QUALITY SYSTEMS, INC. - Investor Relations | NextGen ...
47
UNITED STATES SECURITIES AND EXCHANGE COMMISSION Washington, D.C. 20549 FORM 10-Q ☑ QUARTERLY REPORT PURSUANT TO SECTION 13 OR 15(d) OF THE SECURITIES EXCHANGE ACT OF 1934 For the quarterly period ended September 30, 2012 or o TRANSITION REPORT PURSUANT TO SECTION 13 OR 15(d) OF THE SECURITIES EXCHANGE ACT OF 1934 Commission file number: 001-12537 QUALITY SYSTEMS, INC. (Exact name of registrant as specified in its charter) California (State or other jurisdiction of incorporation or organization) 18111 Von Karman Avenue, Suite 700, Irvine, California (Address of principal executive offices) 95-2888568 (IRS Employer Identification No.) 92612 (Zip Code) (949) 255-2600 (Registrant’s telephone number, including area code) Indicate by check mark whether the registrant (1) has filed all reports required to be filed by Section 13 or 15(d) of the Securities Exchange Act of 1934 during the preceding 12 months (or for such shorter period that the registrant was required to file such reports), and (2) has been subject to such filing requirements for the past 90 days. Yes ☑ No o Indicate by check mark whether the registrant has submitted electronically and posted on its corporate Web site, if any, every Interactive Data File required to be submitted and posted pursuant to Rule 405 of Regulation S-T (§ 232.405 of this chapter) during the preceding 12 months (or for such shorter period that the registrant was required to submit and post such files). Yes ☑ No o Indicate by check mark whether the registrant is a large accelerated filer, an accelerated filer, or a non-accelerated filer, or a smaller reporting company. See the definitions of “large accelerated filer,” “accelerated filer” and “smaller reporting company” in Rule 12b-2 of the Exchange Act. Large accelerated filer ☑ Accelerated filer o Non-accelerated filer o (Do not check if a smaller reporting company) Small reporting company o Indicate by check mark whether the registrant is a shell company (as defined in Rule 12b-2 of the Exchange Act). Yes o No ☑ The number of outstanding shares of the Registrant’s common stock as of October 31, 2012 was 59,369,702 shares.
-
Upload
khangminh22 -
Category
Documents
-
view
5 -
download
0
Transcript of QUALITY SYSTEMS, INC. - Investor Relations | NextGen ...

UNITED STATESSECURITIES AND EXCHANGE COMMISSION
Washington, D.C. 20549
FORM 10-Q
☑ QUARTERLY REPORT PURSUANT TO SECTION 13 OR 15(d) OF THE SECURITIES EXCHANGE ACT OF 1934
For the quarterly period ended September 30, 2012
or
o TRANSITION REPORT PURSUANT TO SECTION 13 OR 15(d) OF THE SECURITIES EXCHANGE ACT OF 1934
Commission file number: 001-12537
QUALITY SYSTEMS, INC.(Exact name of registrant as specified in its charter)
California(State or other jurisdiction of incorporation or organization)
18111 Von Karman Avenue, Suite 700, Irvine, California(Address of principal executive offices)
95-2888568(IRS Employer Identification No.)
92612(Zip Code)
(949) 255-2600(Registrant’s telephone number, including area code)
Indicate by check mark whether the registrant (1) has filed all reports required to be filed by Section 13 or 15(d) of the Securities Exchange Act of 1934 during the preceding12 months (or for such shorter period that the registrant was required to file such reports), and (2) has been subject to such filing requirements for the past 90 days. Yes ☑ No o
Indicate by check mark whether the registrant has submitted electronically and posted on its corporate Web site, if any, every Interactive Data File required to be submitted andposted pursuant to Rule 405 of Regulation S-T (§ 232.405 of this chapter) during the preceding 12 months (or for such shorter period that the registrant was required to submitand post such files). Yes ☑ No o
Indicate by check mark whether the registrant is a large accelerated filer, an accelerated filer, or a non-accelerated filer, or a smaller reporting company. See the definitions of“large accelerated filer,” “accelerated filer” and “smaller reporting company” in Rule 12b-2 of the Exchange Act.
Large accelerated filer ☑ Accelerated filer oNon-accelerated filer o (Do not check if a smaller reporting company) Small reporting company o
Indicate by check mark whether the registrant is a shell company (as defined in Rule 12b-2 of the Exchange Act). Yes o No ☑
The number of outstanding shares of the Registrant’s common stock as of October 31, 2012 was 59,369,702 shares.

QUALITY SYSTEMS, INC.
TABLE OF CONTENTSFORM 10-Q
FOR THE QUARTERLY PERIOD ENDED SEPTEMBER 30, 2012
Item Page
PART I. FINANCIAL INFORMATION Item 1. Financial Statements (Unaudited) Consolidated Balance Sheets as of September 30, 2012 and March 31, 2012 3
Consolidated Statements of Comprehensive Income for the three and six months ended September 30, 2012 and 2011 4
Consolidated Statements of Cash Flows for the six months ended September 30, 2012 and 2011 6
Notes to Consolidated Financial Statements 8
Item 2. Management’s Discussion and Analysis of Financial Condition and Results of Operations 22Item 3. Quantitative and Qualitative Disclosures about Market Risks 41Item 4. Controls and Procedures 41
PART II. OTHER INFORMATION Item 1. Legal Proceedings 42Item 1A. Risk Factors 42Item 2. Unregistered Sales of Equity Securities and Use of Proceeds 42Item 3. Defaults Upon Senior Securities 42Item 4. Mine and Safety Disclosure 42Item 5. Other Information 42Item 6. Exhibits 43
Signatures 44

PART I. FINANCIAL INFORMATION
ITEM 1. FINANCIAL STATEMENTS
QUALITY SYSTEMS, INC.CONSOLIDATED BALANCE SHEETS
(In thousands, except per share data)(Unaudited)
September 30,
2012 March 31, 2012
ASSETS Current assets:
Cash and cash equivalents $ 117,043 $ 134,444
Restricted cash 5,223 1,962
Marketable securities 4,989 4,987
Accounts receivable, net 151,787 145,756
Inventories 3,858 3,715
Income taxes receivable 6,063 2,628
Deferred income taxes, net 10,127 10,127
Other current assets 6,712 9,090
Total current assets 305,802 312,709Equipment and improvements, net 20,296 17,841
Capitalized software costs, net 29,232 19,994
Intangibles, net 31,299 23,259
Goodwill 63,161 60,776
Other assets 6,860 5,773
Total assets $ 456,650 $ 440,352
LIABILITIES AND SHAREHOLDERS’ EQUITY Current liabilities:
Accounts payable $ 8,955 $ 4,532
Deferred revenue 67,968 83,108
Accrued compensation and related benefits 9,894 11,870
Dividends payable 10,382 10,354
Other current liabilities 31,108 19,568
Total current liabilities 128,307 129,432Deferred revenue, net of current 1,225 1,293
Deferred income taxes, net 4,500 5,351
Deferred compensation 3,208 3,497
Other noncurrent liabilities 7,103 5,602
Total liabilities 144,343 145,175Commitments and contingencies (Note 12) Shareholders’ equity: Common stock $0.01 par value; authorized 100,000 shares; issued and outstanding 59,370 and 59,180 shares at September 30, 2012and March 31, 2012, respectively
594 592
Additional paid-in capital 175,747 169,033
Accumulated other comprehensive loss (55) (45)
Retained earnings 136,021 125,597
Total shareholders’ equity 312,307 295,177
Total liabilities and shareholders’ equity $ 456,650 $ 440,352
The accompanying notes are an integral part of these consolidated financial statements.

QUALITY SYSTEMS, INC.CONSOLIDATED STATEMENTS OF COMPREHENSIVE INCOME
(In thousands, except per share data)(Unaudited)
Three Months Ended September 30, Six Months Ended September 30,
2012 2011 2012 2011
Revenues: Software, hardware and supplies $ 23,720 $ 31,860 $ 49,564 $ 60,771
Implementation and training services 8,535 6,094 20,581 11,566
System sales 32,255 37,954 70,145 72,337Maintenance 38,715 35,214 77,283 66,716
Electronic data interchange services 15,024 11,985 28,847 24,077
Revenue cycle management and related services 14,486 11,142 28,887 23,023
Other services 15,648 11,339 29,262 21,923
Maintenance, EDI, RCM and other services 83,873 69,680 164,279 135,739Total revenues 116,128 107,634 234,424 208,076
Cost of revenue: Software, hardware and supplies 5,624 4,187 11,395 8,801
Implementation and training services 7,507 5,050 16,652 9,125
Total cost of system sales 13,131 9,237 28,047 17,926Maintenance 4,741 3,994 9,552 7,848
Electronic data interchange services 9,151 7,964 18,399 15,926
Revenue cycle management and related services 10,556 8,456 21,426 17,282
Other services 8,785 6,369 17,335 11,966
Total cost of maintenance, EDI, RCM and otherservices 33,233 26,783 66,712 53,022
Total cost of revenue 46,364 36,020 94,759 70,948Gross profit 69,764 71,614 139,665 137,128
Operating expenses: Selling, general and administrative 37,832 32,169 74,513 61,555
Research and development costs 6,272 7,358 14,848 14,185
Amortization of acquired intangible assets 1,316 520 2,453 1,002
Total operating expenses 45,420 40,047 91,814 76,742Income from operations 24,344 31,567 47,851 60,386
Interest income (expense), net (62) 75 (27) 157
Other income (expense), net 220 (144) 7 (182)
Income before provision for income taxes 24,502 31,498 47,831 60,361Provision for income taxes 8,811 11,002 16,643 20,882
Net income $ 15,691 $ 20,496 $ 31,188 $ 39,479Other comprehensive income (loss):
Foreign currency translation (net of $0 tax) 47 6 (10) 2
Unrealized loss on AFS securities (net of $0 tax) — (12) — (23)
Comprehensive income $ 15,738 $ 20,490 $ 31,178 $ 39,458
Net income per share: Basic $ 0.26 $ 0.35 $ 0.53 $ 0.67
Diluted $ 0.26 $ 0.35 $ 0.53 $ 0.67
Weighted-average shares outstanding: Basic 59,347 58,664 59,314 58,511
Diluted 59,386 59,005 59,386 58,902
Dividends declared per common share $ 0.175 $ 0.175 $ 0.350 $ 0.350

The accompanying notes are an integral part of these consolidated financial statements.

QUALITY SYSTEMS, INC.CONSOLIDATED STATEMENTS OF CASH FLOWS
(In thousands)(Unaudited)
Six Months Ended September 30,
2012 2011
Cash flows from operating activities: Net income $ 31,188 $ 39,479
Adjustments to reconcile net income to net cash provided by operating activities: Depreciation 3,386 2,546Amortization of capitalized software costs 4,879 3,888Amortization of other intangibles 3,810 1,979Provision for bad debts 3,103 2,859Share-based compensation 1,383 1,661Deferred income tax benefit (851) —Tax benefit associated with stock options (26) 2,261Excess tax benefit from share-based compensation 26 (2,261)Change in fair value of contingent consideration 856 —Loss on disposal of equipment and improvements — 23
Changes in assets and liabilities, net of amounts acquired: Accounts receivable (7,736) (12,437)Inventories (143) (858)Income taxes receivable (3,435) (3,230)Other current assets (394) 122Other assets (1,088) 397Accounts payable 3,677 (347)Deferred revenue (15,226) 6,155Accrued compensation and related benefits (1,976) (454)Income taxes payable — (3,530)Other current liabilities 8,742 (3,336)Deferred compensation (289) 268Other non-current liabilities (1,230) 1,925
Net cash provided by operating activities 28,656 37,110
Cash flows from investing activities: Additions to capitalized software costs (14,117) (6,133)
Additions to equipment and improvements (4,836) (4,672)
Cash acquired from purchase of CQI — 222
Purchase of CQI — (2,737)
Purchase of IntraNexus — (3,279)
Purchase of Poseidon (2,033) —
Purchase of Matrix (5,073) —
Net cash used in investing activities (26,059) (16,599)
Cash flows from financing activities: Excess tax benefit from share-based compensation (26) 2,261
Proceeds from exercise of stock options 764 6,781
Dividends paid (20,736) (20,395)
Net cash used in financing activities (19,998) (11,353)Net (decrease) increase in cash and cash equivalents (17,401) 9,158Cash and cash equivalents at beginning of period 134,444 116,617
Cash and cash equivalents at end of period $ 117,043 $ 125,775

QUALITY SYSTEMS, INC.CONSOLIDATED STATEMENTS OF CASH FLOWS – (Continued)
(In thousands)(Unaudited)
Six Months Ended September 30,
2012 2011
Supplemental disclosures of cash flow information: Cash paid during the period for income taxes, net of refunds $ 20,962 $ 25,380
Non-cash investing and financing activities: Unrealized gain (loss) on marketable securities, net of tax $ 2 $ (22)
Common stock issued at fair value for Opus earnout settlement $ — $ 11,888
Effective May 1, 2012, the Company acquired Poseidon in a transaction summarized as follows: Fair value of assets acquired $ 2,551 Cash paid (2,033) Purchase price holdback (500) Liabilities assumed $ 18
Effective April 16, 2012, the Company acquired Matrix in a transaction summarized as follows: Fair value of assets acquired $ 14,587 Cash paid (5,073) Common stock issued at fair value (3,953) Purchase price holdback (853) Fair value of contingent consideration (2,862) Fair value of non-compete agreement (liability) (1,100) Liabilities assumed $ 746
Effective July 26, 2011, the Company acquired CQI in a transaction summarized as follows: Fair value of assets acquired $ 11,417Cash paid (2,737)Common stock issued at fair value (2,864)Purchase price holdback (600)Fair value of contingent consideration (2,346)
Liabilities assumed $ 2,870
Effective April 29, 2011, the Company acquired IntraNexus in a transaction summarized as follows: Fair value of assets acquired $ 4,524Cash paid (3,279)Purchase price holdback (125)Fair value of contingent consideration (800)
Liabilities assumed $ 320
The accompanying notes are an integral part of these consolidated financial statements.
QUALITY SYSTEMS, INC.NOTES TO CONSOLIDATED FINANCIAL STATEMENTS
(In thousands, except shares and per share data)(Unaudited)
1. Summary of Significant Accounting Policies
Principles of Consolidation. The consolidated financial statements include the accounts of Quality Systems, Inc. and its wholly-owned subsidiaries, which consists of NextGenHealthcare Information Systems, LLC (“NextGen”), NextGen RCM Services, LLC, Opus Healthcare Solutions, LLC (“Opus”), ViaTrack Systems, LLC (“ViaTrack”), MatrixManagement Solutions, LLC ("Matrix"), QSI Management, LLC and Quality Systems India Healthcare Private Limited (“QSIH”) (collectively, the “Company”). Allintercompany accounts and transactions have been eliminated.
Basis of Presentation. The accompanying unaudited consolidated financial statements as of September 30, 2012 and for the three and six months ended September 30, 2012and 2011 have been prepared in accordance with the requirements of Form 10-Q and Article 10 of the Securities and Exchange Commission Regulation S-X and therefore donot include all information and notes which would be presented were such consolidated financial statements prepared in accordance with accounting principles generallyaccepted in the United States of America (“GAAP”). These consolidated financial statements should be read in conjunction with the audited consolidated financial statementspresented in the Company's Annual Report on Form 10-K for the fiscal year ended March 31, 2012. Amounts related to disclosures of March 31, 2012 balances within theseinterim consolidated financial statements were derived from the aforementioned Form 10-K. In the opinion of management, the accompanying consolidated financialstatements reflect all adjustments which are necessary for a fair presentation of the results of operations and cash flows for the periods presented. The results of operations forsuch interim periods are not necessarily indicative of results of operations to be expected for the full year. References to amounts in the consolidated financial statement sections are in thousands, except shares and per share data, unless otherwise specified. On July 27, 2011, the Company’s Board of Directors approved a two-for-one stock split (the “stock split”) of the Company’s outstanding shares of common stock.Shareholders of record at the close of business on October 6, 2011 received one additional share for every outstanding share held on the record date. The additional shares weredistributed on October 26, 2011. All share and per share data provided herein gives effect to this stock split, applied retroactively.
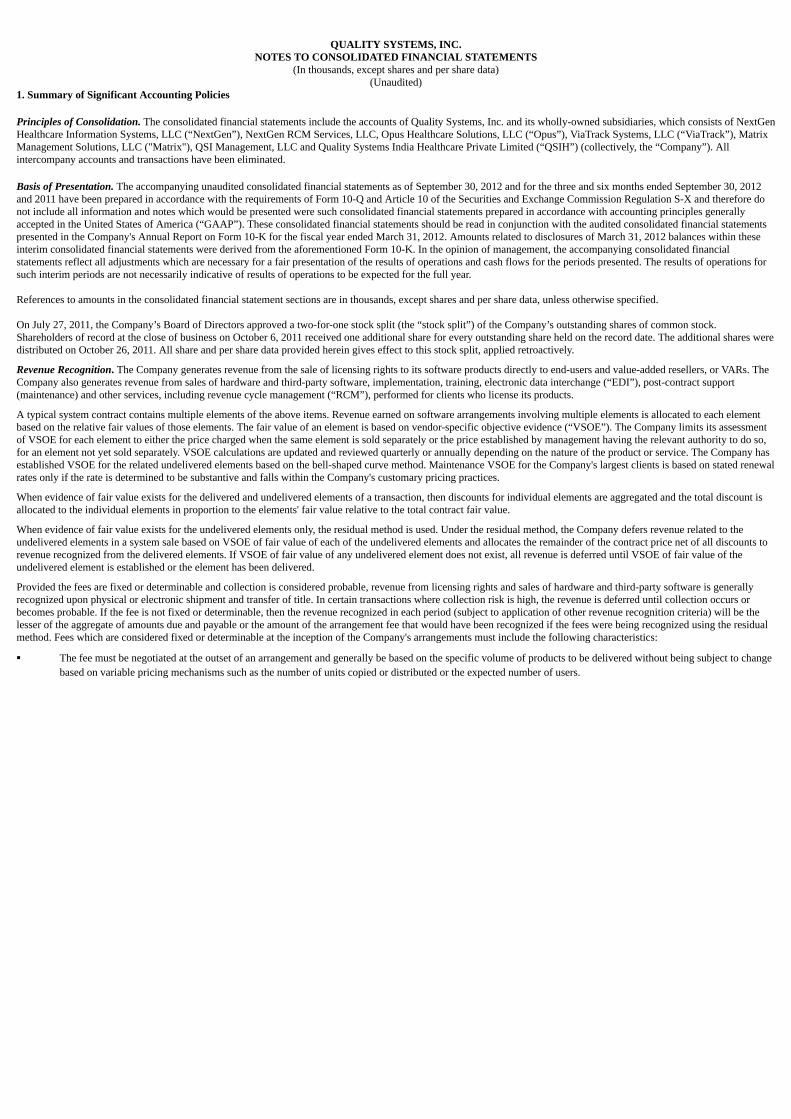
Revenue Recognition. The Company generates revenue from the sale of licensing rights to its software products directly to end-users and value-added resellers, or VARs. TheCompany also generates revenue from sales of hardware and third-party software, implementation, training, electronic data interchange (“EDI”), post-contract support(maintenance) and other services, including revenue cycle management (“RCM”), performed for clients who license its products.
A typical system contract contains multiple elements of the above items. Revenue earned on software arrangements involving multiple elements is allocated to each elementbased on the relative fair values of those elements. The fair value of an element is based on vendor-specific objective evidence (“VSOE”). The Company limits its assessmentof VSOE for each element to either the price charged when the same element is sold separately or the price established by management having the relevant authority to do so,for an element not yet sold separately. VSOE calculations are updated and reviewed quarterly or annually depending on the nature of the product or service. The Company hasestablished VSOE for the related undelivered elements based on the bell-shaped curve method. Maintenance VSOE for the Company's largest clients is based on stated renewalrates only if the rate is determined to be substantive and falls within the Company's customary pricing practices.
When evidence of fair value exists for the delivered and undelivered elements of a transaction, then discounts for individual elements are aggregated and the total discount isallocated to the individual elements in proportion to the elements' fair value relative to the total contract fair value.
When evidence of fair value exists for the undelivered elements only, the residual method is used. Under the residual method, the Company defers revenue related to theundelivered elements in a system sale based on VSOE of fair value of each of the undelivered elements and allocates the remainder of the contract price net of all discounts torevenue recognized from the delivered elements. If VSOE of fair value of any undelivered element does not exist, all revenue is deferred until VSOE of fair value of theundelivered element is established or the element has been delivered.
Provided the fees are fixed or determinable and collection is considered probable, revenue from licensing rights and sales of hardware and third-party software is generallyrecognized upon physical or electronic shipment and transfer of title. In certain transactions where collection risk is high, the revenue is deferred until collection occurs orbecomes probable. If the fee is not fixed or determinable, then the revenue recognized in each period (subject to application of other revenue recognition criteria) will be thelesser of the aggregate of amounts due and payable or the amount of the arrangement fee that would have been recognized if the fees were being recognized using the residualmethod. Fees which are considered fixed or determinable at the inception of the Company's arrangements must include the following characteristics:
▪ The fee must be negotiated at the outset of an arrangement and generally be based on the specific volume of products to be delivered without being subject to changebased on variable pricing mechanisms such as the number of units copied or distributed or the expected number of users.

▪ Payment terms must not be considered extended. If a significant portion of the fee is due more than 12 months after delivery or after the expiration of the license, thefee is presumed not fixed or determinable.
Revenue from implementation and training services is recognized as the corresponding services are performed. Maintenance revenue is recognized ratably over the contractualmaintenance period.
Contract accounting is applied where services include significant software modification, development or customization.
The Company ensures that the following criteria have been met prior to recognition of revenue:
▪ the price is fixed or determinable;
▪ the customer is obligated to pay and there are no contingencies surrounding the obligation or the payment;
▪ the customer's obligation would not change in the event of theft or damage to the product;
▪ the customer has economic substance;
▪ the amount of returns can be reasonably estimated; and
▪ the Company does not have significant obligations for future performance in order to bring about resale of the product by the customer.
The Company has historically offered short-term rights of return in certain sales arrangements. When the Company is able to estimate returns for these types of arrangements,revenue is recognized, net of an allowance for returns, and these arrangements are recorded in the consolidated financial statements. If the Company is unable to estimatereturns for these types of arrangements, revenue is not recognized in the consolidated financial statements until the rights of return expire, provided also, that all other criteriafor revenue recognition have been met.
Revenue related to sales arrangements that include hosting or the right to use software stored on the Company's hardware is recognized in accordance to the same revenuerecognition criteria discussed above only if the customer has the contractual right to take possession of the software without incurring a significant penalty and it is feasible forthe customer to either host the software themselves or through another third-party. Otherwise, the arrangement is accounted for as a service contract in which the entirearrangement is deferred and recognized over the period that the hosting services are being performed.
From time to time, the Company offers future purchase discounts on its products and services as part of its sales arrangements. Such discounts that are incremental to the rangeof discounts reflected in the pricing of the other elements of the arrangement, that are incremental to the range of discounts typically given in comparable transactions, and thatare significant, are treated as an additional element of the contract to be deferred. Amounts deferred related to future purchase options are not recognized until either thecustomer exercises the discount offer or the offer expires.
RCM service revenue is derived from services fees, which include amounts charged for ongoing billing and other related services, and are generally billed to the customer as apercentage of total collections. The Company does not recognize revenue for services fees until these collections are made, as the services fees are not fixed or determinableuntil such time.
Revenue is reported into two categories, “system sales” and “maintenance, EDI, RCM and other services.” Revenue in the system sales category includes software license fees,third-party hardware and software and implementation and training services related to purchase of the Company's software systems. Revenue in the maintenance, EDI, RCMand other services category includes maintenance, EDI, RCM services, consulting services, annual third-party license fees, hosting services, Software as a Service ("SaaS")fees and other services revenue.
Goodwill. The Company tests goodwill for impairment annually at the end of its first fiscal quarter, referred to as the annual test date. The Company will also test forimpairment between annual test dates if an event occurs or circumstances change that would indicate the carrying amount may be impaired. Impairment testing for goodwill isperformed at a reporting-unit level, which is defined as an operating segment or one level below an operating segment (referred to as a component). A component of anoperating segment is a reporting unit if the component constitutes a business for which discrete financial information is available and segment management regularly reviewsthe operating results of that component.
An impairment loss would generally be recognized when the carrying amount of the reporting unit's net assets exceeds the estimated fair value of the reporting unit. As ofSeptember 30, 2012, the Company has not identified any events or circumstances that would require an interim goodwill impairment test. See Note 4.
Share-Based Compensation. The following table shows total share-based compensation expense included in the consolidated statements of income for the three and sixmonths ended September 30, 2012 and 2011:

Three Months Ended September 30, Six Months Ended September 30,
2012 2011 2012 2011
Costs and expenses: Cost of revenue $ 73 $ 70 $ 149 $ 119
Research and development costs 74 44 133 77
Selling, general and administrative 272 591 1,101 1,465
Total share-based compensation 419 705 1,383 1,661Income tax benefit (127) (260) (447) (618)
Decrease in net income $ 292 $ 445 $ 936 $ 1,043
Recent Accounting Standards. New accounting pronouncements implemented by the Company during the current year or requiring implementation in future periods arediscussed below or in the notes, where applicable.
In the first quarter of fiscal 2013, the Company adopted new accounting guidance intended to simplify goodwill impairment testing. Under the revised guidance, entitiestesting goodwill for impairment have the option to first assess qualitative factors to determine whether the existence of events or circumstances leads to a determination that itis more likely than not that the fair value of a reporting unit is less than its carrying amount. If, after assessing the totality of events or circumstances, an entity determines it ismore likely than not that the fair value of a reporting unit is less than its carrying amount, then performing the two-step impairment test would be required. Under the revisedguidance, an entity has the option to bypass the qualitative assessment for any reporting unit in any period and proceed directly to performing the first step of the two-stepgoodwill impairment test. An entity may resume performing the qualitative assessment in any subsequent period. The revised guidance does not change how goodwill iscalculated or assigned to reporting units, nor does it revise the requirement to test goodwill annually for impairment. In addition, the revised guidance does not amend therequirement to test goodwill for impairment between annual tests if events or circumstances warrant; however, it does revise the examples of events and circumstances that anentity should consider. The adoption did not have a material impact on the Company's financial position, results of operations or cash flows and is discussed further within thisfootnote.
In the first quarter of fiscal 2013, the Company adopted guidance regarding the presentation of comprehensive income. The new standard requires the presentation ofcomprehensive income, the components of net income and the components of other comprehensive income either in a single continuous statement of comprehensive income orin two separate but consecutive statements. The adoption of this guidance did not have a material impact on the Company's financial statements.
In the first quarter of fiscal 2013, the Company adopted additional guidance on fair value measurements intended to clarify the application of the existing guidance anddisclosure requirements, as well as change certain fair value measurement principles and require additional disclosures surrounding these fair value measurements. Theadoption of this guidance did not have a material impact on the Company's financial statements.
2. Fair Value Measurements
The following tables set forth by level within the fair value hierarchy the Company’s financial assets and liabilities that were accounted for at fair value on a recurring basis atSeptember 30, 2012 and March 31, 2012:
Balance at Quoted Prices in ActiveMarkets for Identical
Assets (Level 1)
Significant OtherObservable Inputs
(Level 2)
Unobservable Inputs
(Level 3) September 30,
2012 ASSETS Cash and cash equivalents (1) $ 117,043 $ 117,043 $ — $ —
Restricted cash 5,223 5,223 — —
Marketable securities (2) 4,989 4,989 — —
$ 127,255 $ 127,255 $ — $ —
LIABILITIES Contingent consideration related to acquisitions $ 9,339 $ — $ — $ 9,339
$ 9,339 $ — $ — $ 9,339

Balance at Quoted Prices in ActiveMarkets for Identical
Assets (Level 1)
Significant OtherObservable Inputs
(Level 2)
Unobservable Inputs
(Level 3) March 31,
2012 ASSETS Cash and cash equivalents (1) $ 134,444 $ 134,444 $ — $ —
Restricted cash 1,962 1,962 — —
Marketable securities (2) 4,987 4,987 — —
$ 141,393 $ 141,393 $ — $ —
LIABILITIES Contingent consideration related to acquisitions $ 6,556 $ — $ — $ 6,556
$ 6,556 $ — $ — $ 6,556
___________________________________(1) Cash equivalents consists of money market funds.(2) Marketable securities consist of fixed-income securities.
The Company’s contingent consideration liability is accounted for at fair value on a recurring basis and is adjusted to fair value when the carrying value differs from fair value.Key assumptions include discount rates and probability-adjusted achievement of revenue and strategic targets that are not observable in the market. The categorization of theframework used to measure fair value of the contingent consideration liability is considered Level 3 due to the subjective nature of the unobservable inputs used. The fairvalues of the contingent consideration liability for Sphere Health Systems, Inc. ("Sphere"), IntraNexus, Inc. ("IntraNexus"), CQI Solutions, Inc. ("CQI"), ViaTrack, and Matrixwere estimated based on the probability of achieving certain business milestones and management’s forecast of expected revenues. See Note 3.
The following table presents activity in the Company’s financial assets and liabilities measured at fair value using significant unobservable inputs (Level 3), as of and for thesix months ended September 30, 2012:
Total Liabilities
Balance as of April 1, 2012 $ 6,556Acquisitions (Note 3) 2,862
Earnout payments (935)
Fair value adjustments 856
Balance as of September 30, 2012 $ 9,339
Non-Recurring Fair Value Measurements
The Company has certain assets, including goodwill and other intangible assets, which are measured at fair value on a non-recurring basis and are adjusted to fair value only ifan impairment charge is recognized. The categorization of the framework used to measure fair value of the assets is considered Level 3 due to the subjective nature of theunobservable inputs used. During the six months ended September 30, 2012, there were no adjustments to fair value of such assets, except for the intangible assets acquiredfrom Matrix and The Poseidon Group, Inc. ("Poseidon") as discussed further below.
3. Business Combinations
On May 1, 2012, the Company acquired Poseidon, a leading provider of hospital emergency department documentation and web-based electronic medical record solutions. ThePoseidon purchase price totaled $2,533. Poseidon operates under the Hospital Solutions Division.
On April 16, 2012, the Company acquired Matrix, a provider of revenue cycle management services, healthcare IT solutions and training, implementation and support centeredaround NextGen Healthcare's suite of practice management software and electronic health record solutions. The Matrix purchase price totaled $13,841. The purchase priceincluded contingent consideration payable over an 18-month period with a fair value of $2,862, which shall not exceed $4,000. The goodwill associated with this acquisition isdeductible for tax purposes. Matrix operates under the RCM Services Division.
The Company accounted for the Matrix and Poseidon acquisitions as purchase business combinations. The purchase price for each was allocated to the tangible and intangibleassets acquired and liabilities assumed based on their estimated fair values as of the applicable acquisition date. The fair value of the assets acquired and liabilities assumedrepresent management’s estimate of fair value. The estimated fair value of the acquired tangible and intangible assets and liabilities assumed were determined using multiplevaluation approaches depending on the type of tangible or intangible asset acquired, including but not limited to the income approach, the excess earnings method and the relieffrom royalty
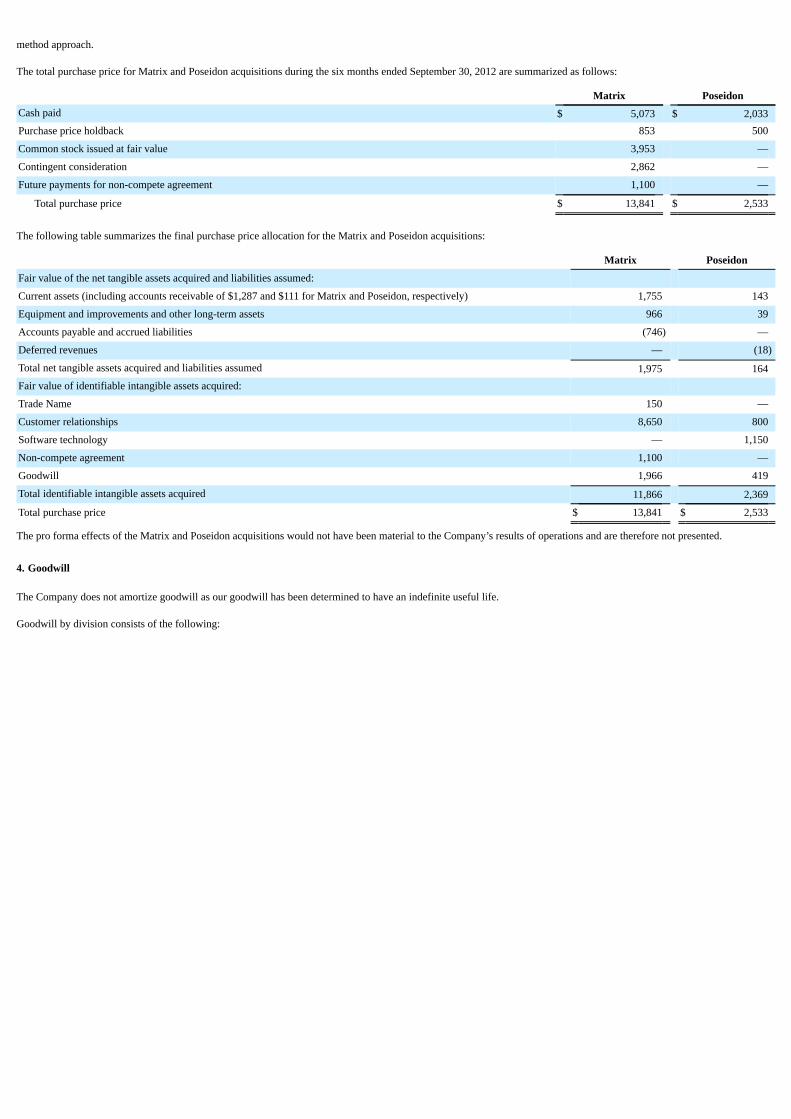
method approach.
The total purchase price for Matrix and Poseidon acquisitions during the six months ended September 30, 2012 are summarized as follows:
Matrix PoseidonCash paid $ 5,073 $ 2,033Purchase price holdback 853 500
Common stock issued at fair value 3,953 —
Contingent consideration 2,862 —
Future payments for non-compete agreement 1,100 —
Total purchase price $ 13,841 $ 2,533
The following table summarizes the final purchase price allocation for the Matrix and Poseidon acquisitions:
Matrix Poseidon
Fair value of the net tangible assets acquired and liabilities assumed: Current assets (including accounts receivable of $1,287 and $111 for Matrix and Poseidon, respectively) 1,755 143
Equipment and improvements and other long-term assets 966 39
Accounts payable and accrued liabilities (746) —
Deferred revenues — (18)
Total net tangible assets acquired and liabilities assumed 1,975 164Fair value of identifiable intangible assets acquired: Trade Name 150 —
Customer relationships 8,650 800
Software technology — 1,150
Non-compete agreement 1,100 —
Goodwill 1,966 419
Total identifiable intangible assets acquired 11,866 2,369
Total purchase price $ 13,841 $ 2,533
The pro forma effects of the Matrix and Poseidon acquisitions would not have been material to the Company’s results of operations and are therefore not presented.
4. Goodwill
The Company does not amortize goodwill as our goodwill has been determined to have an indefinite useful life.
Goodwill by division consists of the following:

March 31,
2012 Acquisitions September 30,
2012
QSI Dental Division ViaTrack Systems, LLC $ 7,289 $ — $ 7,289
Total QSI Dental Division goodwill 7,289 — 7,289NextGen Division
NextGen Healthcare Information Systems, Inc. 1,840 — 1,840
Total NextGen Division goodwill 1,840 — 1,840Hospital Solutions Division
The Poseidon Group, Inc. — 419 419
CQI Solutions, Inc. 4,863 — 4,863
IntraNexus, Inc. 1,903 — 1,903
Opus Healthcare Solutions, Inc. 13,537 — 13,537
Sphere Health Systems, Inc. 1,020 — 1,020
Total Hospital Solutions Division goodwill 21,323 419 21,742
RCM Services Division Matrix Management Solutions, LLC — 1,966 1,966
Practice Management Partners, Inc. 19,485 — 19,485
Healthcare Strategic Initiatives 10,839 — 10,839
Total RCM Services Division goodwill 30,324 1,966 32,290
Total goodwill $ 60,776 $ 2,385 $ 63,161
5. Intangible Assets
In connection with the Poseidon acquisition, the Company recorded $1,950 of intangible assets related to customer relationships and software technology. The Company isamortizing the customer relationships over five years and the software technology over five years.
In connection with the Matrix acquisition, the Company recorded $9,900 of intangible assets related to a trade name, customer relationships and a non-compete agreement. TheCompany is amortizing the trade name over six months, the customer relationships over five years and the non-compete agreement over four years.
The Company’s intangible assets, other than capitalized software development costs, with determinable lives are summarized as follows:
September 30, 2012
Customer
Relationships Trade Name &
Contracts Software
Technology TotalGross carrying amount $ 23,156 $ 2,018 $ 20,509 $ 45,683Accumulated amortization (7,921) (936) (5,527) (14,384)
Net intangible assets $ 15,235 $ 1,082 $ 14,982 $ 31,299
March 31, 2012
Customer
Relationships Trade Name &
Contracts Software
Technology TotalGross carrying amount $ 13,706 $ 768 $ 19,359 $ 33,833Accumulated amortization (5,901) (606) (4,067) (10,574)
Net intangible assets $ 7,805 $ 162 $ 15,292 $ 23,259
Activity related to the intangible assets for the six months ended September 30, 2012 and 2011 is summarized as follows:

Customer
Relationships Trade Name &
Contracts Software
Technology TotalBalance as of April 1, 2012 $ 7,805 $ 162 $ 15,292 $ 23,259Acquisition 9,450 1,250 1,150 11,850
Amortization (1) (2,020) (330) (1,460) (3,810)
Balance as of September 30, 2012 $ 15,235 $ 1,082 $ 14,982 $ 31,299
Customer
Relationships Trade Name &
Contracts Software
Technology Total
Balance as of April 1, 2011 $ 6,327 $ 208 $ 10,355 $ 16,890Acquisition 1,700 — 5,930 7,630
Amortization (1) (922) (80) (977) (1,979)
Balance as of September 30, 2011 $ 7,105 $ 128 $ 15,308 $ 22,541
_____________________________(1) Amortization of the customer relationships and the trade name and contracts intangible assets is included in operating expenses and amortization of the software technologyintangible assets is included in cost of revenue for software, hardware, and supplies.
The following table represents the remaining estimated amortization of intangible assets with determinable lives as of September 30, 2012:
For the year ended March 31, 2013 (remaining six months) $ 3,7442014 7,3912015 6,3352016 5,9982017 and beyond 7,831
Total $ 31,299
6. Capitalized Software Costs
The Company’s capitalized software development costs are summarized as follows:
September 30,
2012 March 31, 2012Gross carrying amount $ 79,338 $ 65,221Accumulated amortization (50,106) (45,227)
Net capitalized software costs $ 29,232 $ 19,994
Activity related to net capitalized software costs for the six months ended September 30, 2012 and 2011 is summarized as follows:
2012 2011
Balance as of April 1 $ 19,994 $ 15,150
Capitalized 14,117 6,133
Amortization (4,879) (3,888)
Balance as of September 30 $ 29,232 $ 17,395
The following table represents the remaining estimated amortization of capitalized software costs as of September 30, 2012:

For the year ended March 31, 2013 (remaining six months) $ 4,9692014 11,3772015 7,7852016 3,9262017 and beyond 1,175
Total $ 29,232
7. Composition of Certain Financial Statement Captions
Accounts receivable include amounts related to maintenance and services that were billed but not yet rendered at each period end. Undelivered maintenance and services areincluded as a component of the deferred revenue balance on the accompanying consolidated balance sheets.
September 30,
2012 March 31,
2012Accounts receivable, gross $ 162,115 $ 154,237Allowance for doubtful accounts (10,328) (8,481)
Accounts receivable, net $ 151,787 $ 145,756
Inventories are summarized as follows:
September 30,
2012 March 31,
2012
Computer systems and components $ 3,858 $ 3,709
Miscellaneous parts and supplies — 6
Inventories $ 3,858 $ 3,715
Equipment and improvements are summarized as follows:
September 30,
2012 March 31,
2012Computer equipment $ 29,008 $ 24,936Furniture and fixtures 7,197 6,358
Leasehold improvements 5,836 4,906
42,041 36,200Accumulated depreciation and amortization (21,745) (18,359)
Equipment and improvements, net $ 20,296 $ 17,841
Current and non-current deferred revenue are summarized as follows:
September 30,
2012 March 31,
2012
Maintenance $ 11,642 $ 12,742
Implementation services 42,603 55,235
Annual license services 9,171 11,730
Undelivered software and other 4,552 3,401
Deferred revenue $ 67,968 $ 83,108
Deferred revenue, net of current $ 1,225 $ 1,293
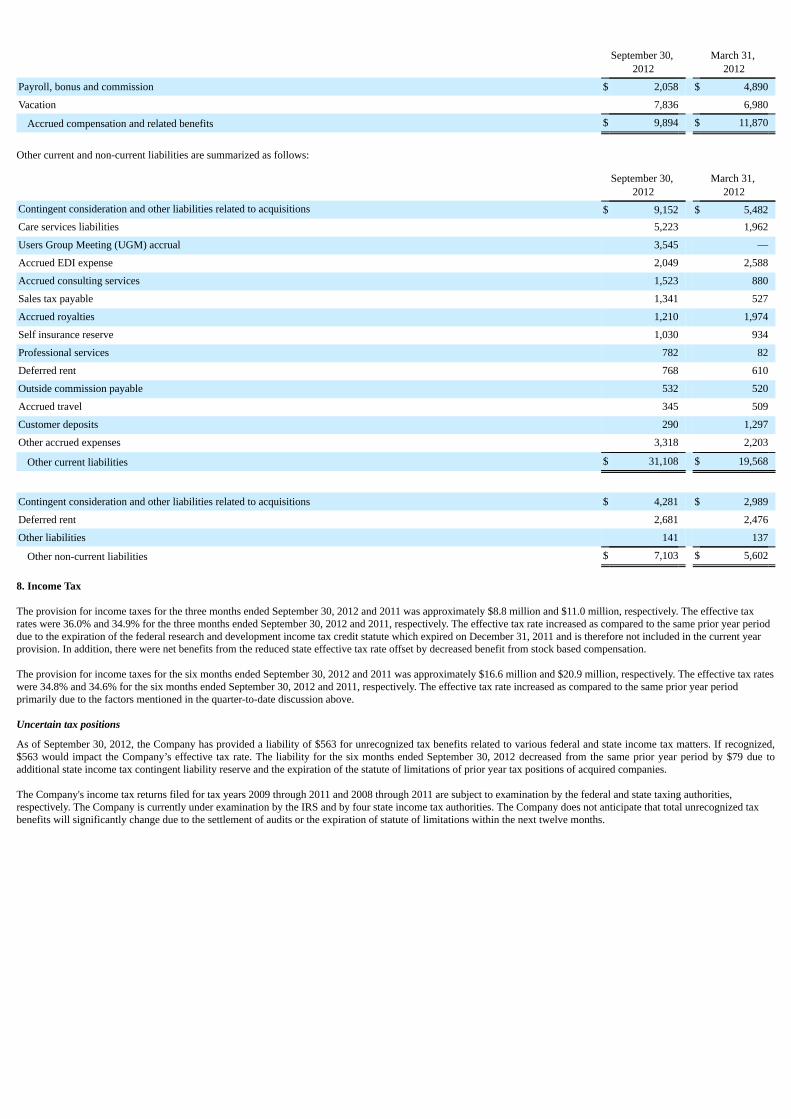
Accrued compensation and related benefits are summarized as follows:
September 30,
2012 March 31,
2012
Payroll, bonus and commission $ 2,058 $ 4,890
Vacation 7,836 6,980
Accrued compensation and related benefits $ 9,894 $ 11,870
Other current and non-current liabilities are summarized as follows:
September 30,
2012 March 31,
2012Contingent consideration and other liabilities related to acquisitions $ 9,152 $ 5,482Care services liabilities 5,223 1,962
Users Group Meeting (UGM) accrual 3,545 —
Accrued EDI expense 2,049 2,588
Accrued consulting services 1,523 880
Sales tax payable 1,341 527
Accrued royalties 1,210 1,974
Self insurance reserve 1,030 934
Professional services 782 82
Deferred rent 768 610
Outside commission payable 532 520
Accrued travel 345 509
Customer deposits 290 1,297
Other accrued expenses 3,318 2,203
Other current liabilities $ 31,108 $ 19,568
Contingent consideration and other liabilities related to acquisitions $ 4,281 $ 2,989
Deferred rent 2,681 2,476
Other liabilities 141 137
Other non-current liabilities $ 7,103 $ 5,602
8. Income Tax
The provision for income taxes for the three months ended September 30, 2012 and 2011 was approximately $8.8 million and $11.0 million, respectively. The effective taxrates were 36.0% and 34.9% for the three months ended September 30, 2012 and 2011, respectively. The effective tax rate increased as compared to the same prior year perioddue to the expiration of the federal research and development income tax credit statute which expired on December 31, 2011 and is therefore not included in the current yearprovision. In addition, there were net benefits from the reduced state effective tax rate offset by decreased benefit from stock based compensation.
The provision for income taxes for the six months ended September 30, 2012 and 2011 was approximately $16.6 million and $20.9 million, respectively. The effective tax rateswere 34.8% and 34.6% for the six months ended September 30, 2012 and 2011, respectively. The effective tax rate increased as compared to the same prior year periodprimarily due to the factors mentioned in the quarter-to-date discussion above.
Uncertain tax positions
As of September 30, 2012, the Company has provided a liability of $563 for unrecognized tax benefits related to various federal and state income tax matters. If recognized,$563 would impact the Company’s effective tax rate. The liability for the six months ended September 30, 2012 decreased from the same prior year period by $79 due toadditional state income tax contingent liability reserve and the expiration of the statute of limitations of prior year tax positions of acquired companies.
The Company's income tax returns filed for tax years 2009 through 2011 and 2008 through 2011 are subject to examination by the federal and state taxing authorities,respectively. The Company is currently under examination by the IRS and by four state income tax authorities. The Company does not anticipate that total unrecognized taxbenefits will significantly change due to the settlement of audits or the expiration of statute of limitations within the next twelve months.

9. Earnings per Share
The Company provides dual presentation of “basic” and “diluted” earnings per share (“EPS”). Shares discussed below are in thousands.
Three Months Ended September 30, Six Months Ended September 30,
2012 2011 2012 2011Net income $ 15,691 $ 20,496 $ 31,188 $ 39,479Basic net income per share: Weighted-average shares outstanding — Basic 59,347 58,664 59,314 58,511
Basic net income per common share $ 0.26 $ 0.35 $ 0.53 $ 0.67
Net income $ 15,691 $ 20,496 $ 31,188 $ 39,479
Diluted net income per share: Weighted-average shares outstanding — Basic 59,347 58,664 59,314 58,511
Effect of potentially dilutive securities 39 341 72 391
Weighted-average shares outstanding — Diluted 59,386 59,005 59,386 58,902
Diluted net income per common share $ 0.26 $ 0.35 $ 0.53 $ 0.67
The computation of diluted net income per share does not include 1,205 and 1,024 options to acquire shares of common stock for the three and six months endedSeptember 30, 2012, respectively, because their inclusion would have an anti-dilutive effect on net income per share.
The computation of diluted net income per share does not include 455 and 307 options to acquire shares of common stock for the three and six months ended September 30,2011, respectively, because their inclusion would have an anti-dilutive effect on net income per share.
10. Share-Based Awards
All share and per share data provided within this footnote is adjusted for the effect of the stock split, as discussed in Note 1.
Employee Stock Option Plans
In September 1998, the Company’s shareholders approved a stock option plan (the “1998 Plan”) under which 8,000,000 shares of common stock were reserved for the issuanceof options. The 1998 Plan provides that employees, directors and consultants of the Company may, at the discretion of the Board of Directors or a duly designatedcompensation committee, be granted options to purchase shares of common stock. The exercise price of each option granted was determined by the Board of Directors at thedate of grant, and options under the 1998 Plan expire no later than 10 years from the grant date. Options granted will generally become exercisable in accordance with theterms of the agreement pursuant to which they were granted. Certain option grants to directors became exercisable three months from the date of grant. Upon an acquisition ofthe Company by merger or asset sale, each outstanding option may be subject to accelerated vesting under certain circumstances. The 1998 Plan terminated on December 31,2007. As of September 30, 2012, there were 40,000 outstanding options related to the 1998 Plan.
In October 2005, the Company’s shareholders approved a stock option and incentive plan (the “2005 Plan”) under which 4,800,000 shares of common stock were reserved forthe issuance of awards, including stock options, incentive stock options and non-qualified stock options, stock appreciation rights, restricted stock, unrestricted stock, restrictedstock units, performance shares, performance units (including performance options) and other share-based awards. The 2005 Plan provides that employees, directors andconsultants of the Company may, at the discretion of the Board of Directors or a duly designated compensation committee, be granted awards to acquire shares of commonstock. The exercise price of each option award shall be determined by the Board of Directors at the date of grant in accordance with the terms of the 2005 Plan, and under the2005 Plan awards expire no later than 10 years from the grant date. Options granted will generally become exercisable in accordance with the terms of the agreement pursuantto which they were granted. Upon an acquisition of the Company by merger or asset sale, each outstanding option may be subject to accelerated vesting under certaincircumstances. The 2005 Plan terminates on May 25, 2015, unless terminated earlier by the Board of Directors. As of September 30, 2012, there were 1,256,591 outstandingoptions and 2,887,747 shares available for future grant related to the 2005 Plan.
A summary of stock option transactions during the six months ended September 30, 2012 is as follows:

Number of
Shares
Weighted-AverageExercise
Priceper Share
Weighted-Average
RemainingContractualLife (years)
AggregateIntrinsic
Value(in thousands)
Outstanding, April 1, 2012 988,337 $ 32.09 5.4 Granted 511,500 28.77 7.7
Exercised (45,366) 16.83 0.6 $ 77
Forfeited/Canceled (157,880) 31.99 6.0
Outstanding, September 30, 2012 1,296,591 $ 31.35 6.0 $ 54
Vested and expected to vest, September 30, 2012 1,238,609 $ 31.31 6.0 $ 54
Exercisable, September 30, 2012 318,866 $ 27.50 3.6 $ 52
The Company utilizes the Black-Scholes valuation model for estimating the fair value of share-based compensation with the following assumptions:
Six MonthsEnded September
30, 2012
Six MonthsEnded September
30, 2011
Expected life 5.0 years 4.3 years
Expected volatility 41.3% - 45.0% 41.2%
Expected dividends 2.4% - 3.8% 1.6%
Risk-free rate 0.7% - 0.8% 1.8%
The weighted average grant date fair value of stock options granted during the six months ended September 30, 2012 and 2011 was $8.41 and $13.32 per share, respectively.
The Company issues new shares to satisfy option exercises. Based on historical experience of option cancellations, the Company has estimated an annualized forfeiture rate of5.8% and 3.8% for employee options for the six months ended September 30, 2012 and 2011, respectively, and 0.0% for director options for the six months endedSeptember 30, 2012 and 2011. Forfeiture rates will be adjusted over the requisite service period when actual forfeitures differ, or are expected to differ, from the estimate.
During the six months ended September 30, 2012, a total of 511,500 options to purchase shares of common stock were granted under the 2005 Plan at an exercise price equalto the market price of the Company’s common stock on the date of grant. A summary of stock options granted under the 2005 Plan during fiscal years 2013 and 2012 is asfollows:
Number of Vesting
Option Grant Date Shares Exercise Price Terms (1) Expires
September 25, 2012 20,000 $ 18.42 Five years September 25, 2020
May 24, 2012 346,000 $ 29.17 Five years May 24, 2020
May 24, 2012 30,000 $ 29.17 Five years May 24, 2020
May 23, 2012 115,500 $ 29.45 Four years May 23, 2020
Fiscal year 2013 option grants 511,500
May 31, 2011 459,400 $ 43.04 Five years May 31, 2019
Fiscal year 2012 option grants 459,400
__________________________________(1) Options vest in equal annual installments on each grant anniversary date commencing one year following the date of grant.
Performance-Based Awards
On May 24, 2012, the Board of Directors approved its fiscal year 2013 equity incentive program for certain employees to be awarded options to purchase the Company’scommon stock. The maximum number of options available under the equity incentive program plan is 600,000, of which 220,000 are reserved for the Company’s namedexecutive officers and 380,000 for non-executive employees of the Company. Under the program, executives are eligible to receive options based on meeting certain targetincreases in EPS performance and revenue and operating

income growth during fiscal year 2013. Under the program, the non-executive employees are eligible to receive options based on satisfying certain management establishedcriteria and recommendations of senior management. The options shall be issued pursuant to one of the Company’s shareholder approved option plans, have an exercise priceequal to the closing price of the Company’s shares on the date of grant, a term of eight years and vesting in five equal annual installments commencing one year following thedate of grant.
Compensation expense associated with the performance based awards under the Company’s equity incentive plans are initially based on the number of options expected to vestafter assessing the probability that certain performance criteria will be met. Cumulative adjustments are recorded quarterly to reflect subsequent changes in the estimatedoutcome of performance-related conditions. The Company utilized the Black-Scholes option valuation model and recorded stock compensation expense related to theperformance based awards of approximately $345 during the six months ended September 30, 2011. Stock compensation expense related to the performance based awards wasnot significant for the six months ended September 30, 2012. See the assumptions used below.
Six MonthsEnded September
30, 2012
Six MonthsEnded September
30, 2011
Expected life 5.0 years 4.3 years
Expected volatility 41.7% - 45.0% 41.2% - 42.2%
Expected dividends 2.5% - 3.8% 1.4% - 1.6%
Risk-free rate 0.6% - 0.7% 1.0% - 1.8%
Non-vested stock option award activity, including employee stock options and performance-based awards, during the six months ended September 30, 2012 is summarized asfollows:
Non-VestedNumber of
Shares
Weighted-Average
Grant-DateFair Valueper Share
Outstanding, April 1, 2012 778,319 $ 10.76
Granted 511,500 8.41
Vested (154,214) 8.24
Forfeited/Canceled (157,880) 10.32
Outstanding, September 30, 2012 977,725 $ 10.01
As of September 30, 2012, $7,380 of total unrecognized compensation costs related to stock options is expected to be recognized over a weighted-average period of 3.8 years.This amount does not include the cost of new options that may be granted in future periods or any changes in the Company’s forfeiture percentage. The total fair value ofoptions vested during the six months ended September 30, 2012 and 2011 was $1,270 and $1,111, respectively.
Restricted Stock
On May 24, 2012, the Board of Directors approved its 2013 Director Compensation Program, whereby each non-employee director is to be awarded shares of restricted stockupon election or re-election to the Board of Directors. The shares of restricted stock are awarded under the 2005 Plan. Such shares of restricted stock vest in two equal, annualinstallments on the first and second anniversaries of the grant date and are nontransferable for one year following vesting. The weighted-average grant date fair value for therestricted stock was estimated using the market price of the common stock on the date of grant. The fair value of the restricted stock is amortized on a straight-line basis overthe vesting period.
As of September 30, 2012, 78,235 shares of restricted stock have been awarded under the 2013 Director Compensation Program and other director compensation programsapproved by the Board of Directors for prior fiscal years, all pursuant to terms substantially similar to those described above, and approximately $324 and $246 ofcompensation expense related to the restricted stock was recorded during the six months ended September 30, 2012 and 2011, respectively. Restricted stock activity for the sixmonths ended September 30, 2012 is summarized as follows:

Number of
Shares
Weighted-Average
Grant-DateFair Valueper Share
Outstanding, April 1, 2012 30,001 $ 36.32
Granted 21,275 19.08
Vested (17,667) 31.95
Outstanding, September 30, 2012 33,609 $ 26.68
As of September 30, 2012, $811 of total unrecognized compensation costs related to restricted stock is expected to be recognized over a weighted-average period of 2.2 years.This amount does not include the cost of new restricted stock that may be granted in future periods. 11. Concentration of Credit Risk
The Company had cash deposits at U.S. banks and financial institutions which exceeded federally insured limits at September 30, 2012. The Company is exposed to credit lossfor amounts in excess of insured limits in the event of non-performance by the institutions; however, the Company does not anticipate non-performance by these institutions.
12. Commitments, Guarantees and Contingencies
Commitments and Guarantees
Software license agreements in both the QSI Dental Division and NextGen Division include a performance guarantee that the Company's software products will substantiallyoperate as described in the applicable program documentation for a period of 365 days after delivery. To date, the Company has not incurred any significant costs associatedwith its performance guarantee or other related warranties and does not expect to incur significant warranty costs in the future. Therefore, no accrual has been made forpotential costs associated with these warranties. Certain arrangements also include performance guarantees related to response time, availability for operational use, and otherperformance-related guarantees. Certain arrangements also include penalties in the form of maintenance credits should the performance of the software fail to meet theperformance guarantees. To date, the Company has not incurred any significant costs associated with these warranties and does not expect to incur significant warranty costs inthe future. Therefore, no accrual has been made for potential costs associated with these warranties.
The Company has historically offered short-term rights of return in certain sales arrangements. If the Company is able to estimate returns for these types of arrangements andall other criteria for revenue recognition have been met, revenue is recognized and these arrangements are recorded in the consolidated financial statements. If the Company isunable to estimate returns for these types of arrangements, revenue is not recognized in the consolidated financial statements until the rights of return expire, provided also, thatall other criteria of revenue recognition have been met.
Certain standard sales agreements contain a money back guarantee providing for a performance guarantee that is already part of the software license agreement as well astraining and support. The money back guarantee also warrants that the software will remain robust and flexible to allow participation in the federal health incentive programs.The specific elements of the performance guarantee pertain to aspects of the software, which the Company has already tested and confirmed to consistently meet using theCompany's existing software without any modifications or enhancements. To date, the Company has not incurred any costs associated with this guarantee and does not expectto incur significant costs in the future. Therefore, no accrual has been made for potential costs associated with this guarantee.
The Company's standard sales agreements in the NextGen Division contain an indemnification provision pursuant to which it shall indemnify, hold harmless, and reimburse theindemnified party for losses suffered or incurred by the indemnified party in connection with any United States patent, any copyright or other intellectual property infringementclaim by any third-party with respect to its software. The QSI Dental Division arrangements occasionally utilize this type of language as well. As the Company has notincurred any significant costs to defend lawsuits or settle claims related to these indemnification agreements, the Company believes that its estimated exposure on theseagreements is currently minimal. Accordingly, the Company has no liabilities recorded for these indemnification obligations.
The Company has entered into marketing assistance agreements with existing users of the Company's products which provide the opportunity for those users to earncommissions if they host specific site visits upon the Company's request for prospective clients that directly result in a purchase of the Company's software by the visitingprospects. Amounts earned by existing users under this program are treated as a selling expense in the period when earned.
13. Operating Segment Information
The Company has four reportable segments that are evaluated regularly by its chief decision making group in deciding how to allocate resources and in assessing performance.

Operating segment data is as follows:
Three Months Ended September 30, Six Months Ended September 30,
2012 2011 2012 2011
Revenue:
QSI Dental Division $ 4,846 $ 4,512 $ 9,800 $ 9,607
NextGen Division 87,328 82,489 173,521 157,114
Hospital Solutions Division 8,172 8,453 19,536 15,744
RCM Services Division 15,782 12,180 31,567 25,611
Consolidated revenue $ 116,128 $ 107,634 $ 234,424 $ 208,076
Operating income:
QSI Dental Division $ 679 $ 620 $ 1,148 $ 1,898
NextGen Division 33,897 34,310 62,737 63,635
Hospital Solutions Division (1,165) 2,451 1,182 5,513
RCM Services Division 1,789 1,098 3,642 3,139
Unallocated corporate expense (1) (10,856) (6,912) (20,858) (13,799)
Consolidated operating income $ 24,344 $ 31,567 $ 47,851 $ 60,386
_________________________________(1) Unallocated corporate expense includes eliminations relating to QSIH revenues and related expenses included in the results of operating segments. For the six monthsended September 30, 2012 and 2011, eliminations were not significant.
Management evaluates performance based upon stand-alone segment operating income. Because the Company does not evaluate performance based upon return on assets atthe operating segment level, assets are not tracked internally by segment. Therefore, segment asset information is not presented.
14. Subsequent Events
On October 25, 2012, the Board of Directors approved a quarterly cash dividend of $0.175 per share on the Company’s outstanding shares of common stock, payable toshareholders of record as of December 14, 2012 with an expected distribution date on or about January 4, 2013.
ITEM 2. MANAGEMENT’S DISCUSSION AND ANALYSIS OF FINANCIAL CONDITION AND RESULTS OF OPERATIONS
CAUTIONARY NOTE REGARDING FORWARD-LOOKING STATEMENTS
This Quarterly Report on Form 10-Q and certain information incorporated herein by reference contain forward-looking statements within the “safe harbor” provisions of thePrivate Securities Litigation Reform Act of 1995. All statements included or incorporated by reference in this Quarterly Report on Form 10-Q, other than statements that arepurely historical, are forward-looking statements. Words such as “anticipate,” “expect,” “intend,” “plan,” “believe,” “seek,” “estimate,” “will,” “should,” “would,” “could,”“may,” and similar expressions also identify forward-looking statements. These forward-looking statements include, without limitation, discussions of our productdevelopment plans, business strategies, future operations, financial condition and prospects, developments in and the impacts of government regulation and legislation,including, without limitation, The American Recovery and Reinvestment Act and The Patient Protection and Affordable Care Act, and market factors influencing our results.Our expectations, beliefs, objectives, intentions and strategies regarding our future results are not guarantees of future performance and are subject to risks and uncertainties,both foreseen and unforeseen, that could cause actual results to differ materially from results contemplated in our forward-looking statements. These risks and uncertaintiesinclude, but are not limited to, our ability to continue to develop new products and increase systems sales in markets characterized by rapid technological evolution,consolidation, and competition from larger, better-capitalized competitors. Many other economic, competitive, governmental and technological factors could affect our abilityto achieve our goals, and interested persons are urged to review any risks that may be described in “Item 1A. Risk Factors” as set forth herein and other risk factors appearingin our most recent Annual Report on Form 10-K for the fiscal year ended March 31, 2012 (“Annual Report”), as supplemented by additional risk factors, if any, in our interimfilings on our Quarterly Report on Form 10-Q, as well as in our other public disclosures and filings with the Securities and Exchange Commission ("SEC"). Because of theserisk factors, as well as other variables affecting our financial condition and results of operations, past financial performance may not be a reliable indicator of futureperformance and historical trends should not be used to anticipate results or trends in future periods. We assume no obligation to update any forward-looking statements. Youare cautioned not to place undue reliance on forward-looking statements, which speak only as of the date of the filing of this Quarterly Report on Form 10-Q.
This management's discussion and analysis of financial condition and results of operation, or MD&A, is provided as a supplement to the consolidated financial statements andnotes thereto included elsewhere in this Quarterly Report on Form 10-Q in order to enhance your understanding of our results of operations and financial condition and shouldbe read in conjunction with, and is qualified in its entirety by, the consolidated financial statements and related notes thereto included elsewhere in this Quarterly Report onForm 10-Q. Historical results of operations, percentage margin fluctuations and any trends that may be inferred from the discussion below are not necessarily indicative of theoperating results for any future period.
Our MD&A is organized as follows:
• Management Overview. This section provides a general description of our Company and operating segments, a discussion as to how we derive our revenue,background information on certain trends and developments affecting our Company, a summary of our acquisition transactions and a discussion onmanagement’s strategy for driving revenue growth.
• Critical Accounting Policies and Estimates. This section discusses those accounting policies that are considered important to the evaluation and reporting of ourfinancial condition and results of operations, and whose application requires us to exercise subjective or complex judgments in making estimates andassumptions. In addition, all of our significant accounting policies, including our critical accounting policies, are summarized in Note 1, “Summary ofSignificant Accounting Policies,” of our notes to consolidated financial statements included elsewhere in this Quarterly Report on Form 10-Q.
• Company Overview. This section provides a more detailed description of our Company, operating segments, products and services offered.
• Overview of Results of Operations and Results of Operations by Operating Divisions. These sections provide our analysis and outlook for the significant line itemson our consolidated statements of income, as well as other information that we deem meaningful to understand our results of operations on both a consolidatedbasis and an operating division basis.
• Liquidity and Capital Resources. This section provides an analysis of our liquidity and cash flows.
• New Accounting Pronouncements. This section provides a summary of the most recent authoritative accounting standards and guidance that have either been recentlyadopted by our Company or may be adopted in the future.

Management Overview
Quality Systems, Inc. and its wholly-owned subsidiaries operate as four business divisions which are comprised of: (i) the QSI Dental Division, (ii) the NextGen Division,(iii) the Hospital Solutions Division (formerly Inpatient Solutions) and (iv) the RCM Services Division (formerly Practice Solutions). In fiscal year 2011, we opened a captiveentity in India called Quality Systems India Healthcare Private Limited (“QSIH”). We primarily derive revenue by developing and marketing healthcare information systemsthat automate certain aspects of medical and dental practices, networks of practices such as physician hospital organizations (“PHOs”) and management service organizations(“MSOs”), ambulatory care centers, community health centers and medical and dental schools along with comprehensive systems implementation, maintenance and supportand add on complementary services such as revenue cycle management (“RCM”) and electronic data interchange (“EDI”). Our systems and services provide our clients withthe ability to redesign patient care and other workflow processes while improving productivity through the facilitation of managed access to patient information. Utilizing ourproprietary software in combination with third-party hardware and software solutions, our products enable the integration of a variety of administrative and clinical informationoperations.
The turbulence in the worldwide economy has impacted almost all industries. While healthcare is not immune to economic cycles, we believe it is more heavily influenced byUS-based regulatory and national health projects than by the economic cycles of our economy. The impact of the current economic conditions on our existing and prospectiveclients has been mixed. While we continue to see organizations that are doing fairly well operationally, some organizations, especially those with a large dependency onMedicaid populations, have been impacted by the challenging financial conditions faced by many state governments. Various factors have had, and are anticipated to continueto have, a meaningful impact on the U.S. healthcare industry, including the Obama Administration's broad healthcare reform efforts (particularly the HITECH portion of theAmerican Recovery and Reinvestment Act and the Patient Protection and Affordable Care Act), the individual state responses to the government-requested Medicaidexpansion to address new insureds, and the increasing focus of private businesses on moving their employee health benefit offerings to a more wellness-based health platform.
Our strategy is to focus on providing software and services to the medical and dental communities, both in the ambulatory and inpatient settings. The key elements of thisstrategy are to continue development and enhancement of our software solutions to support healthcare reform and the transition from fee for service to pay forperformance/quality initiatives such as accountable care organizations. We also want to continue to bring further integration between our ambulatory and inpatient products, tocontinue investments in our infrastructure including but not limited to product development, sales, marketing, implementation and support, to continue efforts to makeinfrastructure investments within an overall context of maintaining reasonable expense discipline, to add new clients through maintaining and expanding sales, marketing andproduct development activities and to expand our relationship with existing clients through delivery of add-on and complementary products and services while continuing ourgold-standard commitment of service in support of our client satisfaction programs. We believe that our growing customer base that is using our software on a daily basis is astrategic asset, and we intend to expand our product and service offerings towards this customer base in order to leverage this strategic asset.
Critical Accounting Policies and Estimates
The discussion and analysis of our consolidated financial statements and results of operations is based upon our consolidated financial statements, which have been prepared inaccordance with accounting principles generally accepted in the United States of America. The preparation of these consolidated financial statements requires us to makeestimates and judgments that affect the reported amounts of assets, liabilities, revenue and expenses, and related disclosures of contingent assets and liabilities. On an on-goingbasis, we evaluate estimates (including but not limited to those related to revenue recognition, uncollectible accounts receivable, software development cost, intangible assetsand self-insurance accruals) for reasonableness. We base our estimates on historical experience and on various other assumptions that management believes to be reasonableunder the circumstances, the results of which form the basis for making judgments about the carrying values of assets and liabilities that may not be readily apparent from othersources. Actual results may differ from these estimates under different assumptions or conditions.
We describe our significant accounting policies in Note 2, “Summary of Significant Accounting Policies,” of our notes to consolidated financial statements included in ourAnnual Report. We discuss our critical accounting policies and estimates in Item 7, “Management’s Discussion and Analysis of Financial Condition and Results ofOperations,” of our Annual Report. There have been no material changes in our significant accounting policies or critical accounting policies and estimates since the end offiscal year 2012.
Company Overview
Quality Systems, Inc. was incorporated in California in 1974. Our principal offices are located at 18111 Von Karman Ave., Suite 700, Irvine, California, 92612. We operate ona fiscal year ending on March 31.
The Company was founded with an early focus on providing information systems to dental group practices. This focus area would later become the QSI Dental Division. In themid-1980's, we capitalized on the increasing focus on medical cost containment and further expanded our information processing systems to serve the medical market. In themid-1990's, we made two acquisitions that accelerated our penetration of the medical market and formed the basis for the NextGen Division. Today, we serve the dentalmarkets through our QSI Dental Division, physician practice, inpatient and RCM services through NextGen Division, Hospital Solutions Division and RCM Services Division.
The Divisions operate largely as stand-alone operations, with each Division maintaining its own distinct product lines, product platforms, development, implementation andsupport teams and branding. However, there are a growing number of customers who are simultaneously utilizing software or services from more than one of our Divisions. Inan effort to encourage this cross selling of our products and services between Divisions, we are in the process of further integrating our ambulatory and inpatient products toprovide a more robust and comprehensive platform to offer our customers. The Divisions also share the resources of our “corporate office,” which includes a variety ofaccounting and other administrative functions.
The QSI Dental Division and NextGen Division develop and market practice management software that is designed to automate and streamline a number of the administrativefunctions required for operating a medical or dental practice, such as patient scheduling and billing. It is important to note that since in both the medical and dentalenvironments, practice management software systems have already been implemented by the vast majority of practices, we actively compete for the replacement market. TheQSI Dental Division and NextGen Division also develop and market software that automates patient records in physician practices, community health centers (CHC's) andhospital settings. In this patient records area of our business, we are typically competing to replace paper-based patient record alternatives as opposed to replacing previouslypurchased systems. The Hospital Solutions Division develops and markets an equivalent practice management software product, which performs administrative functionsrequired for operating a small hospital as well as physician documentation and computerized physician order entry (CPOE) charting.
In January 2011, QSIH was formed in Bangalore, India to function as our India-based captive to offshore technology application development and business processingservices.
We continue to pursue product and service enhancement initiatives within each of our Divisions. The majority of such expenditures are currently targeted to the NextGenDivision product line and client base.
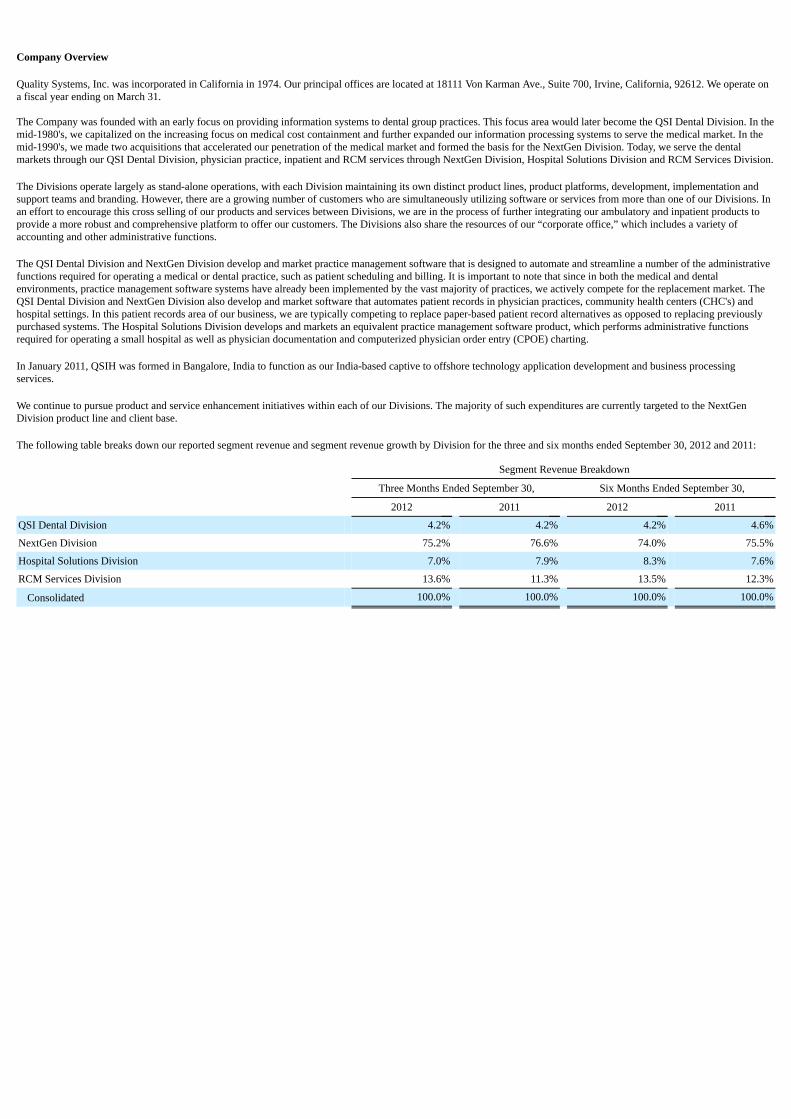
The following table breaks down our reported segment revenue and segment revenue growth by Division for the three and six months ended September 30, 2012 and 2011:
Segment Revenue Breakdown
Three Months Ended September 30, Six Months Ended September 30,
2012 2011 2012 2011
QSI Dental Division 4.2% 4.2% 4.2% 4.6%
NextGen Division 75.2% 76.6% 74.0% 75.5%
Hospital Solutions Division 7.0% 7.9% 8.3% 7.6%
RCM Services Division 13.6% 11.3% 13.5% 12.3%
Consolidated 100.0% 100.0% 100.0% 100.0%

Segment Revenue Growth
Three Months Ended September 30, Six Months Ended September 30,
2012 2011 2012 2011
QSI Dental Division 7.4 % (2.9)% 2.0% (3.9)%
NextGen Division 5.9 % 35.4 % 10.4% 27.1 %
Hospital Solutions Division (3.3)% 121.6 % 24.1% 125.8 %
RCM Services Division 29.6 % 1.1 % 23.3% 7.6 %
Consolidated 7.9 % 32.1 % 12.7% 26.6 %
QSI Dental Division. The QSI Dental Division, co-located with our corporate headquarters in Irvine, California, focuses on developing, marketing and supporting softwaresuites sold to dental organizations located throughout the United States. In addition, the QSI Dental Division supports a growing number of dental organizations using itsSoftware as a Service (“SaaS”) model-based financial and clinical software, as well as a number of medical clients that use the QSI Dental Division's UNIX®-based legacymedical practice management software product. This SaaS software, formerly called NextDDS™, has undergone a name change and is now “QSIDental™ Web”. The namechange was undertaken to give the product stronger identification in the marketplace as a web-based solution.
In July 2009, we licensed source code that allows us to deliver hosted, Web-based SaaS model practice management and clinical software solutions to the dental industry. Thissoftware solution, QSIDental Web, is being marketed primarily to the multi-location dental group practice market in which the QSI Dental Division has historically been adominant player. QSIDental Web moves the QSI Dental Division to the forefront of the emergence of Internet-based applications and cloud computing and represents asignificant growth opportunity for the Division to sell to both its existing client base and new clients. The QSI Dental Division participates jointly with the NextGen Division in providing software and services to safety-net clinics like Federally Qualified Health Centers(“FQHC”) and other “safety net” health centers, including Public Health Centers, Community Health Centers, Free Clinics, as well as Rural and Tribal Health Centers. FQHCsare community-based organizations and are funded by the federal government, which provide medical and dental services to underprivileged and underserved communities.The Patient Protection and Affordable Care Act, which was signed into law in March 2010, reserved $11 billion over a multi-year period for FQHCs, creating unprecedentedopportunities for FQHCs growth and the formation of new FQHCs. When combined and used in tandem, NextGen Ambulatory EHR, NextGen Electronic Dental Record andNextGen Practice Management provides a unique product in this marketplace - an integrated patient record accessible by both physicians and dentists. The QSI Dental Division's legacy practice management software suite uses a UNIX® operating system. It's Clinical Product Suite (“CPS”) can be fully integrated with theclient server-based practice management software offered from each of our Divisions. When integrated and delivered with the NextGen Healthcare practice managementsolution, CPS is re-branded as NextGen EDR (Electronic Dental Record). CPS/EDR incorporates a wide range of clinical tools including, but not limited to, periodontalcharting and digital imaging of X-ray and inter-oral camera images as part of the electronic patient record. The QSI Dental Division also develops, markets, and provides EDIservices to dental practices, including electronic submission of claims to insurance providers as well as automated patient statements.
NextGen Division. The NextGen Division, with headquarters in Horsham, Pennsylvania and a significant location in Atlanta, Georgia, provides integrated clinical, financialand connectivity solutions for ambulatory and dental provider organizations. The NextGen Division's major product categories include the NextGen Ambulatory product suiteand NextGen Community Connectivity.
The NextGen Ambulatory product suite streamlines patient care with standardized, real-time clinical and administrative workflows within a physician’s practice, and majorproduct categories include NextGen Electronic Health Records (“NextGenehr”), NextGen Practice Management (“NextGenpm”), NextGen Dashboard, NextGen Mobile andNextGen NextPen. NextGen Community Connectivity consists of NextGen Health Information Exchange (“NextGen HIE,” formerly Community Health Solution), NextGenPatient Portal (“NextMD.com”), and NextGen Health Quality Measures (“NextGen HQM”). The NextGen Division also offers hosting services, NextGuard – Data Protectionservices, and consulting services, such as strategic governance models and operational transformation, technical consulting such as data conversions or interface development.The NextGen Division products utilize Microsoft Windows technology and can operate in a client-server environment as well as via private intranet, the Internet, or in an ASPenvironment. The NextGen Division also provides EDI services, which include electronic submission of claims to insurance providers as well as automated patient statements.
Hospital Solutions Division. The Hospital Solutions Division, with its primary location in Austin, Texas, provides integrated clinical, financial and connectivity solutions forrural and community hospitals. This Hospital Solutions Division also develops and markets an equivalent practice management software product for the small hospital market,which performs the administrative functions required for operating a small hospital.
In the last few years, we have continued to acquire companies that were established developers of software and services for the inpatient market to operate under the HospitalSolutions Division. On May 1, 2012, we acquired The Poseidon Group, Inc. ("Poseidon"), a provider of emergency

department software. On July 26, 2011, we acquired CQI Solutions, Inc. ("CQI"), a provider of hospital systems for surgery management. On April 29, 2011, we acquiredIntraNexus, Inc. ("IntraNexus"), a provider of Web-based integrated clinical and hospital information systems. On February 10, 2010, we acquired Opus Healthcare Solutions,LLC ("Opus"), a provider of Web-based clinical solutions to hospital systems and integrated health networks nationwide. On August 12, 2009, we acquired Sphere HealthSystems, Inc. ("Sphere"), a provider of financial information systems to the small hospital inpatient market. These acquisitions are part of our strategy to continue to expand inthe small hospital market and to add new clients by taking advantage of cross selling opportunities between the ambulatory and inpatient markets. RCM Services Division. The RCM Services Division, with locations in St. Louis, Missouri and Hunt Valley, Maryland, provides technology solutions and consulting servicesto cover the full spectrum of healthcare providers' RCM needs, from patient access through claims denials, with a primary focus on billing and collection services. The RCMServices Division combines a Web-delivered SaaS model and the NextGenpm software platform to execute its service offerings. Execution of the plan to transition our clientbase onto the NextGen platform is being implemented. On April 15, 2012, we acquired Matrix Management Solutions, LLC (“Matrix”). Since 1998, North Canton, Ohio-basedMatrix, a value-added reseller for NextGen Healthcare, has provided RCM services, healthcare IT solutions and training, implementation and support centered on NextGen®
technology, to its clients nationwide. The acquisition will enable our RCM Services Division to expand its footprint among private and hospital-based physicians and groups byleveraging Matrix's RCM expertise. Overview of Our Results
• Consolidated revenue increased 12.7% and income from operations decreased 20.8% in the six months ended September 30, 2012 as compared to the same prior yearperiod. Revenue was positively impacted by growth in implementation sales as well as service revenue, which grew 78.0% and 21.0%, respectively.
• Consolidated operating income was negatively impacted by: (a) a change in the mix of revenue towards lower margin service revenue, (b) higher selling, general andadministrative expenses, which was primarily a result of increased headcount and selling-related expenses at the NextGen Division and (c) higher corporate-relatedexpenses.
• We have benefited and hope to continue to benefit from the increased demands on healthcare providers for greater efficiency and lower costs, financial incentives from theARRA to physicians who adopt electronic health records, as well as increased adoption rates for electronic health records and other technology in the healthcare arena. Wealso believe that healthcare reform and the movement towards pay for performance/quality initiatives will also stimulate demand for robust enterprise electronic healthrecord software as well.
• While we expect to benefit from the increasing demands for greater efficiency as well as government support for increased adoption of electronic health records, thecurrent economic environment, the increased adoption rates already achieved by large practices, combined with unpredictability of the federal government's plans topromote increased adoption of electronic medical records, makes the near term achievement of such benefits and, ultimately, their impact on system sales, uncertain.
• The consolidation of healthcare providers by hospitals, payers, and large physician groups is creating both competitive threats as well as opportunities for our products.Hospital software providers are leveraging their position with their hospital customers to gain market share with hospital owned physician practices. Insurance providersand large physician groups are also consolidating physician offices creating additional opportunity for ambulatory software providers such as NextGen.
QSI Dental Division
• QSI Dental Division revenue increased 2.0% in the six months ended September 30, 2012 and divisional operating income (excluding unallocated corporate expenses)decreased 39.5% as compared to the same prior year period. The decline in operating income is the result of a decrease in system sales and higher selling, general andadministrative expenses in the current period. It should be noted that the QSI Dental Division's new software solution (“QSIDental™ Web”) is being sold as a SaaSsolution which spreads revenue over a longer period of time rather than being recognized upfront. Revenue recognized from QSIDental Web was not significant in the sixmonths ended September 30, 2012.
• The QSI Dental Division is well-positioned to sell to the FQHCs market and intends to continue leveraging the NextGen Division's sales force to sell its dental electronicmedical records software to practices that provide both medical and dental services, such as FQHCs, which are receiving grants as part of the ARRA.
• Our goal for the QSI Dental Division is to maximize profit performance given the constraints represented by a relatively weak purchasing environment in the dental grouppractice market while taking advantage of opportunities with the new QSIDental™ Web product.
NextGen Division• NextGen Division revenue increased 10.5% in the six months ended September 30, 2012 and divisional operating income (excluding unallocated corporate expenses)
decreased 1.4% as compared to the same prior year period. NextGen revenue was positively impacted by growth in implementation and service revenue which grew84.0% and 20.2%, respectively.
• Recurring revenue, which consists primarily of maintenance and EDI revenue, increased 16.6% to $90.7 million and accounted for 52.3% of total NextGen Divisionrevenue for the six months ended September 30, 2012. In the same period a year ago, recurring revenue of $77.8 million represented 50.0% of total NextGen Divisionrevenue.

• During the six months ended September 30, 2012, we added staffing resources in anticipation of growth from the ARRA and the future of healthcare reform andaccountable care organizations. Our goals include taking maximum advantage of benefits related to the ARRA and continuing to further enhance our existing products,including continued efforts to maintain our status as a qualified vendor under the ARRA, integrating our inpatient and ambulatory software products, further developmentand enhancements of our portfolio of specialty focused templates within our EHR software, developing new products for targeted markets, continuing to add new clients,selling additional software and services to existing clients, expanding penetration of connectivity and other services to new and existing clients, and capitalizing on growthand cross selling opportunities within the RCM Services Division and the Hospital Solutions Division.
• The NextGen Division's growth is attributed to a strong brand name and reputation within a growing marketplace for electronic health records and investments in sales andmarketing activities, including new marketing campaigns, trade show attendance and other expanded advertising and marketing expenditures. We have also benefited fromwinning numerous industry awards for the NextGen Division's flagship NextGenehr and NextGenpm software products and more recently in 2010 for its NextGen HIEproduct. Further, the increasing acceptance of electronic records technology in the healthcare industry continues to provide growth opportunities.
Hospital Solutions Division
• Hospital Solutions Division revenue increased 24.1% in the six months ended September 30, 2012. Divisional operating income (excluding unallocated corporateexpenses) decreased 78.6% to $1.2 million for the six months ended September 30, 2012 as compared to $5.5 million for the same prior year period. However, revenue forthe six months ended September 30, 2012 was negatively impacted by the termination of maintenance by a large customer and an increase in reserves related to certaincustomer implementation issues.
• Operating income for the six months ended September 30, 2012 was negatively impacted by increases in implementation costs. In addition, operating income as apercentage of revenue decreased to approximately 6.1% of revenue in the six months ended September 30, 2012 versus 35.0% of revenue in the same prior year periodprimarily as a result of lower gross profit margin due to a change in revenue mix towards lower margin service revenue, as well as a $2.5 million increase in selling,general and administrative expenses during the period.
• Our acquisition of Poseidon in May 2012 did not significantly impact the Hospital Solutions Division results for the period.
• The Hospital Solutions Division has benefited from being able to offer both financial and CCHIT® certified clinical software, which has been packaged together. TheHospital Solutions Division has also benefited from cross sell opportunities with existing NextGen Division customers, including hospitals that are owned or affiliatedwith physician offices.
• We intend to continue to invest in implementation and training, support, and development to support our growing customer base.
RCM Services Division
• RCM Services Division revenue increased 23.3% in the six months ended September 30, 2012. Divisional operating income (excluding unallocated corporate expenses)increased 16.0% to $3.6 million in the six months ended September 30, 2012 as compared to $3.1 million for the same prior year period. Our acquisition of Matrix in April2012 added approximately $5.8 million in revenue for the current period.
• The RCM Services Division benefited from organic growth achieved through cross selling RCM services to existing NextGen Division clients and well as new clientsadded during the six months ended September 30, 2012. The division also benefited from the cross sale of software and services to its existing customers. Systems sales toexisting RCM Services customers are credited to the division.
• The Company believes that a significant opportunity exists to cross sell revenue cycle management services to existing NextGen ambulatory customers. The portion ofexisting NextGen Division customers who are using the RCM Services Division's RCM services is less than 15%. There is also a significant opportunity to expand theRCM Services Division's services into the Hospital Solution Division's customers as well. Management is actively pursuing efforts to achieve faster growth from expandedefforts to leverage the existing NextGen Division's sales force towards selling revenue cycle management services.
• Operating income as a percentage of revenue decreased to approximately 11.5% of revenue in the six months ended September 30, 2012 versus 12.3% of revenue in thesame prior year period primarily as a result of a drop in system sales to RCM customers compared to the prior year period, as well as higher selling, general andadministrative expenses during the current period.
The following table sets forth, for the periods indicated, the percentage of net revenue represented by each item in our consolidated statements of income (certain percentagesbelow may not sum due to rounding):

Three Months Ended September 30, Six Months Ended September 30,
(Unaudited) 2012 2011 2012 2011
Revenues:
Software, hardware and supplies 20.4% 29.6% 21.1% 29.2%
Implementation and training services 7.3 5.7 8.8 5.6
System sales 27.8 35.3 29.9 34.8
Maintenance 33.3 32.7 33.0 32.1
Electronic data interchange services 12.9 11.1 12.3 11.6
Revenue cycle management and related services 12.5 10.4 12.3 11.1
Other services 13.5 10.5 12.5 10.5
Maintenance, EDI, RCM and other services 72.2 64.7 70.1 65.3
Total revenues 100.0 100.0 100.0 100.0
Cost of revenue: Software, hardware and supplies 4.8 3.9 4.9 4.2
Implementation and training services 6.5 4.7 7.1 4.4
Total cost of system sales 11.3 8.6 12.0 8.6
Maintenance 4.1 3.7 4.1 3.8
Electronic data interchange services 7.9 7.4 7.8 7.7
Revenue cycle management and related services 9.1 7.9 9.1 8.3
Other services 7.6 5.9 7.4 5.8
Total cost of maintenance, EDI, RCM and other services 28.7 24.9 28.4 25.6
Total cost of revenue 39.9 33.5 40.4 34.1
Gross profit 60.1 66.5 59.6 65.9
Operating expenses:
Selling, general and administrative 32.6 29.9 31.8 29.6
Research and development costs 5.4 6.8 6.3 6.8
Amortization of acquired intangible assets 1.1 0.5 1.0 0.5
Total operating expenses 39.1 37.2 39.1 36.9
Income from operations 21.0 29.3 20.4 29.0
Interest income (expense), net (0.1) 0.1 0.0 0.1
Other income (expense), net 0.2 (0.1) 0.0 (0.1)
Income before provision for income taxes 21.1 29.3 20.4 29.0
Provision for income taxes 7.6 10.2 7.1 10.0
Net income 13.5% 19.0% 13.3% 19.0%
Comparison of the Three Months Ended September 30, 2012 and September 30, 2011
Net Income. Our net income for the three months ended September 30, 2012 was $15.7 million, or $0.26 per share on both a basic and fully diluted basis. In comparison, weearned $20.5 million, or $0.35 per share on both a basic and fully diluted basis for the three months ended September 30, 2011. The change in net income for the three monthsended September 30, 2012 was primarily attributed to the following:
• an increase in recurring revenue based gross profit, including maintenance, RCM and EDI which grew 8.8%, 46.4% and 46.1%, respectively, compared to the prioryear period; offset by
• an decrease in implementation services gross profit of 1.6% compared to the prior year period;• a 34.6% decrease in consolidated software, hardware and supplies gross profit as a result of reduced software revenue; and• an increase in selling, general and administrative expenses and amortization of acquired intangibles.
Revenue. Revenue for the three months ended September 30, 2012 increased 7.9% to $116.1 million from $107.6 million for the three months ended September 30, 2011.NextGen Division revenue increased 5.9% to $87.3 million from $82.5 million in the three months ended September 30, 2011, QSI Dental Division revenue increased 7.4% to$4.8 million from $4.5 million, RCM Services Division revenue

increased 29.6% to $15.8 million from $12.2 million, and Hospital Solutions Division revenue decreased 3.3% during that same period to $8.2 million from $8.5 million.
System Sales. Revenue earned from our company-wide sales of systems for the three months ended September 30, 2012 decreased 15.0% to $32.3 million from $38.0 millionin the same prior year period.
Our decrease in revenue from sales of systems was principally the result of a 17.1% decrease in revenue at our NextGen Division, which decreased $5.6 million to $27.0million during the three months ended September 30, 2012 from $32.6 million during the same prior year period. The decrease was driven by a decrease in software revenue,partially offset by an increase in implementation and training services revenue. Our decline in software revenue was related to a number of factors including higher adoptionrates by large physician groups which results in a smaller number of new opportunities, the consolidation of physician offices by hospitals and other large enterprises therebyreducing the number of potential opportunities, and an extension to the deadline to adopt stage two meaningful use requirements until calendar 2014.
We believe there are other trends which may positively impact future systems sales. Many of our existing large enterprise customers have plans to grow which will drive futurerevenue opportunities as these customers purchase additional software and services to support their growth plans. We also expect to benefit from the growth of a replacementmarket driven by an expected consolidation of EHR vendors. Finally, we believe many new opportunities will be created by the evolution of healthcare from a pay for servicesreimbursement model to a pay for performance model around the management of patient populations. We are developing new products around these new opportunities whichare expected to help drive future growth. It is difficult to assess the relative impact as well as the timing of positive and negative trends, however, we believe the long termopportunities for the Company are significant.
The following table breaks down our reported system sales into software, hardware, third-party software, supplies and implementation and training services components on aconsolidated and divisional basis for the three months ended September 30, 2012 and 2011 (in thousands):
Software
Hardware, ThirdParty Softwareand Supplies
Implementationand Training
Services Total System
Sales
Three Months Ended September 30, 2012
QSI Dental Division $ 302 $ 471 $ 394 $ 1,167
NextGen Division 18,851 1,757 6,451 27,059
Hospital Solutions Division 1,917 297 1,599 3,813
RCM Services Division 125 — 91 216
Consolidated $ 21,195 $ 2,525 $ 8,535 $ 32,255
Three Months Ended September 30, 2011
QSI Dental Division $ 397 $ 451 $ 241 $ 1,089
NextGen Division 27,056 982 4,590 32,628
Hospital Solutions Division 2,621 340 1,217 4,178
RCM Services Division 13 — 46 59
Consolidated $ 30,087 $ 1,773 $ 6,094 $ 37,954
NextGen Division software license revenue decreased 30.3% in the three months ended September 30, 2012 versus the same period last year. The NextGen Division’s softwarerevenue accounted for 69.7% of divisional system sales revenue during the three months ended September 30, 2012 compared to 82.9% during the same period a year ago.Software license revenue continues to be an area of primary emphasis for the NextGen Division.
During the three months ended September 30, 2012, 6.5% of the NextGen Division’s system sales revenue was represented by hardware and third-party software compared to3.0% during same period a year ago. The number of clients who purchase hardware and third-party software and the dollar amount of hardware and third-party softwarerevenue fluctuates each quarter depending on the needs of clients. The inclusion of hardware and third-party software in the NextGen Division’s sales arrangements is typicallyat the request of our clients.
Implementation and training revenue related to system sales at the NextGen Division increased 40.5% in the three months ended September 30, 2012 compared to the sameprior year period. Implementation and training revenue related to system sales at the Hospital Solutions Division increased 31.4%, in the three months ended September 30,2012 as compared to the same prior year period. The amount of implementation and training services revenue is dependent on several factors, including timing of clientimplementations, the availability of qualified staff and the mix of services being rendered. The number of implementation and training staff increased during the three monthsended September 30, 2012 versus the same prior year period in order to accommodate the increased amount of implementation services sold in conjunction with software sales.We have experienced a decline in the level of systems sales in recent quarters which in turn have resulted in a decline in the amount of implementation services sold comparedto prior periods, specifically in the ambulatory business unit. We intend to address the fluctuation in demand for services by managing the use of third parties forimplementation services. We have historically relied on third parties for a portion of our implementations in order to manage customer requirements.

Maintenance, EDI, RCM and Other Services. For the three months ended September 30, 2012, our company-wide revenue from maintenance, EDI, RCM and other servicesgrew 20.4% to $83.9 million from $69.7 million in the same prior year period. The increase is primarily due to an increase in maintenance, EDI and other services revenuefrom the NextGen Division and RCM revenue from the RCM Services Division.
Total NextGen Division maintenance revenue for the three months ended September 30, 2012 grew 11.5% to $33.1 million from $29.7 million for the same prior year periodwhile NextGen Division EDI revenue grew 26.9% to $13.7 million compared to $10.8 million in the same prior year period. Other services revenue for the NextGen Division,which consists primarily of third-party annual software license renewals, consulting services, SaaS fees and hosting services, increased 43.5% to $13.5 million in the threemonths ended September 30, 2012 from $9.4 million in the same prior year period. Other services revenue benefited from a strong increase in consulting revenue to existingNextGen Division customers.
QSI Dental Division maintenance, EDI and other services revenue for the three months ended September 30, 2012 and 2011 was $3.7 million and $3.4 million, respectively.For the three months ended September 30, 2012, RCM revenue for the RCM Services Division increased to $14.5 million compared to $11.1 million in the same prior yearperiod. RCM revenue was positively impacted by the acquisition of Matrix which contributed $3.2 million in the current period. For the Hospital Solutions Division,maintenance and other services revenue for the three months ended September 30, 2012 increased 1.9% as compared to the same prior year period primarily due to an increasein other services revenue.
The following table details maintenance, EDI, RCM and other services revenue by category on a consolidated and divisional basis for the three months ended September 30,2012 and 2011 (in thousands):
Maintenance EDI RCM Other Total
Three Months Ended September 30, 2012
QSI Dental Division $ 1,946 $ 1,350 $ — $ 383 $ 3,679
NextGen Division 33,071 13,696 — 13,502 60,269
Hospital Solutions Division 3,478 — — 881 4,359
RCM Services Division 220 (22) 14,486 882 15,566
Consolidated $ 38,715 $ 15,024 $ 14,486 $ 15,648 $ 83,873
Three Months Ended September 30, 2011
QSI Dental Division $ 1,918 $ 1,189 $ — $ 316 $ 3,423
NextGen Division 29,653 10,796 — 9,412 49,861
Hospital Solutions Division 3,619 — — 656 4,275
RCM Services Division 24 — 11,142 955 12,121
Consolidated $ 35,214 $ 11,985 $ 11,142 $ 11,339 $ 69,680
Maintenance revenue for the NextGen Division increased by $3.4 million for the three months ended September 30, 2012 as compared to the same prior year period. Thegrowth in maintenance revenue is primarily a result of increases related to net additional licenses from new clients and existing clients, as well as a price increase that becameeffective during the quarter ended September 30, 2011.
The NextGen Division’s EDI revenue growth has come from new clients and from further penetration of the division’s existing client base while the growth in RCM revenue isprimarily attributable to the Matrix acquisition. We intend to continue to promote maintenance, EDI and RCM services to both new and existing clients. Growth in otherservices revenue is primarily due to increases in third-party annual software licenses, consulting services, SaaS fees and hosting services revenue.
Cost of Revenue. Cost of revenue for the three months ended September 30, 2012 increased 28.7% to $46.4 million from $36.0 million in the same prior year period and thecost of revenue as a percentage of revenue increased to 39.9% from 33.5% driven primarily by a higher percentage of lower margin revenue streams such as implementationand RCM services as well as slight cost increases across all revenue categories.
The following table details revenue and cost of revenue on a consolidated and divisional basis for the three months ended September 30, 2012 and 2011 (in thousands):

Three Months Ended September 30,
2012 % 2011 %
QSI Dental Division
Revenue $ 4,846 100.0% $ 4,512 100.0%
Cost of revenue 2,621 54.1% 2,102 46.6%
Gross profit $ 2,225 45.9% $ 2,410 53.4%
NextGen Division
Revenue $ 87,328 100.0% $ 82,489 100.0%
Cost of revenue 27,850 31.9% 22,240 27.0%
Gross profit $ 59,478 68.1% $ 60,249 73.0%
Hospital Solutions Division
Revenue $ 8,172 100.0% $ 8,453 100.0%
Cost of revenue 4,238 51.9% 2,360 27.9%
Gross profit $ 3,934 48.1% $ 6,093 72.1%
RCM Services Division
Revenue $ 15,782 100.0% $ 12,180 100.0%
Cost of revenue 10,978 69.6% 8,760 71.9%
Gross profit $ 4,804 30.4% $ 3,420 28.1%
Unallocated cost of revenue $ 677 N/A $ 558 N/A
Consolidated
Revenue $ 116,128 100.0% $ 107,634 100.0%
Cost of revenue 46,364 39.9% 36,020 33.5%
Gross profit $ 69,764 60.1% $ 71,614 66.5%
Gross profit margins at the QSI Dental Division for the three months ended September 30, 2012 decreased to 45.9% from 53.4% for the same prior year period. Gross profitmargins at the NextGen Division for three months ended September 30, 2012 decreased to 68.1% compared to 73.0% for the same prior year period primarily due to decreasedsoftware sales. Gross margin in the Hospital Solutions Division decreased to 48.1% for the three months ended September 30, 2012 as compared to 72.1% for the same prioryear period due to growth in implementation and training revenue which carries lower profit margins compared to software. Implementation and training revenue in theHospital Solutions Division represented approximately 19.6% of total Hospital Solutions Division revenue compared to 14.4% in the year ago period. Gross margin in theRCM Services Division increased to 30.4% for the three months ended September 30, 2012 as compared to 28.1% for the same prior year period due to increased softwaresales, partially offset by an increase in RCM revenue which carries lower profit margins.
The following table details the individual components of cost of revenue and gross profit as a percentage of total revenue on a consolidated and divisional basis for the threemonths ended September 30, 2012 and 2011:
Hardware,Third PartySoftware
Payroll andRelatedBenefits EDI Other
Total Costof Revenue Gross Profit
Three Months Ended September 30, 2012
QSI Dental Division 8.8% 20.3% 14.6% 10.4% 54.1% 45.9%
NextGen Division 1.9% 11.7% 8.7% 9.6% 31.9% 68.1%
Hospital Solutions Division 3.2% 25.1% 0.0% 23.6% 51.9% 48.1%
RCM Services Division 0.0% 45.1% 1.0% 23.5% 69.6% 30.4%
Consolidated 2.0% 17.6% 7.3% 13.0% 39.9% 60.1%
Three Months Ended September 30, 2011
QSI Dental Division 7.3% 22.4% 8.4% 8.5% 46.6% 53.4%
NextGen Division 1.0% 11.5% 7.7% 6.8% 27.0% 73.0%
Hospital Solutions Division 3.6% 15.2% 0.0% 9.1% 27.9% 72.1%
RCM Services Division 0.0% 46.8% 2.0% 23.1% 71.9% 28.1%
Consolidated 1.4% 16.3% 6.5% 9.3% 33.5% 66.5%
During the three months ended September 30, 2012, hardware and third-party software constituted a higher portion of cost of revenue compared to the same prior year periodin the NextGen Division. The number of clients who purchase hardware and third-party software and the dollar amount of hardware and third-party software purchasedfluctuates each quarter depending on the needs of our clients.

Our payroll and benefits expense associated with delivering our products and services increased to 17.6% of consolidated revenue in the three months ended September 30,2012 compared to 16.3% during the same period last year. The absolute level of consolidated payroll and benefit expenses grew from $17.5 million in the three months endedSeptember 30, 2011 to $20.4 million in the three months ended September 30, 2012, an increase of 16.7%, or approximately $2.9 million. Of the $2.9 million increase,approximately $1.4 million of the increase is related to the RCM Services Division as RCM is a service business, which inherently has higher percentage of payroll costs as apercentage of revenue. Increases of approximately $0.8 million in the NextGen Division and $0.8 million for the Hospital Solutions Division are primarily due to headcountadditions and increased payroll and benefits expense associated with delivering products and services. Payroll and benefit expenses related to the QSI Dental Divisionremained consistent period over period. The amount of share-based compensation expense included in cost of revenue was not significant for the three months endedSeptember 30, 2012 and 2011.
Other cost of revenue, which primarily consists of third-party annual license, hosting costs and outsourcing costs, increased to 13.0% of total revenue during the three monthsended September 30, 2012 as compared to 9.3% for the same period a year ago. Other expenses increased as a percentage of revenue primarily due to a lower percentage ofrevenue from software licenses which do not carry a significant amount of other expenses.
As a result of the foregoing events and activities, our gross profit percentage decreased to 60.1% for the three months ended September 30, 2012 versus 66.5% for the sameprior year period.
We anticipate continued additions to headcount in all of our divisions in areas related to delivering products and services in future periods, but due to the uncertainties in thetiming of our sales arrangements, our sales mix, the acquisition and training of qualified personnel and other issues, we cannot accurately predict if related headcount expenseas a percentage of revenue will increase or decrease in the future.
Selling, General and Administrative Expenses. Selling, general and administrative expenses for the three months ended September 30, 2012 increased 17.6% to $37.8 millionas compared to $32.2 million for the same prior year period. The increase in these expenses resulted primarily from:
• $1.6 million increase in salaries and related benefit expenses primarily as a result of headcount additions;• $0.4 million increase in support services, depreciation and maintenance fees related to the April 1, 2012 go-live of our enterprise resource planning ("ERP") system;• $0.8 million of acquisition related expenses, including fair value adjustments;• $1.0 million of proxy contest related expenses; and• $1.8 million net increase in other selling and administrative expenses.
Share-based compensation expense was approximately $0.3 million and $0.6 million for the three months ended September 30, 2012 and 2011, respectively, and is included inthe aforementioned amounts. Selling, general and administrative expenses as a percentage of revenue increased from 29.9% in the three months ended September 30, 2011 to32.6% in the three months ended September 30, 2012.
We do not anticipate significant increases in expenditures for trade shows, advertising and the employment of additional sales and administrative staff at the NextGen Divisionuntil additional revenue growth is achieved. We anticipate future increases in corporate expenditures being made in a wide range of areas including professional services andcontinued investment in our ERP system. While we expect selling, general and administrative expenses to increase on an absolute basis, we cannot accurately predict theimpact these additional expenditures will have on selling, general and administrative expenses as a percentage of revenue.
Research and Development Costs. Research and development costs for the three months ended September 30, 2012 and 2011 were $6.3 million and $7.4 million, respectively.The decrease in research and development expenses was primarily due to the achievement of technological feasibility for one of our major projects intended to bring greaterintegration between our ambulatory and inpatient software products and solutions, therefore allowing us to begin to capitalize costs related to this project in the current period.We also continue to invest significantly in enhancements to our specialty template development, preparation for ICD10 requirements, new products including NextGen Mobile,NextGen NextPen, NextGen Community Connectivity consisting of NextGen Health Information Exchange (“NextGen HIE,” formerly Community Health Solution), NextGenPatient Portal (“NextMD.com”), and NextGen Health Quality Measures (“NextGen HQM”), and other enhancements to our existing products. Additions to capitalizedsoftware costs offset increases in research and development costs. For the three months ended September 30, 2012 and 2011, our additions to capitalized software were $9.8million and $3.6 million, respectively, as we continue to enhance our software to meet the Meaningful Use definitions under the ARRA as well as further integrate bothambulatory and inpatient products. The $9.8 million in capitalized software added in the current quarter included $3.0 million paid for the source code of a pharmacy systemwhich supports Hospital Division customers as well as stepped up investments in the hospital business unit. Research and development costs as a percentage of revenuedecreased to 5.4% in the three months ended September 30, 2012 from 6.8% for the same prior year period. We intend to continue to invest heavily in research anddevelopment as we develop a new integrated inpatient and outpatient, web-based software platform as well as continue to bring additional functionality and features to themedical community. Share-based compensation expense included in research and development costs was not significant for the three months ended September 30, 2012 and2011.
Amortization of Acquired Intangible Assets. Amortization included in operating expenses related to acquired intangible assets for the three months ended September 30, 2012and 2011 were $1.3 million and $0.5 million, respectively.

Interest and Other Income (Expense). Total interest and other expense for the three months ended September 30, 2012 was $0.2 million of income as compared to $0.1million of expense for the three months ended September 30, 2011. Interest and other income consist primarily of dividends and interest earned on our investments along withforeign currency gains or losses for the period.
Our investment policy is determined by our Board of Directors. We currently maintain our cash in very liquid short term assets including tax exempt and taxable money marketfunds and short-term U.S. Treasury securities with maturities of 90 days or less at the time of purchase. Our Board of Directors continues to review alternate uses for our cashincluding, but not limited to, payment of a special dividend, initiation of a stock buyback program, an expansion of our investment policy to include investments with longermaturities of greater than 90 days, and other items. Additionally, it is possible that we will utilize some or all of our cash to fund acquisitions or other similar businessactivities. Any or all of these programs could significantly impact our investment income in future periods.
Provision for Income Taxes. The provision for income taxes for the three months ended September 30, 2012 and 2011 were $8.8 million and $11.0 million, respectively. Theeffective tax rates were 36.0% and 34.9% for the three months ended September 30, 2012 and 2011, respectively. The effective rate for the three months ended September 30,2012 increased as compared to the same prior year period due to the expiration of the federal research and development income tax credit statute which expired on December31, 2011 and is therefore not included in the current year provision. In addition, the net benefit from the reduced state effective tax rate offset by decreased benefit from stockbased compensation.
Comparison of the Six Months Ended September 30, 2012 and September 30, 2011
Net Income. Our net income for the six months ended September 30, 2012 was $31.2 million, or $0.53 per share on both a basic and fully diluted basis. In comparison, weearned $39.5 million, or $0.67 per share on both a basic and fully diluted basis for the six months ended September 30, 2011. The change in net income for the six monthsended September 30, 2012 was primarily attributed to the following:
• an increase in recurring revenue based gross profit, including maintenance, RCM and EDI which grew 15.1%, 30.0% and 28.2%, respectively, compared to the prioryear period;
• an increase in implementation services gross profit of 61.0% compared to the prior year period; offset by• a 26.6% decrease in consolidated software, hardware and supplies gross profit as a result of reduced software revenue; and• an increase in selling, general and administrative expenses, research and development costs and amortization of acquired intangibles.
Revenue. Revenue for the six months ended September 30, 2012 increased 12.7% to $234.4 million from $208.1 million for the six months ended September 30, 2011.NextGen Division revenue increased 10.5% to $173.5 million from $157.1 million in the six months ended September 30, 2011, QSI Dental Division revenue increased 2.0%to $9.8 million from $9.6 million, RCM Services Division revenue increased 23.3% to $31.6 million from $25.6 million, and Hospital Solutions Division revenue increased24.1% to $19.5 million from $15.7 million in the same prior year period.
System Sales. Revenue earned from our company-wide sales of systems for the six months ended September 30, 2012 decreased 3.0% to $70.1 million from $72.3 million inthe same prior year period.
Our decrease in revenue from sales of systems was principally the result of a 5.0% decrease in category revenue at our NextGen Division, partially offset by a 20.6% increaseat our Hospital Solutions Division. NextGen Division sales in this category decreased $3.0 million to $57.7 million during the six months ended September 30, 2012 from$60.8 million during the same prior year period while the Hospital Solutions Division delivered a $1.6 million increase in category revenue to $9.6 million in the six monthsended September 30, 2012 as compared to $8.0 million in the same prior year period. The decrease in system sales was driven primarily by lower sales of software to both newand existing clients, partially offset by increased implementation revenue at both the NextGen and Hospital Solutions Divisions.
The following table breaks down our reported system sales into software, hardware, third-party software, supplies and implementation and training services components on aconsolidated and divisional basis for the six months ended September 30, 2012 and 2011 (in thousands):
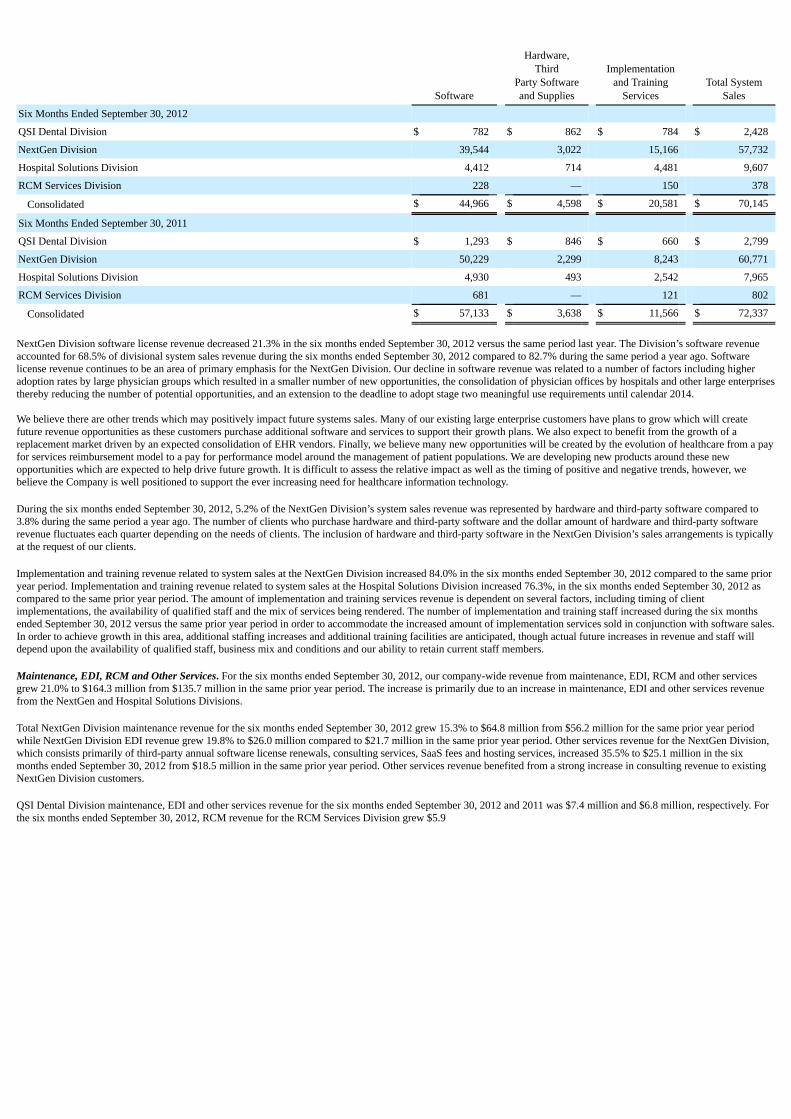
Software
Hardware,Third
Party Softwareand Supplies
Implementationand Training
Services Total System
Sales
Six Months Ended September 30, 2012
QSI Dental Division $ 782 $ 862 $ 784 $ 2,428
NextGen Division 39,544 3,022 15,166 57,732
Hospital Solutions Division 4,412 714 4,481 9,607
RCM Services Division 228 — 150 378
Consolidated $ 44,966 $ 4,598 $ 20,581 $ 70,145
Six Months Ended September 30, 2011
QSI Dental Division $ 1,293 $ 846 $ 660 $ 2,799
NextGen Division 50,229 2,299 8,243 60,771
Hospital Solutions Division 4,930 493 2,542 7,965
RCM Services Division 681 — 121 802
Consolidated $ 57,133 $ 3,638 $ 11,566 $ 72,337
NextGen Division software license revenue decreased 21.3% in the six months ended September 30, 2012 versus the same period last year. The Division’s software revenueaccounted for 68.5% of divisional system sales revenue during the six months ended September 30, 2012 compared to 82.7% during the same period a year ago. Softwarelicense revenue continues to be an area of primary emphasis for the NextGen Division. Our decline in software revenue was related to a number of factors including higheradoption rates by large physician groups which resulted in a smaller number of new opportunities, the consolidation of physician offices by hospitals and other large enterprisesthereby reducing the number of potential opportunities, and an extension to the deadline to adopt stage two meaningful use requirements until calendar 2014.
We believe there are other trends which may positively impact future systems sales. Many of our existing large enterprise customers have plans to grow which will createfuture revenue opportunities as these customers purchase additional software and services to support their growth plans. We also expect to benefit from the growth of areplacement market driven by an expected consolidation of EHR vendors. Finally, we believe many new opportunities will be created by the evolution of healthcare from a payfor services reimbursement model to a pay for performance model around the management of patient populations. We are developing new products around these newopportunities which are expected to help drive future growth. It is difficult to assess the relative impact as well as the timing of positive and negative trends, however, webelieve the Company is well positioned to support the ever increasing need for healthcare information technology.
During the six months ended September 30, 2012, 5.2% of the NextGen Division’s system sales revenue was represented by hardware and third-party software compared to3.8% during the same period a year ago. The number of clients who purchase hardware and third-party software and the dollar amount of hardware and third-party softwarerevenue fluctuates each quarter depending on the needs of clients. The inclusion of hardware and third-party software in the NextGen Division’s sales arrangements is typicallyat the request of our clients.
Implementation and training revenue related to system sales at the NextGen Division increased 84.0% in the six months ended September 30, 2012 compared to the same prioryear period. Implementation and training revenue related to system sales at the Hospital Solutions Division increased 76.3%, in the six months ended September 30, 2012 ascompared to the same prior year period. The amount of implementation and training services revenue is dependent on several factors, including timing of clientimplementations, the availability of qualified staff and the mix of services being rendered. The number of implementation and training staff increased during the six monthsended September 30, 2012 versus the same prior year period in order to accommodate the increased amount of implementation services sold in conjunction with software sales.In order to achieve growth in this area, additional staffing increases and additional training facilities are anticipated, though actual future increases in revenue and staff willdepend upon the availability of qualified staff, business mix and conditions and our ability to retain current staff members.
Maintenance, EDI, RCM and Other Services. For the six months ended September 30, 2012, our company-wide revenue from maintenance, EDI, RCM and other servicesgrew 21.0% to $164.3 million from $135.7 million in the same prior year period. The increase is primarily due to an increase in maintenance, EDI and other services revenuefrom the NextGen and Hospital Solutions Divisions.
Total NextGen Division maintenance revenue for the six months ended September 30, 2012 grew 15.3% to $64.8 million from $56.2 million for the same prior year periodwhile NextGen Division EDI revenue grew 19.8% to $26.0 million compared to $21.7 million in the same prior year period. Other services revenue for the NextGen Division,which consists primarily of third-party annual software license renewals, consulting services, SaaS fees and hosting services, increased 35.5% to $25.1 million in the sixmonths ended September 30, 2012 from $18.5 million in the same prior year period. Other services revenue benefited from a strong increase in consulting revenue to existingNextGen Division customers.
QSI Dental Division maintenance, EDI and other services revenue for the six months ended September 30, 2012 and 2011 was $7.4 million and $6.8 million, respectively. Forthe six months ended September 30, 2012, RCM revenue for the RCM Services Division grew $5.9

million, or 25.5%, to $28.9 million compared to $23.0 million in the same prior year period. RCM revenue was positively impacted by the acquisition of Matrix whichcontributed $5.8 million in the current year. For the Hospital Solutions Division, maintenance and other services revenue for the six months ended September 30, 2012increased 27.6% as compared to the same prior year period primarily because divisional maintenance revenue increased $1.5 million to $8.2 million from $6.7 million in thesame prior year period. Hospital Solutions Division maintenance and other services revenue was positively impacted by new customers as well as contributions by theIntraNexus, CQI and Poseidon acquisitions.
The following table details maintenance, EDI, RCM and other services revenue by category on a consolidated and divisional basis for the six months ended September 30,2012 and 2011 (in thousands):
Maintenance EDI RCM Other Total
Six Months Ended September 30, 2012
QSI Dental Division $ 3,907 $ 2,734 $ — $ 731 $ 7,372
NextGen Division 64,755 25,951 — 25,083 115,789
Hospital Solutions Division 8,225 — — 1,704 9,929
RCM Services Division 396 162 28,887 1,744 31,189
Consolidated $ 77,283 $ 28,847 $ 28,887 $ 29,262 $ 164,279
Six Months Ended September 30, 2011
QSI Dental Division $ 3,767 $ 2,410 $ — $ 631 $ 6,808
NextGen Division 56,156 21,667 — 18,520 96,343
Hospital Solutions Division 6,729 — — 1,050 7,779
RCM Services Division 64 — 23,023 1,722 24,809
Consolidated $ 66,716 $ 24,077 $ 23,023 $ 21,923 $ 135,739
Maintenance revenue for the NextGen Division increased by $8.6 million for the six months ended September 30, 2012 as compared to the same prior year period. The growthin maintenance revenue is primarily a result of increases related to net additional licenses from new clients and existing clients as well as a price increase that became effectiveduring the quarter ended September 30, 2011.
The NextGen Division’s EDI revenue growth has come from new clients and from further penetration of the division’s existing client base while the growth in RCM revenue isprimarily attributable to the Matrix acquisition. We intend to continue to promote maintenance, EDI and RCM services to both new and existing clients. Growth in otherservices revenue is primarily due to increases in third-party annual software licenses, consulting services, SaaS fees and hosting services revenue.
Cost of Revenue. Cost of revenue for the six months ended September 30, 2012 increased 33.6% to $94.8 million from $70.9 million in the same prior year period and the costof revenue as a percentage of revenue increased to 40.4% from 34.1% driven primarily by a higher percentage of lower margin revenue streams such as implementation andRCM services as well as slight cost increases across all revenue categories.
The following table details revenue and cost of revenue on a consolidated and divisional basis for the six months ended September 30, 2012 and 2011 (in thousands):

Six Months Ended September 30,
2012 % 2011 %
QSI Dental Division
Revenue $ 9,800 100.0% $ 9,607 100.0%
Cost of revenue 5,049 51.5% 4,358 45.4%
Gross profit $ 4,751 48.5% $ 5,249 54.6%
NextGen Division
Revenue $ 173,521 100.0% $ 157,114 100.0%
Cost of revenue 57,347 33.0% 43,706 27.8%
Gross profit $ 116,174 67.0% $ 113,408 72.2%
Hospital Solutions Division
Revenue $ 19,536 100.0% $ 15,744 100.0%
Cost of revenue 8,780 44.9% 4,008 25.5%
Gross profit $ 10,756 55.1% $ 11,736 74.5%
RCM Services Division
Revenue $ 31,567 100.0% $ 25,611 100.0%
Cost of revenue 22,224 70.4% 17,898 69.9%
Gross profit $ 9,343 29.6% $ 7,713 30.1%
Unallocated cost of revenue (1) $ 1,359 N/A $ 978 N/A
Consolidated
Revenue $ 234,424 100.0% $ 208,076 100.0%
Cost of revenue 94,759 40.4% 70,948 34.1%
Gross profit $ 139,665 59.6% $ 137,128 65.9%
_______________________________________(1) Relates to the amortization of acquired software technology intangible assets
Gross profit margins at the QSI Dental Division for the six months ended September 30, 2012 decreased to 48.5% from 54.6% for the same prior year period. Gross profitmargins at the NextGen Division for six months ended September 30, 2012 decreased to 67.0% compared to 72.2% for the same prior year period primarily due to decreasedsoftware sales. Gross margin in the Hospital Solutions Division decreased to 55.1% for the six months ended September 30, 2012 as compared to 74.5% for the same prior yearperiod due to growth in implementation and training revenue which carries lower profit margins compared to software. Gross margin in the RCM Services Division decreasedto 29.6% for the six months ended September 30, 2012 as compared to 30.1% for the same prior year period due to decreased software sales and an increase in RCM revenuewhich carries lower profit margins.
The following table details the individual components of cost of revenue and gross profit as a percentage of total revenue on a consolidated and divisional basis for the sixmonths ended September 30, 2012 and 2011:
Hardware,Third PartySoftware
Payroll andRelatedBenefits EDI Other
Total Costof Revenue Gross Profit
Six Months Ended September 30, 2012
QSI Dental Division 7.0% 19.8% 14.3% 10.4% 51.5% 48.5%
NextGen Division 1.6% 11.6% 8.8% 11.0% 33.0% 67.0%
Hospital Solutions Division 3.9% 21.1% 0.0% 19.9% 44.9% 55.1%
RCM Services Division 0.0% 45.0% 1.2% 24.2% 70.4% 29.6%
Consolidated 1.8% 17.2% 7.3% 14.1% 40.4% 59.6%
Six Months Ended September 30, 2011
QSI Dental Division 7.5% 20.9% 8.9% 8.1% 45.4% 54.6%
NextGen Division 1.3% 11.8% 8.1% 6.6% 27.8% 72.2%
Hospital Solutions Division 3.3% 15.0% 0.0% 7.2% 25.5% 74.5%
RCM Services Division 0.0% 44.9% 2.0% 23.0% 69.9% 30.1%
Consolidated 1.5% 16.5% 6.7% 9.4% 34.1% 65.9%
During the six months ended September 30, 2012, hardware and third-party software constituted a higher portion of cost of revenue compared to the same prior year period inthe NextGen Division. The number of clients who purchase hardware and third-party software and the dollar amount of hardware and third-party software purchased fluctuateseach quarter depending on the needs of our clients.
Our payroll and benefits expense associated with delivering our products and services increased to 17.2% of consolidated revenue in the six

months ended September 30, 2012 compared to 16.5% during the same period last year. The absolute level of consolidated payroll and benefit expenses grew from $34.4million in the six months ended September 30, 2011 to $40.4 million in the six months ended September 30, 2012, an increase of 17.6%, or approximately $6.0 million. Of the$6.0 million increase, approximately $2.7 million of the increase is related to the RCM Services Division as RCM is a service business, which inherently has higher percentageof payroll costs as a percentage of revenue. Increases of $1.6 million in the NextGen Division, $1.8 million for the Hospital Solutions Division are primarily due to headcountadditions and increased payroll and benefits expense associated with delivering products and services. Payroll and benefit expenses related to the QSI Dental Divisionremained consistent period over period. The amount of share-based compensation expense included in cost of revenue was not significant for six months ended September 30,2012 and 2011.
Other cost of revenue, which primarily consists of third-party annual license, hosting costs and outsourcing costs, increased to 14.1% of total revenue during the six monthsended September 30, 2012 as compared to 9.4% for the same period a year ago. Other expenses increased as a percentage of revenue primarily due to a lower percentage ofrevenue from software licenses which do not carry a significant amount of other expenses.
As a result of the foregoing events and activities, our gross profit percentage decreased to 59.6% for the six months ended September 30, 2012 versus 65.9% for the same prioryear period.
Selling, General and Administrative Expenses. Selling, general and administrative expenses for the six months ended September 30, 2012 increased 21.1% to $74.5 million ascompared to $61.6 million for the same prior year period. The increase in these expenses resulted primarily from:
• $5.0 million increase in salaries and related benefit expenses primarily as a result of headcount additions;• $0.8 million increase in support services, depreciation and maintenance fees related to the April 1, 2012 go-live of our ERP system;• $1.1 million of acquisition related expenses, including fair value adjustments• $1.3 million of proxy contest related expenses; and• $4.8 million net increase in other selling and administrative expenses.
Share-based compensation expense was approximately $1.1 million and $1.5 million for the six months ended September 30, 2012 and 2011 and is included in theaforementioned amounts. Selling, general and administrative expenses as a percentage of revenue increased from 29.6% in the six months ended September 30, 2011 to 31.8%in the six months ended September 30, 2012.
Research and Development Costs. Research and development costs for the six months ended September 30, 2012 and 2011 were $14.8 million and $14.2 million, respectively.The slower growth in research and development expenses was primarily due to the achievement of technological feasibility for a major project, allowing us to begin tocapitalize costs related to this project in the current period, offset by continued investment in enhancements to our specialty template development, preparation for ICD10requirements, new products including NextGen Mobile, NextGen NextPen, NextGen Community Connectivity consisting of NextGen Health Information Exchange(“NextGen HIE,” formerly Community Health Solution), NextGen Patient Portal (“NextMD.com”), and NextGen Health Quality Measures (“NextGen HQM”), and otherenhancements to our existing products. Additions to capitalized software costs offset increases in research and development costs. For the six months ended September 30,2012 and 2011, our additions to capitalized software were $14.1 million and $6.1 million, respectively, as we continue to enhance our software to meet the Meaningful Usedefinitions under the ARRA as well as further integrate both ambulatory and inpatient products. The $14.1 million in capitalized software added in the six month period endedSeptember 30, 2012 included $3.0 million paid for the source code of a pharmacy system which supports Hospital Division customers as well as stepped up investments in thehospital business unit. Research and development costs as a percentage of revenue decreased to 6.3% in the six months ended September 30, 2012 from 6.8% for the sameprior year period. We intend to continue to invest heavily in research and development expenses as we develop a new integrated inpatient and outpatient, web-based softwareplatform as well as continue to bring additional functionality and features to the medical community. Share-based compensation expense included in research and developmentcosts was not significant for the six months ended September 30, 2012 and 2011.
Amortization of Acquired Intangible Assets. Amortization included in operating expenses related to acquired intangible assets for the six months ended September 30, 2012and 2011 were $2.5 million and $1.0 million, respectively.
Interest and Other Income (Expense). Total interest and other expense was not significant for the six months ended September 30, 2012 and 2011. Interest and other incomeconsist primarily of dividends and interest earned on our investments along with foreign currency gains or losses for the period.
Provision for Income Taxes. The provision for income taxes for the six months ended September 30, 2012 and 2011 were $16.6 million and $20.9 million, respectively. Theeffective tax rate was 34.8% and 34.6% for the six months ended September 30, 2012 and 2011, respectively. The effective rate for the six months ended September 30, 2012increased as compared to the same prior year period due to the expiration of the federal research and development income tax credit statute which expired on December 31,2011 and is therefore not included in the current year provision. In addition, there were net benefits from the reduced state effective tax rate offset by net decreased benefitfrom stock based compensation and other discrete items.
Liquidity and Capital Resources
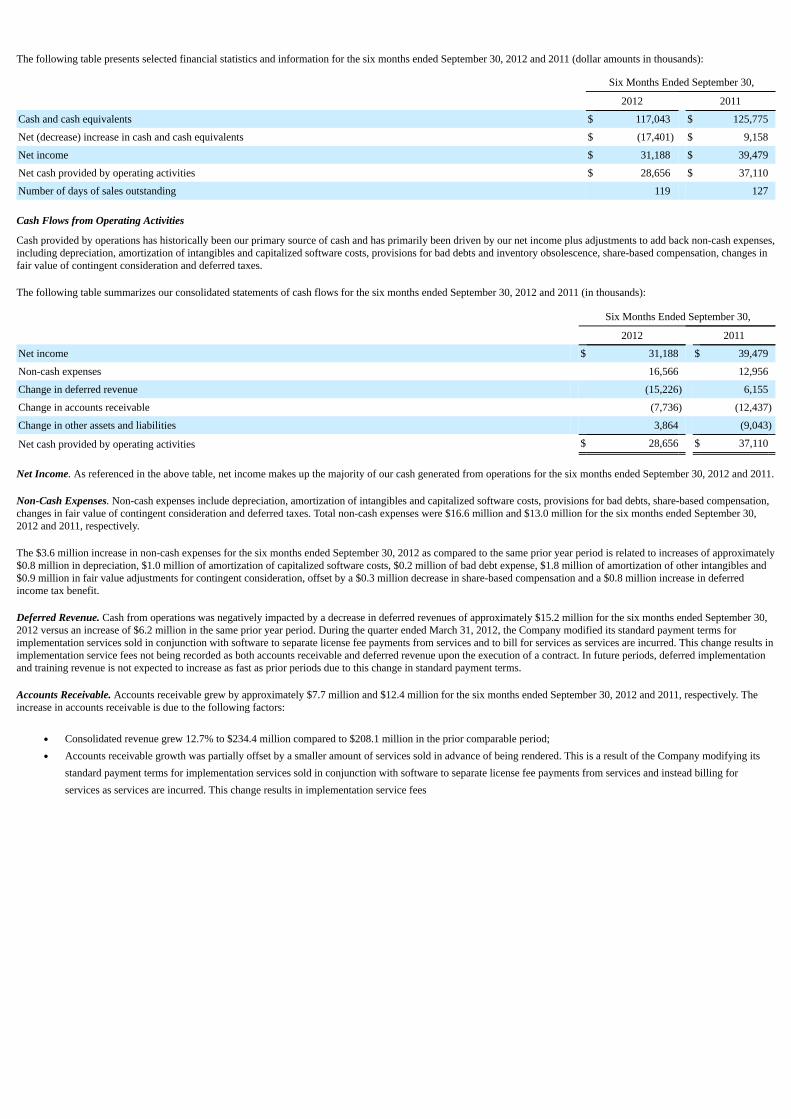
The following table presents selected financial statistics and information for the six months ended September 30, 2012 and 2011 (dollar amounts in thousands):
Six Months Ended September 30,
2012 2011
Cash and cash equivalents $ 117,043 $ 125,775
Net (decrease) increase in cash and cash equivalents $ (17,401) $ 9,158
Net income $ 31,188 $ 39,479
Net cash provided by operating activities $ 28,656 $ 37,110
Number of days of sales outstanding 119 127
Cash Flows from Operating Activities
Cash provided by operations has historically been our primary source of cash and has primarily been driven by our net income plus adjustments to add back non-cash expenses,including depreciation, amortization of intangibles and capitalized software costs, provisions for bad debts and inventory obsolescence, share-based compensation, changes infair value of contingent consideration and deferred taxes.
The following table summarizes our consolidated statements of cash flows for the six months ended September 30, 2012 and 2011 (in thousands):
Six Months Ended September 30,
2012 2011
Net income $ 31,188 $ 39,479
Non-cash expenses 16,566 12,956
Change in deferred revenue (15,226) 6,155
Change in accounts receivable (7,736) (12,437)
Change in other assets and liabilities 3,864 (9,043)
Net cash provided by operating activities $ 28,656 $ 37,110
Net Income. As referenced in the above table, net income makes up the majority of our cash generated from operations for the six months ended September 30, 2012 and 2011.
Non-Cash Expenses. Non-cash expenses include depreciation, amortization of intangibles and capitalized software costs, provisions for bad debts, share-based compensation,changes in fair value of contingent consideration and deferred taxes. Total non-cash expenses were $16.6 million and $13.0 million for the six months ended September 30,2012 and 2011, respectively.
The $3.6 million increase in non-cash expenses for the six months ended September 30, 2012 as compared to the same prior year period is related to increases of approximately$0.8 million in depreciation, $1.0 million of amortization of capitalized software costs, $0.2 million of bad debt expense, $1.8 million of amortization of other intangibles and$0.9 million in fair value adjustments for contingent consideration, offset by a $0.3 million decrease in share-based compensation and a $0.8 million increase in deferredincome tax benefit.
Deferred Revenue. Cash from operations was negatively impacted by a decrease in deferred revenues of approximately $15.2 million for the six months ended September 30,2012 versus an increase of $6.2 million in the same prior year period. During the quarter ended March 31, 2012, the Company modified its standard payment terms forimplementation services sold in conjunction with software to separate license fee payments from services and to bill for services as services are incurred. This change results inimplementation service fees not being recorded as both accounts receivable and deferred revenue upon the execution of a contract. In future periods, deferred implementationand training revenue is not expected to increase as fast as prior periods due to this change in standard payment terms.
Accounts Receivable. Accounts receivable grew by approximately $7.7 million and $12.4 million for the six months ended September 30, 2012 and 2011, respectively. Theincrease in accounts receivable is due to the following factors:
• Consolidated revenue grew 12.7% to $234.4 million compared to $208.1 million in the prior comparable period;
• Accounts receivable growth was partially offset by a smaller amount of services sold in advance of being rendered. This is a result of the Company modifying itsstandard payment terms for implementation services sold in conjunction with software to separate license fee payments from services and instead billing forservices as services are incurred. This change results in implementation service fees

not being recorded as both accounts receivable and deferred revenue upon the execution of a contract; and
• The turnover of accounts receivable measured in terms of days sales outstanding (“DSO”) decreased from 127 days to 119 days during the six months endedSeptember 30, 2012 as compared the same prior year period. The decrease in DSO is primarily due to a change in the mix of revenue towards services versussystems sales which generally has a faster turnover of accounts receivable. DSO was also impacted by a smaller amount of services sold in advance as discussedabove.
Provided turnover of accounts receivable, deferred revenue and profitability remain consistent with the 2012 fiscal year, we anticipate being able to continue generating cashfrom operations during fiscal year 2013 primarily from our net income.
Other Assets and Liabilities. Cash from operations in the six months ended September 30, 2012 was positively impacted by a net $3.9 million increase in other assets andliabilities compared to a net decrease of $9.0 million for the six months ended September 30, 2011. For the six months ended September 30, 2012, the $3.9 million change inother assets and liabilities is primarily the result of an increase in accounts payable of $3.7 million, an increase in other current liabilities of $8.7 million primarily due to thecontingent consideration related to the acquisitions in the current period, partially offset by an increase in income tax receivable of $3.5 million, a decrease in accruedcompensation of $2.0 million, driven primarily by a reduction in performance-based bonuses and commission accruals, and a $3.0 million net decrease in all other assets andliabilities.
Cash Flows from Investing Activities
Net cash used in investing activities for the six months ended September 30, 2012 and 2011 was $26.1 million and $16.6 million, respectively. The $9.5 million increase in netcash used in investing activities during the six months ended September 30, 2012 as compared to the same prior year period is primarily due to net cash paid for theacquisitions of Matrix and Poseidon of $5.1 million and $2.0 million, respectively, in addition to increases of $14.1 million and $4.8 million, respectively, for capitalizedsoftware and equipment and improvements. The prior year period cash flows from investing activities included net cash paid for the acquisitions of IntraNexus and CQI of $3.3million and $2.5 million, respectively, in addition to increases of $6.1 million and $4.7 million, respectively, for capitalized software and equipment and improvements.
Cash Flows from Financing Activities
Net cash used in financing activities for the six months ended September 30, 2012 and 2011 was $20.0 million and $11.4 million, respectively. During the six months endedSeptember 30, 2012, we received proceeds of $0.8 million from the exercise of stock options and paid $20.7 million in dividends to shareholders compared to proceeds of $6.8million from the exercise of stock options and payments of $20.4 million in dividends to shareholders during the same prior year period.
We recorded a reduction in our tax benefit from share-based compensation of $2.3 million during the six months ended September 30, 2011 related to excess tax deductionsreceived from stock option exercises. The benefit was recorded as additional paid in capital. The tax benefit from share-based compensation was not significant for the sixmonths ended September 30, 2012.
Cash and Cash Equivalents and Marketable Securities
At September 30, 2012, we had cash and cash equivalents of $117.0 million. We may use a portion of these funds towards future acquisitions although the timing and amountof funds to be used has not been determined. We intend to expend some of these funds for the development of products complementary to our existing product line as well asnew versions of certain of our products. These developments are intended to take advantage of more powerful technologies and to increase the integration of our products. Weanticipate capital expenditures will increase in fiscal year 2013 and will be funded from cash on hand and cash flows from operations.
In January 2007, our Board of Directors adopted a policy whereby we intend to pay a regular quarterly dividend of $0.125 per share on our outstanding common stock, subjectto further review and approval and the establishment of record and distribution dates by our Board of Directors prior to the declaration of each such quarterly dividend. OurBoard of Directors subsequently increased the quarterly dividend to $0.150 per share in August 2008 and to $0.175 per share in January 2011. We anticipate that futurequarterly dividends, if and when declared by our Board of Directors pursuant to this policy, would likely be distributable on or about the fifth day of each of the months ofOctober, January, April and July.
On October 25, 2012, the Board of Directors approved a quarterly cash dividend of $0.175 per share on our outstanding shares of common stock, payable to shareholders ofrecord as of December 14, 2012 with an expected distribution date on or about January 4, 2013.
Our Board of Directors declared the following dividends during the periods presented (stock split adjusted):

Declaration Date Record Date Payment Date Per Share Dividend
May 24, 2012 June 15, 2012 July 3, 2012 $ 0.175
July 25, 2012 September 14, 2012 October 5, 2012 $ 0.175
Fiscal year 2013 $ 0.350
May 25, 2011 June 17, 2011 July 5, 2011 $ 0.175
July 27, 2011 September 19, 2011 October 5, 2011 $ 0.175
October 26, 2011 December 20, 2011 January 5, 2012 $ 0.175
January 25, 2012 March 20, 2012 April 5, 2012 $ 0.175
Fiscal year 2012 $ 0.700
May 26, 2010 June 17, 2010 July 6, 2010 $ 0.150
July 28, 2010 September 17, 2010 October 5, 2010 $ 0.150
October 25, 2010 December 17, 2010 January 5, 2011 $ 0.150
January 26, 2011 March 17, 2011 April 5, 2011 $ 0.175
Fiscal year 2011 $ 0.625
Management believes that its cash and cash equivalents on hand at September 30, 2012, together with its marketable securities and cash flows from operations, if any, will besufficient to meet its working capital and capital expenditure requirements as well as any dividends to be paid in the ordinary course of business for fiscal year 2013.
Contractual Obligations
The following table summarizes our significant contractual obligations, all of which relate to operating leases, at September 30, 2012 and the effect that such obligations areexpected to have on our liquidity and cash in future periods:
For the year ended March 31, 2013 (remaining six months) $ 4,1132014 7,2382015 6,1672016 5,5282017 and beyond 8,150
$ 31,196
Recent Accounting Pronouncements
Refer to Note 1, “Summary of Significant Accounting Policies,” of our notes to consolidated financial statements included elsewhere in this Quarterly Report on Form 10-Qfor a discussion of new accounting standards.

ITEM 3. QUANTITATIVE AND QUALITATIVE DISCLOSURES ABOUT MARKET RISKS
There is little to no market risk as we currently maintain our cash in very liquid short term assets including tax exempt and taxable money market funds and short-term U.S.Treasury securities with maturities of 90 days or less at the time of purchase.
ITEM 4. CONTROLS AND PROCEDURES
Evaluation of Disclosure Controls and Procedures
Our Chief Executive Officer and Chief Financial Officer (our principal executive officer and principal financial officer, respectively) have evaluated the effectiveness of ourdisclosure controls and procedures (as defined in Rules 13a-15(e) and 15d-15(e) under the Security Exchange Act of 1934, as amended, the "Exchange Act") as ofSeptember 30, 2012, the end of the period covered by this Quarterly Report on Form 10-Q (the “Evaluation Date”). They have concluded that, as of the Evaluation Date, thesedisclosure controls and procedures were effective to ensure that material information relating to the Company and its consolidated subsidiaries would be made known to themby others within those entities and would be disclosed on a timely basis. The Chief Executive Officer and Chief Financial Officer have concluded that our disclosure controlsand procedures are designed, and are effective, to give reasonable assurance that the information required to be disclosed by us in reports that we file under the Exchange Act isrecorded, processed, summarized and reported within the time period specified in the rules and forms of the SEC. They have also concluded that the our disclosure controls andprocedures are effective to ensure that information required to be disclosed in the reports that are filed or submitted under the Exchange Act are accumulated andcommunicated to our management, including the Chief Executive Officer and Chief Financial Officer, to allow timely decisions regarding required disclosure.
Changes in Internal Control over Financial Reporting
On April 1, 2012, we went live with a corporate-wide Enterprise Resource Planning ("ERP") system. Our new ERP system will standardize and automate business processes,improve operational and financial performance, and enhance internal controls. The implementation of our new ERP system has resulted in changes to our business processesand internal controls over financial reporting. The key controls surrounding the ERP system are being identified and are subject to our Sarbanes-Oxley testing.
Management, including our Chief Executive Officer and Chief Financial Officer, has concluded that our disclosure controls and procedures and internal control over financialreporting are designed to provide reasonable assurance of achieving their objectives and are effective at that reasonable assurance level. However, management can provide noassurance that our disclosure controls and procedures or our internal control over financial reporting can prevent all errors and all fraud under all circumstances. A controlsystem, no matter how well conceived and operated, can provide only reasonable, not absolute, assurance that the objectives of the control system are met. Further, the designof a control system must reflect the fact that there are resource constraints, and the benefits of controls must be considered relative to their costs. Because of the inherentlimitations in all control systems, no evaluation of controls can provide absolute assurance that all control issues and instances of fraud, if any, within the Company have beenor will be detected. The design of any system of controls also is based in part upon certain assumptions about the likelihood of future events, and there can be no assurance thatany design will succeed in achieving its stated goals under all potential future conditions; over time, controls may become inadequate because of changes in conditions, or thedegree of compliance with policies or procedures may deteriorate. Because of the inherent limitations in a cost-effective control system, misstatements due to error or fraudmay occur and not be detected.

PART II. OTHER INFORMATION
ITEM 1. LEGAL PROCEEDINGS
We have experienced legal claims by customers regarding product and contract disputes and by other third parties asserting that we have infringed their intellectual propertyrights. We believe that these claims are without merit and intend to defend against them vigorously; however, we could incur substantial costs and diversion of managementresources defending any such claim, even if we are ultimately successful in the defense of such matter. Litigation is inherently uncertain and always difficult to predict. Werefer you to the discussion of infringement and litigation risks in our “Item 1A. Risk Factors” section of our Annual Report.
ITEM 1A. RISK FACTORS
Our business is subject to many risks and uncertainties, which may materially and adversely affect our future business, prospects, financial condition and results of operations.These risk factors are disclosed in “Item 1A. Risk Factors” in our Annual Report.
ITEM 2. UNREGISTERED SALES OF EQUITY SECURITIES AND USE OF PROCEEDS
None.
ITEM 3. DEFAULTS UPON SENIOR SECURITIES
None.
ITEM 4. MINE AND SAFETY DISCLOSURES
Not Applicable ITEM 5. OTHER INFORMATION
None.

ITEM 6. EXHIBITS
Exhibit Number Description
10.1ü Employment Arrangement dated September 19, 2012 between Quality Systems, Inc., and Daniel Morefield, is incorporated by reference to Exhibit 10.1 tothe registrant's Current Report on Form 8-K filed on September 25, 2012.
31.1* Certification of Principal Executive Officer Required by Rule 13a-14(a) of the Securities Exchange Act of 1934, as amended, as Adopted Pursuant toSection 302 of the Sarbanes-Oxley Act of 2002.
31.2* Certification of Principal Financial Officer Required by Rule 13a-14(a) of the Securities Exchange Act of 1934, as amended, as Adopted Pursuant toSection 302 of the Sarbanes-Oxley Act of 2002.
32.1* Certification of Chief Executive Officer and Chief Financial Officer Pursuant to 18 U.S.C. Section 1350, as Adopted Pursuant to Section 906 of theSarbanes-Oxley Act of 2002.
101.INS** XBRL Instance
101.SCH** XBRL Taxonomy Extension Schema
101.CAL** XBRL Taxonomy Extension Calculation
101.LAB** XBRL Taxonomy Extension Label
101.PRE** XBRL Taxonomy Extension Presentation
ü This exhibit is a management contract or a compensatory plan or arrangement.
* Filed herewith.
** XBRL information is furnished and not filed or a part of a registration statement or prospectus for purposes of section 11 or 12 of the Securities and Exchange Act of 1933, asamended, is deemed not filed for purposes of section 18 of the Securities and Exchange Act of 1934, as amended, and otherwise is not subject to liability under these section.

SIGNATURES
Pursuant to the requirements of the Securities Exchange Act of 1934, the registrant has duly caused this report to be signed on its behalf by the undersigned thereunto dulyauthorized.
QUALITY SYSTEMS, INC. Date: November 2, 2012 By: /s/ Steven T. Plochocki
Steven T. Plochocki
Chief Executive Officer (Principal Executive Officer)
Date: November 2, 2012 By: /s/ Paul A. Holt
Paul A. Holt
Chief Financial Officer (Principal Accounting Officer)

EXHIBIT 31.1
CERTIFICATION OF PRINCIPAL EXECUTIVE OFFICER REQUIRED BYRULE 13A-14(A) OF THE SECURITIES EXCHANGE ACT OF 1934, AS AMENDED,
AS ADOPTED PURSUANT TO SECTION 302 OF THE SARBANES-OXLEY ACT OF 2002
I, Steven T. Plochocki, certify that:
1. I have reviewed this Quarterly Report on Form 10-Q of Quality Systems, Inc.;
2. Based on my knowledge, this report does not contain any untrue statement of a material fact or omit to state a material fact necessary to make the statements made, inlight of the circumstances under which such statements were made, not misleading with respect to the period covered by this report;
3. Based on my knowledge, the financial statements, and other financial information included in this report, fairly present in all material respects the financial condition,results of operations and cash flows of the registrant as of, and for, the periods presented in this report;
4. The registrant’s other certifying officer(s) and I are responsible for establishing and maintaining disclosure controls and procedures (as defined in Exchange Act Rules13a-15(e) and 15d-15(e)) and internal control over financial reporting (as defined in Exchange Act Rules 13a-15(f) and 15d-15(f)) for the registrant and have:
(a) Designed such disclosure controls and procedures, or caused such disclosure controls and procedures to be designed under our supervision, to ensure that materialinformation relating to the registrant, including its consolidated subsidiaries, is made known to us by others within those entities, particularly during the period inwhich this report is being prepared;
(b) Designed such internal control over financial reporting, or caused such internal control over financial reporting to be designed under our supervision, to providereasonable assurance regarding the reliability of financial reporting and the preparation of financial statements for external purposes in accordance with generallyaccepted accounting principles;
(c) Evaluated the effectiveness of the registrant’s disclosure controls and procedures and presented in this report our conclusions about the effectiveness of thedisclosure controls and procedures, as of the end of the period covered by this report based on such evaluation; and
(d) Disclosed in this report any change in the registrant’s internal control over financial reporting that occurred during the registrant’s most recent fiscal quarter (theregistrant’s fourth fiscal quarter in the case of an annual report) that has materially affected, or is reasonably likely to materially affect, the registrant’s internalcontrol over financial reporting; and
5. The registrant’s other certifying officer(s) and I have disclosed, based on our most recent evaluation of internal control over financial reporting, to the registrant’s auditorsand the audit committee of the registrant’s board of directors (or persons performing the equivalent functions):
(a) All significant deficiencies and material weaknesses in the design or operation of internal control over financial reporting which are reasonably likely to adverselyaffect the registrant’s ability to record, process, summarize and report financial information; and
(b) Any fraud, whether or not material, that involves management or other employees who have a significant role in the registrant’s internal control over financialreporting.
Date: November 2, 2012 By: /s/ Steven T. Plochocki
Steven T. Plochocki
Chief Executive Officer
(Principal Executive Officer)

EXHIBIT 31.2
CERTIFICATION OF PRINCIPAL FINANCIAL OFFICER REQUIRED BYRULE 13A-14(a) OF THE SECURITIES EXCHANGE ACT OF 1934, AS AMENDED,
AS ADOPTED PURSUANT TO SECTION 302 OF THE SARBANES-OXLEY ACT OF 2002
I, Paul A. Holt, certify that:
1. I have reviewed this Quarterly Report on Form 10-Q of Quality Systems, Inc.;
2. Based on my knowledge, this report does not contain any untrue statement of a material fact or omit to state a material fact necessary to make the statements made, inlight of the circumstances under which such statements were made, not misleading with respect to the period covered by this report;
3. Based on my knowledge, the financial statements, and other financial information included in this report, fairly present in all material respects the financial condition,results of operations and cash flows of the registrant as of, and for, the periods presented in this report;
4. The registrant’s other certifying officer(s) and I are responsible for establishing and maintaining disclosure controls and procedures (as defined in Exchange Act Rules13a-15(e) and 15d-15(e)) and internal control over financial reporting (as defined in Exchange Act Rules 13a-15(f) and 15d-15(f)) for the registrant and have:
(a) Designed such disclosure controls and procedures, or caused such disclosure controls and procedures to be designed under our supervision, to ensure that materialinformation relating to the registrant, including its consolidated subsidiaries, is made known to us by others within those entities, particularly during the period inwhich this report is being prepared;
(b) Designed such internal control over financial reporting, or caused such internal control over financial reporting to be designed under our supervision, to providereasonable assurance regarding the reliability of financial reporting and the preparation of financial statements for external purposes in accordance with generallyaccepted accounting principles;
(c) Evaluated the effectiveness of the registrant’s disclosure controls and procedures and presented in this report our conclusions about the effectiveness of thedisclosure controls and procedures, as of the end of the period covered by this report based on such evaluation; and
(d) Disclosed in this report any change in the registrant’s internal control over financial reporting that occurred during the registrant’s most recent fiscal quarter (theregistrant’s fourth fiscal quarter in the case of an annual report) that has materially affected, or is reasonably likely to materially affect, the registrant’s internalcontrol over financial reporting; and
5. The registrant’s other certifying officer(s) and I have disclosed, based on our most recent evaluation of internal control over financial reporting, to the registrant’s auditorsand the audit committee of the registrant’s board of directors (or persons performing the equivalent functions):
(a) All significant deficiencies and material weaknesses in the design or operation of internal control over financial reporting which are reasonably likely to adverselyaffect the registrant’s ability to record, process, summarize and report financial information; and
(b) Any fraud, whether or not material, that involves management or other employees who have a significant role in the registrant’s internal control over financialreporting.
Date: November 2, 2012 By: /s/ Paul A. Holt
Paul A. Holt
Chief Financial Officer
(Principal Accounting Officer)

EXHIBIT 32.1
CERTIFICATION OF CHIEF EXECUTIVE OFFICER AND CHIEF FINANCIAL OFFICERPURSUANT TO 18 U.S.C. SECTION 1350,
AS ADOPTED PURSUANT TOSECTION 906 OF THE SARBANES-OXLEY ACT OF 2002
In connection with the Quarterly Report on Form 10-Q of Quality Systems, Inc. (the “Company”) for the quarterly period ended September 30, 2012 (the “Report”),the undersigned hereby certify in their capacities as Chief Executive Officer and Chief Financial Officer of the Company, respectively, pursuant to 18 U.S.C. section 1350, asadopted pursuant to Section 906 of the Sarbanes-Oxley Act of 2002, that:
1. the Report fully complies with the requirements of Section 13(a) or 15(d) of the Securities Exchange Act of 1934, as amended; and
2. the information contained in the Report fairly presents, in all material respects, the financial condition and results of operations of the Company.
Date: November 2, 2012 By: /s/ Steven T. Plochocki
Steven T. Plochocki
Chief Executive Officer (Principal Executive Officer)
Date: November 2, 2012 By: /s/ Paul A. Holt
Paul A. Holt
Chief Financial Officer (Principal Accounting Officer)
A signed original of this written statement required by Section 906, or other document authenticating, acknowledging, or otherwise adopting the signatures thatappear in typed form within the electronic version of this written statement required by Section 906, has been provided to the Company and will be retained by the Companyand furnished to the Securities and Exchange Commission or its staff upon request.