Investor Update - GT Capital Holdings Inc.
72
1 Rising Together to New Heights Investor Update JAN TO NOV 2017 FINANCIAL AND OPERATING RESULTS gtcapital.com.ph
-
Upload
khangminh22 -
Category
Documents
-
view
0 -
download
0
Transcript of Investor Update - GT Capital Holdings Inc.

1
Rising Together
to New Heights
Investor
Update
JAN TO NOV 2017
FINANCIAL AND
OPERATING RESULTS
gtcapital.com.ph

Notice
2
The information in this presentation has been prepared by GT Capital Holdings, Inc. (the "Company").
By attending the meeting where this presentation is made, or by reading the presentation slides, you agree to be bound by the following limitations and represent that you are a person who is
permitted under applicable law and regulation to receive information contained in this presentation.
The information communicated in this document contains certain statements that are or may be forward looking. These statements typically contain words such as "will," "expects" and "anticipates"
and words of similar import including those relating to general business plans and strategy of the Company as well as its subsidiaries and associates. By their nature, forward looking statements
involve risk and uncertainty because they relate to events and depend on circumstances that will occur in the future. Actual results may differ materially from these forward-looking statements due
to a number of factors, including future changes or developments in the Company's business, its competitive environment, its ability to implement its strategies and initiatives and respond to
technological changes and political, economic, regulatory and social conditions in the Philippines. There may be additional material risks that are currently not considered to be material or of which
the Company and its advisors or representatives are unaware. The Company assumes no responsibility to update forward-looking statements or to adapt them to future events or developments.
No representation or warranty, express or implied, is made as to the fairness, accuracy, completeness or correctness of the information or opinions contained herein. The Company does not accept
any liability or responsibility for any reliance on the information or opinions contained in this presentation for any purpose. Neither the Company nor any of the Company's advisors or
representatives shall have any responsibility or liability whatsoever (for negligence or otherwise) for any loss arising from any use of this presentation or its contents or otherwise arising in
connection with this presentation. The information set out herein may be subject to updating, completion, revision, verification and amendment and such information may materially change at any
point in time. Certain market information and statistical data included herein have been obtained from sources that the Company believes to be reliable but in no way are warranted by the
Company nor any of the Company's advisors or representatives as to genuineness, accuracy or completeness.
This presentation is based on the economic, regulatory, market and other conditions as in effect on the date hereof. It should be understood that subsequent developments may affect the
information contained in this presentation, which neither the Company nor its advisors are under an obligation to update, revise or affirm.
THIS PRESENTATION AND THE INFORMATION CONTAINED HEREIN DOES NOT CONSTITUTE A PROSPECTUS, OFFERING CIRCULAR OR OFFERING MEMORANDUM OR AN OFFER, OR A
SOLICITATION OF ANY OFFER, TO PURCHASE OR SELL ANY SECURITIES, AND SHOULD NOT BE CONSIDERED AS A RECOMMENDATION THAT ANY INVESTOR SHOULD SUBSCRIBE FOR OR
PURCHASE ANY SECURITIES OF THE COMPANY.
This presentation is strictly confidential to the recipient, may not be reproduced, retransmitted or further distributed to the press or any other person, may not be reproduced in any form and may
not be published, in whole or in part, for any purpose. Neither this document nor any copy of it should be distributed in any country where such distribution may lead to a breach of any law or
regulatory requirement. Distribution of this document in the United States, Australia, Canada or Japan may constitute a violation of United States, Australian, Canadian or Japanese securities law.
Neither this presentation nor any of its contents may be used for any other purpose without the prior written consent of the Company.
The securities mentioned herein have not been, and will not be, registered under the U.S. Securities Act of 1933, as amended (the “Securities Act”), or under the applicable securities laws of
Australia, Canada or Japan, and may not be offered or sold within the United States unless they are registered under the Securities Act or pursuant to an exemption therefrom, or in a transaction
not subject to the registration requirements of the Securities Act and, subject to certain exceptions, may not be offered or sold within Australia, Canada or Japan or to any national, resident or
citizen of Australia, Canada or Japan. No public offer of securities by the Company is being made in the United States, Australia, Canada or Japan.
Mr. Joey B. Crisol
FVP/Head of Investor Relations & Corp. Communication [email protected]
Mrs. Jaydie Dilidili-Robles
Corp. Comm. Manager [email protected]
+632 836 4500 local 7917
Mr. Louis B. de Jesus
Investor Relations Officer [email protected]
+632 836 4500 local 7915
TEL: +632 836 4500 FAX: +632 836 4159 | 43/F GT Tower Int’l, Ayala Ave. cor. H.V. dela Costa St., Makati, Metro Manila
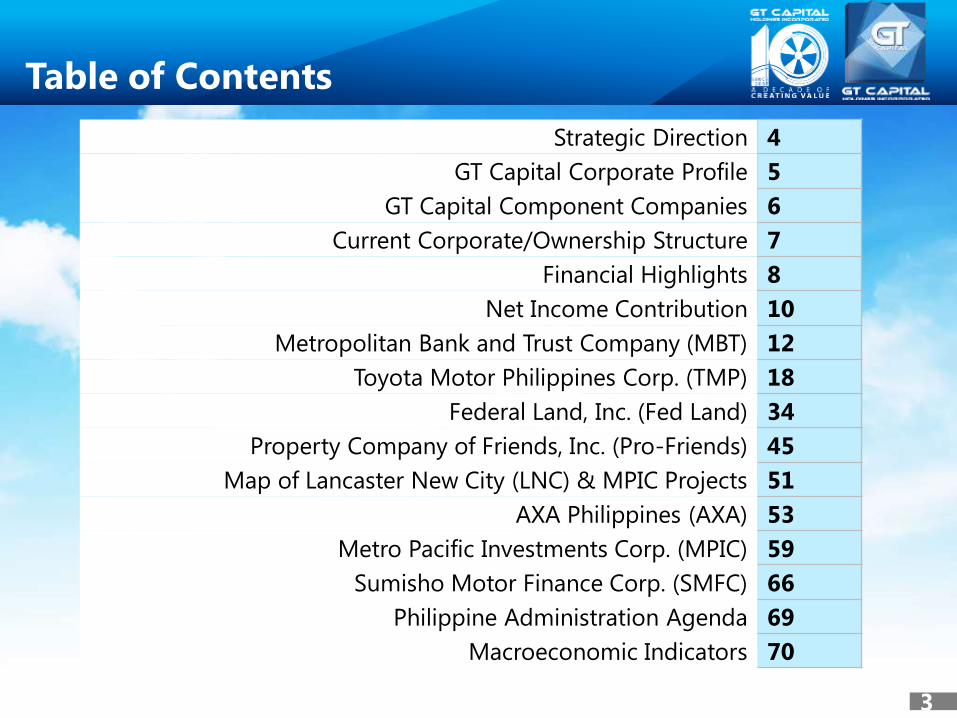
Table of Contents
3
Strategic Direction 4
GT Capital Corporate Profile 5
GT Capital Component Companies 6
Current Corporate/Ownership Structure 7
Financial Highlights 8
Net Income Contribution 10
Metropolitan Bank and Trust Company (MBT) 12
Toyota Motor Philippines Corp. (TMP) 18
Federal Land, Inc. (Fed Land) 34
Property Company of Friends, Inc. (Pro-Friends) 45
Map of Lancaster New City (LNC) & MPIC Projects 51
AXA Philippines (AXA) 53
Metro Pacific Investments Corp. (MPIC) 59
Sumisho Motor Finance Corp. (SMFC) 66
Philippine Administration Agenda 69
Macroeconomic Indicators 70

4
New Sectors Synergy
• Toyota unit sales through
MBT/PSBank auto loans/TFS
lease-to-own package
• Fed Land & Pro-Friends home
mortgages by MBT/PSBank
• AXA bancassurance through
MBT/PSBank branch network
• Motor vehicle insurance
• Cross-selling of GT Capital
products into MPIC subsidiaries
• New strategic partners
• PPP projects
• Infrastructure
• Logistics
TMP/MBT expansion in Next Wave Cities
Wider property sector product offerings
(from Pro-Friends’ affordable/economic to
Fed Land’s upper mid-end)
Master-planned communities
• Retail spaces
• BPO/Commercial space
Expansion in
Existing Sectors
Strategic Direction

GT Capital directly owns market-dominant
businesses in underpenetrated sectors of
the Philippine economy, namely banking;
automotive assembly, importation,
dealership, and financing; infrastructure;
property development; and life- and non-
life insurance.
5
Property
Development
Banking Infrastructure
and Utilities
Life & Non-Life
Insurance
Auto Assembly and
Importation,
Dealership, and
Financing
Listed on the PSE since April 2012
Included in PSEi 16 September 2013
Included in FTSE All World Index 21 March 2014
Included in MSCI Philippine Index 29 May 2015
All-Time High Market Capitalization
(10 August 2016): Php282 billion
Strategic Partnerships with
Best-of-Class Brands
Corporate Profile

GT Capital Component Companies
Strongest bank in the Philippines for
2011, 2013, 2015, and 2016 according to
The Asian Banker
No. 1 bank in net interest margins as of
end-Dec 2017
Second largest Philippine bank by
assets as of end-Dec 2017
1
1
2
Over 40 years experience in vertical,
residential property development
Track record of landmark developments
in Metro Manila
Over 100 has. of land bank in prime
locations
Owns MERALCO, the Philippines’ largest power
distribution company
Largest automotive company in the
Philippines, maintaining 39% market
share as of end-Sept 2017
1
Highest passenger car, commercial
vehicle, and overall sales annually
since 2002
1
Triple Crown winner for 15 consecutive
years 2002 – 2016 1
Combined penetration rate of 13%
among Toyota dealers as of end-
Sept 2017
Network of 5 dealer outlets
Strategic partnership with Mitsui &
Co. of Japan
Second largest life insurance company in
terms of gross premiums as of end-2016
Pioneer in bancassurance
Pioneer in Health and Protection products
Strong bancassurance synergies with
Metrobank and PSBank involving 925
branches
2
1
1
Market leader in auto financing for
Toyota vehicles 1
15-year track record in auto lease
financing
Strategic partnership with Toyota
Financial Services of Japan
1
Strategic contiguous land bank of over 2,000 hectares
Established footprint in horizontal,
affordable and low-cost housing
Presence in Next Wave Cities (Cavite,
Iloilo, Cagayan de Oro)
Owns GLOBAL BUSINESS POWER, one of Visayas’
largest power generation companies 1
Owns MAYNILAD WATER, Metro Manila’s widest
water distribution network 1
Owns METRO PACIFIC TOLLWAYS, which
manages the Philippines’ widest toll road network 1
7
Joint venture with Sumitomo Corporation, one of Japan’s largest
conglomerates
Nationwide footprint in over 320 motorcycle dealerships
A leading institution in financing
Japanese motorcycle brands

Current Corporate Ownership Structure
40.7% 60.0% 58.104
Public Float Grand Titan
28.2%
Auto Assembly and Importation,
Dealership, and Financing Insurance
25.3%2,3
1 Free float (49%), Ty family - related entities (24%); Acquired 9.6% of Metrobank shares in April 2017 2 AXA SA (45%), FMIC (28%), Others (2%) 3 In April of 2016, AXA Philippines completed its acquisition of 100% of Charter Ping An Insurance Corp. from GT Capital.
4 Acquired 40.7% in December 2013 from Ty family - related entities; acquired remaining 19.3% in March 2014 from FMIC. On 7 March 2016, Toyota Manila Bay Corp. and Toyota Cubao, Inc.
merged, with Toyota Manila Bay Corp. (TMBC) as the surviving entity. 5 Acquired 40% on August 2014 from Metrobank and PSBank 6Acquired 11.43% of MPIC primary common shares and 4.13% of secondary common shares from Metro Pacific Holdings, Inc. 7On June 30, 2016, GT Capital subscribed to an additional Php 8.7B worth of shares, increasing its stake to 51.0%. 8On August 8, 2017, GT Capital acquired Sumisho Motor Finance Corporation from Philippine Savings Bank (PSBank).
40.0%5 21.0% 36.0% 51.0%
99.2%
Banking
26.47 %1 36.09%
Property
Development
22.7% 51.0%7 80% 100%
Infrastructure
and Utilities
15.55%6
100%
55.0%
7
56.19% 43.81%
20%

Financial Highlights 9M 2017
Consolidated Net Income -12%
Core Net Income +19%
Revenues +16%
Php10.8 billion
Php12.3 billion 9M 2016*
Php11.0 billion
Php9.3 billion 9M 2016
Php169.5 billion
Php146.2 billion 9M 2016
TMP & TMBC - Auto Sales (TMP – Php130.7B) Php 149.1 billion +15%
Equity in net income of associates (MBT–Php4.1B, MPIC–Php1.7B
AXA Philippines—Php 0.4B)
Php 6.6 billion +43%
FLI & PCFI - Real Estate Sales and Interest income on Real Estate
Sales (PCFI revenue contribution Php4.8B or 44% of total)
Php 10.9 billion +19%
8
*Includes GBP & CPAIC after tax gain on sale of Php2.9B
Excluding increase in stake (Php0.6B) +30%

GT Capital 9M 2017 vs 9M 2016 Comparative in
Ph
p B
illio
n
Consolidated
Core Net Income
9
MBT +40% (+19%)
AXA +39%
FLI +3%
MPIC Php1.76B
+76% (vs. GBP
Php1.0B 9M2017)
TMP -5%
PCFI NI contribution
Php421M +124%
*gross of Php149.3M amortization of FV adjustment
9.3
9M 20179M 2016
11.0
+19%

GT Capital Net Income Contribution
9M 2016 9M 2017
TMP
46.2%
MBT
27.5%
Fed
Land
9.8%
MPIC
7.0%
GBPC
3.9%
AXA
2.8%
TMBC
1.2% PCFI
1.6%
TMP
36.6%
MBT
34.4%
Fed
Land
7.7%
MPIC
12.5%
SMFC
0.0%
AXA
3.2%
PCFI
3.0%
TFS
1.1%
TMBC
1.3%
10
TFS
1.5%
MBT + TMP = 73.7% MBT + TMP = 71.0%
GT Capital Net Income Contribution
9M 2016 9M 2017
Automotive
39%
Banking
34%
Property
11%
Infrastructure
13% Insurance 3%
11
Automotive
49%
Banking
28%
Property
11%
Infrastructure
& Power 11% Insurance 1%
12

Peer Banks Highlights FY 2017
Source: 17-Q Report and SOC of Banks as of 31 December 2017 and BSP Report on Financial and
Economic Indicators
2,668 2,080 1,904
BDO MBT BPI
Total Assets (Php Billion)
1,792 1,265 1,202
BDO MBT BPI
+18% industry growth
+14% +19% +16%
Total Loans (Php Billion)
2,121
1,562 1,528
BDO BPI MBT
+11%
+10% +9%
Total Deposits (Php Billion)
3.8% 3.5% 2.9%
MBT BDO BPI
+15% +11% +10%
Net Interest Margin – NIMs (%)
+12% industry growth +12% industry growth

Peer Banks Highlights FY 2017
14
Source: 17-Q Report and SOC of Banks as of 31 December 2017 and BSP Report on Financial and
Economic Indicators
16.0% 15.1%
13.4%
MBT BDO BPI
Total Equity (Php Billion)
Total Capital Adequacy Ratio (%)
13.4% 13.3% 12.5%
BDO MBT BPI
Common Equity Tier 1 (CET1) Ratio (%)
297
202 181
BDO MBT BPI
14.4% 14.5%
12.7%
11.8% 12.9%
11.8%
MBT BDO BPI
CAR CET1
Total Capital Adequacy Ratio and CET1 (%)
+37% +3% +9%
Conglomerate Ownership in Peer Banks
48.20% 40.08% 36.09%
BPI BDO
Ayala Corporation SM Investments
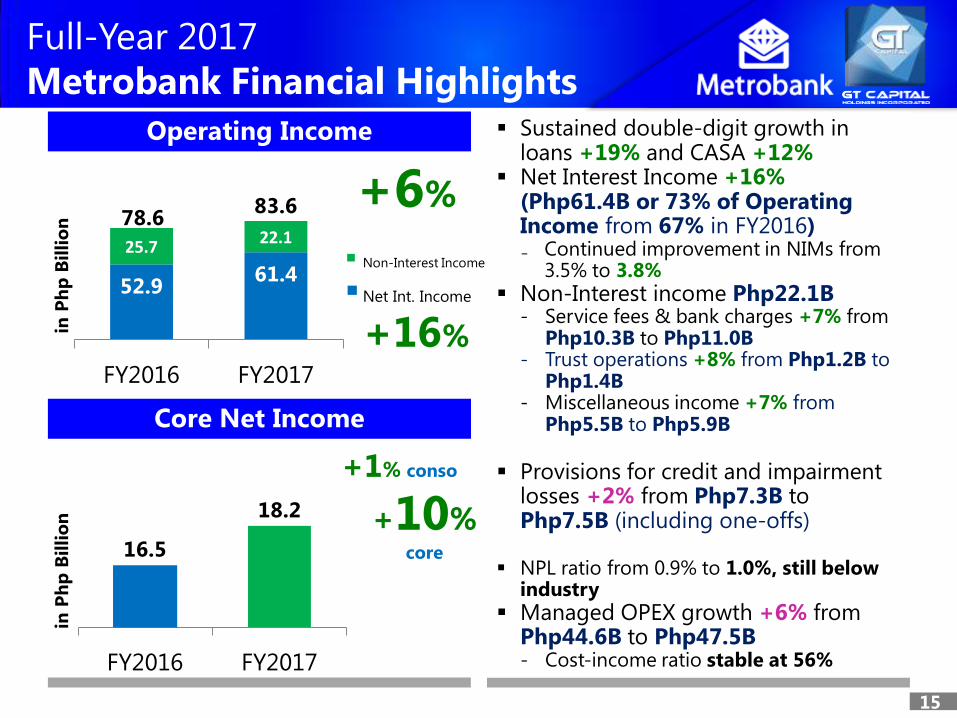
Sustained double-digit growth in loans +19% and CASA +12%
Net Interest Income +16% (Php61.4B or 73% of Operating Income from 67% in FY2016) ₋ Continued improvement in NIMs from
3.5% to 3.8%
Non-Interest income Php22.1B - Service fees & bank charges +7% from
Php10.3B to Php11.0B - Trust operations +8% from Php1.2B to
Php1.4B - Miscellaneous income +7% from
Php5.5B to Php5.9B
Provisions for credit and impairment
losses +2% from Php7.3B to Php7.5B (including one-offs)
NPL ratio from 0.9% to 1.0%, still below industry
Managed OPEX growth +6% from Php44.6B to Php47.5B - Cost-income ratio stable at 56%
15
Operating Income
Core Net Income
Full-Year 2017
Metrobank Financial Highlights in
Ph
p B
illio
n
52.9 61.4
25.7 22.1
FY2016 FY2017
+6%
Non-Interest Income
Net Int. Income
+16%
+1% conso
16.5
18.2
FY2016 FY2017
in P
hp
Bil
lio
n
+10% core
83.6 78.6
Growth rates in green Source: Bank data
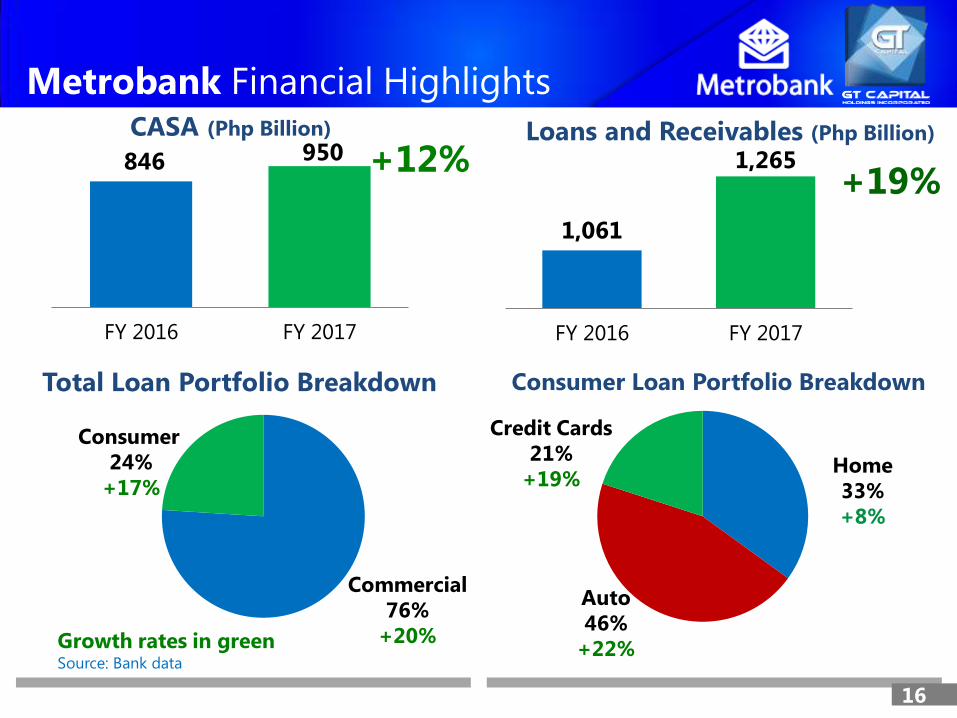
846 950
FY 2016 FY 2017
+12%
1,061
1,265
FY 2016 FY 2017
+19%
Commercial
76%
+20%
Consumer
24%
+17%
CASA (Php Billion) Loans and Receivables (Php Billion)
Total Loan Portfolio Breakdown Consumer Loan Portfolio Breakdown
16
Credit Cards
21%
+19% Home
33%
+8%
Auto
46%
+22%
Metrobank Financial Highlights

17
Metrobank to increase stake in Metrobank Card Corporation October 2017
Prior to acquisition
Metrobank 60%
ANZ Group 40%
Post-acquisition
Metrobank 100%
Two tranches
20% for Php7.4B within 2017
20% remaining by 3Q 2018
1,500,000
cards in force
Number One credit card company
in the Philippines Credit Card Association of the Philippines (CCAP)
32 years
of experience in the
credit card business
Part of ANZ’s global
strategy of focusing on
core banking
operations in Australia
and New Zealand
17

18

Once again, the Philippine auto industry
is the fastest-growing in ASEAN
19
Car Production in Units (‘000) End-Dec 2016 vs End-Dec 2017
Domestic Sales in Units (‘000) End-Dec 2016 vs End-Dec 2017
1,809
1,089
497
214 108
1,832
1,130
464
179 133
1%
+3%
-7%
-17% +30%
Thailand Indonesia Malaysia Vietnam Philippines
End-Nov 2016 End-Nov 2017
Philippines
975
682 515
325 243
994
767
522
380
227
+3%
+12%
+2%
+16% -7%
Indonesia Thailand Malaysia Philippines Vietnam
End-Sept 2016 End-Sept 2017
Philippines
Source: ASEAN Automotive Federation
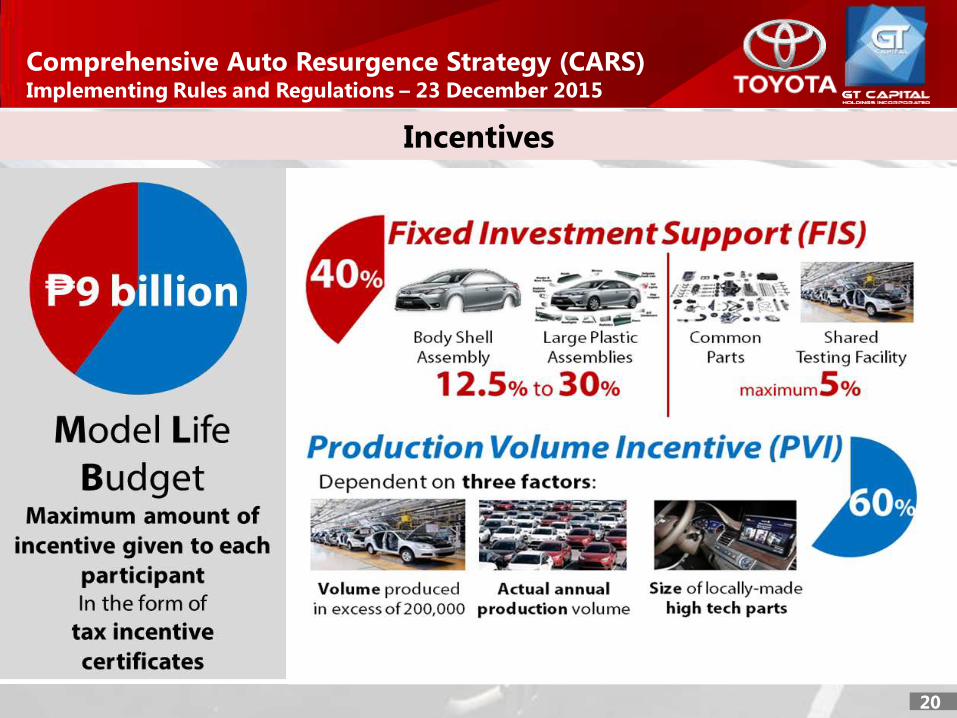
Comprehensive Auto Resurgence Strategy (CARS) Implementing Rules and Regulations – 23 December 2015
20
Incentives

21
Comprehensive Auto Resurgence Strategy (CARS) Implementing Rules and Regulations – 23 December 2015
Rationale and Regulations
• Aims to provide a strategic enhancement program for the Philippine
auto industry to increase local content from 30% to 60%
• Manufacturing of model, body shell, large plastic assemblies, common
parts, OEM parts, and shared testing facility are covered
• Php9.0 billion maximum incentive in the form of tax certificates
• Incentive per unit of 8% of price per unit or Php45,000 per unit
• 40% given for tooling, equipment and training costs for the initial start-up
operation (Fixed Investment Support)
• 60% given for volume-based incentive (Production Volume Incentive)
• Only entirely new models or full model change (FMC) units can qualify
• Minimum production volume of 200,000 units over six years (33,333
units per year or 2,750 units per month)
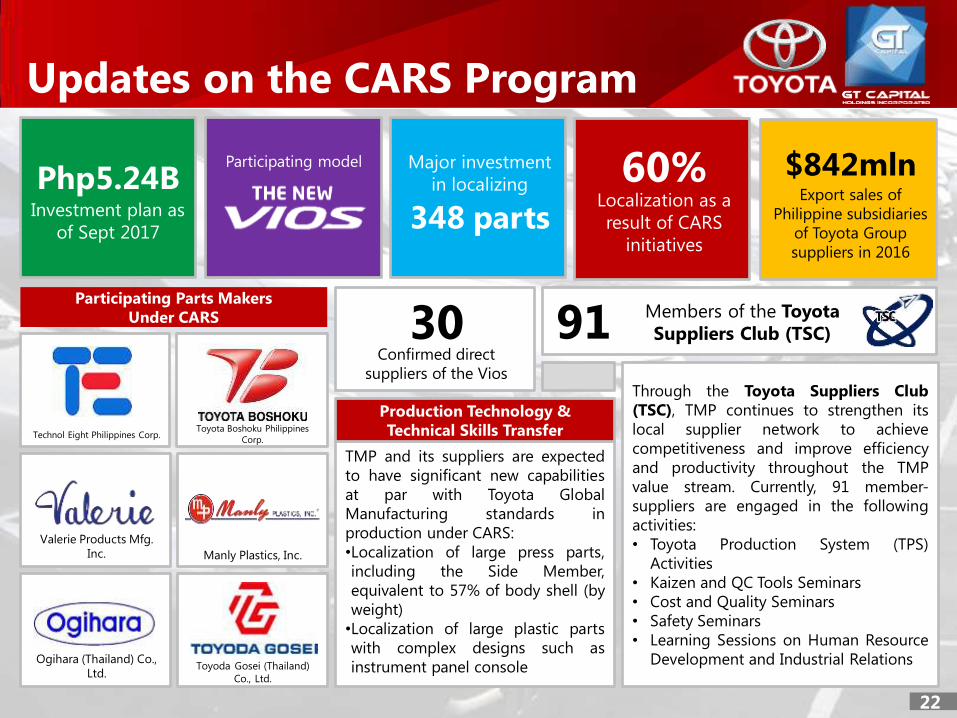
Updates on the CARS Program
22
Php5.24B Investment plan as
of Sept 2017
Participating model
348 parts
Major investment
in localizing 60%
Localization as a
result of CARS
initiatives
$842mln Export sales of
Philippine subsidiaries
of Toyota Group
suppliers in 2016
Participating Parts Makers
Under CARS
Technol Eight Philippines Corp.
Valerie Products Mfg.
Inc. Manly Plastics, Inc.
Ogihara (Thailand) Co.,
Ltd. Toyoda Gosei (Thailand)
Co., Ltd.
Toyota Boshoku Philippines
Corp.
30 Confirmed direct
suppliers of the Vios
91 Members of the Toyota
Suppliers Club (TSC)
Through the Toyota Suppliers Club
(TSC), TMP continues to strengthen its
local supplier network to achieve
competitiveness and improve efficiency
and productivity throughout the TMP
value stream. Currently, 91 member-
suppliers are engaged in the following
activities:
• Toyota Production System (TPS)
Activities
• Kaizen and QC Tools Seminars
• Cost and Quality Seminars
• Safety Seminars
• Learning Sessions on Human Resource
Development and Industrial Relations
TMP and its suppliers are expected
to have significant new capabilities
at par with Toyota Global
Manufacturing standards in
production under CARS:
•Localization of large press parts,
including the Side Member,
equivalent to 57% of body shell (by
weight)
•Localization of large plastic parts
with complex designs such as
instrument panel console
Production Technology &
Technical Skills Transfer

23
Factors in relation to industry car sales
Historically, gasoline prices
have not had a significant
correlation with Philippine
industry car sales.
More significant contributors to
auto sales would be the
affordability of car loan interest
rates and the increase in Filipinos’
disposable incomes.

Industry car sales vs. PH GDP per capita
Source: CAMPI, PEP-BAML
0
500
1000
1500
2000
2500
3000
3500
0
50000
100000
150000
200000
250000
300000
350000
400000
450000
500000
2008 2010 2012 2014 2016
Industry car sales GDP per capita
Units USD Motorization of the Philippine economy
24
The Philippines is now enjoying the
benefits of economic “motorization”
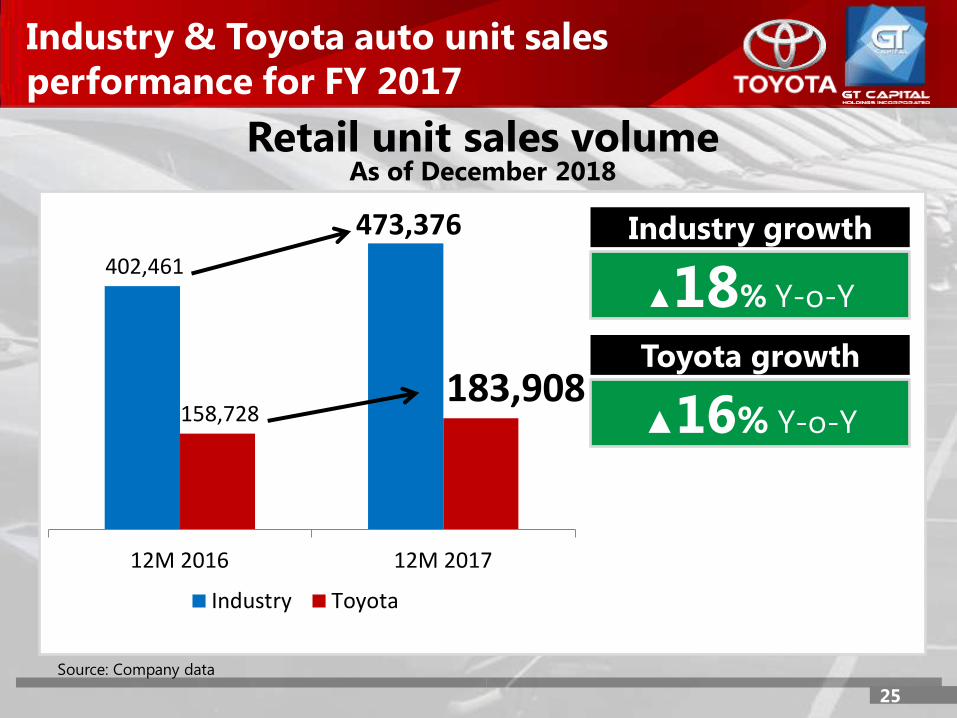
Industry & Toyota auto unit sales
performance for FY 2017
25
402,461
473,376
158,728 183,908
12M 2016 12M 2017
Industry Toyota
Retail unit sales volume As of December 2018
Source: Company data
Toyota growth
▲16% Y-o-Y
Industry growth
▲18% Y-o-Y
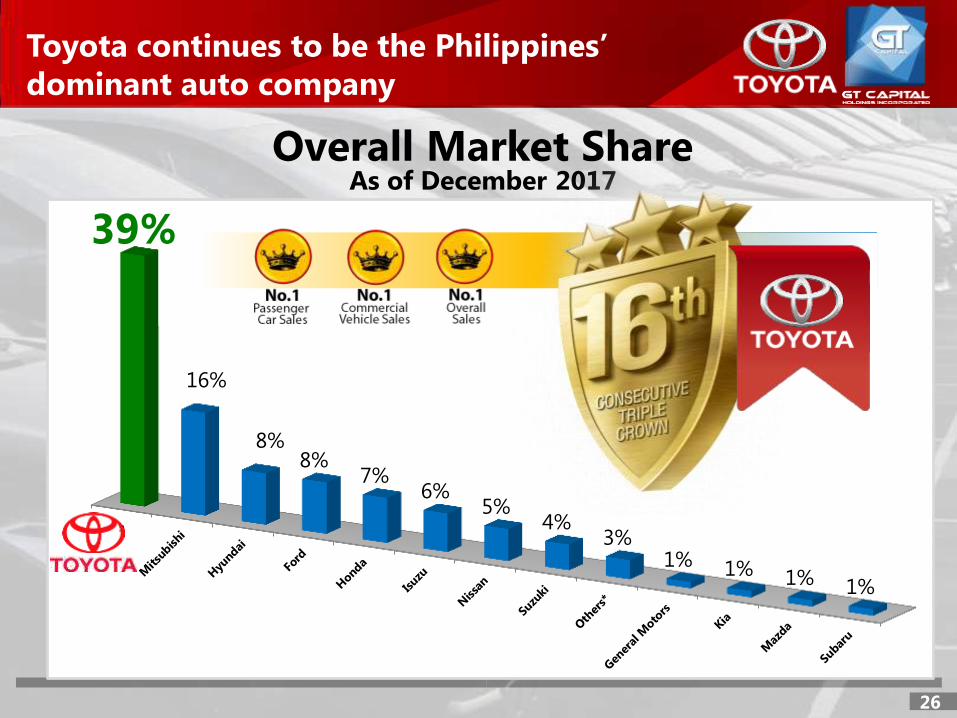
Toyota continues to be the Philippines’
dominant auto company
26
Overall Market Share As of December 2017
39%
16%
8% 8%
7% 6%
5% 4%
3% 1% 1% 1% 1%

Toyota continues to be the Philippines’
dominant auto company
27
Auto Industry Market Share As of December 2017
41%
17%
14% 11%
6% 4%
2% 2% 1% 1% 1% 0%
38%
16%
11% 9%
6% 5% 4% 4% 3% 1% 1% 1% 1%
Passenger Car Commercial Vehicle
Source: Company data

28
Revenues
Net Income ATP
Toyota Financial Highlights
+14%
9M 2016 9M 2017
130.7 115.0
in P
hp
Bil
lio
n
10.5 10
9M 2016 9M 2017
-6%
in P
hp
Billio
n
Wholesale volume +11%
133,261 units; retail volume +16%
(vs +15% industry growth)
Strong retail sales volume:
• PCs: Vios +8%
• CVs: Fortuner +42%, Innova +50%
& Avanza +16%
Overall market share from 39.0% to
39.4%
Due to unfavorable F/X differential and
higher OPEX & OH costs
Implemented across-the-board 2% price
increase (March & September 2017)

Target by end of year 2013 2014 2015 2016 2017 Current 2018E
Number of Dealerships 42 45 49 52 61 64 70
Expansion in Next Wave Cities outside Metro Manila
64 Dealerships as of 26 Feb 2018
Upcoming: Mabolo (Cebu), Calapan (Or. Mindoro),
Tuguegarao (Isabela), Valencia (Negros Or.),
Subic Bay (owned by GT Capital Auto Dealership Holdings, Inc.)
Toyota Dealership Expansion
29
ILIGAN, LANAO
DEL NORTE
January
SILANG, CAVITE
February
Toyota Ilocos Norte
Toyota La Union
Toyota Ilocos Sur
Toyota Dagupan
Toyota Baguio
Toyota Tuguegarao
Toyota Isabela
Toyota Nueva Vizcaya
Toyota Subic
Toyota Tarlac
Toyota Bataan
Toyota Angeles
Toyota San Fernando
Toyota Cabanatuan
Toyota Marilao
Toyota Plaridel
Two new dealers in Bulacan
Toyota Taytay
Toyota Dasmarinas
Toyota Santa Rosa
Toyota Calamba
Toyota San Pablo
Toyota Batangas
Toyota Lipa
Toyota Bacoor
Toyota Silang
Toyota General Trias
Toyota
Calapan
Toyota Puerto Princesa
Toyota Camarines Sur
Toyota Albay
Toyota Aklan Toyota Roxas
Toyota Iloilo
Toyota Bacolod
Toyota Dumaguete
Toyota Mandaue North
Toyota Cebu
Toyota Calbayog
Toyota Tacloban
Toyota Mandaue South
Toyota Talisay
Toyota Tagbilaran
Toyota Lapu-Lapu
Toyota Mabolo
New dealer in Cebu
Toyota Zamboanga
Toyota Cagayan de Oro
Toyota Iligan
Toyota Malaybalay
Toyota Tagum
Toyota Davao
Toyota Matina
New dealer in Davao
Toyota Kidapawan
Toyota General Santos
Toyota Butuan
Toyota Fairview
Toyota Commonwealth
Toyota
Marikina
Toyota
Pasig
Toyota Valenzuela
Toyota Abad Santos
Toyota North Edsa
Toyota Balintawak
Toyota
Cubao
Toyota Quezon Ave
Toyota Otis
Toyota Shaw
Toyota Makati
Toyota Pasong Tamo
Lexus Manila
Toyota Global City
Toyota Bicutan
Toyota Alabang
New dealer in Paranaque
Toyota Manila Bay
Prospective dealership
Existing dealership
Legend

New Building
30
• Inaugurated 19 Oct
2017
• The Philippines’
largest car
dealership of any
brand
• Toyota Manila Bay
Corp (TMBC)
ownership:
• 58% GT Capital
• 42% Mitsui & Co. of
Japan
• TMBC owns 5
dealers: Manila Bay,
Cubao, Marikina,
Abad Santos, Dasmariñas
• 7-storey building,
with full service bay

Globally trusted brand QUALITY, DURABILITY, RELIABILITY (QDR)
High resale value (up to 50%
of original selling price for 5
years old and above)
Availability of original parts,
supplies and service
Dealership network offering
full range of services
Corporate policy of
manufacturing original
parts for models
discontinued up to 15 years
Toyota Brand Attributes
31

In Million PHP Toyota Hyundai Honda Mitsubishi
Model Camry Sonata Accord
Price
Model Altis Elantra Civic Lancer
Price
Model Vios Accent City Mirage G4
Price
Model Innova Adventure
Price
Model Fortuner Santa Fe CR-V Montero Sport
Price
Model Hiace Starex
Price
Model Wigo Eon Brio Mirage
Price
Price Comparable by Category in Million Philippine Peso (PHP)
32
In Million PHP Toyota Hyundai
(No increase yet) Honda Mitsubishi
Model Camry Sonata Accord
Price 1.705 1.896 1.878 1.884 1.904
Model Altis Elantra Civic Lancer
Price 0.941 1.466 0.918 1.158 1.138 1.663 0.928 1.238
Model Vios Accent City Mirage G4
Price 0.629 0.968 0.678 0.928 0.820 1.041 0.584 0.819
Model Innova Adventure
Price 0.990 1.639 0.952 1.010
Model Fortuner Santa Fe CR-V Montero Sport
Price 1.592 2.260 1.748 2.533 1.648 2.086 1.421 2.162
Model Hiace Starex
Price 1.373 2.634 1.378 1.988
Model Wigo Eon Brio Mirage
Price 0.537 0.611 0.493 0.511 0.631 0.791 0.570 0.743 Source: Company websites; Retail prices as of 17 January 2017

Toyota Hyundai Honda Mitsubishi
Model Camry Sonata Accord
Price
Model Altis Elantra Civic Lancer
Price
Model Vios Accent City Mirage G4
Price
Model Innova Adventure
Price
Model Fortuner Santa Fe CR-V Montero Sport
Price
Model Hiace Starex
Price
Model Wigo Eon Brio Mirage
Price
Source: Company websites; Retail prices based on average Peso-Dollar rate of Php50.14/USD1.00
Price Comparable by Category in United States Dollars (USD)
33
Toyota Hyundai Honda Mitsubishi
Model Camry Sonata Accord
Price 33,998 37,807 37,448 37,567 37,966
Model Altis Elantra Civic Lancer
Price 18,764 29,232 18,305 23,091 22,692 33,161 18,504 24,686
Model Vios Accent City Mirage G4
Price 12,542 19,302 13,519 18,504 16,351 20,758 11,645 16,331
Model Innova Adventure
Price 19,741 32,682 18,983 20,140
Model Fortuner Santa Fe CR-V Montero Sport
Price 31,745 45,065 34,855 50,508 32,861 41,595 28,335 43,111
Model Hiace Starex
Price 27,378 52,522 27,478 39,641
Model Wigo Eon Brio Mirage
Price 10,708 12,183 9,831 10,189 12,582 15,773 11,366 14,816

34

Strong office demand continues
35
Quezon City
13%
Bonifacio 3%
Makati 1%
Alabang 2%
Ortigas 2%
Bay Area 1%
Vacancy rates, office space (%)
654,579 square meters
taken up as of 9M 2017 vs. 630,000 sq.m. in FY 2016 (+39%)
Source: Leechiu Property Consultants, as of 30
September 2017
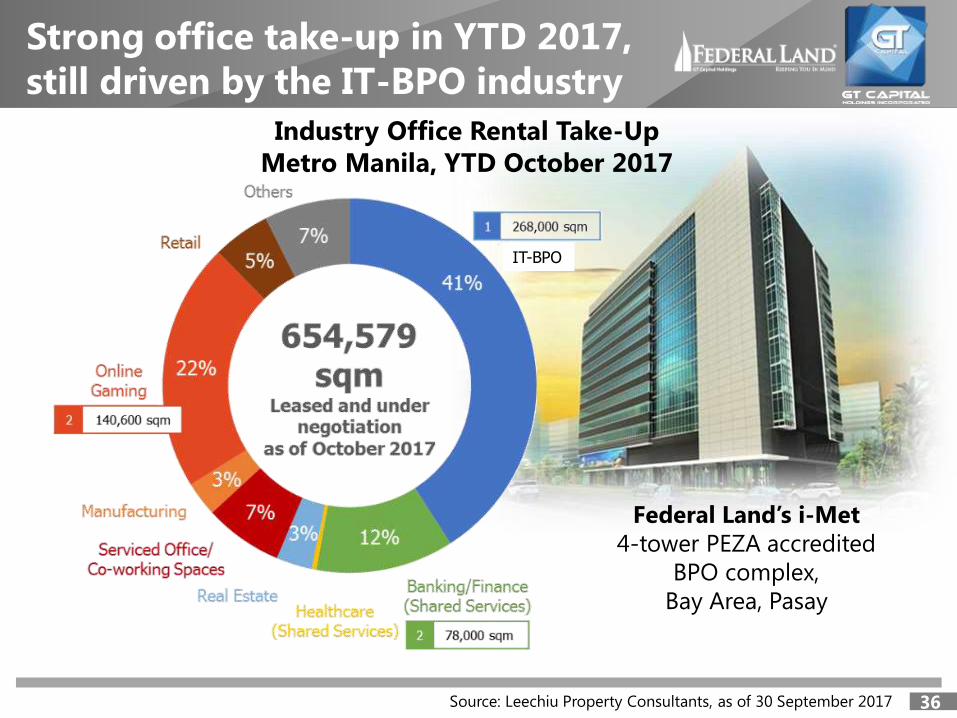
Strong office take-up in YTD 2017,
still driven by the IT-BPO industry
36
Federal Land’s i-Met
4-tower PEZA accredited
BPO complex,
Bay Area, Pasay
Source: Leechiu Property Consultants, as of 30 September 2017
Industry Office Rental Take-Up
Metro Manila, YTD October 2017
IT-BPO

Industry reservation sales in Metro
Manila remain healthy
37 Source: First Metro/DBS Vickers Securities, as of 30 September 2017
Industry-wide reservation sales
Residential condominiums, Metro Manila, YTD 2017
39.4
51.9
59.5
41.1
44.6
55.7 56.8
42.4
46.7
58.4 56.1
45.4
51.9
64.9
0
10
20
30
40
50
60
70
1Q
2014
2Q
2014
3Q
2014
4Q
2014
1Q
2015
2Q
2015
3Q
2015
4Q
2015
1Q
2016
2Q
2016
3Q
2016
4Q
2016
1Q
2017
2Q
2017
In billions
of PHP CAGR +18%

Reservation sales +38% from Php9.3B to
Php12.9B
- Launched 4 projects: - Park Avenue in Jan. 2017 (BGC)
- Sunshine Fort in July 2017, JV with NRE
- Sienna Towers in August 2017 (Marikina)
- Palm Beach West – Siargao in August 2017 (Macapagal)
- Inventory -19% from 1,824 to 1,470
units (7 mos.)
Real estate sales +9% from Php5.9B to
Php6.4B
GPM maintained at 36%
OPEX +6% from Php1,513M to Php1,609M
due to increase in salaries (Php104M), taxes
and licenses (Php41M)
38
Revenues
Net Income
Federal Land Financial Highlights
7.5 8.0
9M 2016 9M 2017
in P
hp
Bil
lio
n +6%
+9% core
Core
Non-core
0.2
-6% +3%
core
Core
Non-core
1,139.8
1,071.2
9M 2016 9M 2017
1,033.5
106.3
in P
hp
Millio
n
7.3
1,139.8 1,071.2
4.3
1,066.9
Php4M gain from sale of Skyland Plaza to PCFI
in 2Q2017
Php106M gain from sale of Marikina lot in
1Q2016

Over 30 On-going Projects
• 7 launched in 2011
• 11 launched in 2012
• 5 launched in 2013
• 4 launched in 2014
• 3 launched in 2015
• 4 launched in 2016
• 4 launched in 2017
7 planned launches in 2018
8 Different Locations
• 6 cities within Metro Manila
• 2 cities outside Metro Manila
18 sqm. to 400 sqm.
unit size range
PHP20M – PHP101M
price range
Federal Land Current Projects
39
Recurring Income at 9% of total revenue
New Launches in 2017
Grand Central Park
Bonifacio
February 2017
JV with Isetan Mitsukoshi
and Nomura Real Estate
August 2017
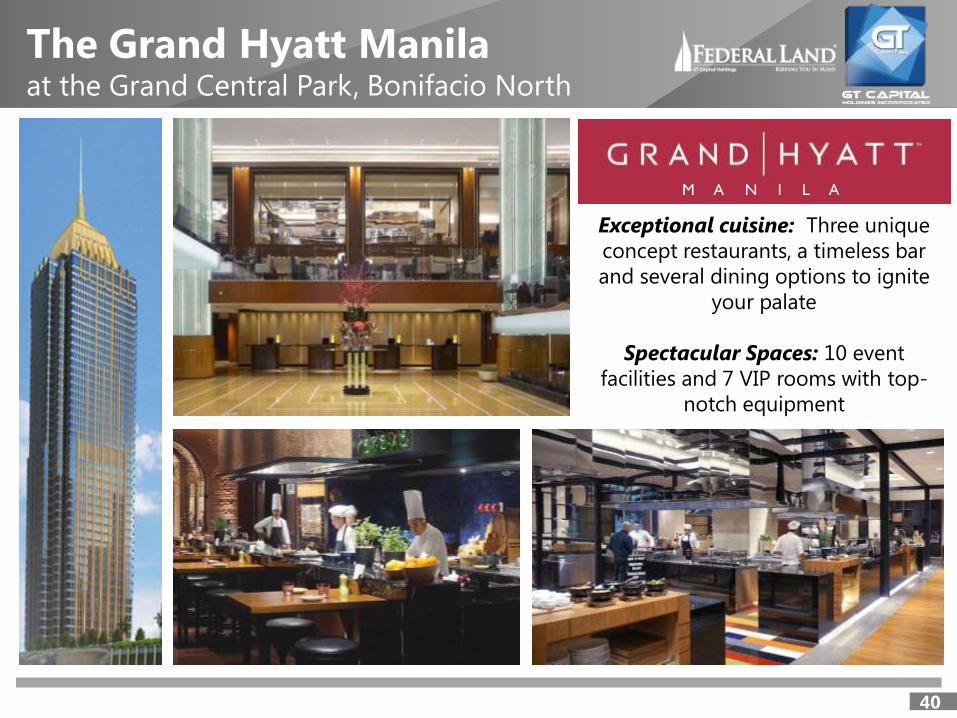
The Grand Hyatt Manila at the Grand Central Park, Bonifacio North
40
M A N I L A
Exceptional cuisine: Three unique
concept restaurants, a timeless bar
and several dining options to ignite
your palate
Spectacular Spaces: 10 event
facilities and 7 VIP rooms with top-
notch equipment

Sunshine Fort at the Grand Central Park, Bonifacio North
41
• Total project cost:
USD400 million
• Located within 10-
hectare Grand
Central Park
• JV between Federal
Land, Nomura Real
Estate
• Isetan Mitsukoshi as
anchor tenant and
O&M partner

◄ Palm Beach West-Siargao BAY AREA, PASAY
Launched August 2017
►
Siena Residences MARIKINA
Launched August 2017
New Project Launches
by Federal Land
42
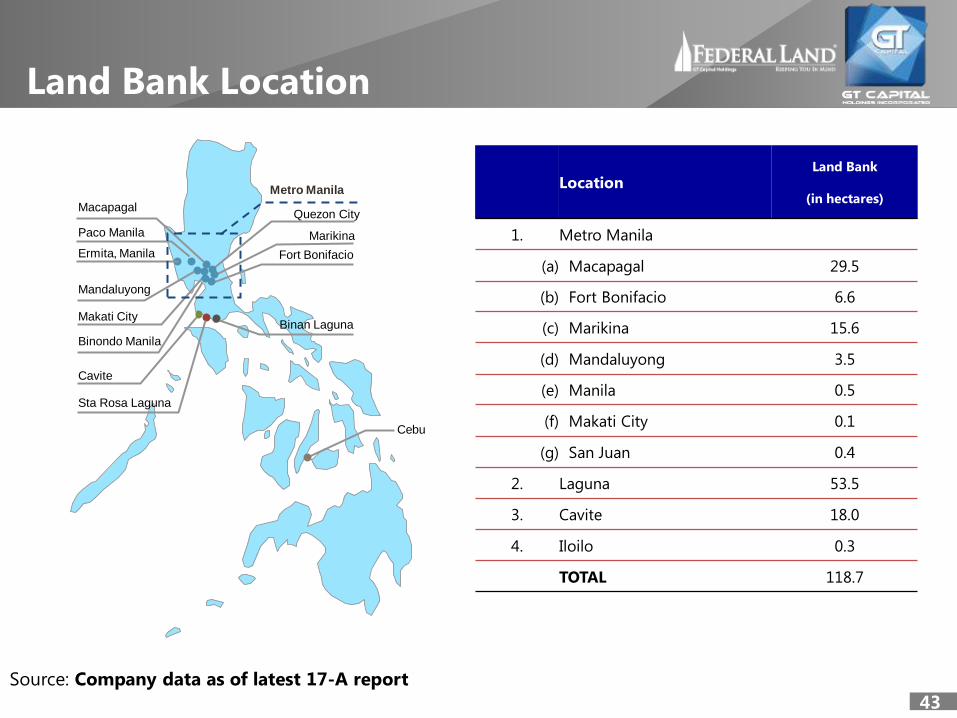
Source: Company data as of latest 17-A report
Land Bank Location
43
Cebu
Fort Bonifacio
Marikina
Macapagal
Paco Manila
Ermita, Manila
Makati City
Mandaluyong
Binondo Manila
Metro Manila
Quezon City
Binan Laguna
Cavite
Sta Rosa Laguna
Location Land Bank
(in hectares)
1. Metro Manila
(a) Macapagal 29.5
(b) Fort Bonifacio 6.6
(c) Marikina 15.6
(d) Mandaluyong 3.5
(e) Manila 0.5
(f) Makati City 0.1
(g) San Juan 0.4
2. Laguna 53.5
3. Cavite 18.0
4. Iloilo 0.3
TOTAL 118.7

Rising Together
to New Heights
44
FIABCI Philippines 2017 Gold Award FOR OUTSTANDING DEVELOPER
• Gold Award for Outstanding Developer in the
Residential High Rise category during the 2017
FIABCI Real Estate Awards for the Grand Midori
Makati
• FIABCI is the Federation Internationale des
Administrateurs de Biens et Conseils Immobiliers
(FIABCI) [English: The International Real Estate
Federation]
45

LRT1 Extension • Metro Pacific signed
engineering, procurement,
and construction (EPC)
agreement - signed
February 12, 2016
• 11.7 km extension of LRT1
to Bacoor, Cavite
• Start of construction slated
by 2017
• Php25B project finance
loan in place, 64%
earmarked for the project
C5 South Link to Cavitex CALA Expressway (CALAX)
Source: Metro Pacific
New developments in Cavite
46
• Expansion of Cavitex
project
• Groundbreaking was in
May 2016
• Php12.7 billion project; 7.6
km
• Construction expected to
start by Q1 2017; Target
completion in 2020
• Ongoing preparation of
detailed engineering
design
• Right-of-way acquisition
50% accomplished
• Target completion 2020
• Start 1H 2017 for
Laguna portion
• Start 2H 2017 for
Cavite portion
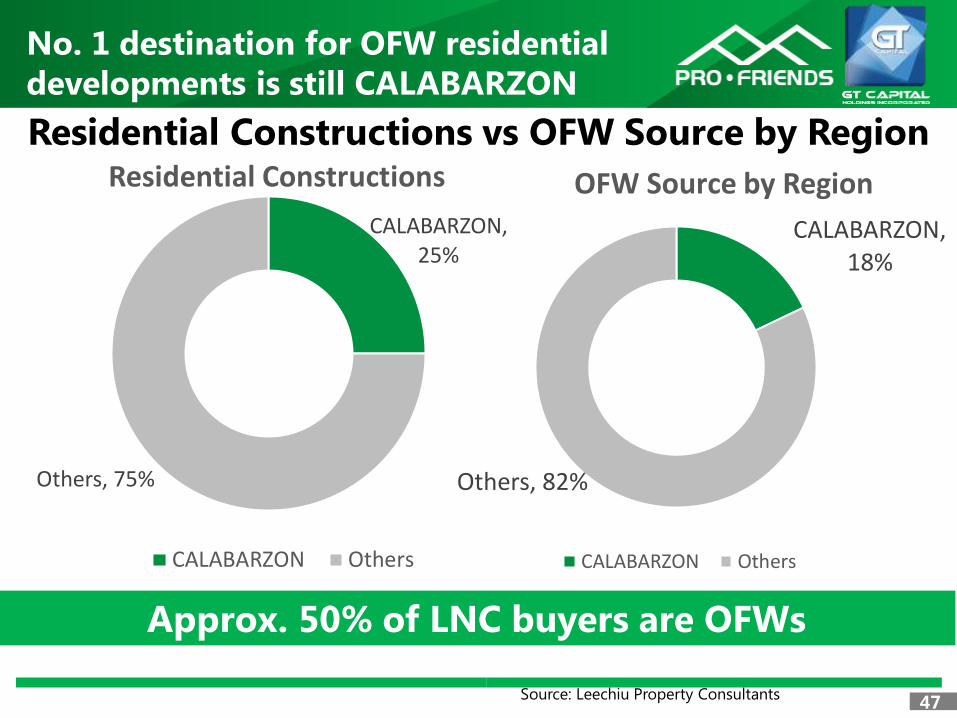
No. 1 destination for OFW residential
developments is still CALABARZON
47
Residential Constructions vs OFW Source by Region
Source: Leechiu Property Consultants
CALABARZON, 18%
Others, 82%
OFW Source by Region
CALABARZON Others
CALABARZON, 25%
Others, 75%
Residential Constructions
CALABARZON Others
Approx. 50% of LNC buyers are OFWs

IT-BPO labor force outside Metro Manila
is estimated to grow by 61% in 2022
48
Number of full-time BPO employees IT-BPAP estimates, 2017-2022
Source: IT-BPAP Roadmap 2022, as of 30 September 2017
941 1014
1086 1161
1236 1301
309 345 381 416 454 499
0
200
400
600
800
1000
1200
1400
2017 2018 2019 2020 2021 2022
Metro Manila Other Regions
+38%
+61%
Em
plo
yees
in
tho
usa
nd
s
+7% CAGR
+10% CAGR
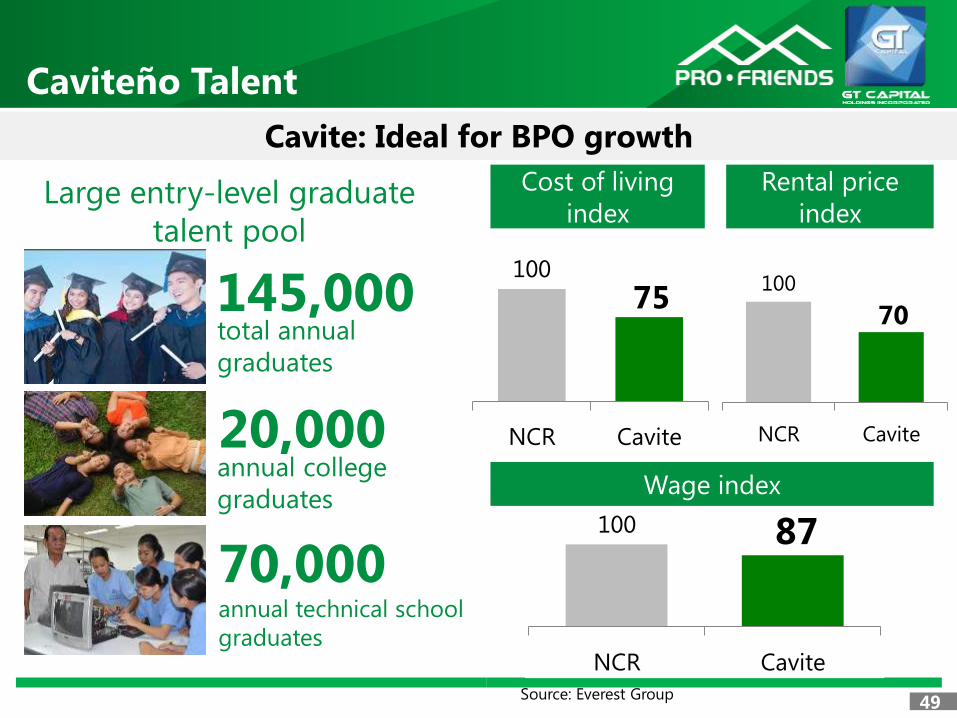
Caviteño Talent
49
Large entry-level graduate
talent pool
Cavite: Ideal for BPO growth
70,000 annual technical school
graduates
145,000 total annual
graduates
20,000 annual college
graduates
Source: Everest Group
100
75
NCR Cavite
Cost of living
index
100
70
NCR Cavite
Rental price
index
100 87
NCR Cavite
Wage index

Property Development Sweet Spot
Source: Housing and Urban Development Coordinating Council 50
Segment Demand Supply Surplus/
(Deficit)
Socialized 1,146,275 551,109 (595,166)
Economic 2,509,271 618,542 (1,890,729)
Low cost 705,642 276,597 (429,045)
Middle 34,590 370,109 335,519
High 6,789 276,597 269,808
Segment Price Range % to Total
Households PHP USD
Socialized <400k <9k 23.0
Economic 400k –
1.25m
9k – 28k 66.3
Low cost 1.25m –
3m
28k – 67k 9.6
Middle 3m – 6m 67k – 133k 0.9
High > 6m > 133k 0.2
2.3 million homes
Total backlog in 2016 for
low-cost and economic segments 6.5 million homes
By 2030, backlog is projected to grow to
The Low-Cost Property Sector
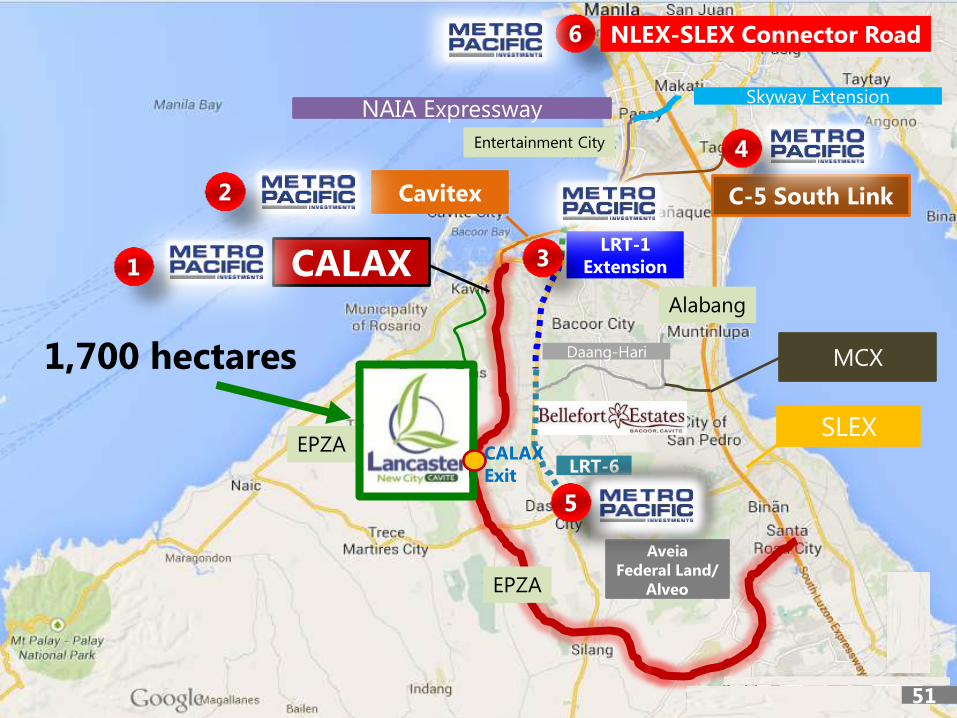
CALAX
MCX
EPZA
EPZA
Alabang
Entertainment City
Cavitex
Daang-Hari
SLEX
Aveia
Federal Land/
Alveo
NAIA Expressway
C-5 South Link
Skyway Extension
LRT-1
Extension
LRT-6 CALAX
Exit
1,700 hectares
1
2
3
4
5
6 NLEX-SLEX Connector Road
51

Gross reservation sales +58% from
Php10.5B to Php16.7B (Php1.9B per
month)
YTD houses built 3,973 units (average of 440
units/month); units delivered qualified for
bank take-out
Aggregate YTD bank take-out Php5.9B
(average of Php650M/month)
Real estate sales +28% from Php3.5B to
Php4.5B
Interest income from in-house financing -2%
from Php337M to Php330M due to
increased bank takeout
OPEX +35% from Php766M to Php1,032M
due to higher salaries and outside services
Higher interest expense due to increased in-
house financing operations
52
Revenues
Net Income
PRO-FRIENDS Financial Highlights
3.9 4.9
9M 2016 9M 2017
+27%
Other Income
RES
0.4
0.4 4.5
in P
hp
Billio
n
785.0 825.4
9M 2016 9M 2017
+5%
in P
hp
Millio
n
3.5
+28%

53
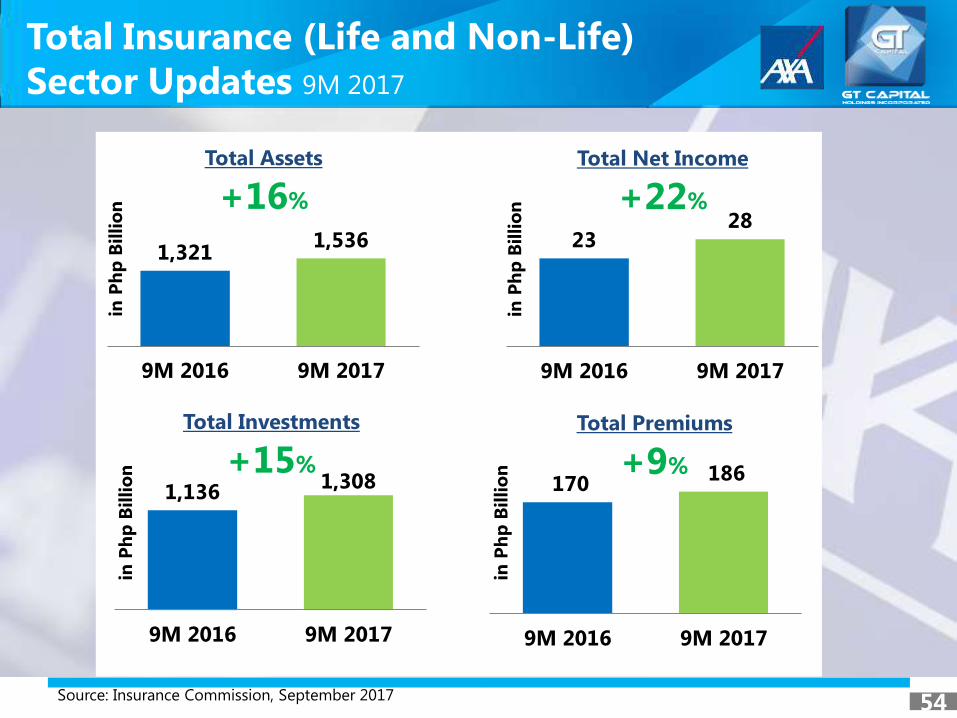
Source: Insurance Commission, September 2017 54
Total Insurance (Life and Non-Life)
Sector Updates 9M 2017
1,321
1,536
9M 2016 9M 2017
Total Assets
in P
hp
Billio
n +16%
23 28
9M 2016 9M 2017
Total Net Income
in P
hp
Billio
n +22%
1,136
1,308
9M 2016 9M 2017
Total Investments
in P
hp
Billio
n +15%
170 186
9M 2016 9M 2017
Total Premiums
in P
hp
Billio
n +9%

Source: Insurance Commission, May 2017 55
31.9
21.5 19.3
18.6 18.1
16.6
12.3
8.1 7.3
5.8 5.8
3.0 2.7
Premium Income in billion Php
Life Insurance Industry Rankings
based on FY 2016 Premium Income
is one of the country’s largest
insurers and the world’s most
trusted insurance brand
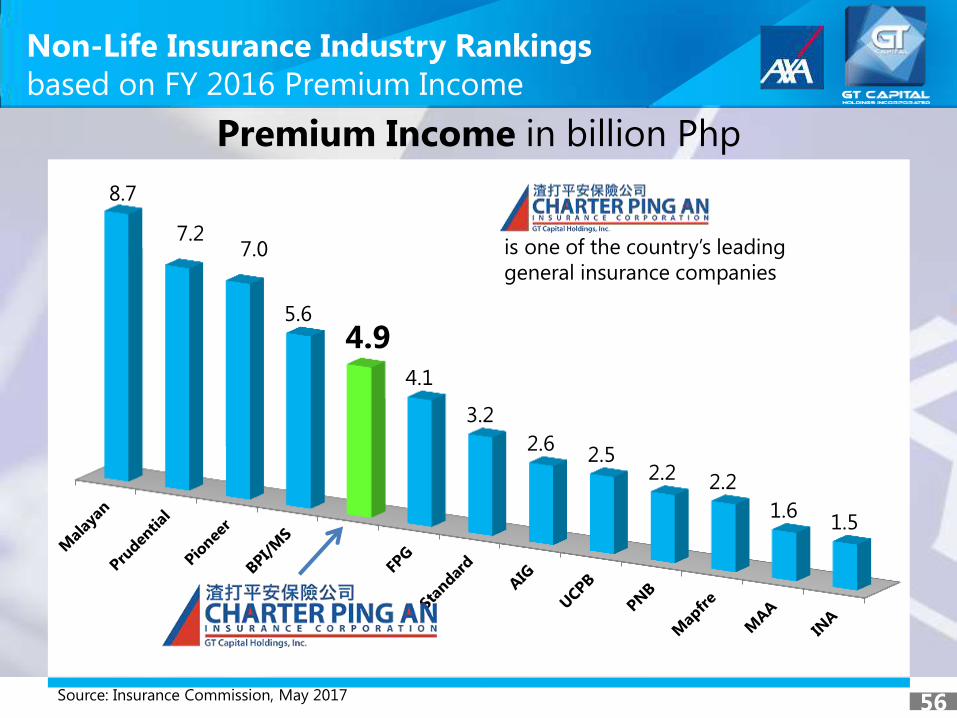
Source: Insurance Commission, May 2017 56
8.7
7.2 7.0
5.6
4.9 4.1
3.2
2.6 2.5
2.2 2.2
1.6 1.5
Premium Income in billion Php
Non-Life Insurance Industry Rankings
based on FY 2016 Premium Income
is one of the country’s leading
general insurance companies
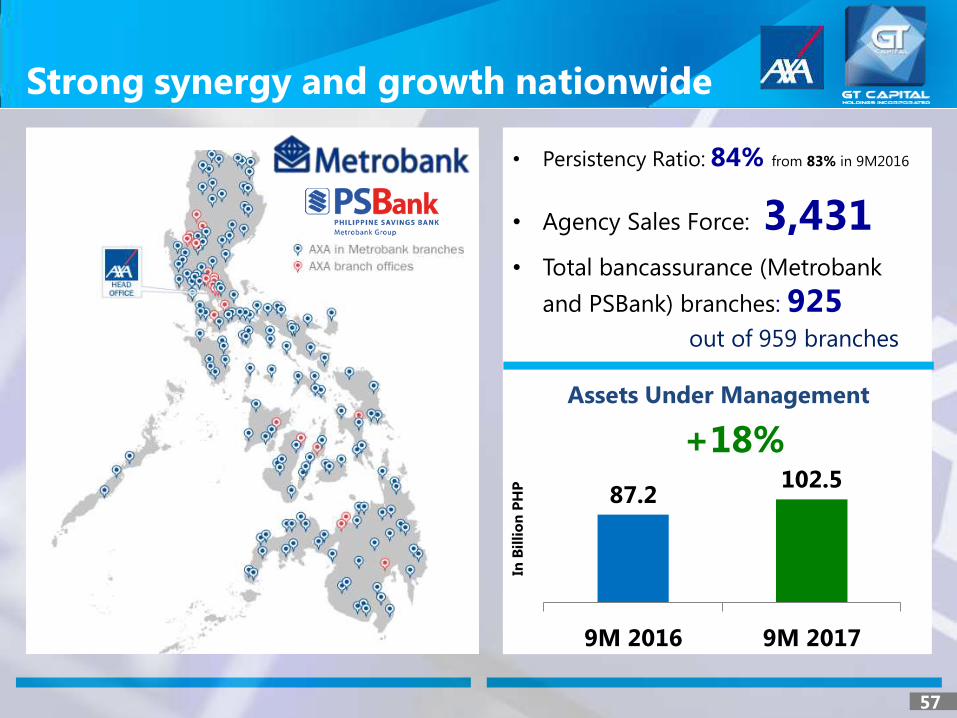
Strong synergy and growth nationwide
57
• Total bancassurance (Metrobank
and PSBank) branches: 925
• Persistency Ratio: 84% from 83% in 9M2016
• Agency Sales Force: 3,431
In B
illi
on
PH
P
+18%
Assets Under Management
87.2 102.5
9M 2016 9M 2017
out of 959 branches

New Business (APE) +26% from Php3.7B
to Php4.7B
o Regular Premium (RP) +29%
o Single Premium (SP) +17%
SP/RP Premium Income mix – from 54:46
to 53:47
CPAIC Gross written premium +15%
Php3.7B to Php4.2B
o Motor +32%
o Property +13%
Premium margins Php3.3B to Php4.4B
+34% due to RP (35% GPM)
AUM-Linked Php75B to Php89B +20%;
Asset management fees +20%
Gain from restatement of reserves
Php273M post-tax (RBC 2 framework)
CPAIC net income Php21M due to
turnaround in financial performance
58
Gross Premium
Net Income
AXA Philippines Financial Highlights in
Ph
p B
illio
n
in P
hp
Billio
n
+18% AXA
CPAIC
+20%
+11%
19.2 22.7
9M 2016 9M 2017
3.5
15.7
18.8
3.9
+109% AXA
CPAIC
+32%
>100%
0.85 1.77
9M 2016 9M 2017
(0.49)
1.33
0.02
1.75

59

• Meralco
o Energy sales +4% from 30,103 GWh to
31,402 GWh; NI* +2%
o Increased effective shareholding from
41.2% (June 2016) to 45.5% (July 2017)
o Higher dividend income from Beacon
from Php1.2B to Php2.5B
• Toll Roads
o High traffic growth: NLEX +7%, Cavitex
+8%, SCTEX +22%, DMT+2% & CII+8%
o Core NI +28%; NI +107%
• Water
o Billed volume +2%; Ave. effective tariff
+0.1%
o NI +6%
• Hospitals
o Outpatient +14%; Inpatient +5%
o NI +14%
• Equity accounting net income for GT
Capital at Php1.73B
Share in Operating Net Income (Core)
Core Net Income
Metro Pacific Financial Highlights in
Ph
p B
illio
n
in P
hp
Billio
n
60
11.6 14.0 +21%
+22%
*Net Income
9.3 11.3
9M 2016 9M 2017
2.7 2.8
2.6 3.0
5.7 7.6
0.4 0.5 0.23
0.21
9M 2016 9M 2017
Logistics / Indra
LRMC/AFPI
Hospitals
Meralco/Beacon/GBPC
MPTC
Maynilad/MWIC
Rising Together
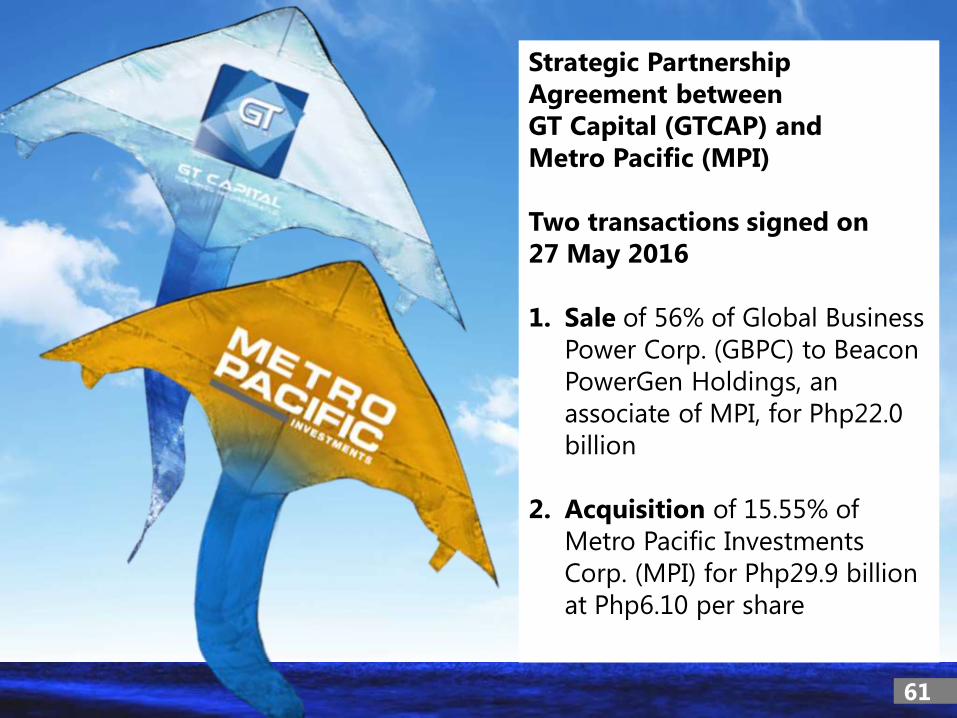
to New Heights Strategic Partnership
Agreement between
GT Capital (GTCAP) and
Metro Pacific (MPI)
Two transactions signed on
27 May 2016
1. Sale of 56% of Global Business
Power Corp. (GBPC) to Beacon
PowerGen Holdings, an
associate of MPI, for Php22.0
billion
2. Acquisition of 15.55% of
Metro Pacific Investments
Corp. (MPI) for Php29.9 billion
at Php6.10 per share
61
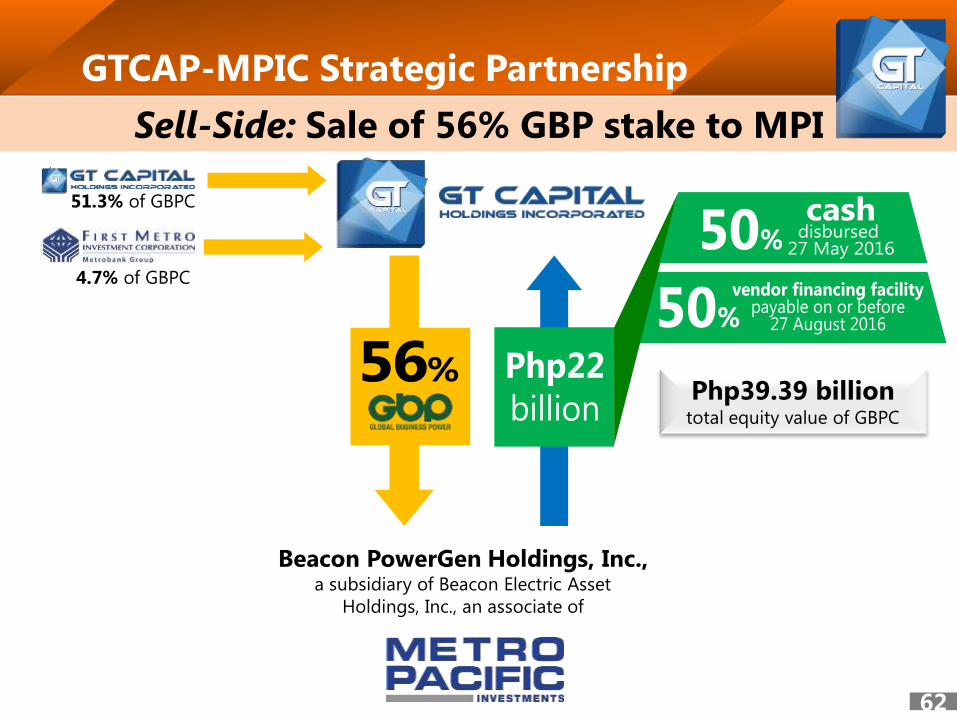
Sell-Side: Sale of 56% GBP stake to MPI
GTCAP-MPIC Strategic Partnership
62
Beacon PowerGen Holdings, Inc., a subsidiary of Beacon Electric Asset
Holdings, Inc., an associate of
Php39.39 billion total equity value of GBPC
51.3% of GBPC
4.7% of GBPC
11.43% Php22
billion
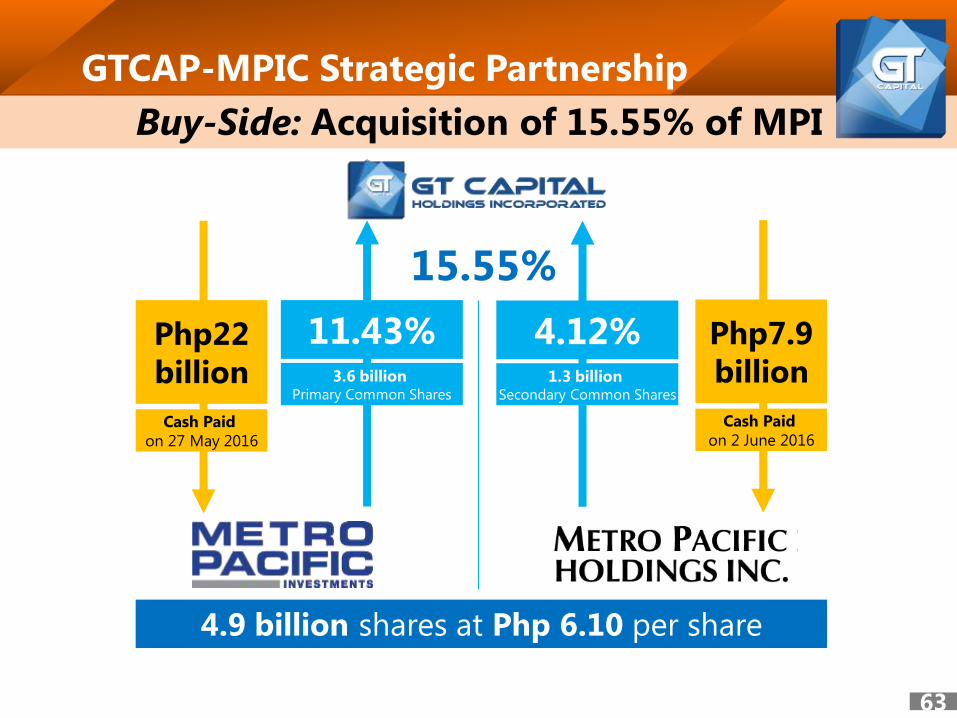
15.55%
Buy-Side: Acquisition of 15.55% of MPI
GTCAP-MPIC Strategic Partnership
4.9 billion shares at Php 6.10 per share
Cash Paid
on 27 May 2016
3.6 billion Primary Common Shares
4.12% 1.3 billion
Secondary Common Shares
Php7.9
billion
Cash Paid
on 2 June 2016
63

Accounting Criteria for
“Significant Influence”
Two board seats
Joint selection of an
Independent Director
Representation in board
committees
Entitled to nominate 1/3 members in each of the:
Audit, Risk Management, Corporate Governance
committees
Veto rights on certain corporate acts: declaration/payment of any dividend, adoption of
annual budget or business plan, capital calls, and
any amendment to such 64
Rationale
GTCAP-MPIC Strategic Partnership
• Diversification of power investments in the Visayas into
the high-growth infrastructure and utilities sectors
• Many of MPIC’s ongoing PPP projects are in Cavite,
home to Pro-Friends’ Lancaster New City
• Set up of Logistics subsidiary (MetroPac Movers, Inc.)
will create opportunities for logistics hub
• Synergies (vehicle sales, staff housing, mortgage loans,
utility connections, insurance, etc.)
• Cross-selling of GT Capital products into MPIC
subsidiaries
65

66
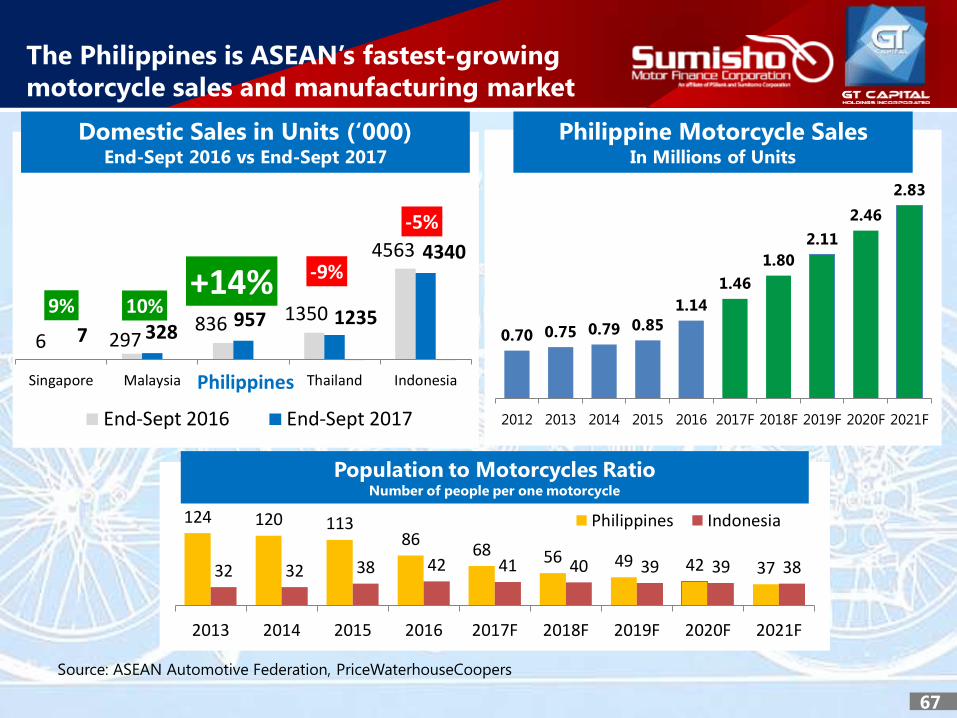
The Philippines is ASEAN’s fastest-growing
motorcycle sales and manufacturing market
67
Source: ASEAN Automotive Federation, PriceWaterhouseCoopers
Philippine Motorcycle Sales In Millions of Units
0.70 0.75 0.79 0.85
1.14
1.46
1.80
2.11
2.46
2.83
2012 2013 2014 2015 2016 2017F 2018F 2019F 2020F 2021F
Population to Motorcycles Ratio Number of people per one motorcycle
124 120 113 86
68 56 49 42 37 32 32 38 42 41 40 39 39 38
2013 2014 2015 2016 2017F 2018F 2019F 2020F 2021F
Philippines Indonesia
Domestic Sales in Units (‘000) End-Sept 2016 vs End-Sept 2017
6 297 836 1350
4563
7 328 957 1235
4340
9% 10% +14% -9%
-5%
Singapore Malaysia Philippines Thailand Indonesia
End-Sept 2016 End-Sept 2017
Philippines

GT Capital enters motorcycle financing
through acquisition of Sumisho
68
20% of
acquired
for Php379.9 million
from
As GDP per capita expands,
More people want to own their
own vehicle
More motorcycle owners shift
from two-wheelers to four
wheelers
Sumisho acquisition is a customer
acquisition strategy that will allow
us to expand to a much broader
population
Evolution of motorization

Philippine Administration Agenda
Continue stable
macroeconomic
policies
Increase PH’s
competitiveness
and the ease of
doing business
Relax constitutional
restrictions on
foreign ownership,
except for land
Increase
infrastructure
spending to 9%
of GDP by 2022
Boost rural
productivity and
rural tourism;
Ensure security
of land tenure
Develop human
capital, including
health and
education
Promote science,
math, and arts to
enhance
innovation
Improve social
protection
programs,
including CCT
69
Source: Various Philippine broadsheets

Source: Bangko Sentral ng Pilipinas, Migrante Int’l, IT-BPAP
Benign inflation
3.2% as of year-end 2017
Foreign direct investments
USD9.4 billion FY 2017
Gross international reserves
USD81.6 billion
end-2017
External Debt-to-GDP
24.5% as of end-2017
PHP11.2 trillion Domestic liquidity, end-2017
▲13% from 9.888 trillion in 2016
Macroeconomic Indicators
53% of Filipinos are below 25 years old
Population 104.9 million
remitting
USD30.8Bln
▲4% YoY Jan-Dec 2017
11 million OFWs
Thriving BPO sector
USD22.9 billion revenues
▲12% year-on-year
1.2 million employees
70
▲18% from 7.9 billion Y-o-Y

Macroeconomic Indicators
89.2 94.2 99.5 105.7 108.9 115.2
2012 2013 2014 2015 2016 2017
In USD Billion Household Consumption
68.7% 10.5%
28.6% Consumption
Government
Investments
Household Consumption as % of GDP As of FY 2017
$2,364 $2,591
$2,768 $2,852 $2,880 $2,947
$3,008
2011 2012 2013 2014 2015 2016 2017
5-year CAGR: +4%; PH now in motorization ($3,000<)
GDP Per Capita
Full Year 2017 GDP Growth
3.9%
3.5% 5.6%
5.0%
6.5% Still the fastest
among the ASEAN-5
Source: Bangko Sentral ng Pilipinas
+6% Year-on-Year
71

Rising Together
to New Heights
72