Investor Presentation - GT Capital Holdings
66
October 2020 Investor Presentation First Half 2020 Financial and Operating Results For more information, Visit gtcapital.com.ph/investor-relations or contact [email protected] Music from Bensound.com
-
Upload
khangminh22 -
Category
Documents
-
view
3 -
download
0
Transcript of Investor Presentation - GT Capital Holdings

October 2020
Investor PresentationFirst Half 2020 Financial and Operating Results
For more information,
Visit gtcapital.com.ph/investor-relations
or contact [email protected]
Music from Bensound.com

Notice/Disclaimer
The information in this presentation has been prepared by GT Capital Holdings, Inc. (the "Company").
By attending the meeting where this presentation is made, or by reading the presentation slides, you agree to be bound by the following limitations and represent that you are a person who is permitted under applicable law and regulation to receive
information contained in this presentation.
The information communicated in this document contains certain statements that are or may be forward looking. These statements typically contain words such as "will," "expects" and "anticipates" and words of similar import including those relating to
general business plans and strategy of the Company as well as its subsidiaries and associates. By their nature, forward looking statements involve risk and uncertainty because they relate to events and depend on circumstances that will occur in the future.
Actual results may differ materially from these forward-looking statements due to a number of factors, including future changes or developments in the Company's business, its competitive environment, its ability to implement its strategies and initiatives
and respond to technological changes and political, economic, regulatory and social conditions in the Philippines. There may be additional material risks that are currently not considered to be material or of which the Company and its advisors or
representatives are unaware. The Company assumes no responsibility to update forward-looking statements or to adapt them to future events or developments.
No representation or warranty, express or implied, is made as to the fairness, accuracy, completeness or correctness of the information or opinions contained herein. The Company does not accept any liability or responsibility for any reliance on the
information or opinions contained in this presentation for any purpose. Neither the Company nor any of the Company's advisors or representatives shall have any responsibility or liability whatsoever (for negligence or otherwise) for any loss arising from
any use of this presentation or its contents or otherwise arising in connection with this presentation. The information set out herein may be subject to updating, completion, revision, verification and amendment and such information may materially change
at any point in time. Certain market information and statistical data included herein have been obtained from sources that the Company believes to be reliable but in no way are warranted by the Company nor any of the Company's advisors or
representatives as to genuineness, accuracy or completeness.
This presentation is based on the economic, regulatory, market and other conditions as in effect on the date hereof. It should be understood that subsequent developments may affect the information contained in this presentation, which neither the
Company nor its advisors are under an obligation to update, revise or affirm.
THIS PRESENTATION AND THE INFORMATION CONTAINED HEREIN DOES NOT CONSTITUTE A PROSPECTUS, OFFERING CIRCULAR OR OFFERING MEMORANDUM OR AN OFFER, OR A SOLICITATION OF ANY OFFER, TO PURCHASE OR SELL ANY
SECURITIES, AND SHOULD NOT BE CONSIDERED AS A RECOMMENDATION THAT ANY INVESTOR SHOULD SUBSCRIBE FOR OR PURCHASE ANY SECURITIES OF THE COMPANY.
This presentation is strictly confidential to the recipient, may not be reproduced, retransmitted or further distributed to the press or any other person, may not be reproduced in any form and may not be published, in whole or in part, for any purpose.
Neither this document nor any copy of it should be distributed in any country where such distribution may lead to a breach of any law or regulatory requirement. Distribution of this document in the United States, Australia, Canada or Japan may constitute
a violation of United States, Australian, Canadian or Japanese securities law. Neither this presentation nor any of its contents may be used for any other purpose without the prior written consent of the Company.
The securities mentioned herein have not been, and will not be, registered under the U.S. Securities Act of 1933, as amended (the “Securities Act”), or under the applicable securities laws of Australia, Canada or Japan, and may not be offered or sold within
the United States unless they are registered under the Securities Act or pursuant to an exemption therefrom, or in a transaction not subject to the registration requirements of the Securities Act and, subject to certain exceptions, may not be offered or sold
within Australia, Canada or Japan or to any national, resident or citizen of Australia, Canada or Japan. No public offer of securities by the Company is being made in the United States, Australia, Canada or Japan.
TEL: +632 8836 4500
FAX: +632 8836 415943/F GT Tower International,
Ayala Ave. cor. H.V. dela Costa
St., Makati, Metro Manila,
Philippines 1227
Jose B. Crisol, Jr.
“Joey”
Senior Vice President and Head,
Investor Relations, Strategic
Planning, and Corporate
David Louis B. de Jesus, Investor Relations and Corp. Comm. [email protected]
Bruce Ricardo O. Lopez, Investor Relations and Strategic Planning [email protected]
Joaquin Juan Paolo V. Mabanta, Investor Relations [email protected]
2

Table of Contents
3
GT Capital Corporate Profile 5
History of Strategic Partnerships 6
Strategic Direction 9
GT Capital Component Companies 11
Current Corporate/Ownership Structure 12
Our Macroeconomic View 13
Group Consolidated Financial Highlights 16
Net Income Contribution 18
Metropolitan Bank and Trust Company (MBT) 19
Toyota Motor Philippines Corp. (TMP) 28
Federal Land, Inc. (Federal Land) 46
Cavite 702 Hectares Share Redemption and Financial Highlights 51
Map of Lancaster New City (LNC) & MPIC Projects 53
AXA Philippines (AXA) 57
Metro Pacific Investments Corp. (MPIC) 59
Covid-Related Assistance and Programs by Metrobank Foundation (MBFI) 61
Key Messages 65

• We trace our history to Metropolitan Bank
and Trust Company (Metrobank), founded by
Dr. George S.K. Ty in 1963
• Universal banking days: Key non-banking
businesses of the Ty family were initially folded
into Metrobank
• Basel III regulations: GT Capital was formed to
assume Metrobank’s non-banking businesses
and to function as the Ty family’s official
holding company.
4
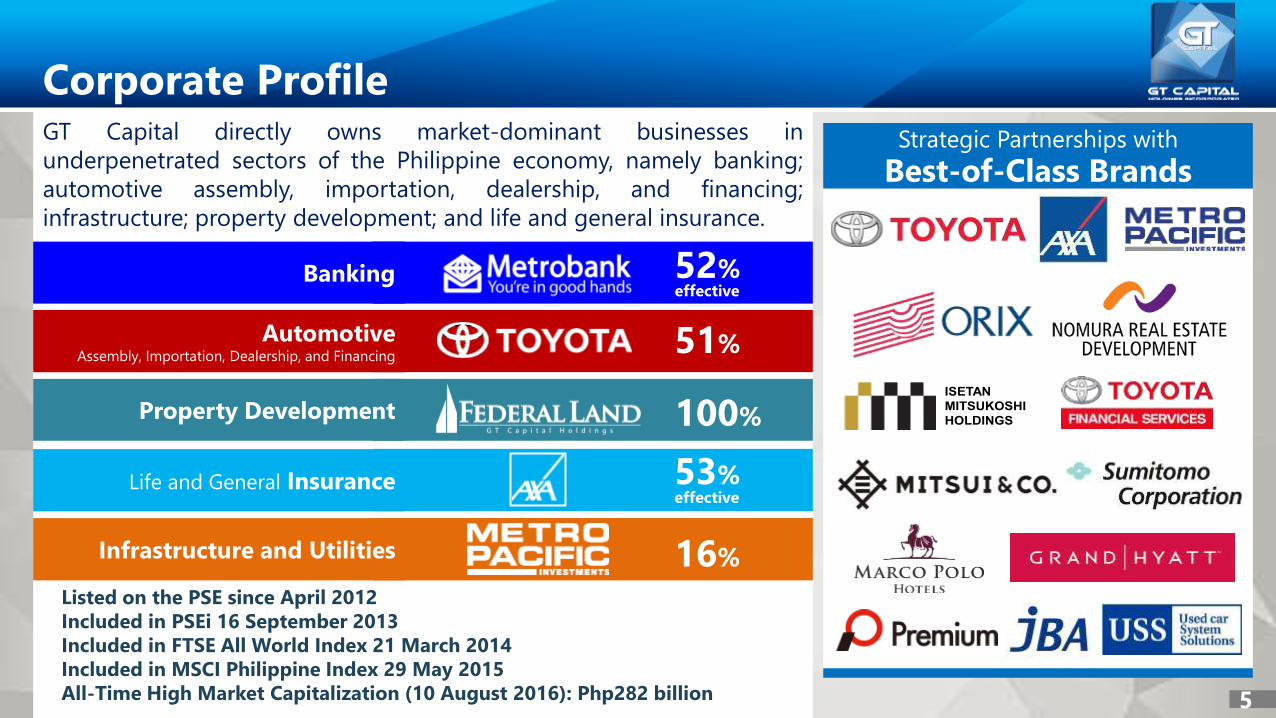
GT Capital directly owns market-dominant businesses in
underpenetrated sectors of the Philippine economy, namely banking;
automotive assembly, importation, dealership, and financing;
infrastructure; property development; and life and general insurance.
Listed on the PSE since April 2012
Included in PSEi 16 September 2013
Included in FTSE All World Index 21 March 2014
Included in MSCI Philippine Index 29 May 2015
All-Time High Market Capitalization (10 August 2016): Php282 billion
Corporate Profile
Strategic Partnerships with
Best-of-Class Brands
5
52%
51%
100%
53%
16%
effective
effective
Property Development
Banking
Infrastructure and Utilities
Life and General Insurance
AutomotiveAssembly, Importation, Dealership, and Financing

Trusted by partners from Japan and around the world
19
88
19
99
20
03
20
09
20
14
19
96
20
02
20
06
20
11
20
15
20
17
20
02
Toyota Motor Philippines
is established with
Toyota Motor Corp and
Mitsui & Co. as partners
Toyota Manila
Bay Corp is
established with
Mitsui & Co.
Ltd as partner
AXA Philippines, a joint
venture with AXA S.A. of
France, assumes the
Group’s life insurance
business
Toyota Financial
Services (TFS)
Philippines, a JV with TFS
of Nagoya, becomes the
Group’s official lease-to-
own auto financing arm
ANZ Bank partners with
Metrobank to form
Metrobank Card, the
country’s number one
credit card company
Marco Polo Hotels
partners with the Group
for the Marco Polo
Hotel in Cebu. Later,
the two join forces to
build Marco Polo
Residences
Sumitomo
Corporation and
PSBank venture into
motorcycle financing
ORIX Corporation
partners with Federal
Land to create
Federal Land-Orix
Corp., the developer
of the Grand Midori
ORIX Corporation and
Federal Land enter into
a venture to build the
Grand Hyatt Manila
and Metrobank
Center in Bonifacio
GT Capital acquires affordable
property developer Pro-Friends
Isetan Mitsukoshi Holdings
and NOMURA Real Estate
partner with Federal Land for
Sunshine Fort at Grand Central
Park, Bonifacio
President
CORAZON C.
AQUINO
1986-1992
President
FIDEL V.
RAMOS
1992-1998
President
JOSEPH E.
ESTRADA
1998-2001
President GLORIA
MACAPAGAL-
ARROYO
2001-2010
President
BENIGNO C.
AQUINO III
2010-2016
President
RODRIGO R.
DUTERTE
2016-present
20
16
-7.3%
3.4%4.3%
6.8% 6.2%
3.0%
-0.6%0.3%
2.1%
4.4% 4.7%5.8% 5.2%
-0.6%
3.1%4.4%
2.9% 3.6%5.0%
6.7%
4.8% 5.2%6.6%
4.2%
1.1%
7.6%
3.7%
6.7% 7.1%6.1% 6.1%
6.9%
GDP Growth, in
percent
Toyota Motor Philippines
achieves its first #1 ranking in
overall sales under current JV
1989
Toyota achieves 1,000,000
vehicles sold in the
Philippines
2015
Metrobank is hailed as the
country’s Strongest Bank by the
Asian Banker
2013 2015 2016
Dr. George Ty is
awarded MAP
Management
Man of the Year
2006
Metrobank
achieves Php1
trillion asset
base
2017
Toyota Motor Philippines
garners the first of its 18
consecutive Triple Crown
2002
GDP Growth,
in percent
20
19
GT Capital acquires
stake in
infrastructure
conglomerate
Metro Pacific
Investments
Corporation
Used Car System
Solutions (USS)
subsidiary JBA enters
into joint venture with
GT Capital and
Mitsui & Co. Ltd.
to establish
JBA Philippines
Global Business Power
is established. Later,
ORIX Corporation,
Formosa, and Meralco
become JV partners
20
20
Premium Group of
Japan enters into
joint venture with
GT Capital and
Mitsui & Co. Ltd.
to establish
Premium Warranty
Philippines
2018 2019
Metrobank is
hailed as the
country’s Best
Managed Bank
by the Asian
Banker
Toyota Corolla
Sapporo enters
into joint
venture with
GTCAD to
acquire Toyota
Sta. Rosa

Strong Group-wide Footprint
Figures as of Latest 17-A, 17-Q, and IR Presentation Disclosures
₱2.3 TnTrillion
total resources
4.0 Mnindividual
depositors
10,000institutional and SME
clients
960branches
nationwide
52remittance
centers
20,000employees Group-
wide
over
60,000vehicles built annually at the
TMP eco-zone
1.8 MnToyota units sold in PH
from 1987-2020
71dealerships
nationwide
3,695regular
employees
80%Pay via
financing
full-time
employeeshectares of
prime land bank
48years of
experience
11,000registered
homeowners
28ongoing
projects
90%Pay via loan
financing
495110
27,000Group-wide
employees
750kdaily vehicle entries on
toll roads
1.4 Mnpatient visits to MPI
hospitals
16 MnCustomers group-wide
407 MnCubic Meters Billed
790institutions
insured
40standalone
branches
7,000exclusive
agents
2,430full-time
employees
1.3Mindividual client
accounts
1.4 Mnlives insured
(incl. group life)
₱123BnBillion
AUM
7

8
Strong Group-wide Footprint
Figures as of Latest 17-A, 17-Q, and IR Presentation Disclosures
1,071Branches
nationwide
23.2Millioncustomers
10,000active
salespersons
68Provinces
Present in
Across an broad
spectrum of clients
Institutional
High net worth
Upper middle-income
Small and medium enterprises
Middle-income and emerging affluent
Affordable segment
Overseas Filipino Workers
BPO employees and others
33,610group-wide
employees including contractual
& agency
14global strategic
partners
approx

9
New Sectors
Cross-selling
within the GT
Capital Group
Exploring
underpenetrated
sectors with new
strategic partners
Extending the value
chain of existing
businesses
Expansion in
Existing Sectors
Strategic Direction
Synergy
• Toyota unit sales through
MBT/PSBank auto loans/TFS
lease-to-own package
• Federal Land home mortgages
by MBT/PSBank
• AXA bancassurance through
MBT/PSBank branch network
• Motor vehicle insurance
• Cross-selling of GT Capital
products into MPIC
subsidiaries
• New strategic
partners
• Infrastructure (MPIC)
• Medical diagnostics
• Retail (e.g. Isetan
Mitsukoshi/Nomura
Real Estate)
• TMP/MBT expansion in Next Wave Cities
• Entry into used car market through JBA
Philippines
• Wider property sector product offerings
• Master-planned communities
• Retail spaces
• BPO/Commercial space

Moving Forward Towards Recovery
Figures as of Latest 17-A, 17-Q, and IR Presentation Disclosures
Strong Fundamentals Financial Discipline
Where are we today?How are we protecting
our financial health?
Pivot Toward Recovery
How are we moving
toward the future?
• Conso cash and near-cash
Php23.6 B
• Conso unutilized short-term bank
lines Php91.3 B
• Conso unutilized long-term bank
lines from major banks Php19.0 B
• Deferred non-essential capex
• Deferred FLI project launches
• Cost control through lower
operating expenses (e.g. Admin,
Sales and Marketing)
GT Capital
•Strong liquidity
•Low Gearing
•Unutilized credit lines
•Conservative CAPEX
budget
Toyota
•Resilient network;
ability for strong restart
•Provincial inquiries
73% of total
•Sustained leading
market share of 39%
•Ability to launch
despite lockdown
Metro Pacific
• Volume recovery to
near pre-Covid levels
Metrobank
•PPOP +61%
•Anticipatory provisions
•Cost-to-income at 45%
•CASA growth +20%
•CAR at 20%
Federal Land
•Robust unbooked
reservation sales
•Recovering POC
•Healthy bookable
revenue pipeline
AXA Philippines
•Net income +29%
•Established digital
platform
•Higher sales of P&H,
Single Premium 10
Metrobank
•22% of clients are now
enrolled in Metrobank’s
e-channels
•79% of total transactions
are now done via e-
channels
•1.2 Million app
downloads on Google
Play and App Store
Federal Land
•Online audience
engagement and sales
conversion
•Online investor events
•360O Virtual Tour
•13,436 project inquiries
from digital channels
Toyota•Shift from a car selling
company to an all-
around mobility provider
•Launch of virtual
showroom
•Launch of MyToyota.PH
•Virtual launches of the
Vios and Wigo
•On-Demand Shuttle
Booking app
•Kinto One Leasing
program
AXA Philippines• Online selling via AXA
Virtual Selling Assist
(AVA) process
• Launch and continuing
development of Emma
app (chatbot &
teleconsultation)

11Figures as of Latest 17-A, 17-Q, and IR Presentation Disclosures
GT Capital Component Companies
Strongest Bank in the Philippines for 2011, 2013,
2015, and 2016 according to The Asian Banker
Best Managed Bank in the Philippines for 2018,
2019 according to The Asian Banker
Second largest Philippine bank by assets as of
end-2019
1
1
2
❖ Over 45 years of experience in vertical, residential
property development
❖ Track record of landmark developments in Metro
Manila
❖ Over 100 hectares of land bank in prime locations
Most dominant automotive company in the
Philippines, maintaining 35% to 40% market share from
2015-2019
1
Highest passenger car, commercial vehicle, and
overall sales annually since 20021
Triple Crown winner for 18 consecutive years 2002 –
20191
❖ Combined penetration rate of 11% among Toyota
dealers as of 1H 2020
❖ Network of 5 dealer outlets
❖ Strategic partnership with Mitsui & Co. of Japan, a
leading global conglomerate
One of the country’s largest life insurance companies in
terms of gross premiums as of end-2019
Pioneer in bancassurance
Second largest non-life insurer in terms of net
premiums written as of end-2018
❖ Strong bancassurance synergies with Metrobank and
PSBank
★
1
2
Market leader in auto financing for Toyota vehicles; Market
penetration rate of 40% as of June 20201
❖ Nearly two decades-long track record in auto lease financing
❖ Strategic partnership with Toyota Financial Services of Japan
❖ Joint venture with Japan Bike Auction Co., Ltd., a subsidiary of
USS Co., Ltd.
❖ Market leader in Indonesia car and motorcycle auction market
❖ Market leader in Japan motorcycle auction market;
25% market share as of December 2018
❖ Owns MERALCO, the Philippines’ largest power distribution
company1
❖ Owns GLOBAL BUSINESS POWER, one of Visayas’ largest power
generation companies1
❖ Owns MAYNILAD WATER, Metro Manila’s widest water distribution
network1
❖ Owns METRO PACIFIC TOLLWAYS, which manages the Philippines’
widest toll road network1
❖ Joint venture with Sumitomo Corporation, one of
Japan’s largest conglomerates
❖ Nationwide footprint in over 320 motorcycle
dealerships
❖ A leading institution in financing Japanese
motorcycle brands
1
1
TOYOTA MANILA
BAY GROUP
1

Current Corporate Ownership Structure
Public FloatGrand Titan55.93% 44.07%
Banking Automotive Property Development Insurance Infrastructure and Utilities
➔51%
40%5
➔58.1% 4
100%
20%7
100% 15.63%
15% owned by Ty family-related
entities
99.2%
82.7%
28%
1 Free float (49%), Ty family - related entities (24%);
Acquired 9.6% of Metrobank shares in April 20172 AXA SA (45%), FMIC (28%), Others (2%)3 In April of 2016, AXA Philippines completed its acquisition of 100% of Charter Ping An Insurance Corporation from GT
Capital.4 Acquired 40.7% in December 2013 from Ty family - related entities; acquired remaining 19.3% in March 2014 from
FMIC. On 7 March 2016, Toyota Manila Bay Corp. and Toyota Cubao, Inc. merged, with Toyota Manila Bay Corp. (TMBC)
as the surviving entity.5 Acquired 40% on August 2014 from Metrobank and PSBank6Acquired 11.43% of MPIC primary common shares and 4.13% of secondary common shares from Metro Pacific Holdings,
Inc.7On August 8, 2017, GT Capital (20%) acquired Sumisho Motor Finance Corporation (50%) from Philippine Savings Bank
(PSBank) (30%).8In April 2017, GT Capital increased its stake in Metrobank to 36.09%. GTCAP further added to its stake in Metrobank as a
result of the Bank’s 2018 stock rights offering.
26.47%1➔ 37.15%8
40.7% ➔ 60.0%
21.0%
➔ 36.0%
50% → 30%8
25.3%2,3
11

Our Macroeconomic View
13
2Q 2020 GDP change (versus 2Q 2019, in %) ASEAN-5, US, China, Taiwan
-41.2-32.9
-17.1 -16.5-12*
-5.3 -0.7
+0.4 +3.2
Singapore US Malaysia Philippines Thailand Indonesia Taiwan Vietnam China
Source: Government statistics from each country; *Estimate from Kasikornbank
2020 Philippine GDP Growth Forecasts (in %)
6.3 6.1
3.0 2.0 1.0 0.6
-0.2 -0.2-4.0
0.6
-3.8-1.9
-4.5-9.0
Feb Feb Mar Apr Apr Apr May May Jun Jun Jun Jun Jul Aug
IMF
Moody’s
World Bank
ADB
FitchShift to ECQ Shift to
MECQ
2Q GDP
results
release
Global
• Expectedly, economies around the
world have suffered from the COVID-
19 pandemic
• Governments have responded by
reducing interest rates and providing
stimulus packages
Philippines
• First recession since 1991
• FY2020 GDP forecasts revised
downwards as the crisis unfolds
• Consumption Spending down -15.5%
in 2Q2020
• Unemployment rate reached 17.7%,
15-year high
• Uncertainty remains due to COVID-19

Our Macroeconomic View
14
Philippine Annual GDP Growth Trend (in %)
Philippine GDP (in USD Billions)
-0.6
-16.5Source: World Bank, Philippine Statistics Authority
83 98130
208
361
1980 1982 1984 1986 1988 1990 1992 1994 1996 1998 2000 2002 2004 2006 2008 2010 2012 2014 2016 2018
2019:
Philippines
• Annual GDP growth averaged 6.4%
from 2010 until 2019, among the
highest in ASEAN
• GDP declined -16.5% in 2Q2020 due
to the lockdown restrictions brought
about by this unprecedented crisis
• Unprecedented crisis; GDP growth at
lowest point since the 1983 debt
moratorium crisis (-7.3%)
Source: World Bank
COVIDGlobal Financial CrisisAsian Financial Crisis
1980: 1990:2000:
2010:
1991:
(last recession)
2Q2020:
1983-84:
-7.3Debt
moratorium
1998: -0.6
Our Macroeconomic View
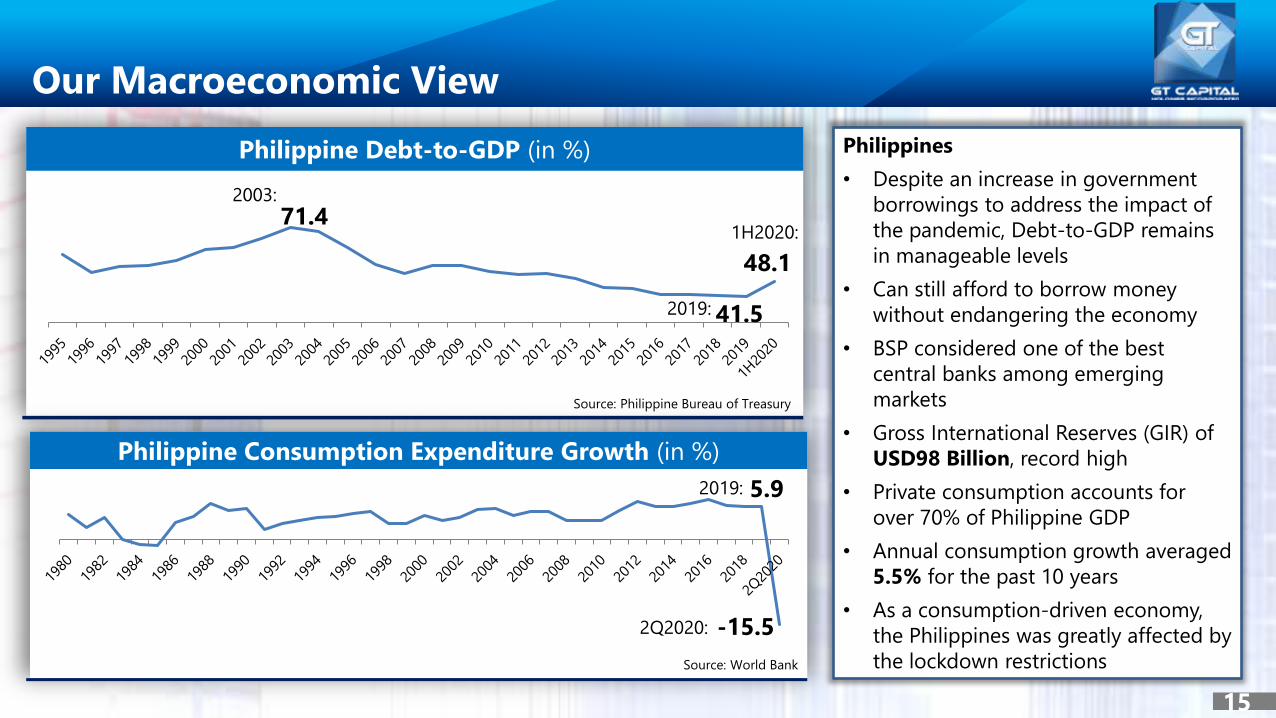
15
Philippine Debt-to-GDP (in %)
Philippine Consumption Expenditure Growth (in %)
Source: Philippine Bureau of Treasury
Philippines
• Despite an increase in government
borrowings to address the impact of
the pandemic, Debt-to-GDP remains
in manageable levels
• Can still afford to borrow money
without endangering the economy
• BSP considered one of the best
central banks among emerging
markets
• Gross International Reserves (GIR) of
USD98 Billion, record high
• Private consumption accounts for
over 70% of Philippine GDP
• Annual consumption growth averaged
5.5% for the past 10 years
• As a consumption-driven economy,
the Philippines was greatly affected by
the lockdown restrictionsSource: World Bank
71.4
41.5
48.1
1H2020:
2003:
2019:
5.9
-15.52Q2020:
2019:

GT Capital Group First Half 2020 Financial Highlights
16
-77%
Net Income
Php1.0 Bn -58%
Net Income
Php171 Mn +29%
Net Income
Php1.6 Bn -38%
Core Net Income
Php5.3 Bn
-62%
Consolidated Net Income
Php2.74 BnPhp7.2 billion 1H 2019
-30%
Net Income
Php9.1 BnPhp13.0 Bn 1H 2019 Php4.3 Bn 1H 2019 Php404 Mn 1H 2019
-55%
Core Net Income
Php3.17 BnPhp7.1 billion 1H 2019
Php1.2 Bn 1H 2019 Php8.7 Bn 1H 2019
● July volumes nearing
pre-Covid levels
● GT Capital’s share in
NI -38% to Php0.8B
due to volume declines
in Power, Water,
Tollways, and Light Rail
● Single Premium-Unit
Linked +48%
● Protection & Health
now 25% of total
revenue, 28% of APE
● +179% Net income
Php309 Mn from GI
● Effective virtual selling
under lockdown
● Reservation sales
+3% to Php9.1B
● Lower booked sales
due to POC stoppage
● Healthy pipeline of
bookable revenue
● -52% decline in
retail sales volume
● Provincial sales
stronger than NCR
● Dealership and
assembly plant
shutdown
● Continued
workforce support
● Very strong PPOP
Php36.1B +61%
● No visibility on NPL
● No specific provisions
● Anticipatory Provisions
up 5x to Php22.8 Bn to
protect loan portfolio
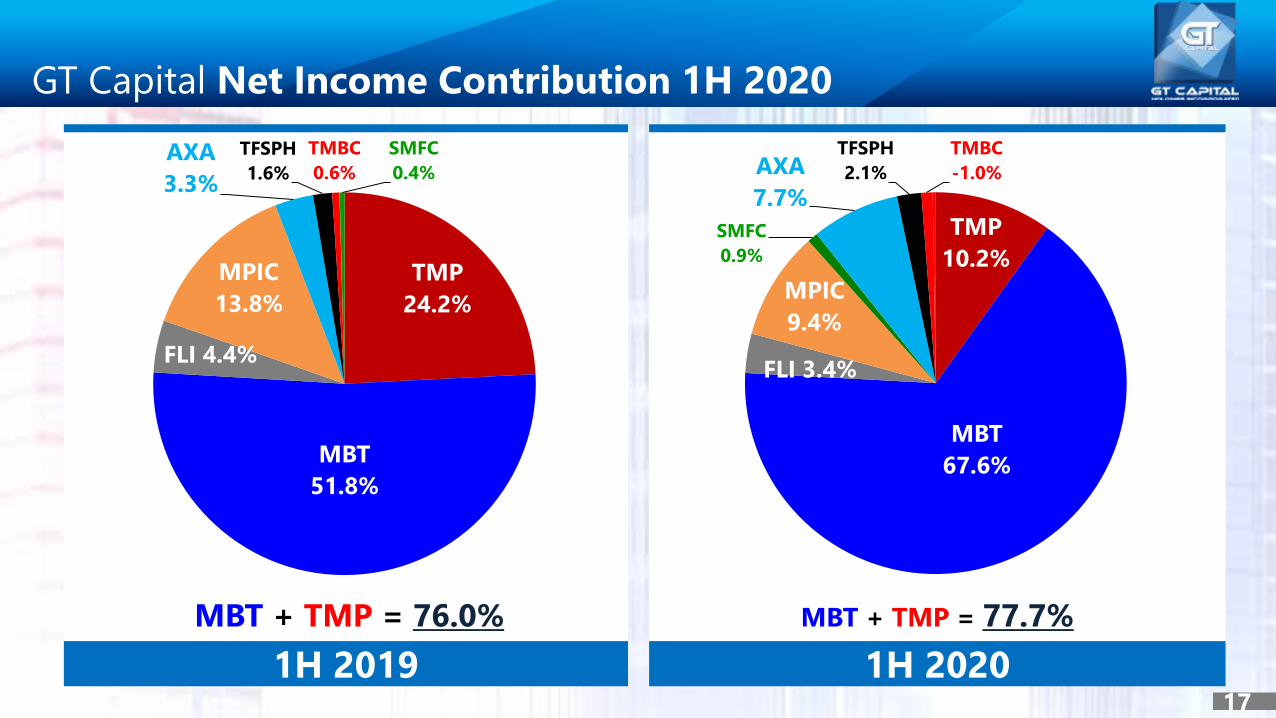
GT Capital Net Income Contribution 1H 2020
17
1H 2019 1H 2020
MBT + TMP = 76.0% MBT + TMP = 77.7%
TMP
24.2%
MBT
51.8%
FLI 4.4%
MPIC
13.8%
AXA
3.3%
TFSPH
1.6%
TMBC
0.6%
SMFC
0.4%
TMP
10.2%
MBT
67.6%
FLI 3.4%
MPIC
9.4%
SMFC
0.9%
AXA
7.7%
TFSPH
2.1%
TMBC
-1.0%

GT Capital Net Income Contribution by Sector
18
1H 2019 1H 2020
Automotive
26.8%
Banking
51.8%
Property
4.4%
Infrastructure
13.8%
Insurance
3.2%
Automotive
11.9%
Banking
67.6%
Property
3.4%
Infrastructure
9.4%
Insurance
7.7%

Rising Together
to New Heights
Partners for
Good
Banking

20
Loose Monetary and Quantitative Easing
3.50%
4.00% 4.00%
4.50%
3.00%
4.75%
4.00%
2.25%
2013 2014 2015 2016 2017 2018 2019 5M20
RRR cuts to support liquidity Deep policy rate cuts to record-low level
Supported by low inflation BSP measures to keep liquidity
2.60%
3.60%
0.70%
1.30%
2.90%
5.20%
2.50%
2.50%
2013 2014 2015 2016 2017 2018 2019 7M20
18%
20% 20% 20% 20%
18%
14%
12%
2013 2014 2015 2016 2017 2018 2019 5M20
• BSP now into QE with Php300-Billion to buy
government securities
• MSME loans can be counted against
Reserve Requirements
*
*Average inflation from January to July. Inflation for the month of June was 2.7%YoY.

21
Banking Industry
Loan Growth vs. GDP Growth Deposit Growth vs. M3 Growth
• Loan growth had a strong start this year
• May be tempered by economic uncertainty
• Deposit and M3 growth sustained in early months
• Can slow down depending on market liquidity
34%
12%
8%
14%12%
9% 9%
14%
32%
11%9%
13% 12%10%
11%
15%
0%
5%
10%
15%
20%
25%
30%
35%
0%
5%
10%
15%
20%
25%
30%
35%
40%
2013 2014 2015 2016 2017 2018 2019 1H20
GD
P G
row
th (
In %
)
Lo
an
Gro
wth
(In
%)
Deposit Growth M3 Growth
16%
20%
14%
17%
19%
16%
11%
9.6%
7.1% 6.1% 6.1% 6.9% 6.7% 6.2% 5.9%
-16.5%
-22.0%
-17.0%
-12.0%
-7.0%
-2.0%
3.0%
8.0%
8%
10%
12%
14%
16%
18%
20%
22%
2013 2014 2015 2016 2017 2018 2019 1H20
GD
P G
row
th (
In %
)
Lo
an
Gro
wth
(In
%)
Loan Growth GDP Growth *
/5M20
*As of 5M 2020
*

22
PH Big Three Banks Adequately CapitalizedThe country’s largest banks have substantial capitalization above the minimum set by BSP
14.3% 14.7%
12.2%
10.0%
13.0%
8.3%
MBT BPI BDO
CAR Tier 1
20.0%
16.5%
13.8%
18.7%
15.6%
12.7%
MBT BPI BDO
CAR CET1
Min. CET1
10.5%Min. CAR
10.0%Min. Tier 1
6.0%
Min. CAR
10.0%
December 31, 2009 June 30, 2020

23
Peer Banks Highlights 1H 2020
NPL Ratio (%)
NPL Coverage (%)
Source: 17-C Report and Investor Presentations of Banks as of 30 June 2020
1.95%1.83% 1.56%
BDO BPI MBT
188%141% 139%
MBT BPI BDO
+101bps
+43bps +2.2bps
Pre-Provision Operating Profit (Php Billion)
Net Interest Margin – NIMs (%)
4.36% 4.24%3.55%
BDO MBT BPI
+41bps+37bps+18bps
36.1 35.5 28.5
MBT BDO BPI
+10.1%+31.8%
+60.7%

Customer Touchpoints
Clients enrolled in e-channels (as of Q2 2020)
% E-Channels to Total Financial Transactions
79%
21%
69%
31% Q2
2020Q2
2019
22%Enrolled
4,000,000 approx. client base
+176%mobile app downloads
Q2 2019 vs Q2 2020
24
Waived fees for
money transfers via
the Metrobank
Mobile App is
extended until
December 31, 2020
InstapaySend money to another
bank, lower than Php50,000
PESONetSend money to another
bank, above Php50,000

25
Loan PortfolioContraction in loan portfolio reflective of slowdown across industries
Net Loans (Php Bn) Gross Loan Breakdown By Segment
FY 2019 Loan Portfolio by Industry Consumer Loan Portfolio Breakdown
1,398 1,333
1H 2019 1H 2020
-5%
76% 75%
24% 25%
1H 2019 1H 2020
Commercial Consumer
41%
27%
32%
Credit Cards
HomeAuto
Flat
+19%
-6%
-4%
+2%
14%
13%
12%
9%9%
6%
6%
18%
Trade
Real Estate
Manufacturing
Households' own use
Financial
Transport and Storage
Utilities
OthersBased on BSP Reporting

26
Asset QualityMetrobank proactively beefed up provisions even as NPL formation remained benign
NPLs amount (Php Bn) NPL Ratio better than industry
Provision and Credit Cost NPL Cover
1 2
3
21.0 19.3 21.1
1H 2019 FY 2019 1H 2020
4.610.1
22.8
1H 2019 FY 2019 1H 2020
66 68
342
87% 103%
188%
1H 2019 FY 2019 1H 2020
1.50% 1.30%1.56%1.60% 1.60%
2.09%
1H 2019 FY 2019 1H 2020
MBT UKB
Provisions for Credit (Php Bn)
Est. Credit Cost (bps)
+1% YoY
(May 2020)
(1 ) Non-Performing Loans; (2) Excludes interbank; (3) Estimated credit cost = Annualized Provisions for Credit / Loans & Receivables, net

27
Branches, Deposits, OPEX, and Efficiency Ratios
• Slow down on opening of physical branches
953957 957
960
2017 2018 2019 1H 2020
Consolidated Branches
56% 55% 45%
1H 2019 FY 2019 1H 2020
Cost-Income Ratio
CASA Deposits per Branch (Php Bn)
1.0 1.1 1.2
1H 2019 FY 2019 1H 2020
• Deposits increased as customers prefer to stay liquid
• Revenue growth has consistently outpaced cost growth,
leading to improved cost-income ratio
Operating Income growth consistently higher than OPEX
11% 11%17% 15% 13%
31%
10%7% 9% 8% 8% 7%
Q1 2019 1H 2019 9M 2019 FY 2019 Q1 2020 1H 2020
Operating Income Operating Expense

Partners for
Good
Automotive

Motorization amid low motor vehicle penetration
29
Motor vehicle penetration per 1000
individuals versus GDP per capitaVehicles per 1,000 individuals, 2019
Motor vehicle penetration in ASEAN
Source: Organisation Internationale des Constructeurs d’Automobiles
(OICA)/International Organization of Motor Vehicle Manufacturers
Vehicles
per 1000
individuals
1,232
452
251165
96 4526

30
Virtual
Showroom
MyToyota.PH
KINTO ONE Leasing
Connected Auto Loan
Fleet Management
Logistics
On-Demand Shuttle
Booking App
Balloon
Payment Plus
Cargo
Digital Transformation Mobility Initiatives
1.123 MnViews
Virtual Model
Launches1.219 Mn
Views

31
Toyota Recent Developments
1Q 2020: 36% 2Q 2020: 46%Market
Share
3M 2020: -23%YoY%YoY 6M 2020: -51%YoY
TMP Monthly Retail Vehicle Sales Monthly Inquiries
Reservations (Daily Average Per Week)
28
550
May 2-9May 11-16May 18-23May 26-30June 1-6June 8-13Jun 15-20Jun 22-27Jun 29-30July 1-4July 6-11July 13-18July 20-25July 27-31May June July
44%
56%
79%
21%
84%
16%
%New
%Pent-up
13,64014,390
15,662
May June July
%Walk-in
%Online
18%
65%
39%
36%
38%
37% *Others:
Phone,
Referral,
Field Sales
Monthly Inquiries (NCR and Outside NCR)
• Customer engagement continued during ECQ through digital channels
• Lack of public transportation created pent up demand for Vios and Wigo
30% 32% 31% 27%
70%100%
68% 69% 73%
Mar Apr May Jun Jul
NCR Outside-NCR
9M: -45%
9M: 39%
8,89012,283
4,52336 2,431
7,485 8,838 8,04410,657
Jan Feb Mar Apr May Jun Jul Aug Sep
Units %MoM
-44%6653%
38%208%
-63%-99%
18% -9%-44% 18% -9%32%
3Q: 40%

32
Retail auto unit sales volume
In Units
TMP 2020 Monthly Retail Vehicle Sales
• Lack of access to public transportation created pent up
demand for the Vios and Wigo
• Month-on-month (MoM) momentum after easing
quarantine restrictions
• New reservations (e.g. orders booked after ECQ): 40% in
May, 80% in June
• Digital infrastructure enhanced during middle of lockdown
to enable supply of services to customers
• % of Digital sales: 70% of units in May, 61% in June
As of September 2020 YTD
8,890 12,283
4,523
36 2,431
7,485 8,833 8,044 10,657
+38%
+6653%+208% +18% +32%
Jan Feb Mar Apr May Jun Jul Aug Sept
297,263
161,212114,117
63,182
9M 2019 9M 2020
Industry Toyota -
Source: Company data, CAMPI, AVID, TMP
• Taal Volcano
eruption
• Restoration of
supply
• Opening of
CALABARZON
dealers
• ECQ (NCR
dealers
closed
March 17)
• All dealers
closed
nationwide
• 20 dealers
open May 1
• 66 open May
20
• All 71 dealers
open June 1
• Cebu ECQ June
16-July 15
• All 71 dealers
open
• Launch of all-
new Wigo
and Vios
• Metro Manila
under MECQ:
All 71 dealers
open but
lower foot
traffic
• All 71 dealers
open
• Launch of all-
new Hilux

STRICTLY CONFIDENTIAL
Automotive Sector Updates
33
Overall Market Share 9M 2020
39%
17%
10%8% 7% 6% 5% 5%
3%1% 0.6% 0.2% 0.2%
MITSUBISHI NISSAN HYUNDAI SUZUKI FORD HONDA ISUZU OTHERS KIA MAZDA SUBARU GM
24,243Unit difference
Source: Company data, CAMPI, AVID
1Q 2020: 36% 2Q 2020: 46%
No.1Passenger Car Sales
No.1CommercialVehicle Sales
No.1OverallSales
3Q 2020: 40%

STRICTLY CONFIDENTIAL
34
Auto Industry Market Share 9M 2020
48%
13%12% 12%
8%
3% 2% 1.3% 0.8% 0.3% 0.1% 0.1%
35%
18%
12%
8%6% 6% 5%
4%3%
0.6%0.5%0.3%0.2% 0.2%
Passenger Car Commercial Vehicle
Source: Company data, CAMPI, AVID
30.5% of market
37.1% of Toyota
Automotive Sector Updates
69.5% of market
62.9% of Toyota

STRICTLY CONFIDENTIALComprehensive Auto Resurgence Strategy (CARS)Implementing Rules and Regulations – 23 December 2015
Incentives, Rationale and Regulations • Manufacturing of model, body shell,
large plastic assemblies, common parts,
OEM parts, and shared testing facility
are covered
• Php9.0 billion maximum incentive in
the form of tax certificates
• Incentive per unit of 8% of price
per unit or Php45,000 per unit
• 40% given for tooling, equipment
and training costs for the initial
start-up operation (Fixed
Investment Support)
• 60% given for volume-based
incentive (Production Volume
Incentive)
• Only entirely new models or full model
change (FMC) units can qualify
• Minimum production volume of 200,000
units over six years (33,333 units per
year or 2,750 units per month) 35
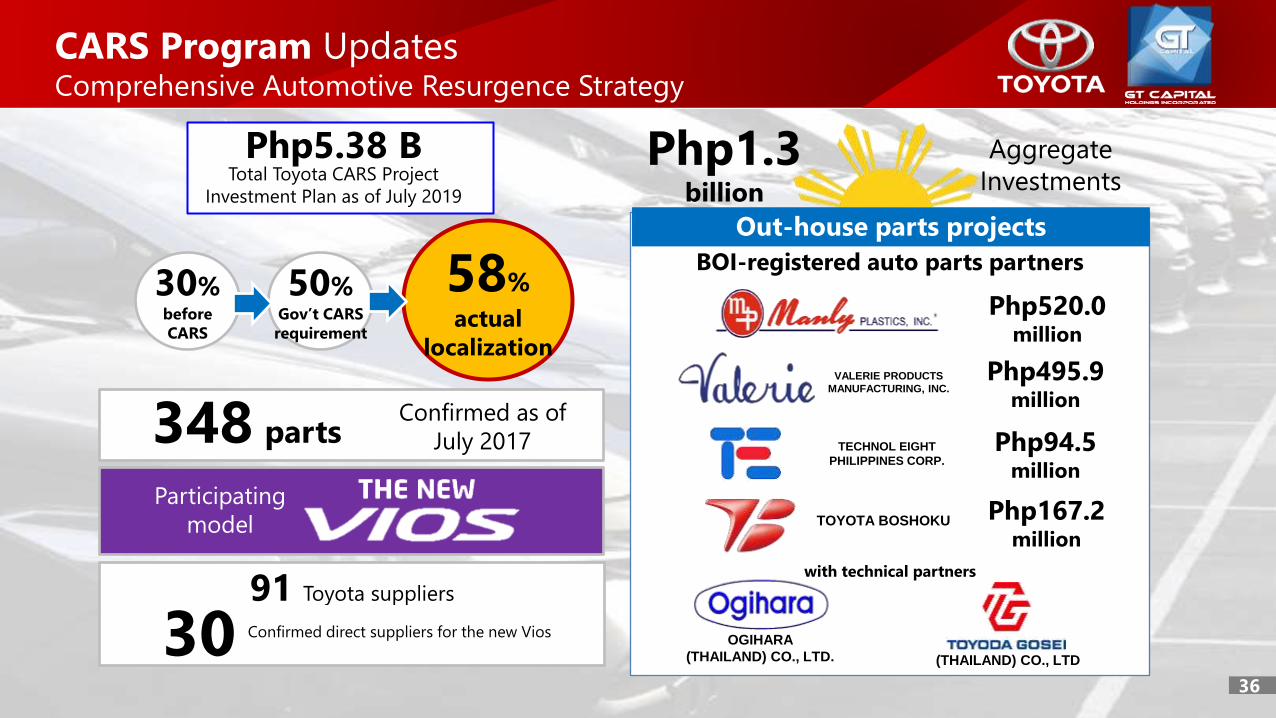
CARS Program UpdatesComprehensive Automotive Resurgence Strategy
Total Toyota CARS Project
Investment Plan as of July 2019
Php5.38 B
Participating
model
Confirmed as of
July 2017348 parts
30 Confirmed direct suppliers for the new Vios
91 Toyota suppliers
36
Php1.3 billion
Aggregate
Investments
Out-house parts projects
BOI-registered auto parts partners
Php495.9million
Php520.0million
Php167.2million
VALERIE PRODUCTS
MANUFACTURING, INC.
Php94.5million
TECHNOL EIGHT
PHILIPPINES CORP.
TOYOTA BOSHOKU
OGIHARA
(THAILAND) CO., LTD.
with technical partners
58%
actual
localization
30%before
CARS
50%Gov’t CARS
requirement
(THAILAND) CO., LTD

CARS Unit Sales ProgressUnits sold of Toyota Vios since launch of CARS Program model
launched in July 2018 to date (cumulative)
Introduction
of FMC Vios
July 2018
222
Sept 2018
3,503
Dec 2018
11,336March 2019
18,423
June 2019
26,933June 2020
57,170
Aug 2018
1,658
Dec 2019
44,500
Sept 2020
64,344

15 June;
1.1 Mn Views
Php568,000 – Php700,00025 July; 1.2 Mn Views
Php671,000 – 1,071,000
2020 Virtual Model Launches on
Facebook, Youtube, and the TMP Website
Php1,285,000 - 1,650,000
20 August; 1.1 Mn Views
Php936,000 (Cargo) - 1,830,000 (Conquest)12 Sept; 1.0 Mn Views
Php1,633,000 – 2,414,00017 Oct; 750,000 Views

Dealership UpdateTarget by end of year 2014 2015 2016 2017 2018 2019-20
Number of Dealers 45 49 52 61 69 71LUZON
28
METRO
MANILA
19
VISAYAS
14
MINDANAO
10
39
Location
Open as of May 1 (GCQ)
Open as of June 1
Luzon Visayas Mindanao
7 7 6
NCR
0
Open as of May 20 (MECQ) 28 10 1018
Total
28 14 1019 71
100%
20
66
Measures in accordance with DOH & WHO:
• Temperature check of customers and employees
• Regular disinfection of facility and vehicles
• Changed showroom and service reception to ensure social distancing
• Control number of persons inside facility
• Customers encouraged to set appointments
Restarting full operationsafter ECQ

Price Comparable by Categoryin Million Philippine Peso (PHP)
40
In Million PHP Toyota Hyundai Honda Mitsubishi
Model Camry Accord
Price 1.841 2.042 2.288
Model Corolla Altis Elantra Civic
Price 0.999 1.595 0.970 1.065 1.115 1.608
Model Vios Accent (Sedan) City Mirage G4
Price 0.671 1.071 0.790 1.038 0.820 1.068 0.735 0.869
Model Innova
Price 1.036 1.694
Model Fortuner Santa Fe CR-V Montero Sport
Price 1.633 2.414 2.158 - 2.538 1.668 2.138 1.565 2.450
Model Hiace Starex
Price 1.101 2.998 1.248 2.938
Model Wigo Brio (Hatch) Mirage (Hatch)
Price 0.568 0.700 0.598 0.735 0.699 0.760
Model Rush Kona BR-V Xpander
Price 0.968 1.100 1.188 1.035 1.155 1.008 1.255
Source: Company websites; Retail prices as of 17 October 2020

41Source: Company websites; Retail prices as of 17 October 2020
Converted prices based on average Peso-Dollar rate of Php50/USD1
Price Comparable by Category
in United States Dollars (USD)
Toyota Hyundai Honda Mitsubishi
Model Camry AccordPrice 36,470 40,452 45,325 Model Corolla Altis Elantra Civic Price 19,790 31,597 19,216 21,097 22,088 31,854Model Vios Accent (Sedan) City Mirage G4Price 13,290 21,216 15,650 20,563 16,244 21,157 14,560 17,215 Model InnovaPrice 20,520 33,558Model Fortuner Santa Fe CR-V Montero SportPrice 32,660 48,280 42,750 50,277 33,043 42,353 31,002 48,534 Model Hiace StarexPrice 21,810 59,390 24,723 58,201 Model Wigo Brio (Hatch) Mirage (Hatch)Price 11,250 13,867 11,846 14,560 13,847 15,055 Model Rush Kona BR-V XpanderPrice 19,180 21,791 23,534 20,503 22,880 19,968 24,861

Globally trusted brandQUALITY, DURABILITY, RELIABILITY (QDR)
High resale value (up to 50% of
original selling price for 5 years old
and above)
Availability of original parts,
supplies and service
Dealership network offering full
range of services
Corporate policy of manufacturing
original parts for models
discontinued up to 15 years
Toyota Brand Attributes
42

Acquisition of Toyota Santa Rosa Dealership
43
60% Php516Million
Cash paid
40% Php344Million
Cash paid
TOYOTA MOTOR PHILIPPINES TOYOTA MOTOR PHILIPPINES
Strategic Partnership Structure
60% 40%
Php110 MnDividend upflow
to GT Capital
• GTCAD will chair the Board and hold
key Finance roles
• TCS will assume management control,
appointing TSR’s president and key
operations positions
• Third-party fairness opinion by KPMG
(RG Manabat & Co)
Php860 MnValuation for 100%

Rationale for the Acquisition of
Toyota Santa Rosa Dealership
44
Diversify
geographical reach
Dealer network
expansion
Strategic partnership
w/ best-in-class brand
Metro Manila & Cavite North Luzon
JBT Global
South Luzon
• Source for 21% of OFWs, highest in the Philippines
• 2nd largest contributor to Philippine GDP
• USD 2,058 GDP per capita
• 37.2% of manufacturing GDP
Expansion into CALABARZON
71
dealers
• One of Japan’s leading
dealership groups
• TCS’s first joint venture
outside Japan
• Gives TCS valuable
international experience
for future global
expansion initiatives

Joint Venture with Premium Group Warranty
45
100%
33.3%66.6%
70% 30%
✓ Provide inspection and warranty service to the
used car sector
✓ Underpenetrated sector; no significant
Philippine competitors
✓ Number 1 warranty co in Japan
✓ Relatively small investment
✓ First-mover advantage
✓ Continues auto value-chain expansion
Rationale
Company Investment Stake
GT Capital/GTCAD Php32.7 M 46.7%
Premium Group Php21.0 M 30.0%
Mitsui & Co. Php16.3 M 23.4%
Total Investment Php70 M 100%
Investment

Partners for
Good
PropertyDevelopment

47
Digital Sales Process and Activities
1H2020 Highlights
1,569 1,510 1,604
524825 964
Jan Feb Mar Apr May Jun
Monthly Project Inquiries
Traditional Marketing
3,917
13,436
Traditional Digital*
March to June Inquiries
*Facebook/Instagram message, comments, emails, direct contact, web contact form
87% Social Media
13% Websites
Digital Platform Engagement
March to June
Customer Engagement(clicks, likes, and comments)
Audience views 1,254,709 151,510
16,558 1,8222,394
6,081
7,927 8,169 8,4499,096
Jan Feb Mar Apr May Jun
Cumulative Reservation Sales (Php Mn)
1Q2020: 86%YoY 1H2020: 3%YoY
77%
23%
+242 M +280 M
+647 M

28 Projects Approved for ResumptionConstruction Update As of September 2020
23 Residential Projects
5 Commercial Projects
Quantum T1, T2 and T3
PBW-Misibis PBW-Siargao PBW-Coron PBW-Baler Mi-Casa-Hawaii
PGMH-Mango PGMH-Mimosa Siena-T1 + T2 SSR-T2 SSR-T3
TGMO-T1 and T2
Met Live Deck iMet T2, T3, and T4 BBW Roadside
HLURB, LGU, DPWH, Local Associations
48

Project Launches in 2019Number of units are all estimates and subject to change
49
The Estate AYALA AVENUE
188 units, Php18.9B (JV 50%)
February
158 units, Php3.9B
March
Mi Casa Tower 1BAY AREA, PASAY 50
sold
31
350 units, Php2.7B
September
Marco Polo
Residences Tower 5CEBU
1,304 units, Php4.6B
August
Quantum
Residences Tower 2
(Amethyst)
TAFT AVENUE
The Seasons
ResidencesNatsu Tower
BGC
November November
The Grand Midori ORTIGAS
313 units, Php8.2B 810 units
28 On-going Projects• 7 launched in 2011
• 11 launched in 2012
• 5 launched in 2013
• 4 launched in 2014
• 3 launched in 2015
• 4 launched in 2016
• 5 launched in 2017
• 8 launched in 2018
• 6 launched in 2019
Launches for 2020 deferred
18 sqm. to 400 sqm.
unit size range
Php20 Mn – Php101 Mn
price range
8 Different Locations
• 6 cities within Metro Manila
• 2 cities outside Metro Manila
Recurring Income at 11% of
total revenue

Source: Company data
Land Bank Location
50
Cebu
Fort Bonifacio
Marikina
Macapagal
Kalaw, Manila
Ermita, Manila
Makati
Mandaluyong
Binondo Manila
Metro Manila
Quezon City
Binan Laguna
Cavite
Sta. Rosa, Laguna
LocationLand Bank
(in hectares)
Metro Manila
Bay Area, Pasay 14.8
Marikina 8.8
Mandaluyong 5.3
Fort Bonifacio 1.9
Kalaw, Manila 0.6
Paranaque 0.3
Outside Metro Manila
Iloilo 0.3
Binan, Laguna 63.5
General Trias, Cavite 3.0
Santa Rosa, Laguna 7.9
Total nationwide land bank
(MM+Prov)106.2

Exchange of Pro-Friends Shares for LandAgreement signed on 10 May 2019
51
Approximately
Php20Billion
702 hectaresof selected assets
Redemptionof 64,530,712
Series A Preferred Shares
in PCFI
(51% of PCFI)

Exchange of Pro-Friends Shares
• GT Capital invested Php16.0 billion for a 51.0% direct
equity stake in Pro-Friends
• Tranche 1: August 2015, Php7.24B for 22.68%
• Tranche 2: June 2016, Php8.76B for 28.3%
• Investment rationale: attain foothold in horizontal,
affordable, low-cost housing sector
Investment History Redemption Rationale
• The selected 702 hectares are best suited for
master-planned, mixed-use developments
o Use for affordable homes no longer optimal
and best use of land bank
• Land values no longer suitable for affordable housing
• Spin-off inevitable
• Partners to focus on areas of expertise
• Right Timing
o Key developments and ongoing infra projects
within the area are expected to translate to
higher land prices in the medium-term
o IT-BPM labor workforce outside Metro Manila
projected to grow 10% annually
o Cavite expected to have the second highest
office supply pipeline in the medium term
Capital Requirements:
• Capex for commercial and retail significantly
higher vs. affordable housing
• GT Capital to focus resources on mixed-use dev’ts 52

CALAX
MCX
EPZA
EPZA
Alabang
Entertainment City
Cavitex
Daang-Hari
SLEX
Aveia
Federal Land/
Alveo
NAIA Expressway
CAVITEX C-5
South Link
Skyway Extension
LRT-1
Extension
LRT-6
1
2
3
4
5
6 NLEX-SLEX Connector RoadTARGET COMPLETION DATES:
CAVITEX - 2021
CAVITEX C-5 South Link - 2021
CALAX - 2022
CTBEX
CALAX
Exit 1
CALAX
Exit 2
Ongoing
infrastructure
projects may
translate to
higher land
prices in the
medium-term

MCX
EPZA
EPZA
Alabang
Entertainment City
CAVITEX
Daang-Hari
SLEX
AVEIA
Federal Land/
Alveo
NAIA Expressway
CAVITEX C-5
South Link
Skyway Extension
LRT-1
Extension
LRT-6
NLEX-SLEX Connector Road
CTBEX
CALAX
Exit 1
CALAX
Exit 2
Rising property values from infra &
other property developments
CALAX
Sale to McDonald’sPhp64.0 million 2,027 sq. m @
Php31,579/sq. mFebruary 2019
Sale to Toyota Manila Bay
Group
to build Toyota Imus
dealershipPhp223.8 million 13,429 sq. m @
Php16,667/sq. mJune 2018
Sale to MetroPac Movers, Inc.Php1.1 billion 202,110 sq. m @
Php5,628/sq. mJuly 2018
Ground breaking: April 3. Target
opening: 4Q21

• 702 hectares of Selected
Assets appraised by Cuervo
Appraisers
• Reyes Tacandong issued
fairness opinion on
Enterprise Value of PCFI
using various
methodologies
• Values converge at Php20
Billion for 51%
55
Valuation Methodology
CALABARZON and Cavite Demographics
CAVITE

Return on Investment
versus
Approximate Value of
“Selected Assets”
Php20.0
Billion
Dividends from PRO-
FRIENDS
Php1.3
Billion
Total Php21.3 Billion
Initial InvestmentPhp16.0
Billion
ReturnIN PERCENTAGE 31%
• GT Capital Net
Income Contribution
from PRO-FRIENDS
CAGR +18%
• Return on investment
of 31%
56
Return on GT Capital’s Investment

Partners for
GoodLife and General
Insurance

19% 21%26% 28%
9M 2019 FY 2019 1Q 2020 1H 2020
AXA Virtual Selling Assist (AVA), Protection and Health
1H2020 Highlights
Annualized Premium Equivalent (APE)
Active Sellers and % of AVA Sellers
Protection and Health
% Contribution to New Business (APE)*
Teleconsultations - COVID-19 Response
204 239404
36%
54%
39%
Apr May Jun
APE (Php Mn) %AVA to APE
2,075 2,4303,084
62%80% 76%
Apr May Jun
Active Sellers % AVA Sellers
*Retail and Group Protection and Health
113
721 793 756
17395199 185
Jan Feb March Apr May Jun
Registrations
Usage
Extended to 750,000 non-health, GI, OFW
customers, life agents, and MBT leads
+7x vs. previous high
58
ECQGCQ

Partners for
Good Infrastructureand Utilities

STRICTLY CONFIDENTIAL
60
Monthly Volume Dashboard
Approximating Pre-Covid Levels

Covid-Related
Assistance
61

62
Helping the nation heal as one
₱1.0billion
₱100million
Policies and programs in place to support
25,600 Group-wide officers, agency-based
support staff and front-liners
Food gift certificates for 1 million familiesthrough Project Ugnayan of the Phil. Disaster
Relief Foundation and Caritas Manila
₱25.4million
20,000 sets of PPE for 21 hospitals inMetro Manila, Cavite, and Cagayan de Oro
₱4.3million
109,200 pairs of gloves and 2,000 sets
of PPE for the Police and Armed Forces
₱18million
Molecular Laboratory for the
Phil. Red Cross capable of 1,000 tests a day
₱15million
22,000 rapid test kits and 3,800 PCR
swab tests c/o U.P. NIH and Project ARK
₱10million
PhilStar Tala Para sa Kapwa, San Juan
Medical Center (via Xavier School),
McDonalds RHMC, Jollibee Group Foundation
Over
Php1.2 Billionin Covid-related
initiatives
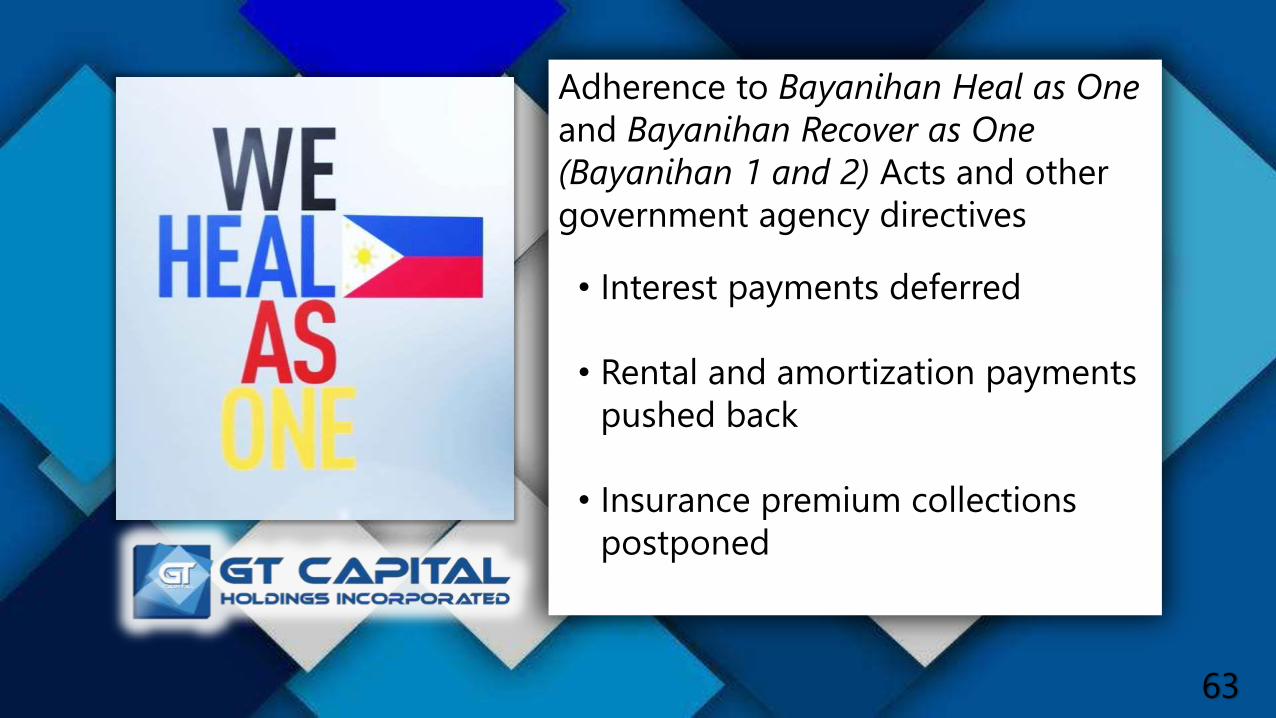
63
Adherence to Bayanihan Heal as One
and Bayanihan Recover as One
(Bayanihan 1 and 2) Acts and other
government agency directives
• Interest payments deferred
• Rental and amortization payments
pushed back
• Insurance premium collections
postponed

Group Services During ECQ
Grace
Periods
Grace periods for
monthly
amortizations, lease
collections, and
insurance premium
payments
Banking
Services
•Branches, Cash
Accept Machines,
and ATMs remained
open
•Waived bank fees on
Instapay and
PesoNet
Insurance
Coverage
•Extended validity of
coverage for
qualified policies
expiring within ECQ
•Covid-19-related
events covered
Auto
Assistance
Financial assistance
to dealerships
Property
Cleaning
Regular disinfection
of all common areas
in all properties
64

65
Our Key Messages
• Uncharted territory
• Strong balance sheet, solid global partners
• Support for employees: preservation of capabilities
• Diversification of sectors
• Strong core businesses
• Accelerating our digital transformation
Partners for
Good
Thank You!
For more information,
Visit gtcapital.com.ph/investor-relations
or contact [email protected]