LUOYANG GLASS COMPANY LIMITED ANNUAL RESULTS ...
49
– 1 – Hong Kong Exchanges and Clearing Limited and The Stock Exchange of Hong Kong Limited take no responsibility for the contents of this announcement, make no representation as to its accuracy or completeness and expressly disclaim any liability whatsoever for any loss howsoever arising from or in reliance upon the whole or any part of the contents of this announcement. * LUOYANG GLASS COMPANY LIMITED ANNUAL RESULTS ANNOUNCEMENT FOR THE YEAR ENDED 31 DECEMBER 2020 I. IMPORTANT NOTICE The board (the “ Board ”) of directors (the “ Directors ”) of Luoyang Glass Company Limited (the “ Company ”) is pleased to announce the consolidated financial results of the Company and its subsidiaries (the “Group”) for the year ended 31 December 2020. The Company’s financial information has been reviewed by the Audit Committee and the auditor of the Company.
-
Upload
khangminh22 -
Category
Documents
-
view
1 -
download
0
Transcript of LUOYANG GLASS COMPANY LIMITED ANNUAL RESULTS ...

– 1 –
Hong Kong Exchanges and Clearing Limited and The Stock Exchange of Hong Kong Limited take no responsibility for the contents of this announcement, make no representation as to its accuracy or completeness and expressly disclaim any liability whatsoever for any loss howsoever arising from or in reliance upon the whole or any part of the contents of this announcement.
*
LUOYANG GLASS COMPANY LIMITED ANNUAL RESULTS ANNOUNCEMENT FOR THE YEAR ENDED
31 DECEMBER 2020
I. IMPORTANT NOTICE
The board (the “Board”) of directors (the “Directors”) of Luoyang Glass Company Limited (the “Company”) is pleased to announce the consolidated financial results of the Company and its subsidiaries (the “Group”) for the year ended 31 December 2020.
The Company’s financial information has been reviewed by the Audit Committee and the auditor of the Company.

– 2 –
II. FINANCIAL STATEMENTS AND NOTES THERETO
(I) Financial Statements
Consolidated Balance Sheet
Item 31 December 2020 31 December 2019(RMB) (RMB)
Current assets:Cash and cash equivalents 300,948,343.56 432,871,497.66Notes receivable 102,441,393.68 198,553,190.06Accounts receivable 637,911,162.29 562,892,681.73Accounts receivable financing 448,697,313.21 162,706,438.58Prepayments 142,259,523.11 59,807,534.23Other receivables 17,023,855.78 37,905,213.08Inventories 257,598,620.68 281,882,687.59Other current assets 55,139,885.94 83,085,172.69
Total current assets 1,962,020,098.25 1,819,704,415.62
Non-current assets:Long-term receivables 55,000,000.00 55,000,000.00Fixed assets 3,068,216,734.33 2,343,435,561.00Construction in progress 54,472,785.67 603,637,921.26Right-to-use assets 12,259,657.09Intangible assets 392,925,010.51 396,358,331.06Development expenditure 14,096,615.36 3,073,758.34Long-term deferred expenses 1,595,431.43 6,792,035.43Deferred income tax assets 10,466,272.12 9,366,216.00Other non-current assets 33,523,206.41 3,671,639.24
Total non-current assets 3,642,555,712.92 3,421,335,462.33
Total assets 5,604,575,811.17 5,241,039,877.95

– 3 –
Item 31 December 2020 31 December 2019(RMB) (RMB)
Current liabilities:Short-term borrowings 1,177,314,071.56 1,240,054,086.26Notes payable 465,733,722.37 605,123,498.86Accounts payable 428,756,037.46 675,397,180.53Contract liabilities 38,214,732.27 15,654,739.42Employee compensation payable 38,978,819.73 31,097,821.63Taxes payable 116,355,071.70 36,694,248.37Other payables 764,011,526.81 356,002,972.21Non-current liabilities due within
one year 137,330,815.42 214,668,497.03Other current liabilities 4,888,222.00 1,834,742.27
Total current liabilities 3,171,583,019.32 3,176,527,786.58
Non-current liabilities:Long-term borrowings 524,063,924.00 545,738,860.14Lease liabilities 9,238,598.97Deferred income 104,408,642.44 104,830,714.44Deferred income tax liabilitiesOther non-current liabilities
Total non-current liabilities 637,711,165.41 650,569,574.58
Total liabilities 3,809,294,184.73 3,827,097,361.16
Shareholders’ equity:Share Capital 548,540,432.00 552,396,509.00Capital reserve 1,982,394,841.30 1,978,538,766.30Surplus reserve 51,365,509.04 51,365,509.04Undistributed profit -955,722,560.53 -1,283,084,419.02
Total equity attributable to shareholders of the Company 1,626,578,221.81 1,299,216,365.32
Minority interests 168,703,404.63 114,726,151.47Total shareholders’ equity 1,795,281,626.44 1,413,942,516.79
Total liabilities and/or shareholders’ equity 5,604,575,811.17 5,241,039,877.95

– 4 –
Balance Sheet of the Company
Item31 December
202031 December
2019(RMB) (RMB)
Current assets:Cash and cash equivalents 125,309,146.98 152,463,896.56Notes receivable 25,000,000.00 1,029,000.00Accounts receivable 172,104,965.11 198,240,989.31Accounts receivable financing 11,328,409.13 12,886,125.11Prepayments 23,779.73 57,754.85Other receivables 489,264,423.62 258,954,816.38Inventories 3,100,908.52Other current assets 664,323.60
Total current assets 826,131,633.09 624,296,905.81
Non-current assets:Long-term receivables 55,000,000.00 55,000,000.00Long-term equity investment 1,886,146,638.35 1,886,146,638.35Fixed assets 2,174,833.48 1,788,774.67Intangible assets 5,511,212.08 5,735,396.92
Total non-current assets 1,948,832,683.91 1,948,670,809.94
Total assets 2,774,964,317.00 2,572,967,715.75

– 5 –
Item31 December
202031 December
2019(RMB) (RMB)
Current liabilities:Short-term borrowings 394,007,666.58 339,443,640.19Notes payable 45,877,926.40 282,000,000.00Accounts payable 49,075,335.55 28,749,713.99Contract liabilities 12,260,748.25 12,849,147.70Employee compensation payable 8,074,804.47 6,853,521.41Taxes payable 2,253,865.09 405,258.48Other payables 791,861,472.98 434,067,998.84Non-current liabilities due within
one year 42,422,967.95 5,649,975.70Other current liabilities 1,593,897.27 1,670,389.18
Total current liabilities 1,347,428,684.54 1,111,689,645.49
Non-current liabilities:Long-term borrowings 228,000,000.00 262,532,959.53
Total non-current liabilities 228,000,000.00 262,532,959.53
Total liabilities 1,575,428,684.54 1,374,222,605.02
Shareholders’ equity:Share Capital 548,540,432.00 552,396,509.00Capital reserve 1,961,847,553.30 1,957,991,478.30Surplus reserve 51,365,509.04 51,365,509.04Undistributed profit -1,362,217,861.88 -1,363,008,385.61
Total shareholders’ equity 1,199,535,632.46 1,198,745,110.73
Total liabilities and shareholders’ equity 2,774,964,317.00 2,572,967,715.75

– 6 –
Consolidated Income Statement
ItemAmount for the period
Amount for previous period
(RMB) (RMB)
I. Operating revenue 3,045,614,913.68 1,854,842,208.09Less: Operating costs 2,101,640,760.29 1,404,274,867.15
Taxes and surcharges 34,534,420.73 25,687,293.69Selling expenses 87,183,559.33 65,890,259.11Administrative expenses 126,659,281.04 112,889,849.73R&D expenses 120,749,370.37 66,823,935.81Finance expenses 116,609,687.62 97,929,142.26Including: Interest expenses 112,471,782.20 92,019,454.58
Interest income 5,786,654.82 3,133,668.95Add: Other income 25,288,445.27 22,353,338.27
Investment income (losses are represented by “-”) -14,203,232.10 -8,939,588.06
Impairment losses on credit (losses are represented by “-”) -4,049,377.16 -27,639,136.97
Impairment losses on assets (losses are represented by “-”) -3,095,566.51 -8,087,991.61
Gains on disposal of assets (losses are represented by “-”) -259,318.91 11,355,077.66
II. Operating profit (loss is represented by “-”) 461,918,784.89 70,388,559.63
Add: Non-operating income 2,713,060.43 18,408,314.15Less: Non-operating expenses 1,777,338.14 1,991,490.00
III. To tal profit (total loss is represented by “-”) 462,854,507.18 86,805,383.78
Less: Income tax expenses 71,829,608.42 18,203,965.20

– 7 –
ItemAmount for the period
Amount for previous period
(RMB) (RMB)
IV. Net profit (net loss is represented by “-”) 391,024,898.76 68,601,418.58(I) Cl assified on a going
concern basis:1. Net profit from
continued operation (net loss is represented by “-”) 391,024,898.76 68,601,418.58
2. Net profit from discontinued operation (net loss is represented by “-”)
(II) Classified by ownership:1. Net profit attributable
to shareholders of the Company (net loss is represented by “-”) 327,361,858.49 53,999,883.71
2. Minority interests (net loss is represented by “-”) 63,663,040.27 14,601,534.87
V. Ot her comprehensive income net of tax
VI. Total comprehensive income 391,024,898.76 68,601,418.58(I) To tal comprehensive
income attributable to shareholders of the Company 327,361,858.49 53,999,883.71
(II) To tal comprehensive income attributable to minority interests 63,663,040.27 14,601,534.87
VII. Earnings per share(I) Basic earnings per share 0.59 0.10(II) Diluted earnings per share
– 8 –
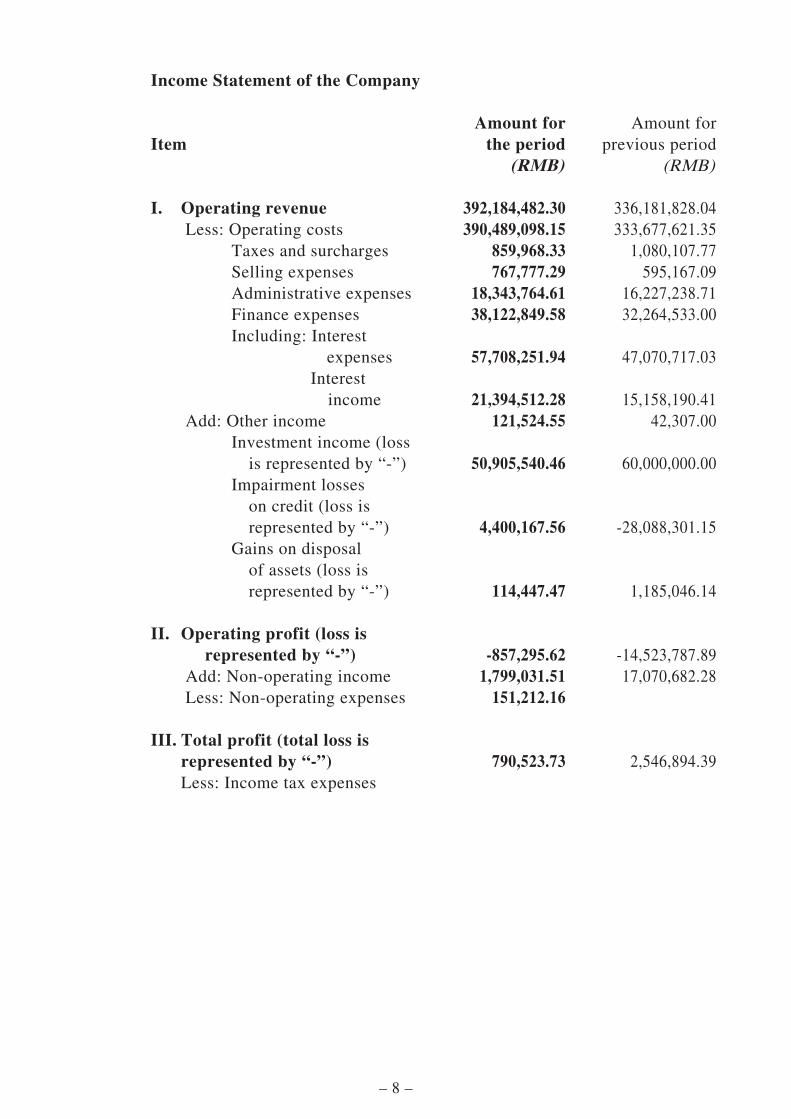
Income Statement of the Company
ItemAmount for the period
Amount for previous period
(RMB) (RMB)
I. Operating revenue 392,184,482.30 336,181,828.04Less: Operating costs 390,489,098.15 333,677,621.35
Taxes and surcharges 859,968.33 1,080,107.77Selling expenses 767,777.29 595,167.09Administrative expenses 18,343,764.61 16,227,238.71Finance expenses 38,122,849.58 32,264,533.00Including: In terest
expenses 57,708,251.94 47,070,717.03Interest
income 21,394,512.28 15,158,190.41Add: Other income 121,524.55 42,307.00
Investment income (loss is represented by “-”) 50,905,540.46 60,000,000.00
Impairment losses on credit (loss is represented by “-”) 4,400,167.56 -28,088,301.15
Gains on disposal of assets (loss is represented by “-”) 114,447.47 1,185,046.14
II. Op erating profit (loss is represented by “-”) -857,295.62 -14,523,787.89
Add: Non-operating income 1,799,031.51 17,070,682.28Less: Non-operating expenses 151,212.16
III. Total profit (total loss is represented by “-”) 790,523.73 2,546,894.39Less: Income tax expenses

– 9 –
ItemAmount for the period
Amount for previous period
(RMB) (RMB)
IV. Ne t profit (net loss is represented “-”) 790,523.73 2,546,894.39
(I) Ne t profit from continued operation(net loss is represented by “-”) 790,523.73 2,546,894.39
(II) Ne t profit from discontinued operation (net loss is represented by “-”)
V. Ot her comprehensive income net of tax
VI. Total comprehensive income 790,523.73 2,546,894.39
VII. Earnings per share(I) Basic earnings per share
(RMB/share)(II) Diluted earnings per share
(RMB/share)

– 10 –
Consolidated Cash Flow Statement
ItemAmount for
the periodAmount for
previous period(RMB) (RMB)
I. Cash flows from operating activities:Cash received from sale of goods or
rendering of services 1,803,176,452.92 1,055,592,878.10Tax refunds received 27,799,600.29 5,226,228.61Other cash received from activities related
to operation 103,074,373.26 60,066,753.95Sub-total of cash inflow from operating
activities 1,934,050,426.47 1,120,885,860.66
Cash paid for purchase of goods and services rendered 1,096,669,686.90 716,915,409.41
Cash paid to and on behalf of employees 239,533,611.24 200,811,953.77Tax payments 157,964,176.12 79,464,474.27Other cash paid for activities related to
operation 85,802,154.43 101,202,034.44Sub-total of cash outflow from operating
activities 1,579,969,628.69 1,098,393,871.89
Net cash flow from operating activities 354,080,797.78 22,491,988.77
II. Cash flow from investment activities:Net cash received from disposal of fixed
assets, intangible assets and other long term assets 22,000.00 15,256,192.45
Other cash received from investment activities 6,761,595.39
Sub-total of cash inflow from investment activities 6,783,595.39 15,256,192.45
Cash paid for purchase and construction of fixed assets, intangible assets and other long-term assets 237,779,722.68 281,125,382.86
Sub-total of cash outflow from investment activities 237,779,722.68 281,125,382.86
Net cash flow from investment activities -230,996,127.29 -265,869,190.41

– 11 –
ItemAmount for
the periodAmount for
previous period(RMB) (RMB)
III. Cash flow from financing activities:Proceeds from loans 1,590,694,303.89 1,706,350,558.83Other cash received from financing-
related activities 856,238,910.72 423,558,370.55Sub-total of cash inflow from financing
activities 2,446,933,214.61 2,129,908,929.38
Cash paid for repayment of loans 1,740,332,625.98 1,304,848,430.62Cash payment for distribution of
dividends and profits or repayment of interest 123,201,042.98 95,873,036.26
Including: Di vidends and profits paid to minority interests by subsidiaries 9,685,787.11
Other cash paid for financing-related activities 714,125,722.16 497,743,742.59
Sub-total of cash outflow from financing activities 2,577,659,391.12 1,898,465,209.47
Net cash flow from financing activities -130,726,176.51 231,443,719.91
IV. Effects of changes in exchange rate on cash and cash equivalents -1,315,741.59 53,682.54
V. Net increase in cash and cash equivalents -8,957,247.61 -11,879,799.19Add: Opening balance of cash and cash
equivalents 148,188,549.43 160,068,348.62
VI. Closing balance of cash and cash equivalents 139,231,301.82 148,188,549.43

– 12 –
Cash Flow Statement of the Company
ItemAmount for
the periodAmount for
the period(RMB) (RMB)
I. Cash flows from operating activities:Cash received from sale of goods or
rendering of services 145,394,531.73 71,479,312.29Other cash received from activities related
to operation 8,500,206.34 29,353,054.59Sub-total of cash inflow from operating
activities 153,894,738.07 100,832,366.88
Cash paid for goods purchased and services rendered 102,923,989.82 42,353,540.58
Cash paid to and on behalf of employees 11,257,941.42 12,083,945.44Tax payments 3,251,747.46 4,011,974.12Other cash paid for activities related to
operation 11,500,715.07 32,627,078.58Sub-total of cash outflow from operating
activities 128,934,393.77 91,076,538.72
Net cash flow from operating activities 24,960,344.30 9,755,828.16
II. Cash flow from investment activities:Cash received from return of investment 23,701,965.76Net cash received from disposal of fixed
assets, intangible assets and other long-term assets 15,342.00
Sub-total of cash inflow from investment activities 23,701,965.76 15,342.00
Cash paid for purchase and construction of fixed assets, intangible assets and other long-term assets 910,619.50
Cash paid for investment 163,606,799.00Sub-total of cash outflow from investment
activities 910,619.50 163,606,799.00
Net cash flow from investment activities 22,791,346.26 -163,591,457.00

– 13 –
ItemAmount for
the periodAmount for
the period(RMB) (RMB)
III. Cash flow from financing activities:Proceeds from loans 513,490,000.00 415,860,000.00Other cash received from activities related
to financing 2,766,323,043.63 2,128,954,623.66Sub-total of cash inflow from financing
activities 3,279,813,043.63 2,544,814,623.66
Cash paid for repayment of loans 456,658,697.84 234,038,799.17Cash paid for distribution of dividends,
profits, or repayment of interest 44,014,859.26 25,767,832.32Other cash paid for financing-related
activities 2,791,512,554.46 2,121,039,197.26Sub-total of cash outflow from financing
activities 3,292,186,111.56 2,380,845,828.75
Net cash flow from financing activities -12,373,067.93 163,968,794.91
IV. Effects of changes in exchange rate on cash and cash equivalents -387.29 142.97
V. Net increase in cash and cash equivalents 35,378,235.34 10,133,309.04Add: Opening balance of cash and cash
equivalents 46,467,911.64 36,334,602.60
VI. Closing balance of cash and cash equivalents 81,846,146.98 46,467,911.64

– 14 –
Con
soli
dat
ed S
tate
men
t of
Ch
ange
s in
Ow
ner
s’ E
qu
ity
Item
Curre
nt pe
riod
Equit
y attr
ibutab
le to
shar
ehold
ers of
the C
ompa
ny
Mino
rity
intere
st
Total
shar
ehold
ers’
equit
y
Shar
e cap
ital
Othe
r equ
ity in
strum
ents
Capit
al
reserv
e
Less:
Trea
sury
stock
Othe
r
comp
rehen
sive
incom
e
Speci
al
reserv
e
Surp
lus
reserv
e
Undis
tribu
ted
profi
tSu
btotal
Prefe
rentia
l
shar
es
Perp
etual
bond
sOt
hers
I.
Balan
ce at
the en
d of la
st ye
ar55
2,396
,509.0
01,9
78,53
8,766
.3051
,365,5
09.04
-1,28
3,084
,419.0
21,2
99,21
6,365
.3211
4,726
,151.4
71,4
13,94
2,516
.79
Othe
r
II.
Balan
ce at
the be
ginnin
g of t
he ye
ar55
2,396
,509.0
01,9
78,53
8,766
.3051
,365,5
09.04
-1,28
3,084
,419.0
21,2
99,21
6,365
.3211
4,726
,151.4
71,4
13,94
2,516
.79
III. I
n crea
se/de
crease
in th
e peri
od
(decre
ase is
repr
esente
d by “
-”)-3,
856,0
77.00
3,856
,075.0
032
7,361
,858.4
932
7,361
,856.4
953
,977,2
53.16
381,3
39,10
9.65
(I)
To tal
comp
rehen
sive i
ncom
e32
7,361
,858.4
932
7,361
,858.4
963
,663,0
40.27
391,0
24,89
8.76
(II)
Sh are
holde
rs’ co
ntribu
tion a
nd
decre
ase in
capit
al-3,
856,0
77.00
3,856
,075.0
0-2.
00-2.
00
1. Ot
hers
-3,85
6,077
.003,8
56,07
5.00
-2.00
-2.00
(III)
Profi
t dist
ributi
on-9,
685,7
87.11
-9,68
5,787
.11
1. Di
stribu
tion t
o sha
rehold
ers-9,
685,7
87.11
-9,68
5,787
.11
(IV) I
n terna
l carr
y-forw
ard of
share
holde
rs’ eq
uity
(V)
Spec
ial re
serve
(VI)
Othe
rs
IV.
Ba lan
ce at
the en
d of t
he pe
riod
548,5
40,43
2.00
1,982
,394,8
41.30
51,36
5,509
.04-95
5,722
,560.5
31,6
26,57
8,221
.8116
8,703
,404.6
31,7
95,28
1,626
.44

– 15 –
Item
Prev
ious p
eriod
Equit
y attr
ibutab
le to
share
holde
rs of
the C
ompa
ny
Mino
rity
intere
st
Total
share
holde
rs’eq
uity
Share
capit
al
Othe
r equ
ity in
strum
ents
Capit
alres
erve
Less:
Trea
sury
stock
Othe
rco
mpreh
ensiv
einc
ome
Spec
ialres
erve
Surpl
usres
erve
Undis
tribu
tedpro
fitSu
btotal
Prefe
rentia
lsh
ares
Perpe
tual
bond
sOt
hers
I. Ba
lance
at the
end o
f last
year
559,7
97,39
1.00
1,971
,137,8
87.30
51,36
5,509
.04-1,
337,0
84,30
2.73
1,245
,216,4
84.61
100,1
24,61
6.60
1,345
,341,1
01.21
II.
Balan
ce at
the be
ginnin
g of t
he ye
ar55
9,797
,391.0
01,9
71,13
7,887
.3051
,365,5
09.04
-1,33
7,084
,302.7
31,2
45,21
6,484
.6110
0,124
,616.6
01,3
45,34
1,101
.21
III. I
ncrea
se/de
crease
in th
e peri
od
(d
ecrea
se is
repres
ented
by “-
”)-7,
400,8
82.00
7,400
,879.0
053
,999,8
83.71
53,99
9,880
.7114
,601,5
34.87
68,60
1,415
.58(I)
To
tal co
mpreh
ensiv
e inc
ome
53,99
9,883
.7153
,999,8
83.71
14,60
1,534
.8768
,601,4
18.58
(II)
Share
holde
rs’ co
ntribu
tion a
nd
de
crease
in ca
pital
-7,40
0,882
.007,4
00,87
9.00
-3.00
-3.00
1. Ot
hers
-7,40
0,882
.007,4
00,87
9.00
-3.00
-3.00
(III)
Profi
t dist
ributi
on(IV
) Int e
rnal c
arry-f
orward
of
share
holde
rs’ eq
uity
(V)
Spec
ial re
serve
(VI)
Othe
rs
IV.
Balan
ce at
the en
d of t
he pe
riod
552,3
96,50
9.00
1,978
,538,7
66.30
51,36
5,509
.04-1,
283,0
84,41
9.02
1,299
,216,3
65.32
114,7
26,15
1.47
1,413
,942,5
16.79

– 16 –
Sta
tem
ent
of C
han
ges
in O
wn
ers’
Eq
uit
y of
th
e C
omp
any
Item
Curre
nt pe
riod
Share
capit
al
Othe
r equ
ity in
strum
ents
Capit
al
reserv
e
Less:
Treas
ury s
tock
Othe
r
compr
ehen
sive
incom
e
Speci
al
reserv
e
Surp
lus
reserv
e
Undis
tribu
ted
profi
t
Total
shareh
olders
’ eq
uity
Prefe
rentia
l
share
s
Perp
etual
bond
sOt
hers
I. Ba
lance
at the
end o
f last y
ear55
2,396
,509.0
01,9
57,99
1,478
.3051
,365,5
09.04
-1,36
3,008
,385.6
11,1
98,74
5,110
.73
II.
Balan
ce at
the be
ginnin
g of th
e year
552,3
96,50
9.00
1,957
,991,4
78.30
51,36
5,509
.04-1,
363,0
08,38
5.61
1,198
,745,1
10.73
III.
In crea
se/de
crease
in th
e peri
od (d
ecreas
e is
repres
ented
by “-
”)-3,
856,0
77.00
3,856
,075.0
079
0,523
.7379
0,521
.73
(I)
Total
comp
rehens
ive in
come
790,5
23.73
790,5
23.73
(II)
Sh are
holde
rs’ co
ntribu
tion a
nd de
crease
in
capita
l-3,
856,0
77.00
3,856
,075.0
0-2.
00
1. Ot
hers
-3,85
6,077
.003,8
56,07
5.00
-2.00
(III)
Profi
t dist
ributi
on
(IV) I
nterna
l carr
y-forw
ard of
share
holde
rs’ eq
uity
(V)
Speci
al res
erve
(VI)
Other
s
IV.
Balan
ce at
the en
d of th
e peri
od54
8,540
,432.0
01,9
61,84
7,553
.3051
,365,5
09.04
-1,36
2,217
,861.8
81,1
99,53
5,632
.46

– 17 –
Item
Previo
us per
iod
Share
capit
al
Other
equit
y inst
rument
s
Capit
al res
erve
Less:
Tre
asury
stock
Other
com
prehen
sive
incom
eSp
ecial
reser
veSu
rplus
reserv
eUn
distrib
uted
profit
Total
shareh
olders
’ equ
ity
Prefer
ential
sha
resPe
rpetua
l bo
nds
Other
s
I. Ba
lance
at the
end o
f last y
ear55
9,797
,391.0
01,9
50,59
0,599
.3051
,365,5
09.04
-1,36
5,555
,280.0
01,1
96,19
8,219
.34
II. B
alanc
e at th
e begi
nning
of th
e year
559,7
97,39
1.00
1,950
,590,5
99.30
51,36
5,509
.04-1,
365,5
55,28
0.00
1,196
,198,2
19.34
III. I
n crea
se/de
crease
in th
e year
(decr
ease is
rep
resen
ted by
“-”)
-7,40
0,882
.007,4
00,87
9.00
2,546
,894.3
92,5
46,89
1.39
(I)
Total
comp
rehens
ive in
come
2,546
,894.3
92,5
46,89
4.39
(II)
Sh are
holde
rs’ co
ntribu
tion a
nd de
crease
in
capita
l-7,
400,8
82.00
7,400
,879.0
0-3.
00
1. Ot
hers
-7,40
0,882
.007,4
00,87
9.00
-3.00
(III)
Profit
distrib
ution
(IV) I
nterna
l carr
y-forw
ard of
share
holde
rs’
equ
ity(V
) Sp
ecial
reserv
e(V
I) Ot
hers
IV. B
alanc
e at th
e end
of th
e year
552,3
96,50
9.00
1,957
,991,4
78.30
51,36
5,509
.04-1,
363,0
08,38
5.61
1,198
,745,1
10.73

– 18 –
(II) Notes to the Financial Statements (Expressed in RMB)
1. Significant Accounting Policies
(1) Basis for preparation of financial statements
(I) Basis for preparation: the financial statements of the Company have been prepared on a going concern basis in respect of the actual transactions and events in accordance with the requirements of the Accounting Standards for Business Enterprises – Basic Standards and the detailed accounting standards (the “Accounting Standards for Business Enterprises”) , and based on the fol lowing significant accounting policies and estimates.
(II) Going concern: as at 31 December 2020, the business operations of the Company were in normal condition with smooth financing channels and its gearing ratio was 67.97%. Although the current liabilities exceeded current assets by RMB1,209,562,921.07, the management of the Company have made assessment that the Company is expected the net cash flow from operations to be positive in the next 12 months. At the same time, China Luoyang Float Glass (Group) Co., Ltd. (“CLFG”), the controlling shareholder, provides daily financial aid to the Company, which can meet the Company’s capital needs for repayment of debts and capital commitments. The management of the Company believe that there is no problem about the Company’s ability to continue operation. Therefore, the Company has prepared the financial statement based on continuing operations.
(2) Accounting period
Accounting year of the Company is the calendar year from 1 January to 31 December.
(3) Measurement currency
The Company’s reporting currency is the Renminbi (“RMB”).

– 19 –
(4) Preparation method of consolidated financial statements
The Company incorporated all of its subsidiaries (including the separate entities controlled by the Company) into the scope of consolidated financial statements, including the enterprises under the Company’s control, divisible part in the investees and structured entities.
The consolidated financial statements shall be prepared on the basis of the f inancial s tatements of the Company and subsidiaries, which offset the internal transactions incurred between the Company and subsidiaries and within subsidiaries. The shareholders’ equity of the subsidiaries not attributable to the Company shall be presented as “minority equity” under the shareholders’ equity item in the consolidated balance sheet. The long-term equity investment of the Company held by the subsidiaries, deemed as treasury stock of the Company as well as the reduction of shareholders’ equity, shall be presented as “Less: Treasury stock” under the shareholders’ equity item in the consolidated balance sheet.
When preparing consolidated financial statements, adjustments are made if the subsidiaries’ accounting policies and accounting periods are different from that of the Company, in accordance with the Company’s accounting policies and accounting periods.
For subsidiaries acquired under enterprise merger involving enterprises under common control, mergers were deemed to have taken place when the ultimate controller began to exercise control over them, the assets, liabilities, operating results and cash flows of the subsidiaries are included in the consolidated financial statements from the beginning of the financial year in which the combination took place. When preparing the consolidated financial statements, for the subsidiaries acquired from business combination not involving entities under common control, the identifiable net assets of the subsidiaries are adjusted on the basis of their fair values on the date of acquisition.
In respect of d isposal of long- term equi ty investment in subsidiaries without losing control, the difference between disposal consideration and the net assets of subsidiaries attributable to the long-term equity investment continually calculated since the date of acquisition or combination date shall be adjusted to capital reserve (capital premium or share capital premium) in the consolidated financial statements. In case the capital reserve is insufficient for offset, retained earnings will be adjusted.

– 20 –
When the control over the investee is lost due to reasons such as disposal of part of the equity investment, remaining shareholding will be remeasured based on the fair value on the date of loss of control when preparing the consolidated financial statements. The difference between the sum of disposal consideration and fair value of the remaining equity less the net assets attributable the original shareholdings calculated from the date of acquisition or combination shall be recorded into the investment income for the period when the control is lost, and goodwill will be written off at the same time. Other comprehensive income related to the original equity investment in the subsidiary will be transferred to investment income for the period when control is lost.
2. Segment Reporting
(1) Determination basis and accounting policies of reporting segments
The Company determines operating segments on the basis of the internal organizational structure, management requirements and internal report system, and determines reporting segments on the basis of operation segments, and discloses information of the segments. For management purposes, the Company has two operating segments. The management of the Company regularly reviews the financial information of each segment to make decisions about resources to be allocated to the segment and to assess its performance.
An operating segment is a component of the Company that meets the following conditions simultaneously:
① The component is able to generate revenues and incur expenses from its ordinary activities;
② I t s opera t ing resu l t s a re regu la r ly eva lua ted by the Company’s management to make decisions about resources to be allocated to the segment and assess its performance;
③ Its accounting information on financial position, operating results and cash flows and others is available to the Company. Two or more operating segments may be aggregated into a single operating segment if they have similar economic characteristics and meet specified conditions.
The operating segments of the Company include information display glass segment and new energy glass segment.

– 21 –
Segment information is disclosed in accordance with the accounting policies and measurement criteria adopted by each segment when reporting to management. The measurement criteria are consistent with the accounting policies and measurement criteria in the preparation of the financial statements. Segment assets exclude deferred income tax assets and segment liabilities exclude deferred income tax liabilities.
Intersegment transactions are measured based on the actual transaction price. Segment revenue and segment expenses are recognized based on the actual revenue generated and actual expenses incurred by the respective segments. Assets and liabilities are allocated according to the assets used or liabilities assumed that are attributable to the operating segment in their daily operating activities.
(2) Financial information of the reporting segments
Segment information for the year 2020 and as at 31 December 2020:
ItemInformation display glass New energy glass
Unallocated items Elimination Total
I. Operating revenue 398,585,187.91 2,645,908,412.12 1,427,769.66 -306,456.01 3,045,614,913.68Including: Re venue from
external principal operations 397,141,767.24 2,614,651,734.05 3,011,793,501.29
Revenue from other external operations 1,443,420.67 31,256,678.07 1,427,769.66 -306,456.01 33,821,412.39
II. Impairment losses of assets -3,095,566.51 -3,095,566.51III. Impairment losses of credit 9,537,269.67 -13,792,320.74 205,673.91 -4,049,377.16IV. De preciation expenses and
amortization expenses 68,343,223.04 138,282,838.00 494,751.63 -162,170.44 206,958,642.23V. Total profit 12,912,055.71 510,776,211.92 790,523.73 -61,624,284.18 462,854,507.18VI. Income tax expenses 2,746,195.52 69,083,412.90 71,829,608.42VII. Net profit 10,165,860.19 441,692,799.02 790,523.73 -61,624,284.18 391,024,898.76VIII. Total assets 1,415,785,177.43 4,317,259,980.49 888,817,678.65 -1,017,287,025.40 5,604,575,811.17IX. Total liabilities 1,005,756,511.59 2,652,404,637.18 1,575,428,684.54 -1,424,295,648.58 3,809,294,184.73

– 22 –
(3) Operating revenue by customer’s geographical location
Geographical locationAmount for the period
Amount for previous period
China (excluding Hong Kong, Macau and Taiwan) 2,991,450,557.06 1,782,618,433.48
Other countries and regions 54,164,356.62 72,223,774.61
Total 3,045,614,913.68 1,854,842,208.09
(4) Non-current assets by its geographical location
Geographical location Closing balance Opening balance
China (excluding Hong Kong, Macau and Taiwan) 3,577,089,440.80 3,356,969,246.33
Total 3,577,089,440.80 3,356,969,246.33
Note: Non-current assets are attributable to the areas where the assets are located, excluding financial assets, separate account assets and deferred income tax assets.
(5) Reliance on major customers
The Company has a diversified customer base. In 2020, only four customers from new energy reporting segment had transaction amounts contributing over 10% to the revenue of the Company.

– 23 –
3. Turnover
Turnover is the invoiced value of the goods sold to the customers after deduction of any trade discounts, VAT and surcharges, the analyses of which are as follows:
(1) Details of operating revenue
ItemAmount for
the periodAmount for
previous period
Revenue from principal operating activities 3,011,793,501.29 1,800,247,448.59
Revenue from other operating activities 33,821,412.39 54,594,759.50
Total operating revenue 3,045,614,913.68 1,854,842,208.09
(2) Revenue from principal operating activities by product
Name of product or serviceAmount for the period
Amount for previous period
Information display glass 397,141,767.24 260,012,118.07New energy glass 2,558,869,152.90 1,540,235,330.52
Other functional glass 55,782,581.15
Total 3,011,793,501.29 1,800,247,448.59
4. Other Income
ItemAmount for
the periodAmount for
previous period
Government grant 24,832,345.81 22,330,708.09Gain from debt restructuring 369,548.11Individual tax refunds 86,551.35 22,630.18
Total 25,288,445.27 22,353,338.27
– 24 –
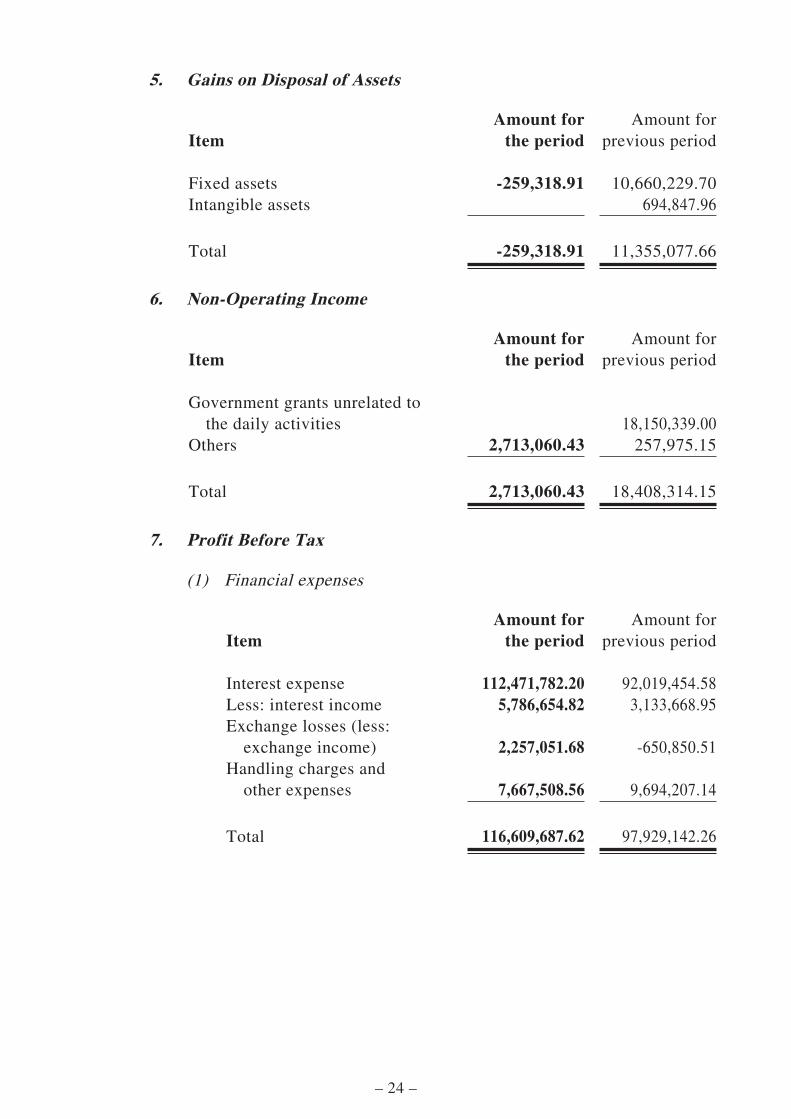
5. Gains on Disposal of Assets
ItemAmount for
the periodAmount for
previous period
Fixed assets -259,318.91 10,660,229.70Intangible assets 694,847.96
Total -259,318.91 11,355,077.66
6. Non-Operating Income
ItemAmount for
the periodAmount for
previous period
Government grants unrelated to the daily activities 18,150,339.00
Others 2,713,060.43 257,975.15
Total 2,713,060.43 18,408,314.15
7. Profit Before Tax
(1) Financial expenses
ItemAmount for
the periodAmount for
previous period
Interest expense 112,471,782.20 92,019,454.58Less: interest income 5,786,654.82 3,133,668.95Exchange losses (less:
exchange income) 2,257,051.68 -650,850.51Handling charges and
other expenses 7,667,508.56 9,694,207.14
Total 116,609,687.62 97,929,142.26

– 25 –
(2) Operating costs
ItemAmount for the period
Amount for previous period
Principal operating costs 2,076,427,457.88 1,367,307,636.65Other operating costs 25,213,302.41 36,967,230.50
Total operating costs 2,101,640,760.29 1,404,274,867.15
(3) Business tax and surcharges
ItemAmount for
the periodAmount for
previous period
Urban maintenance and construction tax 7,765,268.33 3,747,860.71
Education surcharges 6,187,717.79 2,787,181.76Property tax 8,359,682.64 7,426,407.18Land-use tax 9,427,195.13 9,136,754.19Stamp duty 1,294,964.58 1,104,625.98Others 1,499,592.26 1,484,463.87
Total 34,534,420.73 25,687,293.69
(4) Selling expenses
ItemAmount for
the periodAmount for
previous period
Employee compensation 20,290,139.32 14,947,279.13Transportation costs 63,763,833.60 45,128,432.36Business travel Expense 371,948.39 575,200.21Other expenses 2,155,415.15 5,031,763.74
Depreciation 602,222.87 207,583.67
Total 87,183,559.33 65,890,259.11

– 26 –
(5) Administrative expenses
ItemAmount for
the periodAmount for
previous period
Employee compensation 63,018,465.36 63,136,240.20Depreciation of fixed assets 17,121,284.94 8,029,521.39Business entertainment
expenses 1,063,736.14 1,536,200.50Business travel expenses 937,288.97 1,598,399.35Transportation expenses 1,654,490.46 2,063,374.29Office expenses 5,242,305.17 3,973,067.82Intermediary engagement and
consulting fees 7,540,856.30 6,868,076.46Property management fee 3,505,183.03 2,267,806.03Amortization of intangible
assets 8,988,293.74 9,274,750.94Other expenses 17,587,376.93 14,142,412.75
Total 126,659,281.04 112,889,849.73
(6) Impairment loss on assets
ItemAmount for
the periodAmount for
previous period
Loss on bad debtsImpairment loss on inventories -3,095,566.51 -3,396,587.15Impairment loss on fixed assets -4,691,404.46
Total -3,095,566.51 -8,087,991.61
(7) Impairment loss on credit
ItemAmount for
the periodAmount for
previous period
Bad debt loss -4,049,377.16 -27,639,136.97
Total -4,049,377.16 -27,639,136.97

– 27 –
(8) Non-operating expenses
ItemAmount for
the periodAmount for
previous period
Donations 5,000.00 10,000.00Penalties and overdue fine 470,174.16 1,981,050.00Losses on retirement or damage
of fixed assets 1,302,043.98Others 120.00 440.00
Total 1,777,338.14 1,991,490.00
8. Income Tax Expenses
ItemAmount for the period
Amount for previous period
Income tax expenses for the period calculated in accordance with tax laws and relevant regulations 72,929,664.54 21,460,371.97
Deferred income tax expenses -1,100,056.12 -3,256,406.77
Total 71,829,608.42 18,203,965.20
Note: Longhai Glass, Bengbu CNBM Information Display Materials, Hefei New Energy and Tongcheng New Energy, the wholly-owned subsidiaries of the Company and Yixing New Energy, a controlled subsidiary of the Company, are all high-tech enterprises and subject to an enterprise income tax rate of 15% in 2020.

– 28 –
9. Basic Earnings Per Share
Basic earnings per share is calculated by dividing the consolidated net profit attributable to holders of ordinary share of the Company by the weighted average number of ordinary shares outstanding:
ItemAmount for
the periodAmount for
previous period
Net profits attributable to the holders of ordinary shares of the Company 327,361,858.49 53,999,883.71
Total number of shares at the end of the period 552,075,169 559,797,391
Basic earnings per share 0.59 0.10
No diluted earnings per share was calculated as the Company did not have any potential dilutive shares during the year ended 31 December 2020.
10. Accounts Receivable and Notes Receivable
(1) Accounts receivable:
Item Book balance Opening balance
Accounts receivable 750,620,616.69 667,716,061.57Less: provision for bad debts 112,709,454.40 104,823,379.84Accounts receivable, net 637,911,162.29 562,892,681.73
The aging of accounts receivable based on their recording dates is analysed as below:
Aging Closing balance Opening balance
Within 1 year 636,063,884.47 529,539,527.681–2 years 26,583,995.37 68,145,837.662–3 years 20,191,820.30 10,955,320.363–4 years 10,955,320.15 2,578,490.564–5 years 2,205,607.98 1,914,277.29Over 5 years 54,619,988.42 54,582,608.02
Total 750,620,616.69 667,716,061.57

– 29 –
(2) Notes receivable by category
Item Closing balance Opening balance
Trade acceptance 104,532,034.37 202,605,295.99Less: Provision for bad debts 2,090,640.69 4,052,105.93
Total 102,441,393.68 198,553,190.06
(3) Accounts receivable financing
Item Closing balance Opening balance
Bank acceptance 448,697,313.21 162,706,438.58
Total 448,697,313.21 162,706,438.58
11. Accounts Payable and Notes Payable
(1) The aging of accounts payable based on their recording dates is analysed as below
Item Closing Balance Opening balance
Within 1 year (inclusive) 350,179,059.89 488,832,656.23Over 1 year 78,576,977.57 186,564,524.30
Total 428,756,037.46 675,397,180.53
(2) Notes payable by category
Item Closing Balance Opening balance
Bank acceptance 465,733,722.37 516,732,323.56Trade acceptance 88,391,175.30
Total 465,733,722.37 605,123,498.86

– 30 –
12. Reserves
(1) Capital reserve
ItemOpening balance
Increase in the period
Decrease in the period
Closing balance
I. Capital premium 1,903,422,821.29 3,856,075.00 1,907,278,896.29II. Other capital reserves 75,115,945.01 75,115,945.01
Total 1,978,538,766.30 3,856,075.00 1,982,394,841.30
Note: The capital premium increased by RMB3,856,075.00 in the current period, which was the difference between the amount of repurchase capital and the consideration paid.
(2) Surplus reserve
ItemOpening balance
Increase in the period
Decrease in the period
Closing balance
Statutory surplus reserve 51,365,509.04 51,365,509.04
Total 51,365,509.04 51,365,509.04

– 31 –
(3) Undistributed profit
Item Closing balance
Amount
Percentage of allocation or distribution
Undistributed profit at the end of the previous period before adjustment -1,283,084,419.02
Adjustment for total undistributed profit at the beginning of the period (increase expressed with+, and decrease expressed with -)
Undistributed profit at the beginning of the period after adjustment -1,283,084,419.02
Add: Ne t profit attributable to owners of Company for the period 327,361,858.49 ––
Less: Ap propriation to statutory surplus reserve
Appropriation to discretionary surplus reserve
Dividend payable in respect of ordinary shares
Dividend on ordinary share converted to share capital
Undistributed profit at the end of the period -955,722,560.53
13. Subsequent Matters
Nil

– 32 –
III. DISCUSSION AND ANALYSIS OF THE OPERATIONS DURING THE REPORTING PERIOD
Business review
In 2020, under the leadership of the Board of the Company, the management teams at all levels have actively united and led masses of cadres and employees of the Company, resolved to implement the decisions and arrangements of “six stabilizations” and “six guarantees”, and deeply implemented the specific requirements of “three stabilizations, four guarantees and an improvement”. On the basis of regular pandemic prevention and control with all efforts, the Company has further moved forward to carry out quality and efficiency improvement program and benchmarked against the first-class enterprises in term of management, firmly promoted the overall acceleration of the project construction, grasped the new opportunities and planned the new layout, thus successfully achieving the fast growth of the production and sales volume as well as the operating results.
1. Seized new market opportunities for improving, optimizing and expanding the photovoltaic glass business
In the second half of 2020, the photovoltaic industry saw an explosive growth trend. The Company launched the fund-raising project of non-public issuance of shares in due course with the proceeds of to be raised not more than RMB2 billion, which was mainly utilized for the investment and construction of two projects of photovoltaic cell encapsulating material for solar equipment. Meanwhile,cooperation framework agreements have been entered into by the Company and Qinhuangdao North Glass Co., Ltd. * (秦皇 島 北 方 玻 璃 有 限 公 司 ), Triumph Jinghua Glass Co., Ltd. * (凱 盛晶華玻璃有限公司 ), laid the foundation for subsequent acquisitions of the two companies. The implementation of the project would be conducive for the Company to further seizing the new opportunities of industrial development, meeting the market demand for the ultra-thin photovoltaic cell packaging materials, improving, optimizing and expanding the photovoltaic glass business, so that achieving the long-term market advantages and core competitiveness.
2. Firmly promoted the project construction and cemented the foundation of principal businesses
The production line of Puyang ultra-white solar thermal material project has been put into operation on 28 May 2020, which continuously and stably manufactured the products with the specification of 1.3mm to 12mm, which successfully realized positive investment returns during the year when it was put into production.

– 33 –
Hefei New Energy solar energy back-sheet glass further processing project with annual capacity of 11 million m2, Tongcheng New Energy solar energy glass further processing production line project with annual capacity of 10 million m2 and Yixing New Energy photovoltaic glass further processing project with annual capacity of 11.4 million m2 were successively constructed and put into operation. The output of 2.0mm photovoltaic glass used in double-glass modules of the Company rose significantly, accounting for over 70% of the total output. The photovoltaic glass business of the Company achieved double-digit increases in the volume and price during the year.
A new breakthrough was made in the technological innovation of Longhai Glass. The products in large size of 1.1mm and 0.7mm series were developed and produced successively; the quality of the products was improved stably and continued to meet the needs of downstream customers.
3. Deeply promoted streamlined, refined and lean management and continued to improve the overall quality
Firstly, lean operation to increase the profitability. The Company put emphasis on the operating concept of “Price-Cost-Profit”, and implemented such operation measures as “quality improvement, prices stabilizing, steady growth maintaining, inventory control, structure adjusting and cost reduction”, thus achieving a year-on-year increase of 67.30% in the revenue from the principal operations and a year-on-year increase of 7.01 percentage points in the gross profit margin throughout the year. In 2020, the Company organized and carried out “quality improvement for setting off again” activities and developed and implemented “grabbing the leading position” activities plans; implemented the “priority to operation”, strengthened the comprehensive market plan, made every efforts to stabilize the prices and expand the capacity, guaranteeing the stable operation of the production chain; and seized the market opportunities and actively expanded the oversea market of its photovoltaic glass.
Secondly, fine management to improve the management efficiency. The Company further carried out the work of “a year for implementing the rules and regulations”, implemented the long-term driving force with the rigid binding force of the system, and paid close attention to the work of “abolishing, amending and establishing system”. The headquarters of the Company focused on the first-class standard and quality and efficiency improvement, adhered to the problem-oriented practice, cemented its foundation and improved its weak areas. All subsidiaries strengthened digital management, focused on key production and operation indicators, concentrated on measures for cost and expenditure reduction, and achieved

– 34 –
significant results in cost reduction and efficiency improvement. Powered by informatization and intelligentization to increase the operation efficiency of the enterprises in production, Bengbu CNBM Information Display has been recognized as a smart factory in Bengbu city in 2020, five platforms of Longhai Glass smart factory project have been officially put into operation, and Yixing New Energy improved the business processing efficiency by implementing process reengineering.
Thirdly, organization refinement to stimulate the energy and momentum. The Company formulated and issued the “management system for competition for management and important operating positions”, and the middle-level managers of the headquarters were the first to be engaged through appointment. The Company continued to streamline the organization, built an efficient organizational system, and further established and improved the “three cans” management mechanism, in which management can get promotion or demotion, employees can be employed or dismissed, and incomes can increase or decrease.
4. Greater force in environmental protection to advance the transformation project of ultra-low emission
The Company deepened the implementation of the “Responsible Blue Sky Action Plan”, increased investment in environmental protection, further reduced emissions of nitrogen oxides, sulfur dioxide, carbon dioxide, volatile organic compounds, etc., and improved the capacity for recycling and coordinated disposal of resources. The environmental protection facilities, such as Glass Furnace Smoke Gas Dust Removal, Desulfurization and Denitration Project (《玻璃窰爐煙氣除塵脫硫脫硝項目》) of Bengbu CNBM Information Display, Off-peak Energy Storage and VOCs Treatment Project (《錯 峰 儲 能 及VOCs治 理 項 目》) of Hefei New Energy, and Ultra-low Emission Transformation Project (《超低排放改造工程項目》) of Longhai Glass, were successively completed the construction and put into normal operation. In 2020, the total investment for energy conservation and emission reduction of the Company amounted to approximately RMB43.98 million, contributing to an improved effect of energy conservation and emission reduction. The electronic glass and photovoltaic glass unit products all experienced different degrees of year-on-year decreases in comprehensive energy consumption.

– 35 –
The principal operations during the reporting period
During the reporting period, the Company’s operating revenue amounted to RMB3,045,614,913.68, representing a year-on-year increase of RMB1,190,772,705.59; operating profit amounted to RMB461,918,784.89, representing a year-on-year increase of RMB391,530,225.26; net profit attributable to the shareholders of the Company amounted to RMB327,361,858.49, representing a year-on-year increase of RMB273,361,974.78; and basic earnings per share attributable to shareholders of the Company amounted to RMB0.59. Gearing ratio was 67.97%, representing a decrease of 5.05 percentage points from 2019.
(I) Analysis of principal operating activities
1. Analytical statement of changes in relevant items in the income statement and cash flow statement
Unit: Yuan Currency: RMB
ItemAmount for
current period
Amount for the same period
last year Change(%)
Operating revenue 3,045,614,913.68 1,854,842,208.09 64.20Operating costs 2,101,640,760.29 1,404,274,867.15 49.66Taxes and surcharges 34,534,420.73 25,687,293.69 34.44Selling expenses 87,183,559.33 65,890,259.11 32.32Administrative expenses 126,659,281.04 112,889,849.73 12.20Research and development expenses 120,749,370.37 66,823,935.81 80.70Financial expenses 116,609,687.62 97,929,142.26 19.08Investment income -14,203,232.10 -8,939,588.06 58.88Impairment losses on credit -4,049,377.16 -27,639,136.97 -85.35Impairment losses on assets -3,095,566.51 -8,087,991.61 -61.73Gains on disposal of assets -259,318.91 11,355,077.66 -102.28Non-operating income 2,713,060.43 18,408,314.15 -85.26Income tax expenses 71,829,608.42 18,203,965.20 294.58Net cash flow from operating activities 354,080,797.78 22,491,988.77 1,474.25Net cash flow from investment activities -230,996,127.29 -265,869,190.41 -13.12Net cash flow from financing activities -130,726,176.51 231,443,719.91 -156.48
Reasons for change in operating revenue: an increase in revenue as a result of the increase in sales and prices during the reporting period;
Reasons for change in operating costs: an increase in operating costs as a result of the increase in sales of glass during the reporting period;

– 36 –
Reasons for change in taxes and surcharges: an increase in value-added taxes and relevant additional taxes as a result of the increase of revenue during the reporting period;
Reasons for change in selling expenses: the increase in transportation costs as a result of the increase in sales of glass during the reporting period;
Reasons for change in administrative expenses: an increase of expenses as a result of the suspension of production of Longmen Glass during the reporting period;
Reasons for change in research and development expenses: the increase in research and development expenditures during the reporting period;
Reasons for change in financial expenses: a decrease in financial expenses capitalised as a result of new projects have been transferred to fixed assets and commenced operations during the reporting period;
Reasons for change in investment income: loss from de-recognition of accounts receivable financing increased during the reporting period;
Reasons for impairment losses on credit: the expected impairment on credit decreased during the reporting period;
Reasons for change of impairment losses on assets: provision for impairment on assets decreased during the reporting period;
Reasons for change in gains on disposal of assets: disposal of assets decreased during the reporting period;
Reasons for change in non-operating income: government grant included in non-operating income decreased year-on-year during the reporting period;
Reasons for change in income tax expenses: taxable profits increased year-on-year during the reporting period;
Reasons for change in net cash flow from operating activities: cash received from sale of goods or rendering of services increased year-on-year during the reporting period;
Reasons for change in net cash flow from investment activities: cash investment cost in fixed assets decreased year-on-year during the reporting period;

– 37 –
Reasons for change in net cash flow from financing activities: net amount of financing decreased year-on-year during the reporting period.
2. Analysis of revenue and costs
During the reporting period, the Company recorded operating revenue of RMB3,045,614,900, representing an increase of 64.20% as compared with that of the same period of last year. The operating cost amounted to RMB2,101,640,800, representing an increase of 49.66% as compared with that of the same period of last year, mainly due to the increased sales volume and product price resulting from the recovery in photovoltaic glass market in 2020.
(1) Principal operations by industry, by product and by region
Unit: Yuan Currency: RMB
Principal operations by industry
By industryOperating
revenueOperating
costs
Gross profit
margin
Increase/decrease of operating
revenue as compared
with last year
Increase/decrease of operating
costs as compared
with last year
Increase/decrease of gross profit margin as compared
with last year
(%) (%) (%) (%)
New materials 3,011,793,501.29 2,076,427,457.88 31.06 67.30 51.86 Increased by 7.01
percentage points
Principal operations by product
By productOperating
revenueOperating
costs
Gross profit
margin
Increase/decrease of operating
revenue as compared
with last year
Increase/decrease of operating
costs as compared
with last year
Increase/decrease of
gross profit margin as compared
with last year
(%) (%) (%) (%)
Information display glass 397,141,767.24 311,133,523.06 21.66 52.74 51.24 Increasedby 0.78
percentage points
New energy glass
2,558,869,152.90 1,718,067,374.80 32.86 66.13 47.91 Increased by 8.28
percentage points
Other functional glass 55,782,581.15 47,226,560.02 15.34
– 38 –
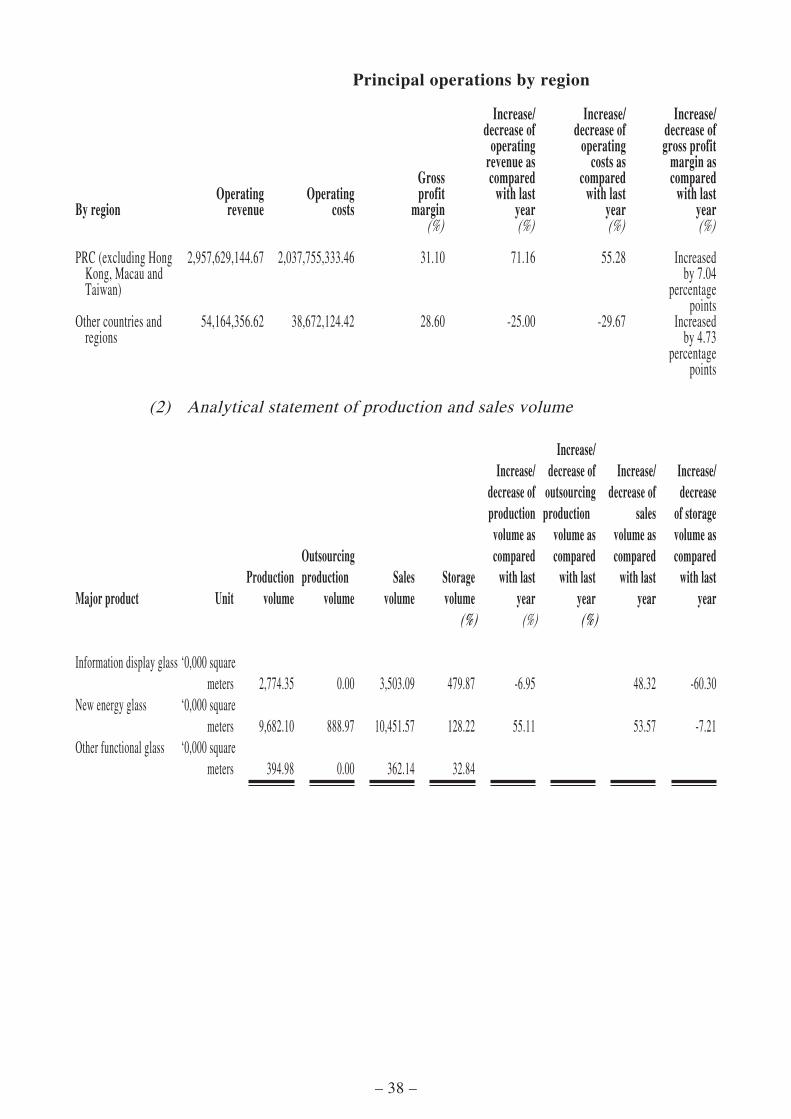
Principal operations by region
By regionOperating
revenueOperating
costs
Gross profit
margin
Increase/decrease of operating
revenue as compared
with last year
Increase/decrease of operating
costs as compared
with last year
Increase/decrease of gross profit
margin as compared
with last year
(%) (%) (%) (%)
PRC (excluding Hong Kong, Macau and Taiwan)
2,957,629,144.67 2,037,755,333.46 31.10 71.16 55.28 Increased by 7.04
percentage points
Other countries and regions
54,164,356.62 38,672,124.42 28.60 -25.00 -29.67 Increased by 4.73
percentage points
(2) Analytical statement of production and sales volume
Major product UnitProduction
volume
Outsourcing production
volumeSales
volumeStoragevolume
Increase/decrease ofproductionvolume ascompared
with lastyear
Increase/decrease of
outsourcing production
volume ascompared
with lastyear
Increase/decrease of
salesvolume ascompared
with lastyear
Increase/decrease
of storagevolume ascompared
with lastyear
(%) (%) (%)
Information display glass ‘0,000 square meters 2,774.35 0.00 3,503.09 479.87 -6.95 48.32 -60.30
New energy glass ‘0,000 square meters 9,682.10 888.97 10,451.57 128.22 55.11 53.57 -7.21
Other functional glass ‘0,000 square meters 394.98 0.00 362.14 32.84

– 39 –
(3) Analytical statement of costs
Unit: Yuan Currency: RMB
By industry
By industryComponentof cost
Amount forcurrent period
Percentageover total cost
for the currentperiod
Amount forthe same period
last year
Percentageover total cost
for the sameperiod last year
Percentage ofchanges in amount
for the currentperiod over the
same period last year Explanation
(%) (%) (%)
New materials – self-produced
Direct materials 1,486,073,474.87 85.92 1,200,943,679.75 87.83 23.74
Direct labour 96,536,359.88 5.58 70,354,302.73 5.15 37.21Manufacturing expenses 147,019,619.67 8.50 96,009,654.17 7.02 53.13
New materials – outsourcing
Material costs 346,798,003.46 100.00
By product
By productComponentof cost
Amount forcurrent period
Percentageover total cost
for the currentperiod
Amount forthe same period
last year
Percentageover total cost
for the sameperiod last year
Percentage ofchanges in amount
for the current period over the
same periodlast year Explanation
(%) (%) (%)Information display glassDirect materials 201,272,685.59 64.69 146,278,955.19 71.11 37.60
Direct labour 35,134,221.94 11.29 21,069,369.67 10.24 66.75Manufacturing expenses 74,726,615.53 24.02 38,367,235.20 18.65 94.77
New energy glass – self-produced
Direct materials 1,248,011,299.02 91.01 1,054,664,724.46 90.80 18.33
Direct labour 58,521,317.78 4.27 49,284,933.06 4.24 18.74Manufacturing expenses 64,736,754.54 4.72 57,642,418.97 4.96 12.31
New energy glass – outsourcing
Material costs 346,798,003.46 100.00
Other functional glass Direct materials 36,789,490.26 77.90Direct labour 2,880,820.16 6.10Manufacturing expenses 7,556,249.60 16.00
(4) Major sales to customers and major suppliers
The total sales to the top five customers amounted to RMB2,170,708,500, representing 71.27% of the total annual sales, of which sales to the related party of the top five customers amounted to RMB189,214,100, representing 6.21% of the total annual sales.

– 40 –
The largest customer accounted for 19.06% of the Group’s annual sales, and the largest customer is an independent third party.
The purchase amount of top five suppliers is RMB659,605,000, representing 34.36% of total purchase amount of the year, of which the amount purchased from the related parties was RMB224,589,000, representing 11.69% of total purchase amount of the year.
The largest supplier accounted for 11.69% of the Group’s total annual procurement, and the largest supplier is a related party of the Company.
3. Expenses
Unit: Yuan Currency: RMB
Item 2020 2019 Changes Reasons of changes(%)
Selling expenses 87,183,559.33 65,890,259.11 32.32 the corresponding increase in transportation costs as a result of the increase in glass sales volume during the reporting period
Administration expenses
126,659,281.04 112,889,849.73 12.20 an increase of expenses as a result of the suspension of production of Longmen Glass
R&D expenses 120,749,370.37 66,823,935.81 80.70 the increase in R&D expenditure during the reporting period
Finance expenses 116,609,687.62 97,929,142.26 19.08 a decrease in financial expenses capitalised as a result of new projects have been transferred to fixed assets and commenced operations
Income tax expenses
71,829,608.42 18,203,965.20 294.58 the year-on-year increase in taxable profits during the reporting period

– 41 –
4. R&D expenditures
Unit: Yuan Currency: RMB
Expensed R&D expenditure in current period 117,463,602.41Capitalized R&D expenditure in current period 17,350,627.25Total of R&D expenditure 134,814,229.66Percentage of total R&D expenditure to operating
revenue (%) 4.43Number of the Company’s R&D staff 332Percentage of R&D staff number to the Company’s
total number of employees (%) 12.57Proportion of capitalization of R&D investment (%) 12.87
5. Cash flow
(1) The net cash f low from operat ing act ivi t ies amounted to RMB354,080,800, representing an increase of RMB331,588,800 as compared with RMB22,492,000 for the same period last year, mainly due to increase in cash received from sale of goods or rendering of services during the reporting period.
(2) The net cash outflow from investing activities amounted to RMB230,996,100 representing a decrease of RMB34,873,100 over that of RMB265,869,200 for the same period last year, mainly due to the year-on-year decrease in cash investment cost in fixed assets during the reporting period.
(3) The net cash outflow from financing activities amounted to RMB130,726,200, representing an increase of RMB362,169,900 over RMB231,443,700 in the net inflow for the same period last year, mainly due to the year-on-year decrease on net amount of financing during the reporting period.
(II) Explanation on significant change of profit caused by non-core business
N/A.

– 42 –
(III) Analysis of assets and liabilities
Unit: Yuan Currency: RMB
Item
Closing balance of current
period
Percentage of closing
balance of current
period over the total
assetsClosing balance
of last period
Percentage of closing
balance of last period
over the total assets
Percentage of changes in closing
balance of current
period over the closing balance of
previous period
(%) (%) (%)
Bank balance and cash 300,948,343.56 5.37 432,871,497.66 8.26 -30.48Notes receivable 102,441,393.68 1.83 198,553,190.06 3.79 -48.41Accounts receivable financing 448,697,313.21 8.01 162,706,438.58 3.10 175.77Prepayments 142,259,523.11 2.54 59,807,534.23 1.14 137.86Other receivables 17,023,855.78 0.30 37,905,213.08 0.72 -55.09Other current assets 55,139,885.94 0.98 83,085,172.69 1.59 -33.63Fixed assets 3,068,216,734.33 54.74 2,343,435,561.00 44.71 30.93Construction in progress 54,472,785.67 0.97 603,637,921.26 11.52 -90.98Development expenditure 14,096,615.36 0.25 3,073,758.34 0.06 358.61Other non-current assets 33,523,206.41 0.60 3,671,639.24 0.07 813.03Accounts payable 428,756,037.46 7.65 675,397,180.53 12.89 -36.52Contract liabilities 38,214,732.27 0.68 15,654,739.42 0.30 144.11Taxes payable 116,355,071.70 2.08 36,694,248.37 0.70 217.09
Other payables 764,011,526.81 13.63 356,002,972.21 6.79 114.61
Non-current liabilities due within one year 137,330,815.42 2.45 214,668,497.03 4.10 -36.03
Other current liabilities 4,888,222.00 0.09 1,834,742.27 0.04 166.43
Analysis on industry operating information
Information display glass segment:
As the major products, the ultra-thin glass substrates for information display glasses belong to key basic materials in the upstream of information industry, which are in line with the requirements of the industrial policies and technical improvement. China strengthened the new infrastructure construct ion, promoted the construct ion of ar t i f ic ial intel l igence, industrial internet, and the Internet of Things, and accelerated the pace of 5G commercialization, which will boost the electronic information manufacturing industry into a new development stage, and further promote the high-end development of related industries. It is expected that the market demand for ultra-thin glass substrate with high quality and high performance will increase at a steady pace.

– 43 –
According to statistics released by the Ministry of Industry and Information Technology of the People’s Republic of China, in 2020, the added value of the electronic information manufacturing industry above designated size increased by 7.7% year-on-year, and the growth rate dropped by 1.6 percentage points as compared with that of the same period of last year. In 2020, the export delivery value of electronic information manufacturing industry above designated size increased by 6.4% year-on-year, and the growth rate increased by 4.7 percentage points year-on-year.
New energy glass segment:
This business segment mainly produces photovoltaic original glass for its end-users, namely photovoltaic power stations. The renewable energy represented by solar energy is regarded as an important component of low-carbon economy of China in the future. Currently, the photovoltaic industry in China ranks the top in terms of the manufacturing scale, the industrialization technology level, expansion of application market, industrial system construction and other aspects around the world. The constant growth in photovoltaic industry will bring sound profitability for photovoltaic glass business as expected in the medium and long run.
On 12 December 2020, at the Climate Ambition Summit, President Xi Jinping announced that by 2030, China’s non-fossil energy will account for around 25% of primary energy consumption, and the total installed capacity of wind power and solar power will reach over 1.2 billion kW. Under the goal of “carbon peak, carbon neutral”, during the “14th Five-Year” period, China’s photovoltaic market will see a peek of marketization construction.
According to the statistics issued by the International Energy Agency (IEA), though the global power demand decreased by 2% in 2020, the renewable energy and photovoltaic power generation rose by 7% and 20%, respectively. With the global economic recovery, it is expected that the global power demand in 2021 will increase by 3% and the installed capacity of renewable energy will increase by 10% as compared to that of 2020. According to the estimation of China Photovoltaic Industry Association, the global photovoltaic market scale in 2021 will speed up its expansion and the total installed capacity will reach 150-170GW, achieving a record high.
The year of 2021 is the starting year of “14th Five-Year” plan, and is also a critical year for the grid parity of the photovoltaic power generation. The domestic photovoltaic application market is expected to constantly maintain its rapid growth momentum, and the additional installed capacity is expected to reach 55-65GW.

– 44 –
Analysis of major controlled and investee companies
Unit: Yuan Currency: RMB
Company name IndustryMajor products or services
Registered capital Total assets Net assets Net profit
CLFG Longmen Glass Co., Ltd.
New materials Information display glass
70,000,000 87,044,589.98 -501,829,201.49 -16,256,395.62
CLFG Longhai Electronic Glass Co., Ltd.
New materials Information display glass
100,000,000 499,922,962.15 138,573,037.01 479,361.86
Bengbu CNBM Information Display Materials Co., Ltd.
New materials Information display glass
632,764,300 848,882,553.53 772,920,821.54 25,578,885.17
CNBM (Puyang) Photoelectric Material Co., Ltd.
New materials New energy glass 240,000,000 742,276,550.97 247,203,582.97 7,972,218.52
CNBM (Hefei) New Energy Co., Ltd.
New materials New energy glass 268,000,000 1,338,160,524.37 498,453,598.91 125,800,537.18
CNBM (Tongcheng) New Energy Materials Co., Ltd.
New materials New energy glass 133,388,980 773,906,312.92 337,662,812.85 88,467,991.38
CNBM (Yixing) New Energy Resources Co., Ltd
New materials New energy glass 313,700,000 1,470,054,340.05 581,535,348.58 219,452,051.94
Operating Plan
In 2021, guided by the high-quality Party building, the Company will coordinate the pandemic prevention and control with the production and operation, promote the operation with the focus of “development”, and perform well in six operation measures of “pursuing development, intensifying financing, focusing on innovation, stabilizing prices, reducing cost and inventory control”, so as to push forward the high-quality development of the Company to a new level and realize the improvement of both size and efficiency of the Company. The Company will strive to achieve an annual output of not less than 169 million square metres and the operating revenue of more than RMB3.3 billion.
1. Further strengthening the Party building to lead high-quality development with high-quality Party building
The Company will always give priority to the building of politics of the Party, strengthen the basic work of Party building, integrate the work of the Party building with the production and operation of the Company, and lead high quality development with high quality Party building.

– 45 –
2. Ensuring the proper implementation of all operation measures
(1) Pursing development for improving and expanding the principal business of new energy. The Company will adhere to the new development concept, accelerate the merger and acquisition integration of enterprises and the construction of new projects to strengthen the scale of the principal business of new energy and boost the development potential.
(2) Intensifying financing for supporting the development and growth of the Company. The Company will conduct the financing activities through multiple channels to reduce the financing costs and secure the development funds of the Company.
(3) Focus ing on innova t ion fo r advanc ing the h igh-qua l i ty development of the Company. The Company will pay attention to the technology innovation, model innovation, platform innovation. It will increase investment in R&D and strive to invest no less than 5% of the revenue in R&D for the year.
(4) Stabilizing prices and laying a solid results foundation. Through the improvement of product quality and services, the Company is enabled to deliver sales and service with quality for the purpose of achieving high quality and preferential prices.
(5) Reducing cost, always on the move. The Company will continue to carry out innovative and project establishment activities for cost reduction and efficiency improvement and rely on innovation to reduce cost, so as to optimize the indicator benchmarking system of “six rates”, carry out benchmarking activities and reduce the cost by expanding the centralized purchase.
(6) Inventory control for improving the quality of asset operation. The Company will implement the reduction of “Two Funds and Four Accounts” well and lower the gearing ratio.
3. Intensifying risk management and control and fulfilling the responsibility commitment
The Company will pay close attention to the work of “abolishing, amending and establishing system” for intensifying the construction of risk control system and effectively controlling the risks points. The Company will strictly implement the safety responsibility system to eliminate all kinds of material safety accidents. It will improve the energy conservation and emission reduction facilities and fulfill the social responsibility commitment to eliminate the risks in relation to environmental protection.

– 46 –
4. Improving the internal incentive mechanism and strengthening the team building to improve the vibrancy and efficiency of enterprise development
The Company will improve the performance assessment mechanism and enhance the positive incentives, allowing the employees to enjoy the development achievements of enterprises and motivate their enthusiasm. It will improve the talent growth mechanism and implement the appointment system and appointment period system for cadres, which will enable them to get promotion or demotion. The Company will put into effect the implementation plan for the cultivation and development of reserve cadres, providing a growth platform for young talents with both integrity and capability. The Company will consolidate three lines of talent growth and perfect the growth mechanism for professional talents, offering all kinds of talents the growth channels.
IV. CAPITAL LIQUIDITY AND FINANCIAL RESOURCES
Capital liquidity
As at 31 December 2020, the Group’s liquidity ratio was 0.62 (31 December 2019: 0.57) and quick ratio was 0.48 (31 December 2019: 0.44). The turnover rate of accounts receivable for the year was 5.02 times (31 December 2019: 3.41 times); and the turnover rate of inventory was 7.70 times (31 December 2019: 5.19 times).
Financial resources
As at 31 December 2020, the Group’s cash and cash equivalents amounted to RMB139,231,301.82, including 85.37% denominated in RMB and 14.63% denominated in US$ and other foreign currencies.
As at 31 December 2020, the Group’s bank loans amounted to RMB1,838,708,810.98 (31 December 2019: RMB2,000,461,443.43), including short-term loans amounting to RMB1,177,314,071.56 (31 December 2019: RMB1,240,054,086.26) and long-term loans amounting to RMB661,394,739.42 (31 December 2019: RMB760,407,357.17).
V. CAPITAL STRUCTURE
As at 31 December 2020, the Group’s current liabilities amounted to RMB3,171,583,019.32 (31 December 2019: RMB3,176,527,786.58), representing a decrease of 0.16% from 2019; non-current liabilities amounted to RMB637,711,165.41 (31 December 2019: RMB650,569,574.58), representing a decrease of 1.98% from 2019; and equity attributable to shareholders of the Company amounted to RMB1,626,578,221.81 (31 December 2019: RMB1,299,216,365.32), representing an increase of 25.20% from 2019.
– 47 –
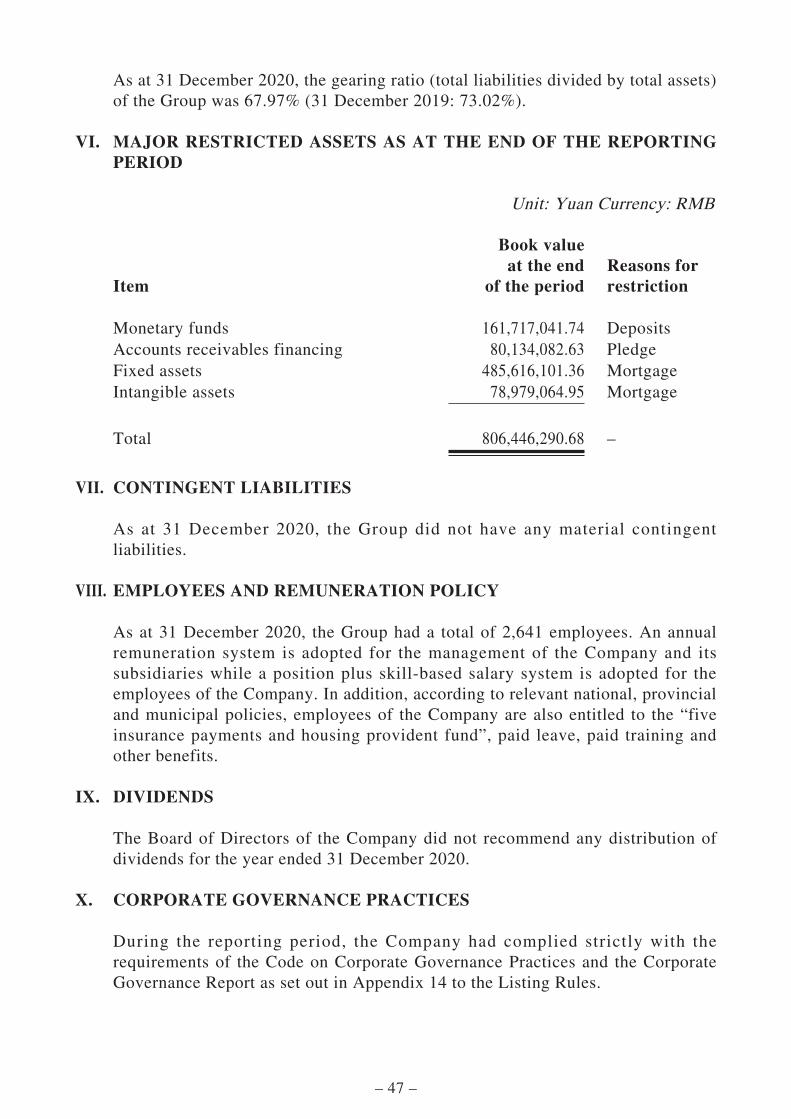
As at 31 December 2020, the gearing ratio (total liabilities divided by total assets) of the Group was 67.97% (31 December 2019: 73.02%).
VI. MAJOR RESTRICTED ASSETS AS AT THE END OF THE REPORTING PERIOD
Unit: Yuan Currency: RMB
Item
Book value at the end
of the periodReasons for restriction
Monetary funds 161,717,041.74 DepositsAccounts receivables financing 80,134,082.63 PledgeFixed assets 485,616,101.36 MortgageIntangible assets 78,979,064.95 Mortgage
Total 806,446,290.68 –
VII. CONTINGENT LIABILITIES
As at 31 December 2020, the Group did not have any material contingent liabilities.
VIII. EMPLOYEES AND REMUNERATION POLICY
As at 31 December 2020, the Group had a total of 2,641 employees. An annual remuneration system is adopted for the management of the Company and its subsidiaries while a position plus skill-based salary system is adopted for the employees of the Company. In addition, according to relevant national, provincial and municipal policies, employees of the Company are also entitled to the “five insurance payments and housing provident fund”, paid leave, paid training and other benefits.
IX. DIVIDENDS
The Board of Directors of the Company did not recommend any distribution of dividends for the year ended 31 December 2020.
X. CORPORATE GOVERNANCE PRACTICES
During the reporting period, the Company had complied strictly with the requirements of the Code on Corporate Governance Practices and the Corporate Governance Report as set out in Appendix 14 to the Listing Rules.

– 48 –
XI. SECURITIES TRANSACTIONS BY DIRECTORS
The Company has adopted the Model Code for Securities Transactions by Directors of Listed Issuers in Appendix 10 to the Listing Rules of the Stock Exchange as its own code of conduct regarding securities transactions by the Directors. During the reporting period, all the Directors of the Company had strictly complied with the code of conduct in relation to the securities transactions by the Directors under the Model Code for Securities Transactions by Directors of Listed Issuers in Appendix 10 to the Listing Rules of the Stock Exchange.
XII. AUDIT COMMITTEE
The audit committee of the Board of the Company has reviewed the audited annual results for the year ended 31 December 2020 and the 2020 annual report.
XIII. PURCHASE, SALE OR REDEMPTION OF LISTED SECURITIES OF THE COMPANY
As approved and authorized by the general meeting, in November 2020, the Company completed matters in relation to the repurchase and cancellation of 3,856,077 A shares in total as the performance compensation shares for the year of 2019 under the significant asset restructuring. The total share capital of the Company was changed to 548,540,432 shares from 552,396,509 shares accordingly.
XIV. CONTINUOUS CONNECTED TRANSACTIONS IN 2020
In 2020, the continuous connected transactions of the Group amounted to RMB3,464.80 million, and the considered and approved annual upper limit amounted to RMB4,656.33 million. The continuous connected transactions did not exceed the disclosed annual upper limit.
All continuous connected transactions of the Group are inseparable from the Group’s daily operations, and are subject to the general commercial terms and conditions, or the transaction clauses are not inferior to the terms and conditions available to or provided by the independent third parties. The transaction price is fair and reasonable, and in the interests of the shareholders of the Company as a whole.
The Company’s continuous connected transaction projects in 2020 have passed the corresponding review and approval procedures according to the relevant listing regulations of Stock Exchange of Hong Kong Limited and SSE, and the actual total transaction volumes have not exceeded the approved upper limit. The Company’s independent auditor has reviewed the relevant continuous connected transactions and has issued the audit report of the projects. The Company’s independent directors have also reviewed and confirmed the continuous connected transactions in 2020.

– 49 –
XV. AUDITED ANNUAL RESULTS ANNOUNCEMENT AND ANNUAL REPORT
The data contained in the annual results announcement of the Company for the year ended 31 December 2020 has been agreed by PKF Daxin Certified Public Accountants LLP, the auditor of Company, and is consistent with the data of the Company’s 2020 annual report. The 2020 annual report will be dispatched to the shareholders and published on Stock Exchange by the Company in due course.
By order of the BoardLuoyang Glass Company Limited*
Zhang ChongChairman
Luoyang, China30 March 2021
As at the date of this announcement, the Board comprises five executive Directors: Mr. Zhang Chong, Mr. Xie Jun, Mr. Ma Yan, Mr. Wang Guoqiang and Mr. Zhang Rong; two non-executive Directors: Mr. Ren Hongcan and Mr. Chen Yong; and four independent non-executive Directors: Mr. Jin Zhanping, Mr. Ye Shuhua, Mr. He Baofeng and Ms. Zhang Yajuan.
* For identification purposes only