TELEFÓNICA, S.A.
305
As filed with the Securities and Exchange Commission on March 29, 2012 UNITED STATES SECURITIES AND EXCHANGE COMMISSION WASHINGTON, D.C. 20549 FORM 20-F Commission file number: 001-09531 TELEFÓNICA, S.A. (Exact name of Registrant as specified in its charter) KINGDOM OF SPAIN (Jurisdiction of incorporation or organization) Distrito Telefónica, Ronda de la Comunicación, s/n 28050 Madrid, Spain (Address of principal executive offices) Consuelo Barbe Capdevila, Securities Market and Corporate Governace Legal Department Distrito Telefónica, Ronda de la Comunicación, s/n, 28050 Madrid, Spain Tel. +34 91 482 3733, Fax. +34 91 482 3768, e-mail: [email protected] María García-Legaz Ponce, Head of Investor Relations, Distrito Telefónica, Ronda de la Comunicación, s/n, 28050 Madrid, Spain Tel. +34 91 482 8700, Fax. +34 91 482 8600, e-mail: [email protected] (Name, Telephone, E-Mail and/or Facsimile number and Address of Company Contact Person) Securities registered or to be registered pursuant to Section 12(b) of the Act: (Mark One) REGISTRATION STATEMENT PURSUANT TO SECTION 12(b) OR (g) OF THE SECURITIES EXCHANGE ACT OF 1934 OR ANNUAL REPORT PURSUANT TO SECTION 13 OR 15(d) OF THE SECURITIES EXCHANGE ACT OF 1934 For the fiscal year ended December 31, 2011 OR TRANSITION REPORT PURSUANT TO SECTION 13 OR 15(d) OF THE SECURITIES EXCHANGE ACT OF 1934 For the transition period from _____ to _____ OR SHELL COMPANY REPORT PURSUANT TO SECTION 13 OR 15(d) OF THE SECURITIES EXCHANGE ACT OF 1934 Title of each class Name of each exchange on which registered Ordinary Shares, nominal value €1.00 per share* American Depositary Shares, each representing one Ordinary Share New York Stock Exchange New York Stock Exchange Guarantees** by Telefónica, S.A. of the $750,000,000 Fixed Rate Guaranteed Senior Notes Due 2013; $850,000,000 Floating Rate Guaranteed Senior Notes Due 2013; $1,200,000,000 Fixed Rate Guaranteed Senior Notes Due 2013; $1,250,000,000 Fixed Rate Notes Due 2015; $900,000,000 Fixed Rate Guaranteed Senior Notes Due 2015; $1,250,000,000 Fixed Rate Guaranteed Senior Notes Due 2016; $1,250,000,000 Fixed Rate Guaranteed Senior Notes Due 2016; $700,000,000 Fixed Rate Guaranteed Senior Notes Due 2017; $1,000,000,000 Fixed Rate Notes Due 2019; $1,400,000,000 Fixed Rate Guaranteed Senior Notes Due 2020; $1,500,000,000 Fixed Rate Guaranteed Senior Notes Due 2021; $2,000,000,000 Fixed Rate Guaranteed Senior Notes Due 2036; each of Telefónica Emisiones, S.A.U. New York Stock Exchange * Not for trading, but only in connection with the listing of American Depositary Shares, pursuant to the requirements of the New York Stock Exchange. ** Not for trading, but only in connection with the listing of the $750,000,000 Fixed Rate Guaranteed Senior Notes Due 2013; $850,000,000 Floating Rate Guaranteed Senior Notes Due 2013; $1,200,000,000 Fixed Rate Guaranteed Senior Notes Due 2013; $1,250,000,000 Fixed Rate Notes Due 2015; $900,000,000 Fixed Rate Guaranteed Senior Notes Due 2015; $1,250,000,000 Fixed Rate Guaranteed Senior Notes Due 2016; $1,250,000,000 Fixed Rate Guaranteed Senior Notes Due 2016; $700,000,000 Fixed Rate Guaranteed Senior Notes Due 2017; $1,000,000,000 Fixed Rate Notes Due 2019; ; $1,400,000,000 Fixed Rate Guaranteed Senior Notes Due 2020; $1,500,000,000 Fixed Rate Guaranteed Senior Notes Due 2021; $2,000,000,000 Fixed Rate Guaranteed Senior Notes Due 2036; each of Telefónica Emisiones, S.A.U. (a wholly-owned subsidiary of Telefónica, S.A.)
-
Upload
khangminh22 -
Category
Documents
-
view
0 -
download
0
Transcript of TELEFÓNICA, S.A.

As filed with the Securities and Exchange Commission on March 29, 2012
UNITED STATES
SECURITIES AND EXCHANGE COMMISSION WASHINGTON, D.C. 20549
FORM 20-F
Commission file number: 001-09531
TELEFÓNICA, S.A. (Exact name of Registrant as specified in its charter)
KINGDOM OF SPAIN (Jurisdiction of incorporation or organization)
Distrito Telefónica, Ronda de la Comunicación, s/n
28050 Madrid, Spain (Address of principal executive offices)
Consuelo Barbe Capdevila, Securities Market and Corporate Governace Legal Department
Distrito Telefónica, Ronda de la Comunicación, s/n, 28050 Madrid, Spain Tel. +34 91 482 3733, Fax. +34 91 482 3768, e-mail: [email protected]
María García-Legaz Ponce, Head of Investor Relations,
Distrito Telefónica, Ronda de la Comunicación, s/n, 28050 Madrid, Spain Tel. +34 91 482 8700, Fax. +34 91 482 8600, e-mail: [email protected]
(Name, Telephone, E-Mail and/or Facsimile number and Address of Company Contact Person)
Securities registered or to be registered pursuant to Section 12(b) of the Act:
(Mark One)
REGISTRATION STATEMENT PURSUANT TO SECTION 12(b) OR (g) OF THE SECURITIES EXCHANGE ACT OF 1934
OR ANNUAL REPORT PURSUANT TO SECTION 13 OR 15(d)
OF THE SECURITIES EXCHANGE ACT OF 1934 For the fiscal year ended December 31, 2011
OR TRANSITION REPORT PURSUANT TO SECTION 13 OR 15(d)
OF THE SECURITIES EXCHANGE ACT OF 1934 For the transition period from _____ to _____
OR SHELL COMPANY REPORT PURSUANT TO SECTION 13 OR 15(d)
OF THE SECURITIES EXCHANGE ACT OF 1934
Title of each class
Name of each exchange on which registered
Ordinary Shares, nominal value €1.00 per share*American Depositary Shares, each representing one
Ordinary Share
New York Stock ExchangeNew York Stock Exchange
Guarantees** by Telefónica, S.A. of the $750,000,000 Fixed Rate Guaranteed Senior Notes Due 2013; $850,000,000 Floating Rate Guaranteed Senior Notes Due 2013; $1,200,000,000 Fixed Rate Guaranteed Senior Notes Due 2013; $1,250,000,000 Fixed Rate Notes Due 2015; $900,000,000 Fixed Rate Guaranteed Senior Notes Due 2015; $1,250,000,000 Fixed Rate Guaranteed Senior Notes Due 2016; $1,250,000,000 Fixed Rate Guaranteed Senior Notes Due 2016; $700,000,000 Fixed Rate Guaranteed Senior Notes Due 2017; $1,000,000,000 Fixed Rate Notes Due 2019; $1,400,000,000 Fixed Rate Guaranteed Senior Notes Due 2020; $1,500,000,000 Fixed Rate Guaranteed Senior Notes Due 2021; $2,000,000,000 Fixed Rate Guaranteed Senior Notes Due 2036; each of Telefónica Emisiones, S.A.U.
New York Stock Exchange
* Not for trading, but only in connection with the listing of American Depositary Shares, pursuant to the requirements of the New York Stock Exchange.
** Not for trading, but only in connection with the listing of the $750,000,000 Fixed Rate Guaranteed Senior Notes Due 2013; $850,000,000 Floating Rate Guaranteed Senior Notes Due 2013; $1,200,000,000 Fixed Rate Guaranteed Senior Notes Due 2013; $1,250,000,000 Fixed Rate Notes Due 2015; $900,000,000 Fixed Rate Guaranteed Senior Notes Due 2015; $1,250,000,000 Fixed Rate Guaranteed Senior Notes Due 2016; $1,250,000,000 Fixed Rate Guaranteed Senior Notes Due 2016; $700,000,000 Fixed Rate Guaranteed Senior Notes Due 2017; $1,000,000,000 Fixed Rate Notes Due 2019; ; $1,400,000,000 Fixed Rate Guaranteed Senior Notes Due 2020; $1,500,000,000 Fixed Rate Guaranteed Senior Notes Due 2021; $2,000,000,000 Fixed Rate Guaranteed Senior Notes Due 2036; each of Telefónica Emisiones, S.A.U. (a wholly-owned subsidiary of Telefónica, S.A.)

Securities registered or to be registered pursuant to Section 12(g) of the Act: None
Securities for which there is a reporting obligation pursuant to Section 15(d) of the Act: None
The number of outstanding shares of each class of capital stock of Telefónica, S.A. at December 31, 2011 was:
Ordinary Shares, nominal value €1.00 per share: 4,563,996,485
Indicate by check mark if the registrant is a well-known seasoned issuer, as defined in Rule 405 of the Securities Act.
Yes No
If this report is an annual or transition report, indicate by check mark if the registrant is not required to file reports pursuant to Section 13 or 15(d) of the Securities Exchange Act of 1934.
Yes No Indicate by check mark whether the registrant (1) has filed all reports required to be filed by Section 13 or 15(d) of the Securities Exchange Act of 1934 during the preceding 12 months (or for such shorter period
that the registrant was required to file such reports) and (2) has been subject to such filing requirements for the past 90 days.
Yes No
Indicate by check mark whether the registrant has submitted electronically and posted on its corporate Web site, if any, every Interactive Data File required to be submitted and posted pursuant to Rule 405 of Regulation S-T (Section 232.405 of this chapter) during the preceding 12 months (or for such shorter period that the registrant was required to submit and post such files).
Yes No
Indicate by check mark whether the registrant is a large accelerated filer, an accelerated filer, or a non-accelerated filer. See definition of “accelerated filer” and “large accelerated filer” in Rule 12b-2 of the
Exchange Act.
Large accelerated filer Accelerated filer Non-accelerated filer
Indicate by check mark which basis of accounting the registrant has used to prepare the financial statements included in this filing:
U.S. GAAP International Financial Reporting Standards as Issued by the international Accounting Standards Board Other
If “Other” has been checked in response to the previous question, indicate by check mark which financial statement item the registrant has elected to follow.
Item 17 Item 18
If this is an annual report indicate by check mark whether the registrant is a shell company (as defined in Rule 12b-2 of the Exchange Act).
Yes No

TABLE OF CONTENTS
Cautionary Statement Regarding Forward-Looking Statements 1Certain Terms and Conventions 3Presentation of Certain Financial Information 6Part I 7Item 1. Identity of Directors, Senior Management and Advisors 7
A. Directors and Senior Management 7B. Advisers 7C. Auditors 7
Item 2. Offer Statistics and Expected Timetable 7Item 3. Key Information 7
A. Selected Financial Data 7B. Capitalization and Indebtedness 9C. Reasons for the Offer and Use of Proceeds 9D. Risk Factors 10
Item 4. Information on the Company 14A. History and Development of the Company 14B. Business Overview 18C. Organizational Structure 72D. Property, Plant and Equipment 72
Item 4A. Unresolved Staff Comments 74Item 5. Operating and Financial Review and Prospects 74
A. Operating Results 74B. Liquidity and Capital Resources 83C. Research and Development, Patents and Licenses, etc. 86D. Trend Information 88E. Off-Balance Sheet Arrangements 89F. Tabular Disclosure of Contractual Obligations 89
Item 6. Directors, Senior Management and Employees 90A. Directors and Senior Management 90B. Compensation 99C. Board Practices 99D. Employees 99E. Share Ownership 99
Item 7. Major Shareholders and Related Party Transactions 100A. Major Shareholders 100B. Related Party Transactions 101C. Interests of Experts and Counsel 101
Item 8. Financial Information 102Item 9. The Offering and Listing 106
A. Offer and Listing Details 106B. Plan of Distribution 110C. Markets 110D. Selling Shareholders 110E. Dilution 110F. Expenses of the Issue 111
Item 10. Additional Information 111A. Share Capital 111B. Memorandum and Articles of Association 111C. Material Contracts 114
i

D. Exchange Controls 117E. Taxation 119F. Dividends and Paying Agents 123G. Statements by Experts 123H. Documents on Display 123I. Subsidiary Information 124
Item 11. Quantitative and Qualitative Disclosures About Market Risk 124Item 12. Description of Securities Other Than Equity Securities 125
D. American Depositary Shares 125Part II 127Item 13. Defaults, Dividend Arrearages and Delinquencies 127Item 14. Material Modifications to the Rights of Security Holders and Use of Proceeds 127Item 15. Controls and Procedures 127Item 16. [Reserved] 127Item 16A. Audit Committee Financial Expert 127Item 16B. Code of Ethics 128Item 16C. Principal Accountant Fees and Services 128Item 16D. Exemptions from the Listing Standards for Audit Committees 128Item 16E. Purchases of Equity Securities by the Issuer and Affiliated Purchasers 128Item 16F. Change in Registrant’s Certifying Accountant 129Item 16G. Corporate Governance 129Part III 132Item 17. Financial Statements 132Item 18. Financial Statements 132Item 19. Exhibits 133
ii

CAUTIONARY STATEMENT REGARDING FORWARD-LOOKING STATEMENTS
This Annual Report contains statements that constitute forward-looking statements within the meaning of Section 27A of the Securities Act of 1933, as amended, Section 21E of the Securities Exchange Act of 1934, as amended, and the safe harbor provisions of the Private Securities Litigation Reform Act of 1995. The forward-looking statements in this Annual Report can be identified, in some instances, by the use of words such as “will,” “expect,” “aim,” “hope,” “anticipate,” “intend,” “believe” and similar language or the negative thereof or by the forward-looking nature of discussions of strategy, plans or intentions. These statements appear in a number of places in this Annual Report including, without limitation, certain statements made in “Item 3. Key Information—Risk Factors,” “Item 4. Information on the Company,” “Item 5. Operating and Financial Review and Prospects” and “Item 11. Quantitative and Qualitative Disclosures About Market Risk” and include statements regarding our intent, belief or current expectations with respect to, among other things:
Such forward-looking statements are not guarantees of future performance and involve numerous risks and uncertainties, and actual results may differ materially from those anticipated in the forward-looking
statements as a result of various factors. The risks and uncertainties involved in our business that could affect the matters referred to in such forward-looking statements include but are not limited to:
• the effect on our results of operations of competition in telecommunications markets;
• trends affecting our financial condition or results of operations;
• acquisitions or investments which we may make in the future;
• our capital expenditures plan;
• our estimated availability of funds;
• our ability to repay debt with estimated future cash flows;
• our shareholder remuneration policies;
• supervision and regulation of the telecommunications sectors where we have significant operations;
• our strategic partnerships; and
• the potential for growth and competition in current and anticipated areas of our business.
• changes in general economic, business or political conditions in the domestic or international markets in which we operate or have material investments that may affect demand for our services;
• changes in currency exchange rates, interest rates or in credit risk in our treasury investments or in some of our financial transactions;
• existing or worsening conditions in the international financial markets;
• the impact of current, pending or future legislation and regulation in countries where we operate, as well as any failure to renew or obtain the necessary licenses, authorizations and concessions to carry out our operations and the impact of limitations in spectrum capacity;
• the actions of existing and potential competitors in each of our markets as well as the potential effects of technological changes;
• failure of suppliers to provide necessary equipment and services on a timely basis;
• the impact of unanticipated network interruptions;
1

Readers are cautioned not to place undue reliance on those forward-looking statements, which speak only as of the date of this Annual Report. We undertake no obligation to release publicly the result of
any revisions to these forward-looking statements which may be made to reflect events or circumstances after the date of this Annual Report including, without limitation, changes in our business or acquisition strategy or planned capital expenditures, or to reflect the occurrence of unanticipated events.
• the effect of reports suggesting that radio frequency emissions cause health problems;
• the impact of impairment charges on our goodwill and assets as a result of changes in the regulatory, business or political environment; and
• the outcome of pending litigation.
2

CERTAIN TERMS AND CONVENTIONS
Our ordinary shares, nominal value €1.00 per share, are currently listed on each of the Madrid, Barcelona, Bilbao and Valencia stock exchanges and are quoted through the Automated Quotation System under the symbol “TEF.” They are also listed on various foreign stock exchanges such as the London and Buenos Aires stock exchanges. American Depositary Shares (“ADSs”), each representing the right to receive one ordinary share, are listed on the New York Stock Exchange and on the Lima Stock Exchange. ADSs are evidenced by American Depositary Receipts (“ADRs”) issued under a Deposit Agreement with Citibank, N.A., as Depositary. During 2011 our shares were delisted from the Tokyo Stock Exchange, and our BDRs were delisted from the Sao Paulo Stock Exchange.
As used herein, “Telefónica,” “Telefónica Group,” “Group” and terms such as “we,” “us” and “our” mean Telefónica, S.A. and its consolidated subsidiaries, unless the context requires otherwise.
As used herein, “Atento” means Atento Holding, Inversiones y Teleservicios, S.A. and its consolidated subsidiaries, unless the context requires otherwise.
Below are definitions of certain technical terms used in this Annual Report:
Certain technical terms used with respect to our business are as follows:
• “Access” refers to a connection to any of the telecommunications services offered by us. We present our customer base using this model because the integration of telecommunications services in bundled service packages has changed the way residential and corporate customers contract for our services. Because a single customer may contract for multiple services, we believe it is more accurate to count the number of accesses, or services a customer has contracted for, as opposed to only counting the number of our customers. For example, a customer that has fixed line telephony service and broadband service represents two accesses rather than a single customer. In addition, we fully count the accesses of all companies over which we exercise control. The following are the main categories of accesses:
• Fixed telephony accesses: includes public switched telephone network, or PSTN, lines (including public use telephony), and integrated services digital network, or ISDN, lines and circuits. For purposes of calculating our number of fixed line accesses, we multiply our lines in service as follows: PSTN (x1); basic ISDN (x1); primary ISDN (x30, x20 or x10); 2/6 digital accesses (x30).
• Internet and data accesses: includes broadband accesses (retail asymmetrical digital subscriber line “ADSL,” very high bit-rate digital subscriber line “VDSL”, satellite, fiber optic and circuits over 2 Mbps), narrowband accesses (Internet service through the PSTN lines) and other accesses, including the remaining non-broadband final client circuits. “Naked ADSL” allows customers to subscribe for a broadband connection without a monthly fixed line fee.
• Pay TV: includes cable TV, direct to home satellite TV, or DTH, and Internet Protocol TV, or IPTV.
• Mobile accesses: includes accesses to mobile network for voice and/or data services (including connectivity). Mobile broadband includes Internet access from devices used to make voice calls and smartphones (mobile Internet), and Internet access from devices that complement fixed broadband, such as PCCards/dongles, and enable large amounts of data to be downloaded on the move (mobile connectivity). Mobile accesses are categorized into contract and prepay accesses.
• Unbundled local loop, or ULL: includes accesses to both ends of the copper local loop leased to other operators to provide voice and DSL services (fully unbundled loop, fully UL) or only DSL service (shared unbundled loop, “shared UL”).
• Wholesale ADSL: means wholesale asymmetrical digital subscriber line.
• Other: includes other circuits for other operators.
3

• “ARPU” is the average revenues per user per month. ARPU is calculated by dividing total service revenues (excluding inbound roaming revenues) from sales to customers for the preceding 12 months by the weighted average number of accesses for the same period, and then divided by 12 months. ARPU is calculated using gross service revenues before deduction of wholesale discounts.
• “CDMA” means Code Division Multiple Access, which is a type of radio communication technology.
• “Cloud computing” is the delivery of computing as a service rather than a product, whereby shared resources, software, and information are provided to computers and other devices as a utility over a network (typically the Internet).
• “Commercial activity” includes the addition of new lines, replacement of handsets, migrations and changes in types of contracts.
• “Customer revenue” means service revenues less interconnection revenues.
• “Duo bundle” means broadband plus voice and/or TV service. We measure “duo bundles” in terms of units, where each bundle of broadband and voice service counts as one unit.
• “Digital Dividend” refers to the amount of spectrum that will be freed up in the switchover from analogue to digital terrestrial TV.
• “FTTx” is a generic term for any broadband network architecture that uses optical fiber to replace all or part of the metal local loop typically used for the last mile of telecommunications wiring.
• “Final client accesses” means accesses provided to residential and corporate clients.
• “Gross adds” means the gross increase in the customer base measured in terms of accesses in a period.
• “HSDPA” means High Speed Downlink Packet Accesses, which is a 3G mobile telephony communications protocol in the High-Speed Packet Access (HSPA) family, which allows networks based on UMTS to have higher data transfers speeds and capacity.
• “Interconnection revenues” means revenues received from other operators which use our networks to connect to our customers.
• “ISP” means Internet service provider.
• “IT”, or information technology, is the acquisition, processing, storage and dissemination of vocal, pictorial, textual and numerical information by a microelectronics-based combination of computing and telecommunications.
• “LMDS” means local multipoint distribution service.
• “LTE” means Long Term Evolution, a mobile access technology.
• “Local loop” means the physical circuit connecting the network termination point at the subscriber’s premises to the main distribution frame or equivalent facility in the fixed public telephone network.
• “M2M”, or machine to machine, refers to technologies that allow both mobile and wired systems to communicate with other devices of the same ability.
• “MVNO” means mobile virtual network operator, which is a mobile operator that is not entitled to use spectrum for the provision of mobile services. Consequently, an MVNO must subscribe to an access agreement with a mobile network operator in order to provide mobile access to their customers. An MVNO pays such mobile network operator for using the infrastructure to facilitate coverage to their customers.
4

In this Annual Report we make certain comparisons in local currency or on a “constant euro basis” or “excluding foreign exchange rate effects” in order to present an analysis of the development of our
results of operations from year-to-year without the effects of currency fluctuations. To make comparisons on a local currency basis, we compare financial items in the relevant local currency for the periods indicated as recorded in the relevant local currency for such periods. To make comparisons on a “constant euro basis” or “excluding foreign exchange rate effects,” we convert the relevant financial item into euro using the prior year’s average euro to relevant local currency exchange rate. In addition, we present certain financial information excluding the effects of Venezuela being considered a hyperinflationary economy in 2009, 2010 and 2011 by eliminating all adjustments made as a result of such consideration.
• “Net adds” means the difference between the customer base measured in terms of accesses at the end of the period and the beginning of the period.
• “Non SMS data revenues” means data revenues excluding SMS revenues.
• “OTT (over the top) services” means TV services over the Internet.
• “Push to talk” is a method of conversing over half-duplex communication lines, including two-way radio, using a button to switch from voice reception mode to transmit mode.
• “Revenues” means net sales and revenues from rendering of services.
• “Service revenues” means revenues less revenues from handset sales.
• “Traffic” means voice minutes used by our customers over a given period, both outbound and inbound. On-net traffic is only included once (outbound), and promotional traffic (free minutes included in commercial promotions) is included. Traffic not associated with our mobile customers (roaming-in; MVNOs; interconnection of third parties and other business lines) is excluded. To arrive at the aggregate traffic for a given period, the individual components of traffic are not rounded.
• “Trio bundle” means broadband plus voice service plus TV. We measure “trio bundles” in terms of units, where each bundle of broadband, voice service and TV counts as one unit.
• “UMTS” means Universal Mobile Telecommunications System.
• “VoIP” means voice over Internet protocol.
• “Wholesale accesses” means accesses we provide to our competitors, who then sell services over such accesses to their residential and corporate clients.
5

PRESENTATION OF CERTAIN FINANCIAL INFORMATION
In this Annual Report, references to “US dollars,” “dollars” or “$,” are to United States dollars, references to “pounds sterling,” “sterling” or “£” are to British pounds sterling, references to “reais” refer to Brazilian reais and references to “euro” or “€” are to the single currency of the participating member states in the Third Stage of the European Economic and Monetary Union pursuant to the treaty establishing the European Community, as amended from time to time.
Our consolidated financial statements as of December 31, 2010 and 2011, and for the years ended December 31, 2009, 2010 and 2011 included elsewhere in this Annual Report including the notes thereto (the “Consolidated Financial Statements”), are prepared in conformity with International Financial Reporting Standards (“IFRS”) as issued by the International Accounting Standards Board (“IASB”).
6

PART I Item 1. Identity of Directors, Senior Management and Advisors A. Directors and Senior Management
Not applicable. B. Advisers
Not applicable. C. Auditors
Not applicable. Item 2. Offer Statistics and Expected Timetable
Not applicable. Item 3. Key Information A. Selected Financial Data
The following table presents certain selected consolidated financial data. It is to be read in conjunction with “Item 5. Operating and Financial Review and Prospects” and the Consolidated Financial Statements. The consolidated income statement and cash flow data for the years ended December 31, 2009, 2010 and 2011 and the consolidated statement of financial position data as of December 31, 2010 and 2011 set forth below are derived from, and are qualified in their entirety by reference to the Consolidated Financial Statements. The consolidated income statement and cash flow data for the years ended December 31, 2007 and 2008 and the consolidated statement of financial position data as of December 31, 2007, 2008 and 2009 set forth below are derived from Telefónica, S.A.’s consolidated financial statements for such years, which are not included herein.
Our Consolidated Financial Statements have been prepared in accordance with IFRS as issued by the IASB.
7

The basis of presentation and principles of consolidation are described in detail in Notes 2 and 3(q), respectively, to our Consolidated Financial Statements.
As of or for the year ended December 31, 2007 2008 2009 2010 2011 (in millions of euro, except share and per share data)Revenues 56,441 57,946 56,731 60,737 62,837Other income 4,264 1,865 1,645 5,869 2,107Supplies (17,907) (17,818) (16,717) (17,606) (18,256)Personnel expenses (7,893) (6,762) (6,775) (8,409) (11,080)Other expenses (12,081) (12,312) (12,281) (14,814) (15,398)Depreciation and amortization (9,436) (9,046) (8,956) (9,303) (10,146)Operating income 13,388 13,873 13,647 16,474 10,064Share of profit (loss) of associates 140 (161) 47 76 (635)Net finance expense (2,851) (2,821) (2,767) (2,537) (2,782)Net exchange differences 7 24 (540) (112) (159)Net financial expense (2,844) (2,797) (3,307) (2,649) (2,941)Profit before tax from continuing operations 10,684 10,915 10,387 13,901 6,488Corporate income tax (1,565) (3,089) (2,450) (3,829) (301)Profit for the year from continuing operations 9,119 7,826 7,937 10,072 6,187Profit after taxes from discontinued operations — — — — —Profit for the year 9,119 7,826 7,937 10,072 6,187Non-controlling interests (213) (234) (161) 95 (784)Profit for the year attributable to equity holders of the parent 8,906 7,592 7,776 10,167 5,403Weighted average number of shares (thousands) 4,758,707 4,645,852 4,552,656 4,522,228 4,511,165Basic and diluted earnings per share from continuing operations attributable to equity holders (euro)(1) 1.87 1.63 1.71 2.25 1.20Basic and diluted earnings per share attributable to equity holders of the parent (euro)(1) 1.87 1.63 1.71 2.25 1.20Earnings per ADS (euro)(1)(2) 1.87 1.63 1.71 2.25 1.20Weighted average number of ADS (thousands)(2) 4,758,707 4,645,852 4,552,656 4,522,228 4,511,165Cash dividends per ordinary share (euro) 0.65 0.90 1.00 1.30 1.52Consolidated Statement of Financial Position Data Cash and cash equivalents 5,065 4,277 9,113 4,220 4,135Property, plant and equipment 32,460 30,545 31,999 35,797 35,463Total assets 105,873 99,896 108,141 129,775 129,623Non-current liabilities 58,044 55,202 56,931 64,599 69,662Equity (net) 22,855 19,562 24,274 31,684 27,383Capital stock 4,773 4,705 4,564 4,564 4,564Consolidated Cash Flow Data Net cash from operating activities 15,551 16,366 16,148 16,672 17,483Net cash used in investing activities (4,592) (9,101) (9,300) (15,861) (12,497)Net cash used in financing activities (9,425) (7,765) (2,281) (5,248) (4,912)
(1) The per share and per ADS computations for all periods presented have been presented using the weighted average number of shares and ADSs, respectively, outstanding for each period, and have been adjusted to reflect the stock dividends which occurred during the periods presented, as if these had occurred at the beginning of the earliest period presented.
(2) Until January 20, 2011, each ADS represented the right to receive three ordinary shares. Since January 21, 2011, each ADS represents the right to receive one ordinary share. The above figures have been restated accordingly. Figures do not include any charges of the Depositary.
8

Exchange Rate Information
As used in this Annual Report, the term “Noon Buying Rate” refers to the rate of exchange for euro, expressed in U.S. dollars per euro, in the City of New York for cable transfers payable in foreign currencies as certified by the Federal Reserve Bank of New York for customs purposes. The Noon Buying Rate certified by the New York Federal Reserve Bank for the euro on March 23, 2012 was $1.3263 = €1.00. The following tables describe, for the periods and dates indicated, information concerning the Noon Buying Rate for the euro. Amounts are expressed in U.S. dollars per €1.00.
Source: Federal Reserve Bank of New York.
Source: Federal Reserve Bank of New York.
Monetary policy within the member states of the euro zone is set by the European Central Bank. The European Central Bank has set the objective of containing inflation and will adjust interest rates in line with this policy without taking account of other economic variables such as the rate of unemployment. It has further declared that it will not set an exchange rate target for the euro.
Our ordinary shares are quoted on the Spanish stock exchanges in euro. Currency fluctuations may affect the dollar equivalent of the euro price of our shares listed on the Spanish stock exchanges and, as a result, the market price of our ADSs, which are listed on the New York Stock Exchange. Currency fluctuations may also affect the dollar amounts received by holders of ADSs on conversion by the depositary of any cash dividends paid in euro on the underlying shares.
Our consolidated results are affected by fluctuations between the euro and the currencies in which the revenues and expenses of some of our consolidated subsidiaries are denominated (principally the Brazilian real, the pound sterling, the Venezuelan Bolivar fuerte (see Note 2 to our Consolidated Financial Statements), the Argentine peso, the Chilean peso, the Czech koruna (crown), the Peruvian nuevo sol, the Mexican peso and the Colombian peso). B. Capitalization and Indebtedness
Not applicable. C. Reasons for the Offer and Use of Proceeds
Not applicable.
Noon Buying Rate Year ended December 31, Period end Average (1) High Low
2007 1.4603 1.3797 1.4862 1.29042008 1.3919 1.4698 1.6010 1.24462009 1.4332 1.3955 1.5100 1.25472010 1.3269 1.3261 1.4536 1.19592011 1.2973 1.4002 1.3875 1.29262012 (through March 23, 2012) 1.3263 1.3105 1.3463 1.2682
(1) The average of the Noon Buying Rates for the euro on the last day reported of each month during the relevant period.
Noon Buying RateMonth ended High Low
September 30, 2011 1.4283 1.3446October 31, 2011 1.4172 1.3281November 30, 2011 1.3803 1.3244December 31, 2011 1.3487 1.2926January 31, 2012 1.3192 1.2682February 29, 2012 1.3463 1.3087March 31, 2012 (through March 23, 2012) 1.3320 1.3025
9

D. Risk Factors
In addition to the other information contained in this Annual Report, prospective investors should carefully consider the risks described below before making any investment decision. The risks described below are not the only ones that we face. Additional risks not currently known to us or that we currently deem immaterial may also impair our business and results of operations. Our business, financial condition, results of operations and cash flow could be materially adversely affected by any of these risks, and investors could lose all or part of their investment. Risks Relating to Our Business
A material portion of our operations and investments are located in Latin America, and we are therefore exposed to risks inherent in operating and investing in Latin America.
At December 31, 2011, approximately 48.5% of our assets were located in our Latin America segment. In addition, approximately 46.5% of our revenues for 2011 were derived from our Latin American segment operations. At December 31, 2011, 54.5% of Latin America assets and 49.0% of Latin America revenues were derived from our operations in Brazil. Our business is thus particularly sensitive to any of the risks relating to Latin America discussed in this section to the extent they arise or manifest themselves in Brazil. Our operations and investments in Latin America (including the revenues generated by these operations, their market value and the dividends and management fees expected to be received therefrom) are subject to various risks linked to the economic, political and social conditions of these countries, including risks related to the following:
Our financial condition and results of operations may be adversely affected if we do not effectively manage our exposure to foreign currency exchange rate, interest rate or financial investment risks.
We are exposed to various types of market risk in the normal course of our business, including, above all, the impact of changes in interest rates of foreign currency exchange rates. We use a variety of
strategies to manage this risk, mainly through the use of financial derivatives, which themselves are suceptible to risks, including counterparty risk. Our risk management strategies may not achieve their desired effect, which could adversely affect our business, financial condition and results of operations.
For a more detailed description of our financial derivatives transactions, see “Item 11. Quantitative and Qualitative Disclosures about Market Risk” and Note 16 to our Consolidated Financial Statements.
Adverse economic conditions could reduce purchases of our products and services.
Our business is impacted by general economic conditions in each of the countries in which we operate. The current uncertainty about whether the economic recovery will continue may negatively affect the level of demand of existing and prospective customers, as our services may not be deemed critical for these customers. The principal macroeconomic factors that could have an adverse impact on consumption and, accordingly, demand for our services include access to credit, unemployment rates, consumer confidence and other general macroeconomic factors.
• government regulation or administrative polices may change unexpectedly, including changes that modify the terms and conditions of concessions and their renewal, which could negatively affect our interests in such countries;
• the effects of inflation or currency depreciation or currency restrictions and other restraints on transfers of funds that may be imposed;
• governments may expropriate or nationalize assets or increase their participation in the economy and companies; and
• economic downturns, political instability and civil disturbances may negatively affect our operations.
10

Existing or worsening conditions in the international financial markets may limit our ability to carry out our business plan.
The operation, expansion and upgrading of our networks, the development and distribution of our services as well as the development and implementation of new technologies or license award renewal processes, require substantial financing.
International financial markets continue to be affected by current uncertainties surrounding the pace of economic recovery, the health of the international banking system and increasing concerns regarding burgeoning public deficits in certain European countries. Worsening conditions in the international credit markets due to any of these factors may make it more difficult and more expensive to refinance our financial debt (at December 31, 2011, our net average debt scheduled to mature in the next six years was approximately €6,850 million per year) or to incur additional debt, if needed.
In addition, if our credit ratings were downgraded, our capacity to raise capital in the international capital markets could be impaired, in terms of access and cost. Although following recent downgrades in our long-term debt we have successfully tapped the capital markets in several instances, we can give no assurance regarding our ability to raise capital in the international capital markets on a timely basis or at all, or at interest rates acceptable to us.
Furthermore, market conditions may make it more difficult to renew our unused bilateral credit facilities, 24% of which as of December 31, 2011 are scheduled to mature prior to December 31, 2012. Finally, the current financial situation may also make it more difficult and costly for us to raise additional equity capital. Risks Relating to Our Industry
We operate in a highly regulated industry, which could adversely affect our businesses, and we depend on government concessions.
As a multinational telecommunications company that operates in regulated markets, we are subject to different laws and regulations in each of the jurisdictions in which we provide services. Such laws and regulations are promulgated and enforced to varying degrees by supranational regulators such as the European Union and national, state, regional and local authorities. Regulation is particularly strict in the markets of those countries in which we hold a significant market position. In this respect, regulatory authorities regularly intervene in the retail and wholesale offering and pricing of our products and services and throughout 2011 generally placed downward pressure on wholesale and retail voice rates, roaming rates, termination rates and SMS messaging rates. Additional regulations could require us to further reduce roaming prices and termination rates in mobile and/or fixed line networks, require us to offer access to our network to other operators and result in the imposition of fines if we fail to fulfill our service commitments. Such regulations and regulatory actions could place significant competitive and pricing pressure on our operations, and could have a material adverse effect on our business, financial condition, results of operations and cash flow.
We provide most of our services under licenses, authorizations and concessions and, as such, are substantially dependent upon them. Regulatory authorities may adopt further regulations or take additional actions that could adversely affect us, including revocation of or failure to renew any of our licenses, authorizations or concessions, implementation of changes to the spectrum allocated to us or the granting or new licenses, authorizations or concessions to our competitors to offer services in the relevant markets. While we pursue license renewals to the extent provided by their contractual terms, we cannot guarantee that we will always complete this process successfully or on beneficial terms for us. In many cases we must satisfy certain obligations, including, among others, minimum specified quality standards, service and coverage conditions and capital investment thresholds in order to qualify for renewal. Failure to comply with these obligations could result in the imposition of fines or even revocation or forfeiture of the license, authorization or concession.
In addition, because we hold a leading market share in many of the counties where we operate, we could face regulatory actions by antitrust or competition authorities. These authorities could prohibit us from taking further actions such as making further acquisitions or continuing to engage in particular practices or impose fines or other
11

penalties on us, which, if significant, could result in loss of market share and harm to our financial performance and future growth.
For further information regarding the matters discussed above and other aspects of the regulatory environments in which our businesses operate, see “Item 4. Information on the Company—Business Overview—Regulation.”
We operate in highly competitive markets and the industry in which we operate is subject to rapid technological changes, which requires us to continuously adapt to such changes and to upgrade ourexisting networks.
We operate in markets that are highly competitive and subject to constant technological development. Therefore, we are subject to the effects of actions by competitors in these markets and rely on our ability
to anticipate and adapt to constant technological changes taking place in the industry. To compete effectively with our competitors, we need to successfully market our products and services and respond to both commercial actions by competitors and other competitive factors affecting these markets, anticipating and adapting promptly to technological changes, changes in consumer preferences and general economic, political and social conditions. Failure to do so effectively could have an adverse impact on our business, results of operations and financial condition. See “Item 4. Information on the Company—Business Overview—Competition.”
New products and technologies arise constantly while the development of existing products and technologies can render obsolete the products and services we offer and the technologies we use. This can force us to investment in the development of new products, technology and services so that we can continue to compete effectively with current or future competitors. Such investments can reduce the revenue margins we obtain. In this respect, margins from traditional voice and data business are shrinking, while new sources of revenues are arising from mobile Internet. One technology that telecommunications operators, including us (in Spain and Latin America), are focused on is the new FTTx-type network, which offers broadband access using optical fiber with superior services, such as high speed Internet and HD television services. However, significant investment is required to deploy these networks, which entails fully or partially substituting the copper wire with fiber optic cables. Currently, minimal demand for the capabilities offered by these new networks to end users could make it difficult to quantify the return on investment and justify the high investment. In addition, many of these networks upgrade tasks and the ability to offer new products or services are not entirely under our control and may be affected by applicable regulations.
Spectrum capacity may become a limiting and costly factor.
Our mobile operations in a number of countries may rely on spectrum availability. Failure to obtain sufficient or adequate spectrum coverage and the costs related to obtaining this capacity could have a material adverse impact on the quality of our services, on our ability to provide new services and on our cash flow, adversely affecting our business, financial condition and results of operations. For further information regarding the matters discussed above and other aspects of the regulatory environments in which our businesses operate, see “Item 4. Information on the Company—Business Overview—Regulation—Licenses and Concessions.”
Our business could be adversely affected if our suppliers fail to provide necessary equipment and services on a timely basis.
As a mobile and fixed telephony operator and provider of telecommunications services and products, we like other companies in the industry we depend upon a small number of major suppliers for essential products and services, mainly network infrastructure and mobile handsets. These suppliers may, among other things, extend delivery times, raise prices and limit supply due to their own shortages and business requirements. If these suppliers fail to deliver products and services on a timely basis, it could jeopardize our network deployment and expansion plans, which could adversely affect our ability to satisfy our license terms and requirements and have a material, adverse effect on our businesses, results of operations and financial condition.
We may be adversely affected by unanticipated network interruptions.
Unanticipated network interruptions as a result of system failures whether accidental or otherwise, including due to network, hardware or software failures, which affect the quality of or cause an interruption in our service, could result in customer dissatisfaction, reduced revenues and traffic and costly repairs, penalties or other measures
12

imposed by regulatory authorities, and could harm our reputation. We attempt to mitigate these risks through a number of measures, including backup systems and protective systems such as firewalls, virus scanners and building security. However, these measures are not effective under all circumstances and cannot avert every action or event that could damage or disrupt our technical infrastructure. Although we carry business interruption insurance, our insurance policy may not provide coverage in amounts sufficient to compensate us for any losses we may incur.
The mobile industry may be harmed by concerns stemming from actual or perceived health risks associated with radio frequency emissions.
Currently, there is significant public concern regarding alleged potential effects of electromagnetic fields emitted by mobile telephones and base stations on human health. This concern has caused certain governments and administrations to take measures that have hindered the deployment of the infrastructure necessary to ensure quality of service and has affected the deployment criteria of new networks.
In May 2011, the specialized body of the World Health Organization for research on cancer (IARC) classified electromagnetic fields of mobile telephony as “possibly carcinogenic,” a classification which also includes products such as coffee and pickled foods. The World Health Organization subsequently indicated, in fact sheet no. 193, published in June 2011, that to date it cannot be confirmed that the use of a mobile telephone has adverse effects on health, although it also announced that in 2012 an official assessment of this risk will be conducted, taking into account all scientific evidence available.
We have devised plans to help assure compliance with codes of good practices and relevant regulations in the various countries in which we operate. Nevertheless, this concern may affect our ability to capture or retain customers, may discourage the use of the mobile telephone and may result in the adoption of new measures by governments or any other regulatory interventions, any of which could materially and adversely affect our business, results of operations and financial condition.
Developments in the telecommunications sector have resulted, and may in the future result, in substantial write-downs of the carrying value of certain of our assets.
We review on an annual basis or more frequently where the circumstances require, the value of each of our assets and cash generating units to assess whether their carrying values can be supported by the future cash flows expected to be derived from such assets and cash generating units, considering in some cases synergies included in their acquisition costs. Changes in the regulatory, business, economic or political environment may result in the necessity of recognizing impairment charges on our goodwill, intangible assets or fixed assets.
Although the recognition of impairments of tangible, intangible and financial assets result in a non-cash charge on the income statement, such charge would adversely affect our results of operations and consequently, our ability to achieve our growth targets. For example, we have faced several corrections regarding the value of certain of our assets that have impacted our results of operations for the year in which the corrections were made. In 2011, an impairment loss was recognized on our stake in Telco, S.p.A., which, among other effects, resulted in a negative impact of €620 million, reducing the value of our stake in Telecom Italia, S.p.A. This value is evaluated at each reporting date for indications of impairment losses. Other Risks
We are involved in disputes and litigation with regulators, competitors and third parties.
We are party to lawsuits and other legal, regulatory and antitrust proceedings in the ordinary course of our business, the final outcome of which is generally uncertain. An adverse outcome in, or any settlement of, these or other proceedings that may be asserted in the future may have a material adverse effect on our business, financial condition, results of operations and cash flow.
For a more detailed description of current legal proceedings, see “Item 8. Financial Information—Legal Proceedings.”
13

Item 4. Information on the Company A. History and Development of the Company Overview
Telefónica, S.A., is a corporation duly organized and existing under the laws of the Kingdom of Spain, incorporated on April 19, 1924. We are:
The following significant events occurred in 2011:
• a diversified telecommunications group which provides a comprehensive range of services through one of the world’s largest and most modern telecommunications networks;
• focused on providing telecommunications services; and
• present principally in Europe and Latin America.
• On January 23, 2011, Telefónica and China Unicom signed an extension to their strategic alliance agreement, pursuant to which both companies agreed to strengthen and deepen their strategic cooperation in certain business areas and committed to investing the equivalent of $500 million in ordinary shares of the other party toward the alliance. On January 28, 2011, China Unicom completed its acquisition of Telefónica shares, resulting in its ownership of 1.37% of our outstanding share capital. Likewise, on September 9, 2011, we completed our acquisition of China Unicom shares. As a consequence of this acquisition, we are the owner of approximately 9.6% of China Unicom’s ordinary share capital.
• On March 25, 2011, pursuant to a corporate restructuring of our subsidiaries in Brazil, Telecomunicações de São Paulo S.A. – Telesp (“Telesp”) and Vivo Participaçoes, S.A., (“Vivo”), the Board of Directors of both companies approved the terms and conditions for a merger of shares, by which the totality of Vivo’s shares were merged into Telesp. Former Vivo shareholders received 1.55 new shares of Telesp in exchange for each Vivo share.
• On July 7, 2011, Telefónica de España, S.A.U. agreed with certain Spanish labor unions to the terms of a redundancy plan affecting up to 6,500 jobs. The redundancy plan was approved by the Spanish labor authorities on July 14, 2011.
• On July 29, 2011, Telefónica Móviles España, S.A.U. submitted a winning bid for 5 frequency blocks, giving the company access to spectrum in all bands assigned to mobile services. The total cost of the spectrum blocks amounted to €842 million, with payment distributed over two years (€441 million was paid in 2011 and the remaining amount will be paid in the second quarter of 2012).
• On September 5, 2011, the Executive Commission of our Board of Directors approved a new organizational structure, the principal features of which include:
(i) the creation of a new business unit, Telefónica Digital, headquartered in London and headed by Mathew Key, who previously headed Telefónica Europe;
(ii) the configuration of two large geographical blocks: Europe (including operations in Spain) and Latin America. José María Álvarez-Pallete, former head of Telefónica Latin America, oversees Europe, while Santiago Fernández Valbuena, previously General Manager of Strategy, Finance and Corporate Development, is in charge of Latin America; and
(iii) the creation of a Global Resources operating unit overseen by Guillermo Ansaldo, former head of Telefónica Spain.
14

Business areas
Throughout 2011, we followed our historical regional, integrated management model based on three business areas by geographical market and integrated fixed line and mobile businesses in Spain, Latin America and the rest of Europe.
We are also involved in the media and contact center segments through Telefónica de Contenidos and Atento, respectively.
For comparative purposes, the presentation of 2010 and 2009 results for Telefónica International Wholesale Services (TIWS) and Telefónica North America (TNA), each formerly consolidated within
Telefónica Latin America during those years, has been revised to present such results as consolidated within Telefónica Europe since January 1, 2011.
On September 5, 2011, the Executive Committee of Telefónica’s Board of Directors approved a new organizational structure with the aim of reinforcing our growth strategy, actively participating in the digital world and capturing the opportunities afforded by our global scale and industrial alliances. We intend to implement this structure throughout 2012 and report our results of operations pursuant to this new structure beginning with our annual report for the year ended December 31, 2012.
• Telefónica Spain: oversees the fixed and mobile telephony services, broadband, internet, data, broadband TV, value added services operations and their development in Spain.
• Telefónica Latin America: oversees the fixed and mobile telephony services, broadband, internet, data, broadband TV, value added services operations and their development in Latin America.
• Telefónica Europe: oversees the fixed and mobile telephony services in the United Kingdom, Germany, Ireland, the Czech Republic and Slovakia. Also includes Telefónica International Wholesale Services (TIWS) and Telefónica North America (TNA), whose activities are primarily focused on the provision of services to multinationals as well as the provision of global wholesale telecommunications services to international fixed and mobile voice operators, ISPs and content providers.
15

The following chart shows the organizational structure of the principal subsidiaries of the Telefónica Group at December 31, 2011, including their jurisdictions of incorporation and our ownership interest. For further detail, see Exhibit 8.1 to this Annual Report.
(1) Ownership in Telefónica Móviles España, S.A.U. is held directly by Telefónica, S.A. (2) 91.76% representing voting interest. (3) Ownership in Telefónica International Wholesale Services, S.L. is held 92.51% by Telefónica, S.A. and 7.49% by Telefónica Datacorp, S.A.U. (4) Ownership in O2 (Europe) Ltd. (U.K.) is held directly by Telefónica, S.A. (5) Companies held indirectly. (6) Ownership in TIWS II is held directly by Telefónica, S.A.
16

Telefónica, S.A., the parent company of the Telefónica Group, also operates as a holding company with the following objectives:
Our principal executive offices are located at Distrito Telefónica, Ronda de la Comunicación, s/n, 28050 Madrid, Spain, and our registered offices are located at Gran Vía, 28, 28013 Madrid, Spain. Our
telephone number is +34 900 111 004. Capital Expenditures and Divestitures
Our principal capital expenditures during the three years ended December 31, 2011 consisted of additions to property, plant and equipment and additions to intangible assets, including spectrum. In 2011, 2010 and 2009, we made capital expenditures of €10,224 million, €10,844 million and €7,257 million, respectively.
Year ended December 31, 2011
Capital expenditures in 2011 declined 5.7% compared with 2010. Capital expenditures in 2011 include the cost of spectrum in Spain, Brazil, Costa Rica and Colombia, amounting to €1,296 million. In Spain there were significant investments in the fixed line business, including investments in broadband to continue the localized roll-out of fiber optics, TV and data services for large corporate customers, as well as the maintenance of the traditional business. Investment in the mobile business was principally directed toward improving third generation (3G) network capability. Investments in Latin America were focused mainly on the mobile business, mostly in the expansion of coverage and on 3G and GSM network capacity. In the fixed line business, network and plant upgrades and investment in broadband accounted for the bulk of the investment. Investment in Europe continued to be focused on improving capacity and coverage of the mobile networks in the United Kingdom and Germany as well as the broadband business, primarily in the Czech Republic and Germany.
Year ended December 31, 2010
Our capital expenditures increased 49.4% to €10,844 million in 2010 compared with €7,257 million in 2009, mainly as a result of the acquisition of spectrum in Germany (€1,379 million) and Mexico (€1,237 million) and the full consolidation in the fourth quarter of 2010 of Vivo. Excluding such spectrum acquisitions, capital expenditures growth would have been 13.4%. Our investments in Spain were directed toward further developing the fixed broadband business with a selective roll-out of fiber optics, Imagenio and data services for large corporate customers and expanding mobile third generation, or 3G, offerings. In Latin America, capital expenditures were directed toward the transformation of the fixed telephony business and continuing to expand coverage and capacity of 3G and GSM networks in our mobile telephony business. In Europe, capital expenditures were directed toward improving the capacity and coverage of our mobile networks and greater investments in the ADSL business.
Year ended December 31, 2009
Our capital expenditures decreased 13.6% to €7,257 million in 2009 compared with €8,401 million in 2008, mainly as a result of investment containment in our three regions of activity. Our investments in Spain were directed toward further developing the broadband business and expanding 3G. In Latin America capital expenditures were directed toward satisfying increased customer demand in broadband and pay TV and increasing coverage and
• coordinate the Group’s activities;
• allocate resources efficiently among the Group;
• provide managerial guidelines for the Group;
• manage the Group’s portfolio of businesses;
• foster cohesion within the Group; and
• foster synergies among the Group’s subsidiaries.
17

capacity of our second generation, or GSM, and mobile 3G networks. In Europe capital expenditures were directed toward expanding the mobile 3G network coverage, developing the broadband business and undertaking IT projects. Financial Investments and Divestitures
Our principal financial investment in 2011 was the extension of our strategic partnership agreement with China Unicom, which extension was executed on January 23, 2011. Telefónica acquired through its subsidiary, Telefónica Internacional, S.A.U., a number of China Unicom shares for consideration totaling $501 million in the aggregate (€358 million at each acquisition date) from third parties during the nine months following the execution of the extension. Following the completion of the transaction, Telefónica holds, through Telefónica Internacional, S.A.U., approximately 9.57% of China Unicom’s voting share capital.
Our principal financial investments in 2010 relate to the acquisition of 50% of Brasilcel, N.V. (“Brasilcel”) (approximately €7,500 million), the acquisition of HanseNet (approximately €275 million) and the acquisition of a 22% stake in D.T.S, Distribuidora de Televisión Digital, S.A. (approximately €488 million). Our principal divesture in 2010 was the reduction of our stake in Portugal Telecom S.G.P.S., S.A. (“Portugal Telecom”) by 7.98%, resulting in cash inflow of €631 million, though we retained a certain amount of economic exposure to fluctuations in the value of Portugal Telecom’s shares through the use of derivative instruments.
Our principal financial investment in 2009 was the acquisition of an additional stake in China Unicom (Hong Kong) Limited (“China Unicom”) (approximately $1,000 million as a consequence of a mutual share exchange). Our principal divestiture in 2009 was the sale of Medi Telecom (€400 million) as described above. Public Takeover Offers
Not applicable. Recent Developments
The principal events that have occurred since December 31, 2011 are set forth below:
On February 21, 2012, Telefónica de Contenidos, S.A.U., a Telefónica wholly-owned company, reached an agreement with Abertis Telecom, S.A. to sell the 13.23% stake of Hispasat S.A. owned by Telefónica de Contenidos, S.A.U. in exchange for €124 million to be received in cash upon the closing of the transaction. The closing of the transaction is subject, among other conditions, to the approval of the Council of Ministers.
For information related to our significant financing transactions completed in 2011 and through the date of this Annual Report, see “Item 5. Operating and Financial Review and Prospects – Liquidity and Capital Resources – Anticipated Sources of Liquidity.” B. Business Overview
We are one of the world’s leading mobile and fixed communications services providers. Our strategy is to become the leader in the new digital world and transform its possibilities into reality.
Against this backdrop, and with the aim of reinforcing our growth story, actively participating in the digital world and maximizing opportunities afforded by our scale and industrial alliances, in September 2011 we approved a new organizational structure for the Telefónica group. This new structure, which we expect to become fully operational in 2012, is organized as follows:
18

This new organizational structure is aimed toward reinforcing our place in the digital world, enabling us to tap growth opportunities, drive innovation, strengthen our product and services portfolio and maximize advantages afforded by our large customer bases in an increasingly connected world. In addition, the creation of our Global Resources operating unit is aimed toward driving the profitability and sustainability of the business by leveraging economies of scale and driving Telefónica’s transformation into a fully global group.
Telefónica Europe’s and Telefónica Latin America’s objective is to shore up the results of the business and generate sustainable growth through available capacity, backed by the global corporation. Our three historical segments, Telefónica Spain, Telefónica Europe and Telefónica Latin America, have been maintained for purposes of this annual report because the organizational change was approved in September 2011, and we expect to implement it throughout the course of 2012.
Our growth strategy for the next few years is geared towards:
• Improving the customer experience in order to continue increasing our number of accesses;
• Promoting growth:
o Boosting the penetration of smartphones in our markets in order to accelerate the growth of mobile data usage;
o Reinforcing our competitive position in the fixed line business with a focus on broadband, offering faster speeds, bundled offers and full IP voice and video services;
o Leveraging growth opportunities arising from an increasingly digital environment (e.g. video, OTT, financial services, cloud computing eHealth and media);
• Continuing efforts to transform our operating model:
o Increasing network capacity in key markets through technological advances or acquisitions of spectrum;
o Focusing on the IT area to accelerate the transformation;
o Proceeding towards becoming an international digital and online service provider group;
• Maximizing economies of scale to boost efficiency.
19

We have operations in Spain, the United Kingdom, Germany, the Czech Republic, Ireland and Slovakia in Europe, as well as Mexico, several countries in Central America, Brazil, Venezuela, Colombia, Peru, Argentina, Chile, Uruguay and Ecuador.
We also have an industrial alliance with Telecom Italia and a strategic alliance with China Unicom, in which we increased our stake to 9.6% of its voting share capital in 2011. In addition, we rolled out our “Partners Program” in 2011 with the objective of unlocking the value of our scale. Three operators have already signed up for this program (Bouygues, Etisalat and Sunrise). This initiative makes a host of services available to selected operators under commercial terms that allow the partners to leverage our scale and foster cooperation in key business areas (e.g. roaming, services to multinationals, procurement and handsets). 2011 Highlights
The amount of cash flow available for distribution to Telefónica, S.A. shareholders, to protect solvency levels (financial debt and commitments) and to accommodate strategic flexibility at December 31, 2011 amounted to €9,270 million up 9.5% from 2010, while we maintained strong investment objectives amid an adverse economic environment.
Growth in accesses remained strong (7%), driven by an 8.4% increase in mobile accesses.
Also noteworthy was the sharp growth of our data business, thanks to increasing mobile broadband penetration, accounting for 16% of our mobile access base in 2011, up from 11% in 2010.
Meanwhile, revenues grew 3.5%, with Telefónica Latin America as the Group’s main growth driver, contributing 6.4 percentage points to consolidated revenue growth (excluding the effects of foreign exchange-rates and Venezuela being considered a hyperinflationary economy) and representing 47% of our consolidated revenue and 54% of OIBDA.
Investment remained at high levels (€10,224 million of capital expenditures, including €1,296 million of spectrum acquisitions in Spain, Brazil, Costa Rica and Colombia), aimed at future growth. Total Group Accesses
At December 31, Percent Change 2009 2010 2011 2009 vs. 2010 2010 vs. 2011 (in thousands)
Fixed telephony accesses(1) 40,606.0 41,355.7 40,119.20 1.8% (3.0)%Internet and data accesses 15,082.5 18,611.4 19,134.2 23.4% 2.8%
Narrowband accesses 1,427.5 1,314.1 909.2 (7.9)% (30.8)%Broadband accesses(2) 13,492.6 17,129.6 18,066.3 27.0% 5.5%Other accesses(3) 162.4 167.8 158.7 3.3% (5.4)%
Mobile accesses 202,332.5 220,240.5 238,748.6 8.9% 8.4%Pre-pay accesses 142,806.6 151,273.9 162,246.9 5.9% 7.3%Contract accesses 59,525.9 68,966.6 76,501.7 15.9% 10.9%
Pay TV accesses(4) 2,489.2 2,787.4 3,309.9 12.0% 18.7%Final clients accesses 260,510.2 282,994.9 301,311.8 8.6% 6.5%
Unbundled local loop accesses 2,206.0 2,529.2 2,928.7 14.7% 15.8%Shared UL accesses 447.7 264.0 205.0 (41.0)% (22.3)%Full UL accesses 1,758.3 2,265.3 2,723.7 28.8% 20.2%
Wholesale ADSL accesses(5) 463.4 687.4 849.3 48.3% 23.6%Other accesses(6) 1,426.0 1,420.7 1,518.0 (0.4)% 6.8%
Wholesale accesses 4,095.3 4,637.4 5,296.0 13.2% 14.2%Total accesses 264,605.5 287,632.3 306,607.8 8.7% 6.6%
(1) PSTN (including public use telephony) x1; ISDN basic access x1; ISDN primary access; 2/6 access x30. Includes our accesses for internal use. It also includes VoIP and naked ADSL accesses.
(2) Includes ADSL, satellite, fiber optic, cable modem and broadband circuits.
(3) Includes remaining non-broadband retail circuits.
20

As the preceding chart illustrates, we managed to capture market growth in terms of accesses despite the economic downturn, the negative impact of regulatory developments and stiff competition.
Our strategy is predicated on capturing growth in our markets and particularly on attracting high-value customers. This strategy led to a 7% increase in total accesses during 2011, driven primarily by the mobile business, with growth in mobile broadband and higher penetration of contract accesses. Total mobile broadband customers stood at 38 million at December 31, 2011, representing a 16% penetration of our total mobile access base.
At December 31, 2011, we held significant direct and indirect non-controlling stakes (of over 5% in all cases) in the following listed telecommunications companies: China Unicom, Telecom Italia, S.p.A., Zon Multimedia, S.p.A. and Hispasat, S.A. As of the date of this Annual Report, we have reached an agreement to sell our stake in Hispasat, S.A. and our interest in Zon Multimedia, S.p.A. was reduced below 5%.
(4) Includes accesses by 153 thousand TVA clients at June 2011.
(5) Includes unbundled lines rented by Telefónica Germany.
(6) Includes circuits for other operators. Includes Wholesale Rental of Telephone Access in Spain.
21

Group Results of Operations
A summary of our results of operations for 2009, 2010 and 2011 and certain consolidated revenue and expense items as a percentage of revenues for the periods indicated is shown below.
Year ended December 31, 2011 compared with year ended December 31, 2010
Consolidated results for the year ended December 31, 2011 reflect the consolidation of 100% of Vivo, effective October 1, 2010. Before October 1, 2010, Vivo was consolidated at 50%.
Revenues
Revenues increased 3.5% in 2011 to €62,837 million. The full consolidation of Vivo had an impact of €2,396 million. Exchange rate effects and the impact of hyperinflation in Venezuela detracted 0.7 percentage points from revenue growth for the year. Excluding all these impacts, revenues would have been largely flat in 2011, with Latin America representing the largest share (47%) and making the largest contribution to growth.
Revenue growth in general was driven by the growth in the number of accesses, as average revenue per access for the Group fell principally due to decreases in average revenue per mobile access in Spain and the rest of Europe and widespread declines in the fixed line voice business. Excluding the impact of declines in interconnection tariffs, revenue growth was slightly more than one percentage point higher.
Other income
Other income for 2011 totaled €2,107 million and principally includes the proceeds from the disposal of non-strategic assets during the year, mainly in Latin America (€541 million), and the positive impact of the partial reduction in our economic stake in Portugal Telecom (€184 million). The decrease in other income compared with 2010 is mainly due to the recognition in 2010 of a capital gain arising from the re-measurement of the previously held investment in Brasilcel (€3,797 million) and gains on the sale of non-strategic assets and the sale of Manx (€260 million and €61 million, respectively). Other income in 2011 also reflects the impact of lower ancillary income.
Year ended December 31 Percent Change 2009 2010 2011 2009 vs. 2010 2010 vs. 2011 Total % of revenues Total % of revenues Total % of revenues Total % Total % (in millions of euro, except percentages)Revenues 56,731 100.0% 60,737 100.0% 62,837 100.0% 4,006 7.1% 2,100 3.5%Other income 1,645 2.9% 5,869 9.7% 2,107 3.4% 4,224 256.7% (3,762) (64.1)%Supplies (16,717) (29.5)% (17,606) (29.0)% (18,256) (29.1)% (889) 5.3% (650) 3.7%Personnel expenses (6,775) (11.9)% (8,409) (13.8)% (11,080) (17.6)% (1,633) 24.1% (2,671) 31.8%Other expenses (12,281) (21.6)% (14,814) (24.4)% (15,398) (24.5)% (2,532) 20.6% (585) 3.9% Operating income before depreciation and
amortization (OIBDA)(1) 22,603 39.8% 25,777 42.4% 20,210 32.2% 3,175 14.0% (5,567) (21.6)%Depreciation and amortization (8,956) (15.8)% (9,303) (15.3)% (10,146) (16.1)% (347) 3.9% (843) 9.1%Operating income 13,647 24.1% 16,474 27.1% 10,064 16.0% 2,827 20.7% (6,410) (38.9)%Share of profit (loss) of associates 47 0.1% 76 0.1% (635) (1.0)% 28 59.8% (711) (940.3)%Net financial expense (3,307) (5.8)% (2,649) (4.4)% (2,941) (4.7)% 658 (19.9)% (292) 11.0%Corporate income tax (2,450) (4.3)% (3,829) (6.3)% (301) (0.5)% (1,378) 56.2% 3,527 (92.1)%Profit for the year from continuing operations 7,937 14.0% 10,072 16.6% 6,187 9.8% 2,135 26.9% (3,885) (38.6)%Profit after taxes from discontinued operations - - - - - - - - - -Profit for the year 7,937 14.0% 10,072 16.6% 6,187 9.8% 2,135 26.9% (3,885) (38.6)%Non-controlling interests (161) (0.3)% 95 0.2% (784) (1.2)% 256 (158.9)% (879) (925.5)%Profit for the year attributable to equity
holders of the parent 7,776 13.7% 10,167 16.7% 5,403 8.6% 2,392 30.8% (4,765) (46.9)%
(1) For a reconciliation of OIBDA to operating income, see “Item 5. Operating and Financial Review and Prospects—Operating Results—Presentation of Financial Information—Non-GAAP financial information—Operating income before depreciation and amortization.”
22

Total expenses
Total expenses includes supplies, personnel expenses and other expenses (principally external services and taxes other than corporate income tax). Total expenses do not include depreciation and amortization. Total expenses in 2011 were €44,734 million, up 9.6% compared with 2010. This increase was primarily due to the impact of our full consolidation of Vivo from October 2010 (€1,574 million) and the increase in personnel expenses due to the recognition in 2011 of €2,671 million of restructuring costs related to our labor force reduction plan in Spain. In 2010, personnel expenses included €658 million of costs stemming from the restructuring of workforces of several operating subsidiaries and €400 million in expenses recognized in relation to the Telefónica Foundation’s social program.
Excluding the aforementioned effects, growth in expenses slightly outpaced revenue growth due to:
Operating income before depreciation and amortization (OIBDA)
As a result of the foregoing, OIBDA in 2011 decreased approximately 22% to €20,210 million from €25,777 million in 2010.
For a reconciliation of OIBDA to operating income, see “Item 5. Operating and Financial Review and Prospects—Operating Results—Presentation of Financial Information—Non-GAAP financial
information—Operating income before depreciation and amortization.”
Depreciation and amortization
Depreciation and amortization increased 9.1% in 2011 due to the full consolidation of Vivo and the amortization of certain assets in Vivo’s purchase price allocation (€336 million in 2011 compared with €84 million in 2010).
Operating income
As a result of the foregoing, operating income declined approximately 39% to €10,064 million in 2011 compared with €16,474 million in 2010. Excluding foreign exchange rate effects and the consideration of Venezuela as a hyperinflationary economy, operating income would have decreased by 38% in the year.
Share of profit (loss) of associates
Our share of loss of associates was €635 million in 2011, compared with a profit of €76 million in 2010. The move to a loss during 2011 was due to the impact of the write-down by Telco SpA of its stake in Telecom Italia and the removal of Portugal Telecom from the scope of consolidation.
Net financial expense
Net financial expenses were €2,941 million for the year ended December 2011, an increase of 11% from the prior year. The increase was mainly driven by the following factors:
• Increased supplies expenses as a result of increased handset costs associated with growing smartphone adoption in all three regions. Nevertheless, this effect was partially offset by lower mobile termination costs in all the regions.
• Increased personnel expenses mainly due to our internalization of contractors in Brazil and wage growth linked to inflation in countries with high inflation rates.
• Increased other expenses as a result of higher investment in customer care, increased commercial costs linked to higher activity and higher expenses associated with the deployment of the 3G network.
• The increase in the average debt outstanding, along with fluctuations in interest rates and other financial operations, led to financial expenses of €263 million. The largest contributor was the 13% increase in average debt outstanding (to €56,351 million).
23

The average cost of debt was 5.22%, which, adjusting for exchange rate differences, fell below 5% (4.91%). Net financial debt increased by €711 million in the year (to €56,304 million) at December 31,
2011.
Corporate income tax
Corporate income tax in 2011 amounted to €301 million (€3,829 million in 2010), on a profit before tax of €6,488 million. In 2011, deferred tax liabilities of €1,288 million (€952 million in profit for the year attributable to equity holders of the parent) recognized in the Vivo purchase price allocation were canceled as a result of the change in the tax value of certain assets following the merger of Telesp and Vivo Participaçoes, which became tax deductable under Brazilian tax regulations.
Non-controlling interests
Profit attributable to non-controlling interests subtracted €784 million from net profit in 2011, compared with a positive contribution to net profit for 2010 of €95 million attributable to non-controlling interests. This amount principally represented non-controlling interests’ share in the profits of Telefónica Brasil and in Telefónica Czech Republic. These impacts were partially offset by the non-controlling interests’ share of losses of Colombia Telecom in Colombia.
Profit for the year attributable to equity holders of the parent
As a result of the foregoing, profit for the year attributable to equity holders of the parent declined 46.9% to €5,403 million for 2011 compared with €10,167 million in 2010. Year ended December 31, 2010 compared with year ended December 31, 2009
Revenues
Revenues increased 7.1% to €60,737 million in 2010 compared with €56,731 million in 2009. Excluding foreign exchange-rate effects and the consideration of Venezuela as a hyperinflationary economy, revenues would have increased by 4.9% in 2010 compared with 2009.
Other income
Other income amounted to €5,869 million in 2010, up from €1,645 million in 2009. In 2010, other income included a €3,797 million capital gain arising from the positive impact of re-measuring the previously held investment in Vivo at the acquisition date of the 50% stake of Brasilcel held by Portugal Telecom. Other income in 2009 included a €220 million gain on the sale of the stake in Medi Telecom.
Total expenses
Total expenses, which includes supplies, personnel expenses and other expenses (mainly external services and taxes other than corporate income tax), rose 14.1% to €40,829 million in 2010 from €35,773 million in 2009. Total expenses do not include depreciation and amortization. This increase was caused by the recognition of non-recurring restructuring costs of €1,262 million in the second half of 2010, stemming primarily from the restructuring of the workforces of several companies (€658 million) and firm commitments related to the Telefónica Foundation's social program (€400 million, €280 million of which was recognized by Telefónica, S.A. and the remainder by Telefónica Latin America). Excluding foreign exchange rate effects and the consideration of Venezuela as a hyperinflationary economy, total expenses would have increased by 11.1% in 2010 compared to 2009.
Supplies
Supplies increased 5.3% to €17,606 million in 2010 compared to €16,717 million in 2009. Supplies, excluding foreign exchange rate effects and the consideration of Venezuela as a hyperinflationary economy, would have
• Foreign exchange gains and losses for the year ended December 31, 2011 increased financial expenses by €29 million.
24

increased by 3.1% from 2009 to 2010. This variance was mainly the result of lower mobile termination expenses in Telefónica Spain, which offset the increase in demand for terminals in our three geographic regions.
Personnel expenses
Personnel expenses increased 24.1% to €8,409 million in 2010 compared to €6,775 million in 2009. Personnel expenses, excluding foreign exchange-rate effects and the consideration of Venezuela as a hyperinflationary economy, would have increased by 20.5% from 2009 to 2010. The increase was primarily due to restructuring of the workforces of several Group companies. In the third quarter of the year, €202 million was recognized, principally for restructuring expenses booked in Germany. The increase was also affected by the reassessment of estimates made in years prior to 2009 of employee obligations, capitalized as a decrease in costs, relating primarily to Telefónica Spain.
Other expenses
Other expenses increased 20.6% to €14,814 million in 2010 from €12,281 million in 2009. Other expenses, excluding foreign exchange-rate effects and the consideration of Venezuela as a hyperinflationary economy, would have increased by 16.8% in 2010. This increase was mainly the result of increased commercial efforts in all three segments and higher network management and systems costs in Telefónica Latin America. This item also included firm commitments related to the Telefónica Foundation's social program (€400 million).
Operating income before depreciation and amortization (OIBDA)
As a result of the foregoing, OIBDA amounted to €25,777 million in 2010.
For a reconciliation of OIBDA to operating income, see “Item 5. Operating and Financial Review and Prospects—Operating Results—Presentation of Financial Information—Non-GAAP financial information—Operating income before depreciation and amortization.”
Depreciation and amortization
Depreciation and amortization increased 3.9% to €9,303 million in 2010 from €8,956 million in 2009. Excluding foreign exchange rate effects and the consideration of Venezuela as a hyperinflationary economy, depreciation and amortization would have increased by 1.6% from 2009 to 2010, principally driven by Telefónica Latin America and Telefónica Europe depreciation and amortization increases. Amortization includes the amortization recognized in the fourth quarter of 2010 related to certain assets acquired as part of the purchase price allocation of Vivo (€84 million).
Operating income
As a result of the foregoing, operating income increased 20.7% to €16,474 million in 2010 from €13,647 million in 2009. Excluding foreign exchange rate effects and the consideration of Venezuela as a hyperinflationary economy, operating income would have increased by 22.4% in the year.
Share of profit (loss) of associates
The share of profit of associates in 2010 amounted to €76 million, 61.7% higher than in 2009 due mainly to improved results from our stake in Telco, S.p.A.
Net financial expense
Net financial expense decreased by 20% in 2010 to €2,649 million. The effect derived from the consideration of Venezuela as a hyperinflationary economy resulted in a reduction in net financial expense of €521 million in 2010. Excluding such effect, the decrease in 2010 is largely explained by the following:
• Changes in accumulated foreign exchange gains and losses at December 31, 2010 from the year before, which resulted in lowering expenses by €172 million.
• The drop in interest rates in the year and changes in the present value of the obligations arising from redundancy programs and other financial transactions, which combined to reduce costs by €410 million. The change in the volume of debt, however, led to an increase in finance costs of €254 million. The net impact of these factors was a €156 million decrease in costs in 2010.
25

Net financial expenses at December 31, 2010 (excluding the aforementioned €191 million expense) amounted to €2,458 million, representing 4.9% of average total debt of €49,999 million.
Corporate income tax
Corporate income tax increased to €3,829 million in 2010 compared with €2,450 million in 2009 (an increase of 56.2%), affected by the reassessment of the value of recognized tax assets in Colombia in the
amount of €864 million. In addition, a tax effect of €321 million was recognized deriving from the re-measurement of the previously held investment in Vivo Participaçoes at the date of acquisition of the 50% stake of Brasilcel held by Portugal Telecom. The increase in corporate income tax was partially offset by tax credits generated in Mexico and Terra Brazil totaling €138 million, which are based on the expected taxable income to be generated by those companies.
Non-controlling interests
Results attributable to non-controlling interests amounted to a positive €95 million in 2010, compared with a negative €161 million in 2009, mainly caused by the non-controlling interests’ share of losses of Colombia Telecom, which increased after the reassessment of the value of recognized tax assets mentioned above, and which more than offset the non-controlling interests’ share of the profits of Vivo, Telesp, and Telefónica Czech Republic.
Profit for the year attributable to equity holders of the parent company
As a result of the foregoing, profit for the year attributable to equity holders of the parent increased by 30.7% to €10,167 million in 2010 from €7,776 million in 2009.
• The €191 million expense corresponding to the adjustment of the value of our investment in BBVA to its fair value from equity to financial results. This interest continues to be recognized as an available for sale financial asset.
26

Segment Results
In the comparison below of our results of operations, we have provided certain comparisons at constant exchange rates in order to present an analysis of the development of our results of operations from year-to-year without the effects of currency fluctuations. To make such comparisons, we have converted into euro certain financial items for the relevant year using the prior year’s average exchange rate. We refer to such comparisons as being made “excluding foreign exchange rate effects.”
We also make certain comparisons on a local currency basis. To make comparisons on a local currency basis, we compare financial items in the relevant local currency for the periods indicated as recorded in the relevant local currency for such periods.
Percent Change Year ended December 31, 2009 vs. 2010 2010 vs. 2011 2009 % 2010 % 2011 % Reported Excl. FX(1) Reported Excl. FX(1)
(in millions of euro, except percentages)Revenues 56,731 60,737 62,837 7.1% 4.9% 3.5% 4.2%Telefónica Spain 19,703 34.7% 18,711 30.8% 17,284 27.5% (5.0)% (5.0)% (7.6)% (7.6)%Telefónica Europe 13,954 24.6% 15,724 25.9% 15,524 24.7% 12.7% 10.1% (1.3)% (1.0)%Telefónica Latin America 22,709 40.0% 25,756 42.4% 29,237 46.5% 13.4% 10.0% 13.5% 15.1%OIBDA 22,603 25,777 20,210 14.0% 13.0% (21.6)% (21.2)%Telefónica Spain 9,757 43.2% 8,520 33.1% 5,072 25.1% (12.7)% (12.7)% (40.5)% (40.5)%Telefónica Europe 3,999 17.7% 4,080 15.8% 4,233 20.9% 2.0% (0.6)% 3.8% 3.7%Telefónica Latin America 9,041 40.0% 13,713 53.2% 10,941 54.1% 51.7% 50.6% (20.2)% (19.4)%OIBDA Margin 39.8% 42.4% 32.2% Telefónica Spain 49.5% 45.5% 29.3% Telefónica Europe 28.7% 25.9% 27.3% Telefónica Latin America 39.8% 53.2% 37.4% Operating income 13,647 16,474 10,064 20.7% 22.4% (38.9)% (38.1)%Telefónica Spain 7,617 55.8% 6,511 39.5% 2,984 29.7% (14.5)% (14.5)% (54.2)% (54.2)%Telefónica Europe 1,011 7.4% 879 5.3% 1,116 11.1% (13.1)% (16.8)% 27.0% 26.5%Telefónica Latin America 5,341 39.1% 9,759 59.2% 6,157 61.2% 82.7% 88.0% (36.9)% (35.5)%Net Results 7,776 10,167 5,403
(1) Excludes the effects of exchange rates and hyperinflation in Venezuela.
27

Revenues and OIBDA Contribution by Country
28

As the preceding tables illustrate, the Telefónica Group is highly diversified geographically, with the Europe (including Spain) and Latin America regions contributing similar proportions of overall revenues in 2011. Spain and Brazil are the largest single contributors to Group revenue and OIBDA on a country-by-country basis, followed by the United Kingdom, Germany, Venezuela, Argentina and Chile. Together, these countries accounted for 83% of OIBDA and 82% of Group revenue in 2011 (72% of OIBDA and 81% of revenue in 2010 and 84% of OIBDA and 82% of revenue in 2009). As a result, most of the information detailed below relates to operations in these regions.
29

Contribution to Growth by Country
30

Telefónica Latin America
Accesses
Competitive positioning
At December 31, Percent Change 2009 2010 2011 2009 vs. 2010 2010 vs. 2011 (in thousands)
Fixed telephony accesses(1) 24,578.3 24,403.6 23,960.7 (0.7)% (1.8)%Internet and data accesses 7,605.2 8,235.1 8,885.9 8.3% 7.9%
Narrowband accesses(2) 1,070.6 674.8 389.4 (37.0)% (42.3)%Broadband accesses(3)(4) 6,426.8 7,442.3 8,385.9 15.8% 12.7%Other accesses(5) 107.8 118.0 110.6 9.5% (6.3)%
Mobile accesses 134,698.9 149,255.4 166,297.9 10.8% 11.4%Pre-pay accesses 111,503.6 119,359.1 131,087.2 7.0% 9.8%Contract accesses 23,195.4 29,896.3 35,210.7 28.9% 17.8%
Pay TV accesses(6) 1,648.6 1,792.7 2,257.7 8.7% 25.9%Final clients accesses 168,531.1 183,686.9 201,402.2 9.0% 9.6%Wholesale accesses 56.1 55.9 50.9 (0.4)% (9.0)%Total accesses 168,587.2 183,742.8 201,453.0 9.0% 9.6%
(1) PSTN (including public use telephony) x1; ISDN basic access x1; ISDN primary access.
(2) Includes Terra Brazil and Terra Colombia narrowband ISP accesses.
(3) Includes Terra Brazil and Terra Mexico narrowband ISP accesses.
(4) Includes ADSL, satellite, fiber optic, cable modem and broadband circuits.
(5) Includes remaining non-broadband retail circuits.
(6) Includes accesses by 153 thousand TVA clients at June 2011.
Market Share Mobile Business(1) At December 31, 2009 2010 2011Brazil 29.7% 29.7% 29.5%Argentina 33.0% 31.0% 29.8%Chile 42.8% 41.4% 39.1%Peru 63.2% 63.4% 61.4%Colombia 21.3% 22.4% 22.4%Venezuela 36.9% 32.7% 32.7%Mexico 20.9% 21.5% 21.1%Central America 22.4% 22.5% 21.7%Ecuador 28.4% 28.2% 28.4%Uruguay 39.3% 38.5% 38.0%
(1) Internal estimates
Market Share Internet and Data Business(1) At December 31, 2009 2010 2011Brazil 23.2% 24.8% 21.9%Argentina 32.0% 31.9% 31.1%Chile 46.1% 45.5% 43.0%Peru 93.9% 91.2% 90.1%Colombia 18.9% 20.8% 18.1%
(1) Internal estimates
31

Key trends in the mobile business:
Key trends in the fixed line business:
Results
(1) Excludes the effects of exchange rates and hyperinflation in Venezuela.
2011 Results of Operations:
Telefónica Latin America represented 47% of consolidated revenue and 54% of consolidated OIBDA in 2011. It was also the largest contributor (6.4 percentage points) to revenue growth in the year. At the OIBDA level, the contribution declined 10.3 percentage points due to the recognition in 2010 of €3,797 million derived from the re-measurement of our previously held investment in Vivo at its fair value at the date of our acquisition of the 50% of Brasilcel held by Portugal Telecom.
Telefónica Latin America reported a 13.5% increase in revenue to €29,237 million in 2011, despite the negative impact (-1.6 percentage points) of foreign-exchange rate effects and the consideration of Venezuela as a hyperinflationary economy. Results for this region are also impacted by the full consolidation of Vivo, from October 2010. Excluding Mexico, which was affected by increased pre-pay revenues and a sharp reduction in mobile termination rates, revenue growth was still strong. The mobile business was driven by sharp increases in both
• We achieved considerable growth in accesses in 2011 (11%), driven by an 18.7% increase in Brazil to 71.6 million accesses, despite the disconnection of approximately one million inactive pre-pay mobile accesses during the year. This represented an acceleration in the pace of growth compared with the prior year and boosted Brazil’s share of total accesses.
• Our contract customer base grew 18% in 2011 and represented 21% of total mobile accesses in Latin America, in line with our growth strategy for the region.
• Mobile broadband accesses increased 114% and represented 10% of the region’s total accesses, helping drive overall growth in revenues.
• Traffic in Telefónica Latin America grew 13% in 2011, outpacing the growth of accesses.
• Total mobile ARPU in the Latinamerican region, excluding foreign exchange rate and hyperinflation effects, increased despite cuts to interconnection prices during the year.
• Broadband accesses grew 13% in 2011 to 8.4 million, thanks to improved service and faster speeds offered at more competitive prices amid fierce competition.
• Our commercial repositioning, through new high definition channels and prepaid TV offers in some business units, drove a 26% increase in TV accesses to 2.3 million.
• There were fixed line access losses of 2%, despite our ongoing commitment to bundling services, which we consider our best line-retention tool.
Percent Change Year ended December 31, 2009 vs. 2010 2010 vs. 2011 2009 2010 2011 Reported Excl. FX(1) Reported Excl. FX(1) (in millions of euro, except percentages) Revenues 22,709 25,756 29,237 13.4% 10.0% 13.5% 15.1%OIBDA 9,041 13,713 10,941 51.7% 50.6% (20.2)% (19.4)%OIBDA margin 39.8% 53.2% 37.4% 13.4 p.p. 14.5 p.p. (15.8) p.p. (16.0) p.p.Depreciation and amortization (3,700) (3,954) (4,783) 6.9% (4.0)% 21.0% 21.1%Operating income 5,341 9,759 6,157 82.7% 88.0% (36.9)% (35.5)%
32

customer bases and mobile ARPU in nearly all countries. Revenue in the fixed line business was negatively impacted by a decline in fixed lines, which outweighed growth in broadband and TV, with significant competitive pressures driving down ARPU.
Finally, revenue trends show higher growth in mobile service revenues due to the Group's efforts to boost commercial activity (e.g. increased spending by content and service providers, increased cost of high-end handsets) in a effort to tap the growth potential of the market despite the negative short-term impact on commercial expenses.
Brazil represented 49% of total revenue in Latin America in 2011, reinforcing its status as the region’s leading market and the main driver of our organic revenue growth in Latin America.
Total expenses in 2011 were €19,502 million, up 15% compared with 2010. In 2010, total expenses were €16,936 million, to which amount we would add €1,638 million if we incorporated the additional50% of Vivo from January to September to make it comparable with 2011. Additionally, in 2010 we recorded non-recurring restructuring charges of €410 million. Also, foreign exchange rates and hyperinflationcontributed €261 million to total expenses. Excluding mainly the above-mentioned effects, total expenses would be comparable and would have grown by 5.8%. This increase compared with 2010 is explained byhigher commercial activity than in the same period a year earlier, aimed at boosting the Company´s future revenue growth.
Supplies expenses increased as the result of market dynamics driven by the growth of new businesses. Thus, content provider and services expenses growth was posted, as well as higher circuits, sites and towers expenses and higher handset costs, affected in particular by the increasing weight of high-end handsets such as smartphones.
Personnel expenses increased, as the result of the internalization of contractors in Brazil and higher inflation in some Latin American markets.
Other expenses increased, as a consequence of efforts to maintain high levels of quality and customer care resulting in higher commissions, higher network and systems costs, as well as higher energy costslinked to new sites as a result of higher network deployment.
OIBDA for Telefónica Latin America fell 20.2% in 2011 to €10,941 million and was impacted by:
Excluding these effects, OIBDA for Telefónica Latin America was virtually flat in 2011, as revenue growth was offset by increased commercial activity and efforts to enhance quality, which affected
network and systems costs, and customer service.
2010 Results of Operations:
Revenues at Telefónica Latin America increased 13.4% to €25,756 million in 2010 from €22,709 million in 2009 (an increase of 10% excluding foreign-exchange rate effects and the consideration of Venezuela as a hyperinflationary economy). Telefónica Latin America’s revenues were affected considerably by the acquisition of the additional stake in Vivo (50%), which led to its full consolidation. If we had included the additional 50% of Vivo in the fourth quarter of 2009, revenue that year would have increased by slightly more than €686 million, leaving an
• The consolidation of the additional 50% of Vivo in 2011. If this acquisition would have taken place in early 2010, OIBDA in 2010 would have been approximately €900 million higher.
• Foreign exchange rates and hyperinflation in Venezuela, which detracted €128 million from OIBDA in Latin America.
• The recognition in 2010 of €3,797 million derived from the re-measurement of our previously held investment in Vivo at its fair value at the date of our acquisition of the 50% of Brasilcel previouslyheld by Portugal Telecom.
• The recognition in 2010 of non-recurring restructuring charges of €410 million.
33

increase in the year of nearly 7%, driven by growth in the mobile businesses due to large gains in accesses throughout the region.
Telefónica Latin America’s OIBDA increased 51.7% to €13,713 million in 2010 from €9,041 million in 2009 (an increase of 50.6% excluding foreign exchange-rate effects and the consideration of Venezuela as a hyperinflationary economy). This increase was affected by a number of factors, including:
Total restructuring costs recognized in 2010 amounted to €410 million. Excluding these impacts, OIBDA rose 9%, driven by the good performance of revenues and greater efficiencies achieved from
regional integration projects and proceeds from the disposal of non-strategic assets (€61 million and €242 million, respectively).
• The positive impact derived from re-measuring our previously held investment in Vivo at the date of our acquisition of the 50% stake in Brasilcel previously held by Portugal Telecom (€3,797 million).
• For purposes of comparison, we add the additional 50% of Vivo (€250 million) to results for the fourth quarter of 2009.
• In 2010, personnel expenses were impacted by non-recurring workforce restructuring expenses, mainly in Argentina (€40 million), Brazil (€60 million), Peru (€23 million), Chile (€12 million) and Colombia (€10 million).
• Other one-off expenses included firm commitments related to Telefónica’s social program (The Telefónica Foundation) amounting to €120 million.
34

Brazil
The Brazilian telecommunications market continues to grow rapidly. It leads the region in adopting new services, with significant progress in mobile and broadband data. In this setting, our operations in Brazil during 2011 also fared well. Telefónica Brasil remained the market leader in mobile accesses and revenues in 2011, although its share in fixed broadband accesses eroded due to aggressive commercial efforts by competitors. It managed to do this by improving the products and services offered. During the year, the company launched fixed wireless service in 90 cities outside Sao Paulo, expanding fixed services beyond its traditional service territories. It also launched a push-to-talk mobile service and began offering high definition products to satellite TV customers. Additionally, after acquiring spectrum in 2010, the company commenced commercial activity in 2011 in the 1800Mhz band in the North and North-eastern regions (in October), Bahia, Sergipe and Espiritu Santo (in November), and Sao Paulo, Rio and Parana Santa Catalina (in December), boosting its commercial position, particularly in the pre-pay segment.
It also repositioned pre-pay with a new “Vivo sempre” rate, boosting top-ups and local and long-distance traffic.
As a result of all the new commercial initiatives, Telefónica ended 2011 with 87.2 million accesses in Brazil (a 15% increase compared with 2010), with strong growth in both mobile (19% increase) and fixed broadband (10% increase) accesses.
At December 31, Percent Change 2009 2010 2011 2009 vs. 2010 2010 vs. 2011 (in thousands) Fixed telephony accesses(1) 11,253.8 11,292.6 10,977.4 0.3% (2.8)%Internet and data accesses 3,440.2 3,848.2 3,942.6 11.9% 2.5%
Narrowband accesses 723.1 446.2 214.5 (38.3)% (51.9)%Broadband accesses(2) 2,638.4 3,319.2 3,648.0 25.8% 9.9%Other accesses(3) 78.7 82.8 80.0 5.2% (3.3)%
Mobile accesses 51,744.4 60,292.5 71,553.6 16.5% 18.7%Pre-pay accesses 41,960.7 47,658.6 55,438.1 13.6% 16.3%Contract accesses 9,783.7 12,633.9 16,115.5 29.1% 27.6%
Pay TV accesses(4) 487.2 486.3 698.6 (0.2)% 43.7%Final clients accesses 66,925.7 75,919.6 87,172.1 13.4% 14.8%Wholesale accesses 34.2 33.9 28.0 (0.9)% (17.3)%Total accesses 66,959.8 75,953.5 87,200.1 13.4% 14.8%
(1) PSTN (including public use telephony) x1; ISDN basic access x1; ISDN primary access 2/6 access x30; includes our accesses for internal use and total accesses from “fixed wireless”.
(2) Includes ADSL, satellite, fiber optic, cable modem and broadband circuits.
(3) Includes remaining non-broadband retail circuits.
(4) Includes accesses by 153 thousand TVA clients at June 2011.
Year ended December 31, Percent Change
2009 2010 20112009 vs. 2010 2010 vs. 2011
Euro Local Currency Euro Local Currency (in millions of euro, except percentages)Revenues 8,376 11,119 14,326 32.8% 12.1% 28.8% 28.7%
Mobile business 3,036 4,959 8,437 63.4% 37.9% n.c. n.c.Service revenues 2,792 4,649 8,014 66.5% 40.3% n.c. n.c.
Fixed telephony business 5,766 6,843 5,890 18.7% 0.2% n.c. n.c.OIBDA 3,139 4,074 5,302 29.8% 9.6% 30.2% 30.0%OIBDA Margin 37.5% 36.6% 37.0% (0.9) p.p. (0.9) p.p. 0.4 p.p. 0.4 p.p.CAPEX 1,228 1,797 2,468 46.4% 23.6% 37.4% 37.2%OpCF (OIBDA – CAPEX) 1,911 2,277 2,834 19.1% 0.6% 24.5% 24.3%
35

2011 Results
Revenues
Revenues in Brazil were impacted by a number of factors:
In addition, following the transfer of the long-distance license from Telesp to Vivo in the last quarter of 2011, long-distance revenues were reclassified such that long-distance revenues arising in the mobile
network are attributed to the mobile business and those from the fixed network to the fixed line business, shown net of eliminations. This has no impact at the consolidated level, but affects comparability of the mobile and fixed line businesses between years.
Like-for-like mobile service revenues (i.e., including the impacts in both years) were 10.6% higher in 2011, in line with the growth in our customer base, with ARPU falling 3.6% due to aggressive commercial activity in the region. Meanwhile, the data business fared well, representing 24% of service revenues and emerging as what we expect to be a key driver of the company’s future growth.
In the fixed line business, revenue adjusted for the transfer of the long-distance license was down 1.4% in local currency. Growth in broadband (11% in local currency) and TV (45% in local currency, but
not comparable due to the addition of TVA) was insufficient to offset the decline in the traditional voice business, mainly because of the loss of open lines (not bundled or pre-pay or controlled usage).
OIBDA
OIBDA for Telefónica Brasil was €5,302 million in 2011. As with revenues, comparisons of OIBDA are not meaningful because of the inclusion of the additional 50% of Vivo since October 2010, the contribution of which to OIBDA in the first nine months of 2010 would have been approximately €900 million. Excluding this impact and the €60 million recognized in 2010 in connection with a workforce restructuring, the OIBDA margin would be similar in 2011 and 2010. OIBDA also includes proceeds from the disposal of non-strategic assets of €186 million in 2011 and €117 million in 2010.
2010 Results
Revenues
Revenues for Telefónica Latin America in Brazil rose 32.8% to €11,119 million in 2010 from €8,376 million in 2009 (an increase of 12.1% in local currency), though the figure is distorted by the acquisition of 50% of Vivo in October 2010.
With respect to Vivo, Telefónica Latin America’s mobile business in Brazil, revenue growth was driven by the increase in the customer base (usage and data). With respect to Telesp, Telefónica Latin America’s fixed line business in Brazil, revenue growth was virtually flat excluding foreign exchange rate effects, as growth in broadband and data was undermined by a decrease in the traditional business.
• The consolidation of the additional 50% of Vivo since October 2010, which affects period-to-period comparison.
• The full consolidation of TVA contributed €81 million to revenue and €22 million to OIBDA for Brazil in 2011.
Year ended December 31, Percent Change (local currency) 2009 2010 2011 2009 vs. 2010 2010 vs. 2011
Traffic (millions of minutes) 52,134 77,463 92,081 48.6% n.c.ARPU (in euro) 9.9 11.0 10.2 (6.0)% n.c.
36

OIBDA
Telefónica Latin America’s OIBDA in Brazil increased 29.8% to €4,074 million in 2010 from €3,139 million in 2009 (an increase of 9.6% in local currency). As explained above, Vivo was included in 2010, affecting comparability.
For purposes of comparison, we could add the additional 50% of Vivo (€250 million) to results for the fourth quarter of 2009. In addition, a €60 million workforce restructuring charge was recognized in 2010.
Argentina
(2) Includes ADSL, satellite, fiber optic, cable modem and broadband circuits.
Telefónica de Argentina continued to focus more on value than volume in 2011, causing it to lose mobile access market share (down 1.2 percentage points from 2010 to 29.8%), but enabling it to remain the leader in terms of revenues. Commercial activity in the mobile business was strong in 2011. Net adds in accesses grew during the year, while the contract segment also delivered a solid performance, with growth of 7% and a penetration rate of 37% of the total access base.
In the fixed line business, the company remained the leader in both fixed line and broadband accesses in Argentina, maintaining growth in number of lines in contrast to the rest of its operations in the region.
At December 31, Percent Change 2009 2010 2011 2009 vs. 2010 2010 vs. 2011 (in thousands) Fixed telephony accesses(1) 4,607.7 4,621.5 4,611.0 0.3% (0.2)%Fixed wireless accesses 36.2 35.5 38.2 (1.9)% 7.6%Internet and data accesses 1,351.0 1,505.4 1,630.7 11.4% 8.3%
Narrowband accesses 112.7 65.7 35.7 (41.7)% (45.7)%Broadband accesses(2) 1,238.3 1,439.7 1,595.1 16.3% 10.8%
Mobile accesses 15,931.9 16,148.9 16,766.7 1.4% 3.8%Pre-pay accesses 10,736.8 10,370.4 10,581.3 (3.4)% 2.0%Contract accesses 5,195.2 5,778.5 6,185.4 11.2% 7.0%
Final clients accesses 21,890.7 22,275.8 23,008.4 1.8% 3.3%Wholesale accesses 9.3 13.0 13.9 39.8% 7.0%Total accesses 21,900.0 22,288.8 23,002.3 1.8% 3.3%
(1) PSTN (including public use telephony) x1; ISDN basic access x1; ISDN primary access 2/6 access x30; includes our accesses for internal use and total accesses from “fixed wireless”.
Year ended December 31, Percent Change
2009 2010 20112009 vs. 2010 2010 vs. 2011
Euro Local Currency Euro Local Currency (in millions of euro, except percentages)Revenues 2,609 3,073 3,174 17.8% 17.9% 3.3% 14.5%
Mobile business 1,643 1,979 2,039 20.4% 20.6% 3.0% 14.2%Service revenues 1,522 1,845 1,880 21.2% 21.4% 1.9% 12.9%
Fixed telephony business 1,047 1,187 1,237 13.3% 13.5% 4.3% 15.6%OIBDA 986 1,082 1,085 9.7% 9.8% 0.2% 11.1%OIBDA Margin 36.8% 34.3% 33.4% (2.5) p.p. (2.5) p.p. (0.9) p.p. (0.9) p.p.CAPEX 319 398 449 25.1% 25.2% 12.6% 24.9%OpCF (OIBDA – CAPEX) 668 684 636 2.4% 2.5% (7.0)% 3.1%
37

2011 Results
Revenues
Growth in mobile service revenues in Argentina (12.9% excluding foreign exchange rate effects) was driven by a base of higher value customers, as reflected in the increase in ARPU and the weight of the
contract segment. Mobile data ARPU growth was driven by both the positive performance of SMS and the higher number of customers with data rates.
Revenues in the fixed line business increased 15.6% in local currency due to higher Internet and content revenues (an increase of 29.5%) stemming from the growth in the broadband customer base, and to higher data, IT and capacity lease revenue (an increase of 18.1%).
OIBDA
OIBDA at Telefónica in Argentina was €1,085 million in 2011, virtually flat compared with 2010 but up 11.1% in local currency. Revenue growth was not fully reflected in OIBDA due to general price increases, which increased expenses.
2010 results
Revenues
Telefónica Móviles Argentina’s revenues increased by 20.4% to €1,979 million in 2010 from €1,643 million in 2009 (an increase of 20.6% in local currency). This increase was primarily driven by an increase of 21.3% in service revenues in 2010 (an increase of 21.4% in local currency). This growth in local currency was mainly due to data revenue growth and increased usage.
Revenues in the fixed line business increased 13.3% to €1,187 million in 2010 from €1,047 million in 2009 (an increase of 13.5% in local currency), with 6.3% growth in the traditional fixed line business, 29.2% growth in the Internet TV and content business and 16.9% growth in the data and IT businesses.
OIBDA
Telefónica Latin America’s OIBDA in Argentina increased 9.8% in local currency, impacted by the recognition of €40 million in 2010 related to a workforce restructuring plan.
Venezuela
Year ended December 31, Percent Change (local currency) 2009 2010 2011 2009 vs. 2010 2010 vs. 2011
Traffic (millions of minutes) 15,562 17,550 18,788 12.8% 7.1%ARPU (in euro) 8.6 9.2 9.7 6.7% 17.3%
At December 31, Percent Change 2009 2010 2011 2009 vs. 2010 2010 vs. 2011 (in thousands) Mobile accesses 10,531.4 9,514.7 9,438.7 (9.7)% (0.8)%
Pre-pay accesses 9,891.1 8,740.3 8,570.9 (11.6)% (1.9)%Contract accesses 640.3 774.4 867.8 20.9% 12.1%
Fixed wireless accesses 1,214.3 966.2 883.4 (20.4)% (8.6)%Pay TV accesses 62.8 69.3 114.3 10.4% 65.0%Total accesses 11,808.5 10,550.2 10,436.4 (10.7)% (1.1)%
38

Telefónica Móviles Venezuela remained the market leader in 2011 in terms of accesses. The company reinforced its leadership by focusing its strategy on innovating and maximizing customer value. Services launched in the year include Movitalk (push-to-talk) and HD pay-TV services. In a country with high smartphone penetration, the company also continued to focus on commercial campaigns to promote mobile broadband adoption.
2011 results
Revenues
Growth in mobile service revenues in Venezuela (12.8% excluding foreign exchange rate effects) was driven heavily by higher ARPU, despite lower interconnection prices, which had a negative impact of €22 million in the year.
Data revenues remained a key growth driver, increasing 23.7% in the year and representing 36% (a three percentage point increase) of mobile service revenues.
OIBDA
OIBDA at Telefónica Móviles Venezuela increased 4.4% in 2011 to €1,177 million. The company’s OIBDA margin was 43.8% (a decrease of three percentage points), with continued high levels of
efficiency in an environment characterized by widespread price increases that translated into higher personnel and subcontractor expenses.
2010 results
Revenues
Service revenues in 2010 increased 21.3% in local currency, excluding the consideration of Venezuela as a hyperinflationary economy. This growth in local currency was due mainly to the rollout of integrated telecommunication offers (mobile, fixed, pay TV and broadband) and the strong performance of smartphone revenues.
OIBDA
OIBDA increased by 10.4% in local currency, excluding the consideration of Venezuela as a hyperinflationary economy, despite measures implemented to manage high inflation rates.
Year ended December 31, Percent Change
2009 2010 20112009 vs. 2010 2010 vs. 2011
Euro Local Currency Euro Local Currency (in millions of euro, except percentages)Revenues 3,773 2,318 2,688 (38.6)% 15.0% 15.9% 11.2%
Service revenues 2,841 2,073 2,435 (27.0)% 21.3% 17.5% 12.8%OIBDA 1,818 1,087 1,177 (40.2)% 10.4% 8.2% 4.4%OIBDA Margin 48.2% 46.9% 43.8% (1.3) p.p. (1.3) p.p. (3.1) p.p. (3.1) p.p.CAPEX 423 293 372 (30.7)% 18.7% 26.9% 0.9%OpCF (OIBDA – CAPEX) 1,395 794 805 (43.1)% 7.7% 1.3% 5.6%
Year ended December 31, Percent Change (local currency) 2009 2010 2011 2009 vs. 2010 2010 vs. 2011
Traffic (millions of minutes) 14,951 14,195 14,529 (5.1)% 2.4%ARPU (in euro) 21.2 14.3 16.7 26.3% 24.8%
39

Chile
Telefónica Chile managed 9.5 million mobile accesses at December 31, 2011, an increase of 9% for the year amid fierce competition. During the year, the company disconnected 0.4 million inactive pre-pay accesses. The company remained the market leader in accesses, with a 39.1% share, despite aggressive commercial activity in the country.
In the fixed line business, broadband accesses increased by 7%. The TV business also fared well due to the launch of HD channels, in line with our strategy aimed at segmenting our product portfolio.
2011 Results
Revenues
Telefónica Chile’s mobile revenues increased 10.1% in local currency to €1,399 million in 2011, driven by the sharp growth in service revenues. Service revenues were 8.9% higher in local currency, with the growth in the customer base making up for decreases in ARPU caused by the drop in usage by pre-pay customers. Data revenues increased 34% and now account for 19% of total service revenues.
At December 31, Percent Change 2009 2010 2011 2009 vs. 2010 2010 vs. 2011 (in thousands) Fixed telephony accesses(1) 2,028.0 1,939.3 1,848.1 (4.4)% (4.7)%Internet and data accesses 807.2 836.0 887.4 3.6% 6.1%
Narrowband accesses 15.9 6.6 5.8 (58.5)% (12.3)%Broadband accesses(2) 783.2 821.5 878.1 4.9% 6.9%Other accesses(3) 8.1 7.9 3.5 (2.5)% (55.9)%
Mobile accesses 7,524.7 8,794.0 9,548.1 16.9% 8.6%Pre-pay accesses 5,435.9 6,179.3 6,732.7 13.7% 9.0%Contract accesses 2,088.8 2,614.7 2,815.4 25.2% 7.7%
Pay TV accesses 285.1 341.2 390.8 19.7% 14.5%Final clients accesses 10,645.0 11,910.5 12,674.4 11.9% 6.4%Wholesale accesses 8.9 5.3 5.2 (40.4)% (2.2)%Total accesses 10,653.8 11,915.8 12,679.6 11.8% 6.4%
(1) PSTN (including public use telephony) x1; ISDN basic access x1; ISDN primary access 2/6 access x30; includes our accesses for internal use and total accesses from “fixed wireless”.
(2) Includes ADSL, satellite, fiber optic, cable modem and broadband circuits.
(3) Includes remaining non-broadband retail circuits.
Year ended December 31, Percent Change
2009 2010 20112009 vs. 2010 2010 vs. 2011
Euro Local Currency Euro Local Currency (in millions of euro, except percentages)Revenues 1,831 2,197 2,310 20.0% 4.3% 5.2% 4.8%
Mobile business 1,010 1,266 1,399 25.4% 9.0% 10.5% 10.1%Service revenues 918 1,175 1,283 28.0% 11.2% 9.2% 8.9%
Fixed telephony business 893 1,038 1,037 16.3% 1.1% (0.1)% (0.4)%OIBDA 763 1,092 1,035 43.2% 24.5% (5.2)% (5.5)%
OIBDA Margin 41.7% 49.7% 44.8% 8.0 p.p. 8.0 p.p. (4.9) p.p. (4.9) p.p.CAPEX 347 516 529 48.8% 29.3% 2.4% 2.1%OpCF (OIBDA – CAPEX) 416 576 507 38.5% 20.4% (12.0)% (12.3)%
40

Fixed line revenues in Chile were broadly unchanged from 2010, with the 12.3% increase in Internet, TV and content offsetting the 8% fall (in local currency) in revenues from the traditional business.
OIBDA
OIBDA fell 5.5% in local currency, partly due to the recognition in 2010 of compensation received on insurance contracts following earthquake damage in February 2010 that was recorded in 2010 and the sale of non-strategic assets totaling €15 million and €50 million in 2010 and 2011, respectively. OIBDA was also impacted in the year by the 24% increase in supply costs (excluding foreign exchange rate effects) caused by higher interconnection costs in the face of increased traffic and higher equipment costs and because of greater commercial activity in the mobile business attributable to purchases of high-end handsets.
2010 results
Revenues
Telefónica Latin America’s revenues from Chile increased 4.3% in local currency due to positive revenue performances in both the fixed and mobile businesses. With respect to Telefónica Móviles Chile, Telefónica Latin America’s mobile business in Chile, revenues increased 9.0% in local currency. Service revenues increased by 27.9% to €1,175 million in 2010 (an increase of 11.2% in local currency) due to growth in voice and data services revenues. With respect to Telefónica Latin America’s fixed line business in Chile, revenues in 2010 increased 16.3% to €1,038 million from €893 million in 2009 (an increase of 1.1% in local currency). Broadband, pay TV, data and IT businesses growth offset the decrease in revenues from the traditional fixed telephony business.
OIBDA
Telefónica Latin America’s OIBDA in Chile increased 43.2% to €1,092 million in 2010 from €763 million in 2009 (an increase of 24.5% in local currency).
Mexico
The year 2011 was marked by Telefónica Mexico’s commercial repositioning, aimed toward adapting its rates in the wake of interconnection price cuts, and by the more restrictive customer acquisition and retention policy adopted by the company. Telefónica Mexico managed 19.7 million mobile accesses at the end of 2011, roughly in line with the prior year.
Year ended December 31, Percent Change (local currency) 2009 2010 2011 2009 vs. 2010 2010 vs. 2011
Traffic (millions of minutes) 10,521 11,791 12,218 12.1% 3.6%ARPU (in euro) 10.7 12.1 11.6 (1.8)% (4.1)%
At December 31 Percent Change 2009 2010 2011 2009 vs. 2010 2010 vs. 2011 (in thousands) Mobile accesses 17,400.5 19,661.6 19,742.4 13.0% 0.4%
Pre-pay accesses 16,328.3 18,061.3 18,149.8 10.6% 0.5%Contract accesses 1,072.1 1,600.2 1,592.6 49.3% (0.5)%
Fixed wireless 334.3 565.5 745.3 69.2% 31.8%Total accesses 17,734.8 20,227.1 20,487.7 14.1% 1.3%
41

2011 results
Revenues
Service revenues in Mexico decreased 13.3% in local currency to €1,387 million, primarily because of reductions in interconnection prices and the impact of lower revenues from outgoing traffic in the pre-pay segment attributable to decreased usage. These changes prompted the company to launch new commercial offers in the second half of the year.
OIBDA
The decline in OIBDA was caused by increased costs associated with the company’s commercial repositioning efforts and 3G network deployment, as well as the impact of the interconnection price cuts explained above. Also, in 2011 the company completed a sale of non-strategic assets for €240 million.
2010 results
Revenues
Mobile service revenues increased 4.1% in 2010 primarily due to increases in the customer base increase and new tariff plans.
OIBDA
Telefónica Latin America’s OIBDA in Mexico increased by 10.5% to €623 million in 2010 from €564 million in 2009 (a decrease of 1.7% in local currency) due to enhanced commercial focus on contract net adds and increasing prepaid revenues.
Peru
Year ended December 31, Percent Change
2009 2010 20112009 vs. 2010 2010 vs. 2011
Euro Local Currency Euro Local Currency (in millions of euro, except percentages)Revenues 1,552 1,832 1,557 18.0% 5.0% (15.0)% (12.3)%
Service revenues 1,412 1,651 1,387 16.9% 4.1% (16.0)% (13.3)%OIBDA 564 623 572 10.5% (1.7)% (8.2)% (5.2)%OIBDA Margin 36.3% 34.0% 36.7% (2.3) p.p. (2.3) p.p. 2.7 p.p. 2.7 p.p.CAPEX 251 1,580 471 n.s. n.s. (70.2)% (69.2)%OpCF (OIBDA – CAPEX) 313 (957) 101 c.s. c.s. c.s. c.s.
At December 31, Percent Change 2009 2010 2011 2009 vs. 2010 2010 vs. 2011 (in thousands) Fixed telephony accesses(1) 2,971.2 2,871.2 2,848.4 (3.4)% (0.8)%Fixed wireless 582.7 537.8 444.6 (7.7)% (17.3)%Internet and data accesses 800.6 885.4 1,120.4 10.6% 26.5%
Narrowband accesses 16.9 15.4 9.4 (8.9)% (38.7)%Broadband accesses(2) 768.0 850.8 1,090.6 10.8% 28.2%Other accesses(3) 15.6 19.2 20.4 23.1% 6.1%
Mobile accesses 11,458.2 12,507.1 13,998.3 9.2% 11.9%Pre-pay accesses 10,214.2 10,104.4 11,079.6 (1.1)% 9.7%Contract accesses 1,244.1 2,402.7 2,918.7 93.1% 21.5%
Pay TV accesses 686.3 690.6 799.0 0.6% 15.7%Final clients accesses 15,916.3 16,954.3 18,766.1 6.5% 10.7%Wholesale accesses 0.5 0.5 0.4 n.a. (3.7)%Total accesses 15,916.8 16,954.8 18,766.6 6.5% 10.7%
42

Telefónica reinforced its leadership of the Peruvian market in 2011, with an 11% increase in total accesses, driven by growth in the mobile, pay TV and fixed broadband businesses.
2011 results
Revenues
Revenues increased 6% in local currency in 2011 due to the strong performance of the mobile business and despite reductions in interconnection prices in the mobile network.
OIBDA
OIBDA is not comparable due to the recognition in 2010 of proceeds from the disposal of non-strategic assets (€39 million) and expenses related to workforce restructuring (€23 million).
2010 results
Revenues
Revenues increased 14.2% to €1,960 million in 2010 from €1,716 million in 2009 (an increase of 2.0% in local currency), driven primarily by service revenue growth.
OIBDA
OIBDA increased 14.0% from €712 million in 2009 to €812 million in 2010, primarily due to overall growth in revenues.
(1) PSTN (including public use telephony) x1; ISDN basic access x1; ISDN primary access 2/6 access x30; includes our accesses for internal use and total accesses from “fixed wireless”.
(2) Includes ADSL, satellite, fiber optic, cable modem and broadband circuits.
(3) Includes remaining non-broadband retail circuits.
Year ended December 31, Percent Change
2009 2010 20112009 vs. 2010 2010 vs. 2011
Euro Local Currency Euro Local Currency (in millions of euro, except percentages)Revenues 1,716 1,960 2,030 14.2% 2.0% 3.6% 6.1%
Mobile business 840 1,001 1,088 19.2% 6.4% 8.7% 11.3%Service revenues 695 854 923 22.9% 9.7% 8.1% 10.6%
Fixed telephony business 1,006 1,097 1,069 9.0% (2.6)% (2.5)% (0.2)%OIBDA 712 812 751 14.0% 1.8% (7.6)% (5.3)%OIBDA Margin 41.5% 41.4% 37.0% (0.1) p.p. (0.1) p.p. (4.4) p.p. (4.4) p.p.CAPEX 271 295 302 8.9% (2.7)% 2.3% 4.8%OpCF (OIBDA – CAPEX) 442 517 449 17.1% 4.6% (13.2)% (11.1)%
43

Colombia
Despite strong competition, Telefónica was very active commercially in Colombia in 2011, ending the year with 13.8 million accesses, an increase of 11% compared with 2010.
2011 results
Revenues
Revenues increased 4.5% in local currency in 2011 due primarily to increased revenues from the mobile business.
OIBDA
OIBDA in Colombia increased 14.2% in 2011 and was impacted by sales of non-strategic assets during 2011 (€25 million) and 2010 (€71 million). Period-to-period comparability at the OIBDA level is also
impacted by the recognition in 2010 of an aggregate of €85 million of non-recurring workforce restructuring expenses, provisions for bad debts and third-party claims.
At December 31, Percent Change 2009 2010 2011 2009 vs. 2010 2010 vs. 2011 (in thousands) Fixed telephony accesses(1) 1,639.8 1,586.9 1,480.6 (3.2)% (6.7)%Internet and data accesses 428.4 553.6 620.3 29.2% 12.0%
Narrowband accesses 5.9 5.6 7.9 (5.1)% 41.5%Broadband accesses(2) 420.3 548.0 612.3 30.4% 11.7%Other accesses(3) 2.2 0.0 0.0 n.a. n.a.
Mobile accesses 8,964.6 10,004.5 11,391.1 11.6% 13.9%Pre-pay accesses 7,203.2 7,679.1 8,626.8 6.6% 12.3%Contract accesses 1,761.4 2,325.5 2,764.2 32.0% 18.9%
Pay TV accesses 127.2 205.3 255.0 61.4% 24.2%Final clients accesses 11,159.9 12,350.3 13,746.9 10.7% 11.3%Wholesale accesses 3.3 3.3 3.3 n.a. n.a.Total accesses 11,163.2 12,353.6 13,750.2 10.7% 11.3%
(1) PSTN (including public use telephony) x1; ISDN basic access x1; ISDN primary access 2/6 access x30; includes our accesses for internal use and total accesses from “fixed wireless”.
(2) Includes ADSL, satellite, fiber optic, cable modem and broadband circuits.
(3) Includes remaining non-broadband retail circuits.
Year ended December 31, Percent Change
2009 2010 20112009 vs. 2010 2010 vs. 2011
Euro Local Currency Euro Local Currency (in millions of euro, except percentages)Revenues 1,269 1,529 1,561 20.5% 1.3% 2.1% 4.5%
Mobile business 685 872 916 27.4% 7.1% 5.0% 7.5%Service revenues 647 814 851 25.8% 5.7% 4.5% 6.9%
Fixed telephony business 615 700 682 14.0% (4.2)% (2.7)% (0.4)%OIBDA 397 484 540 22.1% 2.6% 11.5% 14.2%OIBDA Margin 31.3% 31.7% 34.6% 0.4 p.p. 0.4 p.p. 2.9 p.p. 2.9 p.p.CAPEX 316 334 405 5.9% (11.0)% 21.2% 24.1%OpCF (OIBDA – CAPEX) 81 150 135 84.9% 55.4% (9.9)% (7.8)%
44

2010 results
Revenues
Revenues increased 20.5% to €1,529 million in 2010 from €1,269 million in 2009 (an increase of 1.3% in local currency) due a highly competitive environment both in mobile and fixed telephony.
OIBDA
OIBDA increased 22.1% from €397 million in 2009 to €484 million in 2010, primarily due to the growth in mobile business revenues. Telefónica Spain
Competitive positioning
At December 31, Percent Change 2009 2010 2011 2009 vs. 2010 2010 vs. 2011 (in thousands) Fixed telephony accesses(1) 14,200.1 13,279.7 12,305.4 (6.5)% (7.3)%Free ADSL 14.7 38.1 34.4 159.2% (9.6)%Internet and data accesses 5,722.5 5,879.8 5,710.9 2.7% (2.9)%
Narrowband accesses 219.5 136.1 84.4 (38.0)% (38.0)%Broadband accesses(2) 5,476.8 5,722.3 5,608.6 4.5% (2.0)%Other accesses(3) 26.2 21.4 17.9 (18.3)% (16.6)%
Mobile accesses 23,538.6 24,309.6 24,174.3 3.3% (0.6)%Pre-pay accesses 8,204.5 7,919.8 7,359.4 (3.5)% (7.1)%Contract accesses 15,334.1 16,389.7 16,814.9 6.9% 2.6%
Pay TV accesses 703.0 788.2 833.2 12.1% 5.7%Final clients accesses 44,164.2 44,257.4 43,023.8 0.2% (2.8)%
AMLT(4) 97.4 294.5 440.6 n.s. 49.6%Rented Bundles 2,153.8 2,477.1 2,881.1 15.0% 16.3%
Shared UL accesses 447.7 264.0 205.0 (41.0)% (22.3)%Unbundled local loop accesses(5) 1,706.1 2,213.1 2,676.1 29.7% 20.9%
Wholesale ADSL 359.0 561.3 709.6 56.4% 26.4%Other accesses(6) 3.7 0.9 0.6 (75.7)% (29.2)%Wholesale accesses 2,614.0 3,333.8 4,031.9 27.5% 20.9%Total accesses 46,778.2 47,591.2 47,055.7 1.7% (1.1)%
(1) PSTN (including public use telephony) x1; ISDN basic access x1; ISDN primary access 2/6 access x30; includes our accesses for internal use, VOIP and free ADSL.
(2) Includes ADSL, satellite, fiber optic, cable modem and broadband circuits.
(3) Rented circuits.
(4) Wholesale rental of Linea Telefónica.
(5) Includes naked shared UL.
(6) Wholesale circuits.
Market Share Mobile Business(1) At December 31, 2009 2010 2011Spain 42.5% 41.4% 39.6%
45

2011 Results of Operations
In 2011 the Spanish market was shaped by the economic downturn, with declines in the principal macroeconomic indicators in the latter months of the year, and a fiercely competitive environment with intense commercial pressure.
At the end of 2011, Telefónica Spain managed a total of 47.1 million accesses, nearly the same as in 2010 (a 1% decline) despite heavy pressure from competitors. Against this backdrop, Telefónica Spain’s market share fell slightly.
Fixed broadband Internet accesses fell 2.0% in 2011 as our commercial strategy focused more on “value” amid stiff competition, with a slowdown in promotional activity in certain months of the year before the September launch of a new ADSL offer boosted activity and net adds in the latter part of the year.
Telefónica Spain took a number of steps during the course of the year focused on reducing its operating costs (primarily the labor force reduction plan) and improving its competitive position. At the end of the third quarter, the company launched its new services catalog, which promotes customer exclusivity by offering cross discounts for customers whose entire telecommunications spend is with Movistar. The company also completed the repositioning of its commercial offerings in the fourth quarter of 2011 with the launch of new mobile rates for contract customers. The new rates combine voice, data and SMS offerings, eliminate the voice rate structure that varied depending on time of call and call destination and include unlimited SMS in all data tariffs. Rates are now structured by usage corresponding to the amount each customer wishes to spend. Also, in the fourth quarter of 2011, voice tariffs were streamlined for pre-pay customers with a highly competitive and flexible offer.
In the fixed line business, in the third quarter of 2011, Telefónica launched 10 mega ADSL with value-added services at €24.9 per month, while in the fourth quarter of the year it enhanced its offerings with a basic ADSL plan at €19.9 per month (excluding value-added services and fixed-to-mobile calls). Value-added services packages enjoyed greater adoption during the year.
2011 results
Revenues
Revenues for Telefónica Spain fell 7.6% in 2011 to €17,284 million, impacted by lower ARPU across all services and declining trends in accesses amid waning consumption and stronger pricing pressure.
Market Share Internet and Data Business(1) At December 31, 2009 2010 2011Spain 55.6% 53.4% 49.7%
(1) Internal estimates
Year ended December 31, Percent Change 2009 2010 2011 2009 vs. 2010 2010 vs. 2011 (in millions of euro, except percentages) Revenues 19,703 18,711 17,284 (5.0)% (7.6)%
Mobile business 8,965 8,550 7,747 (4.6)% (9.4)%Service revenues 7,828 7,270 6,548 (7.1)% (9.9)%
Fixed telephony business 12,167 11,397 10,631 (6.3)% (6.7)%OIBDA 9,757 8,520 5,072 (12.7)% (40.5)%OIBDA Margin 49.5% 45.5% 29.3% (4.0) p.p. (16.2) p.p.CAPEX 1,863 2,021 2,914 8.4% 44.2%OpCF (OIBDA – CAPEX) 7,894 6,499 2,158 (17.7)% (66.8)%
46

Telefónica Spain reported a 6.7% decrease in revenues in the fixed line business in 2011, principally due to declines in revenues from traditional access of 10.6%, a decrease in revenues from voice services of 9.0% (due to decreased in traffic and the increasing weight of flat rates) and a decrease in revenues from retail broadband services of 10.1% (due to a 10.2% fall in broadband ARPU attributable to lower effective prices).
Revenues from Telefónica Spain’s mobile business decreased by 9.4% in 2011 to €7,747 million, due mainly to a 9.9% decrease in mobile service revenues attributable to a 10% drop in ARPU and a slightly reduced customer base.
Mobile traffic continued to be impacted by lower customer usage, falling 4.3% in 2011.
Total ARPU decreased 10.2% in 2011 to €22.9 due largely to a 15.7% fall in voice ARPU, which was attributable to interconnection price cuts, lower usage and downward pressure on retail prices. Conversely, data ARPU increased 9.9% in 2011, representing 26% of total ARPU (a five percentage point increase), driven by the rapid growth of mobile broadband. Non-P2P SMS revenues were still the biggest growth driver in the data business, increasing by 24.1% in 2011 and representing 75% of total data revenues (an increase of eight percentage points). Data revenues increased 10.9% in 2011.
Expenses
Total expenses increased 20% in 2011 to €12,635 million due to the recognition of €2,591 million of restructuring costs related to workforce reduction programs with respect to 2010.
Supplies decreased on the back of lower interconnection costs and lower expenditures on purchases of mobile handsets.
Personnel expenses increased due to costs related to the redundancy program.
Other expenses remained largely stable, despite a greater commercial effort at the end of 2011.
OIBDA
OIBDA in 2011 amounted to €5,072 million, down 40.5% from 2010 due to the negative impact of expenses related to the recognition of workforce restructuring expenses (€2,591 million in the third quarter of 2011 and €202 million in the fourth quarter of 2010). Excluding the workforce restructuring expenses, OIBDA would have declined by 12% in 2011, primarily due to weaker revenue performance.
2010 results
Telefónica took control of Tuenti in 2010 pursuant to its strategy of strengthening its social networking presence. It began consolidating this company’s financial results in Telefónica Spain’s mobile business from August 2010, although the impact was not significant.
Revenues
Telefónica Spain’s revenues declined 5.0% in 2010 to €18,711 million, primarily affected by the increasingly challenging operating environment, greater pressure on customer revenues and lower revenues from universal service.
As of or for the year ended December 31, Percent Change 2009 2010 2011 2009 vs. 2010 2010 vs. 2011
Traffic (millions of minutes) 42,039 41,700 39,909 (0.8)% (4.3)%ARPU (in euro) 27.5 25.4 22.9 (7.3)% (10.2)% Pre-pay 12.6 11.4 9.3 (9.1)% (18.7)% Contract 36.5 32.6 29.1 (10.7)% (10.8)%APRU data (in euro) 5.4 5.5 6.0 1.6% 9.9%% of non-P2P SMS revenues over data revenues 60.6% 66.6% 74.6% 6.0 p.p. 7.9 p.p.
47

Revenues from Telefónica Spain’s fixed line business decreased 6.3% to €11,397 million, principally due to decreases in revenues from traditional accesses of 13.1%, (due to lower revenues from universal service and a reduction in the number of accesses), decreased revenues from traditional voice services of 10.9% (affected by lower traffic, mostly international and fixed-to-mobile, and the increasing portion of traffic included in national flat tariff plans), and decreased revenues from retail broadband of 4.3% (a 8.7% decrease of effective ARPU due to price promotions).
Revenues from Telefónica Spain’s mobile business decreased by 4.6% to €8,550 million, due mainly to a 7.1% fall in mobile service revenues (a 3.1 percentage point decrease caused by lower interconnection prices), which suffered from a 7.3% decrease in ARPU.
Traffic was 0.8% lower, reflecting lower customer usage.
Total ARPU decreased 7.3% to €25.4 in 2010, with a 9.5% decrease in voice ARPU because of interconnection price cuts, lower usage and downward pressure on prices. Conversely, data ARPU increased 1.6% during the year, underpinned by a larger contribution by connectivity revenues. As a result, data ARPU represented 21.4% of total ARPU (an increase of 1.9 percentage points compared with 2009). Non-P2P SMS contributed 67% to total data revenues. With the growth in connectivity revenues, data revenues accounted for 21% of services at the end of 2010.
Expenses
Telefónica Spain’s total expenses increased 0.6% to €10,504 million in 2010 compared to €10,443 million in 2009, including €202 million in restructuring expenses derived primarily from the restructuring of workforces and the recognition of a €107 million TV tax.
Supplies decreased 2.5% to €4,185 million in 2010 compared to €4,293 million in 2009, principally due to lower interconnection expenses related to MTR cuts, which offset increased mobile handset expenses.
Personnel expenses increased 15.3% to €2,658 million in 2010 compared to €2,305 million in 2009. Such increase was due primarily to the revision of estimates made prior to 2009 relating to personnel commitments and, particularly in the fourth quarter of 2010, due to restructuring expenses related to personnel reorganization and the negative impact of a higher-than-estimated Consumer Price Index figures.
Other expenses decreased 4.8% to €3,661 million in 2010 compared to €3,845 million in 2009. This decrease was the result of efforts by the company to decrease levels of uncollectible balances and occurred despite the recognition in 2010 of a TV tax provision.
OIBDA
Telefónica Spain’s OIBDA decreased 12.7% to €8,520 million in 2010, impacted by the recognition of non-recurring restructuring expenses related to workforce reduction plans (€202 million) and the TV tax (€107 million), by lower usage and stronger price pressure, which caused revenues to fall, and by stronger commercial efforts compared with the prior year. Telefónica Europe
At December 31, Percent Change 2009 2010 2011 2009 vs. 2010 2010 vs. 2011 (in thousands) Fixed telephony accesses(1) 1,827.5 3,672.4 3,853.1 101.0% 4.9%Internet and data accesses 1,754.7 4,496.4 4,537.4 156.2% 0.9%
Narrowband accesses 137.3 503.2 435.4 n.s. (13.5)%Broadband accesses 1,589.1 3,964.9 4,071.8 149.5% 2.7%Other accesses(2) 28.3 28.3 30.3 0.0% 6.9%
Mobile accesses 44,095.0 46,675.5 48,276.4 5.9% 3.4%Pre-pay accesses 23,098.5 23,994.9 23,800.3 3.9% (0.8)%Contract accesses 20,996.5 22,680.6 24,476.1 8.0% 7.9%
Pay TV accesses 137.6 206.4 219.0 50.0% 6.1%Final clients accesses 47,814.9 55,050.6 56,885.9 15.1% 3.3%Wholesale accesses(3) 1,425.2 1,247.7 1,213.2 (12.5)% (2.8)%Total accesses 49,240.1 56,298.3 58,099.1 14.3% 3.2%
48

Competitive positioning
(1) Internal estimates
Despite the economic downturn and strong competition in its markets, Telefónica Europe was able to expand its customer base in 2011 with growth in contract customers and mobile broadband adoption, two key value drivers.
Telefónica Europe represented 24.7% of consolidated revenues and 20.9% of consolidated OBIDA in 2011. It contributed 0.6 percentage points to the Group’s OIBDA growth excluding foreign exchange rate effects, with a 1.1 percentage point contribution from Germany. In terms of revenues, however, Telefónica Europe was responsible for a 0.3 percentage point reduction in overall growth due to 2011 declines in revenues in the United Kingdom, the Czech Republic and Ireland, which countries were impacted considerably by interconnection price cuts.
Key trends in the mobile business:
(1) PSTN (including public use telephony) x1; ISDN basic access x1; ISDN primary access 2/6 access x30; includes our accesses for internal use, VOIP and free ADSL.
(2) Includes remaining non-broadband retail circuits.
(3) Includes unbundled lines rented by Telefónica Germany. As of March 2010, Telefónica Europe accesses include HanseNet accesses.
Market Share Mobile Business(1) At December 31, 2009 2010 2011United Kingdom 26.2% 26.6% 26.6%Germany 14.6% 15.7% 16.1%Czech Republic 39.2% 38.5% 38.0%Ireland 32.3% 32.0% 33.2%Slovakia 9.8% 14.7% 18.3%
• Telefónica Europe achieved a 3% growth in accesses, led by Germany, where accesses increased 6.1% to 24.5 million at December 31, 2011, due to a 7.8% increase in mobile accesses.
• Commercial momentum was healthy, backed by a sharp increase in mobile contract customers, with net adds of 1.8 million 2011, an increase of 8% from 2010.
• Mobile broadband accesses increased 31% and represented 31% of the region’s total accesses, driving growth in revenues.
• ARPUs of Telefónica and some other European operators were under heavy pressure, affected by interconnection price cuts, an adverse economic backdrop (with waning consumption) and, in some cases, decreases in prices amid fierce competitive pressures.
49

(1) Excludes the effects of exchange rates.
2011 Results of Operations:
Revenues
Revenues at Telefónica Europe fell 1.3% to €15,524 million in 2011, with a negative foreign-exchange rate effect of 0.3 percentage points. Revenues were undermined by reductions in interconnection prices. Excluding this impact, revenues would have increased by 1.7% compared with 2010. Our mobile strategy, predicated on boosting mobile broadband penetration and limited-use data rates, was the principal factor driving revenue growth. As a result of this strategy, non-P2P SMS data revenues increased 33.5% and represented 43% of total data revenues. Total data revenues increased 10.9% and represented 42% of mobile service revenues (an increase of 6 percentage points compared with 2010).
Expenses
Total expenses decreased 3% in 2011 to €11,509 million. In 2010 expenses were impacted by restructuring expenses, mainly related to personnel reorganization. Supplies expenses decreased mainly due to lower interconnection costs in the year, offsetting the increased volume of smartphone sales. Personnel expenses decreased, impacted by personnel restructuring expenses accrued in 2010. Other expenses decreased mainly due to lower customer care expenses.
OIBDA
OIBDA for Telefónica Europe increased 3.8% to €4,233 million in 2011. Foreign exchange rates had a positive impact of 0.1 percentage point. The growth in OIBDA was impacted by the recognition during the second half of 2010 of non-recurring workforce restructuring costs of €320 million. Excluding this impact, Telefónica Europe’s OIBDA in 2011 would have decreased by 2.5%. OIBDA was impacted by lower revenues (including the impact of interconnection price cuts) and higher commercial costs relating to customer loyalty efforts undertaken in the second half of the year and the launch of high-end smartphones in the fourth quarter of 2011.
2010 Results of Operations:
In January 2010, Telefónica Europe acquired the telecommunications services innovator Jajah and in February 2010, through Telefónica Germany, acquired HanseNet, which provides fixed telephony, Internet, broadband and pay TV services in Germany. In June 2010, Telefónica Europe sold Manx Telecom.
Revenues
Telefónica Europe’s revenues increased by 12.7% in 2010 to €15,724 million. HanseNet and Jajah contributed an aggregate of €807 million. Revenue growth accelerated over the course of the year despite the reduction in mobile interconnection prices. This was due to good performances in the United Kingdom and Germany, which offset declines in Ireland and the Czech Republic, in each case impacted by worsening economic conditions. Non-P2P SMS data revenues achieved organic growth of 26.4% in the year, driven by the growing adoption of mobile broadband, which represented 36% of data revenues.
Percent Change Year ended December 31, 2009 vs. 2010 2010 vs. 2011 2009 2010 2011 Reported Excl. FX(1) Reported Excl. FX(1)
(in millions of euro, except percentages) Revenues 13,954 15,724 15,524 12.7% 10.1% (1.3)% (1.0)%OIBDA 3,999 4,080 4,233 2.0% (0.6)% 3.8% 3.7%Margin OIBDA 28.7% 25.9% 27.3% (2.7) p.p. (2.6) p.p. 1.3 p.p. 1.2 p.p.Depreciation and amortization (2,988) (3,201) (3,117) 7.1% 4.4% (2.6)% (2.5)%Operating income 1,011 879 1,116 (13.1)% (16.8)% 27.0% 26.5%
50

Expenses
Telefónica Europe’s total expenses increased partially in 2010 compared with 2009, due to operating expenses related to the consolidation of HanseNet and non-recurring restructuring expenses related to personal reorganization in the second half of the year.
Supplies increased in 2010 compared with 2009, mainly due to the inclusion of HanseNet and the increase of the pound sterling to euro exchange rate over the period, offset by the impact of lower MTRs.
Personnel expenses increased in 2010 compared with 2009, mainly due to non-recurrent restructuring costs, derived primarily from the restructuring of the workforces at Telefónica Germany and Telefónica UK.
Other expenses increased in 2010 compared with 2009 mainly due to the acquisition of HanseNet and the strengthening of the pound sterling to euro exchange rate over the period.
OIBDA
OIBDA increased 2% to €4,080 million in 2010, of which HanseNet and JaJah contributed €71 million during the year. Expenses increased during the year due to non-recurring restructuring costs (€320 million), mostly in relation to workforce reductions, which were recognized in the second half of the year. Also, a capital gain from the sale of Manx of €61 million was recorded during the year. OIBDA in like-for-like terms and excluding the impact of foreign exchange rates would have increased by 3.8%, largely due to increased revenues and efforts to enhance efficiency.
United Kingdom
The United Kingdom market remained extremely competitive in 2011, and was also impacted by adverse economic conditions. The company focused on a “value over volume” strategy in the first half of the
year, before ramping up commercial efforts again in the second half of the year, offering a new rate structures for smartphones in August and implementing a pro-active customer retention program in the contract segment. The company reinforced its commitment to offering customers the best service experience, including innovative digital services, quality customer service and a range smartphone offerings.
Telefónica United Kingdom’s mobile contract accesses increased by 4% in 2011, representing 49% of the total mobile customer base of 22.2 million (an increase of 2.1 percentage points from 2010). Steady demand for smartphones increased the penetration of these handsets to 38% at the end of 2011, up from 29% the prior year.
At December 31, Percent Change 2009 2010 2011 2009 vs. 2010 2010 vs. 2011 (in thousands) Fixed telephony accesses(1) 0.0 86.7 216.1 n.a. n.s.Internet and data accesses 591.5 671.6 620.3 13.5% (7.6)%
Broadband accesses 591.5 671.6 620.3 13.5% (7.6)%Mobile accesses 21,299.3 22,211.5 22,167.5 4.3% (0.2)%
Pre-pay accesses 11,740.3 11,712.3 11,227.3 (0.2)% (4.1)%Contract accesses 9,558.9 10,499.2 10,940.3 9.8% 4.2%
Final clients accesses 21,890.8 22,969.8 23,003.9 4.9% 0.1%Wholesale accesses (2) 0.0 0.0 26.7 n.a. n.a.Total accesses 21,890.8 22,969.8 23,030.7 4.9% 0.3%
(1) PSTN (including public use telephony) x1; ISDN basic access x1; ISDN primary access 2/6 access x30; includes our accesses for internal use, VOIP and free ADSL.
(2) Includes unbundled lines rented by Telefónica United Kingdom.
51

2011 results
Revenues
Telefónica United Kingdom reported a 3.8% decrease in revenues to €6,926 million, with foreign exchange rates contributing a 1.1 percentage points decrease compared with 2010. Mobile service revenues were down 4.8% (or down 3.7% excluding foreign exchange-rate effects) to €6,198 million. Interconnection price cuts were largely responsible for these revenue declines; excluding this impact, service revenues would have only fallen by 0.4%, because of lower growth in customers and trends in ARPU.
Total ARPU decreased 6.6%, or 3.5% excluding the interconnection price cuts. Voice ARPU decreased 14.6% (or decreased 9.2% excluding interconnection price cuts) because of the migration of traffic from minutes bundles, the reduction in rates amid stiff competition and the adverse macroeconomic climate. Data ARPU growth held steady at 5.1%, with more than 80% of contract customers with data tariffs opting for limited data usage.
Mobile voice traffic was 10% lower in 2011, due to the decrease in the pre-pay customer base and usage optimization.
OIBDA
OIBDA at Telefónica United Kingdom increased by 0.3% to €1,836 million in 2011 and was 1.5% higher excluding the impact of foreign exchange rates. In 2010, €72 million of non-recurring restructuring
expenses were recognized, affecting comparability. Excluding this impact, OIBDA would have fallen by 2.3% due to lower revenues.
2010 results
Revenues
Telefónica United Kingdom reported a 10.6% increase in total revenues in 2010 to €7,201 million, with foreign exchange rates contributing a 4.1 percentage point increase. Mobile service revenues increased 9.7% (or 5.6% excluding foreign exchange rate effects) to €6,513 million. Interconnection price cuts had a considerable impact on revenues; excluding such impact service revenues would have increased by 9.2%, driven by increasing penetration of the contract segment in total accesses and the larger number of smartphone users.
Year ended December 31, Percent Change
2009 2010 20112009 vs. 2010 2010 vs. 2011
Euro Local Currency Euro Local Currency (in millions of euro, except percentages)Revenues 6,512 7,201 6,926 10.6% 6.5% (3.8)% (2.7)%
Service revenues 5,936 6,513 6,198 9.7% 5.6% (4.8)% (3.7)%OIBDA 1,680 1,830 1,836 9.0% 4.9% 0.3% 1.5%OIBDA Margin 25.8% 25.4% 26.5% (0.4) p.p. (0.4) p.p. 1.1 p.p. 1.1 p.p.CAPEX 602 717 732 19.1% 14.7% 2.0% 3.3%OpCF (OIBDA – CAPEX) 1,078 1,113 1,104 3.3% (0.5)% (0.8)% 0.3%
As of or for the year ended December 31, Percent Change (local currency) 2009 2010 2011 2009 vs. 2010 2010 vs. 2011
Traffic (millions of minutes) 53,856 58,143 52,250 8.0% (10.1)%ARPU (in euro) 24.7 25.1 23.2 (2.1)% (6.6)%
Pre-pay 12.3 11.8 10.3 (8.2)% (11.4)%Contract 40.8 40.6 37.1 (4.2)% (7.6)%
ARPU data (in euro) 9.3 10.1 10.5 5.3% 5.1%% of non-P2P SMS revenues over data revenues 27.4% 32.8% 40.5% 5.4 p.p. 7.7 p.p.
52

Non-P2P SMS revenues continued to grow in the year, with a year-on-year increase of 31.7%, excluding the impact of foreign exchange rates. As a result, total data revenues represented 40% of mobile service revenues in 2010, nearly two percentage points higher than in 2009.
Total ARPU in 2010 fell 2.1% (excluding foreign exchange-rate effects), heavily impacted by interconnection price cuts. Otherwise, ARPU would have increased by 1.2% during the year. Voice ARPU fell 6.5% (excluding foreign exchange rate effects), while data ARPU increased by 5.3% (excluding foreign exchange rate effects) due to growing demand for data services by smartphone users.
Mobile traffic increased by 8.0% in 2010 to 58,143 million minutes, driven by the growth of the contract customer base and a higher unit usage per customer in the pre-pay segment.
OIBDA
Telefónica United Kingdom’s OIBDA increased 4.9% to €1,830 million in 2010 excluding foreign exchange rate effects. In the year’s fourth quarter, the company recorded a €72 million non-recurring restructuring charge, related to a workforce and store restructuring geared toward placing greater efforts on capturing new business opportunities and improving customer service. Excluding this impact, too, OIBDA would have increased by 9.0%, mostly due to growth in revenues despite higher commercial costs related to increased mobile broadband demand.
Germany
Telefónica Germany performed well in 2011, bolstering its competitive position in the German market with a higher market share and seizing commercial momentum with its “O2 Blue” rates, its
“MyHandy” offer, activity with partners and progress toward unlocking the value of its data business.
Telefónica Germany achieved a 6% increase in accesses in 2011, driven by an 8% growth in mobile accesses and a 12% larger contact customer base. Demand for smartphones remained strong in the year, raising mobile broadband penetration by six percentage points to 26% at December 31, 2011.
Fixed broadband accesses grew 2% in 2011, ending the year at 2.6 million.
At December 31, Percent Change 2009 2010 2011 2009 vs. 2010 2010 vs. 2011 (in thousands) Fixed telephony accesses(1) 0.0 1,916.4 2,055.1 n.a. 7.2%Internet and data accesses 285.1 2,914.7 2,922.3 n.s. 0.3%
Narrowband accesses 0.0 385.7 334.6 n.a. (13.2)%Broadband accesses 285.1 2,529.1 2,587.7 n.s. 2.3%
Mobile accesses 15,507.4 17,049.2 18,380.1 9.9% 7.8%Pre-pay accesses 7,807.0 8,795.2 9,144.5 12.7% 4.0%Contract accesses 7,700.4 8,254.0 9,235.7 7.2% 11.9%
Pay TV accesses 0.0 77.2 83.3 n.a. 7.9%Final clients accesses 15,792.5 21,957.5 23,440.9 39.0% 6.8%Wholesale accesses(2) 1,316.8 1,116.5 1,042.4 (15.2)% (6.6)%Total accesses 17,109.3 23,074.0 24,483.2 34.9% 6.1%
(1) PSTN (including public use telephony) x1; ISDN basic access x1; ISDN primary access 2/6 access x30; includes our accesses for internal use, VOIP and free ADSL.
(2) Includes unbundled lines rented by Telefónica Germany.
Year ended December 31, Percent Change 2009 2010 2011 2009 vs. 2010 2010 vs. 2011 (in millions of euro, except percentages) Revenues 3,746 4,826 5,035 28.9% 4.3%
Service revenues 2,861 2,932 2,946 2.5% 0.5%OIBDA 918 944 1,219 2.8% 29.1%OIBDA Margin 24.5% 19.6% 24.2% (4.9) p.p. 4.7 p.p.CAPEX 796 2,057 558 n.a. (72.9)%OpCF (OIBDA – CAPEX) 122 (1,113) 662 c.s. (159.5)%
53

2011 results
Revenues
Total revenues increased 4.3% in 2011 to €5,035 million. Revenues for 2010 included the results of HanseNet from mid-February 2010, while 2011 revenues included such results for the full year. Excluding
this impact, revenues would have increased by 1.6% during 2011.
Mobile services revenues performed well, especially at the end of 2011, impacted by the interconnection price cut. Excluding this effect, mobile services increased 7.1%, driven by growth in the customer base and trends in ARPU. Non-P2P SMS data revenue growth of 49% was a key driver of revenues, leveraging the increasing penetration of smartphones and the adoption of limited use data rates.
Total ARPU decreased 7.8% in the year due to the sharp reduction in interconnection prices in December 2010. Excluding this impact, total ARPU would have only declined 1.6%, mainly due to the weak performance of the pre-pay segment. The regulation affected voice ARPU, where revenues declined 18.5% in the year. This decline was partly offset by the increase of data ARPU of 13.2% due to increasing mobile broadband penetration and strong adoption of limited use data rates.
Mobile service revenues increased 10% in 2011 due to growth in the customer base and an overall increase in usage.
OIBDA
OIBDA increased 29% to €1,219 million in 2011. Excluding the impact of the consolidation of HanseNet results since February 2010 and the €202 million of restructuring provisions recognized in 2010, OIBDA in 2011 would have increased by 4.9%. OIBDA growth was driven by higher revenues and efficiency gains achieved through our restructuring, which offset the increase in commercial costs.
2010 results
Revenues
Revenues at Telefónica Germany in 2010 increased 28.9% to €4,826 million. This amount includes the results of HanseNet since mid-February 2010. Excluding this impact, revenues would have increased by 7.9% in 2010. The positive revenue performance was mainly the result of increased mobile service revenues and strong demand for smartphones, especially through the “My Handy” product, which eliminates the handset subsidiary from mobile service revenues.
As of or for the year ended December 31, Percent Change 2009 2010 2011 2009 vs. 2010 2010 vs. 2011
Traffic (millions of minutes) 23,257 25,543 27,993 9.8% 9.6%ARPU (in euro) 15.6 14.8 13.6 (5.5)% (7.8)% Pre-pay 5.7 6.1 5.7 7.8% (7.0)% Contract 26.1 23.8 21.9 (8.8)% (8.4)%APRU data (in euro) 4.7 5.0 5.6 6.1% 13.2%% of non-P2P SMS revenues over data revenues 36.7% 41.9% 50.4% 5.2 p.p. 8.5 p.p.
54

Mobile service revenues increased by 2.5% in 2010 to €2,932 million. Excluding the impact of interconnection price cuts, the increase would have been 3.8%. Growth was mainly achieved due to the increase in access and continued growth in non-P2P SMS data revenues (an increase of 31.4% in 2010 to 42% of total revenues compared with 37% of total revenues in 2009). Mobile data revenues rose 15.4% to €970 million in 2010, representing 33% of total mobile service revenues.
OIBDA
OIBDA at Telefónica Germany increased 2.8% to €944 million in 2010. OIBDA growth was impacted by the inclusion of HanseNet’s results since February 2010 and the recognition of €202 million of non-recurring expenses related to workforce restructuring in 2010. Excluding these two impacts, OIBDA growth would have been 11.2%, due mainly to the termination of national roaming agreements in 2009, growth in revenues and cost-savings achieved from the company’s ongoing commitment to efficiency and despite the increase in commercial costs related to smartphone sales in the latter part of the year.
Czech Republic and Slovakia
Slovakia
Accesses in the Czech Republic increased 1.4% in 2011, primarily due to growth in mobile and fixed broadband accesses. Access growth remained strong in Slovakia, above all in the contract segment.
At December 31, Percent Change 2009 2010 2011 2009 vs. 2010 2010 vs. 2011 (in thousands) Fixed telephony accesses(1) 1,770.6 1,669.2 1,581.9 (5.7)% (5.2)%
Free ADSL accesses 62.1 163.7 237.4 163.6% 45.0%VOIP accesses 16.9 38.6 52.1 128.4% 35.0%
Internet and data accesses 848.7 898.8 970.6 5.9% 8.0%Narrowband accesses 137.3 117.5 100.7 (14.4)% (14.3)%Broadband accesses 683.1 753.0 839.6 10.2% 11.5%Other accesses (2) 28.3 28.3 30.3 0.0% 6.9%
Mobile accesses 4,944.6 4,838.6 4,941.7 (2.1)% 2.1%Pre-pay accesses 2,130.2 1,975.0 1,892.4 (7.3)% (4.2)%Contract accesses 2,814.4 2,863.6 3,049.3 1.7% 6.5%
Pay TV accesses 137.6 129.2 135.6 (6.1)% 5.0%Final clients accesses 7,701.5 7,535.8 7.629.8 (2.2)% 1.2%Wholesale accesses 108.4 131.2 144.1 21.0% 9.8%Total accesses 7,810.0 7,667.0 7,773.9 (1.8)% 1.4%
(1) PSTN (including public use telephony) x1; ISDN basic access x1; ISDN primary access 2/6 access x30; includes our accesses for internal use, VOIP and free ADSL.
(2) Retail circuits other than broadband.
At December 31, Percent Change 2009 2010 2011 2009 vs. 2010 2010 vs. 2011 (in thousands) Mobile accesses 552.9 880.4 1,164.1 59.2% 32.2%
Pre-pay accesses 357.2 545.9 666.1 52.8% 22.0%Contract accesses 195.6 334.5 498.0 71.0% 48.9%
Total accesses 552.9 880.4 1,164.1 59.2% 32.2%
55

(1) Includes Slovakia, except for service revenues
2011 results
Revenues
Revenues in the Czech Republic and Slovakia declined 3% to €2,130 million in 2011. In Slovakia, growth in the customer base led to higher revenues in 2011.
OIBDA
OIBDA totaled €931 million in 2011, impacted by efficiency initiatives, sales of non-strategic assets and wide margins in Slovakia, which resulted in a smaller decline in OIBDA as compared with revenues for the year.
2010 results
Revenues
Revenues derived from the Czech Republic, including Slovakia operations, decreased 2.8% to €2,197 million in 2010 compared to €2,260 million in 2009. Slovakia continued to grow in mobile revenues (50.5%) while Czech revenues from fixed and mobile services decreased (-8.7% in local currency) due to MTR cuts, customers optimizing their expenditures and lower government spending on IT services.
OIBDA
OIBDA decreased 9.5% from €1,053 million in 2009 to €953 million in 2010, due primarily to poorer revenues performance, which was partially offset by reductions in direct costs (supplies) and in commercial costs.
Ireland
In Ireland, results were hampered by an extremely adverse business environment, with a reduction in the customer base, due mostly to a smaller number of pre-pay customers as the contract customer base
held steady.
Year ended December 31, Percent Change 2009 (1) 2010 (1) 2011 (1) 2009 vs. 2010 2010 vs. 2011 (in millions of euro, except percentages)Revenues 2,260 2,197 2,130 (2.8)% (3.0)%
Service revenues 1,123 1,078 995 (4.0)% (7.7)%OIBDA 1,053 953 931 (9.5)% (2.3)%OIBDA Margin 46.6% 43.4% 43.7% (3.2) p.p. 0.3 p.p.CAPEX 245 224 229 (8.8)% 2.1%OpCF (OIBDA – CAPEX) 807 729 702 (9.7)% (3.7)%
At December 31, Percent Change 2009 2010 2011 2009 vs. 2010 2010 vs. 2011 (in thousands) Internet and data accesses - 11.2 24.2 n.a. n.s.
Broadband accesses - 11.2 24.2 n.a. n.s. Mobile accesses 1,714.3 1,695.8 1.622.9 (1.1)% (4.3)%
Pre-pay accesses 1,022.5 966.5 870.1 (5.5)% (10.0)%Contract accesses 691.8 729.4 752.9 5.4% 3.2%
Total accesses 1,714.3 1,707.1 1,647.2 (0.4)% (3.5)%
56

2011 results
Revenues
Telefónica Ireland’s revenues decreased 14.7% in 2011, primarily due to the impact of interconnection price cuts on mobile service revenues. ARPU declined amid efforts to optimize usage.
OIBDA
The decrease in OIBDA in 2011 reflects the drop in mobile service revenues and higher commercial costs stemming from increased demand for smartphones.
2010 results
Revenues
Revenues derived from Telefónica Ireland decreased 6.3% to €848 million in 2010 compared to €905 million in 2009. The decrease was mainly the result of lower customer spending, market competition in
the prepay segment and lower MTRs.
OIBDA
OIBDA decreased 9% from €302 million in 2009 to €275 million in 2010, primarily due to a decline in revenues. Our Services and Products
Mobile business
We offer a wide variety of mobile and related services and products to personal and business customers. Although the services and products available vary from country to country, the following are our principal services and products:
Year ended December 31, Percent Change 2009 2010 2011 2009 vs. 2010 2010 vs. 2011 (in millions of euro, except percentages) Revenues 905 848 723 (6.3)% (14.7)%
Service revenues 842 779 677 (7.5)% (13.1)%OIBDA 302 275 206 (9.0)% (25.0)%OIBDA Margin 33.4% 32.4% 28.5% (1.0) p.p. (3.9) p.p.CAPEX 63 60 61 (4.1)% 1.4%OpCF (OIBDA – CAPEX) 239 214 145 (10.3)% (32.5)%
• Mobile voice services. Our principal service in all of our markets is mobile voice telephony.
• Value added services. Customers in most of our markets have access to a range of enhanced mobile calling features, including voice mail, call hold, call waiting, call forwarding and three-way calling.
• Mobile data and Internet services. Current data services offered include Short Messaging Services, or SMS, and Multimedia Messaging Services, or MMS, which allow customers to send messages with images, photographs and sounds. Customers may also receive selected information, such as news, sports scores and stock quotes. We also provide mobile broadband connectivity and Internet access. Through mobile Internet access, our customers are able to send and receive e-mail, browse the Internet, download games, purchase goods and services in m-commerce transactions and use our other data services.
• Wholesale services. We have signed network usage agreements with several MVNOs in different countries.
• Corporate services. We provide business solutions, including mobile infrastructure in offices, private networking and portals for corporate customers that provide flexible on line billing.
57

Fixed business
The principal services we offer in our fixed businesses in Spain, Europe and Latin America are:
Sales and Marketing
Our sales and marketing strategy is aimed toward reinforcing our market position, generating brand awareness, promoting customer growth and achieving customer satisfaction. We use a variety of marketing initiatives and programs, including those that focus on customer value, with in-depth market segmentation; programs to promote customer loyalty; pricing initiatives aimed toward stimulating usage, including segmented packages and innovative tariff options; and initiatives that are responsive to the latest market trends, including those aimed toward boosting demand for our mobile Internet and mobile broadband offerings. In connection with these and our other sales and marketing initiatives, we market our products through a broad range of channels, including television, radio,
• Roaming. We have roaming agreements that allow our customers to use their mobile handsets when they are outside of our service territories, including on an international basis.
• Fixed wireless. We provide fixed voice telephony services through mobile networks in Venezuela, Argentina, Peru, Mexico, Ecuador, El Salvador, Guatemala and Nicaragua.
• Trunking and paging. In Spain and Guatemala, we provide digital mobile services for closed user groups of clients and paging services.
• Traditional fixed telecommunication services. Our principal traditional fixed telecommunication services include PSTN lines; ISDN accesses; public telephone services; local, domestic and international long distance and fixed-to-mobile communications services; corporate communications services; supplementary value-added services (including call waiting, call forwarding, voice and text messaging, advanced voicemail services and conference-call facilities); video telephony; business-oriented value-added services; intelligent network services; leasing and sale of handset equipment; and telephony information services.
• Internet and broadband multimedia services. Our principal Internet and broadband multimedia services include Internet service provider service; portal and network services; retail and wholesale broadband access through ADSL; naked ADSL ( broadband connection without the monthly fixed line fee); narrowband switched access to Internet for universal service, and other technologies; residential-oriented value-added services (including instant messaging, concerts and video clips by streaming video, e-learning, parental control, firewall protection, anti-virus protection, content delivery and personal computer sales); television services such as Imagenio, our IPTV business, cable television and satellite television; companies-oriented value-added services, like puesto integral o puesto informático, which includes ADSL, computer and maintenance for a fixed price and VoIP services. Telefónica Spain provides services based on Fiber to the Home (FTTH), including a new range of products and services name “FUTURA”. This line of products includes high speed Internet access (currently up to 30 Mb), which allows Telefónica Spain to provide its customers with advanced IPTV services, such as Multiroom (allowing clients to watch different TV channels in different rooms) and Digital Video Recording (DVR).
• Data and business-solutions services. Our data and business-solutions services principally include leased lines; virtual private network, or VPN, services; fiber optics services; the provision of hosting and application, or ASP, service, including web hosting, managed hosting, content delivery and application, and security services; outsourcing and consultancy services, including network management, or CGP; and desktop services and system integration and professional services.
• Wholesale services for telecommunication operators. Our wholesale services for telecommunication operators principally include domestic interconnection services; international wholesale services; leased lines for other operators’ network deployment; and local loop leasing under the unbundled local loop regulation framework. It also includes bit stream services, bit stream naked, wholesale line rental accesses and leased ducts for other operators’ fiber deployment.
58

billboards, telemarketing, direct mail and Internet advertising. We also sponsor a variety of local cultural and sporting events in order to enhance our brand recognition. Competition
The telecommunications industry is competitive and consumers generally have a choice of mobile and fixed line operators from which to select services. We are a global telecommunications services provider and face significant competition in most of the markets in which we operate. In Europe, our largest competitor is Vodafone and in Latin America our largest competitor is América Móvil. Newer competitors, including handset manufacturers, internet companies and software providers, are also entering the market and offering integrated communications services.
We compete in our markets on the basis of the price of our services; the quality and range of features associated with those services; the reliability of our network infrastructure and its technological attributes; and the desirability of our offerings, including bundled offerings of one type of service with another and, in the case of the mobile industry, offerings that include subsidized handsets.
To compete effectively with our competitors, we need to successfully market our products and services and to anticipate and respond to various competitive factors affecting the relevant markets, such as the introduction of new products and services, different pricing strategies and changes in consumer preferences. See “Risk Factors – Risks Relating to our Industry – We operate in highly competitive markets and the industry in which we operate is subject to rapid technological changes, which requires us to continually adapt to such changes and to upgrade our existing networks.” Strategic Partnerships China Unicom
Since 2005, we have had a stake in China Unicom and its predecessor company. On September 6, 2009 we entered into a strategic alliance agreement with China Unicom, which provides, among other areas for cooperation, joint procurement of infrastructure and client equipment, common development of mobile service platforms, joint provisions of service to multinational customers, roaming, research and development, sharing of best practices and technical, operational and management know-how, joint development of strategic initiatives in the area of network evolution, joint participation in international alliances and exchanges of senior management. In furtherance of this strategic alliance we entered into a subscription agreement with China Unicom, pursuant to which we increased our voting interest in the share capital of China Unicom to 8.06% and China Unicom obtained 0.87% voting interest in our share capital in October 2009.
Pursuant to the strategic alliance agreement mentioned above, China Unicom has agreed to use its best endeavors to maintain a listing of all the issued ordinary shares of China Unicom on the Hong Kong Stock Exchange. For so long as the strategic alliance agreement with us is in effect, China Unicom shall not (i) offer, issue or sell any significant number of its ordinary shares (including treasury shares), or any securities convertible into or other rights to subscribe for or purchase a significant number of China Unicom’s ordinary shares (including treasury shares), to any current major competitor of Telefónica or (ii) make any significant investment, directly or indirectly, in any current major competitor of Telefónica. We made similar undertakings.
The strategic alliance agreement between us and China Unicom terminates on September 6, 2012 subject to automatic annual renewal, subject to either party’s right to terminate on six months’ notice. Also, the strategic alliance agreement may be terminated by China Unicom if our shareholding in China Unicom drops below 5% of its issued share capital or if China Unicom’s shareholding in us drops below 0.5% of our issued share capital. In addition, the strategic alliance agreement is subject to termination in the event either party is in default and automatically terminates on a change in control of China Unicom.
On January 28, 2011, China Unicom completed its acquisition of 21,827,499 Telefónica shares, representing approximately 1.37% of our voting share capital.
59

As of the date of this Annual Report, Telefónica, through its wholly-owned subsidiary, Telefónica Internacional, has acquired 282,063,000 ordinary shares of China Unicom through several transactions executed in the period between January 23, 2011 and September 7, 2011, investing an aggregate amount equivalent to approximately 500 million U.S. dollars (equivalent to €358 million). Telefónica’s shareholding in China Unicom amounts to 9.6% of its capital stock as of the date of this Annual Report. In addition, at our General Shareholders’ Meeting on May 18, 2011 Mr. Chang Xiaobing, a nominee proposed by China Unicom, was appointed as a member of our Board of Directors.
Telecom Italia
Through a series of transactions from 2007 through 2009, we acquired an indirect holding of 10.49% in the voting shares of Telecom Italia (7.21% of the dividend rights) through our holdings in Telco. The Telecom Italia group is principally engaged in the communications sector and, particularly, in telephone and data services on fixed lines for final and wholesale customers, in the development of fiber optic networks for wholesale customers in the provision of broadband services and Internet services, in domestic and international mobile telecommunications (especially in Brazil), in the television sector using both analog and digital terrestrial technology and in the office products sector. Telecom Italia operates primarily in Europe, the Mediterranean basin and in South America.
For more information, please see “Item 4. Information on the Company —History and Development of the Company—Recent Developments,” “Item 5. Operating and Financial Review and Prospects —Operating Results—Significant Factors Affecting the Comparability of our Results of Operations in the Period Under Review” and “Item 10. Additional Information—Material Contracts.” Telco, through which we hold our stake in Telecom Italia, is included in our Consolidated Financial Statements using the equity method. Regulation
As a telecommunications operator, we are subject to sector-specific telecommunications regulations, general competition law and a variety of other regulations, which can have a direct and material effect on our business areas, particularly in regions and countries that favor more exclusive regulatory intervention. The extent to which telecommunications regulations apply to us depends largely on the nature of our activities in a particular country, with traditional fixed telephony services usually subject to more extensive regulations.
To operate our networks, we must obtain general authorizations, concessions or licenses from national regulatory authorities, or NRAs, in those countries in which we operate. Licensing procedures also apply to our mobile operations with respect to radio frequencies. The duration of any particular license or spectrum right depends on the legal framework in the relevant country.
This section describes the regulatory frameworks and key regulatory developments at the regional level and in selected countries in which we have significant interests. Many of the regulatory developments described in this section involve ongoing proceedings or consideration of potential legislation that have not reached a conclusion. Accordingly, it is difficult for us to accurately quantify the effect on our operations of these developments in such instances.
Electronic Communication Regulation in the EU
The EU legal framework for electronic communications services was developed with the aim of liberalizing and improving the functioning of the EU market for telecommunications networks and services, which culminated in the adoption of the 2002 EU regulatory framework for electronic communications sector (the “EU Framework”). This regulatory framework has been subsequently modified by the European Council in response to technological changes in the industry.
Rules promulgated pursuant to the EU Framework define users’ rights and focus on privacy, data security, protection and preservation and universal access, among other things. Recent EU directives have supplemented the EU Framework with regulations focused on roaming price caps, spectrum allocation and call termination.
EU Member States are generally required to incorporate EU legislation into their domestic law regimes and consider EU legislation when applying domestic law. In each EU Member State a national regulatory authority, or
60

NRA, is responsible for enforcing national telecommunications laws that incorporate the EU Framework. NRAs generally have significant power under their relevant telecommunications acts, including the authority to impose network access and interconnection obligations, and to approve or review new charges and general business terms and conditions of providers with “significant market power”, or SMP. In general, an operator is considered to have SMP if its share of a particular market exceeds 40%. NRAs also have the authority to assign wireless spectrum and supervise frequencies and to impose universal service obligations.
The European Commission supervises the NRAs and formally and informally influences their decisions in order to ensure the harmonized application of the EU Framework throughout the European Union. In particular, the European Commission has identified certain markets that include one or more participants with SMP and has recommended ex ante specific regulation. In these instances, NRAs are instructed to impose at least one obligation relating to price control, transparency, non-discrimination, accounting separation or access obligations on market participants. Companies can challenge decisions of the relevant NRA before national courts. Such legal proceedings can lead to a decision by the European Court of Justice, or ECJ, which is the ultimate authority on the correct application of EU legislation.
EU Competition Law
The EU’s competition rules have the force of law in EU Member States and are, therefore, applicable to our operations in EU Member States.
The EC Treaty prohibits “concerted practices” and all agreements for undertakings that may affect trade between Member States and which restrict, or are intended to restrict, competition within the EU. It also prohibits any abuse of a dominant competitive position within the common market of the EU, or any substantial part of it, that may affect trade between Member States.
The EU Merger Regulation requires that all mergers, acquisitions and joint ventures involving participants meeting certain turnover thresholds be submitted to the EU Commission for review, rather than to the national competition authorities. Under the amended EU Merger Regulation, market concentrations will be prohibited if they significantly impede effective competition in the EU common market. European Commission and the EU Competition Commissioner are granted the authority to apply the European Competition framework.
Similar competition rules are set forth in each EU Member State’s legislation and are enforced by each of their national competition authorities, or NCAs. All European countries where we have activities and referred to below are Member States of the EU.
Recent developments
The regulatory debate in the European Union has continued to focus on the roll-out of ultra-high speed networks, roaming and net neutrality, issues particularly important for the development of the European telecommunications market and Information Society.
The EU Commissioner, Neelie Kroes, gathered 39 CEOs from the telecoms, equipment and content industries in March 2011. She asked for industry’s advice on how to meet the ambitious EU broadband targets, trying to speed up the development of Next Generation access networks. The Industry views were published in July, and contained eleven recommendations about the topics of the: sustainability of the Internet ecosystem; interoperability; and the investment framework and financing of new networks.
This initiative prompted a debate on new ways of promoting the development of fibre networks, and more particularly on co-investment by groups of operators and possible public-private partnerships to spread costs and join forces.
Related to this debate, in October the Commission started a debate about the costs and prices of current fixed copper networks and future fibre networks. The Commission is looking for ways to promote fibre investment and is asking for views about the best approach for setting the prices of current and future wholesale services in order to facilitate fibre investments.
61

In April the Commission published a communication on Net Neutrality in which it basically maintains that there is no need to regulate Net Neutrality. It does believe it is necessary to closely follow and better understand operators’ practices with regard to traffic management. The Commission has asked BEREC to look into current practices of operators with regard to traffic management and to continue working on a series of related issues, such as transparency and minimum quality of service.
In July, the Commission published a proposal for a revision of the Roaming Regulation. It is an attempt to find a long-term solution for the level of roaming prices, which the Commission considers still being too high. This would imply a radical change to the way international roaming services are provided in Europe. From July 2014 European mobile operators would be required to unbundle the sale of roaming services from domestic mobile services. This would allow customers to choose a different provider for making calls in other Member States.
In addition, the Roaming Regulation would extend the current price cap regime for a transitory period to give the new structural changes to the roaming market time to be developed and implemented. The extended price cap regime would also include new price caps on retail charges for data roaming. Telefónica Spain
Spain
General regulatory framework
The legal framework for the regulation of the telecommunications sector in Spain is governed by the General Telecommunications Law (32/2003) and several Royal Decrees. The General Telecommunications Law, among other things, sets forth rules regarding the new system of notification for electronic communications services, establishes the terms by which operators interconnect their networks, defines the universal service provision regime and subjects providers with SMP in particular telecommunications markets to specific obligations.
Regulatory supervision
The Telecommunications Market Commission, or the CMT, is the NRA responsible for regulating the telecommunications and audiovisual service markets in Spain.
Market analysis
Pursuant to the EU Framework, the CMT identifies markets that may lack effective competition and imposes specific obligations upon operators with SMP. The CMT has conducted market analyses to determine which operators have SMP in particular markets. Some of the most prominent conclusions drawn from these analyses and corresponding regulatory developments are described below.
Fixed markets
Retail access to fixed-location public telephone network, retail market for calls at a fixed location and retail lease lines market
In March 2006, following a market analysis, the CMT concluded that Telefónica de España is an operator with SMP in the market for the provision of retail access to fixed-location public telephone network services. As an SMP operator, Telefónica de España has certain specific obligations and is subject to certain restrictions, the most relevant of which are maximum price caps for installation and monthly fees. Telefónica de España also has obligations regarding carrier selection, cost accounting and accounting separation. Telefónica de España is also subject to limitations regarding maximum and minimum amounts offered in connection with promotions. These limits are updated every six months.
62

Wholesale fixed call origination market
On March 22, 2007, the CMT adopted new regulations concerning call origination on the wholesale fixed call origination market that oblige Telefónica de España to provide wholesale access to its fixed network to other operators, allowing competitors to use its networks to provide access and other associated services to their customers.
In December 2008, the CMT concluded that Telefónica de España is an operator with SMP in this market and requested that Telefónica de España offer wholesale service to assist other operators in offering IP telephony services and provide transparent information of migration to Next Generation Networks, or NGN, centrals, which involves the provision of a wide range of information to competitors about network evolution.
Fixed call termination market on individual networks
As an operator with SMP in fixed call termination market on individual networks, Telefónica de España is required to submit an “Interconnection Reference Offer” (OIR) outlining the terms and conditions under which it will interconnect with other operators. In November 2010 the CMT approved a modification of the Telefónica OIR, reducing interconnection prices paid by alternative operators for call termination in Telefónica network.
Mobile market
Mobile voice call termination
In September 2006, the CMT established a progressive reduction schedule for MTRs (the “glide path”) from October 2006 to September 2009. In July 2009, the CMT established a new glide path for mobile voice call termination rates for the four Spanish mobile operators with an objective price of €0.04 per minute to be achieve by April 2012.
In December 2008, Telefónica Móviles España was again identified by the CMT as an operator with SMP in mobile voice call termination on individual mobile networks, and therefore continues to be subject to the obligations already imposed on it by the CMT and as well as the additional obligation to charge for seconds of usage according to a single termination price established by the CMT.
In December 2011, the CMT launched a public consultation related to the termination prices in mobile networks, with a proposed discount from 75 to 80%.
Wholesale (physical) network infrastructures access
In January 2009, the CMT concluded that Telefónica de España is an operator with SMP in the wholesale (physical) network infrastructures access market, and imposed the following obligations on Telefónica de España: access to full and shared unbundled access to copper loops, sub-loops and ducts, cost oriented tariffs and accounting separation, transparency and non-discrimination obligations including an “Unbundling Reference Offer” and a “Ducts Reference Offer.” In February 2008, the CMT imposed similar obligations with respect to vertical access to buildings.
Wholesale broadband access
In January 2009, the CMT identified Telefónica de España as an operator with SMP in the wholesale broadband access market, and consequently the CMT has imposed on Telefónica de España the obligation to provide wholesale broadband access service up to 30 Mbps to other operators in copper and fiber infrastructure. The CMT also obliges Telefónica de España to publish a wholesale broadband access reference offer, provide cost-oriented tariffs and accounting separation, non-discrimination in network access and to communicate broadband retail changes in services prior to offering them in the market.
On November 16, 2010 the CMT approved a new wholesale broadband offer (new broadband ethernet service, or NEBA), which will allow alternative operators to provide retail services to consumers more independently from Telefónica retail offers. Telefónica proposed prices for these wholesale services in March 2011 and we are currently
63

awaiting approval by the CMT. Until the NEBA service is available, Telefónica will offer its FTTH retail services for resale through third parties.
Universal service obligations
The General Telecommunications Law aims to ensure that certain basic telecommunications services are guaranteed to all Spanish citizens.
Under the law, universal service is generally defined as a set of communication services satisfying reasonable quality and price threshold guaranteed to all end users, irrespective of their geographic location. Universal service aims to ensure that all citizens have access to a connection to the fixed line public network and network services, a telephone directory service, a sufficient number of public telephones and functional Internet access. Additional provisions included within the scope of a universal service obligation, or USO, ensure that users with disabilities and special social needs, including those with low incomes, have access to the services enjoyed by the majority of users.
In December 2008, following applications by three operators, Telefónica de España was awarded a tender for the provision of directory enquiry services for a period of three years and it has also been designated for the provision of the remaining universal service elements until a new tender process takes place. A new tender process took place during the third quarter of 2011. Telefónica de España, SAU was designated the operator responsible for the provision of the connection to the public electronic communications network and the provision of the public telephone service available from a fixed location and the operator responsible for the preparation and delivery of public telephone directories to the telephone subscribers. Telefónica Telecomunicaciones Públicas, SAU was designated as the operator responsible for the provision of a sufficient supply of public payphones.
In the year 2011, a draft Law was prepared which amended the General Telecommunications Law, and proceeded to adapt it to the provisions established in the of EU Directives package on electronic communications, which also established the May 25, 2011, as the deadline for the transposition of such package. However, after the announcement by the Prime Minister calling elections for the November 20, 2011 with the corresponding dissolution of the Chambers, the approval of this Act has been postponed. Therefore, the transposition of the directives has not been done within the prescribed period.
Consumer protection
On December 29, 2006, Law 44/2006 regarding the protection of consumers and users was approved, which provides that users may only be charged for services actually used. Consequently, operators may only charge based on exact seconds of usage.
Data retention for law enforcement purposes
The 2006 Directive 2006/24/EC of the European Parliament and of the Council on the retention of data generated or processed in connection with the provision of publicly available electronic communications services or of public communications networks (“Data Retention Directive”) was incorporated into Spanish legislation on November 9, 2007. Electronic communications operators are obliged to ensure the retention of data on electronic communications for a period of twelve months. Additionally, Spain has implemented a register of pre-pay mobile customers in conjunction with these requirements.
Public Broadcasting TV funding mechanism
In August 2009, the Spanish Parliament approved a new funding policy for public television, Radio Televisión Española (“RTVE”), which includes the discontinuation of advertising on public television. The law includes a tax on telecommunications companies and television stations to help fund the phasing out of advertising on RTVE.
The law applies a tax of 0.9% on the gross revenue of telecommunications companies providing audiovisual services in Spain and 3.0% in the case of regular TV broadcasters. Both the Spanish regulator and competition authority questioned the legality of this funding mechanism in light of the national and European regulatory framework. The EU Directorate General of Competition concluded that such funding mechanism did not constitute illegal state aid. Without prejudice to the state aid investigation initiated in December 2009, the European
64

Commission sent on March 18, 2010 a formal request for information to the Spanish government concerning the new charge imposed on telecommunications operators to offset the discontinuation of advertising on RTVE. The Commission is concerned that this administrative charge, based on authorized operators’ gross revenue, may be incompatible with EU law since it does not appear to be related to costs arising from regulatory supervision. In March 2011, the EC appealed to the European Court of Justice for the infringement of European Legislation by the Spanish Kingdom, as the RTVE funding legislation was not abolished as required by the EC. The implementation of the Law on funding of RTVE obligates Telefónica Spain as an electronic communications operator to contribute 0.9% of gross operating revenues excluding those obtained in the wholesale market and as a provider of conditional access services to pay TV to contribute 1.5% of gross operating income. Telefónica Europe
United Kingdom
General regulatory framework
The EU Regulatory Framework was implemented in the United Kingdom by the Communications Act in 2003. This act designates the Office of Communications, or Ofcom, as the NRA responsible for the regulation of electronic communications networks and services.
Market reviews
Currently, the mobile termination charges that Telefónica UK, Vodafone and Everything Everywhere (the merged entity operating the T-Mobile and Orange brands) levy must not exceed 4.42ppm, on average. H3G must not exceed 4.75ppm. This regime expired on March 31, 2011 and Ofcom issued a decision to impose charge controls based on Long Run Incremental Cost (“LRIC”). This decision has been appealed.
Ofcom has recently decided to reduce termination rates to 0.69 pence per minute (in real 2008/09 terms), starting with a reduction to 2.984 pence per minute from April 1, 2011. In each of the subsequent three years (i.e. from April 1, 2012, 2013 and 2014), termination rates will fall by 37.4% minus inflation.
Germany
General regulatory framework
The EU Regulatory Framework was implemented in Germany at the end of June 2004 by the Telecommunications Act. The NRA responsible for regulation of electronic communications networks and services is Budesnetzagentur, or BNetzA.
Market reviews
In August 2006, BNetzA completed its review of voice call termination on individual mobile networks and concluded that, as an operator with SMP, the charges Telefónica Germany made to other operators for terminating calls on Telefónica Germany network had to be reduced, requiring Telefónica Germany to lower its call termination charges from €1.24 per minute to €0.994 per minute. In 2007, Telefónica Germany was required to reduce further its termination charges from €0.994 per minute to €0.880 per minute. Telefónica Germany has brought legal challenges against BNetzA’s 2006 and 2007 decision that Telefónica Germany has SMP and against the imposition of regulatory remedies. The Federal Administrative Court, as the highest level of appeal, confirmed all regulatory remedies meaning that the price controls stay in force for all mobile operators. All four German mobile operators filed a Constitutional Complaint in order to challenge the decision regarding SMP. All other actions (regarding the amount of MTRs) are pending and a decision by the Constitutional Court. The new market analysis of BNetzA in 2008 again concluded that all mobile network operators have SMP, and the decision on remedies does not contain changes in comparison to 2006. This 2008 decision has also been challenged by Telefónica Germany. The claim has been suspended until a decision of the Constitutional Court has been issued. In March 31, 2009 and as of April 1, 2009, BNetzA approved MTR for Telefónica Germany at €0.714 per minute for a period of 20 months (until November 30, 2010) Telefónica Germany challenged that decision and the claim has been suspended pending the Constitutional Court’s decision.
65

Subsequently BNetzA developed its own cost model and imposed it on all four MNOs as the basis for the calculation of MTRs in 2010. Since December 2010, BNetzA decreased MTRs significantly: 3.39 c/min for Telefónica Germany; 3.36 c/min for Vodafone and Eplus; 3.38 c/min for T-Mobile. Telefónica Germany challenged that decision and the regulator issued a final decision in February 2011, with retroactive effect from December 1, 2010, confirming the provisionally approved MTRs. This regulation will remain valid until November 30, 2012. The German regulator has consulted an own cost model implementing the European Commission Recommendation on the Regulatory Treatment on Fixed and Mobile Termination Rates in the EU which is expected will be applicable to the next MTR determination.
Czech Republic
General regulatory framework
The EU Regulatory Framework was implemented in the Czech Republic in 2005 by the Electronic Communications Act. The NRA responsible for the regulation of electronic communications networks and services is the Czech Telecommunication Office, or CTO. Governmental responsibility for the area of electronic communications lies with the Ministry of Industry and Trade.
Several changes occurred in the legal environment of the electronic communications market in the Czech Republic in 2010 including new regulations focused on spectrum allocation, universal service financing, frequency band allocation, and traffic and localization data collection, among other things.
Market reviews
CTO finished its second review of relevant markets in 2010. Following these analyses, Telefónica Czech Republic was designated as an SMP entity in seven relevant markets: one retail market and six wholesale markets.
On April 21, 2010 CTO issued a decision requiring mobile operators to gradually reduce call termination charges to 1.66 Czech Koruna per minute from July 1, 2010, to 1.37 Czech Koruna per minute from January 1, 2011 and to 1.08 Czech Koruna per minute from July 1, 2011. Telefónica Latin America
Brazil
General regulatory framework
The delivery of telecommunications services in Brazil is subject to regulation under the regulatory framework provided in the General Telecommunications Law enacted in July 1997. The National Agency for Telecommunications, ANATEL, is the principal regulatory authority for the Brazilian telecommunications sector.
Interconnection
In July 2005, ANATEL published a new regulation for interconnection among providers of telecommunications services, which require operators to issue a public document disclosing all of the conditions for the establishment of interconnection for all classes and types of services. The SMP regime allows operators to freely negotiate interconnection rates with other operators. If they fail to reach an agreement, each operator may call upon ANATEL to determine the terms and conditions of interconnection.
Competition law
Brazilian competition regulation is based on Law No. 8,884 of June 11, 1994, which generally prohibits any practice aimed at restricting free competition, dominating the relevant market of goods or services, arbitrarily increasing profits, or abusively exercising dominant market position. The Economic Law Office, or SDE, the Secretariat for Economic Monitoring, or SEAE, and the Administrative Council for Economic Defense, or CADE, are the agencies authorized to enforce the competition rules.
66

Recent developments
In June 2011 the new General Plan of Universal Service Goals was approved, which is applicable into 2011-2015 periods. The new Plan establishes goals on public telephony in big cities, and establishes the installation of public telephones in remote and inaccessible areas. Along with the approval of the Plan, Telefónica has signed the revised Concession Agreement for STFC, valid for the period from 2011 to 2015, when there should be further review of its terms. The main change brought refers to the end of restrictions for Concessionaries on operations of cable TV, which allowed Telefónica to exercise the option to purchase full control of the TVA (the cable TV company in the Abril Group).
Additionally, Telefónica Brazil has signed with the Communications Ministry a Term of Commitment to join the National Broadband Plan. Through this document Telefónica agrees to offer popular broadband plans from 1 MByte to maximum price of R$ 35, and to attend progressively all localities of São Paulo until 2014.
In October 2011 Anatel approved the Regulation of Adjustment for Fixed-Mobile Rates, which provides for the progressive reduction of these rates through a reduction factor, to be deducted from inflation. This reduction factor is 18% in 2012, 12% in 2013 and 10% in 2014. The absolute reduction in the public rates should be passed on to mobile interconnection rates (VU-M).
Mexico
General regulatory framework
The provision of all telecommunication services in Mexico is governed by the Federal Telecommunication Law and various service-specific regulations. The governmental agencies which oversee the telecommunications industry in Mexico are the Secretariat of Communications and Transportation, or SCT, and the Federal Telecommunications Commission, or COFETEL.
Prices and tariffs
Tariffs charged to customers are not regulated. They are set by mobile operating companies and must be registered with COFETEL. Rates do not enter into force until registered by COFETEL.
Interconnection
Mexican telecommunications regulations obligate all telecommunications network concessionaires to execute interconnection agreements on specific terms when requested by other concessionaires. Interconnection rates and conditions may be negotiated by the parties. However, should the parties fail to agree, COFETEL must fix the unresolved issues, including tariffs.
Throughout 2011, COFETEL issued several resolutions as a result of different interconnection disputes submitted by several operators. In such resolutions, COFETEL determined a mobile termination charge (“MTC”) for Telefónica, as well as for other mobile operators, of 0.3912 Pesos per minute, billed per second without rounding. Telefónica México has appealed on an administrative basis such resolutions from COFETEL. Such appeals are still pending to be resolved. In May 2011, Mexico’s National Supreme Court of Justice ruled that no court suspensions shall be granted to the effects of COFETEL´s resolutions relating to interconnection matters as it understood that it affects the public interest.
Foreign ownership/restrictions on transfer of ownership
Mexican foreign investment law restricts foreign investment in local fixed service and other telecommunications services to a maximum of 49% of the voting stock, unless the Mexican National Commission of Foreign Investment approves a higher percentage participation, which it can do only in the case of mobile telecommunications companies.
67

Bajacel, Movitel, Norcel, Cedetel and Pegaso, as mobile telecommunications companies, received the required approvals from the National Commission of Foreign Investment permitting our ownership of more than 49% of their outstanding voting capital.
GTM, a company in which Telefónica México has an interest, provides local fixed and long distance services. This operator complies with Mexican foreign investment law, and has a stock structure that includes the participation of its Mexican partner, Enlaces del Norte S.A. de C.V., which owns 51% of the voting stock.
Competition law
The Federal Economic Competition Law enacted in 1992 and amended on June 28, 2006 prohibits monopolies and any practices that tend to diminish, harm or impede competition in the production, processing, distribution or marketing of goods and services. The Federal Competition Commission, or COFECO, is the administrative body empowered to enforce the Law.
Venezuela
In December 2009, a new regulation applicable to all subscription TV service providers was enacted by CONATEL, the national regulatory authority, which mandates the inclusion (12%) of national production services (channels in which both reception and diffusion of sound and images take place in the country to later transmit it by means of subscription TV service providers) in regular programming packages.
An Administrative Decision on Services Agreements (Providencia n° 1302 sobre Condiciones Generales de los Contratos de Servicios de Telecomunicaciones) was adopted, which included various regulations aimed at consumer protection. As a consequence of this regulation (2009), Telcel proceeded to adapt all of its nine services agreements to fulfill all the conditions and impositions established. We have currently received regulator observations of two of the agreements (TV service and radio localization service), and we are in process of including the modifications based on the observations.
Prices and tariffs
Under new Venezuelan regulations, the free-pricing system for telecommunication services remains the same, except for basic telephony services (Local, LDN and LDI) and services rendered under universal service obligations; however, the regulatory entity may, considering CONATEL’s opinion, alter prices for telecommunication services for “public interest reasons.” The amendment does not define the term “public interest reasons.”
In February 2011, CONATEL published an Order whereby reference values are set for the Determination of Interconnection Charges for use of Mobile Telephony Services. The aim of this regulation is the establishment of reference values and criteria for determining interconnection charges in mobile phone use on the basis of a model of long run incremental costs with breakdown of the network elements by CONATEL, who should intervene setting such charges solely in those cases where there are conflicts between operators relating such charges, and they failed to reach consensus within the period specified in the interconnection legislation.
Competition law
Venezuelan law governing competition is the Promotion and Protection of Free Competition Act 1992. It prohibits monopolistic and oligarchic practices and other means that could impede, restrict, falsify, or limit the enjoyment of economic freedom. The Office of the Superintendent for the Promotion and Protection of Free Competition is the agency empowered to apply the Competition Act.
Chile
General regulatory framework
The General Telecommunications Law No. 18,168 of 1982, as amended, establishes the legal framework for the provision of telecommunications services in Chile. The main regulatory authority in Chile is the Under-Secretary of Telecommunications, or SUBTEL.
68

Prices and tariffs
Under the General Telecommunications Law, maximum tariffs for telephony services are set every five years by the Ministry of Transport and Telecommunications and the Ministry of Economy. In addition, the Competition Tribunal may subject any telephony service to price regulation, except for mobile telephone services to the public that are expressly exempted under the General Telecommunications Law.
The Competition Tribunal ruled in January 2009 that only some local telephone services were to be subject to tariff regulation (line connections, monthly fixed charges, variable traffics charges, and public payphone services are excluded). Accordingly, it was determined that every local telephone company, within its service zones, would be regulated with respect to tariff levels and structure. In addition, Telefónica Chile, in its capacity as a “dominant operator” (except in regions where other companies are the dominant operators), is regulated on a non-price basis, with requirements that it not engage in discriminatory pricing and that it give previous notice of plans and packages.
In 2011, the Ministries adopted, among other things, tariffs for local service, access charge and tariffs for other services within the local telephony service. Furthermore, others tariffs were regulated such as the Bitstream service and a number portability charge. Regarding mobile tariffs, charges for the use of the networks were adopted in 2009 for the period 2009-2014 and, the time structure was modified as well. At the end of 2012, a new procedure for the determination of tariffs will start.
On July 16, 2011 the Net Neutrality Act entered into force. Additionally, Long Distance Service was eliminated at the end of November in some regions of the country. Moreover, at the beginning of year 2014, Long Distance service will be completely eliminated in all regions of Chile.
Interconnection
Interconnection is obligatory for all license holders with the same type of public telecommunications services and between telephony public services and intermediate services that provide long distance services. The same requirement applies to holders of those intermediate service licenses, who are required to interconnect their networks to the local telephone network.
A “calling party pays” tariff structure was implemented on February 23, 1999. Under this tariff structure, local telephone companies pay mobile telephone companies an access charge for calls placed from fixed networks to mobile networks. Local telephone companies may pass this interconnection charge on to their customers. Every five years, SUBTEL sets the applicable tariffs for services provided through the interconnected networks.
Competition law
The principal regulation concerning competition in Chile is Decree No. 211 of 1973, whose current text was established in Decree Nº 1 of 2005. Pursuant to the provisions of this law, acts or behavior involving economic activities that constitute abuse of a dominant market position, or limit, restrain, or distort free competition in a manner that injures the common economic interest in the national territory are prohibited. The Competition Tribunal deals with infringements of competition law.
Argentina
General regulatory framework
The basic legal framework for the provision of telecommunications services in Argentina is set forth in the National Telecommunications Law (No. 19,798) of 1972 and in the specific regulations governing each type of telecommunications service. Decree 764/00 established the new and current regulatory framework rules for a free market, and includes interconnection, license, universal service and spectrum rules.
The following regulatory authorities oversee the Argentine telecommunications industry:
• the National Communications Commission, or CNC, supervises compliance with licenses and regulations, and approves changes to mandatory goal and service requirements; and
69

Prices and tariffs
On October 21, 2003, Law No. 25,790 became effective, extending the term for the renegotiation of concession or licensing agreements with public utilities until December 31, 2004, which was subsequently
extended until December 31, 2011. As an investor in Argentina through Telefónica de Argentina, we commenced arbitration proceedings against the Republic of Argentina based on the Reciprocal Protection of Investments Treaty between Spain and Argentina for damages suffered by us because of the measures adopted by the Argentine government in connection with the renegotiation of certain concession and licensing agreements. On August 21, 2009, the parties requested the Tribunal, in accordance with Rule 43 of the ICSID Arbitration Rules, declare a resolution of the termination of the proceedings. The agreement of the parties envisages the possibility of a new request for arbitration under the ICSID Convention being submitted by Telefónica.
Additionally, Decree No. 764/00 established that providers of telephone services may freely set rates and/or prices for their service which shall be applied on a non-discriminatory basis. However, until the Secretary of Communications determines that there is effective competition for telecommunications services, the “dominant” providers in the relevant areas (which include Telefónica de Argentina) must respect the maximum tariffs established in the general tariff structure.
Also, the guidelines set forth in article 26 of Decree No. 1185/90 continue in effect for operators with significant market power. These guidelines establish information obligations with which operators must comply with respect to tariffs and which flow toward both clients and the national regulator. This Decree also establishes the powers the regulator has to revise or revoke such tariffs.
Tariffs charged to customers for mobile services are currently not regulated in Argentina.
Interconnection
Decree No. 764/00 approved new rules for national interconnection and established interconnection standards and conditions with which telephone service providers must comply regardless of pre-existing agreements. The rules for national interconnection set forth that interconnection agreements are to be freely negotiated between the relevant service providers, on a non-discriminatory basis. The regulations also establish the obligation for dominant and significant market operators to unbundle their local loops and to allow competitors to use them on a reasonable basis.
Competition law
Law 25,156, on Protection of Competition prohibits any acts or behaviors related to the production or trade of goods or services, whose purpose or effect is to prevent, restrict or distort competition or market access, or that constitute abuse of dominant position in a market. The National Commission for the Defense of Competition is the authority entrusted with application of the law.
In 2011, the Argentine government announced the end of an investigation into monopolistic concentration by the country’s anti-trust authorities, ratifying the fine (104,692,500 Argentine pesos) imposed on Telefónica for late filing of notification of the transaction. Then in February 2011 the fine was reduced to 50,000,000 Argentine pesos.
Colombia
General regulatory framework
In Colombia, telecommunications are a public service, subject to state regulation and oversight. Law 1341/09 (“Technologies of Information and Communications Law”) reformed the legal framework, establishing the general regime for information and communication technologies. Under this law, providers of network and telecommunications services in Colombia must register with the Information and Communication Technologies Minister. In addition, operators must obtain a concession from the National Television Commission in order to provide television services.
• the Secretariat of Communications, or SECOM, grants new licenses, regulates the bidding and selection processes for radio-spectrum authorizations, and approves the related bidding terms and conditions.
70

Law 1341/09 established a transition period in which operators can: (i) preserve the original titles (licenses, contracts, permissions, authorizations) until their expiration or (ii) adopt the regime of general authorization stated by the law and the corresponding registration and preserve the necessary permissions in order to use the spectrum.
During 2009 the Colombian telecommunications regulator, Comisión de Regulación de Comunicaciones or CRC, identified the telecommunications relevant markets and operators with dominant position and established certain ex ante regulations.
In 2010 the telecommunications authority made a review of relevant markets and published drafts concerning certain markets and projects , such as the migration to NGN networks (where interconnection prices between traditional networks and NGN networks were proposed), a review of the mobile voice market (where modifications of mobile termination rates were proposed) and a review of end user protection measures.
Interconnection
Mobile and fixed operators in Colombia have the right to interconnect to other operators’ networks. Before the intervention of regulatory authorities, operators must attempt direct negotiations. Interconnection must assure compliance with the objectives of non-discriminatory treatment, transparency, prices based on costs plus a reasonable profit and promotion of competition.
Prices and tariffs
The Technologies of Information and Communications Law, provides for free pricing for voice and Internet access services. Therefore, mobile tariffs charged to customers are not regulated, although they may not be discriminatory. Nevertheless, fixed-to-mobile tariffs are subject to a price cap. Rates are fixed by mobile operating companies and must be registered with the Comisión de Regulación de Telecomunicaciones. The regulator set a price cap of 392 Colombian pesos per minute for fixed to mobile tariffs since November 1, 2006, and in 2009 the CRC reduced the tariff to 198.4 Colombian pesos per minute.
In 2011, the CRC issued a progressive reduction on mobile termination charges from 2012- 2015. A new regime for the protection of convergent consumers was adopted as well as a new regime for interconnection for convergent networks, introducing conditions for access by content and applications providers. Furthermore, CRC adopted the conditions for the provision of content and applications in mobile networks setting a new numbering management plan and has fixed price caps for the SMS between operators, applicable from January 1, 2012 to December 31, 2014. Also, has established quality conditions for the provision of the Internet mobile service.
The regulator has also approved conditions for Net Neutrality allowing different offers according to the consumer profile but prohibiting discriminatory behavior.
Television services
In December 2010, the National Television Commission published Agreement Number 006 to modify the fees payable to exploit closed television. Before Agreement Number 006, operators paid 10% of gross incomes; now the percentage has been reduced to 7% of gross incomes.
In January 2011, Colombia Telecom signed with the National Television Commission an amendment to its concession agreement with the effect of including an arbitration clause.
Competition law
The Colombian Competition Law is incorporated in the Law No. 155/59, Decree No 2153/92 and Law 1340/09 on Restrictive Trade Practices. The law prohibits entering in any agreement or engaging in any type of practice, procedure, or system that aims to limit free competition and abuse of a dominant position. The Superintendent of Industry and Commerce is the Colombian competition authority.
71

Peru
General regulatory framework
The provision of telecommunications services in Peru is governed by the Telecommunications Law and related regulations.
Prices and tariffs
Tariffs for fixed telephony services must be approved by the National Regulatory Authority, the Organization for Supervision of Private Investment in Telecommunications, or OSIPTEL, in accordance with a price cap formula based on a productivity factor. Rates charged by mobile providers to their customers have been subject to a free tariff regime supervised by OSIPTEL. Tariffs must be reported to OSIPTEL prior to implementation.
On December 28, 2011 OSIPTEL fixed in S/. 0.0042 per second (not including taxes) (S/. 0.30 per minute, taxes included) the maximum rate applicable to local calls made from Telefónica del Perú S.A.A’s fixed telephones to mobile telephones. This new rate is in force since December 30, 2011 and since then the fixed-mobile rates are determined by the fixed telephone operators.
Interconnection
Mobile service providers are required, upon request, to interconnect with other concession holders. According to the principles of neutrality and non-discrimination contemplated in the Telecommunications Law, the conditions agreed upon in any interconnection agreement will apply to third parties in the event that those conditions are more beneficial than terms and conditions agreed upon separately.
Competition law The general competition framework in Peru is based on the Legislative Decree No. 1034. This law prohibits any monopolistic practices, controls, and restraints on free competition and it is applied, in the telecommunication sector, by OSIPTEL. Licenses and Concessions
Please see Appendix VI to our Consolidated Financial Statements. Seasonality
Our main business is not significantly affected by seasonal trends. Patents
Our business is not materially dependent upon the ownership of patents, commercial or financial contracts or new manufacturing processes. C. Organizational Structure
See “—History and Development of the Company” and “—Business Overview.” D. Property, Plant and Equipment
Our central headquarters for the Telefónica Group are located in “Distrito Telefónica,” in Madrid, Spain.
72

Fixed Networks
We own fixed networks in Spain, Latin America and Europe, having an incumbent role in Spain, Argentina (the greater Buenos Aires metropolitan area and the southern portion of the country), Brazil (São Paulo), Chile, Peru, Colombia and the Czech Republic.
Following market trends, competitive environments, evolution of technologies and new multimedia and broadband services demanded by our customers, we have upgraded our networks in recent years in the following manners:
Mobile Networks
We operate mobile networks in Spain, the United Kingdom, Germany, Ireland, the Czech Republic, Slovakia, Brazil, Argentina, Venezuela, Chile, Peru, Colombia, Mexico, Guatemala, Panama, El Salvador, Nicaragua, Costa Rica, Ecuador and Uruguay.
We use a number of mobile technologies in the countries in which we operate, namely: GSM and UMTS in Spain, the United Kingdom, Ireland, Germany, Czech Republic, Slovakia and Latin America; CDMA 1X in other countries in Latin America (such as, Brazil, Venezuela and Colombia) and, in the Czech Republic (CDMA 450 MHz). We continue the work of upgrading our mobile networks in line with market trends, the demand of new services from customers and the evolution of technologies. The main steps we are currently taking include:
• progressive introduction of broadband access technologies over copper: ADSL, ADSL2+, VDSL2, etc., increasing the bandwidth capacity provided to our broadband clients several times in the last nine years;
• introduction of fiber access technologies (xPON) across different deployment scenarios: fiber to the home (FTTH), fiber to the building (FTTB), fiber to the curb (FTTC), fiber to the node (FTTN), etc., increasing the access speed up to 100 Mbps;
• service support based on powerful Internet Protocol/ Multiprotocol Label Switching (IP/MPLS) backbones, providing full connectivity to the rest of the network layers, such as access and control, to support services for business and customer market segments (fixed and mobile);
• migration of the legacy time division multiplexing (TDM) switching networks (PSTN and ISDN) to new generation network (NGN) over all-IP packet networks;
• migration from legacy transport technologies, such as asynchronous transfer mode (ATM), frame relay (FR), low-rate leased lines, plesiochronous digital hierarchy (PDH) and synchronous digital hierarchy (SDH), to the new generation of optical transport ones, such as dense wavelength division multiplexing (DWDM), coarse wavelength division multiplexing (CWDM) and new generation - synchronous digital hierarchy (NG-SDH);
• introduction of IMS (Internet Multimedia Subsystem) in many countries to simplify the control of the network and ease the deployment of new services over the all-IP converged network;
• empowerment of the intelligence of the network to better manage its use, to avoid saturations and frauds and to identify new business opportunities;
• convergence of fixed and mobile networks, services and support systems from both technological and operational points of view; and
• deployment of new services such as pay TV, to customers connected through broadband accesses in Spain, Czech Republic, Peru, Chile, Colombia and Brazil.
• progressive migration from CDMA technologies to GSM or UMTS technologies in markets where we still exploit these legacy technologies;
73

Satellite communications
The services provided using satellite platforms include television contribution signal to feed cable and IPTV head ends, DTH television, VSAT mainly for telephony and Internet access in rural areas,
emergency solutions, corporate communications and international communications.
Submarine cables
We are one of the world’s largest submarine cable operators. We participate in approximately 25 international underwater cable systems (nine of which are moored in Spain) and own eleven domestic fiber optic cables.
There are submarine cable connections between Spain and Africa, America, Asia and Europe, respectively, which are jointly owned by us with other telecom operators. The SAM-1 cable, which we own, has a length of approximately 22,000 kilometers underwater and 3,000 kilometers terrestrial and links different countries such as the United States, Puerto Rico, Ecuador, Guatemala, Peru, Chile, Brazil, Argentina and Colombia.
The principal services using the capacity of submarine cables are voice circuits, Internet and dedicated circuits for international traffic and for corporations and business customers. Item 4A. Unresolved Staff Comments
Not applicable. Item 5. Operating and Financial Review and Prospects A. Operating Results Presentation of Financial Information
The information in this section should be read in conjunction with our Consolidated Financial Statements and the notes thereto, included elsewhere in this Annual Report. Our Consolidated Financial Statements have been prepared in accordance with IFRS as issued by the IASB.
• introduction of broadband into mobile access using technologies such as UMTS, HSDPA, HSUPAHSPA+ and LTE;
• deployment of new services such as mobile television and distribution services for next generation music, video and games;
• exploration of the adequacy of new technologies such as HSPA and LTE to provide mobile accesses with increased bandwidth, in particular:
− HSPA: we have been committed to the deployment of this technology in countries in which we have a presence and as of December 31, 2011, we have extended our coverage up to the majority of the urban/suburban areas, and we have increased the capacity of the network by upgrading the network technology to the latest available releases of UMTS standards 3GPP REL 6, REL 7 and REL 8;
− LTE: together with main vendors and sharing experience with other operators, we have extensively analyzed the opportunities LTE will bring as 4G mobile technology is used to complement current network technology by creating higher capacity at lower relative cost by user/traffic unit, and, in this regard, during 2011 we implemented commercial operations using this technology in Germany, and we have continued extensive trials in other countries in Europe and Latin America with the objective of broadly launching LTE services during 2012; and
− convergence of fixed and mobile networks, services and support systems from both technological and operational points of view.
74

During the years under review, we were managed as three business areas: Telefónica Spain, Telefónica Europe and Telefónica Latin America, each of which oversees the integrated fixed and
mobile telephone and other businesses in its region. These three business areas form the basis of our segment reporting in our Consolidated Financial Statements.
Non-GAAP financial information
Operating income before depreciation and amortization
Operating income before depreciation and amortization, or OIBDA, is calculated by excluding depreciation and amortization expenses from our operating income in order to eliminate the impact of generally long-term capital investments that cannot be significantly influenced by our management in the short term. Our management believes that OIBDA is meaningful for investors because it provides an analysis of our operating results and our segment profitability using the same measure used by our management. OIBDA also allows us to compare our results with those of other companies in the telecommunications sector without considering their asset structure. We use OIBDA to track our business evolution and establish operational and strategic targets. OIBDA is also a measure commonly reported and widely used by analysts, investors and other interested parties in the telecommunications industry. OIBDA is not an explicit measure of financial performance under IFRS and may not be comparable to other similarly titled measures for other companies. OIBDA should not be considered an alternative to operating income as an indicator of our operating performance, or an alternative to cash flows from operating activities as a measure of our liquidity.
The following table provides a reconciliation of our OIBDA to operating income for the periods indicated.
The following tables provide a reconciliation of OIBDA to operating income for us and each of our business areas for the periods indicated.
Year ended December 31, 2009 2010 2011 (in millions of euro)Operating income before depreciation and amortization 22,603 25,777 20,210Depreciation and amortization expense (8,956) (9,303) (10,146)Operating income 13,647 16,474 10,064
Year ended December 31, 2011
Telefónica SpainTelefónica Latin
AmericaTelefónica
Europe Others and
Eliminations Total (in millions of euro) Operating income before depreciation and amortization 5,072 10,941 4,233 (36) 20,210Depreciation and amortization expense (2,088) (4,783) (3,117) (158) (10,146)Operating income 2,984 6,158 1,116 (194) 10,064
Year ended December 31, 2010(1)
Telefónica SpainTelefónica Latin
AmericaTelefónica
Europe Others and
Eliminations Total (in millions of euro) Operating income before depreciation and amortization 8,520 13,713 4,080 (536) 25,777Depreciation and amortization expense (2,009) (3,954) (3,201) (139) (9,303)Operating income 6,511 9,759 879 (675) 16,474
75

Net financial debt and net debt
We calculate net financial debt by deducting the positive mark-to-market value of derivatives with a maturity beyond one year from the relevant balance sheet date and other interest-bearing assets (each of which are components of non-current financial assets in our consolidated statement of financial position), current financial assets and cash and cash equivalents from the sum of (i) current and non-current interest-bearing debt (which includes the negative mark-to-market value of derivatives with a maturity beyond one year) and (ii) other payables (a component of non-current trade and other payables in our consolidated statement of financial position). We calculate net debt by adding to net financial debt those commitments related to financial guarantees, not considered as net financial debt, and those related to workforce reduction. We believe that net financial debt and net debt are meaningful for investors because they provide an analysis of our solvency using the same measures used by our management. We use net financial debt and net debt to calculate internally certain solvency and leverage ratios used by management. Neither net debt nor net financial debt as calculated by us should be considered an alternative to gross financial debt (the sum of current and non-current interest-bearing debt) as a measure of our liquidity.
The following table provides a reconciliation of our net financial debt and net debt to gross financial debt at the dates indicated:
Significant Factors Affecting the Comparability of our Results of Operations in the Periods Under Review
Please see “Comparative information and main changes in the consolidation scope” in Note 2 to our Consolidated Financial Statements.
Year ended December 31, 2009(1)
Telefónica SpainTelefónica Latin
AmericaTelefónica
Europe Others and
Eliminations Total (in millions of euro) Operating income before depreciation and amortization 9,757 9,041 3,999 (194) 22,603Depreciation and amortization expense (2,140) (3,700) (2,988) (128) (8,956)Operating income 7,617 5,341 1,011 (322) 13,647
(1) Restated for comparative purposes to show the inclusion within Telefónica Europe in 2011 of the results of both Telefónica International Wholesale Services and Telefónica North America (previously included in Telefónica Latinoamérica).
As of December 31, 2009 2010 2011 (in millions of euro)Non-current interest-bearing debt 47,607 51,356 55,659Current interest-bearing debt 9,184 9,744 10,652Gross financial debt 56,791 61,100 66,311Other non-current payables 515 1,718 1,583Other current payables (deferred payment for the acquisition of Brasilcel) — 1,977 —Non-current financial assets(1) (2,736) (3,408) (4,830)Current financial assets (1,906) (1,574) (2,625)Cash and cash equivalents (9,113) (4,220) (4,135)Net financial debt 43,551 55,593 56,304Commitments related to financial guarantees 71 — —Net commitments related to workforce reduction 2,261 1,710 1,810Net debt 45,883 57,303 58,114
(1) Positive mark-to-market value of derivatives with a maturity beyond one year from the relevant statement of financial position date and other interest-bearing assets.
76

Significant Changes in Accounting Policies
Please see Note 3(s) to our Consolidated Financial Statements. Critical Accounting Policies and Estimates
The preparation of financial statements in conformity with IFRS requires management to make estimates and assumptions that affect the amounts reflected in the Consolidated Financial Statements and accompanying notes. We base our estimates on historical experience, where applicable, and other assumptions that we believe are reasonable under the circumstances. Actual results may differ from those estimates under different assumptions or conditions.
We consider an accounting estimate to be critical if:
The various policies that are important to the portrayal of our financial condition, results of operations and cash flows include:
Accounting for long-lived assets, including goodwill
Property, plant and equipment and intangible assets, other than goodwill, are recorded at acquisition cost. If such assets are acquired in a business combination, the acquisition cost is the estimated fair value
of the acquired property, plant and equipment or intangible assets. Property, plant and equipment and intangible assets with definite useful lives are depreciated or amortized on a straight-line basis over their estimated useful lives.
Intangible assets with indefinite useful lives are not amortized, but are, instead, subject to an impairment test on a yearly basis and whenever there is an indication that such assets may be impaired.
Accounting for long-lived assets and intangible assets involves the use of estimates for determining: (a) the fair value at the acquisition date in the case of such assets acquired in a business combination, and (b) the useful lives of the assets over which they are to be depreciated or amortized. We believe that the estimates we make to determine an asset’s useful life are “critical accounting estimates” because they require our management to make estimates about technological evolution and competitive uses of assets.
When an impairment in the carrying amount of an asset occurs, non-scheduled write-downs are made. We perform impairment tests of identifiable intangible and long-lived assets whenever there is reason to believe that the carrying value may exceed the recoverable amount, which is the higher of the asset’s fair value less costs to sell and its value in use. Furthermore, previously recognized impairment losses may be reversed when changes in the estimates used to determine the asset’s recoverable amount indicate that an impairment loss recognized in prior periods no longer exists or may have decreased.
The determination of whether the impairment of long-lived and intangible assets is necessary involves the use of significant estimates and judgment that includes, but is not limited to, the analysis of the cause of potential impairment in value, the timing of such potential impairment and an estimate of the amount of the impairment, which requires the estimation of the future expected cash flows, discount rates and the fair value of the assets.
• it requires us to make assumptions because information was not available at the time or it included matters that were highly uncertain at the time we were making our estimate; and
• changes in the estimate or different estimates that we could have selected may have had a material impact on our financial condition or results of operations.
• accounting for long-lived assets, including goodwill;
• deferred taxes;
• provisions; and
• revenue recognition.
77

Specifically, management has to make certain assumptions in respect of uncertain matters, such as growth in revenues, changes in market prices, operating margins, and technology developments and obsolescence, discontinuance of services and other changes in circumstances that indicate the need to perform an impairment test. Management’s estimates about technology and its future development require significant judgment because the timing and nature of technological advances are difficult to predict.
Goodwill arises when the cost of a business combination exceeds the acquirer’s interest in the net fair value of the identifiable assets acquired and liabilities and contingent liabilities assumed. Goodwill is not amortized, but is, instead, subject to an impairment test on a yearly basis and whenever there is an indication that the goodwill may be impaired.
Non-scheduled write-downs of goodwill are made when an impairment in the carrying amount of goodwill occurs. We review, on a regular basis, the performance of our cash-generating units. We compare the carrying amount of the cash-generating unit to which the goodwill has been allocated with its recoverable amount. The determination of the recoverable amount of the cash-generating unit involves extensive use of estimates and significant management judgment is involved. Methods commonly used by us for valuations include discounted cash flow methods.
A significant change in the facts and circumstances that we relied upon in making our estimates may have a material impact on our operating results and financial condition.
Deferred taxes
Management assesses the recoverability of deferred tax assets on the basis of estimates of our future taxable profit. The recoverability of deferred tax assets ultimately depends on our ability to generate sufficient taxable profit during the periods in which the deferred tax assets are utilized. In making this assessment, our management considers the scheduled reversal of deferred tax liabilities, projected taxable profit and tax planning strategies.
This assessment is carried out on the basis of internal projections, which are updated to reflect our most recent operating trends. In accordance with applicable accounting standards, a deferred tax asset must be recognized for all deductible temporary differences and for the carry-forward of unused tax credits and unused tax losses to the extent that it is probable that taxable profit will be available against which the deductible temporary difference can be utilized. Our current and deferred income taxes are impacted by events and transactions arising in the normal course of business as well as in connection with special and non-recurring items. Assessment of the appropriate amount and classification of income taxes is dependent on several factors, including estimates of the timing and realization of deferred tax assets and the timing of income tax payments. Actual collections and payments may materially differ from these estimates as a result of changes in tax laws as well as unanticipated future transactions impacting our income tax balances.
Provisions
Provisions are recorded when, at the end of the period, we have a present obligation as a result of past events, whose settlement requires an outflow of resources that is considered probable and can be measured reliably. This obligation may be legal or constructive, arising from, but not limited to, regulation, contracts, common practice or public commitments, which have created a valid expectation for third parties that we will assume certain responsibilities. The amount recorded is the best estimation performed by the management in respect of the expenditure that will be required to settle the obligations, considering all the information available at the closing date, including the advice of external experts, such as legal advisors or consultants.
If we are unable to reliably measure the obligation, no provision is recorded and information is then presented in the notes to the Consolidated Financial Statements.
Because of the inherent uncertainties in this estimation, actual expenditures may be different from the originally estimated amount recognized.
78

Revenue recognition
Connection fees
Revenues from connection fees originated when customers connect to our network are deferred over the average expected length of the customer relationship.
The expected customer relationship period is estimated based on recent historical experience of customer churn rates. Significant changes in our estimations may result in differences in the amount and timing of revenues recognized.
Multiple-element arrangements
Arrangements involving the delivery of bundled products or services are assessed to determine whether it is necessary to separate the arrangement into individual component deliverables, each with its own revenue recognition criteria.
Revenues relating to the bundled contracts is allocated to the different deliverables identified, based on their relative fair values (i.e., the fair value of each individual component deliverables in relation to the total fair value of the bundled deliverables), considering that amounts contingent upon delivery of undelivered items are not allocated to delivered items. Given that the handsets and airtime are price-sensitive and volatile in a competitive marketplace, the determination of fair values in the mobile phone business is quite complex.
Additionally, a significant change in the facts and circumstances upon which we based our fair value estimates may have an impact on the allocation of revenues among the different deliverables identified and, consequently, on future revenues. Operating Environment
Our results of operations are dependent, to a large extent, on the level of demand for our services in the countries in which we operate. Demand for services in those countries is affected by the performance of their respective economies, including changes in gross domestic product, or GDP, inflation, or CPI, external accounts and unemployment rates.
Operating environment by country
Spain
In 2011, Spanish GDP grew by 0.7% (Spanish National Institute of Statistics estimates), compared with a positive average annual growth rate of 3.6% in the period 1998 through 2008 and a contraction on average of 1.8% in 2009 and 2010. This performance was explained by a contraction of internal demand, though household consumption grew at 0.1% according to Consensus Forecast’s (an independent research firm) estimates (“CFe”) in 2011 compared with an annual rate of -1.7% during 2009-10 and compared with average growth of 3.6% during the period 1998 through 2008. Investment contracted at an annual rate of 4.4% (CFe) during 2011 after a 11.3% decline on average in 2009 and 2010, compared with average annual growth of 5.6% during the period 1998 through 2008. Inflation averaged 3.2% in 2011, compared with 1.9% on average in 2009 and 2010 and -0.3% in 2009. Despite the higher average annual inflation rate, prices in 2011 experienced a high degree of volatility throughout the year, reaching a minimum of 2.4% in December having reached a maximum of 3.8% in April. The current account deficit for 2011 reached 4.0% of GDP (CFe), compared with 4.6% of GDP in 2010 and 5.2% of GDP in 2009. The unemployment rate reached 22.85% at the end of 2011, higher than the average rates of 20.3% in 2010 and 18.8% in 2009.
United Kingdom
In 2011, the British economy, measured in terms of GDP, grew by 0.9%, compared with a growth rate of 2.1% in 2010 and a negative growth rate of 4.4% in 2009. Fixed capital investment decreased by 1.9% (CFe), compared with a growth of 3.1% in 2010 and a contraction of 13.4% in 2009. Private consumption fell by 0.9% (CFe), compared with a 1.2% growth rate in 2010 after falling at an annual rate of 3.5% in 2009. The CPI increased by an average
79

annual growth rate of 4.5%, compared with 3.3% in 2010 and 2.2% in 2009. The unemployment rate reached 8.4% in 2011, compared with an average annual rate of 7.8% in 2010 and 7.6% in 2009.
Germany
In 2011, the German economy grew 3.0%, after growing 3.7% in 2010 and contracting 5.1% in 2009. Growth in 2011 was due to an expansion in fixed income investment of 6.5% (CFe) in such year, and the positive contribution of the external sector to GDP growth (exports increased 11.6% while imports grew 11%). Because of this, the current account balance declined to 5.2% in 2011, from 5.7% of GDP in 2010. Inflation averaged 2.3% in 2011, compared with 1.1% in 2010 and 0.3% in 2009. At the end of 2011, inflation stood at 2.1%. At the end of 2011, the unemployment rate stood at 6.6 %, compared with an average of 7.7% in 2010 and 8.1% in 2009. In 2011, 546,250 jobs were created, compared with the 188,500 jobs created in 2010 and the 18,250 created in 2009, according to Bundesbank.
Czech Republic
The Czech economy grew 1.7% in 2011, after growing 2.6% in 2010 and contracting 4.5% in 2009. Private consumption contracted 0.3% in 2011, expanded 0.5% in 2010 and contracted 0.3% in 2009 (Source: Consensus Forecast, with reference to data published by the Czech Statistical Office). Inflation, as measured by the CPI, grew 2.4%, compared with 2.3% in December 2010, slightly above the Central Bank objective (2%) and above the 1% level reached in 2009. The current account had a €6.1 billion deficit, higher than the €5.6 billion deficit recorded in 2010 (€4.4 billion deficit in 2009). Net foreign direct investment was slightly reduced, creating a €3.1 billion surplus in 2011. This surplus is lower than the surplus accounted in 2010 (€3.8 billion) but higher than that accounted for in 2009 (€1.4 billion). The European debt crisis had a negative impact on the Czech crown in 2011, with the average Czech crown to euro exchange rate for 2011 depreciating by 2.18%, compared with an appreciation of 5.6% in 2010 and 1.7% in 2009.
Brazil
Brazilian GDP increased more than 2% in 2011, following an increase of 7.5% in 2010 and a contraction of 0.3% in 2009. Investment increased more than 4% in 2011, compared with an increase of 21.3% in 2010 and following a decrease of 6.7% in 2009 (Source: Brazilian Geography and Statistics Institute). Inflation, as measured by the CPI, increased to 6.5% (above the inflation target established by the Central Bank of 4.5%), compared with 5.9% in 2010 and 4.3% in 2009. Due to inflation, the basic interest rate, the SELIC, was increased from 10.75% to 11% in 2011. The current account deficit reached $52.6 billion in 2011, compared with $47.3 billion in 2010 and $24.3 billion in 2009. This deficit in 2011 was financed by capital inflows, such as foreign direct investments of $66.7 billion, and portfolio investments, of 25.1 billion. As a consequence, international reserves rose by $63.4 billion in 2011, to a record level of $352 billion. Despite the improvement in domestic economic data, the deterioration of worldwide economic circumstances led to an increase in country risk. The J.P. Morgan Emerging Markets Bond Index Plus (EMBI + Brazil) ended 2011 at 233 basis points, from 189 basis points at the end of 2010 and 192 basis points at the end of 2009. As the risk increased and the global economic environment became more challenging, the exchange rate halted its appreciatory trend. The Brazilian real depreciated against the U.S. dollar by 7.7 % in 2011, reaching an exchange rate of R$1.88 per $1.00 on December 31, 2011, from R$1.67 per $1.00 on December 31, 2010 and R$1.74 per $1.00 at the end of 2009.
Mexico
Mexico’s real GDP grew by 3.9% (CFe) in 2011, after growing 5.4% in 2010 and after contracting 6.1% in 2009. Inflation, as measured by the CPI, was 3.82% at December 2011 compared with 4.15% at December 2010, above the central bank’s target of 3% but inside its tolerance range of 2% to 4%. Despite the harsh economic downturn suffered in 2009, during 2011 the aggregate demand in Mexico has shown a stabilizing trend that began in 2010. Indeed, exports have increased by more than 7%, private consumption by almost 4.5% and investment by 7.5% compared with 2010. The current account balance posted a deficit of $10 billion in 2011, compared with $5.7 billion in 2010. These external imbalances were well financed by capital inflows and international reserves held by the central bank reached $143 billion in 2011 (amounting to 12.6% of GDP). At December 31, 2011, the exchange rate relative to the
80

U.S. dollar was 13.94 Mexican pesos to the U.S. dollar (compared with the minimum of 11.65 Mexican pesos to the U.S. dollar reached in July 2011).
Venezuela
The Venezuelan economy experienced positive results in 2011, reversing the contraction experienced during the prior two years. In 2011, GDP expanded approximately 4.0%, after contracting 1.5% in 2010. Last year, the best results were observed in non-oil activity, which rose 4.3%. Private consumption increased 3.7% (compared with a decrease of 1.9% in 2010 and a decrease of 2.9% in 2009) despite high inflation, mainly due to the high expansion in public consumption. In 2011, investment showed a 12.5% growth (growth of 1.0% in 2010 and a decrease of 19.1% in 2009), public consumption grew 6.0% (growth of 2.1% in 2010 and 1.5% in 2009), exports increased 5.9% (decrease of 12.9% in 2010 and 13.7% in 2009), and imports increased 13.4% (decrease of 2.9% in 2010 and 19.6% in 2009). In terms of inflation, the national CPI rose to 27.6% in 2011, 27.2% in 2010 and 25.1% in 2009. Venezuela continues to have the highest inflation rate in Latin America. The unemployment rate reached 8.2% at the end of 2011, 8.7% at the end of 2010 and 7.9% at the end of 2009. The external accounts experienced a positive impact as a result of the recovery of oil prices, with the current account surplus increasing to $31.5 billion in 2011, in comparison with $14.4 billion in 2010 and $8.6 billion in 2009. Additionally, the capital account deficit reached $32.6 billion in 2011, compared with deficits of $18.6 billion in 2010 and $14.0 billion in 2009. This performance generated a reduction in the central bank’s stock of international reserves to $29.9 billion at the end of 2011 (Source: Central Bank of Venezuela).
Chile
Chilean GDP grew by an estimated 6.3% (CFe) in 2011, the highest annual growth in fourteen years. A continuing strong post-earthquake output recovery was the main driver of the annual outcome, offsetting the loss of dynamism brought about by worsening global economic conditions. The unemployment rate decreased from 8.1% in 2010 to 7.1% in 2011 progressing closer to full employment levels. Inflation, measured by consumer price index (CPI), rose to 4.4% in 2011 compared with 3.0% in 2010 and -1.7% in 2009. CPI inflation surpassed the monetary policy target range (3% -/+1%) fueled by higher international oil and food prices and the emergence of demand pressures due to the outperformance of the economy. The Central Bank key interest rate was increased from 3.25% at December 2010 to 5.25% at June 2011 and remained unchanged the rest of the year. The Fiscal balance reached a surplus of 1.2% of GDP, compared with 0.4% and 4.4% GDP deficits in 2010 and 2009, respectively. Foreign direct investment net inflows accumulated $9.0 billion in 2011, increasing from $6.4 billion in 2010 and $4.8 billion in 2009. The trade balance surplus diminished from $15.9 billion in 2010 to $10.6 billion in 2011 mainly because of copper price decreases in the last part of the year. At the end of 2011 the nominal Chilean Peso to US Dollar exchange rate was $521.5, reflecting a year end Peso depreciation of 11.3%; however the local currency appreciated from an average of $510.3 in 2010 to an average of $483.7 in 2011. Throughout the year the exchange rate mainly tracked turbulences in the international financial markets.
Argentina
Argentina’s GDP grew by 7.6% in 2011 (CFe). This data is similar, but lower, to the average annual growth rates of approximately 8.5% achieved from 2003 through 2008. The Argentine peso depreciated 7.7% relative to the U.S. dollar, closing at 4.29 Argentine pesos per U.S. dollar at the end of 2011 compared with 3.98 Argentine pesos per U.S. dollar at the end of 2010 and 3.81 Argentine pesos per U.S. dollar at the end of 2009. The official CPI increased 9.5% in 2011 (compared with 10.9% in 2010 and 7.7% in 2009). The current account balance showed a surplus of $1.3 billion in 2011 (CFe), which is €1.6 billion and €9.8 billion lower compared with 2010 and 2009, respectively. The trade balance contributed significantly to this result since imports increased 30.8 %, more than the 23.7 % increase in exports over the same period. Economic conditions affected unemployment positively, which decreased to 7.1 % at the end of 2011 from 7.3% at the end of 2010 and 8.4% at the end of 2009.
Colombia
Macroeconomic conditions improved in Colombia in 2011. After GDP growth deceleration in 2009 and a recovery the following year, growth continued to accelerate in 2011. The positive performance of domestic demand components, private consumption and investment were the main drivers of this growth. Industry and retail sales
81

continued to show significant growth over the year. Analysts forecast GDP to grow nearly 5.5% at the end of 2011 (Source: Latin Focus Consensus Forecast’s estimate). The unemployment rate averaged 10.8% in 2011, compared with 11.8% and 12% in 2010 and 2009, respectively. At the end of third quarter of 2011, the balance of payments registered a current account deficit of $6,828 million, 2.7% of GDP YTD as of September 2011, compared with 3.1% and 2.1% of GDP in 2010 and 2009, respectively. The current account deficit in 2011 was mainly financed through higher private external debt, foreign direct investment (FDI) inflows and portfolio investment. This resulted in a financial account surplus of $10,640 million (4.2% of GDP YTD as of September 2011). Despite FDI inflows and better economic outlooks for the Colombian economy (stronger economic growth and the investment grade recovery), the Colombian peso depreciated 1.5% during 2011 against the U.S. dollar (closing the year at 1,942.7 Colombian pesos per one US dollar) primarily as a consequence of the high volatility in international markets and global economic uncertainty. The inflation rate was 3.7% at the end of 2011, compared with 3.2% and 2.0% at the end of 2010 and 2009, respectively.
Peru
During 2011, the Peruvian economy, in terms of GDP, grew by 6.9% compared with 8.8% in 2010 and 0.9% in 2009. GDP growth acceleration was mainly driven by domestic private demand (Source: Central Bank of Peru). Consumer prices, as measured by the CPI, increased by 4.7% in 2011 2.7 percentage points over the center and beyond the range of the central bank’s target, compared with 2.1% in 2010 and 0.3% in 2009. The fiscal deficit was approximately 2% GDP in 2011, compared with a fiscal deficit of 0.6% in 2010 and 1.9% in 2009. In the foreign exchange market, the Peruvian nuevo sol appreciated 4.2% against the U.S. dollar in 2011, reaching 2,696 Peruvian nuevo sol per U.S. dollar at the end of the year, compared with an appreciation of 2.9% against the U.S. dollar in 2010 and 8% in 2009. Long term capital inflows boosted international net reserves, reaching US$ 48.9 billion, compared with US$ 44.1 billion in 2010 and US$ 33.1 billion in 2009. Country risk, measured by the J.P. Morgan Emerging Markets Bond Index (EMBIG Peru), rose 60 basis points to 217 basis points in 2011, due to turmoil in European debt and financial markets. Long-term sovereign debt is currently investment grade rated by Fitch, Standard and Poor’s and Moody’s rating agencies. Exchange Rate Fluctuations
We publish our Consolidated Financial Statements in euro. Because a substantial portion of our assets, liabilities, revenues and profit are denominated in currencies other than the euro, we are exposed to fluctuations in the values of these currencies against the euro. Currency fluctuations have had and may continue to have a material impact on our financial condition, results of operations and cash flows.
We estimate that in 2011 variations in currencies decreased our collection and payment and cash balance by approximately €169 million and decreased our consolidated revenues by approximately 0.7%. Currency fluctuations can also have a significant impact on our statement of financial position, particularly equity attributable to equity holders of the parent, when translating the financial statements of subsidiaries located outside the euro zone into euro. For example, in 2011 equity attributable to equity holders of the parent decreased by €897 million due to the translation of the financial statements of our foreign subsidiaries, principally due to the depreciation of the pound sterling and Brazilian real relative to the euro.
We estimate that in 2010 variations in currencies decreased our collection and payment and cash balance by approximately €463 million and increased our consolidated revenues by approximately 2.2% including the devaluation in the Venezuelan bolivar. Currency fluctuations can also have a significant impact on our statement of financial position, particularly equity attributable to equity holders of the parent, when translating the financial statements of subsidiaries located outside the euro zone into euro. For example, in 2010 equity attributable to equity holders of the parent increased by €430 million due to the translation of the financial statements of our foreign subsidiaries, principally due to the appreciation of the Brazilian real and the pound sterling relative to the euro, and the effect of the devaluation in Venezuela.
We estimate that in 2009 variations in currencies increased our collection and payment and cash balance by approximately €269 million and decreased our consolidated revenues by approximately 3.1%. Currency fluctuations can also have a significant impact on our statement of financial position, particularly equity attributable to equity
82

holders of the parent, when translating the financial statements of subsidiaries located outside the euro zone into euro. For example, in 2009 equity attributable to equity holders of the parent increased by €2,238 million due to the translation of the financial statements of our foreign subsidiaries, principally due to the appreciation of the Brazilian real and the pound sterling relative to the euro, and the effect of the devaluation in Venezuela.
The table below sets forth the average exchange rates against the euro of the dollar and the key currencies that impacted our consolidated results of operations for the periods indicated. Positive percentage changes represent a decline in the value of the applicable currency relative to the euro, and negative percentage changes represent increases in the value of the applicable currency relative to the euro.
Source: Central treasury bank of the respective countries.
We describe certain risks relating to exchange rate fluctuations in “Item 3. Key Information—Risk Factors,” and we describe our policy with respect to limiting our exposure to short-term fluctuations in
exchange rates under “Item 11. Quantitative and Qualitative Disclosures About Market Risk.” Group Results of Operations
Please see Item 4.B “Business Overview — Group Results of Operations.” B. Liquidity and Capital Resources Cash Flow Analysis
The table below sets forth consolidated cash flow information for the periods indicated. Positive figures refer to cash inflows and those in parenthesis refer to cash outflows.
For a discussion of our cash flows for the years ended December 31, 2009, 2010 and 2011, please see Note 23 to our Consolidated Financial Statements.
2009(1) Average
2010(1) Average
2011(1) Average
% change 2009 to 2010 Average
% change 2010 to 2011 Average
Pound Sterling 0.89 0.86 0.87 (3.37)% 1.16%U.S. Dollar 1.39 1.32 1.40 (5.04)% 6.06%Brazilian Real 2.76 2.33 2.33 (15.58)% 0.00%Argentine Peso 5.17 5.18 5.74 0.19% 10.81%Peruvian Nuevo Sol 4.18 3.74 3.83 (10.53)% 2.41%Chilean Peso 775.80 674.36 672.25 (13.08)% (0.31)%Mexican Peso 18.78 16.71 17.25 (11.02)% 3.23%Venezuelan Bolivar fuerte (2) 3.10 5.75 5.56 85.48% (3.30)%Czech Crown 26.44 25.29 24.59 (4.35)% (2.77)%Colombian Peso 2,985.07 2,509.22 2,568.67 (15.94)% 2.37%Guatemalan Quetzal 11.33 10.66 10.83 (5.91)% 1.59%
(1) These exchange rates are used to convert the income statements of our subsidiaries from local currency to euro.
(2) After considering Venezuela a hyperinflationary country, the income statement from operations in Venezuela is to be accounted pursuant to the closing exchange rate of Venezuelan bolivar fuerte to euro.
Year ended December 31, 2009 2010 2011IFRS (in millions of euro)Net cash from operating activities 16,148 16,672 17,483Net cash used in investing activities (9,300) (15,861) (12,497)Net cash used in financing activities (2,281) (5,248) (4,912)
83

Anticipated Uses of Funds
Our principal liquidity and capital resource requirements consist of the following:
We have announced for 2012 a capital expenditure over revenues target similar to that achieved in 2011. This target excludes any spectrum licenses which we may acquire. In 2012, we expect to continue
expanding our mobile networks, especially in 3G, selectively invest in LTE and to further enhance our fixed broadband networks with selective fiber deployment. We also expect to invest to improve IT capabilities. Finally we plan to invest in digital sources to build capabilities and a power position in the digital markets.
We may also use funds to acquire new licenses engaged in complementary or related businesses in the digital world.
We also have liquidity requirements related to the costs and expenses relating to the operation of our business, our payment of dividends, shareholder remuneration and pre-retirement payment commitments and financial and real estate investments. In 2011, with respect to these items, we had the following principal cash expenditures: €6,852 million in connection with the payment of dividends on Telefónica S.A. shares, €3,560 million in connection with financial and net real estate investments, €807 million principally in connection with commitments under pre-retirement plans and €386 million in connection with the acquisition of Telefónica treasury shares.
We also have liquidity requirements related to debt service requirements in connection with our existing and future debt. At December 31, 2011, we had gross financial debt of €66,311 million compared with €61,100 million at December 31, 2010. For the amortization schedule of our consolidated gross financial debt at December 31, 2011 and a further description of financing activity in 2011, see “—Anticipated Sources of Liquidity” below. Our net financial debt increased to €56,304 million at December 31, 2011 compared with €55,593 million at December 31, 2010. For a reconciliation of net financial debt to gross financial debt (the sum of current and non-current interest-bearing liabilities), see “—Presentation of Financial Information—Non-GAAP financial information—Net financial debt and net debt.”
For a discussion of our liquidity risk management policy, see Note 16 to our Consolidated Financial Statements. Anticipated Sources of Liquidity
Cash flows from operations are our primary source of cash funding for existing operations, capital expenditures, interest obligations and principal payments. We also rely on external borrowings, including a variety of short- and medium-term financial instruments, principally bonds and debentures, and borrowings from financial institutions. Cash and cash equivalents are mainly held in euro and euro-denominated instruments. We believe that, in addition to internal generation of funds, our medium-term note program, our euro commercial paper program, our corporate domestic promissory note program and available lines of credit will provide us with substantial flexibility for our future capital requirements as existing debt is retired. As of the date of this Annual Report, our management believes that our working capital is sufficient to meet our present requirements.
The following table shows the amortization schedule of our consolidated gross financial debt at December 31, 2011, as stated in euro using the European Central Bank buying rate for euro on such date. We may have exchange rate financial derivatives as instruments assigned to the underlying debt instruments. In 2011, the average cost of net debt, which we measure as net financial expense divided by our average net debt, was 5.22%, which, adjusting for
• capital expenditures for existing and new operations;
• acquisitions of new licenses or other operators or companies engaged in complementary or related businesses;
• costs and expenses relating to the operation of our business;
• dividend, other shareholder remuneration, and pre-retirement payments; and
• debt service requirements relating to our existing and future debt.
84

exchange rate differences, fell to below 5% (4.91%). The table below includes the fair value of those derivatives classified as financial liabilities (negative mark-to-market) under IFRS (€313 million classified as a current financial liability and €2,136 million as a non-current financial liability). It does not include the fair value of derivatives classified as financial assets (positive mark-to-market) under IFRS (€385 million classified as current financial assets and €4,294 million as non-current financial assets). For a further description of liquidity risk faced by us, see Note 16 to our Consolidated Financial Statements, and for a description of our financial liabilities, see Note 13 to our Consolidated Financial Statements.
During 2011, we obtained financing of approximately €11,500 million (excluding financing under short-term commercial paper programs), mainly in connection with pre-financing the 2011 and part of the
2012 and 2013 debt maturities.
In 2011, as a part of our refinancing plan to enhance our flexibility, primarily, we issued, through Telefónica Emisiones, S.A.U.: (i) six year bonds in an aggregate principal amount of €1,200 million, with an annual interest rate of 4.750% on February 7, 2011, increasing up to an aggregate principal amount of €1,300 million on March 21, 2011, (ii) five year bonds in an aggregate principal amount of $1,250 million, with an annual interest rate of 3.992% on February 16, 2011, (iii) ten year bonds in an aggregate principal amount of $1,500 million, with an annual interest rate of 5.462%, on February 16, 2011, (iv) five year bonds in an aggregate principal amount of €1,000 million, with an annual interest rate of 4.967% on November 3, 2011, and (v) five year bonds in an aggregate principal amount of 7,000 million Japanese yen, with an annual interest rate of 2.8247% on November 4, 2011.
On May 3, 2011, Telefónica arranged long-term financing in an amount of $376 million at fixed rates guaranteed by the export credit agency of Finland (Finnvera). This financing entails four tranches: $94 million maturing on January 30, 2020, $90 million maturing on July 30, 2020, $94 million maturing on January 30, 2021 and $98 million maturing on July 30, 2021.
On May 12, 2011, Telefónica, S.A., signed an amendment to the syndicated loan agreement entered into on July 28, 2010 whereby it was agreed that, with respect to the €5,000 million that would initially mature in July 2013, €2,000 million would be extended for another year, i.e. until July 2014, and another €2,000 million would be extended for a further three years, i.e. until July 2016.
In addition, in 2011, certain of our Latin American companies raised funds in financial markets in an aggregate principal amount equivalent to approximately €2,600 million, primarily: (a) on September 20, 2011, Vivo, S.A. arranged long-term financing with Banco Nacional de Desenvolvimento Econômico e Social (BNDES) in an amount of 3,000 million Brazilian reais (outstanding balance at December 31,2011 was 1,004 million Brazilian reais, equivalent to €414 million); and (b) on November 22, 2011, Telefónica Móviles Chile issued five-year notes in an aggregate principal amount of approximately €165 million, structured into two tranches, the first, in the amount of 66,000 million Chilean pesos (approximately €98 million), with an annual interest rate of 6.30%, and the second, in
AMORTIZATION SCHEDULE FOR THE YEAR ENDED DECEMBER 31, 2012 2013 2014 2015 2016 Subsequent Total Non-convertible euro and foreign currency debentures and bonds 2,824 5,203 4,933 3,860 6,590 15,012 38,422Promissory notes and commercial paper 1,832 — — — — — 1,832Other marketable debt securities — — — — — 1,985 1,985Loans and other payables (principal and interest accrued) 5,683 2,314 2,746 4,384 2,774 3,722 21,623Derivative financial liabilities 313 92 126 289 191 1,438 2,449Total (*) 10,652 7,609 7,805 8,533 9,555 22,157 66,311
(*) Estimated future interest payments as of December 31, 2011 on our interest-bearing-debt (not included above) are as follows: €3,215 million in 2012, €3,083 million in 2013, €2,638 million in 2014, €2,040 million in 2015, €1,740 million in 2016, and €7,545 million in subsequent years. With respect to floating rate debt, we estimate future interest payments as the forward rates derived from yield curves quoted for the different currencies on December 31, 2011.
85

the amount of 2 million development units (Unidades de Fomento) (approximately €66 million), determined by the Central Bank of Chile, with a yield of 3.60%.
During 2011, we have continued to be active under certain commercial paper programs (domestic and European) with an outstanding balance of €1,685 million at December 31, 2011.
At December 31, 2011, we had unused committed credit lines of approximately €10,119 million, all of which bear interest at a floating rate based on market indices, principally the Euro Interbank Offered Rate, or EURIBOR, and the London Interbank Offered Rate, or LIBOR, 24% of which are scheduled to mature prior to December 31, 2012.
In 2012, through the date of this Annual Report, we increased our €1,200 million six-year notes issued on February 7, 2011 by an aggregate of principal amount of €120 million, with an annual interest rate of 4.750%, on February 7, 2012. On February 21, 2012 we issued six-year notes in an aggregate principal amount of €1,500 million, with an annual interest rate of 4.797%. On March 12, 2012 we issued eight-year notes in an aggregate principal amount of £700 million, with an annual interest rate of 5.597%. Telefónica Europe, B.V., entered into a financing agreement on February 15, 2012, with China Development Bank in an aggregate principal amount of $375 million due in 2022. In addition, on March 2, 2012, we refinanced part of our financial liabilities related to the syndicated loan originally dated on October 31, 2005, scheduled to mature on December 14, 2012 and December 13, 2013 as follows: i) a three-year term loan facility in an aggregate amount of £729 million available from December 14, 2012 and maturing on December 14, 2015; ii) a three-year term loan facility in an aggregate amount of £633 million available from December 14, 2012 and maturing on December 14, 2015; iii) a five-year revolving credit facility in an aggregate amount up to €756 million available from March 2, 2012 and maturing on March 2, 2017; and iv) a five-year multicurrency revolving credit facility in an aggregate amount up to £1,469 million available from December 13, 2013 and maturing on March 2, 2017.
Our borrowing requirements are not significantly affected by seasonal trends.
Our ability to use external sources of financing will depend in large part on our credit ratings. We believe that we are well-positioned to raise capital in financial markets. However, negative conditions in the financial markets or a downgrade of any of the ratings of our debt by any of Fitch, Moody’s, JCR and/or Standard & Poor’s may increase the cost of our future borrowings or may make it more difficult to access the public debt markets. In connection with the credit rating agencies’ review of our debt ratings, the rating agencies may give considerable weight to general macroeconomic and political conditions, the performance of our businesses in countries where we operate, our financial and shareholder remuneration policy, our acquisition policy, our ability to integrate acquisitions and our ability to refinance debt.
For a discussion of our liquidity and country risk management policy, see Note 16 to our Consolidated Financial Statements. Intragroup Loans
We lend funds to our operating subsidiaries, directly or through holding companies that head our different lines of business. At December 31, 2011, we had loans outstanding totaling €4,343 million (€5,424 million at December 31, 2010) to companies in the Telefónica Group (including subsidiaries located in Latin American countries). These funds are derived from retained cash flows, loans, bonds and other sources (such as asset disposals). C. Research and Development, Patents and Licenses, etc.
Telefónica remains firmly committed to technological innovation as an essential tool for achieving competitive advantages, anticipating market trends and differentiating its products. By introducing new technologies and developing new products and business processes, we seek to become a more effective, efficient and customer-oriented Group.
86

Telefónica has developed an open innovation model for the management of technological innovation to boost the application of technical research in the development of new commercial products and services.Telefónica focuses on certain applied research and development (R&D) priorities that are aligned with its strategy. Open innovation initiatives driving this model include the creation of a venture capital fund andinvolvement in business collaboration forums, among others. The model also uses the knowledge developed at technology centers, universities and start-ups, among other sources, and encourages innovation inconjunction with other agents (e.g. customers, universities, public administrations, suppliers, content providers and other companies), making them “technological partners.” Telefónica believes it cannot rely solely on acquired technology to differentiate its products from those of its competitors and to improve its market positioning. It is also important to encourage R&D initiatives in an effort to achieve thisdifferentiation and make inroads into other innovation activities. The Group's R&D policy is geared towards:
In 2011, the technological innovation projects undertaken focused on sustainable innovation, process efficiency, creation of new revenues streams, customer satisfaction, consolidation of operations in new
markets and technological leadership.
Technical innovation activities are a key part of Telefónica strategy of creating value through broadband communications and services, the IP network, mobile networks and new generation networks (fiber optic).
In 2011, projects were undertaken to promote greater access to information technology, new services focused on new Internet business models, advanced user interfaces, mobile television and other broadband services. These initiatives, among others, were undertaken based on our objective of rapidly identifying emerging technologies that could have a relevant impact on our businesses and pilot testing these technologies in new services, applications and platform prototypes.
Most of our R&D activities are carried out by Telefónica Investigación y Desarrollo, S.A.U. (Telefónica I+D), a wholly owned subsidiary, which focuses on providing solutions to our various lines of business. In its operations, Telefónica I+D receives the assistance of other companies and universities. Telefónica I+D’s mission is centered on enhancing the Company’s competitive positioning by leveraging technological innovation and product development. Telefónica I+D undertakes experimental and applied research and new product development with the overriding goal of broadening the range of services offered and reducing operating costs. It also provides technical assistance to the Group’s operations in Latin America and Europe. Telefónica I+D's technological innovation activities focus on the following areas:
• developing new products and services in order to gain market share;
• boosting customer loyalty;
• driving revenue growth;
• enhancing innovation management;
• improving business practices;
• increasing the quality of infrastructure services to improve customer service and reduce costs;
• promoting global products;
• supporting open innovation; and
• creating value from the technology generated.
• Natural P2P communication of the future, using the Internet, Web 2.0 and smartphones;
• Video and multimedia services (combining text, audio, images and video) offering an enhanced user experience on all connected devices;
• Advanced solutions in emerging ITC business such as e-health, and remote patient support or monitoring; and
• M2M (machine-to-machine) service management associated with energy efficiency and mobility.
87

At December 31, 2011, Telefónica I+D had 653 employees and collaborated with skilled professionals from over 80 companies and more than 50 universities.
Research and development costs at Telefónica amounted €983 million, €797 million and €693 million in 2011,2010 and 2009, respectively, representing 1.6%, 1.3% and 1.2% of consolidated revenues,
respectively. These figures were calculated using guidelines of the Organisation for Economic Co-operation and Development (OECD). Using these and other guidelines, there are R&D costs that, due to the length of projects and/or accounting classifications, are not included in their entirety in the consolidated statement of financial position.
Telefónica registered 95 patents in 2011, of which 57 were registered with the Spanish patent office and 38 with patent offices in the European Union, the United States and with other international patent offices. D. Trend Information
We are an integrated diversified telecommunications group that offers a wide range of services, mainly in Spain, Europe, and Latin America. Our activity is based upon providing fixed and mobile services, Internet and data, pay TV and value added services, among others. Our operations in 25 countries, managed through a regional organization geared towards certain businesses units, enable us to leverage our strong local positioning, as well as the advantages afforded by our scale, two features that have been reinforced by the opportunities arising from our holdings in and strategic alliances with China Unicom and Telecom Italia.
As a multinational telecommunications company that operates in regulated markets, we are subject to different laws and regulations in each of the jurisdictions in which we provide services. We expect the regulatory landscape to continue to change in Europe as a consequence of the revised regulations resulting from the implementation of the review of the common regulatory framework currently in place in the European Union. In addition, we may also face pressure from regulatory initiatives in some countries regarding tariffs, the reform of rights of spectrum use and allocation, issues related to the quality of service, and the regulatory treatment of new broadband infrastructure deployments.
We face intense competition in most of our markets, and we are therefore subject to the effects of actions taken by our competitors. The intensity of the competition may deepen, which could have an impact on tariff structures, consumption, market share and commercial activity and negatively affect our number of customers, revenues and profitability.
However, we believe we are in a strong competitive position in most of the markets where we operate, enabling us to continue taking advantage of the growth opportunities that arise in these markets, such as by boosting both fixed and mobile broadband services and by furthering the development of services beyond connectivity, information technology services and related businesses. In this respect, we seek to lead the industry by anticipating trends in the new digital environment.
Consequently, we embarked on a restructuring in September 2011 with the aim of reinforcing our growth, actively participating in the digital world and capturing opportunities afforded by our scale and industrial alliances. This new organization gave rise to two cross-cutting areas, Telefónica Digital and Telefónica Global Resources, in addition to the Telefónica Europe and Telefónica Latin America segments. We expect this structure to bolster Telefónica’s place in the digital world, enabling it to tap growth opportunities arising in this environment, drive innovation, strengthen the product and services portfolio and maximize advantages afforded by its global customer
• Cloud computing, which makes intensive use of resources available on the Web to develop, publish, commercialize and distribute applications.
• Making use of user communication profiles to uncover opportunities to develop different products and business models (marketing campaigns, target marketing, contextual services, churn reduction,cross-selling, etc.)
• Network and architecture services in a new global infrastructure shared by all business lines to reduce operating and maintenance costs, on which the Group can roll out new services and provide greatercapacity amid increasing demand for mobile data, video content and the shift from people-based Internet to an object-based Internet.
88

bases in an increasingly connected world. In addition, we expect that the creation of a Global Resources operating unit will ensure the profitability and sustainability of the business by leveraging economies of scale and driving Telefónica’s transformation into a fully global company. Telefónica Europe’s and Telefónica Latin America’s objective is to reinforce the results of the business and generate sustainable growth, backed by the Global Corporation.
In Spain, following the commercial re-positioning carried out at the end of 2011, Telefónica expects to continue to intensify its commercial commitment to offering quality services, increasing the effectiveness of its sales channels and further improving the quality and features of its networks to increase customer satisfaction through targeted commercial offerings that are aimed toward ensuring the best response to their communications’ needs. In this respect, we expect to continue to boost innovation to offer the best products and services, drive the mobile and fixed broadband growth and bundling services to provide the best integrated communications solutions in the market. Efficiency will continue to play a very important role in all areas of management, both in commercial and operational areas, including systems, networks and processes. We will focus on our customers and their satisfaction, and we expect to see savings derived from the 2011 restructuring plan, while continuing to remain committed to ensuring Telefónica Spain remains a desirable place to work.
In Latin America, our strategy is based on a regional model that captures growth and efficiency of scale without losing sight of the local management of the client. The mobile business will continue to play a fundamental role as an engine of regional growth. That is why we will continue to work to improve the capacity and coverage of our networks, adapting our distribution channel to enhance the quality of our offerings both in voice and data in order to keep and attract high-value customers. Regarding the fixed telephony business, we will encourage the increase of broadband speed and expand the supply of bundled services. Meanwhile, we expect to further advance efficiency, in operational and commercial terms, and attempt to achieve further synergies by implementing global, regional and local projects.
In Europe, customers will remain at the center of our strategy and management priorities in the region in order to guarantee a high level of customer satisfaction with our services. With the objective of offering our customers the best value, we expect to boost mobile broadband services, adding new products and services to our current portfolio. In such a competitive market, we will dedicate our efforts to reinforcing our market position. Another objective in coming years is to improve operating efficiency, pursuant to which we will roll out several local and regional initiatives, with the support of Telefónica Global Resources.
In summary, in the context of intense competition and regulatory pressure on pricing, Telefónica aims to continue strengthening its business model to make it more efficient and capture the synergies arising from the integrated approach of businesses, processes and technologies, while focusing even more on the client.
This section contains forward-looking statements. For additional information concerning forward-looking statements and the risks that could affect the matters referred to in such forward-looking statements, see “Cautionary Statement Regarding Forward-Looking Statements” above. E. Off-Balance Sheet Arrangements
We have commitments that could require us to make material payments in the future. These commitments are not included in our consolidated statement of financial position at December 31, 2011 although they are described in the notes to our Consolidated Financial Statements. For additional detail regarding our off-balance sheet commitments, see Note 21(b) and Note 16 to our Consolidated Financial Statements. F. Tabular Disclosure of Contractual Obligations
The following table describes our contractual obligations and commitments with definitive payment terms which may require significant cash outlays in the future. The amounts payable (including accrued interest payments) are as of December 31, 2011. For additional information, see our Consolidated Financial Statements.
89

In addition, at December 31, 2011, we had short and long term employee benefits provisions amounting to €807 million and €4,999 million, respectively.
For details of the composition of, and changes in, our debt, see “—Liquidity and Capital Resources—Anticipated Sources of Liquidity” and Note 13 to our Consolidated Financial Statements.
Item 6. Directors, Senior Management and Employees A. Directors and Senior Management
During 2011, our Board of Directors met 14 times. At March 29, 2012 our Board of Directors had met three times during 2012. At March 29, 2012, our directors, their respective positions on our Board and the year they were appointed to such positions were as follows:
Payments Due by Period Total Less than 1 year 1-3 years 3-5 years More than 5 Years (in millions of euro) Financial liabilities (1)(2) 66,311 10,652 15,414 18,088 22,157Operating lease obligations (3) 9,613 1,543 2,591 2,114 3,365Purchase and other contractual obligations(4) 2,568 1,473 737 345 13Other liabilities (5) 2,869 696 2,173 — —Total 81,361 14,364 20,915 20,547 25,535
(1) Capital (finance) lease obligations are not calculated separately and are instead included as part of our long-term debt obligations.
(2) This item includes the fair value of those derivatives classified as current financial liabilities (negative mark-to-market) under IFRS (€313 million). Future interest payments as of December 31, 2011 on our interest-bearing-debt (not included above) are as follows: €3,215 million in 2012, €3,083 million in 2013, €2,638 million in 2014, €2,040 million in 2015, €1,740 million in 2016 and €7,545 million in subsequent years. With respect to floating rate debt, we estimate future interest payments as the forward rates derived from yield curves quoted for the different currencies on December 31, 2011. It does not include the fair value of derivatives classified as financial assets (positive mark-to-market) under IFRS (€385 million classified as current financial assets and €4,294 million as non-current financial assets). For a more detailed description of our financial derivative transactions, see “Item 11. Quantitative and Qualitative Disclosures About Market Risk” and Note 16 to our Consolidated Financial Statements. For details of the composition of this item, see “Liquidity and Capital Resources– Anticipated sources of Liquidity”).
(3) Our operating lease obligations have in some cases extension options conditioned on the applicable law of each country. Accordingly, we have included only those amounts that represent the initial contract period.
(4) This item includes definitive payments due for agreements to purchase goods (such as network equipment) and services.
(5) “Other liabilities” include: (a) long-term obligations that require us to make cash payments, excluding financial debt obligations included in the table under “Financial Liabilities” above and (b) other provisions. Because of the nature of the risks covered by “Other liabilities” such as other provisions, it is not possible to determine a reliable schedule of potential payments, if any. For details of the composition of other provisions, see Note 15 to our Consolidated Financial Statements.
Name Age First Appointed Current Term Ends
Chairman Mr. César Alierta Izuel(1) 66 1997 2012Vice-chairmen Mr. Isidro Fainé Casas(1)(2) 69 1994 2016Mr. José María Abril Pérez (1)(3)(5)(8) 60 2007 2013Members (vocales) Mr. Julio Linares López(1)(8) 66 2005 2016Mr. Ignacio Moreno Martínez (3) 54 2011 2012Mr. José Fernando de Almansa Moreno-Barreda(5)(6)(9) 63 2003 2013Mr. Jose María Álvarez –Pallete López 48 2006 2012Mr. David Arculus (5)(6) 65 2006 2016Ms. Eva Castillo Sanz (6)(9)(11) 49 2008 2013Mr. Carlos Colomer Casellas(1)(8)(10)(11) 67 2001 2016Mr. Peter Erskine(1)(8)(9)(10) 60 2006 2016Mr. Alfonso Ferrari Herrero (1)(4)(5)(6)(7)(9)(10)(11) 70 2001 2016
90

Board Committees
At March 29, 2012, the committees of our Board of Directors and members thereof are as follows:
Executive Commission
Our Board of Directors has expressly delegated all of its authority and power to the Executive Commission except as prohibited by Spanish corporate law, under our Articles of Association, or under our Board Regulations. This commission is made up of fewer directors and meets more frequently than our Board of Directors. The members of the Executive Commission are Mr. César Alierta Izuel, Mr. Isidro Fainé Casas, Mr. José María Abril Pérez, Mr. Julio Linares López, Mr. Carlos Colomer Casellas, Mr. Peter Erskine, Mr. Alfonso Ferrari Herrero, Mr. Gonzalo Hinojosa Fernández de Angulo, Mr. Francisco Javier de Paz Mancho and Mr. Ramiro Sánchez de Lerín García-Ovies, as secretary.
Audit and Control Committee
The Audit and Control Committee functions are regulated by our bylaws and our Board Regulations. The Audit and Control Committee has the primary objective of providing support to our Board of Directors in its supervisory and oversight functions, specifically having the following responsibilities:
Mr. Luiz Fernando Furlán(5) 65 2008 2013Mr. Gonzalo Hinojosa Fernández de Angulo (1)(4)(5)(7)(9)(10)(11) 66 2002 2012Mr. Pablo Isla Álvarez de Tejera(6)(7)(10)(11) 48 2002 2012Mr. Antonio Massanell Lavilla(2)(4)(7)(8)(11) 57 1995 2016Mr. Francisco Javier de Paz Mancho (1)(5)(6)(7) 53 2007 2013Mr. Chang Xiaobing (12) 54 2011 2016
(1) Member of the Executive Commission of the Board of Directors.
(2) Nominated by Caja de Ahorros y Pensiones de Barcelona (“La Caixa”).
(3) Nominated by Banco Bilbao Vizcaya Argentaria, S.A. (“BBVA”).
(4) Member of the Audit and Control Committee of the Board of Directors.
(5) Member of the International Affairs Committee.
(6) Member of the Regulation Committee.
(7) Member of the Human Resources and Corporate Reputation and Responsibility Committee.
(8) Member of the Innovation Committee.
(9) Member of the Strategy Committee.
(10) Member of the Nominating, Compensation and Corporate Governance Committee.
(11) Member of the Service Quality and Customer Service Committee.
(12) Nominated by China Unicom (Hong Kong) Limited
• to report, through its chairman, to our shareholders at the general shareholders’ meeting regarding matters raised therein by the shareholders relating to the functions and matters of competence of the committee;
• to propose to our Board of Directors to submit to our general meeting of shareholders the appointment of our auditors referred to in Article 264 of the Spanish Corporation Law, as well as, when appropriate, the terms of their engagement, the scope of their professional assignment and the revocation, re-appointment or non-renewal of their appointment;
• to supervise the effectiveness of the Company's internal control system, the internal audit and the risk management systems as well as to discuss with our auditors any significant weaknesses in the internal control system detected during the audit;
• to supervise the preparation and submission of regulated financial information;
91

The Audit and Control Committee meets at least once per quarter and as many times as considered necessary. During 2011, the Audit and Control Committee met 11 times and, as of the date of this Annual
Report, had met three times in 2012. The members of the Audit and Control Committee are Mr. Gonzalo Hinojosa Fernández de Angulo (chairman), Mr. Antonio Massanell Lavilla and Mr. Alfonso Ferrari Herrero.
Nominating, Compensation and Corporate Governance Committee
The Nominating, Compensation and Corporate Governance Committee is responsible for, among other things, reporting to our Board of Directors with respect to proposals for the appointment, re-election and removal of directors, members of the Executive Committee and the other committees of our Board of Directors and top members of our management and management of our subsidiaries. In addition, the Nominating, Compensation and Corporate Governance Committee is responsible for proposing to the Board of Directors, within the framework established in the bylaws, the compensation for the directors and reviewing it periodically to ensure that it is in keeping with the tasks performed by them, as provided in Article 35 of the Board Regulations, to propose to the Board of Directors, within the framework established in the bylaws, the extent and amount of the compensation, rights and remuneration of a financial nature, of the Chairman, the executive directors and the senior executive officers of Telefónica, including the basic terms of their contracts, for purposes of contractual implementation thereof and to supervise compliance with Telefónica’s internal rules of conduct and the corporate governance rules thereof in effect from time to time.
The members of the Nominating, Compensation and Corporate Governance Committee are Mr. Alfonso Ferrari Herrero (chairman), Mr. Carlos Colomer Casellas, Mr. Peter Erskine, Mr. Gonzalo Hinojosa Fernández de Angulo and Mr. Pablo Isla Álvarez de Tejera. During 2011, the Nominating, Compensation and Corporate Governance Committee met eight times, and as of the date of this Annual Report, had met three times in 2012.
Human Resources and Corporate Reputation and Responsibility Committee
The Human Resources and Corporate Reputation and Responsibility Committee is responsible for reviewing our personnel policy and making proposals to our Board of Directors regarding our personnel policy, corporate reputation, responsibility and the promotion of our values within the Telefónica Group. The Human Resources and Corporate Reputation and Responsibility Committee met four times during 2011 and as of the date of this Annual Report had met once in 2012. The members of the Human Resources and Corporate Reputation and Responsibility Committee are Mr. Francisco Javier de Paz Mancho (chairman), Mr. Alfonso Ferrari Herrero, Mr. Gonzalo Hinojosa Fernández de Angulo, Mr. Pablo Isla Álvarez de Tejera and Mr. Antonio Massanell Lavilla.
Regulation Committee
The Regulation Committee’s main objective is to monitor the main regulatory matters which affect us. Another responsibility of the Regulation Committee is to act as a communication and information channel between our management team and our Board of Directors concerning regulatory matters. The members of the Regulation Committee are Mr. Pablo Isla Álvarez de Tejera (chairman), Mr. José Fernando de Almansa Moreno-Barreda, Mr. David Arculus, Ms. Eva Castillo Sanz, Mr. Alfonso Ferrari Herrero, and Mr. Francisco Javier de Paz Mancho.
• to establish and maintain the necessary relations with the auditors to receive, for review by the Committee, information on all matters that may put their independence at risk, and any other matters related to the process of auditing our accounts, as well as to receive information and maintain communication with our auditors as required by laws relating to the audit process and with respect to technical regulations on auditing. In any event, the Audit and Control Committee must receive annually written confirmation from our auditors of their independence vis-à-vis the entity or entities directly or indirectly related thereto, as well as information regarding additional services of any kind provided to such entities by our auditors, or by the persons or entities related thereto, pursuant to Law 19/1988, of July 12, on Auditing of Financial Statements; and
• to issue on an annual basis, prior to the issuance of the audit report, a report stating an opinion regarding the independence of our auditors. This report must in all cases include an opinion on the provision of the additional services referred to in the immediately preceding paragraph.
92

During 2011, the Regulation Committee met six times, and as of the date of this Annual Report, had met once in 2012.
Service Quality and Customer Service Committee
The Service Quality and Customer Service Committee is responsible for monitoring and reviewing the standards of quality of the main services we provide. The Service Quality and Customer Service Committee acts as an information channel between our senior management team and our Board of Directors. The members of the Service Quality and Customer Service Committee are Mr. Antonio Massanell Lavilla (chairman), Ms. Eva Castillo Sanz, Mr. Carlos Colomer Casellas, Mr. Alfonso Ferrari Herrero, Mr. Gonzalo Hinojosa Fernández de Angulo, and Mr. Pablo Isla Álvarez de Tejera. During 2011 the Service Quality and Customer Service Committee met four times, and as of the date of this Annual Report, had met once in 2012.
International Affairs Committee
The International Affairs Committee is responsible for analyzing international events and matters that affect the Telefónica Group and reporting these events and possible consequences to our Board of Directors. The International Affairs Committee pays close attention to events taking place in countries where we have operations and which may affect our competitive position, corporate image and financial results. The International Affairs Committee also oversees our non-profit foundations in such countries. The members of the International Affairs Committee are Mr. José Fernando de Almansa Moreno-Barreda (chairman), Mr. José María Abril Pérez, Mr. David Arculus, Mr. Alfonso Ferrari Herrero, Mr. Luiz Fernando Furlán, Mr. Gonzalo Hinojosa Fernández de Ángulo and Mr. Francisco Javier de Paz Mancho. During 2011, the International Affairs Committee met four times, and as of the date of this Annual Report had met once in 2012.
Innovation Committee
The Innovation Committee is responsible for advising and assisting in all matters regarding innovation. Its main object is to examine, analyze and periodically monitor the Group’s innovation projects, provide guidance and help ensure the implementation and development of innovation initiatives across the Group. The members of the Innovation Committee are Mr. Carlos Colomer Casellas (chairman), Mr. José María Abril Pérez, Mr. Antonio Massanell Lavilla, Mr. Peter Erskine and Mr. Julio Linares López. During 2011, the Innovation Committee met 11 times, and as of the date of this Annual Report, had met twice in 2012.
Strategy Committee
Without prejudice to any other tasks that the Board of Directors may assign thereto, the primary duty of the Strategy Committee is to support the Board of Directors in the analysis and implementation of the global strategy policy of the Telefónica Group. The members of the Strategy Committee are Mr. Peter Erskine (chairman), Mr. José Fernando de Almansa Moreno-Barreda, Ms. Eva Castillo Sanz, Mr. Alfonso Ferrari Herrero and Mr. Gonzalo Hinojosa Fernández de Angulo. The Strategy Committee met ten times during 2011, and as of the date of this Annual Report, had met twice in 2012. Biographies of Directors
Mr. César Alierta Izuel serves as our Executive Chairman and Chairman of our Board of Directors. Mr. Alierta began his career in 1970 as general manager of the capital markets division at Banco Urquijo, S.A. in Madrid, where he worked until 1985. Subsequently, he founded and served as chairman of Beta Capital Sociedad de Valores, S.A. which he combined as from 1991 with his post as chairman of the Spanish Financial Analysts’ Association (Instituto Español de Analistas Financieros). Between 1996 and 2000, he was director and chairman of Tabacalera, S.A. At that time Tabacalera, S.A. changed its name into Altadis, S.A. (following its merger with the French Group, Seita-Société Nationale D’Éxplotation Industrielle des Tabacs et Allumettes) and he became director and chairman of Altadis, S.A. He has also been a member of the board of directors of the Madrid Stock Exchange (Bolsa de Madrid), Plus Ultra Compañía de Seguros y Reaseguros, S.A. and of Iberia, S.A. On January 1997, Mr. Alierta was appointed as a director of Telefónica and on July 26, 2000, he was appointed as our Executive Chairman. Mr. Alierta is director of Telecom Italia since November 8, 2007 and of China Unicom (Hong Kong) Limited since October 15, 2008, and
93

of International Consolidated Airlines Group (IAG) since September 2010. Mr. Alierta holds a law degree from the University of Zaragoza and an MBA from Columbia University (New York) and is currently a member of the Columbia Business School Board of Overseers, and Chairman of the Social Board of the UNED (National Long Distance Spanish University).
Mr. Isidro Fainé Casas serves as Vice-Chairman of our Board of Directors. For over 40 years, Mr. Fainé has worked in several financial institutions, including amongst others: Banco Atlántico, S.A., (1964), Banco de Asunción (Paraguay) (1969), Banco Riva y García, S.A. (1973), Banca Jover, S.A. (1974), and Banco Unión, S.A. (1978). Mr. Fainé is currently chairman of Caja de Ahorros y Pensiones de Barcelona (“la Caixa”) of Caixa Bank, S.A., of Criteria Caixaholding, S.A., and of Confederación Española de Cajas de Ahorros; vice-chairman of Abertis Infraestructuras, S.A. and of Sociedad General de Aguas de Barcelona, S.A. (AGBAR); and second vice-chairman of Repsol YPF, S.A. He is also a member of the board of directors of Banco Portugués de Investimento, S.A. (BPI), and a non-executive director of Bank of East Asia. Mr. Fainé holds a doctorate degree in economics, a diploma in Alta Dirección (Senior Management) from IESE Business School (Instituto de Estudios Superiores de la Empresa) and an ISMP in business administration from Harvard University. He is a member of the Royal Academy of Economics and Finance (Real Academia de Ciencias Económicas y Financieras).
Mr. José María Abril Pérez serves as Vice-Chairman of our Board of Directors. From 1975 to 1982 he served as financial manager of Sociedad Anónima de Alimentación (SAAL). Since then, and until he joined the Banco Bilbao Vizcaya Argentaria Group (BBVA), he was financial manager of Sancel-Scott Ibérica, S.A. In 1985 he joined Banco Bilbao, S.A. as managing director of Investment Corporate Banking. From January to April 1993, he was appointed executive coordinator of Banco Español de Crédito, S.A. In 1998, he became general manager of the Industrial Group of BBVA. In 1999, he was appointed member of the executive committee of the BBVA Group. He has also been a member of the board of directors of Repsol, S.A., Iberia, S.A. and Corporación IBV. In 2002 he became managing director of the Wholesale and Investment Banking Division and a member of the executive committee of BBVA, and he is now in early retirement. Until July 2007, he was vice president of Bolsas y Mercados Españoles, S.A. He is currently a member of the board of directors of Advancell, S.A. He holds a degree in economics from the University of Deusto (Bilbao, Spain) and he has been professor at such university for nine years.
Mr. Julio Linares López serves as a director of our Board of Directors and as our Chief Operating Officer since December 19, 2007. In May 1970, he joined our Research and Development Center, where he held several positions until he was appointed head of our Technology Department in 1984. In April 1990, he was appointed General Manager of Telefónica Investigación y Desarrollo, S.A. In December 1994, he became deputy general manager of the Marketing and Services Development department in the commercial area and subsequently, deputy general manager for Corporate Marketing. In July 1997, he was appointed chief executive officer of Telefónica Multimedia S.A. and chairman of Telefónica Cable and Producciones Multitemáticas, S.A. In May 1998 he was appointed General Manager of Strategy and Technology in Telefónica, S.A. In January 2000, he was appointed executive chairman of Telefónica de España, S.A., a position which he held until December 2005, when he was appointed our managing director for Coordination, Business Development and Synergies. He is currently member of the board of directors and of the executive committee of Telecom Italia and member of the Social Council of the Complutense University of Madrid. Mr. Linares holds a degree in telecommunications engineering from the Polytechnic University of Madrid (Universidad Politécnica de Madrid).
Mr. José Fernando de Almansa Moreno-Barreda serves as a director of our Board of Directors. In December 1974 he joined the Spanish Diplomatic Corps (Cuerpo Diplomático) and served from 1976 to 1992 as Secretary of the Spanish Embassy in Brussels, Cultural Counselor of the Spanish Delegation to Mexico, Chief Director for Eastern European Affairs, Director of Atlantic Affairs in the Spanish Foreign Affairs Ministry, Counselor to the Spanish Permanent Representation to NATO in Brussels, Minister-Counselor of the Spanish Embassy in the Soviet Union, General Secretary of the National Commission for the 5th Centennial of the Discovery of the Americas and Deputy General Director for Eastern Europe Affairs in the Spanish Foreign Affairs Ministry. From 1993 to 2002, Mr. Fernando de Almansa was appointed Chief of the Royal Household by His Majesty King Juan Carlos I, and is currently personal advisor to His Majesty the King. He is also a substitute director of Grupo Financiero BBVA Bancomer , S.A. de C.V. and of BBVA Bacomer, S.A.. He holds a law degree from the University of Deusto (Bilbao, Spain).
94

Mr. José María Álvarez-Pallete López serves as a director of our Board of Directors and, since September 11, 2011, as Chairman of Telefónica Europe. He began his career at Arthur Young Auditors in 1987. In 1988, he joined Benito & Monjardín/Kidder, Peabody & Co., where he held various positions in the research and corporate finance departments. In 1995, he joined Valenciana de Cementos Portland, S.A. (Cemex) as head of the Investor Relations and Studies department. In 1996 he was promoted to chief financial officer of Cemex Group in Spain, and in 1998, to chief administration and financial officer of Cemex in Indonesia, headquartered in Jakarta, and he was appointed member of the Board of Cemex Asia, Ltd. In February 1999 he joined the Telefónica Group as general manager of Finance for Telefónica International, S.A. In September of the same year he was promoted to chief financial officer of Telefónica. In July 2002, he was appointed chairman and chief executive officer of Telefónica Internacional, S.A., in July 2006 general manager of Telefónica Latinoamérica, and in March 2009, Chairman of Telefónica Latinoamérica. Mr. Álvarez-Pallete holds a degree in economics from the Complutense University of Madrid. He also studied economics at the Université Libre de Belgique and holds an International Management Program from the Pan-American Institute of Executive Business Administration (IPADE) and an advance research degree (DEA) from the department of finance and accounting of the Complutense University of Madrid.
Sir David Arculus serves as a director of our Board of Directors. From 1998 to 2004, he was chairman of Severn Trent Plc. and from 1998 to 2001 he was chairman of IPC Group Ltd. From 2004 to January 2006, he served as chairman of O2, Plc. (now Telefónica Europe, Plc.). Sir David Arculus is currently a member of the board of directors of Pearson, Plc. He is also chairman of Numis, Plc. and of Aldermore Bank, Plc. In 1972 he received an MBA from the London Business School. In 1968, he received his master’s degree in engineering and economics from Oriel College, Oxford, and in 2003 he received a degree Honoris Causa from the University of Central England.
Ms. Eva Castillo Sanz serves as a director of our Board of Directors. Ms. Castillo began her career at the Spanish broker Beta Capital Sociedad de Valores, S.A., where she worked for five years. After that, she worked for another five years for Goldman Sachs International in London in the International Equities department. In 1997 Ms. Castillo joined Merrill Lynch as head of Equity Markets for Spain and Portugal. In 1999, she was promoted to Country Manager for Spain and Portugal and in 2000 she became chief executive officer of Merrill Lynch Capital Markets Spain. After that, Ms. Castillo was appointed chief operating officer for EMEA Equity Markets. In October 2003 she was appointed head of Global Markets & Investment Banking in Spain and Portugal, as well as president of Merrill Lynch Spain. Until December 2009, she headed Global Wealth Management business operations in Europe, the Middle East and Africa, including Merrill Lynch Bank (Suisse) and the International Trust and Wealth Structuring business. She was a member of the Merrill Lynch EMEA Executive Committee, the Global Wealth Management Executive and Operating Committees. Ms. Castillo is currently director of Old Mutual, plc. Ms. Castillo holds degrees in business, economics and law (ICADE – E3) from the Universidad Pontificia de Comillas of Madrid.
Mr. Carlos Colomer Casellas serves as a director of our Board of Directors. Mr. Colomer began his career in 1970 as marketing vice-chairman of Henry Colomer, S.A. In 1980, he was appointed chairman and general manager of Henry Colomer, S.A. and Haugron Cientifical, S.A. In 1986, he was also appointed president of Revlon for Europe. In 1989, he became chairman of Revlon International and in 1990, he was appointed executive vice-president and chief operating officer of Revlon Inc. in New York. In 2000, he was appointed chairman and chief executive officer of The Colomer Group. He is also chairman of Ahorro Bursátil, S.A. SICAV and Inversiones Mobiliarias Urquiola, S.A. SICAV. Mr. Colomer has a degree in economics from the University of Barcelona and an MBA from IESE Business School (Instituto de Estudios Superiores de la Empresa).
Mr. Peter Erskine serves as a director of our Board of Directors. He began his career in the field of marketing and trade mark management in Polycell and in Colgate Palmolive. He worked for several years at the Mars Group, serving as vice-chairman for Europe of Mars Electronics. In 1990 he was appointed vice-president of Marketing and Sales of Unitel. From 1993 to 1998, he held a number of senior positions, including director of British Telecom (BT) Mobile and president and chief executive officer of Concert. In 1998 he became managing director of BT Cellnet. Subsequently, in 2001 he became chief executive officer and a director of the board of directors of Telefónica Europe, Plc. In 2006 he became executive chairman of Telefónica Europe, Plc (until December 31, 2007 after which he became a non-executive Director) and from July 2006 until December 2007 he served as general manager of the business unit Telefónica Europe. In 2008, he joined the Telecom Advisory Boards of Apax Partners and MacQuarie European Infrastructure Fund, and become a member of the Strategy Advisory Committee of Henley Management Centre. In January 2009 he joined the Board of Ladbrokes Plc.
95

as a non executive director, becoming chairman in May 2009. Currently, he is also member of the advisory board of Henley Management Centre. In 1973, he received a degree in psychology from Liverpool University.
Mr. Alfonso Ferrari Herrero serves as a director of our Board of Directors. From 1968 to 1969 he was assistant to the financial manager of Hidroeléctrica del Cantábrico, S.A. From 1969 to 1985, he worked in Banco Urquijo, S.A. holding several positions as analyst, manager of Industrial Investments and as a representative in several subsidiaries of Banco Urquijo, S.A. in his capacity as member of the board of directors. From 1985 to 1996 he was a member of the board of directors and manager of Corporate Finance of Beta Capital Sociedad de Valores, S.A., of which Mr. Ferrari was a co-founder. From 1996 until 2000 served as chairman and chief operating officer of Beta Capital, S.A. He has a doctorate in industrial engineering from the Industrial Engineers Technical School of the Polytechnic University of Madrid (Escuela Técnica Superior de Ingenieros Industriales de la Universidad Politécnica de Madrid) and holds an MBA from Harvard University.
Mr. Luiz Fernando Furlán serves as a director of our Board of Directors. Throughout his career he has been a member of the board of directors of several companies in Brazil and abroad such as Sadia, S.A., Embraco, S.A. (Brasmotor Group-Brazil) and Panamco (Pan American Beverages, Inc. – USA). He was also member of the consulting board of IBM in Latin America and of ABN Amro Bank in Brazil, as well as chairman of Brazilian Chicken Exporters Association (ABEF), Brazilian Association of Public Owned Companies (ABRASCA) and of Mercosur European Union Business Forum (MEBF). He also was vice-president of São Paulo Entrepreneurs Association (FIESP). From 2003 to 2007 he was Minister of Development, Industry and Foreign Trade of Brazil. Currently he is chairman of the board of directors of BRF-Brasil Foods, S.A. and of Amazonas Sustainability Foundation and member of the board of directors of Amil Participações S.A. and of AGCO Corporation, and member of the Advisory/Consultive Board of Panasonic (Japan), McLarty & Associates (USA) and Wal-Mart Stores Inc. (USA). He holds a degree in chemical engineering from the Industrial Engineering Faculty of São Paulo and in business administration from University of Santana (São Paulo), with specialization in financial administration from Fundação Getúlio Vargas (São Paulo).
Mr. Gonzalo Hinojosa Fernández de Angulo serves as a director of our Board of Directors. He began his career in 1966 in Cortefiel, S.A. and served in several management positions since then. From 1976 to 1985 Mr. Hinojosa was general manager of Cortefiel, S.A. and from 1985 until 2005 he served as chief executive officer of Cortefiel Group, a post which he combined with his appointment as chairman from 1998 until 2006. From 1991 through 2002, he served as a director of Banco Central Hispano Americano, S.A. and as a director of Portland Valderribas, S.A. He has also served as a director of Altadis, S.A. (1998-2007) and of Dinamia Capital Privado, S.A., SCR. Mr. Hinojosa has a degree in industrial engineering from the Industrial Engineers Technical School of the Polytechnic University of Madrid (Escuela Técnica Superior de Ingenieros Industriales de la Universidad Politécnica de Madrid).
Mr. Pablo Isla Álvarez de Tejera serves as a director of our Board of Directors. Mr. Isla began his career in 1989 as Government Attorney (Abogado del Estado), and he joined the Body of Government Attorneys that year, in the first position of the candidates, for the Spanish Ministry of Transportation, Tourism and Communications. In 1991 he moved to the General Management of the Legal Services of the Spanish Government (Dirección General del Servicio Jurídico del Estado). From 1992 to 1996, Mr. Isla served as general manager of the Legal Services Department of Banco Popular, S.A. In 1996, he was appointed general manager of the National Heritage Department of the Treasury Department of Spain (Ministerio de Economía y Hacienda). He also served as General Secretary of Banco Popular Español, S.A. from 1998 to 2000. In July 2000, Mr. Isla was appointed chairman of the board of Grupo Altadis and co-chairman of the company. In June 2005, Mr. Isla was appointed the deputy chairman and chief executive officer of Inditex, S.A.. Since 2011, Mr. Isla has been the Chaiman of Inditex, S.A. Mr. Isla has a degree in law from the Complutense University of Madrid.
Mr. Antonio Massanell Lavilla serves as a director of our Board of Directors. In 1971 he joined the Caja de Ahorros y Pensiones de Barcelona (“la Caixa”), where he held several posts and in 1990, he was appointed assistant manager and secretary of the Steering Committee, and from 1999 to June 2011 he served as executive general assistant manager. In the same year, he was appointed member of the board of directors of Sociedad Española de Medios de Pago, S.A. From 1992 to 1994, Mr. Massanell served as Chairman of the Steering Committee of Sistema 6000 de la Confederación Española de Cajas de Ahorros, and director of Visa Spain (1995-1998), Autema (1991-2003), Colonial Real Estate (1992-2003), Baqueira Beret (1998-2006) and Occidental Hotels Management, B.V.
96

(2003-2007). Mr. Massanell is currently general manager of Caixa Bank and a member of the boards of directors of e-la Caixa, S.A., Boursorama, S.A., Caixa Capital Risc, S.G.E.C.R., S.A., Mediterránea Beach & Golf Community, S.A. and Serveis Informátics “La Caixa,” S.A. He is also chairman of Port Aventura Entertainment, S.A. and Barcelona Digital Centre Tecnológic (former Fundació Barcelona Digital). Mr. Antonio Massanell Lavilla holds a degree in economics from the University of Barcelona.
Mr. Ignacio Moreno Martínez serves as a director on our Board of Directors. Previous posts include Head of Corporate Banking and Private Equity at Banco de Vizcaya, Banco Santander de Negocios, and Mercapital. He also served as Deputy General Manager of Corporate and Institutional Banking at Corporación Bancaria de España, S.A. – Argentaria, CEO of Desarrollo Urbanístico Chamartín, S.A., and Chairman of Argentaria Bolsa, Sociedad de Valores. In addition, he also served as General Manager of the Chairman’s Office at Banco Bilbao Vizcaya Argentaria, S.A., and CEO of Vista Capital Expansión, S.A., SGECR – Private Equity. Mr. Moreno is currently CEO of N+1 Private Equity. Mr. Moreno holds a degree in Economics and Business Studies from the University of Bilbao, a Master’s degree in Marketing and Sales Management from the Instituto de Empresa and an MBA from INSEAD.
Mr. Francisco Javier De Paz Mancho serves as a director of our Board of Directors. From 1990 to 1993, he was General Secretary of the Spanish Consumers Association (Unión de Consumidores de España, UCE). From 1993 to 1996, he served as general manager of Internal Trade of the Spanish Ministry of Tourism and Commerce. From 1994 to 1996, he was chairman of the Observatory of Trading of the Spanish Ministry of Tourism and Commerce (Observatorio de la Distribución Comercial del Ministerio de Comercio y Turismo); from 1996 to 2004, he was corporate strategy manager of the Panrico Donuts Group. From 1998 to 2004, he served as director of Mutua de Accidentes de Zaragoza (MAZ) and of the Panrico Group. From 2004 to 2006, he was director of Tunel de Cadí, S.A.C. and from 2003 to 2004, he served as chairman of the Patronal Pan y Bollería Marca (COE). From 2004 to 2007, he was chairman of the National Company MERCASA. He has also been a member of the board of directors of Altadis, S.A., and of the Economic and Social Board and its permanent commission. From July 2006, he has been a member of the Executive Committee of the Chambers Board (Consejo Superior de Cámaras). Mr. de Paz has a diploma in publicity and information and followed studies in law. He followed a Programa de Alta Dirección de Empresas from the IESE Business School (Instituto de Estudios Superiores de la Empresa, University of Navarra).
Mr. Chang Xiaobing serves as a director of our Board of Directors. Prior to joining China United Telecommunications Corporation, Mr. Chang served as Deputy Director of the Nanjing Municipal Posts and Telecommunications Bureau of Jiangsu Province, Deputy Director General of the Directorate General of Telecommunications of the Ministry of Posts and Telecommunications, and Deputy Director General and Director General of the Department of Telecommunications Administration of the former Ministry of Information Industry, as well as Vice President of China Telecommunications Corporation. Mr. Chang became the Chairman of China United Telecommunications Corporation in November 2004. He was appointed in December 2004 as an Executive Director, Chairman and Chief Executive Officer of China Unicom (Hong Kong) Limited. In December 2008, China United Telecommunications Corporation changed its company name to China United Network Communications Group Company Limited ("Unicom Group"). He serves as the Chairman of Unicom Group, China United Network Communications Limited ("A Share Company") and China United Network Communications Corporation Limited ("CUCL"), respectively. Mr. Chang graduated in 1982 from the Nanjing Institute of Posts and Telecommunications with a bachelor's degree in telecommunications engineering and received a master's degree in business administration from Tsinghua University in 2001. He received a doctor's degree in business administration from the Hong Kong Polytechnic University in 2005. Executive Officers/Management Team
At March 29, 2012, our executive management team consisted of the following individuals:
Name
Position
Appointed
Age
Mr. César Alierta Izuel Chairman of the Board of Directors and Chief Executive Officer 2000 66Mr. Julio Linares López Chief Operating Officer 2007 66Mr. José María Álvarez –Pallete López Chairman of Telefónica Europe 2011 48Mr. Guillermo Ansaldo Lutz General Manager of Global Resources 2011 50Mr. Matthew Key Chairman of Telefónica Digital 2011 49Mr. Santiago Fernández Valbuena Chaiman of Telefónica Latin América 2002 54Mr. Luis Abril Pérez Technical General Secretary to the Chairman 2002 64
97

Biographies of the Executive Officers and Senior Management
We present below the biographies of our executive officers and senior management who do not also serve on our Board of Directors.
Mr. Guillermo Ansaldo Lutz serves as General Manager of Global Resources since September 2011, and he is also member of the Executive Committee of Telefónica. From 1989 to 2000 he worked for McKinsey & Company holding different positions in Spain and Argentina. In 1995, he was appointed partner of McKinsey & Company in Argentina. From 2000 to 2004 he was the chief executive officer of Telefónica de Argentina, S.A. and since April 2005, he held the position of chief executive officer of Telefónica de España, S.A. From December 2007 to September 2011 he was Chairman and CEO of Telefónica España. He holds a degree in industrial engineering from the Universidad de Buenos Aires and an MBA from The Amos Tuck School of Business Administration, Dartmouth College.
Mr. Matthew Key serves as Chairman of Telefónica Digital since September 2011 and is a member of the Executive Committee of Telefónica. From 1984 until 1998 he held various positions of responsibility in Arthur Young, the Grand Metropolitan Plc (1988), Coca Cola & Schweppes Beverages Ltd (1993-1995), Kingfisher Plc and finally, from 1998 to 2002, Vodafone Plc. From 2000 to 2002 he worked as non-executive director of Vodafone Egypt. He has served as chairman and non-executive director of Tesco Mobile since 2003. In February 2002, he was appointed chief financial officer of Telefónica UK until December 2004. In January 2005, he was appointed chief executive officer of Telefónica UK. He was appointed chairman and chief executive of Telefónica Europe in November 2007, a post he held until September 2011. He holds a “first class” honours degree in economics from Birmingham University.
Mr. Santiago Fernández Valbuena serves as Chairman of Telefónica Latinoamérica and is a member of the Executive Committee of Telefónica. He has served as our chief financial officer since July 2002 to 2010 and from 2010 to September 2011 General Manager of Strategy, Finance and Development. He joined Telefónica Group in 1997 as chief executive officer of Fonditel, Telefónica’s pension assets manager. Previously, he was the managing director of Societé Génerale Equities, and also head of Equities & Research at Beta Capital in Madrid. Mr. Fernández Valbuena served as president of the Research Commission at the Spanish Institute of Financial Analysts. He has held senior teaching positions at Complutense University, and with the MBA programs of the Manchester Business School and Instituto de Empresa. He holds a degree in economics from the Universidad Complutense of Madrid and he also holds an M.S. and a PhD degree in economics and finance from Northeastern University in Boston (United States).
Mr. Luis Abril Pérez serves as our Technical General Secretary to the Chairman and is a member of the Executive Committee of Telefónica. Mr. Abril started his professional career as a microeconomics professor in the Commercial University of Deusto, where he went on to head its Finance Department. In 1978, he moved to Banco de Vizcaya, S.A., as treasury director and then worked as head of the president’s technical department. During his work with the Banco Bilbao Vizcaya Group (1988 to 1991), he acted as general director for the Asset Management division. From 1994 to 1999, Mr. Abril acted as general manager for Banco Español de Crédito, S.A. (Banesto), and he later acted as general manager of research and communications for Banco Santander Central Hispano, S.A. (1999 to 2001). He is also non-executive Vice President and Member of the Board of Directors in Canal+ DTS, Member of the Board of Directors in Deusto and Member of the Board of Directors in Council of the Americas-Americas Society. Mr. Abril holds a degree in economics and a law degree from the Commercial University of Deusto and he also holds an MBA from the North European Management Institute, Oslo, Norway.
Mr. Calixto Ríos Pérez serves as our General Manager of Internal Audit. In 1973, Mr. Ríos joined Banco Exterior de España, S.A. as the General Manager of Extebank in New York City. Subsequently he was appointed chief executive officer and chief operating officer of Extebandes in Venezuela. Later, Mr. Ríos returned to Madrid as the general manager of International Banking Subsidiaries of Banco Exterior de España, S.A. In 1990, he was
Name
Position
Appointed
Age
Mr. Calixto Ríos Pérez General Manager of Internal Audit 2002 67Mr. Ángel Vilá Voix General Manager of Finance and Corporate Development 2011 47Mr. Ramiro Sánchez de Lerín García-Ovies General Legal Secretary and Secretary to the Board 2003 57
98

appointed chief executive officer responsible for overseeing the construction, management and marketing of the Olympic Village for the Olympic games of Barcelona and a year later was appointed chief financial officer of Tabacalera, S.A. After the merger of Tabacalera with the French company, Seita, he was appointed advisor to the chairman and head of Strategy and Planning. In November 2000, he joined the Telefónica Group as general manager for Institutional Relations, and in July 2002 he was appointed general manager for Internal Auditing and Communications. He holds a degree in economics from the Complutense University of Madrid.
Mr. Ramiro Sánchez de Lerín García-Ovies serves as our General Secretary and Secretary to our Board of Directors. He is also a member of the Executive Committee. He began his career in Arthur Andersen, first working for its audit department and later for its tax department. In 1982, he became a Government Attorney (Abogado del Estado) and started working for the local tax authorities in Madrid (Delegación de Hacienda de Madrid). Afterwards he was assigned to the State Secretariat for the European Communities and later to the Foreign Affairs Ministry. He has been general secretary and secretary of the Board of Elosúa, S.A., Tabacalera, S.A., Altadis, S.A. and Xfera Móviles, S.A. He has also held teaching positions in Instituto Católico de Administración y Dirección de Empresas (ICADE), Instituto de Empresa and Escuela de Hacienda Pública.
Mr. Ángel Vilá Boix serves as our General Manager for Finance and Corporate Development and is a member of the Executive Committee at Telefónica, S.A. Prior to joining Telefónica, he held positions atCitigroup, McKinsey&Co, Ferrovial and Planeta. Mr. Vilá joined Telefónica in 1997 as Group Controller, moving on to become CFO of Telefónica Internacional, where he led the Telebras privatization team. In 2000, he was appointed Group Head of Corporate Development. He is member of the Boards of Directors of Telco SpA and Digital+. He previously served on the Boards of BBVA and Endemol, and on the Advisory panel of Macquarie MEIF funds. He graduated in Industrial Engineering from Universitat Politècnica de Catalunya and holds a MBA from Columbia University (New York). B. Compensation
Please see Note 21(f) to our Consolidated Financial Statements. Incentive Plans
Please see Note 20 to our Consolidated Financial Statements. C. Board Practices
Please see “—Directors and Senior Management” above. D. Employees
Please see “ Headcount and employee benefits” in Note 19 to our Consolidated Financial Statements. E. Share Ownership
At March 29, 2012, the following members of our Board of Directors beneficially owned directly or indirectly an aggregate of 7,188,521 shares, representing approximately 0.158% of our capital stock.
Name
Percentage of Shares Beneficially Owned
Mr. César Alierta Izuel 0.094%Mr. Isidro Fainé Casas 0.011%Mr. Julio Linares López 0.009%Mr. José María Abril Pérez 0.004%Mr. José Fernando de Almansa Moreno-Barreda 0.000%Mr. Jose María Álvarez-Pallete López 0.007%Mr. David Arculus 0.000%Ms. Eva Castillo Sanz 0.002%Mr. Carlos Colomer Casellas 0.002%
99

At March 29, 2012, members of our executive management team (excluding members of our Board of Directors listed above) beneficially owned an aggregate of 1,435,241 of our shares, representing approximately 0.03 % of our capital stock.
None of our directors or executive officers beneficially owned shares representing one percent or more of our share capital at March 29, 2012.
None of our directors and executive officers held options in respect of shares representing one percent or more of our share capital at March 29, 2012. Item 7. Major Shareholders and Related Party Transactions A. Major Shareholders General
At March 29, 2012, we had 4,563,996,485 shares outstanding, each having a nominal value of €1.00 per share. All outstanding shares have the same rights.
At March 29, 2012, according to information provided to us or to the Spanish National Securities Commission, the CNMV, beneficial owners of 3% or more of our voting stock were as follows:
To the extent that our shares are represented by account in the book-entry form, we do not keep a shareholder registry and our ownership structure cannot be known precisely. Based on the information available to us there is no individual or corporation that directly or indirectly through one or more intermediaries may exercise any type of control over us. Nevertheless, we have certain shareholders whose holdings are considered material.
At December 31, 2011 approximately 252,954,331 of our shares were held in the form of ADSs by 870 holders of record, including Cede & Co., the nominee of the Depository Trust Company. The number of ADSs outstanding was 163,944,981 at December 31, 2010.
Name
Percentage of Shares Beneficially Owned
Mr. Peter Erskine 0.001%Mr. Alfonso Ferrari Herrero 0.013%Mr. Luiz Fernando Furlán 0.000%Mr. Gonzalo Hinojosa Fernández de Angulo 0.011%Mr. Pablo Isla Alvarez de Tejera 0.000%Mr. Antonio Massanell Lavilla 0.000%Mr. Ignacio Moreno Martínez 0.000%Mr. Francisco Javier de Paz Mancho 0.001%Mr. Chang Xiaobing 0.000%
Name of Beneficial Owner
Number of Shares
Percent
Banco Bilbao Vizcaya Argentaria, S.A.(1) 258,217,137 5.657%Caja de Ahorros y Pensiones de Barcelona (“la Caixa”)(2) 246,898,917 5.410%Blackrock, Inc.(3) 177,257,649 3.88%
(1) Based on the information provided by Banco Bilbao Vizcaya Argentaria, S.A. as at December 31, 2011 for the 2011 Annual Report on Corporate Governance. (2) Based on information provided by Caja de Ahorros y Pensiones de Barcelona, “la Caixa” as at December 31, 2011 for the 2011 Annual Report on Corporate Governance. The 5.409% indirect shareholding
in Telefónica is owned by Caixa Bank, S.A. (3) According to notification sent to the Spanish National Securities Commission, the CNMV, dated February 4, 2010.
100

Ownership Limitations
There are no limitations with respect to the ownership of our assets or share capital except those related to assets derived from the application of the reciprocity principle. Article 6 of the General Telecommunications Law, or the GTL, provides for the application of the reciprocity principle under existing international treaties or agreements signed and ratified by Spain. The Spanish government, upon request, may authorize exceptions to the reciprocity principle contained in the GTL. B. Related Party Transactions
During 2011 and through the date of this Annual Report, none of our directors nor any member of our management team has been involved in any related party transactions with us.
Our Board of Directors’ Regulations grant the Board of Directors the exclusive power to authorize any transactions with major shareholders or with our directors. Prior to authorizing any such transaction, our Board will receive an opinion from the Nominating, Compensation and Corporate Governance Committee addressing the fairness of the transaction to our shareholders and us. Any of our directors that may have an interest in the proposed transaction must abstain from voting on the proposed transaction.
Two of our major shareholders are financial institutions. We have entered into related party transactions with both companies within our ordinary course of business, and always on arm’s length terms. During 2011, the executed transactions were generally loans, capital markets or derivative transactions provided to us by these financial institutions and agreements for us to provide telecommunications and broadband services to such institutions. Related Party Transactions with Significant Shareholders
Please see Note 10 to our Consolidated Financial Statements. Intra-Group Loans
We are the parent company of the Telefónica Group and operate through our subsidiaries and affiliated companies. We coordinate group policies, including financial policy and, in some cases, actual financial management is conducted by us. Most of the transactions we perform with other members of the Telefónica Group relate to financing transactions, including covering their needs for funds and providing interest rate and exchange rate hedges.
At December 31, 2011, as recorded in our parent company accounts, we loaned a total of €4,343 million (€5,424 million at December 31, 2010) to companies of the Telefónica Group while companies of the Telefónica Group and their associates loaned us a total of €51,848 million (€50,320 million at December 31, 2010), of which €10,048 million (€10,063 million at December 31, 2010) was loaned to us by Telefónica Europe, B.V. and €32,078 million (€29,424 million at December 31, 2010) was loaned to us by Telefónica Emisiones S.A.U., our financing subsidiaries devoted to raising funds in the capital markets, €7,380 million (€9,011 million at December 31, 2010) was loaned to us by Telefónica Finanzas, S.A.U., our subsidiary in charge of financial support for Telefónica Group companies and €2,332 million (€1,812 million at December 31, 2010) was loaned by us to Telfisa Global, B.V., our financing subsidiary charged with centralizing and managing the cash pooling of our subsidiaries in Latin America, Europe and the United States.
With respect to the balances with associated companies, the line item “Non-current financial assets” on the consolidated statement of financial position at December 31, 2011, includes “Loans to Associates” amounting to €685 million (€647 million at December 31, 2010). C. Interests of Experts and Counsel
Not applicable.
101

Item 8. Financial Information Consolidated Financial Statements
Please see Item 18. Legal Proceedings
Telefónica and its group companies are party to several legal proceedings which are currently in progress in the courts of law and the arbitration bodies of the various countries in which we are present.
Based on the advice of our legal counsel it is reasonable to assume that these legal proceedings will not materially affect our financial position or solvency, regardless of the outcome. We highlight the following unresolved legal proceedings or those underway in 2011:
Contentious proceeding in connection with the merger between Terra Networks, S.A. and Telefónica, S.A.
On September 26, 2006, Telefónica was notified of the claim filed by former shareholders of Terra Networks, S.A. (Campoaguas, S.L., Panabeni, S.L. and others) alleging breach of contract in respect of the terms and conditions set forth in the prospectus of the initial public offering of shares of Terra Networks, S.A. dated October 29, 1999. This claim was rejected by a ruling issued on September 21, 2009, and the appellants ordered to pay court costs. This ruling was appealed in June, 2010. Telefónica objected to the appeal on January 5, 2011.
Cancellation of the UMTS license granted to Quam GMBH in Germany
In December 2004, the Germany Telecommunications Market Regulator revoked the UMTS license granted in 2000 to Quam GmbH, in which Telefónica has a stake. After obtaining a suspension of the revocation order, on January 16, 2006, Quam GmbH filed a suit against the order with the German courts. This claim sought to overturn the revocation order and, if this failed, to be reimbursed for the total or partial payment of the original amount paid for the license.
This claim was rejected by the Cologne Administrative Court. Quam GmbH appealed the decision before the Supreme Administrative Court of North Rhine-Westphalia, which also rejected its appeal. Quam GmbH filed a new appeal before the Federal Supreme court for Administrative Cases, which appeal was also rejected on August 17, 2011. Finally, in October 2011, Quam GmbH submitted a constitutional complaint before the Federal Constitutional Court that it is still pending resolution.
Appeal against the European Commission ruling of July 4, 2007 against Telefónica de España’s broadband pricing policy
On February 22, 2006, we were sent a statement of objections, initiating disciplinary proceedings for conduct that goes against Article 82 of EC Treaty rules. Subsequently, on July 9, 2007, the European Commission issued a decision, imposing a fine of €152 million on us and Telefónica de España. The ruling charged us with applying a margin squeeze between the prices we charged competitors to provide regional and national wholesale broadband services and our retail broadband prices using ADSL technology from September 2001 to December 2006.
On September 10, 2007, we and Telefónica de España both filed appeals to overturn the decision before the Court of First Instance of the European Community. The Kingdom of Spain also lodged an appeal to overturn the decision. Meanwhile, France Telecom and the Spanish Association of Bank Users (AUSBANC) filed requests to intervene, to which we have submitted our comments.
The ECTA (European Competitive Telecommunications Association) has submitted an application dated November 4, 2010 to intervene in the ruling supporting the EU’s conclusions. Telefónica objected the intervention of ECTA on December 7, 2010. A hearing was held on May 23, 2011. On March 29, 2012, the General Court of the EU has upheld the decision of the EC. Telefónica will lodge an appeal with the European Court of Justice for its annulment.
102

Appeal against the decision by Agencia Nacional de Telecomunicações (ANATEL) regarding the inclusion of interconnection and network usage revenues in the Fundo de Universalização de Serviços de Telecomunicações (FUST).
Brasilcel (Vivo) Group operators, together with other Brazilian mobile operators, appealed ANATEL’s decision of December 16, 2005, to include interconnection and network usage revenues and expenses in the calculation of the amounts payable into the Fund for Universal Access to Telecommunications Services (Fundo de Universalização de Serviços de Telecomunicações, or FUST for its initials in Portuguese), a fund to pay for the obligations to provide universal service, with retroactive application from 2000. On March 13, 2006, the Brasilia Federal Regional Court granted the injunction requested by the appellants, preventing ANATEL’s decision from being applied. On March 6, 2007, a ruling in favor of the mobile operators was issued, stating that it was not appropriate to include the revenues received from other operators in the taxable income for the FUST calculation and rejecting the retroactive application of ANATEL’s decision. ANATEL filed an appeal to overturn this decision with the Brasilia Regional Federal Court no.1. This appeal is pending resolution.
At the same time, Telesp and Telefónica Empresas, S.A., together with other fixed line operators through ABRAFIX (Associação Brasileira de Concessionárias de Serviço Telefonico Fixo Comutado) appealed ANATEL’s decision of December 16, 2005, also obtaining injunctions. On June 21, 2007, Federal Regional Court No. 1 ruled that it was not appropriate to include the interconnection and network usage revenues and expense in FUST taxable income and rejected the retroactive application of ANATEL’s decision. ANATEL filed an appeal to overturn this ruling on April 29, 2008 before Brasilia Federal Regional Court No. 1. This appeal is pending resolution.
Public civil procedure by the São Paulo government against Telesp for alleged repeated malfunctioning in the services provided by Telesp requesting compensation for damages to the customers affected.
In February 3, 2009, the Public Ministry of the State of São Paulo initiated proceedings against Telesp for alleged repeated malfunctioning in the telecommunication services provided by Telesp. The proceedings sought compensation for damages to the customers affected. A general claim was filed by the Public Ministry of the State of São Paulo suggesting an indemnification of 1,000 million Brazilian reais, calculated on the company’s revenues base over the last five years. Telesp’s potential responsibility will only be known in the calculation and enforcement of the award by affected consumers.
This proceeding was suspended via resolution dated November 5, 2009, for a period of 90 days, to assess the proposed agreement being negotiated between the parties. As no agreement was reached, the suspension was lifted and the procedure remains in the courts. A judgment was issued on April 20, 2010, imposing payment of damages suffered by all consumers who proved to be eligible for the award. Telesp filed an appeal on May 5, 2010, which is still pending. It is not currently possible to evaluate the amount involved in this lawsuit.
Case before the Directorate General for Competition of the European Commission – Telefónica / Portugal Telecom
On January 5, 2011, the European Commission sent a request to Telefónica, S.A. for information on the agreements entered into with Portugal Telecom SGPS, S.A. (Portugal Telecom) for the purchase of its ownership interest in Brasilcel, a joint venture in which both parties own an interest in the Brazilian company, Vivo. On January 19, 2011, the European Commission initiated formal proceedings to investigate whether Telefónica and Portugal Telecom had infringed on European Union anti-trust laws with respect to a clause contained in these agreements. After responding to a number of requests for information from the European Commission, on September 24, 2011, Telefónica received a list of charges from the European Commission. On January 13, 2012, it presented its response to the charges. Due to the preliminary nature of these proceedings, we are unable to form an opinion concerning the amount of any potential liability related to this matter or the likelihood of an adverse judgment.
103

Tax proceedings
Brazil tax proceedings
On June 13, 2011 the Treasury of the State of São Paulo initiated new proceedings against Telesp (currently Telefónica Brasil) with respect to the services subject to the ICMS tax (VAT-like tax on telecommunications services).
Telefónica is currently engaged in discussions with the Treasury of the State of São Paulo concerning which telecommunications services should be subject to this tax. Specifically, the Tax Administration has demanded the payment of the ICMS on services that are complementary or supplementary to the basic telecommunication services. As of the date of this annual report, Telefónica has challenged every resolution resulting from a legal or administrative proceeding regarding this claim. The aggregate amount of these proceedings including interest, penalties and other items as of the date of this annual report was approximately €1,077 million.
Proceeding against Telefónica del Perú, S.A.A. regarding the income tax for years 2000 and 2001
On February 11, 2011, Telefónica del Perú, S.A.A. was notified of an adverse decision by the tax court in a matter initiated by tax authorities in 2005 relating to income tax payments for the 2000 and 2001 tax years. The dispute relates to the deductibility of certain expenses (such as financial expenses, provision for bad debts, leases and personnel expenses) and the tax neutrality of the restructuring process carried out by Telefónica del Perú, S.A.A. in January, 2000.
Telefónica del Perú, S.A.A. filed a legal action in the relevant court, seeking to reverse the administrative resolution, as the Company believes that this ruling has no reasonable basis. However, pursuant to an enforcement resolution issued by the Peruvian tax authority (SUNAT) Telefónica del Perú has paid approximately € 38 million. An appeal has been filed against the said resolution in order to get the money back until a final decision on the merits is released.
For information on legal proceedings related to tax matters, see Note 17 to our Consolidated Financial Statements. Dividend information and shareholders’ return
Dividend background
The table below sets forth the annual dividends declared per share and the year to which such dividends correspond. Generally, the dividend for a given year is paid in two tranches, one in the second-half of the relevant year and the other during the first half of the following year.
Additionally, our Board of Directors analyzed and positively considered a revision of our shareholder remuneration targets announced in October 2009, which were established considering an economic and
operating environment and financial market conditions that have changed materially since then. In the current environment and considering our stock market valuation, we have decided to anticipate a flexible shareholder remuneration scheme, initially set for 2013, while maintaining remuneration for our shareholders that is compatible with our strategy of
Year ended December 31,
Dividends per share
(euro)2011(1) 1.602010 1.402009 1.152008 1.002007 0.75
(1) A cash dividend of €0.77 per share was paid on November 7, 2011, charged against unrestricted reserves. The remaining amount (€0.83), will be paid in May 2012. With the payment of this dividend, we will have completed our stated commitment to distribute a dividend of €1.60 per share.
104

sustained investment in our business, including spectrum acquisition, capturing growth opportunities in our markets and enhancing our financial flexibility.
Total shareholder remuneration for the year 2012 is expected to amount to €1.50 per share, including the payment of a cash dividend of €1.30 per share and a share buyback for the remaining amount. Treasury shares acquired will be amortized and the share buyback is scheduled for completion by May 2013.
For the year 2013, the estimated minimum total shareholder remuneration per share will be similar to that for 2012 (€1.50 per share). The remuneration mix (dividend, share buyback or the combination of both) will be determined by us considering market conditions and investor preferences at that time.
Payments of any future dividends will be dependent on our results of operations, liquidity and capital resources and market conditions at the time, all of which may be influenced by a variety of factors. See “Cautionary Statement Regarding Forward-Looking Statements.”
Treasury shares and share buyback program
We held the following Telefónica, S.A. shares as treasury shares at the dates indicated:
These treasury shares are directly owned by Telefónica, S.A., except for 1 share held by Telefónica Móviles Argentina, S.A. as of December 31, 2011 (16,896 treasury shares held by Telefónica Móviles Argentina, S.A. at December 31, 2010).
The following transactions involving treasury shares were carried out in 2010 and 2011:
The amount paid to acquire Telefónica, S.A. shares in 2011 was €822 million (€897 million in 2010).
At the date of authorization for issue of our Consolidated Financial Statements, we held 234 million call options on treasury shares subject to physical settlement (options on 190 million and 160 million
treasury shares at December 31, 2011 and 2010, respectively).
Number of sharesAcquisition price(euro per share)
Trading price(1)
(euro per share) Market value(2)
(in millions of euro)Percentage of
our capital stock(3)
Treasury shares at December 31, 2011 84,209,364 15.68 13.39 1,127 1,84508%Treasury shares at December 31, 2010 55,204,942 17.01 16.97 937 1.20957%Treasury shares at December 31, 2009 6,329,530 16.81 19.52 124 0.13868%
(1) Closing price of our shares on the Automated Quotation System of the Spanish stock exchange at the indicated dates.
(2) Market value is calculated as trading price times number of shares held on treasury at the indicated dates.
(3) Calculated using capital stock at each date.
Number of sharesTreasury shares at December 31, 2011 84,209,364Acquisitions 55,979,952Performance Share Plan (2,900,189)Disposals (24,075,341)Treasury shares at December 31, 2010 55,204,942Acquisitions 52,650,000Performance Share Plan (2,964,437)Disposals (810,151)Treasury shares at December 31, 2009 6,329,530
105

Item 9. The Offering and Listing A. Offer and Listing Details General
Our ordinary shares, nominal value €1.00 each, are currently listed on each of the Madrid, Barcelona, Bilbao and Valencia stock exchanges and are quoted through the Automated Quotation System under thesymbol “TEF.” They are also listed on various foreign exchanges such as the London and Buenos Aires stock exchanges. Our ADSs are listed on the New York Stock Exchange and the Lima Stock Exchange.
The table below sets forth, for the periods indicated, the reported high and low quoted closing prices, as adjusted for all stock splits, for our shares on the Madrid Stock Exchange, which is the principal Spanish market for our shares, and our ADSs on the New York Stock Exchange:
Source: Madrid Stock Exchange Information and Bloomberg. (1) The closing prices prior to January 21, 2011 reflect the adjustment for the ratio change.
Until January 21, 2011, each ADS represented the right to receive three ordinary shares. As of January 21, 2011, the ADS-to-Share Ratio was changed, so that each ADS now represents the right to receive one ordinary share.
On March 28, 2012, the closing price of our shares on the Automated Quotation System of the Spanish stock exchanges was €12.300 per share, equal to $16.313 at the Noon Buying Rate on March 23, 2012 for cable transfers in euro as certified for customs purposes by the Federal Reserve Bank of New York on that date.
Our ADSs are listed on the New York Stock Exchange under the symbol “TEF.” Citibank, N.A. is the Depositary issuing ADSs in form of certificated ADSs (American Depositary Receipts, or ADRs) oruncertificated ADSs pursuant to the deposit agreement dated as of November 13, 1996, as amended as of December 3, 1999 and as further amended as of June 23, 2000 and as of March 9, 2007 amongTelefónica, the Depositary and the holders from time to time of ADSs (the “Deposit Agreement”).
At December 31, 2011, approximately 252,954,331 of our shares were held in the form of ADSs by 870 holders of record, including Cede & Co., the nominee of The Depository Trust Company. Thenumber of ADSs outstanding
Per Share(in euro)
Per ADS(in dollars)(1)
High Low High Low
Year ended December 31, 2007 23.260 15.200 34.37 20.15Year ended December 31, 2008 22.780 12.730 33.97 15.88Year ended December 31, 2009 19.750 13.690 29.69 17.24Year ended December 31, 2010 19.820 14.875 28.55 17.81Year ended December 31, 2011 18.655 12.690 27.08 16.58Quarter ended March 31, 2010 19.820 16.440 28.55 22.53Quarter ended June 30, 2010 18.090 14.875 24.72 17.81Quarter ended September 30, 2010 18.410 15.090 24.91 19.05Quarter ended December 31, 2010 19.595 16.390 27.56 21.33Quarter ended March 31, 2011 18.655 16.580 25.74 21.61Quarter ended June 30, 2011 18.230 16.020 27.08 22.63Quarter ended September 30, 2011 16.985 12.690 24.79 17.80Quarter ended December 31, 2011 15.830 12.835 22.54 16.61Month ended September 30, 2011 14.590 12.690 20.70 17.80Month ended October 31, 2011 15.830 14.070 22.54 18.38Month ended November 30, 2011 15.180 12.865 20.63 17.00Month ended December 31, 2011 14.115 12.835 18.85 16.61Month ended January 31, 2012 13.710 13.005 17.73 16.58Month ended February 29, 2012 13.495 12.810 17.76 16.95Month ended March 31, 2012 (through March 28, 2012) 13.010 12.300 17.27 16.31
106

was 54,648,327 at December 31, 2010. (163,944,981 taking into account the ADS-to-Share ratio effective January 21, 2011). Spanish Securities Market Legislation
The Spanish Securities Markets Act (Ley del Mercado de Valores, or the LMV), enacted in 1988 and further amended, regulates the primary and secondary securities markets in Spain by establishing principles for their organization and operation, rules governing the activities of persons and institutions operating in these markets and a system for their supervision. This legislation and the regulation implementing it (mainly, as far as private issuers are concerned, the Royal Decree 1310/2005, of November 4, in relation to the issuance of securities and its admission to listing in official secondary markets, and Royal Decree 1362/2007, of October 19, concerning the transparency requirements in relation to information about issuers whose securities are admitted to trading on a regulated market):
On March 11, 2005 Royal Decree Law 5/2005 was approved, modifying the LMV in order to implement the Directive 2003/71/EC of the European Parliament and of the Council on the prospectus to be
published when securities are offered to the public or admitted to trading. The Directive: (i) harmonizes the requirements for the process of approval of the prospectuses in order to grant to the issuer a single passport for such document, valid throughout the European Union; (ii) incorporates the application of the country of origin principle by which the prospectus will be approved by the Member States of the European Union where the issuer has its registered office but it also introduces as a new matter the possibility that in certain circumstances, such as issues with high minimum denominations (€1,000 or more), the issuer may designate the relevant European Union competent authority for prospectus approval.
Subsequently, Royal Decree 1310/2005 partially developed the LMV in relation to the admission to trading of securities in the official secondary markets, the sales or subscription public offers and the prospectus required to those effects.
Royal Decree 1333/2005 developed the LMV in relation to market abuse, implementing Directive 2003/6/EC of the European Parliament and of the Council, relating insider dealing and market manipulation practices (“market abuse”).
On April 12, 2007 Law 6/2007 was approved, modifying the LMV in order to implement the Directive 2004/25/EC of the European Parliament and of the Council relating to public tender offers and the Directive 2004/109/EC relating to the transparency of issuers. Law 6/2007 intends: (i) to encourage an efficient market for corporate control, while protecting the rights of minority shareholders of listed companies and (ii) to enforce transparency in financial markets.
In relation to public tender offers, Law 6/2007 (i) establishes the cases in which a company must launch a takeover bid over the whole share capital of the relevant company; (ii) establishes that takeover bids shall be launched
• establishes an independent regulatory authority, the CNMV, to supervise the securities markets;
• establishes the rules for surveillance, supervision and sanction provided for the representation of transferable securities by book entries or by certificate;
• establishes a framework for the issuance of securities;
• establishes a framework for trading activities;
• establishes the disclosure obligations of issuers, particularly the obligation to file annual audited financial statements and to make public quarterly financial information;
• establishes the framework for tender offers;
• establishes the code of conduct for all market participants; and
• regulates market abuse infringements.
107

once a specific stake on the share capital of the company has been reached; (iii) adds new obligations for the board of directors of the target companies of the takeover bid in terms of defensive measures against the takeover bid; (iii) regulates the squeeze-out and sell-out procedure when a 90% of the share capital is held following a takeover bid. Royal Decree 1066/2007 completes the regulation currently in place for takeover bids in Spain.
Regarding transparency of issuers whose shares are accepted to trading on an official market, Law 6/2007 (i) modifies the reporting requirements of the periodic financial information of listed companies and issuers of listed securities; (ii) establishes a new disclosure regime for significant shareholders; (iii) adds new information and disclosure requirements for issuers of listed securities; (iv) establishes a civil liability procedure of the issuer and board of directors in connection with the financial information disclosed by issuers of securities; and (v) confers new supervisory powers upon the CNMV with respect to the review of accounting information.
On December 19, 2007 Law 47/2007 was approved, modifying the LMV in order to implement the Directive 2004/39/EC of the European Parliament and of the Council, on Markets in Financial Instruments (MiFID); the Directive 2006/73/EC of the European Parliament and of the Council on organizational requirements and operating conditions regarding the Market in Financial Instruments Directive, and the Directive 2006/49/EC of the European Parliament and of the Council on the capital adequacy of investment firms and credit institutions. Its principal aim is to establish a general legal framework for financial markets in the European Union, in particular with regard to financial services, as well as to ensure appropriate transparency for investors through a regular flow of the relevant information concerning security issuers. Amongst other things, the new regime (i) establishes new multilateral trading facilities for listing shares apart from the stock markets; (ii) reinforces the measures for the protection of investors; (iii) establishes new organizational requirements for investment firms; (iv) implements new supervisory powers for CNMV, establishing cooperation mechanisms amongst national supervisory authorities.
On July 4, 2009, Law 3/2009, regarding structural modifications on Spanish Corporations (Ley 3/2009, de 3 de abril, sobre modificaciones estructurales de las sociedades mercantiles) came into force, modifying the maximum threshold established in the Spanish Corporation Act as to the number of treasury shares held by listed companies and their subsidiaries from 5% up to 10% of their total capital outstanding.
On August 1, 2011, Law 25/2001, partially reforming the Spanish Corporation Act and transposing Directive 2007/36/EC of the European Parliament and of the Council of 11 July relating to the exercise of certain rights shareholders in listed companies (Ley 25/2001, de 1 de agosto, de reforma parcial de la Ley de Sociedades de Capital y de incorporación de la Directiva 2007/36/CE, del Parlamento Europeo y del Consejo, de 11 de Julio, sobre el ejercicio de determinados derechos de los accionistas de las sociedades cotizadas.) was approved. Securities Trading in Spain
The Spanish securities market for equity securities consists of four stock exchanges located in Madrid, Bilbao, Barcelona and Valencia and the Automated Quotation System, or Mercado Continuo. During 2009, the Automated Quotation System accounted for the majority of the total trading volume of equity securities on the Spanish stock exchanges.
Automated Quotation System
The Automated Quotation System links the four Spanish stock exchanges, providing those securities listed on it with a uniform continuous market that eliminates certain of the differences among the local exchanges. The principal features of the system are the computerized matching of buy and sell orders at the time of entry of the order. Each order is executed as soon as a matching order is entered, but can be modified or canceled until executed. The activity of the market can be continuously monitored by investors and brokers. The Automated Quotation System is operated and regulated by Sociedad de Bolsas, S.A., a corporation owned by the companies that manage the local exchanges. All trades on the Automated Quotation System must be placed through a brokerage firm, an official stock broker or a dealer firm that is a member of a Spanish stock exchange. Beginning January 1, 2000, Spanish banks were allowed to become members of Spanish stock exchange and, therefore, can trade through the Automated Quotation System.
108

In a pre-opening session held from 8:30 a.m. to 9:00 a.m. each trading day, an opening price is established for each security traded on the Automated Quotation System based on a real-time auction. The regime concerning opening prices was changed by an internal rule issued by the Sociedad de Bolsas. Pursuant to such rule, each stock in the continuous market is assigned a static and a dynamic range within which its price can fluctuate. The price of a stock may rise or fall within its static range (which is published once a month and is calculated according to the stock’s average historic price volatility) above or below its opening price (which shall be the closing price of the previous session). When the stock trades outside of this range, the trading of the stock is suspended for 5 minutes, during which an auction takes place. After this auction, the price of the stock can once again rise or fall within its static range above or below its last auction price (which will be considered as the new static price before triggering another auction). Furthermore, the price of a stock cannot rise or fall by more than its dynamic price range (which is fixed and published once a month and is calculated according to the stock’s average intra-day volatility), from the last price at which it has traded. If the price variation exceeds the stock’s dynamic range, a five minute auction is triggered. Between 5:30 p.m. and 5:35 p.m. a closing price is established for each security through an auction system similar to the one held for the pre-opening early in the morning.
Trading hours for block trades are also from 9:00 a.m. to 5:30 p.m. Between 5:30 p.m. and 8:00 p.m., certain trades may occur outside the computerized matching system without prior authorization from Sociedad de Bolsas, S.A. at a price within the range of 5% above the higher of the average price and closing price for the day and 5% below the lower of the average price and closing price for the day if there are no outstanding bids or offers, respectively, on the system matching or bettering the terms of the proposed off-system transaction and, if, among other things, the trade involves more than €300,000 and more than 20% of the average daily trading volume of the stock during the preceding three months. These trades must also relate to individual orders from the same person or entity and be reported to the Sociedad de Bolsas, S.A. before 8:00 p.m. At any time trades may take place (with the prior authorization of the Sociedad de Bolsas, S.A.) at any price if:
Information with respect to the computerized trades between 9:00 a.m. and 5:30 p.m. is made public immediately, and information with respect to trades outside the computerized matching system is reported
to Sociedad de Bolsas, S.A. by the end of the trading day and published in the Boletín de Cotización and in the computer system by the beginning of the next trading day.
Clearance and settlement system
The Sociedad de Gestión de los Sistemas de Registro, Compensación y Liquidación de Valores S.A.U., formerly Iberclear, was created by the Ley 44/2002 de Medidas de Reforma del Sistema Financiero, enacted on November 22, 2002 to increase the efficiency of the Spanish financial markets. Such law introduced a new article, 44-bis to the LMV which established the framework for the constitution of Sociedad de Gestión de los Sistemas de Registro, Compensación y Liquidación de Valores S.A.U.
Iberclear is regulated by the Spanish Securities Act and where appropriate by Royal Decree 505/1987 of April 3, 1987, Royal Decree 166/1992 of February 14, 1992, and by any other related regulation. This company, which is a wholly owned subsidiary of Bolsas y Mercados Españoles, Sociedad Holding de Mercados y Sistemas Financieros, S.A. (Bolsas y Mercados Españoles), has the following functions:
• the trade involves more than €1.5 million and more than 40% of the average daily volume of the stock during the preceding three months;
• the transaction derives from a merger or spin-off process, or from the reorganization of a group of companies;
• the transaction is executed for the purposes of settling a litigation or completing a complex group of contracts; or
• Sociedad de Bolsas, S.A. finds other justifiable cause.
• bookkeeping of securities represented by means of book entries admitted to trading in the stock markets or in the public debt book entry market;
109

Iberclear will provide the CNMV, the Bank of Spain and the Ministry of Economy with the information that these entities may request regarding the registry clearance and settlement performed within the
systems managed by Iberclear.
Transactions carried out on the Spanish stock exchanges are cleared and settled through Iberclear.
Only members of the system are entitled to use Iberclear, and membership is restricted to authorized broker members of the Spanish stock exchanges, the Bank of Spain (when an agreement, approved by the Spanish Ministry of Economy and Finance, is reached with Iberclear) and, with the approval of the CNMV, other brokers not members of the Spanish stock exchanges, banks, savings banks and foreign settlement and clearing systems. The clearance and settlement system and its members are responsible for maintaining records of purchases and sales under the book-entry system. Shares of listed Spanish companies are held in book-entry form. Iberclear, which manages the clearance and settlement system, maintains a registry reflecting the number of shares held by each of its member entities (each, an entidad participante) as well as the amount of such shares held on behalf of beneficial owners. Each member entity, in turn, maintains a registry of the owners of such shares. Spanish law considers the legal owner of the shares to be the member entity appearing in the records of Iberclear as holding the relevant shares in its own name or the investor appearing in the records of the member entity as holding the shares.
The settlement of any transactions must be made three business days following the date on which the transaction was carried out.
Obtaining legal title to shares of a company listed on a Spanish stock exchange requires the participation of a Spanish official stockbroker, broker-dealer or other entity authorized under Spanish law to record the transfer of shares. To evidence title to shares, at the owner’s request, the relevant member entity must issue a certificate of ownership. In the event the owner is a member entity, Iberclear is in charge of the issuance of the certificate with respect to the shares held in the member entity’s name.
Brokerage commissions are not regulated. Brokers’ fees, to the extent charged, will apply upon transfer of title of shares from the Depositary to a holder of ADRs in exchange for such ADSs, and upon any later sale of such shares by such holder. Transfers of ADSs do not require the participation of an official stockbroker. The Deposit Agreement provides that holders depositing shares with the Depositary in exchange for ADSs or withdrawing shares in exchange for ADSs will pay the fees of the official stockbroker or other person or entity authorized under Spanish law applicable both to such holder and to the Depositary. B. Plan of Distribution
Not applicable. C. Markets
Please see “—Offer and Listing Details” above. D. Selling Shareholders
Not applicable. E. Dilution
Not applicable.
• managing the clearance and settlement system for the brokerage transactions in the stock markets and at the public debt book entry market; and
• providing technical and operational services directly linked to the registry, clearance and settlement of securities, or any other service required by Iberclear to be integrated with any other registry, clearance, and settlement systems.
110

F. Expenses of the Issue
Not applicable. Item 10. Additional Information A. Share Capital
Not applicable. B. Memorandum and Articles of Association
The following summary describes certain material considerations concerning our capital stock and briefly describes certain provisions of our bylaws and Spanish law. Corporate Objectives
Article 4 of Title I of our bylaws sets forth our corporate purposes:
Director Qualification
In order to be elected as a director, a person must have held a number of our shares representing a nominal value of no less than €3,000 for at least three years prior to his or her election. These shares may not be transferred so long as such person remains a director. This requirement does not apply to any person who, at the time of his or her appointment, has either a labor or professional relationship with the company or is expressly exempted from such requirement by a vote of at least 85% of the Board of Directors. Interested Transactions
When a director or persons related to him or her has an interest in a transaction with us or with any of the companies of our Group, such transaction (if unrelated to the ordinary course of our business or if not performed on an arm’s length basis involving consideration that is significant to the Company and otherwise) must be presented to the Nominating, Compensation and Corporate Governance Committee. Such committee shall assess the transaction from the point of view of equal treatment of shareholders and the arm’s length basis of the transaction and shall be included in the Annual Corporate Governance Report and in the periodic information of the Company upon the terms set forth in applicable laws and regulations. The performance of such transactions requires the authorization of our Board of Directors, after the favorable report of the committee. The interested director must refrain from participating in votes that affect such transaction.
• The provision and operation of all kinds of public or private telecommunications services and, for such purpose, the design, installation, maintenance, repair, improvement, acquisition, disposition, interconnection, management, administration of, and any other activity not included in the preceding enumeration with respect to, all kinds of telecommunications networks, lines, satellites, equipment, systems and technical infrastructure whether now existing or to be created in the future, including the premises in which any and all of the foregoing items are located;
• the provision and operation of all kinds of services that are ancillary or supplemental to or result from telecommunications services;
• the research and development, promotion and application of all kinds of component principles, equipment and systems directly or indirectly used for telecommunications;
• manufacturing and production activities and, in general, all other forms of industrial activity in connection with telecommunications; and
• acquisition, disposition and, in general, all other forms of commercial activity in connection with telecommunications.
111

Significant Differences in Corporate Governance Practices
Corporate governance guidelines
In Spain, companies with securities listed on a Spanish stock exchange are expected to follow the Conthe Code published in May 2006, which contains corporate governance and shareholder disclosure recommendations. It combines and substitutes the former Spanish Corporate Governance Codes: the Olivencia Code of Good Governance and the Aldama Report. Spanish listed companies are required by law to publish an Annual Report on Corporate Governance and also to publish corporate governance information on their websites. We base our corporate governance procedures on the recommendations of the Conthe Code. As part of our corporate governance procedures, we have adopted regulations for our Board of Directors that govern, among other things, director qualification standards, responsibilities, compensation, access to management information, the Board of Directors’ purpose and each of our Board committee’s purpose and responsibilities. Moreover, we have a Regulation of the General Shareholders’Meeting that aims to reinforce its transparency, providing shareholders with a framework guaranteeing and facilitating exercise of their rights. The Annual Report on Corporate Governance published by us provides a detailed explanation of our corporate governance procedures and explains the role and duties of our Board of Directors and Board Committees. For a more detailed description regarding our corporate governance practices see “Item 16G. Corporate Governance.” Description of Our Capital Stock
Description of share capital
At March 29, 2012, our issued share capital consisted of 4,563,996,485 ordinary registered shares with a nominal value of €1.00 each.
Our shareholders have delegated to the Board of Directors the authority to issue up to 2,281,998,242 new shares. The Board of Directors is authorized to exclude preemptive rights, in whole or in part, pursuant to the applicable provisions of the Spanish Corporation Law. The Board’s authorization to issue new shares expires on May 18, 2016.
Meetings and voting rights
We hold our ordinary general shareholders’ meeting during the first six months of each fiscal year on a date fixed by the Board of Directors. Extraordinary general shareholders’ meetings may be called, from time to time, at the discretion of our Board of Directors or upon the request of shareholders representing 5% of our paid-in share capital. We publish notices of all ordinary and extraordinary general shareholders’ meetings in the Official Gazette of the Commercial Registry, and on our web site at least one month before the relevant meeting. Furthermore, the Board of Directors may publish notices in other media, if deemed appropriate in order to give broader publicity to the notice meeting.
Each share of Telefónica, S.A. entitles the holder to one vote. However, only registered holders of shares representing a nominal value of at least €300 (which currently equals at least 300 shares) are entitled to attend a general shareholders’ meeting. Holders of shares representing a nominal value of less than €300 (less than 300 shares), may aggregate their shares by proxy and select a representative that is a shareholder to attend a general shareholders’ meeting or delegate his or her voting rights by proxy to a shareholder who has the right to attend the shareholders’ meeting.
Any share may be voted by proxy. Proxies must be in writing and are valid only for a single meeting.
Only holders of record five days prior to the day on which a general meeting of shareholders is scheduled to be held may attend and vote at the meeting. Under the deposit agreement for our ADSs, our depositary accepts voting instructions from holders of ADSs. The depositary executes such instructions to the extent permitted by law and by the terms governing the shares. The depositary or its nominee, whichever is applicable, will be entitled to vote by proxy the shares represented by the ADSs.
Shareholders representing, in person or by proxy, at least 25% of our subscribed voting capital constitute a quorum for a general meeting of shareholders. If a quorum is not present at the first call, then the meeting can be held
112

on second call. Regardless of the number of shareholders present at the meeting on second call, they are deemed to constitute a quorum.
Shareholders representing, in person or by proxy, at least 50% of our subscribed voting capital constitute a quorum on a first call for shareholders’ meetings at which shareholders will be voting on any of the following actions:
When a quorum is present on the first call, these special resolutions must be adopted by the affirmative vote of shareholders representing a majority of our present subscribed voting capital.
If a quorum for the meeting is not present after the first call, upon a second call for the meeting, 25% of our subscribed voting capital will constitute a quorum. When shareholders representing less than 50%
of the subscribed voting capital are in attendance, these special resolutions must be adopted by a vote of two-thirds of those shareholders present.
Dividends
Shareholders vote on final dividend distributions at the shareholders’ meeting. Distributable profits are equal to:
The amount of distributable profits is based on our unconsolidated financial statements prepared in accordance with Spanish GAAP, which differ from the Consolidated Financial Statements prepared in
accordance with IFRS included elsewhere in this Annual Report.
The Board of Directors can approve interim dividend payments without a prior shareholder vote on the issue. However, under those circumstances, the dividend is limited to distributable net profits of the current year and is subject to certain legal requirements.
Unclaimed dividends revert to us five years from their date of payment.
Registration and transfers
Our shares are in registered book-entry form. Transfers executed through stock exchange systems are implemented pursuant to the stock exchange clearing and settlement procedures carried out by the Spanish clearing institution. Transfers executed outside of stock exchange systems, that is, over the counter, are implemented pursuant to the general legal regime for book-entry transfer, including registration by the Spanish clearing institution.
There are no restrictions with respect to the transfer of our shares.
• issuance of bonds;
• increase or reduction of share capital;
• any other amendment of our bylaws;
• merger, split or spin-off of Telefónica;
• withdrawal or restriction of the right of pre-emptive subscription to new shares, the transfer of the business as a going concern, the transformation of the company, or the removal of a registered office abroad.
• net profits for the year; plus
• profits carried forward from previous years; plus
• distributable reserves; minus
• losses carried forward from previous years; minus
• amounts allocated to reserves as required by law or by our bylaws.
113

Liquidation rights
Under Spanish law, upon our liquidation, the shareholders would be entitled to receive, on a pro rata basis, any assets remaining after the payment of our debts and taxes and liquidation expenses. C. Material Contracts Material Contracts Related to Our Investment in Telecom Italia
On April 28, 2007, we, together with a group of Italian investors (the “Italian Investors”), including Assicurazioni Generali S.p.A. (“Generali”), Sintonia S.A. (“Sintonia”), Intesa Sanpaolo S.p.A. (“Intesa Sanpaolo”) and Mediobanca S.p.A. (“Mediobanca”), entered into a co-investment agreement, (the “Co-Investment Agreement”), to establish the terms and conditions for our participation in what is now Telco. Through Telco, on October 23, 2007, we and the Italian Investors purchased the entire share capital of Olimpia S.p.A., or Olimpia, which held approximately 18% of the ordinary share capital of TelecomItalia. As of the date of this Annual Report, the Italian Investors hold a total of 53.8% of Telco’s share capital and we hold the remaining 46.2%.
In addition to Telco’s participation in Telecom Italia’s ordinary share capital through its interest in Olimpia, pursuant to the Co-Investment Agreement, on October 25, 2007, Generali and Mediobanca contributed to Telco ordinary shares of Telecom Italia they held on that date. These shares in the aggregate amounted to 5.6% of Telecom Italia’s ordinary share capital and brought Telco’s direct and indirect participation in Telecom Italia’s ordinary share capital to approximately 23.6%.
On April 28, 2007, the Italian Investors also entered into a shareholders’ agreement, (the “Shareholders’ Agreement”), which establishes, among other things, the principles of corporate governance of Telco and Olimpia, respectively, the principles related to the transfer of Telco’s shares and any Olimpia shares or Telecom Italia shares directly or indirectly owned by Telco and the principles of designation, among the parties, of candidates to be included in a common list for the appointment of directors of Telecom Italia pursuant to the voting list mechanism provided for by Telecom Italia’s by-laws.
On November 19, 2007, the parties to the Shareholders’ Agreement amended the Shareholders’ Agreement as well as the bylaws of Telco to include the specific limitations imposed by ANATEL as initially posted on its website on October 23, 2007 and subsequently published on November 5, 2007 as ANATEL’s “Ato” No. 68,276 dated October 31, 2007. We refer to such agreement as the Amendment to the Shareholders’ Agreement.
Pursuant to the Shareholders’ Agreement, we entered into an option agreement (the “Option Agreement”), with Telco on November 6, 2007, which provides that, in the event that a decision to dispose, directly or indirectly, in any form or manner (including through measures with equivalent effect, such as mergers and demergers of Telco or Olimpia) or encumber Telecom Italia shares or Olimpia shares or any rights attached thereto, including but not limited to voting rights, is taken by the board of directors of Telco by a simple majority resolution according to the procedure specifically provided for by the Shareholders’ Agreement and we are a dissenting party, then we will have the right, to be exercised within 30 days of such decision being taken, to buy from Telco the Telecom Italia shares or the Olimpia shares, as the case may be, at the same price and conditions offered by the third party offering to acquire such Telecom Italia shares or Olimpia shares.
On December 10, 2007, an agreement was reached to merge Olimpia into Telco, as a result of which Telco’s entire stake in the voting shares of Telecom Italia (23.6%) became a direct stake. In March 2008, Telco acquired 121.5 million additional shares of Telecom Italia, equivalent to 0.9% of its share capital, bringing its total direct interest to 24.5% of Telecom Italia voting shares.
On October 28, 2009, Sintonia requested, pursuant to the Shareholders Agreement, the non-proportional de-merger of Telco, with the withdrawal of its pro rata share of the assets and liabilities of Telco (comprised of Telecom Italia shares held by Telco representing approximately 2.1% of Telecom Italia’s share capital). The terms of Sintonia’s exit were approved on November 26, 2009, and the transaction closed on December 22, 2009. Upon Sintonia’s exit, Telco’s interest in Telecom Italia was reduced to 22.45% of Telecom Italia’s share capital. At the
114

same time, our stake in Telco increased from 42.3% to 46.2%, thereby allowing us to maintain our indirect interest in Telecom Italia at 10.5% of Telecom Italia’s voting rights (7.2% of the dividend rights).
On October 28, 2009, Telco investors, other than Sintonia, entered into an agreement (the “Renewal Agreement”), through which they agreed (i) not to request the non-proportional de-merger of Telco with the withdrawal of their corresponding share of Telecom Italia shares held by Telco at that time (as was previously done by Sintonia) and (ii) to extend and modify the Shareholders Agreement for an additional term of three years until April 27, 2013 (effective as of April 28, 2010) substantially on the same terms and conditions, except to provide (a) that the right of Telco’s investors to request the non-proportional de-merger of Telco will only be exercisable in the period between October 1, 2012 and October 28, 2012, and (b) for an early withdrawal right period exercisable between April 1, 2011 and April 28, 2011. On the same date and in connection with the Renewal Agreement, separately, we entered into an Amendment Deed to the Call Option Agreement with Telco (i) to extend the term of the Option Agreement to coincide with the expiration date of the Renewal Agreement and (ii) to exempt certain transactions regarding the Telecom Italia shares, namely those related to the exercise of de-merger and early withdrawal rights pursuant to the Renewal Agreement.
In line with the commitments assumed by Telco shareholders, on December 22, 2009, the rest of Telco’s financing needs with respect to debt maturities were met with a bridge loan granted by shareholders, including ourselves, Intesa Sanpaolo and Mediobanca for approximately €902 million, and a bank bridge loan granted by Intesa Sanpaolo and Mediobanca for the remaining €398 million.
On January 11, 2010, Telco arranged a €1,300 million loan with Intesa Sanpaolo, Mediobanca, Société Générale, S.p.A. and Unicredito, S.p.A., maturing on May 31, 2012, part of which is secured with the Telecom Italia shares held by Telco. The lending banks have granted Telco shareholders, including ourselves, a call option on the Telecom Italia shares that they may be entitled to receive as a result of the potential execution of the pledge.
The financing from the bridge loans described above was cancelled with the proceeds of a bond issuance subscribed by Telco’s shareholders, on a pro rata basis in accordance with their interests in Telco, on February 19, 2010 for an aggregate principal amount of €1,300 million. Our subscription amounted to an aggregate principal amount of €600 million.
On October 6, 2010, Telefónica, Intesa Sanpaolo, Mediobanca, and Generali (collectively, the “Existing Shareholders”), Telco, certain companies controlled by Telefónica, Telecom Italia and certain companies controlled by Telecom Italia entered into a “compromiso” (the “Compromiso”) in order to terminate certain administrative and judicial proceedings in Argentina related to the Telco investment in Telecom Italia. The Compromiso was required in order for the Argentine authorities to approve the Telco investment in Telecom Italia and it was accepted by the competent Argentine authorities on October 13, 2010. Pursuant to a deed of amendment dated December 10, 2010 (the “2010 Amendment Deed”), the Existing Shareholders implemented the Compromiso by inserting an additional clause into the Shareholders’ Agreement (with such amendments and integrations from time to time agreed, the “Prior Shareholders’ Agreement”) related to the governance of Telco and Telecom Italia with respect to the operations of Telecom Italia, Telefónica and their respective group companies which offer telecommunications, Internet, data, radio, media and substitute services in Argentina.
On February 29, 2012, the Existing Shareholders entered into a renewal agreement (the “Second Renewal Agreement”) in which the parties agreed to terminate, effective the date of the Second Renewal Agreement, the Prior Shareholders’ Agreement and enter into a new shareholders agreement for a period of three years on the same terms and conditions set out in the original Shareholders’ Agreement dated as of April 28, 2007 between the Existing Shareholders and Sintonia S.A., as subsequently amended and supplemented in 2007, 2009, 2010 and pursuant to the 2010 Amendment Agreement, subject to the amendments and integrations set forth therein (the “New Shareholders’ Agreement”). Further, on February 29, 2012, the call option granted to Telefónica to purchase shares of Telecom Italia held by Telco pursuant to the Prior Shareholders’ Agreement was extended to February 28, 2015 pursuant to an amendment deed to the Option Agreement (the “Telefónica Option Amendment Deed”) entered into between Telefónica and Telco.
115

In addition, on February 29, 2012, the Existing Shareholders undertook to take actions to ensure the refinancing of Telco’s financial indebtedness through appropriate financial instruments, contractual agreements and/or corporate transactions in proportion to their respective shareholdings of Telco. Material Contract Related to Our Investment in China Unicom
On September 6, 2009, Telefónica and China Unicom entered into a subscription agreement, or the Subscription Agreement, pursuant to which each party conditionally agreed to invest the equivalent of $1 billion in the other party through the acquisition of shares in the other party. Moreover, both parties entered into a strategic alliance agreement which provides for, among other areas for cooperation, joint procurement of infrastructure and client equipment, common development of mobile service platforms, joint provisions of service to multinational customers, roaming, research and development, sharing of best practices and technical, operational and management know-how, joint development of strategic initiatives in the area of network evolution, joint participation in international alliances and exchanges of senior management.
On October 21, 2009, the mutual share exchange pursuant to the Subscription Agreement was implemented through the subscription by Telefónica Internacional of 693,912,264 newly issued shares of China Unicom and a contribution in kind to China Unicom of 40,730,735 shares of Telefónica.
Following the completion of the transaction, we increased our share of China Unicom’s voting share capital from 5.38% to 8.06% and obtained the right to appoint a member to its board of directors, while China Unicom became owner of approximately 0.87% of our voting share capital at that date. Subsequently, after a capital reduction carried out by China Unicom, we reached a shareholding equivalent to 8.37% of the company’s voting share capital.
Under the Subscription Agreement, we agreed with China Unicom that for a period of one year from completion of the acquisition of the mutual share exchange, we shall not, directly or indirectly, sell, transfer or dispose of any of the China Unicom shares held, directly or indirectly, by us or any of our subsidiaries (save for the transfer of such shares to any member of the Telefónica group). China Unicom has made an analogous undertaking with respect to its participation in our share capital.
In addition, subject to Telefónica or any of its subsidiaries holding in aggregate, directly or indirectly, not less than 5% of the issued share capital of China Unicom from time to time and to the extent not prohibited under applicable law, the articles of association of China Unicom and the Hong Kong Listing Rules, we shall be entitled to nominate one representative to the Board of Directors of China Unicom.
Finally, with effect from completion, and for so long as the strategic alliance agreement is in effect, China Unicom shall not (i) offer, issue or sell any significant number of its ordinary shares (including those held in treasury by the company itself, if any), or any securities convertible into or other rights to subscribe for or purchase a significant number of China Unicom’s ordinary shares (including those held in treasury by the company itself, if any), to any of our current major competitors or (ii) make any significant investment, directly or indirectly, in any of our current major competitors. We have made similar undertakings.
The strategic alliance agreement between the parties terminates on the third anniversary and automatically renews thereafter for one year terms, subject to either party’s right to terminate on six month’s notice. Also, the strategic alliance agreement may be terminated by China Unicom if we sell our shares in China Unicom causing us to own less than 5% of the issued share capital of China Unicom or by us if China Unicom sells our shares and ceases to own at least 0.5% of our issued share capital. In addition, the strategic alliance agreement is subject to termination in the event either party is in default and automatically terminates on a change in control of China Unicom.
On January 23, 2011, Telefónica and China Unicom entered into an extension to their already existing strategic alliance agreement (the “Enhanced Strategic Alliance Agreement”) in which both companies agreed to strengthen and deepen their strategic cooperation in certain business areas and through which, upon the terms and conditions set out thereof, each party agreed to invest the equivalent of $500 million in ordinary shares of the other party toward the alliance. Furthermore, we have agreed to propose the appointment of a director nominated by China Unicom. Following completion of the transaction, we will own approximately a 9.6% of China Unicom’s voting share capital.
116

Pursuant to the Enhanced Strategic Alliance Agreement and as of the date of this Annual Report, Telefónica, through its wholly-owned subsidiary, Telefónica Internacional, has acquired 282,063,000 ordinary shares of China Unicom through several transactions executed in the period between January 25, 2011 and September 7, 2011, investing an aggregate amount equivalent to approximately 500 million U.S. dollars (equivalent to €358 million).
Additionally, on January 28, 2011, China Unicom acquired 21,827,499 Telefónica shares at the agreed price of €17.16 per share, giving it ownership of 1.37% of the Company’s capital (the arithmetic average of the closing price of Telefónica shares as quoted on the Madrid Stock Exchange for the thirty consecutive trading days ending on January 14, 2011), which represents a total price of $500 million. In recognition of China Unicom’s stake in Telefónica, the Company nominated Mr. Chang Xiaobing, who was designated by China Unicom, to the Board of Directors at the General Shareholders’ Meeting held on May 18, 2011.
At December 31, 2011 Telefónica’s shareholding in China Unicom amounted to 9.6% of its capital stock.
Since their strategic alliance agreement signed in September 2009, Telefónica and China Unicom have made significant progress in various areas of cooperation. In this respect, we believe that this new agreement will enhance this alliance and deepen cooperation between the two companies in the areas of procurement, mobile service platforms, service to MNCs, wholesale carriers, roaming technology/R&D, international business development, cooperation and sharing of best practices. Material Contract related to the acquisition of Vivo (PT)
On July 28, 2010, we signed an agreement with Portugal Telecom for the acquisition by Telefónica of the 50% of the capital stock of Brasilcel owned by Portugal Telecom. Brasilcel owned approximately 60% of the total share capital of Vivo Participaceos, S.A. The acquisition price of such capital stock was €7,500 million, €4,500 million of which was paid at the closing of the transaction on September 27, 2010, €1,000 million of which was paid on December 30, 2010, and the remaining €2,000 million of which was paid on October 31, 2011. Upon closing of the transaction, the respective subscription and shareholders agreements entered into by Telefónica and Portugal Telecom in 2002 relating to their joint venture in Brazil were terminated. D. Exchange Controls Exchange Controls and Other Limitations Affecting Security Holders
Ownership limitations
There are no limitations with respect to the ownership of our assets or share capital except those derived from the application of the reciprocity principle as described above.
Trading by us in our own shares or shares of companies under our control
Consistent with applicable Spanish laws and regulations and the authorization of our shareholders, from time to time we or our affiliates engage in transactions involving securities of members of our Group. These transactions may include purchases of shares of group members, forward contracts with respect to these shares and other similar transactions.
At December 31, 2011, we held 84,209,364 shares of treasury stock, representing 1.84508 % of our capital stock. At December 31, 2010, we held 55,204,942 shares of treasury stock, representing 1.20957% of our capital stock. As a part of our shareholders’ remuneration policy, we have implemented various share buyback programs since 2003. For further description about our shareholders’ return, see “Item 8. Financial Information—Dividend Information and Share Buyback Programs.”
The Spanish Corporations Law prohibits the purchase by us and our subsidiaries of shares in the secondary market except in the following limited circumstances:
• the purchase of shares must be authorized by a general meeting of our shareholders and, in the case of a purchase of shares by a subsidiary, also by a general meeting of shareholders of the subsidiary;
117

Any acquisition of our shares exceeding, or that causes us and our subsidiaries’ holdings to exceed, 1% of our voting rights must be reported to the CNMV.
At our annual general shareholders meeting held on June 2, 2010, our shareholders extended their prior authorization to the Board of Directors to acquire our shares for an additional 5 years from the date of
such meeting. The authorization also applies to companies under our control. Pursuant to the authorization, the aggregate nominal value of our shares held by us or any of our subsidiaries cannot exceed the limit established by applicable laws (which is, as of the date of this Annual Report, 10% of our outstanding capital).
Other restrictions on acquisitions of shares
A person or group of persons that directly or indirectly exercises beneficial ownership or control of 3% or more of the voting rights, or which increases or decreases the number of shares which it owns or controls to an amount which equals or exceeds 3% 5%, 10%, 15%, 20%, 25%, 30%, 35%, 40%, 45%, 50%, 60%, 70%, 75%, 80% and 90% of such voting rights, must inform us and the CNMV of such ownership.
A person or group of persons that fails to inform any of the above entities after reaching any of the indicated thresholds may incur fines and penalties. A person or group that is a member of our Board of Directors or a member of our Executive Commission must report any acquisition or transfer of our capital stock, regardless of the amount of shares acquired or transferred.
For reporting requirements concerning acquisitions by us or our affiliates of our shares, see “—Trading by us in our own shares or shares of companies under our control” above. Dividend and Liquidation Rights
According to Spanish law and our bylaws, dividends may only be paid out of profits or distributable reserves if the value of our net worth is not, and as a result of such distribution would not be, less than our capital stock. Pursuant to Spanish law, we are required to reserve 10% of our fiscal year net income until the amount in our legal reserve reaches 20% of our capital. Our legal reserve is currently at 20%.
Dividends payable by us to non-residents of Spain ordinarily are subject to a Spanish withholding tax. For the tax implications of dividends, see “—Taxation.”
Upon our liquidation, our shareholders would be entitled to receive pro rata any assets remaining after the payment of our debts and taxes and expenses of such liquidation. Any change in the rights of shareholders to receive dividends and payment upon liquidation would require an amendment to our bylaws by resolution adopted by a general meeting of shareholders. If there were more than one class of shares, such amendment would also require the approval of each class of shareholders affected by the amendment. Preemptive Rights and Increases of Share Capital
Pursuant to the Spanish Corporations Law, shareholders have preemptive rights to subscribe for any new shares and for bonds convertible into shares. Such rights may not be available under special circumstances if waived by a resolution passed at a general meeting of shareholders in accordance with Article 308 of the Spanish Corporations Law, or the Board of Directors, if authorized (Article 506 of the Spanish Corporation Law). Further, such rights, in any event, will not be available in the event of an increase in capital to meet the requirements of a convertible bond issue or a merger in which shares are issued as consideration. Such rights:
• the shares so purchased have no economic or voting rights while held by us and have no voting rights while held by our subsidiaries;
• the purchaser must create reserves equal to the purchase price of any shares that are purchased and, if a subsidiary is the acquirer, the reserve must also be recorded by the parent company; and
• the total number of shares held by us and our subsidiaries may not exceed 10% of our total capital.
118

Absent an exemption from registration, shares issuable upon exercise of rights must be registered under the Securities Act of 1933 in order to be offered to holders of ADRs. If we decided not to register the
shares, the rights would not be distributed to holders of ADRs. Pursuant to the Deposit Agreement, however, holders of ADRs are entitled to receive their proportionate share of the proceeds, if any, from sale by the Depositary of any rights accruing to holders of ADRs. E. Taxation
The following is a general summary of the material Spanish and U.S. federal income tax consequences to U.S. Holders (as defined below) of the ownership and disposition of shares or ADSs. This summary is based upon Spanish and U.S. tax laws (including the U.S. Internal Revenue Code of 1986, as amended (the “Code”), final, temporary and proposed Treasury regulations, rulings, judicial decisions and administrative pronouncements), and the Convention Between the United States of America and the Kingdom of Spain for the Avoidance of Double Taxation and the Prevention of Fiscal Evasion with Respect to Taxes on Income, signed February 22, 1990, (the “Treaty”), all as of the date hereof and all of which are subject to change or changes in interpretation, possibly with retroactive effect. In addition, the summary is based in part on representations of the Depositary and assumes that each obligation provided for in or otherwise contemplated by the Deposit Agreement or any other related agreements will be performed in accordance with its terms.
As used herein, the term “U.S. Holder” means a beneficial owner of one or more shares or ADSs:
(a) that is, for U.S. federal income tax purposes, one of the following:
i. a citizen or resident of the United States,
ii. a corporation (or other entity taxable as a corporation) created or organized in or under the laws of the United States or any political subdivision thereof, or
iii. an estate or trust the income of which is subject to U.S. federal income taxation regardless of its source;
(b) who is entitled to the benefits of the Treaty;
(c) who holds the shares or ADSs as capital assets for U.S. federal income tax purposes;
(d) who owns, directly, indirectly or by attribution, less than 10% of the share capital or voting stock of Telefónica; and
(e) whose holding is not attributable to a fixed base or permanent establishment in Spain.
This summary does not address all of the tax considerations that may apply to holders that are subject to special tax rules, such as U.S. expatriates, insurance companies, tax-exempt organizations, certain financial institutions, persons subject to the alternative minimum tax, dealers and certain traders in securities, persons holding shares or ADSs as part of a straddle, hedging, conversion or integrated transaction, persons who acquired their shares or ADSs pursuant to the exercise of employee stock options or otherwise as compensation, partnerships or other entities classified as partnerships for U.S. federal income tax purposes or persons whose functional currency is not the U.S. dollar. Such holders may be subject to U.S. federal income tax consequences different from those set forth below.
If a partnership holds shares or ADSs, the tax treatment of a partner generally will depend upon the status of the partner and the activities of the partnership. A partner in a partnership that holds shares or ADSs is urged to consult its own tax advisor regarding the specific tax consequences of owning and disposing of the shares or ADSs.
• are transferable;
• may be traded on the Automated Quotation System; and
• may be of value to existing shareholders because new shares may be offered for subscription at prices lower than prevailing market prices.
119

For purposes of the Treaty and U.S. federal income tax, U.S. Holders of ADSs will generally be treated as owners of the underlying shares represented by such ADSs. Accordingly, no gain or loss will be recognized if a U.S. Holder exchanges ADSs for the underlying shares represented by those ADSs.
The U.S. Treasury has expressed concerns that parties to whom American depositary receipts are released before shares are delivered to the depositary, or intermediaries in the chain of ownership between holders and the issuer of the security underlying the American depositary receipts, may be taking actions that are inconsistent with the claiming of foreign tax credits by U.S. holders of American depositary receipts. Such actions would also be inconsistent with the claiming of the reduced rate of tax applicable to dividends received by certain non-corporate U.S. Holders. Accordingly, the availability of foreign tax credits to U.S. Holders of ADSs and the reduced tax rate for dividends received by certain non-corporate U.S. Holders of ADSs, each as described below, could be affected by actions taken by such parties or intermediaries.
This discussion assumes that Telefónica is not, and will not become, a passive foreign investment company (“PFIC”), as discussed below under “—U.S. Federal Income Tax Considerations—Passive foreign investment company rules.”
U.S. Holders of shares or ADSs should consult their own tax advisors concerning the specific Spanish and U.S. federal, state and local tax consequences of the ownership and disposition of shares or ADSs in light of their particular situations as well as any consequences arising under the laws of any other taxing jurisdiction. In particular, U.S. Holders are urged to consult their own tax advisors concerning their eligibility for benefits under the Treaty. Spanish Tax Considerations
Taxation of dividends
Under Spanish law, dividends paid by Telefónica to U.S. Holders of ordinary shares or ADSs are subject to Spanish Non-Resident Income Tax, withheld at source, as of January 1, 2012, at a rate of 21%. For these purposes, upon distribution of the dividend, Telefónica or its paying agent will withhold an amount equal to the tax due according to the rules set forth above (i.e., applying the general withholding tax rate of 21%).
However, under the Treaty, if you are a U.S. Holder, you are entitled to a reduced withholding tax rate of 15%.
To benefit from the Treaty-reduced rate of 15%, you must provide to Telefónica through its paying agent in Spain, before the tenth day following the end of the month in which the dividends were payable, a certificate from the U.S. Internal Revenue Service (“IRS”) stating that, to the best knowledge of the IRS, such U.S. Holders are residents of the United States within the meaning of the Treaty and entitled to its benefits.
If the certificate referred to in the above paragraph is not provided within said term, you may afterwards obtain a refund of the amount withheld in excess of the rate provided for in the Treaty.
Spanish Refund Procedure
According to Spanish Regulations on Non-Resident Income Tax, approved by Royal Decree 1776/2004 dated July 30, 2004, as amended, a refund for the amount withheld in excess of the Treaty-reduced rate can be obtained from the relevant Spanish tax authorities. To pursue the refund claim, if you are a U.S. Holder, you are required to file:
The refund claim must be filed within four years from the date in which the withheld tax was collected by the Spanish tax authorities.
• the corresponding Spanish tax form;
• the certificate referred to in the preceding section, and
• evidence of the Spanish Non-Resident Income Tax that was withheld with respect to you.
120

U.S. Holders are urged to consult their own tax advisors regarding refund procedures and any U.S. tax implications thereof.
Additionally, under Spanish law, the first €1,500 of dividends obtained by individuals who are not resident in Spain for tax purposes, and do not operate through a permanent establishment in Spain, will be exempt from taxation in certain circumstances. U.S. Holders should consult their tax advisors to determine whether this exemption is available.
Taxation of capital gains
As of January 1, 2012, the rate applicable to capital gains of non-residents of Spain who are not entitled to the benefit of any applicable treaty for the avoidance of double taxation and who do not operate through a fixed base or a permanent establishment in Spain is 21% under Spanish law.
Under the Treaty, capital gains realized by U.S. Holders arising from the disposition of shares or ADSs will not be taxed in Spain, provided that the seller has not maintained a direct or indirect holding of 25% or more in our capital during the 12 months preceding the disposition of the shares or ADSs. U.S. Holders will be required to establish that they are entitled to the exemption from tax under the Treaty by providing to the relevant Spanish tax authorities a certificate of residence issued by the IRS stating that to the best knowledge of the IRS, such U.S. Holder is a U.S. resident within the meaning of the Treaty.
Spanish wealth tax
Individual U.S. Holders who hold shares or ADSs located in Spain are subject to the Spanish Wealth Tax (Impuesto sobre el Patrimonio) (Spanish Law 19/1991), which imposes tax on property located in Spain on the last day of any year.
Inheritance and gift tax
Transfers of shares or ADSs on death and by gift to individuals are subject to Spanish inheritance and gift taxes (Impuesto sobre Sucesiones y Donaciones), respectively, if the transferee is a resident of Spain for tax purposes, or if the shares or ADSs are located in Spain at the time of death, regardless of the residence of the heir or beneficiary. The state applicable tax rate, after applying relevant personal, family and wealth factors, generally ranges between 7.65% and 81.6% for individuals. Notwithstanding the above, certain autonomous communities have used their right to establish their own tax rates and deductions and to control the management and settlement of such taxes.
Gifts granted to corporations non-resident in Spain are subject to Spanish Non-Resident Income Tax at a 21% tax rate on the fair market value of the shares as a capital gain. If the donee is a United States resident corporation, the exclusions available under the Treaty described in the section “—Taxation of Capital Gains” above will be applicable.
Expenses of Transfer
Transfers of shares or ADSs will be exempt from any transfer tax (Impuesto sobre Transmisiones Patrimoniales) or value added tax. Additionally, no stamp tax will be levied on such transfers. U.S. Federal Income Tax Considerations
Taxation of dividends
Distributions received by a U.S. Holder on shares or ADSs, including the amount of any Spanish taxes withheld, other than certain pro rata distributions of shares to all shareholders (including ADS holders), will constitute foreign source dividend income to the extent paid out of Telefónica’s current or accumulated earnings and profits (as determined for U.S. federal income tax purposes). Because Telefónica does not maintain calculations of its earnings and profits under U.S. federal income tax principles, it is expected that distributions generally will be reported to U.S. Holders as dividends. The amount of dividend income paid in euros that a U.S. Holder will be required to include in income will equal the U.S. dollar value of the distributed euros, calculated by reference to the exchange rate in effect
121

on the date the payment is received by the Depositary (in the case of ADSs) or by the U.S. Holder (in the case of shares), regardless of whether the payment is converted into U.S. dollars on the date of receipt. If the dividend is converted to U.S. dollars on the date of receipt, a U.S. Holder will generally not be required to recognize foreign currency gain or loss in respect of the dividend income. A U.S. Holder may have foreign currency gain or loss if the dividend is converted into U.S. dollars after the date of its receipt. Gain or loss that a U.S. Holder realizes on a sale or other disposition of euros will be U.S.-source ordinary income or loss. Corporate U.S. Holders will not be entitled to claim the dividends-received deduction with respect to dividends paid by Telefónica. Subject to applicable limitations and the discussion above regarding concerns expressed by the U.S. Treasury, dividends received by certain non-corporate U.S. Holders in taxable years beginning before January 1, 2013 will be taxable at a maximum rate of 15%. Non-corporate U.S. Holders should consult their own tax advisors to determine whether they are subject to any special rules that limit their ability to be taxed at this favorable rate.
Spanish income taxes withheld from dividends on shares or ADSs at a rate not exceeding the rate provided in the Treaty will be creditable against a U.S. Holder’s U.S. federal income tax liability, subject to applicable restrictions and limitations that may vary depending upon the U.S. Holder’s circumstances and the discussion above regarding concerns expressed by the U.S. Treasury. Spanish taxes withheld in excess of the rate applicable under the Treaty will not be eligible for credit against a U.S. Holder’s federal income tax liability. See “Spanish Tax Considerations—Taxation of dividends” above for a discussion of how to obtain the applicable treaty rate. Instead of claiming a credit, a U.S. Holder may elect to deduct foreign taxes (including the Spanish taxes) in computing its taxable income, subject to generally applicable limitations. An election to deduct foreign taxes (instead of claiming foreign tax credits) applies to all taxes paid or accrued in the taxable year to foreign countries and possessions of the United States. The limitations on foreign taxes eligible for credit are calculated separately with respect to specific classes of income. The rules governing foreign tax credits are complex. Therefore, U.S. Holders should consult their own tax advisors regarding the availability of foreign tax credits in their particular circumstances.
Taxation upon sale or other disposition of shares or ADSs
A U.S. Holder will generally recognize U.S. source capital gain or loss on the sale or other disposition of shares or ADSs. Any such gain or loss will be long-term capital gain or loss if the U.S. Holder has held such shares or ADSs for more than one year. The amount of the U.S. Holder’s gain or loss will be equal to the difference between such U.S. Holder’s tax basis in the shares or ADSs sold or otherwise disposed of and the amount realized on the sale or other disposition, as determined in U.S. dollars.
As discussed under “Spanish Tax Considerations—Taxation of capital gains” above, gain realized by a U.S. Holder on the sale or other disposition of shares or ADSs will be exempt from Spanish tax on capital gains under the Treaty. If a U.S. Holder is eligible for the exemption from Spanish tax on capital gains but does not follow appropriate procedures for obtaining the exemption, such holder will not be entitled to credit the amount of Spanish tax on capital gains paid against its U.S. federal income tax liability. U.S. Holders should consult their own tax advisors regarding the potential Spanish tax consequences of a sale or other disposition of shares or ADSs and the procedures available for an exemption from such tax.
Passive foreign investment company rules
Telefónica believes that it was not a PFIC for U.S. federal income tax purposes for its 2011 taxable year. However, because PFIC status depends upon the composition of a company’s income and assets and the market value of its assets (including, among others, less than 25% owned equity investments) from time to time, there can be no assurance that Telefónica will not be considered a PFIC for any taxable year. If Telefónica were treated as a PFIC for any taxable year during which a U.S. Holder held a share or ADS, certain adverse tax consequences could apply to the U.S. Holder.
If Telefónica were treated as a PFIC for any taxable year during which a U.S. Holder held a share or ADS, gain recognized by a U.S. Holder on a sale or other disposition of such share or ADS would be allocated ratably over the U.S. Holder’s holding period for the share or ADS. The amounts allocated to the taxable year of the sale or other disposition and to any year before Telefónica became a PFIC would be taxed as ordinary income. The amount allocated to each other taxable year would be subject to tax at the highest rate in effect for individuals or corporations, as appropriate, and an interest charge would be imposed on the resulting tax liability. The same treatment would
122

apply to any distribution in respect of shares or ADSs to the extent it exceeds 125% of the average of the annual distributions on shares or ADSs received by the U.S. Holder during the preceding three years or the U.S. Holder’s holding period, whichever is shorter. Certain elections may be available that would result in alternative treatments (such as mark-to-market treatment) of the shares or ADSs.
In addition, if Telefónica were treated as a PFIC in a taxable year in which it pays a dividend or in the prior taxable year, the favorable dividend rate discussed above with respect to dividends paid to certain non-corporate U.S. Holders would not apply.
If we were a PFIC for any taxable year during which a U.S. Holder held shares or ADSs, such U.S. Holder may be required to file a report containing such information as the U.S. Treasury may require.
Information reporting and backup withholding
Payments of dividends and sales proceeds that are made within the United States or through certain U.S.-related financial intermediaries generally are subject to information reporting and backup withholdingunless the U.S. Holder is an exempt recipient or, in the case of backup withholding, the U.S. Holder provides a correct taxpayer identification number and certifies that it is not subject to backup withholding. The amount of any backup withholding from a payment to a U.S. Holder will be allowed as a credit against the U.S. Holder’s U.S. federal income tax liability and may entitle such U.S. Holder to a refund, provided that the required information is timely furnished to the IRS.
Certain U.S. Holders who are individuals or are controlled by individuals, may be required to report information relating to stock of a non-U.S. person, subject to certain exceptions (including an exception for stock held through a U.S. financial institution). U.S. Holders are urged to consult their tax advisers regarding the effect, if any, of this legislation on their ownership and disposition of shares or ADSs. F. Dividends and Paying Agents
Not Applicable. G. Statements by Experts
Not Applicable. H. Documents on Display Where You Can Find More Information
We file Annual Reports on Form 20-F and furnish periodic reports on Form 6-K to the SEC. You may read and copy any of these reports at the SEC’s public reference room in Washington, D.C. Please call the SEC at 1-800-SEC-0330 for further information on the public reference rooms. Our SEC filings are also available to the public from commercial document retrieval services. Some of our SEC filings are also available at the website maintained by the SEC at “http://www.sec.gov.”
Our ADSs are listed on the New York Stock Exchange under the symbol “TEF.” You may inspect any periodic reports and other information filed with or furnished to the SEC by us at the offices of the New York Stock Exchange, 20 Broad Street, New York, New York 10005.
As a foreign private issuer, we are exempt from the rules under the Exchange Act which prescribe the furnishing and content of proxy statements, and our officers, directors and principal shareholders are exempt from the reporting and “short-swing” profit recovery provisions contained in Section 16 of the Exchange Act.
We are subject to the informational requirements of the Spanish securities commission and the Spanish stock exchanges, and we file reports and other information relating to our business, financial condition and other matters with the Spanish securities commission and the Spanish stock exchanges. You may read such reports, statements and other information, including the annual and biannual financial statements, at the public reference facilities maintained
123

in Madrid and Barcelona. Some of our Spanish securities commission filings are also available at the website maintained by the Spanish securities commission at http://www.cnmv.es.
We have appointed Citibank, N.A. to act as Depositary for the Telefónica ADSs. Citibank will, as provided in the Deposit Agreement, arrange for the mailing of summaries in English of such reports and communications to all record holders of the ADSs of Telefónica. Any record holder of Telefónica ADSs may read such reports and communications or summaries thereof at Citibank’s office located at 388 Greenwich Street, 14th Floor, New York, New York 10013. I. Subsidiary Information
Not applicable. Item 11. Quantitative and Qualitative Disclosures About Market Risk
We are exposed to various financial market risks as a result of: (i) our ordinary business activity, (ii) debt incurred to finance our business, (iii) our investments in companies, and (iv) other financial instruments related to the above commitments.
The main market risks affecting us are as follows:
We are also exposed to liquidity risk if a mismatch arises between our financing needs (including operating and financial expense, investment, debt redemptions and dividend commitments) and our sources
of finance (including revenues, divestments, credit lines from financial institutions and capital market transactions). The cost of financing could also be affected by movements in credit spreads (over benchmark rates) demanded by lenders.
Finally, we are exposed to “country risk” (which overlaps with market and liquidity risks). This refers to the possible decline in the value of assets, cash flows generated or cash flows returned to the parent company as a result of political, economic or social instability in the countries where we operate, especially in Latin America.
We seek to actively manage these risks through the use of derivatives (primarily on exchange rates, interest rates and share prices) and by incurring debt in local currencies, where appropriate, with a view to stabilizing cash flows, our income statement and, to a lesser extent, part of the value of our investments. In this way, we attempt to protect our solvency, facilitate financial planning and take advantage of investment opportunities.
We manage our exchange rate risk and interest rate risk in terms of net debt and net financial debt as calculated by us. We believe that these parameters are more appropriate to understanding our debt position. Net debt and net financial debt take into account the impact of our cash balance and cash equivalents including derivatives positions
a) Exchange rate risk
Exchange rate risk arises primarily from (i) our international presence, through our investments and businesses in countries that use currencies other than the euro (primarily in Latin America, but also in the United Kingdom and the Czech Republic), and (ii) debt denominated in currencies other than that of the country where the business is conducted or the home country of the company incurring such debt.
b) Interest rate risk
Interest rate risk arises primarily from changes in interest rates affecting (i) financial expenses on floating rate debt (or short-term debt likely to be renewed), due to changes in interest rates and (ii) the value of long-term liabilities at fixed interest rates.
c) Share price risk
Share price risk arises primarily from changes in the value of our equity investments that may be bought, sold or otherwise involved in transactions, from changes in the value of derivatives associated with such investments, from changes in the value of our treasury shares and from equity derivatives.
124

with a positive value linked to liabilities. Neither net debt nor net financial debt as calculated by us should be considered an alternative to gross financial debt (the sum of current and non-current interest-bearing debt) as a measure of our liquidity. For a more detailed description on reconciliation of net debt and net financial debt to gross financial debt, see “Item 5. Operating and Financial Review and Prospects—Presentation of Financial Information—Non-GAAP financial information—Net financial debt and net debt.”
For a more detailed description on quantitative and qualitative disclosures about market risks see Note 16 to our Consolidated Financial Statements. Item 12. Description of Securities Other Than Equity Securities D. American Depositary Shares
The Depositary of our ADR program is Citibank, N.A., and the address of its principal executive office is 388 Greenwich Street, 14th Floor, New York, New York 10013.
Our ADSs are listed on the New York Stock Exchange under the symbol “TEF.”
Until January 21, 2011, each ADS represented the right to receive three ordinary shares of capital stock of €1.00 nominal value each, of Telefónica, S.A. Citibank, in its capacity as Depositary, effected a ratio change on the Telefónica, S.A.’s ADR program so that each ADS now represents the right to receive one ordinary share. The effective date of the ratio change was January 21, 2011. The Depositary issues ADSs in form of certificated ADSs (American Depositary Receipts, or ADRs) or uncertificated ADSs pursuant to the Deposit Agreement.
Under the terms of the Deposit Agreement, as of the date of this Annual Report, an ADS holder may have to pay the following services fees to the Depositary.
Category
Depositary Actions
Associated Fee / By Whom Paid
(a) Depositing or substituting the underlying shares Issuance of ADSs upon the deposit of shares Up to U.S.$5.00 for each 100 ADSs (or portion thereof) evidenced by the new ADSs delivered (charged to person depositing the shares or receiving the ADSs)(1)
(b) Receiving or distributing dividends Distribution of cash dividends or other cash distributions; distribution of share dividends or other free share distributions; distribution of securities other than ADSs or rights to purchase additional ADSs
Up to U.S.$5.00 for each 100 ADSs (or portion thereof) held (in the case of cash distributions, deducted from the relevant distribution; in the case of all other distributions, billed to the relevant holder)(2)
(c) Selling or exercising rights Distribution or sale of securities Up to U.S.$5.00 for each 100 ADSs (or portion thereof) held (billed to the relevant holder)
(d) Withdrawing an underlying security Acceptance of ADSs surrendered for withdrawal of deposited securities Up to U.S.$5.00 for each 100 ADSs (or portion thereof) evidenced by the ADSs surrendered (charged to person surrendering or to person to whom withdrawn securities are being delivered)(1)
(e) Transferring, splitting or grouping receipts Transfers Up to U.S.$1.50 per ADS so presented (charged to person presenting certificate for transfer)
125

The Depositary has agreed to reimburse or pay on behalf of Telefónica, S.A, certain reasonable expenses related to our ADS program and incurred by us in connection with the program (such as NYSE
listing fees, legal and accounting fees incurred with preparation of Form 20-F and ongoing SEC compliance and listing requirements, distribution of proxy materials, investor relations expenses, etc). The Depositary has covered all such expenses incurred by us during 2011 for an amount of $5.9 million. The amounts the Depositary reimbursed or paid are not perforce related to the fees collected by the depositary from ADS holders.
As part of its service to us, the Depositary has agreed to waive certain expenses for the standard costs associated with the administration of our ADS program for the year ended December 31, 2011.
(f) General depositary services, particularly those charged on an annual basis
Other services performed by the Depositary in administering the ADSs Up to U.S.$5.00 for each 100 ADSs (or portion thereof) held on the applicable record date (billed to person holding ADSs on applicable record date established by the Depositary)(2)
(g) Expenses of the Depositary Certain fees and expenses incurred by the depositary bank and certain taxes and governmental charges in connection with:
• compliance with foreign exchange control regulations or any law or regulation relating to foreign investment;
• the Depositary or its custodian’s compliance with applicable law,
rule or regulation; • stock transfer or other taxes and other governmental charges; • cable, telex, facsimile transmission/delivery; • expenses of the Depositary in connection with the conversion of
foreign currency into U.S. dollars (which are paid out of such foreign currency);
• any other charge payable by Depositary or its agents.
Expenses payable at the sole discretion of the Depositary (billed or deducted from cash distributions to person holding ADSs on applicable record date established by the Depositary)
(1) In the case of ADSs issued by the Depositary into The Depository Trust Company (“DTC”) or presented to the Depositary via DTC, the ADS issuance and cancellation fees will be payable to the Depositary by DTC Participant(s) receiving the ADSs from the Depositary or the DTC Participant(s) surrendering the ADSs to the Depositary for cancellation, as the case may be, on behalf of the beneficial owner(s) and will be charged by the DTC Participant(s) to the account(s) of the applicable beneficial owner(s) in accordance with the procedures and practices of the DTC participant(s) as in effect at the time.
(2) For ADSs held through DTC, the Depositary fees for distributions other than cash and the Depositary service fee are charged by the Depositary to the DTC Participants in accordance with the procedures and practices prescribed by DTC from time to time and the DTC Participants in turn charge the amount of such fees to the beneficial owners for whom they hold ADSs.
126

Part II Item 13. Defaults, Dividend Arrearages and Delinquencies
None. Item 14. Material Modifications to the Rights of Security Holders and Use of Proceeds
Not applicable. Item 15. Controls and Procedures Disclosure Controls and Procedures
Our Chief Executive Officer and our Chief Financial Officer, after evaluating the effectiveness of our disclosure controls and procedures (as defined in Rule 13a-15(e) under the Securities Exchange Act of 1934) as of the end of the period covered by this Form 20-F, have concluded that, as of such date, our disclosure controls and procedures were effective. Management’s Annual Report on Internal Control over Financial Reporting
The management of Telefónica is responsible for establishing and maintaining adequate internal control over financial reporting as defined in Rule 13a–15(f) under the Securities Exchange Act of 1934. Telefónica’s internal control system is designed to provide reasonable assurance as to the reliability of financial reporting and the preparation of the published financial statements under generally accepted accounting principles.
Any internal control system, no matter how well designed, has inherent limitations, including the possibility of human error and the circumvention or overriding of the controls and procedures, which may not prevent or detect misstatements.
Telefónica management assessed the effectiveness of Telefónica’s internal control over financial reporting as of December 31, 2011. In making this assessment, it used the criteria set forth by the Committee of Sponsoring Organizations of the Treadway Commission (COSO) in Internal Control – Integrated Framework. Based on its assessment and those criteria, Telefónica management believes that at December 31, 2011, Telefónica’s internal control over financial reporting is effective. Report of the Independent Registered Public Accounting Firm
Telefónica’s independent registered public accounting firm, Ernst & Young, S.L., has issued a report on the effectiveness of the company’s internal control over financial reporting. The report is included on page F-1.1. Changes in Internal Control Over Financial Reporting
There were no changes in our internal control over financial reporting during the period covered by this Annual Report that have materially affected, or are reasonably likely to materially affect, our internal control over financial reporting. Item 16. [Reserved] Item 16A. Audit Committee Financial Expert
Our Board of Directors has determined that Mr. Antonio Massanell Lavilla meets the requirements of an “audit committee financial expert” as such term is defined by the SEC.
127

Item 16B. Code of Ethics
In December 2006, we adopted a code of business conduct and ethics, the Telefónica Business Principles, which apply to all Telefónica Group employees. In March 2008, we decided to modify such Business Principles in order to gather in them all components of the code of ethics definition in Section 406 of Sarbanes-Oxley Act, and consequently our code of ethics for senior officers was replaced by the Telefónica Business Principles. These Principles were further modified on October 8, 2010 in order to include a new principle of privacy and data protection. A copy of the Telefónica Business Principles is filed as an Exhibit to this Annual Report. For more information, please see “Item 16G. Corporate Governance—Code of Ethics.” Item 16C. Principal Accountant Fees and Services
Please see Note 21(d) to our Consolidated Financial Statements. The Audit and Control Committee’s Pre-Approval Policies and Procedures
The engagement of any service rendered by our external auditor or any of its affiliates must always have the prior approval of our Audit and Control Committee. Such Committee has developed a Pre-approval Policy regarding the engagement of professional services by our external auditor, in accordance with the Spanish Audit Law and the Sarbanes-Oxley Act. This Policy establishes the obligation to obtain prior approval from our Audit and Control Committee for any service to be rendered by our external auditor to Telefónica or any of its subsidiaries.
This Policy sets forth restrictions on engaging our external auditor for the performance of non-audit services, according to which the engagement of our external auditor for the provision of such services is only permitted when there is no other firm available to provide the needed services at a comparable cost and with a similar level of quality. Moreover, this Policy prohibits the engagement of our external auditor for the provision of certain type of services that would be considered as “prohibited services.”
In addition, the Audit and Control Committee oversees the total amount of fees paid to our external auditor for the provision of non-audit services in order to assure that such fees do not exceed a certain percentage of the total amount of fees paid for the provision of audit services. Item 16D. Exemptions from the Listing Standards for Audit Committees
Not applicable. Item 16E. Purchases of Equity Securities by the Issuer and Affiliated Purchasers
The number of shares of treasury stock at December 31, 2011 amounted to 84,209,364 (55,204,942 at December 31, 2010). These treasury shares are directly owned by Telefónica, S.A., except for one share held by Telefónica Móviles Argentina, S.A.
Year ended December 31, 2011
Period of Fiscal Year
Total Number of Shares Purchased
Average Price Paid per Share (euro)
Total Number of Shares (or Units)
Purchased as Part of Publicly Announced
Plans or Programs(1)
January 1 to January 31 750,000 16.80 219,776February 1 to February 28 — — —March 1 to March 31 2,250,000 17.56 399,572April 1 to April 30 3,027,577 17.90 194,977May 1 to May 31 1,800,000 16.86 207,957June 1 to June 30 6,167,704 14.75 1,685,009July 1 to July 31 5,988,123 14.84 1,201,509August 1 to August 31 13,407,065 14.00 254,376September 1 to September 30 4,090,530 13.67 —October 1 to October 31 6,010,626 15.23 —November 1 to November 30 7,488,327 14.98 —December 1 to December 31 5,000,000 13.45 —Total 55,979,952 14.85 4,163,176
128

For a more detailed description of our plans or programs, see “Item 8. Financial Information—Dividend Information and Shareholders’ Return”, “Item 11. Quantitative and Qualitative Disclosures About
Market Risk—Share Price Risk.” and “Item 6. Directors, Senior Management and Employees—Incentive Plans.” Item 16F. Change in Registrant’s Certifying Accountant
During the years ended December 31, 2010 and 2011 and through the date of this Annual Report, the principal independent accountant engaged to audit our financial statements, Ernst & Young, S.L., has not resigned, indicated that it has declined to stand for re-election after the completion of its current audit or been dismissed. For each of the years ended December 31, 2010 and 2011, Ernst & Young, S.L. has not expressed reliance on another accountant or accounting firm in its report on our audited annual accounts for such periods. Item 16G. Corporate Governance Significant Differences in Corporate Governance Practices
Corporate governance guidelines
In Spain, companies with securities listed on a Spanish stock exchange are expected to follow the Conthe Code published in May 2006, which contains corporate governance and shareholder disclosure recommendations. It combines and substitutes the former Spanish Corporate Governance Codes: the Olivencia Code of Good Governance and the Aldama Report. Spanish listed companies are required by law to publish an Annual Report on Corporate Governance and also to publish corporate governance information on their websites. We base our corporate governance procedures on the recommendations of the Conthe Code. As part of our corporate governance procedures, we have adopted regulations for our Board of Directors that govern, among other things, director qualification standards, responsibilities, compensation, access to management information, the Board of Directors’ purpose and each of our Board Committee’s purpose and responsibilities. Moreover, we have a Regulation of the General Shareholders’ Meeting that aims to reinforce its transparency, providing shareholders with a framework guaranteeing and facilitating exercise of their rights. The Annual Report on Corporate Governance published by us provides a detailed explanation of our corporate governance procedures and explains the role and duties of our Board of Directors and Board Committees. Our Annual Report on Corporate Governance is available on our website at www.telefonica.com. None of the information contained on our website is incorporated in this Annual Report.
Committees
We have had an Audit and Control Committee since 1997. Our Audit and Control Committee is composed of three non-executive directors, all of whom are deemed Rule 10A-3 independent by our Board of Directors. The functions, composition and competencies of this Committee are regulated by the Board of Directors’ Regulations and are similar to those required by the New York Stock Exchange. The Audit and Control Committee shall consist of not less than three nor more than five directors appointed by our Board of Directors. All Committee members shall be external directors. When appointing such members, our Board of Directors shall take into account the appointees’ knowledge and experience in matters of accounting, auditing and risk management.
(1) As of June 30 and July 4, 2011, following the end of the third phase of the Performance Share Plan, a total of 2,446,104 treasury shares were added, corresponding to two derivative financial instrumentsarranged by the Company to meet its obligations to deliver treasury shares to its managers and executives. A net 2,900,189 shares, corresponding to a total of 4,166,304 gross shares, less a withholding of1,266,115 shares prior to delivery at the option of the employee, was delivered. In addition, 1,717,082 shares could be assigned for the Global Employee Share Plan.
129

We have had a Nominating, Compensation and Corporate Governance Committee since 1997, which is composed of five external directors. The functions, composition and competencies of this Committee are regulated by the Board of Directors’ Regulations and are very similar to those required by the NYSE. The Nominating, Compensation and Corporate Governance Committee shall consist of not less than three nor more than five directors appointed by the Board of Directors. All members of the Committee must be external directors and the majority thereof must be independent. The Chairman of the Nominating, Compensation and Corporate Governance Committee, who shall in all events be an independent director, shall be appointed from among its members.
Additionally we have a Human Resources and Corporate Reputation and Responsibility Committee, a Regulation Committee, a Service Quality and Customer Service Committee, an International Affairs Committee, an Innovation Committee and a Strategy Committee. The functions, composition and competencies are regulated by the Board of Directors’ Regulations.
Independence of the Board
As of the date of this Annual Report, we have 18 directors, out of which eight have been deemed independent by our Board of Directors attending to the director’s classification contained in the Conthe Corporate Governance Code. A significant majority of our current directors, 15, are non-executive directors. We, in accordance with the Conthe Code, assess the independence of our directors. Among other things, independent directors: (i) shall not be, past employees or executive directors of any of the Group companies, unless three or five years have elapsed, respectively, (ii) shall not receive any payment or other form of compensation from us or our group on top of their directors’ fees, unless the amount involved is not significant, (iii) shall not be partners, now or on the past three years, in the external auditor or in the firm responsible for the audit report, (iv) shall not be executive directors or senior officers of another company where one of our executive directors or senior officers is an external director, (v) shall not have material business dealings with us or any other company in our group, (vi) shall not be spouses, nor partners maintaining an analogous affective relationship, nor close relative of any of our executive directors or senior officers and (vii) shall not stand in any of the situations listed in (i), (v) or (vi) above in relation to a significant shareholder or a shareholder with board representation.
The classification of each director shall be explained by the Board of Directors to the shareholders at the general shareholders’ meeting at which the appointment thereof must be made or ratified. Furthermore, such classification shall be reviewed annually by our Board of Directors after verification by the Nominating, Compensation and Corporate Governance Committee, and reported in the Annual Corporate Governance Report.
Internal Audit Function
We have an Internal Audit Department responsible for internal audit matters and for ensuring the efficiency of the internal audit control process of our different units. This Internal Audit Department reports directly to the Audit and Control Committee, thus supporting the adequate performance of all its functions.
Non-Executive Director Meetings
Pursuant to the NYSE listing standards, non-executive directors of U.S.-listed companies must meet on a regular basis without management present and the company must disclose a method for any interested parties to communicate directly with the non-executive directors. As a group, our non-executive directors do not meet formally without management present. Nevertheless, every committee of the Board of Directors is composed exclusively of non-executive directors (other than the Innovation Committee, which includes Julio Linares, one of our executive directors), thus giving each of these committees, the chance to analyze and discuss any matter related to our management, within its respective area of responsibility.
Whistleblowing
We have procedures in place that allow any employee to anonymously and confidentially report instances of fraud, alterations of financial information or specific risks to Telefónica and its subsidiaries.
130

Code of Ethics
The NYSE listing standards require U.S. companies to adopt a code of business conduct and ethics for directors, officers and employees, and promptly disclose any waivers of the code for directors or executive officers. In 2004 we adopted, as required by the Sarbanes-Oxley Act, a code of ethics that applied to our principal executive officer, principal financial officer and to our senior financial officers. In December 2006, we adopted a code of business conduct and ethics, the “Telefónica Business Principles,” which apply to all Telefónica Group employees. On March 2008, we decided to modify such Business Principles in order to incorporate within them all components of the code of ethics definition in Section 406 of Sarbanes Oxley Act, and consequently our code of ethics for senior officers was replaced by such Business Principles. These Principles were further modified on October 8, 2010 in order to include a new principle of privacy and data protection.
We also have an Internal Code of Conduct for securities markets issues to prevent insider trading misconduct and to control possible conflicts of interest. In addition, the Regulations of the Board of Directors set out in detail our directors’ main obligations relating to conflicts of interest concerning business opportunities, misappropriation of our assets, confidentiality and non-competition.
131

Part III Item 17. Financial Statements
We have responded to Item 18 in lieu of responding to this Item. Item 18. Financial Statements
Please see pages F-1.1 through F-162.
132

Item 19. Exhibits
We agree to furnish to the SEC upon request, copies of the instruments defining the rights of the holders of our long-term debt and of our subsidiaries’ long-term debt.
Exhibit Number
Description
1.1 Amended and Restated bylaws (English translation)* 4.1 Shareholders’ Agreement dated as of April 28, 2007 among Telefónica S.A., Assicurazioni Generali S.p.A., Sintonia S.A., Intesa Sanpaolo S.p.A., Mediobanca S.p.A.** 4.2 Co-investment Agreement dated as of April 28, 2007 among Telefónica S.A., Assicurazioni Generali S.p.A., Sintonia S.A., Intesa Sanpaolo S.p.A., Mediobanca S.p.A.** 4.3 Call Option Agreement, dated November 6, 2007, between Telefónica, S.A. and Telco*** 4.4 Amendment to the Shareholders’ Agreement and Bylaws, dated November 19, 2007 among Telefónica S.A., Generali, Sintonia S.A., Intesa Sanpaolo S.p.A. and Mediobanca S.p.A.*** 4.5 Renewal Agreement, dated October 28, 2009, by and among Telefónica S.A., Assicurazioni Generali S.p.A. (on its own behalf and on behalf of its subsidiaries Generali Vie S.A.,
Alleanza Toro S.p.A., INA Assitalia S.p.A., Generali Lebensversicherung A.G.), Intesa Sanpaolo S.p.A. and Mediobanca S.p.A. **** 4.6 Amendment Deed to the Call Option, dated October 28, 2009, by and between Telefónica S.A. and Telco S.p.A. **** 4.7 Subscription Agreement, dated September 6, 2009 between Telefónica, S.A. and China Unicom (Hong Kong) Limited***** 4.8 Enhanced Strategic Alliance Agreement dated January 23, 2011 between Telefónica, S.A. and China Unicom (Hong Kong) Limited ****** 4.9 Amendment Deed, dated December 10, 2010, by and among Telefónica S.A., Assicurazioni Generali S.p.A. (on its own behalf and on behalf of its subsidiaries Generali Vie S.A.,
Alleanza Toro S.p.A., INA Assitalia S.p.A. and Generali Lebensversicherung AG), Intesa Sanpaolo S.p.A. and Mediobanca S.p.A. ******** 4.10 Second Renewal Agreement, dated February 29, 2012, by and among Telefónica S.A., Assicurazioni Generali S.p.A. (on its own behalf and on behalf of its subsidiaries Generali Vie
S.A., Alleanza Toro S.p.A., INA Assitalia S.p.A. and Generali Lebensversicherung AG), Intesa Sanpaolo S.p.A. and Mediobanca S.p.A. ******** 4.11 Amendment Deed to Call Option Agreement, dated February 29, 2012, between Telefónica and Telco ******** 8.1 Subsidiaries of Telefónica (see Note 1 to the Consolidated Financial Statements and Appendix V thereto) 11.1 Code of Ethics (“Telefónica Business Principles”) ******* 12.1 Certification of César Alierta Izuel, Chief Executive Officer of Telefónica, pursuant to Section 302 of the Sarbanes-Oxley Act of 2002 12.2 Certification of Miguel Escrig Meliá, Chief Financial Officer of Telefónica, pursuant to Section 302 of the Sarbanes-Oxley Act of 2002 13.1 Certification pursuant to 18 U.S.C. Section 1350, as adopted pursuant to Section 906 of the Sarbanes-Oxley Act of 2002
* Incorporated by reference to Telefónica’s Annual Report on Form 20-F for the fiscal year ended December 31, 2009
** Incorporated by reference to Telefónica’s Annual Report on Form 20-F for the fiscal year ended December 31, 2006.
*** Incorporated by reference to Telefónica’s Schedule 13D/A filed on November 26, 2007.
**** Incorporated by reference to Telefónica’s Schedule 13D/A filed on November 23, 2009.
***** Incorporated by reference to Telefónica’s Schedule 13D/A filed on September 17, 2009.
****** Incorporated by reference to Telefónica’s Schedule 13D filed on February 8, 2011.
******* Incorporated by reference to Telefónica’s Annual Report on Form 20-F for the fiscal year ended December 31, 2010.
******** Incorporated by reference to Telefónica’s Schedule 13 D/A filed on March 12, 2012.
133

SIGNATURES
The registrant hereby certifies that it meets all of the requirements for filing on Form 20-F and has duly caused and authorized the undersigned to sign this Annual Report on its behalf.
Date: March 29, 2012
TELEFÓNICA, S.A.
By: /s/ César Alierta Izuel Name: César Alierta Izuel Title: Chief Executive Officer
TELEFÓNICA, S.A.
By: /s/ Miguel Escrig Meliá Name: Miguel Escrig Meliá Title: Chief Financial Officer
134

TELEFÓNICA, S.A. AND SUBSIDIARIES
COMPOSING THE TELEFÓNICA GROUP
CONSOLIDATED FINANCIAL STATEMENTS
(CONSOLIDATED ANNUAL ACCOUNTS)
F-1

REPORT OF INDEPENDENT REGISTERED PUBLIC ACCOUNTING FIRM The Board of Directors and Shareholders of Telefónica, S.A. We have audited Telefónica, S.A.’s internal control over financial reporting as of December 31, 2011, based on criteria established in Internal Control—Integrated Framework issued by the Committee of Sponsoring Organizations of the Treadway Commission (the COSO criteria). Telefónica, S.A.’s management is responsible for maintaining effective internal control over financial reporting, and for its assessment of the effectiveness of internal control over financial reporting included in the accompanying Annual Report on Internal Control over Financial Reporting. Our responsibility is to express an opinion on Telefónica, S.A.’s internal control over financial reporting based on our audit. We conducted our audit in accordance with the standards of the Public Company Accounting Oversight Board (United States). Those standards require that we plan and perform the audit to obtain reasonable assurance about whether effective internal control over financial reporting was maintained in all material respects. Our audit included obtaining an understanding of internal control over financial reporting, assessing the risk that a material weakness exists, testing and evaluating the design and operating effectiveness of internal control based on the assessed risk, and performing such other procedures as we considered necessary in the circumstances. We believe that our audit provides a reasonable basis for our opinion. A company’s internal control over financial reporting is a process designed to provide reasonable assurance regarding the reliability of financial reporting and the preparation of financial statements for external purposes in accordance with generally accepted accounting principles. A company’s internal control over financial reporting includes those policies and procedures that (1) pertain to the maintenance of records that, in reasonable detail, accurately and fairly reflect the transactions and dispositions of the assets of the company; (2) provide reasonable assurance that transactions are recorded as necessary to permit preparation of financial statements in accordance with generally accepted accounting principles, and that receipts and expenditures of the company are being made only in accordance with authorizations of management and directors of the company; and (3) provide reasonable assurance regarding prevention or timely detection of unauthorized acquisition, use, or disposition of the company’s assets that could have a material effect on the financial statements. Because of its inherent limitations, internal control over financial reporting may not prevent or detect misstatements. Also, projections of any evaluation of effectiveness to future periods are subject to the risk that controls may become inadequate because of changes in conditions, or that the degree of compliance with the policies or procedures may deteriorate. In our opinion, Telefónica, S.A. maintained, in all material respects, effective internal control over financial reporting as of December 31, 2011, based on the COSO criteria. We also have audited, in accordance with the standards of the Public Company Accounting Oversight Board (United States), the consolidated statements of financial position of Telefónica, S.A. and subsidiaries as of December 31, 2011 and 2010, and the related consolidated statements of income, comprehensive income, changes in equity, and cash flows for each of the three years in the period ended December 31, 2011 and our report dated March 28, 2012 expressed an unqualified opinion thereon.
Madrid, Spain March 28, 2012
ERNST & YOUNG, S.L.
/s/ Ignacio Viota del Corte
Ignacio Viota del Corte
F-1.1

REPORT OF INDEPENDENT REGISTERED PUBLIC ACCOUNTING FIRM
The Board of Directors and Shareholders of Telefónica, S.A. We have audited the accompanying consolidated statements of financial position of Telefónica, S.A. and subsidiaries as of December 31, 2011 and 2010, and the related consolidated statements of income, comprehensive income, changes in equity, and cash flows for each of the three years in the period ended December 31, 2011. These consolidated financial statements are the responsibility of Telefónica, S.A.’s Directors. Our responsibility is to express an opinion on these financial statements based on our audits. We conducted our audits in accordance with the standards of the Public Company Accounting Oversight Board (United States). Those standards require that we plan and perform the audit to obtain reasonable assurance about whether the financial statements are free of material misstatement. An audit includes examining, on a test basis, evidence supporting the amounts and disclosures in the financial statements. An audit also includes assessing the accounting principles used and significant estimates made by management, as well as evaluating the overall financial statement presentation. We believe that our audits provide a reasonable basis for our opinion. In our opinion, the financial statements referred to above present fairly, in all material respects, the consolidated financial position of Telefónica, S.A. and subsidiaries as of December 31, 2011 and 2010, and the consolidated results of their operations and their cash flows for each of the three years in the period ended December 31, 2011, in conformity with International Financial Reporting Standards as issued by the International Accounting Standards Board. We also have audited, in accordance with the standards of the Public Company Accounting Oversight Board (United States), Telefónica S.A.’s internal control over financial reporting as of December 31, 2011, based on criteria established in Internal Control-Integrated Framework issued by the Committee of Sponsoring Organizations of the Treadway Commission and our report dated March 28, 2012 expressed an unqualified opinion thereon.
Madrid, Spain March 28, 2012
ERNST & YOUNG, S.L.
/s/ Ignacio Viota del Corte
Ignacio Viota del Corte
F-1.2

TELEFÓNICA GROUP CONSOLIDATED STATEMENT OF FINANCIAL POSITION AT DECEMBER 31 (MILLIONS OF EUROS)
The accompanying Notes 1 to 24 and Appendices I to VI are an integral part of these consolidated statements of financial position.
ASSETS NOTE 2011 2010
A) NON-CURRENT ASSETS 108,800 108,721
Intangible assets (Note 6) 24,064 25,026Goodwill (Note 7) 29,107 29,582Property, plant and equipment (Note 8) 35,463 35,797Investment properties 6 5Investments in associates (Note 9) 5,065 5,212Non-current financial assets (Note 13) 8,678 7,406Deferred tax assets (Note 17) 6,417 5,693
B) CURRENT ASSETS 20,823 21,054
Inventories 1,164 1,028Trade and other receivables (Note 11) 11,331 12,426Current financial assets (Note 13) 2,625 1,574Tax receivables (Note 17) 1,567 1,331Cash and cash equivalents (Note 13) 4,135 4,220Non-current assets held for sale 1 475
TOTAL ASSETS (A+B) 129,623 129,775
EQUITY AND LIABILITIES NOTE 2011 2010
A) EQUITY 27,383 31,684
Equity attributable to equity holders of the parent 21,636 24,452Non-controlling interests (Note 12) 5,747 7,232
B) NON-CURRENT LIABILITIES 69,662 64,599
Non-current interest-bearing debt (Note 13) 55,659 51,356Non-current trade and other payables (Note 14) 2,092 2,304Deferred tax liabilities (Note 17) 4,739 6,074Non-current provisions (Note 15) 7,172 4,865
C) CURRENT LIABILITIES 32,578 33,492
Current interest-bearing debt (Note 13) 10,652 9,744Current trade and other payables (Note 14) 17,855 19,251Current tax payables (Note 17) 2,568 2,822Current provisions (Note 15) 1,503 1,675
TOTAL EQUITY AND LIABILITIES (A+B+C) 129,623 129,775
F-2

TELEFÓNICA GROUP CONSOLIDATED INCOME STATEMENTS FOR THE YEARS ENDED DECEMBER 31 (MILLIONS OF EUROS)
The accompanying Notes 1 to 24 and Appendices I to VI are an integral part of these consolidated income statements.
INCOME STATEMENT NOTE 2011 2010 2009
Revenues (Note 19) 62,837 60,737 56,731Other income (Note 19) 2,107 5,869 1,645Supplies (18,256) (17,606) (16,717)Personnel expenses (11,080) (8,409) (6,775)Other expenses (Note 19) (15,398) (14,814) (12,281)Depreciation and amortization (Note 19) (10,146) (9,303) (8,956)
OPERATING INCOME 10,064 16,474 13,647
Share of (loss) profit of associates (Note 9) (635) 76 47
Finance income 827 792 814Exchange gains 2,795 3,508 3,085Finance costs (3,609) (3,329) (3,581)Exchange losses (2,954) (3,620) (3,625)
Net financial expense (Note 16) (2,941) (2,649) (3,307)
PROFIT BEFORE TAX FROM CONTINUING OPERATIONS 6,488 13,901 10,387
Corporate income tax (Note 17) (301) (3,829) (2,450)
PROFIT FOR THE YEAR FROM CONTINUING OPERATIONS 6,187 10,072 7,937
Profit after taxes from discontinued operations (Note 18) - - -PROFIT FOR THE YEAR 6,187 10,072 7,937
Non-controlling interests (Note 12) (784) 95 (161)PROFIT FOR THE YEAR ATTRIBUTABLE TO EQUITY HOLDERS OF THE PARENT 5,403 10,167 7,776
Basic and diluted earnings per share from continuing operations attributable to equity holders of the parent (euros) (Note 19) 1.20 2.25 1.71Basic and diluted earnings per share attributable to equity holders of the parent (euros) (Note 19) 1.20 2.25 1.71
F-3

CONSOLIDATED STATEMENT OF COMPREHENSIVE INCOME Year ended December 31
(MILLIONS OF EUROS) 2011 2010 2009
Profit for the year 6,187 10,072 7,937
Other comprehensive income (loss) (Losses) gains on measurement of available-for-sale investments (13 ) (61 ) 638 Reclassification of losses (gains) included in the income statement 3 202 (4 )Income tax impact 3 (57 ) (105 )
(7 ) 84 529 Losses on hedges (921 ) (291 ) (794 )Reclassification of losses (gains) included in the income statement 210 73 (77 )Income tax impact 217 62 262
(494 ) (156 ) (609 ) Translation differences (1,265 ) 820 1,982 Actuarial gains (losses) and impact of limit on assets for defined benefit pension plans (Note 15) (85 ) (94 ) (189 )Income tax impact 28 35 53
(57 ) (59 ) (136 ) Share of income (loss) recognized directly in equity of associates and others 58 (84 ) 233 Reclassification of (gains) losses included in the income statement - - - Income tax impact (9 ) 23 2
49 (61 ) 235
Total other comprehensive income (loss) (1,774 ) 628 2,001
Total comprehensive income recognized in the year 4,413 10,700 9,938
Attributable to: Equity holders of the parent 4,002 10,409 9,418 Non-controlling interests 411 291 520
4,413 10,700 9,938
The accompanying Notes 1 to 24 and Appendices I to VI are an integral part of these consolidated statements of comprehensive income
F-4

CONSOLIDATED STATEMENT OF CHANGES IN EQUITY (MILLIONS OF EUROS)
Attributable to equity holders of the parent Non-
controlling interests
(Note 12) Total equity
Share capital
Share premium
Legal reserve
Revaluation reserve
Treasury shares
Retained earnings
Available-for-sale
investments Hedges Equity of associates
Translation differences Total
Financial position at December 31, 2010 4,564 460 984 141 (1,376) 19,971 45 648 (42) (943) 24,452 7,232 31,684
Profit for the year - - - - 5,403 - - - - 5,403 784 6,187
Other comprehensive income (loss) - - - - (52) (7) (494) 49 (897) (1,401) (373) (1,774)
Total comprehensive income - - - - 5,351 (7) (494) 49 (897) 4,002 411 4,413
Dividends paid (Note 12) - - - - (6,852) - - - - (6,852) (876) (7,728)Net movement in treasury shares - - - - (777) - - - - - (777) - (777)Acquisitions and disposals of non-controlling interests and business combinations (Note 5) - - - - 984 - - - (323) 661 (1,200) (539)Other movements - - - (15) 371 (206) - - - - 150 180 330Financial position at December 31, 2011 4,564 460 984 126 (1,782) 19,248 38 154 7 (2,163) 21,636 5,747 27,383Financial position at December 31, 2009 4,564 460 984 157 (527) 16,685 (39) 804 19 (1,373) 21,734 2,540 24,274
Profit for the year - - - - 10,167 - - - - 10,167 (95) 10,072Other comprehensive income (loss) - - - - - (55) 84 (156) (61) 430 242 386 628
Total comprehensive income - - - - - 10,112 84 (156) (61) 430 10,409 291 10,700
Dividends paid (Note 12) - - - - - (5,872) - - - (5,872) (440) (6,312)Net movement in treasury shares - - - - (849) - - - - - (849) - (849)Acquisitions and disposals of non-controlling interests and business combinations (Note 5) - - - - - - - - - - - 4,307 4,307Other movements - - - (16) - (954) - - - - (970) 534 (436)Financial position at December 31, 2010 4,564 460 984 141 (1,376) 19,971 45 648 (42) (943) 24,452 7,232 31,684Financial position at December 31, 2008 4,705 460 984 172 (2,179) 16,069 (566) 1,413 (216) (3,611) 17,231 2,331 19,562Profit for the year - - - - - 7,776 - - - - 7,776 161 7,937Other comprehensive income (loss) - - - - - (136) 527 (609) 235 1,625 1,642 359 2,001
Total comprehensive income 7,640 527 (609) 235 1,625 9,418 520 9,938Dividends paid (Note 12) - - - - - (4,557) - - - - (4,557) (295) (4,852)
Hyperinflation restatement to 01/01/09 (Note 2) 613 613 - 613Net movement in treasury shares - - - - (656) - - - - - (656) - (656)Acquisitions and disposals of non-controlling interests - - - - - - - - - - - (122) (122)Capital reduction (Note 12) (141) - - - 2,308 (2,167) - - - - - - -Other movements - - - (15) - (300) - - - - (315) 106 (209)Financial position at December 31, 2009 4,564 460 984 157 (527) 16,685 (39) 804 19 (1,373) 21,734 2,540 24,274
The accompanying Notes 1 to 24 and Appendices I to VI are an integral part of these consolidated statements of changes in equity.
F-5

TELEFÓNICA GROUP CONSOLIDATED STATEMENT OF CASH FLOWS FOR THE YEARS ENDED DECEMBER 31 (MILLIONS OF EUROS)
The accompanying Notes 1 to 24 and Appendices I to VI are an integral part of these consolidated statements of cash flow.
NOTE 2011 2010 2009Cash flows from operating activities
Cash received from customers 77,222 72,867 67,358Cash paid to suppliers and employees (55,769) (51,561) (46,198)Dividends received 82 136 100Net interest and other financial expenses paid (2,093) (2,154) (2,170)Taxes paid (1,959) (2,616) (2,942)
Net cash from operating activities (Note 23) 17,483 16,672 16,148
Cash flows from investing activities
Proceeds on disposals of property, plant and equipment and intangible assets 811 315 242Payments on investments in property, plant and equipment and intangible assets (9,085) (8,944) (7,593)Proceeds on disposals of companies, net of cash and cash equivalents disposed 4 552 34Payments on investments in companies, net of cash and cash equivalents acquired (2,948) (5,744) (48)Proceeds on financial investments not included under cash equivalents 23 173 6Payments made on financial investments not included under cash equivalents (669) (1,599) (1,411)Payments from cash surpluses not included under cash equivalents (646) (621) (548)Government grants received 13 7 18
Net cash used in investing activities (Note 23) (12,497) (15,861) (9,300)
Cash flows from financing activities
Dividends paid (Note 12) (7,567) (6,249) (4,838)Transactions with equity holders (399) (883) (947)Proceeds on issue of debentures and bonds (Note 13) 4,582 6,131 8,617Proceeds on loans, borrowings and promissory notes 4,387 9,189 2,330Cancellation of debentures and bonds (Note 13) (3,235) (5,482) (1,949)Repayments of loans, borrowings and promissory notes (2,680) (7,954) (5,494)
Net cash used in financing activities (Note 23) (4,912) (5,248) (2,281)
Effect of foreign exchange rate changes on collections and payments (169) (463) 269
Effect of changes in consolidation methods 10 7 -
Net (decrease) increase in cash and cash equivalents during the year (85) (4,893) 4,836
CASH AND CASH EQUIVALENTS AT JANUARY 1 4,220 9,113 4,277
CASH AND CASH EQUIVALENTS AT DECEMBER 31 (Note 13) 4,135 4,220 9,113
RECONCILIATION OF CASH AND CASH EQUIVALENTS WITH THE STATEMENT OF FINANCIAL POSITION
BALANCE AT JANUARY 1 4,220 9,113 4,277Cash on hand and at banks 3,226 3,830 3,236Other cash equivalents 994 5,283 1,041
BALANCE AT DECEMBER 31 (Note 13) 4,135 4,220 9,113Cash on hand and at banks 3,411 3,226 3,830Other cash equivalents 724 994 5,283
F-6

TELEFÓNICA, S.A. AND SUBSIDIARIES COMPOSING THE TELEFÓNICA GROUP
NOTES TO THE CONSOLIDATED FINANCIAL STATEMENTS (CONSOLIDATED ANNUAL ACCOUNTS) FOR THE YEAR ENDED DECEMBER 31, 2011
Telefónica, S.A. and its subsidiaries and investees (the “Telefónica Group” or "the Group”) make up an integrated group of companies operating mainly in the telecommunications, media and contactcenter industries. The parent company of the Group is Telefónica, S.A. (“Telefónica” or “the Company”), a public limited company incorporated on April 19, 1924 for an indefinite period. Its registered office is at calleGran Vía 28, Madrid (Spain). Appendix V lists the subsidiaries, associates and investees in which the Telefónica Group has direct or indirect holdings, their corporate purpose, country, functional currency, share capital, theTelefónica Group’s effective shareholding and their method of consolidation.
Telefónica’s basic corporate purpose, pursuant to Article 4 of its Bylaws, is the provision of all manner of public or private telecommunications services, including ancillary or complementarytelecommunications services or related services. All the business activities that constitute this stated corporate purpose may be performed either in Spain or abroad and wholly or partially by theCompany, either through shareholdings or equity interests in other companies or legal entities with an identical or a similar corporate purpose. In 2011, the Telefónica Group followed a regional, integrated management model based on three business areas by geographical market and integrated wireline and wireless businesses in Spain, LatinAmerica and the rest of Europe. On September 5, 2011, the Executive Committee of Telefónica’s Board of Directors approved a new organizational structure with the aim of reinforcing its growth story, actively participating in thedigital world and capturing the most of the opportunities afforded by its global scale and industrial alliances. More detailed information on the activities carried out by the Group is provided in Note4. The business activities carried out by most of the Telefónica Group companies are regulated by broad ranging legislation, pursuant to which permits, concessions or licenses must be obtained incertain circumstances to provide the various services. In addition, certain wireline and wireless telephony services are provided under regulated rate and price systems.
The accompanying consolidated financial statements were prepared from the accounting records of Telefónica, S.A. and of each of the companies comprising the Telefónica Group, whose individual
(1) BACKGROUND AND GENERAL INFORMATION
Telefónica Group organizational structure
Corporate structure of the Group
(2) BASIS OF PRESENTATION OF THE CONSOLIDATED FINANCIAL STATEMENTS
F-7

financial statements were prepared in accordance with the generally accepted accounting principles prevailing in the various countries in which they are located, and for purposes of these consolidatedfinancial statements are presented in accordance with International Financial Reporting Standards (IFRS) as issued by the International Accounting Standards Board (IASB), which for the purposes ofthe Telefónica Group are not different from those adopted by the European Union, to give a true and fair view of the consolidated equity and financial position at December 31, 2011, and of theconsolidated results of operations, changes in consolidated equity and the consolidated cash flows obtained and used in the year then ended. The figures in these consolidated financial statements areexpressed in millions of euros, unless otherwise indicated, and therefore may be rounded. The euro is the Group’s reporting currency. The accompanying consolidated financial statements for the year ended December 31, 2011 were prepared by the Company’s Board of Directors at its meeting on February 22, 2012 for submission for approval at the General Shareholders’ Meeting, which is expected to occur without modification. Note 3 contains a detailed description of the most significant accounting policies used to prepare these consolidated financial statements. For comparative purposes, the accompanying financial statements for 2011 include the consolidated statement of financial position at December 31, 2010 and the consolidated income statement, theconsolidated statement of comprehensive income, the consolidated statement of changes in equity and the consolidated statement of cash flows and the notes thereto for the year ended December 31,2010 and 2009. Comparative information and main changes in the consolidation scope The main events and changes in the consolidation scope affecting comparability of the consolidated information for 2011 and 2010 (see Appendix I for a more detailed explanation of the changes inconsolidation scope in 2010 and the main transactions in 2009) are as follows: 2011
Expanding on the existing strategic partnership, on January 23, 2011, Telefónica, S.A. and China Unicom (Hong Kong) Limited (“China Unicom”) signed an extension to their Strategic Partnership Agreement, in which both companies agreed to strengthen and deepen their strategic cooperation in certain business areas, and committed to investing the equivalent of 500 million USdollars in ordinary shares of the other party. Telefónica acquired through its subsidiary Telefónica Internacional, S.A.U. 282,063,000 ordinary shares of China Unicom from third parties for 358million euros.
Subsequent to the execution of this transaction, Telefónica, through Telefónica Internacional, S.A.U., has a shareholding of approximately 9.57% of the voting shares of China Unicom.
China Unicom completed the acquisition of Telefónica shares on January 28, 2011, giving it ownership of 1.37% of the Company’s capital.
a) Extension of the strategic partnership agreement with China Unicom
F-8

In recognition of China Unicom's stake in Telefónica, approval was given at Telefónica’s General Shareholders' Meeting for the appointment of a board member named by China Unicom, inaccordance with prevailing legislation and the Company's Bylaws.
On March 25, 2011 the Boards of Directors of each of the subsidiaries controlled by Telefónica, Vivo Participações and Telesp, approved the terms and conditions of a merger and restructuringprocess whereby all shares of Vivo Participações that were not owned by Telesp were exchanged for Telesp shares, at a rate of 1.55 new Telesp shares for each Vivo Participações share. Theseshares then became the property of Telesp, whereby Vivo Participações then became a wholly owned subsidiary of Telesp. The restructuring process was approved by the shareholders of VivoParticipações at the Extraordinary General Shareholders’ Meeting held on April 27, 2011 and by the shareholders of Telesp at the Extraordinary General Shareholders’ Meeting held on the same date, following authorization by Anatel the Brazilian telecommunications regulator.
Once the shares were exchanged, the Telefónica Group became the owner of 73.9% of Telesp which, in turn, has 100% ownership of the shares of Vivo, S.A. The impact on equity attributable toequity holders of the parent arising from this transaction was an increase of 661 million euros (an increase of 984 million euros in “Retained earnings” offset by the impact of translation differences), against net equity attributable to non-controlling interests.
On June 14, 2011, the respective Boards of Directors of Vivo Participações and Telesp approved a restructuring plan whose objective is to simplify the corporate structure of both companies andfoster their integration, eliminating Vivo Participações from the corporate chain through the incorporation of its total equity into Telesp, and concentrating all mobile telephony activities in Vivo,S.A. (now a direct subsidiary of Telesp).
The transaction was also subject to authorization from the Brazilian telecommunications regulator and was approved at the General Shareholders’ Meetings of both companies on October 3, 2011.The company emerging from the merger changed its name of incorporation to Telefónica Brasil, S.A.
As a result of the merger of the Brazilian companies Telesp and Vivo Participações in October 2011, the tax value of certain assets identified in the purchase price allocation changes, among themlicenses, as they become tax deductible under Brazilian tax regulation. The change in the tax value of the licenses requires the reversal of the deferred tax liability recognized in the prior purchaseprice allocation, resulting in an impact to “Corporate income tax” in the accompanying consolidated income statement in the amount of 1,288 million euros (952 million euros in profit attributableto equity holders of the parent company) (Note 17).
b) Corporate structure in Brazil
F-9

On July 7, 2011, Telefónica de España, S.A.U. agreed with workers’ representatives a collective redundancy procedure for the period from 2011 to 2013 for up to a maximum of 6,500 employees,through voluntary, universal and non-discriminatory programs. The “Redundancy Plan” was approved by employment authorities on July 14, 2011.
The Group has recognized the cost of the 2011 Redundancy Plan, per Company estimates, under “Personnel expenses” in the accompanying consolidated income statement in an amount of 2,671 million euros (see Note 15).
2010
On July 28, 2010, Telefónica, S.A. and Portugal Telecom, SGPS, S.A. (“Portugal Telecom”) signed an agreement for the acquisition by Telefónica, S.A. of 50% of the share capital of Brasilcel,N.V. (“Brasilcel”) owned by Portugal Telecom. (Brasilcel owned approximately 60% of Vivo Participaçoes, S.A.). This transaction was completed on September 27, 2010, terminating the jointventure agreements entered into by Telefónica and Portugal Telecom in 2002.
Vivo Participaçoes, S.A. was changed from the proportionate to full consolidation method within the scope of consolidation as of the transaction completion date.
On December 21, 2010, the merger between Telefónica and Brasilcel was registered in the Madrid Mercantile Register, with the Company becoming a direct shareholder of the Brazilianconsolidated group Vivo, with 59.6% of its capital stock.
Pursuant to Brazilian legislation, on October 26, 2010, Telefónica, S.A. announced a tender offer for the voting shares of Vivo Participaçoes, S.A. (“Vivo Participaçoes”) held by non-controlling interests representing approximately 3.8% of its capital stock. This offer was approved by the Brazilian market regulator (C.V.M.) on February 11, 2011 and, after its execution, Telefónicaacquired an additional 2.7% of the Brazilian company's capital stock, for a total of 62.3%.
Additionally, in accordance with IFRS 3 (see Note 3.c), the Telefónica Group remeasured the previously held 50% investment in Brasilcel, generating a capital gain of 3,797 million euros,recognized under "Other income" in the accompanying consolidated income statement for 2010 (Note 19).
The main impacts of this transaction are explained in Note 5.
On December 3, 2009, Telefónica’s subsidiary in Germany, Telefónica Deutschland GmbH (“Telefónica Deutschland”), signed an agreement to acquire all of the shares of German company HanseNet Telekommunikation GmbH (“HanseNet”). The transaction was completed on February 16, 2010, the date on which the Telefónica Group completed the acquisition of 100% of theshares of HanseNet. The amount initially paid out was approximately 913 million euros, which included 638 million euros of refinanced debt, and
c) Redundancy plan in Spain
a) Acquisition of 50% of Brasilcel, N.V.
b) Acquisition of HanseNet Telekommunikation GmbH
F-10

an acquisition cost in the amount of 275 million euros, which was ultimately reduced by 40 million euros upon completion of the transaction (Note 5).
This company has been included in the Telefónica Group’s consolidation scope under the full consolidation method.
Regarding the devaluation of the Venezuelan Bolívar on January 8, 2010, the two main factors to consider with respect to the Telefónica Group’s 2010 financial statements were:
The principal accounting policies used in preparing the accompanying consolidated financial statements are as follows:
The financial statements of the Group’s foreign subsidiaries were translated to euros at the year-end exchange rates, except for:
Goodwill and statement of financial position items remeasured to fair value when a stake is acquired in a foreign operation are recognized as assets and liabilities of the company acquired andtherefore translated at the closing exchange rate.
The exchange rate differences arising from the application of this method are included in “Translation differences” under “Equity attributable to equity holders of the parent” in the accompanying consolidated statements of financial position, net of the portion of said differences attributable to non-controlling interests, which is shown under “Non-controlling interests.” When the Company loses control of a foreign subsidiary, either through total or partial sale or dilution of its interest, the entire cumulative translation difference since January 1, 2004 (the IFRS transition date)applicable to such operation is recognized in income together with any gain or loss from the loss of control. Transactions in the stock of subsidiaries that do not result in loss of control arerecognized within equity, with a reallocation of the related cumulative translation difference. All other transactions resulting in the total or partial sale of the Company´s interest in an entity notcontrolled by the Company will result in a proportionate recognition of the related cumulative translation difference in income.
The financial statements of Group companies whose functional currency is the currency of a hyperinflationary economy are adjusted for inflation in accordance with the procedure
c) Devaluation of the Venezuelan Bolívar
• The decrease in the Telefónica Group’s net assets in Venezuela as a result of the new exchange rate, with a balancing entry in translation differences under equity of the Group, generatingan effect of approximately 1,810 million euros at the date of devaluation.
• The translation of results and cash flows from Venezuela at the new devalued closing exchange rate.
(3) ACCOUNTING POLICIES
a) Translation methodology
1. Capital and reserves, which were translated at historical exchange rates.
2. Income statements, which were translated at the average exchange rates for the year.
3. Statements of cash flow, which were translated at the average exchange rate for the year.
F-11

described in the following paragraph prior to their translation to euros. Once restated, all items of the financial statements are converted to euros using the closing exchange rate. Amounts shownfor prior years for comparative purposes are not modified.
To determine the existence of hyperinflation, the Group assesses the qualitative characteristics of the economic environment of the country, such as the trends in inflation rates over the previousthree years. The financial statements of companies whose functional currency is the currency of a hyperinflationary economy are adjusted to reflect the changes in purchasing power of the localcurrency, such that all items in the statement of financial position not expressed in current terms (non-monetary items) are restated by applying a general price index at the financial statementclosing date, and all income and expense, profit and loss are restated monthly by applying appropriate adjustment factors. The difference between initial and adjusted amounts is taken to profit orloss.
In that regard, as indicated in Note 2, Venezuela has been classified as a hyperinflationary economy in 2011 and 2010. The inflation rates used to prepare the restated financial information arethose published by the Central Bank of Venezuela. On an annual basis, these rates are 27.59% and 27.18% for 2011 and 2010, respectively.
Monetary transactions denominated in foreign currencies are translated to euros at the exchange rates prevailing on the transaction date, and are adjusted at year end to the exchange rates thenprevailing.
All realized and unrealized exchange gains or losses are taken to the income statement for the year, with the exception of gains or losses arising from specific-purpose financing of investments in foreign investees designated as hedges of foreign currency risk to which these investments are exposed (see Note 3 i), and exchange gains or losses on intra-group loans considered part of the net investment in a foreign operation, which are included under “Other comprehensive income.”
b) Foreign currency transactions
F-12

In all cases, goodwill is recognized as an asset denominated in the currency of the company acquired.
Goodwill is tested for impairment annually or more frequently if there are certain events or changes indicating the possibility that the carrying amount may not be fully recoverable.
The potential impairment loss is determined by assessing the recoverable amount of the cash generating unit (or group of cash-generating units) to which the goodwill relates when originated. If this recoverable amount is less than the carrying amount, an irreversible impairment loss is recognized in income (see Note 3 f).
Intangible assets are stated at acquisition or production cost, less any accumulated amortization or any accumulated impairment losses.
The useful lives of intangible assets are assessed individually to be either finite or indefinite. Intangible assets with finite lives are amortized systematically over the useful economic life andassessed for impairment whenever events or changes indicate that their carrying amount may not be recoverable. Intangible assets with indefinite useful lives are not amortized, but are tested forimpairment annually, or more frequently in the event of indications that their carrying amount may not be recoverable (see Note 3 f).
c) Goodwill
- For acquisitions occurring from January 1, 2010, the effective date of Revised IFRS 3, Business combinations, goodwill represents the excess of acquisition cost over the fair values of identifiable assets acquired and liabilities assumed at the acquisition date. Cost of acquisition is the sum of the fair value of consideration delivered and the value attributed to existing non-controlling interests. For each business combination, the company determines the value of non-controlling interests at either their fair value or their proportional part of the net identifiableassets acquired. After initial measurement, goodwill is carried at cost, less any accumulated impairment losses. Whenever an equity interest is held in the acquiree prior to the businesscombination (business combinations achieved in stages), the carrying value of such previously held equity interest is remeasured at its acquisition-date fair value and the resulting gain or loss, if any, is recognized in profit or loss.
- For acquisitions after January 1, 2004, the IFRS transition date, and prior to January 1, 2010, the effective date of Revised IFRS 3, Business combinations, goodwill represents the excess of the acquisition cost over the acquirer’s interest, at the acquisition date, in the fair values of identifiable assets, liabilities and contingent liabilities acquired from a subsidiary or joint venture.After initial measurement, goodwill is carried at cost, less any accumulated impairment losses.
- In the transition to IFRS, Telefónica availed itself of the exemption allowing it not to restate business combinations taking place before January 1, 2004. As a result, the accompanyingconsolidated statements of financial position include goodwill net of amortization deducted until December 31, 2003, arising before the IFRS transition date, from the positive consolidationdifference between the amounts paid to acquire shares of consolidated subsidiaries, and their carrying amounts plus increases in the fair value of assets and liabilities recognized in equity.
d) Intangible assets
F-13

Management reassesses the indefinite useful life classification of these assets on an annual basis.
Amortization methods and schedules are revised annually at year end and, where appropriate, adjusted prospectively.
Research and development costs
Research costs are expensed as incurred. Costs incurred in developing new products to be marketed or used for the Group’s own network, and whose future economic viability is reasonably certain, are capitalized and amortized on a straight-line basis over the period during which the related project is expected to generate economic benefits, starting upon its completion.
Recoverability is considered to be reasonably assured when the Group can demonstrate the technical feasibility of completing the intangible asset, whether it will be available for use or sale, itsintention to complete and its ability to use or sell the asset and how the asset will generate future economic benefits.
As long as intangible assets developed internally are not in use, the associated capitalized development costs are tested for impairment annually or more frequently if there are indications that thecarrying amount may not be fully recoverable. Costs incurred in connection with projects that are not economically viable are charged to the consolidated income statement for the year in whichthis circumstance becomes known.
Service concession arrangements and licenses
These arrangements relate to the acquisition cost of the licenses granted to the Telefónica Group by various public authorities to provide telecommunications services and to the value assigned tolicenses held by certain companies at the time they were included in the Telefónica Group.
These concessions are amortized on a straight-line basis over the duration of related licenses from the moment commercial exploitation commences.
Customer base
This primarily represents the allocation of acquisition costs attributable to customers acquired in business combinations, as well as the acquisition value of this type of assets in a third-party acquisition entailing consideration. Amortization is on a straight-line basis over the estimated period of the customer relationship.
Software
Software is stated at cost and amortized on a straight-line basis over its useful life, generally estimated to be between three and five years.
F-14

Property, plant and equipment is stated at cost less any accumulated depreciation and any accumulated impairment in value. Land is not depreciated.
Cost includes external and internal costs comprising warehouse materials used, direct labor used in installation work and the allocable portion of the indirect costs required for the relatedinvestment. The latter two items are recorded as revenues under “Other income - Own work capitalized.” Cost includes, where appropriate, the initial estimate of decommissioning, retirement and site reconditioning costs when the Group is under obligation to incur such costs due to the use of the asset.
Interest and other financial expenses incurred and directly attributable to the acquisition or construction of qualifying assets are capitalized. Qualifying assets at the Telefónica Group are thoseassets that require a period of at least 18 months to bring the assets to their intended use or sale.
The costs of expansion, modernization or improvement leading to increased productivity, capacity or efficiency or to a lengthening of the useful lives of assets are capitalized when recognitionrequirements are met.
Upkeep and maintenance expenses are expensed as incurred.
The Telefónica Group assesses the need to write down, if appropriate, the carrying amount of each item of property, plant and equipment to its recoverable amount, whenever there are indicationsthat the asset’s carrying amount exceeds the higher of its fair value less costs to sell or its value in use. The impairment provision is not maintained if the factors giving rise to the impairmentdisappear (see Note 3 f).
The Group’s subsidiaries depreciate their property, plant and equipment, net of their residual values, once they are in full working condition using the straight-line method based on the assets’estimated useful lives, calculated in accordance with technical studies which are revised periodically based on technological advances and the rate of dismantling, as follows:
Assets’ estimated residual values and methods and depreciation periods are reviewed, and adjusted if appropriate, prospectively at each financial year end.
Non-current assets, including property, plant and equipment, goodwill and intangible assets are evaluated at each reporting date for indications of impairment losses. Wherever such indicationsexist, or in the case of assets which are subject to an annual impairment test, recoverable amount is estimated. An asset’s recoverable amount is the higher of fair value less costs to sell and value in use. In assessing value in use, the estimated future cash flows deriving from the use of the asset or its cash generating unit, as applicable, are discounted to their present value using a pre-tax discount rate that reflects current market assessments of the time value of money and the risks specific to the asset. When the carrying amount of an asset
e) Property, plant and equipment
Years of estimated useful life
Buildings 25 – 40 Plant and machinery 10 – 15 Telephone installations, networks and subscriber equipment 5 – 20 Furniture, tools and other items 2 – 10
f) Impairment of non-current assets
F-15

exceeds its recoverable amount, the asset is considered to be impaired. In this case, the carrying amount is written down to recoverable amount and the resulting loss is taken to the incomestatement. Future depreciation or amortization charges are adjusted for the asset’s new carrying amount over its remaining useful life. Each asset is assessed individually for impairment, unless theasset does not generate cash inflows that are largely independent of those from other assets (or cash generating units).
The Group bases the calculation of impairment on the business plans of the various cash generating units to which the assets are allocated. These business plans generally cover a period of three tofive years. For periods after the term of the strategic plan, an expected constant or decreasing growth rate is applied to the projections based on these plans. The growth rates used in 2011 and 2010are as follows:
The main variables used by management to determine recoverable amounts are ARPU (average revenues per user), customer acquisition and retention costs, share of net adds in accesses, marketshares, investments in non-current assets, growth rates and discount rates.
Tax discount rates are adjusted for country and business risks. The following ranges of rates were used in 2011 and 2010:
When there are new events or changes in circumstances that indicate that a previously recognized impairment loss no longer exists or has been decreased, a new estimate of the asset’s recoverable amount is made. A previously recognized impairment loss is reversed only if there has been a change in the estimates used to determine the asset’s recoverable amount since the last impairmentloss was recognized. If that is the case, the carrying amount of the asset is increased to its recoverable amount. The reversal is limited to the net carrying amount that would have been determinedhad no impairment loss been recognized for the asset in prior years. Such reversal is recognized in profit or loss and the depreciation charge is adjusted in future periods to allocate the asset’s revised carrying amount. Impairment losses relating to goodwill cannot be reversed in future periods.
The determination of whether an arrangement is, or contains a lease is based on the substance of the agreement and requires an assessment of whether the fulfillment of the arrangement isdependent on the use of a specific asset and the agreement conveys a right to the Telefónica Group to the use of the asset.
Leases where the lessor does not transfer substantially all the risks and benefits of ownership of the asset are classified as operating leases. Operating lease payments are recognized as an expensein the income statement on a straight-line basis over the lease term.
Rates 2011 2010
Businesses in Spain 0.51%-0.59% 0.91%-1.10% Businesses in Latin America 1.75%-2.58% 1.66%-2.56% Businesses in Europe 0.96%-1.07% 1.28%-1.46%
Rates 2011 2010 Businesses in Spain 7.5%-14.8% 7.8%-8.6% Businesses in Latin America 7.3%-17.8% 7.2%-17.3% Businesses in Europe 5.9%-11.2% 6.3%-10.9%
g) Lease payments
F-16

Leases are classified as finance leases when the terms of the lease transfer substantially all the risks and rewards incidental to ownership of the leased item to the Group. These are classified at theinception of the lease, in accordance with its nature and the associated liability, at the lower of the present value of the minimum lease payments or the fair value of the leased property. Leasepayments are apportioned between finance costs and reduction of the principal of lease liability so as to achieve a constant rate of interest on the remaining balance of the liability. Finance costsare reflected in the income statement over the lease term.
In firm sale and leaseback transactions resulting in a finance lease, the asset sold is not derecognized and the case received is considered finance for the lease term. However, when the sale andleaseback transaction results in an operating lease, and it is clear that both the transaction and subsequent lease income are established at fair value, the asset is derecognized and any gain or lossgenerated on the transaction is recognized.
The Telefónica Group’s investments in companies over which it exercises significant influence but does not control or jointly control with third parties are accounted for using the equity method.The Group evaluates whether it exercises significant influence not only on the basis of its percentage ownership but also on the existence of qualitative factors such representation on the board ofdirectors of the investee, its participation in decision-making processes, interchange of managerial personnel and access to technical information. The carrying amount of investments in associatesincludes related goodwill and the consolidated income statement reflects the share of profit or loss from operations of the associate. If the associate recognizes any gains or losses directly inequity, the Group also recognizes the corresponding portion of these gains or losses directly in its own equity.
The Group assesses the existence of indicators of impairment of the investment in each associate at each reporting date in order to recognize any required valuation adjustments. To do so, therecoverable value of the investment as a whole is determined as described in Note 3.f.
All normal purchases and sales of financial assets are recognized in the statement of financial position on the trade date, i.e. the date that the Company commits to purchase or sell the asset. TheTelefónica Group classifies its financial instruments into four categories for initial recognition purposes: financial assets at fair value through profit or loss, loans and receivables, held-to-maturity investments and available-for-sale financial assets. When appropriate, the Company re-evaluates the designation at each financial year end.
Financial assets held for trading, i.e., investments made with the aim of realizing short-term returns as a result of price changes, are included in the category financial assets at fair value through profit or loss and presented as current or non-current assets, depending on their maturity. Derivatives are classified as held for trading unless they are designated as effective hedging instruments.The Group also classifies certain financial instruments under this category when doing so eliminates or mitigates measurement or recognition inconsistencies that could arise from the applicationof other criteria for measuring assets and liabilities or for recognizing gains and losses on different bases. Also in this category are financial assets for which an investment and disposal strategyhas been designed based on their fair value.
h) Investments in associates
i) Financial assets and liabilities
Financial investments
F-17

Financial instruments included in this category are recorded at fair value and are remeasured at subsequent reporting dates at fair value, with any realized or unrealized gains or losses recognizedin the income statement.
Financial assets with fixed maturities that the Group has the positive intention and ability – legal and financial – to hold until maturity are classified as held-to-maturity and presented as “Current assets” or “Non-current assets,” depending on the time left until settlement. Financial assets falling into this category are measured at amortized cost using the effective interest rate method. Gainsand losses are recognized in the income statement when the investments are settlement or impaired, as well as through the amortization process.
Financial assets which the Group intends to hold for an unspecified period of time and could be sold at any time to meet specific liquidity requirements or in response to interest-rate movements are classified as available-for-sale. These investments are recorded under “Non-current assets,” unless it is probable and feasible that they will be sold within 12 months. Financial assets in thiscategory are measured at fair value. Gains or losses arising from changes in fair value are recognized in equity at each financial year end until the investment is derecognized or determined to beimpaired, at which time the cumulative gain or loss previously reported in equity is recognized in profit or loss. Dividends from available-for-sale investments are recognized in the income statement when the Group has the right to receive the dividend. Fair value is determined in accordance with the following criteria:
Fair value is considered to be quoted market price or other valuation references available at the closing date.
Fair value is determined using valuation techniques such as discounted cash flow analysis, option valuation models, or by reference to arm’s length market transactions. Exceptionally, withequity instruments, when fair value cannot be reliably determined, the investments are carried at cost.
Loans and receivables include financial assets with fixed or determinable payments that are not quoted in an active market and do not fall into any of the previous categories. These assets arecarried at amortized cost using the effective interest rate method. Gains and losses are recognized in the income statement when the loans and receivables are derecognized or impaired, as well asthrough the amortization process. Trade receivables are recognized at the original invoice amount. A valuation adjustment is recorded when there is objective evidence of customer collection risk.The amount of the valuation adjustment is calculated as the difference between the carrying amount of the doubtful trade receivables and their recoverable amount. As a general rule, current tradereceivables are not discounted.
The Group assesses at each reporting date whether a financial asset is impaired. If there is objective evidence that an impairment loss on a financial asset carried at amortized cost has beenincurred, the amount of the loss is measured as the difference between the asset’s carrying amount and the present value of estimated future cash flows (excluding future expected credit losses thathave not been incurred) discounted at the financial asset’s original effective interest rate.
For equity instruments included in available-for-sale financial assets, the Company assesses individually for each security whether there is any objective evidence that an asset is impaired as aresult of one or more events indicating that the carrying amount of the security will not be recovered. If there is objective evidence that an available-for-sale financial instrument is
1. Listed securities on active markets:
2. Unlisted securities:
F-18

impaired, the cumulative loss recognized in equity, measured as the difference between the acquisition cost (net of any principal payments and amortization made) and the fair value at that date,less any impairment loss on that investment previously recognized in the income statement, is removed from equity and recognized in the consolidated income statement.
Financial assets are only fully or partially derecognized when:
Cash and cash equivalents
Cash and cash equivalents comprise cash on hand and at banks, demand deposits and other highly liquid investments with an original maturity of three months or less. These items are stated athistorical cost, which does not differ significantly from realizable value.
For the purpose of the consolidated statement of cash flows, cash and cash equivalents are shown net of any outstanding bank overdrafts.
Preferred stock
Preferred shares are classified as a liability or equity instrument depending on the issuance terms. A preferred share issue is considered equity only when the issuer is not obliged to give cash oranother financial instrument in the form of either principle repayment or dividend payment, whereas it is recorded as a financial liability on the statement of financial position whenever theTelefónica Group does not have the right to avoid cash payments.
These debts are recognized initially at the fair value of the consideration received less directly attributable transaction costs. After initial recognition, these financial liabilities are measured atamortized cost using the effective interest rate method. Any difference between the cash received (net of transaction costs) and the repayment value is recognized in the income statement over thelife of the debt. Interest-bearing debt is considered non-current when its maturity is over 12 months or the Telefónica Group has full discretion to defer settlement for at least another 12 monthsfrom the reporting date.
Financial liabilities are derecognized when the obligation under the liability is discharged, cancelled or expires. Where an existing financial liability is replaced by another from the same lenderunder substantially different terms, such an exchange is treated as a derecognition of the original liability and the recognition of a new liability, and the difference between the respective carryingamounts is recognized in the income statement.
Derivative financial instruments are initially recognized at fair value, normally equivalent to cost. Their carrying amounts are subsequently remeasured at fair value. Derivatives are carried asassets when the fair value is positive and as liabilities when the fair value is negative. They are classified as current or non-current depending on whether they fall due within less than or
1. The rights to receive cash flows from the asset have expired.
2. An obligation to pay the cash flows received from the asset to a third party has been assumed.
3. The rights to receive cash flows from the asset have been transferred to a third party and all the risks and rewards of the asset have been substantially transferred.
Issues and interest-bearing debt
Derivative financial instruments and hedge accounting
F-19

after one year, respectively. Derivatives that meet all the criteria for consideration as long-term hedging instruments are recorded as non-current assets or liabilities, depending on their positive ornegative values.
The accounting treatment of any gain or loss resulting from changes in the fair value of a derivative depends on whether the derivative in question meets all the criteria for hedge accounting and, ifappropriate, on the nature of the hedge.
The Group designates certain derivatives as:
A hedge of the foreign currency risk of a firm commitment may be accounted for as a fair value or a cash flow hedge.
Changes in fair value of derivatives that qualify as fair value hedges are recognized in the income statement, together with changes in the fair value of the hedged asset or liability attributable tothe risk being hedged.
Changes in the fair value of derivatives that qualify and have been assigned to hedge cash flows, which are highly effective, are recognized in equity. The portion considered ineffective is takendirectly to the income statement. Fair value changes from hedges that relate to firm commitments or forecast transactions that result in the recognition of non-financial assets or liabilities are included in the initial measurement of those assets or liabilities. Otherwise, changes in fair value previously recognized in equity are recognized in the income statement in the period in which thehedged transaction affects profit or loss.
An instrument designed to hedge foreign currency exposure from a net investment in a foreign operation is accounted for in a similar manner to cash flow hedges.
The application of the Company’s corporate risk-management policies could result in financial risk-hedging transactions that make economic sense, yet do not comply with the criteria andeffectiveness tests required by accounting policies to be treated as hedges. Alternatively, the Group may opt not to apply hedge accounting criteria in certain instances. In these cases, gains orlosses resulting from changes in the fair value of derivatives are taken directly to the income statement. Transactions used to reduce the exchange rate risk relating to the income contributed byforeign subsidiaries are not treated as hedging transactions.
From inception, the Group formally documents the hedging relationship between the derivative and the hedged item, as well as the associated risk management objectives and strategies. Thedocumentation includes identification of the hedge instrument, the hedged item or transaction and the nature of the risk being hedged. In addition, it states how it will assess the hedginginstrument’s effectiveness in offsetting the exposure to changes in the hedged item’s fair value or cash flows attributable to the hedged risk. Hedge effectiveness is assessed, prospectively andretrospectively, both at the inception of the hedge relationship and on a systematic basis throughout the life of the hedge.
1. Fair value hedges, when hedging the exposure to changes in the fair value of a recognized asset or liability or a firm transaction;
2. Cash flow hedges, when hedging exposure to variability in cash flows that is either attributable to a particular risk associated with a recognized asset or liability or a highly probable forecasttransaction; or
3. Hedges of a net investment in a foreign operation.
F-20

Hedge accounting is discontinued whenever the hedging instrument expires or is sold, terminated or settled, the hedge no longer meets the criteria for hedge accounting or the Company revokesthe designation. In these instances, gains or losses accumulated in equity are not taken to the income statement until the forecast transaction or commitment affects profit or loss. However, if thehedged transaction is no longer expected to occur, the cumulative gains or losses recognized directly in equity are taken immediately to the income statement.
The fair value of the derivative portfolio includes estimates based on calculations using observable market data, as well as specific pricing and risk-management tools commonly used by financialentities.
Materials stored for use in investment projects and inventories for consumption and replacement are valued at the lower of weighted average cost and net realizable value.
When the cash flows associated with the purchase of inventory are effectively hedged, the corresponding gains and losses accumulated in equity become part of the cost of the inventoriesacquired.
Obsolete, defective or slow-moving inventories have been written down to estimated net realizable value. The recoverable amount of inventory is calculated based on inventory age and turnover.
Treasury shares are stated at cost and deducted from equity. Any gain or loss obtained on the purchase, sale, issue or cancellation of treasury shares is recognized directly in equity.
Call options on treasury shares to be settled through the physical delivery of a fixed number of shares at a fixed price are considered treasury share instruments. They are valued at the amount ofpremium paid and are presented as a reduction in equity. If the call options are exercised upon maturity, the amount previously recognized is reclassified as treasury shares together with the pricepaid. If the options are not exercised upon maturity, the amount is recognized directly in equity.
Provisions required to cover the accrued liability for defined-benefit pension plans are determined using “the projected unit credit” actuarial valuation method. The calculation is based ondemographic and financial assumptions for each country considering the macroeconomic environment. The discount rates are determined based on market yield curves. Plan assets are measured atfair value. Actuarial gains and losses on post-employment defined-benefit plans are recognized immediately in equity.
For defined-contribution pension plans, the obligations are limited to the payment of the contributions, which are taken to the income statement as accrued.
Provisions for post-employment benefits (e.g. early retirement or other) are calculated individually based on the terms agreed with the employees. In some cases, these may require actuarialvaluations based on both demographic and financial assumptions.
j) Inventories
k) Treasury share instruments
l) Provisions
Pensions and other employee obligations
F-21

Provisions are recognized when the Group has a present obligation (legal or constructive), as a result of a past event, it is probable that an outflow of resources embodying economic benefits willbe required to settle the obligation and a reliable estimate can be made of the amount of the obligation. When the Group expects some or all of a provision to be reimbursed, for example under aninsurance contract, the reimbursement is recognized as a separate asset, but only when the reimbursement is virtually certain. The expense relating to any provision is presented in the incomestatement net of any reimbursement. If the effect of the time value of money is material, provisions are discounted, and the corresponding increase in the provision due to the passage of time isrecognized as a finance cost.
The Group has compensation systems linked to the market value of its shares, providing employees share options. Certain compensation plans are cash-settled, while equity-settled in others.
For cash-settled share-based transactions, the total cost of the rights granted is recognized as an expense in the income statement over the vesting period with recognition of a correspondingliability (Performance period). The total cost of the options is measured initially at fair value at the grant date using statistical techniques, taking into account the terms and conditions establishedin each share option plan. At each subsequent reporting date, the Group reviews its estimate of fair value and the number of options it expects to be settled, remeasuring the liability, with anychanges in fair value recognized in the income statement.
For equity-settled share option plans, fair value at the grant date is measured by applying statistical techniques or using benchmark securities. The cost is recognized, together with a correspondingincrease in equity, over the vesting period. At each subsequent reporting date, the Company reviews its estimate of the number of options it expects to vest, with a corresponding adjustment toequity.
This heading in the accompanying consolidated income statement includes all the expenses and credits arising from the corporate income tax levied on the Spanish Group companies and similartaxes applicable to the Group’s foreign operations.
The income tax expense of each year includes both current and deferred taxes, where applicable.
Current tax assets and liabilities for the current and prior periods are measured at the amount expected to be recovered from or paid to the taxation authorities. The tax rates and tax laws used tocompute the amount are those that are enacted or substantively enacted by the reporting date.
Deferred taxes are calculated based on a statement of financial position analysis of the temporary differences generated as a result of the difference between the tax bases of assets and liabilitiesand their respective carrying amounts.
The main temporary differences arise due to discrepancies between the tax bases and carrying amounts of property, plant and equipment, intangible assets, and non-deductible provisions, as well as differences in the fair value and tax bases of net assets acquired from a subsidiary, associate or joint venture.
Other provisions
m) Share-based payments
n) Corporate income tax
F-22

Furthermore, deferred taxes arise from unused tax credits and tax loss carryforwards.
The Group determines deferred tax assets and liabilities by applying the tax rates that will be effective when the corresponding asset is received or the liability is settled, based on tax rates and taxlaws that are enacted (or substantively enacted) at the reporting date.
Deferred income tax assets and liabilities are not discounted to present value and are classified as non-current, irrespective of the date of their reversal.
The carrying amount of deferred income tax assets is reviewed at each reporting date and reduced to the extent that it is no longer probable that sufficient taxable profit will be available to allowall or part of the deferred income tax asset to be utilized. Unrecognized deferred income tax assets are reassessed at each reporting date and are recognized to the extent that it has become probablethat future taxable profit will allow the deferred tax asset to be recovered.
Deferred tax liabilities on investments in subsidiaries, branches, associates and joint ventures are not recognized if the parent company is in a position to control the timing of the reversal and ifthe reversal is unlikely to take place in the foreseeable future.
Deferred income tax relating to items directly recognized in equity is recognized in equity. Deferred tax assets and liabilities arising from the initial recognition of the purchase price allocation ofbusiness combinations impact the amount of goodwill. However, subsequent changes in tax assets acquired in a business combination are recognized as an adjustment to profit or loss.
Deferred tax assets and liabilities are offset if a legally enforceable right exists to set off current tax assets against current tax liabilities and the deferred taxes relate to the same taxable entity andthe same taxation authority.
Revenue and expenses are recognized on the income statement based on an accruals basis; i.e. when the goods or services represented by them take place, regardless of when actual payment orcollection occurs.
The Telefónica Group principally obtains revenues from providing the following telecommunications services: traffic, connection fees, regular (normally monthly) network usage fees,interconnection, network and equipment leasing, handset sales and other services such as pay TV and value-added services (e.g. text or data messaging) and maintenance. Products and services may be sold separately or in promotional packages (bundled).
Revenues from calls carried on Telefónica’s networks (traffic) entail an initial call establishment fee plus a variable call rate, based on call length, distance and type of service. Both wireline andwireless traffic is recognized as revenue as service is provided. For prepaid calls, the amount of unused traffic generates a deferred revenue recognized in “Trade and other payables” on the statement of financial position. Prepaid cards generally expire within 12 months and any deferred revenue from prepaid traffic is taken directly to the income statement when the card expires asthe Group has no obligation to provide service after this date.
Revenue from traffic sales and services at a fixed rate over a specified period of time (flat rate) are recognized on a straight-line basis over the period of time covered by the rate paid by the customer.
o) Revenue and expenses
F-23

Connection fees arising when customers connect to the Group’s network are deferred and taken to the income statement throughout the average estimated customer relationship period, whichvaries by type of service. All related costs, except those related to network enlargement expenses, administrative expenses and overhead, are recognized in the income statement as incurred.
Installment fees are taken to the income statement on a straight-line basis over the related period. Equipment leases and other services are taken to profit or loss as they are consumed.
Interconnection revenues from wireline-wireless and wireless-wireline calls and other customer services are recognized in the period in which the calls are made.
Revenues from handset and equipment sales are recognized once the sale is considered complete, i.e., generally when delivered to the end customer.
In the wireless telephony business there are loyalty campaigns whereby customers obtain points for the telephone traffic they generate. The amount assigned to points awarded is recognized asdeferred income until the points are exchanged and recognized as sales or services according to the product or service chosen by the customer. This exchange can be for discounts on the purchaseof handsets, traffic or other types of services depending on the number of points earned and the type of contract involved. The accompanying consolidated statements of financial position includethe related deferred revenue, based on an estimate of the value of the points accumulated at year-end, under “Trade and other payables.”
Bundle packages, which include different elements, are sold in the wireline, wireless and internet businesses. They are assessed to determine whether it is necessary to separate the separatelyidentifiable elements and apply the corresponding revenue recognition policy to each element. Total package revenue is allocated among the identified elements based on their respective fairvalues (i.e. the fair value of each element relative to the total fair value of the package).
As connection or initial activation fees, or upfront non-refundable fees, cannot be separately identifiable as elements in these types of packages, any revenues received from the customer for theseitems are allocated to the remaining elements. However, amounts contingent upon delivery of undelivered elements are not allocated to delivered elements.
All expenses related to mixed promotional packages are taken to the income statement as incurred.
The key assumptions concerning the future and other relevant sources of uncertainty in estimates at the reporting date that could have a significant impact on the consolidated financial statementswithin the next financial year are discussed below.
A significant change in the facts and circumstances on which these estimates and related judgments are based could have a material impact on the Group’s results and financial position.
p) Use of estimates, assumptions and judgments
F-24

Property, plant and equipment, intangible assets and goodwill
The accounting treatment of investments in property, plant and equipment and intangible assets entails the use of estimates to determine the useful life for depreciation and amortization purposesand to assess fair value at their acquisition dates for assets acquired in business combinations.
Determining useful life requires making estimates in connection with future technological developments and alternative uses for assets. There is a significant element of judgment involved inmaking technological development assumptions, since the timing and scope of future technological advances are difficult to predict.
When an item of property, plant and equipment or an intangible asset is considered to be impaired, the impairment loss is recognized in the income statement for the period. The decision torecognize an impairment loss involves estimates of the timing and amount of the impairment, as well as analysis of the reasons for the potential loss. Furthermore, additional factors, such astechnological obsolescence, the suspension of certain services and other circumstantial changes are taken into account.
The Telefónica Group evaluates its cash-generating units’ performance regularly to identify potential goodwill impairments. Determining the recoverable amount of the cash-generating units to which goodwill is allocated also entails the use of assumptions and estimates and requires a significant element of judgment.
Deferred income taxes
The Group assesses the recoverability of deferred tax assets based on estimates of future earnings. The ability to recover these taxes depends ultimately on the Group’s ability to generate taxable earnings over the period for which the deferred tax assets remain deductible. This analysis is based on the estimated schedule for reversing deferred tax liabilities, as well as estimates of taxableearnings, which are sourced from internal projections and are continuously updated to reflect the latest trends.
The recognition of tax assets and liabilities depends on a series of factors, including estimates as to the timing and realization of deferred tax assets and the projected tax payment schedule. ActualGroup company income tax receipts and payments could differ from the estimates made by the Group as a result of changes in tax legislation or unforeseen transactions that could affect taxbalances.
Provisions
Provisions are recognized when the Group has a present obligation as a result of a past event, it is probable that an outflow of resources will be required to settle the obligation and a reliableestimate can be made of the amount of the obligation. This obligation may be legal or constructive, deriving from inter alia regulations, contracts, normal practices or public commitments that leadthird parties to reasonably expect that the Group will assume certain responsibilities. The amount of the provision is determined based on the best estimate of the outflow of resources required tosettle the obligation, bearing in mind all available information at the statement of financial position date, including the opinions of independent experts such as legal counsel or consultants.
Given the uncertainties inherent in the estimates used to determine the amount of provisions, actual outflows of resources may differ from the amounts recognized originally on the basis of theestimates.
F-25

Revenue recognition
Connection fees
Connection fees, generated when customers connect to the Group’s network, are deferred and recognized as revenue over the average estimated customer relationship period.
The estimate of the average estimated customer relationship period is based on the recent history of customer churn. Potential changes in estimates could lead to changes in both the amount andtiming of the future recognition of revenues.
Bundled offers
Bundled offers that combine different elements are assessed to determine whether it is necessary to separate the different identifiable components and apply the corresponding revenue recognitionpolicy to each element. Total package revenue is allocated among the identified elements based on their respective fair values.
Determining fair values for each identified element requires estimates that are complex due to the nature of the business.
A change in estimates of fair values could affect the apportionment of revenue among the elements and, as a result, the date of recognition of revenues.
The consolidation methods applied are as follows:
In certain circumstances, some of the Group’s investees may require a qualified majority to adopt certain resolutions. This, together with other factors, is taken into account when selecting theconsolidation method.
All material accounts and transactions between the consolidated companies were eliminated on consolidation. The returns generated on transactions involving capitalizable goods or services bysubsidiaries with other Telefónica Group companies were eliminated on consolidation.
The financial statements of the consolidated companies have the same financial year-end as the parent company’s individual financial statements and are prepared using the same accounting policies. In the case of Group companies whose accounting and valuation methods differed from those of the Telefónica Group, adjustments were made on consolidation in order to present theconsolidated financial statements on a uniform basis.
q) Consolidation methods
− Full consolidation method for companies over which the Company controls either by exercising effective control or by virtue of agreements with the other shareholders.
− Proportionate consolidation method for companies which are jointly controlled with third parties (joint ventures). Similar items are grouped together such that the corresponding proportionof these companies’ overall assets, liabilities, expenses and revenues and cash flows are integrated on a line by line basis into the consolidated financial statements.
− Equity method for companies in which there is significant influence, but not control or joint control with third parties.
F-26

The consolidated income statement and consolidated statement of cash flows include the revenues and expenses and cash flows of companies that are no longer in the Group up to the date onwhich the related holding was sold or the company was liquidated, and those of the new companies included in the Group from the date on which the holding was acquired or the company wasincorporated through year end.
Revenue and expenses associated with discontinued operations are presented in a separate line on the consolidated income statement. Discontinued operations are those with identifiable operationsand cash flows (for both operating and management purposes) and that represent a line of business or geographic unit which has been disposed of or is available for sale.
The share of non-controlling interests in the equity and results of the fully consolidated subsidiaries is presented under "Non-controlling interests" on the consolidated statement of financial position and income statement, respectively.
Changes in investments in subsidiaries without loss of control:
Prior to January 1, 2010, the effective date of IAS 27 (Amended) Consolidated and separate financial statements, the Telefónica Group treated increases in equity investments of companies already controlled by the Group via purchases of non-controlling interests by recognizing any difference between the acquisition price and the carrying amount of the non-controlling interest’s participation as goodwill. In transactions involving the sale of investments in subsidiaries in which the Group retained control, the Telefónica Group derecognized the carrying amount of theshareholding sold, including any related goodwill. The difference between this amount and the sale price was recognized as a gain or loss in the consolidated income statement.
Effective January 1, 2010, any increase or decrease in the percentage of ownership interests in subsidiaries that does not result in a loss of control is accounted for as a transaction with owners intheir capacity as owners, which means that as of the aforementioned date, these transactions do not give rise to goodwill or generate profit or loss; any difference between the carrying amount ofthe non-controlling interests and the fair value of the consideration received or paid, as applicable, is recognized in equity.
Commitments to acquire non-controlling interests (put options):
Put options granted to non-controlling interests of subsidiaries are measured at the exercise price and classified as a financial liability, with a deduction from non-controlling interests on the consolidated statement of financial position at each reporting date. Prior to January 1, 2010, the effective date of IAS 27 (Amended) Consolidated and separate financial statements, where the exercise price exceeded the balance of non-controlling interests, the difference was recognized as an increase in the goodwill of the subsidiary. At each reporting date, the difference was adjustedbased on the exercise price of the options and the carrying amount of non-controlling interests. As of January 1, 2010, the effect of this adjustment is recognized in equity in line with the treatmentof transactions with owners described in the previous paragraphs.
r) Acquisitions and disposals of non-controlling interests
F-27

The accounting policies applied in the preparation of the financial statements for the year ended December 31, 2011 are consistent with those used in the preparation of the Group’s consolidated annual financial statements for the year ended December 31, 2010, except for the application of new standards, amendments to standards and interpretations published by the InternationalAccounting Standards Board (IASB) and the IFRS Interpretations Committee (IFRIC), and adopted by the European Union, effective as of January 1, 2011, noted below:
This revised standard includes the following changes: (i) it includes a partial exemption for entities with government shareholdings, which requires disclosures of information on balancesand transactions with these entities only if they are significant, taken individually or collectively; and (ii) includes a new revised definition of a “related party.” The adoption of this standard has had no impact on the disclosures included in the Group’s consolidated financial statements.
The purpose of this change is to clarify that rights issues that allow a set number of own equity instruments to be acquired for a fixed exercise price are classified as equity, regardless of thecurrency in which the exercise price is denominated, provided that the issue is aimed at all holders of the same class of shares in proportion to the number of shares they already own. Theadoption of these changes has had no impact on the financial position or results of the Group.
These improvements establish a series of amendments to current IFRS with the aim of removing inconsistencies and clarifying wording. These amendments have had no impact on theresults or financial position of the Group.
This interpretation establishes that: (i) when the terms of a financial liability are renegotiated with the creditor and the creditor accepts the company’s equity instruments to extinguish all or part of the liability, the instruments issued are considered to be part of the consideration paid to extinguish the financial liability; (ii) these instruments must be measured at their fair value,unless this cannot be reliably estimated, in which case the valuation of the new instruments must reflect the fair value of the financial liability settled; and (iii) the difference between thecarrying amount of the extinguished financial liability and the initial value of the equity instrument issued is recognized in the income statement for the period. The adoption of these criteriaintroduced by this new interpretation has had no impact on the financial position or results of the Group.
This change is applied in specific situations in which the company is obligated to make minimum annual contributions to its defined benefit plan and make prepayments in order to meetthis obligation. The amendment allows the company to consider the economic benefits that arise from such prepayments as an asset. The adoption of these criteria has had no impact on thefinancial position or results of the Group.
s) New IFRS and interpretations of the IFRS Interpretations Committee (IFRIC)
− Revised IAS 24, Related party disclosures
− Amendments to IAS 32, Classification of rights issues
− Improvements to IFRSs (May 2010)
− IFRIC 19, Extinguishing financial liabilities with equity instruments
− Amendments to IFRIC 14, Prepayments when there is a minimum funding requirement
F-28

New standards and IFRIC interpretations issued but not effect as of December 31, 2011 At the date of preparation of the accompanying consolidated financial statements, the following IFRS, amendments and IFRIC interpretations had been published, but their application was notmandatory:
The Group is currently assessing the impact of the application of these standards, amendments and interpretations. Based on the analyses made to date, the Group estimates that their adoption will not have a significant impact on the consolidated financial statements in the initial period of application. However, thechanges introduced by IFRS 9 will affect financial instruments and transactions with financial assets carried out on or after January 1, 2015.
Combining the wireline and wireless telephony services underscores the need to manage the business by region in order to offer customers the best integrated solutions and support wireless-wireline convergence.
Standards and amendments Mandatory application: annual periods beginning on
or after
IFRS 9 Financial instruments January 1, 2015
IFRS 10 Consolidated financial statements January 1, 2013
IFRS 11 Joint arrangements January 1, 2013
IFRS 12 Disclosures of interests in other entities January 1, 2013
IFRS 13 Fair value measurement January 1, 2013
Revised IAS 19 Employee benefits January 1, 2013
Revised IAS 27 Separate financial statements January 1, 2013
Revised IAS 28 Investments in associates and joint ventures January 1, 2013
Amendments to IFRS 7
Disclosures - Transfers of financial assets July 1, 2011
Disclosures – Offsetting of financial assets and liabilities January 1, 2013
Disclosures - Transition to IFRS 9 January 1, 2015
Amendments to IAS 1 Presentation of items of other comprehensive income July 1, 2012
Amendments to IAS 12 Deferred tax: Recovery of underlying assets January 1, 2012
Amendments to IAS 32 Offsetting of financial assets and liabilities January 1, 2014
Interpretations Mandatory application: annual periods beginning on
or after
IFRIC 20 Stripping costs in the production phase of a surface mine January 1, 2013
(4) SEGMENT INFORMATION
F-29

To implement this management model, the Group had three large business areas in 2011: Telefónica Spain, Telefónica Europe and Telefónica Latin America, with each overseeing the integratedbusiness. This forms the basis of the segment reporting in these consolidated financial statements. Telefónica Spain oversees the wireline and wireless telephony, broadband, internet, data, broadband TV, value added services operations and their development in Spain. Telefónica Latin America oversees the same operations in Latin America. Telefónica Europe oversees the wireline, wireless, broadband, value added services and data operations in the UK, Germany, Ireland, the Czech Republic and the Slovak Republic. The Telefónica Group is also involved in the media and contact center businesses through investments in Telefónica de Contenidos and Atento, included under “Other and eliminations” together with the consolidation adjustments and the remaining Group companies. The segment reporting takes into account the impact of the purchase price allocation (PPA) to assets acquired and the liabilities assumed from the companies included in each segment. The assets andliabilities presented in each segment are those managed by the heads of each segment, irrespective of their legal structure. Telefónica uses operating income before depreciation and amortization (OIBDA) to track the performance of the business and to establish operating and strategic targets. OIBDA is calculated byexcluding depreciation and amortization from operating income to eliminate the impact of investments in fixed assets that cannot be directly controlled by management in the short term. Therefore, it isconsidered to be more important for investors as it provides a gauge of segment operating performance and profitability using the same measures utilized by management. This metric also allows forcomparisons with other companies in the telecommunications sector without consideration of their asset structure. OIBDA is a commonly reported measure and is widely used among analysts, investors and other interested parties in the telecommunications industry, although not a measure explicitly defined in IFRS,and therefore, may not be comparable to similar indicators used by other companies. OIBDA should not be considered as an alternative to operating income as a measurement of our consolidatedoperating results or as an alternative to consolidated cash flows from operating activities as a measurement of our liquidity. The Group manages its borrowing activities and tax implications centrally. Therefore, it does not disclose the related assets, liabilities, revenue and expenses breakdown by reportable segments. In order to present the information by region, revenue and expenses arising from intra-group invoicing for the use of the trademark and management services have been eliminated from the operatingresults of each Group region, while centrally-managed projects have been incorporated at a regional level. These adjustments have no impact on the Group's consolidated results. Inter-segment transactions are carried out at market prices. Key information for these segments is as follows:
F-30

1 Revised to present, for comparative purposes, results for Telefónica International Wholesale Services (TIWS) and Telefónica North America (TNA), formerly part of Telefónica Latin America, andconsolidated within Telefónica Europe since January 1, 2011.
2011
Millions of euros Telefónica
Spain Telefónica
Latin America Telefónica
Europe Other and eliminations
Total Group
Revenues 17,284 29,237 15,524 792 62,837External revenues 16,941 29,138 15,212 1,546 62,837Inter-segment revenues 343 99 312 (754 ) -
Other operating income and expenses (12,212) (18,296) (11,291) (828) (42,627)OIBDA 5,072 10,941 4,233 (36) 20,210Depreciation and amortization (2,088) (4,783) (3,117) (158) (10,146)OPERATING INCOME 2,984 6,158 1,116 (194) 10,064CAPITAL EXPENDITURE 2,914 5,299 1,705 306 10,224INVESTMENTS IN ASSOCIATES 1 3 - 5,061 5,065FIXED ASSETS 15,070 43,890 28,133 1,541 88,634TOTAL ALLOCATED ASSETS 21,428 62,923 35,247 10,025 129,626TOTAL ALLOCATED LIABILITIES 12,768 27,289 9,754 52,429 102,243
2010 (revised1)
Millions of euros Telefónica
Spain Telefónica
Latin America Telefónica
Europe Other and eliminations
Total Group
Revenues 18,711 25,756 15,724 546 60,737External revenues 18,301 25,618 15,407 1,411 60,737Inter-segment revenues 410 138 317 (865 ) -
Other operating income and expenses (10,191) (12,043) (11,644) (1,082) (34,960)OIBDA 8,520 13,713 4,080 (536) 25,777Depreciation and amortization (2,009) (3,954) (3,201) (139) (9,303)OPERATING INCOME 6,511 9,759 879 (675) 16,474CAPITAL EXPENDITURE 2,021 5,455 3,152 216 10,844INVESTMENTS IN ASSOCIATES 1 71 - 5,140 5,212FIXED ASSETS 14,179 45,459 29,329 1,438 90,405TOTAL ALLOCATED ASSETS 23,291 64,963 36,199 5,322 129,775TOTAL ALLOCATED LIABILITIES 11,021 29,093 10,333 47,644 98,091
F-31

1 Revised to present, for comparative purposes, results for Telefónica International Wholesale Services (TIWS) and Telefónica North America (TNA), formerly part of Telefónica Latin America, andconsolidated within Telefónica Europe since January 1, 2011.
2009 (revised1)
Millions of euros Telefónica
Spain Telefónica
Latin America Telefónica
Europe Other and eliminations
Total Group
Revenues 19,703 22,709 13,954 365 56,731External revenues 19,354 22,600 13,653 1,124 56,731Inter-segment revenues 349 109 301 (759 ) -
Other operating income and expenses (9,946) (13,668) (9,955) (559) (34,128)OIBDA 9,757 9,041 3,999 (194) 22,603Depreciation and amortization (2,140) (3,700) (2,988) (128) (8,956)OPERATING INCOME 7,617 5,341 1,011 (322) 13,647CAPITAL EXPENDITURE 1,863 3,377 1,801 216 7,257INVESTMENTS IN ASSOCIATES 3 152 - 4,781 4,936FIXED ASSETS 14,082 24,441 27,537 1,351 67,411TOTAL ALLOCATED ASSETS 26,156 42,336 32,994 6,655 108,141TOTAL ALLOCATED LIABILITIES 13,363 22,614 6,769 41,121 83,867
F-32

The composition of segment revenues, detailed by the main countries in which the Group operates, is as follows:
1 Revised to present, for comparative purposes, results for Telefónica International Wholesale Services (TIWS) and Telefónica North America (TNA), formerly part of Telefónica Latin America, andconsolidated within Telefónica Europe since January 1, 2011.
On September 5, 2011, the Executive Committee of Telefónica, S.A.’s Board of Directors approved a new organizational structure, which will become fully operational starting in 2012. The maindifferences are:
This new organizational structure will revolve around a nine-member Executive Committee, backed by a Transformation Committee composed of the company’s senior managers.
Millions of euros
2011 2010 (revised1) 2009 (revised1)
Country Fixed Mobile Other and
eliminations Total Fixed MobileOther and
eliminations Total Fixed MobileOther and
eliminations Total
Spain 10,631 7,747 (1,094) 17,284 11,397 8,550 (1,236) 18,711 12,167 8,965 (1,429) 19,703
Latin America 29,237 25,756 22,709Brazil 5,890 8,436 (1,799) 14,326 6,843 4,959 (683) 11,119 5,766 3,036 (426) 8,376Argentina 1,237 2,039 (102) 3,174 1,187 1,979 (93) 3,073 1,047 1,643 (81) 2,609Chile 1,037 1,399 (126) 2,310 1,038 1,266 (107) 2,197 893 1,010 (72) 1,831Peru 1,069 1,088 (127) 2,030 1,097 1,001 (138) 1,960 1,006 840 (130) 1,716Colombia 682 916 (37) 1,561 700 872 (43) 1,529 615 685 (31) 1,269Mexico N/A 1,557 N/A 1,557 N/A 1,832 - 1,832 N/A 1,552 - 1,552Venezuela N/A 2,688 N/A 2,688 N/A 2,318 - 2,318 N/A 3,773 - 3,773Remaining operators and inter-segment eliminations 1,591 1,728 1,583
Europe 15,524 15,724 13,954UK 164 6,762 - 6,926 134 7,067 - 7,201 70 6,442 - 6,512Germany 1,426 3,609 - 5,035 1,412 3,414 - 4,826 558 3,188 - 3,746Czech Republic 913 1,217 - 2,130 960 1,237 - 2,197 1,015 1,248 (3) 2,260Ireland 12 711 N/A 723 4 844 - 848 1 904 - 905Remaining operators and inter-segment eliminations 710 652 531
Other and inter-segment eliminations 792 546 365
Total Group 62,837 60,737 56,731
• The streamlining and balancing of the business’ geographical mix based on stages of market development, leading to the configuration of two large blocks: Europe and Latin America.
• The creation of a new business unit, Telefónica Digital, headquartered in London with regional offices in Madrid, Sao Paulo, Silicon Valley and certain strategic hubs in Asia. Its mission will beto bolster Telefónica’s place in the digital world and leverage any growth opportunities arising in this environment, driving innovation, strengthening the product and service portfolio and maximizing the advantages of its large customer base.
• The creation of a Global Resources operating unit designed to ensure the profitability and sustainability of the business by leveraging and unlocking economies of scale, as well as drivingTelefónica’s transformation into a fully global group.
F-33

For information purposes, segment information for 2011 in accordance with the new definition of the Telefónica Group regions is as follows:
Business combinations
2011
Acquisition of Acens Technologies, S.L.
On June 7, 2011, the Telefónica Group formalized the acquisition of 100% of Acens Technologies, S.L., a leader in hosting/housing in Spain for small- and medium-sized enterprises.
The consideration paid for the purchase was approximately 55 million euros. After the preliminary allocation of the purchase price to the assets acquired and the liabilities assumed, the goodwillgenerated on the transaction was 52 million euros.
2010
Acquisition of Brasilcel, N.V.
As described in Note 2.b), on July 28, 2010, Telefónica and Portugal Telecom signed an agreement for the acquisition by Telefónica of 50% of the capital stock of Brasilcel, N.V. (company then jointlyowned by Telefónica and Portugal Telecom, which owned shares representing, approximately, 60% of the aforementioned capital stock of Brazilian company Vivo Participações, S.A.). The acquisitionprice for the aforementioned capital stock of Brasilcel was 7,500 million euros, of which 4,500 million euros was paid at the closing of the transaction on September 27, 2010, 1,000 million euros onDecember 30, 2010, and the remaining 2,000 million euros on October 31, 2011.
2011
Millions of euros Telefónica
Latin America Telefónica
Europe Other and eliminations
Total Group
Revenues 28,941 32,074 1,822 62,837External revenues 28,831 31,891 2,115 62,837Inter-segment revenues 110 183 (293 ) -
Other operating income and expenses (18,057) (22,803) (1,767) (42,627)OIBDA 10,884 9,271 55 20,210Depreciation and amortization (4,770) (5,076) (300) (10,146)OPERATING INCOME 6,114 4,195 (245) 10,064CAPITAL EXPENDITURE 5,263 4,515 446 10,224INVESTMENTS IN ASSOCIATES 3 1 5,061 5,065FIXED ASSETS 43,716 42,584 2,334 88,634TOTAL ALLOCATED ASSETS 65,475 55,738 8,410 129,623TOTAL ALLOCATED LIABILITIES 27,124 21,910 53,206 102,240
(5) BUSINESS COMBINATIONS AND ACQUISITIONS OF NON-CONTROLLING INTERESTS
F-34

Furthermore, the aforementioned agreement established that Portugal Telecom waived its right to the declared dividend payable by Brasilcel of approximately 49 million euros. In accordance with IFRS 3, the Group opted to record at fair value the non-controlling interests of Vivo Participaçoes, S.A. corresponding to non-voting shares, determining such fair value based on adiscounted cash flows valuation determined in accordance with the company's business plans. In 2010, Telefónica proceeded to recognize and value the identifiable assets acquired and liabilities assumed at the date of acquisition. These values were determined using various measurement methods for each type of asset and/or liability based on the best available information. The advice of experts was also considered in addition tothe various other considerations made in determining these fair values. The methods and assumptions used to measure these fair values were as follows: Licenses The fair value of the licenses was determined through the use of the Multi-period Excess Earnings Method (MEEM), which is based on a discounted cash flows analysis of the estimated future economicbenefits attributable to the licenses, net of the elimination of charges related to contributing assets involved in the generation of such cash flows and excluding cash flows attributable to the customerbase. This method assumes that intangible assets rarely generate income on their own. Thus, the cash flows attributable to the licenses are those remaining after the return on investment of all the contributingassets required to generate the projected cash flows. Customer base The customer base was measured using the MEEM, which is based on a discounted cash flow analysis of the estimated future economic benefits attributable to the customer base, net of the eliminationof charges involved in its generation. An analysis of the average length of customer relationships, using the retirement rate method, was performed in order to estimate the remaining useful life of thecustomer base. The objective of the analysis of useful lives is to estimate a survival curve that predicts future customer churn of our current customer base. The so-called “Iowa curves” were considered to approximate the survival curve of customers. Trademark The fair value of the trademark was calculated using the “relief-from-royalty” method. This method establishes that an asset's value is calculated by capitalizing the royalties saved by holding theintellectual property. In other words the trademark owner generates a gain in holding the intangible asset rather than paying royalties for its use. The royalties saving was calculated by applying a marketroyalty rate (expressed as a percentage of revenues) to future revenues expected to be generated from the sale of products and services associated with the intangible asset. A market royalty rate is therate, normally expressed as a percentage of net revenues, that a knowledgeable, interested holder would charge a knowledgeable, interested user for the use of an asset in an arm's length transaction.
F-35
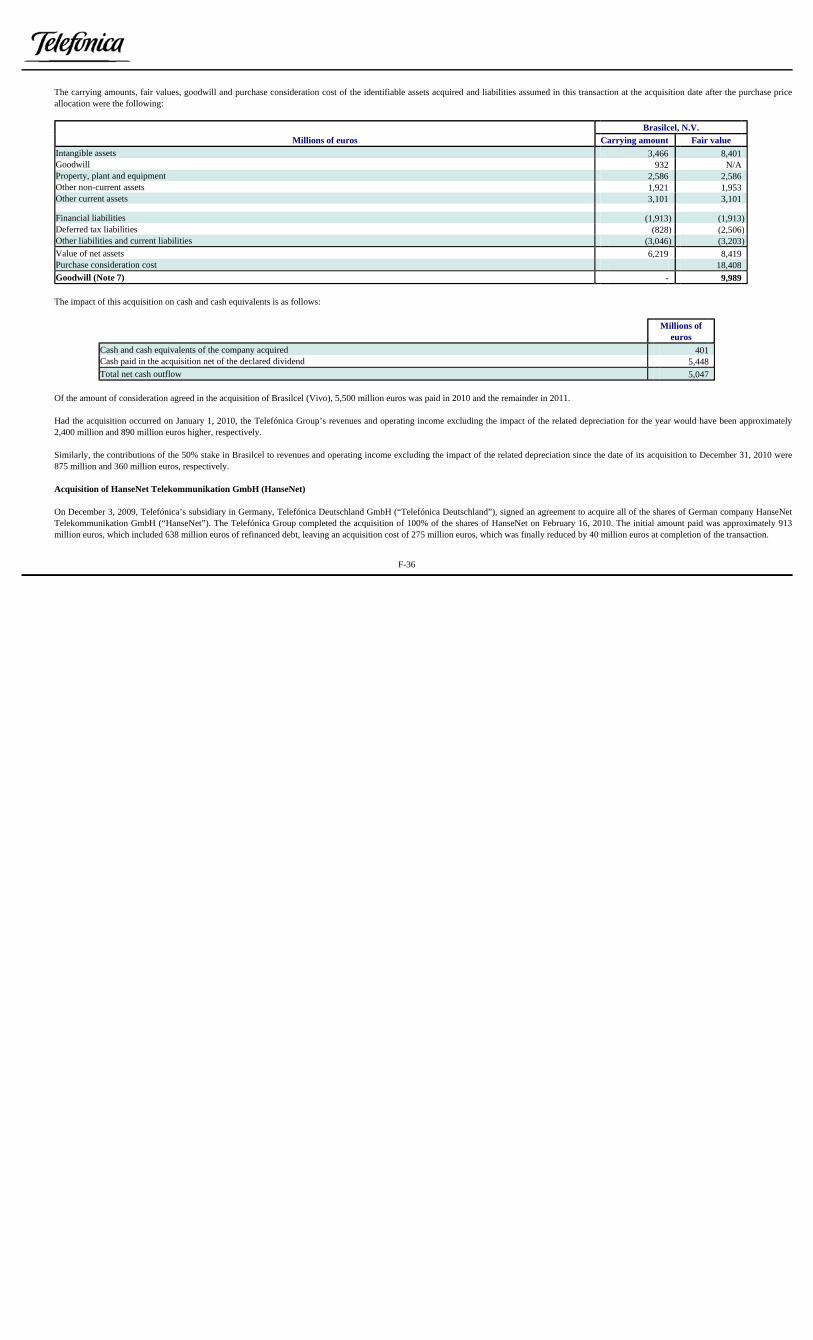
The carrying amounts, fair values, goodwill and purchase consideration cost of the identifiable assets acquired and liabilities assumed in this transaction at the acquisition date after the purchase priceallocation were the following:
The impact of this acquisition on cash and cash equivalents is as follows:
Of the amount of consideration agreed in the acquisition of Brasilcel (Vivo), 5,500 million euros was paid in 2010 and the remainder in 2011. Had the acquisition occurred on January 1, 2010, the Telefónica Group’s revenues and operating income excluding the impact of the related depreciation for the year would have been approximately2,400 million and 890 million euros higher, respectively. Similarly, the contributions of the 50% stake in Brasilcel to revenues and operating income excluding the impact of the related depreciation since the date of its acquisition to December 31, 2010 were875 million and 360 million euros, respectively. Acquisition of HanseNet Telekommunikation GmbH (HanseNet) On December 3, 2009, Telefónica’s subsidiary in Germany, Telefónica Deutschland GmbH (“Telefónica Deutschland”), signed an agreement to acquire all of the shares of German company HanseNet Telekommunikation GmbH (“HanseNet”). The Telefónica Group completed the acquisition of 100% of the shares of HanseNet on February 16, 2010. The initial amount paid was approximately 913million euros, which included 638 million euros of refinanced debt, leaving an acquisition cost of 275 million euros, which was finally reduced by 40 million euros at completion of the transaction.
Brasilcel, N.V.
Millions of euros Carrying amount Fair value
Intangible assets 3,466 8,401Goodwill 932 N/AProperty, plant and equipment 2,586 2,586Other non-current assets 1,921 1,953Other current assets 3,101 3,101
Financial liabilities (1,913) (1,913)Deferred tax liabilities (828) (2,506)Other liabilities and current liabilities (3,046) (3,203)Value of net assets 6,219 8,419Purchase consideration cost 18,408Goodwill (Note 7) - 9,989
Millions of
euros
Cash and cash equivalents of the company acquired 401Cash paid in the acquisition net of the declared dividend 5,448Total net cash outflow 5,047
F-36

Upon the acquisition of this shareholding, the purchase price was allocated to the identifiable assets acquired and the liabilities assumed using generally accepted valuation methods for each type of assetand/or liability, based on the best available information. The complete carrying amounts, fair values, goodwill and purchase consideration cost of the identifiable assets acquired and the liabilities assumed in this transaction at the date control was obtained areas follows:
In addition, the impact of this acquisition on cash and cash equivalents was as follows:
The contributions to the Telefónica Group’s revenues and operating income excluding the impact of the related depreciation from the consolidation of HanseNet in 2010 amounted to 786 million and 77million euros, respectively. 2009 No significant business combinations were carried out in 2009 that had been completed as of December 31, 2009.
Acquisitions of non-controlling interests 2011 Acquisition of non-controlling interests of Vivo Participações As described in Note 2, on October 26, 2010, Telefónica, S.A. announced a tender offer for the acquisition of all outstanding voting shares of Vivo Participações, S.A. (Vivo Participações) not alreadyowned or controlled by Telefónica, representing approximately 3.8% of its capital stock.
HanseNet Millions of euros Carrying amount Fair value
Intangible assets 277 309Goodwill 461 N/AProperty, plant and equipment 514 531Other assets 191 235
Financial liabilities (657) (665)Deferred tax liabilities - (101)Other liabilities and current liabilities (303) (356)Value of net assets 483 (47)Purchase consideration cost - 235Goodwill (Note 7) - 282
Millions of euros
Cash and cash equivalents of the company acquired 28Cash paid in the acquisition 235Total net cash outflow 207
F-37

This offer was approved by the Brazilian market regulator (C.V.M.) on February 11, 2011 and, after its execution, Telefónica acquired an additional 2.7% of Vivo Participações’ capital stock for 539 million euros, for a total of 62.3%. In addition, on March 25, 2011 the Boards of Directors of each of the subsidiaries controlled by Telefónica, Vivo Participações and Telesp approved the terms and conditions of a restructuring processwhereby all shares of Vivo Participações that were not owned by Telesp were exchanged for Telesp shares, at a rate of 1.55 new Telesp shares for each Vivo share. These shares then became theproperty of Telesp, whereby Vivo Participações then became a wholly owned subsidiary of Telesp. Once the shares were exchanged, the Telefónica Group became the owner of 73.9% of Telesp which,in turn, has 100% ownership of the shares of Vivo Participações. The impact of this transaction on equity attributable to non-controlling interests was a decrease of 661 million euros.
2010 There were no significant acquisitions of non-controlling interests in 2010. The detail of the main transactions carried out in 2010 is provided in Appendix I.
The composition of and movements in net intangible assets in 2011 and 2010 are as follows:
(6) INTANGIBLE ASSETS
Millions of euros
Balance at 12/31/10
Transfersand other
Inclusion of Companies
Translation
Exclusion ofCompanies
Balance at12/31/11 Additions Amortization Disposals
differences and hyperinflation adjustments
Development costs 206 106 (68) - (34) (1) - - 209Service concession arrangements and licenses 14,566 503 (1,041) (8) 1,387 (643) - - 14,764Software 3,526 1,249 (1,588) (2) 610 (63) - - 3,732Customer base 3,143 - (595) - 1 (73) 26 - 2,502Other intangible assets 2,172 26 (184) (4) (41) (53) - - 1,916Prepayments on intangible assets 1,413 953 - - (1,422) (3) - - 941Net intangible assets 25,026 2,837 (3,476) (14) 501 (836) 26 - 24,064
Millions of euros Translation
Balance at 12/31/09 Additions Amortization Disposals
Transfersand other
differences and hyperinflation
adjustment Inclusion of Companies
Exclusion ofCompanies
Balance at12/31/10
Development costs 162 104 (55) - (18) 2 11 - 206Service concession arrangements and licenses 8,842 1,237 (836) - 61 623 4,639 - 14,566Software 2,948 945 (1,381) - 558 134 322 - 3,526Customer base 2,681 - (563) - (141) 134 1,032 - 3,143Other intangible assets 1,139 41 (309) (18) 166 50 1,103 - 2,172Prepayments on intangible assets 74 1,638 - - (324) 5 20 - 1,413Net intangible assets 15,846 3,965 (3,144) (18) 302 948 7,127 - 25,026
F-38

The gross cost, accumulated amortization and impairment losses of intangible assets at December 31, 2011 and 2010 are as follows:
“Additions” in 2011 include the acquisition of spectrum licenses in Spain for 842 million euros (of which 793 million euros are recognized as prepayments on intangible assets as the licenses had not yetstarted), the acquisition of spectrum in band H (1.9 GHz/2.1GHz) in Brazil for 349 million euros, the acquisition of spectrum licenses in Costa Rica for 68 million euros and the acquisition of software. “Additions” in 2010 include the acquisition of the spectrum license in Mexico for 1,237 million euros, for the 1850-1910/1930-1990 MHz and 1710-1770/2110-2170 MHz frequencies. Telefónica México acquired eight additional blocks of radioelectric spectrum, equivalent to 140 MHz in the 1900 MHz auction and 60 MHz in the 1700 MHz auction. The cost of these licenses will be paid in 20years (Note 14). Furthermore, an advanced payment of 1,379 million euros was made for the license to use the spectrum in Germany, which was recognized as "Additions" of prepayments on intangibleassets and reclassified as concessions and licenses in 2011. Finally, we also made investments in software. Changes in the consolidation scope from inclusion of companies in 2010 primarily consisted of the consolidation of all assets of HanseNet, as well as the 50% interest in Vivo Participaçoes, S.A. (Note5).
Balance at December 31, 2011
Gross costAccumulated amortization
Impairment losses
Net intangible assets
Millions of euros Development costs 787 (578) - 209 Service concession arrangements and licenses 21,228 (6,464) - 14,764 Software 15,081 (11,326) (23) 3,732 Customer base 6,181 (3,679) - 2,502 Other intangible assets 3,358 (1,437) (5) 1,916 Prepayments on intangible assets 941 - - 941 Net intangible assets 47,576 (23,484) (28) 24,064
Balance at December 31, 2010
Gross costAccumulated amortization
Impairment losses
Net intangible
Millions of euros assets
Development costs 1,229 (1,023) - 206 Service concession arrangements and licenses 20,438 (5,872) - 14,566 Software 13,724 (10,172) (26) 3,526 Customer base 6,481 (3,338) - 3,143 Other intangible assets 3,445 (1,269) (4) 2,172 Prepayments on intangible assets 1,413 - - 1,413 Net intangible assets 46,730 (21,674) (30) 25,026
F-39

Details of the principal concessions and licenses with which the Group operates are provided in Appendix VI. At December 31, 2011 and 2010, the Group carried intangible assets with indefinite useful lives of 105 and 108 million euros, respectively, related primarily to permanent licenses to operate wirelesstelecommunications services in Argentina. Intangible assets are also subject to impairment tests whenever there are indicators of a potential loss in value and, in any event, at the end of each year for intangible assets with indefinite useful lives.There was no significant impairment recognized in the consolidated financial statements for 2011 and 2010 as a result of these impairment tests. “Other intangible assets” includes the amounts allocated to trademarks acquired in business combinations, of 2,292 million euros and 2,339 million euros at December 31, 2011 and 2010 (1,449 millioneuros and 1,586 million euros net of the related accumulated amortization), respectively. “Translation differences and hyperinflation adjustments” reflects the impact of exchange rate movements on opening balances, as well as the impact of the monetary adjustments due to hyperinflation inVenezuela. The effect of exchange rates on movements in the year is included in the column corresponding to such movement.
The movement in this heading assigned to each Group segment was the following:
Goodwill generated in the acquisition of foreign companies is treated as an asset denominated in the currency of the company acquired, and is therefore subject to exchange rate differences, which areincluded under “Translation differences.” The impairment tests carried out did not identify the need to recognize any material write-downs to goodwill at the 2011 and 2010 year ends as the recoverable amount, in all cases based on value in use,was higher than carrying amount.
(7) GOODWILL
Millions of euros
2011 Balance at 12/31/10 Acquisitions Disposals Transfers
Translation differences and hyperinflation adjustments
Balance at 12/31/11
Telefónica Spain 3,280 52 - - - 3,332Telefónica Latin America 15,672 - - (2) (626) 15,044Telefónica Europe 10,421 - (3) 2 110 10,530Other 209 - - - (8) 201Total 29,582 52 (3) - (524) 29,107
Millions of euros
2010 Balance at 12/31/09 Acquisitions Disposals Transfers
Translation differences and hyperinflation adjustments
Balance at 12/31/10
Telefónica Spain 3,238 42 - - - 3,280Telefónica Latin America 6,320 9,201 - (350) 501 15,672Telefónica Europe 9,810 397 (37) - 251 10,421Other 198 - - - 11 209Total 19,566 9,640 (37) (350) 763 29,582
F-40

In addition, sensitivity analyses were performed on changes reasonably expected to occur in the primary valuation variables, and the recoverable amount remained above the net carrying amount. 2011 “Additions” in 2011 relate to the goodwill arising on the acquisition of Acens Technologies, S.L. (see Note 5). 2010 “Additions” in 2010 include the goodwill generated on the acquisition of Vivo Participaçoes in the amount of 9,989 million euros which, net of the goodwill from the previously held investment, resultsin an addition to this line item of 9,200 million euros. Similarly, the acquisitions of HanseNet and Jajah led to increases in goodwill of 282 million and 115 million euros, respectively, while the acquisition of Tuenti Technologies, S.L. led to an addition ingoodwill of 42 million euros. Disposals in 2010 comprise the divestment of Manx Telecom Limited. Fluctuations in exchange rates in the various countries in which the Group operates, combined with the hyperinflationary adjustment in Venezuela, led to a decrease in goodwill of 524 million euros(increase of 763 million euros in 2010).
The composition of and movement in the items comprising net “Property, plant and equipment” in 2011 and 2010 were the following:
(8) PROPERTY, PLANT AND EQUIPMENT
Millions of euros
Balance at 12/31/10
Translation
Inclusion of Companies
Exclusion ofCompanies
Balance at12/31/11 Additions Depreciation Disposals
Transfers and other
differences and hyperinflation adjustments
Land and buildings 6,152 252 (569) (125) 381 (98) - - 5,993Plant and machinery 24,206 2,015 (5,398) (53) 3,274 (335) 3 (4) 23,708Furniture, tools and other items 1,947 348 (703) (3) 234 (22) 12 (3) 1,810
Total PP&E in service 32,305 2,615 (6,670) (181) 3,889 (455) 15 (7) 31,511
PP&E in progress 3,259 4,574 - (4) (4,122) 7 - - 3,714Advance payments on PP&E 8 9 - - (5) - - - 12Installation materials 225 189 - (2) (176) (10) - - 226
Net PP&E 35,797 7,387 (6,670) (187) (414) (458) 15 (7) 35,463
F-41

The gross cost, accumulated depreciation and impairment losses of property, plant and equipment at December 31, 2011 and 2010 are as follows:
Millions of euros
Balance at 12/31/09
Translation
Inclusion of Companies
Exclusion ofCompanies
Balance at12/31/10 Additions Depreciation Disposals
Transfers and other
differences and hyperinflation adjustments
Land and buildings 6,092 61 (538) (40) 180 332 87 (22) 6,152Plant and machinery 21,391 1,447 (4,869) (57) 3,750 1,198 1,390 (44) 24,206Furniture, tools and other items 1,660 448 (752) - 339 77 178 (3) 1,947
Total PP&E in service 29,143 1,956 (6,159) (97) 4,269 1,607 1,655 (69) 32,305
PP&E in progress 2,619 4,781 - (3) (4,370) 139 100 (7) 3,259Advance payments on PP&E 10 3 - - (5) - - - 8Installation materials 227 139 - (16) (143) 18 - - 225
Net PP&E 31,999 6,879 (6,159) (116) (249) 1,764 1,755 (76) 35,797
Balance at December 31, 2011
Gross cost Accumulated depreciation
Impairment losses Net PP&E
Land and buildings 12,522 (6,526) (3) 5,993Plant and machinery 100,692 (76,961) (23) 23,708Furniture, tools and other items 7,463 (5,571) (82) 1,810Total PP&E in service 120,677 (89,058) (108) 31,511PP&E in progress 3,714 - - 3,714Advance payments on PP&E 12 - - 12Installation materials 248 - (22) 226Net PP&E 124,651 (89,058) (130) 35,463
Balance at December 31, 2010
Gross cost Accumulated depreciation
Impairment losses Net PP&E
Land and buildings 12,372 (6,216) (4) 6,152Plant and machinery 100,496 (76,266) (24) 24,206Furniture, tools and other items 7,406 (5,367) (92) 1,947Total PP&E in service 120,274 (87,849) (120) 32,305PP&E in progress 3,259 - - 3,259Advance payments on PP&E 8 - - 8Installation materials 256 - (31) 225Net PP&E 123,797 (87,849) (151) 35,797
F-42

“Additions” for 2011 and 2010, totaling 7,387 million euros and 6,879 million euros, respectively, reflect the Group’s investment efforts made during the year. “Additions” in Telefónica Spain amount to 1,411 million euros in 2011, compared to 1,500 million euros in 2010. Significant investments in the wireline business include those in broadband to continuewith the localized roll-out of fiber optics, TV and data services for large corporate customers, as well as the maintenance of the traditional business. Investment in the wireless business mainly went toimproving third generation (3G) network capacity. Telefónica Latin America’s investments in 2011 and 2010 amounted to 4,401 million euros and 3,948 million euros, respectively. Investment in 2011 focused mainly on the wireless business, mostly inthe expansion of coverage and on 3G and GSM network capacity, and on the wireline business, network and plant upgrades and investment in broadband accounted for the bulk of the investment.Customer related investments were also made in both the wireline and wireless businesses. Investment in Telefónica Europe in 2011 and 2010 amounted to 1,351 million euros and 1,254 million euros, respectively. Investments in 2011 continued to be focused on improving capacity andcoverage of the mobile networks in the United Kingdom and Germany as well as the broadband business, primarily in the Czech Republic and Germany. Changes in the consolidation scope for the inclusion of companies in 2010 primarily consisted of the consolidation of the Group’s interest in HanseNet, as well as the additional 50% of Vivo Participaçoes, S.A. (Note 5). “Translation differences and hyperinflation adjustments” reflects the impact of exchange rate movements on opening balances, as well as the impact of the monetary adjustments due to hyperinflation inVenezuela. The effect of exchange rates on movements in the year is included in the column corresponding to such movement. Telefónica Group companies have purchased insurance policies to reasonably cover the possible risks to which their property, plant and equipment used in operations are subject, with suitable limits andcoverage. In addition, as part of its commercial activities and network roll-out, the Group maintains several property acquisition commitments. The timing of scheduled payments in this regard isdisclosed in Note 19. Property, plant and equipment deriving from finance leases amounted to 648 million euros at December 31, 2011 (787 million euros at December 31, 2010). The most significant finance leases aredisclosed in Note 22. The net amounts of “Property, plant and equipment” temporarily out of service at December 31, 2011 and 2010 were not significant.
F-43

Associates
The breakdown of amounts recognized in the consolidated statements of financial position and income statements related to associates is as follows:
Transactions performed through Brasilcel group companies are shown at 50% until September 27, 2010.
The breakdown of the main associates and key financial highlights for the last 12-month periods available at the time of preparation of these consolidated financial statements are as follows:
(*) Through this company, Telefónica effectively has an indirect stake in Telcom Italia, S.p.A.’s voting shares at December 31, 2011 of approximately 10.46%, representing 7.19% of the dividend rights (10.47% and 7.20%, respectively, at December 31,2010).
(9) ASSOCIATES AND JOINT VENTURES
Millions of euros
Description 12/31/11 12/31/10
Investments in associates 5,065 5,212Long-term loans to associates (Note 13) 3 604Short-term loans to associates 682 43Receivables from associates for current operations (Note 11) 69 84Loans granted by associates (Note 14) 347 147Payables to associates for current operations (Note 14) 93 46Revenue from operations with associates 578 518Work performed by associates and other operating expenses 617 906Share of (loss) profit of associates (635) 76
December 31, 2011 Millions of euros
COMPANY % holding Total assets Total liabilities Operating incomeProfit (loss) for the
year Carrying amount Market value
Telco, S.p.A. (Italy) (*) 46.18% 5,410 3,300 - (1,126) 1,453 N/A
DTS Distribuidora de Televisión Digital, S.A. (Spain) 22.00% 1,423 458 908 50 473 N/A
China Unicom (Hong Kong) Limited 9.57% 53,332 27,961 22,466 539 3,031 3,665
Other 108
TOTAL 5,065
December 31, 2010 Millions of euros
COMPANY % holding Totalassets Total liabilities Operating income
Profit (loss) for the year Carrying amount Market value
Telco, S.p.A. (Italy) (*) 46.18% 6,554 3,356 - 63 2,055 N/A
DTS Distribuidora de Televisión Digital, S.A. (Spain) 22.00% 1,497 497 1,085 169 488 N/A
China Unicom (Hong Kong) Limited 8.37% 47,494 24,238 18,604 388 2,499 2,112
Other 170
TOTAL 5,212
F-44

The detail of the movement in investments in associates in 2011 and 2010 was the following:
“Acquisitions” and “Disposals” at December 31, 2011 and 2010 reflect the amounts from transactions detailed in the changes to the consolidation scope (see Appendix I). The amount for 2011 includesthe investment of 358 million euros in China Unicom as part of the agreement to extend the strategic partnership (see Note 2). The amount for 2010 includes the disposal of 472 million euros due to thedeconsolidation of Portugal Telecom, as well as the addition of 488 million euros for the 22% stake in DTS Distribuidora de Televisión Digital, S.A. The year 2011 reflects the impact of the adjustment made by Telco, S.p.A. to the value of its stake in Telecom Italia which, coupled with the impact of operational synergies considered in the investmentand its contribution to profit for the year, resulted in a negative impact on “Share of (loss) profit of associates” of 620 million euros. The most significant dividends received from associates in 2011 were those from China Unicom, for 18 million euros, and DTS Distribuidora de Televisión Digital, S.A., for 18 million euros. Joint ventures On December 27, 2002, Telefónica Móviles, S.A. and PT Movéis Serviços de Telecomunicaçoes, S.G.P.S., S.A. (PT Movéis) set up a 50/50 joint venture, Brasilcel, via the contribution of 100% of thegroups’ direct and indirect shares in Brazilian cellular operators. This company was integrated in the consolidated financial statements of the Telefónica Group using proportionate consolidation. As disclosed in Note 2, on September 27, 2010 these joint venture agreements were terminated, thereby having no impact since such date. The contributions of Brasilcel, N.V. to the Telefónica Group’s 2009 consolidated statement of financial position and 2010 and 2009 consolidated income statements are as follows:
(*) For the period from January 1, 2010 to September 27, 2010
Investments in associates Millions of eurosBalance at 12/31/09 4,936Acquisitions 489Disposals (473)Translation differences 321Income 76Dividends (97)Transfers and other (40)Balance at 12/31/10 5,212Acquisitions 358Disposals (3)Translation differences 218Income (loss) (635)Dividends (45)Transfers and other (40)Balance at 12/31/11 5,065
Millions of euros 2010 2009Current assets - 1,170Non-current assets - 5,617Current liabilities - 1,170Non-current liabilities - 1,505Operating revenue 2,583(*) 2,743Operating expenses 1,896(*) 2,046
F-45

Significant shareholders The main transactions between Telefónica Group companies and significant shareholders of the Company are described below. All of these transactions were carried out at market prices. Banco Bilbao Vizcaya Argentaria, S.A. (BBVA) and subsidiaries comprising the consolidated group:
Caja de Ahorros y Pensiones de Barcelona (“la Caixa”), and subsidiaries comprising the consolidated group:
Associates and joint ventures The most significant balances and transactions with associates and joint ventures and their contributions to the consolidated statement of financial position and income statement are detailed in Note 9.
(10) RELATED PARTIES
• Financing transactions, with approximately 538 million euros drawn down at December 31, 2011 (682 million euros at December 31, 2010).
• Time deposits amounting to 349 million euros at December 31, 2011 (260 million euros at December 31, 2010).
• Derivative transactions, for a total nominal amount of approximately 23,291 million euros at December 31, 2011 (11,197 million euros at December 31, 2010).
• Dividends and other earnings distributed to BBVA in 2011 for 514 million euros (439 million euros in 2010).
• Guarantees granted by BBVA for approximately 584 million euros at December 31, 2011 (922 million euros at December 31, 2010).
• Services, mainly telecommunications and telemarketing, rendered by Telefónica Group companies to the BBVA Group.
• Financing transactions, with approximately 370 million euros drawn down at December 31, 2011 (305 million euros at December 31, 2010).
• Time deposits amounting to 298 million euros at December 31, 2011 (118 million euros at December 31, 2010).
• Derivative transactions, for a total nominal amount of approximately 800 million euros in 2011 and 2010.
• Dividends and other earnings distributed to la Caixa in 2011 for 366 million euros (298 million euros in 2010).
• Guarantees granted for 56 million euros at December 31, 2011 (47 million euros in 2010).
• The telecommunications services rendered by Telefónica Group companies to la Caixa group companies.
F-46

Directors and senior executives During the financial year to which these accompanying consolidated annual financial statements refer, the Directors and senior executives did not perform any transactions with Telefónica or anyTelefónica Group company other than those in the Group’s normal trading activity and business. Compensation and other benefits paid to members of the Board of Directors and senior executives, as well as the detail of the equity interests and positions or duties held by the directors in companiesengaging in an activity that is identical, similar or complementary to that of the Company are detailed in Note 21 of these consolidated financial statements.
The breakdown of this consolidated statement of financial position heading at December 31, 2011 and 2010 is as follows:
Public-sector net trade receivables in the countries in which the Group operates at December 31, 2011 and 2010 amounted to 779 million euros and 696 million euros, respectively. The breakdown of trade receivables at December 31, 2011 and 2010 is as follows:
The movement in impairment losses in 2011 and 2010 is as follows:
(11) TRADE AND OTHER RECEIVABLES
Balance at Balance atMillions of euros 12/31/11 12/31/10Trade receivables 12,282 13,002Receivables from associates (Note 9) 69 84Other receivables 918 1,182Allowance uncollectibles (3,135) (3,098)Short-term prepayments 1,197 1,256Total 11,331 12,426
Millions of euros 12/31/11 12/31/10Trade receivables billed 9,168 9,420Trade receivables unbilled 3,114 3,582Total 12,282 13,002
Millions of eurosImpairment losses at December 31, 2009 2,589Allowances, net of retirements 847Amounts applied (664)Inclusion of companies 133Exclusion of companies (1)Translation differences 194Impairment losses at December 31, 2010 3,098Allowances, net of retirements 784Amounts applied (729)Inclusion of companies 2Exclusion of companies (1)Translation differences (19)Impairment losses at December 31, 2011 3,135
F-47

The balance of trade receivables billed net of impairment losses at December 31, 2011 amounted to 6,033 million euros (6,322 million euros at December 31, 2010), of which 3,400 million euros werenot yet due (3,852 million euros at December 31, 2010). Of the amounts due, only net amounts of 280 and 260 million euros are over 360 days at December 31, 2011 and 2010, respectively. They are mainly with the public sector.
a) Share capital and share premium
At December 31, 2011, Telefónica, S.A.’s share capital amounted to 4,563,996,485 euros and consisted of 4,563,996,485 fully paid ordinary shares of a single series, par value of 1 euro, allrecorded by the book-entry system and traded on the Spanish electronic trading system (“Continuous Market”), where they form part of the Ibex 35 Index, on the four Spanish Stock Exchanges (Madrid, Barcelona, Valencia and Bilbao) and listed on the New York, London, Buenos Aires and Lima Stock Exchanges. With respect to authorizations given regarding share capital, on May 18, 2011, authorization was given at the Annual Shareholders’ Meeting of Telefónica, S.A. for the Board of Directors, at its discretion and in accordance with the Company’s needs, to increase the Company’s capital, at one or several times, within a maximum period of five years from that date, under the terms ofSection 297.1.b) of the Corporate Enterprises Act up to a maximum increase of 2,281,998,242.50 euros, equivalent to half of Telefónica, S.A.’s share capital at that date, by issuing and placingnew shares, be they ordinary, preferred, redeemable, non-voting or of any other type permitted by the Law, -with or without a premium- and, in all cases, in exchange for cash, and expresslyconsidering the possibility that the new shares may not be fully subscribed. The Board of Directors was also empowered to exclude, partially or fully, pre-emptive subscription rights under the terms of Section 506 of the Spanish Enterprises Act. In addition, at the June 2, 2010 Shareholders’ Meeting, authorization was given for the Board of Directors to issue fixed-income securities and preferred shares at one or several times within a maximum period of five years from that date. These securities may be in the form of debentures, bonds, promissory notes or any other kind of fixed-income security, plain or, in the case of debentures and bonds, convertible into shares of Telefónica, S.A. and/or exchangeable for shares of any of the Group companies or of any other company. They may also be preferred shares. The total maximum amount of the securities issued agreed under this authorization is 25,000 million euros or the equivalent in another currency. For promissory notes, the outstanding balance ofpromissory notes issued under this authorization will be calculated for purposes of the aforementioned limit. As at December 31, 2011, the Board of Directors had exercised these powers,approving two programs for the issuance of corporate promissory notes in 2011 and 2012. In addition, on June 2, 2010, shareholders voted to authorize the acquisition by the Board of Directors of treasury shares, up to the limits and pursuant to the terms and conditions established at theShareholders’ Meeting, within a maximum period of five years from that date. However, it specified that in no circumstances could the par value of the shares acquired, added to that of thetreasury shares already held by Telefónica, S.A. and by any of its subsidiaries, exceed the maximum legal percentage at any time (currently 10% of Telefónica, S.A.’s share capital).
(12) EQUITY
F-48

Finally, on December 28, 2009, the deed of capital reduction formalizing the implementation by Telefónica, S.A.’s Board of Directors of the resolution adopted by the Shareholders’ Meeting on June 23, 2009, was executed. Capital was reduced through the cancellation of treasury shares previously acquired by Telefónica, S.A. as authorized by the Shareholders’ Meeting. As a result, 141 million Telefónica, S.A. treasury shares were cancelled and the Company’s share capital was reduced by a nominal amount of 141 million euros. Article 5 of the Corporate Bylaws relating to the amount of share capital was amended accordingly to show 4,563,996,485 euros. At the same time, a reserve was established for cancelled shares as described in the “Other reserves” section of this Note. The cancelled shares were delisted on December 30, 2009.
Proposed distribution of profit attributable to equity holders of the parent
Telefónica, S.A. generated 4,910 million euros of profit in 2011.
Accordingly, the Company’s Board of Directors will submit the following proposed distribution of 2011 profit for approval at the Shareholders’ Meeting:
Dividends paid in 2011 At its meeting of April 12, 2011, Telefónica, S.A.’s Board of Directors resolved to pay an interim dividend against 2011 profit of a fixed gross 0.75 euros per outstanding share carrying dividendrights. This dividend was paid in full on May 6, 2011, and the total amount paid was 3,394 million euros. In addition, approval was given at the General Shareholders’ Meeting on May 18, 2011 to pay a gross 0.77 dividend per share outstanding carrying dividend rights with a charge to unrestrictedreserves. This dividend was paid in full on November 7, 2011, and the total amount paid was 3,458 million euros. In accordance with Article 277 of the Corporate Enterprises Act, the following table presents the mandatory statement of accounts prepared to confirm the existence of sufficient liquidity to paythe dividend at the date of its approval.
Millions of eurosTotal distributable profit 4,910Interim dividend (paid in May 2011) 3,394Goodwill reserve 2Voluntary reserves 1,514Total 4,910
b) Dividends
F-49

The Telefónica Group manages its liquidity risks (see Note 16) in order to have cash available for the following year. Dividends paid in 2010 At its meeting of April 28, 2010, the Company’s Board of Directors resolved to pay an interim dividend against 2010 profit of a fixed gross 0.65 euros per outstanding share carrying dividendrights. This dividend was paid in full on May 11, 2010, and the total amount paid was 2,938 million euros. In addition, approval was given at the General Shareholders’ Meeting on June 2, 2010 to pay a gross 0.65 dividend per share outstanding with a charge to unrestricted reserves. This dividend waspaid in full on November 8, 2010, and the total amount paid was 2,934 million euros. Dividends paid in 2009 At its meeting held on June 23, 2009, the Company’s Board of Directors resolved to pay a dividend charged to unrestricted reserves for a fixed gross amount of 0.50 euros per outstanding sharecarrying dividend rights. This dividend was paid in full on November 11, 2009, and the total amount paid was 2,280 million euros. In addition, in May 2009 an interim dividend against 2009 profit of a gross 0.50 euros per share was paid, entailing a total payment of 2,277 million euros.
Legal reserve According to the text of the Corporate Enterprises Act, companies must transfer 10% of profit for the year to a legal reserve until this reserve reaches at least 20% of share capital. The legalreserve can be used to increase capital by the amount exceeding 10% of the increased share capital amount. Except for this purpose, until the legal reserve exceeds the limit of 20% of sharecapital, it can only be used to offset losses, if there are no other reserves available. At December 31, 2011, the Company had duly set aside this reserve.
Liquidity statement at April 12, 2011 Millions of euros Income from January 1 through March 31, 2011 5,961Mandatory appropriation to reserves -Distributable income 5,961
Proposed interim dividend (maximum amount) 3,423 Cash position at April 12, 2011 Funds available for distribution Cash and cash equivalents 1,670Unused credit facilities 6,593Proposed interim dividend (maximum amount) (3,423)Difference 4,840
c) Reserves
F-50

Revaluation reserves The balance of “Revaluation reserves” arose as a result of the revaluation made pursuant to Royal Decree-Law 7/1996 dated June 7. The revaluation reserve may be used, free of tax, to offset any losses incurred in the future and to increase capital. From January 1, 2007, it may be allocated to unrestricted reserves, provided thatthe capital gain has been realized. The capital gain will be deemed to have been realized in respect of the portion on which the depreciation has been recorded for accounting purposes or when the revalued assets have beentransferred or derecognized. In this respect, an amount of 15 million euros in 2011 (16 million euros in 2010 and 15 million euros in 2009) corresponding to revaluation reserves subsequentlyconsidered unrestricted was reclassified to “Retained earnings.” Retained earnings These reserves include undistributed profits of companies comprising the consolidated Group less interim dividends paid against profit for the year, actuarial gains and losses, and the impact ofthe asset ceiling on defined-benefit plans.
The translation differences relate mainly to the effect of exchange rate fluctuations on the net assets of the companies located abroad after the elimination of intra-group balances and transactions. They also include exchange rate differences resulting from intra-group monetary items considered part of the net investment in a foreign subsidiary, and the impact of the restatement of financialstatements of companies in hyperinflationary economies (see Note 3.b). The Group took an exemption that allows all translation differences generated up to the IFRS transition date to be reset to zero, with the impact on prior years recognized as retained earnings. The breakdown of the accumulated contribution of translation differences at December 31 is as follows:
d) Translation differences
Millions of euros 2011 2010 2009Telefónica Latin America (550) 1,208 1,052Telefónica Europe (2,071) (2,363) (2,524)Other adjustments and intra-group eliminations 458 212 99Total Telefónica Group (2,163) (943) (1,373)
F-51

At December 31, 2011, 2010 and 2009, Telefónica Group companies held the following shares in the Telefónica, S.A. parent company:
Telefónica, S.A. directly owns all treasury shares in the Group, except for one share that is held by Telefónica Móviles Argentina, S.A. (16,896 treasury shares held by Telefónica MóvilesArgentina, S.A. at December 31, 2010). In 2009, 2010 and 2011 the following transactions involving treasury shares were carried out:
The amount paid to acquire treasury shares in 2011 was 822 million euros (897 million and 1,005 million euros in 2010 and 2009, respectively). Treasury shares sold in 2011 and 2010 amounted to 445 million euros and 14 million euros, respectively. The amount in 2011 included 371 million euros related to the strategic alliance withChina Unicom (see Note 2). Following the end of the third phase of the Performance Share Plan (see Note 20.a), a total of 2,446,104 treasury shares were added, corresponding to two derivative financial instruments arrangedby the Company to meet its obligations to deliver treasury shares to managers and executives. A net 2,900,189 shares (33 million euros) were finally delivered. At the date of authorization for issue of these consolidated financial statements, Telefónica held 234 million call options on treasury shares subject to physical settlement (options on 190 million,160 million and 150 million treasury shares at December 31, 2011, 2010 and 2009, respectively).
e) Treasury shares
Euros per share
Number of shares Acquisition price Trading priceMarket value
Millions of euros %Treasury shares at 12/31/11 84,209,364 15.68 13.39 1,127 1.84508%Treasury shares at 12/31/10 55,204,942 17.01 16.97 937 1.20957%Treasury shares at 12/31/09 6,329,530 16.81 19.52 124 0.13868%
Number of
sharesTreasury shares at 12/31/08 125,561,011Acquisitions 65,809,222Exchange of Telefónica, S.A. shares for China Unicom shares (40,730,735)Employee share option plan (3,309,968)Share cancellation (141,000,000)Treasury shares at 12/31/09 6,329,530Acquisitions 52,650,000Disposals (810,151)Employee share option plan (Note 20.a) (2,964,437)Treasury shares at 12/31/10 55,204,942Acquisitions 55,979,952Disposals (24,075,341)Employee share option plan (Note 20.a) (2,900,189)Treasury shares at 12/31/11 84,209,364
F-52

The Company also has a derivative financial instrument on approximately 26 million Telefónica shares, subject to net settlement, recognized under “Current interest-bearing debt” in the accompanying consolidated statement of financial position.
“Non-controlling interests” represents the share of non-controlling interests in the equity and profit or loss for the year of fully consolidated Group companies. The movements in this heading inthe 2011, 2010 and 2009 consolidated statement of financial position are as follows:
f) Non-controlling interests
Millions of euros Balance at 12/31/10
Capital contributions and inclusion of companies
Profit/(loss) for the year
Change in translation differences
Acquisitions of non-
controlling interests and exclusion of companies
Dividends paid
Other movements
Balance at12/31/11
Telefónica Czech Republic, a.s. 1,033 - 95 (25) - (161) (2) 940Telefónica Chile, S.A. 23 - 2 (1) - (3) - 21Telefónica Brasil, S.A. 6,136 - 864 (345) (539) (710) (661) 4,745Fonditel Entidad Gestora de Fondos de Pensiones, S.A. 22 - 2 - - (1) - 23Iberbanda, S.A. 2 - (4) - 2 - - -Colombia Telecomunicaciones, S.A., ESP - - (175) - - - 175Other 16 - - 3 (2) (1) 2 18Total 7,232 - 784 (368) (539) (876) (486) 5,747
Millions of euros Balance at 12/31/09
Capital contributions and inclusion of companies
Profit/(loss) for the year
Change in translation differences
Acquisitions of non-
controlling interests and exclusion of companies
Dividends paid
Other movements
Balance at12/31/10
Telefónica Czech Republic, a.s. 1,044 - 88 57 - (156) - 1,033Telefónica Chile, S.A. 22 - 3 3 - (1) (4) 23Telesp Participaçoes, S.A. 542 - 131 69 - (105) (7) 630Brasilcel (Holdings) 885 4,304 224 258 - (171) 6 5,506Fonditel Entidad Gestora de Fondos de Pensiones, S.A. 23 - 2 - - (3) - 22Iberbanda, S.A. 6 - (4) - - - - 2Colombia Telecomunicaciones, S.A., ESP - - (540) - - - 540 -Other 18 6 1 3 (3) (4) (5) 16Total 2,540 4,310 (95) 390 (3) (440) 530 7,232
Millions of euros Balance at 12/31/08
Capital contributions and inclusion of companies
Profit/(loss) for the year
Change in translation differences
Acquisitions of non-
controlling interests and exclusion of companies
Dividends paid
Other movements
Balance at12/31/09
Telefónica Czech Republic, a.s. 1,095 - 114 21 - (186) - 1,044Telefónica Chile, S.A. 23 1 1 6 (8) (1) - 22Telesp Participaçoes, S.A. 385 - 101 118 - (64) 2 542Brasilcel (Holdings) 774 - 46 214 (108) (41) - 885Fonditel Entidad Gestora de Fondos de Pensiones, S.A. 20 - 3 - - - - 23Iberbanda, S.A. 9 - (3) - - - - 6Colombia Telecomunicaciones, S.A., ESP - - (104) - - - 104 -Other 25 - 3 (2) (7) (3) 2 18Total 2,331 1 161 357 (123) (295) 108 2,540
F-53

2011 The movement in 2011 includes the exchange of Telesp shares for Vivo Participações shares, which resulted in a net decrease of 661 million euros (see Note 5), included under “Other movements.” “Acquisitions of non-controlling interests and exclusion of companies” includes the impact of the tender offer for the voting shares of Vivo Participaçoes, S.A. held by non-controlling interests representing, approximately, 3.8% of its capital stock. After its execution, Telefónica acquired an additional 2.7% of the Brazilian company’s capital stock for 539 million euros, for a total stake of62.3% (Note 5). Also noteworthy were the dividends declared in the year by Telefónica Czech Republic, a.s. and Telefónica Brasil, S.A. “Other movements” includes the impact of the agreement signed with the holders of non-controlling interests in Colombia Telecomunicaciones, S.A., ESP (see Notes 21.b and 3.r). 2010 As disclosed in Note 5, the Group availed itself of the option to measure the non-controlling interests of Vivo Participaçoes, S.A. at fair value at the date of acquisition (see Note 3.c) in the amount of5,290 million euros, which has resulted in an increase in non-controlling interests of 4,304 million euros, net of the amount of the previously existing non-controlling interests. Similarly, the activity in 2010 reflected the allocation to non-controlling interests of the losses incurred by Colombia Telecomunicaciones, S.A., ESP, as described in Note 17, in the amount of 414million euros. “Other movements” includes the impact of the agreement signed with the holders of non-controlling interests in Colombia Telecomunicaciones, S.A., ESP (see Notes 21.b and 3.r). Also noteworthy was the impact of the dividends paid during that year by Brasilcel, N.V., Telefónica O2 Czech Republic, a.s. and Telesp Participaçoes, S.A. 2009 The reorganization of Brasilcel Group companies in 2009 following the acquisition of the Telemig Group in 2008 decreased the balance of “Non-controlling interests” by 108 million euros. Also noteworthy was the impact of the dividends paid during that year by Telefónica O2 Czech Republic, a.s. and Telesp Participaçoes, S.A.
F-54

1.- Financial assets
The breakdown of financial assets of the Telefónica Group at December 31, 2011 and 2010 is as follows:
The calculation of the fair values of the Telefónica Group’s debt instruments required an estimate, for each currency and counterparty, of a credit spread curve using the prices of the Group’s bonds and credit derivatives. Derivatives are measured using the valuation techniques and models normally used in the market, based on money-market curves and volatility prices available in the market.
(13) FINANCIAL ASSETS AND LIABILITIES
December 31, 2011
Fair value through profit or loss Measurement hierarchy
Millions of euros
Held for trading
Fair value option
Available-for-sale Hedges
Level 1 (Quoted prices)
Level 2 (Other directly
observable market inputs)
Level 3 (Inputs not
based on observable
market data)Amortized
cost Held-to-maturity
investmentsTotal carrying
amountTotal fair
valueNon-current financial assets 1,574 273 1,310 2,720 1,521 4,355 1 2,798 3 8,678 8,673Investments - - 680 - 588 91 1 - - 680 680Long-term credits - 273 630 - 894 9 - 1,322 3 2,228 2,223Deposits and guarantees - - - - - - - 1,875 - 1,875 1,476Derivative instruments 1,574 - - 2,720 39 4,255 - - - 4,294 4,294Impairment losses - - - - - - - (399) - (399) -Current financial assets 165 171 518 225 668 367 44 5,024 657 6,760 6,760Financial investments 165 171 518 225 668 367 44 889 657 2,625 2,625Cash and cash equivalents - - - - - - - 4,135 - 4,135 4,135Total financial assets 1,739 444 1,828 2,945 2,189 4,722 45 7,822 660 15,438 15,433
December 31, 2010
Fair value through profit or loss Measurement hierarchy
Millions of euros
Held for trading
Fair value option
Available-for-sale Hedges
Level 1 (Quoted prices)
Level 2 (Other directly
observable market inputs)
Level 3 (Inputs not based on
observable market data)
Amortized cost
Held-to-maturity
investmentsTotal carrying
amountTotal fair
valueNon-current financial assets 948 211 1,194 1,630 1,321 2,660 2 3,423 - 7,406 7,325Investments - - 597 - 482 113 2 - - 597 597Long-term credits 12 211 597 - 816 4 - 2,118 - 2,938 2,838Deposits and guarantees - - - - - - - 1,680 - 1,680 1,324Derivative instruments 936 - - 1,630 23 2,543 - - - 2,566 2,566Impairment losses - - - - - - - (375) - (375) -Current financial assets 272 160 309 201 554 363 25 4,604 248 5,794 5,794Financial investments 272 160 309 201 554 363 25 384 248 1,574 1,574Cash and cash equivalents - - - - - - - 4,220 - 4,220 4,220Total financial assets 1,220 371 1,503 1,831 1,875 3,023 27 8,027 248 13,200 13,119
F-55

The movement in items composing “Non-current financial assets” and the related impairment losses at December 31, 2011 and 2010 are as follows:
“Investments” includes the fair value of investments in companies where Telefónica does not exercise significant control and for which there is no specific disposal plan in the short term (see Note3.i). Among these is the Telefónica Group's shareholding in Banco Bilbao Vizcaya Argentaria, S.A. (BBVA) since 2000 of 326 million euros (418 million euros at December 31, 2010), representing0.90% of its share capital. In 2011, the Telefónica Group adjusted the value of its investment in BBVA by 80 million euros. In 2010, the Telefónica Group transferred 191 million euros of thevalue of the holding in BBVA, up to its fair value, from equity to net financial expenses. In 2011, the direct stake in Portugal Telecom and the assigned shares through the equity swaps contracts were transferred to “Investments.” The amount transferred was 256 million euros. At theend of 2010, they were included under “Non-current assets held for sale” in the consolidated statement of financial position. In this respect, economic exposure to Portugal Telecom was reduced in 2011 via partial disposals, which generated a gain of 184 million euros (see Note 19). Given the poor situation of financial markets, at year-end the Group assessed the securities in its portfolio of listed available-for-sale assets individually for impairment. The analysis did not identify the need to recognize any significant additional impairment losses. “Long-term credits and prepayments” includes mainly the investment of the net level premium reserves of the Group’s insurance companies, primarily in fixed-income securities, amounting to 894 million and 931 million euros at December 31, 2011 and 2010, respectively, and long-term prepayments of 149 million euros and 167 million euros at December 31, 2011 and 2010,respectively. At December 2010 the amounts included the long-term credit with Telco, S.p.A. in an amount of 600 million euros, which has been classified as short term in 2011. “Deposits and guarantees” consists mainly of balances to cover guarantees and stood at 1,875 million euros at December 31, 2011 (1,680 million euros at December 31, 2010). These deposits willdecrease as the respective obligations they guarantee are reduced.
a) Non-current financial assets
Millions of euros
Investments Long-term credits and prepayments
Deposits and guarantees
Derivative financial assets Impairment losses Total
Balance at 12/31/09 654 1,940 1,496 2,411 (513) 5,988Acquisitions 51 1,465 339 62 (79) 1,838Disposals (1) (748) (112) (389) 243 (1,007)Inclusion of companies 8 205 203 34 (7) 443Translation differences 13 99 (186) 16 39 (19)Fair value adjustments (128) 60 34 444 - 410Transfers - (83) (94) (12) (58) (247)Balance at 12/31/10 597 2,938 1,680 2,566 (375) 7,406Acquisitions - 936 425 224 (11) 1,574Disposals (12) (873) (207) - 1 (1,091)Translation differences (1) (45) (53) 34 1 (64)Fair value adjustments (160) 18 2 1,721 - 1,581Transfers 256 (746) 28 (251) (15) (728)Balance at 12/31/11 680 2,228 1,875 4,294 (399) 8,678
F-56

“Derivative financial assets” includes the fair value of economic hedges of assets or liabilities in the consolidated statement of financial position whose maturity is 12 months or greater, as part ofthe Group’s financial risk-hedging strategy (see Note 16).
This heading in the accompanying consolidated statement of financial position at December 31, 2011 and 2010 includes mainly the following items:
Current financial assets that are highly liquid and have maturities of three months or less from the date contracted are recorded under “Cash and cash equivalents” on the accompanying consolidated statement of financial position.
The composition of this heading at December 31, 2011 and 2010 is as follows:
The maturity profile of these financial liabilities at December 31, 2011 is as follows:
b) Current financial assets
− Investments in financial instruments recognized at fair value to cover commitments undertaken by the Group’s insurance companies, amounting to 171 million euros at December 31, 2011(160 million euros at December 31, 2010). The maturity schedule for these financial assets is established on the basis of payment projections for the commitments.
− Derivative financial assets with a short-term maturity or not used to hedge non-current items in the consolidated statement of financial position, which amounted to 385 million euros (371million euros in 2010). The variation in the balance between the two years was due to exchange- and interest-rate fluctuations (see Note 16).
− Short-term deposits and guarantees amounted to 87 million euros at December 31, 2011 (196 million euros at December 31, 2010).
− Financing extended to Telco, S.p.A. for 600 million euros.
− Current investments of cash surpluses which, given their characteristics, have not been classified as “Cash and cash equivalents.”
2.- Financial liabilities
Millions of euros Balance at 12/31/11
Balance at 12/31/10
Issues 42,239 39,692 Interest-bearing debt 24,072 21,408 Total 66,311 61,100 Total non-current 55,659 51,356 Total current 10,652 9,744
F-57

The composition of these financial liabilities, by category, at December 31, 2011 and 2010 is as follows:
The calculation of the fair values of the Telefónica Group’s debt instruments required an estimate, for each currency and subsidiary, of the credit spread curve using the prices of the Group’s bonds and credit derivatives. Some of the financing arranged by various Telefónica Group companies is subject to compliance with certain financial covenants. All the covenants were being complied with at the date of theseconsolidated financial statements.
Maturity
(Millions of euros) 2012 2013 2014 2015 2016 Subsequent
years TotalDebentures and bonds 2,824 5,203 4,933 3,860 6,590 15,012 38,422Promissory notes & commercial paper 1,832 - - - - - 1,832Other marketable debt securities - - - - - 1,985 1,985Loans and other payables 5,683 2,314 2,746 4,384 2,774 3,722 21,623Derivative financial liabilities 313 92 126 289 191 1,438 2,449TOTAL 10,652 7,609 7,805 8,533 9,555 22,157 66,311
• The estimate of future interest that would accrue on these financial liabilities held by the Group at December 31, 2011 is as follows: 3,215 million euros in 2012, 3,083 million euros in 2013,2,638 million euros in 2014, 2,040 million euros in 2015, 1,740 million euros in 2016 and 7,545 million euros in years after 2016. For variable rate financing, the Group mainly estimatesfuture interest using the forward curve of the various currencies at December 31, 2011.
• The amounts shown in this table take into account the fair value of derivatives classified as financial liabilities (i.e., those with a negative fair value) and exclude the fair value of derivativesclassified as current financial assets, in the amount of 385 million euros, and those classified as non-current, for 4,294 million euros (i.e., those with a positive fair value).
December 31, 2011 Fair value through profit or loss Measurement hierarchy
Millions of euros Held for trading
Fair value option Hedges
Level 1 (Quoted prices)
Level 2 (Other directly
observable market inputs)
Level 3 (Inputs not based on observable
market data) Liabilities at
amortized costTotal carrying
amountTotal fair
valueIssues - - - - - - 42,239 42,239 42,203Interest-bearing debt 1,246 - 1,203 78 2,371 - 21,623 24,072 21,961Total financial liabilities 1,246 - 1,203 78 2,371 - 63,862 66,311 64,164
December 31, 2010
Fair value through profit or loss Measurement hierarchy
Millions of euros Held for trading
Fair value option Hedges
Level 1 (Quoted prices)
Level 2 (Other directly
observable market inputs)
Level 3 (Inputs not based on observable
market data) Liabilities at
amortized costTotal carrying
amountTotal fair
valueIssues - - - - - - 39,692 39,692 39,127Interest-bearing debt 695 - 806 210 1,291 - 19,907 21,408 19,777Total financial liabilities 695 - 806 210 1,291 - 59,599 61,100 58,904
F-58

The movement in issues of debentures, bonds and other marketable debt securities in 2011 and 2010 is as follows:
Bonds and other marketable debt securities Telefónica, S.A. has a full and unconditional guarantee on issues made by Telefónica Emisiones, S.A.U., Telefónica Finanzas México, S.A. de C.V. and Telefónica Europe, B.V., all of which are,directly or indirectly, wholly owned subsidiaries of Telefónica, S.A. Appendix II presents the characteristics of all outstanding debentures and bond issues at year-end 2011 and 2010, as well as the significant issues made in each year. Promissory notes & commercial paper At December 31, 2011, Telefónica Europe, B.V., had a program for issuance of commercial paper, guaranteed by Telefónica, S.A., for an amount of up to 2,000 million euros. The outstandingbalance of commercial paper issued under this program at December 31, 2011 was 1,596 million euros, issued at an average interest rate of 1.50% (1,613 million issued in 2010 at an average rateof 0.82%). On December 13, 2010, Telefónica Móviles, S.A. (Peru) registered a commercial paper program for an equivalent of up to 150 million US dollars (approximately 116 million euros). Theoutstanding balance of commercial paper issued under this program at December 31, 2011 was 13 million US dollars (approximately 9 million euros). On 20 December, 2010, Telefónica de Perú, S.A.A. registered a commercial paper program for an equivalent of up to 150 million US dollars (approximately 116 million euros). At December 31,2011, no amount had been drawn under this program. On May 11, 2011, Telefónica Móviles Colombia, S.A. registered a commercial paper program for an equivalent of up to 350,000 million Colombian pesos (approximately 137 million euros). Theoutstanding balance of commercial paper issued under this program at December 31, 2011 was 318,055 million Colombian pesos (approximately 127 million euros).
a) Issues
Millions of euros
Domestic currency
issues
Foreign currency
issues
Short-termpromissory notes and
commercial paper
Other non Current Marketable debt
securities TotalBalance at 12/31/09 17,575 15,387 873 2,008 35,843New issues 2,392 3,879 1,102 - 7,373Redemptions, conversions and exchanges (1,269) (3,634) (311) - (5,214)Changes in consolidation scope - 317 - - 317Revaluation and other movements 96 1,250 64 (37) 1,373Balance at 12/31/10 18,794 17,199 1,728 1,971 39,692New issues 2,300 2,283 166 - 4,749Redemptions, conversions and exchanges (2,250) (985) (66) - (3,301)Changes in consolidation scope - - - - -Revaluation and other movements 641 439 5 14 1,099Balance at 12/31/11 19,485 18,936 1,833 1,985 42,239
F-59

At December 31, 2011, Telefónica, S.A. has a corporate promissory note program for 500 million euros, which can be increased to 2,000 million euros, with an outstanding balance at such date of87 million euros (42 million euros in 2010). Other marketable debt securities This heading consists mainly of preferred shares issued by Telefónica Finance USA, LLC, with a redemption value of 2,000 million euros. These shares have the following features:
The detail of “Interest-bearing debt” is as follows:
The average interest rate on outstanding loans and other payables at December 31, 2011 was 4.04% (2.56% in 2010). This percentage does not include the impact of hedges arranged by the Group.
The main financing transactions included under “Interest-bearing debt” outstanding at December 31, 2011 and 2010 and their nominal amounts are provided in Appendix IV.
Interest-bearing debt arranged in 2011 and 2010 mainly includes the following:
• Interest rate up to December 30, 2012 of 3-month Euribor, and maximum and minimum effective annual rates of 7% and 4.25%, respectively, and from then on 3-month Euribor plus a 4% spread.
• Interest is paid every three calendar months provided the Telefónica Group generates consolidated profit.
b) Interest-bearing debt
Balance at 12/31/11 Balance at 12/31/10
Current Non-current
Current Non-current
Total Total Loans and other payables 5,683 15,940 21,623 3,664 16,243 19,907Derivative financial liabilities (Note 16) 313 2,136 2,449 323 1,178 1,501
Total 5,996 18,076 24,072 3,987 17,421 21,408
• On October 31, 2011, Telefónica Brasil took out a loan with Banco do Brasil (BNB) for 150 million US dollars (equivalent to approximately 116 million euros);
• On September 20, 2011, Vivo, S.A. arranged long-term financing with Banco Nacional de Desenvolvimento Econômico e Social (BNDES) for a nominal amount of up to 3,000 millionBrazilian reais. Principal amounts drawn under this financing at December 31, 2011 amounted to 1,004 million Brazilian reais (equivalent to 414 million euros).
• On May 12, 2011 Telefónica, S.A. signed an amendment to the syndicated loan agreement entered into on July 28, 2010 whereby it was agreed that, in exchange for the additionalpayment of certain fees and an upward adjustment to applicable interest rates, of the 5,000 million euros that would initially mature in July 2013, 2,000 million euros would be extendedfor another year, i.e. until July 2014, and another 2,000 million for a further three years, i.e. until July 2016. At December 31, 2011, this line of credit had been drawn down by 8,000million euros (6,000 million euros at December 31, 2010).
F-60

The main repayments or maturities of bank interest-bearing debt in 2011 and 2010 are as follows:
• On May 3, 2011, Telefónica, S.A. entered into a long-term line of credit facility for an aggregate amount of 376 million US dollars at a fixed rate with the guarantee of the Finnish ExportCredits Guarantee Board (Finnvera). This credit facility is divided into four tranches: a tranche of 94 US dollars maturing on January 30, 2020, another of 90 million US dollars maturing onJuly 30, 2020, a third of 94 million US dollars maturing on January 30, 2021, and a fourth of 98 million US dollars maturing on July 30, 2021. At December 31, 2011, none of this credit hadbeen drawn down.
• On March 29, 2011, Atento Inversiones y Teleservicios, S.A.U. and its subsidiaries, Atento, N.V. and Atento Teleservicios España, S.A.U., entered into a four-year syndicated loan agreementtotaling 235 million euros. At December 31, 2011, the outstanding balance on this loan amounted to 228 million euros.
• On February 12, 2010, Telefónica, S.A. entered into a long-term credit facility for an aggregate amount of 472 million US dollars at fixed rates with the guarantee of the Swedish Export Credits Guarantee Board (EKN) for equipment and network purchases from a supplier in this country. This credit facility is divided into three tranches: a tranche of 232 US dollars maturingon November 30, 2018, another of 164 million US dollars maturing on April 30, 2019, and a third of 76 million US dollars maturing on November 30, 2019. During the year, it repaid 218million US dollars of the first tranche and 154 million US dollars of the second, although since this facility has a repayment schedule at December 31, 2011, the outstanding balance amountedto 335 million US dollars (equivalent to 259 million euros).
• On December 12, 2011, the loan facility arranged by Telefónica Finanzas, S.A.U. with the European Investment Bank (EIB) for 300 million euros matured as scheduled. This loan had theguarantee of Telefónica, S.A.
• On June 28, 2011, the syndicated loan facility arranged by Telefónica, S.A. on June 28, 2005 for 6,000 million euros matured as scheduled. The outstanding balance at maturity was 300million euros (5,700 million matured in 2010).
• On January 5, 2011, the syndicated loan facility arranged by Telefónica Móviles Chile, S.A. on December 29, 2005 for 180 million euros (equivalent to 138 million euros) matured asscheduled.
• On June 21, 2011, the syndicated loan facility arranged by Telefónica Móviles Chile, S.A. on October 28, 2005 for 150 million euros (equivalent to 116 million euros) matured as scheduled.
• In 2011, Vivo, S.A. paid the installments included in the repayment schedule for the financing arranged with BNDES on July 13, 2007, for an aggregate amount of 318 million Brazilian reais(equivalent to approximately 131 million euros). At December 31, 2011, the nominal amount outstanding on this financing was 818 million Brazilian reais (approximately 337 million euros).
• In 2011, Telesp paid the installments included in the repayment schedule for the financing arranged with BNDES on October 23, 1997, for an aggregate amount of 408 million Brazilian reais(equivalent to approximately 168 million euros). At December 31, 2011, the nominal amount outstanding on this financing was 1,390 million Brazilian reais (approximately 573 millioneuros).
F-61

At December 31, 2011, the Telefónica Group had total unused credit facilities from various sources amounting to approximately 10,119 million euros (approximately 11,000 million euros at December31, 2010), which included 2,000 million euros related to the undrawn amount of the loan to acquire Brasilcel, N.V.
Loans by currency
The breakdown of loans by currency at December 31, 2011 and 2010, along with the equivalent value of foreign-currency loans in euros, is as follows:
The composition of “Trade and other payables” is as follows:
“Deferred income” principally includes the amount of connection fees not yet recognized in the income statement, customer loyalty programs, and advance payments received on prepay contracts.
• In 2011, Telefónica Móviles Colombia, S.A. paid the installments included in the repayment schedule for the financing arranged with the Inter-American Development Bank (IDB) on December 20, 2007, for an aggregate amount of 218 million US dollars (equivalent to approximately 168 million euros). At December 31, 2011, the nominal amount outstanding on thisfinancing was 273 million US dollars (approximately 211 million euros).
Outstanding balance (in millions)
Currency EurosCurrency 12/31/11 12/31/10 12/31/11 12/31/10Euros 13,099 11,778 13,099 11,778US dollars 2,520 2,580 1,947 1,931Brazilian reais 4,014 3,633 1,545 1,632Argentine pesos 764 1,080 137 203Colombian pesos 9,035,173 8,176,727 3,594 3,197Yen 14,916 16,882 149 155Chilean peso 106,284 54,886 158 88New soles 853 948 245 253Pounds sterling 552 557 661 648Czech crown 49 131 2 5Other currencies 86 17Total Group N/A N/A 21,623 19,907
(14) TRADE AND OTHER PAYABLES
12/31/11 12/31/10Millions of euros Non-current Current Non-current CurrentTrade payables - 8,888 - 9,038Advances received on orders - 77 - 83Other payables 1,620 6,684 1,761 8,162Deferred income 472 1,766 543 1,775Payable to associates (Note 9) - 440 - 193Total 2,092 17,855 2,304 19,251
F-62

Non-current “Other payables” mainly comprises the deferred portion of the payment for acquiring the license for spectrum use in Mexico, in the amount of 878 million euros (1,039 million euros in2010) (Note 6).
The detail of current “Other payables” at December 31, 2011 and 2010 is as follows:
Information on deferred payments to suppliers of Spanish companies (Third additional provision, "Information requirement" of Law 15/2010 of July 5th)
The Telefónica Group’s Spanish companies have adapted their internal processes and payment schedules to the provisions of Law 15/2010, which establishes measures against late payments incommercial transactions. To this end contractual conditions with commercial suppliers in 2011 have included payment periods equal to or inferior to 85 days, as established in the regulation.
For efficiency and in line with general business practice, the Telefónica Group’s companies in Spain have defined payment schedules with providers, whereby payments are made on set days, which, forthe main companies, occur three times a month. Invoices falling due between two payment days are settled on the following payment date in the schedule. Payments to Spanish suppliers in 2011 surpassing the established legal limit were the results of circumstances or incidents beyond the payment policies, which include the closing of agreements withsuppliers over the delivery of goods or the rendering of services, or occasional processing issues. Information on contracts entered into after Law 15/2010 took effect that surpassed the established legal limit per the law is as follows:
At the date of authorization for issue of these financial statements, the Group had processed the outstanding payments, except for cases where an agreement with suppliers was being negotiated.
Millions of euros Balance at 12/31/11
Balance at 12/31/10
Dividends payable by Group companies 241 199Payables to suppliers of property, plant and equipment 4,393 4,455Accrued employee benefits 728 780Deferred payment for Brasilcel, N.V. (Note 5) - 1,977Other non-financial non-trade payables 1,322 751Total 6,684 8,162
2011 Millions of euros Amount % Payments within allowable period 8,361 95.2Other 425 4.8Total payments to commercial suppliers 8,786 100.0Weighted average days past due 38 Deferrals at year-end that exceed the limit (*) 27
(*) To adapt to Law 15/2010, the Telefónica Group’s Spanish companies paid 82 million euros in early 2011 related to the outstanding balance not adapted at year-end 2010.
F-63

The amounts of provisions in 2011 and 2010 are as follows:
Employee benefits
In the last few years, the Telefónica Group has carried out early retirement plans in order to adapt its cost structure to the prevailing environment in the markets where it operates, making certainstrategic decisions relating to its size and organization.
In this respect, on July 29, 2003, the Ministry of Labor and Social Affairs approved a labor force reduction plan for Telefónica de España, S.A.U. through various voluntary, universal and non-discriminatory programs, which were announced on July 30, 2003. The plan concluded on December 31, 2007, with 13,870 employees taking part for a total cost of 3,916 million euros.Provisions recorded for this plan at December 31, 2011 and 2010 amounted to 1,404 million and 1,825 million euros, respectively.
On July 14, 2011, the Ministry of Labor and Social Affairs approved a new labor force reduction plan for Telefónica de España, S.A.U. for up to a maximum of 6,500 employees for the periodfrom 2011 to 2013, through various voluntary, universal and non-discriminatory programs (the “Redundancy Plan”).
The cost of estimated payments for the Redundancy Plan, recognized by the Group, using actuarial criteria updated with a market interest rate curve (see Note 3.p) is 2,671 million euros,recognized under “Personnel expenses” in the accompanying consolidated income statement (see Note 19). A total of 2,359 requests for voluntary severance were received in 2011, which hasresulted in 1,925 employee contracts being terminated in 2011, for which the estimated present value of future payments is 659 million euros.
The provision recorded for the Redundancy Plan at December 31, 2011 amounted to 2,727 million euros.
Furthermore, the Group had recorded provisions totaling 567 million euros (931 million euros at December 31, 2010) for other planned adjustments to the workforce and plans prior to 2003.
The companies bound by these commitments calculated provisions required at 2011 and 2010 year-end using actuarial assumptions pursuant to current legislation, including the PERM/F- 2000 C mortality tables and a variable interest rate based on market yield curves.
(15) PROVISIONS
12/31/11 12/31/10 Millions of euros Current Non-current Total Current Non-current Total
Employee benefits: 807 4,999 5,806 916 2,974 3,890 - Termination plans 790 3,908 4,698 898 1,858 2,756 - Post-employment defined benefit plans - 799 799 - 829 829 - Other benefits 17 292 309 18 287 305Other provisions 696 2,173 2,869 759 1,891 2,650Total 1,503 7,172 8,675 1,675 4,865 6,540
a) Termination plans
F-64

The movement in provisions for post employment plans in 2011 and 2010 is as follows:
The Group has a number of defined-benefit plans in the countries where it operates. The following tables present the main data of these plans:
Millions of euros Total Provisions for post employment plans at 12/31/09 3,070 Additions 406 Retirements/amount applied (813)Transfers (3)Translation differences and accretion 96 Provisions for post employment plans at 12/31/10 2,756 Additions 2,787 Retirements/amount applied (936)Transfers (29)Translation differences and accretion 120 Provisions for post employment plans at 12/31/11 4,698
b) Post-employment defined benefit plans
12/31/11 Spain Europe Latin America
Millions of euros ITP Survival UK Germany Brazil Other TotalObligation 412 242 976 55 298 18 2,001Assets - - (971) (79) (235) (7) (1,292)Net provision before asset ceiling 412 242 5 (24) 63 11 709Asset ceiling - - - 17 51 - 68Net provision 412 242 5 2 127 11 799Net assets - - - 9 13 - 22
12/31/10 Spain Europe Latin America
Millions of euros ITP Survival UK Germany Brazil Other TotalObligation 424 208 918 57 272 13 1,892Assets - - (838) (63) (250) (5) (1,156)Net provision before asset ceiling 424 208 80 (6) 22 8 736Asset ceiling - - - 9 71 - 80Net provision 424 208 80 3 106 8 829Net assets - - - - 13 - 13
F-65

The movement in the present value of obligations in 2011 and 2010 is as follows:
Movements in the fair value of plan assets in 2011 and 2010 are as follows:
Spain Europe Latin America
Millions of euros ITP Survival UK Germany Brazil Other TotalPresent value of obligation at 12/31/09 451 191 922 37 159 11 1,771Translation differences - - 31 - 26 - 57Current service cost - 8 29 2 4 - 43Past service cost - - (35) - - - (35)Interest cost 15 7 55 2 23 1 103Actuarial losses and gains 8 9 - 16 2 1 36Benefits paid (50) (7) (14) - (11) - (82)Plan curtailments - - 1 - - - 1Inclusion of companies - - - - 69 - 69Exclusion of companies - - (71) - - - (71)Present value of obligation at 12/31/10 424 208 918 57 272 13 1,892Translation differences - - 29 - (26) 1 4Current service cost - 9 25 3 4 1 42Past service cost - - - - - - -Interest cost 13 7 51 2 26 2 101Actuarial losses and gains 23 26 (27) (7) 38 2 55Benefits paid (48) (8) (20) - (16) - (92)Plan curtailments - - - - - (1) (1)Present value of obligation at 12/31/11 412 242 976 55 298 18 2,001
Europe Latin America
Millions of euros UK Germany Brazil Other TotalFair value of plan assets at 12/31/09 744 58 116 - 918Translation differences 23 - 25 1 49Expected return on plan assets 54 2 23 1 80Actuarial losses and gains (4) (5) 4 - (5)Company contributions 76 8 4 3 91Employee contributions 1 - - - 1Benefits paid (14) - (11) - (25)Inclusion of companies - - 89 - 89Exclusion of companies (42) - - - (42)Fair value of plan assets at 12/31/10 838 63 250 5 1,156Translation differences 29 - (21) 1 9Expected return on plan assets 48 3 23 - 74Actuarial losses and gains (13) (3) (5) - (21)Company contributions 89 16 3 1 109Employee contributions - - - - -Benefits paid (20) - (15) - (35)Fair value of plan assets at 12/31/11 971 79 235 7 1,292
F-66

The amounts of actuarial gains and losses of these plans recognized directly in equity in accordance with their asset ceilings in 2011, 2010 and 2009, before non-controlling interests and before the related tax effect, are as follows:
The Group’s principal defined-benefit plans are:
a) Plans in Spain:
The amount for this provision totaled 412 million euros at December 31, 2011 (424 million euros at December 31, 2010).
The amount for this provision totaled 242 million euros at December 31, 2011 (208 million euros at December 31, 2010).
These plans do not have associated assets which qualify as “plan assets” under IAS 19.
The main actuarial assumptions used in valuing these plans are as follows:
b) Plans in the rest of Europe:
The various O2 Group companies consolidated within the Telefónica Group have defined-benefit post-employment plans, covered by qualifying assets.
The number of beneficiaries of these plans at December 31, 2011 and 2010 is as follows:
Millions of euros 2011 2010 2009 Spain (48) (17) 1 Europe 14 (6) (184)Latin America (51) (71) (6)Total (85) (94) (189)
a. ITP: Telefónica Spain reached an agreement with its employees whereby it recognized supplementary pension payments for employees who had retired as of June 30, 1992, equal to thedifference between the pension payable by the social security system and that which would be paid to them by ITP (Institución Telefónica de Previsión). Once the aforementioned supplementarypension payments had been quantified, they became fixed, lifelong and non-updateable and sixty percent (60%) of the payments are transferable to the surviving spouse, recognized as such as ofJune 30, 1992, and to underage children.
b. Survival: serving employees who did not join the defined pension plan are still entitled to receive survivorship benefits at the age of 65.
Survival ITP 12/31/11 12/31/10 12/31/11 12/31/10Discount rate 0.787%-2.521% 0.682%-3.417% 0.787%-2.521% 0.682%-3.417%Expected rate of salary increase 2.50% 2.50% - -Mortality tables PERM/F-2000C
Combined with OM77PERM/F-2000C
Combined with OM7792% PERM 2000C/100%
PERF 2000 C 92% PERM 2000C/100%
PERF 2000 C
Employees 2011 2010 UK 4,590 4,617 Germany 5,979 5,839
F-67

The main actuarial assumptions used in valuing these plans are as follows:
c) Plans in Latin America:
Subsidiary Telefónica Brasil (formerly Telecomunicações de São Paulo, S.A.) and its subsidiaries had various pension plan, medical insurance and life insurance obligations with employees.
The main actuarial assumptions used in valuing these plans are as follows:
In addition, Telefónica Brasil, along with other companies resulting from the privatization of Telebrás (Telecomunicações Brasileiras, S.A.) in 1998, adhered to PBS-A, a non-contribution defined benefit plan managed by Fundação Sistel de Seguridade Social, whose beneficiaries are employees that retired prior to January 31, 2000. At December 31, 2011, net plan assets amounted to 668million Brazilian reais, equivalent to 275 million euros (579 million Brazilian reais at December 31, 2010, equivalent to 260 million euros). This plan does not have an impact on the consolidatedstatement of financial position, given that recovery of the assets is not foreseeable. The valuations used to determine the value of obligations and plan assets, where appropriate, were performed as of December 31, 2011 by external and internal actuaries. The projected unit creditmethod was used in all cases. c) Other benefits This heading mainly includes the amount recorded by Telefónica Spain related to the accrued portion of long-service bonuses to be awarded to employees after 25 years’ service, amounting to 210 million euros (196 million euros at December 31, 2010).
12/31/11 12/31/10 UK Germany UK GermanyNominal rate of salary increase 4.0% 3.5% 4.5% 1%Nominal rate of pension payment increase 2.9% 1.0%-4.0% 3.5% 2.0%-4.0%Discount rate 4.9% 5.3% 5.6% 6.1%Expected inflation 3.0% 2% 3.5% 2.0%-4.0%Expected return on plan assets
- Shares 7.0% N/A 7.5% N/A- UK government bonds - N/A - N/A- Other bonds 4.9% N/A 5.2% N/A- Rest of assets 3.0% 4%-4.25% 4.2% 4.10%-4.25%Mortality tables Pna00mc0.5 underpin Prf. Klaus Heubeck (RT
2005 G)Pna00mcfl0.5 Prf. Klaus Heubeck (RT
2005 G)
12/31/11 12/31/10Discount rate 9.73% 10.25%Nominal rate of salary increase 6.54%-7.20% 6.54% - 7.20%Expected inflation 4.50% 5.00%Cost of health insurance 7.64% 8.15%Expected return on plan assets 11.07%-12.08% 10.70% - 11.60%Mortality tables AT 2000 M/F AT 2000 M/F
F-68

Other provisions The movement in “Other provisions” in 2011 and 2010 is as follows:
“Other provisions” includes the amount recorded in 2007 in relation to the 188 million euro fine imposed on Telefónica de España, S.A.U. by the EC anti-trust authorities. Also included are the provisions for dismantling of assets recognized by Group companies in the amount of 401 million euros in 2011 (405 million euros in 2010). Finally, “Other Provisions” in 2011 and 2010 also includes the provisions recorded (or used) by Group companies to cover the risks inherent in the realization of certain assets, the contingencies arisingfrom their respective business activities and the risks arising from commitments and litigation acquired in other transactions, recognized as indicated in Note 3.1. Given the nature of the risks covered by these provisions, it is not possible to determine a reliable schedule of potential payments, if any.
The Telefónica Group is exposed to various financial market risks as a result of: (i) its ordinary business activity, (ii) debt incurred to finance its business, (iii) its investments in companies, and (iv) otherfinancial instruments related to the above commitments. The main market risks affecting Group companies are as follows:
Exchange rate risk arises primarily from (i) Telefónica’s international presence, through its investments and businesses in countries that use currencies other than the euro (primarily in LatinAmerica, but also in the United Kingdom and the Czech Republic), and (ii) debt denominated in currencies other than that of the country where the business is conducted or the home country ofthe company incurring such debt.
Interest rate risk arises primarily from changes in interest rates affecting (i) financial expenses on floating rate debt (or short-term debt likely to be renewed), due to changes in interest rates and (ii) the value of long-term liabilities at fixed interest rates.
Millions of euros Other provisions at December 31, 2009 1,695 Additions 733 Retirements/amount applied (315)Transfers 112 Inclusion of companies 341 Translation differences 84 Other provisions at December 31, 2010 2,650 Additions 707 Retirements/amount applied (480)Transfers 88 Translation differences (96)Other provisions at December 31, 2011 2,869
(16) DERIVATIVE FINANCIAL INSTRUMENTS AND RISK MANAGEMENT POLICIES
1. Exchange rate risk
2. Interest rate risk
F-69

Share price risk arises primarily from changes in the value of the equity investments that may be bought, sold or otherwise involved in transactions, from changes in the value of derivativesassociated with such investments, from changes in the value of treasury shares and from equity derivatives.
The Telefónica Group is also exposed to liquidity risk if a mismatch arises between its financing needs (including operating and financial expense, investment, debt redemptions and dividendcommitments) and its sources of finance (including revenues, divestments, credit lines from financial institutions and capital market transactions). The cost of finance could also be affected bymovements in the credit spreads (over benchmark rates) demanded by lenders. Finally, the Telefónica Group is exposed to “country risk” (which overlaps with market and liquidity risks). This refers to the possible decline in the value of assets, cash flows generated or cash flowsreturned to the parent company as a result of political, economic or social instability in the countries where the Telefónica Group operates, especially in Latin America. The Telefónica Group actively manages these risks through the use of derivatives (primarily on exchange rates, interest rates and share prices) and by incurring debt in local currencies, whereappropriate, with a view to stabilizing cash flows, the income statement and investments. In this way, it attempts to protect the Telefónica Group’s solvency, facilitate financial planning and takeadvantage of investment opportunities. The Telefónica Group manages its exchange rate risk and interest rate risk in terms of net debt and net financial debt as calculated by them. The Telefónica Group believes that these parameters are moreappropriate to understanding its debt position. Net debt and net financial debt take into account the impact of the Group’s cash balance and cash equivalents including derivatives positions with a positive value linked to liabilities. Neither net debt nor net financial debt as calculated by the Telefónica Group should be considered an alternative to gross financial debt (the sum of current and non-current interest-bearing debt) as a measure of liquidity. For a more detailed description on reconciliation of net debt and net financial debt to gross financial debt, see Note 2.
Exchange rate risk The fundamental objective of the exchange rate risk management policy is that, in event of depreciation in foreign currencies relative to the euro, any potential losses in the value of the cash flowsgenerated by the businesses in such currencies, caused by depreciation in exchange rates of a foreign currency relative to the euro, are offset (to some extent) by savings from the reduction in the eurovalue of debt denominated in such currencies. The degree of exchange rate hedging employed varies depending on the type of investment. At December 31, 2011, net debt in Latin American currencies was equivalent to approximately 7,953 million euros. However, the Latin American currencies in which this debt is denominated is notdistributed in proportion to the cash flows generated in each currency. The future effectiveness of the strategy described above as a hedge of exchange rate risks therefore depends on which currenciesdepreciate relative to euro. The Telefónica Group aims to protect itself against declines in Latin American currencies relative to the euro affecting asset values through the use of dollar-denominated debt, incurred either in Spain (where such debt is associated with an investment as long as it is considered to be an effective hedge) or in the country itself, where the market for local currency financing or hedges may be inadequateor non-existent. At December 31, 2011, the Telefónica Group’s net debt denominated in dollars was equivalent to 1,373 million euros.
3. Share price risk
F-70

The Telefónica Group’s aim is to maintain the same proportion of pound sterling-denominated net debt to operating income excluding the impact of the related depreciation as the Telefónica Group’s net debt to operating income excluding the impact of the related depreciation ratio, on a consolidated basis, to reduce its sensitivity to changes in the pound sterling to euro exchange rate. Pound sterling-denominated net debt at December 31, 2011, was equivalent to 3,540 million euros, less than the 4,025 million euros at December 31, 2010. The risk-management objective to protect the investment in the Czech Republic is similar to that described for the investment in the UK, where the amount of Czech crown-denominated debt is proportional to the “Telefónica Europe” business unit in the Czech Republic. Czech crown-denominated net debt at December 31, 2011 was 1.7 times operating income excluding the impact of therelated depreciation in Czech crown (1.6 times in 2010) on a consolidated basis and 2.5 times (2.3 times in 2010) on a proportional basis. Both were below the Telefónica Group’s net debt to operating income excluding the impact of the related depreciation ratio in 2011. The Telefónica Group also manages exchange rate risk by seeking to minimize the negative impact of any remaining exchange rate exposure on the income statement, regardless of whether there areopen positions. Such open position exposure can arise for any of three reasons: (i) a thin market for local derivatives or difficulty in sourcing local currency finance which makes it impossible to arrangea low-cost hedge (as in Argentina and Venezuela), (ii) financing through intra-group loans, where the accounting treatment of exchange rate risk is different from that for financing through capitalcontributions, and (iii) as the result of a deliberate policy decision, to avoid the high cost of hedges that are not warranted by expectations or high risk of depreciation. In 2011, exchange rate management resulted in negative exchange rate differences totaling 176 million euros (excluding the impact of monetary correction), compared to 147 million euros in negativedifferences in 2010. The following table illustrates the sensitivity of income loss and equity to changes in exchange rates, where: a) to calculate the impact on the income statement, the exchange rate position affecting theincome statement at the end of 2011 was considered constant during 2012; and b) to calculate the impact on equity, only monetary items have been considered, namely debt and derivatives such ashedges of net investments and loans to subsidiaries associated with the investment, whose composition is considered constant in 2012 and identical to that existing at the end of 2011. In both cases, LatinAmerican currencies are assumed to depreciate against the US dollar, and the rest of the currencies against the euro by 10%.
The Group’s monetary position in Venezuela at December 31, 2011 is a net debtor position of 1,428 million Venezuelan bolivars (equivalent to approximately 257 million euros). However, it had anaverage creditor position in 2011, leading to a higher financial expense in the amount of 21 million euros.
Millions of euros Currency Change
Impact on the consolidated income statement
Impact on consolidated equity
All currencies vs. EUR 10% 112 (180)USD vs. EUR 10% 15 32
European currencies vs. EUR 10% 1 (353)Latin American currencies vs. USD 10% 96 141
All currencies vs. EUR (10)% (112) 180USD vs. EUR (10)% (15) (32)
European currencies vs. EUR (10)% (1) 353Latin American currencies vs. USD (10)% (96) (141)
F-71

Interest rate risk The Telefónica Group’s financial expenses are exposed to changes in interest rates. In 2011, the rates applied to the largest amount of short-term debt were mainly based on the Euribor, the Czech crown Pribor, the Brazilian SELIC, the US dollar and pound sterling Libor, and the Colombian UVR. In nominal terms, at December 31, 2011, 66% of the Telefónica Group’s net debt (or 70% of long-term net debt) was at rates fixed for a period longer than one year, compared to 65% of net debt (70% of long-term net debt) in 2010. Of the remaining 30% (net debt at floating or fixed rates maturing in lessthan one year), the interest rate on 15 percentage points was set for period of more than one year (5% of long-term debt), compared to 18 percentage points on debt at floating or fixed rates maturing inless than one year (7% of long-term net debt) at December 31, 2010. This decrease in 2011 from 2010 is due to our decision to cancel or not renew an amount equivalent to 692 million euros of caps andfloors in euros, US dollars and pounds sterling, following the policy implemented in 2009 in anticipation of a fall in interest rates. In addition, early retirement liabilities were discounted to present value over the year based on the curve on the swap rate markets. The decrease in interest rates has increased the market value of theseliabilities. However, this increase was nearly completely offset by the increase in the value of the hedges on these positions. Net financial expenses rose 11% to 2,941 million euros in 2011 from 2,649 million euros in 2010, mainly due to the 12.7% increase in average debt in 2011. Stripping out exchange-rate effects (and including the impact of monetary correction), net financial expense for 2011 totaled 2,764 million euros, a 10% increase from the 2,502 million euros obtained in 2010, below the 12.7% increase inaverage debt mentioned previously. To illustrate the sensitivity of financial expenses to variability in short-term interest rates, a 100 basis points increase in interest rates in all currencies in which Telefónica has financial positions atDecember 31, 2011 has been assumed, and a 100 basis points decrease in interest rates in all currencies except pound sterling and the US dollar, to avoid negative rates. The constant position equivalentto that prevailing at the end of 2011 has also been assumed. To illustrate the sensitivity of equity to variability in interest rates, a 100 basis points increase in interest rates in all currencies and in all curve periods where there is a financial position at December 31,2011, and a 100 basis points decrease in all currencies and in all periods, have been assumed. In addition, only positions with cash flow hedges have been considered, given that they are mostly the onlypositions where the change in fair value due to interest rate movements is recorded in equity.
Millions of euros Change in basis points
(bp) (*) Impact on consolidated
income statementImpact on consolidated
equity +100bp (141) 779 -100bp 147 849
(*) Impact on results of 100bp change in all currencies, except the pound sterling and the US dollar.
F-72

Share price risk The Telefónica Group is exposed to changes in the value of equity investments that may be bought, sold or otherwise involved in transactions, from changes in the value of derivatives associated withsuch investments, from treasury shares and from equity derivatives. According to the Telefónica, S.A. share option plan, Performance Share Plan (PSP) and the Performance & Investment Plan (PIP) (see Note 20) the shares to be delivered to employees under such planmay be either the parent company treasury shares, acquired by them or any of its Group companies; or newly-issued shares. The possibility of delivering shares to beneficiaries of the plan in the future,in accordance with relative total shareholders’ return, implies a risk since there could be an obligation to hand over a maximum number of shares at the end of each phase, whose acquisition (in the eventof acquisition in the market) in the future could imply a higher cash outflow than required on the start date of each phase if the share price is above the corresponding price on the phase start date. In theevent that new shares are issued for delivery to the beneficiaries of the plan, there would be a dilutive effect for ordinary shareholders as a result of the higher number of shares delivered under such planoutstanding. To reduce the risk associated with variations in share price under these plans, Telefónica has acquired instruments that replicate the risk profile of some of the shares deliverable under the plan asexplained in Note 20. During 2010, an incentive plan for Group employees to purchase Telefónica shares, approved at the Ordinary General Shareholders’ Meeting of 2009, was initiated. The cost of this plan will not exceed 50 million euros, as agreed in the aforementioned Ordinary General Shareholders’ Meeting (see Note 20 for further details). In addition, the Group may use part of the treasury shares of Telefónica, S.A. held at December 31, 2011 to cover shares deliverable under the PSP or the PIP. The net asset value of the treasury sharescould increase or decrease depending on variations in Telefónica, S.A.’s share price. Liquidity risk The Telefónica Group seeks to match the schedule for its debt maturity payments to its capacity to generate cash flows to meet these maturities, while allowing for some flexibility. In practice, this hasbeen translated into two key principles:
As of December 31, 2011, the average maturity of its 56,304 million euros of net financial debt was 5.44 years.
1. The Telefónica Group’s average maturity of net financial debt is intended to stay above 6 years, or be restored above that threshold in a reasonable period of time if it eventually falls below it.This principle is considered as a guideline when managing debt and access to credit markets, but not a rigid requirement. When calculating the average maturity for the net financial debt and partof the undrawn credit lines can be considered as offsetting the shorter debt maturities, and extension options on some financing facilities may be considered as exercised, for calculation purposes.
2. The Telefónica Group must be able to pay all commitments over the next 12 months without accessing new borrowing or accessing the capital markets (although drawing upon firm credit linesarranged with banks), assuming budget projections are met.
F-73

At December 31, 2011, gross financial debt scheduled maturities in 2012 amounted to approximately 10,333 million euros (including the net position of derivative financial instruments), which is lowerthan the amount of funds available, calculated as the sum of: a) current financial assets and cash at December 31, 2011 (6,434 million euros excluding derivative financial instruments), b) annual cashgeneration projected for 2012; and c) undrawn credit facilities arranged with banks whose original maturity is over one year (an aggregate of more than 7,724 million euros at December 31, 2011),providing flexibility to the Telefónica Group with regard to accessing capital or credit markets in the next 12 months. For a further description of the Telefónica Group’s liquidity and capital resources in 2012, see Note 13.2 Financial Liabilities and Appendix III. Country risk The Telefónica Group managed or mitigated country risk by pursuing two lines of action (in addition to its normal business practices):
Regarding the first point, at December 31, 2011, the Telefónica Group’s Latin American companies had net financial debt not guaranteed by the parent company of 6,564 million euros, which represents11.7% of consolidated net financial debt. Regarding the repatriation of funds to Spain, it received 3,139 million euros from the Group’s Latin America companies in 2011, of which 2,379 million euros was from dividends, 402 million eurosfrom intra-group loans (payments of interest and repayments of principal), 112 million euros from financial investments, 28 million euros from capital reductions and 219 million euros from other items.These amounts were equally offset by additional amounts invested in Mexico (65 million euros). As a result of the foregoing, net funds repatriated to Spain from the Group’s Latin America companies amounted to the equivalent of 3,074 million euros at December 31, 2011. In this regard, it is worth noting that since February 2003, Venezuela has had an exchange control mechanism in place, managed as indicated above by the Currency Administration Commission(CADIVI). The body has issued a number of regulations (“providencias”) governing the modalities of currency sales in Venezuela at official exchange rates. Foreign companies which are duly registeredas foreign investors are entitled to request approval to acquire currencies at the official exchange rate by the CADIVI, in line with regulation number 029, article 2, section c) "Remittance of earnings,profits, income, interest and dividends from international investment." Telefónica Venezolana, C.A. (formerly Telcel, C.A.), a Telefónica Group subsidiary in Venezuela, obtained the aforementionedrequested approval on 295 million Venezuelan bolivars in 2006, 473 million Venezuelan bolivars in 2007 and 785 million Venezuelan Bolivars in 2008. At December 31, 2011, payment of twodividends agreed by the company in the amount of 5,882 million Venezuelan bolivars is pending approval by the CADIVI.
1. Partly matching assets to liabilities (those not guaranteed by the parent company) in the Telefónica Group’s Latin American companies such that any potential asset impairment would be accompanied by a reduction in liabilities; and,
2. Repatriating funds generated in Latin America that are not required for the pursuit of new, profitable business development opportunities in the region.
F-74

Credit risk The Telefónica Group trades in derivatives with creditworthy counterparties. Therefore, Telefónica, S.A. generally trades with credit entities with “senior debt” ratings of at least “A.” In Spain, where most of the Group’s derivatives portfolio is held, there are netting agreements with financial institutions, with debtor or creditor positions offset in case of bankruptcy, limiting the risk to the net position.In addition, since Lehman went bankrupt, the credit ratings of rating agencies have proved to be less effective as a credit risk management tool. Therefore, the 5-year CDS (Credit Default Swap) of credit institutions has been added. This way, the CDS of all the counterparties with which Telefónica, S.A. operates is monitored at all times in order to assess the maximum allowable CDS for operating at anygiven time. Transactions are generally only carried out with counterparties whose CDS is below the threshold. For other subsidiaries, particularly those in Latin America, assuming a stable sovereign rating provides a ceiling which is below “A,” trades are with local financial entities whose rating by local standards is considered to be of high creditworthiness. Meanwhile, with credit risk arising from cash and cash equivalents, the Telefónica Group places its cash surpluses in high quality and highly liquid money-market assets. These placements are regulatedby a general framework, revised annually. Counterparties are chosen according to criteria of liquidity, solvency and diversification based on the conditions of the market and countries where the Groupoperates. The general framework sets: (i) the maximum amounts to be invested by counterparty based on its rating (long-term debt rating); (ii) the maximum tenor of the investment, set at 180 days; and (iii) the instruments in which the surpluses may be invested (money-market instruments). The Telefónica Group considers managing commercial credit risk as crucial to meeting its sustainable business and customer base growth targets in a manner that is consistent with its risk-management policy. This is based on continuous monitoring of the risk assumed and the resources necessary to optimize the risk-reward ratio in its operations. Particular attention is given to those clients that could cause amaterial impact on the Group's financial statements for which, depending on the segment and type of relation, hedging instruments or collateral may be required to mitigate exposure to credit risk. All Group companies adopt policies, procedures, authorization guidelines, and homogeneous management practices, in consideration of the particularities of each market and best international practices,and incorporating this commercial credit risk management model into the Group's decision making processes, both from a strategic and day to day operating perspective, which risk assessment guidesthe commercial offering available for the various credit profiles. The Telefónica Group’s maximum exposure to credit risk is initially represented by the carrying amounts of the financial assets (Notes 10, 11 and 13) and the guarantees given by the Telefónica Group. Several Telefónica Group companies provide operating guarantees granted by external counterparties, which are offered during their normal commercial activity, in bids for licenses, permits andconcessions, and spectrum acquisitions. At December 31, 2011, these guarantees amounted to approximately 2,545 million euros (see Note 21.e).
F-75

Capital management Telefónica’s corporate finance department, which is in charge of Telefónica’s capital management, takes into consideration several factors when determining Telefónica’s capital structure, with the aim of ensuring sustainability of the business and maximizing the value to shareholders. Telefónica monitors its cost of capital with a goal of optimizing its capital structure. In order to do this, Telefónica monitors the financial markets and updates to standard industry approaches forcalculating weighted average cost of capital, or WACC. Telefónica also uses a net financial debt ratio below 2.35x operating income excluding the impact of the related depreciation in the medium term(excluding items of a non-recurring or exceptional nature), enabling to obtain and maintain the desired credit rating over the medium term, and with which the Telefónica Group can match the potentialcash flow generation with the alternative uses that could arise at all times. These general principles are refined by other considerations and the application of specific variables, such as country risk in the broadest sense, or the volatility in cash flow generation, whendetermining the Telefónica Group’s financial structure. Derivatives policy At December 31, 2011, the nominal value of outstanding derivatives with external counterparties amounted to 178,641 million euros equivalent, a 27% increase from 140,272 million euros equivalent atDecember 31, 2010. This figure is inflated by the use in some cases of several levels of derivatives applied to the nominal value of a single underlying liability. For example, a foreign currency loan canbe hedged into floating rate, and then each interest rate period can be fixed using a fixed rate hedge, or FRA (forward rate agreement). Even using such techniques to reduce the position, it is stillnecessary to take extreme care in the use of derivatives to avoid potential problems arising through error or a failure to understand the real position and its associated risks. Telefónica’s derivatives policy emphasizes the following points:
Acceptable underlyings include profits, revenues and cash flows in either a company’s functional currency or another currency. These flows can be contractual (debt and interest payments,settlement of foreign currency payables, etc.), reasonably certain or foreseeable (property, plant, and equipment purchases, future debt issues, commercial paper programs, etc.). The acceptabilityof an underlying asset in the above cases does not depend on whether it complies with accounting rules requirements for hedge accounting, as is required in the case of certain intragrouptransactions, for instance. Parent company investments in subsidiaries with functional currencies other than the euro also qualify as acceptable underlying assets.
Economic hedges, which are hedges with a designated underlying asset and which in certain circumstances offset fluctuations in the underlying asset value, do not always meet the requirementsand effectiveness tests laid down by accounting standards for treatment as hedges. The decision to maintain positions that cease to qualify as effective or fail to meet other requirements willdepend on the marginal impact on the income statement and how far this might compromise the goal of a stable income statement. In any event, the variations are recognized in the incomestatement.
1) Derivatives based on a clearly identified underlying.
F-76

This matching basically applies to foreign currency debt and derivatives hedging foreign currency payments by Telefónica Group subsidiaries. The aim is to eliminate the risk arising fromchanges in foreign currency interest rates. Nonetheless, even when the aim is to achieve perfect hedging for all cash flows, the lack of liquidity in certain markets, especially in Latin Americancurrencies, has meant that historically there have been mismatches between the terms of the hedges and those of the debts they are meant to hedge. The Telefónica Group intends to reduce thesemismatches, provided that doing so does not involve disproportionate costs. In this regard, if adjustment does prove too costly, the financial timing of the underlying asset in foreign currency willbe modified in order to minimize interest rate risk in foreign currency.
In certain cases, the timing of the underlying as defined for derivative purposes may not be exactly the same as the timing of the contractual underlying.
Generally, the aim is to ensure that the hedging derivative and the hedged asset or liability belong to the same company. Sometimes, however, the holding companies (Telefónica, S.A. andTelefónica Internacional, S.A.) have arranged hedges on behalf of a subsidiary that owns the underlying asset. The main reasons for separating the hedge and the underlying asset were possibledifferences in the legal validity of local and international hedges (as a result of unforeseen legal changes) and the different credit ratings of the counterparties (of the Telefónica Group companiesas well as those of the banks).
Telefónica considers the sale of options when: i) there is an underlying exposure (on the consolidated statement of financial position or associated with a highly probable cash outflow) that wouldoffset the potential loss for the year if the counterparty exercised the option, or ii) the option is part of a structure in which another derivative offsets any loss. The sale of options is also permittedin option structures where, at the moment they are taken out, the net premium is either positive or zero.
For instance, it would be possible to sell short-term options on interest rate swaps that entitle the counterparty to receive a certain fixed interest rate, below the level prevailing at the time theoption was sold. This would mean that if rates fell and the counterparty exercised its option, the Group would swap part of its debt from floating rate to a lower fixed rate, having received apremium.
2) Matching of the underlying to one side of the derivative.
3) Matching the company contracting the derivative and the company that owns the underlying.
4) Ability to measure the derivative’s fair value using the valuation systems available to the Telefónica Group.
The Telefónica Group uses a number of tools to measure and manage risks in derivatives and debt. The main ones are Kondor+, licensed by Reuters, which is widely used by financial institutions,and MBRM specialist financial calculator libraries.
5) Sale of options only when there is an underlying exposure.
F-77

The main risks that may qualify for hedge accounting are as follows:
Regarding the underlying:
This may on occasion mean that the hedging instruments have longer terms than the related contractual underlying. This happens when the Group enters into long-term swaps, caps or collars to protect ourselves against interest rate rises that may raise the financial expense of its promissory notes, commercial paper and some floating rate loans which mature earlier thantheir hedges. These floating rate financing programs are highly likely to be renewed and Telefónica commits to this by defining the underlying asset in a more general way as a floatingrate financing program whose term coincides with the maturity of the hedge.
Hedges can be of three types:
6) Hedge accounting
• Variations in market interest rates (either money-market rates, credit spreads or both) that affect the value of the underlying asset or the measurement of the cash flows;
• Variations in exchange rates that change the value of the underlying asset in the company’s functional currency and affect the measurement of the cash flow in the functional currency;
• Variations in the volatility of any financial variable, asset or liability that affect either the valuation or the measurement of cash flows on debt or investments with embedded options,whether or not these options are separable; and
• Variations in the valuation of any financial asset, particularly shares of companies included in the portfolio of “Available-for-sale financial assets”.
• Hedges can cover all or part of the value of the underlying;
• The risk to be hedged can be for the whole period of the transaction or for only part of the period; and
• The underlying may be a highly probable future transaction, or a contractual underlying (loan, foreign currency payment, investment, financial asset, etc.) or a combination of both thatdefines an underlying with a longer term.
• Fair value hedges.
• Cash flow hedges. Such hedges can be set at any value of the risk to be hedged (interest rates, exchange rates, etc.) or for a defined range (interest rates between 2% and 4%, above 4%,etc.). In this last case, the hedging instrument used is options and only the intrinsic value of the option is recognized as an effective hedge. Changes in the time value of options arerecognized in the income statement. To prevent excessive swings in the income statement from changes in time value, the hedging ratio (amount of options for hedging relative to theamount of options not treated as hedges) is assigned dynamically, as permitted by the standard.
F-78

Hedges can comprise a combination of different derivatives.
Management of accounting hedges is not static, and the hedging relationship may change before maturity. Hedging relationships may change to allow appropriate management that serves theGroup’s stated principles of stabilizing cash flows, stabilizing net financial income/expense and protecting share capital. The designation of hedges may therefore be cancelled, before maturity,because of a change in the underlying, a change in perceived risk on the underlying or a change in market view. Derivatives included in these hedges may be reassigned to new hedges where they meet the effectiveness test and the new hedge is well documented. To gauge the efficiency of transactions defined as accounting hedges, the Group analyzes the extent to which the changes in thefair value or in the cash flows attributable to the hedged item would offset the changes in fair value or cash flows attributable to the hedged risk using a linear regression model.
The main guiding principles for risk management are established by Telefónica’s Finance Department and implemented by company financial officers (who are responsible for balancing the interests ofeach company and those of the Telefónica Group). The Corporate Finance Department may allow exceptions to this policy where these can be justified, normally when the market is too thin for thevolume of transactions required or on clearly limited and small risks. New companies joining the Telefónica Group as a result of mergers or acquisitions may also need time to adapt.
• Hedges of net investment in consolidated foreign subsidiaries. Generally, such hedges are arranged by the parent company and the other Telefónica holding companies. Whereverpossible, these hedges are implemented through real debt in foreign currency. Often, however, this is not always possible as many Latin American currencies are non-convertible, makingit impossible for non-resident companies to issue local currency debt. It may also be that the debt market in the currency concerned is too thin to accommodate the required hedge (forexample, the Czech crown and pounds sterling), or that an acquisition is made in cash with no need for market financing. In these circumstances derivatives, either forwards or cross-currency swaps are used to hedge the net investment.
F-79

The breakdown of the financial results recognized in 2011, 2010 and 2009 is as follows:
The breakdown of Telefónica’s derivatives at December 31, 2011, their fair value at year-end and the expected maturity schedule are as set forth in the table below:
(Millions of euros) 2011 2010 2009Interest income 586 454 528Dividends received 42 40 45Other financial income 181 266 151Interest expenses (2,671) (2,514) (3,036)Ineffective portion of cash flow hedges 1 (16) (17)Accretion of provisions and other liabilities (106) (145) (254)Changes in fair value of financial assets at fair value through profit or loss 573 25 124Changes in fair value of financial liabilities at fair value through profit or loss (808) (39) (132)Transfer from equity to profit and loss from cash flow hedges (210) (73) 77Transfer from equity to profit and loss from available-for-sale assets (3) (202) 4Gain/(loss) on fair value hedges 908 168 (427)(Loss)/gain on adjustment to items hedged by fair value hedges (747) (211) 439Other expenses (528) (290) (269)Net finance costs excluding foreign exchange differences (2,782) (2,537) (2,767)
Millions of euros Fair value: at 12/31/11 (**)
Maturity (notional amount) (*) Derivatives 2012 2013 2014 Subsequent years TotalInterest rate hedges (81) (1,785) 668 (825) 8,217 6,275Cash flow hedges 866 (1,118) 1,086 (350) 11,380 10,998Fair value hedges (947) (667) (418) (475) (3,163) (4,723)Exchange rate hedges (962) 328 339 77 6,702 7,446Cash flow hedges (932) 340 230 1 6,519 7,090Fair value hedges (30) (12) 109 76 183 356Interest and exchange rate hedges (618) (76) 1,110 (45) 2,547 3,536Cash flow hedges (597) (31) 1,158 66 2,098 3,291Fair value hedges (21) (45) (48) (111) 449 245Hedge of net investment in foreign operations (81) (1,427) (160) (280) (1,313) (3,180)Derivatives not designated as hedges (488) 9,375 (480) (144) (1,516) 7,235Interest rate (230) 8,038 (579) (144) (2,404) 4,911Exchange rate (255) 1,338 99 - 888 2,325Interest and exchange rate (3) (1) - - - (1)
(*) For hedges, the positive amount is in terms of fixed “payment.” For foreign currency hedges, a positive amount means payment in functional vs. foreign currency.(**) Positive amounts indicate payables.
F-80
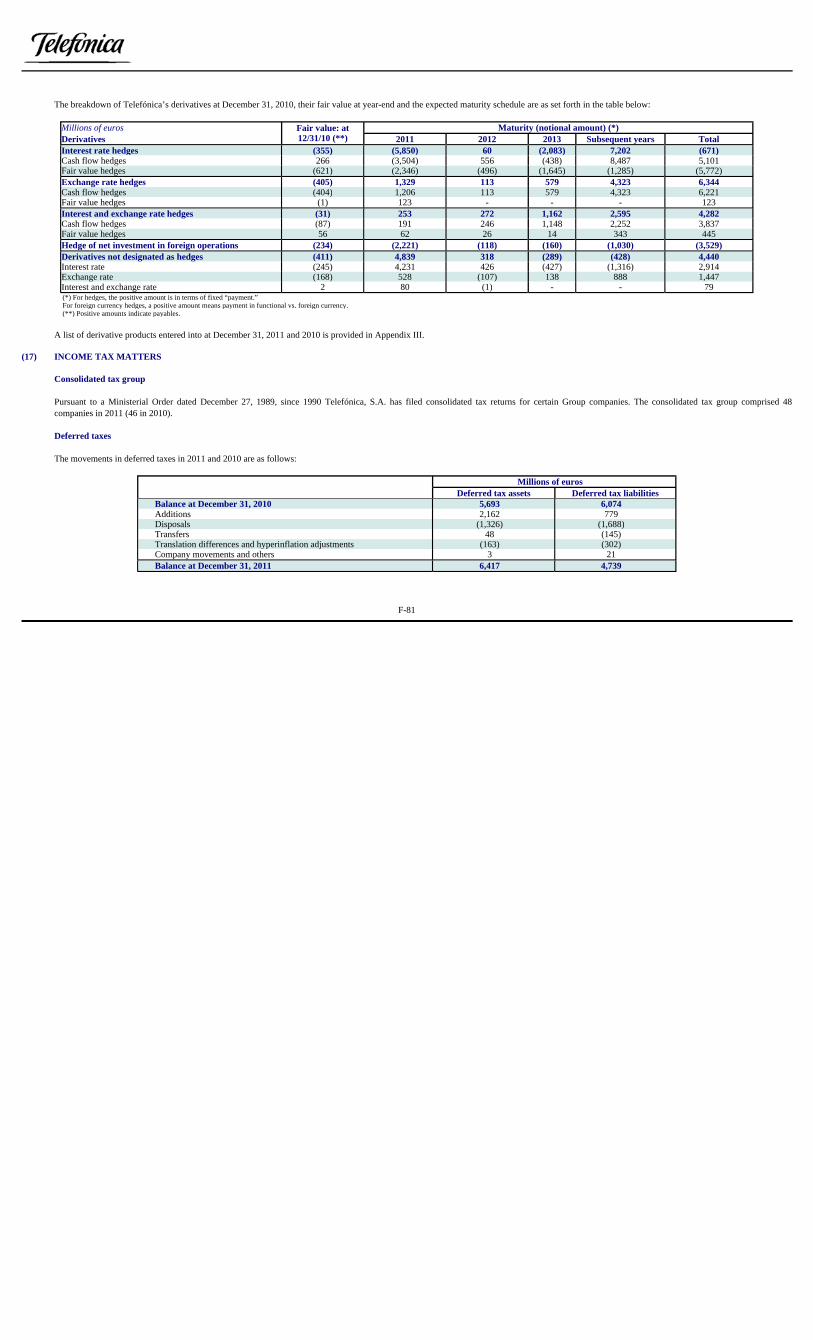
The breakdown of Telefónica’s derivatives at December 31, 2010, their fair value at year-end and the expected maturity schedule are as set forth in the table below:
A list of derivative products entered into at December 31, 2011 and 2010 is provided in Appendix III.
Consolidated tax group Pursuant to a Ministerial Order dated December 27, 1989, since 1990 Telefónica, S.A. has filed consolidated tax returns for certain Group companies. The consolidated tax group comprised 48companies in 2011 (46 in 2010). Deferred taxes The movements in deferred taxes in 2011 and 2010 are as follows:
Millions of euros Fair value: at 12/31/10 (**)
Maturity (notional amount) (*) Derivatives 2011 2012 2013 Subsequent years TotalInterest rate hedges (355) (5,850) 60 (2,083) 7,202 (671)Cash flow hedges 266 (3,504) 556 (438) 8,487 5,101Fair value hedges (621) (2,346) (496) (1,645) (1,285) (5,772)Exchange rate hedges (405) 1,329 113 579 4,323 6,344Cash flow hedges (404) 1,206 113 579 4,323 6,221Fair value hedges (1) 123 - - - 123Interest and exchange rate hedges (31) 253 272 1,162 2,595 4,282Cash flow hedges (87) 191 246 1,148 2,252 3,837Fair value hedges 56 62 26 14 343 445Hedge of net investment in foreign operations (234) (2,221) (118) (160) (1,030) (3,529)Derivatives not designated as hedges (411) 4,839 318 (289) (428) 4,440Interest rate (245) 4,231 426 (427) (1,316) 2,914Exchange rate (168) 528 (107) 138 888 1,447Interest and exchange rate 2 80 (1) - - 79(*) For hedges, the positive amount is in terms of fixed “payment.” For foreign currency hedges, a positive amount means payment in functional vs. foreign currency.(**) Positive amounts indicate payables.
(17) INCOME TAX MATTERS
Millions of euros Deferred tax assets Deferred tax liabilities
Balance at December 31, 2010 5,693 6,074 Additions 2,162 779 Disposals (1,326) (1,688) Transfers 48 (145) Translation differences and hyperinflation adjustments (163) (302) Company movements and others 3 21 Balance at December 31, 2011 6,417 4,739
F-81

“Additions” of deferred tax assets in 2011 include the tax impact of the labor force reduction plan for Telefónica in Spain (see Note 15). Meanwhile, “Disposals” of deferred tax assets include the impact of the Group’s labor force reduction plans carried out and which were recorded in previous years. The movement in “Deferred tax liabilities” in 2011 includes mainly the reversal of a deferred tax liability as a result of the merger between Brazilian companies Telesp and Vivo Participações, S.A. inOctober in the amount of 1,288 million euros (see Note 2). Expected realization of deferred tax assets and liabilities In the majority of cases, realization of the Group’s deferred tax assets and liabilities depends on the future activities carried out by the different companies, tax regulations in the different countries inwhich these companies operate, and on the strategic decisions affecting the companies. In this regard, the expected realization is based on a series of assumptions that may be altered as the correspondingsituations continue to develop. Under the assumptions made, the estimated realization of deferred tax assets and liabilities recognized in the consolidated statement of financial position at December 31,2011 is as follows:
Deferred tax assets Deferred tax assets in the accompanying consolidated statement of financial position include tax loss carryforwards, unused tax credits recognized (deductions) and deductible temporary differencesrecognized at the end of the reporting period. Tax credits for loss carryforwards The available tax loss carryforwards in Spain at December 31, 2011 at the main Group companies amounted to 4,933 million euros (4,575 million euros for companies belonging to the tax group). The consolidated statement of financial position at December 31, 2011 includes a 729 million euro deferred tax asset corresponding to 2,430 million euros of recognized tax loss carryforwards in Spain.
Millions of euros
Deferred tax assets
Deferred tax liabilities
Balance at December 31, 2009 5,971 3,082Additions 1,221 586Disposals (2,270) (421)Transfers (16) 365Translation differences and hyperinflation adjustments 207 312Company movements and others 580 2,150Balance at December 31, 2010 5,693 6,074
12/31/11 Total Less than 1 year More than 1 year
Deferred tax assets 6,417 1,094 5,323
Deferred tax liabilities 4,739 777 3,962
F-82

The 2002 tax return included a negative adjustment of 2,137 million euros from Telefónica Móviles, S.A. (now Telefónica, S.A.) arising through the transfer of certain holdings of Group companiesacquired in previous years, which was challenged by the Spanish tax authorities. The challenging of this adjustment in the tax audit has not affected the consolidated financial statements as in accordancewith past rulings by the tax authorities, which differed from the interpretation put forward by the Company, the Company decided then not to recognize it. In relation to the sale by Terra Networks, S.A. (now Telefónica, S.A.) of its stake in Lycos Inc. in 2004, the Company began procedures to recognize a higher tax loss of up to 7,418 million eurosbecause of measuring as acquisition value for tax purposes, the market value of Lycos Inc. shares received, rather than their carrying amount, in conformity with Article 159 of the Spanish CorporationLaw. No effect on the consolidated financial statements has been considered until the Company receives a definitive ruling on this procedure. Telefónica Europe has recognized 439 million euros, mainly from the Telefónica Germany Group, which has tax credits and deductible temporary differences incurred in prior years amounting to 7,682million euros, of which 412 million euros have been recognized as deferred tax assets in line with the prospects of generating future taxable earnings. These tax credits do not expire. Unused tax credits recognized in the consolidated statement of financial position at the Latin American subsidiaries at December 31, 2011 amounted to 323 million euros. Deductions The Group has recognized an amount of 191 million euros of unused tax credits, generated primarily from export activity, in the consolidated statement of financial position at December 31, 2011. Temporary differences Temporary differences are generated as a result of the difference between tax bases of the assets and liabilities and their respective carrying amounts. Deductible temporary differences, tax deductionsand credits and tax loss carryforwards give rise to deferred tax assets on the consolidated statement of financial position, whereas taxable temporary differences in tax bases give rise to deferred taxliabilities on the consolidated statement of financial position. The sources of deferred tax assets and liabilities from temporary differences recognized at December 31, 2011 and 2010 are as follows:
The net movements of assets and liabilities resulting from temporary differences recognized directly in equity in 2011 and 2010 amounts to 239 million euros and 63 million euros, respectively, asshown in the consolidated statement of comprehensive income.
Millions of euros
2011 2010 Deferred tax Deferred tax Deferred tax Deferred tax assets liabilities assets liabilitiesProperty, plant and equipment 283 753 273 467Intangible assets 268 2,211 265 4,522Personnel commitments 1,546 - 956 -Provisions 1,267 158 1,172 81Investments in subsidiaries, associates and joint ventures 614 975 443 532Other 757 642 873 472Total 4,735 4,739 3,982 6,074
F-83

Tax payables and receivables Current tax payables and receivables at December 31, 2011 and 2010 are as follows:
Reconciliation of book profit before taxes to taxable income The reconciliation between accounting profit and the income tax expense for 2011, 2010 and 2009 is as follows:
The income tax expense for 2011 includes the reversal of a deferred tax liability as a result of the merger between Brazilian companies Telesp and Vivo Participações, S.A. in October for 1,288 millioneuros (see Note 2), included in the preceding table under “Increase/(Decrease) in tax expense arising from temporary differences.”
Millions of euros Balance at Balance at 12/31/11 12/31/10Taxes payable: Tax withholdings 163 124Indirect taxes 1,018 1,164Social security 187 228Current income taxes payable 611 695Other 589 611Total 2,568 2,822
Millions of euros Balance at Balance at 12/31/11 12/31/10Tax receivables: Indirect tax 772 775Current income taxes receivable 569 338Other 226 218Total 1,567 1,331
Millions of euros 2011 2010 2009Accounting profit before tax 6,488 13,901 10,387Tax expense at prevailing statutory rate (30%) 1,946 4,170 3,116Effect of statutory rate in other countries (19) (52) (20)Variation in tax expense from new taxes 11 10 (15)Permanent differences (22) (69) (402)Changes in deferred tax charge due to changes in tax rate (26) (21) -Capitalization of tax deduction and tax relief (97) (112) (143)Use of loss carryforwards (200) (134) (5)Increase / (Decrease) in tax expense arising from temporary differences (1,344) (42) (82)Other 52 79 1Income tax expense 301 3,829 2,450Breakdown of current/deferred tax expense Current tax expense 1,557 2,455 3,848Deferred tax benefit (1,256) 1,374 (1,398)Total income tax expense 301 3,829 2,450
F-84

The permanent differences arise mainly from events that produce taxable income not recognized in the consolidated income statement, as well as impacts recognized in profit before tax that do notgenerate taxable profit. Noteworthy in this respect in 2010 is the portion of the capital gain obtained from the remeasurement of the previously held investment in Brasilcel (see Note 2), as it relates totemporary differences on investments in subsidiaries (see Note 3.n). In addition, permanent differences for 2010 include the recognition of tax credits in Mexico and Terra Brasil, in the amounts of 75 million euros and 63 million euros, respectively, based on the estimatesof taxable income of each of the companies according to the updated business plan. In addition, subsequent to the review of tax assets recognized in the consolidated statement of financial position at the end of 2010, it was determined that the 864 million euros of tax assets recognized atColombia Telecomunicaciones, S.A. should be derecognized since the company’s revised business plans did not ensure that there would be sufficient taxable profit to allow the deferred tax asset to beutilized.
Tax inspections and tax-related lawsuits On September 25, 2002, tax inspections commenced at several companies included in tax group 24/90, of which Telefónica, is the parent company for the years from 1998 to 2000. The tax assessments related to this review, which included settlement agreements and imposed fines on Telefónica, were signed by the company in disagreement in October 2004 and July 2005. The total amount of these assessments was 140 million euros. In April 2007, Telefónica filed an administrative appeal before the National Court of Justice, requesting the annulment of the settlement as well as the inclusion of other concepts in its favor not contemplated in the inspection. In the process, it was requested that the execution of the settlements and penalties appealed be suspended by providing the appropriate guarantees. On February 22, 2010, Telefónica received the notification of the ruling by the National Court of Justice dated February 4, 2010, in which it partially accepted the Company’s allegations, annulling the imposition of sanctions. On May 18, 2010, the National Court of Justice accepted Telefónica, S.A.'s appeal and ruled on April 5, 2010 to refer the case to the Supreme Court. On June 4, 2010, the tax authorities filed an appeal before the Supreme Court against one of the rulings of the National Court of Justice partially accepting Telefónica’s allegations. In January 2011, Telefónica submitted a brief of opposition against that appeal before the Supreme Court. In addition, a new tax inspection commenced in June 2006 and concluded in July 2008 for the periods 2001-2004. The income tax statements for such periods included a negative adjustment for 2,317 million euros which was challenged by the Spanish tax authorities, although this did not affect the consolidated financial statements as it was not recognized. At the same time, the Treasury challenged the export credits claimed, which amounted to deductions of approximately 346 million euros. Telefónica filed an administrative appeal before the Central Administrative Economic Court, which on September 10, 2009 ruled against the interests of the Company. Telefónica, S.A. filed an administrative appeal before the National Court of Justice against this resolution of September 10, 2009. Telefónica, S.A. filed the claim in April 2010. Telefónica presented in writing its conclusions in April 2011.
F-85

Additional, in June 2010, new inspections of various companies in the 24/90 tax group, of which Telefónica, S.A. is the parent, were initiated. The taxes subject to review were corporate income tax for the years 2005 to 2007, VAT, tax withholdings and payments on account in respect of personal income tax, tax on investment income, property tax and nonresident income tax for the years 2006 to 2007. Meanwhile, Telecomunicações de São Paulo, S.A. – Telefónica Brasil has a number of appeals underway regarding the ICMS –similar to VAT- levied on telecommunications services. There is a dispute with the Brazilian tax authorities over which services should be subject to settlement of this tax. In most cases, the authorities require the collection of the ICMS on complementary or auxiliary services to base telecommunications service. To date, all the related procedures are being contested in all instances (administrative and judicial). The aggregate amount of these assessments, updated to take into account interests, fines and other items, is approximately 1,077 million euros. On February 11, 2011, Telefónica del Perú, S.A.A. was notified of the decision of the tax court concluding the administrative instance in the matter regarding income tax for 2000 and 2001 and the respective payments on account, noted by the tax authorities in 2005, confirming the reservations of the National Tax Administration (SUNAT) regarding (i) financial charges, (ii) provisions for doubtful collectibles, (iii) lease expenses (TPI), (iv) non-divestment reorganization and (v) overhead. The company has submitted various appeals at the judicial level, petitioning the courts to overturn the decision, considering that it was based on insufficient legal grounds. Telefónica del Perú has paid 38 million euros, in compliance with a collection enforcement rule established in order to have the company pay the amount until a definitive resolution of the matter is reached. No additional provisions are deemed necessary for recognition in the consolidated financial statements of the Group at December 31, 2011 as a result of the final resolution of tax litigation and ongoing inspections. Years open for inspection
The years open for review by the tax inspection authorities for the main applicable taxes vary from one consolidated company to another, based on each country’s tax legislation, taking into account their respective statute-of-limitations periods. In Spain, as a result of the tax audit completed in 2008, the main companies of the tax group are open to inspection for all years from 2005. In the other countries in which the Telefónica Group has a significant presence, the years open for inspection by the relevant authorities are generally as follows:
• The last seven years in Argentina
• The last five years in Brazil, Mexico, Colombia and the Netherlands
• The last four years in Venezuela, Nicaragua and Peru
• The last three years in Chile, Ecuador, El Salvador, the US and Panama
• The last two years in Uruguay
• In Europe, the main companies have open to inspection the last six years in the United Kingdom, the last eight years in Germany, and the last three years in the Czech Republic.
F-86

The tax audit of the open years is not expected to give rise to additional material liabilities for the Group.
None of the Group’s principal operations were discontinued in 2011, 2010 or 2009.
Revenues: The breakdown of “Revenues” is as follows:
Other income
The breakdown of “Other income” is as follows:
The gain on disposal of assets in 2011 relates mainly to the disposal of non-strategic items of property, plant and equipment of the Group, mostly in Latin America, for 564 million euros (with 200million euros by Telefónica Brasil and 240 million euros by Telefónica Móviles Mexico) and the gain on the partial settlement of the equity swap contracts on the investment in Portugal Telecom for 184million euros (see Note 13). The gain on disposal of assets in 2010 included the capital gain recognized in accordance with IFRS 3 resulting from the remeasurement of the previously held interest in Brasilcel, as described in Note5, in the amount of 3,797 million euros. It also included gains on the sale of certain non-strategic Group property, plant and equipment and the sale of Manx, for 260 million euros and 61 million euros,respectively.
(18) DISCONTINUED OPERATIONS
(19) REVENUE AND EXPENSES
Millions of euros 2011 2010 2009Rendering of services 58,415 56,434 52,498Net sales 4,422 4,303 4,233Total 62,837 60,737 56,731
Millions of euros 2011 2010 2009Ancillary income 445 882 584Own work capitalized 739 737 720Government grants 62 66 54Gain on disposal of assets 861 4,184 287Total 2,107 5,869 1,645
F-87

Other expenses The breakdown of “Other expenses” in 2011, 2010 and 2009 is as follows:
In 2010, the Group approved firm commitments in connection with the Telefónica Foundation’s social welfare projects, in order to provide it with adequate financing to enable it to carry out its forecastshort and medium-term plans, in the amount of 400 million euros. These commitments were partially met with the contribution of certain properties in 2011 to the foundation, generating a gain of 40million euros. Outstanding commitments at the end of the year amounted to 259 million euros. Estimated schedule The estimated payment schedule for the next few years on operating leases, purchase and contractual commitments is as follows:
The main finance lease transactions are described in Note 22. Headcount and employee benefits a) Number of employees The table below presents the breakdown of the Telefónica Group’s average number of employees in 2011, 2010 and 2009, together with total headcount at December 31 each year. The employees shownfor each subgroup include the Telefónica Group companies with similar activities in accordance with the segment reporting.
Millions of euros 2011 2010 2009Leases 1,033 1,083 1,068Advertising 1,457 1,419 1,123Other external services 10,529 9,726 7,729Taxes other than income tax 1,328 1,279 1,203Other operating expenses 190 453 203Change in trade provisions 818 853 874Losses on disposal of fixed assets and changes in provisions for fixed assets 43 1 81Total 15,398 14,814 12,281
12/31/11 Total Less than 1 year 1 to 3 years 3 to 5 years Over 5 years
Operating lease obligations 9,613 1,543 2,591 2,114 3,365
Purchase and other contractual obligations 2,568 1,473 737 345 13
2011 2010 2009 Average Year-end Average Year-end Average Year-end
Telefónica Spain 35,168 33,929 35,313 35,379 35,318 35,338Telefónica Latin America 60,589 61,527 55,164 60,909 50,709 51,606Telefónica Europe 26,715 26,085 26,517 25,968 28,249 27,023Subsidiaries and other companies 163,673 169,486 152,053 162,850 140,875 143,459Total 286,145 291,027 269,047 285,106 255,151 257,426
F-88

The number of employees shown in the table above corresponds to the consolidated companies. It is worth highlighting the large number of employees at the various companies of the Atento Groupperforming contact center activities, whose average and year-end headcount for 2011 were 152,197 and 156,734, respectively. Of the final headcount at December 31, 2011, approximately 53.5% are women (51.5% and 51.8% at December 31, 2010 and December 31, 2009, respectively). “Personnel expenses” in 2011 include the amount related to the labor force reduction plan of Telefónica de España, S.A.U. The amount recognized by the Group to undertake the restructuring in Spainwas 2,671 million euros (Note 15). In 2010, the Group reduced its workforce as part of the integration of its businesses, entailing provisions of 670 million euros in the different companies comprisingthe Group, including provision made in Germany for the integration of Telefónica Germany and HanseNet in an amount of 202 million euros. b) Employee benefits The Telefónica Group has arranged a defined-contribution pension plan for its employees in Spain. Under this plan, the company makes contributions of 4.51% of the regular base salary (6.87% foremployees of Telefónica de España, S.A.U. whose hiring date was prior to June 30, 1992). This is in addition to a 2.21% compulsory contribution by each participant. This plan is entirely externalized inoutside funds. At December 31, 2011, a total of 49,580 Group employees were covered by the pension plans managed by the subsidiary Fonditel Entidad Gestora de Fondos de Pensiones, S.A. (51,572 and 52,915 atDecember 31, 2010 and 2009, respectively). The contributions made by the various companies in 2011 amounted to 104 million euros (99 million euros and 97 million euros in 2010 and 2009,respectively). Furthermore, in 2006, the Group approved a Pension Plan for Senior Executives, wholly funded by the company, which complements the previous plan. This plan envisages annual defined contributionsequivalent to specific percentages of the executives’ fixed remuneration, in accordance with their professional category, and extraordinary contributions in accordance with the circumstances of eachexecutive, payable in line with the conditions of said Plan. No provision was made for this plan as it has been fully externalized. Depreciation and amortization The breakdown of “Depreciation and amortization” on the consolidated income statement is as follows:
Earnings per share
Basic earnings per share amounts are calculated by dividing net profit for the year attributable to ordinary equity holders of the parent by the weighted average number of ordinary shares outstandingduring the year.
Millions of euros 2011 2010 2009
Depreciation of property, plant and equipment 6,670 6,159 6,095
Amortization of intangible assets 3,476 3,144 2,861
Total 10,146 9,303 8,956
F-89

Diluted earnings per share amounts are calculated by dividing net profit for the year attributable to ordinary equity holders of the parent (adjusted for any dilutive effects inherent in converting potential ordinary shares issued) by the weighted average number of ordinary shares outstanding during the year plus the weighted average number of ordinary shares that would be issued on the conversion of allthe dilutive potential ordinary shares into ordinary shares.
Both basic and diluted earnings per share attributable to equity holders of the parent are calculated based on the following data:
The denominators used in the calculation of both basic and diluted earnings per share have been adjusted to reflect any transactions that changed the number of shares outstanding without acorresponding change in equity as if they had taken place at the start of the first period under consideration. There have been no transactions involving existing or potential ordinary shares between the end of the year and the date of preparation of the consolidated financial statements. Basic and diluted earnings per share attributable to equity holders of the parent broken down by continuing and discontinued operations are as follows:
Millions of euros 2011 2010 2009Profit attributable to ordinary equity holders of the parent from continuing operations 5,403 10,167 7,776Profit attributable to ordinary equity holders of the parent from discontinued operations - - -Total profit attributable to equity holders of the parent for basic earnings 5,403 10,167 7,776Adjustment for dilutive effects of the conversion of potential ordinary shares - - -Total profit attributable to equity holders of the parent for diluted earnings 5,403 10,167 7,776
ThousandsNumber of shares 2011 2010 2009Weighted average number of ordinary shares (excluding treasury shares) for basic earnings per share 4,511,165 4,522,228 4,552,656Telefónica, S.A. share option plan. 1,675 6,017 7,908Weighted average number of ordinary shares (excluding treasury shares) outstanding for diluted earnings per share 4,512,840 4,528,245 4,560,564
Continuing operations Discontinued operations TotalFigures in euros 2011 2010 2009 2011 2010 2009 2011 2010 2009
Basic earnings per share 1.20 2.25 1.71 - - - 1.20 2.25 1.71Diluted earnings per share 1.20 2.25 1.71 - - - 1.20 2.25 1.71
F-90

At year-end 2011, 2010 and 2009, the Telefónica Group had the following shared-based payment plans linked to the share price of Telefónica, S.A. The main plans in force at the end of 2011 are asfollows:
At the General Shareholders’ Meeting of Telefónica, S.A. on June 21, 2006, its shareholders approved the introduction of a long-term incentive plan for managers and senior executives of Telefónica, S.A. and other Telefónica Group companies. Under this plan, selected participants who met the qualifying requirements were given a certain number of Telefónica, S.A. shares as a formof variable compensation.
The Plan was initially intended to last seven years. It is divided into five phases, each three years long, beginning on July 1 (the “Start Date”) and ending on June 30 three years later (the “End Date”). At the start of each phase the number of shares to be awarded to Plan beneficiaries is determined based on their success in meeting targets set. The shares are delivered, assuming targets aremet, at the End Date of each phase. Each phase is independent from the others. The first started on July 1, 2006 (with shares delivered on July 1, 2009) and the fifth phase on July 1, 2010 (with anyshares to be delivered from July 1, 2013).
Award of the shares is subject to a number of conditions:
June 30, 2009 marked the end of the first phase of this plan, which entailed the following maximum number of shares allocated:
With the maturity of the plan, in July 2009 a total of 3,309,968 shares (corresponding to a total of 4,533,393 gross shares less a withholding of 1,224,610 shares prior to delivery and at the option of theemployee) were delivered to Telefónica Group directors included in the first phase. The shares delivered were deduced from the Company’s treasury shares in 2009.
(20) SHARE-BASED PAYMENT PLANS
a) Telefónica, S.A. share plan: “Performance Share Plan”
– The beneficiary must continue to work for the company throughout the three-year duration of each phase, subject to certain special conditions related to departures.
– The actual number of shares awarded at the end of each phase will depend on success in meeting targets and the maximum number of shares assigned to each executive. Success is measuredby comparing the Total Shareholder Return (“TSR”), which includes both share price and dividends offered by Telefónica shares, with the TSRs offered by a basket of listed telecomscompanies that comprise the comparison group. Each employee who is a member of the plan is assigned at the start of each phase a maximum number of shares. The actual number of sharesawarded at the end of the phase is calculated by multiplying this maximum number by a percentage reflecting their success at the date in question. This will be 100% if the TSR of Telefónicais equal to or better than that of the third quartile of the Comparison Group and 30% if Telefónica's TSR is in line with the average. The percentage rises linearly for all points between thesetwo benchmarks. If the TSR is below average no shares are awarded.
No. of shares Unit fair value End date
1st phase July 1, 2006 6,530,615 6.43 June 30, 2009
F-91

All the shares included in the first phase of the plan were hedged with a derivative instrument acquired in 2006. The cost of this instrument was 46 million euros, which in unit terms is 6.43 euros pershare. At June 30, 2009, the bank with which the financial instrument was entered into delivered the contracted shares to Telefónica, S.A. These were accounted for as treasury shares. The second phase of the plan matured on June 30, 2010, with the maximum number of shares allocated as follows:
With the maturity of the second phase of the plan on June 30, 2010, a total of 2,964,437 shares (corresponding to a total of 4,091,071 gross shares less a withholding of 1,132,804 shares prior to delivery,at the option of the employee) were delivered to Telefónica Group directors included in the second phase. The shares delivered were deducted from the Company’s treasury shares in 2010. The third phase of the plan matured on June 30, 2011, with the maximum number of shares allocated as follows:
With the maturity of the third phase of the plan on June 30, 2011 a total of 2,900,189 shares (corresponding to a total of 4,166,304 gross shares less a withholding of 1,266,115 shares prior to delivery, atthe option of the employee) were delivered to Telefónica Group directors included in the third phase. The shares delivered were deducted from the Company’s treasury shares in 2011. The third phase of the Plan was partially covered through two financial instruments relating to 2,446,104 shares at a cost of 10.18 euros per share. The maximum number of the shares issuable in each of the two outstanding phases at December 31, 2011 is as follows:
This plan is equity-settled via the delivery of shares to the participants. Accordingly, a balancing entry for the 49, 42 and 43 million euros of employee benefits expenses recorded in 2011, 2010 and 2009, respectively, was made in equity.
No. of shares Unit fair value End date
2nd phase July 1, 2007 5,556,234 7.70 June 30, 2010
No. of shares Unit fair value End date
3rd phase July 1, 2008 5,286,980 8.39 June 30, 2011
No. of shares assigned Outstanding shares at
12/31/11 Unit fair value End date
4th phase July 1, 2009 6,356,597 5,407,401 8.41 June 30, 2012
5th phase July 1, 2010 5,025,657 4,684,289 9.08 June 30, 2013
F-92

In relation to the fourth phase of the Plan and for the sole purpose of ensuring the shares necessary at the end of this phase, Telefónica, S.A. purchased an instrument from a financial institution with thesame features as the Plan whereby, at the end of the phase, Telefónica will obtain part of the shares necessary to settle the phase (4 million shares). The cost of the financial instrument was 36 millioneuros, equivalent to 8.41 euros per option (see Note 16).
In addition to the Performance Share Plan, another plan called the Performance Cash Plan, operating under the same conditions as the Performance Share Plan is targeted at Telefónica Europe. Thisplan entails delivery to this segment’s executives of a specific number of theoretical options in Telefónica, S.A. which, in the event, would be cash-settled at the end of each phase via a paymentequivalent to the market value of the shares on settlement date up to a maximum of three times the notional value of the shares at the delivery date. The value of theoretical options is established as the average share price in the 30 days immediately prior to the start of each phase, except for the first phase, where the average share price duringthe 30 days immediately prior to May 11, 2006 (12.83 euros) was taken as the reference. The estimated duration of this plan is also 7 years, with 5 phases, each of 3 years, commencing on July 1 of each year, starting in 2006. Like the Telefónica, S.A. Performance Share Plan, the performance rate for setting payments is measured based on the TSR on Telefónica shares with respect to the comparison group’s TSRs, in line with the following criteria:
The number of options assigned at December 31, 2011 was 358,860 (364,601 and 412,869 at December 31, 2010 and 2009, respectively).
The fair value at December 31, 2011 of the options delivered in each phase in force at that time was 13.39 euros per option.
This value is calculated by taking the Telefónica share price and including the estimated TSR and is updated at each year end.
At the June 23, 2009 General Shareholders’ Meeting of Telefónica, S.A. , the shareholders approved the introduction of a Telefónica, S.A. share incentive plan for all employees of the TelefónicaGroup worldwide, with certain exceptions. Under this plan, participants that meet the qualifying requirements are offered the possibility of acquiring Telefónica, S.A. shares, with this companyassuming the obligation of giving participants a certain number of Telefónica, S.A. shares free of charge.
b) Telefónica, S.A. share option plan targeted at Telefónica Europe employees: “Performance Cash Plan”
• Below average 0% • Average 30% • Equal to or higher than the third quartile 100%
c) Telefónica, S.A. global share plan: “Global Employee Share Plan”
F-93

The initial duration of the plan is intended to be two years. Employees subscribed to the plan can acquire Telefónica, S.A. shares through monthly installments of up to 100 euros (or the localcurrency equivalent), up to a maximum of 1,200 euros over a twelve-month period of (acquisition period). The delivery of shares will occur, where applicable, when the plan is consolidated, as ofSeptember 1, 2012, subject to a number of conditions:
The acquisition period opened in August 2010, and at December 31, 2011, 37,230 employees had adhered to the plan. This plan is equity-settled via the delivery of shares to the participants.Accordingly, a balancing entry for the 21 and 11 million euros of employee benefits expenses recorded in 2011 and 2010, respectively, was made in equity.
At the General Shareholders’ Meeting held on May 18, 2011, a new long-term share-based incentive plan called “Performance and Investment Plan” (the “Plan” or “PIP”) was approved for Telefónica Group directors and executive officers. This plan will take effect following completion of the Performance Share Plan. Under this Plan, a certain number of shares of Telefónica, S.A. will be delivered to plan participants selected by the Company who decide to participate on compliance with stated requirements andconditions. The Plan lasts five years and is divided into three independent three-year phases (i.e. delivery of the shares for each three-year phase three years after the start date). The first phase began on July 1, 2011 (with the delivery of the related shares from July 1, 2014). The second phase will begin on July 1, 2012 (with delivery of the related shares from July 1, 2015). The third phase will begin onJuly 1, 2013 (with delivery of the related shares from July 1, 2016). The specific number of Telefónica, S.A. shares deliverable within the maximum amount established to each member at the end of each phase will be contingent and based on the Total ShareholderReturn (“TSR”) of Telefónica, S.A. shares (from the reference value) throughout the duration of each phase compared to the TSRs of the companies included in the Dow Jones Global Sector TitansTelecommunications Index. For the purposes of this Plan, these companies make up the comparison group (“Comparison Group”). The TSR is the indicator used to determine the Telefónica Group’s medium- and long-term value generation, measuring the return on investment for each shareholder. For the purposes of this Plan,the return on investment of each phase is defined as the sum of the increase or decrease in the Telefónica, S.A. share price and dividends or other similar items received by the shareholder during thephase in question.
- The beneficiary must continue to work for the company throughout the two-year duration of the plan (consolidation period), subject to certain special conditions related to departures.
- The actual number of shares to be delivered at the end of the consolidation period will depend on the number of shares acquired and retained by each employee. Each employee who is amember of the plan, has remained a Group employee, and has retained the shares acquired for an additional twelve-month period after the acquisition date, will be entitled to receive one free share per share acquired and retained at the end of the consolidation period.
d) Long-term incentive plan based on Telefónica, S.A. shares: “Performance and Investment Plan”
F-94

At the beginning of each phase, each Participant is allocated a theoretical number of shares. According to the Plan, the number of shares to be delivered will range from:
The Plan includes an additional condition regarding compliance by all or part of the Participants with a target investment and holding period of Telefónica, S.A. shares through each phase (“Co-Investment”), to be determined for each participant, as appropriate, by the Board of Directors based on a report by the Nominating, Compensation and Corporate Governance Committee.Participants meeting the co-investment requirement will receive an additional number of shares, provided the rest of the requirements established in the Plan are met. In addition, and independently of any other conditions or requirements that may be established, in order to be entitled to receive the corresponding shares, each Participant must be a TelefónicaGroup employee at the delivery date for each phase, except in special cases as deemed appropriate. Shares will be delivered at the end of each phase (i.e., in 2014, 2015, and 2016, respectively). The specific delivery date will be determined by the Board of Directors or the committee or individualentrusted by the Board to do so. The shares to be delivered to Participants, subject to compliance with the pertinent legal requirements in this connection, may be either (a) treasury shares in Telefónica, S.A. acquired by Telefónica,S.A. itself or by any of the Telefónica Group companies; or (b) newly-issued shares. The first allocation of shares under this Plan was made on July 1, 2011. Therefore, the maximum number of shares assigned (including the amount of co-investment) under the Plan at December 31, 2011 is as follows:
In connection with the PIP Plan, Telefónica, S.A. acquired an instrument from a financial institution with the same features of the plan, whereby at the end of the phase, Telefónica will obtain part ofthe shares necessary to settle the phase (4 million shares). The cost of the financial instrument is 37 million euros, equivalent to 9.22 euros per option
- 30% of the number of theoretical shares if Telefónica, S.A.’s TSR is at least equal to the Comparison Group’s median, and
- 100% if Telefónica, S.A.’s TSR is within the third quartile or higher than the Comparison Group’s. The percentage is calculated using linear interpolation when it falls between the median andthird quartile.
- No shares will be delivered if Telefónica, S.A.’s TSR is below the Comparison Group’s median.
Phase No. of shares assigned Unit fair value End date
1st phase July 1, 2011 5,545,628 8.28 June 30, 2014
F-95

At Telefónica, S.A.'s General Shareholders' Meeting held on May 18, 2011, the Company approved the roll-out of the Restricted Share Plan (RSP), a long-term share-based incentive plan with two primary aims: (a) to retain and motivate certain high-potential employees, and (b) to retain key personnel upon new acquisitions, providing them with an ownership interest in the Company throughrights convertible to shares. The RSP is established for a five-year period, with independent deliveries permitted at any time between 2011 and 2015. At each delivery date the Company extends certain Restricted Share Units(RSUs) carrying the right to automatically receive the same number of Telefónica, S.A. shares at the end of the vesting period, subject to compliance with certain length-of-service requirements. Delivery of shares is conditional on compliance with certain service-related conditions, namely:
The required deliveries at December 31, 2011 were not significant.
Telefónica and its group companies are party to several lawsuits or proceedings that are currently in progress in the law courts and administrative and arbitration bodies of the various countries in whichthe Telefónica Group is present. Considering the reports of the Company’s legal advisors regarding these proceedings, it is reasonable to assume that this litigation or cases will not materially affect the financial position or solvency ofTelefónica Group, regardless of the outcome. Among unresolved cases or those underway in 2011 (see Note 17 for details of tax-related cases), the following are of special note: Contentious proceedings in connection with the merger between Terra Networks, S.A. and Telefónica On September 26, 2006, Telefónica was notified of the claim filed by former shareholders of Terra Networks, S.A. (Campoaguas, S.L., Panabeni, S.L. and others) alleging breach of contract in respect ofthe terms and conditions set forth in the Prospectus of the Initial Public Offering of shares of Terra Networks, S.A. dated October 29, 1999. This claim was rejected via a ruling issued on September 21,2009, and the appellants were charged for the court costs. This ruling was
e) “Restricted Share Plan” (RSP)
1. Final delivery: participants must have been employed by the Company continuously from the grant date to the conversion date
2. Final delivery: participants must have worked for a minimum period of 12 months within the vesting period
3. The specific duration of the vesting period will be set on a case-by-case basis.
(21) OTHER INFORMATION
a) Litigation and arbitration
F-96

appealed on December 4, 2009. On June 16, 2010, Telefónica was notified of the written appeal filed by the appellants. Telefónica opposed this appeal in January 2011. Cancellation of the UMTS license granted to Quam GMBH in Germany. In December 2004, the German Telecommunications Market Regulator revoked the UMTS license granted in 2000 to Quam GmbH, in which Telefónica has a stake. After obtaining a suspension of therevocation order, on January 16, 2006, Quam GmbH filed a suit against the order with the German courts. This claim sought two objectives: 1) to overturn the revocation order issued by the GermanTelecommunications Market Regulator, and 2) if this failed, to be reimbursed for the total or partial payment of the original amount paid for the license; i.e. 8,400 million euros. This claim was rejected by the Cologne Administrative Court. Quam GmbH appealed the decision before the Supreme Administrative Court of North Rhine-Westphalia, which also rejected its appeal. Lastly, Quam GmbH filed a new appeal, at third instance, before the Federal Supreme Court for Administrative Cases, which was not admitted for processing. Quam GmbH appealed this decision on August 14, 2009. On August 17, 2011, after the oral hearing, the Federal Administrative Court rejected Quam GMBH’s appeal at third instance. In October 2011, Quam GmbH filed a constitutional complaint for the German Federal Constitutional Court (Karlsruhe). Appeal against the European Commission ruling of July 4, 2007 against Telefónica de España’s broadband pricing policy. On July 9, 2007, Telefónica was notified of the decision issued by the European Commission (“EC”) imposing a fine of approximately 152 million euros for breach of the former article 82 of EC Treatyrules by charging unfair prices between whole and retail broadband access services. The ruling charged Telefónica with applying a margin squeeze between the prices it charged competitors to provideregional and national wholesale broadband services and its retail broadband prices using ADSL technology between September 2001 and December 2006. On September 10, 2007, Telefónica and Telefónica de España filed an appeal to overturn the decision before the General Court of the European Union. The Kingdom of Spain, as an interested party, alsolodged an appeal to overturn the decision. Meanwhile, France Telecom and the Spanish Association of Bank Users (AUSBANC) filed requests to intervene, which the General Court admitted. A hearing was held on May 23, 2011, at which Telefónica presented its case. A ruling has yet to be issued as of December 31, 2011. Claim against the decision by Agencia Nacional de Telecomunicações (ANATEL) regarding the inclusion of interconnection and network usage revenues in the Fundo de Universalização de Serviços deTelecomunicações (FUST). Vivo Group operators, together with other wireless operators, appealed ANATEL’s decision of December 16, 2005, to include interconnection and network usage revenues and expenses in thecalculation of the amounts payable into the Fund for Universal Access to Telecommunications
F-97

Services (Fundo de Universalização de Serviços de Telecomunicações or FUST for its initials in Portuguese) –a fund to pay for the obligations to provide universal service- with retroactive application from 2000. On March 6, 2007, a ruling in favor of the wireless operators was issued, stating that it was not appropriate to include the revenues received from other operators in the taxable income for theFUST’s calculation and rejecting the retroactive application of ANATEL’s decision. ANATEL filed an appeal to overturn this decision with Brasilia Regional Federal Court no. 1. This appeal is pendingresolution. At the same time, Telefónica Brasil and Telefónica Empresas, S.A., together with other wireline operators through ABRAFIX (Associação Brasileira de Concessionárias de Serviço Telefonico Fixo Comutado) appealed ANATEL’s decision of December 16, 2005, also obtaining injunctions. On June 21, 2007, Federal Regional Court no. 1 ruled that it was not appropriate to include theinterconnection and network usage revenues and expense in the FUST’s taxable income and rejected the retroactive application of ANATEL’s decision. ANATEL filed an appeal to overturn this rulingon April 29, 2008 before Brasilia Federal Regional Court no. 1. No further action has been taken since then. The amount of the claim is quantified at 1% of the interconnection revenues. Public civil procedure by the Sao Paulo government against Telefónica Brasil for alleged reiterated malfunctioning in the services provided by Telefónica Brasil compensation for damages to thecustomers affected This proceeding was filed by the Public Ministry of the State of Sao Paulo for alleged reiterated malfunctioning in the services provided by Telefónica Brasil, seeking compensation for damages to thecustomers affected. A general claim is filed by the Public Ministry of the State of Sao Paulo, for 1,000 million Brazilian reais (approximately 448 million euros), calculated on the company’s revenue base over the last five years. In April 2010, a ruling in first instance convicting the Telefónica Group was issued. On May 5, 2010, Telefónica Basil filed an appeal before the Sao Paolo Court of Justice, suspending the effect of theruling. No further action has been taken since then. Case before the Directorate General for Competition of the European Commission – Telefónica / Portugal Telecom On January 5, 2011, the European Commission sent a request to Telefónica, S.A. for information on the agreements entered into with Portugal Telecom SGPS, S.A. (Portugal Telecom) for the purchaseof its ownership interest in Brasilcel, N.V., a joint venture in which both are venturers and owner of Brazilian company Vivo. On January 19, 2011, the European Commission initiated formalproceedings to investigate whether Telefónica and Portugal Telecom had infringed on European Union anti-trust laws with respect to a clause contained in these agreements. After responding to anumber of requests for information from the European Commission, on September 24, 2011, Telefónica received a list of charges from the European Commission. On January 13, 2012, it presented itsresponse to the charges.
F-98

Telefónica Internacional, S.A.U. as strategic partner of Colombia Telecomunicaciones, S.A. ESP. Pursuant to the terms of the Framework Investment Agreement signed on April 18, 2006 between Telefónica Internacional, S.A.U., the Colombian government and Colombia Telecomunicaciones, S.A.ESP, shareholders of Colombia Telecomunicaciones, S.A. ESP may offer, from April 28, 2006, at any time and in a single package, all the shares they hold in Colombia Telecomunicaciones, S.A. ESPto Telefónica Internacional, S.A.U., who shall be obliged to acquire them, directly or via one of its subsidiaries. The sale/purchase price of each share will be determined based on a per share valuation ofeach share offered for sale by an independent investment bank designated by agreement between the two parties. Guarantees provided for Ipse 2000 (Italy). The Telefónica Group had provided guarantees for the Italian company Ipse 2000 S.p.A. (holder of a UMTS license in Italy and in which the Company has a stake through Solivella B.V.) to ensure theamounts payable to the Italian government in connection with the grant of the license. In November 2010, the last of the 10 monthly payments scheduled was paid. Therefore, the guarantee expired onthat day. Pending was the release letter to be issued by the Italian government, which is finally issued. There are no other risks or commitments related to this matter. Acquisition of radioelectric spectrum by Telefónica Móviles España S.A.U. Telefónica Móviles España S.A.U. has won the concessions for the private use of public radioelectric spectrum in the 800 MHz, 900 MHz and 2.6 GHz bands, all until December 31, 2030. The totalamount these concessions is 842 million euros, of which 441 million euros has already been paid, leaving an outstanding amount to be paid by June 1, 2012, of 401 million euros. The contingencies arising from the litigation and commitments described above were evaluated (see Note 3.1) when the consolidated financial statements for the year ended December 31, 2011 wereprepared. The provisions recorded in respect of the commitments taken as a whole are not material.
Through its investees and in line with its environmental policy, the Telefónica Group has undertaken various environmental-management initiatives and projects. In 2011 and 2010, these initiatives and projects resulted in expenditure and investment for insignificant amounts, which were recognized in the consolidated income statement and consolidated statement of financial position, respectively. The Group has launched various projects aimed at improving current systems to reduce the environmental impact of its existing installations, with project costs being added to the cost of the installationto which the project relates. In addition, in line with its commitment to the environment, the Group announced the creation of a Climate Change Office to provide a framework for strategic and RD&I projects in the quest for energyefficient solutions. This initiative entails the launch and implementation of solutions in each area that contribute to optimizing the Company's processes (operations, suppliers, employees, customers andsociety).
b) Commitments
c) Environmental matters
F-99

The Group has also rolled out internal control mechanisms sufficient to pre-empt any environmental liabilities that may arise in future, which are assessed at regular intervals either by Telefónica staff orrenowned third-party institutions. No significant risks have been identified in these assessments.
The expenses accrued in respect of the fees for services rendered to the various member firms of the Ernst & Young international organization, to which Ernst & Young, S.L. (the auditors of theTelefónica Group) belongs, amounted to 27.93 million euros and 27.71 million euros in 2011 and 2010, respectively. The detail of these amounts is as follows:
The description of the fees paid to the various member firms of the Ernst & Young international organization is as follows:
• In the area of operations, the main objective is to develop and implement projects that will allow for more efficient networks and systems by reducing and optimizing energy consumption.
• In the area of suppliers, active efforts are underway to include energy efficiency criteria in the purchasing process for all product lines in the Telefónica Group’s value chain.
• In the area of employees, the aim is to foster among the Company’s employees a culture of respect and awareness regarding the environment and energy saving.
• In the area of customers, work is being carried out to better leverage ICTs (information and communication technologies) and increase energy efficiency with the objective of reducing carbonemissions.
• And finally, in the area of society, the objective is to promote change in citizens’ behavior through actions by the Telefónica Group.
d) Auditors’ fees
Millions of euros 2011 2010Audit services (1) 26.29 25.75Audit-related services (2) 1.64 1.92Tax services (3) - 0.03All other services (4) - 0.01TOTAL 27.93 27.71
(1) Audit services: services included under this heading are mainly the audit of the annual and reviews of interim financial statements, work to comply with the requirements of the Sarbanes-Oxley Act (Section 404) and the review of the 20-F report to be filed with the US Securities and Exchange Commission (SEC).
(2) Audit-related services: This heading mainly includes services related to the review of the information required by regulatory authorities, agreed financial reporting procedures not requested by legalor regulatory bodies and the review of corporate responsibility reports.
(3) Tax services: no such services were provided in 2011. The services in 2010 related to the review of tax obligations.
F-100

Ernst & Young’s fees include amounts in respect of fully and proportionately consolidated Telefónica Group companies. A total of 0.07 and 0.04 million euros, respectively, corresponding to 50% of thefees paid by proportionately consolidated companies, were included in 2011 and 2010, respectively. The expenses accrued in respect of the fees for services rendered to other auditors in 2011 and 2010 amounted to 32.41 million euros and 28.10 million euros, respectively, as follows:
Other auditors’ fees include amounts in respect of fully and proportionately consolidated Telefónica Group companies. In 2011 and 2010, a total of 0.02 million euros and 0.02 million euros,respectively, corresponding to 50% of the fees by proportionately consolidated companies, were included.
The Company is required to issue trade guarantees and deposits for concession and spectrum tender bids (see Note 16) and in the ordinary course of its business. No significant additional liabilities in theaccompanying consolidated financial statements are expected to arise from guarantees and deposits issued.
Directors’ compensation The compensation of Telefónica, S.A.’s Directors is governed by Article 28 of the Bylaws, which states that the compensation amount that the Company may pay to all of its Directors as remunerationand attendance fees shall be fixed by the shareholders at the General Shareholders’ Meeting, which amount shall remain unchanged until and unless the shareholders decide to modify it. The Board ofDirectors shall determine the exact amount to be paid within such limit and the distribution thereof among the Directors. This compensation, as laid down in said article of the Bylaws, is compatible withother professional or employment compensation accruing to the Directors by reason of any executive or advisory duties that they perform for the Company, other than the supervision and collectivedecision-making duties inherent in their capacity as Directors. Accordingly, on April 11, 2003, shareholders set the maximum gross annual amount to be paid to the Board of Directors at 6 million euros. This includes a fixed payment and fees for attending meetingsof the Board of Director’s advisory or control Committees. Total compensation paid to Telefónica, S.A.’s Directors for discharging their duties in 2011 amounted to 4,549,501 euros in fixedcompensation.
(4) All other services: the services included under this heading relate to training.
Millions of euros 2011 2010Audit services 0.68 0.75Audit-related services 0.76 1.26Tax services: 6.37 7.29All other services (consulting, advisory, etc.) 24.60 18.80TOTAL 32.41 28.10
e) Trade and other guarantees
f) Directors’ and Senior executives’ compensation and other benefits
F-101

The compensation paid to Telefónica, S.A. directors in their capacity as members of the Board of Directors, the Executive Committee and/or the advisory and control Committees consists of a fixedamount payable monthly plus fees for attending the meetings of the Board’s advisory or control committees. Board members other than the Chairman do not receive any amounts for their directorships,but only the corresponding amounts for discharging their executive duties as stipulated in their respective contracts. The following table presents the fixed amounts established for membership to the Telefónica, S.A. Board of Directors, Executive Commission and the advisory or control Committees:
In addition, the amounts paid for attendance at each of the Advisory or Control Committee’s meetings is 1,250 euros.
(Amounts in euros)Position Board of Directors Executive Commission Advisory or Control CommitteesChairman 300,000 100,000 28,000 Vice Chairman 250,000 100,000 - Board member:
Executive - - - Proprietary 150,000 100,000 14,000 Independent 150,000 100,000 14,000 Other external 150,000 100,000 14,000
F-102

Individual breakdown The following table presents the breakdown by item of the compensation and benefits paid to Telefónica, S.A. Directors in 2011:
(euros)
It is duly noted that Mr. Vitalino Nafría Aznar tendered his resignation as Director on December 14, 2011. Appointed to replace him by the method of co-option was Mr. Ignacio Moreno Martínez, which did not receive any compensation in this respect in 2011. The following table presents the specific compensation paid to Directors of Telefónica, S.A. for membership of the various advisory or control Committees in 2011:
Director Wage/
Compensation1
Fixed Payment Board
Committees2 Attendance fees3
Short-term Variable
Compensation4 Other items5 TOTALExecutive Mr. César Alierta Izuel 2,530,800 100,000 -- 4,015,440 265,300 6,911,540Mr. Julio Linares López 1,973,100 -- -- 3,011,580 126,084 5,110,764Mr. José María Álvarez-Pallete López 316,000 -- -- -- 21,570 337,570Proprietary Mr. Isidro Fainé Casas 250,000 100,000 -- -- 10,000 360,000Mr. Vitalino Nafría Aznar 250,000 56,000 26,250 -- -- 332,250Mr. José María Abril Pérez 150,000 122,167 13,750 -- -- 285,917Mr. Antonio Massanell Lavilla 150,000 70,000 32,500 -- 10,000 262,500Mr. Chang Xiaobing 87,500 -- -- -- -- 87,500Independent Mr. David Arculus 150,000 28,000 11,250 -- -- 189,250Ms. Eva Castillo Sanz 150,000 42,000 25,000 -- -- 217,000Mr. Carlos Colomer Casellas 150,000 156,000 21,250 -- 130,000 457,250Mr. Alfonso Ferrari Herrero 150,000 212,000 58,750 -- 132,500 553,250Mr. Luiz Fernando Furlán 150,000 14,000 5,000 -- -- 169,000Mr. Gonzalo Hinojosa Fernández de Angulo 150,000 198,000 48,750 -- 133,750 530,500Mr. Pablo Isla Álvarez de Tejera 150,000 75,833 13,750 -- -- 239,583Mr. Javier de Paz Mancho 150,000 156,000 11,250 -- 120,000 437,250Other external Mr. Fernando de Almansa Moreno-Barreda 150,000 56,000 25,000 -- 10,000 241,000Mr. Peter Erskine 150,000 156,000 27,500 -- 3,750 337,250
1 Wage/Compensation: Cash compensation with a predefined payment frequency, accruable or not over time and payable contractually, irrespective of effective attendance by the Director to Telefónica, S.A. Board Meetings. Includes non-variableremuneration accrued, as appropriate, by the Director for discharging any related executive duties.
2 Fixed Payment Board Committees: Amount of items other than attendance to meetings payable to Directors for membership to the Executive Committee or advisory or control Committees of Telefónica, S.A., irrespective of effective attendanceto meetings of said Committees.
3 Attendance fees: Amounts payable for attendance to meetings of the advisory or control Committees of Telefónica, S.A.
4 Short-term variable compensation: Variable amount linked to the performance or achievement of individual or group objectives (quantitative or qualitative) and commensurate with other compensation or any other reference in euros for a periodof up to a year.
5 Other items: Includes, inter alia, amounts paid for membership to the various regional advisory committees in Spain, and the Telefónica Corporate University Advisory Council.
F-103

Amounts in euros
Board Members Audit and Control
Nomination, Compensation and Corporate Governance
Human Resources and
Corporate Reputation
and Responsibility Regulation
Service Quality and Customer Service
International Affairs Innovation Strategy TOTAL
Mr. César Alierta Izuel - - - - - - - - -Mr. Isidro Fainé Casas - - - - - - - - -Mr. Vitalino Manuel Nafría Aznar 26,500 - 16,500 21,500 - 17,750 - - 82,250Mr. Julio Linares López - - - - - - - -Mr. José María Abril Pérez - - - - - 20,250 15,667 - 35,917Mr. José Fernando de Almansa Moreno-Barreda - - - 21,500 - 34,250 - 25,250 81,000Mr. José María Álvarez-Pallete López - - - - - - - - -Mr. David Arculus - - - 20,250 - 19,000 - 39,250Ms. Eva Castillo Sanz - - - 21,500 20,250 - - 25,250 67,000Mr. Carlos Colomer Casellas - 17,750 - - 17,750 - 41,750 - 77,250Mr. Peter Erskine - 20,250 - - - - 24,000 39,250 83,500Mr. Alfonso Ferrari Herrero 27,750 38,000 17,750 21,500 20,250 20,250 - 25,250 170,750Mr. Luiz Fernando Furlán - - - - - 19,000 - - 19,000Mr. Gonzalo Hinojosa Fernández de Angulo 40,500 22,750 19,000 - 20,250 20,250 - 24,000 146,750Mr. Pablo Isla Álvarez de Tejera - 20,250 14,000 35,500 14,000 - 5,833 - 89,583Mr. Antonio Massanell Lavilla 25,250 - 16,500 - 34,250 - 26,500 - 102,500Mr. Francisco Javier de Paz Mancho - - 33,000 16,500 - 17,750 - - 67,250Mr. Chang Xiaobing - - - - - - - - -
TOTAL 120,000 119,000 116,750 158,250 126,750 168,500 113,750 139,000 1,062,000
F-104

The following presents also a breakdown of the amounts received from other Telefónica Group companies by Directors for discharging executive duties or for membership of the companies’ governing bodies:
(euros)
With respect to employee benefits, the following table presents a breakdown of internal or external contributions made in 2011 to both long-term savings schemes (including retirement and any othersurvival benefit) financed fully or partially by the Company for Directors, along with any other compensation in kind received by the Director during the year:
Share-based payment plans information as follows:
Director Wage/
Compensation1 Attendance fees2
Short-term variable
compensation3 Other items4 TOTALExecutive Mr. José María Álvarez-Pallete López 961,709 -- 1,140,138 57,553 2,159,400Proprietary Mr. Vitalino Nafría Aznar 16,737 -- -- 16,737Independent Mr. David Arculus 86,456 -- -- 86,456Ms. Eva Castillo Sanz 240,847 -- -- 240,847Mr. Alfonso Ferrari Herrero 297,275 -- -- 297,275Mr. Luiz Fernando Furlán 299,406 -- -- 299,406Mr. Javier de Paz Mancho 840,667 -- -- 840,667Other external Fernando de Almansa Moreno-Barreda 436,214 -- -- 436,214Mr. Peter Erskine 86,456 -- -- 86,456
1 Wage/Compensation: Cash compensation with a predefined payment frequency, accruable or not over time and payable contractually, irrespective of effective attendance by the Director to Board Meetings or similar of the Telefónica Group company in question. Includes non-variable remuneration accrued, as appropriate, by the Director for discharging executive duties.
2 Attendance fees: Amounts payable for attendance to meetings of the Board of Directors or similar bodies of any Telefónica Group company.
3 Short-term variable compensation: Variable amount linked to the performance or achievement of individual or group objectives (quantitative or qualitative) and commensurate with other compensation or any other reference in euros for a period of up to a year.
4 Other items: Other amounts related to pension schemes.
Director (Executive) Contributions to pension plans Contribution to the Pension Plan for Senior Executives1 Compensation in kind2
Mr. César Alierta Izuel 8,402 1,014,791 57,955Mr. Julio Linares López 9,468 555,033 83,923Mr. José María Álvarez-Pallete López 7,574 355,563 17,346
1 Contributions to the Pension Plan for Executives set up in 2006, funded exclusively by the Company to complement the existing Pension Plan. It entails defined contributions equivalent to a certain percentage of the Director’s fixed remuneration in accordance with their professional category within the Telefónica Group’s organization.
2 “Compensation in kind” includes life and other insurance premiums (e.g. general medical and dental insurance).
(i) The “Performance Share Plan” (“PSP”) approved at the General Shareholders’ Meeting of June 21, 2006, whose fifth and final phase began in 2010. Under this plant, shares corresponding to thethird phase were delivered in July 2011. In accordance with the general terms and conditions, a rate of 97.8% was applied to the theoretical number of shares assigned to each participant todetermine the number of shares to deliver.
F-105

Accordingly, the shares delivered in the third phase of the PSP to the three Executive Directors were as follows: 145,544 shares to Mr. César Alierta Izuel, 99,233 shares to Mr. Julio Linares López, and 66,155 shares to Mr. José María Álvarez-Pallete López. Likewise, the maximum number of shares corresponding to the fourth and fifth cycle of the PSP that will be delivered (fromJuly 1, 2012 and July 1, 2013, respectively) to each of the Executive Directors of Telefónica, upon completion of conditions for delivery, is as follows: D. César Alierta Izuel (173,716 shares and170,897 shares for the fourth and fifth cycles, respectively), D. Julio Linares López (130,287 and 128,173 shares for the fourth and fifth cycles, respectively), D. José María Álvarez-Pallete López (78,962 and 77,680 for the fourth and fifth cycles, respectively); and
Furthermore, at the General Shareholders’ Meeting of Telefónica, S.A. on June 23, 2009, its shareholders approved the introduction of a Telefónica, S.A. share incentive plan for all employees, includingexecutives and board members, of the Telefónica Group worldwide. Under this plan, employees that meet the qualifying requirements are offered the possibility of acquiring Telefónica, S.A. shares,with this company assuming the obligation of giving participants a certain number of shares free of charge. The maximum sum each employee can assign to this plan is 1,200 euros, while the minimumis 300 euros. The three board members decided to participate in this plan, contributing the maximum, i.e. 100 euros a month, over 12 months. Therefore, at the date of preparing these financial statements, the threeexecutive Directors had acquired a total of 212 shares through this plan, whereby they are entitled to receive, free of charge, an equivalent number of shares providing that, among other conditions, theyretain the acquired shares during the consolidation period (12 months from the end of the acquisition period). It should be noted that the external Directors do not receive and did not receive in 2011 any compensation in the form of pensions or life insurance, nor do they participate in the share-based payment plans linked to Telefónica’s share price. In addition, the Company does not grant and did not grant in 2011 any advances, loans or credits to the Directors, or to its top executives, thus complying with the requirements of the U.S.A. Sarbanes-Oxley Act, which is applicable to Telefónica, S.A. as a listed company in that market.
(ii) The “Performance & Investment Plan“ (“PIP”) approved at the General Shareholders’ Meeting of May 18, 2011. Under this plan, participants who meet qualifying requirements receive a numberof Telefónica shares as variable remuneration. The first phase of this plan began in 2011, once the PSP has finished. The theoretical number of shares assigned and the maximum possible numberof shares to be received by the Executive Directors in the first phase of the PIP if the co-investment requirement established in the Plan and the maximum target TSR established for each phase aremet are as follows: (i) to Mr. César Alierta Izuel: 249,917 theoretical shares and a maximum of 390,496 shares; to Mr. Julio Linares López: 149,950 theoretical shares and a maximum of 234,298;and Mr. José María Álvarez-Pallete López: 79,519 theoretical shares and a maximum of 124,249 shares.
F-106

Senior executives’ compensation Meanwhile, the seven senior executives1 of the Company in 2011, excluding those that are also members of the Board of Directors, received since their appointment a total for all items in 2011 of12,122,954 euros. In addition, the contributions by the Telefónica Group in 2011 with respect to the Pension Plan described in Note 20 for these Directors amounted to 2,709,866 euros. Contribution tothe pension plan amounted to 50,208 euros and compensation in kind including life and other insurance premiums (e.g. general medical and dental insurance) to 154,955 euros. Meanwhile, a total of 299,377 shares corresponding to the third phase of the PSP were delivered to senior executives of the Company, who had that consideration at the time of the delivery. Themaximum number of shares corresponding to the fourth and fifth cycle of the PSP assigned to senior executives of the Company are 394,779 shares in the fourth cycle and 350,485 shares in the fifthcycle. Regarding the “Performance and Investment Plan” approved at the General Shareholders’ Meeting of May 18, 2011, a total of 457,949 shares were assigned to all executive directors of the Company.
Pursuant to Section 229 of the consolidated Corporate Enterprises Act, introduced by Royal Legislative Decree 1/2010 of July 2, details are given below of (i) the direct and indirect interests held bymembers of the Board of Directors of Telefónica, S.A., and by persons related thereto as set out in Section 231 of the consolidated Corporate Enterprises Act and (ii) the positions or duties carried out bythose individuals, both of the foregoing in respect to companies with the same, analogous, or similar corporate purpose as that of Telefónica, S.A.
g) Equity interests and positions held or duties performed in companies engaging in an activity that is identical, similar or complementary to that of the Company
Name Activity performed Company Position or functions Stake %2
Mr. Isidro Fainé Casas Telecommunications Abertis Infraestructuras, S.A. Vice Chairman < 0.01%
Mr. David Arculus Telecommunications British Sky Broadcasting Group, Plc. -- < 0.01%
Telecommunications BT Group, Plc. -- < 0.01%
Mr. Ignacio Moreno Martínez Telecommunications Conitas Comunicaciones, S.A. Director 4.89%
1 In this context, senior executive are taken as being those individuals who, in fact or in law, perform senior management duties, reporting directly to the Board of Directors or executive Committees or the CEOs thereof, including in all cases the Manager of Internal Audit.
2 In cases where the shareholding is less than 0.01% of share capital, “<0.01%” is noted.
F-107

Information on Board member Chang Xiaobing, Executive Chairman of China Unicom (Hong Kong) Limited, is not included in this section given that:
In addition, for information purposes, details are provided below on the positions or duties performed by members of the Board of Directors of Telefónica, S.A. in those companies whose activity isidentical, similar or complementary to the corporate purpose of the Company, of any Telefónica Group company, or of any company in which Telefónica, S.A. or any of its Group companies holds asignificant interest whereby it is entitled to board representation in those companies or in Telefónica, S.A.
• in accordance with Article 26 bis of the Company's Bylaws, whereby "(...) the following shall not be deemed to be in a situation of effective competition with the Company, even if they havethe same or a similar or complementary corporate purpose: (...) companies with which Telefónica, S.A. maintains a strategic alliance", Mr. Xiaobing's interests are not in conflict with those ofTelefónica, S.A.
• Mr. Xiaobing holds no stakes in the capital of the companies in which he is a Board member (Section 229 of the Corporate Enterprises Act).
Name Company Position or functions
Mr. César Alierta Izuel Telecom Italia, S.p.A. Director
China Unicom (Hong Kong) Limited Director
Mr. Julio Linares López Telecom Italia, S.p.A. Director
Mr. Alfonso Ferrari Herrero Telefónica Chile, S.A. Acting Director
Telefónica del Perú, S.A.A. Director
Mr. Francisco Javier de Paz Mancho
Atento Inversiones y Teleservicios, S.A.U. Non-executive Chairman
Telefónica Brasil, S.A. Director
Telefónica de Argentina, S.A. Director
Mr. José Fernando de Almansa Moreno-Barreda
Telefónica Brasil, S.A. Director
Telefónica de Argentina, S.A. Director
Telefónica del Perú, S.A.A. Director
Telefónica Móviles México, S.A. de C.V. Director
F-108

(*) On February 3, 2012, Mr. José María Álvarez-Pallete López tendered his resignation as Director of Telefónica DataCorp, S.A.U.
Mr. José María Álvarez- Pallete López
Telefónica Europe, Plc. Chairman of the Board of Directors
Telefónica Czech Republic, a.s. Chairman of Supervisory Board
Telefónica de Argentina, S.A. Acting Director
Telefónica del Perú, S.A.A. Director
Telefónica Móviles Colombia, S.A. Acting Director
Telefónica Datacorp, S.A.U. Director (*)
Mr. Luiz Fernando Furlán Telefónica Brasil, S.A. Director
Ms. María Eva Castillo Sanz Telefónica Czech Republic, a.s. First Vice Chairman of Supervisory Board
Mr. Chang Xiaobing
China United Network Communications Group Company Limited Chairman
China United Network Communications Corporation Limited Chairman
China Unicom (Hong Kong) Limited Executive Chairman
China United Network Communication Limited Chairman
F-109

The principal finance leases at the Telefónica Group are as follows:
These commitments arise from plant and equipment lease agreements. Between March 30, 1991 and April 9, 2001, finance lease agreements were signed between Telefónica UK and a number of USleasing trusts. A part of the radio and switch equipment of its GSM network is subject to the terms of said agreements. The agreements have a term of 16 years and an early purchase option after the first12 years. At December 31, 2011 and 2010, net assets under this lease amounting to 197 and 201 million euros, respectively, were recognized under property, plant and equipment.
Similarly, via its subsidiary Colombia Telecomunicaciones, S.A., ESP, the Group has a finance lease agreement with PARAPAT, the consortium which owns the telecommunications assets and managesthe pension funds for the entities which were predecessors to Colombia Telecomunicaciones, S.A., E.S.P., and which regulate the operation of assets, goods and rights relating with the provision oftelecommunications services by the company, in exchange for financial consideration. This agreement includes the transfer of these assets and rights to Colombia Telecomunicaciones, S.A., ESP once the last installment of the consideration has been paid in line with the payment scheduleover a period of 17 years from 2006:
The net amount of property, plant and equipment recorded under the terms of this lease was 421 million euros at December 31, 2010 (470 million euros at December 31, 2010).
(22) FINANCE LEASES
a) Future minimum lease payment commitments in relation to finance leases at Telefónica Europe companies.
Millions of euros Present value Revaluation Pending payment Within one year 40 - 40 From one to five years 175 19 194 Total 215 19 234
b) Finance lease agreement at Colombia Telecomunicaciones, S.A., ESP.
Million euros Present value Revaluation Future payments 2012 284 16 300
2013-2016 1,053 426 1,479 Subsequent years 1,360 2,023 3,383
Total 2,698 2,464 5,162
F-110

Net cash from operating activities Net cash from operating activities increased 4.86% to 17,483 million euros in 2011 from 16,672 million euros in 2010, which in turn represented an increase of 3.24% from 16,148 million euros in2009. In 2011, the Telefónica Group obtained operating cash flow (operating revenue less payments to suppliers for expenses and employee benefits expenses) totaling 21,453 million euros, 0.69% more thanthe 21,306 million euros generated in 2010. Cash received from customers increased by 5.98% to 77,222 million euros in 2011 from 72,867 million euros in 2010. This increase, which helped improve operating cash flow from the prior year, wasdriven by the larger contribution from Vivo to consolidated customer collections following the acquisition of an additional 50% of the company in 2010, efforts to manage current assets in the variousregions and the positive results of by Telefónica’s global efficiency projects. Cash payments to suppliers and employees in 2011 amounted to 55,769 million euros, up 8.16% from the 51,561 million euros recorded in 2010. This increase was due to Vivo’s larger share of consolidated payments to suppliers compared to 2010, commercial efforts undertaken in the various regions and payments of certain restructuring expenses, which were offset by containment andmanagement of current liabilities, which contributed positively to the generation of operating cash flow. Meanwhile, as compared to 2010, cash payments to employees in 2011 followed the trend resulting from costs associated with the change in average headcount, in line with 2009. In 2010, operating cash flow was 0.69% more than the 21,160 million euros generated in 2009. This improvement was due to the robust growth of consolidated income, which continued to accelerate in all regions, underpinned by significant business diversification and the high level of commercialactivity, above all in wireline and wireless broadband. This growth was driven simultaneously by policies to strengthen customer loyalty and bundling voice, broadband and television services. Cash received from customers increased by 8.18% to 72,867 million euros in 2010 from 67,358 million euros in 2009. Telefónica Latin America continued to enjoy accelerating growth due todiversification and enhanced commercial effort. Telefónica Europe saw a sharp rise in income, while the businesses in Spain generated operating cash flow thanks to a considerable and effectivecommercial efforts and cost controls. In 2010, cash paid to suppliers and employees increased 11.61% to 51,561 million euros from 46,198 million euros in 2009. This increase was attributable to a higher supply of handsetss in TelefónicaLatin America, partially offset by lower mobile termination expenses in Telefónica Spain and Telefónica Europe, and increased commercial effort in the three regions. Attempts to increase the efficiencyof the cost structure contributed positively to the generation of operating cash flow. Cash flows arising from payments of interest and other finance costs were relatively steady in 2011 despite the increase in interest rates during the year and the rise in financial debt, mostly due topayments of deferred interest, decreasing by 0.4% to 2,011 million euros. In 2010, payments of interest and other finance expenses decrease 0.74% to 2,154 million euros from 2,170 million euros in2009, in line with the decline in interest rates during the year and despite the increase in financial debt during the year.
(23) CASH FLOW ANALYSIS
F-111

Tax payments amounted to 1,959 million euros in 2011, down 25.1% compared with 2010 (2,616 million euros), primarily because no tax payments on account for the tax group were made in 2011. In2010, payments on account amounted to 729 million euros, compared to 1,297 million euros in 2009. Tax paid in 2010 decreased by 326 million euros, a 11.1% decrease from 2,942 million euros in2009, primarily attributable to lower tax payments on accounts in 2010. Net cash used in investing activities Net cash used in investing activities decreased by 21.21% in 2011 to 12,497 million euros from 15,861 million euros in 2010, primarily due to the decrease in payments for investments in companies netof cash and cash equivalents. During the year, payments for investments in companies amounted to 2,948 million euros, with the principal investments being: the third payment for the acquisition in 2010 of 50% of Brasilcel, N.V.,for which a total of 1,970 million euros was paid in the year; the payment to non-controlling interests of Vivo of 539 million euros; the acquisition of an additional 1.2% of the share capital of ChinaUnicom for 358 million euros; and the acquisition of Acens for 52 million euros, net of cash and cash equivalents. Payments on financial investments not included in cash equivalents amounted to 669 million euros in 2011 and mainly include legal deposits, financial investments by Telefónica insurance companies,the repurchase of Telefónica S.A. bonds in secondary markets and options on equity instruments. In 2010, payments for investments in companies which amounted to 5,744 million euros, with the main investments being the acquisition of 50% of Brasilcel, for a total of 5,047 million (net of cash andcash equivalents), the acquisition of 22% of the share capital of DTS, Distribuidora de Televisión Digital S.A. (230 million euros) and the acquisitions in Europe of JaJah Inc. and the German companyHanseNet Telekommunikation GmbH (“HanseNet”) for 150 million euros and 207 million euros, respectively, net of cash and cash equivalents. Payments on financial investments not included in cash equivalents amounted to 1,599 million euros in 2010. This includes payments of 638 million euros for the refinancing in connection with theacquisition of 100% of shares of HanseNet and the financing provided to Telco, SpA, for 600 million euros at December 31, 2010. Proceeds on disposals of companies in 2010 (552 million euros) primarily related to divestments in Meditelcom for 380 million euros and in Manx Telecom Limited for 157 million euros (in the lattercase, net of cash and cash equivalents). Payments on investments in companies (net of cash and cash equivalents acquired) in 2009 amounted to 48 million euros. The principal investments were the acquisition of shares of non-controlling shareholders of the Telefónica Argentina Group for 22 million euros, which represented the acquisition of an additional 1.8% stake, and the payment of Telefónica Chile, S.A.’s second takeover for 18 million euros. In 2009, proceeds on disposals of companies amounted to 34 million euros. The main transaction in this respect was the sale of Meditelcom for 20 million euros. Payments on investments in property, plant and equipment and intangible assets totalled 9,085 million euros in 2011, 1.57% higher than the prior year (8,944 million euros). This increase was due to therise in acquisitions of property, plant and equipment and intangible assets during the period, particularly the purchases of spectrum licenses in Brazil and Spain (349 million euros and 441 million euros,respectively). Payments on investments in property, plant and equipment and intangible assets increased 17.8% to 8,944 million euros in 2010 from 7,593 million euros in
F-112

2009. This increase was due to the rise in acquisitions of property, plant and equipment and intangible assets during the period, particularly the purchases of spectrum licenses in Mexico and Germany (276 million euros and 1,379 million euros, respectively). Proceeds on disposals of property, plant and equipment and intangible assets amounted to 811 million euros in 2011, an increase of 157% from 315 million euros 2010, primarily due to receipts from thedisposal of non-strategic assets (693 million euros). In 2009, this item amounted to 242 million euros. In 2011, net cash flows from cash surpluses not included under cash equivalents amounted to 646 million euros, 3.97% higher than the 621 million euros recorded in 2010. Net investments in 2009amounted to 548 million euros. Net cash used in financing activities In 2011, net cash used in financing activities amounted to 4,912 million euros, 6.41% lower than in 2010 (5,248 million euros). The decrease was primarily due to lower cash outflow from theredemption of bonds and debentures (3,235 million euros compared to 5,482 million euros in 2010), which was not offset by proceeds from new issues of bonds and debentures, which declined from6,131 million euros in 2010 to 4,582 million euros in 2011, to higher proceeds from the sale of treasury shares (375 million euros) and declines in both proceeds and payments on loans, credit facilitiesand promissory notes, whichpayments declined from 7,954 million euros in 2010 to 2,680 million euros in 2011. The decrease in proceeds from and payments on loans was primarily due to thedrawdown in 2010 of 6,000 million on the syndicated facility agreement signed on July 28, and to several voluntary repayments amounting to 5,700 million euros under its 6,000 million euros creditfacility of June 2005 (see Note 13). These decreases were partly offset by an increase in the dividend paid by Telefónica, S.A., which amounted to 6,852 million euros compared with 5,872 millioneuros in 2010. Net cash used in financing activities in 2010 increased by 130% to 5,248 million in 2010 euros from 2,281 million euros in 2009, mainly due to the higher dividend distributed by Telefónica, S.A. of5,872 million euros (4,557 million euros in 2009), the higher cash outflow due to redemption of bonds and debentures upon maturity, totaling 5,482 million euros (1,949 million euros in 2009) andrepayments of loans, credit facilities and promissory notes for 7,954 million euros (5,494 million euros in 2009).
The following events regarding the Telefónica Group took place between December 31, 2011 and the date of authorization for issue of the accompanying consolidated financial statements:
Financing
(24) EVENTS AFTER THE REPORTING PERIOD
• On January 5, 2012, Telefónica Europe, B.V. arranged financing guaranteed by Telefónica, S.A. with China Development Bank (CDB) for an aggregate amount of 375 million US dollars(equivalent to approximately 290 million euros) at a floating rate and maturing in 2022. This financing was completed on February 15, 2012.
• On January 21, 2012, MMO2, Plc repaid at maturity the bonds issued on January 25, 2002, for an aggregate amount of 375 pounds sterling (equivalent to approximately 481 million euros).
F-113

Sale of Telefónica’s stake in Hispasat, S.A.
On February 21, 2012, Telefónica de Contenidos, S.A.U., a company wholly owned by Telefónica, S.A., reached an agreement to sell its 13.23% stake in Hispasat, S.A. to Abertis Telecom, S.A. for 124million euros in cash, which it will receive when the transaction is closed. Closing of the transaction is subject, inter alia, to approval by the Spanish Cabinet.
• On February 7, 2012, Telefónica Emisiones, S.A.U., as part of the European medium-term notes program (“EMTN”) registered with the Financial Services Authority (FSA) in London andupdated on June 20, 2011, extended the issue of bonds made on February 7, 2011 for an initial aggregate amount of 1,200 million euros maturing on February 7, 2017, by 120 million euros. Thesebonds are guaranteed by Telefónica, S.A.
• On February 21, 2012, Telefónica Emisiones, S.A.U., as part of the EMTN registered with the Financial Servies Authority (FSA) in London and updated on June 20, 2011, issue bonds for anaggregate amount of 1,500 million euros maturing on February 21, 2018. These bonds are guaranteed by Telefónica, S.A.
F-114

APPENDIX I: CHANGES IN THE CONSOLIDATION SCOPE
The following changes took place in the consolidation scope in 2011: Telefónica Spain On June 7, 2011, the Telefónica Group formalized the acquisition of 100% of Acens Technologies, S.L., a leader in hosting/housing in Spain for small- and medium-sized enterprises. The consideration paid for the purchase was 55 million euros. This company has been included in the Telefónica Group’s consolidation scope using the full consolidation method. In August, Telefónica de España, S.A.U. increased its stake in Iberbanda, S.A. from 51% to 100%. The Telefónica Group still consolidates this company using the full consolidation method. Telefónica Salud, S.A., a 51% subsidiary of the Group, was sold off from the Telefónica Group in the year. This company, which had been fully consolidated in the Telefónica Group, was removed fromthe consolidation scope. Telefónica Latin America In February 2011, the Costa Rican company Telefónica Costa Rica, S.A. was included in the Telefónica Group’s consolidation scope using the full consolidation method following payment by Telefónica, S.A. of 2.2 million US dollars corresponding to 100% of its initial share capital. On March 25, 2011 the Boards of Directors of each of the subsidiaries controlled by Telefónica, Vivo Participações and Telecomunicações de São Paulo S.A. – Telesp approved the terms and conditions of a restructuring process whereby all shares of Vivo Participações that were not owned by Telesp were exchanged for Telesp shares, at a rate of 1.55 new Telesp shares for each Vivo Participações share. These shares then became the property of Telesp, whereby Vivo Participações then became a wholly owned subsidiary of Telesp. On June 14, 2011, the Boards of Directors of Vivo Participações and Telesp approved a restructuring plan whose objective is to simplify the corporate structure of both companies and foster theirintegration, eliminating Vivo Participações from the corporate chain through the incorporation of its total equity into Telesp, and concentrating all mobile telephony activities in Vivo, S.A. (now a directsubsidiary of Telesp). In October, the company arising from the merger changed its name to Telefónica Brasil, S.A. At the end of 2011, the Telefónica Group owned of 73.9% of Telefónica Brasil which, in turn, has 100% ownership of the shares of Vivo, S.A. Both companies are still fully consolidated in theTelefónica Group’s consolidation scope. In April, the Spanish company Wayra Investigación y Desarrollo, S.L. was incorporated. Its corporate purpose is to identify talent in Spain and Latin America in the field of new Information andCommunication Technologies (ICT) and promote its development through integral support and provide the entrepreneurs with the necessary tools and financing. This company has been included in theTelefónica Group’s consolidation scope using the full consolidation method. Also in 2011, Wayra incorporated companies in Peru, Venezuela, Mexico, Argentina and Colombia. All of these companies have been included in the Telefónica Group’s consolidation scope using the full consolidation method. As of January 1, 2011, Telefónica Brasil included GTR Participações e Emprendimentos, S.A., TVA Sul Paraná, S.A., Lemontree, S.A. and Comercial Cabo TV São Paulo, S.A. in its consolidatedfinancial statements using the full consolidation method. Up until 2010, these companies had been included in the Telefónica Group’s consolidated financial statements through the equity method of accounting.
F-115

Telefónica Europe German company Telefónica Germany GmbH & Co. OHG, a wholly owned subsidiary of the Telefónica Group, set up a German company, Telefónica Global Online Services, GmbH, with initialcapital of 25 thousand euros. Other companies In accordance with the strategic partnership agreement reached by Telefónica, S.A. and China Unicom on January 23, 2011, Telefónica, S.A. paid 358 million euros to increase its ownership interest inChina Unicom by approximately 1.2% to 9.6%. The Telefónica Group continues to account for this investment using the equity method of accounting. In December, Telefónica, S.A. incorporated Luxembourg company Telefónica Luxembourg Holding, S.à.r.l. with initial share capital of 12,500 euros. It is the company’s sole shareholder. This company has been included in the Telefónica Group’s consolidation scope using the full consolidation method. In December, Telefónica Digital España, S.L., formerly Terra Networks Asociadas, S.L.U., a wholly owned subsidiary of Telefónica, S.A., incorporated Sonora Music Streaming España, S.L.Unipersonal, subscribing and paying out the entire initial share capital of 3 thousand euros. Also in December, Telefónica, S.A. subscribed and paid out the entire share capital of Telefónica Digital Holdings, S.L.U., which amounted to 3 thousand euros. Atento Italia, S.R.L. was wound up and liquidated in 2011. This company, which had been fully consolidated, was removed from the Telefónica Group’s consolidation scope. Solivella Investments, B.V. and 3G Mobile AG, both of which were fully consolidated, were wound up in 2011 and therefore removed from the Telefónica Group’s consolidation scope. Changes to the 2010 consolidation scope are described in the following sections. Telefónica Spain In April 2010, Teleinformática y Comunicaciones, S.A. (Telyco) sold its subsidiary Telyco Marruecos, S.A. This company, which had been fully consolidated in the Telefónica Group, was removedfrom the consolidation scope. In August, Telefónica Móviles España, S.A.U., a wholly owned subsidiary of Telefónica, S.A., acquired approximately 91.2% of the Spanish company Tuenti Technologies, S.L. Following a subsequentrights offering, the Telefónica Group increased its stake in the company’s share capital to 91.38%. This company is included in the consolidated financial statements of the Telefónica Group using thefull consolidation method. Telefónica Latin America On June 30, the Telefónica Chile group embarked on a corporate restructuring. The restructuring was executed through the acquisition by Inversiones Telefónica Móviles Holding Limitada of all assetsof fixed line telephony in Chile through its acquisition of Telefónica Internacional Chile, Ltda. On September 27, 2010, Telefónica acquired 50% of the shares of Brasilcel (a Dutch company that owns shares representing, approximately, 60% of the share capital stock of Brazilian company VivoParticipações, S.A.) owned by Portugal Telecom, having made a first payment, as agreed, of 4,500 million euros. The Brasilcel Group, which was previously proportionately
F-116

consolidated in the Telefónica Group, has been fully consolidated since September 2010 (100% of all assets and liabilities of the Brazilian group are consolidated. Subsequently, in December 2010, across-border merger was completed whereby the Dutch company was taken over by Telefónica, S.A. Telefónica Europe In January 2010, the Telefónica Group, through its wholly owned subsidiary Telefónica Europe Plc, acquired 100% of the shares of Jajah Inc. for 145 million euros. This company has been included inthe Telefónica Group’s consolidation scope using the full consolidation method. On December 3, 2009, the Telefónica Group’s subsidiary in Germany, Telefónica Deutschland GmbH (“Telefónica Deutschland”), signed an agreement to acquire all of the shares of German company HanseNet Telekommunikation GmbH (“HanseNet”). The transaction was completed on February 16, 2010, the date on which the Telefónica Group completed the acquisition of 100% of the shares ofHanseNet. The amount initially paid out was approximately 913 million euros, which included 638 million euros of refinanced debt, leaving an acquisition cost of 275 million euros, which was finallyreduced by 40 million euros on completion of the transaction. This company has been included in the Telefónica Group’s consolidation scope using the full consolidation method. In June 2010, British company Manx Telecom Limited was sold for approximately 164 million euros. The sale generated a gain of 61 million euros. This company, which had been fully consolidated inthe Telefónica Group, was removed from the consolidation scope. Other companies In April 2010, Chilean company Telefónica Factoring Chile, S.A., which is 50% owned by the Telefónica Group, was incorporated. This company is included in the consolidation scope using the equitymethod. In February 2010, Irish company Telfin Ireland Limited was incorporated, with an initial share capital of approximately 919 million euros, fully subscribed by its sole shareholder Telefónica, S.A. Thiscompany has been included in the Telefónica Group’s consolidation scope using the full consolidation method. In June 2010, the Telefónica Group reduced its ownership interest in Portugal Telecom by 7.98%. In addition, Telefónica entered into three equity swap contracts for Portugal Telecom shares with anumber of financial institutions, all subject to net settlement, which grant Telefónica the equivalent total return of the investment. The company, included in the consolidation scope using the equitymethod of accounting, was removed from the consolidation scope on June 30, 2010. In December 2010, Telefónica, S.A., through subsidiary Telefónica de Contenidos, S.A.U., completed the acquisition of 22% of the capital stock of D.T.S., Distribuidora de Televisión Digital S.A. forapproximately 488 million euros, 228 million euros of which was settled by cancelling the subordinated loan between Telefónica de Contenidos, S.A.U. (as creditor) and Sogecable, S.A. (currently PrisaTelevisión, S.A.U., as debtor). This company was included in the consolidation scope using the equity method of accounting. Changes to the 2009 consolidation scope are described in the following sections.
F-117

Telefónica Europe BT Cellnet Ltd and SPT Telecom Finance, B.V. were liquidated. Both fully consolidated companies were excluded from the scope of consolidation of the Telefónica Group. In December, German company Telefónica Global Services, GmbH, a wholly owned subsidiary of the Telefónica Group, established German company Telefónica Global Roaming, GmbH, with initialcapital of 25 thousand euros. The company was fully consolidated in the Telefónica Group. Telefónica Latin America Pursuant to Chilean law, on December 1, 2008, Telefónica, S.A., through subsidiary Inversiones Telefónica Internacional Holding, Ltda., launched a second tender offer (“second offer”) for all the shares of Compañía de Telecomunicaciones de Chile, S.A. (CTC) Telefónica did not already hold (representing 3.25% of CTC’s capital). Upon completion of the second offer, Telefónica’s indirect stake in CTC’s share capital increased from 97.89% to 96.75% at the date the CNMV was notified on January 9, 2009. This Chilean companyis still fully consolidated in the Telefónica Group. In order to restructure the Brazilian Vivo Group, Telemig Celular, S.A. was taken over by Telemig Celular Participaçoes, S.A., which in turn was taken over by Vivo Participaçoes, S.A. Subsequent tothis operation, the first two companies, which had been consolidated using proportionate consolidation, were excluded from the Telefónica Group. The Telefónica Group consolidated Vivo Participaçoes, S.A. using proportionate consolidation. As part of the aforementioned restructuring, on November 19 Tagilo Participaçoes, Ltda., Sudestecel Participaçoes, Ltda., Avista Participaçoes, Ltda. and Vivo Brasil Comunicações Ltda. were takenover by Portelcom Participaçoes, S.A. All these companies were excluded from the scope of consolidation of the Telefónica Group in which they had been previously proportionately consolidated. On December 3, 2009, following approval by the Comisión Nacional de Valores de la República Argentina, the Argentine securities regulatory, Telefónica, S.A. acquired shares representing 1.8% of theshare capital of Telefónica de Argentina, S.A. held by minority shareholders for a price of approximately 23 million euros. This acquisition gave the Telefónica Group a 100% stake in this Argentineancompany. This company is still fully consolidated in the consolidated financial statements of the Telefónica Group. On October 21, 2009, Telefónica, S.A. and China Unicom (Hong Kong) Limited (“China Unicom”) completed the mutual share exchange agreement through which Telefónica, through TelefónicaInternacional, S.A.U., subscribed for 693,912,264 newly issued shares of China Unicom, satisfied by the contribution in kind to China Unicom of 40,730,735 Telefónica shares. This involved aninvestment of approximately 1,000 million US dollars in ordinary shares in the other party. Subsequent to this acquisition, the Telefónica Group increased its stake in voting capital from 5.38% to8.06%. On November 5, 2009, an agreement was reached to repurchase shares from one of the major shareholders of China Unicom, SK Telecom Co., Ltd. ("SKT”). Subsequent to this acquisition and the redemption of these shares, considering the share capital of China Unicom, Telefónica held 8.37% of China Unicom's share capital. The Telefónica Group accounts for this investment using the equitymethod.
F-118

Other companies In February 2009, Telefónica International Wholesale Services II, S.L. was incorporated with an initial capital of 3,006 euros, fully subscribed and paid up by Telefónica, S.A. The company has beenincorporated into the Telefónica Group's financial statements. In 2009, Telefónica International Wholesale Services II, S.L. incorporated the European companies TIWS Hungary, TIWS Sweden and TIWS Latvia, subscribing and paying up 100% of their respectiveshare capital. All of these companies were included in the Telefónica Group’s consolidation scope using the full consolidation method. Spanish company Telefónica Remesas, S.A. was incorporated by Telefónica Telecomunicaciones Públicas, S.A., a wholly owned Telefónica Group subsidiary, with initial capital of 0.3 million euros,fully subscribed and paid. The company was included in the Telefónica Group’s consolidation scope using the full consolidation method. Telefónica Móviles España, S.A., a 100% owned subsidiary of Telefónica, S.A., sold its 32.18% stake in Moroccan company Medi Telecom, S.A. (Méditel) and the company’s outstanding loans, for 400 million euros to the rest of Méditel’s local partners. This company, which in the prior year was accounted for by the Telefónica Group using the equity method, was removed from the consolidationscope. The Spanish company Atento Teleservicios España, S.A.U., a solely owned subsidiary of the Telefónica Group, was taken over in 2009 by the Dutch company Atento EMEA, B.V. This fullyconsolidated company was excluded from the scope of consolidation. Subsequent to Sintonia, S.A. selling its stake in Telco, S.p.A. (Telco), an Italian company that held a 22.45% stake in the telecommunications operator Telecom Italia, S.p.A., Telefónica, S.A. increasedits stake in Telco from 42.3% to 46.18%, retaining the effective stake in Telecom Italia, S.p.A. through this company of 10.36% of its voting share capital. This company is still included in theconsolidated financial statements of the Telefónica Group under the equity method. In November, Telefónica Servicios Audiovisuales, S.A., a wholly owned subsidiary of the Telefónica Group, acquired 100% of Spanish company Gloway Broadcast Services, S.L. (“Gloway”) for approximately 6 million euros. The company was fully consolidated in the financial statements of the Telefónica Group.
F-119

APPENDIX II: DEBENTURES AND BONDS
The list and main features of outstanding debentures and bonds at December 31, 2011 are as follows (in millions of euros):
Telefónica and its instrumental companies Maturity (nominal)
Debentures and bonds Currency % Interest rate 2012 2013 2014 2015 2016Subsequent
years Total
CAIXA 07/21/29 ZERO COUPON EUR 6.386% - - - - - 64 64
ABN 15Y BOND EUR 1.0225 x GBSW10Y - - - 50 - - 50
Telefónica, S.A. - - - 50 - 64 114
T. EUROPE BV SEP_00 GLOBAL D USD 8.250% - - - - - 966 966
TEBV FEB_03 EMTN FIXED TRANCHE A EUR 5.125% - 1,500 - - - - 1,500
TEBV FEB_03 EMTN FIXED TRANCHE B EUR 5.875% - - - - - 500 500
T.EUROPE BV JULY A 2007 JPY 2.110% 150 - - - - - 150
T.EUROPE BV JULY B 2007 JPY 1 x JPYL6M + 0.425000% 150 - - - - - 150
Telefónica Europe, B.V. 300 1,500 - - - 1,466 3,266
EMTN O2 EUR (I) EUR 4.375% - - - - 1,750 - 1,750
EMTN O2 GBP (I) GBP 5.375% - - - - 898 898
EMTN O2 GBP (II) GBP 5.375% - - - - - 599 599
TELEF EMISIONES JUN 06 TRANCHE C USD 6.421% - - - - 966 - 966
TELEF EMISIONES JUN 06 TRANCHE D USD 7.045% - - - - - 1,546 1,546
TELEF EMISIONES SEPTEMBER 06 EUR 4.393% 500 - - - - - 500
TELEF EMISIONES DECEMBER 06 GBP 5.888% - - 598 - - - 598
TELEF EMISIONES FEBRUARY 07 EUR 4.674% - - 1,500 - - - 1,500
TELEF EMISIONES JUNE B 07 CZK 4.351% 116 - - - - - 116
TELEF EMISIONES JUNE C 07 CZK 4.623% - - 101 - - - 101
TELEF EMISIONES JULY A 07 USD 5.855% - 580 - - - - 580
TELEF EMISIONES JULY C 07 USD 6.221% - - - - - 541 541
TELEF EMISIONES JUNE 08 EUR 5.580% - 1,250 - - - - 1,250
TELEF EMISIONES FEBRUARY 09 EUR 5.431% - - 2,000 - - - 2,000
TELEF EMISIONES APRIL 2016 EUR 5.496% - - - - 1,000 - 1,000
TELEF EMISIONES APRIL 3, 2016 EUR 5.496% - - - - 500 - 500
TELEF EMISIONES JULY 6, 2015 USD 4.949% - - - 966 - - 966
TELEF EMISIONES JULY 15, 2019 USD 5.877% - - - - - 773 773
TELEF EMISIONES JUNE 2015 EUR 1 x EURIBOR3M + 1.825% - - - 400 - - 400
TELEF EMISIONES JULY B 07 USD 1 x USDL3M + 0.33000% - 657 - - - - 657
TELEF EMISIONES JANUARY 07 A EUR 1 x EURIBOR6M + 0.83000% - - - - - 55 55
TELEF EMISIONES JANUARY 07 B EUR 1 x EURIBOR3M + 0.70% - - - - - 24 24
TELEF EMISIONES NOVEMBER 11, 2019 EUR 4.693% - - - - - 1,750 1,750
EMTN GBP 12/09/2022 650 GBP GBP 5.289% - - - - - 778 778
TELEF EMISIONES DECEMBER 09 EUR 1 x EURIBOR3M + 0.70% - - 100 - - - 100
TELEF EMISIONES MARCH 10 EUR 3.406% - - - 1,400 - - 1,400
TELEF EMISIONES APRIL 1, 2010 USD 2.582% - 927 - - - - 927
TELEF EMISIONES APRIL 2, 2010 USD 3.729% - - - 696 - - 696
TELEF EMISIONES APRIL 3, 2010 USD 5.134% - - - - - 1,082 1,082
TELEF EMISIONES SEPTEMBER 10 EUR 3.661% - - - - - 1,000 1,000
EMTN GBP 10/08/2029 400 GBP GBP 5.445% - - - - - 479 479
TELEF EMISIONES FEBRUARY 2011 EUR 4.750% - - - - - 1,200 1,200
TELEF EMISIONES FEBRUARY 2011 USD 3.992% - - - - 966 - 966
TELEF EMISIONES FEBRUARY 2011 USD 5.462% - - - - - 1,159 1,159
TELEF EMISIONES MARCH 2011 EUR 4.750% - - - - - 100 100
TELEF EMISIONES NOVEMBER 2011 EUR 4.967% - - - - 1,000 - 1,000
TELEF EMISIONES NOVEMBER 2011 JPY 2.8247% - - - - 70 - 70
Telefónica Emisiones, S.A.U 616 3,414 4,299 3,462 6,252 11,984 30,027
Total Telefónica, S.A. and its instrumental companies 916 4,914 4,299 3,512 6,252 13,514 33,407
F-120

Foreign operators % Interest Maturity
Debentures and bonds Currency rate 2012 2013 2014 2015 2016 Subsequent years Total
Series F UF 6.000% 2 2 2 2 1 - 9
Series L UF 3.750% 100 - - - - - 100
Series N CLP 3.500% - - 166 - - - 166
Series M CLP 6.050% - - 31 - - - 31
Telefónica Chile, S.A. 102 2 199 2 1 - 306
Bond A CLP 5.600% - - 48 - - - 48
Bond C CLP 6.300% - - - - 98 - 98
Bond D UF 3.600% - - - - 66 - 66
USD bond CLP 2.875% - - - 232 - - 232
Telefónica Móviles Chile, S.A. - - 48 232 164 - 444
Series B USD 8.000% 4 2 6
Series C USD 8.500% 1 - - - - - 1
Commercial paper USD 4.000% 4 - - - - - 4
Commercial paper USD 4.000% 12 - - - - - 12
Otecel, S.A. 21 2 - - - - 23
CB TELEFONICA FINANZAS MEXICO B MXN 9.250% 194 - - - - - 194
T FINANZAS MEX EMISIÓN 0710 FIJ MXN 8.070% - - - - - 110 110
T. FINANZAS MEX EMISION 0710 VAR MXN TIIE28 + 55bp - - 222 - - - 222
Telefónica Finanzas México, S.A. 194 - 222 - - 110 526
T. Perú 4th Program (10th Series A) PEN 7.875% 9 - - - - - 9
T. Perú 4th Program (10th Series B) PEN 6.438% 15 - - - - - 15
T. Perú 4th Program (16th Series A) PEN 6.000% 29 - - - - - 29
T. Perú 4th Program (4th Series A) PEN 6.625% 23 - - - - - 23
T. Perú 4th Program (16th Series B) PEN 6.250% - 9 - - - - 9
T. Perú 4th Program (41st Series A) PEN 7.938% 5 - - - - - 5
T. Perú 4th Program (42nd Series A) PEN 7.375% - 7 - - - - 7
T. Perú 4th Program (42nd Series B) PEN 5.313% - 6 - - - - 6
T. Perú 4th Program (42nd Series C) PEN 6.063% - 4 - - - - 4
T. Perú 5th Program (5th Series A) PEN 6.188% - 6 - - - - 6
T. Perú 5th Program (3rd Series A) PEN 4.375% 9 - - - - - 9
T. Perú 5th Program (25th Series A) PEN 4.313% 6 - - - - - 6
T. Perú 5th Program (25th Series B) PEN 4.313% 3 - - - - - 3
T. Perú 5th Program (31st Series A) PEN 7.500% - - - - 7 - 7
T. Perú 4th Program (45th Series A) USD 6.688% - - - - 17 - 17
T. Perú Senior Notes PEN 8.000% - 36 72 72 36 - 216
T. Perú 5th Program (33rd Series A) PEN 6.813% - - - - - 18 18
T. Perú 5th Program (29th Series A) PEN 6.188% - - - - 17 - 17
PROG1EM1B PEN 7.900% 12 - - - - - 12
PROG1EM1D PEN 8.075% - - - - - 35 35
F-121

Foreign operators % Interest Maturity Debentures and bonds Currency rate 2012 2013 2014 2015 2016 Subsequent years Total
T. Perú 4th Program (19th Series A) PEN VAC + 3.6250% - - - - - 20 20
T. Perú 4th Program (36th Series A) PEN VAC + 3.6875% - - - - - 50 50
T. Perú 4th Program (12th Series A) PEN VAC + 3.6875% - - - - - 20 20
T. Perú 4th Program (36th Series B) PEN VAC + 3.3750% - - - - - 16 16
T. Perú 4th Program (19th Series B) PEN VAC + 2.8750% - - - - - 16 16
T. Perú 4th Program (37th Series A) PEN VAC + 3.1250% - - - - - 15 15
T. Perú 4th Program (19th Series C) PEN VAC + 3.1875% - - - - - 6 6
T. Perú 5th Program (22nd Series Aa) PEN VAC + 3.5000% - - - - - 7 7
T. Perú 5th Program (22nd Series Ab) PEN VAC + 3.5000% - - - - - 4 4
T. Perú 5th Program (22nd Series Ac) PEN VAC + 3.5000% - - - - - 8 8
Telefónica del Perú, S.A.A. 111 68 72 72 77 215 615
T.M. Perú 1st Program (3rd Series A) PEN 7.438% - 10 - - - - 10
T.M. Perú 1st Program (3rd Series B) PEN 7.688% - 6 - - - - 6
T.M. Perú 1st Program (16th Series A) PEN 8.188% - 7 - - - - 7
T.M. Perú 1st Program (18th Series A) PEN 6.313% - - 11 - - - 11
T.M. Perú 1st Program (18th Series B) PEN 6.375% - - 18 - - - 18
T.M. Perú 2nd Program (3rd Series A) PEN 5.750% - 7 - - - - 7
T.M. Perú 2nd Program (11th Series A) PEN 7.750% - - - - - 20 20
T.M. Perú 2nd Program (9th Series A) PEN 6.813% - - - - 18 - 18
T.M. Perú 2nd Program (9th Series B) PEN 6.375% - - - - 15 - 15
T.M. Perú 2nd Program (11th Series B) PEN 7.375% - - - - - 18 18
T.M. Perú 2nd Program (1st Series C) PEN 4.75% 10 - - - - - 10
Telefónica Móviles Perú, S.A. 10 30 29 - 33 38 140
Nonconvertible bonds BRL 1.06 x CDI 140 - - - - - 140
Nonconvertible bonds BRL 1.08 x CDI 40 - - - - - 40
Nonconvertible bonds BRL 1.12 x CDI - 264 - - - - 264
Nonconvertible bonds BRL IPCA + 7% - - 30 - - - 30
Convertible bonds (Telemig) I BRL IPCA + 0.5% - - - - - 3 3
Convertible bonds (Telemig) II BRL IPCA + 0.5% - - - - - 7 7
Convertible bonds (Telemig) III BRL IPCA + 0.5% - - - - - 13 13
Brasilcel Group 180 264 30 - - 23 497
Total issues other operators 618 366 600 306 275 386 2,551
TOTAL OUTSTANDING DEBENTURES AND BONDS 1.534 5,280 4,899 3,818 6,527 13,900 35,958
F-122

The list and main features of outstanding debentures and bonds at December 31, 2010 are as follows (in millions of euros):
Telefónica and its instrumental companies Maturity (nominal)
Debentures and bonds Currency % Interest rate 2011 2012 2013 2014 2015Subsequent
years Total
CAIXA 07/21/29 ZERO COUPON EUR 6.39% - - - - - 61 61
ABN 15Y BOND EUR 1.0225xGBSW10Y - - - - 50 - 50
Telefónica, S.A. - - - - 50 61 111
T. EUROPE BV SEP_00 GLOBAL D USD 8.250% - - - - - 935 935
TEBV FEB_03 EMTN FIXED TRANCHE A EUR 5.125% - - 1,500 - - - 1,500
TEBV FEB_03 EMTN FIXED TRANCHE B EUR 5.875% - - - - - 500 500
T.EUROPE BV JULY A 2007 JPY 2.110% - 138 - - - 138
T.EUROPE BV JULY B 2007 JPY 1 x JPYL6M + 0.40000% - 138 - - - 138
Telefónica Europe, B.V. - 276 1,500 - - 1,435 3,211
EMTN O2 EUR (I) EUR 4.375% - - - - - 1,750 1,750
EMTN O2 EURO (II) EUR 3.750% 2,250 - - - - - 2,250
EMTN O2 GBP (I) GBP 5.375% - - - - - 871 871
EMTN O2 GBP (II) GBP 5.375% - - - - - 581 581
TELEF EMISIONES JUN 06 TRANCHE B USD 5.984% 748 - - - - - 748
TELEF EMISIONES JUN 06 TRANCHE C USD 6.421% - - - - - 935 935
TELEF EMISIONES JUN 06 TRANCHE D USD 7.045% - - - - - 1,497 1,497
TELEF EMISIONES SEPTEMBER 06 EUR 4.393% - 500 - - - - 500
TELEF EMISIONES DECEMBER 06 GBP 5.888% - - - 581 - - 581
TELEF EMISIONES FEBRUARY 07 EUR 4.674% - - - 1,500 - - 1,500
TELEF EMISIONES JUNE B 07 CZK 4.351% - 120 - - - - 120
TELEF EMISIONES JUNE C 07 CZK 4.623% - - - 104 - - 104
TELEF EMISIONES JULY A 07 USD 5.855% - - 561 - - - 561
TELEF EMISIONES JULY C 07 USD 6.221% - - - - - 524 524
TELEF EMISIONES JUNE 08 EUR 5.580% - - 1,250 - - - 1,250
TELEF EMISIONES FEBRUARY 09 EUR 5.431% - - - 2,000 - - 2,000
TELEF EMISIONES APRIL 2016 EUR 5.496% - - - - - 1,000 1,000
TELEF EMISIONES APRIL 2016 EUR 5.496% - - - - - 500 500
TELEF EMISIONES JULY 6, 2015 USD 4.949% - - - - 935 935
TELEF EMISIONES JULY 15, 2019 USD 5.877% - - - - - 748 748
TELEF EMISIONES JUNE 2015 EUR 1 x EURIBOR3M + 1.825% - - - - 400 - 400
TELEF EMISIONES JULY B 07 USD 1 x USDL3M + 0.33000% - - 636 - - - 636
TELEF EMISIONES JANUARY 06 A EUR 1 x EURIBOR6M + 0.83000% - - - - - 55 55
TELEF EMISIONES JANUARY 06 B EUR 1 x EURIBOR3M + 0.70% - - - - - 24 24
TELEF EMISIONES NOVEMBER 11, 2019 EUR 4.693% - - - - 1,750 1,750
EMTN GBP 12/09/2022 650 GBP GBP 5.289% - - - - 755 755
TELEF EMISIONES DECEMBER 09 EUR 1 x EURIBOR3M + 0.70% - - 100 - - 100
TELEF EMISIONES MARCH 10 EUR 3.406% - - - 1,400 1,400
TELEF EMISIONES APRIL 1, 2010 USD 2.582% - 898 - - - 898
TELEF EMISIONES APRIL 2, 2010 USD 3.729% - - - 674 - 674
TELEF EMISIONES APRIL 3, 2010 USD 5.134% - - - - 1,048 1,048
TELEF EMISIONES SEPTEMBER 10 EUR 3.661% - - - - - 1,000 1,000
EMTN GBP 10/08/2029 400 GBP GBP 5.445% - - - - - 465 465
Telefónica Emisiones, S.A.U. 2,998 620 3,345 4,285 3,409 13,503 28,160
Total Telefónica, S.A. and its instrumental companies 2.998 896 4,845 4,285 3,459 14,999 31,482
F-123
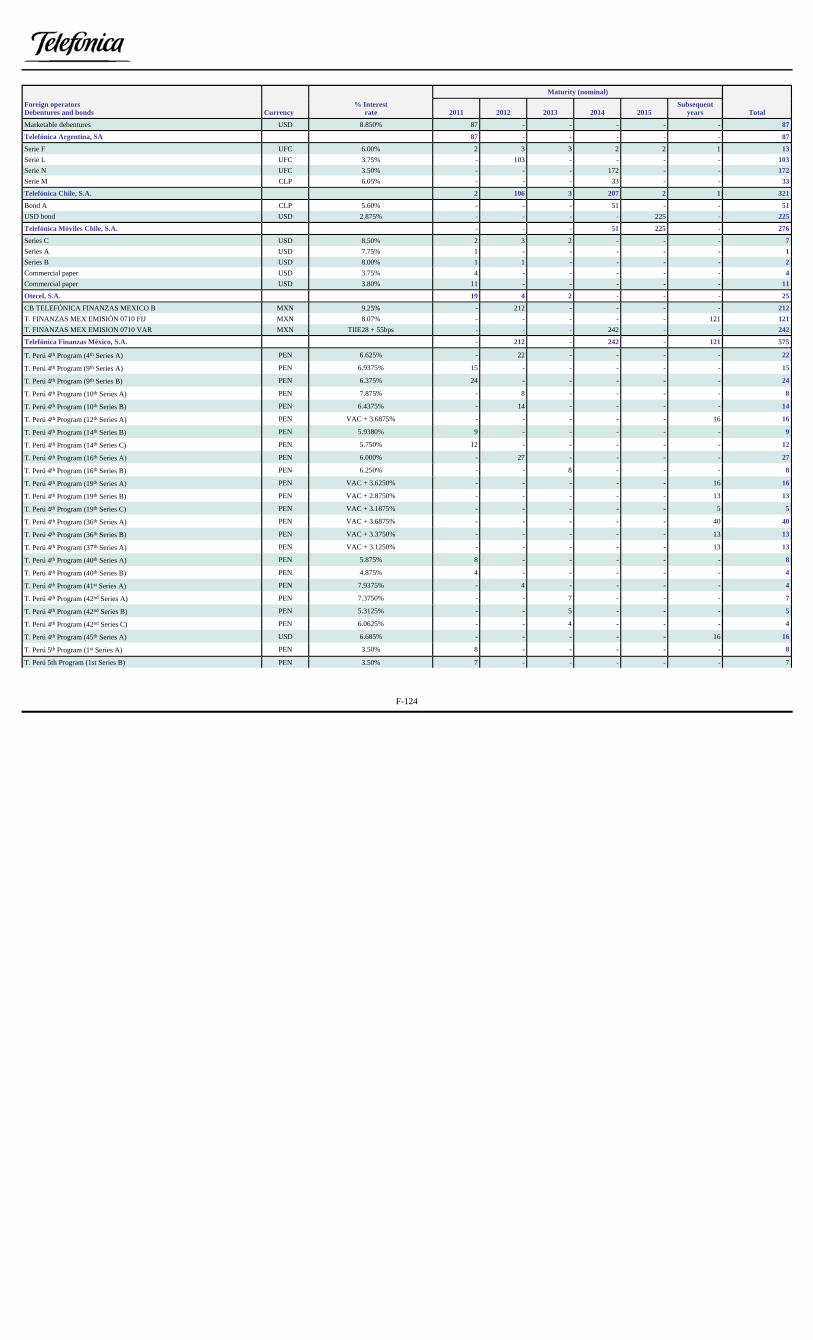
Maturity (nominal)
Foreign operators Debentures and bonds Currency
% Interestrate 2011 2012 2013 2014 2015
Subsequent years Total
Marketable debentures USD 8.850% 87 - - - - - 87
Telefónica Argentina, SA 87 - - - - - 87
Serie F UFC 6.00% 2 3 3 2 2 1 13
Serie L UFC 3.75% - 103 - - - - 103
Serie N UFC 3.50% - - - 172 - - 172
Serie M CLP 6.05% - - - 33 - - 33
Telefónica Chile, S.A. 2 106 3 207 2 1 321
Bond A CLP 5.60% - - - 51 - - 51
USD bond USD 2.875% - - - - 225 - 225
Telefónica Móviles Chile, S.A. - - - 51 225 - 276
Series C USD 8.50% 2 3 2 - - - 7
Series A USD 7.75% 1 - - - - - 1
Series B USD 8.00% 1 1 - - - - 2
Commercial paper USD 3.75% 4 - - - - - 4
Commercial paper USD 3.80% 11 - - - - - 11
Otecel, S.A. 19 4 2 - - - 25
CB TELEFÓNICA FINANZAS MEXICO B MXN 9.25% - 212 - - - - 212
T. FINANZAS MEX EMISIÓN 0710 FIJ MXN 8.07% - - - - - 121 121
T. FINANZAS MEX EMISION 0710 VAR MXN TIIE28 + 55bps - - - 242 - - 242
Telefónica Finanzas México, S.A. - 212 - 242 - 121 575
T. Perú 4th Program (4th Series A) PEN 6.625% - 22 - - - - 22
T. Perú 4th Program (9th Series A) PEN 6.9375% 15 - - - - - 15
T. Perú 4th Program (9th Series B) PEN 6.375% 24 - - - - - 24
T. Perú 4th Program (10th Series A) PEN 7.875% - 8 - - - - 8
T. Perú 4th Program (10th Series B) PEN 6.4375% - 14 - - - - 14
T. Perú 4th Program (12th Series A) PEN VAC + 3.6875% - - - - - 16 16
T. Perú 4th Program (14th Series B) PEN 5.9380% 9 - - - - - 9
T. Perú 4th Program (14th Series C) PEN 5.750% 12 - - - - - 12
T. Perú 4th Program (16th Series A) PEN 6.000% - 27 - - - - 27
T. Perú 4th Program (16th Series B) PEN 6.250% - - 8 - - - 8
T. Perú 4th Program (19th Series A) PEN VAC + 3.6250% - - - - - 16 16
T. Perú 4th Program (19th Series B) PEN VAC + 2.8750% - - - - - 13 13
T. Perú 4th Program (19th Series C) PEN VAC + 3.1875% - - - - - 5 5
T. Perú 4th Program (36th Series A) PEN VAC + 3.6875% - - - - - 40 40
T. Perú 4th Program (36th Series B) PEN VAC + 3.3750% - - - - - 13 13
T. Perú 4th Program (37th Series A) PEN VAC + 3.1250% - - - - - 13 13
T. Perú 4th Program (40th Series A) PEN 5.875% 8 - - - - - 8
T. Perú 4th Program (40th Series B) PEN 4.875% 4 - - - - - 4
T. Perú 4th Program (41st Series A) PEN 7.9375% - 4 - - - - 4
T. Perú 4th Program (42nd Series A) PEN 7.3750% - - 7 - - - 7
T. Perú 4th Program (42nd Series B) PEN 5.3125% - - 5 - - - 5
T. Perú 4th Program (42nd Series C) PEN 6.0625% - - 4 - - - 4
T. Perú 4th Program (45th Series A) USD 6.685% - - - - - 16 16
T. Perú 5th Program (1st Series A) PEN 3.50% 8 - - - - - 8
T. Perú 5th Program (1st Series B) PEN 3.50% 7 - - - - - 7
F-124

Maturity (nominal)
Foreign operators Debentures and bonds Currency
% Interestrate 2011 2012 2013 2014 2015
Subsequent years Total
T. Perú 5th Program (3rd Series A) PEN 4.38% - 8 - - - - 8
T. Perú 5th Program (5th Series A) PEN 6.1875% - - 6 - - - 6
T. Perú 5th Program (25th Series A) PEN 4.3125% - 5 - - - - 5
T. Perú 5th Program (25th Series B) PEN 4.3125% - 3 - - - - 3
T. Perú 5th Program (25th Series B) PEN 7.50% - - - - - 6 6
T. Perú 5th Program (33rd Series A) PEN 6.8125% - - - - - 16 16
T. Perú 5th Program (22nd Series A) PEN VAC + 3.5000% - - - - - 16 16
T. Perú Senior Notes PEN 8.000% - - 33 67 67 34 201
Telefónica del Perú, S.A. 87 91 63 67 67 204 579
T.M. Perú 1st Program (2nd Series A) PEN 7.0625% 14 - - - - - 14
T.M. Perú 1st Program (2nd Series B) PEN 7.5625% 7 - - - - - 7
T.M. Perú 1st Program (2nd Series C) PEN 7.5625% 12 - - - - - 12
T.M. Perú 1st Program (3rd Series A) PEN 7.4375% - - 10 - - - 10
T.M. Perú 1st Program (3rd Series B) PEN 7.6875% - - 5 - - - 5
T.M. Perú 1st Program (16th Series A) PEN 8.1875% - - 6 - - - 6
T.M. Perú 1st Program (18th Series A) PEN 6.3125% - - - 11 - - 11
T.M. Perú 1st Program (18th Series B) PEN 6.3750% - - - 17 - - 17
T.M. Perú 2nd Program (3rd Series A) PEN 5.750% - - 7 - - - 7
T.M. Perú 2nd Program (9th Series A) PEN 6.8125% - - - - - 16 16
T.M. Perú 2nd Program (9th Series B) PEN 6.3750% - - - - - 13 13
T.M. Perú 2nd Program (11th Series A) PEN 7.750% - - - - - 19 19
Telefónica Móviles, S.A. (Perú) 33 - 28 28 - 48 137
Nonconvertible bonds BRL 1.20 x CDI 90 - - - - - 90
Nonconvertible bonds BRL 1.06 x CDI - 153 - - - - 153
Nonconvertible bonds BRL 1.08 x CDI - 44 - - - - 44
Nonconvertible bonds BRL 1.12 x CDI - - 287 - - - 287
Nonconvertible bonds BRL IPCA + 7% - - - 32 - - 32
Convertible bonds (Telemig) BRL IPCA + 0.5% - - - - - 25 25
Vivo Participações, S.A. 90 197 287 32 - 25 631
O2 pounds sterling issue GBP 7.625% - 436 - - - - 436
MMO2, Plc - 436 - - - - 436
Total issues other operators 318 1,046 383 627 294 399 3,067
TOTAL OUTSTANDING DEBENTURES AND BONDS 3,316 1,942 5,228 4,912 3,753 15,398 34,549
F-125
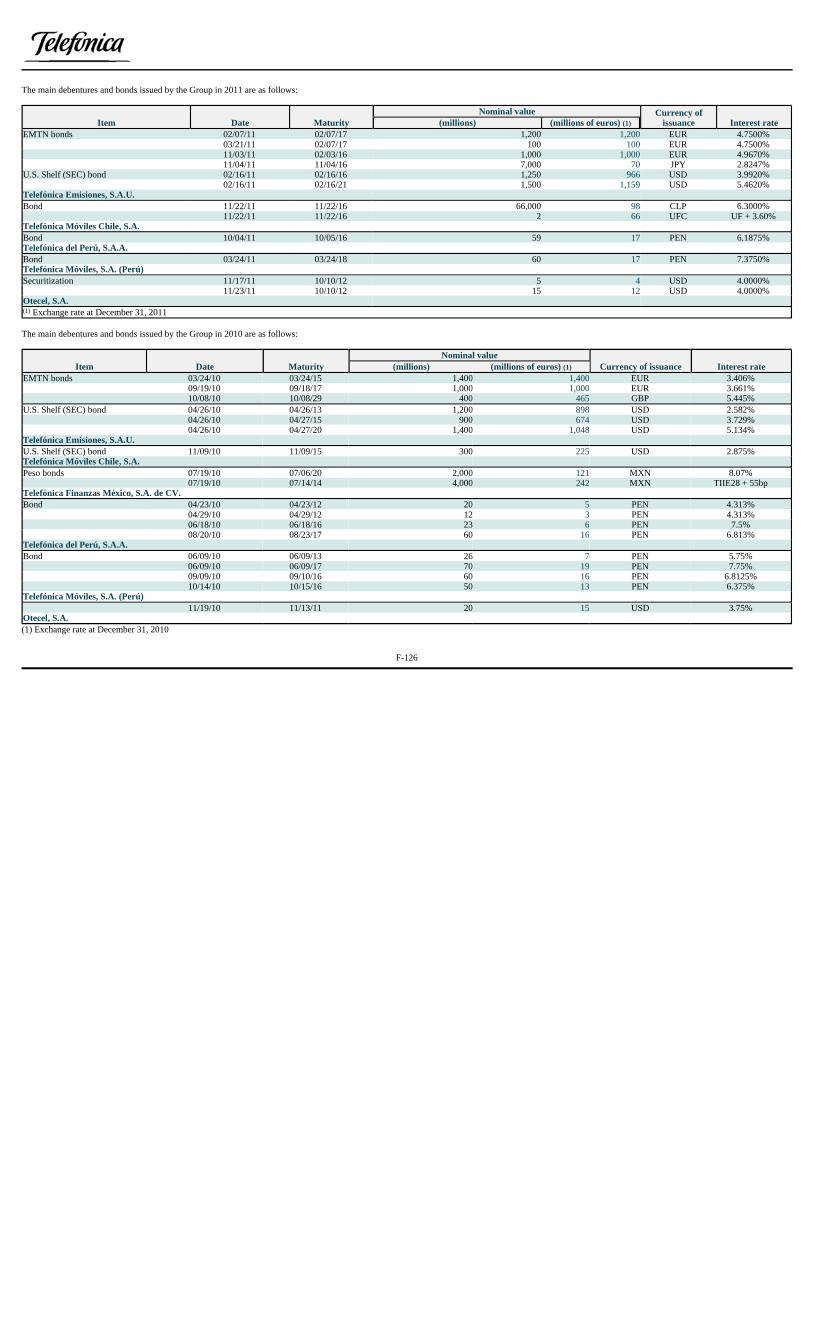
The main debentures and bonds issued by the Group in 2011 are as follows:
The main debentures and bonds issued by the Group in 2010 are as follows:
(1) Exchange rate at December 31, 2010
Item Date MaturityNominal value Currency of
issuance Interest rate(millions) (millions of euros) (1) EMTN bonds 02/07/11 02/07/17 1,200 1,200 EUR 4.7500% 03/21/11 02/07/17 100 100 EUR 4.7500% 11/03/11 02/03/16 1,000 1,000 EUR 4.9670% 11/04/11 11/04/16 7,000 70 JPY 2.8247%U.S. Shelf (SEC) bond 02/16/11 02/16/16 1,250 966 USD 3.9920% 02/16/11 02/16/21 1,500 1,159 USD 5.4620%Telefónica Emisiones, S.A.U.
Bond 11/22/11 11/22/16 66,000 98 CLP 6.3000% 11/22/11 11/22/16 2 66 UFC UF + 3.60%Telefónica Móviles Chile, S.A.
Bond 10/04/11 10/05/16 59 17 PEN 6.1875%Telefónica del Perú, S.A.A.
Bond 03/24/11 03/24/18 60 17 PEN 7.3750%Telefónica Móviles, S.A. (Perú)
Securitization 11/17/11 10/10/12 5 4 USD 4.0000% 11/23/11 10/10/12 15 12 USD 4.0000%Otecel, S.A. (1) Exchange rate at December 31, 2011
Item Date Maturity Nominal value
Currency of issuance Interest rate(millions) (millions of euros) (1) EMTN bonds 03/24/10 03/24/15 1,400 1,400 EUR 3.406% 09/19/10 09/18/17 1,000 1,000 EUR 3.661% 10/08/10 10/08/29 400 465 GBP 5.445%U.S. Shelf (SEC) bond 04/26/10 04/26/13 1,200 898 USD 2.582% 04/26/10 04/27/15 900 674 USD 3.729% 04/26/10 04/27/20 1,400 1,048 USD 5.134%Telefónica Emisiones, S.A.U.
U.S. Shelf (SEC) bond 11/09/10 11/09/15 300 225 USD 2.875%Telefónica Móviles Chile, S.A.
Peso bonds 07/19/10 07/06/20 2,000 121 MXN 8.07% 07/19/10 07/14/14 4,000 242 MXN TIIE28 + 55bpTelefónica Finanzas México, S.A. de CV.
Bond 04/23/10 04/23/12 20 5 PEN 4.313% 04/29/10 04/29/12 12 3 PEN 4.313% 06/18/10 06/18/16 23 6 PEN 7.5% 08/20/10 08/23/17 60 16 PEN 6.813%Telefónica del Perú, S.A.A.
Bond 06/09/10 06/09/13 26 7 PEN 5.75% 06/09/10 06/09/17 70 19 PEN 7.75% 09/09/10 09/10/16 60 16 PEN 6.8125% 10/14/10 10/15/16 50 13 PEN 6.375%Telefónica Móviles, S.A. (Perú)
11/19/10 11/13/11 20 15 USD 3.75%Otecel, S.A.
F-126
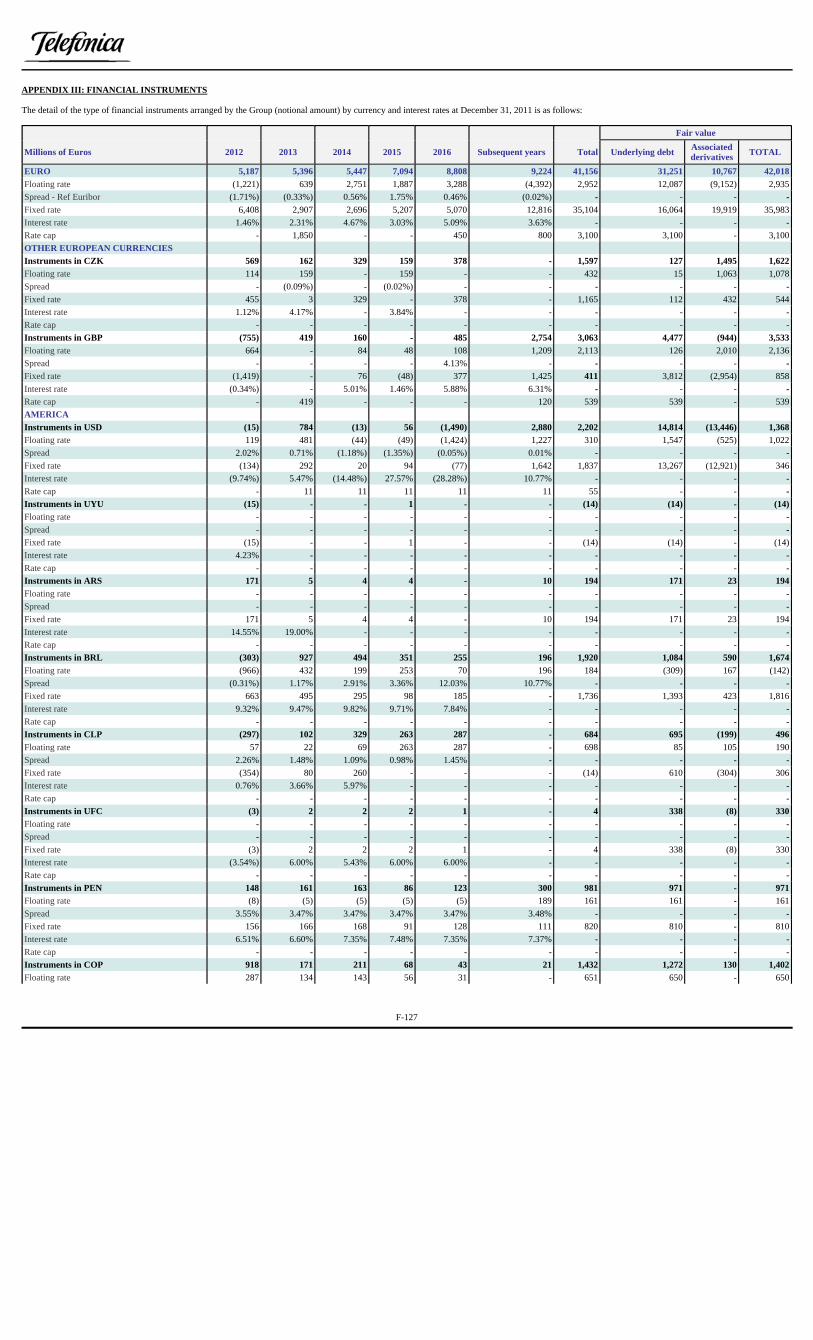
APPENDIX III: FINANCIAL INSTRUMENTS The detail of the type of financial instruments arranged by the Group (notional amount) by currency and interest rates at December 31, 2011 is as follows:
Fair value
Millions of Euros 2012 2013 2014 2015 2016 Subsequent years Total Underlying debt Associated derivatives TOTAL
EURO 5,187 5,396 5,447 7,094 8,808 9,224 41,156 31,251 10,767 42,018
Floating rate (1,221) 639 2,751 1,887 3,288 (4,392) 2,952 12,087 (9,152) 2,935
Spread - Ref Euribor (1.71%) (0.33%) 0.56% 1.75% 0.46% (0.02%) - - - -
Fixed rate 6,408 2,907 2,696 5,207 5,070 12,816 35,104 16,064 19,919 35,983
Interest rate 1.46% 2.31% 4.67% 3.03% 5.09% 3.63% - - - -
Rate cap - 1,850 - - 450 800 3,100 3,100 - 3,100
OTHER EUROPEAN CURRENCIES
Instruments in CZK 569 162 329 159 378 - 1,597 127 1,495 1,622
Floating rate 114 159 - 159 - - 432 15 1,063 1,078
Spread - (0.09%) - (0.02%) - - - - - -
Fixed rate 455 3 329 - 378 - 1,165 112 432 544
Interest rate 1.12% 4.17% - 3.84% - - - - - -
Rate cap - - - - - - - - - -
Instruments in GBP (755) 419 160 - 485 2,754 3,063 4,477 (944) 3,533
Floating rate 664 - 84 48 108 1,209 2,113 126 2,010 2,136
Spread - - - - 4.13% - - - - -
Fixed rate (1,419) - 76 (48) 377 1,425 411 3,812 (2,954) 858
Interest rate (0.34%) - 5.01% 1.46% 5.88% 6.31% - - - -
Rate cap - 419 - - - 120 539 539 - 539
AMERICA
Instruments in USD (15) 784 (13) 56 (1,490) 2,880 2,202 14,814 (13,446) 1,368
Floating rate 119 481 (44) (49) (1,424) 1,227 310 1,547 (525) 1,022
Spread 2.02% 0.71% (1.18%) (1.35%) (0.05%) 0.01% - - - -
Fixed rate (134) 292 20 94 (77) 1,642 1,837 13,267 (12,921) 346
Interest rate (9.74%) 5.47% (14.48%) 27.57% (28.28%) 10.77% - - - -
Rate cap - 11 11 11 11 11 55 - - -
Instruments in UYU (15) - - 1 - - (14) (14) - (14)
Floating rate - - - - - - - - - -
Spread - - - - - - - - - -
Fixed rate (15) - - 1 - - (14) (14) - (14)
Interest rate 4.23% - - - - - - - - -
Rate cap - - - - - - - - - -
Instruments in ARS 171 5 4 4 - 10 194 171 23 194
Floating rate - - - - - - - - - -
Spread - - - - - - - - - -
Fixed rate 171 5 4 4 - 10 194 171 23 194
Interest rate 14.55% 19.00% - - - - - - - -
Rate cap - - - - - - - - - -
Instruments in BRL (303) 927 494 351 255 196 1,920 1,084 590 1,674
Floating rate (966) 432 199 253 70 196 184 (309) 167 (142)
Spread (0.31%) 1.17% 2.91% 3.36% 12.03% 10.77% - - - -
Fixed rate 663 495 295 98 185 - 1,736 1,393 423 1,816
Interest rate 9.32% 9.47% 9.82% 9.71% 7.84% - - - - -
Rate cap - - - - - - - - - -
Instruments in CLP (297) 102 329 263 287 - 684 695 (199) 496
Floating rate 57 22 69 263 287 - 698 85 105 190
Spread 2.26% 1.48% 1.09% 0.98% 1.45% - - - - -
Fixed rate (354) 80 260 - - - (14) 610 (304) 306
Interest rate 0.76% 3.66% 5.97% - - - - - - -
Rate cap - - - - - - - - - -
Instruments in UFC (3) 2 2 2 1 - 4 338 (8) 330
Floating rate - - - - - - - - - -
Spread - - - - - - - - - -
Fixed rate (3) 2 2 2 1 - 4 338 (8) 330
Interest rate (3.54%) 6.00% 5.43% 6.00% 6.00% - - - - -
Rate cap - - - - - - - - - -
Instruments in PEN 148 161 163 86 123 300 981 971 - 971
Floating rate (8) (5) (5) (5) (5) 189 161 161 - 161
Spread 3.55% 3.47% 3.47% 3.47% 3.47% 3.48% - - - -
Fixed rate 156 166 168 91 128 111 820 810 - 810
Interest rate 6.51% 6.60% 7.35% 7.48% 7.35% 7.37% - - - -
Rate cap - - - - - - - - - -
Instruments in COP 918 171 211 68 43 21 1,432 1,272 130 1,402
Floating rate 287 134 143 56 31 - 651 650 - 650
F-127

Fair value
Millions of Euros 2012 2013 2014 2015 2016 Subsequent years Total Underlying debt Associated derivatives TOTAL
Spread 3.78% 3.24% 3.20% 3.22% 3.31% - - - - -
Fixed rate 631 37 68 12 12 21 781 622 130 752
Interest rate 4.47% 6.48% 6.71% 5.22% 5.22% 5.30% - - - -
Rate cap - - - - - - - - - -
Instruments in UVR - 35 - 119 132 2,437 2,723 2,723 - 2,723
Floating rate - 35 - 119 132 2,437 2,723 2,723 - 2,723
Spread - - - - - - - - - -
Fixed rate - - - - - - - - - -
Interest rate - - - - - - - - - -
Rate cap - - - - - - - - - -
Instruments in VEB (1,653) (4) (3) - - - (1,660) (1,671) - (1,671)
Floating rate - - - - - - - - - -
Spread - - - - - - - - - -
Fixed rate (1,653) (4) (3) - - - (1,660) (1,671) - (1,671)
Interest rate 1.68% 14.19% 16.00% - - - - - - -
Rate cap - - - - - - - - - -
Instruments in UDI (32) (32) (32) (76) (21) 91 (102) 876 60 936
Floating rate (32) (32) (32) (76) (21) 91 (102) 876 60 936
Spread 3.63% 5.21% 5.26% 4.66% 6.50% (3.18%) - - - -
Fixed rate - - - - - - - - - -
Interest rate - - - - - - - - - -
Rate cap - - - - - - - - - -
Instruments in MXN 451 54 276 54 54 791 1,680 920 (166) 754
Floating rate (2) - - - - 58 56 248 (26) 222
Spread - - - - - 0.74% - - - -
Fixed rate 453 54 276 54 54 733 1,624 672 (140) 532
Interest rate 10.13% 3.70% 5.19% 3.70% 3.70% 3.95% - - - -
Rate cap - - - - - - - - - -
Instruments in GTQ (6) - - - - - (6) (19) - (19)
Floating rate (6) - - - - - (6) (6) - (6)
Spread 0.01% - - - - - - - - -
Fixed rate - - - - - - - (13) - (13)
Interest rate - - - - - - - - - -
Rate cap - - - - - - - - - -
ASIA
Instruments in JPY - - - - - - - 520 (532) (12)
Floating rate - - - - - - - 150 (150) -
Spread - - - - - - - - - -
Fixed rate - - - - - - - 370 (382) (12)
Interest rate - - - - - - - - - -
Rate cap - - - - - - - - - -
TOTAL 55,854 58,535 (2,230) 56,305
Floating rate 10,172 18,353 (6,448) 11,905
Fixed rate 41,988 36,543 4,218 40,761
Rate cap 3,694 3,639 - 3,639
Currency options 22 - 22 22
F-128

The table below is an extract of the previous table that shows the sensitivity to interest rates originated by our position on interest rate swaps categorized into instruments entered into for trading purposesand instruments entered into for purposes other than trading at December 31, 2011:
INTEREST RATE SWAPS Maturity Millions of euros 2012 2013 2014 2015 2016 Subsequent years TOTAL Fair valueTRADING PURPOSES EUR (78)Fixed to fixed - - - - - - - 27Receiving leg (2,023) - (35) (20) - - (2,078) (2,081)
Average interest rate 1.60% - - - - - 1.56% -Paying leg 2,023 - 35 20 - - 2,078 2,108
Average spread 1.60% - 1.12% 1.63% - - 1.60% -Fixed to floating - - - - - - - (527)Receiving leg (475) (1,405) (1,447) (745) (2,145) (6,626) (12,843) (8,061)
Average interest rate 15.34% 2.76% 2.22% 3.15% 0.41% 3.15% 2.99% -Paying leg 475 1,405 1,447 745 2,145 6,626 12,843 7,534
Average spread 0.17% 0.85% 1.35% 0.60% 2.57% - 0.71% -Floating to fixed - - - - - - - 408Receiving leg (7,458) (710) (1,325) - (3,485) (1,325) (14,303) (12,663)
Average spread (0.05%) 1.56% - - 1.22% - 0.35% -Paying leg 7,458 710 1,325 - 3,485 1,325 14,303 13,071
Average interest rate 0.92% 2.35% 3.14% - 1.54% 7.80% 1.99% -Floating to floating - - - - - - - 14Receiving leg (4,123) - - (50) - - (4,173) (4,191)
Average interest rate (0.08%) - - - - - (0.08%) -Paying leg 4,123 - - 50 - - 4,173 4,205
Average spread (0.08%) - - 0.28% - - (0.08%) -USD 54Fixed to floating - - - - - - - (42)Receiving leg - - (39) (39) (124) (286) (488) (529)
Average interest rate - - 1.04% 1.66% 1.15% 3.61% 2.62% -Paying leg - - 39 39 124 286 488 487
Average spread - - - - - - - -Floating to fixed - - - - - - - 96Receiving leg (128) (464) (100) (105) (19) (1,021) (1,837) (655)
Average spread 2.57% 3.61% - - - - 1.09% -Paying leg 128 464 100 105 19 1,021 1,837 751
Average interest rate - - 0.92% 2.52% 1.07% 3.31% 2.05% -GBP (3)Fixed to floating - - - - - - - (11)Receiving leg - - 60 48 108 341 557 559
Average interest rate - - - - - - - -Paying leg - - (60) (48) (108) (341) (557) (570)
Average spread - - 1.53% 1.46% 1.75% 2.25% 2.01% -Floating to fixed - - - - - - - 8Receiving leg - - 156 - - 269 425 434
Average spread - - 1.31% - - 2.40% 2.00% -Paying leg - - (156) - - (269) (425) (426)
Average interest rate - - - - - - - -
NON TRADING PURPOSES EUR - - - - - - - 522Fixed to floating - - - - - (70) (70) (1,039)Receiving leg (594) (1,654) (2,815) (1,005) (3,093) (2,650) (11,811) (12,717)
Average interest rate 4.26% 4.69% 3.26% 2.32% 2.80% 3.41% 3.35% -Paying leg 594 1,654 2,815 1,005 3,093 2,580 11,741 11,678
Average spread 0.04% 0.03% 0.01% 0.03% 0.01% - 0.02% -Floating to fixed - - - - - - - 1,561Receiving leg (4,776) (4,476) (2,330) (6,302) (3,120) (13,303) (34,307) (24,704)
Average spread 1.03% 0.65% 0.74% 0.32% - - 0.34% -Paying leg 4,776 4,476 2,330 6,302 3,120 13,303 34,307 26,265
Average interest rate 0.92% 1.33% 1.62% 2.70% 3.13% 3.19% 2.43% -Floating to floating - - - - - - - -Receiving leg (42) - - - - - (42) (43)
F-129
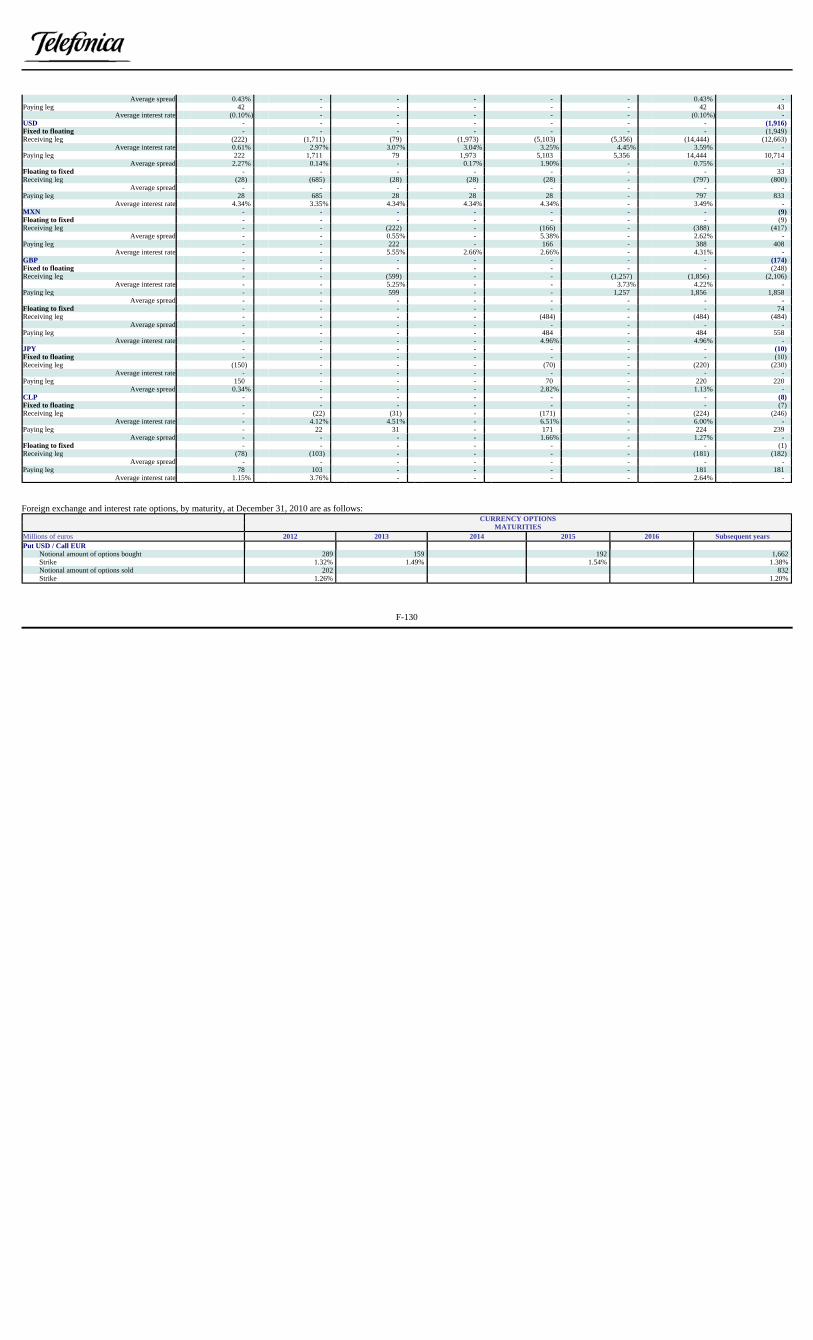
Foreign exchange and interest rate options, by maturity, at December 31, 2010 are as follows:
Average spread 0.43% - - - - - 0.43% -Paying leg 42 - - - - - 42 43
Average interest rate (0.10%) - - - - - (0.10%) -USD - - - - - - - (1,916)Fixed to floating - - - - - - - (1,949)Receiving leg (222) (1,711) (79) (1,973) (5,103) (5,356) (14,444) (12,663)
Average interest rate 0.61% 2.97% 3.07% 3.04% 3.25% 4.45% 3.59% -Paying leg 222 1,711 79 1,973 5,103 5,356 14,444 10,714
Average spread 2.27% 0.14% - 0.17% 1.90% - 0.75% -Floating to fixed - - - - - - - 33Receiving leg (28) (685) (28) (28) (28) - (797) (800)
Average spread - - - - - - - -Paying leg 28 685 28 28 28 - 797 833
Average interest rate 4.34% 3.35% 4.34% 4.34% 4.34% - 3.49% -MXN - - - - - - - (9)Floating to fixed - - - - - - - (9)Receiving leg - - (222) - (166) - (388) (417)
Average spread - - 0.55% - 5.38% - 2.62% -Paying leg - - 222 - 166 - 388 408
Average interest rate - - 5.55% 2.66% 2.66% - 4.31% -GBP - - - - - - - (174)Fixed to floating - - - - - - - (248)Receiving leg - - (599) - - (1,257) (1,856) (2,106)
Average interest rate - - 5.25% - - 3.73% 4.22% -Paying leg - - 599 - - 1,257 1,856 1,858
Average spread - - - - - - - -Floating to fixed - - - - - - - 74Receiving leg - - - - (484) - (484) (484)
Average spread - - - - - - - -Paying leg - - - - 484 - 484 558
Average interest rate - - - - 4.96% - 4.96% -JPY - - - - - - - (10)Fixed to floating - - - - - - - (10)Receiving leg (150) - - - (70) - (220) (230)
Average interest rate - - - - - - - -Paying leg 150 - - - 70 - 220 220
Average spread 0.34% - - - 2.82% - 1.13% -CLP - - - - - - - (8)Fixed to floating - - - - - - - (7)Receiving leg - (22) (31) - (171) - (224) (246)
Average interest rate - 4.12% 4.51% - 6.51% - 6.00% -Paying leg - 22 31 - 171 - 224 239
Average spread - - - - 1.66% - 1.27% -Floating to fixed - - - - - - - (1)Receiving leg (78) (103) - - - - (181) (182)
Average spread - - - - - - - -Paying leg 78 103 - - - - 181 181
Average interest rate 1.15% 3.76% - - - - 2.64% -
CURRENCY OPTIONS MATURITIESMillions of euros 2012 2013 2014 2015 2016 Subsequent yearsPut USD / Call EUR
Notional amount of options bought 289 159 192 1,662Strike 1.32% 1.49% 1.54% 1.38%Notional amount of options sold 202 832Strike 1.26% 1.20%
F-130

Cash flows receivable or payable on derivative financial instruments settled via the swap of nominals, by currency of collection/payment, along with contractual maturities are as follows:
INTEREST RATE OPTIONS MATURITIESMillions of euros 2012 2013 2014 2015 Subsequent yearsCollars
Notional amount of options bought 919 - - 504 1,698Strike Cap 5.05% - - 4.29% 4.76%Strike Floor 3.30% - - 3.00% 3.63%
Caps Notional amount of options bought 2,749 - - - -
Strike 4.37% - - - -Notional amount of options sold 3,668 - - 504 1,698
Strike 4.95% - - 4.45% 5.22%Floors
Notional amount of options bought 919 - - 450 1,698Strike 0.96% - - 0.50% 0.99%
Notional amount of options sold - - - - -Strike - - - - -
Millions of euros 2012 2013 2014 2015 2016 Subsequent years TotalCurrency swaps
Receive ARS - - - - - - -Pay ARS - - - - - - -
Receive BRL 110 - 68 - - - 178Pay BRL (258) (136) (151) (197) (177) (38) (957)
Receive CLP 89 103 - 263 116 - 571Pay CLP (252) (206) (212) (527) (231) - (1,428)
Receive COP - - - - - - -Pay COP (214) (37) (37) (12) (12) (21) (333)
Receive CZK - - - - - - -Pay CZK (114) (159) (228) (159) (378) - (1,038)
Receive EUR 608 286 281 163 1,151 - 2,489Pay EUR (582) (2,943) (72) (3,176) (4,533) (8,034) (19,340)
Receive GBP - - - - - - -Pay GBP - - - - (484) - (484)
Receive JPY 599 - - - 70 - 669Pay JPY - - - - - - -
Receive MAD 90 - - - - - 90Pay MAD (90) - - - - - (90)
Receive MXN - - - - - - -Pay MXN (51) (51) (51) (51) (51) (645) (900)
Receive PEN - - - - - - -Pay PEN (29) (15) (15) (15) (35) (23) (132)
Receive UFC 199 - 166 - 133 - 498Pay UFC (100) - - - (66) - (166)
Receive USD 306 3,498 284 4,203 4,690 8,419 21,400Pay USD (189) (260) (73) (277) (54) - (853)
Receive UDI 52 52 52 52 52 664 924Pay UDI - - - - - - -
TOTAL 174 132 12 267 191 322 1,098Forwards
Receive ARS 26 - - - - - 26Pay ARS (197) - - - - - (197)
F-131

The detail of the type of financial instruments by the Group notional amount by currency and interest rates at December 31, 2010 was as follows:
Receive BRL - - - - - - -Pay BRL (192) - - - - - (192)
Receive CLP 185 - - - - - 185Pay CLP (91) - - - - - (91)
Receive COP 18 - - - - - 18Pay COP (190) - - - - - (190)
Receive CZK 5 - - - - - 5Pay CZK (604) - - - - - (604)
Receive EUR 3,661 - - - - - 3,661Pay EUR (3,350) (19) - - - - (3,369)
Receive GBP 2,530 - - - - - 2,530Pay GBP (994) - - - - - (994)
Receive MXN 4 - - - - - 4Pay MXN (597) - - - - - (597)
Receive PEN 2 - - - - - 2Pay PEN (93) - - - - - (93)
Receive UFC 20 - - - - - 20Pay UFC (20) - - - - - (20)
Receive USD 1,682 22 - - - - 1,704Pay USD (1,792) - - - - - (1,792)
TOTAL 13 3 - - - - 16
Fair value
Millions of Euros 2011 2012 2013 2014 2015Subsequent
years Total Underlying
debt Associated derivatives TOTAL
EURO 6,343 3,777 7,548 3,677 6,933 11,336 39,614 34,588 6,151 40,739Floating rate 796 1,855 6,862 1,195 2,529 (5,177) 8,060 8,575 (784) 7,791Spread - Ref Euribor 0.12% 0.59% 0.22% 0.04% 1.16% 11.70% (6.81%) Fixed rate 5,547 (228) (14) 2,482 4,404 15,263 27,454 21,870 6,648 28,518Interest rate (0.46%) 3.69% (157%) 4.78% 3.24% 25.17% 14.86% Rate cap - 2,150 700 - - 1,250 4,100 4,143 287 4,430OTHER EUROPEAN CURRENCIES (469) 1,324 170 919 164 3,377 5,485 3,882 1,589 5,471Instruments in CZK 646 242 164 338 164 - 1,554 45 1,527 1,572Floating rate - 116 164 - 164 - 444 - 446 446Spread - (0.00%) (0.09%) - (0.02%) - (0.04%) Fixed rate 646 126 - 338 - - 1,110 45 1,081 1,126Interest rate 1.81% 4.17% - 3.84% - - 2.69% Rate cap - - - - - - - - - -Instruments in GBP (1,115) 1,082 6 581 - 3,377 3,931 3,837 62 3,899Floating rate - 238 - 581 - 1,340 2,159 101 1,818 1,919Spread - 0.27% - - - - 0.03% Fixed rate (1,115) 437 6 - - 1,921 1,249 3,210 (1,874) 1,336Interest rate (1.99%) 7.57% 6.44% - - 17.33% 31.12% Rate cap - 407 - - - 116 523 526 118 644AMERICA (1,035) 1,639 1,982 1,317 830 5,006 9,739 17,237 (8,700) 8,537Instruments in USD (257) 10 650 36 27 1,270 1,736 12,880 (11,715) 1,165Floating rate (153) 93 480 68 (73) (86) 329 1,950 (1,787) 163Spread 1.84% 0.80% 0.69% 0.76% (0.56%) 0.53% 0.53% Fixed rate (114) (93) 160 (42) 90 1,344 1,345 10,867 (9,931) 936Interest rate (23.54%) 3.93% 7.83% 1.05% 27.27% (86.84%) (82.40%) Rate cap 10 10 10 10 10 12 62 63 3 66Instruments in UYU (48) - - - - - (48) 2 - 2Floating rate - - - - - - - - -Spread - - - - - - - - -Fixed rate (48) - - - - - (48) 2 - 2Interest rate 3.40% - - - - - 3.40% - - Rate cap - - - - - - - - - -Instruments in ARS 399 - - - - 15 414 139 252 391
F-132

Fair value Millions of Euros 2011 2012 2013 2014 2015
Subsequent years Total
Underlying debt
Associated derivatives TOTAL
Floating rate - - - - - - - - - -Spread - - - - - - - Fixed rate 399 - - - - 15 414 139 252 391Interest rate 13.29% - - - - - 12.77% Rate cap - - - - - - - - - -Instruments in BRL (1,127) 662 856 406 299 125 1,221 582 674 1,256Floating rate (1,608) 336 460 203 234 34 (341) (636) 388 (248)Spread (0.90%) 3.89% 3.28% 5.57% 1.26% - (16.67%) Fixed rate 481 326 396 203 65 91 1,562 1,218 286 1,504Interest rate 7.53% 7.60% 4.61% 7.58% 7.77% 27.24% 7.98% Rate cap - - - - - - - - - -Instruments in CLP (64) 225 110 312 283 - 866 (129) 795 666Floating rate (56) 85 24 33 283 - 369 87 689 776Spread (2.53%) 1.63% 1.48% - 0.98% - 1.60% Fixed rate (8) 140 86 279 - - 497 (216) 106 (110)Interest rate (24.06%) 3.86% 3.66% - - - 5.47% Rate cap - - - - - - - - - -Instruments in UFC 3 2 2 2 2 2 13 197 121 318Floating rate - - - - - - - - - -Spread - - - - - - - Fixed rate 3 2 2 2 2 2 13 197 121 318Interest rate 40.94% 7.45% 6.00% 5.43% 6.00% 6.00% 13.62% Rate cap - - - - - - - - - -Instruments in PEN 60 152 144 124 77 360 917 1,130 125 1,255Floating rate - - - - - - - - - -Spread - - - - - - - Fixed rate 60 152 144 124 77 360 917 1,130 125 1,255Interest rate 18.68% 6.23% 6.73% 6.58% 7.95% 31.05% 17.06% Rate cap - - - - - - - - - -Instruments in COP 551 322 154 135 26 5 1,193 561 715 1,276Floating rate 147 124 129 110 26 5 541 584 - 584Spread 2.22% 3.10% 3.11% 3.14% 3.00% 3.00% 2.86% Fixed rate 404 198 25 25 - - 652 (23) 715 692Interest rate 2.42% 8.43% 7.09% 7.09% - - 4.60% Rate cap - - - - - - - - - -Instruments in UVR 7 - - - 52 2,523 2,582 2,582 - 2,582Floating rate - - - - - - - - - -Spread - - - - - - - Fixed rate 7 - - - 52 2,523 2,582 2,582 - 2,582Interest rate 12.38% - - - 12.38% 74.28% 72.88% Rate cap - - - - - - - - - -Instruments in VEB (1,082) - - - - - (1,082) (1,084) - (1,084)Floating rate - - - - - - - - - -Spread - - - - - - - Fixed rate (1,082) - - - - - (1,082) (1,084) - (1,084)Interest rate 1.66% - - - - - 1.66% - - Rate cap - - - - - - - - - -Instruments in UDI 45 48 60 54 58 492 757 - (246) (246)Floating rate 45 48 60 54 58 492 757 - (246) (246)Spread 3.56% 3.52% 3.12% 3.09% 3.09% 2.98% 3.07% Fixed rate - - - - - - - - - -Interest rate - - - - - - - - -Rate cap - - - - - - - - - -Instruments in MXN 484 218 6 248 6 214 1,176 377 579 956Floating rate (70) - - 242 - 87 259 17 - 17Spread 0.45% - - 0.55% - 0.46% 0.55% Fixed rate 554 218 6 6 6 127 917 360 579 939Interest rate 3.57% 9.10% 4.00% 4.00% 4.00% 5.16% 5.11% Rate cap - - - - - - - - - -Instruments in GTQ (6) - - - - - (6) - - -Floating rate (6) - - - - - (6) - - -Spread - - - - - - - Fixed rate - - - - - - - - - -Interest rate - - - - - - - Rate cap - - - - - - - - -ASIA (1) - - - - - (1) 295 (301) (6)Instruments in JPY (1) - - - - - (1) 295 (301) (6)Floating rate - - - - - - - 138 (138) -Spread - - - - - - - Fixed rate (1) - - - - - (1) 157 (163) (6)Interest rate (0.04%) - - - - - (0.04%)
F-133

The table below is an extract of the previous table that shows the sensitivity to interest rates originated by the Group´s position on interest rate swaps categorized into instruments entered into fortrading purposes and instruments entered into for purposes other than trading at December 31, 2010:
Fair value
Millions of Euros 2011 2012 2013 2014 2015Subsequent
years Total Underlying
debt Associated derivatives TOTAL
Rate cap - - - - - - - - - -TOTAL 4,838 6,740 9,700 5,913 7,927 19,719 54,837 56,002 (1,261) 54,741Floating rate (905) 2,895 8,179 2,486 3,221 (3,305) 12,571 10,816 386 11,202Fixed rate 5,733 1,278 811 3,417 4,696 21,646 37,581 40,454 (2,055) 38,399Rate cap 10 2,567 710 10 10 1,378 4,685 4,732 408 5,140Currency options (175) Other 931
INTEREST RATE SWAPS Maturity Millions of euros 2011 2012 2013 2014 2015 Subsequent years TOTAL Fair valueTRADING PURPOSES EUR (88)Fixed to fixed - - - - - - - 3Receiving leg - - - (35) (20) - (55) (50)
Average interest rate - - - - - - -Paying leg - - - 35 20 - 55 53
Average spread - - - 1.12% 1.63% - 1.31%Fixed to floating - - - - - - - (308)Receiving leg (1,685) (420) (1,250) (1,255) (575) (2,359) (7,544) (6,141)
Average interest rate 4.62% 4.25% 3.46% 2.50% 3.57% 3.37% 3.59%Paying leg 1,685 420 1,250 1,255 575 2,359 7,544 5,833
Average spread 0.00% 0.00% 0.95% 1.56% 0.77% 2.45% 1.24%Floating to fixed - - - - - - - 218Receiving leg (5,327) (175) (710) (1,000) - (2,185) (9,397) (8,812)
Average spread 0.00% 0.00% 2.00% 0.00% - 0.00% 0.15%Paying leg 5,327 175 710 1,000 - 2,185 9,397 9,030
Average interest rate 1.03% 2.17% 2.35% 3.43% - 3.32% 1.94% Floating to floating - - - - - - - (1)Receiving leg - - - - (50) - (50) (52)
Average interest rate - - - - - - - Paying leg - - - - 50 - 50 51
Average spread - - - - - - - USD - - - - - - - 6Fixed to floating - - - - - - - (13)Receiving leg (68) - - - (37) (322) (427) (440)
Average interest rate 3.08% - - - 0.00% 3.26% 2.95% Paying leg 68 - - - 37 322 427 427
Average spread - - - - 1.04% - 0.09%Floating to fixed - - - - - - - 19Receiving leg (206) (67) (449) - (102) (876) (1,700) (633)
Average spread 0.35% 3.99% 3.61% - - - 1.15%Paying leg 206 67 449 - 102 876 1,700 652
Average interest rate 0.50% - - - 2.52% 3.54% 2.03% -
F-134

NON TRADING PURPOSES EUR - - - - - - - (784)Fixed to floating - - - - - - - (661)Receiving leg (2,039) (504) (1,654) (3,055) (1,005) (3,318) (11,575) (12,218)
Average interest rate 3.23% 3.50% 3.77% 4.69% 3.33% 3.47% 3.78%Paying leg 2,039 504 1,654 3,055 1,005 3,318 11,575 11,557
Average spread 0.80% 0.01% 0.05% 0.03% 0.01% 0.00% 0.16%Floating to fixed - - - - - - - (123)Receiving leg (11,699) (556) (550) (2,230) (5,412) (11,832) (32,279) (15,695)
Average spread 0.19% - - 3.48% 2.35% - 0.70%Paying leg 11,699 556 550 2,230 5,412 11,832 32,279 15,572
Average interest rate 2.64% 2.82% 3.74% - 1.09% 3.72% 3.01% -USD - - - - - - - (880)Fixed to floating - - - - - - - (928)Receiving leg (776) (42) (1,501) (42) (1,875) (4,891) (9,127) (9,539)
Average interest rate - 3.90% - 5.52% - 4.84% 2.64%Paying leg 776 42 1,501 42 1,875 4,891 9,127 8,611
Average spread - - - - -Floating to fixed - - - - - - - 48Receiving leg (28) (28) (664) (28) (28) (28) (804) (802)
Average spread - - - - - - - Paying leg 28 28 664 28 28 28 804 850
Average interest rate 4.34% 4.34% 4.34% 3.35% 4.34% 4.34% 4.31% -MXN - - - - - - - (1)Floating to fixed - - - - - - - (1)Receiving leg (85) - - - - (121) (206) (69)
Average spread 0.61% 0.25% -Paying leg 85 - - - - 121 206 68
Average interest rate 8.16% 3.37% -GBP - - - - - - - 2Fixed to floating - - - - - - - (64)Receiving leg - - - (581) - (1,220) (1,801) (1,867)
Average interest rate 5.25% - 3.92% 2.66% -Paying leg - - - 581 - 1,220 1,801 1,803
Average spread - 1.64% 1.11% -Floating to fixed - - - - - - - 66Receiving leg (628) - - - - (470) (1,098) (1,099)
Average spread - - - -Paying leg 628 - - - - 470 1,098 1,165
Average interest rate 5.12% 4.96% 2.13% -JPY - - - - - - - (4)Fixed to floating - - - - - - - (4)Receiving leg - - (138) - - - (138) (142)
Average interest rate 1.68% 1.68% -Paying leg - - 138 - - - 138 138
Average spread - - - -CLP - - - - - - - (35)Fixed to floating - - - - - - - 1Receiving leg - - (24) (33) - - (57) (56)
Average interest rate 4.12% 4.51% - 2.39% -Paying leg - - 24 33 - - 57 57
Average spread - - - -Floating to fixed - - - - - - - (36)Receiving leg (297) (60) (110) - - - (467) (355)
Average spread 1.55% - - - 0.98% -Paying leg 297 60 110 - - - 467 319
Average interest rate - 1.82% 3.74% 1.11% -
F-135

Foreign exchange and interest rate options, by maturity, at December 31, 2010 were as follows:
Cash flows receivable or payable on derivative financial instruments settled via the swap of nominals, by currency of collection/payment, along with contractual maturities at December 31, 2010 were as follows:
CURRENCY OPTIONS MATURITIES 2011 2012 2013 2014 2015 Subsequent yearsPut USD / Call EUR
Notional amount of options bought 217 154 186 1,609Strike 1.59% 1.49% 1.54% 1.38%Notional amount of options sold 195 831Strike 1.49% 1.20%
INTEREST RATE OPTIONS
MATURITIES
Figures in euros 2011 2012 2013 2014 Subsequent years
Collars
Notional amount of options bought - 1,406,622,132 - - 2,179,179,407
Strike Cap - 4.718% - - 4.63%
Strike Floor - 3.204% - - 3.48%
Caps
Notional amount of options bought - 4,430,888,760 - - -
Strike - 4.031% - - -
Notional amount of options sold - 5,837,510,892 - - 2,179,179,407
Strike - 3.669% - - 5.032%
Floors
Notional amount of options bought - 1,706,622,132 - - 2,121,333,140
Strike - 0.764% - - 0.786%
Notional amount of options sold - 700,000,000 - - -
Strike - 2.147% - - -
Millions of euros 2011 2012 2013 2014 2015Subsequent
years Total
Currency swaps
Receive ARS - - - - - - -
Pay ARS (54) - - - - - (54)
Receive BRL 75 - - - - - 75
Pay BRL (202) (73) (5) (84) (199) - (563)
Receive CLP 204 95 110 - 284 - 693
Pay CLP (408) (271) (221) (228) (565) - (1,693)
Receive COP - - - - - - -
Pay COP (198) (198) (25) (25) - - (446)
Receive CZK - - - - - - -
Pay CZK (117) (117) (164) (235) (164) - (797)
Receive EUR 978 323 160 281 163 588 2,493
Pay EUR (870) (485) (2,928) (41) (3,145) (8,286) (15,755)
Receive GBP - - - - - - -
Pay GBP (628) - - - - (470) (1,098)
Receive JPY 18 552 - - - 138 708
Pay JPY - - - - - - -
F-136

Millions of euros 2011 2012 2013 2014 2015Subsequent
years Total
Receive MAD - 89 - - - - 89
Pay MAD - (89) - - - - (89)
Receive MXN - - - - - - -
Pay MXN (12) (12) (12) (12) (12) (182) (242)
Receive PEN - - - - - - -
Pay PEN (17) (28) (19) (14) (14) (54) (146)
Receive UFC 41 206 - 171 - - 418
Pay UFC (133) (103) - - - - (236)
Receive USD 1,526 225 3,224 151 4,007 8,104 17,237
Pay USD (185) - (112) - (268) - (565)
Receive UDI 12 12 12 12 12 186 246
Pay UDI - - - - - - -
TOTAL 30 126 20 (24) 99 24 275
Forwards
Receive ARS - - - - - - -
Pay ARS (229) - - - - - (229)
Receive BRL - - - - - - -
Pay BRL (156) - - - - - (156)
Receive CLP 129 - - - - - 129
Pay CLP (129) - - - - - (129)
Receive COP 65 - - - - - 65
Pay COP (295) - - - - - (295)
Receive CZK - - - - - - -
Pay CZK (718) - - - - - (718)
Receive EUR 3,357 - - - - - 3,357
Pay EUR (3,055) (32) (18) - - - (3,105)
Receive GBP 2,257 8 - - - - 2,265
Pay GBP (1,031) - - - - - (1,031)
Receive MXN 286 - - - - - 286
Pay MXN (746) - - - - - (746)
Receive PEN 42 2 - - - - 44
Pay PEN (12) - - - - - (12)
Receive UFC - - - - - - -
Pay UFC (11) - - - - - (11)
Receive USD 2,351 26 21 - - - 2,398
Pay USD (2,107) (2) - - - - (2,109)
TOTAL (2) 2 3 - - - 3
F-137

APPENDIX IV: INTEREST-BEARING DEBT The main financing transactions included under this heading outstanding at December 31, 2011 and 2010 and their nominal amounts are as follows:
(*) Multi-currency loan
Descriptive name summary Contractual limit
amount Currency
Outstanding principal balance (millions of
euros) Arrangement Maturity (millions) 12/31/11 12/31/10 date dateTotal Telefónica, S.A. and its instrument companies
Telefónica, S.A. 2005 syndicated facility 650 EUR - 300 06/28/05 06/28/11Telfisa EIB bilateral facility 300 EUR - 300 12/12/06 12/12/11Telefónica Europe, B.V. 2006 syndicated facility 4,200 GBP 2,965 2,945
Tramo D (*) 2,100 GBP 2,502 2,459 12/07/06 12/14/12Tramo E (*) 2,100 GBP 463 486 12/07/06 12/14/13
Telefónica, S.A. 2010 syndicated facility 8,000 EUR 8,000 6,000 Tranche A.1 1,000 EUR 1,000 3,000 07/28/10 07/28/13Tranche A.2 2,000 EUR 2,000 - 07/28/10 07/28/14Tranche A.3 2,000 EUR 2,000 - 07/28/10 07/28/16Tranche B 3,000 EUR 3,000 3,000 07/28/10 07/28/15
Bilateral loan 160 EUR 160 160 12/22/10 12/22/15Telfisa EIB bilateral facility 100 EUR 100 100 01/31/07 01/31/15Telfisa EIB bilateral facility 375 EUR 375 375 01/30/08 01/30/15Telfisa EIB bilateral facility 253 USD 196 227 09/15/04 09/15/16Cajas Telefónica, S.A. 2006 Saving Bank’s syndicated facility 700 EUR 700 700 04/21/06 04/21/17Telefónica, S.A. ECAs – EKN loan 472 USD 259 - 02/12/10 11/30/19Telefónica Europe, B.V. bilateral 15,000 JPY 150 138 08/16/07 07/27/37
Other operators
Telefónica Chile 2005 syndicated facility 150 USD - 112 10/28/05 06/21/11Móviles Chile 2006 syndicated facility 180 USD - 134 12/29/05 01/05/11Cesky financing 115 EUR 115 115 07/30/97 07/30/12Telefónica Chile 2008 syndicated facility 150 USD 116 112 06/09/08 05/13/13Telefónica Brasil bilateral loan – Banco do Brasil 150 USD 116 - 10/31/11 10/25/13Vivo bilateral loan - BNDES 818 BRL 339 509 07/13/07 08/15/14Colombia Telecomunicaciones loan 310,000 COP 123 121 12/28/09 12/28/14Vivo EIB bilateral 265 USD 212 203 02/29/08 03/02/15Atento syndicated facility 235 EUR 228 - 03/29/11 03/29/15Telefónica Brasil bilateral loan - BNDES 1,390 BRL 576 812 10/23/97 05/15/15Móviles Colombia IDB financing 273 USD 211 367
Tranche A 83 USD 64 83 12/20/07 11/15/14Tranche B 190 USD 147 284 12/20/07 11/15/12
Vivo bilateral loan - BNB 255 BRL 111 170 10/30/08 10/30/16Telefónica Brasil bilateral loan - BNDES 3,000 BRL 414 - 09/20/11 07/15/19
Others 6,157 6,069 Total 21,623 19,907
F-138

APPENDIX V: MAIN COMPANIES COMPRISING THE TELEFÓNICA GROUP The table below lists the main companies comprising the Telefónica Group at December 31, 2011 and the main investments consolidated using the equity method. Included for each company are the company name, corporate purpose, country, functional currency, share capital (in million of functional currency units), the Telefónica Group's effective shareholding and thecompany or companies through which the Group holds a stake.
Name and corporate purpose Country Currency Capital % Telefónica Group Holding company
Parent company:
Telefónica, S.A. Spain EUR 4,564
Telefónica Spain
Telefónica de España, S.A.U. Telecommunications service provider Spain EUR 1,024 100% Telefónica, S.A. (100%)
Telefónica Móviles España, S.A.U. Wireless communications services provider Spain EUR 423 100% Telefónica, S.A. (100%)
Acens Technologies, S.L. Hosting, housing and telecommunications solutions service provider Spain EUR 23 100% Telefónica de España, S.A.U. (100%)
Telefónica Soluciones Sectoriales, S.A.U. Consulting services for ICT companies Spain EUR 14 100% Telefónica de España, S.A.U. (100%)
Teleinformática y Comunicaciones, S.A.U. (TELYCO) Promotion, marketing and distribution of telephone and telematic equipment and services Spain EUR 8 100% Telefónica de España, S.A.U. (100%)
Telefónica Serv. de Informática y Com. de España, S.A.U. Telecommunications systems, networks and infrastructure engineering Spain EUR 5 100% Telefónica de España, S.A.U. (100%)
Telefónica Cable, S.A.U. Cable telecommunication services provider Spain EUR 3 100% Telefónica de España, S.A.U. (100%)
Iberbanda, S.A. Broadband telecommunications operator Spain EUR 2 100% Telefónica de España, S.A.U. (100%)
Telefónica Telecomunicaciones Públicas, S.A.U. Installation of public telephones Spain EUR 1 100% Telefónica de España, S.A.U. (100%)
Interdomain, S.A.U. Internet resources operator Spain EUR - 100% Telefónica Soluciones Sectoriales, S.A. (100%)
Telefónica Remesas, S.A. Remittance management Spain EUR - 100% Telefónica Telecomunicaciones Públicas, S.A.U. (100%)
Tuenti Technologies, S.L. Private social platform Spain EUR - 91.38% Telefónica Móviles España, S.A.U. (91.38%)
Telefónica Latin America
Telefónica Internacional, S.A.U. Investment in the telecommunications industry abroad Spain EUR 2,839 100% Telefónica, S.A. (100%)
Telefónica International Holding, B.V. Holding company Netherlands EUR - 100% Telefónica Internacional, S.A.U. (100%)
F-139

Name and corporate purpose Country Currency Capital % Telefónica Group Holding company
Latin American Cellular Holdings, B.V. Holding company Netherlands EUR 281 100% Telefónica, S.A. (100%)
Telefónica Datacorp, S.A.U. Telecommunications service provider and operator Spain EUR 700 100% Telefónica, S.A. (100%)
Telefónica Brasil, S.A. Wireline telephony operator in Sao Paulo
Brazil BRL 37,798 73.92% Telefónica Internacional, S.A.U. (29.42%) Sao Paulo Telecomunicaçoes Participaçoes, Ltda. (19.72%) Telefónica, S.A. (24.72%) Telefónica Chile, S.A. (0.06%)
Vivo, S.A. Wireless services operator
Brazil BRL 7,051 73.9% Telefónica Brasil, S.A.(100%)
Compañía Internacional de Telecomunicaciones, S.A. Holding company
Argentina ARS 561 100% Telefónica Holding de Argentina, S.A. (47.22%) Telefónica Móviles Argentina Holding, S.A. (42.77%) Telefónica International Holding, B.V. (10.01%)
Telefónica de Argentina, S.A. Telecommunications service provider
Argentina ARS 624 100% Compañía Internacional de Telecomunicaciones, S.A. (51.49%) Telefónica Internacional, S.A. (16.20%) Telefónica Móviles Argentina, S.A. (29.56%) Telefónica International Holding, B.V. (0.95%) Telefónica, S.A. (1.80%)
Telefónica Móviles Argentina Holding, S.A. Holding company Argentina ARS 1,198 100% Telefónica, S.A. (75%)
Telefónica Internacional, S.A.U. (25%)
Telefónica Venezolana, C.A. Wireless communications operator Venezuela VEF 1,468 100%
Latin America Cellular Holdings, B.V. (97.04%) Telefónica, S.A. (0.09%) Comtel Comunicaciones Telefónicas, S.A. (2.87%)
Telefónica Móviles Chile, S.A. Wireless communications services operator Chile CLP 589,404 99.99% TEM Inversiones Chile Ltda. (99.99%)
Telefónica Chile, S.A. Local and international long distance telephony services provider Chile CLP 578,078 97.89% Inversiones Telefónica Internacional Holding Ltda. (53.00%)
Telefónica Internacional de Chile, S.A. (44.89%)
Telefónica del Perú, S.A.A. Local, domestic and international long distance telephone service provider Peru PEN 2,962 98.33%
Telefónica Internacional, S.A.U. (49.90%) Latin America Cellular Holdings, B.V. (48.28%) Telefónica, S.A. (0.15%)
Telefónica Móviles Perú, S.A.C. Wireless communications services provider Peru PEN 625 99.99% Telefónica del Perú, S.A.A. (99.99%)
F-140

Name and corporate purpose Country Currency Capital % Telefónica Group
Holding company
Colombia Telecomunicaciones, S.A. ESP Communications services operator Colombia COP 909,929 52.03% Telefónica Internacional, S.A.U. (52.03%)
Telefónica Móviles Colombia, S.A. Wireless communications operator Colombia COP 82 100% Olympic, Ltda. (50.57%)
Telefónica, S.A. (49.43%)
Telefónica Móviles México, S.A. de C.V. (MEXICO) Holding company Mexico MXN 50,452 100% Telefónica, S.A. (100%)
Pegaso Comunicaciones y Sistemas, S.A. de C.V. Wireless telephone and communications services Mexico MXN 27,173 100% Telefónica Móviles México, S.A. de C.V. (100%)
Telefónica Móviles del Uruguay, S.A. Wireless communications and services operator Uruguay UYU 255 100% Latin America Cellular Holdings, B.V. (68.00%)
Telefónica, S.A. (32.00%)
Telefónica Larga Distancia de Puerto Rico, Inc. Telecommunications service operator Puerto Rico USD - 98% Telefónica Internacional Holding, B.V. (98%)
Telefónica Móviles Panamá, S.A. Wireless telephony services Panama USD 24 100% Telefónica, S.A. (56.31%)
Panamá Cellular Holdings, B.V. (43.69%)
Telefónica Móviles El Salvador, S.A. de C.V. Provision of wireless and international long distance communications services El Salvador USD 187 99.18% Telefónica El Salvador Holding, S.A. de C.V. (99.18%)
Telefónica Móviles Guatemala, S.A. Wireless, wireline and radio paging communications services provider
Guatemala GTQ 1,420 99.98% TCG Holdings, S.A. (65.99%) Telefónica, S.A. (13.60%) Guatemala Cellular Holdings, B.V. (13.12%) Panamá Cellular Holdings, B.V. (7.27%)
Telefonía Celular de Nicaragua, S.A. Wireless telephony services Nicaragua NIO 247 100% Latin America Cellular Holdings, B.V. (100%)
Otecel, S.A. Wireless communications services provider Ecuador USD 183 100% Ecuador Cellular Holdings, B.V. (100%)
Telefónica de Costa Rica TC, S.A. Wireless communications Costa Rica CRC 91,047 100% Telefónica, S.A. (100%)
Wayra Investigacion y Desarrollo, S.L. Talent identification and development in ICT. Spain EUR - 100% Telefónica Internacional, S.A.U. (100%)
WY Telecom, S.A. de C.V. Talent identification and development in ICT. Mexico MXN 8 100% Telefónica Móviles México, S.A. de C.V. (98%)
Pegaso PCS, S.A. de C.V. (2%)
Wayra Argentina, S.A. Talent identification and development in ICT. Argentina ARS 7 100% Telefónica Móviles Argentina, S.A. (90%)
Telefónica Internacional Holding, B.V. (10%)
Wayra Colombia, S.A.S. Technological innovation-based business project development Colombia COP 5 100% Telefónica Móviles Colombia, S.A. (100%)
Proyecto Wayra, C.A. Commercial, industrial and mercantile activities Venezuela VEF 2 100% Telefónica Venezolana, C.A. (100%)
F-141

Name and corporate purpose Country Currency Capital % Telefónica Group Holding company
Wayra Perú Aceleradora de Proyectos, S.A.C. Technological innovation-based business project development Peru PEN 2 100% Telefónica del Perú, S.A.A. (99.99%)
Telefónica Móviles Perú, S.A.C. (0.01%)
Terra Networks Brasil, S.A. ISP and portal Brazil BRL 1,046 100% Sao Paulo Telecomunicaçoes Participaçoes, Ltda. (100%)
Terra Networks México, S.A. de C.V. ISP, portal and real-time financial information services Mexico MXN 45 99.99% Terra Networks Mexico Holding, S.A. de C.V. (99.99%)
Terra Networks Perú, S.A. ISP and portal Peru PEN 10 99.99% Telefónica Internacional, S.A.U. (99.99%)
Terra Networks Argentina, S.A. ISP and portal Argentina ARS 7 100% Telefónica Internacional, S.A.U. (99.99%)
Telefónica International Holding, B.V. (0.01%)
Terra Networks Guatemala, S.A. ISP and portal Guatemala GTQ 154 99.99% Telefónica Internacional, S.A.U. (99.99%)
Telefónica Holding Atticus, B.V. Holding company Netherlands EUR - 100% Telefónica Internacional, S.A.U. (100%)
Telefónica Europe
Telefónica Europe plc Holding company UK GBP 39 100% Telefónica, S.A. (100%)
MmO2 plc Holding company UK GBP 9 99.99% Telefónica Europe plc (99.99%)
O2 Holdings Ltd. Holding company UK GBP 12 100% MmO2 plc (100%)
Telefónica UK Ltd. Wireless communications services operator UK GBP 17 100% O2 Networks Ltd. (80.00%)
O2 Cedar Ltd. (20.00%)
Tesco Mobile Ltd. (*) Wireless telephony services UK GBP - 50% O2 Communication Ltd. (50.00%)
O2 (Europe) Ltd. Holding company UK EUR 1,239 100% Telefónica, S.A. (100%)
Telefónica Germany GmbH & Co. OHG Wireless communications services operator Germany EUR 51 100% Telefónica Germany Verwaltungs GmBh (99.99%)
Telefónica O2 Germany Management GmBh (0.01%)
Telefonica Ireland Ltd. Wireless communications services operator Ireland EUR 98 100% O2 Netherland Holdings B.V. (97.06%)
Kilmaine, Ltd. (2.94%)
Jajah Inc. IP telephony platform US USD - 100% Telefónica Europe plc (100%)
Telefónica Czech Republic, a.s. Telecommunications service provider Czech Republic CZK 32,209 69.41% Telefónica, S.A. (69.41%)
Telefónica Slovakia, s.r.o. Wireless telephony, internet and data transmission services Slovak Republic EUR 240 69.41% Telefónica Czech Republic, a.s. (100%)
F-142

Name and corporate purpose Country Currency Capital % Telefónica Group
Holding company
Telefónica International Wholesale Services II, S.L. International services provider Spain EUR - 100% Telefónica, S.A. (100%)
Telefónica International Wholesale Services, S.L. International services provider Spain EUR 230 100% Telefónica, S.A. (92.51%)
Telefónica Datacorp, S.A.U.(7.49%)
Telefónica International Wholesale Services America, S.A. Provision of high bandwidth communications services Uruguay UYU 14,563 100% Telefónica, S.A. (74.36%)
Telefónica International Wholesale Services, S.L. (25.64%)
Telefónica International Wholesale Services USA, Inc. Provision of high bandwidth communications services US USD 36 100% T. International Wholesale Services America, S.A. (100%)
Other companies
Telefónica Global Services, GmbH Purchasing services Germany EUR - 100% Telefónica Germany GmbH & Co. OHG (100%)
Telefónica Global Roaming, GmbH Optimization of network traffic Germany EUR - 100% Telefónica Global Services, GmbH (100%)
Telefónica Compras Electrónicas, S.L. Development and provision of information society services Spain EUR - 100% Telefónica Global Services, GmbH (100%)
Telefónica de Contenidos, S.A.U. Organization and operation of multimedia service-related businesses Spain EUR 1,865 100% Telefónica, S.A. (100%)
Televisión Federal S.A.- TELEFE Provision and operation TV and radio broadcasting – ervices Argentina ARS 135 100% Atlántida Comunicaciones S.A. (79.02%)
Enfisur S.A. (20.98%)
Atlántida Comunicaciones, S.A. Media Argentina ARS 22 100% Telefónica Media Argentina S.A. (93.02%)
Telefónica Holding de Argentina, S.A. (6.98%)
Telefónica Servicios Audiovisuales, S.A.U. Provision of all type of audiovisual telecommunications services Spain EUR 6 100% Telefónica de Contenidos, S.A.U. (100%)
Telefónica On The Spot Services, S.A.U. Provision of telemarketing services Spain EUR 1 100% Telefónica de Contenidos, S.A.U. (100%)
Telefónica Broadcast Services, S.L.U. DSNG-based transmission and operation services Spain EUR - 100% Telefónica Servicios Audiovisuales, S.A.U. (100%)
Telefónica Learning Services, S.L. Vertical e-learning portal Spain EUR 1 100% Telefónica Digital España, S.L. (100%)
Red Universal de Marketing y Bookings Online, S.A. (RUMBO) (*) Online travel agency Spain EUR 1 50.00% Telefónica Digital España, S.L. (50.00%)
Atento Inversiones y Teleservicios, S.A.U. Holding company Spain EUR 24 100% Telefónica, S.A. (100%)
Atento Ceská Republika, a.s. Provision of call-center services Czech Republic CZK 1 100% Atento Inversiones y Teleservicios, S.A. (100%)
Atento Teleservicios España, S.A.U. Provision of all type of telemarketing services Spain EUR 1 100% Atento N.V. (100%)
F-143

Name and corporate purpose Country Currency Capital % Telefónica Group
Holding company
Atento Impulsa, S.L.U. Management of specialist job centers for people with disabilities Spain EUR - 100% Atento Teleservicios España, S.A. (100%)
Atento N.V. Holding company and telecommunications service provider Netherlands EUR - 100% Atento Inversiones y Teleservicios, S.A. (100%)
Atento Brasil, S.A. Provision of call-center services Brazil BRL 152 100% Atento N.V. (100%)
Atento Colombia, S.A. Provision of call-center services
Colombia COP 2,997 100% Atento N.V. (94.98%) Atento Mexicana, S.A. De C.V. (5.00%) Atento Venezuela, S.A. (0.01%) Atento Brasil, S.A. (0.004%) Teleatento del Perú, S.A.C. (0.004%)
Atento Argentina, S.A. Provision of call-center services Argentina ARS 4 100% Atento Holding Chile, S.A. (75.56%)
Atento N.V. (24.44%)
Atento Mexicana, S.A. de C.V. Provision of call-center services Mexico MXN 47 100% Atento N.V. (100%)
Teleatento del Perú, S.A.C. Provision of call-center services Peru PEN 14 100% Atento N.V. (83.33%)
Atento Holding Chile, S.A. (16.67%)
Atento Chile, S.A. Telecommunications services provider
Chile CLP 11,128 100% Atento Holding Chile, S.A. (71.16%) Telefónica Chile, S.A. (27.44%) Telefónica Empresas Chile, S.A. (0.96%) Telefónica Larga Distancia, S.A. (0.44%)
Atento Centroamérica, S.A. Provision of call-center services Guatemala GTQ 55 100% Atento N.V. (99.99%)
Atento El Salvador, S.A. de C.V. (0.01%)
Telfin Ireland Ltd. Intragroup financing Ireland EUR - 100% Telefónica, S.A. (100%)
Telefónica Digital España, S.L. Holding company Spain EUR 7 100% Telefónica, S.A. (100%)
Telefónica Ingeniería de Seguridad, S.A.U. Security services and systems Spain EUR 7 100% Telefónica, S.A. (100%)
Telefónica Engenharia de Segurança do Brasil, Ltda. Security services and systems Brazil BRL 35 99.99% Telefónica Ingeniería de Seguridad, S.A. (99.99%)
Telefónica Capital, S.A.U. Finance company Spain EUR 7 100% Telefónica, S.A. (100%)
Lotca Servicios Integrales, S.L. Aircraft ownership and operation Spain EUR 17 100% Telefónica, S.A. (100%)
Fonditel Pensiones, Entidad Gestora de Fondos de Pensiones, S.A. Administration of pension funds Spain EUR 16 70.00% Telefónica Capital, S.A. (70.00%)
F-144

Name and corporate purpose Country Currency Capital % Telefónica Group Holding company
Fonditel Gestión, Soc. Gestora de Instituciones de Inversión Colectiva, S.A. Administration and representation of collective investment schemes Spain EUR 2 100% Telefónica Capital, S.A. (100%)
Telefónica Investigación y Desarrollo, S.A.U. Telecommunications research activities and projects Spain EUR 6 100% Telefónica, S.A. (100%)
Telefónica Investigación y Desarrollo de México, S.A. de C.V. Telecommunications research activities and projects Mexico MXN - 100% Telefónica Investigación y Desarrollo, S.A. (100%)
Telefónica Luxembourg Holding, S.à.r.L. Holding company Luxembourg EUR 8 100% Telefónica, S.A. (100%)
Casiopea Reaseguradora, S.A. Reinsurance Luxembourg EUR 4 100% Telefónica Luxembourg Holding, S.à.r.L. (100%)
Pléyade Peninsular, Correduría de Seguros y Reaseguros del Grupo Telefónica, S.A. Distribution, promotion or preparation of insurance contracts Spain EUR - 100% Telefónica Finanzas, S.A.U. (TELFISA) (83.33%)
Telefónica, S.A. (16.67%)
Telefónica Insurance, S.A. Direct insurance transactions Luxembourg EUR 6 100% Casiopea Reaseguradora, S.A. (95.00%)
Seguros de Vida y Pensiones Antares, S.A. (5.00%)
Seguros de Vida y Pensiones Antares, S.A. Life insurance, pensions and health insurance Spain EUR 51 100% Telefónica, S.A. (89.99%)
Casiopea Reaseguradora, S.A. (10.01%)
Telefónica Finanzas, S.A.U. (TELFISA) Integrated cash management, consulting and financial support for Group companies Spain EUR 3 100% Telefónica, S.A. (100%)
Fisatel Mexico, S.A. de C.V. Integrated cash management, consulting and financial support for Group companies Mexico MXN 5 100% Telefónica, S.A. (100%)
Telfisa Global, B.V. Integrated cash management, consulting and financial support for Group companies Netherlands EUR - 100% Telefónica, S.A. (100%)
Telefónica Europe, B.V. Fund raising in capital markets Netherlands EUR - 100% Telefónica, S.A. (100%)
Telefónica Finance USA, L.L.C. (**) Financial intermediation US EUR 2,000 0.01% Telefónica Europe, B.V. (0.01%)
Telefónica Emisiones, S.A.U. Financial debt instrument issuer Spain EUR - 100% Telefónica, S.A. (100%)
Spiral Investments, B.V. Holding company Netherlands EUR 39 100% Telefónica Móviles España, S.A.U. (100%)
Telefónica Global Technology, S.A.U. Gloabl management and operation of IT systems Spain EUR 10 100% Telefónica, S.A. (100%)
Telefónica Móviles Soluciones y Aplicaciones, S.A. IT and communications services provider Chile CLP 7,801 100% Telefónica S.A. (100%)
F-145

Name and corporate purpose Country Currency Capital % Telefónica Group Holding company
Aliança Atlântica Holding B.V. Holding company Netherlands EUR 40 93.99% Telefónica, S.A. (50.00%)
Telefónica Brasil, S.A. (43.99%)
Telefónica Gestión de Servicios Compartidos España, S.A. Management and administrative services rendered Spain EUR 8 100% Telefónica, S.A. (100%)
Telefónica Gestión de Servicios Compartidos, S.A.C. Management and administrative services rendered Argentina ARS - 99.99% T. Gestión de Servicios Compartidos España, S.A. (95.00%)
Telefónica, S.A. (4.99%)
Telefónica Gestión de Servicios Compartidos, S.A. Management and administrative services rendered Chile CLP 1,019 97.89% Telefónica Chile, S.A.(97.89%)
Telefónica Gestión de Servicios Compartidos, S.A. Management and administrative services rendered Peru PEN 1 100% T. Gestión de Servicios Compartidos España, S.A. (99.99%)
Telefónica del Perú, S.A.A. (0.01%)
Cobros Serviços de Gestao, Ltda. Management and administrative services rendered Brazil BRL - 99.33% T. Gestión de Servicios Compartidos España, S.A. (99.33%)
Tempotel, Empresa de Trabajo Temporal, S.A. Temporary employment agency Spain EUR - 100% T. Gestión de Servicios Compartidos España, S.A. (100%)
Telefonica Serviços Empresariais do BRASIL, Ltda. Management and administrative services rendered Brazil BRL 12 99.99% T. Gestión de Servicios Compartidos España, S.A. (99.99%)
Telefónica Gestión de Servicios Compartidos México, S.A. de C.V. Management and administrative services rendered Mexico MXN 50 100% T. Gestión de Servicios Compartidos España, S.A. (100%)
Telefónica Servicios Integrales de Distribución, S.A.U. Distribution services provider Spain EUR 2 100% T. Gestión de Servicios Compartidos España, S.A. (100%)
Companies accounted for using the equity method
Telefónica Factoring España, S.A. Factoring services provider Spain EUR 5 50.00% Telefónica, S.A. (50.00%)
Telefónica Factoring Do Brasil, Ltd. Factoring services provider Brazil BRL 5 50.00% Telefónica, S.A. (40.00%)
Telefónica Factoring España, S.A. (10.00%)
Telefónica Factoring Mexico, S.A. de C.V. SOFOM ENR Factoring services provider Mexico MXN 33 50.00%
Telefónica, S.A. (40.5%) Telefónica Factoring España, S.A. (9.50%)
Telefónica Factoring Perú, S.A.C. Factoring services provider Peru PEN 6 50.00%
Telefónica, S.A. (40.5%) Telefónica Factoring España, S.A. (9.50%)
Telefónica Factoring Colombia, S.A. Factoring services provider Colombia COP 4,000 50.00%
Telefónica, S.A. (40.5%) Telefónica Factoring España, S.A. (9.50%)
Telco, S.p.A. Holding company Italy EUR 2,186 46.18% Telefónica, S.A. (46.18%)
DTS Distribuidora de Televisión Digital, S.A. Broadcasting, satellite TV signal transmission and linkage services Spain EUR 126 22.00% Telefónica de Contenidos, S.A.U. (22%)
F-146

(*) Consolidated by using proportionate consolidation method (**) Fully consolidated with 100% of voting rights Through these consolidated financial statements, Telefónica (Germany) GmbH & Co. OHG, complies with the provisions of Art. 264b HGB [“Handelsgesetzbuch”: Germany code of commerce], and is exempt in accordance with the stipulations of Art. 264b HGB.
Name and corporate purpose Country Currency Capital % Telefónica Group
Holding company
Hispasat, S.A. Operation of a satellite telecommunications system Spain EUR 122 13.23% Telefónica de Contenidos, S.A.U. (13.23%)
China Unicom (Hong Kong) Limited Telecommunications service operator China RMB 2,311 9.57% Telefónica Internacional, S.A.U. (9.57%)
F-147

APPENDIX VI: KEY REGULATORY ISSUES AND CONCESSIONS AND LICENSES HELD BY THE TELEFÓNICA GROUP In order to provide network services, the Group must obtain general authorizations, concessions or licenses from the national regulatory authorities of the countries in which the Group operates.Procedures for obtaining licenses are also applicable to radio frequency permits for the Group’s mobile operators. The duration of a license or of the rights to use spectrum depend on the legal frameworkapplicable in the country in question. The main issues regarding the regulatory environment in which the Group operates, as well as the service licenses, concessions and authorizations held by the Group at December 31, 2011, are describedbelow. Regulatory environment The regulatory debate in 2011 remained focused on the roll-out of ultra-high speed networks, roaming charges and net neutrality, all important issues for the development of the Europeantelecommunications market and the Information Society. In March 2011, the European Commission held a roundtable with 39 executives of telecommunications, equipment and content companies to discuss speeding up Next Generation network deployment.In July, the industry representatives presented 11 specific proposals regarding the sustainability of the internet ecosystem, interoperability, the framework for investments and network funding. Thisinitiative sparked debate over new mechanisms for fiber network development, particularly co-investment between operators and public-private funding. In this connection, in October the Commission held a consultation on the current costs and pricing of copper networks and the future fiber networks. The Commission encourages investment in fiber andis currently looking at how to set prices for current and future wholesale services to achieve this goal. In April, the Commission released a report on Net Neutrality, in which it maintains the non-regulatory alternative. It did, however, pose the need to know and supervise operators’ traffic management practices. The Commission turned to BEREC to draft a set of guidelines for transparency and minimum quality of service standards. In July, the Commission released a proposal for a review of the Roaming Regulation aimed a achieving a long-term solution to continued high roaming costs. The proposal entails a dramatic change tohow roaming services have been provided in Europe until now. From July 2014, mobile operators would be forced to separate the sale of roaming services from their domestic services. This would allowusers to choose a different operator for calls made in other Member States. The proposal includes a transitional period during which the current maximum prices would be applied until the structuralmeasure is implemented. Retail data roaming prices would also include new caps. In Spain, the government reorganized spectrum during the year 2011 to prepare the industry for mobile broadband. In an auction, Telefónica Móviles España, S.A.U. obtained 6 MHz (2x10 MHz each)in the 800 MHz (2x10 MHz), 900 MHz (2x10 MHz) and 2.6 GHz (2x20 MHz each) bands for a total of 842 million euros, of which it has already paid 441 million euros. It has until June 1, 2012, to paythe remaining 401 million euros. The government also held a tender to appoint the operator(s) in charge of providing components of the universal service. Telefónica de España, S.A.U. was appointed public electronic communicationsnetwork connection and public telephony service provider. It was also entrusted with drafting and delivering the telephone directory to subscribers of public telephone service.
F-148

Telefónica Telecomunicaciones Públicas, S.A.U. was engaged to oversee the part of universal service dealing with having a sufficient number of public pay telephones. The concession for theappointment of the universal service operator is for five years, from January 1, 2012 to December 31, 2017. Also during the year, the government passed Royal Decree 726/ 2011, of May 20, which states that connection to the public electronic communications network with internet access, guaranteed underthe universal service, must allow for broadband data communication with download speeds of at least 1Mbit per second. As regards regulation of relevant markets, a general Service Level Agreement (SLA) model was implemented –within the scope of NEON (new national operator environment)- to ensure quality indicators in wholesale offers. The Spanish telecoms regulator, Comisión del Mercado de Telecomunicaciones (CMT), raised the price of the unbundled loop and cut prices for wholesale access to thetelephone network (AMLT). The regulator put a freeze on monthly charges and finally approved the new wholesale broadband service (NEBA), which will replace the current indirect access service.Lastly, in December 2011, the CMT launched a public consultation on mobile network call termination rates, proposing a reduction of 75-80 %. The government prepared a draft bill amending General Telecommunications Law 32/2003, of November 3, to adapt it to the package of EU directives on electronic communications. It set the deadlinefor transposing these directives into Spanish law at May 25, 2011. The November 20 general elections and the dissolution of the house of representatives delayed passage of this law for its presentationto congress and the senate in the new legislature. Accordingly, the directives were not transposed within the established timeframe. Finally, the European Commission brought the Kingdom of Spain before the European Court of Justice in 2011 for failure to eliminate within the established timeframe the tax included in the law onfunding of RTVE, which affects Telefónica España, S.A.U., Telefónica Móviles, S.A.U. and Telefónica Telecomunicaciones Públicas, S.A.U. as electronic communications operators (0.9% of grossoperating revenues excluding those obtained in the wholesale market) and providers of conditional access services to pay TV (1.5% of gross operating income). In the other European markets where Telefónica operates, discussions surrounding the procedures for awarding and sharing radioelectric spectrum intensified in 2011. In Germany, the regulator launched a public consultation to identify demand for spectrum in the 900 MHz and 1800 MHz frequencies from 2017. A decision in this respect should come in 2013. On October 21, 2011, amid theprocess for refarming, the regulator adopted the decision not to redistribute spectrum in the 900 MHz frequency, allowing Telefónica Germany to keep the spectrum allotted to it. In the Czech Republic, in September 2011 the regulator (CTO) published the terms and conditions for a combined spectrum auction in the 800 MHz, 1800 MHz and 2.6 GHz bands. This auction will beheld during the second half of 2012. At the end of 2011, in Slovakia, the regulator set the guidelines for initiating an allocation of frequencies in the 800 MHz, 1800 MHz and 2.6 GHz bands in the first quarter of 2012. In Ireland, the regulator continued to hold public consultations on a future spectrum auction expected to take place in 2012. Because of delays in the auction, Telefónica Ireland was given a provisionallicense in the 900 MHz band until 2013. The national regulators also continued to adopt measures aimed at reducing mobile termination rates (MTRs). In the United Kingdom, in March 2011, regulator OFCOM adopted a decision to
F-149

reduce termination rates. Both Vodafone and Everything Everywhere appealed this decision before the Competition Appeals Tribunal (CAT), with the support of Telefónica UK. In the resolution to this appeal, the CAT agreed to bring forward the date of application of the rates for the year included in the OFCOM resolution (2015) to 2014, as it deemed this would helpcompetition and, ultimately, consumers. In Germany, the regulator adopted a decision in February 2011, with retroactive effects from December 1, 2010, cutting MTRs. The MTRs will remain effective until November 30, 2012. The Germanregulator also launched a consultation implementing a more stringent cost model, which is expected to be applied when the next MTRs are established. In Slovakia, in May 2011, the regulator decided not to extend the asymmetric application of MTRs to Telefónica Slovakia. In the Czech Republic, the regulator, CTO, reduced MTRs in two steps. From July 1, 2011, the price is 1.08 Czech crown per minute. In Ireland, MTRs are established based on the average price of MTRs published by the BEREC. In Latin America, in February 2011, the fine levied by the anti-trust authorities of Argentina imposed on Telefónica for late filing of notification of the concentration move related to the newcomposition of the company controlling Telecom Argentina was reduced to 50 million Argentine pesos (from 104.7 million Argentine pesos initially, equivalent to approximately 19 million euros). In Brazil, in June 2011, the country’s President approved the new general targets for universal service plan (PGMU) applicable for 2011 to 2015. The PGMU lowers the targets for public telephone itslarge cities and sets out the installation of public telephones in remote and inaccessible areas. Along with approval of the PGMU, Telefónica signed a revised CFTS contract, valid between 2011 and2015. The principal change relates to the end of restrictions on cable TV concessionaires, enabling Telefónica to exercise its option to acquire full control of TVA (the Abril group’s cable TV company). Meanwhile, Telefónica Brasil signed a memorandum of understanding with the Communications Ministry to participate in the national broadband plan. With this document, Telefónica undertakes tooffer 1 MB private broadband plans at a maximum price of 35 Brazilian reais and to gradually service all cities of São Paulo until 2014. In June, Vivo signed the terms of operation of band H (1.8 GHz) spectrum, which it was awarded in the 2010 tender. In October 2011, Anatel approved the fixed-mobile rate adjustment regulation, which entails a gradual reduction of these rates by applying a CPI- factor. This reduction factor is 18% in 2012, 12% in2013 and 10% in 2014. The absolute decrease in public rates must be passed on to mobile interconnection prices (VU-M). In Peru, on December 28, 2011, Osiptel set the cap on local calls from fixed telephones of Telefónica del Perú, S.A.A. customers to mobile telephony networks, for both personal and trunkcommunications. This new rate, in place since last December 30, came alongside a new rate scheme, which grants fixed telephony operators control over the rates for fixed-to-mobile calls. In Chile, in line with the rate-setting procedure for the 5-year period from 2009 to 2014, the country’s ministry adopted a series of measures, including rates on local calls, access and minor localtelephony service. In addition, rates were regulated for unbundled wholesale broadband
F-150

(Bitstream). For mobile rates, a cap was placed on access fees for network usage, while the time structure was also modified. A new rate-setting process will begin at the end of 2012. On July 16, 2011, a new net neutrality law in Chile came into effect. Long-distance service was eliminated in some regions of the country between October and November. Around the beginning of2014, it will be eliminated throughout the country. Subtel called for bids in a public tender to allocate public fixed and/or mobile data transmission service in the 2.505 - 2.565 MHz and 2.625 - 2.685 MHz frequency bands. Bids will be received andopened on April 19, 2012. In Mexico, through 2011, the Federal Telecommunications Commission (“Cofetel”), in a plenary meeting, issued a number of resolutions over interconnection disputes lodged by various operators.Among these, it set a mobile telephone call termination rate in Telefónica México’s mobile network and for other operators of 0.3912 Mexican pesos per minute of interconnection, measured by secondand without rounding. Telefónica México has filed an administrative appeal to Cofetel’s resolutions, although to date they have not been resolved. In May 2011, the Supreme Court ruled that Cofetel’s resolutions regarding interconnection should not be suspended without effect as it was an issue on public interest. On October 27, 2011, the CFC declared all mobile operators (except Nextel) in the switched termination services market to be dominant operators. Appeals were filed against these resolutions onDecember 13 and 16. In Venezuela, CONATEL published a government order in February setting reference levels for setting interconnection prices for use of mobile telephone services based on long-run incremental costs with a breakdown of network components by CONATEL, which will only step in to set price where consensus is not reached in disputes among operators over interconnection prices during the periodspecified in the interconnection regulations. In Colombia, the Telecommunications Regulation Commission (CRT) set a scaled reduction in mobile access charges from April 2012 to 2015 for both usage and capacity and initiated an individualadministrative proceeding against COMCEL (América Móviles group) as the dominant operator. In May 2011, it designed a new protection scheme for convergent users. In August, it established a newinterconnection regime for converging networks, laying down the general terms for network access for content and application providers. In December, it established the terms for providing content andapplication services on mobile networks, setting new government rules on numbering and mobile internet quality. It approved maximum regulated SMS rates among mobile operators from January 1,2012 to December 31, 2014. It also issued the terms for net neutrality, allowing for product differentiation by customer usage profile and prohibiting arbitrary discrimination of traffic. In Ecuador, the July 2010 ruling that Claro (América Móviles group) was the dominant mobile operator in the relevant mobile/domestic mobile market pursuant to an application submitted by Telecsaand MoviStar was upheld. The National Communications Department established the requirement that Claro share the infrastructure; MoviStar and Claro entered into a sharing agreement that covers theinclusion of base stations. This agreement is still in force. In Guatemala, Congress unveiled a number of draft bills in 2011. Noteworthy of these regarding the renewal of frequency licenses is the proposed increase in license periods to 25 years from 15 years. In El Salvador, amendments (interconnection prices and maximum rates) were made in April to the Telecommunications Law to establish that the ANR will set base interconnection prices and rates forfixed and mobile telephony users based on a cost model recognized by the UIT. The approved amounts must be reviewed each year. In addition, the country migrated to a system in which fixed-to-mobile call rates are set by the fixed telephony operator, which only has to pay the
F-151

mobile operator an interconnection fee. The outcome of the first cost review by ANR was notified to operators in July 2011. In July 2012, the ANR must disclose the results of the approved fees andrates review. In Panama, the National Public Services Regulator (ASEP) brought forward the deadline for portability to November 29, 2011 from the initial estimate of March 2012, declaring portability applicablefirst to mobile operators and then to fixed operators. In Costa Rica, on January 7, 2011 the regulator (SUTEL) awarded Telefónica with one of the three licenses applied for, subject to the technical, financial and legal requirements laid down in the biddingdocuments. In May 2011, Telefónica and the Costa Rican government entered into an agreement for the use and operation of radioelectric spectrum to provide mobile telecommunications services for aperiod of 15 years. Telefónica began operations in November 2011. Main concessions and licenses held by the Telefónica Group Spain In accordance with the European Union regulatory framework, companies wishing to operate a telecommunications network or provide electronic communication services must notify the Spanishtelecommunications market regulator (Comisión del Mercado de Telecomunicaciones, CMT) prior to commencing such activities. Every three years, operators must notify the CMT of their intention tocontinue these activities. Concessions for the use of spectrum are auctioned through a competitive, non-discriminatory procedure. Telefónica Móviles España holds rights to provide mobile services in certain spectrum bands.The main concessions are as follows:
UK Telefónica UK has provided GSM services since July 1994. In January 2011, this license was modified to enable the UMTS roll-out on the 900 MHz (2 x 17.4 MHz) and 1800MHz (2 x 5.8 MHz) frequency bands. This license is for an indefinite period. In April 2000, Telefónica UK obtained a UMTS license expiring on December 13, 2021 (2 x 10 MHz + 5 MHz). Telefónica UK may apply forindefinite validity for this license. To be eligible, it must agree to provide coverage to 90% of the population.
Technology Duration End date Renewal period
800 MHz 19 years December 31, 2030 --
900 MHz (Pp. technological neutrality) 19 years December 31, 2030 ---
DCS-1800 (Pp. technological neutrality) 19 years December 31, 2030 ----
UMTS 20 years (+ 5 extension) April 18, 2020 (+ April 5-18, 2025) 5 years
2.6 GHz 19 years December 31, 2030 ------
F-152

Germany Telefónica O2 Germany obtained a GSM license for the 1800 MHz frequency band in October 1998, as well as a separate license for the 900 MHz band in February 2007 (GSM900 2 x 5 MHz and GSM1800: 2 x 17.4 MHz). The GSM licenses expire on December 31, 2016. These licenses are for a set period of time, although they may be renewed. The German regulator launched a public consultation to identify demand for spectrum in the 900 MHz and 1800 MHz frequencies from 2017. A decision in this respect is expected for 2013. On October 21, 2011, amid the process for refarming, the regulator adopted the decision not to redistribute spectrum in the 900 MHz frequency, allowing Telefónica Germany to keep the spectrum allotted to it. In August 2000, Telefónica Germany obtained a UMTS license expiring on December 31, 2020 (2 x 9.9 MHz). In May 2010, after a spectrum auction procedure, Telefónica Germany acquired 10 MHz in the 800 MHz band (Digital Dividend), 20 MHz in the 2.6 GHz band (paired), 10 MHz in the 2.6 GHz band(unpaired), 5 MHz in the 2.0 GHz band (paired), and 20 MHz in the 2.0 GHz band (unpaired). These licenses expire in 2025. The assigned frequencies may be used for any technology. Czech Republic Telefónica Czech Republic provides electronic mobile communications services in the 900 MHz and 1800 MHz bands, under the GSM standard, in accordance with CTO licenses valid until February 7,2016; in the 2100 MHz band under the UMTS standard, valid until January 1, 2022; and in the 450 MHz band for CDMA 2000, valid until February 7, 2011. The Czech government has granted anindividual license to operate the CDMA network, which is valid under November 30, 2013. The amendment to the Electronic Communications Law, which took effect on January 1, 2012, grantsTelefónica Czech Republic (as the previous license holder) the right to obtain a new license in the same 450 MHz frequency without having to participate in a selection process. Slovakia On September 7, 2006, Telefónica Slovakia secured a license for supplying electronic communications services through the public network using the GSM and UMTS mobile network standards. Thelicense was granted for 20 years and expires in September 2026. Ireland Since March 1997, Telefónica Ireland has been providing GSM services under a license granted in May 1996. The GSM900 license is for a 15-year period (GSM900: 2 x 7.2 MHz). In May 2011, thecompany was provisionally granted a license to extend the validity of its license until January 2013). In 2000, the company obtained another GSM 1800 license (2 x 14.4 MHz), also for 15 years. InOctober 2002, the company secured a 20-year UMTS license (2 x 15 MHz + 5 MHz). Brazil In Brazil, concessions are awarded for providing services under the public system and authorizations are granted for providing private system services. The only service provided under both systems isthe Commuted Fixed Telephony Service (CFTS). All other services are provided under the private system. The main differences between the systems relate to the obligations which operators have to fulfil. Public services concessionaires, such as Telefónica Brasil, are required to expand the network (universalservice obligations) and ensure continuity in service undertakings. These obligations are not imposed on operators that provide services under the private system.
F-153

In the state of São Paulo, Telefónica Brasil provides local and long-distance CFTS under the public system. In the remaining states of Brazil, Telefónica Brasil provides local and long-distance CFTS, and broadband services, all under the private system. In 2005, Telefónica Brasil’s concession arrangements for local and long-distance services were extended for an additional 20-year period. Telefónica Brasil’s authorization for local and long-distance services under the private system was granted for an unlimited period of time. Telefónica Brasil also holds an authorization to provide broadband data services under the private system in the state of São Paulo for an unlimited period of time. Licenses for personal mobile services carry the right to provide mobile services for an unlimited period of time. However, the use of spectrum is restricted in accordance with the specific licenseconditions. All Telefónica’s Brazilian mobile operators are integrated under Vivo and hold the following licenses:
* Vivo Participações S.A. was incorporated by Vivo S.A. in 2011. License renewals for “A” and “B” bands must be requested 30 months in advance of the expiry date. Spectrum rights may be renewed only once, for a 15-year period. After this period, the license mustbe renegotiated. License renewals for the “E” band must be requested between 36 and 48 months in advance of the expiry date. Spectrum rights may be renewed only once, for a 15-year period. After this period, the license must be renegotiated.
• Vivo-Rio Grande do Sul (“A” band) until 2022 (renewed in 2006);
• Vivo-Rio de Janeiro (“A” band) until 2020 (renewed in 2005);
• Vivo-Espírito Santo (“A” band) until 2023 (renewed in 2008);
• Vivo-Bahia (“A” band) and Vivo-Sergipe (“A” band) until 2023 (renewed in 2008);
• Vivo-São Paulo (“A” band) until 2023 or 2024, for the cities of Ribeirão Preto and Guatapará (renewed in 2008);
• Vivo-Paraná/Santa Catarina (“B” band) until 2013;
• Vivo-Distrito Federal (“A” band) until 2021 (renewed in 2006);
• Vivo-Acre (“A” band), Vivo-Rondônia (“A” band), Vivo-Mato Grosso (“A” band) and Vivo-Mato Grosso do Sul (“A” band) until 2024 (renewed in 2008);
• Vivo-Goiás/Tocantins (“A” band) until 2023 (renewed in 2008);
• Vivo-Amazonas/Roraima/Amapá/Pará/Maranhão (“B” band) until 2013;
• Vivo Minas Gerais* (“A” band) until 2023 (renewed in 2007);
• Vivo for the cities in which CTBC Telecom operates in the state of Minas Gerais* (“E” band) until 2020;
F-154

In December 2007, ANATEL auctioned off nationally 15 blocks in the 1900 MHz band (“L” band). Vivo won 13 through Brasil, except in the northern region and the towns of Londrina and Tamaranain the state of Paraná. The spectrum licenses, along with the related renewal dates, are as follows:
License renewals for the “L” band must be requested between 36 and 48 months in advance of the expiry date. Spectrum rights may be renewed only once, for a 15-year period. After this period, the license must be renegotiated. In April 2008, ANATEL auctioned off 36 blocks 2100 MHz band (3G licenses). Vivo obtained nine in the “J” band through Brasil, enabling it to provide nationwide coverage in 3G. The spectrum licenses, along with the related renewal dates, are as follows:
• Vivo-Rio Grande do Sul (“L” band) until 2022 (renewed in 2006) or also to 2022 for cities in the Pelotas metropolitan area;
• Vivo-Rio de Janeiro (“L” band) until 2020 (renewed in 2005);
• Vivo-Espírito Santo (“L” band) until 2023 (renewed in 2008);
• Vivo-Bahia (“L” band) and Vivo-Sergipe (“L” band) until 2023 (renewed in 2008);
• Vivo-São Paulo (“L” band) until 2023, the cities of Ribeirão Preto, Guatapará and Bonfim Paulista (all renewed in 2008) until 2024, and the cities where CTBC Telecom operates in the state ofSão Paulo until 2022;
• Vivo-Paraná (excluding the cities of Londrina and Tamarana)/Santa Catarina (“L” band) until 2013;
• Vivo-Federal District (“L” band) until 2021 (renewed in 2006);
• Vivo-Acre (“L” band), Vivo-Rondônia (“L” band), Vivo-Mato Grosso (“L” band) and Vivo-Mato Grosso do Sul (“L” band) until 2024 (renewed in 2008) and the city of Paranaíba de Mato Grosso do Sul until 2022;
• Vivo-Goiás/Tocantins (“L” band) until 2023 (renewed in 2008) and the cities where CTBC Telecom operates in the state of Goiás until 2022; and
• Vivo-Alagoas/Ceará/Paraíba/Piauí/Pernambuco/Rio Grande do Norte (“L” band) until 2022;
• Vivo-Rio Grande do Sul (including cities in the Pelotas metropolitan area) (“J” band) until 2023;
• Vivo-Rio de Janeiro (“J” band) until 2023;
• Vivo-Espírito Santo (“J” band) until 2023;
• Vivo-Bahia (“J” band) and Vivo-Sergipe (“J” band) until 2023;
• Vivo-São Paulo (including the cities of Ribeirão Preto, Guatapará and Bonfim Paulista and the cities where CTBC Telecom operates in the state of São Paulo) (“J” band) until 2023;
F-155

* Vivo Participações S.A. was incorporated by Vivo S.A. in 2011. License renewals for the “J” band must be requested between 36 and 48 months in advance of the expiry date. Spectrum rights may be renewed only once, for a 15-year period. After this period, the license must be renegotiated. In December 2010, ANATEL auctioned off 169 licenses in the 900 MHz, 1800 MHz and 2100 MHz frequencies. Vivo secured 23 blocks, 14 in 1800 MHz frequency band “D”, “E”, “M” and extension bands, and 9 in the 900 MHz extension bands, giving it nationwide coverage in the 1800 MHz frequency band. The spectrum licenses are up for renewal in 2023.
• Vivo-Paraná (including the cities of Londrina and Tamarana)/Santa Catarina (“J” band) until 2023;
• Vivo-Federal District (“J” band) until 2023;
• Vivo-Acre (“J” band), Vivo-Rondônia (“J” band), Vivo-Mato Grosso (“J” band) and Vivo-Mato Grosso do Sul (including the city of Paranaíba) (“J” band) until 2023;
• Vivo-Goiás (including the cities where CTBC Telecom operates in the state of Goiás)/Tocantins (“J” band) until 2023;
• Vivo-Alagoas/Ceará/Paraíba/Piauí/Pernambuco/Rio Grande do Norte (“J” band) until 2023;
• Vivo-Amazonas/Roraima/Amapá/Pará/Maranhão (“J” band) until 2023; and
• Vivo-Minas Gerais (including the cities where CTBC Telecom operates in the state of Minas Gerais) (“J” band) until 2023
• "M" Band (1800 MHz) in the Federal District and the states of Paraná, Santa Catarina, Rio Grande do Sul, Goiás, Tocantins, Mato Grosso do Sul, Mato Grosso, Rondônia and Acre;
• Extension of the 1800 MHz band throughout the State of São Paulo;
• “D" Band (1800 MHz) in the cities of Pelotas, Morro Redondo, Capão do Leão and Turuçu in the state of Rio Grande do Sul;
• "E" Band (1800 MHz) in the states of Alagoas, Ceará, Paraíba, Piauí, Pernambuco and Rio Grande do Norte;
• Extension of the 900 MHz band in the State of Rio de Janeiro;
• Extension of the 900 MHz band in the State of Espírito Santo;
• Extension of the 900 MHz band in the States of Goiás, Tocantins, Mato Grosso do Sul, Mato Grosso, Rondônia and Acre and the Federal District, with the exception of the cities of Paranaíba inthe state of Mato Grosso do Sul and the cities of Buriti Alegre, Cachoeira Dourada, Inaciolândia, Itumbiara, Paranaiguara and São Simão, in the state of Goiás;
• Extension of the 900 MHz band in the State of Rio Grande do Sul, with the exception of the cities of Pelotas, Morro Redondo, Capão do Leão and Turuçu;
F-156

It is also worth highlighting that Vivo has a MCS –multimedia communication services- license allowing it to provide nationwide service for an unlimited period of time. Along with approval of the PGMU, Telefónica signed a revised CFTS contract, valid between 2011 and 2015 after which the terms must be revised again. The principal change relates to the end ofrestrictions on cable TV concessionaires, enabling Telefónica to exercise its option to acquire full control of TVA (the Abril group’s cable TV company).
• Extension of the 900 MHz band in the cities of registry area number 43 in the state of Paraná with the exception of the cities of Londrina and Tamarana;
• Extension of the 900 MHz band in the States of Paraná and Santa Catarina with the exception of the cities of registry area number 43 in the state of Paraná and the cities of Londrina andTamarana;
• Extension of the 900 MHz band in the state of Bahía;
• Extension of the 900 MHz band in the state of Sergipe;
• Extension of the 900 MHz band in the states of Amazonas, Amapá, Maranhão Pará and Roraima;
• Extension of the 1800 MHz band in the state of São Paulo, with the exception of the cities in the metropolitan area of São Paulo and the cities where CTBC Telecom operates in the state of SãoPaulo;
• Extension of the 1800 MHz band in the States of Amazonas, Amapá, Maranhão Pará and Roraima;
• Extension of the 1800 MHz band in the city of Paranaíba in the state of Mato Grosso do Sul;
• Extension of the 1800 MHz band in the cities of Buriti Alegre, Cachoeira Dourada, Inaciolândia, Itumbiara, Paranaiguara and São Simão, in the state of Goiás;
• Another extension of the 1800 MHz band in the cities of Buriti Alegre, Cachoeira Dourada, Inaciolândia, Itumbiara, Paranaiguara and São Simão, in the state of Goiás;
• Extension of the 1800 MHz band in the states of Rio do Janeiro, Espírito Santo, Bahía and Sergipe;
• Extension of the 1800 MHz band in the states of Amazonas, Amapá, Maranhão Pará and Roraima;
• Extension of the 1800 MHz band in the states of Alagoas, Ceará, Paraíba, Piauí, Pernambuco and Rio Grande do Norte;
• Extension of the 1800 MHz band in the city of Paranaíba in the state of Mato Grosso do Sul, and the cities of Buriti Alegre, Cachoeira Dourada, Inaciolândia, Itumbiara, Paranaiguara and SãoSimão, in the state of Goiás;
• Extension of the 1800 MHz band in the cities of Londrina and Tamarana in the state of Paraná;
F-157

Mexico Authorizations to provide mobile telephone services in Mexico (mobile and personal communications services, PCS, in the 800 MHz and 1900 MHz bands, respectively) are granted throughconcessions. Telefónica Móviles México and its subsidiaries and investees hold 40 licenses for providing telecommunications services. Concessions in the “A” band (800 MHz) mobile telephone services were initially granted in 1990 and were renewed in May 2010 for a 15-year period. In addition, at the same time a concession wasgranted for the installation, operation and development of a public telecommunications network for the same length as the aforementioned concessions. The subsidiary Pegaso Comunicaciones y Sistemas, S.A. de C.V. holds a concession for providing public telecommunications services, granted in 1998, and nine licenses for providing personalcommunications services (PCS) in the 1900 MHz band, until 2018. These licenses are renewable for an additional 20-year period. Renewal has been requested for all licenses. In April 2005, Telefónica México obtained four additional licenses in the same 1900 MHz band, for providing personal communications services (PCS) for a 20-year period, with possible renewal for an additional 20-year period. In addition, new concessions were awarded during 2010: eight spectrum concessions in the 1900 MHz band for providing personal communications services (PCS) and for a greater bandwidth in regions1,2,3,4,5,6,7 and 9, for a period of 20 years; and six new concessions in band 1.7 – 2.1 GHz to provide AWS services in regions 2,3,4,5,6,7 and 9, for a period of 20 years. On January 6, 2011, the Communications and Transport Department (“SCT”) granted Grupo de Telecomunicaciones Mexicanas, S.A. de C.V. (“GTM”) a concession to install, operate and exploit apublic telecommunication network to provide restricted TV and data transmission via satellite throughout the country. Also in 2011, GTM initiated procedures to obtain a concession for the rights tobroadcast and receive signals of frequency bands linked to foreign satellite systems that cover or may provide services throughout Mexico for the purposes of providing satellite internet. The authorityhas yet to issue a ruling. However, on December 20, 2011, GTM received a favorable opinion by the Federal Competition Commission (“CFC”), which is required before the concession can be granted. Venezuela Telefónica Venezolana, C.A. holds a mobile telephone concession for operating and offering mobile services in the 800 MHz band, with national coverage. This concession was granted in 1991 andexpires on May 31, 2011. The concession is renewable for up to 20 years, at the discretion of CONATEL. In line with prevailing legislation, Telefónica Venezolana, C.A. submitted the application forrenewal of the general 806-890 MHz and 890 to 902 concession (related to the provision of subscription TV services, radiodetermination –PTT-, wireless telephony and data access network), toCONATEL, 90 days before their expiry. On May 31, 2011, CONATEL renewed these licenses for another 11 years. Pursuant to these renewals, the new expiry of the concessions is November 28, 2022. Telefónica Venezolana, C.A. also holds a private network services concession granted in 1993 and renewed in 2007, until December 15, 2025. This concession allows Telefónica Venezolana, C.A. toprovide private point-to-point and point-to-multipoint telecommunications services for companies.
F-158

In 2001, Telefónica Venezolana, C.A. secured a concession for offering nationwide wireless fixed access services using wireless technology in the subscriber loop until August 24, 2026. In 2000, Telefónica Venezolana, C.A. received a general authorization for offering local, national long-distance and international long-distance telephony services and for operating telecommunications networks, for a 25-year period to December 15, 2025. In 2007, the remaining services provided by Telefónica Venezolana, C.A. were incorporated into this license, namely mobile, private networks,Internet access and transport services. On the same date, the company secured a concession for operating in the 1900 MHz band for a 15-year period until November 2022, renewable for a 10-year period. Via administrative order PADS-GST-00120, of March 31, 2011, the regulator granted Telefónica Venezolana, C.A. the Land Mobile Radio (for "Push to Talk" service) license, enabling it providenationwide service in the assigned mobile telephony bands. The license expires on December 15, 2025, i.e. the same expiration date as its general HGT-001 license covering all the specific telecommunications services it can provide. Sistemas Timetrac, C.A. initially began operating under the 10-year concession No. SRMT-C-001 granted on July 30, 1996. While this concession expired on July 30, 2006, it was not until March 10,2008 that CONATEL converted the licenses, granting the general HGTS-01268 license, which includes radiodetermination and telecommunications network creation and operation. The regulator setexpressly the expiration of this license at September 23, 2010. On May 21, 2010, procedures were initiated to renew the license and, according to a statement issued by the regulator, definitive renewalwill be given once the technical rule containing the allocation of frequency bands (CUNABAF) is published. Chile Telefónica Chile holds the following telecommunications services licenses:
• Local public telephony services. Telefónica Chile holds a renewable license for local telephony services in all regions of Chile, for a 50-year period. This license was awarded in 1982, except for the X and XI regions, which were incorporated into the license in 1995. In addition, Telefónica Chile holds other nationwide renewable licenses for local telephone services, exclusivelytargeting rural areas. It also holds a renewable nationwide license for public data transmission services for a period of 30 years from July 1995 and another four renewable licenses for publicdata transmission services for a period of 30 years from June 2008. Telefónica Chile also has a renewable nationwide license for public VOIP services, for a period of 30 years from August2010.
• Long distance licenses. Through its subsidiary Telefónica Larga Distancia, Telefónica Chile holds renewable licenses for a 30-year period as from November 1989, to install and operate a national fiber optics network, a national base station network and other transmission equipment, and to provide national and international long-distance services, including voice, data and image transmission throughout Chile. In addition, the company holds renewable nationwide public data transmission services licenses for a 30-year period as from June 1993. Telefónica also holdsindefinite licenses for providing national and international long-distance services through central switches and nationwide cable and fiber optic networks.
• Public data transmission services. Since March 1987, Telefónica Empresas holds a license for an indefinite period for providing public nationwide data transmission services.
F-159

Argentina Telefónica de Argentina holds licenses, all of which have been granted for an unlimited period, allowing it to provide fixed telephony services, international telecommunications services, local servicesin the northern and southern regions; long-distance, international telecommunications services and data transmission in the northern region; and Internet and international data transmission accessservices. Telefónica Móviles de Argentina’s licenses for providing mobile services include PCS licenses and the corresponding authorizations for using spectrum in different regions, as well as licenses for trunkservices or closed groups of users, in different cities. These licenses do not expire, although they may be cancelled by SECOM in the event of failure to comply with the license terms. Colombia In March 1994, the company was awarded concessions for providing mobile services in the eastern region, along the Caribbean coast and in the western region, for a 10-year period, renewed for another 10 years to March 2014. Prior to that year, Telefónica Móviles Colombia may waive the concessions, renew the spectrum use permit for a 10-year period, and subsequently negotiate an extension. IfTelefónica Móviles Colombia continues to hold its current concessions until 2014, in that year it must seek registration as a telecommunications operator and request permission to use spectrum. In addition, Telefónica Móviles Colombia holds nationwide carrier service concessions granted in June 1998 and November 1998 (initially for 10 years, renewed for an additional 10 years). In 2008,these concessions were rolled over into a convergent permit to provide carrier services for an additional 10 years (which may be extended for a further 10 years). As in the preceding case, TelefónicaMóviles Colombia may waive these licenses and seek registration as an operator under the general authorization system set out by law.
• Public mobile telephony services. Since November 1989, Telefónica Móviles Chile has held licenses for an indefinite period for providing public mobile telephone services throughout Chile in the 800 MHz band. In addition, the company holds three licenses for providing nationwide mobile telecommunications services in the 1900 MHz band. These concessions may be renewed forsuccessive 30-year periods from November 2002, at the request of the license holder.
• Limited television license. Telefónica Multimedia holds a license to establish, operate and use part of the 2.6 GHz band spectrum in Santiago de Chile for intermediate telecommunicationsservices, authorizing the frequencies used for communicating voice, data and images, for a thirty-year period as from May 2008. The company also has a limited license to provide televisionservices in the 2.6 GHz band. Since December 2005, the company holds a 10-year renewable license for providing limited satellite television services. In addition, since January 2006, it has alimited license for providing nationwide television services in the largest cities, except in region III, in Telefónica Chile’s VDSL broadband network, for an indefinite period. Furthermore, in March 2007 the company was awarded a limited license for providing television services through the VDSL broadband network in the Santiago de Chile metropolitan area, for an indefiniteperiod.
F-160

In 2011, Telefónica Móviles obtained a license via Resolution 2105 of 2011 to operate 15 MHz spectrum in the 1900 frequency band after participating in an auction held by the ICT Ministry. The ICTMinistry requested applicants to send, by January 6, 2012, statements of interest in acquiring spectrum in the 1.7, 2.1 and 2.5 GHz bands in order to verify plurality in participating in the allocationprocess. With respect to fixed telephone services, the law establishes an indefinite permit for all operators to operate as local exchange carriers, nationwide. Colombia Telecomunicaciones registered inNovember 8, 2011, enabling it to provide all telecommunications networks and services; e.g. long-distance carrier services, value-added services, domestic carrier services and mobile services. Peru Telefónica del Perú, S.A. provides nationwide fixed telecommunications services under two concessions granted on May 16, 1994 by the Transport and Communications Ministry. The concessions wereinitially for 20 years, with partial renewal for additional five-year periods up to a maximum of 20 years. To date, three partial renewals extending the concession to November 27, 2027 have beenapproved. Telefónica Móviles Peru has four mobile services concessions, each for 20-year periods renewable for equal periods. Although the concession periods for providing mobile service in Lima and Callaohave expired, they remain valid by law until the renewals are processed. It also holds three 20-year concessions to provide domestic and international long-distance carrier services expiring between 2019 and 2022, three 20-year concessions to provide fixed mobile telephone services expiring between 2019 and 2028 and three concessions for local carrier services expiring between 2016 and 2022. Ecuador Otecel renewed the mobile telephony services concession under which it provides advanced mobile services, including 3G services. The concession expires in November 2023 and may be renewed foran additional 15-year period. In addition, Otecel holds a fixed and mobile carrier services concession expiring in 2017. This concession may be renewed for an additional 15-year period. The different licenses for providing added-value mobile services and Internet access services expire in 2011. This license has been renewed until June 2, 2021 and may be extended for another 10 years.
F-161

Other countries in Latin America
Country
License/Concession
Type of services Spectrum Band Expiry
Costa Rica Concession Telecommunication services (7) 10.6 MHz/850 MHz30 MHz/1800 MHz 20 MHz/2100 MHz
2026 (8)
El Salvador Concession Telecommunication services (1) 25 MHz/800 MHz Band B 2018(2)
Concession Telecommunication services (1) 30 MHz/1900 MHz Band C 2021
Guatemala Concession Telecommunication services (1) 80 MHz/1900 MHz Bands B, C, E and F 2014(3)
Concession Telecommunication services (1) 2014(3)
Concession Telecommunication services (1) 2014(3)
Nicaragua Concession Mobile telecommunication services 25 MHz/800 MHz Band A 2023(4)
Concession Mobile telecommunication services Additional spectrum 60 MHz /1900 Bands B, D, E and F 2023(4)
Panama Concession GSM/UMTS 25 MHz /80010MHz/1900 MHz
Band ABand F
2016(5)
Uruguay License Mobile telephony 25 MHz/800 MHz 2022-2024(6)
(1) In accordance with the Telecommunications Law all of these concessions were granted to provide any type of telecommunication services.
(2) Concessions for the use of spectrum are granted for a period of 20 years and may be renewed for additional 20 year periods once the procedures established by the Telecommunications Law are fulfilled.
(3) These concessions are granted for a period of 15 years and may be renewed for successive 15 year periods at the holder’s request. In order to renew a concession the holder must prove to the regulatory agency that the spectrum has actually been used during the prior 15-year period. These concessions expire in 2014.
(4) Telefonía Celular de Nicaragua, S.A. ("TCN") obtained a concession in 1992 for a period of 10 years to use the 25 MHz spectrum in band A of 800 MHz in order to provide mobile telecommunication services. This concession was renewed for a period of 10 years from August 2013 until July 2023. The regulatory agency awarded TCN additional spectrum of 65 MHz in bands B, D, E and F of 1900. The concession may be renewed for an additional 10-year periods via negotiation with TELCOR two years in advance of the expiry of the current concession, subject to compliance by the operator with certain conditions.
(5) The concession is valid for 20 years and expires in 2016. It is renewable for an additional period in accordance with the concession contract. The Government of Panama granted the right to use 10MHz (5+5) in the 1900 MHz until 2016, which can be renewed for a further period.
(6) The expiry date depends upon the spectrum awarded: 800 MHz band (12.5 MHz + 12.5 MHz) – 20 years from July 2004; 1900 MHz band (5 MHz + 5 MHz) – 20 years from December 2002; and 1900 MHz band (5 MHz + 5 MHz) – 20 years from July 2004.
(7) Except for traditional basic telephone services through copper networks.
(8) The concession may be renewed for a period that added to the initial period and previous renewals does not exceed 25 years from the start date.
F-162

Exhibit 12.1
CERTIFICATIONS I, César Alierta Izuel, certify that:
1. I have reviewed this annual report on Form 20-F of Telefónica, S.A.;
2. Based on my knowledge, this report does not contain any untrue statement of a material fact or omit to state a material fact necessary to make the statements made, in light of the circumstances under which such statements were made, not misleading with respect to the period covered by this report;
3. Based on my knowledge, the financial statements, and other financial information included in this report, fairly present in all material respects the financial condition, results of operations and cash flows of the company as of, and for, the periods presented in this report;
4. The company’s other certifying officers and I are responsible for establishing and maintaining disclosure controls and procedures (as defined in Exchange Act Rules 13a-15(e) and 15d-15(e)) and internal control over financial reporting (as defined in Exchange Act Rules 13a-15(f) and 15d-15(f)) for the company and have:
a. Designed such disclosure controls and procedures, or caused such disclosure controls and procedures to be designed under our supervision, to ensure that material information relating to the company, including its consolidated subsidiaries, is made known to us by others within those entities, particularly during the period in which this report is being prepared;
b. Designed such internal control over financial reporting, or caused such internal control over financial reporting to be designed under our supervision, to provide reasonable assurance regarding the reliability of financial reporting and the preparation of financial statements for external purposes in accordance with generally accepted accounting principles;
c. Evaluated the effectiveness of the company’s disclosure controls and procedures and presented in this report our conclusions about the effectiveness of the disclosure controls and procedures, as of the end of the period covered by this report based on such evaluation; and
d. Disclosed in this report any change in the company’s internal control over financial reporting that occurred during the period covered by the annual report that has materially affected, or is reasonably likely to materially affect, the company’s internal control over financial reporting; and
5. The company’s other certifying officers and I have disclosed, based on our most recent evaluation of internal control over financial reporting, to the company’s auditors and the audit committee of the company’s board of directors (or persons performing the equivalent functions):
a. All significant deficiencies and material weaknesses in the design or operation of internal control over financial reporting which are reasonably likely to adversely affect the company’s ability to record, process, summarize and report financial information; and
b. Any fraud, whether or not material, that involves management or other employees who have a significant role in the company’s internal control over financial reporting.
Date: March 29, 2012 /s/ César Alierta Izuel Name: César Alierta Izuel Title: Chairman and Chief Executive Officer

Exhibit 12.2
CERTIFICATIONS I, Miguel Escrig Meliá, certify that:
1. I have reviewed this annual report on Form 20-F of Telefónica, S.A.;
2. Based on my knowledge, this report does not contain any untrue statement of a material fact or omit to state a material fact necessary to make the statements made, in light of the circumstances under which such statements were made, not misleading with respect to the period covered by this report;
3. Based on my knowledge, the financial statements, and other financial information included in this report, fairly present in all material respects the financial condition, results of operations and cash flows of the company as of, and for, the periods presented in this report;
4. The company’s other certifying officers and I are responsible for establishing and maintaining disclosure controls and procedures (as defined in Exchange Act Rules 13a-15(e) and 15d-15(e)) and internal control over financial reporting (as defined in Exchange Act Rules 13a-15(f) and 15d-15(f)) for the company and have:
a. Designed such disclosure controls and procedures, or caused such disclosure controls and procedures to be designed under our supervision, to ensure that material information relating to the company, including its consolidated subsidiaries, is made known to us by others within those entities, particularly during the period in which this report is being prepared;
b. Designed such internal control over financial reporting, or caused such internal control over financial reporting to be designed under our supervision, to provide reasonable assurance regarding the reliability of financial reporting and the preparation of financial statements for external purposes in accordance with generally accepted accounting principles;
c. Evaluated the effectiveness of the company’s disclosure controls and procedures and presented in this report our conclusions about the effectiveness of the disclosure controls and procedures, as of the end of the period covered by this report based on such evaluation; and
d. Disclosed in this report any change in the company’s internal control over financial reporting that occurred during the period covered by the annual report that has materially affected, or is reasonably likely to materially affect, the company’s internal control over financial reporting; and
5. The company’s other certifying officers and I have disclosed, based on our most recent evaluation of internal control over financial reporting, to the company’s auditors and the audit committee of the company’s board of directors (or persons performing the equivalent functions):
a. All significant deficiencies and material weaknesses in the design or operation of internal control over financial reporting which are reasonably likely to adversely affect the company’s ability to record, process, summarize and report financial information; and
b. Any fraud, whether or not material, that involves management or other employees who have a significant role in the company’s internal control over financial reporting.
Date: March 29, 2012 /s/ Miguel Escrig Meliá Name: Miguel Escrig Meliá Title: Chief Financial Officer

Exhibit 13.1
CERTIFICATION PURSUANT TO 18 U.S.C. SECTION 1350, AS ADOPTED PURSUANT TO
SECTION 906 OF THE SARBANES OXLEY ACT OF 2002
The certification set forth below is being submitted in connection with the Annual Report on Form 20-F for the year ended December 31, 2011 (the “Annual Report”) for the purpose of complying with Rule 13a-14(b) or Rule 15d-14(b) of the Securities Exchange Act of 1934 (the “Exchange Act”) and Section 1350 of Chapter 63 of Title 18 of the United States Code.
César Alierta Izuel, Chairman and Chief Executive Officer, and Miguel Escrig Meliá, Chief Financial Officer, of Telefónica, S.A., each certifies that, to the best of his knowledge:
Date: March 29, 2012
1. the Annual Report fully complies with the requirements of Section 13(a) or 15(d) of the Exchange Act; and
2. the information contained in the Annual Report fairly presents, in all material respects, the financial condition and results of operations of Telefónica, S.A.
/s/ César Alierta Izuel
Name: César Alierta Izuel Title: Chairman and Chief Executive Officer
/s/ Miguel Escrig Meliá
Name: Miguel Escrig Meliá Title: Chief Financial Officer