COMPAÑÍA PESQUERA CAMANCHACA S.A. AND ...
93
COMPAÑÍA PESQUERA CAMANCHACA S.A. AND SUBSIDIARIES Consolidated financial statements As of December 31, 2019 CONTENTS Consolidated statements of financial position Consolidated statements of changes in equity Consolidated statements of net income by function Consolidated statements of comprehensive income Consolidated statements of direct cash flow Notes to the consolidated financial statements ThUS$ - Thousands of US dollars UF - Unidades de fomento (a Chilean peso based inflation linked currency unit) ThCh$ - Thousands of Chilean pesos
-
Upload
khangminh22 -
Category
Documents
-
view
5 -
download
0
Transcript of COMPAÑÍA PESQUERA CAMANCHACA S.A. AND ...

COMPAÑÍA PESQUERA CAMANCHACA S.A. AND SUBSIDIARIES
Consolidated financial statements
As of December 31, 2019
CONTENTS
Consolidated statements of financial position Consolidated statements of changes in equity Consolidated statements of net income by function Consolidated statements of comprehensive income Consolidated statements of direct cash flow Notes to the consolidated financial statements
ThUS$ - Thousands of US dollars UF - Unidades de fomento (a Chilean peso based inflation linked currency unit)
ThCh$ - Thousands of Chilean pesos

EY Chile
Arturo Prat 199, Tower A Office 509, Floor 5, Concepción
Tel: +56 (41) 2467000
www.eychile.cl
Independent Auditors' Report
Dear Shareholders and Directors of Compañía Pesquera Camanchaca S.A.
We have audited the accompanying consolidated financial statements of Compañía Pesquera Camanchaca S.A. and subsidiaries, which comprise the consolidated statements of financial position as of December 31, 2019 and the related consolidated statements of comprehensive income, changes in equity, and cash flow for the year then ended, and the related notes to the consolidated financial statements.
Management's responsibility for the consolidated financial statements Management is responsible for the preparation and fair presentation of these consolidated financial statements in accordance with International Financial Reporting Standards. This responsibility includes the design, implementation and maintenance of relevant internal controls for the preparation and fair presentation of consolidated financial statements that are free from material misstatement, whether due to fraud or error.
Auditor’s responsibility
Our responsibility is to express an opinion on these consolidated financial statements based on our audit. We conducted our audit in accordance with generally accepted auditing standards in Chile. Those standards require that we plan and perform the audit to obtain reasonable assurance about whether the consolidated financial statements are free of material misstatement.
An audit involves performing procedures to obtain audit evidence about the amounts and disclosures in the consolidated financial statements. The procedures selected depend on the auditors’ judgment, including the assessment of the risks of material misstatement in the consolidated financial statements, whether due to fraud or error. In making those risk assessments, the auditor considers internal controls relevant for the preparation and fair presentation of the consolidated financial statements of the entity in order to design audit procedures that are appropriate in the circumstances, but not for the purpose of expressing an opinion on the effectiveness of the entity’s internal control. Accordingly, we do not express such an opinion. An audit also includes evaluating the accounting policies used and the reasonableness of significant accounting estimates made by management, as well as evaluating the overall presentation of the consolidated financial statements.

We believe that the audit evidence obtained is sufficient and appropriate to provide a basis for our audit opinion.
Opinion
In our opinion, the consolidated financial statements referred to above present fairly, in all material respects, the financial position of Compañía Pesquera Camanchaca S.A. and subsidiaries as of December 31, 2019 and the results of their operations and cash flows for the year then ended in accordance with International Financial Reporting Standards.
Other matters - Report of other auditors on the consolidated financial statements as of December 31, 2018
The consolidated financial statements of Compañía Pesquera Camanchaca S.A. and subsidiaries for the years ended December 31, 2018 and 2017 (the financial statements as of December 31, 2017 provided the basis for presenting the consolidated statement of financial position as of January 1, 2018), prior to the restatement adjustments described in Note 3, were audited by other auditors, who expressed an unqualified opinion thereon in their report dated March 26, 2019.
Restatement of the consolidated financial statements as at December 31, 2018 and January 1, 2018
As mentioned in Note 3 to the consolidated financial statements as of December 31, 2019, the Company changed its accounting policy for calculating the fair value of biological assets. This change involved restating the consolidated financial statements as at December 31, 2018 and the consolidated statement of financial position as at January 1, 2018.
We audited the restatement adjustments described in Note 3 that restated the 2018 consolidated financial statements, during our audit of the 2019 consolidated financial statements. In our opinion, these adjustments are appropriate and have been correctly applied. We were not engaged to audit, review or apply any procedures to the 2018 consolidated financial statements other than the restatement adjustments. Accordingly, we do not express an opinion or provide any other assurance regarding the 2018 consolidated financial statements taken as a whole. This matter does not change our opinion.
Concepción, March 18, 2020

CONTENTS
Consolidated statements of financial position Consolidated statements of changes in equity Consolidated statements of net income by function Consolidated statements of comprehensive income Consolidated statements of direct cash flow Notes to the consolidated financial statements
NOTE 1 - General information ................................................................................................. 2
NOTE 2 - Summary of significant accounting policies ............................................................. 3 2.1 Period covered .................................................................................................................................. 3
2.2 Basis of preparation ......................................................................................................................... 3
2.3 New pronouncements ......................................................................................................................4
2.4 Basis of consolidation.......................................................................................................................6
2.5 Segment reporting ........................................................................................................................... 8
2.6 Foreign currency transactions ........................................................................................................ 8
2.7 Property, plant and equipment........................................................................................................9
2.8 Biological assets .............................................................................................................................. 10
2.9 Intangible assets other than goodwill ........................................................................................... 11
2.10 Interest costs ................................................................................................................................... 12
2.11 Impairment losses on non-financial assets ................................................................................... 12
2.12 Financial assets and liabilities ....................................................................................................... 12
2.13 Derivative financial instruments and hedge activities ................................................................. 13
2.14 Inventories ...................................................................................................................................... 14
2.15 Statement of cash flow ................................................................................................................... 15
2.16 Classification of current and non-current balances ..................................................................... 15
2.17 Earnings per share.......................................................................................................................... 15
2.18 Trade and other receivables ........................................................................................................... 15
2.19 Cash and cash equivalents ............................................................................................................. 16
2.20 Share capital ................................................................................................................................... 16
2.21 Trade and other payables ............................................................................................................... 16
2.22 Income and deferred taxes ............................................................................................................. 16
2.23 Employee benefits .......................................................................................................................... 17
2.24 Provisions........................................................................................................................................ 18
2.25 Revenue recognition ....................................................................................................................... 18
2.26 Dividend policy ............................................................................................................................... 19
2.27 Distributable net income................................................................................................................ 19
2.28 Leases .............................................................................................................................................. 19
2.29 The environment ............................................................................................................................ 21
NOTE 3 - Changes in accounting policies and estimates ......................................................... 21
NOTE 4 - Financial risk management ..................................................................................... 27 4.1. Credit risk ....................................................................................................................................... 27
4.2. Liquidity risk ................................................................................................................................... 27

4.3. Market risk ..................................................................................................................................... 28
NOTE 5 - Financial instruments ............................................................................................. 29
NOTE 6 - Significant accounting estimates and judgments ..................................................... 30
NOTE 7 - Segment reporting .................................................................................................. 32
NOTE 8 - Cash and cash equivalents ...................................................................................... 35
NOTE 9 - Other current and non-current financial assets ........................................................ 36
NOTE 10 - Trade and other receivables .................................................................................. 36
NOTE 11 - Related party balances and transactions ................................................................ 37
NOTE 12 - Inventories ........................................................................................................... 39
NOTE 13 - Biological assets ................................................................................................... 40
NOTE 14 - Other current and non-current non-financial assets ............................................... 41
NOTE 15 - Equity method investments................................................................................... 42
NOTE 16 - Tax assets and rights receivable ............................................................................ 42
NOTE 17 - Intangible assets other than goodwill .................................................................... 43
NOTE 18 - Property, plant and equipment .............................................................................. 52
NOTE 19 - Income and deferred taxes .................................................................................... 55
NOTE 20 - Other current and non-current financial liabilities ................................................. 56
NOTE 21 - Operating lease liabilities ..................................................................................... 61
NOTE 22 - Trade and other payables ...................................................................................... 62
NOTE 23 - Other provisions ................................................................................................... 64
NOTE 24 - Current tax liabilities ............................................................................................ 64
NOTE 25 - Employee benefit provisions ................................................................................ 64
NOTE 26 - Equity .................................................................................................................. 65
NOTE 27 - Earnings per share ................................................................................................ 68
NOTE 28 - Operating revenue ................................................................................................ 68
NOTE 29 - Administrative expenses ....................................................................................... 68
NOTE 30 - Distribution costs ................................................................................................. 69
NOTE 31 - Financial costs ...................................................................................................... 69
NOTE 32 - Exchange differences ........................................................................................... 70
NOTE 33 - Other income (losses) ........................................................................................... 71
NOTE 34 - Assets and liabilities in foreign currencies ............................................................ 72
NOTE 35 - Guarantees and contingencies ............................................................................... 74
NOTE 36 - Sanctions .............................................................................................................. 80
NOTE 37 - The environment .................................................................................................. 81
NOTE 38 - Employee distribution .......................................................................................... 82
NOTE 39 - Subsequent events ................................................................................................ 82

COMPAÑÍA PESQUERA CAMANCHACA S.A. AND SUBSIDIARIES
CONSOLIDATED STATEMENT OF FINANCIAL POSITION AS OF DECEMBER 31, 2019, DECEMBER 31, 2018 (RESTATED) AND JANUARY 1, 2018
(RESTATED)
Assets
Note
As of December 31, 2019
ThUS$
As of December 31, 2018
Restated
ThUS$
As of January 1, 2018
Restated
ThUS$
Current assets
Cash and cash equivalents 8 41,873 30,748 10,205
Other financial assets, current 9 361 327 646
Other non-financial assets, current 14 15,798 19,301 17,256
Trade and other receivables, current 10 95,777 77,339 75,817
Related party receivables, current 11 116 92 176
Inventories 12 76,669 55,297 71,853
Biological assets, current 13 150,742 138,415 110,704
Tax assets, current 16 6,726 2,672 3,319
Total current assets 388,062 324,191 289,976
Non-current assets
Other financial assets, non-current 9 701 701 762
Other non-financial assets, non-current 14 17,149 18,869 21,010
Rights receivable, non-current 16 1,252 1,349 5,520
Related party receivables, non-current 11 2,208 2,314 2,544
Equity method investments 15 4,871 4,699 5,565
Intangible assets other than goodwill 17 50,313 50,313 50,894
Intangible assets 1,214 1,214 834
Property, plant and equipment 18 287,683 255.462 232,356
Deferred tax assets 19 29,202 24,645 26,331
Total non-current assets 394,593 359,566 345,816
Total assets 782,655 683,757 635,792
The accompanying notes 1 to 39 are an integral part of these consolidated financial statements.

COMPAÑÍA PESQUERA CAMANCHACA S.A. AND SUBSIDIARIES
CONSOLIDATED STATEMENT OF FINANCIAL POSITION AS OF DECEMBER 31, 2019, DECEMBER 31, 2018 (RESTATED) AND JANUARY 1, 2018
(RESTATED)
Liabilities
Note
As of December 31, 2019
ThUS
$
As of December 31, 2018 Restated
ThUS$
As of January 1,
2018 Restated
ThUS$
Current liabilities
Other financial liabilities, current 20 31,575 1,306 18,144
Operating lease liabilities, current 21 2,964 - -
Trade and other payables, current 22 100,953 99,823 106,420
Related party payables, current 11 375 784 1,441
Other provisions, current 23 7,129 7,459 561
Current tax liabilities 24 346 6,874 2,112
Employee benefit provisions, current 25 3,520 2,708 2,434
Total current liabilities 146,862 118,954 131,112
Non-current liabilities
Other financial liabilities, non-current 20 116,928 80,406 153,819
Operating lease liabilities, non-current 21 10,299 - -
Trade and other payables, non-current 671 302 728
Deferred tax liabilities 19 20,188 16,126 14,357
Employee benefit provisions, non-current 25 1,027 1,108 1,149
Total non-current liabilities 149,113 97,942 170,053
Equity
Subscribed and paid share capital 26 284,134 284,134 217,742
Share premium 26 - - 155,006
Retained earnings (losses) 26 35,210 20,728 (93,949)
Other reserves 26 50,527 50,784 7
Equity attributable to owners of the parent company 369,871 355,646 278,806
Non-controlling interests 26 116,809 111,215 55,821
Total equity 486,680 466,861 334,627 Total equity and liabilities 782,655 683,757 635,792
The accompanying notes 1 to 39 are an integral part of these consolidated financial statements.

COMPAÑÍA PESQUERA CAMANCHACA S.A. AND SUBSIDIARIES
CONSOLIDATED STATEMENTS OF CHANGES IN EQUITY FOR THE YEARS ENDED DECEMBER 31, 2019 AND 2018 (RESTATED)
Share capital
ThUS$
Share premium
ThUS$
Foreign currency translation reserve
ThUS$
Cash flow
hedge reserve
ThUS$
Other reserves
ThUS$
Total other
reserves
ThUS$
Retained earnings (losses)
ThUS$
Equity attributab
le to owners of the parent company
ThUS$
Non-controllin
g interests
ThUS$
Total equity
ThUS$
Opening balance as of January 1, 2019
Changes in equity
Dividends
Comprehensive income
Net income for the year
284,134 - (420) (32) 51,236 50,784 20,728
(6,138)
20,620
355,646
(6,138)
20,620
111,215
(6,644)
12,300
466,861
(12,782)
32,920
Other comprehensive income (319) 62 (257) (257) (62) (319)
Closing balance as of December 31, 2019 284,134 - (739) 30 51,236 50,527 35,210 369,871 116,809 486,680
Share capital
ThUS$
Share premium
ThUS$
Foreign currency translation reserve
ThUS$
Cash flow
hedge reserve ThUS$
Other reserves
ThUS$
Total other
reserves ThUS$
Retained earnings (losses)
ThUS$
Equity attributab
le to owners of
the parent
company ThUS$
Non-controllin
g interests
ThUS$
Total equity ThUS$
Opening balance aS of January 1, 2018
(restated) Capitalization of earnings
217,742 66,392
155,006
(155,006)
(1) 8 - 7 (93,949)
88,614
278,806
-
(9,974)
34,438
50,777
1,599
55,821
-
(4,279)
14,997
(100)
44,776
334,627
-
(14,253)
49,435
50,677
46,375
Changes in equity
Dividends (9,974)
Comprehensive income
Net income for the year 34,438
Other comprehensive income Increase (decrease) for changes in interest in subsidiaries that do not involve loss of control
(419) (40) 51,236 50,777
1,599
Closing balance as of December 31, 2018 (restated) 284,134 - (420) (32) 51,236 50,784 20,728 355,646 111,215 466,861
The accompanying notes 1 to 39 are an integral part of these consolidated financial statements.

COMPAÑÍA PESQUERA CAMANCHACA S.A. AND SUBSIDIARIES
CONSOLIDATED STATEMENT OF NET INCOME BY FUNCTION FOR THE YEARS ENDED DECEMBER 31, 2019 AND 2018 (RESTATED)
Note
For the years ended December 31,
2019 2018 Restated
ThUS$ ThUS$
Operating revenue 28 620,030 626,480
Cost of sales 12 (504,774) (491,766)
Gross margin 115,256 134,714
Net fair value adjustments to biological assets 13 311 2,327
Administrative expenses 29 (19,272) (31,230)
Distribution costs 30 (28,528) (28,550)
Financial costs 31 (8,081) (10,171)
Share of net income of equity method associates 1,654 1,650
Exchange differences 32 (3,074) (2,993)
Other income (losses) 33 (13,923) 1,722
Financial income 37 53
Net income before tax 44,380 67,522
Income tax expense 19 (11,460) (18,087)
Net income from continuing operations 32,920
49,435
Net income (loss) from discontinued operations - -
Net income for the year 32,920 49,435
Net income attributable to:
Owners of the parent company 20,620 34,438
Non-controlling interests 12,300 14,997
Net income for the year 32,920 49,435
Earnings per share:
Basic earnings per share (US$/share) 27 0.0050 0.0083
Earnings per share on discontinued operations (US$/share) 0.0000 0.0000
Basic earnings per share 0.0050 0.0083
The accompanying notes 1 to 39 are an integral part of these consolidated financial statements.

COMPAÑÍA PESQUERA CAMANCHACA S.A. AND SUBSIDIARIES
CONSOLIDATED STATEMENT OF COMPREHENSIVE INCOME FOR THE YEARS ENDED DECEMBER 31, 2019 AND 2018 (RESTATED)
For the years ended December 31
Restated 2019 2018
ThUS$ ThUS$
Net income for the year 32,920 49,435
Gain (loss) from cash flow hedge 62 (40)
Gain (loss) from foreign currency translation (381) (519)
Gain from change in ownership 51,236
Total comprehensive income 32,601 100,112
Total comprehensive income (loss) attributable to:
Owners of the parent company
Non-controlling interests
20,363
12,238
85,215
14,897
Total comprehensive income 32,601 100,112
The accompanying notes 1 to 39 are an integral part of these consolidated financial statements.

COMPAÑÍA PESQUERA CAMANCHACA S.A. AND SUBSIDIARIES
CONSOLIDATED STATEMENTS OF DIRECT CASH FLOW FOR THE YEARS ENDED DECEMBER 31, 2019 AND 2018
As of December 31, 2019
ThUS$
As of December 31, 2018
ThUS$
CASH FLOW FROM (USED BY) OPERATING ACTIVITIES
Receipts
Receipts from selling goods and providing services 643,035 675,767
Other receipts from operating activities
Payments
Payments to suppliers for goods and services (534,929) (522,116)
Payments to and on behalf of employees (71,820) (82,114)
Dividends received 1,203 2,077
Interest paid (5,171) (9,557)
Interest received 37 54
Income taxes refunded (paid) (5,866) (3,616)
Other receipts (payments) 682 93
Net cash flow from (used by) operating activities 27,171 60,588
CASH FLOW FROM (USED BY) FINANCING ACTIVITIES
Receipts from issuing shares - 100,975
Receipts from short-term loans 82,622 6,000
Loan repayments (16,026) (95,913)
Dividends paid (17,114) (1,006)
Net cash flow from (used by) financing activities 49,482 10,056
CASH FLOW FROM (USED BY) INVESTING ACTIVITIES
Receipts from sales of property, plant and equipment 1,640 533
Purchases of property, plant and equipment (65,672) (49,216)
Other receipts (payments) (339)
Net cash flow from (used by) investing activities (64,032) (49,022)
Net increase (decrease) in cash and cash equivalents,
before the effect of changes in exchange rates 12,621 21,622
Effect of exchange rate changes on cash and cash equivalents (1,496) (1,079)
NET INCREASE (DECREASE) IN CASH AND CASH EQUIVALENTS 11,125 20,543
CASH AND CASH EQUIVALENTS AT THE START OF THE YEAR 30,748 10,205
CASH AND CASH EQUIVALENTS AT THE END OF THE YEAR 41,873 30,748
The accompanying notes 1 to 39 are an integral part of these consolidated financial statements.

2
COMPAÑÍA PESQUERA CAMANCHACA S.A. AND SUBSIDIARIES
NOTES TO THE CONSOLIDATED FINANCIAL STATEMENTS
AS OF DECEMBER 31, 2019
NOTE 1 - General information
Compañía Pesquera Camanchaca S.A. is a publically listed company registered on the Securities Registry of the Financial Market Commission (FMC), formerly the Superintendent of Securities and Insurance, under registration number 1060. The Company is domiciled at Avenida El Golf No. 99, Floor 10, Las Condes, Santiago, Chile. Its Chilean identification number is 93,711,000-6.
Compañía Pesquera Camanchaca S.A. was incorporated as a privately held company by public deed dated December 3, 1976. The business objective of Compañía Pesquera Camanchaca S.A. is fishing in general, including research-related fishing and, particularly, capturing, catching, collecting and harvesting hydro-biological resources; engaging in aquaculture of all species, including all living marine organisms and algae; conserving, freezing, and applying preservation techniques to hydro-biological species; creating products originating from any hydro-biological species through partial or complete processing of Company catches or third-party catches obtained during the extraction or harvesting phases; building, maintaining, repairing, operating, and leasing ships suitable for extractive fishing or processing, or other support vessels; and industrializing, creating, selling, distributing and exporting products originating from its activities.
Infrastructure and equipment
The group has processing plants for each business in Iquique, Caldera, Tomé, Talcahuano, Coronel, Calbuco and Chonchi. It also has salmon hatcheries, pre-smolt units and salmon grow-out sites in the tenth and eleventh regions. The group also has abalone farming sites in the third region, mussel farming sites in the tenth region, and a significant fishing fleet distributed across the northern and central-southern areas of the country.
Marketing
The group sells its products both in Chile and abroad, mainly in the US, Asian, Latin American and European markets.
Compañía Pesquera Camanchaca S.A. is the parent company for its subsidiaries Salmones Camanchaca S.A., Camanchaca Cultivos Sur S.A., Transportes Interpolar Ltda., Camanchaca Pesca Sur S.A., Camanchaca SpA and Aéreo Interpolar Ltda. Furthermore, its subsidiary Camanchaca SpA owns Camanchaca Inc., Inmobiliaria Camanchaca S.A. and Kabushiki Kaisha Camanchaca; Camanchaca Pesca Sur S.A. owns Cannex S.A.; and Salmones Camanchaca S.A. owns Fiordo Blanco S.A. and Fiordo Azul S.A.
The group has direct and indirect holdings in Sociedad Inmobiliaria Cabilantago Ltda., Surproceso S.A. and New World Currents Inc.
Salmones Camanchaca S.A. has participated in a joint venture partnership since 2016, to produce and market trout. It has contributed maritime concessions to this partnership. The "Manager" of this joint venture partnership is Caleta Bay S.A. and the other partner is Kabsa S.A. The partnership earnings are divided equally between these three companies and are reflected in Other income (losses) in the statement of net income by function.

3
An IPO for primary and secondary shares of Salmones Camanchaca S.A. took place on February 2, 2018. Accordingly, Compañía Pesquera Camanchaca S.A.’s direct and indirect interest in this subsidiary fell from 100% to 70%. The group's consolidated financial statements for the year ended December 31, 2019 were approved at a Board of Directors meeting held on March 18, 2020.
NOTE 2 - Summary of significant accounting policies
The principal accounting policies used to prepare these consolidated financial statements have been applied in a uniform manner, and are described as follows.
2.1 Period covered
These consolidated financial statements cover the following periods: Consolidated statements of financial position aS of December 31, 2019, December 31, 2018 and
January 1, 2018. Consolidated statements of net income by function for the years ended December 31, 2019 and 2018. Consolidated statements of comprehensive income for the years ended December 31, 2019 and 2018. Consolidated statements of changes in equity for the years ended December 31, 2019 and 2018. Consolidated statements of direct cash flow for the years ended December 31, 2019 and 2018.
2.2 Basis of preparation
These consolidated financial statements for Compañía Pesquera Camanchaca S.A. have been prepared in accordance with International Financial Reporting Standards (IFRS) issued by the International Accounting Standards Board (IASB).
The consolidated financial statements present comparative information for the previous year, and the group presents an additional statement of financial position referring to the beginning of the previous year, when there was a retroactive application of an accounting policy, a retroactive restatement or a reclassification of items within the financial statements. The consolidated financial statements include a consolidated statement of financial position as of January 1, 2018, due to the retroactive application of a change in accounting policy regarding the valuation of biological assets (see Note 3).
The preparation of consolidated financial statements in accordance with IFRS requires the use of specific accounting estimates and also requires management to exercise its judgment when implementing the Company’s accounting policies. Note 6 of these consolidated financial statements discloses the areas which involve a higher degree of judgment and complexity, and where assumptions and estimates are significant to the consolidated financial statements.
These consolidated financial statements have been prepared from accounting records held by the Company and the other companies within the group. The figures in these consolidated financial statements are expressed in thousands of US dollars, which is the Company’s functional currency.
The consolidated financial statements have been prepared on a historical cost basis, except for items recognized at fair value in accordance with International Financial Reporting Standards. The book vales of assets and liabilities hedged with transactions that qualify for hedge accounting are adjusted to reflect changes in the fair value in relation to the hedged risks.

4
2.3 New pronouncements
New accounting pronouncements covering standards, interpretations and amendments that must be applied to annual periods beginning on or after January 1, 2020.
The new standards, interpretations, improvements and amendments to IFRS that have been issued but have not yet taken effect as of the date of these financial statements are detailed below. The Company has not adopted these standards early:
Conceptual Framework
Standards and Interpretations Mandatory application date
Conceptual Framework (revised) January 1, 2020
Conceptual Framework (Revised)
The IASB issued the revised Conceptual Framework in March 2018. It includes some new concepts, provides updated definitions and recognition criteria for assets and liabilities and clarifies some important concepts.
The changes to the Conceptual Framework may affect the application of IFRS in situations where no standard applies to a particular transaction or event. The revised Conceptual Framework is effective for annual periods beginning on or after January 1, 2020.
IFRS 17 Insurance Contracts
The IASB issued IFRS 17 Insurance Contracts in May 2017, which is a comprehensive new accounting standard for insurance contracts covering recognition and measurement, presentation and disclosure. When effective, IFRS 17 will replace IFRS 4 Insurance Contracts that was issued in 2005. The new standard applies to all insurance contracts, regardless of the entities that issue them.
IFRS 7 applies to reporting periods starting on or after January 1, 2021, with comparative figures required. Early application is permitted, provided the entity also applies IFRS 9 and IFRS 15.
Amendments Mandatory application date
IFRS 3 Definition of a business January 1, 2020
IFRS 9, IAS 9 and IFRS 7
Reference interest rate reform January 1, 2020
IFRS 3 Business Combinations - Definition of a Business
The IASB issued amendments in terms of the definition of a business in IFRS 3 Business Combinations to help entities determine whether an acquired set of activities and assets is a business or not. The IASB clarifies the minimum requirements for a business, removes the assessment of whether market participants are capable of replacing any missing elements, adds guidance to help entities assess whether an acquired process is substantive, narrows the definitions of a business and of outputs, and introduces an optional fair value concentration test. The amendments must be applied to transactions that are either business combinations or asset acquisitions for which the acquisition date is on or after the beginning of the first annual reporting period beginning on or after January 1, 2020. Consequently, entities do not have to revisit such transactions that occurred in prior periods. Earlier application is permitted and must be disclosed.
IFRS 10 & IAS 28 Consolidated Financial Statements - sale or contribution of To be determined assets between an investor and an associate or joint venture
IAS 1 and IAS 8 Definition of material January 1, 2020
IFRS 17 Insurance Contracts January 1, 2021

5
Since the amendments apply prospectively to transactions or other events that occur on or after the date of first application, most entities will likely not be affected by these amendments on transition. However, entities considering the acquisition of activities and assets after first applying the amendments should promptly update their accounting policies.
The amendments could be relevant in other areas of IFRS. For example, the definition of a business may also be relevant where a parent loses control of a subsidiary and has early adopted Sale or Contribution of Assets between an Investor and its Associate or Joint Venture (Amendments to IFRS 10 and IAS 8).
IAS 1 Financial Statement Presentation and IAS 8 Accounting Policies, Changes in Accounting Estimates and Errors - Definition of Material
The IASB issued IAS 1 Financial Statement Presentation and IAS 8 Accounting Policies, Changes in Accounting Estimates and Errors in October 2018, to align the definition of "material" across all standards and to clarify certain aspects of the definition. The new definition states that information is material if omitting, misstating or obscuring it could reasonably be expected to influence decisions that the primary users of general purpose financial statements make on the basis of those financial statements, which provide financial information about a specific reporting entity.
The amendments must be applied prospectively. Earlier application is permitted and must be disclosed. Although the amendments to the definition of material are not expected to have a significant impact on an entity’s financial statements, the introduction of the term ‘obscuring information’ in the definition could potentially impact how materiality judgments are made in practice, by elevating the importance of how the information is communicated and organized in the financial statements.
IFRS 9, IAS 9 and IFRS 7 Reference Interest Rate Reform
The IASB issued amendments to IFRS 9, IAS 39 and IFRS 7 in September 2019, completing the first phase of its response to the effect of interbank offering rates (IBOR) reform on financial reporting. The amendments provide temporary exceptions that allow hedge accounting to continue during the period of uncertainty, prior to the replacement of current benchmark interest rates with nearly risk-free alternative interest rates.
The amendments must be applied retrospectively. However, any hedging relationship that has previously been discontinued cannot be reinstated with the application of these amendments, nor can a hedging relationship be assigned using the benefit of retrospective reasoning. Earlier application is permitted and must be disclosed.
IFRS 10 Consolidated Financial Statements and IAS 28 Investments in Associates and Joint Ventures - sale or contribution of assets between an investor and an associate or joint venture
Amendments to IFRS 10 Consolidated Financial Statements and IAS 28 Investments in Associates and Joint Ventures (2011) address an inconsistency between the requirements of IFRS 10 and IAS 28 (2011) in the treatment of a sale or contribution of assets between an investor and an associate or joint venture. The amendments were issued in September 2014 and recognize a full gain or a loss when the transaction involves a business (whether or not in a subsidiary). They recognize a partial gain or loss when the transaction involves assets that do not constitute a business, even if these assets are in a subsidiary. The date of mandatory application of these amendments is to be determined since IASB is waiting for the results of its research project on accounting using the equity method. These amendments must be applied retrospectively, and early adoption is permitted, which must be disclosed. The entity will evaluate the impact of the amendments once they become applicable.

6
2.4 Basis of consolidation
a) Subsidiaries
Subsidiaries are all the entities over which the group has the power to direct its financial and operating policies. Such power is generally associated with an ownership interest of more than half of the voting rights. When evaluating whether group controls another entity, all its currently exercisable or convertible voting rights and their effects are considered. Subsidiaries are consolidated from the date on which control is transferred to the group, and they are excluded from consolidation on the date such control ceases.
The acquisition method is used to account for the acquisition of subsidiaries by the group. The acquisition cost is the fair value of the assets delivered, equity instruments issued and liabilities incurred or assumed at the date of exchange. Identifiable assets, liabilities and contingencies acquired in a business combination are initially valued at their fair value on the acquisition date, regardless of the extent of minority interests. At each acquisition, the group recognizes any minority interest at its fair value, or the proportional value of the minority interest over the fair value of the acquired net assets.
The surplus acquisition cost over the fair value of the group’s share of the acquired net identifiable assets is recognized as purchased goodwill. If the purchase price is less than the fair value of the net assets of the acquired subsidiary, the difference is recognized directly in net income.
Intercompany transactions, balances and unrealized gains on transactions between group entities are eliminated. Unrealized losses are also eliminated, unless that transaction provides evidence that the transferred asset is impaired. The accounting policies at subsidiaries are amended as necessary, to ensure that group policies have been consistently adopted.
The following subsidiaries are included in these consolidated financial statements, together with their functional currency:
Consolidated company
Country
Functional currency
Ownership interest 12-31-2019 12-31-2018
Direct %
Indirect %
Total %
Total %
Salmones Camanchaca S.A. Chile US dollars 70.00 - 70 70
Fiordo Blanco S.A. Chile US dollars - 70.00 70 70
Fiordo Azul S.A. Chile US dollars - 70.00 70 -
Camanchaca Cultivos Sur S.A. Chile US dollars 93.05 6.95 100 100
Transportes Interpolar Ltda. Chile Chilean peso 99.00 1.00 100 100
Camanchaca Inc. USA US dollars 0.05 99.95 100 100
Inmobiliaria Camanchaca S.A. Chile US dollars 3.06 96.94 100 100
Camanchaca SpA. Chile US dollars 100.00 - 100 100
Camanchaca Pesca Sur S.A. Chile US dollars 70.00 - 70 70
Kabushiki Kaisha Camanchaca Japan US dollars 0.50 99.50 100 100
Aéreo Interpolar Ltda. Chile US dollars 99.00 1.00 100 100
Cannex S. A. Chile Chilean peso - 70.00 70 70
Salmones Camanchaca S.A. began a corporate restructuring process in September 2017. Accordingly, on September 11, 2017 that company transferred all the shares it held in Transportes Interpolar Ltda. to Compañía Pesquera Camanchaca S.A. and Camanchaca SpA leaving them with an interest of 99.95% and 1%, respectively, in Transportes Interpolar Ltda.

7
On February 2, 2018, 19,800,000 shares of its subsidiary Salmones Camanchaca S.A., equal to 30% of that company were placed through the Santiago Stock Exchange using an Order Book Auction mechanism, where 9,181,992 shares were primary shares and 10,618,008 shares were secondary shares, at a price of Ch$3,268 per share, which are traded on the Santiago, Chile and Oslo, Norway Stock Exchanges, using representative certificates. The placement raised US$109 million
Cannex S.A. is a company that sells canned jack mackerel. This company was CREATED ON November 10, 2017 and is owned by the subsidiary companies Camanchaca Pesca Sur S.A. with 99 % and Camanchaca SpA with 1%. Therefore, it is consolidated to form part of the consolidated Compañía Pesquera Camanchaca S.A. group. The subsidiary Camanchaca Pesca Sur began directly selling its canned products as of February 2019.
Fiordo Azul S.A. was created on January 31, 2019. Its business purpose is aquaculture in general, especially breeding, producing and farming salmon and other species. Salmones Camanchaca S.A. directly and indirectly owns 100 % of the company and therefore consolidates it.
b) Non-controlling interests and transactions
The group considers transactions with non-controlling shareholders as if they were transactions with group shareholders. When acquiring a non-controlling interest, the difference between the amount paid and the share of the book value of that company's net assets is recorded in equity. Income and losses due to write-offs that benefit non-controlling interests are also recognized in equity, provided that control is maintained.
c) Associates
Associates are defined as all entities over which the group exercises significant influence, but over which it has no control, generally with an ownership interest between 20% and 50% of the voting rights. Investments in associates are accounted for using the equity method and are initially recognized at cost. The investment of the group in associates includes purchased goodwill, net of any accumulated impairment losses.
The group’s share of net income or losses in associates subsequent to acquiring them are recognized in net income, and its share of equity movements that are not due to net income subsequent to their acquisition are recognized in reserves, and reflected as appropriate in the statement of comprehensive income. When the group’s share of a subsidiary or associate’s losses is equal to or greater than its share in that company, including any other unsecured receivables, the group does not recognize further losses unless it has incurred obligations or made payments on behalf of that subsidiary or associate.
Unrealized gains on transactions between the group and its associates are eliminated to the extent of the group’s interest in the associate. Unrealized losses are also eliminated, unless the transaction provides evidence of impairment of the transferred asset. The accounting policies at associates are amended as necessary, to ensure that group policies have been consistently adopted.
Surproceso S.A provides aquaculture services. It has a commercial relationship with Salmones Camanchaca S.A. and provides it with slaughtering and gutting services. Compañía Pesquera Camanchaca S.A. owned 33.3 % of this company, but under the corporate restructuring in September 2017, all these shares were transferred to Salmones Camanchaca S.A., who now owns that percentage.

8
Sociedad Inmobiliaria Cabilantago Ltda. is a company that administers its own real estate, where Compañía Pesquera Camanchaca S.A. directly owns a 46.78% interest AS of December 31, 2019.
New Worlds Currents Inc. was incorporated in Hong Kong to establish, process and operate businesses associated with marketing salmon in China. The subsidiary Salmones Camanchaca S.A. owns 5% of this company.
2.5 Segment reporting
Financial information by segment is presented consistently with internal reports provided to those responsible for taking the relevant operating decisions. This information is detailed in Note 6. The business segments used by Compañía Pesquera Camanchaca S.A. and subsidiaries are: - Industrial Fishing - Salmon Farming - Other Seafood
2.6 Foreign currency transactions
a) Functional and presentation currency
The entries included in the financial statements of each of the group’s companies are valued using the currency of the primary economic environment in which that company operates (“functional currency”). The consolidated financial statements are expressed in US dollars, which is both the functional and presentation currency of the Camanchaca group.
b) Transactions and balances
Transactions in foreign currencies other than the functional currency are translated to the functional currency using the exchange rate in effect as of the transaction date. Monetary assets and liabilities denominated in foreign currencies are translated to the functional currency at the exchange rates prevailing as of the reporting date.
All differences that arise from settling or translating monetary items are recognized in the statement of net income, except for monetary items that form part of the hedge for the group’s net investment in a foreign business. These differences are recognized in other comprehensive income until the net investment is sold, at which time they are reclassified to the statement of net income.
Non-monetary items that are valued at historical cost in a foreign currency are translated using the prevailing exchange rate on the initial transaction date. Non-monetary items that are valued at fair value in a foreign currency are translated using the prevailing exchange rate at the date when the fair value was determined.
The assets and liabilities of foreign businesses are translated on consolidation into U.S. dollars at the exchange rate in effect on the closing date, and their transactions are translated at the average monthly exchange rate. Exchange differences arising on translation are recognized in other comprehensive income. When a foreign investment is sold, the component of other comprehensive income relating to that investment is reclassified to the statement of net income.

9
Exchange rates
The exchange rates of foreign currencies and the Unidad de Fomento (a Chilean peso based inflation-indexed monetary unit) compared to the US dollar as of the reporting dates were as follows:
Date Ch$ / US$ UF / US$ Euro / US$ Yen / US$ Nok / US$
12-31-2019 748.74 0.0264 0.8918 108.90 8.7907
12-31-2018 694.77 0.0252 0.8742 110.38 8.7272
01-01-2018 614.75 0.0229 0.8317 112.59 8.1739
2.7 Property, plant and equipment
The group’s property, plant and equipment is made up of land, building, infrastructure, machinery, equipment and other fixed assets. The main fixed assets are offshore fishing vessels (PAM), naval equipment (pontoons), fishmeal and oil plants, canning and freezing plants, hatcheries, grow-out sites and primary and value-added processing plants.
Property, plant and equipment are recognized at their cost less accumulated depreciation and any impairment losses. Cost includes the purchase price of the assets and the following items, if any, as permitted by IFRS.
• The financial cost of loans to finance constructions in progress is capitalized during construction.
• Employee costs directly related to the constructions in progress. • Expansion, modernization and improvement costs that represent an increase in productivity,
capacity or efficiency or a longer useful life are capitalized as an increase in the cost of the corresponding assets.
• Replacement or overhaul of whole components that increase the asset’s useful life, or its economic capacity, are recorded as an increase in value of the corresponding assets, while the replaced or overhauled components are derecognized.
Construction in progress are transferred to operating property, plant and equipment once the testing period has been completed, at which time depreciation begins.
Regular maintenance, conservation and repair expenses are expensed in the period they are incurred.
Subsequent costs are included in the asset’s initial value or recognized as a separate asset only when it is probable that the future economic benefits associated with the items of fixed asset will flow to the group and the cost of the item can be reliably measured. The value of the replaced component is expensed.
Land is not depreciated. Depreciation is calculated using the straight-line method over the assets’ economic useful lives, until it reaches its residual value.
Minimum useful life in years
Maximum useful life in years
Buildings 10 50 Plant and equipment 5 20 Vessels 35 40 Vehicles 7 10 Machinery and other assets 3 20
Residual values, useful lives and of depreciation methods for property, plant and equipment assets are reviewed and adjusted prospectively at each year-end.
The gain or loss on the disposal of an asset is the difference between the net proceeds from its disposal and the asset's book value, and is recognized in the statement of net income when the asset is derecognized.

10
The Company recognizes right-of-use leased assets based on the lease payments for the remaining lease term, in accordance with IFRS 16 "Leases", using the option to record the asset at a value equal to the liability, as permitted by the standard. Right-of-use leased assets recorded at the date of initial application will incur depreciation over the remaining contract term.
2.8 Biological assets
Biological assets include the following.
Biological assets include groups of breeders, eggs, smolts and fish at marine grow-out sites. They are evaluated at initial recognition and subsequently.
Live fish inventories at all their freshwater stages, which are breeders, eggs, fry and smolts. These are valued at accumulated cost at the reporting date.
The fair value valuation criteria for fish at marine grow-out sites includes the value of the concession as a component of the farming risk, in accordance with the definition in IAS 41. Therefore, a valuation model has been adopted that calculates the Fair Value Adjustment (FVA) by applying a risk factor to the expected biomass margin at each marine grow-out site. An exponential model is used and the risk factor discounts the expected biomass margin.
The estimated fair value of fish biomass is based on the volume of fish biomass, average biomass weights, cumulative biomass costs for each site, estimated remaining costs and estimated sales prices.
Volume of fish biomass
The volume of fish biomass is an estimate based on the number of smolts in the sea, an estimate of their growth, identified mortality in the period, average weights, and other factors. Uncertainty with respect to the volume of biomass is normally lower in the absence of bulk mortality events during the cycle, or if the fish catch acute diseases.
The biomass is the weight when it is calculated for each farming site. The target harvest weight depends on each site.
Cumulative Costs
Cumulative costs for farming sites at the date of the fair value calculation are obtained from the company's accounts.
Remaining Costs
Estimated remaining costs are based on the forecast direct and indirect costs that will affect the biomass at each site through to final harvest.
This estimate is refined at each calculation, and uncertainty reduces as the harvest approaches.
Operating revenue
Revenue is calculated using several sales prices forecast by the company for each month based on future price information from public sources, adjusted to historical price behavior from the main destination market for our fish. This is reduced by the costs of harvesting, processing, packaging, distribution and sale.

11
A Fair Value Adjustment is applied to all fish at marine grow-out sites, under the current model.
Changes in the fair value of biological assets are recorded in the statement of net income for the period.
All biological assets are classified as current biological assets, as they form part of the normal farming cycle that concludes with harvesting the fish.
The gain or loss on the sale of these assets may vary in comparison to their calculated fair value at the reporting date.
The Company uses the following method.
Stage Asset Valuation
Fresh water Eggs, fry, smolts and breeders
Direct and indirect cumulative costs at their various stages.
Sea water Salmon, mussels and abalone
Fair Value, as there is a market with reference prices and companies that sell these assets. If no market can be identified, then cumulative cost is used.
Hierarchy
Fair value hierarchy is determined according to the data source, according to IFRS 13. The Company’s valuation model uses hierarchy level III. The most significant unobserved variables are the sales price and the average weight.
2.9 Intangible assets other than goodwill
Individually acquired intangible assets are initially measured at cost. The cost of intangible assets acquired in a business combination is their fair value as of the date of acquisition. After initial recognition, intangible assets are recorded at cost less any accumulated amortization and any accumulated impairment loss. Internally generated intangible assets, excluding capitalized development expenditure, are not capitalized and the related expense is recognized in the statement of net income for that year.
a) Tradable fishing licenses
Tradable fishing licenses acquired from third parties are presented at historical cost. The useful life of these rights is indefinite, as fishing licenses have an indefinite useful life. Therefore, they are not amortized. This status of indefinite useful life is reviewed at each reporting date, in order to assess whether events and circumstances continue to support an indefinite useful life for that asset.
b) Aquaculture concessions
Aquaculture concessions have an indefinite useful life, because they have no expiry date nor a measurable useful life. Therefore, they are not amortized. This status of indefinite useful life is reviewed at each reporting date, in order to assess whether events and circumstances continue to support an indefinite useful life for that asset.
Gains or losses that may arise upon de-recognizing an intangible asset are the difference between the net income from the sale and the asset's book value, and are recognized in the statement of net income when the asset is de-recognized.

12
2.10 Interest costs
Interest costs directly attributable to the acquisition, construction or production of an asset whose start-up or sale requires an extended period of time are capitalized as part of the cost of the asset. Other interest costs are expensed when they are incurred. Interest costs include interest and other costs incurred by the group in connection with its financing.
2.11 Impairment losses on non-financial assets
The Company evaluates whether there is any indication of impairment of any asset as of each reporting date. If any indication is found, then the Company will estimate the asset's recoverable value. The Company tests each intangible asset with an indefinite useful life for impairment every year, regardless of whether there is any indication of impairment. An impairment loss is recognized for the amount that the asset’s book value exceeds its recoverable value. The recoverable value is the greater of the fair value of an asset less the costs to sell it, or its value in use. Value in use is the present value of forecast cash flow produced by an asset or cash-generating unit.
Impairment is assessed by grouping assets at the lowest levels at which they generate separately identifiable cash flows (cash-generating units). The Company uses value in use to calculate the recoverable value. Value in use is based on forecast cash flows that are discounted to present value using a before-tax discount rate that reflects current market assessments of the time value of money and any asset specific risks.
All non-financial assets are evaluated at each closing date to determine whether there is any indication that the impairment loss recorded in previous years no longer exists or has decreased. If such an indication is found, the Company estimates the recoverable value of the asset or the cash-generating units. A previously recorded impairment loss is reversed only if there has been a change in the assumptions used to determine the recoverable value since the last impairment loss was recorded. The reversal is limited to ensuring that the book value of the asset does not exceed its recoverable value, nor does it exceed its original book value net of depreciation had no impairment loss been recognized in prior years. This reversal is recorded in the statement of net income unless the asset is carried at a revalued value, in which case the reversal is recorded as an increase in the revaluation.
Intangible assets with an indefinite useful life as of December 31 are tested annually for impairment. This applies to both individual assets and cash-generating units, as appropriate, and when circumstances indicate that the book value may be impaired.
2.12 Financial assets and liabilities
Financial assets
The group initially measures a financial asset at its fair value plus transaction costs, in the case of a financial asset not valued at fair value through profit or loss, in accordance with IFRS 9.
Financial assets are subsequently measured at fair value through profit or loss (FVPL), amortized cost, or fair value through other comprehensive income (FVOCI), in accordance with IFRS 9.
The classification is based on two criteria. These are the group's business model for managing the assets, and whether the contractual cash flows of the financial instruments represent "solely payments of principal and interest" on the outstanding principal amount (the 'SPPI criterion').

13
The classification and measurement of the group's financial assets are as follows:
• Financial assets measured at amortized cost, for financial instruments that are held within a
business model whose objective is to hold financial assets and collect the contractual cash flows that meet the SPPI criterion. This category includes the group's trade and other receivables.
• Financial assets measured at fair value through other comprehensive income (FVOCI), with gains
or losses recognized in the statement of net income upon settlement. Financial assets in this category are group instruments that meet the SPPI criterion and are held within a business model for both cash flow collection and sale.
Other financial assets are classified and subsequently measured as follows:
• Equity instruments measured at fair value through other comprehensive income (FVOCI), with no
recognition of gains or losses in the statement of net income upon settlement. This category only includes equity instruments that the group intends to hold in the foreseeable future and which the group has irrevocably chosen to classify in this category upon initial recognition or transition.
• Financial assets measured at fair value through profit or loss (FVPL), comprise derivative
instruments and listed equity instruments that the group had not irrevocably chosen to classify at FVOCI upon initial recognition or transition. This category also includes debt instruments whose cash flow characteristics do not meet the SPPI criterion, or are not held within a business model whose objective is to recognize contractual cash flows or sales.
Financial liabilities
Equity instruments. An equity instrument is any contract that evidences a residual interest in the assets of a company after deducting all of its liabilities. Equity instruments are recorded at the value of the consideration received, net of direct issuance costs.
Financial liabilities. Financial liabilities are classified either as financial liabilities “at fair value through profit and loss”, or as “other financial liabilities”.
a) Financial liabilities are classified at fair value through profit and loss when these are held for sale or are designated as such.
b) Other financial liabilities, including loans, are valued initially at the amount of cash received, net of transaction costs. Other financial liabilities are subsequently valued at amortized cost using the effective interest method, recognizing the interest expense based on the effective interest rate.
The effective interest rate method is a method of calculating the amortized cost of a financial liability and of allocating interest expense throughout the corresponding period. The effective interest rate is the rate that exactly discounts the estimated cash flows payable over the expected life of the financial liability, or when appropriate, a shorter period when the associated liability has a prepayment option that it expects to exercise.
2.13 Derivative financial instruments and hedge activities
Derivatives are initially recognized at fair value on the date on which the derivative contract is signed and are subsequently re-measured at fair value. The method used to record the resulting gain or loss depends on whether it is a hedging instrument and, if so, the nature of the underlying item.

14
The Company does not hold any cash flow hedges as of the close of these consolidated financial statements.
The effective portion of changes in fair value hedges that are designated and qualify as cash flow hedges are recognized in equity. Any loss or gain related to the ineffective portion is recognized immediately in the consolidated statement of net income within “financial costs”. The all fair value hedges are classified as Other non-current financial assets or liabilities.
When a hedge instrument matures or is sold or when it does not meet hedge accounting requirements, any gain or loss accumulated in net equity until that point remains in equity and is recognized when the forecasted transaction is finally recognized in the consolidated statement of net income. When the forecasted transaction is not expected to occur, any accumulated gain or loss in equity is recognized immediately in the consolidated statement of net income within “other net gains (losses)”.
2.14 Inventories
Inventories are valued at the lower of cost or net realizable value. Cost is calculated using the average cost method.
The cost of finished goods and products in-process includes the costs of raw materials, direct labor, other direct costs and general manufacturing expenses, based on normal operating capacity, but excluding interest.
Net realizable value is the estimated sales price during the normal course of business, less any variable costs to sell them.
Obsolete or slow-moving products are recognized at their recoverable value.
Inventory valuation policy
i) The group values its inventories as follows.
a) The production cost of manufactured inventory includes all costs related to the units produced such as labor and fixed and variable costs required to transform raw materials into finished products.
The production cost of fresh and frozen salmon is based on the last fair value of biological asset when harvested, plus direct and indirect production costs.
b) The acquisition cost of purchased inventory includes its purchase cost, customs fees, transport,
storage and other costs attributable to its acquisition.
ii) Inventory cost calculation formula
Inventories of finished products are valued using the weighted average cost, ie. the cost of each product unit is based on the weighted average cost at the beginning of the period, and the cost of items purchased or produced during the period.
Inventories of raw materials, packaging materials are valued at weighted average cost.
Subsequent storage costs or costs incurred in delivering products to customers are not included in inventory costs.

15
Commercial discounts, rebates and other similar adjustments are deducted to arrive at the purchase cost.
Net realizable value is the estimated sales price less all estimated finishing costs and sales and marketing costs.
The Company evaluates the net realizable value of inventories at the end of each period and adjusts their book value if necessary.
2.15 Statement of cash flow
The Company has defined the following policies in order to prepare the statement of cash flow:
Cash and cash equivalents include cash on hand, at banks, term deposits with financial institutions, mutual funds and other short-term, highly liquid investments that are readily realizable, with a low risk of changes in value and an original maturity of up to three months. Bank overdrafts are classified as third-party resources within current liabilities in the statement of financial position.
i. Operating Activities: These are the group's principal source of operating revenue as well as other
activities that cannot be classified as investing or financing.
ii. Investing Activities: These are the acquisition and disposal by any means of long-term assets and other investments not included in cash and cash equivalents.
iii. Financing Activities: These bring about changes in the size and composition of equity and
financial liabilities.
2.16 Classification of balances as current and non-current
Balances in the consolidated statement of financial position are classified by maturity with current balances maturing in less than 12 months and non-current balances in more than 12 months. Should the Company have any obligations that mature in less than twelve months, but can be refinanced over the long term at management's discretion, using unconditionally available credit agreements with long-term maturities, such obligations may be classified as non-current liabilities.
Deferred tax assets and liabilities are classified as non-current assets and liabilities.
2.17 Earnings per Share
Basic earnings per share is calculated as the ratio between net income for the period attributable to the parent company divided by the weighted average number of ordinary shares in circulation during that period.
2.18 Trade and other receivables
Trade receivables are initially recognized at fair value (nominal value including implicit interest), and they are subsequently recognized at their amortized cost according to the effective interest rate method, less provisions for impairment losses. A provision is established for impairment losses on trade receivables when there is objective evidence that the group will not be able to collect all amounts owed in accordance with the original terms of the trade receivable.
Implicit interest must be disaggregated and recognized as financial income to the extent that such interest has accrued.

16
The provision is the difference between the asset’s book value and the present value of its estimated future cash flows, discounted using the effective interest rate.
However, if the difference between the nominal value and the fair value is not significant, the nominal value is used.
Doubtful debt provisions on trade and other receivables are based on a stratification of the customer portfolio and the age of those debts. An individual analysis is performed for those cases that have exceeded the normal collection period and the Company believes that collection is doubtful.
2.19 Cash and cash equivalents
Cash and cash equivalents include cash on hand, term deposits with financial institutions, other highly liquid short-term investments that can be readily converted into known amounts of cash that are subject to a negligible risk of changes in value and have a maturity of three months or less on their acquisition date.
Bank overdrafts are included in current financial liabilities in the consolidated statements of financial position, when appropriate.
2.20 Share capital
Share capital is represented by ordinary shares.
Incremental costs directly attributable to new share issues or options are presented in net equity as a deduction from their proceeds.
The issue premium is the excess price on placing shares during the IPO in 2010.
Legal minimum dividends on ordinary shares are recognized as a reduction in equity when they are accrued.
2.21 Trade and other payables
Trade payables are initially recognized at fair value and subsequently at amortized cost using the effective interest rate method.
However, similarly to trade receivables, if the difference between the nominal value and the fair value is not significant, the nominal value is used.
2.22 Current and deferred income taxes
Income tax expense for the year includes both current and deferred taxes.
Current tax assets and liabilities are measured at the values expected to recover from or pay to the tax authorities. Income tax expense for the year includes both current and deferred taxes.
Current income taxes are based on the tax laws at the reporting date, in the countries where each subsidiary operates and generates taxable income.

17
Deferred taxes are calculated using the liability method on temporary differences that arise between the tax value of assets and liabilities and their book values. However, if deferred taxes arise from the initial recognition of a liability or an asset in a transaction other than a business combination, which at the time of the transaction do not affect accounting net income nor taxable profit, then they are not accounted for.
Deferred tax is calculated using the current tax rates and laws, or those about to be approved at the reporting date, which are likely to be applicable when the corresponding deferred tax asset is collected or deferred tax liability is settled.
Deferred tax assets are recognized to the extent that it is likely that future tax benefits are available to offset such temporary differences.
The Company does not record deferred taxes on temporary differences that arise from investments in subsidiaries, associates and investments in joint control agreements, provided the Company can control when those temporary differences will reverse and the temporary differences are not likely to reverse in the foreseeable future.
An entity must offset deferred tax assets with deferred tax liabilities only if the tax authority recognizes that it has the legal right to offset the amounts recognized in those items; and the deferred tax assets and liabilities arise from income taxes levied by the same tax authority on the same entity or taxpayer, or on different entities or taxpayers that intend either to settle current tax assets and liabilities on a net basis or to simultaneously recover the assets and pay the liabilities in each of the future periods in which significant amounts of deferred tax assets or liabilities are expected to be paid or recovered.
Current and deferred income taxes are recognized in the consolidated statement of net income, except taxes arising on items recognized in other comprehensive income, or directly in equity, or on a business combination, or as mentioned in the following paragraph. In which case, the corresponding tax is also recognized in other comprehensive income, directly in the statement of net income, or in commercial goodwill, respectively.
2.23 Employee benefits
Employee severance indemnity
This liability is the present value of defined benefit obligations at the reporting date. It is calculated annually using actuarial assumptions and by discounting the corresponding estimated cash flows. Gains and losses arising from adjustments due to changes in trends of actuarial assumptions are recognized immediately in the statement of financial position with a charge or credit, as appropriate, to reserves through other comprehensive income in the period in which they occur. These changes are not reclassified to the statement of net income in subsequent periods.
The parameters used in the actuarial valuation model are as follows: mortality and invalidity rates, discount rates, salary growth rates, staff turnover rates due to resignations and staff turnover rates due to severance.
Employee vacations
The Company recognizes employee vacation expenses on an accrual basis. This benefit is provided to all employees and is a fixed amount based on each employee's employment contract, in accordance with IAS 19.

18
2.24 Provisions
Provisions are recognized when:
i) The Company has a legal or implicit obligation, as a result of past events.
ii) It is likely that a disbursement will be necessary to settle the obligation.
iii) The amount can be reliably estimated.
iv) Provisions are measured at the present value of Management’s best estimate of the expenditures required to settle the obligation. The discount rate used to calculate the present value reflects current market assessments at the reporting date of the time value of money, as well as any specific risks related to the particular liability.
2.25 Revenue recognition
Operating revenue is recorded at the fair value of the consideration received or receivable derived from that revenue. The Company takes into consideration all the relevant facts and circumstances when applying each step of the model established by IFRS 15 regarding customer contracts: (i) identify the contract, (ii) identify the performance obligations, (iii) determine the transaction price, (iv) assign the transaction price to the performance obligations, and (v) revenue recognition. The Company also assesses any incremental costs that arise from winning a contract and any costs directly related to fulfilling a contract. The Company recognizes revenue when the steps set out in this IFRS have been successfully completed.
(i) Operating revenue recognition from the sale of goods
Operating revenue from the sale of goods is recognized when the Company has transferred control over the goods sold to the buyer; when revenue can be reliably measured; when the Company cannot influence how the goods sold are managed; when the Company is likely to receive the financial benefits of the transaction; and when the transaction costs can be reliably measured.
Operating revenue is based on the price established in the sale agreement, net of volume discounts as of the sale date. There is no significant funding component, as sales proceeds are collected within a reduced average period, which is in line with market practice.
Operating revenue from export sales is based on Incoterms 2010, which are official regulations for interpreting trade terms, and they are issued by the International Chamber of Commerce.
The principal Incoterms used by the Company are as follows:
"CFR (Cost and Freight)", where the Company is responsible for all costs, including principal transport costs, until the goods arrive at the destination port. Risk is transferred to the buyer when the goods are loaded onto the ship, in the country of origin.
"CIF (Cost, Insurance and Freight)", where the Company arranges and pays the foreign transportation costs and other costs, such as insurance. Compañía Pesquera Camanchaca S.A. ceases to be responsible for the goods once they have been delivered to the maritime or air carrier, in accordance with the corresponding deadline.

19
The sale is complete when the goods are delivered to the carrier. This service is arranged by the seller.
FOB (Free on Board) and similar, where the buyer arranges and pays the transport costs. Therefore, the sale is complete when the goods are delivered to the carrier arranged by the buyer.
(ii) Operating revenue recognition for providing services
Operating revenue from services is recognized when the performance obligation has been satisfied. Operating revenue is accounted for considering the degree of service completion as of the closing date, and whether the Company has an enforceable right to payment for providing those services.
2.26 Dividend policy
The Company is obliged to distribute a mandatory minimum dividend equivalent to 30% of net distributable income, in accordance with Corporate Law, unless unanimously agreed otherwise by the shareholders.
Under IFRS, this obligation to shareholders must be recognized before the closing date of the annual financial statements with the resulting decrease in equity.
2.27 Net distributable income
A meeting of the Board of Directors of Compañía Pesquera Camanchaca S.A. ON November 15, 2010 agreed to apply the following general policies to calculate the Company's net distributable income, in accordance with the provisions of Title I of Circular 1,945 dated September 29, 2009 issued by the Financial Market Commission:
The calculation of the Company's net distributable income to determine the minimum obligatory dividend will be based on its net income less any changes in the unrealized gains and losses on assets and liabilities during the respective period. Those changes must be added back to this calculation when the gains and losses are realized.
Consequently, the Board of Directors agreed that the calculation of the Company's net distributable income to determine the minimum obligatory dividend should exclude the unrealized gains and losses on the fair value of biological assets governed by IAS 41, the unrealized gains and losses arising on the acquisition of other entities, and the unrealized gains and losses arising from applying paragraphs 34, 42, 39 and 58 of the Revised IFRS 3, which refers to business combinations.
The effects of deferred taxes related to the items indicated in i) and ii) will be treated in the same way as the item that gave rise to the deferred tax.
2.28 Leasing
The Company has applied IFRS 6 "Leases" using the amended retrospective approach since January 1, 2019. Therefore, comparative information has not been restated and continues to be reported in accordance with IAS 17 "Leases" and IFRIC 4 "Determining whether an arrangement contains a lease".

20
a) Policy as of January 1, 2019
When a contract begins, the Company assesses whether the contract contains a lease, defined as whether the contract gives the right to control the use of an identified asset for a period of time in exchange for consideration. A contract gives Compañía Pesquera Camanchaca S.A. the right to control the use of an identified asset if:
i) The contract involves the explicit or implicit use of an identified asset. If the supplier has a substantial right of substitution, then the asset is not identified;
ii) The Company has the right to receive substantially all the financial benefits from using the asset during the period; and
iii) The Company has the right to direct the use of the asset. This right is exercised when significant decisions are taken, for example how and why the asset is used. In exceptional cases, the decision on how and why the asset is used is predetermined. It has the right to direct the use of the asset if it has the right to operate the asset, or if it designed the asset in a manner that predetermines how and why it will be used.
At the beginning or revaluation of a contract containing a lease component, the Company assigns the consideration in the contract to each lease component on the basis of its independent relative prices, by separately allocating the associated cost of capital.
b) Lessee
Compañía Pesquera Camanchaca S.A. recognizes a right-of-use asset and a lease liability when the lease begins. The right-of-use asset is initially valued at cost, which comprises the initial lease liability adjusted for any lease payments made on or before the start date, plus any initial direct costs and an estimate of the costs to dismantle and eliminate the underlying asset or to restore the underlying asset or the site where it is located, less any lease incentives received. The right-of-use asset is subsequently depreciated using the straight-line method from the start date to the end of its estimated useful life according to the contract term. The estimated useful lives of right-of-use assets are determined by considering future renewals according to the contract term. The value of a right-of-use asset is regularly evaluated and reduced by any impairment losses, and adjusted for specific new valuations of the lease liability. The lease liability is initially valued at the present value of future payments, discounted using the interest rate implicit in the lease, or if that rate cannot be readily determined, the Company's borrowing rate, incorporating additional adjustments considering the risk of the country and each of the subsidiaries. Lease payments included in valuing the lease liability comprise the following:
- Fixed payments, included in the contract. - The exercise price under a purchase option that the Company may reasonably exercise. - Lease payments on an optional renewal period if the Company is reasonably certain to exercise the renewal option. - Penalties for early termination of a lease, unless the Company is reasonably certain that it will not terminate the lease early.
The lease liability is valued at amortized cost using the effective interest method. It is revalued when there is a change in future lease payments due to a change in an index or rate. When the lease liability is accordingly revalued, the book value of the right-of-use asset is adjusted, unless this reaches zero, in which case the adjustment is recognized in the statement of net income.

21
The Company presents right-of-use assets in “Property, plant and equipment” and the associated obligations in “Operating lease liabilities, current and non-current” within the consolidated statement of financial position. The Company has elected not to recognize right-of-use assets and lease liabilities for contracts with a term of 12 months or less, and for contracts whose assets have a value under US$5,000. The Company recognizes the lease payments associated with these transactions as a straight-line expense over the contract term.
Treatment under IAS 17
The Company as a lessee classified as finance leases all those leases that transfer substantially all the risks and rewards of ownership, during the comparative period. Assets held under other leases were classified as operating leases and were not recognized in the consolidated statement of financial position. Payments for operating leases were recognized in the statement of net income on a straight-line basis over the contract term. The lease incentives received were recognized as an integral part of the total lease expense during the contract term.
c) Lessor
The Company as a lessor determined whether each contract was a finance lease or an operating lease when the lease contract began. The Company’s accounting policies as lessor in the comparative period are as stipulated by IFRS 16.
2.29 The environment
The disbursements associated with improvements and investments in productive processes that improve environmental conditions are recorded as an expense or investment in the for the year in which they arise. When these disbursements are part of investment projects, they are recorded as increases to property, plant and equipment.
The group has established the following disbursements types for environmental protection projects.
a) Disbursements relating to improvements and investments in productive processes that improve
environmental conditions. b) Disbursements relating to verifying and monitoring regulations and laws covering industrial
processes and facilities. c) Other disbursements that affect the environment.
NOTE 3 - CHANGES IN ACCOUNTING POLICIES AND ESTIMATES
Changes in policies
3.1 Change in fair value calculation of biological assets
Compañía Pesquera Camanchaca S.A. for Salmones Camanchaca S.A. reviewed its accounting policy to calculate the fair value of biological assets during 2019, in line with changes in the Chilean salmon industry in recent years. Previously, fair value was the market price less estimated processing and sales costs for fish at grow-out sites that weighed over 4 kg for Atlantic salmon and 2.5kg for Pacific salmon. The market price was adjusted appropriately for each marine group at the reporting date, from which the harvesting, processing, packaging, distributing and selling costs were deducted, and the volume was adjusted for process yields.

22
Smaller fish were valued at cost and were subject to impairment testing. Market prices were obtained from international reference price publications for the Atlantic salmon published by Urner Barry Publications Inc. in its report "Urner Barry's Seafood Price-Current” and for Pacific salmon from DataSalmon for the Japanese market.
The Company has chosen to migrate to the valuation method detailed in Note 2.8, with effect from these financial statements. This model values all fish at marine grow-out sites at fair value, where the value of the concession has been incorporated as part of the farming risk, in accordance with the definition in IAS 41. Therefore, a valuation model has been adopted that calculates the Fair Value Adjustment (FVA) by applying a risk factor to the expected biomass margin at each marine grow-out site. Changes in the fair value of biological assets are recorded in the consolidated statement of net income for the period. All biological assets are classified as current biological assets, as they form part of the normal farming cycle that concludes with harvesting the fish. The Company has applied the new valuation model retroactively for comparison purposes to its financial statements as of December 31, 2018.
As of December 31, 2019, the subsidiary Salmones Camanchaca had a one third interest in a trout joint venture. However, as this is not a separate legal entity from the joint venture Manager, Caleta Bay, the Company does not exercise joint control or significant influence over the key decisions of this business. The Manager is fully responsible for the entire value chain, it operates this business in its own name and its own risk, and is liable to the aquaculture, sanitary, environmental or other authorities. The only assets that Salmones Camanchaca contribute to this trout joint venture are the concessions where the fish are farmed, and it receives variable compensation associated with this contribution. Therefore, it does not comply with the definition of a joint venture for accounting purposes, nor can it be measured at fair value as a financial asset under IFRS 9, since the Company's accounting policy is to value concessions at cost. As the concessions contributed by Salmones Camanchaca to the trout joint venture have never been legally transferred to the Manager, these concessions cannot be valued at fair value, according to IAS 10. Therefore, the Company's accounting policy is to recognize one third of the trout joint venture earnings in Other income and losses within the consolidated statement of net income by function and not within operating income, which is recycled annually. This was a change with respect to the financial statements as of December 31, 2018.
The Company has restated the financial statements as of December 31, 2018, in accordance with International Financial Reporting Standards, recording these changes of accounting policies with a decrease in biological assets of ThUS$157, a decrease in the deferred tax liability of ThUS$43 and a decrease in equity of ThUS$114. All the biological assets were amended were reclassified as current, as the normal farming cycle concludes with harvesting the fish. These effects are as follows.

23
CONSOLIDATED STATEMENTS OF FINANCIAL POSITION (December 31, 2018 restated) Original
presentation
Differences Restated
Assets
As of December 31,
2018
Change in Accounting
Policy
Reclassification
As of December 31,
2018
ThUS$ ThUS$ ThUS$ ThUS$
Current assets
Other non-financial assets, current 9,860 - 9,441 19,301
Trade and other receivables, current 88,046 - (10,707) 77,339
Biological assets, current 117,990 (157) 20,582 138,415
Other assets, current 89,136 - - 89,136
Total current assets 305,032 (157) 19,316 324,191
Non-current assets
Biological assets, non-current 20,582 - (20,582) -
Other assets, non-current 359,566 - - 359,566
Total non-current assets 380,148 - (20,582) 359,566
Total assets 685,180 (157) (1,266) 683,757
Liabilities
Original presentation
Differences Restated
As of December 31,
2018
Change in Accounting
Policy
Reclassification As of
December 31, 2018
ThUS$ ThUS$ ThUS$ ThUS$
Current liabilities
Trade and other payables, current
Other provisions
Employee benefit provisions, current
Other current liabilities
108,548
2,556
8,964
-
-
-
-
(8,725)
7,459
152
-
99,823
7,459
2,708
8,964
Total current liabilities 120,068 - (1,114) 118,954
Non-current liabilities
Deferred tax liabilities
Employee benefit provisions, non-current
Other liabilities, non-current
16,168
1,261
80,708
(43)
-
-
1
(153)
-
16,126
1,108
80,708
Total non-current liabilities
98,137 (43) (152) 97,942
Equity
Retained earnings (accumulated losses)
Equity attributable to owners of the parent company
Other equity
20,808
355,726
90,441
(114)
-
-
34
(34)
-
20,728
355,692
90,441
Total equity
Total equity and liabilities
466,975
685,180
(114)
(157)
-
(1,266)
466,861
683,757

24
The effect of the change in policy on net income is ThUS$ 5,221 for the positive fair value adjustment, and for ThUS$ 1,931 for the negative taxes, with the trout joint venture reclassified as previously explained. This information is shown as follows.
CONSOLIDATED STATEMENTS OF NET INCOME BY FUNCTION (December 31, 2018 restated)
For the year
ended December 31,
2018
Original presentation
ThUS$
Change in accounting
policy
ThUS$
Reclassifications
ThUS$
As of
December 31, 2018
Restated
ThUS$
Operating revenue 629,370 (2,890) 626,480
Cost of sales (491,766) (491,766)
Gross margin 137,604 - (2,890) 134,714
Net fair value adjustments to biological assets (4,825) 7,152 - 2,327
Administrative expenses (31,230) (31,230)
Distribution costs (28,550) (28,550)
Financial costs (10,171) (10,171)
Share of net income of equity method associates 1,650 1,650
Exchange differences (2,993) (2,993)
Other income (losses) (1,168) 2,890 1,722
Financial income 53 53
Net income before taxes 60,370 7,152 - 67,522
Income tax (expense) income (16,156) (1,931) (18,087)
Net income (loss) from continuing operations 44,214
5,221
-
49,435
Net income (loss) from discontinued operations
Net income (loss) for the year 44,214 5,221 - 49,435
The consolidated statement of comprehensive income was amended as follows.
CONSOLIDATED STATEMENTS OF COMPREHENSIVE INCOME (December 31, 2018 restated) Original
presentation
Differences Restated
As of December 31, 2018
Change in Accounting
Policy
Reclassifications
As of December 31, 2018
ThUS$ ThUS$ ThUS$ ThUS$
Net income for the year 44,214 5,221 - 49,435
Gain (loss) from cash flow hedge (40) - - (40)
Gain (loss) from foreign currency translation (519) - - (519)
Gain from change in ownership 51,236 - - 51,236
Total comprehensive income 94,891 5,221 - 100,112
Total comprehensive income (loss) attributable to: - 0
Owners of the parent company 81,559 3,656 - 85,215
Non-controlling interests 13,332 1,565 - 14,897
Total comprehensive income 94,891 5,221 - 100,112
Biological assets as of January 1, 2018 have decreased due to the fair value adjustment and deferred tax liabilities of ThUS$7,308 and ThUS$1,973 respectively and a decrease in equity due to the reduced earnings of ThUS$5,335. Biological assets were reclassified as current as already explained by the fish cycle.

25
CONSOLIDATED STATEMENTS OF FINANCIAL SITUATION (January 1, 2018 restated)
Original presentation
Differences Restated
Assets
As of December 31
2017
Change in Accounting Policy
Reclassifications As of
January 1 2018
ThUS$ ThUS$ ThUS$ ThUS$
Current assets Other non-financial assets, current Trade and other receivables, current Biological assets, current Other assets, current
13,052 80,021
101,979 86,199
- -
(7,308) -
4,204
(4,204) 16,033
17,256 75,817
110,704 86,199
Total current assets 281,251 (7,308) 16,033 289,976
Non-current assets Biological assets, non-current Other assets, non-current
16,033
345,816
- -
(16,033)
0
345,816
Total non-current assets Total assets
361,849 643,100
- (7,308)
(16,033) -
345,816 635,792
Original presentation
Differences Restated
Liabilities
As of December 31,
2017
Change in Accounting Policies
Reclassifications As of
January 1, 2018
ThUS$ ThUS$ ThUS$ ThUS$
Current liabilities Trade and other payables, current Other provisions, current Other liabilities, current
106,981
24,131
- - -
(561)
561 -
106,420
561 24,131
Total current liabilities 131,112 - - 131,112
Non-current liabilities Deferred tax liabilities Other liabilities, non-current
16,330 155,696
(1,973) -
- -
14,357 155,696
Total non-current liabilities
172,026 (1,973) 0 170,053
Equity Retained earnings (accumulated losses) Equity attributable to owners of the parent company
Other equity
(88,614) 284,141 144,435
(5,335)
- -
- - -
(93,949) 284,141 144,435
Total equity Total equity and liabilities
339,962 643,100
(5,335) (7,308)
- -
334,627 635,792
These changes made do not affect the company's statement of cash flow because they are changes in fair value and deferred taxes.
3.2 New standards, interpretations and amendments
The Company applied specific standards, interpretations and amendments for the first time, which are effective for periods beginning on or after January 1, 2019.
The standards, interpretations and amendments to IFRS that became effective at the date of the financial statements, their nature and impacts are as follows:
Standards and Interpretations Mandatory Effective Date
IFRS 16 Leasing January 1, 2019 IFRIC 23 Uncertainty over Income Tax Treatments January 1, 2019
IFRS 16 Leases
IFRS 16 replaces IAS 17 Leases, IFRIC 4 Determining whether an Arrangement Contains a Lease, SIC-15 Operating Leases - Incentives, and SIC-27 Evaluating the Substance of Transactions involving the Legal Form of a Lease. The standard establishes the recognition, measurement, presentation and disclosure principles for leases and requires lessees to account for most leases using a single model.

26
The lessor's accounting under IFRS 16 remains substantially unchanged from IAS 17. Lessors shall continue to classify leases as operating or finance leases using principles similar to those in IAS 17.
IFRS 6 requires that lease contracts that were classified as operating leases with a contract term greater than 12 months have a similar accounting treatment to finance leases. In general terms, this means that right-of-use assets subject to operational lease contracts must be recognized, together with a liability for the present value of the payments associated with the contract.
Monthly lease payments in the statement of net income will be replaced by asset depreciation, together with the corresponding finance charges. If lease contracts are amended, such as the lease value, term, inflation indexation, associated interest rate, etc., the lessee shall recognize any change to the revalued lease liability as an adjustment to the value of the right-of-use asset.
The method adopted by the Company is the simplified retrospective approach.
The Company has determined the following changes in lease commitments that fall within the scope of IFRS 16, as of June 30, 2019.
ThUS$ Total current assets - Total non-current assets 12.992
Deferred tax assets 73
Total current liabilities (2,964)
Total non-current liabilities (10,298)
Total equity (197)
Lease expense 4,274 Interest (947)
Depreciation (3,597) Gain (loss) on deferred taxes 73
Net income (loss) (197)
IFRIC 23 Uncertainty over Income Tax Treatments
The Interpretation addresses accounting for income taxes when tax treatments involve uncertainty that affects the application of IAS 12 Income Taxes. It does not apply to taxes or levies that are outside the scope of IAS 12, nor does it specifically include requirements related to interest and penalties associated with uncertain tax treatment. The Interpretation specifically addresses the following:
• Whether an entity treats uncertain tax positions separately • An entity’s assumptions about the tax authority’s assessment of tax treatments • How an entity determines taxable income (tax losses), tax bases, unused tax losses, unused tax credits, and tax
rates. • How an entity treats changes in facts and circumstances.
The entity must determine whether to treat each uncertain tax position separately, or in conjunction with one or more treatments of uncertain tax positions. The entity should select the approach that best anticipates how to resolve the uncertainty.
IFRIC 23 clarifies how to apply the recognition and measurement requirements of IAS 12 when there is uncertainty regarding income tax treatments. The Company has determined that this standard has no impact on the consolidated financial statements.

27
The standards, interpretations and amendments to IFRS effective as of the date of the financial statements and detailed below had no impact on these financial statements.
Amendments Mandatory effective
date
IFRS 3 Business combinations – previously held interests in a joint operation
January 1, 2019
IFRS 9 Financial instruments – payments with negative compensation
January 1, 2019
IFRS 11 Joint arrangements – previously held interests in a joint operation
January 1, 2019
IAS 12 Income taxes – tax consequences of payments related to financial instruments classified as equity
January 1, 2019
IAS 23 Borrowing costs – borrowing costs eligible for capitalization January 1, 2019
IAS 28 Investments in associates – long-term investments in associates or joint ventures
January 1, 2019
IAS 19 Employee benefits - plan amendments, curtailments or settlements
January 1, 2019
NOTE 4 - Financial risk management
The fishing and aquaculture businesses are exposed to various financial risks: credit risk, liquidity risk, interest rate risk and market risk.
4.1. Credit risk
a) Customer portfolio risk
The Company has no customers in arrears, but not impaired, as of the reporting date. b) Sales risk
The Company uses the usual agreements operating in the industry to market its products. These are contracted with recognized and qualified insurance companies and financial institutions. These agreements are insurance policies covering credit, transport and cargo, confirmation of letters of credit, etc. Where collection is directly performed by the Company, this is substantiated by a long-term business relationship, a full record of payment behavior and recognized financial solvency.
The group has established policies to ensure that product sales on credit are made to customers with an appropriate credit history, to mitigate sales risks. The group mostly sells into the wholesale market, and export sales are supported by letters of credit. Domestic sales are preferably to customers with an appropriate credit history.
4.2. Liquidity risk
The group’s liquidity risks arise from a shortfall of funds for operating costs, financial costs, investments, debt repayments and dividends, compared its sources. This risk is mitigated through prudent liquidity management, which involves holding sufficient cash and marketable securities, together with balanced bank financing.

28
The group has cash and short-term cash equivalents to date that match investment terms to its obligations, thus respecting its investment holding policy, which on average may not exceed the average payment terms for its obligations.
Capital and interest commitments over the terms of bank loans and other commitments are as follows.
a) As of December 31, 2019
Description
Between 1 and
3 months ThUS$
Between 3 and
12 months ThUS$
Between 1 and
5 years ThUS$
Over 5 years
ThUS$
ThUS$ Interest-bearing loans 305 36,469 125,747 - 162,521 Finance lease liabilities 991 2,866 10,092 2,105 16,054 Trade and other payables 85,852 15,101 671 - 101,624 Related party payables 375 - - - 375
b) As of December 31, 2018
Description
Between 1 and
3 months ThUS$
Between 3 and
12 months ThUS$
Between 1 and
5 years ThUS$
Over 5 years ThUS$
ThUS$ Interest-bearing loans 246 4,848 90,806 - 95,900
Trade and other payables 99,171 9,377 302 - 108,850
Related party payables 784 - - - 784
4.3. Market risk
a) Exchange rate risk
The group has selected the US dollar as its functional currency. Therefore, it is exposed to exchange rate risk on transactions in Chilean pesos. The exchange rate risk arises on planned commercial transactions, and on assets and liabilities held in Chilean pesos.
The company’s consolidated statement of financial position as of December 31, 2019 has a net asset in Chilean pesos totaling ThUS$ 16,281 (ThUS$ 21,378 AS of December 31, 2018). Therefore, an increase of 5% in the exchange rate generates an exchange loss of ThUS$ 814, (ThUS$ 1,069 as of December 31, 2018) while a 5% decrease in the exchange rate generates a gain of the same amount.
b) Interest rate risk
Movements in interest rates amend the expected cash flows for assets and liabilities that are subject to variable interest rates.
The companies are exposed to interest rate risks, since their long-term financing is at a variable interest rate, which is amended every six months.
The group has ThUS$ 148,503 in bank liabilities in US dollars as of December 31, 2019 (ThUS$ 81,712 as of December 31, 2018). Sensitivity analysis on the interest rates for bank loans reveal that a 1% pa movement in interest rates at the reporting date would result in additional or lower interest costs of ThUS$ 1,469, as appropriate (ThUS$ 817 as of December 31, 2018).

29
NOTE 5 - Financial Instruments
The Company has financial instruments as of December 31, 2019 and December 31, 2018 valued at their fair value according to the IFRS 9 classification as shown in the following table, and there are no differences between their fair value and book value.
12-31-2019 12-31-2018
Description
Book
value
ThUS$
Fair
value
ThUS$
Book
value
ThUS$
Fair
Value
ThUS$ Financial assets at fair value through profit and loss
Cash and cash equivalents
Cash balances 204 204 147 147
Bank balances 41,669 41,669 30,601 30,601
Financial assets at amortized cost Other financial assets (ii)
361 361 327 327
Trade and other receivables (i) 95,777 95,777 77,339 77,211
Related party receivables (i) 116 116 92 92
Recoverable rights, non-current (ii) 1,252 1,252 1,349 1,349
Financial liabilities at amortized cost
Other financial liabilities (iv) 31,575 31,575 1,306 1,306
Operating lease liabilities (iii) 2,964 2,964 - -
Other financial liabilities, non-current (iv) 116,928 116,928 80,406 80,406
Trade and other payables, current (iv) 100,953 100,953 99,823 99,823
Related party payables (iv) 375 375 784 784
Operating lease liabilities, non-current (iii) 10,299 10,299 - -
Payables, non-current 671 671 302 302
(i) Trade and other receivables
Trade and other receivables are amounts owed by customers for goods sold or services rendered in the ordinary course of business. They are usually settled within a period of 30 days, so are classified as current. Trade and other receivables are initially recognized at the value of the unconditional commitment, unless they contain significant financing components, in which case they are recognized at fair value. The group accepts trade and other receivables with the objective of collecting the corresponding contractual cash flows and subsequently values them at amortized cost using the effective interest method. The details of group impairment policies and calculations of impairment loss provisions are included in Note 10 (Trade and other receivables).
The book values of trade and other receivables are treated as equal to their fair values, due to their short-term nature.
Information about the impairment of trade and other receivables and the group's exposure to credit risk, exchange rate risk and interest rate risk can be found in Note 4 (b) Financial Risk Management.

30
(ii) Other financial assets at amortized cost
The group classifies its financial assets at amortized cost provided they meet the following two criteria:
- The asset is held within a business model that aims to receive contractual cash flows. - The contractual terms give rise to cash flows that are solely receipts of principal and interest.
These amounts generally come from transactions outside the normal course of business for the group.
(iii) Operating lease liabilities
The corresponding lease obligations, net of finance charges, are included in lease liabilities. The interest element of the finance cost is charged to the statement of net income over the lease period so as to produce a constant periodic rate of interest on the remaining balance of the liability for each period.
(iv) Trade and other payables
Trade and other payables are not guaranteed and are generally paid within 60 days of recognition.
The book values of trade and other payables are treated as equal to their fair values, due to their short-term nature.
NOTE 6 - Significant accounting estimates and judgments
The estimates and judgments used are continually evaluated and are based on historical experience and other factors, including expectations of future events that are considered reasonable based on the circumstances.
Significant accounting estimates and judgments
The group produces estimates and judgments about the future. The main accounting estimates are as follows.
a) Useful lives of plant and equipment
Group management determines the estimated useful lives and corresponding depreciation charges for its plant and equipment. Likely changes in estimates could occur as a result of technical innovations and competitor’s measures in response to severe industry cycles. Management will increase the depreciation charge when the actual useful lives are less than previously estimated useful lives, and depreciate or eliminate technically obsolete or non-strategic assets that have been abandoned or sold.
b) Biological assets
The fair valuation of biological assets is based on the reference value of salmon in its current biomass condition.
The fish biomass estimate will always be based on assumptions, even though the Company has ample experience with these factors. The estimates take into account the following components: volume of fish biomass, average biomass weights, distribution of fish weights and market prices.

31
The volume of fish biomass estimate is based on the number of smolts in the sea, their estimated growth and their mortality during the period, etc. Uncertainty with respect to the volume of biomass is normally lower in the absence of mass mortality events or acute diseases during the cycle.
Fish grow at various rates and even though average weights can be accurately estimated, there is always a wide variation in the quality and size of the fish. The distribution of fish quality and size is important, as these attract different prices on the market.
The value of fish biomass is based on a normal weight distribution.
c) Employee severance indemnity provision
Management recognizes in its financial statements the obligation to pay employee severance benefits in the future, as established by IAS 19, based on the corresponding actuarial calculation.
d) Asset impairment
The recoverable amount of property, plant and equipment is revalued annually according to IAS 36, as the company has intangible assets with indefinite lives. Factors that are considered an indication of impairment are declining market values, significant changes in the technological environment, obsolescence or physical deterioration, changes in the way the item is used or expected to be used, including ceasing to use it, etc. The group evaluates whether there is evidence of impairment at each reporting date, and whether the book value of an item of property, plant and equipment or an intangible asset is greater than its value in use.
It evaluates each Cash Generating Unit (CGU), which are Salmon Business, Northern Fishing Business, Southern Fishing Business and Other Seafoof Business.
The group has used a cash flow forecasting model to calculate the value in use of its assets, based on the following assumptions.
1. Ten year evaluation horizon. Investments in the industry are long-term, as are the cycles and risks
that affect the biomass. Therefore, a horizon of less than 10 years does not reflect the company’s long term situation.
2. Residual value. The residual value at the end of the horizon.
Forecast cash flows. Cash flows used in the methodology are based on budget data, best estimates and reasonable and substantiated assumptions that represent Management’s best estimates, taking into account the prevailing economic conditions during the remaining useful life of the evaluated assets. The most important assumptions are:
2.1. Sales and production volumes. 2.2. Estimated annual inflation of 3% and its impact on prices, sales and administration costs, and
other costs.
3. Cash flow forecasts are brought to present value using a discount rate that reflects the time value of money and the risks specific to the asset. The Weighted Average Cost of Capital (WACC) rate is used, calculated on the basis of the following variables: The company or industry beta; the risk-free rate of return; the market rate of return; the cost of the Company’s financial debt; and the long-term target debt/equity ratio.

32
This evaluation resulted in no indications of asset impairment in any CGU.
Except for the estimated biomass fair value of the biological assets, Management believes that these consolidated financial statements do not contain any assumptions about the future or other uncertain estimates that risk causing significant adjustments to this accounting period and the next.
NOTE 7 - Segment reporting
The group segments its financial information by business, which is aligned with how Management operate the business, since Management and the Board of Directors manage the business using the same classification.
a) Fishing Business
Fishmeal Fish oil Canned Jack mackerel Frozen langostino lobster Frozen Jack mackerel
The group is involved in the extractive fishing business, and holds a significant position in the two main fishing areas in Chile. It operates in the 15th, 1st and 2nd regions in northern Chile, while the central-southern zone covers the rest of Chile, with the exception of the 11th and 12th region that are based in Coronel in the 8th region.
Market
Fishmeal is mainly sold on the Asian markets, especially China, which represents an average of about 60% of the group's sales, and to the Chilean salmon farming feed industry. Fish oil for human consumption is mainly sold into the European market, where it is used in the feed additive and pharmaceutical industry.
Canned fish is a product made mainly from Jack mackerel in a one-pound can. Its high protein and omega 3 content and low cost make it a product in high demand for human consumption. Frozen Jack mackerel is a product for human consumption that is mostly sold to emerging markets. The langostino lobster is a highly appreciated crustacean for its taste and nutritional characteristics. It is sold in IQF format in various packages, including institutional packaging and retail format. This product is mainly exported to the United States.
b) Salmon business
The group aims to participate in every stage of the production process, and introduce the latest technology to each link in the value chain. Market
Atlantic salmon is sold as Trim C, D, and E, HG and Hon fillets, in 4, 5, 6, and 8 oz. fresh and frozen portions. The group prepares its products in plants in Tomé and Puerto Montt. They are mainly sold into the North American, Japanese and Brazilian markets.

33
c) Seafood business
This business comprises:
Mussel farming Abalone farming
The mussel concessions are concentrated in three large farming areas. They are all operational and located in the 10th region. They all have their own land-based facilities and direct access to their farms, which improves supply logistics.
The group has two land farming sites that produce Abalone, located in the 3rd region, and a frozen abalone processing plant.
Markets
The group produces and markets mussels as frozen mussel flesh and whole frozen vacuum-packed mussels. The group's comprehensive distribution network grants it to access several markets around the world and first class customers.
The group mainly markets its abalone products to Japan, United States, Hong Kong, China, Vietnam and Singapore, through IQF products and cans.
The segment operating results for the year ended December 31, 2019 are as follows:
Industrial
Fishing
ThUS$
Salmon
Farming
ThUS$
Other
Seafood
ThUS$
Total
ThUS$
Operating revenue 157,621 435,576 26,833 620,030
Cost of sales (140,003) (343,998) (20,773) (504,774)
Net fair value adjustments to biological assets - 311 - 311
Administrative expenses (7,426) (9,331) (2,515) (19,272)
Distribution costs (12,307) (13,125) (3,096) (28,528) Financial costs (2,969) (4,901) (211) (8,081)
Share of profit (loss) of associates 50 1,604 - 1,654
Exchange differences (2,103) (1,082) 111 (3,074)
Other income (losses) (7,200) (6,717) (6) (13,923)
Financial income - 37 - 37
Income tax benefit (expense) 3,601 (15,126) 65 (11,460) ====== ====== ====== ======
Net income (10,736) 43,248 408 32,920 ====== ====== ====== ======
Net income attributable to the parent company
(10,330) 30,542 408 20,620
Net income attributable to non-controlling interests
(406) 12,706 - 12,300
====== ====== ====== ======
Net income (10,736) 43,248 408 32,920

34
The segment operating results for the year ended December 31, 2018 are as follows:
Industrial
Fishing
ThUS$
Salmon
Farming
ThUS$
Other
Seafood
ThUS$
Total
ThUS$
Operating revenue 163,167 433,406 29,907 626,480
Cost of sales (127,635) (338,215) (25,916) (491,766)
Net fair value adjustments to biological assets - 2,327 - 2,327
Administrative expenses (13,687) (13,928) (3,615) (31,230)
Distribution costs (11,124) (13,665) (3,761) (28,550)
Financial costs (3,513) (6,470) (188) (10,171)
Share of profit (loss) of associates 21 1,629 - 1,650
Exchange differences (2,108) (1,310) 425 (2,993)
Other income (losses) (110) 1,820 12 1,722
Financial income 4 49 - 53
Income tax benefit (expense) (1,295) (17,547) 755 (18,087) ====== ====== ====== 0
Net income 3,720 48,096 (2,381) 49,435 ====== ====== ====== ======
Net income attributable to the parent company
3,493 33,326 (2,381) 34,438
Net income attributable to non-controlling interests
227 14,770 - 14,997
====== ====== ====== ======
Net income 3,720 48,096 (2,381) 49,435
The segment assets, liabilities and cash flow as of December 31, 2019 are as follows.
Industrial Fishing ThUS$
Salmon Farming ThUS$
Other Seafood ThUS$
Other ThUS$
Total ThUS$
Current assets 66,325 301,255 20,482 - 388,062
Non-current assets 201,464 135,410 27,351 30,368 394,593
Current liabilities 28,627 113,835 4,400 - 146,862 Non-current liabilities 37,641 109,440 2,483 (451) 149,113
Cash flows from (used by) operating activities
Cash flows from (used by) financing activities
Cash flows from (used by) investing activities
8,027 19,206 (62) - 27,171
23,630 24,630 1,222 - 49,482
(21,752) (40,509) (1,771) - (64,032)
The segment assets, liabilities and cash flow as of December 31, 2018 are as follows.
Industrial Fishing ThUS$
Salmon Farming ThUS$
Other Seafood ThUS$
Other ThUS$
Total ThUS$
Current assets 56,621 247,967 19,603 - 324,191 Non-current assets 195,155 114,809 26,657 22,945 359,566 Current liabilities 21,510 92,756 4,688 - 118,954 Non-current liabilities 30,491 65,015 2,400 36 97,942

35
Cash flows by segment AS of December 31, 2018 are as follows.
Industrial Fishing ThUS$
Salmon Farming ThUS$
Other Seafood ThUS$
Other ThUS$
Total ThUS$
Cash flows from (used by) operating activities
Cash flows from (used by) financing activities
Cash flows from (used by) investing activities
3,104
6,050
(15,442)
55,628
1,988
(31,675)
1,856
2,018
(1,905)
-
-
-
60,588
10,056
(49,022)
Segment operating revenue by market for the year ended December 31, 2019 are as follows.
Market
Industrial Fishing ThUS$
Salmon Farming ThUS$
Other Seafood ThUS$
Total
ThUS$ USA 16,821 209,021 12,068 237,910
Europe + Eurasia 3,392 62,493 9,243 75,128
Asia, except Japan 36,485 24,802 1,114 62,401
Japan 8,820 37,913 3,260 49,993
LATAM, except Chile 9,201 69,727 303 79,231
Chile 49,283 26,936 695 76,914
Others 33,619 4,684 150 38,453
Total 157,621 435,576 26,833 620,030
Segment operating revenue by market for the year ended December 31, 2018 are as follows.
Market Industrial Fishing ThUS$
Salmon Farming ThUS$
Other Seafood ThUS$
Total
ThUS$ USA 15,585 194,341 13,451 223,377
Europe + Eurasia 5,720 97,376 10,302 113,398
Asia, except Japan 53,574 28,188 1,241 83,003
Japan 6,046 16,500 3,634 26,180
LATAM, except Chile 8,994 74,037 338 83,369
Chile 43,657 20,067 774 64,498
Others 29,591 2,897 167 32,655
Total 163,167 433,406 29,907 626,480
The company has no foreign final customers that represent more than 10% of sales. The company has no foreign assets representing the 10% or more of the total.
NOTE 8 - Cash and cash equivalents
Cash and cash equivalents are as follows.
12-31-2019 ThUS$
12-31-2018 ThUS$
Cash balances 204 147 Bank balances 41,669 30,601
Total cash and cash equivalents 41,873 30,748
Balances by currency are shown in Note 33 (Foreign currency assets and liabilities).

36
NOTE 9 - Other current and non-current financial assets
Other financial assets held to maturity are as follows.
12-31-2019 12-31-2018
Current
ThUS$
Non-current
ThUS$
Current
ThUS$
Non-current
ThUS$
Lease guarantees 251 - 213 -
Performance bonds 110 - 112 -
Others - - 2 -
Investments in other companies - 701 - 701
Total 361 701 327 701
NOTE 10 - Trade and other receivables
Trade and other receivables are as follows.
12-31-2019 12-31-2018
Trade receivables
Doubtful debt
provision
Net trade receivables
Trade receivables
Doubtful debt
provision
Net trade receivables
Customers 92,170 (528) 91,642 73,712 (514) 73,198 Insurance claims - - - 941 - 941 Miscellaneous receivables 3,751 - 3,751 1,676 - 1,676 Staff receivables 384 - 384 364 - 364 Notes receivable - - - 1 (1) - Others - - - 1,160 - 1,160 Total Current Assets 96,305 (528) 95,777 77,854 (515) 77,339
Compañía Pesquera Camanchaca S.A. does not have any receivables that are guaranteed or renegotiated or any payments that have been rejected and have entered a judicial collection process. It has not factored any of its receivables during 2019 and 2018.
The company has no financial assets as of the reporting date that are in arrears and not impaired.
The classification of debtors by maturity, net of the impairment provision, is as follows.
12-31-2019 12-31-2018
Overdue ranges
Number of
customers
non-
renegotiated
portfolio
Gross non-renegotiated
portfolio ThUS$
Impairme
nt provision
ThUS$
Net trade
receivables ThUS$
Number of
customers
non-
renegotiate
d portfolio
Gross non-renegotiated
portfolio ThUS$
Impairment provision
ThUS$
Net trade
receivables ThUS$
Not yet due 333 47,930 - 47,930 795 66,762 - 66,762 1-30 days 221 11,192 - 11,192 201 8,485 - 8,485 31-60 days 87 2,422 - 2,422 21 1,490 - 1,490 61-90 days 41 589 - 589 17 88 (37) 51 91-120 days 28 993 - 993 2 250 (100) 150 121-150 days 38 396 - 396 5 95 (1) 94 151-180 days 45 933 (122) 811 5 21 1 22 181-210 days 29 88 (7) 81 1 51 (27) 24 211-250 days 29 557 (48) 509 9 11 (6) 5 >250 days 31 2,089 (351) 1,738 66 601 (345) 256 Total 882 67,189 (528) 66,661 1,122 77,854 (515) 77,339

37
Movements in the non-collectable portfolio were as follows:
12-31-2019 ThUS$
12-31-2018 ThUS$
Opening balance
Reversal for payments received
Increases
(515)
712
(725)
(206)
145
(454) Closing balance (528) (515)
NOTE 11 - Related party balances and transactions
1) Related party receivables are as follows:
1.1 Current
Chilean ID number
Country
Transaction term
Currency
12-31-2019
Current
ThUS$
12-31-2018
Current
ThUS$
Scallop Chile S.A. 76,515,665-3 Chile Under 30 days Ch$ 97 73
Jorge Fernández Valdés 3,189,057-8 Chile Under 30 days Ch$ 19 19
Total 116 92
1.2 Non-current
Chilean ID number
Country
Transaction term
Currency
12-31-2019
Non-current ThUS$
12-31-2018
Non-current ThUS$
Soc. Inmobiliaria Cabilantago Ltda. 79,845,260-6 Chile No defined term Ch$ 2,208 2,314
Total 2,208 2,314
* The non-current receivable from Sociedad Inmobiliaria Cabilantago Ltda. arose from loans to the latter to acquire land. The company's intention is to keep this land. Therefore, this receivable does not have a defined term. It is linked to changes in the CPI.
2) Related party payables are as follows:
Chilean ID
number
Country
Transaction term
Currency
12-31-2019 12-31-2018
Current Current
ThUS$ ThUS$ Frigorífico Pacífico S.A. 77,858,550-2 Chile Under 30 days Ch$ 202 428 Inversiones Los Fresnos Ltda. 78,172,330-4 Chile Under 30 days Ch$ 53 129 Surproceso S.A. 76,346,370-2 Chile Under 30 days Ch$ - 97 Scallop Chile S.A. 76,515,665-3 Chile Under 30 days Ch$ 20 20 Serv y Asesoría CxW Chile Ltda. 76,049,608-1 Chile Under 30 days Ch$ - 5 Codepack S.A. 96,974,100-8 Chile Under 30 days Ch$ 21 22 Méndez y Fernández Ltda. 78,022,530-0 Chile Under 30 days Ch$ 22 23 Alessandri y Cia. Ltda. 79,784,430-6 Chile Under 30 days Ch$ - 2 Transporte Pacifico Ltda 79,874,550-6 Chile Under 30 days Ch$ - 2 Servicios de Gestión Ambiental S.A. 78,431,420-0 Chile Under 30 days Ch$ 2 - Soc. Inmobiliaria Cabilantago Ltda. 79,845,260-6 Chile Under 30 days Ch$ - 56
New World Currents 96,974,100-8 Hong Kong
Under 30 days US$ 55 -
Total 375 784

38
3) Transactions with related companies and entities for over ThUS$20 are as follows.
12/31/2019 12/31/2018
Company
Chilean ID number
Country
Relationship
Description
Currency
Amount
ThUS$
Effect on
net income
(charge)/
credit
ThUS$
Amount
ThUS$
Effect on net
income
(charge)/
credit
ThUS$
Frigorífico Pacifico S.A. 77,858,550-2 Chile Director and subsidiary shareholder
Leased refrigerators Ch$ 2,732 (2,296) 3,697 (3,107)
Inversiones Los Fresnos Ltda. 78,172,330-4 Chile Shareholder Office leases Ch$ 854 (733) 967 (813)
Surproceso S.A. 76,346,370-2 Chile Associate Salmon processing Ch$ 2,488 - 3,094 -
Soc. Inmobiliaria Cabilantago Ltda. 79,845,260-6 Chile Associate Real estate lease Ch$ 271 (228) 105 (88)
Servicios y Asesorías CXW Chile Ltda. 76,049,608-1 Chile Related Associate Commissions Ch$ 94 (79) 89 (75)
Jorge Fernández Valdés 3,189,057-8 Chile Shareholder Product sales Ch$ 54 45 107 90
Codepack S.A. 96,974.100-8 Chile Related Director Packaging Ch$ 246 (207) 134 (113)
Scallop Chile S.A. 76,515,665-3 Chile Related shareholder Real estate lease Ch$ 44 44 47 47
Scallop Chile S.A. 76,515,665-3 Chile Related shareholder Seed purchases Ch$ 24 17 4 -
Scallop Chile S.A. 76,515,665-4 Chile Related shareholder Product purchases Ch$ 51 - - -
Comercial Panamericana 85,714,200-4 Chile Related shareholder Product sales Ch$ 627 198 1,167 169
New World Currents Inc. Foreign Hong Kong
Associate Commissions Ch$ 98 (98) - -
Remuneration and benefits received by the Board and group senior executives.
The group are managed by their respective boards of directors, who have received fees of ThUS$ 1,146 during 2019 (ThUS$ 1,060 in 2018).
Remuneration of group senior executives during 2019 was ThUS$2,515 (ThUS$ 3,411 in 2018).

39
NOTE 12 - Inventories
Inventories as of each reporting date are as follows.
Unit of
Measure
12/31/2019 12/31/2018
Quantity ThUS$ Quantity ThUS$
Atlantic and Pacific salmon* Kilo 5,707,903 44,782 3,692,319 22,894
Fishmeal* Tons 5,304 5,755 5,003 6,538
Canned fish* Box (24 cans) 366,938 4,185 293,179 3,608
Mussels* Kilo 1,563,588 2,804 1,227,586 2,765
Frozen Jack mackerel* Tons 473 295 3,549 1,859
Langostino lobster* Kilo 130,194 1,750 137,079 1,606
Abalone* Kilo 56,913 1,068 22,236 573
Fish oil* Tons 1,411 1,581 459 431
Other products* N/A - 90 - 8
Fair value of salmon harvested but not sold* N/A - 2,639 - 4,299
Production supplies N/A N/A 14,056 N/A 11,860
Net realizable value provision* N/A N/A (1,403) N/A (362)
Decrease in provisions (933) (782)
Total 76,669 55,297
* Total finished product inventory at net realizable value plus fair value.
Quantities are for finished products and differences in processes, qualities or value added are not distinguished.
Group inventories are valued at the lower of cost or net realizable value.
12.1 Information on finished products
The Company has not written off any finished products at the reporting dates.
12.2 Reconciliation of finished products
Movements in finished products are as follows. 12-31-2019
ThUS$
12-31-2018
ThUS$
Opening balance 44,219 60,912
Increases for production costs 261,057 259,152
Increases for harvested biological assets 210,240 165,466
Cost of sales (448,908) (438,619)
Fair value of harvested biological assets in inventory 79,520 97,950
Fair value of harvested biological assets sold (81,179) (100,280)
Net realizable value provision (1,403) (362)
Closing balance 63,546 44,219

40
Cost of sales is composed as follows.
12-31-2019
ThUS$
12-31-2018
ThUS$
Cost of products sold 448,908 438,619
Cost of services 2,046 5,798
Cost of smolts sold 2,157 -
Cost of fallow periods 50,347 46,380
Mortality costs 1,316 969
TOTAL 504,774 491,766
NOTE 13 - Biological assets
Biological assets are as follows.
12-31-2019 12-31-2018
Item ThUS$ ThUS$
Salmon 142,615 131,687
Abalone 2,828 2,501
Mussels 5,299 4,227
Total 150,742 138,415
Movements in biological assets are as follows. 12-31-2019
ThUS$ 12-31-2018
ThUS$
Opening balance as of January 1 138,415 110,704
Increases due to growing-out, production and purchasing 226,671 189,366
Decreases due to sales and harvesting (212,397) (165,466)
Fair value adjustment for the period 81,491 95,299
Fair value of harvested biological assets, transferred to inventories (79,520) (90,642)
Fish mortality (3,920) (969)
Reverse (increase) in net realizable value adjustment provision 2 123
Closing balance 150,742 138,415
Biological assets are as follows:
Biomasses as of 12/31/2019
Thousand units
Final biomass
Ton
Production costs
ThUS$
Fair value adjustments
ThUS$
Total Cost
ThUS$ Fish in sea water 12,337 32,368 113,385 15,631 129,016
Fish in fresh water 21,276 643 13,599 - 13,599
Farmed mussels - 32,651 5,298 - 5,299
Farmed abalone 4,453 - 2,828 2,828
Total 135,110 15,631 150,742

41
Biomasses as of 12/31/2018 Thousand
units
Final biomass
Ton
Production costs
ThUS$
Fair value adjustments
ThUS$
Value provision
(*)
ThUS$
Total Cost
ThUS$
Fish in sea water 12,985 24,670 107,438 13,659 - 121,097
Fish in fresh water 23,190 578 10,590 - - 10,590
Farmed mussels - 29,709 4,227 - - 4,227
Farmed abalone 4,522 - 2,503 - (2) 2,501 Total 124,758 13,659 (2) 138,415
(*) The net realizable value provision is for farmed fish and aquaculture that are ready to be harvested but are still being farmed.
Movements in the fair value adjustment of biological assets and inventories are as follows.
12-31-2019 ThUS$
12-31-2018 ThUS$
Opening fair value of biological assets and inventories 17,959 15,633 Biological increase in the year 81,490 95,299 Less: Sales of biological assets in fair value adjustment (81,179) (92,973)
Closing balance 18,270 17,959
Sensitivity analysis on the effect on fair value, due to an increase or decrease in price at the reporting date is as follows.
Change in ThUS$
Species Increase
US$0.1 Decrease
US$0.1 Increase US$0.2
Decrease US$0.2
Salmon 1,235 (1,223) 2,480 (2,431)
NOTE 14 - Other current and non-current non-financial assets
Other current and non-current non-financial assets are as follows.
12-31-2019 12-31-2018
Current
ThUS$
Non-current
ThUS$
Current
ThUS$
Non-current
ThUS$
Artisanal Fishermen (*) - 17,010 - 18,730 Insurance policies 2,469 - 4,806 - Fishing licenses 885 - - - Langostino lobster fishing permits 1,341 - 1,360 -
Recoverable taxes 8,545 - 9,441 -
Water supply agreement - - 338 -
Prepaid rent 4 - 2 -
Prepaid expenditure at sites 853 - 1,590 -
Other prepaid expenditure 1,701 139 1,764 139
Total 15,798 17,149 19,301 18,869
(*) Resources for artisanal fishermen, which are paid for with supplies of fish.

42
NOTE 15 - Equity method investments
Investments in associates as of December 31, 2019 are as follows.
Chilean ID number
Name Country Investments in associate
ThUS$
Interest
% 79,845,260-6 Soc Inmobiliaria Cabilantago Ltda. Chile 66 46.78 76,346,370-2 Surproceso S.A. Chile 4,750 33.33
Foreign New World Currents Inc. Hong Kong 55 25.00 Total 4,871
Investments in associates as of December 31, 2018 are as follows.
Chilean ID number
Name Country Investmen
ts in associate ThUS$
Interest
%
79,845,260-6 Soc Inmobiliaria Cabilantago Ltda. Chile 17 46.78 76,346,370-2 Surproceso S.A. Chile 4,681 33.33
Foreign New World Currents Inc. Panama 1 25.00 Total 4,699
The assets and liabilities of associated companies are as follows.
12-31-2019 12-31-2018
Assets ThUS$
Liabilities ThUS$
Assets ThUS$
Liabilities ThUS$
Current Non-current
7,370 9,382
2,282 14,469
5,204 15,487
1,821 18,870
Total 16,752 16,751 20,691 20,691
The operating income and expenses of associated companies are as follows.
As of 12/31/2019 As of 12/31/2018 Operating revenue 21,586 19,991 Net income of associates 4,823 4,933
NOTE 16 - Tax assets and rights receivable
Current tax assets are as follows.
12-31-2019
ThUS$
12-31-2018
ThUS$
Monthly provisional tax payments 4,436 292
Provisional payment for absorbed profits 985 905
Training expenses, Sence 508 526
Donations 183 199
Labor bonus tax - 117
Other recoverable taxes 614 633
Total 6,726 2,672
Non-current rights receivable are as follows.
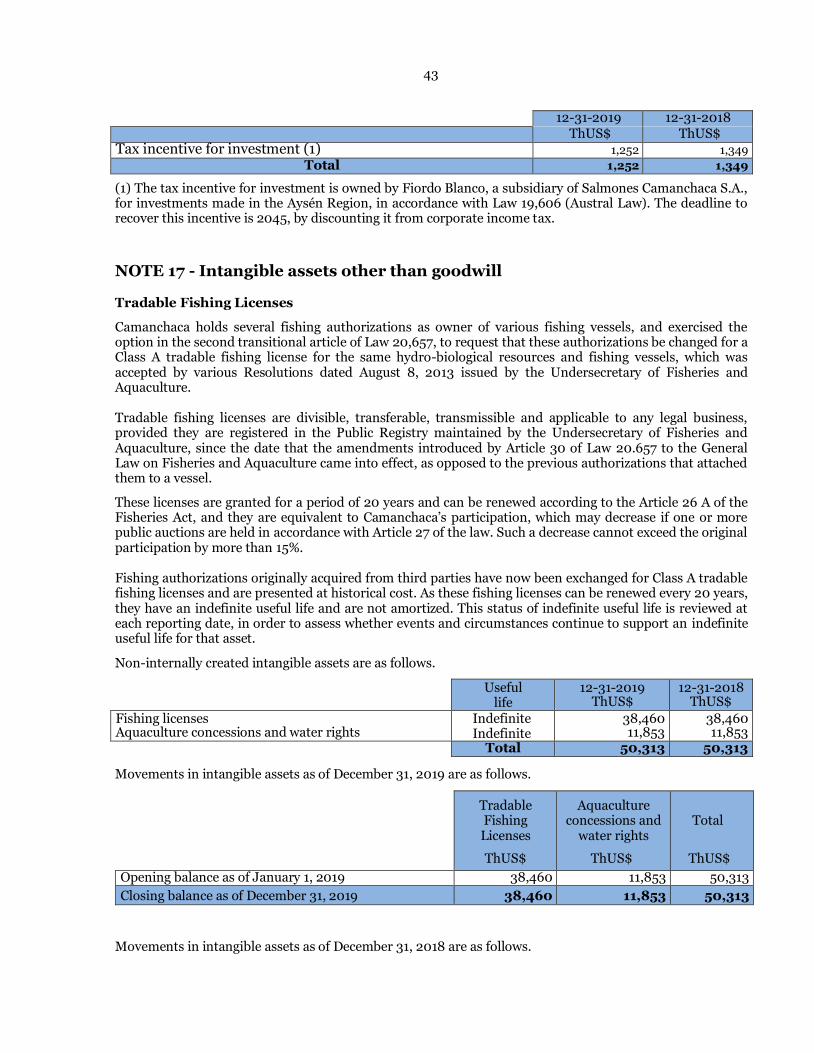
43
12-31-2019 12-31-2018 ThUS$ ThUS$ Tax incentive for investment (1) 1,252 1,349
Total 1,252 1,349
(1) The tax incentive for investment is owned by Fiordo Blanco, a subsidiary of Salmones Camanchaca S.A., for investments made in the Aysén Region, in accordance with Law 19,606 (Austral Law). The deadline to recover this incentive is 2045, by discounting it from corporate income tax.
NOTE 17 - Intangible assets other than goodwill
Tradable Fishing Licenses
Camanchaca holds several fishing authorizations as owner of various fishing vessels, and exercised the option in the second transitional article of Law 20,657, to request that these authorizations be changed for a Class A tradable fishing license for the same hydro-biological resources and fishing vessels, which was accepted by various Resolutions dated August 8, 2013 issued by the Undersecretary of Fisheries and Aquaculture.
Tradable fishing licenses are divisible, transferable, transmissible and applicable to any legal business, provided they are registered in the Public Registry maintained by the Undersecretary of Fisheries and Aquaculture, since the date that the amendments introduced by Article 30 of Law 20.657 to the General Law on Fisheries and Aquaculture came into effect, as opposed to the previous authorizations that attached them to a vessel.
These licenses are granted for a period of 20 years and can be renewed according to the Article 26 A of the Fisheries Act, and they are equivalent to Camanchaca’s participation, which may decrease if one or more public auctions are held in accordance with Article 27 of the law. Such a decrease cannot exceed the original participation by more than 15%.
Fishing authorizations originally acquired from third parties have now been exchanged for Class A tradable fishing licenses and are presented at historical cost. As these fishing licenses can be renewed every 20 years, they have an indefinite useful life and are not amortized. This status of indefinite useful life is reviewed at each reporting date, in order to assess whether events and circumstances continue to support an indefinite useful life for that asset.
Non-internally created intangible assets are as follows.
Useful life
12-31-2019 ThUS$
12-31-2018 ThUS$
Fishing licenses Aquaculture concessions and water rights
Indefinite Indefinite
38,460 11,853
38,460 11,853
Total 50,313 50,313
Movements in intangible assets as of December 31, 2019 are as follows.
Tradable Fishing Licenses
ThUS$
Aquaculture concessions and
water rights
ThUS$
Total
ThUS$
Opening balance as of January 1, 2019 38,460 11,853 50,313
Closing balance as of December 31, 2019 38,460 11,853 50,313
Movements in intangible assets as of December 31, 2018 are as follows.

44
Tradable Fishing Licenses
ThUS$
Aquaculture concessions and
water rights ThUS$
Total
ThUS$
Opening balance as of January 1, 2018 38,460 12,434 50,894 Disposals - (581) (581) Closing balance as of December 31, 2018 38,460 11,853 50,313
Water rights
N° DGA Resolution Water source Location Owner Status
1 494/1990 Superficial and Current Puerto Varas Salmones Camanchaca Granted 2 046/2011 Underground Puerto Varas Salmones Camanchaca Granted 3 200/1998 Superficial and Current Purranque Salmones Camanchaca Granted 4 154/2008 Superficial and Current Puerto Varas Salmones Camanchaca Granted 5 184/2001 Underground Puerto Varas Salmones Camanchaca Granted 6 318/2003 Underground Puerto Varas Salmones Camanchaca Granted 7 235/2009 Underground Puerto Varas Salmones Camanchaca Granted 8 91/2013 Underground Puerto Varas Salmones Camanchaca Granted 9 263/2008 Superficial and Detained Frutillar Salmones Camanchaca Granted
10 356/1998 Superficial and Current Frutillar Salmones Camanchaca Granted 11 001/2010 Underground Frutillar Salmones Camanchaca Granted 12 468/2004 Superficial and Current Cochamo Salmones Camanchaca Granted 13 468/2004 Superficial and Current Puerto Montt Salmones Camanchaca Granted 14 468/2004 Superficial and Current Puerto Montt Salmones Camanchaca Granted 15 468/2004 Superficial and Current Puerto Montt Salmones Camanchaca Granted 16 468/2004 Superficial and Current Cochamo Salmones Camanchaca Granted 17 134/2006 Superficial and Current Cochamo Salmones Camanchaca Granted 18 N/A Superficial and Current Antuco Salmones Camanchaca Granted 19 N/A Superficial and Current Antuco Salmones Camanchaca Granted 20 390/2007 Underground Calbuco Salmones Camanchaca Granted 21 150/2015 Superficial and Current Chaitén Salmones Camanchaca Granted 22 Denied Superficial and Current Chaitén Salmones Camanchaca Denied 23 109/2015 Superficial and Current Chaitén Salmones Camanchaca Granted 24 149/2015 Superficial and Current Chaitén Salmones Camanchaca Granted 25 In process Superficial and Current Puerto Varas Salmones Camanchaca Requested 26 In process Superficial and Current Purranque Salmones Camanchaca Requested 27 012/1998 Superficial and Current Chaitén Fiordo Blanco Granted 28 183/1998 Superficial and Current Chaitén Fiordo Blanco Granted 29 126/1999 Superficial and Current Chaitén Fiordo Blanco Granted 30 360/1998 Superficial and Current Chaitén Fiordo Blanco Granted

45
N° DGA Resolution Water source Location Owner Status 31 1239/1998 Superficial and Current Chaitén Fiordo Blanco Granted 32 124/1999 Superficial and Current Chaitén Fiordo Blanco Granted 33 429/1998 Superficial and Current Chaitén Fiordo Blanco Granted 34 269/1998 Superficial and Current Chaitén Fiordo Blanco Granted 35 692/2000 Superficial and Current Chaitén Fiordo Blanco Granted 36 137/1998 Superficial and Current Chaitén Fiordo Blanco Granted 37 161/2001 Superficial and Current Chaitén Fiordo Blanco Granted 38 356/1997 Superficial and Current Chaitén Fiordo Blanco Granted 39 685/1997 Superficial and Current Purranque Fiordo Blanco Granted 40 246/2006 Superficial and Current Chaitén Fiordo Blanco Granted 41 397/2004 Superficial and Current Chaitén Fiordo Blanco Granted 42 496/2004 Superficial and Current Chaitén Fiordo Blanco Granted 43 In process Superficial and Current Puerto Varas Fiordo Blanco Request 44 74/05-22-2007 Unnamed spring Chonchi Compañía Pesquera Camanchaca S.A. Recorded 45 75/05-22-2007 Unnamed spring Chonchi Compañía Pesquera Camanchaca S.A. Recorded 46 153/07-03-2007 Unnamed spring Chonchi Compañía Pesquera Camanchaca S.A. Recorded 47 77/05-22-2007 Unnamed spring Chonchi Compañía Pesquera Camanchaca S.A. Recorded 48 78/05-22-2007 Unnamed spring Chonchi Compañía Pesquera Camanchaca S.A. Recorded 49 79/05-22-2007 Unnamed spring Chonchi Compañía Pesquera Camanchaca S.A. Recorded 50 018/01-24-2007 Underground Chonchi Compañía Pesquera Camanchaca S.A. Recorded 51 019/01-24-2007 Underground Chonchi Compañía Pesquera Camanchaca S.A. Recorded 52 196/09-12-2008 Estero Rauco Chonchi Compañía Pesquera Camanchaca S.A. Recorded 53 169/09-24-2009 Unnamed spring Curaco de Velez Camanchaca Cultivos Sur S. A. Recorded 54 170/09-24-2009 Unnamed spring Curaco de Velez Camanchaca Cultivos Sur S. A. Recorded 55 035/02-16-2010 Unnamed stream Curaco de Velez Camanchaca Cultivos Sur S. A. Recorded 56 036/02-16-2010 Unnamed spring Quinchao Camanchaca Cultivos Sur S. A. Recorded 57 472/08-28-1995 Unnamed 1 (Estero Castro) Chonchi Compañía Pesquera Camanchaca S.A. Recorded 58 842/08-27-2010 Unnamed 2 (Estero Castro) Chonchi Compañía Pesquera Camanchaca S.A. Recorded 59 472/08-28-1995 Unnamed 4 (Estero Castro) Chonchi Compañía Pesquera Camanchaca S.A. Recorded 61 337/12-15-2008 Unnamed stream Chonchi Compañía Pesquera Camanchaca S.A. Recorded 62 193/09-12-2008 Estero Rauco Chonchi Compañía Pesquera Camanchaca S.A. Recorded

46
Salmonid Concessions
Name
Region
Macro zone
Number Concession
district Neighbo
rhood
Municipality
Sea water or fresh water
Surface area
Status (Use,
Fallow, Other)
Maqui Beach (Lake C.)
X 6 1 Frutillar Fresh 7.5 Fallow
Chaiquen X 1
1 Puerto Varas
Sea Water
3.74
Use
Pucheguin X 1 1 Cochamo Sea Water 3 Fallow Pucheguin coast X 1 1 Cochamo Sea Water 9 Use Farellones X 1 1 Cochamo Sea Water 21.06 Use Marimelli X 1 1 Cochamo Sea Water 24.98 Fallow Chilco River 1 X 1 1 Cochamo Sea Water 6 Use Chilco River 2 X 1 1 Cochamo Sea Water 6.75 Use Cascajal X 1 1 Cochamo Sea Water 9 Use Factoría X 1 1 Cochamo Sea Water 9 Fallow Puelche X 1 2 Hualaihue Sea Water 7.54 Fallow Manihueico X 1 2 Hualaihue Sea Water 15 Use Contao X 1 2 Hualaihue Sea Water 15 Use Chagual River X 1 2 Hualaihue Sea Water 7.2 Fallow Aulen X 1 2 Hualaihue Sea Water 3.25 Fallow San José X 1 3b Calbuco Sea Water 3.75 Fallow Penasmo X 1 3b Calbuco Sea Water 28.56 Fallow Pilpilehue X 3 10b Chonchi Sea Water 32 Use Ahoni X 3 10b Queilen Sea Water 33.45 Use Pumalín X 5 14 Chaitén Sea Water 5.58 Use Islets X 5 14 Chaitén Sea Water 36 Use Edwards X o 15 Chaitén Sea Water 9.04 Fallow Yelcho X 5 16 Chaitén Sea Water 4.5 Fallow Chilco X 5 16 Chaitén Sea Water 6.5 Fallow Fiordo Largo X 5 16 Chaitén Sea Water 6 Fallow Cabudahue X 5 16 Chaitén Sea Water 6 Fallow

47
Name
Region
Macro zone
Number Concession
district Neighbo
rhood
Municipalit
y
Sea water or fresh water
Surface area
Status (Use,
Fallow, Other)
Pillán X 5 16 Chaitén Sea Water 19.63 Fallow Isla Nieves X 5 16 Chaitén Sea Water 6.5 Fallow Puerto Argentino X 5 16 Chaitén Sea Water 6.5 Use Reñihue 3 X 5 16 Chaitén Sea Water 6,32 Fallow Loncochalgua X 5 17 Hualaihue Sea Water 8 Use Porcelana X 5 17 Chaitén Sea Water 18.54 Use Leptepu X 5 17 Chaitén Sea Water 24.5 Use Cahuelmó X 5 17 Hualaihue Sea Water 8 Fallow Piedra Blanca X 5 17 Hualaihue Sea Water 2 Fallow Marilmó X 5 17 Chaitén Sea Water 3 Use Arbolito XI 6 18b Cisnes Sea Water 12.5 Fallow Lamalec XI 6 18b Cisnes Sea Water 12.5 Fallow Noreste Garrao 1 XI 6 18b Cisnes Sea Water 12.5 Fallow Piure Stream XI 6 18b Cisnes Sea Water 12.5 Fallow Filomena 2 XI 6 18b Cisnes Sea Water 12.5 Fallow East Lamalec XI 6 18b Cisnes Sea Water 12.5 Fallow East Filomena XI 6 18b Cisnes Sea Water 12.5 Fallow Chonos XI 6 18c Cisnes Sea Water 12.5 Use Licha XI 6 18c Cisnes Sea Water 12.5 Fallow Garrao XI 6 18c Cisnes Sea Water 12.5 Fallow Gallo Stream XI 6 18c Cisnes Sea Water 12.5 Fallow Suroeste Leucayec XI 6 18c Guaitecas Sea Water 11.08 Use Piure Channel XI 6 18c Cisnes Sea Water 12.5 Use Noreste Francisco XI 6 18d Cisnes Sea Water 12.5 Fallow East Jechica XI 6 18d Cisnes Sea Water 12.5 Fallow South Garrao XI 6 18d Cisnes Sea Water 12.5 Fallow South Jechica XI 6 18d Cisnes Sea Water 12.5 Fallow West Filomena XI 6 18d Cisnes Sea Water 12.5 Fallow

48
Name
Region
Macro zone
Number Concession
district Neighbo
rhood
Municip
ality
Sea water or fresh water
Surface area
Status (Use,
Fallow, Other)
SWest Filomena XI 6 18d Cisnes Sea Water 12.5 Fallow Carmencita XI 6 18d Cisnes Sea Water 6.06 Fallow Forsyth XI 6 19a Cisnes Sea Water 8.45 Use Johnson 1 XI 6 19a Cisnes Sea Water 10.6 Use Johnson 2 XI 6 19a Cisnes Sea Water 6.35 Use
Midhurst XI 6 19a Cisnes Sea Water N/A Fallow Tahuenahuec XI 6 20 Cisnes Sea Water 5,52 Fallow Benjamin XI 6 20 Cisnes Sea Water 50.88 Fallow King XI 6 20 Cisnes Sea Water 29.38 Fallow Punta Alta XI 6 20 Cisnes Sea Water 26.56 Fallow No Name XI 6 20 Cisnes Sea Water 17.84 Fallow South Izaza XI 6 20 Cisnes Sea Water 8.96 Fallow
Martita XI 6 20 Cisnes Sea Water 17.57 Fallow Paso Lautaro XI 6 20 Cisnes Sea Water 9.8 Fallow SWeste Tahuenahuec XI 6 20 Cisnes Sea Water 14.64 Fallow Southeast Izaza XI 6 20 Cisnes Sea Water 6.62 Fallow Port Róbalo XI 6 20 Cisnes Sea Water 14.07 Fallow Williams 1 XI 6 21d Cisnes Sea Water 11.95 Fallow Williams 2 XI 6 21d Cisnes Sea Water 10.28 Fallow
Williams Sector 2 XI 6 21d Cisnes Sea Water N/A Fallow James Sector 2 XI 6 21d Cisnes Sea Water N/A Fallow

49
Mytilid Concessions
Name
Region
Municipality
Sea water or fresh water
Surface
area
Status (Use, Fallow, Other)
Sur Factoría 3 X Cochamo Sea Water 2.5 Fallow Norte Cascajal 1 X Cochamo Sea Water 6.5 Fallow Norte Cascajal 2 X Cochamo Sea Water 6.5 Fallow Pangalito River West X Cochamo Sea Water 2.5 Fallow Northwest Punta Ahoni X Queilen Sea Water 5.68 Use Southeast Punta Terao 1 X Chonchi Sea Water 43.87 Fallow South Punta Terao 2 X Chonchi Sea Water 49.15 Fallow Chilco 3 X Chaitén Sea Water 9 Fallow ESTE PUNTA CHOHEN X Quemchi Sea Water 39.54 Use SUR MORRO QUINTERQUEN X Quemchi Sea Water 59,82 Use OESTE PUNTA CHOHEN X Quemchi Sea Water 17.56 Fallow OESTE PUNTA TELIUPA X Quemchi Sea Water 12.32 Use NORTE PUNTA QUECHUCO 1 X Quemchi Sea Water 30,72 Use SECTOR QUEUDE X Quemchi Sea Water 17.73 Use SUR PUNTA QUECHUCO X Quemchi Sea Water 20.24 Use OESTE ESTERO PUNIE X Quemchi Sea Water 15.58 Use NORTE PUNTA QUECHUCO 2 X Quemchi Sea Water 19.86 Use NOROESTE CHOHEN 1 X Quemchi Sea Water 38.78 Use NOROESTE CHOHEN 2 X Quemchi Sea Water 20.07 Use PUNTA QUECHUCO X Quemchi Sea Water 20 Fallow SURESTE PUNTA QUECHUCO X Quemchi Sea Water 20 Use SUR PUNTA CACHIHUE X Quemchi Sea Water 56.29 Fallow SUROESTE PUNTA CACHIHUE 1 X Quemchi Sea Water 57,31 Fallow SUROESTE PUNTA CACHIHUE 2 X Quemchi Sea Water 57.85 Fallow SUROESTE PUNTA CACHIHUE 3 X Quemchi Sea Water 38.34 Fallow SUROESTE PUNTA CACHIHUE 4 X Quemchi Sea Water 21.78 Fallow RILAN A X Castro Sea Water 102 Use RILAN B X Castro Sea Water 44.93 Use RILAN C X Castro Sea Water 49.34 Use PUNTA PULLAO X Castro Sea Water 35.35 Fallow ESTERO RILAN X Castro Sea Water 12.2 Use NORTE ESTERO RILAN 1 X Castro Sea Water 3.89 Fallow NORTE ESTERO RILAN 2 X Castro Sea Water 4 Use NORTE ESTERO RILAN 3 X Castro Sea Water 4.03 Fallow

50
Name
Region
Municipality
Sea water or fresh water
Surface area
Status (Use, Fallow, Other)
HUENAO 1 X Curaco de Velez Sea Water 21.09 Use HUENAO 2 X Curaco de Velez Sea Water 9.03 Use HUENAO 3 X Curaco de Velez Sea Water 20 Use LA PLANCHADA X Curaco de Velez Sea Water 13.5 Use TANECUHE 1 X Curaco de Velez Sea Water 26.08 Use TANECUHE 2 X Curaco de Velez Sea Water 31.1 Fallow CHANGUITAD X Curaco de Velez Sea Water 21.72 Fallow CHEQUIAN 2 X Quinchao Sea Water 47.99 Fallow CHEQUIAN 1 X Quinchao Sea Water 29.19 Use
PUNTA MACHACO-ISLA QUEHUI X Castro Sea Water 27.13 Use NORTE PELDEHUE-ISLA QUEHUI X Castro Sea Water 40.94 Use PUNTA PINDO-ISLA CHELIN X Castro Sea Water 27.93 Use ALDACHILDO X Curaco de Velez Sea Water 49.85 Use PALQUI X Quinchao Sea Water 75.8 Use QUENAC 1 X Quinchao Sea Water 58.15 Fallow QUENAC 2 X Quinchao Sea Water 39.17 Fallow QUENAC 3 X Quinchao Sea Water 49.07 Fallow QUENAC 4 X Quinchao Sea Water 42.67 Fallow TANECUHE, SECTOR 1 X Curaco de Velez Sea Water 10 Use SECTOR CHOHEN X Quemchi Sea Water 18.76 Fallow PUNTA MATAO 3 X Quinchao Sea Water 18,92 Fallow TANECUHE, SECTOR 3 X Curaco de Velez Sea Water 9 Use PUNTA PULLAO 2 X Castro Sea Water 17.79 Fallow PUNTA MATAO 1 X Quinchao Sea Water 24.46 Fallow PUNTA MATAO 2 X Quinchao Sea Water 14.58 Fallow OESTE ISLA CHELIN X Castro Sea Water 40.96 Fallow LIN-LIN X Quinchao Sea Water 28.48 Fallow LLINGUA X Quinchao Sea Water 42.82 Fallow ESTERO RILAN 2 X Castro Sea Water 33.98 Fallow

51
Oyster, Abalone and Microalgae Concessions
Name
Region
Municipa
lity
Sea water or fresh water
Surface Area
Status (Use, Fallow, Other)
Macroalgae expansion BI III Caldera Sea Water 30.0 Fallow
Macroalgae expansion BI III Caldera Sea Water 15.0 Being renounced
Macroalgas Corchetes III Caldera Sea Water 9.32 Fallow
Hatchery Caldereta III Caldera Sea Water 20.083 Use
Bahía Inglesa (ExCMI) III Caldera Sea Water 524.47 Fallow
Bahía Inglesa (BI 5) III Caldera Sea Water 13.98 Being renounced
Abalone Extension BI III Caldera Sea Water 9.26 Fallow
Bahía Inglesa (BI 4) islotes Copiapinos III Caldera Sea Water 12.72 Being renounced
Obispito III Caldera Sea Water 265.88 Being renounced
Macroalgas Ramada III Caldera Sea Water 40.8 Being renounced
Macroalgas Corchetes III Caldera Sea Water 37.14 Being renounced
Macroalgas Corchetes III Caldera Sea Water 25.1 Being renounced
Punta Pescadores 2 Tierra Ex CMI III Caldera Sea Water 0.37 Being renounced
Punta Pescadores 1 Tierra Camanchaca III Caldera Sea Water 0,541 Being renounced
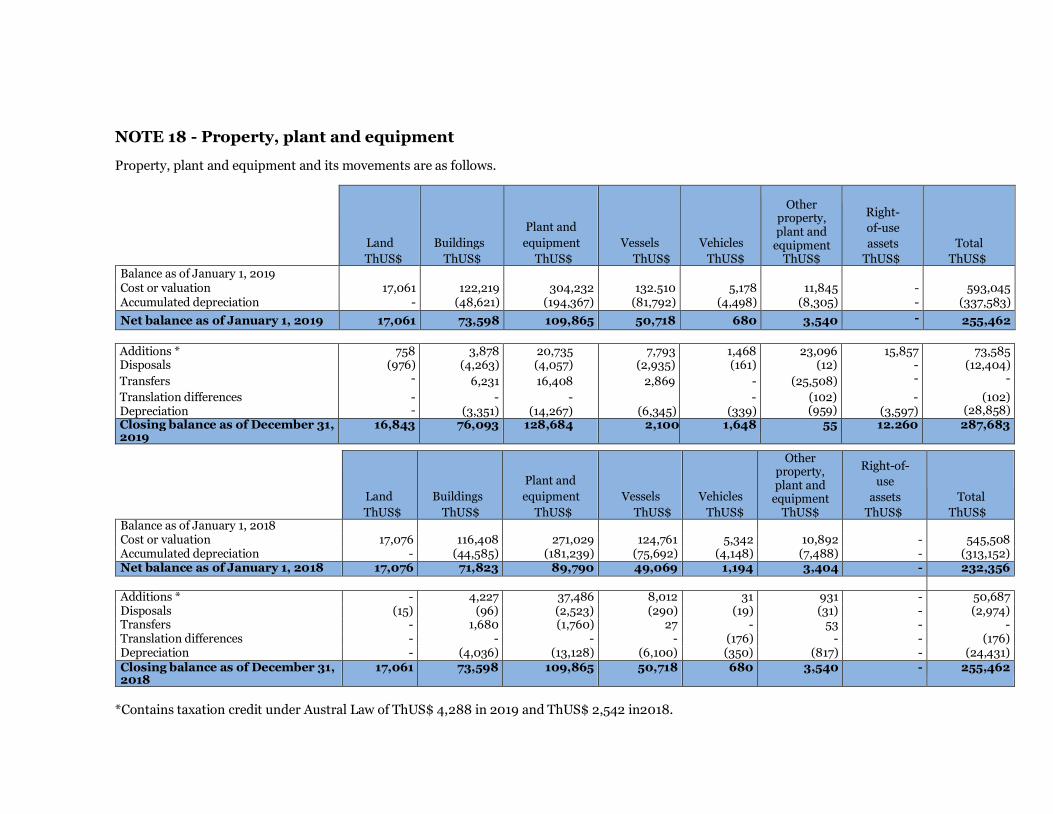
NOTE 18 - Property, plant and equipment
Property, plant and equipment and its movements are as follows.
Land
ThUS$
Buildings
ThUS$
Plant and
equipment
ThUS$
Vessels
ThUS$
Vehicles
ThUS$
Other property, plant and
equipment ThUS$
Right-
of-use
assets
ThUS$
Total
ThUS$ Balance as of January 1, 2019
Cost or valuation 17,061 122,219 304,232 132.510 5,178 11,845 - 593,045 Accumulated depreciation - (48,621) (194,367) (81,792) (4,498) (8,305) - (337,583)
Net balance as of January 1, 2019 17,061 73,598 109,865 50,718 680 3,540 - 255,462
Additions * Disposals
Transfers
758 (976)
-
3,878 (4,263)
6,231
20,735 (4,057)
16,408
7,793 (2,935)
2,869
1,468 (161)
-
23,096 (12)
(25,508)
15,857 - -
73,585 (12,404)
-
Translation differences Depreciation
- -
- (3,351)
- (14,267)
- (6,345)
- (339)
(102) (959)
- (3,597)
(102) (28,858)
Closing balance as of December 31, 2019
16,843 76,093 128,684 2,100 1,648 55 12.260 287,683
Land
ThUS$
Buildings
ThUS$
Plant and
equipment
ThUS$
Vessels
ThUS$
Vehicles
ThUS$
Other property, plant and
equipment ThUS$
Right-of-
use
assets
ThUS$
Total
ThUS$ Balance as of January 1, 2018
Cost or valuation 17,076 116,408 271,029 124,761 5,342 10,892 - 545,508 Accumulated depreciation - (44,585) (181,239) (75,692) (4,148) (7,488) - (313,152) Net balance as of January 1, 2018 17,076 71,823 89,790 49,069 1,194 3,404 - 232,356
Additions * - 4,227 37,486 8,012 31 931 - 50,687 Disposals (15) (96) (2,523) (290) (19) (31) - (2,974) Transfers - 1,680 (1,760) 27 - 53 - - Translation differences - - - - (176) - - (176) Depreciation - (4,036) (13,128) (6,100) (350) (817) - (24,431) Closing balance as of December 31, 2018
17,061 73,598 109,865 50,718 680 3,540 - 255,462
*Contains taxation credit under Austral Law of ThUS$ 4,288 in 2019 and ThUS$ 2,542 in2018.

53
Property, plant and equipment as of December 31, 2019 is as follows.
Gross value
ThUS$
Accumulated depreciation
ThUS$
Net value
ThUS$ Land 16,843 - 16,843 Buildings 128,065 (51,972) 76,093 Plant and equipment 337,318 (208,634) 128,684 Vessels 140,237 (88,137) 52.100 Vehicles 6,485 (4,837) 1,648 Other property, plant and equipment 9,319 (9,264) 55 Right-to-use assets 15,857 (3,597) 12,260
Total 654,124 (366,441) 287,683
Property, plant and equipment as of December 31, 2018 is as follows.
Gross value
ThUS$
Accumulated Depreciation
ThUS$
Net value
ThUS$ Land 17,061 - 17,061 Buildings 122,219 (48,621) 73,598 Plant and equipment 304,232 (194,367) 109,865 Vessels 132,510 (81,792) 50,718 Vehicles 5,178 (4,498) 680 Other property, plant and equipment 11,845 (8,305) 3,540
Total 593,045 (337,583) 255,462
a) Valuation
Management has chosen the cost model as its accounting policy, and has applied this policy to all items in property, plant and equipment.
b) Depreciation method
The depreciation method applied to all items of property, plant and equipment (excluding land) is the straight line method, which produces a constant expense over their useful life.
The distribution of the depreciation expense is as follows.
2019
ThUS$
2018
ThUS$
Administrative expenses 503 1,880
Distribution costs 291 146 Production 28,064 22,405
Total 28,858 24,431
c) Property, plant and equipment subject to guarantees or restrictions
The group has mortgaged and pledged property, plant and equipment, to guarantee the syndicated loan for Compañía Pesquera Camanchaca S.A. and Salmones Camanchaca S.A. (Note 35).
d) Insurance
The group has insurance policies to cover the risks to items of property, plant and equipment, including in some cases loss of profit or loss due to strikes.

54
The group constantly analyzes its insurance cover to ensure that it is reasonable when compared to the risks inherent to its business.
e) The gross value of property, plant and equipment that are fully depreciated and still in use are as
follows. 12-31-2019
Gross value ThUS$
12-31-2018 Gross value
ThUS$ Buildings 15,328 17,936 Plant and equipment 96,750 90,539 Vessels 27,478 33,795 Motor vehicles 1,182 472 Other property, plant and equipment 3,267 3,438
Total 144,005 146,180
f) The characteristics of the fishing business means that the extent that these assets are used depends
on multidimensional factors, which include.
i) The seasonality of schools of pelagic biomasses in the oceans. This factor significantly affects the utilization of the fishing fleet and productive assets at any given moment. When fish appear for a few months, utilization increases at that moment, but then reduces during other months, compared to uniformly distributed appearances throughout the year. This factor varies over time and cannot be forecast. Therefore, utilization rates must be analyzed on a multi-year basis.
ii) The geographical location of schools when they appear, specifically their distance from base stations and processing plants. This factor significantly affects the utilization of the fishing fleet and productive assets. This factor is variable and unpredictable from one year to the next, and the greater this distance, the lower the capacities may appear with respect to those times when schools are closer to the processing facilities, so this analysis must cover several seasons.
iii) The raw material utilization strategy from fishing, whether the company processes it into frozen or canned products for human consumption, or for fish meal and oil. This factor significantly affects the utilization of the fishing fleet and productive assets. These decisions on how best to utilize the raw material depend on multiannual margin trends, which define each strategy. This factor determines the organoleptic preservation status, freshness and other characteristics of the raw material once it has been captured and until it reaches its destination on land, which heavily impacts the utilization of each vessel’s hold. For example, producing frozen products for human consumption reduces the available capacity of each vessel’s hold to about two thirds, compared to the available capacity for producing fishmeal. Therefore, the analysis should consider the trend over several years to establish the utilization trend.
iv) The Authority defines variations in overall fishing quotas of each species year by year, which
depend on the sustainability of the species according to the new Fishing Law. These increases and decreases are aimed at preserving each species. These variations directly influence the utilization of the fishing fleet and its productive assets. Chile has joined various ORP (Regional Fishing Organizations), for example the Jack mackerel ORP, which set overall quotas to protect the sustainability of a species that has been subject to strong quota reductions in previous years. These quotas have shown a positive multi-year trend consistent with species sustainability. Therefore, catches may be predicted and the utilization of fishing assets could follow a similar trend.

55
Therefore, the company defines its fishing asset utilization cycles on a multi-year basis, and depending on the combinations of factors mentioned above, it plans the utilization of its offshore fishing vessels (PAM), which are operative and ready for use according to the matrix of factors described above, whenever necessary. The company does not keep such assets if they are not operative, which means they have not been fully maintained, their hulls cleaned, repaired or lack associated insurance, which limits their use during the year.
g) There are no items of property, plant and equipment that are no longer actively used, but not
classified as held for sale, in accordance with IFRS 5.
h) Management believes that all items of property, plant and equipment have fair values that are not significantly different from their book values.
i) The cost of maintenance and repairs to offshore fishing vessels during 2019 was ThUS$ 3,179, which
ensures that these vessels are in optimal conditions to continue operating, and the capitalization criteria only addresses the highest expenditure and work that extends the life of the vessel.
NOTE 19 - Income and deferred taxes
Law 20,780 was published in the Official Gazette on September 29, 2014 amending the Chilean tax regime. Subsequently, Law 0,899 was enacted on February 1, 2016, which amended it, by simplifying it and clarifying some aspects. The essential changes to the income tax regimes were that corporations must adopt the "partially integrated system". The former Law gave them the option to alternatively adopt the "attributed income system”, but this option was withdrawn by the latter Law.
Deferred tax assets and liabilities are as follows.
12-31-2019 12-31-2018
Deferred tax assets
ThUS$
Deferred tax
liabilities ThUS$
Deferred tax assets
ThUS$
Deferred tax
liabilities ThUS$
Tax losses 29,503 2,018 25,163 1,976 Inventory provisions 1,105 354 916 110 Staff vacation provisions 313 488 254 436 Staff severance indemnity provision 65 240 123 229 Doubtful debt provisions 122 119 116 135 Prepaid income 319 2,593 98 2,061 Right-of-use leases 75 (3) - - Property, plant and equipment (2,387) (5,339) (1,749) (5,630) Manufacturing expenses - (14,208) (179) (9,161) Fishing rights and concessions 52 (34) 21 (1,638) Biological assets 116 (6,903) - (4,849) Other provisions 57 701 69 492 Other property, plant and equipment (138) (214) (187) (287)
Total 29,202 (20,188) 24,645 (16,126) Net total 9,014 8,519

56
Income taxes are as follows.
12-31-2019
ThUS$
12-31-2018
ThUS$
Current tax expense (13,168) (17,028)
Tax expense adjustment (prior period) 1,213 38
Effect of deferred tax assets and liabilities for the period 495 (1,097)
Total (11,460) (18,087)
Reconciliation of tax expense using statutory rate to tax expense using effective rate.
12-31-2019
ThUS$
12-31-2018
ThUS$
Income tax expense using the statutory rate (11,983) (18,231)
Income tax on salaries and wages (76) (86)
Tax effect of non-taxable revenue 776 445
Tax effect of non-deductible expenses (205) (174)
Rate effect on foreign subsidiaries 28 41
Total (11,460) (18,087)
Effective rate 25.2% 26.79%
NOTE 20 - Other current and non-current financial liabilities
Other financial liabilities are as follows.
Current 12-31-2019
ThUS$ 12-31-2018
ThUS$ a) Interest-bearing loans 31,575 1,306
Total current 31,575 1,306
Non-current 12-31-2019
ThUS$ 12-31-2018
ThUS$ a) Interest-bearing loans 116,928 80,406
Total non-current 116,928 80,406
a) Interest-bearing loans
Compañía Pesquera Camanchaca and its subsidiary Salmones Camanchaca S.A. agreed a rescheduling agreement, a financing commitment and a joint and several guarantee for a loan from the banks DNB Bank ASA, Cooperative Rabobank U.A. and Banco Santander Chile S.A. ON November 27, 2017, according to a public deed. This agreement enabled these companies to reschedule liabilities of US$ 165 million. The rescheduling covers three financing tranches.

57
✓ Tranche A conditions o Debtor: Compañía Pesquera Camanchaca S.A. o Quantity: US$ 25 million. Prepaid in February 2018. o Maturity: November 2019, Line Availability, Six-monthly repayments: four equal
installments from May 27, 2018 to November 27, 2019, unless the IPO for Salmones Camanchaca S.A. is approved, in which case the loan will be fully repaid from these funds.
o Rate: Applicable Margin + Libor for the defined period
✓ Tranche B conditions o Debtor: Compañía Pesquera Camanchaca S.A. o Quantity: US$ 40 million. o Maturity: November 2022. o Minimum six-monthly repayments: six equal installments from May 27, 2020 to
November 27, 2022. o Rate: Applicable Margin + Libor for the defined period
✓ Tranche C conditions o Debtor: Salmones Camanchaca S.A. o Quantity: US$ 100 million. o Maturity: November 2022. o Six-monthly repayments: two equal installments of 10% of the loan from November 27,
2020 and November 27, 2021, plus a final repayment for the remaining 80% of the loan on November 27, 2022.
o Rate: Applicable Margin + Libor for the defined period
The costs of tranches A, B and C are represented by a margin over LIBOR, which depends on the extent of borrowing measured every six months as the ratio between Net Borrowing and the previous twelve months EBITDA, and this margin will fluctuate between 2.25% and 3.25%.
Salmones Camanchaca S.A. has guaranteed the obligations of Compañía Pesquera Camanchaca S.A. with respect to tranches A and B, whereas Compañía Pesquera Camanchaca S.A. has guaranteed the obligations of its subsidiary in respect of tranche C. The guarantees associated with these tranches consist of pledged shares owned by the parent company in Subsidiaries Camanchaca Pesca Sur S.A., Camanchaca Cultivos Sur S.A. and the shares of Salmones Camanchaca S.A. that were not part of the IPO. The most representative and significant assets of the respective borrowers are also pledged in guarantee. However, the IPO for Salmones Camanchaca S.A. was completed on February 2, 2018 and the full repayment of Tranche A, then Salmones Camanchaca S.A. ceased to guarantee the obligations of its parent company, while Compañía Pesquera Camanchaca S.A. also ceased to guarantee the obligations of its subsidiary, all in accordance with the Financing Agreement.
The current loan has the following financial covenants:
a) The debt ratio must not exceed 4 times, defined as the ratio of Net Financial Debt to EBITDA for the last 12 calendar months.
b) The equity ratio must be at least 40%, defined as the ratio of Total Equity to Total Assets.
These ratios must be measured every quarter, and they have both been met.
On February 12, 2018, Compañía Pesquera Camanchaca S.A. had to repay the entire Tranche A of US$25 million. ON March 15, 2018, Company Pesquera Camanchaca S.A. voluntarily repaid part of Tranche B by US$10 million and Salmones Camanchaca S.A. voluntarily repaid part of Tranche C by US$20 million. On September 13, 2018 Salmones Camanchaca S.A. voluntarily repaid another US$10 million.

58
On November 9, 2018, Salmones Camanchaca S.A. voluntarily repaid another US$10 million and on November 27, 2018 it voluntarily repaid another US$10 million.
On April 23, 2019, Salmones Camanchaca S.A. requested US$ 44 million, as a disbursement of Tranche C.
Furthermore, Compañía Pesquera Camanchaca S.A. has uncommitted short-term lines of credit with Chilean banks totaling US$ 23 million as of December 31, 2019.
Leasing: The subsidiary Inmobiliaria Camanchaca S.A. has a loan from Banco Scotiabank (formerly BBVA Chile) that matures in September 2020 of ThUS$ 2,026.
Interest-bearing loans
Obligations that mature in under 12 months 12-31-2019
ThUS$
12-31-2018
ThUS$
Banco de Chile
-
433
DNB Bank ASA 2,493 -
Rabobank Cooperate U.A. 3,373 -
Banco Santander 11,467 -
Banco Crédito e Inversiones 8,000 -
Banco Estado 5,131 -
Scotiabank Chile 529 485 Interest payable 582 388
Total 31,575 1,306
Obligations that mature in over 12 months
12-31-2019
ThUS$
12-31-2018
ThUS$
DNB Bank ASA
39,667
27,200
Rabobank Cooperate U.A. 53,667 36,800 Banco Santander 23,333 16,000 Banco Estado 261 - Scotiabank Chile - 406
Total 116,928 80,406

59
The group’s loans are as follows.
a) As of December 31, 2019
Current Non-current
Maturity Maturity
Debtor
Chilean ID
Debtor
Country
Creditor
Chilean ID
Creditor
Country
Currency
Repayments
Nominal
rate
Effective
rate
Guarantees
Under
90 days
Over 90
days to 1
year Total
Current
Over 1
year to
3 years
Over 3
years to
5 years
Over 5
years Total Non-
Current
93,711,000-6
93,711,000-6
93,711,000-6
93,711,000-6
93,711,000-6
93,711,000-6
76,065,596-1
76,065,596-1
76,065,596-1
76,065,596-2
96,786,700-4
77,970,900-0
Camanchaca S.A.
Camanchaca S.A.
Camanchaca S.A.
Camanchaca S.A.
Camanchaca S.A.
Camanchaca S.A.
Salmones Camanchaca S.A.
Salmones Camanchaca S.A.
Salmones Camanchaca S.A.
Salmones Camanchaca S.A.
Inmobiliaria Camanchac S.A.
Transportes Interpolar Ltda
Chile
Chile
Chile
Chile
Chile
Chile
Chile
Chile
Chile
Chile
Chile
Chile
Foreign
97,036,000-K
Foreign
97,030,000-7
97,030,000-8
97,006,000-6
Foreign
97,036,000-K
Foreign
97,006,000-6
97,018,000-1
97,030,000-7
DNB Bank ASA
Banco Santander
Rabobank Cooperate U.A.
Banco del Estado
Banco Santander
Banco de Crédito e
Inversion DNB Bank ASA
Banco Santander
Rabobank Cooperate U.A.
Banco de Crédito e Inv
Scotiabank Chile
Banco del Estado
Norway
Chile
Holland
Chile
Chile
Chile
Norway
Chile
Holland
Chile
Chile
Chile
US$
US$
US$
US$
US$
US$
US$
US$
US$
US$
US$
US$
Semi-annual and at maturity
Semi-annual and at maturity
Semi-annual and at maturity
Semi-annual and at maturity
Semi-annual and at maturity
Semi-annual and at maturity
Semi-annual and at maturity
Semi-annual and at maturity
Semi-annual and at maturity
Semi-annual and at maturity
Quarterly
Monthly
5.17
5.17
5.17
2.88
2.99
2.81
4.17
4.17
4.17
2.81
6.20
3.00
5.17
5.17
5.17
2.88
2.99
2.81
4.17
4.17
4.17
2.81
6.20
3.00
% of assets
% of assets
% of assets
% of assets
% of assets
% of assets
% of assets
% of assets
% of assets
% of assets
% of assets
% of assets
-
-
-
-
-
-
-
-
-
-
265
33
1,183
696
1,601
5,004
10,019
4,021
1,486
874
2,010
4,021
264
98
1,183
696
1,601
5,004
10,019
4,021
1,486
874
2,010
4,021
529
131
9,067
5,333
12,267
-
-
-
30,600
18,000
41,400
-
-
261
-
-
-
-
-
-
-
-
-
-
-
-
-
-
-
-
-
-
-
-
9,067
5,333
12,267
-
-
-
30,600
18,000
41,400
-
-
261
298 31,277 31,575 116,928 - - 116,928
b) As of December 31, 2018
Current Non-current
Maturity Maturity
Debtor
Chilean ID
Debtor
Country
Creditor
Chilean ID
Creditor
Country
Currency
Repayments
Nominal
rate
Effective
rate
Guarantees
Under
90
days
Over 90
days to 1
year Total
Current
Over
1 to 3
years
Over 3
years to
5 years
Over 5
years Total Non-
Current
93,711,000-6 Camanchaca S.A. Chile Foreign DNB Bank ASA Norway US$ Semi-annual and at maturity 5.14 5.14 % of assets - 49 49 6,800 3,400 - 10,200
93,711,000-6 Camanchaca S.A. Chile 97,036,000-K Banco Santander Chile US$ Semi-annual and at maturity 5.14 5.14 % of assets - 29 29 4,000 2,000 - 6,000
93,711,000-6 Camanchaca S.A. Chile Foreign Rabobank Cooperative U.A. Norway US$ Semi-annual and at maturity 5.14 5.14 % of assets - 67 67 9,200 4,600 - 13,800
76,065,596-1 Salmones Camanchaca S.A. Chile Foreign DNB Bank ASA Norway US$ Semi-annual and at maturity 5.14 5.14 % of assets - 82 82 3,400 13,600 - 17,000
76,065,596-1 Salmones Camanchaca S.A. Chile 97,036,000-K Banco Santander Chile US$ Semi-annual and at maturity 5.14 5.14 % of assets - 49 49 2,000 8,000 - 10,000
76,065,596-1 Salmones Camanchaca S.A. Chile Foreign Rabobank Cooperative U.A. Norway US$ Semi-annual and at maturity 5.14 5.14 % of assets - 112 112 4,600 18,400 - 23,000
96,786,700-4 Inmobiliaria Camanchaca S.A. Chile 97,032,000-8 BBVA Banco Bhif Chile US$ Three monthly 6.20 6.20 % of assets 110 375 485 406 - - 406
96,786,700-4 Inmobiliaria Camanchaca S.A. Chile 97,004,000-5 Banco de Chile Chile US$ Three monthly 6.20 6.20 % of assets 109 324 433 - - - -
Foreign Kabushiki Kaisha Camanchaca Japan Foreign Shoko Chukin Japan Yen Monthly 1.30 1.30 Unsecured - - - - - -
219 1,087 1,306 30,406 50,000 - 80,406

60
Reconciliation of financial obligations for the statement of cash flows:
i) As of December 31, 2019
Other financial liabilities Balance as of January 1,
2019 ThUS$
Cash Flows
Accrued
ThUS$
Others
ThUS$
Balance as of
December 31, 2019 ThUS$
Payments
Acquisitions ThUS$
Capital ThUS$
Interest ThUS$
Current
Bank loans
Total other financial liabilities, current
1,306
1,306
(15,620)
(15,620)
(5,171)
(5,171)
38,622
38,622
4,951
4,951
7,487
7,487
31,575
31,575
Non-current
Bank loans
Total other financial liabilities, non-current
80,406
80,406
(406)
(406)
-
-
44,000
44,000
-
-
(7,072)
(7,072)
116,928
116,928
Total other financial liabilities 81,712 (16,026) (5,171) 82,622 4,951 415 148,503
ii) As of December 31, 2018
Other financial liabilities Balance as of January 1,
2018 ThUS$
Cash Flows
Accrued
ThUS$
Others
ThUS$
Balance as of
December 31, 2018
ThUS$
Payments
Acquisitions ThUS$
Capital ThUS$
Interest ThUS$
Current
Bank loans
Total
Bank loans
Total
18,144
18,144
153,819
153,819
(23,413)
(23,413)
(72,500)
(72,500)
(6,334)
(6,334)
-
-
6,000
6,000
-
-
5,996
5,996
-
-
913
913
(913)
(913)
1,306
1,306
80,406
80,406
Total other financial liabilities 171,963 (95,913) (6,334) 6,000 5,996 - 81,712

61
NOTE 21 - Operating lease liabilities
These include obligations arising from commercial operating leases with third parties, which were signed in the normal course of business. The obligations associated with operating leases as of December 31, 2019 and December 31, 2018 are as follows.
12-31-2019
ThUS$
12-31-2018
ThUS$
Operating lease liabilities, current 2,964 -
Operating lease liabilities, non-current 10,299 -
Total 13,263 -
These liabilities by maturity as of December 31, 2019 are as follows.
Maturities of Operating Lease Liabilities
Total
ThUS$
Under 90 days
ThUS$
91 days to 1 year
ThUS$ 1 to 3 years
ThUS$ 3 to 5 years
ThUS$
Over 5 years
ThUS$
Operating lease liabilities
400
2,564
2,900
4,350
3,049
13,263
Total
400
2,564
2,900
4,350
3,049
13,263
The effects on the statement of net income of operating lease contracts are as follows:
ThUS$
Lease expense 909
Interest (947)
Depreciation (3,100)
Gain (loss) on deferred taxes 847
Net income (loss) (2,291)
Operating lease contracts that have not been included because they cover variable rents, total ThUS$1,205 per year.

62
NOTE 22 - Trade and other payables
Trade and other payables are as follows.
12-31-2019 ThUS$
12-31-2018 ThUS$
Trade payables 80,599 75,359 Notes payable 2,165 4,195 Miscellaneous payables 302 82 Retentions 2,607 2,722 Dividends payable 9,930 14,253 Other 5,350 3,212
Total 100,953 99,823
Trade payables by supplier as of December 31, 2019 are as follows.
SUPPLIERS WITH PAYMENTS NOT OVERDUE
Supplier
Amount by payment terms in days
Total
ThUS$
Average payment
period (days)
Under 30
31-60
61-90
91-120
121-365
Over 366
Products 10,771 21,222 11,201 8,905 1,936 - 54,035 45
Services 8,745 13,309 251 - 132 - 22,437 38
Grand Total
19,515
34,531
11,452
8,905
2,068
-
76,471
SUPPLIERS WITH PAYMENTS OVERDUE
Supplier
Amount by overdue range in days Total
ThUS$ Under 30
31-60
61-90
91-120
121-180
Over 181
Products 521 1,390 1,113 23 7 154 3,208
Services 755 146 - 13 - 6 920
Grand Total 1,276 1,536 1,113 36 7 160 4,128
Trade payables by business segment as of December 31, 2019 are as follows.
SUPPLIERS WITH PAYMENTS NOT OVERDUE
Supplier
Amount by payment terms in days
Total
ThUS$
Average payment period (days)
Under 30
31-60
61-90
91-120
121-365
Over 366
Industrial Fishing 4,636 6,521 762 - - - 11,919 42
Salmon Farming 14,310 27,405 10,406 8,905 2,068 - 63,094 29
Other Seafood 570 605 284 - - - 1,459 45
Grand Total
19,515
34,531
11,452
8,905
2,068
-
76,471

63
SUPPLIERS WITH PAYMENTS OVERDUE
Supplier
Amount by overdue range in days Total
ThUS$ Under 30
31-60
61-90
91-120
121-180
Over 181
Industrial Fishing 661 112 16 - 7 160 956
Salmon Farming 604 1,422 1,097 32 - - 3,155
Other Seafood 11 2 - 4 - - 17
Grand Total 1,276 1,536 1,113 36 7 160 4,128
Trade payables by supplier as of December 31, 2018 are as follows.
SUPPLIERS WITH PAYMENTS NOT OVERDUE
Supplier
Amount by payment terms
Total
ThUS$
Average payment
period (days)
Under 30 31-60 61-90 91-120 121-365
Products 16,412 10,403 7,925 7,698 - 42,438 52
Services 26,601 4,625 16 - - 31,242 43
Grand Total 43,013 15,028 7,941 7,698 - 73,680
SUPPLIERS WITH PAYMENTS OVERDUE Amount by overdue range in days
Total Supplier Under 30 31-60 61-90 91-120 121-180 Over 181 ThUS$
Products 244 25 9 3 - 235 516
Services 586 104 69 22 81 301 1,163
Grand Total 830 129 78 25 81 536 1,679
Trade payables by business segment as of December 31, 2018 are as follows.
SUPPLIERS WITH PAYMENTS NOT OVERDUE
Supplier
Amount by payment terms in days
Total
ThUS$
Average payment
period (days)
Under 30
31-60
61-90
91-120
Industrial Fishing 9,063 1,054 17 10,134 42 Salmon Farming 31,051 13,756 7,846 7,698 60,351 51 Other Seafood 2,899 218 78 - 3,195 43
Grand Total
43,013
15,028
7,941
7,698
73,680
SUPPLIERS WITH PAYMENTS OVERDUE
Supplier
Amount by overdue range in days
Total
ThUS$
Under 30
31-60
61-90
91-120
121-180
Over 181
Industrial Fishing 408 49 38 9 41 349 894 Salmon Farming 345 61 23 1 12 121 563 Other Seafood 77 19 17 15 28 66 222
Grand Total 830 129 78 25 81 536 1,679
The Company has no confirming transactions.

64
NOTE 23 - Other provisions
The items that comprise Other provisions at the reporting date are as follows:
12-31-2019
ThUS$
12-31-2018
ThUS$
Provisions for legal proceedings* 406 480
Site closure costs 6,197 6,583
Decommissioning Iquique plant 526 396
Total 7,129 7,459
* Legal proceedings are described under Note 35 f) on contingencies
Movements in provisions are as follows:
Provisions for legal proceedings
Site closure costs
Decommissioning Iquique plant
12-31-2019
ThUS$
12-31-2018
ThUS$
12-31-2019
ThUS$
12-31-2018
ThUS$
12-31-2019
ThUS$
12-31-2018
ThUS$
Opening balance 455 286 6,608 - 396 -
Increases 15 185 6,197 6,608 43 396
Decreases or payments (64) (16) (6,608) - 87 -
Closing balance 406 455 6,197 6,608 526 396
NOTE 24 - Current tax liabilities
These are as follows. 12-31-2019
ThUS$ 12-31-2018
ThUS$ Income taxes 13,168 17,028 Austral law credits (4,288) (6,871) Provisional monthly tax payments (8,534) (3,313) Other taxes - 30
Total 346 6,874
NOTE 5 - Employee benefit provisions
These provisions are as follows:
Current Non-current 12-31-2019
ThUS$ 12-31-2018
ThUS$ 12-31-2019
ThUS$ 12-31-2018
ThUS$
Vacation provision Employee severance indemnity provision
2,968
552
2,130
578
- 1,027
- 1,108
Total 3,520 2,708 1,027 1,108

65
Movements in the employee benefit provisions are as follows.
Current Non-current
Vacation provision Employee severance
indemnities Employee severance
indemnities
12-31-2019 ThUS$
12-31-2018 ThUS$
12-31-2019 ThUS$
12-31-2018 ThUS$
12-31-2019 ThUS$
12-31-2018 ThUS$
Opening balance Increase (decrease)
2,130
838
1,812
318
578
(26)
544
34
1,108
(81)
971
137
Closing balance 2,968 2,130 552 578 1,027 1,108
NOTE 6 - Equity
a) The controlling entities' shareholdings in Compañía Pesquera Camanchaca S.A. as of December
31, 2019 are as follows.
Chilean ID
number
Shareholders
Number of shares
% Ownership
76,076,557-0 Inversiones HFG Ltda. 1,376,846,422 33.17%
78,172,330-4 Inversiones LOS FRESNOS Ltda. 815,613,373 19.65%
76,076,548-1 Inversiones HCL Ltda. 321,644,260 7.75%
78,172,320-7 Inversiones CIFCO Ltda. 107,520,160 2.59%
- Others 1,529,047,785 36.84%
Total 4,150,672,000 100.00%
b) Capital management
Capital management aims to safeguard its ability to continue as a going concern, to generate returns for its shareholders, to generate benefits for other stakeholders, and to maintain an optimal structure that reduces its cost of capital. It forms part of the company’s Investment and Financing Policy, which establishes that investments must have appropriate project-specific financing, to maintain its productive assets in optimal operating conditions as well as those that increase its productive capacity to comply with the company's strategic development plan, and other matters. Therefore, financing should provide the funds required for its existing assets to operate well, and for new investments, in accordance with the investment policy. Financing includes using its own resources and external resources up to a limit that does not compromise the company's equity position or limit its growth. The company will maintain several financing options open, such as short and long-term bank loans, supplier credit and other sources. Camanchaca reports compliance with its commitments to financial institutions every quarter. There are covenants related its profitability and equity, which are presented in Note 8. As of December 31, 2019 and 2018, the Company has complied with the financial indicators required by those commitments.

66
c) Share capital
The Company’s issued, subscribed and paid share capital is as follows. As of December 31, 2019
Subscribed capital Paid capital Series ThUS$ ThUS$
Single 284,134 284,134 Total 284,134 284,134
As of December 31, 2018
Subscribed capital Paid capital Series ThUS$ ThUS$
Single 284,134 284,134 Total 284,134 284,134
Common Shares Total number of shares Balance as of December 31, 2019 and December 31, 2018 4,150,672,000
d) Share premium
An Extraordinary Shareholders Meeting was held on April 26, 2018 and agreed to capitalize the "share premium" account in the audited statement of financial position as of December 31, 2017 of US$ 155,005,775. It also agreed to reduce the authorized, subscribed and paid capital by absorbing in full the accumulated losses that were recorded in the "retained earnings (accumulated losses)" account in the audited statement of financial position as of December 31, 2017 of US$ 88,613,763. Consequently, the company's share capital increased from US$ 217,741,755.44 to US$ 284,133,767.44. This left the company with no accumulated losses as of that date.
e) Dividend provision
A dividend of ThUS$ 6,138 was provided in the consolidated financial statements. A dividend of ThUS$ 9,974 was provided as of December 31, 2018, which was approved at the Ordinary Shareholders' Meeting held on April 26, 2019 and paid on May 15, 2019 (table attached).
Description
As of 12-31-2019
ThUS$
As of 12-31-2018
Original
ThUS$
As of 12-31-2018
Restated
ThUS$
Net income 20,620 30,782 34,438
Reduction in net distributable income
Fair value adjustment for the year* 218 (3,378) 1,630
Deferred taxes (27%) (59) 912 (440)
Net fair value adjustment loss (gain) 159 (2,466) 1,190
Net distributable income 20,461
33,248
33,248
Dividends equivalent to 30% 6,138 9,974 9,974
* The fair value adjustment for the year arises at the subsidiary Salmones Camanchaca S.A., where the parent company holds a 70% interest, so that percentage is applied to the fair value adjustment.

67
f) Other reserves
Other reserves are as follows. 12-31-2019
ThUS$ 12-31-2018
ThUS$ Hedge reserves 30 (32) Translation of other companies reserves (739) (420) Change in participation reserves 51,236 51,236
Total 50,527 50,784
The change in participation reserves are mainly composed of ThUS$ 34,762 from the gain on the sale of shares in the subsidiary Salmones Camanchaca S.A. and of ThUS$ 18,832 shares issued and sold by that subsidiary.
g) Retained earnings
Movements in retained earnings are as follows.
12-31-2019 ThUS$
12-31-2018 ThUS$
Opening balance 20,728 (93,949) Capitalization of earnings - 88,614 Increase for changes in the participation in subsidiaries - 1,599 Dividends paid or provided (6,138) (9,974) Net income for the period 20,620 34,438
Closing balance 35,210 20,728
h) Non-controlling interests
The composition of non-controlling interests as of December 31, 2019 and December 31, 2018 are as follows. Equity
participation as of 12-31-2019
ThUS$
Earnings participation as of 12-31-2019
ThUS$ Camanchaca Pesca Sur S.A. 55,694 (405) Salmones Camanchaca S.A. 61,115 12,705
Total 116,809 12,300
Equity participation as of 12-31-2018
ThUS$
Earnings participation as of 12-31-2018
ThUS$ Camanchaca Pesca Sur S.A. 56,079 227 Salmones Camanchaca S.A. 55,136 14,770
Total 111,215 14,997

68
NOTE 27 - Earnings per share
Earnings per share are as follows. 12-31-2019 12-31-2018
Description ThUS$ ThUS$
Net income (loss) attributable to equity holders of parent company 20,620 34,438 Weighted average number of shares 4,150,672,000 4,150,672,000 Basic earnings per share (US$/share) 0.0050 0.0083
Basic earnings per share is net income attributable to shareholders divided by the number of single series shares. The Company has not issued convertible debt or other equity securities. Consequently, there are no potentially diluting effects on earnings per share.
NOTE 28 - Operating revenue
Group operating revenue is as follows.
For the years ended December 31
2019 ThUS$
2018 ThUS$
Industrial Fishing sales 157,621 163,167 Salmon Farming sales 435,576 433,406 Other Seafood sales 26,833 29,907
Total 620,030 626,480
The group's operating revenue is mainly of the sale of finished products from the capture of pelagic species and revenue from the sale of finished products from the harvesting biological assets.
NOTE 29 - Administrative expenses
Administrative expenses are as follows.
For the years ended December 31
2019 ThUS$
2018 ThUS$
Remuneration 8,456 15,282 Communications 1,578 4,045 Leases 382 1,183 Depreciation 940 1,752 Audit and consultancy 659 540 Travel and traveling allowances 576 804 Legal expenses 754 946 Overhead expenses 2,832 3,333 Stock market expenses 503 430 Membership fees 1,396 1,429 Other administrative expenses 1,196 1,486
Total 19,272 31,230

69
NOTE 30 - Distribution costs
Distribution costs are as follows.
For the years ended December 31
2019 ThUS$
2018 ThUS$
Remuneration
8,054
7,972
Storage expenses 5,913 5,682 Commissions 2,720 4,169 Haulage costs 2,574 2,932 Maritime freight 3,134 2,165 Insurance 949 615 Shipment costs 443 899 Travel and traveling allowances 526 548 Samples and analysis 252 165 Export certificates 763 601 Leases 215 184 Sales and marketing expenses 789 818 Other expenses 2,196 1,800
Total 28,528 28,550
NOTE 31 - Financial costs
Financial costs are as follows. For the years ended December 31
2019 ThUS$
2018 ThUS$
Financial interest 6,264 6,017 Financial commissions 693 734 Interest on leases - IFRS 16 947 - Gain (loss) on foreign exchange hedges - 3,223 Other expenses 177 197
Total 8,081 10,171

70
NOTE 32 - Exchange differences
Exchange differences are as follows.
For the years ended December 31
Description Currency 2019
ThUS$ 2018
ThUS$
Assets (charge) / credit
Banks Ch$ (1,485) (941)
Banks Euros (11) (104)
Domestic customers Ch$ (391) (1,456)
Foreign customers Euros 58 128
Foreign customers GBP 10 (30)
Notes receivable Ch$ - (1)
Miscellaneous receivables Ch$ (169) (181)
Commercial current accounts with related companies Ch$ (88) (110)
Associated related companies Ch$ (169) (295)
Recoverable taxes Ch$ (1,369) (1,814)
Prepaid expenses Ch$ (5) (36)
Other non-current non-financial assets Ch$ (1,491) (2,552)
Other non-current non-financial assets UF (13) (27)
Others Ch$ 60 (175)
Total (5,063) (7,594)
Liabilities (charge) / credit
Trade payables Ch$ 2,134 3,643
Trade payables Euros (33) 16
Trade payables NOK (4) (2)
Trade payables JPY (1) 1
Trade payables GBP (2) 3
Notes payable Ch$ (87) 92
Notes payable UF - 8
Notes payable Euros (4) 4
Provisions and withholdings Ch$ (142) 842
Provisions and retentions UF 128 (6)
Total 1,989 4,601
(Loss) gain on exchange differences (3,074) (2,993)

71
NOTE 33 - Other income (losses)
Other net income and losses for the period are as follows.
For the years ended December 31
2019 ThUS$
2018 ThUS$
Net loss on selling assets (5,259) (391) Gain (loss) on insurance claims (2,245) 65 Costs of disposing of property, plant and equipment (3,952) (912) Earnings from the trout joint venture (2,536) 2,890 Others 69 70
Total (13,923) 1,722
The net loss on selling assets is mainly the sale of offshore fishing vessels that were not in use. The subsidiary Camanchaca Pesca Sur sold the offshore vessel Yagán, which resulted in a loss of US$ 1.9 million, while the sale of the offshore vessel Loa 4 produced a gain of US$ 0.2 million. The subsidiary Camanchaca Pesca Sur sold rights, concessions and movable property in Cabilantago to the parent company in December 2019, which produced a loss of US$ 2.5 million.
The gain (loss) on insurance claims is the deductible for extraordinary fish mortality and for expenses not covered by insurance at events that occurred in the first half of the year due to oxygen deficits.
The costs of disposing of property, plant and equipment is mainly the replacement of assets in the salmon farming segment that still had a remaining useful life, and disused assets at the fishmeal and oil plant in Talcahuano in the southern industrial fishing segment.
The subsidiary Salmones Camanchaca had a one third interest in a trout joint venture. However, as this is not a separate legal entity from the joint venture Manager, Caleta Bay, the subsidiary does not exercise joint control or significant influence over the key decisions of this business. The Manager is fully responsible for the entire value chain, it operates this business in its own name and its own risk, and is liable to the aquaculture, sanitary, environmental or other authorities. The only assets that Salmones Camanchaca contribute to this trout joint venture are the concessions where the fish are farmed, and it receives variable compensation associated with this contribution. Therefore, it does not comply with the definition of a joint venture for accounting purposes, nor can it be measured at fair value as a financial asset under IFRS 9, since the company's accounting policy is to value concessions at cost. As the concessions contributed by Salmones Camanchaca to the trout joint venture have never been legally transferred to the Manager, these concessions cannot be valued at fair value, according to IAS 8.10. Therefore, the company's accounting policy is to recognize one third of the trout joint venture earnings in Other income and losses within the statement of net income by function and not within operating income, which is recycled annually. This was a change with respect to the financial statements as of December 31, 2018.

72
NOTE 34 - Assets and liabilities in foreign currencies
Assets and liabilities in foreign currencies are as follows:
Description Currency 12-31-2019
ThUS$
12-31-2018
ThUS$
Current assets
Cash and cash equivalents
Cash and cash equivalents
Cash and cash equivalents
Cash and cash equivalents
Other financial assets, current
Other financial assets, current
Other financial assets, current
Other financial assets, current
Other non-financial assets, current
Other non-financial assets, current
Other non-financial assets, current
Trade and other receivables, current
Trade and other receivables, current
Trade and other receivables, current
Trade and other receivables, current
Trade and other receivables, current
Related party receivables, current
Related party receivables, current
Inventories
Inventories
Biological assets, current
Tax assets, current
Tax assets, current
US$
Ch$
Euros
Yen
Ch$
UF
Yen
US$
US$
Ch$
JPY
US$
Ch$
Euros
Yen
GBP
US$
Ch$
US$
Yen
US$
Yen
Ch$
25,314
12,239
1,112
3,208
74
264
-
23
8,284
7,306
208
86,373
6,195
665
2,451
93
50
66
71,126
5,543
150,742
10
6,716
13,220
11,967
1,867
3,694
19
83
225
-
9,847
9,454
-
69,294
4,556
1,058
2,249
182
50
42
53,076
2,221
138,415
12
2,660
Total 388,062 324,191
Description Currency 12-31-2019
ThUS$ 12-31-2018
ThUS$
Non-current assets Other financial assets, non-current Other non-financial assets, non-current Other non-financial assets, non-current Other non-financial assets, non-current Rights receivable, non-current Related party receivables, non-current Equity method investments Intangible assets other than goodwill Property, plant and equipment Goodwill Deferred tax assets Deferred tax assets
US$ US$ Ch$ Yen US$ Ch$ US$ US$ US$ US$ US$ Yen
701 126
17,010 13
1,252 2,208 4,871
50,313 287,683
1,214 29,177
25
701 126
18,730 13
1,349 2,314 4,699
50,313 255,462
1,214 24,577
68 Total 394,593 359,566

73
Description Currency 12-31-2019 ThUS$
12-31-2018 ThUS$
Current liabilities
Other financial liabilities, current US$ 31,575 1,306
Other financial liabilities, current Yen - -
Operating lease liabilities, current UF 2,429 -
Operating lease liabilities, current US$ 153 -
Operating lease liabilities, current Ch$ 382 -
Trade and other payables, current US$ 65,463 75,392
Trade and other payables, current Ch$ 33,509 20,773
Trade and other payables, current UF 1,652 846
Trade and other payables, current Euro 216 2,638
Trade and other payables, current NOK 5 -38
Trade and other payables, current Yen 86 195
Trade and other payables, current GBP 22 17
Related party payables, current US$ 55 -
Related party payables, current Ch$ 320 784
Other provisions, current US$ 6,723 7,004
Other provisions, current Ch$ 406 455
Tax liabilities, current US$ - 6,509
Tax liabilities, current Ch$ 346 332
Employee benefit provisions, current Yen 133 33
Employee benefit provisions, current US$ 3,387 2,708
Total 146,862 118,954
Description Currency 12-31-2019 ThUS$
12-31-2018 ThUS$
Non-current liabilities
Other financial liabilities, non-current US$ 116,928 80,406
Operating lease liabilities, non-current UF 9,932 -
Operating lease liabilities, non-current US$ 189 -
Operating lease liabilities, non-current Ch$ 178 -
Trade and other payables, non-current US$ 201 302
Trade and other payables, non-current UF 470 -
Deferred tax liabilities US$ 20,188 16,126
Employee benefit provisions, non-current Ch$ 952 960
Employee benefit provisions, non-current Yen 75 148
Total 149,113 97,942

74
NOTE 35 - Guarantees and contingencies
a) Guarantees
There are performance guarantees issued by:
Value
ThUS$ Bank
Banco de Chile 1,187
Total 1,187
b) Bank loan conditions
On November 27, 2017 the parent company and its subsidiary Salmones Camanchaca S.A. signed a debt rescheduling, financing commitment and joint and several guarantee contract with DNB, Rabobank and Banco Santander that constituted guarantees and cross-guarantees. An Initial Public Offering of shares in Salmones Camanchaca S.A. took place on February 2, 2018, and in accordance with the debt rescheduling agreement, the cross guarantees granted by the parent company and its other subsidiaries were lifted, leaving only the assets of each company pledged in guarantee.
a) Guarantees of Compañía Pesquera Camanchaca and subsidiaries other than Salmones Camanchaca:
i. Mortgages on plots of land, including everything built on them. The parent company and other
subsidiaries mortgaged 3 properties in Caldera, 9 in Tome, 3 in Coronel and 1 in Chonchi.
ii. Twenty-one marine mortgages over fishing vessels and naval crafts belonging to the parent company and other subsidiaries.
iii. Pledge
a. Non-possessory pledge Direct over the fishmeal plant in Iquique and mussel processing
plant in Chiloé. b. Compañía Pesquera Camanchaca S.A. as holder of shares of Salmones Camanchaca S.A.,
together with Inmobiliaria Camanchaca S.A., owner of 1 share, which total 70% of Salmones Camanchaca S.A.
c. Compañía Pesquera Camanchaca S.A. as owner of shares in Camanchaca Pesca Sur S.A., together with Camanchaca SpA., as owner of 100 shares, which sum to a 70% interest in that company.
d. Compañía Pesquera Camanchaca S.A. as owner of 58,670 shares in Camanchaca Cultivos Sur S.A., together with Inmobiliaria Camanchaca S.A. as owner of 19,318 shares.
e. Non-possessory pledge over Class A tradable fishing licenses owned by Compañía Pesquera Camanchaca S.A. and its subsidiary Camanchaca Pesca Sur.
b) Salmones Camanchaca guarantees:
i. Mortgage on six plots including everything built on them, four in Tome, one in Puerto Varas
and one in Calbuco.
ii. One mortgage on a fishing vessel and four naval crafts owned by Salmones Camanchaca.

75
iii. Pledge
a. Non-possessory pledge over the salmon processing plant in Tome, Calbuco and the Fish Hatchery in Petrohue.
b. Salmones Camanchaca S.A. and subsidiary mortgaged to the Banks all the aquaculture concessions that it owns for salmon and trout.
c) Direct Guarantees
Debtor Assets
Guarantee
Property
Book value
ThUS$
Name
Relationship Camanchaca S.A. Commercial Property mortgage Iquique real estate 1,640 Camanchaca S.A. Commercial Property mortgage Caldera real estate 7,229 Camanchaca S.A. Commercial Property mortgage Tome real estate 1,225 Camanchaca S.A. Commercial Property mortgage Vessels in Iquique 12,466 Camanchaca S.A. Commercial Pledge Machinery and equipment 10,845
d) Indirect guarantees
Debtor
Assets Guarantee
Property
Book value
ThUS$
Name
Relationship
Salmones Camanchaca S.A. Commercial Property mortgage Tome real estate 3,876 Salmones Camanchaca S.A. Commercial Property mortgage Puerto Varas real estate 2,215 Salmones Camanchaca S.A. Commercial Property mortgage Calbuco real estate 214 Salmones Camanchaca S.A. Commercial Property mortgage Salmon vessels 1,665 Salmones Camanchaca S.A. Commercial Pledge Machinery and equipment 10,737 Salmones Camanchaca S.A. Commercial Pledge Buildings and construction 13.511

76
e) Guarantees from third parties
The guarantees from third parties are financing operations with fish suppliers. Details of guarantees as of December 31, 2019 are as follows.
Chilean ID
number
Debtor
Pledge or Mortgage
Vessels
Value
ThUS$
Relationship 1,488,630 3,362,676 4,036,951 4,519,519 4,564,997 4,585,309 5,214,974 5,253,152 5,408,694 5,408,694 5,564,010 5,998,936 5,998,936 6,100,065 6,135,537 6,329,914 6,331,533 6,458,130 6,665,647 6,748,011 6,822,000 6,836,899 7,327,121 7,384,937 7,481,718 7,487,933 7,487,933 7,609,249 8,099,348 8,277,898 8,416,133 8,727,526
Anibal Méndez Rodríguez Sergio Duran Saavedra Manuel Ricardo Torres Sergio Cabrera Silva Manuel Bustos Molina Mario Alberto Gomez Vega Anastasio Segundo Vásquez Neira Dominguez Miguel Luis Monares Moya Luis Monares Moya Adolfo Segundo Chaparro Monsalves Jóse García Muñoz Jose Israel Garcia Muñoz Carlos San Martín Pinchera Moisés Espinoza Roa Julio Torres Vergara María Elía Agurto Bustos Juan Nova Rojas Fernando Monsalves Silva Manuel Bravo Vera Fernando Pradel Elgueta Arturo Valenzuela Francisco Zapata Gutierrez Virgilio Nova Rojas Julio Alveal Flores Veronica Ruiz Quiñan Veronica Ruiz Quiñan Jorge Enrique Cofré Reyes Antonio Bastias Macaya Manuel Espinoza Garrido Alejandro Nova Rojas Alejandro Vidal Carrillo
1 Vessel Promissory 1 Vessel 1 Vessel 1 Vessel 1 Vessel 2 Vessels 1 Vessel 1 Vessel Promissory 1 Vessel 1 Vessel 1 Vessel 1 Vessel 1 Vessel Promissory 2 Vessels 1 Vessel 1 Vessel Promissory 1 Vessel Promissory 1 Vessel 1 Vessel 1 Vessel 1 Vessel Promissory 1 Vessel 1 Vessel 1 Vessel 1 Vessel 1 Vessel
Juanita Yolanda Master Abraham La Ruty II El Yeye Cayumanqui,Santa Carmen Gloria Primera I Yolanda S Yolanda S Don Adolfo II José Sebastián Punta Maule II Poseidon II Don Miguel II Santa Elena José Enrique Galilea I Nagasaki Don Humberto Santa Elvita Noemi Simoney Ulises Buena fe III Shimane Constitución Veronica Alejandra Veronica Alejandra Tomé y Tomé II El Acuario I Reina del Mar II Yoshira Monte Everest
160 15 500 276 160 200 425 300 329 138 400 250 400 560 400 18 398 480 400 20 500 30 400 480 500 324 472 1,130 160 100 480 120
Suppliers Suppliers Suppliers Suppliers Suppliers Suppliers Suppliers Suppliers Suppliers Suppliers Suppliers Suppliers Suppliers Suppliers Suppliers Suppliers Suppliers Suppliers Suppliers Suppliers Suppliers Suppliers Suppliers Suppliers Suppliers Suppliers Suppliers Suppliers Suppliers Suppliers Suppliers Suppliers

77
Chilean ID number
Debtor Pledge or Mortgage
Vessels
Value ThUS$
Relationship 8,730,467 Juan Garcés Ramírez 1 Vessel Sixto Abranham 560 Suppliers 8,784,320 Juan Rosales Parra 1 Vessel Silvia Eliana 150 Suppliers 8,901,579 Justo Macaya Silva 1 Vessel Bill 500 Suppliers 8,901,579 Justo Macaya Silva 1 Vessel Don Alex 275 Suppliers 8,901,579 Justo Macaya Silva Promissory Bill 216 Suppliers 8,912,682 Juan San Martin Promissory Lazaro II 17 Suppliers 9,063,718 Oscar Gutierrez Promissory Santa Patricia 32 Suppliers 9,184,130 Jacob Exequiel Muñoz 1 Vessel Domenica 381 Suppliers 9,419,692 Eduardo Joaquin Suazo Saldaña 1 Vessel Paulina 239 Suppliers 9,645,621 Eduardo Jaime Villaroel Leal 1 Vessel Andrés 300 Suppliers 9,927,786 Cáceres Rojas Lorena Promissory El Yeye 28 Suppliers
10,041,980 Muñoz Pizarro Mauricio Javier 1 Vessel Barlovento 500 Suppliers 10,113,541 Sergio Edgardo Duran Silva 1 Vessel Don Fernando I 400 Suppliers 10,222,373 Ernesto Manuel Valenzuela Vasquez 1 Vessel Gilda Heidy 150 Suppliers 10,255,858 Rubén Moya 1 Vessel Don Rubén 263 Suppliers 10,255,858 Rubén Moya 1 Vessel Saray Esmeralda 269 Suppliers 12,323,409 Cristian Aquiro Vallejos Salas 1 Vessel Siloe 290 Suppliers 10,294,247 José Escobar Roca 1 Vessel Don Matias " J " 200 Suppliers 10,294,247 José Escobar Roca Promissory Don Matias " J " 98 Suppliers 10,428,125 Marcos Romero Barrera 1 Vessel Ana Belén 150 Suppliers 10,820,867 Manuel Bustos Rodríguez Promissory Perla Negra 44 Suppliers 10,824,619 Manuel Reyes Neira 1 Vessel Doña Candelaría 500 Suppliers 10,843,418 Jorge Soto Macaya 1 Vessel Marbella II 160 Suppliers 10,843,652 Julio Reyes Garrido 1 Vessel Babilonia 179 Suppliers 10,860,160 Manuel Garrido Maripangue 1 Vessel Linares 400 Suppliers 10,879,303 Ibarra Tejerina Julio César 2 Vessels Concepción. 900 Suppliers
Borney
11,202,246 Omar Gómez Almonte 2 Vessels Vilos 850 Suppliers II.Humboldt II
11,376,018 Hernández Palacios Francisco Fernando 2 Vessels Valencia y 650 Suppliers Chenco
11,791,674 Juan Martinez Manriquez 1 Vessel Rio Loa I 520 Suppliers 11,902,809 Juan Alberto Saenz 1 Vessel Doña Sandra 197 Suppliers 12,320,818 Walter Sebastian Reyes Garrido 1 Vessel Mesana 560 Suppliers 12,979,597 Hector Monsalves 1 Vessel Don Hernán M 315 Suppliers 12,979,597 Hector Monsalves Promissory Don Hernán M 335 Suppliers 13,619,520 Jose Acuña 1 Vessel Amparito I 197 Suppliers

78
Chilean ID number Debtor
Pledge or Mortgage Vessels
Value ThUS$ Relationship
14,235,833 John Poblete Pedreros 1 Vessel Santa Anita 260 Suppliers
14,235,833 John Poblete Pedreros Promissory Santa Anita 170 Suppliers 14,390,236 Alex Cordero Urzua 1 Vessel Don Leonel 560 Suppliers
14,706,506 Igor Sovenko 1 Vessel Eben-Ezer II 400 Suppliers 15,911,090 Gonzalo Alberto Araya Promissory Chico Risso 30 Suppliers
16,767,429 Carlos Riquelme Alarcon 1 Vessel Nelly Nicole 400 Suppliers 16,767,429 Carlos Riquelme Alarcon Promissory Nelly Nicole 149 Suppliers
52,003,186 Viviana Bernardette Quezada Martinez E.I.R.L
1 Vessel Delia Rosa 400 Suppliers
53,310,793 Comunidad Espinoza Jeno y Compañia 1 Vessel Macedonia I 400 Suppliers
76,006,325 Sociedad Pesquera Guacolda 1 Vessel Cristian Guillermo
500 Suppliers
76,202,609 Fernando Martínez Carmona 1 Vessel Doña Carmela 400 Suppliers 77,136,760 Pesquera FamCord Ltda 1 Vessel Don Patricio 630 Suppliers
77,780,330 Pesquera Bahia Coliumo 1 Vessel Don Pedro M 560 Suppliers 78,454,630 Jiménez y Santibáñez Ltda 1 Vessel Jefte 400 Suppliers
78,454,630 Jiménez y Santibáñez Ltda Promissory Jefte 138 Suppliers 79,822,090 Pesquera Pez Maule 1 Vessel Margarita del Mar 239 Suppliers
79,822,090 Pesquera Pez Maule Promissory Margarita del Mar 152 Suppliers
The guarantees from third parties are financing operations with fish suppliers. Details of guarantees as of December 31, 2018 are as follows.
Chilean ID number
Debtor
Pledge or Mortgage
Vessels
Value ThUS$
Relationship
1,488,630 4,036,951 4,519,519 4,564,997 4,585,309 5,214,974 5,253,152 5,408,694 5,564,010 5,998,936 5,998,936 6,100,065 6,135,537 6,331,533 6,458,130 6,665,647 6,822,000 7,327,121 7,384,937 7,481,718 7,487,933 7,609,249 8,099,348 8,277,898 8.416,133 8,727,526 8,730,467 8,784,320 8,901,579 8,901,579 9,184,130
Anibal Méndez Rodríguez Manuel Ricardo Torres Sergio Cabrera Silva Manuel Bustos Molina Mario Alberto Gomez Vega Anastasio Segundo Vásquez Neira Dominguez Miguel Luis Monares Moya Adolfo Segundo Chaparro Monsalves Jóse García Muñoz Jose Israel Garcia Muñoz Carlos San Martín Pinchera Moisés Espinoza Roa María Elía Agurto Bustos Juan Nova Rojas Fernando Monsalves Silva Fernando Pradel Elgueta Francisco Zapata Gutierrez Virgilio Nova Rojas Julio Alveal Flores Veronica Ruiz Quiñan Jorge Enrique Cofré Reyes Antonio Bastias Macaya Manuel Espinoza Garrido Alejandro Nova Rojas Alejandro Vidal Carrillo Juan Garcés Ramírez Juan Rosales Parra Justo Macaya Silva Justo Macaya Silva Jacob Exequiel Muñoz
1 Vessel 1 Vessel 1 Vessel 1 Vessel 1 Vessel 2 Vessels 1 Vessel 1 Vessel 1 Vessel 1 Vessel 1 Vessel 1 Vessel 1 Vessel 2 Vessels 1 Vessel 1 Vessel 1 Vessel 1 Vessel 1 Vessel 1 Vessel 1 Vessel 1 Vessel 1 Vessel 1 Vessel 1 Vessel 1 Vessel 1 Vessel 1 Vessel 1 Vessel 1 Vessel 1 Vessel
Juanita Master Abraham La Ruty II El Yeye Cayumanqui, Santa Carmen Gloria Primera I Yolanda S Don Adolfo II José Sebastián Punta Maule II Poseidon II Don Miguel II José Enrique, Galilea I Nagasaki Don Humberto Noemi Simoney Buena fe III Shimane Constitución Veronica Alejandra Tomé y Tomé II El Acuario I Reina del Mar II Yoshira Monte Everest Sixto Abranham Silvia Eliana Bill Don Alex Domenica
160 500 276 160 200 425 300 329 400 250 400 560 400 398 480 400 500 400 480 500 324 1,130 160 100 480 120 560 150 500 275 381
Suppliers Suppliers Suppliers Suppliers Suppliers Suppliers Suppliers Suppliers Suppliers Suppliers Suppliers Suppliers Suppliers Suppliers Suppliers Suppliers Suppliers Suppliers Suppliers Suppliers Suppliers Suppliers Suppliers Suppliers Suppliers Suppliers Suppliers Suppliers Suppliers Suppliers Suppliers

79
Chilean ID
number
Debtor Pledge or Mortgage
Vessels
Value
ThUS$
Relationship 9,419,692 Eduardo Joaquin Suazo Saldaña 1 Vessel Paulina 239 Suppliers 9,645,621 Eduardo Jaime Villaroel Leal 1 Vessel Andrés 300 Suppliers
10,041,980 Muñoz Pizarro Mauricio Javier 1 Vessel Barlovento 500 Suppliers 10,113,541 Sergio Edgardo Duran Silva 1 Vessel Don Fernando I 400 Suppliers 10,222,373 Ernesto Manuel Valenzuela Vasquez 1 Vessel Gilda Heidy 150 Suppliers 10,255,858 Rubén Moya 1 Vessel Don Rubén 263 Suppliers 10,255,858 Rubén Moya 1 Vessel Saray Esmeralda 269 Suppliers 10,294,247 José Escobar Roca 1 Vessel Don Matias " J " 200 Suppliers 10,428,125 Marcos Romero Barrera 1 Vessel Ana Belén 150 Suppliers 10,824,619 Manuel Reyes Neira 1 Vessel Doña Candelaría 500 Suppliers 10,843,418 Jorge Soto Macaya 1 Vessel Marbella II 160 Suppliers 10,843,652 Julio Reyes Garrido 1 Vessel Babilonia 179 Suppliers 10,860,160 Manuel Garrido Maripangue 1 Vessel Linares 400 Suppliers
10,879,303 Ibarra Tejerina Julio César
2 Vessels Concepción.
Borney
900
Suppliers
11,202,246 Omar Gómez Almonte
2 Vessels Vilos
II.Humboldt II
850
Suppliers
11,376,018 Hernández Palacios Francisco Fernando
2 Vessels
Valencia y Chenco
650
Suppliers
11,791,674 Juan Martínez Manriquez 1 Vessel Rio Loa I 520 Suppliers 11,902,809 Juan Alberto Saenz 1 Vessel Doña Sandra 197 Suppliers 12,320,818 Walter Sebastian Reyes Garrido 1 Vessel Mesana 560 Suppliers 12,323,409 Cristian Aquiro Vallejos Salas 1 Vessel Siloe 290 Suppliers 12,979,597 Hector Monsalves 1 Vessel Don Hernán M 315 Suppliers 13,619,520 Jose Acuña 1 Vessel Amparito I 197 Suppliers 14,235,833 John Poblete Pedreros 1 Vessel Santa Anita 260 Suppliers 14,390,236 Alex Cordero Urzua 1 Vessel Don Leonel 560 Suppliers 14,706,506 Igor Sovenko 1 Vessel Eben-Ezer II 400 Suppliers 16,767,429 Carlos Riquelme Alarcon 1 Vessel Nelly Nicole 400 Suppliers
52,003,186 Viviana Bernardette Quezada Martínez E.I.R.L
1 Vessel
Delia Rosa
400
Suppliers
53,310,793 Comunidad Espinoza Jeno y Compañía 1 Vessel Macedonia I 400 Suppliers
76,006,325 Sociedad Pesquera Guacolda
1 Vessel Cristian
Guillermo
500
Suppliers 76,202,609 Fernando Martínez Carmona 1 Vessel Doña Carmela 400 Suppliers 77,136,760 Pesquera FamCord Ltda 1 Vessel Don Patricio 630 Suppliers 77,780,330 Pesquera Bahia Coliumo 1 Vessel Don Pedro M 560 Suppliers 78,454,630 Jiménez y Santibáñez Ltda 1 Vessel Jefte 400 Suppliers
79,822,090 Pesquera Pez Maule
1 Vessel Margarita del
Mar
239
Suppliers

80
Chilean ID
number
Debtor Pledge or Mortgage
Vessels
Value
ThUS$
Relationship 3,362,676 5,408,694 6,329,914 6,748,011 6,836,899 7,487,933 8,901,579 8,912,682 9,063,718 9,927,786 10,294,247 10,820,867 12,979,597 14,235,833 15,911,090 16,767,429 78,454,630 79,822,090
Sergio Duran Saavedra Luis Monares Moya Julio Torres Vergara Manuel Bravo Vera Arturo Valenzuela Veronica Ruiz Quiñan Justo Macaya Silva Juan San Martin Oscar Gutierrez Cáceres Rojas Lorena José Escobar Roca Manuel Bustos Rodríguez Hector Monsalves John Poblete Gonzalo Alberto Araya Carlos Riquelme Alarcon Jiménez y Santibáñez Ltda Pesquera Pez Maule
Promissory Promissory Promissory Promissory Promissory Promissory Promissory Promissory Promissory Promissory Promissory Promissory Promissory Promissory Promissory Promissory Promissory Promissory
Yolanda Yolanda S Santa Elena Santa Elvita Ulises Veronica Alejandra Bill Lazaro II Santa Patricia El Yeye Don Matias " J " Perla Negra Don Hernán M Santa Anita Chico Risso Nelly Nicole Jefte Margarita del Mar
15 138 18 20 30 472 216 17 32 28 98 44 335 170 30 149 138 152
Suppliers Suppliers Suppliers Suppliers Suppliers Suppliers Suppliers Suppliers Suppliers Suppliers Suppliers Suppliers Suppliers Suppliers Suppliers Suppliers Suppliers Suppliers
f) Contingencies
The company regularly evaluates the likelihood of loss on its litigations and contingencies, in accordance with estimates provided by its legal advisers. Detailed information relating to these processes is available, provided it does not compromise the company’s defense. As of the date of these consolidated financial statements, Compañía Pesquera Camanchaca S.A. and its subsidiaries have lawsuits or administrative issues pending before courts of law or administrative bodies, as applicable, and have recorded provisions as of December 31, 2019 as follows.
12-31-2019 12-31-2018
Proceedings Number of cases
Accounting provision
ThUS$
Number of cases
Accounting provision
ThUS$
Civil
Employment
Administrative
Criminal
22
10
8
2
251
46
109
-
24
7
11
1
219
100
161
-
Total 42 406 43 480
NOTE 36 - Sanctions
Compañía Pesquera Camanchaca S.A. and subsidiaries, its Directors and Managers have not been subject to sanctions of any kind by the Financial Market Commission or other administrative authorities as of the date these consolidated financial statements were issued.

81
NOTE 37 - The environment
Compañía Pesquera Camanchaca S.A. and its subsidiaries continuously renew their commitment to the environment, by implementing new processes and technologies at their production plants. This has enabled them to achieve a sustainable business, and to further develop their fishing businesses and farm species in an efficient manner, while minimizing their impact on the environment.
Investments were made in the following environmental mitigation projects DURING THE PERIOD January 1 to December 31, 2019.
12-31-2019
Investment
ThUS$ Project name Waste management 1,164 Environmental services 425
Total 1,589
Investments were made in the following environmental mitigation projects DURING THE PERIOD January 1 to December 31, 2018.
12-31-2018
Investment ThUS$ Project name
Waste management 1,363 Environmental services 643
Total 2,006
The parent company and its subsidiaries are committed to complying with all environmental regulations. In particular they will continue to actively participate in discussions regarding projects that involve amendments and improvements to environmental and health regulations, to ensure that these can be implemented from a technical, financial, social and environmental perspective. They are dedicated to supporting the best proposal for the environment and developing the industry.

82
NOTE 38 - Employment distribution
The number of group employees by category at the reporting date is as follows.
Company
Laborers
Professionals and
Technicians Senior
Executives Total
12-31-2019
Compañía Pesquera Camanchaca S.A 293 195 13 501
Salmones Camanchaca S.A. 1,492 326 13 1,831
Transportes Interpolar Ltda. 40 12 - 52
Aéreo Interpolar Ltda. - 7 - 7
Camanchaca Cultivos Sur 321 53 2 376
Camanchaca Pesca Sur S.A. 870 156 2 1,028
Foreign Commercial Offices - 19 5 24
Total 3,016 768 35 3,819
Company
Laborers
Professionals and
Technicians Senior
Executives Total
12-31-2018
Compañía Pesquera Camanchaca S.A 308 182 13 503
Salmones Camanchaca S.A. 1,045 277 13 1,335 Transportes Interpolar Ltda. 29 10 - 39
Aéreo Interpolar Ltda. - 9 - 9 Camanchaca Cultivos Sur 294 55 2 351 Camanchaca Pesca Sur S.A. 510 143 2 655
Foreign Commercial Offices - 20 5 25
Total 2,186 696 35 2,917
NOTE 39 - Subsequent events
The first cases of Coronavirus began to appear in China during January 2020, but as of the date of this report, it had spread to almost the entire world and over 200 cases had been detected in Chile. This situation has affected Camanchaca’s target export markets, leading the company to implement measures that reduce the health risks for its employees that secure operational continuity for its production facilities and that open up new target markets. So far there are no Camanchaca employees diagnosed with the virus, nor has the operation of any of its production facilities been suspended. Its supply of consumables and export chains have continued to function, although under new sanitary protocols. However, as the pandemic is still spreading, there are risks that production or logistics could yet be disrupted.
During February, the Russian authority imposed export restrictions on many Chilean processing plants, including the two Camanchaca processing plants that had been previously authorized. This will require diverting product to other markets in successive months. The Russian market represents around 5% of world consumption of farmed Atlantic salmon, and it purchased 8% of Chilean Atlantic salmon exports in 2019. (Source: Kontali). The Russian market received 18% of Salmones Camanchaca S.A.’s Atlantic salmon sales in 2019. The company believes that it can divert these sales to other markets, as it usually does when relative conditions change, so does not expect to change any of its farming or investment plans.
On February 28, 2020, Compañía Pesquera Camanchaca extended the repayment schedule of its long-term credit line (Tranche B), which totals US$ 40 million, by 2 years. To date it has drawn down US$ 30 million from this facility from Rabobank, DNB and Santander banks. Consequently, repayments originally scheduled to begin in May 2020 will now begin in May 2022, and the credit facility scheduled to end in November 2022 will now end in November 2024.

83
No subsequent events have occurred between December 31, 2019 and the date on which these consolidated financial statements were issued, which might have a significant effect on their interpretation.