CRÉDIT AGRICOLE S.A.
260
CRÉDIT AGRICOLE S.A. CONSOLIDATED FINANCIAL STATEMENTS AT 31 DECEMBER 2020 Examined by the Crédit Agricole S.A. Board of Directors on 10 February 2021 UNAUDITED VERSION
-
Upload
khangminh22 -
Category
Documents
-
view
1 -
download
0
Transcript of CRÉDIT AGRICOLE S.A.

CRÉDIT AGRICOLE S.A.
Consolidated financial statements of the Crédit Agricole S.A. group.
31 December 2020
CONSOLIDATED FINANCIAL STATEMENTS AT 31 DECEMBER
2020
Examined by the Crédit Agricole S.A. Board of Directors on 10 February 2021
UNAUDITED VERSION
Consolidated financial statements of Credit Agricole S.A. 31 December 2020
2
SUMMARY
GENERAL FRAMEWORK.............................................................................................................................................................. 5
LEGAL PRESENTATION OF THE ENTITY ................................................................................................................................... 5
CRÉDIT AGRICOLE INTERNAL RELATIONS ............................................................................................................................ 7
INFORMATION PERTAINING TO THE RELATED PARTIES ...................................................................................................... 11
CONSOLIDATED FINANCIAL STATEMENTS ............................................................................................................................... 13
INCOME STATEMENT ........................................................................................................................................................... 13
NET INCOME AND OTHER COMPREHENSIVE INCOME ........................................................................................................... 14
BALANCE SHEET – ASSETS ............................................................................................................................................................ 15
BALANCE SHEET – LIABILITIES ....................................................................................................................................................... 16
STATEMENT OF CHANGES IN EQUITY ......................................................................................................................................... 17
CASH FLOW STATEMENT .............................................................................................................................................................. 19
NOTES TO THE CONSOLIDATED FINANCIAL STATEMENTS ....................................................................................................... 22
NOTE 1 Group accounting policies and principles, assessments and estimates applied. ................................... 22
1.1 Applicable standards and comparability .......................................................................................................... 22
1.2 Accounting policies and principles ..................................................................................................................... 26
1.3 Consolidation principles and methods (IFRS 10, IFRS 11 and IAS 28) .............................................................. 51
NOTE 2 Major structural transactions and material events during the period ........................................................ 55
NOTE 3 Financial management, risk exposure and hedging policy ...................................................................... 64
3.1 Credit risk .................................................................................................................................................................. 64
3.2 Market risk ............................................................................................................................................................... 100
3.3 Liquidity and financing risk .................................................................................................................................. 109
3.4 Hedge accounting ............................................................................................................................................... 113
3.5 Operational risks .................................................................................................................................................... 125
3.6 Capital management and regulatory ratios .................................................................................................... 125
NOTE 4 Notes on net income and other comprehensive income ........................................................................ 126
4.1 Interest income and expenses ............................................................................................................................ 126
4.2 Fees and commissions income and expense .................................................................................................. 127
4.3 Net gains (losses) on financial instruments at fair value through profit or loss ............................................ 127
4.4 Net gains (losses) on financial instruments at fair value through other comprehensive income ............ 129
4.5 Net gains (losses) arising from the derecognition of financial assets at amortised cost ........................... 129
4.6 Net income (expenses) on other activities ....................................................................................................... 129
4.7 Operating expenses ............................................................................................................................................. 130
4.8 Amortisation of intangible assets and depreciation of property, plant and equipment ......................... 131
4.9 Cost of risk .............................................................................................................................................................. 132
4.10 Net gains (losses) on other assets ....................................................................................................................... 133
4.11 Income tax charge ............................................................................................................................................... 133
4.12 Changes in other comprehensive income ....................................................................................................... 135
NOTE 5 Segment reporting ....................................................................................................................................... 138
5.1 Operating segment information ......................................................................................................................... 140
5.2 Segment information: geographical analysis .................................................................................................. 142
5.3 Insurance specificities .......................................................................................................................................... 142
NOTE 6 Notes to the balance sheet ......................................................................................................................... 146
6.1 Cash, central banks .............................................................................................................................................. 146
6.2 Financial assets and liabilities at fair value through profit or loss .................................................................. 146

Consolidated financial statements of Credit Agricole S.A. 31 December 2020
3
6.3 Hedging derivatives.............................................................................................................................................. 150
6.4 Financial assets at fair value through other comprehensive income .......................................................... 150
6.5 Financial assets at amortised cost ..................................................................................................................... 152
6.6 Transferred assets not derecognised or derecognised with on‑going involvement ................................. 155
6.7 Exposure to sovereign risk .................................................................................................................................... 158
6.8 Financial liabilities at amortised cost ................................................................................................................. 160
6.9 Information on the offsetting of financial assets and financial liabilities ...................................................... 162
6.10 Current and deferred tax assets and liabilities ................................................................................................. 164
6.11 Accrued income and expenses and other assets and liabilities .................................................................. 166
6.12 Non-current assets held for sale and discontinued operations ..................................................................... 167
6.13 Joint ventures and associates ............................................................................................................................. 169
6.14 Investment property ............................................................................................................................................. 172
6.15 Property, plant & equipment and intangible assets (excluding goodwill) .................................................. 173
6.16 Goodwill ................................................................................................................................................................. 174
6.17 Insurance company technical reserves ............................................................................................................ 177
6.18 Provisions ................................................................................................................................................................ 179
6.19 Subordinated debt ............................................................................................................................................... 186
6.20 Capital .................................................................................................................................................................... 188
6.21 Net profit (loss) for the year attributable to minority interests ........................................................................ 192
6.22 Breakdown of financial assets and financial liabilities by contractual maturity ......................................... 194
NOTE 7 Employee benefits and other compensation ............................................................................................ 195
7.1 Analysis of employee expenses .......................................................................................................................... 195
7.2 Average headcount ............................................................................................................................................ 195
7.3 Post-employment benefits, defined-contribution plans ................................................................................. 195
7.4 Post-employment benefits, defined-benefit plans .......................................................................................... 196
7.5 Other employee benefits .................................................................................................................................... 199
7.6 Share-based payments ........................................................................................................................................ 199
7.7 Executive compensation ..................................................................................................................................... 200
NOTE 8 Lease contracts ............................................................................................................................................ 201
8.1 Leases for which the Group is the lessee .......................................................................................................... 201
8.2 Leases for which the Group is the lessor ............................................................................................................ 203
NOTE 9 Commitments given and received and other guarantees ....................................................................... 204
NOTE 10 Reclassification of financial instruments ..................................................................................................... 207
NOTE 11 Fair value of financial instruments .............................................................................................................. 208
11.1 Fair value of financial assets and liabilities recognised at amortised cost .................................................. 209
11.2 Information about financial instruments measured at fair value .................................................................. 212
11.3 Estimated impact of inclusion of the margin at inception ............................................................................. 226
NOTE 12 Scope of consolidation at 31 December 2020 .......................................................................................... 227
12.1 Information on subsidiaries .................................................................................................................................. 227
12.2 Composition of the scope ................................................................................................................................... 229
NOTE 13 Investments in non-consolidated companies and structured entities ..................................................... 255
13.1 Information on subsidiaries .................................................................................................................................. 255
13.2 Non-consolidated structured entities ................................................................................................................ 255
NOTE 14 Events subsequent to 31 December 2020 .................................................................................................. 260
14.1 Unwinding of 15% of the switch guarantee mechanism ................................................................................ 260

Consolidated financial statements of Credit Agricole S.A. 31 December 2020
4
14.2 Redemption by Crédit Agricole Consumer Finance of 49% of the capital of the joint venture CACF
Bankia S.A. ............................................................................................................................................................................. 260

Consolidated financial statements of Credit Agricole S.A. 31 December 2020
5
GENERAL FRAMEWORK
LEGAL PRESENTATION OF THE ENTITY
Since the Extraordinary General Meeting of 29 November 2001, the Company’s name has been: Crédit Agricole S.A.
Since 1 July 2012, the address of the Company’s registered office has been: 12, place des États-Unis, 92127 Montrouge
Cedex, France.
Registration number: 784 608 416 Nanterre Trade and Companies Register
NAF code: 6419Z.
Crédit Agricole S.A. is a French public limited company (“Société anonyme”) with a Board of Directors governed by
ordinary company law and more specifically by Book II of the French Commercial Code (“Code de commerce”).
Crédit Agricole S.A. is also subject to the provisions of the French Monetary and Financial Code and more specifically
Articles L. 512-47 et seq. thereof.
Crédit Agricole S.A. was licensed as an authorised lending institution in the mutual and cooperative banks category
on 17 November 1984. As such, it is subject to oversight by the banking supervisory authorities, and more particularly
by the French Regulatory and Resolution Supervisory Authority (ACPR) and the European Central Bank.
Crédit Agricole S.A. shares are admitted for trading on Euronext Paris. Crédit Agricole S.A. is subject to the prevailing
stock market regulations particularly with respect to public disclosure obligations.
A bank with mutual roots
SAS Rue La Boétie, which is wholly owned by the Regional Banks, holds the majority of Crédit Agricole S.A.’s share
capital. Shares in SAS Rue La Boétie may not be transferred outside the Regional Banks’ network. Furthermore, any
trading in these shares between Regional Banks is governed by a liquidity agreement that in particular sets out the
procedures for determining the transaction price. This encompasses both disposals of shares between the Regional
Banks and capital increases at SAS Rue La Boétie.
Fédération Nationale du Crédit Agricole (FNCA) acts as a consultative and representative body, and as a
communication forum for the Regional Banks.
In accordance with the provisions of the French Monetary and Financial Code (Articles L. 511-31 and L. 511-32), as the
corporate centre of the Crédit Agricole network, Crédit Agricole S.A. is responsible for exercising administrative,
technical and financial control over the institutions affiliated to it in order to maintain a cohesive network (as defined
in Article R. 512-18 of the French Monetary and Financial Code) and to ensure their proper functioning and compliance
with all regulations and legislation governing them. In that regard, Credit Agricole S.A. may take all necessary measures
notably to ensure the liquidity and solvency of the network as a whole and of each of its affiliated institutions.

Consolidated financial statements of Credit Agricole S.A. 31 December 2020
6

Consolidated financial statements of Credit Agricole S.A. 31 December 2020
7
CRÉDIT AGRICOLE INTERNAL RELATIONS
INTERNAL FINANCING MECHANISMS
Crédit Agricole has instituted a number of internal financing mechanisms specific to the Group.
Regional Banks’ current accounts
Each Regional Bank holds a current account with Crédit Agricole S.A., which records the financial movements resulting
from internal financial transactions within the Group. This account, which may be in credit or debit, is presented in the
balance sheet under “Crédit Agricole internal transactions - Current Accounts” and integrated on a specific line item,
either “Loans and receivables due from credit institutions” or “Due to credit institutions”.
Special savings accounts
Funds held in special savings accounts (popular savings passbook accounts [Livret d’épargne populaire], sustainable
development passbook accounts [Livret de développement durable], home purchase savings schemes and
accounts, popular savings schemes, youth passbook accounts [Livret jeune] and passbook savings accounts [Livret A])
are collected by the Regional Banks on behalf of Crédit Agricole S.A. and must be transferred to the latter. Crédit
Agricole S.A. recognises them on its balance sheet as “Due to customers”.
Term deposits and advances
The Regional Banks also collect savings funds (passbook accounts, bonds, warrants, certain term accounts and similar
accounts etc.) on behalf of Crédit Agricole S.A. These funds are transferred to Crédit Agricole S.A., and are recognised
as such on its balance sheet.
Special savings accounts and time deposits and advances are used by Crédit Agricole S.A. to make “advances”
(loans) to the Regional Banks, with a view to funding their medium and long term loans.
A series of four internal financial reforms has been implemented. These reforms have permitted the transfer back to
the Regional Banks, in the form of so-called “mirror advances” (with maturities and interest rates precisely matching
those of the savings funds received) of first 15%, 25%, then 33% and, since 31 December 2001, 50% of the savings
resources, which they are free to use at their discretion.
Since 1 January 2004, the financial margins generated by the centralised management of funds collected (and not
transferred back via mirror advances) are shared by the Regional Banks and Crédit Agricole S.A. and are determined
by using replacement models and applying market rates.
Furthermore, the Regional Banks may be refinanced in the form of advances negotiated at market rates with Crédit
Agricole S.A.
Transfer of Regional Banks’ liquidity surpluses
The Regional Banks may use their “monetary” deposits (demand deposits, non-centralised time deposits and
negotiable certificates of deposit) to finance lending to their customers. Surpluses must be transferred to Crédit
Agricole S.A. where they are booked as current or time accounts, under “Crédit Agricole internal transactions”.
Foreign currency transactions
Crédit Agricole S.A. represents the Regional Banks with respect to the Banque de France and centralises their foreign
exchange transactions.

Consolidated financial statements of Credit Agricole S.A. 31 December 2020
8
Medium and long-term notes issued by Crédit Agricole S.A.
These are placed mainly on the market or by the Regional Banks with their customers. They are booked on the balance
sheet by Crédit Agricole S.A. under liabilities either as “Debt securities” or as “Subordinated debt”, depending on the
type of security issued.
TLTRO III mechanism
The ECB set out a third series of longer-term refinancing operations in March 2019, the terms and conditions of which
were reviewed in September 2019 and again in March and April 2020, in connection with the COVID-19 situation.
The TLTRO III mechanism aims to provide longterm refinancing, with a subsidy in the event of reaching a lending
performance target based on growth of lending to firms and households, which is applied over the three-year maturity
of the TLTRO operation, with an additional subsidy, awarding a further and temporary incentive, which is applied over
the one-year period between June 2020 and June 2021.
Provided that the level of outstanding amounts giving entitlement to these subsidies allow to consider the subsidies as
already granted by the ECB in relation to the support to the economy both in the first year and in subsequent years,
the interest accrued with a negative interest rate takes this subsidy into account.
All subsidies are spread over the expected refinancing period from the TLTRO III drawing date. Outstanding amounts
that give entitlement to the subsidy already exceed the level required to be able to benefit from the planned levels
of subsidies. The additional subsidy for the first year is linearly accrued over one year, starting from June 2020.
For the new subsidy announced by the ECB following its meeting of 10 December 2020, covering the period from
June 2021 to June 2022, these principles will continue to apply as long as there is a reasonable assurance that the level
of eligible amounts outstanding will render it possible to meet the conditions necessary to acquire these subsidies when
they become due and payable by the ECB.
As at 31/12/2020, the Group has drawn 133 billion euros in TLTRO III at the ECB.
HEDGING OF LIQUIDITY AND SOLVENCY RISKS AND BANKING RESOLUTION
Under the legal internal financial solidarity mechanism enshrined in Article L. 511-31 of the French Monetary and
Financial Code (CMF), Crédit Agricole S.A., as the central body of the Crédit Agricole network, must take all necessary
measures to ensure the liquidity and solvency of each affiliated credit institution, as well as the network as a whole. As
a result, each member of the network benefits from this internal financial solidarity.
The general provisions of the CMF (Code monétaire et financier — French Monetary and Financial Code) are reflected
in the internal provisions setting out the operational measures required for this legal solidarity mechanism.
In the initial public offering of Crédit Agricole S.A., CNCA (now Crédit Agricole S.A.) signed an agreement with the
Regional Banks in 2001 aimed at governing internal relations within the Crédit Agricole network. The agreement notably
provides for the creation of a Fund for Bank Liquidity and Solvency Risks (FRBLS) designed to enable Crédit Agricole S.A.
to fulfil its role as central body by providing assistance to any affiliated members that may experience difficulties. The
main provisions of this agreement are set out in Chapter III of the Registration Document filed by Crédit Agricole S.A.
with France's Commission des Opérations de Bourse on 22 October 2001 under number R. 01-453.
The European banking crisis management framework was adopted in 2014 by EU Directive 2014/59 (known as the
“Bank Recovery and Resolution Directive — BRRD”), incorporated into French law by Order 2015-1024 of
20 August 2015, which also adapted French law to the provisions of European Regulation 806/2014 of 15 July 2014
establishing uniform rules and a uniform procedure for the resolution of credit institutions and certain investment firms
in the framework of a Single Resolution Mechanism and a Single Resolution Fund. Directive (EU) 201/879 of 20 May 2019,
known as “BRRD2”, amended the BRRD and was incorporated into French law by Order 2020-1636 of
21 December 2020.
This framework, which includes measures to prevent and to resolve banking crises, is intended to preserve financial
stability, to ensure the continuity of activities, services and operations of institutions whose failure could significantly
impact the economy, to protect depositors, and to avoid or limit the use of public financial support as much as
possible. In this context, the European Resolution Authorities, including the Single Resolution Board, have been granted
extensive powers to take all necessary measures in connection with the resolution of all or part of a credit institution or
the group to which it belongs.
For cooperative banking groups, the ”extended single point of entry” (“extended SPE”) resolution strategy is favoured
by the resolution authorities, whereby resolution tools would be applied simultaneously at the level of Crédit
Agricole S.A. and the affiliated entities. In this respect, and in the event of a resolution of the Crédit Agricole Group,
the scope comprising Crédit Agricole S.A. (in its capacity as the corporate centre) and its affiliated entities would be
considered as a whole as the expanded single entry point. Given the foregoing and the solidarity mechanisms that
exist within the network, a member of the Crédit Agricole network cannot be put individually in resolution.

Consolidated financial statements of Credit Agricole S.A. 31 December 2020
9
The resolution authorities may initiate resolution proceedings against a credit institution where it considers that: the
institution has failed or is likely to fail, there is no reasonable prospect that another private measure will prevent the
failure within a reasonable time, a resolution measure is necessary, and a liquidation procedure would be inadequate
to achieve the resolution objectives mentioned above.
The resolution authorities may use one or more resolution tools, as described below, with the objective of recapitalising
or restoring the viability of the institution. The resolution tools should be implemented in such a way that equity holders
(shares, mutual shares, CCIs, CCAs) bear losses first, with creditors following up immediately, provided that they are not
excluded from bail-in legally speaking or by a decision of the resolution authorities. French law also provides for a
protective measure when certain resolution tools or decisions are implemented, such as the principle that equity
holders and creditors of an institution in resolution may not incur greater losses than those they would have incurred if
the institution had been liquidated in the context of a judicial liquidation procedure under the French Commercial
Code (NCWOL principle referred to in Article L. 613-57.I of the CMF). Thus, investors are entitled to claim compensation
if the treatment they receive in a resolution is less favourable than the treatment they would have received if the
institution had been subject to normal insolvency proceedings.
In the event that the resolution authorities decide to put the Crédit Agricole group in resolution, they will first write down
the CET1 instruments (shares, mutual shares, CCI and CCA), additional Tier 1 instruments, and Tier 2 instruments, in order
to absorb losses, and then possibly convert the additional Tier 1 instruments and Tier 21 instruments into equity securities.
Then, if the resolution authorities decide to use the bail-in tool, the latter would be applied to debt instruments2, resulting
in the partial or total write-down of these instruments or their conversion into equity in order to absorb losses.
With respect to the corporate centre and all affiliated entities, the resolution authorities may decide to implement, in
a coordinated manner, impairment or conversion measures and, where applicable, internal bailouts. In such an event,
the impairment or conversion measures and, where applicable, internal bailout measures would apply to all entities
within the Crédit Agricole network, regardless of the entity in question and regardless of the origin of the losses.
The creditor hierarchy in resolution is defined by the provisions of Article L 613-55-5 of the CMF, effective as at the date
of implementation of the resolution.
Equity holders and creditors of the same rank or with identical rights in liquidation will then be treated equally,
regardless of the group entity of which they are creditors.
The scope of this bail-in, which also aims to recapitalise the Crédit Agricole group, is based on capital requirements at
the consolidated level.
Investors must then be aware that there is therefore a significant risk that holders of shares, mutual shares, CCIs and
CCAs and holders of debt instruments of a member of the network will lose all or part of their investment if a resolution
procedure is implemented on the Group, regardless of the entity of which they are a creditor.
The other resolution tools available to the resolution authorities are essentially the total or partial transfer of the activities
of the institution to a third party or to a bridge institution and the separation of the assets of the institution.
This resolution framework does not affect the legal internal financial solidarity mechanism enshrined in Article L. 511-31
of the French Monetary and Financial Code, which applies to the Crédit Agricole network, as defined in Article R. 512-
18 of the same Code. Crédit Agricole S.A. considers that, in practice, this mechanism should be implemented prior to
any resolution procedure.
The implementation of a resolution procedure to the Crédit Agricole group would thus mean that the legal internal
solidarity mechanism had failed to remedy the failure of one or more network entities, and hence of the network as a
whole. It would also limit the likelihood that the conditions for triggering the guarantee covering the liabilities of Crédit
Agricole S.A. (granted in 1988 to its third party creditors by the Regional Banks on a joint and several basis, and up to
the aggregate amount of their own funds) are met. It should be recalled that this guarantee may be triggered in the
event of an asset shortfall following Crédit Agricole S.A.‘s bankruptcy or dissolution.
1 Articles L. 613-48 and L. 613-48-3 of the CMF
2 Articles L. 613-55 and L. 613-55-1 of the CMF

Consolidated financial statements of Credit Agricole S.A. 31 December 2020
10
SPECIFIC GUARANTEES PROVIDED BY THE REGIONAL BANKS TO CRÉDIT AGRICOLE S.A. (SWITCH)
The Switch guarantee mechanism, established on 23 December 2011 and supplemented by an initial addendum
signed on 19 December 2013 and twice amended in 2016 on 17 February (Amendment no. 2) and 21 July
(Amendment no. 3), respectively, forms part of the financial relationship between Crédit Agricole S.A., as corporate
centre, and the mutual network of Crédit Agricole Regional Banks. The most recent amendments to these guarantees
took effect retroactively on 1 July 2016, replacing the previous guarantees, and expire on 1 March 2027, subject to
total or partial early termination or extension in accordance with the terms of the contract. A first partial termination
corresponding to 35% of the Switch guarantees took place on 2 March 2020.
With this mechanism, and subject to the upper limit specified in the agreement, the Regional Banks assume, on behalf
of Crédit Agricole S.A., regulatory prudential requirements relating to the equity method of accounting for certain
equity investments held by Crédit Agricole S.A. They also assume the associated economic risks in the form of
compensation, where applicable.
The guarantees allow the transfer of regulatory prudential requirements that apply to Crédit Agricole S.A.’s equity
investments in Crédit Agricole Assurances (CAA), the latter being equity-accounted for regulatory reasons: we are
talking about the Insurance Switch guarantees. They are subject to fixed compensation covering the present value of
the risk and the cost of capital for the Regional Banks.
The effectiveness of the mechanism is secured by cash deposits paid by the Regional Banks to Crédit Agricole S.A.
These security deposits are calibrated to reflect the capital savings for Credit Agricole S.A., and are compensated at
a fixed rate based on conditions prevailing for long-term liquidity.
The Insurance Switch guarantees protect Crédit Agricole S.A. from a decline in the equity-accounted value of these
equity investments, subject to payment by the Regional Banks of compensation from the cash deposit. Likewise, if the
equity-accounted value later recovers, Crédit Agricole S.A. could return previously paid compensation in accordance
with a clawback provision.
In regulatory terms:
Crédit Agricole S.A. reduces its capital requirements in proportion to the amount of the guarantee provided
by the Regional Banks;
The Regional Banks symmetrically record capital requirements matching those offloaded by Crédit
Agricole S.A.
This mechanism, which is neutral at the Crédit Agricole group level, enables the rebalancing of capital allocation
between Crédit Agricole S.A. and the Regional Banks.
In accounting terms:
The guarantees are essentially insurance contracts, due to the existence of an insurance risk as defined by
IFRS 4. For the insured, they are treated as a first demand guarantee, and their compensation is recognised
in stages as a deduction from the interest margin under Revenues. In the event of a call on guarantees, or
following an improvement in fortunes, where applicable, the compensation payment or redemption
proceeds would be recognised under cost of risk;
It should be noted that the Insurance Switch guarantees are triggered on a half-yearly basis and are assessed
on the basis of half-yearly changes in the equity-accounted value of the Crédit Agricole Assurances equity
investments. At each quarterly period-end, the Regional Banks are required to estimate if there is a risk that
compensation will be payable and to fund provisions accordingly. On the other hand, Crédit Agricole S.A.
cannot recognise equivalent income because it is not certain. At each half-yearly period-end, and if the
conditions have been met, Crédit Agricole S.A. and the Regional Banks recognise on a symmetrical basis the
effects of triggering the guarantees (calling or claw-back).
CAPITAL TIES BETWEEN CRÉDIT AGRICOLE S.A. AND THE REGIONAL BANKS
The capital ties between Crédit Agricole S.A. and the Regional Banks are governed by an agreement entered into by
the parties prior to Crédit Agricole S.A.’s initial public offering.
Under the terms of this agreement, the Regional Banks exercise their control over Crédit Agricole S.A. through SAS Rue
La Boétie, a holding company wholly owned by the Regional Banks. The purpose of SAS Rue La Boétie is to hold enough
shares to ensure that it always owns at least 50% of the share capital and voting rights of Crédit Agricole S.A.
In addition, under the agreement, Crédit Agricole S.A. directly owned approximately 25% of the share capital of each
Regional Bank (except for Caisse régionale de la Corse which is 99.9%-owned). Following the transaction to simplify
the Group’s capital structure on 3 August 2016, the bulk of the cooperative investment certificates (“certificats
coopératifs d’investissement” or CCIs) and the cooperative associate certificates (“certificats coopératifs d’associés”
or CCAs) held by Crédit Agricole S.A. were transferred to a holding company (“Sacam Mutualisation”) jointly owned
by the Regional Banks.

Consolidated financial statements of Credit Agricole S.A. 31 December 2020
11
INFORMATION PERTAINING TO THE RELATED PARTIES
The related parties of Crédit Agricole S.A. are the consolidated companies, including equity-accounted entities, the
Group’s Senior Executives and the Regional Banks, given the Group’s legal structure and due to the fact that Crédit
Agricole S.A. is the central body of the Crédit Agricole network.
In accordance with the internal financial mechanisms at Crédit Agricole, transactions between Crédit Agricole S.A.
and the Regional Banks(1) are presented on the balance sheet and income statement as Crédit Agricole internal
transactions (Note 4.1 “Interest income and expenses”, Note 4.2 “Net fees and commissions”, Note 6.5 “Financial assets
at amortised cost” and Note 6.8 “Financial liabilities at amortised cost”).
OTHER SHAREHOLDERS’ AGREEMENTS
Shareholder agreements signed during the financial year are detailed in Note 2 “Major structural transactions and
material events during the period”.
RELATIONSHIPS BETWEEN CONTROLLED COMPANIES AFFECTING THE CONSOLIDATED BALANCE SHEET
A list of Crédit Agricole S.A. companies can be found in Note 12 “Scope of consolidation at 31 December 2020”. Since
the transactions and outstandings at year-end between the Group’s fully consolidated companies are eliminated on
consolidation, only transactions with companies consolidated by the equity method affect the Group’s consolidated
financial statements.
The main corresponding outstandings and commitments in the consolidated balance sheet at 31 December 2020
relate to transactions with the equity-accounted entities for the following amounts:
loans and receivables due from credit institutions: €3,032 million;
loans and receivables due from customers: €2,934 million;
debt due to credit institutions: €3,584 million;
debts due to customers: €425 million;
commitments given on financial instruments: €7,359 million;
commitments received on financial instruments: €4,051 million.
The transactions entered into with these entities did not have a material effect on the income statement for the period.
1 With the exception of Caisse régionale de la Corse, which is fully consolidated.

Consolidated financial statements of Credit Agricole S.A. 31 December 2020
12
MANAGEMENT OF RETIREMENT, EARLY RETIREMENT AND END-OF-CAREER ALLOWANCES: INTERNAL HEDGING
CONTRACTS WITHIN THE GROUP
As presented in Note 1.2 “Accounting policies and principles”, employees are provided with various types of post-
employment benefits. These concerns:
end-of-career allowances;
retirement plans, which may be either “defined-contribution” or “defined-benefit” plans.
The liability in this respect is partially funded by collective insurance contracts taken out with Predica, the Crédit
Agricole group’s life insurance company.
These contracts govern:
the setting up by the insurance company of mutual funds for investing contributions made by the employer
to build up sufficient funds to cover end-of-career allowances or the various pension schemes;
the management of the funds by the insurance company;
the payment to the beneficiaries of the allowances and of the benefits due under the various plans.
Information on post-employment benefits is provided in Note 7 “Employee benefits and other compensation” in
paragraphs 7.3 and 7.4.
RELATIONS WITH SENIOR MANAGEMENT
Detailed information on senior executives’ compensation is provided in paragraph 7.7 of Note 7 “Employee benefits
and other compensation”, as well as in the “Compensation policy” section, Chapter 3 “Corporate governance” of
the Universal Registration Document.
There exist no material transactions between Crédit Agricole S.A. and its senior management, their families or the
companies they control and which are not included in the Group’s scope of consolidation.

Consolidated financial statements of Credit Agricole S.A. 31 December 2020
13
CONSOLIDATED FINANCIAL STATEMENTS
INCOME STATEMENT
(in millions of euros) Notes 31/12/2020 31/12/2019
Interest and similar income 4.1 23,534 25,107
Interest and similar expenses 4.1 (11,716) (13,663)
Fee and commission income 4.2 10,679 10,556
Fee and commission expenses 4.2 (6,458) (6,500)
Net gains (losses) on financial instruments at fair value through profit or loss 4.3 2,256 17,082
Net gains (losses) on held for trading assets/liabilities 2,466 4,730
Net gains (losses) on other financial assets/liabilities at fair value through profit or loss (210) 12,352
Net gains (losses) on financial instruments at fair value through other comprehensive
income 4.4 586 162
Net gains (losses) on debt instruments at fair value through other comprehensive
income that may be reclassified subsequently to profit or loss 524 47
Remuneration of equity instruments measured at fair value through other
comprehensive income that will not be reclassified subsequently to profit or loss
(dividends)
62 115
Net gains (losses) arising from the derecognition of financial assets at amortised cost 4.5 25 (9)
Net gains (losses) arising from the reclassification of financial assets at amortised cost to
financial assets at fair value through profit or loss ‑ ‑
Net gains (losses) arising from the reclassification of financial assets at fair value through
other comprehensive income to financial assets at fair value through profit or loss ‑ ‑
Income on other activities 4.6 36,337 41,042
Expenses on other activities 4.6 (34,935) (53,180)
Reclassification of net gains (losses) of designated financial assets applying the overlay
approach 5.3 192 (445)
Revenues 20,500 20,152
Operating expenses 4.7 (11,748) (11,713)
Depreciation, amortisation and impairment of property, plant & equipment and
intangible assets 4.8 (1,143) (1,048)
Gross operating income 7,609 7,391
Cost of risk 4.9 (2,606) (1,256)
Operating income 5,003 6,135
Share of net income of equity-accounted entities 413 352
Net gains (losses) on other assets 4.10 75 54
Change in value of goodwill 6.16 (903) (589)
Pre-tax income 4,588 5,952
Income tax 4.11 (1,129) (456)
Net income from discontinued operations 6.12 (221) (38)
Net income 3,238 5,458
Non-controlling interests 6.21 546 614
NET INCOME GROUP SHARE 2,692 4,844
Earnings per share (in euros) ¹ 6.20 0.804 1.482
Diluted earnings per share (in euros) ¹ 6.20 0.804 1.482
¹ Corresponds to income excluding interest on deeply subordinated notes and including net income from discontinued or held-for-sale
operations.

Consolidated financial statements of Credit Agricole S.A. 31 December 2020
14
NET INCOME AND OTHER COMPREHENSIVE INCOME
(in millions of euros) Notes 31/12/2020 31/12/2019
Net income 3,238 5,458
Actuarial gains and losses on post-employment benefits 4.12 (93) (162)
Other comprehensive income on financial liabilities attributable to changes in
own credit risk ¹ 4.12 (149) (74)
Other comprehensive income on equity instruments that will not be
reclassified to profit or loss ¹ 4.12 (81) 53
Pre-tax other comprehensive income on items that will not be reclassified to
profit or loss excluding equity-accounted entities 4.12 (323) (183)
Pre-tax other comprehensive income on items that will not be reclassified to
profit or loss on equity-accounted entities 4.12 3 (30)
Income tax related to items that will not be reclassified to profit or loss
excluding equity-accounted entities 4.12 94 71
Income tax related to items that will not be reclassified to profit or loss on
equity-accounted entities 4.12 (2) 8
Other comprehensive income on items that will not be reclassified to profit or
loss from discontinued operations 4.12 ‑ 3
Other comprehensive income on items that will not be reclassified
subsequently to profit or loss net of income tax 4.12 (228) (131)
Gains and losses on translation adjustments 4.12 (805) 301
Gains and losses on debt instruments at fair value through other
comprehensive income that may be reclassified to profit or loss 4.12 550 1,189
Gains and losses on hedging derivative instruments 4.12 323 361
Reclassification of net gains (losses) of designated financial assets applying
the overlay approach
4.12-
5.3 (198) 434
Pre-tax other comprehensive income on items that may be reclassified to
profit or loss excluding equity-accounted entities 4.12 (130) 2,285
Pre-tax other comprehensive income on items that may be reclassified to
profit or loss on equity-accounted entities, Group Share 4.12 (136) 9
Income tax related to items that may be reclassified to profit or loss excluding
equity-accounted entities 4.12 (277) (481)
Income tax related to items that may be reclassified to profit or loss on equity-
accounted entities 4.12 1 1
Other comprehensive income on items that may be reclassified to profit or
loss from discontinued operations 4.12 (11) (12)
Other comprehensive income on items that may be reclassified subsequently
to profit or loss net of income tax 4.12 (553) 1,802
OTHER COMPREHENSIVE INCOME NET OF INCOME TAX 4.12 (781) 1,671
NET INCOME AND OTHER COMPREHENSIVE INCOME 2,457 7,129
Of which Group share 2,014 6,464
Of which non-controlling interests 443 665
¹ Of which +€51 millions of items transferred to Reserves of items that cannot be reclassified

Consolidated financial statements of Credit Agricole S.A. 31 December 2020
15
BALANCE SHEET – ASSETS
(in millions of euros) Notes 31/12/2020 31/12/2019
Cash, central banks 6.1 194,269 93,079
Financial assets at fair value through profit or loss 3.1-6.2-
6.6.6.7 432,462 399,477
Held for trading financial assets 261,968 230,721
Other financial assets at fair value through profit or loss 170,494 168,756
Hedging derivative Instruments 3.2-3.4 21,745 19,368
Financial assets at fair value through other comprehensive income 3.1-6.4-6.6-
6.7 266,072 261,321
Debt instruments at fair value through other comprehensive income
that may be reclassified to profit or loss 263,856 258,803
Equity instruments at fair value through other comprehensive income
that will not be reclassified to profit or loss 2,216 2,518
Financial assets at amortised cost 3.1-3.3-6.5-
6.6-6.7 953,900 906,280
Loans and receivables due from credit institutions 463,169 438,581
Loans and receivables due from customers 405,937 395,180
Debt securities 84,794 72,519
Revaluation adjustment on interest rate hedged portfolios 7,463 7,145
Current and deferred tax assets 6.10 4,304 4,300
Accruals, prepayments and sundry assets 6.11 40,307 38,349
Non-current assets held for sale and discontinued operations 6.12 2,734 475
Deferred participation 6.17 ‑ ‑
Investments in equity-accounted entities 6.13 7,650 7,232
Investment property 6.14 6,522 6,576
Property, plant and equipment 6.15 5,779 5,598
Intangible assets 6.15 3,196 3,163
Goodwill 6.16 14,659 15,280
TOTAL ASSETS 1,961,062 1,767,643

Consolidated financial statements of Credit Agricole S.A. 31 December 2020
16
BALANCE SHEET – LIABILITIES
(in millions of euros) Notes 31/12/2020 31/12/2019
Central banks 6.1 864 1,896
Financial liabilities at fair value through profit or loss 6.2 265,173 246,669
Held for trading financial liabilities 229,265 206,708
Financial liabilities designated at fair value through profit or loss 35,908 39,961
Hedging derivative Instruments 3.2-3.4 15,218 13,293
Financial liabilities at amortised cost 1,146,854 989,962
Due to credit institutions 3.3-6.8 264,919 142,041
Due to customers 3.1-3.3-6.8 719,388 646,914
Debt securities 3.3-6.8 162,547 201,007
Revaluation adjustment on interest rate hedged portfolios 10,380 9,183
Current and deferred tax liabilities 6.10 3,334 3,766
Accruals, deferred income and sundry liabilities 6.11 52,941 49,285
Liabilities associated with non-current assets held for sale and discontinued
operations 6.12 1,430 478
Insurance company technical reserves 6.17 363,124 356,107
Provisions 6.18 4,197 4,364
Subordinated debt 3.3-6.19 24,052 21,797
Total Liabilities 1,887,567 1,696,800
Equity 73,495 70,843
Equity - Group share 65,217 62,920
Share capital and reserves 28,323 27,368
Consolidated reserves 32,037 27,865
Other comprehensive income 2,175 2,843
Other comprehensive income on discontinued operations (10) ‑
Net income (loss) for the year 2,692 4,844
Non-controlling interests 8,278 7,923
TOTAL LIABILITIES AND EQUITY 1,961,062 1,767,643
Consolidated financial statements of Credit Agricole S.A. 31 December 2020
17
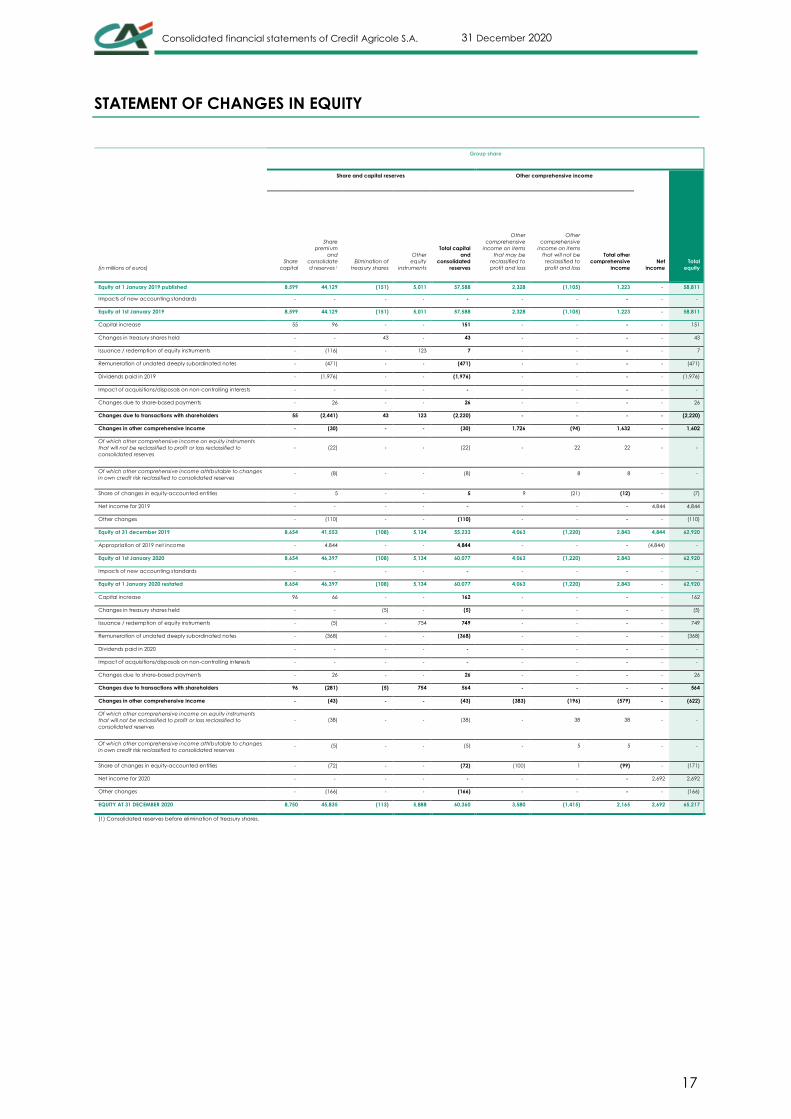
STATEMENT OF CHANGES IN EQUITY
Group share
Share and capital reserves Other comprehensive income
Net
income
Total
equity (in millions of euros)
Share
capital
Share
premium
and
consolidate
d reserves 1
Elimination of
treasury shares
Other
equity
instruments
Total capital
and
consolidated
reserves
Other
comprehensive
income on items
that may be
reclassified to
profit and loss
Other
comprehensive
income on items
that will not be
reclassified to
profit and loss
Total other
comprehensive
income
Equity at 1 January 2019 published 8,599 44,129 (151) 5,011 57,588 2,328 (1,105) 1,223 ‑ 58,811
Impacts of new accounting standards ‑ ‑ ‑ ‑ ‑ ‑ ‑ ‑ ‑ ‑
Equity at 1st January 2019 8,599 44,129 (151) 5,011 57,588 2,328 (1,105) 1,223 ‑ 58,811
Capital increase 55 96 ‑ ‑ 151 ‑ ‑ ‑ ‑ 151
Changes in treasury shares held ‑ ‑ 43 ‑ 43 ‑ ‑ ‑ ‑ 43
Issuance / redemption of equity instruments ‑ (116) ‑ 123 7 ‑ ‑ ‑ ‑ 7
Remuneration of undated deeply subordinated notes ‑ (471) ‑ ‑ (471) ‑ ‑ ‑ ‑ (471)
Dividends paid in 2019 ‑ (1,976) ‑ ‑ (1,976) ‑ ‑ ‑ ‑ (1,976)
Impact of acquisitions/disposals on non-controlling interests ‑ ‑ ‑ ‑ ‑ ‑ ‑ ‑ ‑ ‑
Changes due to share-based payments ‑ 26 ‑ ‑ 26 ‑ ‑ ‑ ‑ 26
Changes due to transactions with shareholders 55 (2,441) 43 123 (2,220) ‑ ‑ ‑ ‑ (2,220)
Changes in other comprehensive income ‑ (30) ‑ ‑ (30) 1,726 (94) 1,632 ‑ 1,602
Of which other comprehensive income on equity instruments
that will not be reclassified to profit or loss reclassified to
consolidated reserves
‑ (22) ‑ ‑ (22) ‑ 22 22 ‑ ‑
Of which other comprehensive income attributable to changes
in own credit risk reclassified to consolidated reserves ‑ (8) ‑ ‑ (8) ‑ 8 8 ‑ ‑
Share of changes in equity-accounted entities ‑ 5 ‑ ‑ 5 9 (21) (12) ‑ (7)
Net income for 2019 ‑ ‑ ‑ ‑ ‑ ‑ ‑ ‑ 4,844 4,844
Other changes ‑ (110) ‑ ‑ (110) ‑ ‑ ‑ ‑ (110)
Equity at 31 december 2019 8,654 41,553 (108) 5,134 55,233 4,063 (1,220) 2,843 4,844 62,920
Appropriation of 2019 net income ‑ 4,844 ‑ ‑ 4,844 ‑ ‑ ‑ (4,844) ‑
Equity at 1st January 2020 8,654 46,397 (108) 5,134 60,077 4,063 (1,220) 2,843 ‑ 62,920
Impacts of new accounting standards ‑ ‑ ‑ ‑ ‑ ‑ ‑ ‑ ‑ ‑
Equity at 1 January 2020 restated 8,654 46,397 (108) 5,134 60,077 4,063 (1,220) 2,843 ‑ 62,920
Capital increase 96 66 ‑ ‑ 162 ‑ ‑ ‑ ‑ 162
Changes in treasury shares held ‑ ‑ (5) ‑ (5) ‑ ‑ ‑ ‑ (5)
Issuance / redemption of equity instruments ‑ (5) ‑ 754 749 ‑ ‑ ‑ ‑ 749
Remuneration of undated deeply subordinated notes ‑ (368) ‑ ‑ (368) ‑ ‑ ‑ ‑ (368)
Dividends paid in 2020 ‑ ‑ ‑ ‑ ‑ ‑ ‑ ‑ ‑ ‑
Impact of acquisitions/disposals on non-controlling interests ‑ ‑ ‑ ‑ ‑ ‑ ‑ ‑ ‑ ‑
Changes due to share-based payments ‑ 26 ‑ ‑ 26 ‑ ‑ ‑ ‑ 26
Changes due to transactions with shareholders 96 (281) (5) 754 564 ‑ ‑ ‑ ‑ 564
Changes in other comprehensive income ‑ (43) ‑ ‑ (43) (383) (196) (579) ‑ (622)
Of which other comprehensive income on equity instruments
that will not be reclassified to profit or loss reclassified to
consolidated reserves
‑ (38) ‑ ‑ (38) ‑ 38 38 ‑ ‑
Of which other comprehensive income attributable to changes
in own credit risk reclassified to consolidated reserves ‑ (5) ‑ ‑ (5) ‑ 5 5 ‑ ‑
Share of changes in equity-accounted entities ‑ (72) ‑ ‑ (72) (100) 1 (99) ‑ (171)
Net income for 2020 ‑ ‑ ‑ ‑ ‑ ‑ ‑ ‑ 2,692 2,692
Other changes ‑ (166) ‑ ‑ (166) ‑ ‑ ‑ ‑ (166)
EQUITY AT 31 DECEMBER 2020 8,750 45,835 (113) 5,888 60,360 3,580 (1,415) 2,165 2,692 65,217
(1) Consolidated reserves before elimination of treasury shares.

Consolidated financial statements of Credit Agricole S.A. 31 December 2020
18
Non-controlling interests
Total consolidated
equity
Other comprehensive income
Total equity (in millions of euros)
Capital, associated
reserves and income
Other comprehensive
income on items that may
be reclassified to profit
and loss
Other comprehensive
income on items that will
not be reclassified to profit
and loss
Total other comprehensive
income
Equity at 1 January 2019 published 6,826 (114) (7) (121) 6,705 65,516
Impacts of new accounting standards ‑ ‑ ‑ ‑ ‑ ‑
Equity at 1st January 2019 6,826 (114) (7) (121) 6,705 65,516
Capital increase ‑ ‑ ‑ ‑ ‑ 151
Changes in treasury shares held ‑ ‑ ‑ ‑ ‑ 43
Issuance / redemption of equity instruments ‑ ‑ ‑ ‑ ‑ 7
Remuneration of undated deeply subordinated notes (27) ‑ ‑ ‑ (27) (498)
Dividends paid in 2019 (376) ‑ ‑ ‑ (376) (2,352)
Impact of acquisitions/disposals on non-controlling interests ‑ ‑ ‑ ‑ ‑ ‑
Changes due to share-based payments 12 ‑ ‑ ‑ 12 38
Changes due to transactions with shareholders (391) ‑ ‑ ‑ (391) (2,611)
Changes in other comprehensive income 1 67 (16) 51 52 1,654
Of which other comprehensive income on equity instruments
that will not be reclassified to profit or loss reclassified to
consolidated reserves
1 ‑ (1) (1) ‑ ‑
Of which other comprehensive income attributable to changes
in own credit risk reclassified to consolidated reserves ‑ ‑ ‑ ‑ ‑ ‑
Share of changes in equity-accounted entities (1) ‑ ‑ ‑ (1) (8)
Net income for 2019 614 ‑ ‑ ‑ 614 5,458
Other changes 944 ‑ ‑ ‑ 944 834
Equity at 31 december 2019 7,993 (47) (23) (70) 7,923 70,843
Appropriation of 2019 net income ‑ ‑ ‑ ‑ ‑ ‑
Equity at 1st January 2020 7,993 (47) (23) (70) 7,923 70,843
Impacts of new accounting standards ‑ ‑ ‑ ‑ ‑ ‑
Equity at 1 January 2020 restated 7,993 (47) (23) (70) 7,923 70,843
Capital increase ‑ ‑ ‑ ‑ - 162
Changes in treasury shares held ‑ ‑ ‑ ‑ - (5)
Issuance / redemption of equity instruments 2 ‑ ‑ ‑ 2 751
Remuneration of undated deeply subordinated notes (106) ‑ ‑ ‑ (106) (474)
Dividends paid in 2020 (109) ‑ ‑ ‑ (109) (109)
Impact of acquisitions/disposals on non-controlling interests ‑ ‑ ‑ ‑ - -
Changes due to share-based payments 8 ‑ ‑ ‑ 8 34
Changes due to transactions with shareholders (205) ‑ ‑ ‑ (205) 359
Changes in other comprehensive income (2) (35) (33) (68) (70) (692)
Of which other comprehensive income on equity instruments
that will not be reclassified to profit or loss reclassified to
consolidated reserves
(2) ‑ 2 2 ‑ -
Of which other comprehensive income attributable to changes
in own credit risk reclassified to consolidated reserves ‑ ‑ ‑ ‑ ‑ -
Share of changes in equity-accounted entities ‑ (35) ‑ (35) (35) (206)
Net income for 2020 546 ‑ ‑ ‑ 546 3,238
Other changes 2 119 ‑ ‑ ‑ 119 (47)
EQUITY AT 31 DECEMBER 2020 8,451 (117) (56) (173) 8,278 73,495
(2) The other changes principally concern the inclusion of Amundi BOC Wealth Management Company Limited (with a 55% stake in Amundi) with an impact of +€57 million in equity.

Consolidated financial statements of Credit Agricole S.A. 31 December 2020
19
CASH FLOW STATEMENT
The cash flow statement is presented using the indirect method.
Operating activities are representative of income-generating activities of Crédit Agricole S.A.
Tax inflows and outflows are included in full within operating activities.
Investment activities show the impact of cash inflows and outflows associated with purchases and sales of investments
in consolidated and non-consolidated companies, property, plant and equipment and intangible assets. This section
includes strategic equity investments classified as at “Fair value through profit or loss” or “Fair value through other
comprehensive income on items that cannot be reclassified".
Financing activities show the impact of cash inflows and outflows associated with operations of financial structure
concerning equity and long-term borrowing.
The net cash flows attributable to the operating, investment and financing activities of discontinued operations are
presented on separate lines in the cash flow statement.
Net cash and cash equivalents include cash, debit and credit balances with central banks and debit and credit
demand balances with credit institutions.

Consolidated financial statements of Credit Agricole S.A. 31 December 2020
20
(in millions of euros) Notes 31/12/2020 31/12/2019
Pre-tax income 4,588 5,952
Net depreciation and impairment of property, plant & equipment and intangible
assets 1,143 1,048
Impairment of goodwill and other fixed assets 6.16 903 589
Net addition to provisions 9,488 22,608
Share of net income (loss) of equity-accounted entities (502) (608)
Net income (loss) from investment activities (74) (54)
Net income (loss) from financing activities 3,024 2,955
Other movements 1,726 5,021
Total Non-cash and other adjustment items included in pre-tax income 15,708 31,559
Change in interbank items 55,411 (24,679)
Change in customer items 54,781 9,461
Change in financial assets and liabilities (73,179) (21,872)
Change in non-financial assets and liabilities 1,547 7,137
Dividends received from equity-accounted entities ¹ 189 310
Taxes paid (1,853) (1,063)
Net change in assets and liabilities used in operating activities 36,896 (30,706)
Cash provided (used) by discontinued operations 97 32
Total Net cash flows from (used by) operating activities (A) 57,289 6,837
Change in equity investments ² (2,478) 7,229
Change in property, plant & equipment and intangible assets (748) (947)
Cash provided (used) by discontinued operations (2) ‑
Total Net cash flows from (used by) investing activities (B) (3,228) 6,282
Cash received from (paid to) shareholders ³ 351 (2,666)
Net cash flows from (used in) financing activities ⁴ 7,458 4,880
Cash provided (used) by discontinued operations (125) (9)
Total Net cash flows from (used by) financing activities (C) 7,684 2,206
Impact of exchange rate changes on cash and cash equivalent (D) (1,308) 1,266
NET INCREASE/(DECREASE) IN CASH AND CASH EQUIVALENT (A + B + C + D) 60,437 16,591
Cash and cash equivalents at beginning of period 90,776 74,185
Net cash accounts and accounts with central banks * 91,236 66,017
Net demand loans and deposits with credit institutions ** (460) 8,168
Cash and cash equivalents at end of period 151,213 90,776
Net cash accounts and accounts with central banks * 193,455 91,236
Net demand loans and deposits with credit institutions ** (42,242) (460)
NET CHANGE IN CASH AND CASH EQUIVALENTS 60,437 16,591
* Consisting of the net balance of the "Cash, central banks" item, excluding accrued interest and including cash of entities
reclassified as discontinued operations.
** Consisting of the balance of the "Non doubtful current accounts in debit” and "Non doubtful overnight accounts and advances"
items as detailed in Note 6.3 and the "Current accounts in credit" and "Overnight accounts and deposits" items as detailed in Note
6.5 (excluding accrued interest and including Crédit Agricole internal transactions).

Consolidated financial statements of Credit Agricole S.A. 31 December 2020
21
1 Dividends received from equity-accounted entities:
At 31 December 2020, this amount includes the payment of dividends from insurance entities for €139 million, from Credit Agricole
Consumer Finance subsidiaries for €25 million, from Amundi subsidiaries for €13 million and from Crédit Agricole S.A. for €12 million.
2 Change in equity investments:
This line shows the net effects on cash of acquisitions and disposals of equity investments.
- The net impact on Group cash of acquisitions and disposals of consolidated equity investments (subsidiaries and equity-accounted
entities) on 31 December 2020 is -€738 million. The main transactions concern the acquisition of Sabadell Asset Management for -€424
million , the subscription to the capital increase of BforBank by Crédit Agricole S.A. for -€106 million, the takeover of 70% of Hama Polska
by CALEF for -€31 million, the subscription to capital increases of equity-accounted companies including Korian for -€115 million, the
creation of Amundi BOC Wealth Management Company Limited for -€72 million and the takeover of 100% of Ménafinance for -€29.3
million in net cash acquired.
- During the same period, the net impact on the Group cash position of acquisitions and disposals of non-consolidated equity
investments came to -€1,740 million, essentially from insurance investments.
3 Cash received from (paid to) shareholders:
This amount is predominantly comprised of -€538 million in dividends paid, excluding dividends paid in shares, by Crédit Agricole S.A.
Group. It breaks down as follows:
- Dividends paid by non-controlled subsidiaries for -€109 million, and
- Interest, equivalent to dividends on undated financial instruments treated as equity for -€474 million.
This amount also corresponds to the capital increase reserved for employees for + € 163 million and to issues and repayments of equity
instruments for + € 752 million.
4 Other cash provided (used) by financing activities:
At 31 December 2020, debt issues totalled +€20,098 million and redemptions -€11,818 million. Subordinated debt issues totalled
+€3,732 million and redemptions -€1,509 million.
This line also includes cash flows from interest payments on subordinated debt and bonds for -€3,150 million.

Consolidated financial statements of Credit Agricole S.A. 31 December 2020
22
NOTES TO THE CONSOLIDATED FINANCIAL STATEMENTS
NOTE 1 Group accounting policies and principles, assessments and
estimates applied.
1.1 Applicable standards and comparability
Pursuant to EC Regulation no. 1606/2002, the consolidated financial statements have been prepared in accordance
with IAS/IFRS standards and IFRIC interpretations applicable at 31 December 2020 and as adopted by the European
Union (carve-out version), thus using certain exceptions in the application of IAS 39 on macro-hedge accounting.
These standards and interpretations are available on the European Commission website at:
https://ec.europa.eu/info/business-economy-euro/company-reporting-and-auditing/company-reporting/financial-
reporting_en
The standards and interpretations are the same as those applied and described in the Group’s financial statements
for the financial year ended 31 December 2019.
They have been supplemented by the IFRS standards as adopted by the European Union at 31 December 2020 and
that must be applied for the first time in 2020.
These cover the following:
Standards, amendments or interpretations Applicable
in the Group
Date of first-time application:
financial years from
Amendment to references to the conceptual framework in the IFRS
standards
Yes 1st January 2020
IAS 1/IAS 8 Presentation of Financial statements
Definition of material
Yes 1st January 2020
Amendment to IFRS 9, IAS 39 and IFRS 7 Financial Instruments
Interest rate benchmark reform – Phase 1
Yes 1st January 20201
Amendment to IFRS3 Business combinations
Definition of a business
Yes 1st January 2020
Amendment to IFRS 16 Leases²
Rent concessions related to Covid-19
Yes 1st June 2020
1 The Group decided to early apply the amendment to IFRS 9, IAS 39 and IFRS 7 Financial instruments on the Interest rate benchmark
reform from 1 January 2019.
²Non-significant impact at 31 December 2020 of the application of the amendment to IFRS16 in 2020.
Moreover, as long as the early application of standards and interpretations adopted by the European Union is optional
for a period, this option is not selected by the Group, unless otherwise stated.
This is the case in particular for:

Consolidated financial statements of Credit Agricole S.A. 31 December 2020
23
Standards, amendments or interpretations Applicable
in the Group
Date of first-time application: financial
years from
Amendment to IFRS9, IAS39, IFRS7, IFRS4 and IFRS16
Interest rate benchmark reform – Phase 22
Yes 1st January 20211
Amendment to IFRS 4
Optional deferral of the application of IFRS 9 for entities engaged
primarily in insurance activities, including entities in the insurance
industry owned by a financial conglomerate as at 1 January 2023
No
1 January 2021
1 The Group decided to early apply the amendment to IFRS 9, IAS 39, IFRS 7, IFRS 4 and IFRS 16 on the Interest rate benchmark reform – Phase 2 from
1 January 2020.
2 Non-significant impact at 31 December 2020 of the application of the Interest rate benchmark reform – Phase 2.
BENCHMARK INDICES REFORMS
Reforms of benchmark indices, often referred to as “IBOR reforms”, have entered a new phase with the very gradual
development of the use of risk-free rate indices (RFR: Risk Free Rates) in new contracts. The situation remains
heterogeneous across currencies and asset classes. At this stage, a more significant increase in transaction volumes
has been observed in the derivatives markets, particularly with the use of SONIA. Conversely, liquidity on the €STR
markets is less developed.
For a majority of existing contracts that benchmark the interest rate indices that must be replaced, it is now considered
that the replacement rate will be a combination of forward rates (pre-determined or post-determined) calculated
from RFR and an adjustment spread, with the latter aimed at ensuring economic equivalence with the replaced index.
Despite this strong orientation, at this stage the adoption of RFR and the limited number of contracts renegotiated to
update fallback clauses or to proactively replace the benchmark, reflect heterogeneous levels of maturity in the
detailed definition of the transition mechanisms - including agreements - according to currencies and asset classes.
Developments of information systems, which are contingent on precise definitions of target replacement rates in order
to be finalised, are still in progress.
The private sector remains at the forefront of these transitions. However, recent announcements suggest a possible
intervention by the authorities to support transitions for contract scopes that could not timely be renegotiated, be it to
replace the benchmark rate in anticipation of the disappearance of indexes, or to insert robust fallback clauses that
allow for a transition to the disappearance of indexes. Nevertheless, in the absence of an ex-ante definition of the
scope of contracts that could benefit from such support, the preparation of transition plans continues. In addition,
proactive early transitions are still strongly encouraged by some authorities, such as the British authority (FCA: Financial
Conduct Authority).
Specifically for the scope of derivative contracts, and by extension to Repo contracts and securities lending/borrowing
contracts, the ISDA has finalised the implementation of a protocol that will enable the new fallback clauses to be
automatically incorporated into the contract. This protocol is likely to simplify the transition of derivative contracts
between the parties that have agreed to it. CACIB and the entities that are most active in derivatives have joined. For
other non-derivative instruments, such mechanism does not exist and numerous bilateral renegotiations will be
necessary.
Crédit Agricole continues to steer benchmark index transitions through the Benchmarks project, by incorporating the
recommendations of national working groups and the milestones set by the authorities, primarily the FCA. Thus, the
project aims to follow the standards defined by the market. The timetable for the transition project revolves around the
phases of adoption and alternative rate offers and the dates on which the use of indices whose discontinuation is
announced. The transition plans finalised for each Crédit Agricole group entity, incorporating the most recent
conclusions of the working groups and market associations and, where applicable, details of possible government
intervention, will be in operation in 2021.

Consolidated financial statements of Credit Agricole S.A. 31 December 2020
24
With regard to the transition from EONIA to €STR (transition no later than 3 January 2022), work has been initiated. The
clearing houses have switched the compensation of EONIA collateral to the €STR. The flows that benchmark the €STR
are increasing only very gradually. Moreover, EURIBOR - like any benchmark - is likely to see its methodology changed
or replaced in the long term. Nonetheless, the short-term replacement scenario of EURIBOR, following a timetable that
would be similar to that of LIBOR transitions, is not anticipated at this stage.
As things stand, the list of the main benchmark indices at the Crédit Agricole group level, and/or defined as critical by
ESMA, that are affected by a certain or potential transition remains unchanged:
EONIA, which will disappear on 3 January 2022;
LIBOR (USD, GBP, CHF, JPY and EUR), which could cease to exist at the end of 2021 but has not yet been
officially announced;
EURIBOR, WIBOR, STIBOR, which may disappear, but not as anticipated in the short term.
EURIBOR, LIBOR (notably USD) and EONIA represent - in descending order - the Group's largest exposure to the
benchmark indices.
In addition to preparing for the anticipated transitions and, at the very least, compliance with BMR, the project's work
also aims at identifying and managing the risks inherent in the transitions to the benchmark indices, particularly on the
financial, operational and customer protection aspects.
In order to ensure that the accounting hedging relationships affected by this benchmark interest rate reform can
continue despite the uncertainties over the timetable and terms of transition between the current indices and the new
indices, the IASB published amendments to IAS 39, IFRS 9 and IFRS 7 in September 2019, which were adopted by the
European Union on 15 January 2020. The Group will apply these amendments as long as uncertainties about the
benchmarks will concern the timings and amounts of interest rate benchmark-based cash flows and considers, in this
respect, that all its hedging contracts, mainly those relating to EONIA, EURIBOR and LIBOR rates (USD, GBP, CHF, JPY),
are eligible for hedge accounting at 31 December 2020.
As at 31 December 2020, the inventory of hedging derivatives impacted by the reform and on which uncertainties
remain shows a nominal amount of €587 billion.
Other amendments, published by the IASB in August 2020, supplement those published in 2019 and focus on the
accounting consequences of replacing the former reference interest rates with other reference rates following the
reforms.
These amendments, known as “Phase 2”, mainly are changes in contractual cash flows. They allow entities not to de-
recognise or adjust the carrying amount of financial instruments to reflect the changes required by the reform, but
rather to update the effective interest rate to reflect the change in the alternative reference rate.
With regard to hedge accounting, entities will not have to de-designate their hedging relationships when making the
changes required by the reform.
The Group decided to early apply these amendments, from 1 January 2020.

Consolidated financial statements of Credit Agricole S.A. 31 December 2020
25
At 31/12/2020, the breakdown by significant benchmark index of instruments, based on the old benchmark rates and
which must move to the new rates before maturity, is as follows:
In millions of euros
EONIA EURIBOR LIBOR USD LIBOR GBP LIBOR JPY LIBOR CHF LIBOR EUR WIBOR STIBOR
Total non-
derivative
financial assets 1,542 266,410 71,401 6,461 13,956 5,727 2 2,734 156
Total non-
derivative
financial liabilities 6,136 69,754 37,762 2,404 1,348 123 5 1,537 68
Total notional
amount of
derivatives
484,902 3,771,688 2,856,710 363,111 956,350 98,152 ‑ 9,313 29,402
With regard to EONIA index exposures, the outstandings carried forward are those with a maturity date after 3 January
2022, the transition date.
For non-derivative financial instruments, the exposures correspond to the nominal value of the securities and the
outstanding capital of depreciable instruments.
DURATION OF LEASES IFRS 16 — IFRS IC DECISION OF 26 NOVEMBER 2019
During the first half of 2019, IFRS IC received a request about the determination of the enforceable term for the
recognition of lease agreements under IFRS 16, in particular for two types of lease agreements:
Leases without a contractual term, cancellable by either party subject to notice to terminate;
Leases that are renewable automatically (unless terminated by one of the parties), with no contractual
penalty due in the event of termination.
At its meeting on 26 November 2019, IFRS IC recalled that, in application of IFRS 16 and in general, a lease is no longer
enforceable when the lessee and lessor each have the right to terminate the lease without permission from the other
party with no more than an insignificant penalty, and clarified that in determining the enforceable term of a lease, the
broader economics of the contract must be taken into account, and that the notion of penalty is understood to go
beyond contractual termination payments and includes any economic incentive not to terminate the contract.
This decision constitutes a change in the Group's approach to determining lease terms, and goes beyond the specific
cases for which IFRS IC has received requests, as recalled by the AMF in its recommendations at 31 December 2019. In
fact, the determination of the lease term to be used for the valuation of the right of use and the lease liability is made
in accordance with IFRS 16 within this enforceable period.
As soon as this final decision of IFRS IC was published, the Crédit Agricole group set up a project involving the
accounting, finance, risk and IT departments in order to bring the matter into compliance for the 31 December 2020
year end.
The Group has chosen a term corresponding to the first exit option after 5 years as the reasonably certain term of a
lease. This term, at the inception of French commercial leases, will be applied in the majority of cases. The main
exception will be the case of a lease in which the Group has waived its three-year interim exit options (e.g. in return for
a reduction in rental income); in this case, the term of the lease will remain 9 years.
STANDARDS AND INTERPRETATIONS NOT YET ADOPTED BY THE EUROPEAN UNION AS AT 31 DECEMBER 2020
The standards and interpretations published by the IASB at 31 December 2020 but not yet adopted by the European
Union are not applied by the Group. They will become mandatory only as from the date planned by the European
Union and have not been applied by the Group at 31 December 2020.
This concerns IFRS 17 in particular:

Consolidated financial statements of Credit Agricole S.A. 31 December 2020
26
IFRS 17 “Insurance Contracts” issued in May 2017 will replace IFRS 4. It will apply to financial years beginning 1 January
2023 subject to adoption by the European Union.
IFRS 17 sets out the new measurement and recognition principles for insurance contract liabilities and evaluation of
their profitability, in addition to their presentation. Between 2017 and 2019, a framework on the implementation project
in order to identify the challenges and impacts of the standard on the Group’s insurance subsidiaries began. Analysis
and preparation work for implementation continued in 2020.
1.2 Accounting policies and principles
USE OF ASSESSMENTS AND ESTIMATES TO PREPARE THE FINANCIAL STATEMENTS
Estimates made to draw up the financial statements are by nature based on certain assumptions and involve risks and
uncertainties as to whether they will be achieved in the future.
Future results may be influenced by many factors, including:
activity in domestic and international financial markets;
fluctuations in interest and foreign exchange rates;
the economic and political climate in certain industries or countries;
changes in regulations or legislation.
This list is not exhaustive.
Accounting estimates based on assumptions are principally used in the following assessments:
financial instruments measured at fair value;
investments in non-consolidated companies;
pension schemes and other post-employment benefits;
stock option plans;
impairment of debt instruments at amortised cost or at fair value through other comprehensive income that
can be reclassified to profit or loss;
provisions;
impairment of goodwill;
deferred tax assets;
valuation of equity-accounted entities;
policyholders’ deferred profit sharing.
The procedures for the use of assessments or estimates are described in the relevant sections below.
FINANCIAL INSTRUMENTS (IFRS 9, IAS 32 AND IAS 39)
Definitions
IAS 32 defines a financial instrument as any contract that gives rise to a financial asset of one entity and a financial
liability or equity instrument of another entity, meaning any contract representing contractual rights or obligations to
receive or pay cash or other financial assets.
Derivative instruments are financial assets or liabilities whose value changes according to that of an underlying asset,
which requires a low or nil initial investment, and for which settlement occurs at a future date.
Financial assets and liabilities are treated in the financial statements in accordance with IFRS 9 as adopted by the
European Union, including for financial assets held by the Group’s insurance entities.
IFRS 9 sets the principles governing the classification and measurement of financial instruments, impairment of credit
risk and hedge accounting, excluding macro-hedging transactions.
It should nevertheless be noted that Crédit Agricole S.A. has opted not to apply the IFRS 9 general hedging model. All
hedging relationships consequently remain within the scope of IAS 39 pending future provisions relating to macro-
hedging.

Consolidated financial statements of Credit Agricole S.A. 31 December 2020
27
Conventions for valuing financial assets and liabilities
Initial measurement
During their initial recognition, financial assets and liabilities are measured at fair value as defined by IFRS 13.
Fair value as defined by IFRS 13 corresponds to the price that would be received to sell an asset or paid to transfer a
liability in an ordinary transaction between market participants, on the principal or the most advantageous market, at
the valuation date.
Subsequent measurement
After initial recognition, financial assets and liabilities are measured according to their classification either at amortised
cost using the effective interest rate method (EIR) for debt instruments or at fair value as defined by IFRS 13. Derivative
instruments are always measured at fair value.
Amortised cost corresponds to the amount at which the financial asset or liability is measured during its initial
recognition, including transaction costs directly attributable to its acquisition or issue, reduced by repayments of
principal, increased or reduced by the cumulative amortisation calculated by the effective interest rate method (EIR)
on any difference (discount or premium) between the initial amount and the amount at maturity. In the case of a
financial asset at amortised cost or at fair value through comprehensive income that can be reclassified to profit or
loss, the amount may be adjusted if necessary in order to correct for impairment (see the section on “Provisions for
credit risk”).
The effective interest rate (EIR) is the rate that exactly discounts estimated future cash payments or receipts through
the expected life of the financial instrument or, when appropriate, a shorter period, to obtain the net carrying amount
of the financial asset or financial liability.
Financial assets
Classification and measurement of financial assets
Non-derivative financial assets (debt or equity instruments) are classified on the balance sheet in accounting
categories that determine their accounting treatment and their subsequent valuation mode.
The criteria for the classification and valuation of financial assets depends on the nature of the financial assets,
according to whether they are qualified as:
debt instruments (e.g. loans and fixed or determinable income securities); or
equity instruments (e.g. shares)
These financial assets are classified in one of the following three categories:
financial assets at fair value through profit or loss;
financial assets at amortised cost (debt instruments only);
financial assets at fair value through equity (for debt instruments, that can be reclassified to profit or loss; for
equity instruments, that cannot be reclassified to profit or loss).
Debt instruments
The classification and valuation of a debt instrument depend on the combination of two criteria: the business model
defined at portfolio level and the analysis of the contractual terms determined by debt instrument, unless the fair value
option is used.
- The three business models
The business model represents the strategy followed by the management of Crédit Agricole S.A. for managing its
financial assets in order to achieve its objectives. The business model is specified for a portfolio of assets and does not
constitute a case-by-case intention for an isolated financial asset.
We distinguish three business models:
The hold to collect model where the aim is to collect contractual cash flows over the lifetime of the assets;
this model does not always imply holding all of the assets until their contractual maturity; however, sales of
assets are strictly governed;

Consolidated financial statements of Credit Agricole S.A. 31 December 2020
28
The hold to collect and sell model where the aim is to collect the contractual cash flows over the lifetime of
the assets and to sell the assets; under this model, both the sale of the financial assets and receipt of cash
flows are essential; and
The other/sell model, where the main aim is to sell the assets.
In particular, it concerns portfolios where the aim is to collect cash flows via sales, portfolios whose performance is
assessed based on fair value and portfolios of financial assets held for trading.
When the management strategy for managing financial assets does not correspond to either the collect model or the
collect and sell model, these financial assets are classified in a portfolio whose management model is other/sell.
- The contractual terms (“Solely Payments of Principal & Interest” or "SPPI" test):
“SPPI” testing combines a set of criteria, examined cumulatively, to establish whether contractual cash flows meet the
characteristics of simple financing (principal repayments and interest payments on the remaining amount of principal
due).
The test is satisfied when the financing gives entitlement only to the repayment of the principal and when the payment
of interest received reflects the time value of money, the credit risk associated with the instrument, the other costs and
risks of a conventional loan contract and a reasonable margin, whether the interest rate is fixed or variable.
In simple financing, interest represents the cost of the passage of time, the price of credit and liquidity risk over the
period, and other components related to the cost of carrying the asset (e.g. administrative costs etc.).
In some cases, when qualitative analysis of this nature does not allow a conclusion to be made, quantitative analysis
(or benchmark testing) is carried out. This additional analysis consists of comparing the contractual cash flows of the
asset under review with the cash flows of a benchmark asset.
If the difference between the cash flows of the financial asset and the benchmark asset is considered immaterial, the
asset is deemed to be simple financing.
Moreover, specific analysis is conducted when the financial asset is issued by special purpose entities establishing a
differentiated order of payment among the holders of the financial assets by contractually linking multiple instruments
and creating concentrations of credit risk (“tranches”).
Each tranche is assigned a rank of subordination that specifies the order of distribution of cash flows generated by the
structured entity.
In this case, the “SPPI” test requires an analysis of the characteristics of contractual cash flows of the asset concerned
and underlying assets according to the “look-through” approach and the credit risk borne by the tranches subscribed
compared to the credit risk of the underlying assets.
The mode of recognition of debt instruments resulting from qualification of the business model combined with the
“SPPI” test may be presented in the following diagram:

Consolidated financial statements of Credit Agricole S.A. 31 December 2020
29
Debt instruments
Business models
Hold to collect
Hold to collect and sell
Other/Sell
SPPI Test
Pass Amortised cost
Fair value through comprehensive
income that may be reclassified to profit
or loss
Fair value through profit or loss
(SPPI Test N/A)
Fail Fair value through
profit or loss
Fair value through profit or loss
Debt instruments at amortised cost
Debt instruments are measured at amortised cost if they are eligible for the hold to collect model and if they pass the
“SPPI” test.
They are recorded at the settlement date and their initial valuation also includes accrued interest and transaction
costs.
Amortisation of any premiums or discounts and loans and receivables transaction costs on fixed-income securities is
recognised in the income statement using the effective interest rate method.
This category of financial assets is impaired under the conditions described in the specific paragraph “Provisioning for
credit risks”.
Debt instruments at fair value through other comprehensive income (items that can be reclassified)
Debt instruments are measured at fair value through other comprehensive income on items that can be reclassified if
they are eligible for the collect and sell model and if they pass the SPPI test.
They are recorded at the trade date and their initial valuation also includes accrued interest and transaction costs.
Amortisation of any premiums or discounts and transaction costs on fixed-income securities is recognised in the income
statement using the effective interest rate method.
These financial assets are subsequently measured at fair value, with changes in fair value recorded in other
comprehensive income on items that can be reclassified and offset against the outstandings account (excluding
accrued interest recognised in profit or loss according to the effective interest rate method).
If the securities are sold, these changes are transferred to the income statement.
This category of financial instruments is impaired by ECL under the conditions described in the specific paragraph
“Provisions for credit risks” (without this affecting the fair value on the balance sheet).

Consolidated financial statements of Credit Agricole S.A. 31 December 2020
30
Debt instruments at fair value through profit or loss
Debt instruments are measured at fair value through profit or loss in the following cases:
The instruments are classified in portfolios composed of financial assets held for trading or for which the main
objective is disposal.
Financial assets held for trading are assets acquired or generated by the enterprise primarily with the aim of disposal
in the short term or which are included in a portfolio of financial instruments managed as a unit and with the purpose
of making a profit from short term price fluctuations or an arbitrage margin. Although contractual cash flows are
received during the period that Crédit Agricole S.A. holds the assets, receiving these contractual cash flows is not
essential but ancillary.
Debt instruments that do not fulfil the criteria of the “SPPI” test. This is notably the case of the UCITS;
Financial instruments classified in portfolios which Crédit Agricole S.A. designates at fair value in order to
reduce an accounting treatment difference on the income statement. In this case, the instrument is classified
as designated at fair value through profit or loss.
Financial assets measured at fair value through profit or loss are initially recognised at fair value, excluding transaction
costs (directly recorded to profit or loss) and including accrued interest.
They are subsequently measured at fair value and changes in fair value are recognised in profit or loss, under
“Revenues”, offset against the outstandings account. Interest on these instruments are recorded under “Net gains
(losses) on financial instruments at fair value through profit and loss”.
This category of financial assets is not impaired.
Debt instruments measured by definition at fair value through profit or loss whose business model is “Other/sell” are
recorded at the trade date.
Debt instruments designated at fair value through profit or loss are recorded on the trade date.
Debt instruments measured by definition at fair value through profit or loss, failing the SPPI test, are recorded at the
settlement date.
Equity instruments
Equity instruments are by default recognised at fair value through profit or loss, except in the case of the irrevocable
option for classification at fair value through other comprehensive income on items that cannot be reclassified,
providing that these instruments are not held for trading purposes.
Equity instruments at fair value through profit or loss
Financial assets measured at fair value through profit or loss are initially recognised at fair value, excluding transaction
costs (directly recorded to profit or loss). Equity instruments held for trading purposes are recorded at the trade date.
Equity instruments measured at fair value through profit or loss and not held for trading are recorded at the settlement
date.
They are subsequently measured at fair value and changes in fair value are recognised in profit or loss, under Revenues,
offset against the outstandings account.
This category of financial assets is not impaired.
Equity instruments at fair value through other comprehensive income on items that cannot be reclassified
(irrevocable option)
The irrevocable option to recognise equity instruments at fair value through other comprehensive income on items that
cannot be reclassified is adopted at the transactional level (line by line) and applies from the date of initial recognition.
These securities are recorded at the trade date.
The initial fair value includes transaction costs.
During subsequent valuations, changes in fair value are recognised in other comprehensive income on items that
cannot be reclassified. In case of disposal, these changes are not reclassified to profit or loss. The gain or loss on disposal
is recognised in other comprehensive income.
Only dividends are recognised in profit or loss, if:
the right of the entity to receive payment is established;

Consolidated financial statements of Credit Agricole S.A. 31 December 2020
31
it is probable that the economic benefits associated with the dividends will flow to the entity;
the amount of dividends can be reliably estimated.
Reclassification of financial assets
In the case of a significant change in the business model used for managing financial assets (new activity, acquisition
of entities, disposal or discontinuation of a significant activity), a reclassification of these financial assets is necessary.
The reclassification applies to all financial assets in the portfolio from the date of reclassification.
In other cases, the business model remains unchanged for existing financial assets. If a new business model is identified,
it applies prospectively to new financial assets grouped in a new management portfolio.
Temporary investments in/disposals of securities
Temporary disposals of securities (loans of securities, securities delivered under repurchase agreements) do not
generally fulfil the conditions for derecognition.
Securities lent or sold under repurchase agreements remain on the balance sheet. In the case of securities under
repurchase agreements, the amounts received, representing the liability to the transferee, are recognised on the
liabilities side of the balance sheet by the transferor.
Securities borrowed or received under repurchase agreements are not recognised on the balance sheet of the
transferee.
In the case of securities under repurchase agreements, a debt to the transferor is recorded on the balance sheet of
the transferee and offset against the amount paid. If the security is subsequently resold, the transferee records a liability
equivalent to the fair value of fulfilling their obligation to return the security received under the agreement.
Revenue and expenses relating to such transactions are posted to profit and loss on a prorated basis, except in the
case of classification of assets and liabilities at fair value through profit or loss.
Derecognition of financial assets
A financial asset (or group of financial assets) is fully or partially derecognised if:
the contractual rights to the cash flows from the financial asset expire;
or are transferred or are deemed to have expired or been transferred because they belong de facto to one
or more beneficiaries; and substantially all the risks and rewards of the financial asset are transferred.
In this case, any rights or obligations created or retained at the time of transfer are recognised separately as assets
and liabilities.
If the contractual rights to the cash flows are transferred but some of the risks and rewards of ownership as well as
control are retained, the financial assets continue to be recognised to the extent of the Group’s continuing
involvement in the asset.
Financial assets renegotiated for commercial reasons without financial difficulties of the counterpart with the aim of
developing or keeping a commercial relation are derecognised at the date of the renegotiation. The new loans
granted to customers are recorded at this date at their fair value on the date of renegotiation. Subsequent recognition
depends on the business model and the SPPI test.
Interests paid by the government (IAS 20)
Under French government measures to support the agricultural and rural sector and to help home buyers, certain
Crédit Agricole group entities grant subsidised loans at rates fixed by the government. Consequently, the government
pays these entities the difference between the subsidised lending rate and a predetermined benchmark rate. Thus,
the loans that benefit from these subsidies are granted at market rates.

Consolidated financial statements of Credit Agricole S.A. 31 December 2020
32
The subsidy system is periodically reviewed by the government.
In accordance with IAS 20, subsidies received from the government are recorded in profit or loss under Interest and
similar income and spread over the life of the corresponding loans.
Overlay approach applicable to insurance activities
Crédit Agricole S.A. uses the overlay approach for financial assets held for the purposes of an activity related to
insurance contracts, which are designated in accordance with the option offered by the amendments to IFRS 4
“Applying IFRS 9 ‘Financial Instruments’ with IFRS 4 ‘Insurance Contracts’”, published by the IASB in September 2016.
This approach aims to remedy the temporary accounting consequences of the discrepancy between the effective
date of IFRS 9 and that of the new standard on insurance contracts replacing IFRS 4 (IFRS 17). This has the effect of
eliminating from the income statement part of the additional accounting mismatch and the temporary volatility which
could be caused by application of IFRS 9 before IFRS 17 came into force.
Eligible financial assets are designated instrument by instrument, and this may be done:
at 1 January 2018, during the initial application of IFRS 9; or
subsequently, but only at the time of the initial recognition of the assets in question.
In application of the overlay approach, Crédit Agricole S.A. reclassifies, for designated financial assets only, their
impact in the income statement under other comprehensive income such that the amount presented in the income
statement corresponds to that which would have been presented in the income statement if IAS 39 had been applied.
Consequently, the amount reclassified is equal to the difference between:
the amount presented in net income under IFRS 9 for designated financial assets; and
the amount that would have been presented in net income for designated financial assets if the insurer had
applied IAS 39.
In the income statement, the effects of this reclassification are recognised under “revenues”, before tax effects, on
the line “Reclassification of net gains or losses on financial assets related to the overlay approach”. The tax effects
related to this reclassification are presented on the line “Income tax charge”.
In the statement of other comprehensive income, the effects of this reclassification are recognised as net gains and
losses recognised directly in other comprehensive income on items that may be reclassified to profit or loss on the line
“Reclassification of net gains or losses on financial assets related to the overlay approach”.
The financial assets that may be designated must fulfil the following characteristics:
They are held by insurers within the Group for purposes of insurance activities;
They are measured at fair value through profit or loss under IFRS 9 but would not have been measured in this
way under IAS 39; they are financial assets which, under IAS 39 would have been recognised at amortised
cost (assets held to maturity, loans and receivables) or at fair value through other comprehensive income
(available-for-sale financial assets).
Evaluation of the impact of the designated financial assets on the income statement
Pursuant to the overlay approach, Crédit Agricole S.A. continues to apply the accounting policies and principles that
the Group applied under IAS 39 for the recognition of profit or loss from designated financial assets:
Financial assets at amortised cost under IAS 39
Financial assets at amortised cost are initially recognised at their initial fair value, including directly-attributable
transaction costs and accrued interest.
They are subsequently measured at amortised cost with amortisation of any premium or discount and transaction costs
using the corrected effective interest rate method.
Available-for-sale financial assets under IAS 39
“Available-for-sale financial assets” are initially recognised at initial fair value, including transaction costs that are
directly attributable to the acquisition, and accrued interest.
“Available-for-sale financial assets” are later measured at fair value and subsequent changes in fair value are
recorded in other comprehensive income.
If the securities are sold, these changes are transferred to the income statement.

Consolidated financial statements of Credit Agricole S.A. 31 December 2020
33
Amortisation of any premiums or discounts and transaction costs on fixed-income securities is recognised in the income
statement using the effective interest rate method.
Impairment of designated financial assets under IAS 39
Impairment must be recognised when there is objective evidence of impairment resulting from one or more events
occurring after the initial recognition of the financial asset.
Objective evidence of loss corresponds to a prolonged or significant decline in the value of the security for equity
securities or the appearance of significant deterioration in credit risk evidenced by a risk of non-recovery for debt
securities.
For equity securities, Crédit Agricole S.A. uses quantitative criteria as indicators of potential impairment. These
quantitative criteria are mainly based on a loss of 30% or more of the value of the equity instrument over a period of
six consecutive months. Crédit Agricole S.A. may also take account of other factors such as financial difficulties of the
issuer, or short term prospects etc.
Notwithstanding the above-mentioned criteria, Crédit Agricole S.A. recognises an impairment loss when there is a
decline in the value of the equity instrument higher than 50% or prolonged over three years.
Financial liabilities
Classification and measurement of financial liabilities
Financial liabilities are classified on the balance sheet in the following two accounting categories:
financial liabilities at fair value through profit or loss, either due to their nature or optionally;
financial liabilities at amortised cost.
Financial liabilities at fair value through profit or loss due to their nature
Financial instruments issued primarily to be bought back in the short term, instruments forming part of an identified
portfolio of financial instruments which are managed together and which have indications of a recent profile of short-
term profit-taking, and derivatives (with the exception of certain hedging derivatives) are measured at fair value due
to their nature.
Changes in the fair value of this portfolio are recognised through profit or loss.
Financial liabilities designated at fair value through profit or loss
Financial liabilities fulfilling one of the three conditions defined by the standard below may be designated for
measurement at fair value through profit or loss: for hybrid issues comprising one or more separable embedded
derivatives, in order to reduce or eliminate the distortion of accounting treatment or groups of managed financial
liabilities for which performance is measured at fair value.
This option is irrevocable and applies mandatorily from the date of initial recognition of the instrument.
During subsequent measurement, these financial liabilities are measured at fair value through profit or loss for changes
in fair value not related to own credit risk and through other comprehensive income on items that cannot be
reclassified for changes in value related to own credit risk, unless this aggravates an accounting mismatch (in which
case any changes in value related to the company's own credit risk are recorded in the income statement, as required
by the standard).
Financial liabilities measured at amortised cost
All other liabilities fulfilling the definition of a financial liability (excluding derivatives) are measured at amortised cost.
These liabilities are initially measured at fair value (including transaction income and costs) and subsequently at
amortised cost using the effective interest rate method.
Deposits and savings accounts
Deposits and savings accounts are recorded under the category “Financial liabilities at amortised cost – Due to
customers” in spite of the characteristics of the collection system within the Crédit Agricole group, with deposits

Consolidated financial statements of Credit Agricole S.A. 31 December 2020
34
originating from the Regional Banks centralised at Crédit Agricole S.A. For the Group, the ultimate counterparty for
these deposits is the end customer.
The deposits and savings are initially measured at fair value and subsequently at amortised cost.
Regulated savings products are by nature deemed to be at market rates.
Provisions are accounted where necessary against home purchase savings schemes and accounts as set out in
Note 6.18 “Provisions”.
Reclassification of financial liabilities
The initial classification of financial liabilities is irrevocable. No subsequent reclassification is authorised.
Distinction between debt instruments and equity
Securities are classed as debt instruments or equity instruments based on the economic substance of the contractual
terms.
A financial liability is a debt instrument if it includes a contractual obligation:
to provide another entity with cash, another financial asset or a variable number of equity instruments; or
to exchange financial assets and liabilities with another entity at potentially unfavourable conditions.
An equity instrument is a non-redeemable financial instrument which offers discretionary return representing a residual
interest in a company after deduction of all its financial liabilities (net assets) and which is not qualified as a debt
instrument.
Treasury share buyback
Treasury shares or equivalent derivative instruments such as options on treasury shares bought by Crédit Agricole S.A.
with a fixed strike ratio, including shares held to cover stock option plans, do not meet the definition of a financial asset
and are deducted from equity. They do not generate any impact on the income statement.
Derecognition and modification of financial liabilities
A financial liability is derecognised in full or in part:
when it is extinguished; or
when quantitative or qualitative analyses suggest it has undergone a substantial change following
restructuring.
A substantial modification of an existing financial liability must be recorded as an extinction of an initial financial liability
and the recognition of a new financial liability (novation). Any differential between the carrying amount of the extinct
liability and the new liability will be recognised immediately in the income statement.
If the financial liability is not derecognised, the original effective interest rate is maintained. A discount/premium is
recognised immediately in the income statement at the date of modification and is then spread, using the original
effective interest rate, over the remaining life of the instrument.
Negative interest on financial assets and financial liabilities
In accordance with the IFRS IC decision of January 2015, negative interest income (expense) on financial assets that
do not meet the definition of income under IFRS 15 is recognised as interest expense in the income statement and not
as a reduction of interest income. The same applies to negative interest expense (income) on financial liabilities.
Provisions for credit risks
Scope of application
In accordance with IFRS 9, Crédit Agricole S.A. recognises a correction for changes in value for expected credit losses
(ECL) on the following outstandings:

Consolidated financial statements of Credit Agricole S.A. 31 December 2020
35
financial assets of debt instruments recognised at amortised cost or fair value through other comprehensive
income (items that can be reclassified) (loans and receivables, debt securities);
financing commitments which are not measured at fair value through profit or loss;
guarantee commitments coming under IFRS 9 and which are not measured at fair value through profit or loss;
rental receivables coming under IFRS 16; and
trade receivables generated by transactions under IFRS 15.
Equity instruments (at fair value through profit or loss or through Other Comprehensive Income on items that cannot
be reclassified) are not concerned by impairment provisions.
Derivative instruments and other instruments at fair value through profit or loss are subject to the calculation of
counterparty risk which is not covered by the ECL model. This calculation is described in Chapter 5 “Risks and Pillar 3”.
Credit risk and provisioning stages
Credit risk is defined as risk of loss related to default by a counterparty leading to its inability to meet its commitments
to the Group.
The process of provisioning credit risk has three stages (Buckets):
1st stage (Bucket 1): upon initial recognition of the financial instrument (credit, debt security, guarantee etc.),
the entity recognises the 12-month expected credit losses;
2nd stage (Bucket 2): if the credit quality deteriorates significantly for a given transaction or portfolio, the
entity recognises the losses expected to maturity;
3rd stage (Bucket 3): when one or more default events have occurred on the transaction or on a
counterparty with an adverse effect on the estimated future cash flows, the entity recognises incurred credit
losses to maturity. Subsequently, if the conditions for classifying financial instruments in Bucket 3 are not met,
the financial instruments are reclassified in Bucket 2, then in Bucket 1 according to the subsequent
improvement in the quality of the credit risk.
Definition of default
The definition of default for the requirements of ECL provisioning is identical to that used in management and for the
calculation of regulatory ratios. A debtor is, therefore, considered to be in default when at least one of the following
conditions has been met:
a significant arrear in payment, generally more than ninety days past due, unless specific circumstances point
to the fact that the delay is due to reasons independent of the debtor’s financial situation;
the entity believes that the debtor is unlikely to settle its credit obligations unless it avails itself of certain
measures such as enforcement of collateral security right.
A loan in default (Bucket 3) is said to be impaired when one or more events occur which have a negative effect on
the estimated future cash flows from this financial asset. Indications of impairment of a financial asset cover observable
data on the following events:
significant financial difficulties of the issuer or borrower;
a breach of contract, such as default or overdue payment;
the granting, by the lender(s) to the borrower, for economic or contractual reasons related to financial
difficulties of the borrower, of one or more favours that the lender(s) would not have considered under other
circumstances;
the increasing probability of bankruptcy or financial restructuring of the borrower;
the disappearance of an active market for the financial asset due to financial difficulties;
the purchase or creation of a financial asset with a significant discount, which reflects the credit losses
suffered.
It is not necessarily possible to isolate a particular event. The impairment of the financial asset could result from the
combined effect of several events.
The defaulting counterparty returns to a sound situation only after a period of observation that makes it possible to
confirm that the debtor is no longer in default (assessment by the Risk Management Department).

Consolidated financial statements of Credit Agricole S.A. 31 December 2020
36
Definition of expected credit loss (“ECL”)
ECL is defined as the weighted expected probable value of the discounted credit loss (principal and interest). It
represents the present value of the difference between the contractual cash flows and the expected cash flows
(including principal and interest).
The ECL approach is designed to anticipate as early as possible the recognition of expected credit losses.
ECL governance and measurement
The governance of the system for measuring IFRS 9 parameters is based on the structure implemented as part of the
Basel framework. The Group’s Risk Management Department is responsible for defining the methodological framework
and supervising the loan loss provisioning system.
The Group primarily relies on the internal rating system and current Basel processes to generate the IFRS 9 parameters
required to calculate ECL. The assessment of the change in credit risk is based on an expected loss model and
extrapolation based on reasonable scenarios. All information that is available, relevant, reasonable and justifiable,
including of a forward-looking nature, must be retained.
The formula includes the probability of default, loss given default and exposure at default parameters.
These calculations are broadly based on the internal models used as part of the regulatory framework, but with
adjustments to determine an economic ECL. IFRS 9 recommends a Point in Time analysis while having regard to
historical loss data and forward looking macro-economic data, whereas the prudential regulation analyses the
perspectives Through The Cycle for probability of default and in a Downturn for Loss Given Default.
The accounting approach also requires the recalculation of certain Basel parameters, in particular to eliminate internal
recovery costs or floors that are imposed by the regulator in the regulatory calculation of Loss Given Default (“LGD”).
ECLs are calculated according to the type of product concerned: financial instruments or off-balance sheet
instruments.
The expected credit losses for the coming 12 months make up a percentage of the lifetime expected credit losses,
and represent the lifetime cash flow shortfalls in the event of a default during the 12 months following the reporting
period (or a shorter period if the expected lifetime of the financial instrument is less than 12 months), weighted by the
probability of default within twelve months.
Expected credit losses are discounted at the effective interest rate used for the initial recognition of the financial
instrument.
The terms of measurement of ECLs include collateral and other credit enhancements that are part of the contractual
terms and which the entity does not account for separately. The estimate of the expected cash flow shortfalls from a
guaranteed financial instrument reflects the amount and timing of the recovery of the guarantees. In accordance
with IFRS 9, the inclusion of guarantees and sureties does not affect the assessment of the significant deterioration in
credit risk: this is based on the evolution of the debtor’s credit risk without taking into account guarantees.
The models and parameters used are backtested at least annually.
Forward-looking macroeconomic data are taken into account in accordance with a methodological framework
applicable at two levels:
at Group level for the determination of a shared framework for the consideration of forward-looking data in
the estimation of PD and LGD parameters over the transaction amortisation period;
at the level of each entity in respect of its own portfolios.
Significant deterioration of credit risk
All Group entities must assess, for each financial instrument, the deterioration of credit risk from origination to each
reporting date. Based on this assessment of the change in credit risk, the entities must classify their exposure into
different risk categories (Buckets)
To assess significant deterioration, the Group uses a process based on two levels of analysis:
the first level is based on absolute and relative Group criteria and rules that apply to all Group entities;
the second level is linked to the expert assessment, based on local forward-looking information, of the risk
held by each entity in its portfolios that may lead to an adjustment in the Group Bucket 2 reclassification
criteria (switching a portfolio or sub-portfolio to ECL at maturity).
Each financial instrument is, without exception, assessed for significant deterioration. Contagion is not required for the
downgrading of financial instruments of the same counterparty from Bucket 1 to Bucket 2. The significant deterioration

Consolidated financial statements of Credit Agricole S.A. 31 December 2020
37
assessment must consider the change in credit risk of the principal debtor without taking account of any guarantee,
including for transactions with a shareholder guarantee.
Possible losses in respect of portfolios of small loans with similar characteristics may be estimated on a statistical basis
rather than individually assessed.
To measure the significant deterioration of credit risk since initial recognition, it is necessary to look back at the internal
rating and PD (probability of default) at origination.
Origination means the trading date, on which the entity became bound by the contractual terms of the financial
instrument. For financing and guarantee commitments, origination means the date on which the irrevocable
commitment was made.
In the absence of an internal rating model, the Crédit Agricole group uses the absolute threshold of non-payment for
over 30 days as the maximum threshold for significant deterioration and classification in Bucket 2.
For outstandings (with the exception of securities) for which internal rating systems are in place (in particular exposures
monitored by authorised methods), the Crédit Agricole group considers that all of the information incorporated into
the rating systems allows for a more detailed assessment than the non-payment for over 30 days criterion alone.
If deterioration since origination is no longer observed, impairment may be reduced to 12-month expected credit
losses (Bucket 1).
To make up for the fact that certain significant deterioration factors or indicators may not be identifiable at instrument
level, the standard allows for the assessment of significant deterioration at financial instrument portfolio level, or for
groups of portfolios or parts of portfolios.
Portfolios can be created for the collective assessment of deterioration for instruments that share common
characteristics, such as:
instrument type;
credit risk rating (including internal Basel II rating for entities with an internal ratings system);
collateral type;
date of initial recognition;
remaining term until maturity;
business sector;
geographical location of the borrower;
the value of collateral relative to the financial assets, if this has an impact on the probability of default (for
example, non-recourse loans in certain countries or loan-to-value ratios);
distribution channel, purpose of financing etc.
Differentiation of significant deterioration by market is therefore possible (home loans, consumer finance, loans to
farmers or small businesses, corporate finance etc.).
The grouping of financial instruments for the purposes of collective credit risk assessment may change over time, as
new information becomes available.
For securities, Crédit Agricole S.A. uses an approach that consists of applying an absolute level of credit risk, in
accordance with IFRS 9, below which exposures are classified in Bucket 1 and provisions are made based on 12-month
ECL.
As such, the following rules shall apply for monitoring the significant deterioration of securities:
“Investment Grade” securities, at the reporting date, are classified in Bucket 1 and provisions are made based
on 12-month ECL;
“Non-Investment Grade” securities (NIG), at the reporting date, must be subject to monitoring for significant
deterioration, since origination, and be classified in Bucket 2 (lifetime ECL) in the event of significant
deterioration in credit risk.
Relative deterioration must be assessed prior to the occurrence of a known default (Bucket 3).
Restructuring due to financial difficulty
Debt instruments restructured due to financial difficulties are those for which the entity has amended the original
financial terms (interest rate, term etc.) for economic or legal reasons linked to the financial difficulties of the borrower,
Consolidated financial statements of Credit Agricole S.A. 31 December 2020
38
under conditions that would not have been considered under other circumstances. As such, these can be any debt
instruments, regardless of the risk deterioration category of the debt instrument since the initial recognition.
In accordance with the EBA (European Banking Authority) definition as stated in the “Risk Factors” chapter, debt
restructuring for financial difficulties of the debtor refers to any modification to one or more credit agreements for that
same reason, as well as any refinancing granted due to financial difficulties experienced by the customer.
This definition of restructuring must be applied to each agreement and not at client level (no contagion).
The definition of loans restructured due to financial difficulty is therefore comprised of two cumulative criteria:
Contract modification or debt refinancing (concessions);
A customer who is in a financial difficulty (a debtor facing, or about to face, difficulties in honouring financial
commitments).
“Contract modification” refers to the following example situations:
There is a difference between the modified contract and the former terms of the contract, to the benefit of
the borrower;
The contract modifications result in more favourable conditions for the borrower, from which other customers
of the bank, with a similar risk profile and at the same time, do not benefit.
“Refinancing” refers to situations in which a new debt is granted to the client to enable it to repay in full or in part
another debt for which it cannot meet the contractual terms and conditions due to its financial position.
The restructuring of a loan (whether performing or non-performing) infers the presumed existence of a proven risk of
loss (Bucket 3). The need to recognise impairment on the restructured exposure must therefore be analysed
accordingly (a restructuring does not automatically result in the recognition of impairment for proven losses or
classification as default).
The “restructured loan” classification is temporary.
Once the restructuring as defined by the EBA has been carried out, the exposure continues to be classified as
“restructured” for at least 2 years, if the exposure was performing when restructured, and 3 years if the exposure was
in default when restructured. These periods are extended in the event of the occurrence of certain events (e.g. further
incidents).
In the absence of derecognition for this type of event, the reduction of future cash flows granted to a counterparty,
or the postponing of these flows as part of a restructuring, shall result in the recognition of a discount in the cost of risk.
It represents loss of future cash flow discounted at the original effective rate. It is equal to the difference between:
The carrying amount of the loan;
And the sum of theoretical future cash flows from the “restructured” loan, discounted at the original effective
interest rate (defined at the date of the financing commitment).
In the event of a waiver of part of the share capital, this amount shall constitute a loss to be recorded immediately in
cost of risk.
The discount recognised when a loan is restructured is accounted for under cost of risk.
Upon reversal of the discount, the portion associated with the passage of time is recorded in revenues.
Accounts uncollectible
When a loan is deemed uncollectible, i.e. when it cannot be recovered in full or in part, the amount deemed
uncollectible must be derecognised from the balance sheet and written off.
The decision as to when to write off a loan is taken on the basis of an expert opinion. This must therefore be established
by each entity, with its Risk Management Department, according to its own business knowledge. Before any write-offs,
a Bucket 3 provision must be made (with the exception of assets at fair value through profit or loss).
For loans at amortised cost or fair value through other comprehensive income on items that can be reclassified, the
amount written off is recorded under cost of risk (nominal amount) and “revenues” (interests).

Consolidated financial statements of Credit Agricole S.A. 31 December 2020
39
Derivative financial instruments
Classification and measurement
Derivative instruments are financial assets or liabilities classified by default as derivative instruments held-for-trading
unless they can be considered to be hedging derivatives.
They are recorded on the balance sheet at their initial fair value on the trading date.
They are subsequently recognised at their fair value.
At the end of each reporting period, the counterparty of the change in fair value of derivatives on the balance sheet
is recorded:
Through profit or loss if it concerns derivative instruments held-for-trading and for fair value hedges;
Through other comprehensive income for cash flow hedging derivatives and net investments in foreign
operations for the effective portion of the hedge.
Hedge accounting
General framework
In accordance with a decision made by the Group, Crédit Agricole SA chooses not to apply the “hedge accounting”
component of IFRS 9, as permitted by the standard. All hedging relationships will continue to be documented in
accordance with the rules of IAS 39 until, at the latest, the date on which the macro-hedging text is adopted by the
European Union. However, hedge accounting under IAS 39 uses the classification and measurement principles of IFRS 9
to decide which financial instruments qualify.
Under IFRS 9, and taking account of the IAS 39 hedging principles, debt instruments at amortised cost or fair value
through other comprehensive income (items that may be reclassified) qualify as fair value hedges and as cash flow
hedges.
Documentation
Hedging relationships must comply with the following principles:
Fair value hedges are intended to provide protection from exposure to changes in the fair value of an asset
or a liability that has been recognised, or of a firm commitment that has not been recognised, attributable
to the risk(s) hedged and that may have an impact on net income (for instance, the hedging of all or some
changes in fair value caused by the interest rate risk of a fixed-rate debt);
Cash flow hedges are intended to provide protection from exposure to changes in the future cash flow of an
asset or liability that has been recognised, or of a transaction considered to be highly probable, attributable
to the risk(s) hedged and that could (in the event of a planned transaction not carried out) have an impact
on net income (for instance, the hedging of changes in all or some of the future interest payments on a
floating-rate debt);
Net investment hedges in foreign operations are intended to provide protection against the risk of
unfavourable changes in fair value associated with the foreign exchange risk of an investment carried out
abroad in a currency other than the euro, Crédit Agricole S.A.’s presentation currency.
Hedges must also meet the following criteria in order to be eligible for hedge accounting:
The hedging instrument and the hedged item must be eligible;
There must be formal documentation from inception, primarily including the individual identification and
characteristics of the hedged item, the hedging instrument, the nature of the hedging relationship and the
nature of the hedged risk;
The effectiveness of the hedge must be demonstrated, at inception and retrospectively, by testing at each
reporting date.
For interest rate hedges for a portfolio of financial assets or financial liabilities, Crédit Agricole group documents the
hedging relationship for fair value hedges in accordance with the carve-out version of IAS 39 as adopted by the
European Union. In particular:
The Group documents these hedging relationships based on its gross position in derivative instruments and
hedged items;
The effectiveness of the hedging relationships is measured by maturity schedules.

Consolidated financial statements of Credit Agricole S.A. 31 December 2020
40
Further details on the Group’s risk management strategy and its application are presented in Chapter 5 “Risks and
Pillar 3”.
Measurement
The remeasurement of the derivative at fair value is recorded in the financial statements as follows:
fair value hedges: the change in value of the derivative is recognised in the income statement symmetrically
with the change in value of the hedged item in the amount of the hedged risk. Only the net amount of any
ineffective portion of the hedge is recognised in the income statement;
cash flow hedges: the change in value of the derivative is recognised in the balance sheet through a specific
account in other comprehensive income (items that may be reclassified) for the effective portion and any
eventual ineffective portion of the hedge is recognised in the income statement. Profits or losses on the
derivative accrued through other comprehensive income are reclassified to profit or loss when the hedged
cash flows occur;
hedges of net investment in a foreign operation: the change in value of the derivative is recognised in the
balance sheet in the translation adjustment equity account (items that may be reclassified) and any
ineffective portion of the hedge is recognised in the income statement.
Where the conditions for benefiting from hedge accounting are no longer met, the following accounting treatment
must be applied prospectively, unless the hedged item disappears:
fair value hedges: only the hedging instrument continues to be revalued through profit or loss. The hedged
item is wholly accounted for according to its classification. For debt instruments at fair value through other
comprehensive income (items that may be reclassified), changes in fair value subsequent to the ending of
the hedging relationship are recorded in other comprehensive income in their entirety. For hedged items
valued at amortised cost, which were interest rate hedged, the revaluation adjustment is amortised over the
remaining life of those hedged items;
cash flow hedges: the hedging instrument is valued at fair value through profit or loss. The amounts
accumulated in other comprehensive income under the effective portion of the hedge remain in other
comprehensive income until the hedged item affects profit or loss. For interest rate hedged instruments,
income statement is affected according to the payment of interest. The revaluation adjustment is therefore
amortised over the remaining life of those hedged items;
hedges of net investment in a foreign operation: The amounts accumulated in other comprehensive income
under the effective portion of the hedge remain in other comprehensive income as long as the net
investment is held. The income is recorded once the net investment in a foreign operation exits the scope of
consolidation.
Embedded derivatives
An embedded derivative is a component of a hybrid contract that meets the definition of a derivative product. This
definition applies only to financial liabilities and non-financial contracts. Embedded derivatives must be accounted for
separately from the host contract if the following three conditions are met:
the hybrid contract is not measured at fair value through profit or loss;
the embedded component taken separately from the host contract has the characteristics of a derivative;
the characteristics of the derivative are not closely related to those of the host contract.
Determination of the fair value of financial instruments
When determining the fair value of financial instruments observable inputs must be prioritised. It is presented using the
hierarchy defined in IFRS 13.
IFRS 13 defines fair value as the price that would be received to sell an asset or paid to transfer a liability in an ordinary
transaction between market participants, on the principal or the most advantageous market, at the valuation date.
Fair value applies individually to each financial asset or financial liability. A portfolio exemption may be used where
the management and risk monitoring strategy so allow and are appropriately documented. Thus, certain fair value
parameters are calculated on a net basis when a group of financial assets and financial liabilities is managed on the
basis of its net exposure to market or credit risks. This is notably the case for the CVA/DVA calculation described in
Chapter 5 “Risks and Pillar 3”.

Consolidated financial statements of Credit Agricole S.A. 31 December 2020
41
Crédit Agricole S.A. considers that the best evidence of fair value is reference to quoted prices published in an active
market.
When such quoted prices are not available, fair value is determined using valuation techniques that maximise the use
of relevant observable data and minimise the use of unobservable data.
When a debt is valued at fair value through profit or loss (by nature or designated), fair value takes account of the
own credit risk of the issuer.
Fair value of structured issues
In accordance with IFRS 13, Crédit Agricole S.A. values its structured issues, recognised at fair value, by taking as a
reference the issuer spread that specialist participants agree to receive to acquire new Group issues.
Counterparty risk on derivative instruments
Crédit Agricole S.A. incorporates into fair value the assessment of counterparty risk for derivative assets (Credit
Valuation Adjustment or CVA) and, using a symmetrical treatment, the non-performance risk for derivative liabilities
(Debit Valuation Adjustment or DVA or own credit risk).
The CVA makes it possible to determine the expected losses due to the counterparty from the perspective of the Crédit
Agricole group, and DVA, the expected losses due to the Crédit Agricole group from the perspective of the
counterparty.
The CVA/DVA is calculated on the basis of an estimate of expected losses based on the probability of default and loss
given default. The methodology used maximises the use of observable market inputs. It is primarily based on market
data such as registered and listed CDS (or Single Name CDS) or index CDS in the absence of registered CDS on the
counterparty. In certain circumstances, historical default data may also be used.
Fair value hierarchy
The standard classifies fair value into three levels based on the observability of inputs used in valuation techniques:
Level 1: fair value corresponding to quoted prices (unadjusted) in active markets
Level 1 is composed of financial instruments that are directly quoted in active markets for identical assets and liabilities
that the entity can access at the valuation date. These are stocks and bonds quoted in active markets (such as the
Paris Stock Exchange, the London Stock Exchange or the New York Stock Exchange etc.) and also fund securities
quoted in an active market and derivatives traded on an organised market, in particular futures.
A market is regarded as being active if quoted prices are readily and regularly available from an exchange, broker,
dealer, pricing service or regulatory agency, and those prices represent actual and regularly occurring market
transactions on an arm’s length basis.
For financial assets and liabilities with offsetting market risks, Crédit Agricole S.A. uses mid-prices as a basis for
establishing fair values for the offsetting risk positions. The Group applies the current asking price to open short positions
and the current bid price to open long positions.
Level 2: fair value measured using directly or indirectly observable inputs other than those in Level 1
The inputs used are observable either directly (i.e. prices) or indirectly (derived from prices) and generally consist of
data from outside the entity, which are publicly available or accessible and based on a market consensus.
Level 2 consists of:
stocks and bonds quoted in an inactive market or not quoted in an active market but for which the fair value
is established using a valuation methodology usually used by market participants (such as discounted cash
flow techniques or the Black & Scholes model) and based on observable market data;
instruments that are traded over the counter, the fair value of which is measured with models using
observable market data, i.e. that can be derived from various independently available external sources
which can be obtained on a regular basis. For example, the fair value of interest rate swaps is generally
derived from the yield curves of market interest rates as observed at the reporting date.

Consolidated financial statements of Credit Agricole S.A. 31 December 2020
42
When the models are consistent notably with standard models based on observable market data (such as interest rate
yield curves or implied volatility surfaces), the day one gain or loss resulting from the initial fair value measurement of
the related instruments is recognised in profit or loss at inception.
Level 3: fair value that is measured using significant unobservable inputs
For some complex instruments that are not traded in an active market, fair value measurement is based on valuation
techniques using assumptions that cannot be observed on the market for an identical instrument. These instruments
are disclosed within Level 3.
This mainly concerns complex interest rate instruments, equity derivatives, structured credit instruments for which fair
value measurement includes, for instance, correlation or volatility inputs that are not directly benchmarkable with
market data.
The transaction price is deemed to reflect the fair value at initial recognition, any recognition of day one gain or loss is
deferred.
The margin relating to these structured financial instruments is generally recognised through profit or loss over the period
during which inputs are deemed unobservable. When market data become “observable”, the remaining margin to
be deferred is immediately recognised in profit or loss.
Valuation methodologies and models used for financial instruments that are disclosed within Levels 2 and 3 incorporate
all factors that market participants would consider in setting a price. They shall be beforehand validated by an
independent control. Fair value measurement notably includes both liquidity risk and counterparty risk.
Offsetting of financial assets and financial liabilities
In accordance with IAS 32, Crédit Agricole S.A. nets a financial asset and a financial liability and reports the net amount
when, and only when, it has a legally enforceable right to offset the amounts reported and intends either to settle on
a net basis, or to realise the asset and settle the liability simultaneously.
The derivative instruments and the repurchase agreements handled with clearing houses that meet the two criteria
required by IAS 32 have been offset on the balance sheet.
Net gains (losses) on financial instruments
Net gains (losses) on financial instruments at fair value through profit or loss
For financial instruments recognised at fair value through profit or loss, this item notably includes the following income
statement elements:
Dividends and other revenues from equities and other variable-income securities which are classified under
financial assets at fair value through profit or loss;
Changes in fair value of financial assets or liabilities at fair value through profit or loss;
Gains and losses on disposal of financial assets at fair value through profit or loss;
Changes in fair value and gains and losses on disposal or termination of derivative instruments not included
in a fair value hedge or cash flow hedge relationship.
This item also includes the ineffective portion of hedges.
Net gains (losses) on financial instruments at fair value through other comprehensive income
For financial assets recognised at fair value through other comprehensive income, this item notably includes the
following income statements elements:
Dividends from equity instruments classified as financial assets at fair value through other comprehensive
income that cannot be reclassified;
Gains (losses) on disposals and income associated with the termination of hedging relationships on debt
instruments classified as financial assets at fair value through other comprehensive income that can be
reclassified;
Net income on disposals or associated with the termination of fair value hedging instruments of financial
assets at fair value through other comprehensive income when the hedged item is sold.

Consolidated financial statements of Credit Agricole S.A. 31 December 2020
43
Financing commitments and guarantees given
Financing commitments that are not designated as fair value through profit or loss or not treated as derivative
instruments within the meaning of IFRS 9 are not recognised on the balance sheet. They are, however, covered by
provisions in accordance with the provisions of IFRS 9.
A financial guarantee contract is a contract under which the issuer must make specific payments to reimburse the
holder for a loss incurred due to a specific debtor’s failure to make a payment when due under the initial or amended
terms of a debt instrument.
Financial guarantee contracts are recognised at fair value initially then subsequently at the higher of:
the value adjustment amount for losses determined in accordance with the provisions of the “Impairment”
section of IFRS 9; or
the amount originally recognised less, where applicable, the sum of income recognised in accordance with
the principles of IFRS 15 “Revenue from contracts with customers”.
PROVISIONS (IAS 37 AND 19)
Crédit Agricole S.A. has identified all obligations (legal or constructive) resulting from a past event for which it is
probable that an outflow of resources will be required to settle the obligation, and for which the due date or amount
of the settlement is uncertain but can be reliably estimated. These estimates are discounted where applicable
whenever there is a material impact.
For obligations other than those related to credit risk, Crédit Agricole S.A. has set aside general provisions to cover:
operational risks;
employee benefits;
commitment execution risks;
claims and liability guarantees;
tax risks (excluding income tax);
risks related to home purchase savings schemes.
The latter provision is designed to cover the Group’s obligations in the event of unfavourable moves impacting home
purchase savings schemes. These obligations are: i) to pay a fixed interest rate on the savings contract determined at
inception for an undefined period of time; and ii) to grant a loan to home purchase savings plan and account savers
at a rate fixed at inception of the contract. The provision is calculated for each generation of a home purchase savings
scheme and for all home purchase savings accounts, with no netting of obligations between generations.
The amount of these obligations is calculated taking account notably of:
subscriber behaviour models, based on assumptions regarding subscriber behaviour drawn from historical
experience, which may not necessarily reflect actual trends in future behaviour;
an estimate of the amount and term of the loans that will be granted in the future, based on historical
experience over an extended period of time;
the yield curve for market rates and reasonably foreseeable trends.
Certain estimates may be made to determine the amount of the following provisions:
the provision for operational risks, which although subject to examination for identified risks, requires
Management to make assessments with regard to incident frequency and the potential financial impact;
the provision for legal risks, which is based on Management’s best estimate in light of the information in its
possession at the end of the reporting period.
Detailed information is provided in Note 6.18 “Provisions”.
EMPLOYEE BENEFITS (IAS 19)
In accordance with IAS 19, employee benefits are recorded in four categories:
short-term employee benefits, including salaries, social security contributions, annual leave, profit-sharing and
incentive plans and premiums, are defined as those which are expected to be settled within twelve months
of the financial year in which the related services have been rendered;

Consolidated financial statements of Credit Agricole S.A. 31 December 2020
44
post-employment benefits falling into two categories: defined-benefit schemes and defined-contribution
schemes;
other long-term benefits (long-service awards, bonuses and compensation payable twelve months or more
after the end of the financial year);
severance payments.
Post-employment benefits
Defined-benefit plans
At each reporting date, Crédit Agricole S.A. sets aside reserves to cover its liabilities for retirement and similar benefits
and all other employee benefits falling in the category of defined-benefit plans.
In keeping with IAS 19, these commitments are stated based on a set of actuarial, financial and demographic
assumptions, and in accordance with the Projected Credit Units method. Under this method, for each year of service,
a charge is booked in an amount corresponding to the employee’s vested benefits for the period. The charge is
calculated based on the discounted future benefit.
Liabilities for retirement and other future employee benefits are based on assumptions made by Management with
respect to the discount rate, staff turnover rate and probable increases in salary and social security costs. (See Note
7.4 “Post-employment benefits, defined-benefit schemes”).
Discount rates are determined based on the average term of the commitment, that is, the arithmetical average of the
terms calculated between the valuation date and the payment date weighted by employee turnover assumptions.
The underlying used is the discount rate by reference to the iBoxx AA.
In accordance with IAS 19, Crédit Agricole S.A. revised all actuarial gains and losses that were recognised in other
comprehensive income that cannot be reclassified. Actuarial gains and losses consist of experience adjustments
(difference between what has been estimated and what has occurred) and the effect of changes in actuarial
assumptions.
The expected return on plan assets is determined using discount rates applied to measure the defined benefit
obligation. The difference between the expected and actual return on plan assets is recognised in other
comprehensive income that cannot be reclassified.
The amount of the provision is equal to:
the present value of the obligation to provide the defined benefits at the end of the reporting period,
calculated in accordance with the actuarial method recommended by IAS 19;
if necessary, reduced by the fair value of the assets allocated to covering these commitments. These may
be represented by an eligible insurance policy. In the event that 100% of the obligation is covered by a policy
that meets exactly the expense amount payable over the period for all or part of a defined-benefit plan, the
fair value of the policy is deemed to be the value of the corresponding obligation, (i.e. the amount of the
corresponding actuarial liability).
For such obligations that are not covered, a provision for retirement benefits is recognised under Provisions on the
liabilities side of the balance sheet. This provision is equal to Crédit Agricole S.A.'s liabilities towards employees in service
at financial year-end, governed by the Crédit Agricole group's collective agreement that came into effect on
1 January 2005.
A provision to cover the cost of early retirement commitments is also listed under Provisions. This provision covers the
additional discounted cost of the various early retirement agreements signed by the Crédit Agricole group entities
under which employees of eligible age may take early retirement.
Lastly, certain Group companies are liable to pay supplementary retirement benefits. A provision is calculated on the
basis of the Company’s actuarial liability for these benefits. These provisions are also shown on the liabilities side of the
balance sheet under “Provisions”.
Defined contribution plans
“Employers” contribute to a variety of compulsory pension schemes. Plan assets are managed by independent
organisations and the contributing companies have no legal or implied obligation to pay additional contributions if
the funds do not have sufficient assets to cover all benefits corresponding to services rendered by employees during
the year and during prior years. Consequently, Crédit Agricole S.A. has no liabilities in this respect other than its
contributions due for the financial year ended.

Consolidated financial statements of Credit Agricole S.A. 31 December 2020
45
Other long-term benefits
Other long-term benefits are employee benefits other than post-employment benefits or termination benefits but not
fully due to employees within twelve months after the end of the financial year in which the related services have been
rendered.
These include, in particular, bonuses and other deferred compensation payable twelve or more months after the end
of the financial year in which they vest, but which are not share-based.
The measurement method is similar to the one used by the Group for post-employment benefits with defined-benefit
schemes.
SHARE-BASED PAYMENTS (IFRS 2)
IFRS 2 on “Share-based payment” requires valuation of share-based payment transactions in the Company’s income
statement and balance sheet. This standard applies to transactions with employees and more specifically to:
share-based payment transactions settled in equity instruments;
share-based payment transactions settled in cash.
Share-based payment plans initiated by Crédit Agricole group that are eligible for IFRS 2 are mainly transactions settled
in equity instruments (stock options, free share allocation plans, variable compensation settled in indexed cash or in
shares etc.).
Options granted are measured at their fair value at the date of grant primarily using the Black & Scholes model. These
options are recognised as a charge under Employee expenses, with a corresponding adjustment to equity, spread
over the vesting period.
Employee share issues offered to employees as part of the Employee savings plans are also subject to the IFRS 2
standard. Shares may be offered to employees with a maximum discount of 30%. These plans have no vesting period
but the shares are subject to a lock-up period of five years. The benefit granted to employees is measured as the
difference between the fair value per share acquired taking account of the lock-up period and the purchase price
paid by the employee on the subscription date multiplied by the number of shares subscribed.
A more detailed description of the method, existing plans and valuation methods is provided in Note 7.6 “Share-based
payments”.
The cost of share based payments settled in Crédit Agricole S.A. equity instruments and the cost of share subscriptions
are recognised in the financial statements of the entities that employ the plan beneficiaries. The impact is recorded
under Employee expenses, with a corresponding increase in Consolidated reserves Group share.
CURRENT AND DEFERRED TAXES (IAS 12)
In accordance with IAS 12, the income tax charge includes all income taxes, whether current or deferred.
It defines current tax liability as “the amount of income tax payable (recoverable) in respect of the taxable profit (tax
loss) for a financial year”. Taxable income is the profit (or loss) for a given accounting period measured in accordance
with the rules determined by the tax authorities.
The applicable rates and rules used to measure the current tax liability are those in effect in each country where the
Group’s companies are established.
The current tax liability includes all taxes on income, payable or recoverable, for which payment is not subordinated
to the completion of future transactions, even if payment is spread over several years.
The current tax liability must be recognised as a liability until it is paid. If the amount that has already been paid for the
current year and previous years exceeds the amount due for these years, the surplus must be recognised under assets.
Moreover, certain transactions carried out by the entity may have tax consequences that are not taken into account
in measuring the current tax liability. IAS 12 defines a difference between the carrying amount of an asset or liability
and its tax base as a temporary difference.
This standard requires that deferred taxes be recognised in the following cases:
a deferred tax liability should be recognised for any taxable temporary differences between the carrying
amount of an asset or liability on the balance sheet and its tax base, unless the deferred tax liability arises
from:
initial recognition of goodwill;

Consolidated financial statements of Credit Agricole S.A. 31 December 2020
46
the initial recognition of an asset or a liability in a transaction that is not a business combination and
that does not affect either the accounting or the taxable profit (taxable loss) at the transaction date.
a deferred tax asset should be recognised for any deductible temporary differences between the carrying
amount of an asset or liability on the balance sheet and its tax base, insofar as it is deemed probable that a
future taxable profit will be available against which such deductible temporary differences can be allocated.
a deferred tax asset should also be recognised for carrying forward unused tax losses and tax credits insofar
as it is probable that a future taxable profit will be available against which the unused tax losses and tax
credits can be allocated.
The tax rates applicable in each country are used as appropriate.
Deferred taxes are not discounted.
Taxable unrealised gains on securities do not generate any taxable temporary differences between the carrying
amount of the asset and the tax base. As a result, deferred tax is not recognised on these gains. When the relevant
securities are classified financial assets at fair value through other comprehensive income, unrealised gains and losses
are recognised directly through other comprehensive income. The tax charge or saving effectively borne by the entity
arising from these unrealised gains or losses is reclassified as a deduction from these gains.
In France long-term capital gains on the sale of equity investments, as defined by the General Tax Code, are exempt
to tax; with the exception of 12% of long-term capital gains that are taxed at the normally applicable rate. Accordingly,
unrealised gains recognised at the end of the year generate a temporary difference requiring the recognition of
deferred tax on this share.
Under IFRS 16 “Leases”, a deferred tax liability is recognised on the right of use and a deferred tax asset on the rental
debt for leases for which the Group is a lessee.
Current and deferred tax is recognised in net income for the financial year, unless the tax arises from:
either a transaction or event that is recognised directly through other comprehensive income, during the
same year or during another year, in which case it is directly debited or credited to other comprehensive
income;
or a business combination.
Deferred tax assets and liabilities are offset against each other if, and only if:
the entity has a legally enforceable right to offset current tax assets against current tax liabilities; and
the deferred tax assets and liabilities apply to income taxes assessed by the same tax authority:
a) either for the same taxable entity, or
b) for different taxable entities that intend either to settle current tax assets and liabilities on a net basis, or to settle
their tax assets and liabilities at the same time during each future financial year in which it is expected that
substantial deferred tax assets or liabilities will be paid or recovered.
Tax risks relating to income tax result in the recognition of a current tax receivable or liability when the probability of
receiving the asset or paying the liability is considered more likely than not. These risks are also taken into account in
the valuation of current and deferred tax assets and liabilities.
IFRIC 23 on measuring uncertain tax positions applies when an entity has identified one or more uncertainties about
the tax positions they have adopted. It also provides details of how to estimate them:
the analysis must be based on an assessment by the tax authorities;
the tax risk must be recognised as a liability as soon as he is more likely than unlikely that the tax authorities
will question the treatment adopted, for an amount reflecting Management’s best estimate;
in the event that the probability of a refund by the tax authorities is greater than 50%, a receivable must be
recognised.
When tax credits on income from securities portfolios and amounts receivable are effectively used to pay income tax
due for the year, they are recognised under the same heading as the income with which they are associated. The
corresponding tax charge continues to be recognised under the “Income tax” charge heading in the income
statement.

Consolidated financial statements of Credit Agricole S.A. 31 December 2020
47
TREATMENT OF FIXED ASSETS (IAS 16, 36, 38 AND 40)
The Crédit Agricole group applies component accounting for all of its property, plant and equipment. In accordance
with the provisions of IAS 16, the depreciable amount takes account of the potential residual value of property, plant
and equipment.
Land is measured at cost less any impairment losses.
Property used in operations, investment property and equipment are measured at their acquisition cost less
accumulated depreciation and impairment losses since the time they were placed in service.
Purchased software is measured at acquisition cost less accumulated depreciation and impairment losses since
acquisition.
Proprietary software is measured at cost less accumulated depreciation and impairment losses since completion.
Apart from software, intangible assets are mainly assets acquired during a business combination resulting from
contractual rights (e.g. distribution agreement). These were valued on the basis of corresponding future economic
benefits or expected service potential.
Fixed assets are depreciated over their estimated useful lives.
The following components and depreciation periods have been adopted by Crédit Agricole group following the
application of the measures on component accounting for property, plant and equipment. These depreciation
periods are adjusted according to the type of asset and its location:
Exceptional depreciation charges corresponding to tax-related depreciation and not to any real impairment in the
value of the asset are eliminated in the consolidated financial statements.
FOREIGN CURRENCY TRANSACTIONS (IAS 21)
At the reporting date, assets and liabilities denominated in foreign currencies are translated to euro, the Crédit Agricole
group’s operating currency.
In accordance with IAS 21, a distinction is made between monetary (e.g. debt instruments) and non-monetary items
(e.g. equity instruments).
Foreign-currency denominated monetary assets and liabilities are translated at the closing rate. The resulting
translation adjustments are recorded in the income statement. There are three exceptions to this rule:
for debt instruments at fair value through other comprehensive income that can be reclassified, only the
translation adjustments calculated on amortised cost are taken to the income statement; the balance is
recorded in other comprehensive income that can be reclassified;
translation adjustments on elements designated as cash flow hedges or forming part of a net investment in a
foreign entity are recognised in other comprehensive income that can be reclassified;
Component Depreciation period
Land Not depreciable
Structural works 30 to 80 years
Non-structural works 8 to 40 years
Plant and equipment 5 to 25 years
Fixtures and fittings 5 to 15 years
Computer equipment 4 to 7 years
Special equipment 4 to 5 years

Consolidated financial statements of Credit Agricole S.A. 31 December 2020
48
for financial liabilities designated at fair value through profit or loss, translation adjustments related to value
changes attributable to own credit risk accounted in other comprehensive income (items than cannot be
reclassified).
Non-monetary items are treated differently depending on the type of items before translation:
items at historical cost are measured at the foreign exchange rate on the transaction date (historical rate);
items at fair value are measured at the foreign exchange rate at the end of the reporting period.
Translation adjustments on non-monetary items are recognised:
in the income statement if the gain or loss on the non-monetary item is recorded in the income statement;
in other comprehensive income that cannot be reclassified if the gain or loss on the non-monetary item is
recorded in other comprehensive income that cannot be reclassified.
REVENUES FROM CONTRACTS WITH CUSTOMERS (IFRS 15)
Fee and commission income and expenses are recognised in income based on the nature of services with which they
are associated.
Fees and commissions that are an integral part of the effective yield on a financial instrument are recognised as an
adjustment to the yield on the instrument and included in its effective interest rate.
The recognition of other types of fees and commissions on the income statement must reflect the rate of transfer to
the customer of control of the goods or services sold:
the net income from a transaction associated with the provision of services is recognised under “Fee and
commissions” at the time of transfer of control of the service to the customer, if this can be reliably estimated.
This transfer may take place as the service is provided (ongoing service) or on a specific date (one-off
service):
a) Fee and commission income from ongoing services (fees and commissions on payment instruments, for
example) is recognised in income according to the degree of progress of the service provided.
b) Fee and commission income paid or received as compensation for one-off services is recognised in income,
in its entirety, when the service is provided.
Fee and commission income payable or receivable and contingent upon the achievement of a performance target
is recognised for the amount at which it is highly probable that the income thus recognised will not later be subject to
a significant downward adjustment upon resolution of the contingency. These estimates are updated at the end of
each reporting period. In practice, this condition can result in the deferred recognition of certain items of performance-
related fee and commission income until the expiry of the performance assessment period and until such income has
been definitively acquired.
INSURANCE (IFRS 4)
Liabilities remain partially valued under French GAAP, as permitted by IAS and IFRS regulations, pending further
amendments to the existing standards. Financial assets held by the Crédit Agricole group’s insurance companies have
been reclassified into the financial assets categories set out in IFRS 9.
The technical reserves of non-life insurance contracts include;
reserves for claims, to cover the total cost of claims incurred but not yet paid should they be already subject
of a claim and assessed or not, and
reserves relating to the acquisition of premiums (mainly provisions for unearned premiums), allowing for the
recognition of premiums relating to risks hedged over the course of a financial year as earnings for said year,
and therefore to carry forward the portion of premiums written over the course of the year for a risk hedging
period subsequent to the current financial year.
Provision for increasing risks may be required for insurance transactions against the risk of sickness and disability when
the premiums are unbroken. It is equal to the difference between the current values of the commitments made by the
insurer and by the policyholders. It is calculated based on a continuous process of updating biometric bases
(probability of incidence of a state of dependency, length of support, etc.). Since 2017, an additional provision to
cover increasing risks has been created for the Assurance Dépendance product. It takes the form of a global provision,
separate from the provision for increasing regulatory risks, allowing it to deal with a possible shortfall in future financial

Consolidated financial statements of Credit Agricole S.A. 31 December 2020
49
production today, as this could not be compensated quickly by price revaluations that are contractually limited to 5%
per annum.
The mathematical provisions of life insurance contracts and financial contracts containing discretionary participation
features correspond to the difference between the current value of insurer commitments and policyholder
commitments. Provisions are calculated using actuarial methods that include assumptions pertaining to the premiums,
the performance of financial assets, contract redemption rates and changes in operating expenses.
Contracts containing discretionary participation features are collectively classified as a liability under insurance
company’s technical reserves. They are recognised in the same manner as insurance contracts. Premiums on these
contracts are recognised as income and the increase in obligations to policyholders is recognised as an expense.
Life insurance technical reserves are conservatively estimated based on the technical rates defined in the contracts.
Liabilities associated with contracts with or without discretionary participation features or minimum guarantee are
measured based on the fair value of the underlying assets or its equivalent at the end of the reporting period and are
recorded under financial liabilities.
The financial margin on these policies is taken to profit or loss, after reversal of technical items (premiums, benefits,
etc.), according to deposit accounting principles.
Property and casualty insurance policy liabilities are estimated at the end of the reporting period, without applying
any discount. Claims management costs associated with technical reserves are charged to a provision in the financial
statements at the reporting date.
For non-life insurance contracts, acquisition costs are recognised as and when the premium is earned. For life insurance
contracts, directly identifiable acquisition costs are deferred over the profit generation period.
Total expenses related to the insurance business are presented in Note 4.6 “Net income (expenses) on other activities”.
Insurance or investment contracts with discretionary participation in profits are subject to “shadow accounting” in
accordance with the option offered by IFRS 4. This shadow accounting consists of recording the portion of positive or
negative revaluations of the financial assets backing these contracts in a policyholders’ deferred profit sharing item,
and of certain consolidation adjustments (e. g. elimination of the provision for liquidity risk) that may potentially accrue
to policyholders.
In addition, CRC Regulation 2000-05 provides for the recognition of deferred profit sharing, which must be recognised
in the case of deferred profit sharing liabilities and for their recoverable amount in the case of deferred profit sharing
assets.
This policyholders’ deferred profit sharing is recognised as a liability “Insurance contract technical reserves” or as an
asset, with a corresponding entry in income statement or other comprehensive income similar to the unrealised gains
and losses on the assets to which it relates.
With regard to savings contracts, the policyholders’ deferred profit sharing rate is assessed prospectively on the basis
of scenarios studied that are consistent with the insurance company’s management guidelines. It is only updated if it
varies significantly.
In the event of a net unrealised loss, a deferred profit sharing asset is only recognised if it is highly probable that it will
be allocated, by entity, to future profit sharings. This is especially the case if this deferred profit sharing asset can be
deducted from future policyholder sharings, either directly by deducting it from the deferred profit sharing liabilities
recorded for future disposal profits, or indirectly by being recoverable from future sums paid to policyholders.
The recoverability tests implemented in the event of a deferred profit sharing asset are in accordance with the CNC
recommendation of 19 December 2008. They are based:
firstly, on liquidity analyses of the company, which show the enterprise’s capacity to access funding sources
to meet its obligations and its ability to hold assets with unrealised losses even if new production declines. The
tests were performed with and without new production;
secondly, on a comparison between the average value of future services measured by the internal model
replicating the company’s management decisions and the value of the assets representing the obligations
at market value. This shows the company’s ability to meet its obligations.
Lastly, sensitivity tests on the ability to activate policyholders’ deferred profit sharing are also carried out, based in
particular on a uniform increase in redemptions applied to redemption rates drawn from scenarios similar to those used
by the French Regulatory and Resolution Supervisory Authority, or on a further decline in the equity and real estate
markets.
Furthermore, in accordance with the provisions of IFRS 4, the Group ensures at each reporting date that the liabilities
recognised for insurance policies and investment contracts containing discretionary participation (net of deferred
acquisition costs and associated intangible assets) are adequate to meet estimated future cash flows.
The liability adequacy test used to verify this must meet the following minimum requirements, as defined in the
standard:
Consolidated financial statements of Credit Agricole S.A. 31 December 2020
50
it must consider all future contractual cash flows, including associated management costs, fees and
commissions as well as options and guarantees implicit in these contracts;
if the test shows that the liability is inadequate, it is wholly recognised in profit or loss.
LEASE (IFRS 16)
The Group may be the lessor or lessee of a lease.
Leases for which the Group is the lessor
Leases are analysed in accordance with their substance and financial reality. They are classified as finance leases or
operating leases.
In the case of finance leases, they are considered equivalent to a fixed asset sale to the lessee financed by
a credit granted by the lessor. The analysis of the economic substance of finance leases leads the lessor to:
Remove the leased asset from the balance sheet;
Record a financial debt for the customer under “financial assets at amortised cost” for a value equal to the
present value at the contract’s implicit rate of the rental payments due to the lessor under the lease, plus any
non-guaranteed residual value owed to the lessor;
Recognise deferred taxes for temporary differences relating to the financial debt and the net carrying
amount of the leased asset;
Break down rental income corresponding into interest and capital depreciation.
In the case of operating leases, the lessor recognises the leased assets under “Property, plant & equipment”
on the assets side of its balance sheet and records the rental income on a straight-line basis under “Income
from other activities” in the income statement.
Leases for which the Group is the lessee
Leases are recognised in the balance sheet on the date on which the leased asset is made available. The lessee
records an asset representing the right of use of the leased asset under “property, plant & equipment” over the
estimated term of the contract and a liability representing the rental payment obligation under “miscellaneous
liabilities” over the same term.
The lease period of a contract corresponds to the non-cancellable term of the lease adjusted for the contract
extension options that the lessee is reasonably certain to exercise and the termination option that the lessee is
reasonably certain not to exercise.
In France, the term used for the “3/6/9” commercial leases is generally 9 years with an initial non-cancellable period
of 3 years. The Group has chosen a term corresponding to the first exit option after 5 years as the reasonably certain
term of a lease. This term, at the inception of French commercial leases, is applied in the majority of cases. The main
exception is the case of a lease in which the interim exit options have been waived (e.g. in return for a reduction in
rental income); in this case, the term of the lease remains 9 years. This 5-year term is also applied to leases that are
automatically extended.
The lease liability is recognised for an amount equal to the present value of the rental payments over the term of the
contract. Rental payments include fixed rents, variable rents based on a rate or index, and payments that the lessee
expects to pay as residual value guarantees, purchase options or early termination penalties. Variable rents that are
not based on an index or rate and the non-deductible VAT on rents are excluded when calculating the debt and are
recognised under “operating expenses”.
The discount rate applicable to the calculation of the right-of-use asset and the lease liability is, by default, the lessee’s
marginal rate of indebtedness over the term of the agreement at the date of signature of the agreement, when the
implicit rate cannot easily be established. The marginal indebtedness rate takes account of the rent payment structure.
It reflects the terms of the lease (term, guarantee, economic environment etc.) - here, the Group applies the IFRS IC
decision of 17 September 2019 since the implementation of FRS 16 (no impact of this decision).
The lease expense is broken down into interest and amortisation of capital.
The right of use of the asset is valued at the initial value of the lease liability plus the initial direct costs, advance
payments and restoration costs, reduced by the lease inducements. It is amortised over the estimated term of the
lease.
The lease liability and the right of use may be adjusted in the event of amendment to the lease, re-estimation of the
lease period or rent review related to the application of indices or rates.

Consolidated financial statements of Credit Agricole S.A. 31 December 2020
51
Deferred taxes are recognised as temporary differences in right-of-use and rental liabilities by the lessee.
In accordance with the exception set out in the standard, short-term leases (initial term of less than twelve months)
and leases for which the new value of the leased asset is low are not recognised on the balance sheet; the
corresponding leasing expenses are recorded on a straight-line basis in the income statement under “operating
expenses”.
In accordance with the standard, the Group does not apply IFRS 16 to leases of intangible assets.
NON-CURRENT ASSETS HELD FOR SALE AND DISCONTINUED OPERATIONS (IFRS 5)
A non-current asset (or a disposal group) is classified as held-for-sale if its carrying amount will be recovered principally
through a sale transaction rather than through continuing use.
For this to be the case, the asset (or disposal group) must be available for immediate sale in its present condition and
its sale must be highly probable.
The relevant assets and liabilities are shown separately on the balance sheet under “Non-current assets held for sale
and discontinued operations” and “Liabilities associated with non-current assets held for sale and discontinued
operations”.
A non-current asset (or disposal group) classified as held for sale is measured at the lower of its carrying amount and
fair value less costs of sale. In case of unrealised losses, impairment is recognised in the income statement. Non-current
assets are no longer amortised when they are reclassified.
If the fair value of a group of assets held for sale less its selling costs is less than its carrying amount after impairment of
non-current assets, the difference is allocated to the other assets in the group of assets held for sale including the
financial assets and is recognised under net income from discontinued operations.
A discontinued operation is a component that the Group has either disposed of, or that is classified as held for sale,
according to the following situations:
it represents a separate major business line or geographical area of operations;
it is part of a single coordinated plan to dispose of a separate major business line or geographical area of
operations; or
it is a subsidiary acquired exclusively with a view to resale.
The following are disclosed on a separate line of the income statement:
the profit or loss from discontinued operations until the date of disposal, net of tax;
the gain or loss recognised on the disposal or on measurement to fair value less costs of sale of the assets and
liabilities constituting the discontinued operations, net of tax.
1.3 Consolidation principles and methods (IFRS 10, IFRS 11 and IAS 28)
SCOPE OF CONSOLIDATION
The consolidated financial statements include the financial statements of Crédit Agricole S.A. and those of all
companies over which, in compliance with IFRS 10, IFRS 11 and IAS 28, Crédit Agricole S.A. exercises control, joint
control or significant influence.
Definitions of control
In compliance with international accounting standards, all entities under control, under joint control or under significant
influence are consolidated, provided that they are not covered by the exclusions below.
Exclusive control over an entity is deemed to exist if Crédit Agricole S.A. is exposed to or entitled to receive variable
returns as a result of its involvement with the entity and if the power it holds over this entity allows it to influence these
returns. Power in this context means substantive (voting or contractual) rights. Rights are considered substantive if the
holder of the rights can in practice exercise them when decisions about the Company’s relevant activities are made.
Crédit Agricole S.A. is deemed to control a subsidiary through voting rights when its rights give it the practical ability to
direct the subsidiary’s relevant activities. Crédit Agricole S.A. is generally considered to control a subsidiary when it
holds more than half the existing or potential voting rights in an entity, whether directly or indirectly through subsidiaries,

Consolidated financial statements of Credit Agricole S.A. 31 December 2020
52
except when it can be clearly demonstrated that such ownership does not give it the power to direct its relevant
activities. Control is also deemed to exist where Crédit Agricole S.A. holds half or less than half of the voting rights,
including potential rights, in an entity but is able in practice to direct its relevant activities at its sole discretion, notably
because of the existence of contractual arrangements, the size of its stake in the voting rights compared to those of
other investors, or other reasons.
Control of a structured entity is not assessed on the basis of voting rights as these have no effect on the entity’s returns.
The analysis of control takes into account contractual arrangements, but also Crédit Agricole S.A.'s involvement and
decisions since creating the entity and what decisions it made at that time, what agreements were made at its
inception and what risks are borne by Crédit Agricole S.A., any rights under agreements that give the investor the
power to direct relevant activities in specific circumstances only and any other facts or circumstances that indicate
the investor can direct the entity’s relevant activities. Where there is a management agreement, the extent of decision-
making powers granted to the delegated manager and the remuneration accorded by such contractual
arrangements are examined to establish whether the manager is in practice acting as an agent (with delegated
powers) or as a principal (on their own account).
Furthermore, when decisions on the entity’s relevant activities are taken, the indicators used to assess whether an entity
is acting as agent or principal are as follows: the extent of the decision-making powers compared to the powers over
the entity delegated to the manager, the remuneration provided for under the contractual arrangements, any
substantive rights that may affect the decision-making capacity of other parties involved in the entity and the exposure
to variable returns of other interests in the entity.
Joint control is deemed to exist when there is a contractual division of control over an economic activity. Decisions
affecting the entity’s relevant activities require unanimous agreement of the joint controllers.
In traditional entities, significant influence is defined as the power to influence but not control a company’s financial
and operational policies. Crédit Agricole S.A. is presumed to have significant influence if it owns 20% or more of the
voting rights in an entity, whether directly or indirectly through subsidiaries.
Exclusions from the scope of consolidation
In accordance with IAS 28, minority interests held by entities for which the paragraph 18 option has been applied, are
excluded from the scope of consolidation insofar as they are classified under financial assets at fair value through profit
or loss by nature.
CONSOLIDATION METHODS
The methods of consolidation are respectively defined by IFRS 10 and IAS 28. They depend on the type of control
exercised by Crédit Agricole S.A. over the entities that can be consolidated, regardless of activity or whether or not
they have legal entity status:
full consolidation, for controlled entities, including entities with different financial statement structures, even if
their business is not an extension of that of Crédit Agricole S.A. ;
the equity method, for the entities over which Crédit Agricole S.A. exercises significant influence and joint
control.
Full consolidation consists in substituting for the value of the shares each of the assets and liabilities carried by each
subsidiary. The equity and income attributable to non-controlling interests is presented separately in the consolidated
balance sheet and income statement.
Non-controlling interests are as defined by IFRS 10 and incorporate instruments representing current ownership interests
and that give right to a proportional share of the net assets in the event of liquidation and the other equity instruments
issued by the subsidiary and not held by the Group.
The equity method consists in substituting for the value of shares the Group’s proportional share of the equity and
income of the companies concerned.
The change in the carrying amount of these shares includes changes in goodwill.
In the event of incremental share purchases or partial disposals with continued joint control or significant influence,
Crédit Agricole S.A. recognises:
in the case of an increase in the percentage of interest, additional goodwill;
in the case of a reduction in the percentage of interest, a gain or loss on disposal/dilution in profit or loss.

Consolidated financial statements of Credit Agricole S.A. 31 December 2020
53
RESTATEMENTS AND ELIMINATIONS
Where necessary, financial statements are restated to harmonise the valuation methods applied to consolidated
companies.
The impact of Group internal transactions on the consolidated balance sheet and income statement is eliminated for
fully consolidated entities.
Capital gains or losses arising from intra-group asset transfers are eliminated; any potential impairment measured at
the time of disposal in an internal transaction is recognised.
TRANSLATION OF THE FINANCIAL STATEMENTS OF FOREIGN OPERATIONS (IAS 21)
The financial statements of entities representing a “foreign operation” (subsidiary, branch, associate or joint venture)
are translated to euro in two steps:
if applicable, the local currency in which the financial statements are prepared is converted into the
functional currency (currency of the main business environment of the entity). The conversion is made as if
the information had been recognised initially in the functional currency (same conversion principles as for
foreign currency transactions here above);
the functional currency is converted into euros, the currency in which the Group’s consolidated financial
statements are presented. Assets and liabilities, including goodwill, are converted at the closing exchange
rate. Equity items, such as share capital or reserves, are converted at their historical foreign exchange rates.
Income and expenses included in the income statement are converted at the average exchange rate for
the period. Foreign exchange impacts resulting from this conversion are recognised as a separate
component of shareholders’ equity. In the event of exit from the foreign operation (disposal, repayment of
capital, liquidation, discontinuation of activity) or in the event of deconsolidation due to a loss of control
(even without disposal), these translation adjustments are recognised in the income statement when the
result of exit or loss of control is recognised.
BUSINESS COMBINATIONS – GOODWILL
Business combinations are accounted for using the acquisition method in accordance with IFRS 3, except for business
combinations under common control, which are excluded from the scope of application of IFRS 3. Pursuant to IAS 8,
these transactions are entered at carrying amount using the pooling of interests method, with reference to US standard
ASU805-50 which seems to comply with the IFRS general principles.
At the date of acquisition, the identifiable assets, liabilities and contingent liabilities of the acquired entity which satisfy
the conditions for recognition set out in IFRS 3 are recognised at fair value.
Notably, restructuring liabilities are only recognised as a liability of the acquired entity if, at the date of acquisition, the
acquiree is under an obligation to complete the restructuring.
Price adjustment clauses are recognised at fair value even if their application is not probable. Subsequent changes in
the fair value of clauses if they are financial liabilities are recognised in the income statement. Only price adjustment
clauses relating to transactions where control was obtained at the latest by 31 December 2009 may still be recorded
against goodwill, because these transactions were accounted for under IFRS 3 pre revision (2004).
The non-controlling interests that are shares of current interests giving rights to a share of the net assets in the event of
liquidation may be measured, at acquirer’s choice, in two ways:
at fair value on the date of acquisition;
at the share of the identifiable assets and liabilities of the acquired company revalued at fair value.
The option may be exercised at each acquisition.
The balance of non-controlling interests (equity instruments issued by the subsidiary and not held by the Group) should
be recognised for its fair value on the date of acquisition.
The initial assessment of assets, liabilities and contingent liabilities may be revised within a maximum period of
twelve months after the date of acquisition.
Some transactions relating to the acquired entity are recognised separately from the business combination. These
include:

Consolidated financial statements of Credit Agricole S.A. 31 December 2020
54
transactions that end a pre-existing relationship between the acquired company and the acquiring
company;
transactions that compensate employees or the selling shareholders of the acquired company for future
services;
transactions aimed at reimbursing the acquiree or its former shareholders for acquisition-related costs that
they have assumed on behalf of the acquirer.
These separate transactions are generally recognised in the income statement at the acquisition date.
The transferred consideration at the time of a business combination (the acquisition cost) is measured as the total of
fair values transferred by the acquirer, at the date of acquisition in exchange for control of the acquired entity (for
example: cash, equity instruments etc.).
The costs directly attributable to the business combination shall be recognised as expenses, separately from the
business combination. If the transaction is highly probable, they are recognised under “Net gains (losses) on other
assets”, otherwise they are recognised under “Operating expenses”.
The difference between the sum of acquisition costs and non-controlling interests and the net balance at the date of
acquisition of acquired identifiable assets and liabilities assumed, valued at their fair value, is recognised, when it is
positive, in the assets side of the consolidated balance sheet, under “Goodwill” when the acquired entity is fully
consolidated and under “Investments in equity-accounted entities” when the acquired company is consolidated using
the equity method of accounting. Any badwill is recognised immediately through profit or loss.
Goodwill is carried in the balance sheet at its initial amount in the currency of the acquired entity and converted at
the closing rate at the end of the reporting period.
When control is taken by stages, the interest held before taking control is revalued at fair value through profit or loss at
the date of acquisition and the goodwill is calculated once, using the fair value at the date of acquisition of acquired
assets and liabilities taken over.
Goodwill is tested for impairment whenever there is objective evidence of a loss of value and at least once a year.
The choices and assumptions used in assessing non-controlling interests at the date of acquisition may influence the
amount of initial goodwill and any impairment resulting from a loss of value.
For the purpose of impairment testing, goodwill is allocated to the Group Cash Generating Units (CGUs) that are
expected to benefit from the business combination. The CGUs have been defined within the Group’s business lines as
the smallest identifiable group of assets and liabilities functioning in a single business model. Impairment testing consists
of comparing the carrying amount of each CGU, including any goodwill allocated to it, with its recoverable amount.
The recoverable amount of the CGU is defined as the higher of fair value less than of selling costs and value in use. The
value in use is the present value of the future cash flows of the CGU, as set out in medium-term business plans prepared
by the Group for management purposes.
When the recoverable amount is lower than the carrying amount, a corresponding impairment loss is recognised for
the goodwill allocated to the CGU. This impairment is irreversible.
In the case of an increase in the percentage ownership interest of Crédit Agricole S.A. in an entity that is already
exclusively controlled, the difference between the acquisition cost and the share of net assets acquired is recognised
under “Consolidated reserves Group share”; in the event that the Crédit Agricole S.A.’s percentage ownership interest
in an entity that remains under its exclusive control declines, the difference between the selling price and the carrying
amount of the share of net assets sold is also recognised directly under “Consolidated reserves Group share”. Expenses
arising from these transactions are recognised in equity.
The accounting treatment of sale options granted to minority shareholders is as follows:
when a sale option is granted to the minority shareholders of a fully consolidated subsidiary, a liability is
recognised in the balance sheet; on initial recognition, the liability is measured at the estimated present value
of the exercise price of the options granted to the minority shareholders. Against this liability, the share of net
assets belonging to the minority shareholders concerned is reduced to zero and the remainder is deducted
from equity;
subsequent changes in the estimated value of the exercise price will affect the amount of the liability, offset
by an equity adjustment. Symmetrically, subsequent changes in the share of net assets due to minority
shareholders are cancelled, offset in equity.
When there is a loss of control, the proceeds from the disposal are calculated on the entirety of the entity sold and any
investment share kept is recognised in the balance sheet at its fair value on the date control was lost.

Consolidated financial statements of Credit Agricole S.A. 31 December 2020
55
NOTE 2 Major structural transactions and material events during
the period
The scope of consolidation and changes to it as at 31 December 2020 are shown in detail at the end of the notes in
Note 13 “Scope of consolidation at 31 December 2020”.
2.1 COVID-19 health crisis
Faced with the COVID-19 health crisis and its economic consequences, Crédit Agricole S.A. underwent a massive
mobilisation. To support its customers whose business would be impacted by the Coronavirus crisis, the Group actively
participated in the economic support measures put in place by the public and local authorities.
2.1.1 State-guaranteed loans (SGL)
In the context of the health and economic crisis related to COVID-19, starting 25 March 2020, Crédit Agricole S.A. has
granted all of its corporate customers, whatever their size and status (farmers, professionals, merchants, artisans,
companies, etc.), access to the massive and unprecedented State-guaranteed loan scheme, in addition to the
measures already announced (extension of due dates, accelerated procedures for examining applications, etc.).
Companies can apply for these loans until 30 June 2021.
This financing takes the form of a 12-month loan, and the borrower has the option to amortise it over an additional
period of one to five years.
Over this additional period, the loan may, during the amortisation phase, have a further period of one year during
which only the interest and the cost of the State guarantee will be paid.
The total term of the loan may not exceed six years.
The Group’s offer for the first year takes the form of a zero-interest loan; only the cost of the guarantee is re-invoiced
(via a commission paid by the customer) in accordance with the eligibility conditions defined by the State to benefit
from the guarantee.
The amount of these loans may be as high as three months of revenues, thus allowing entrepreneurs to have access
to the necessary financing to get through the current period.
These loans belong to a “Collection” business model and meet the test for contractual terms. They are therefore
recognised at amortised cost.
At 31 December 2020, the amount of State-guaranteed loans granted to customers by Crédit Agricole S.A. in France
amounted to €9.5 billion. The amount of the guarantee received from the French State in connection with these loans
is €8.5 billion.
2.1.2 Due date extension on loans granted to customers
Starting March 2020, the Group joined the French banking community initiative coordinated by the Fédération des
Banques Françaises (FBF) to offer an extension of the due dates for outstanding loans by up to six months for Corporate
and Professional customers at no additional cost.
The implementation of a postponement of due dates of this nature without penalties or additional costs and with
maintenance of the contractual rate over a maximum period of six months implies that only interim interest will be
collected after the postponement over the remaining duration of the loan, excluding any guarantee costs of the
French Public Investment Bank.
As proposed by the Group, the postponement of due dates implies:
An extension of the term of the loan if the customer wishes to maintain its initial loan instalments; or
An increase in its instalments after the suspension if the customer wants to maintain its initial term.
This postponement results in a postponement of the original due dates.
Outstanding loans to customers in France with non-contractual due date postponements amounted to €16.6 billion in
2020, including €0.9 billion still outstanding as at 31 December 2020 at Crédit Agricole S.A. level.

Consolidated financial statements of Credit Agricole S.A. 31 December 2020
56
2.1.3 Impact of these measures on credit risk
In accordance with the IASB communication of 27 March 2020 relating to the recognition of expected credit losses
under IFRS 9 on financial instruments under the current exceptional circumstances, the importance of exercising
judgement in the application of IFRS 9 credit risk principles and the resulting classification of financial instruments was
restated.
The due date extension on loans granted to customers does not systematically cast doubts on the customer’s financial
position, and there is no automatic increase in counterparty risk. Amendments to the agreement cannot generally be
considered as developments linked to restructuring events due to financial difficulties.
As a result, this postponement does not result in an automatic changeover of outstandings, the impairment of which
are based on expected loan losses over 12 months (Bucket 1) to recognition of impairment of expected losses at
maturity (Bucket 2), nor does it result in the automatic transfer of outstandings to the doubtful category (Bucket 3).
Similarly, the calculation of the amount of expected losses must take into account the specific circumstances and the
support measures put in place by the public authorities.
2.1.4 Credit risk rating measurement
In the context of the health and economic crisis related to COVID-19, the Group has revised its macroeconomic
forecasts (forward-looking) for the determination of the year-end credit risk estimate. As a reminder, an initial
recognition of the effects of the health crisis and its macro-economic effects has already been included in the Q2
2020 report.
Background of select macroeconomic scenarios
The Group used four scenarios for calculating IFRS 9 provisioning parameters with projections for 2022.
These four scenarios incorporate differentiated hypotheses as to the impacts of the COVID-19 crisis on the economy in
faster, slower and full return to normality of mobility, activity and consumption, and largely depend on how the health
situation development, which is still very uncertain today (taking into account a second lock-down, but also favourable
prospects related to the discovery of vaccines at the end of the year). The strength of customer type confidence is
also decisive which – depending on health, economic and employment expectations – results in different levels of
wait-and-see and cautious behaviour. This in turn determines the propensity of households to consume the abundant
savings they accumulated during the lockdown and the capacity of businesses to invest. The scale, effectiveness and
timing of government stimulus support programmes also have a significant impact on the development of activity.
The rebound in Q3 2020, enabled by ending lockdowns in most European countries, was stronger than expected. In
France, GDP rebounded by 18.2% in Q3 versus Q2, after a -13.7% decline in Q2 versus Q1. The extent of the second
wave led to significant restrictions in Europe in Q4. In France, it seemed likely that the second lockdown would be
extended beyond early December, in order to control levels as the virus started to circulate again (target of maximum
5,000 infections per day). With an assumption of a lockdown until mid-December, France’s GDP was expected to drop
by about -8% in Q4 vs Q3. The average annual growth in 2020 was not expected to be affected much (-10.1% vs. -9.1%
forecast in September), but the achieved growth (i.e. 2021 annual growth if the quarterly GDP is equal to that of Q4
2020, therefore zero quarterly growth) for 2021 is negative (-1.6%).
The first scenario describes a gradual yet not synchronised recovery from the crisis, with the growth profile
strongly dependent on health assumptions, for which uncertainty is high. Moreover, health developments
and measures taken are not identical among European countries.
Scenario 1 assumes the pandemic will persist in 2021 with a ‘stop and go’ scenario during Q1 and Q2 (alternating
relaxation, restrictions and short lock-down periods), but less detrimental than in 2020 (better control of epidemic flows,
fewer restrictions on mobility). Even with a vaccine on the market, we assume that a large roll-out would not take place
until mid-2021.
For 2021, a GDP growth forecast for France of +4.6%, compared to the +7.3% forecast used for late June, including a
fairly clear rebound for Q1 2021, but more moderate than for Q3 2020, due to a cautious lifting of the lockdown – with
ongoing restrictive curfew-type measures likely – and in Q2 2021 a third wave (particularly related to climate issues and
insufficient effectiveness of the testing strategy) is assumed to result in a new, shorter episode of lockdown and a
decline in GDP. Lastly, in H2 2021 a rebound (lifting of the lockdown) and an improvement in the situation due to
vaccination campaigns. But a cautious recovery, despite support measures: some sectors will remain markedly
weakened (aeronautics, automotive, trade, tourism, hotels, restaurants, culture, etc.); uncertainty about a resumption
of investments despite the stimulus plan; bankruptcies; continued high precautionary savings by households in light of
rising unemployment, limiting the use of the savings accumulated during successive lockdowns.

Consolidated financial statements of Credit Agricole S.A. 31 December 2020
57
As a result, the ECB would move towards more easing and more purchases of sovereign debt securities. Indeed, with
the outlook for growth and inflation still bleak, future sovereign debt issuance should induce the ECB to do more. We
do not expect a rate cut in the foreseeable future. Net asset purchases under the PEPP (€750 billion in March to
€1,350 billion in June) are due to end in June 2021. This scenario assumes that the ECB will increase its purchasing
programmes during H2 2021 as well as 2022 (via an extension and expansion of the PEPP or a simple increase in the
APP).
Since the peak of risk aversion in March, the yield on the 10-year Bund did try to recover but has been systematically
reduced to -0.50%/-0.60%. No view on the evolution of the pandemic, on the growth profile of 2021 and, more
generally, a very high degree of uncertainty. Also, the Bund remains at a very low level.
The second scenario involves more negative health developments and more severe restrictive measures.
The second scenario uses identical forecasts to those of the first scenario for the year 2020. The profile for 2021 is
assumed to be fairly comparable to Q1 2021 (cautious lifting of lockdown), but in Q2 2021, a stronger and faster third
wave is assumed, resulting in a more serious lockdown of about two months, versus a month in the central scenario.
This Scenario 2 would result in a much sharper decline in GDP in Q2, but also followed by a stronger rebound in Q3.
In this scenario, for 2021: there would be an average GDP increase expected at +3% vs. +4.6% in Scenario 1.
The third scenario is slightly more favourable than Scenario 1 and assumes a significantly stronger
recovery in 2021 (GDP growth in France of +7.1% due to faster control of the health situation).
The fourth scenario, the least likely, is characterised by a slightly stronger decline in activity in 2021 and
an additional shock, in France, that would involve renewed social tensions, blockades, and strikes.
In France, in this scenario, domestic demand will fall sharply in H1 2021. There is a persistent circulation of the virus. State
support measures will not be renewed in 2021 and, lastly, an increase in unemployment and bankruptcies is observed.
With no visibility and with excess capacity, there is a marked downward revision of investments.
Households remain very cautious with few major purchases.
There are also renewed social tensions and a freezing of the reform programme. Lastly, at the national level, there is a
downgrade of the credit rating by a notch.
In this scenario, in France, gradual recovery is postponed in 2021 (average increase of only +1.9% of GDP), with the
activity trend level weighed down by a higher increase in unemployment (12.5% in 2021 after 10% in 2020).
Furthermore, with regard to:
Support measures: Note that the risk parameter forecast process has been revised in 2020 to better reflect
the impact of government programmes in IFRS 9 forecasts. The effect of this revision is to mitigate the sudden
intensity of the crisis and the strength of the recovery, and to spread these over a longer period (3 years).
The variables relating to the interest rates level, and more generally all the variables linked to the capital
markets, have not been modified, because their forecasts already structurally include the effects of the
support policies.
Local and subsidiary scenarios: As noted above, sector complements established at the local level ("forward
looking local") by some Group entities can complement the centrally defined macroeconomic scenarios.
At the end of December 2020, including local forward looking scenarios, the share of Bucket 1/Bucket 2 provisions on
the one hand (provisioning for performing loans) and Bucket 3 provisions on the other hand (provisioning for proven
risks) represented 27% and 73% respectively as regards Crédit Agricole S.A.
At the end of December 2020, net additions to provisions for Bucket 1/Bucket 2 represented 32% of
Crédit Agricole S.A.’s annual cost of risk compared to 68% for the Bucket 3 share of proven risks and other provisions.
Sensitivity analysis of IFRS 9 provisions (Buckets 1 and 2 ECL amounts)
Scenario 1 was weighted at 55% for the calculation of IFRS ECL amounts for Q4-2020. By way of example, the 10-point
reduction in the weighting of scenario 1 in the calculations at Q4-2020 in favour of the more unfavourable Scenario 2,

Consolidated financial statements of Credit Agricole S.A. 31 December 2020
58
lead to a rise in the ECL stock under “forward looking central” of around 0.8% for Crédit Agricole S.A. However, such a
change in the weight would not necessarily have a significant impact due to “forward looking local” adjustments,
which could mitigate the effect.
2.1.5 Decision regarding the 2019 dividend
On 27 March 2020, the European Central Bank issued recommendations asking that the banks under its supervision not
pay dividends as long as the coronavirus crisis persists, and until “at least the beginning of October 2020”.
This deadline appeared to be incompatible with the French Commercial Code, which stipulates that an annual
dividend must be paid no later than 30 September.
Under these conditions, the Board of Directors of Crédit Agricole S.A., which was consulted in writing on 1 April 2020
pursuant to the legal provisions on the functioning of deliberative bodies during the COVID-19 epidemic, decided not
to propose to the General Meeting of 13 May 2020 the distribution of a dividend initially set at €0.70 per share for the
2019 financial year, and to allocate the entire profit for 2019 to a reserve account.
On 28 July 2020, the ECB extended its recommendation not to pay dividends until January 2021.
On 15 December 2020, the ECB changed its recommendations, asking all banks to consider not distributing cash
dividends and not repurchasing shares, or to limit such distributions, until 30 September 2021. Accordingly, in the event
of a distribution, dividends and share buybacks must remain below 15% of the cumulative distributable earnings for
financial years 2019 and 2020 and must not exceed 20 basis points of the CET1 ratio, whichever is lower. In addition,
banks planning to make distributions should contact their joint prudential supervisory team to determine whether the
level of distribution they are contemplating is prudent.
As at 31 December 2020, Crédit Agricole S.A. had not distributed any dividends for the 2019 financial year.
2.1.6 Insurance support scheme for professionals
In the context of the health and economic crisis related to COVID-19 and with the aim of supporting and helping
professionals through this crisis, the Crédit Agricole Group decided on 22 April 2020 to implement an unprecedented
extra-contractual support scheme for all of its policyholders who have taken out professional multi-risk insurance with
business interruption.
This insurance support scheme entails the payment of a sum corresponding to a flat-rate estimate of the loss of income
for the relevant economic sector during the period.
As at 31 December 2020, under this scheme, a sum of €237.5 million had been paid to the Group’s professional
policyholders impacting net banking income, of which:
€231.5 million was paid by the Crédit Agricole Group:
o €96.5 million by Pacifica;
o €96.5 million by the Regional Banks and LCL;
o €38.5 million by La Médicale de France.
€6 million outside the Group was paid by the general agents of La Médicale de France.
2.2 Main changes in the scope of consolidation
2.2.1 Acquisition of Sabadell Asset Management by Amundi
On 21 January 2020, Amundi and Banco Sabadell announced the signing of a 10-year strategic partnership for the
distribution of asset management products in the Banco Sabadell network in Spain.
The combination of the strong regional presence of the Banco Sabadell network and Amundi’s comprehensive range
of savings products and solutions creates significant potential for growth in Spain between the two partners.
Within this framework, Amundi acquires the entire share capital of Sabadell Asset Management, Banco Sabadell's
asset management subsidiary, with €22 billion in assets under management at 31/12/2019.
On 30 June 2020, all regulatory authorisations required to complete this transaction had been obtained, and Amundi
acquired the entire share capital of Sabadell Asset Management for a cash purchase price of €430 million. An earn-
out of up to €30 million could be payable by 2024.

Consolidated financial statements of Credit Agricole S.A. 31 December 2020
59
This acquisition, financed exclusively by Amundi’s excess share capital, generated the recognition of €335 million in
goodwill.
In accordance with IFRS 3R, the goodwill presented in this note is a preliminary measurement and may be revalued in
the coming year.
2.2.2 Acquisition of additional Menafinance shares by Crédit Agricole Consumer Finance
Following the ten-year renewal of its partnership with Groupe FNAC DARTY Group in March 2020, Crédit Agricole
Consumer Finance took control of Menafinance, the entity that provides consumer credit to Darty customers. This entity
was previously under the joint control of the two partners and was equity-accounted by Crédit Agricole S.A.
As a result, on 30 June 2020, Crédit Agricole Consumer Finance acquired the 50% of Menafinance’s share capital held
by Groupe FNAC DARTY, i.e. 185,358 Menafinance shares for a total amount of €29.3 million.
Since the transaction, Menafinance has been wholly owned by Crédit Agricole Consumer Finance and is fully
consolidated by Crédit Agricole S.A.
At 30 June 2020, in accordance with IFRS 3R, this additional acquisition had a positive impact of €12.6 million on profit
Group share for the revaluation of shares previously held. In addition, it generated the recognition of goodwill of €25.2
million.
On 1 October 2020, Menafinance was absorbed by Crédit Agricole Consumer Finance.
2.2.3 Full disposal of CACIB’s remaining stake in the share capital of BSF
On 28 September 2020, Crédit Agricole Corporate & Investment Bank (Crédit Agricole CIB) announced the disposal of
its remaining 4% stake in the capital of Banque Saudi Fransi (BSF). The buyers were two Saudi government-related
institutional investors. They acquired the stake held by Crédit Agricole CIB in BSF at a price of 30.00 Saudi Riyals (SAR)
per share, for a total consideration of SAR 1.45 billion equivalent to around €332 million.
BSF shares were accounted in Crédit Agricole CIB balance sheet as Financial assets at fair value through Other
Comprehensive Income; thus the transaction will have no impact on P&L.
At 31 December 2020, following the sale, Crédit Agricole CIB no longer holds any interest in the share capital of Banque
Saudi Fransi (BSF).
2.2.4 Disposal plans (IFRS 5)
2.2.4.1 CRÉDIT AGRICOLE BANK ROMANIA
Crédit Agricole Bank Romania is a fully-owned subsidiary of Crédit Agricole S.A.
During 2019, Crédit Agricole S.A. initiated a process to put Crédit Agricole Bank Romania up for sale.
Crédit Agricole Bank Romania’s assets and liabilities have thus been reclassified under IFRS5 in the consolidated
financial statements at 31 December 2019.
In December 2020, negotiations with the Romanian bank Vista Bank Romania S.A. led to the signing of an agreement
to sell Crédit Agricole Bank Romania to Vista Bank Romania S.A. on 4 January 2021. The completion of this transaction,
which is subject to the approval of the competent Romanian regulatory authorities (the National Bank of Romania
and the National Competition Council), is expected to take place in the first half of 2021.
Crédit Agricole Bank Romania is therefore maintained pursuant to IFRS 5 in the Crédit Agricole S.A. consolidated
financial statements at 31 December 2020 for an amount of €521 million in “Non-current assets held for sale” and for
an amount of €501 million in “Liabilities associated with non-current assets held for sale”.
The net income is classified under “Net income from operations discontinued or being sold” for an amount of -€7.5
million.
2.2.4.2 CRÉDIT AGRICOLE CONSUMER FINANCE NEDERLAND (CACF NL)
Crédit Agricole Consumer Finance Nederland is a wholly owned subsidiary of Crédit Agricole S.A.
In October 2019, the Executive Management of Crédit Agricole S.A. and CACF began the process of putting CACF NL
up for sale.

Consolidated financial statements of Credit Agricole S.A. 31 December 2020
60
A programme to actively search for a potential buyer was launched, leading to the receipt of several offers in the
fourth quarter of 2020. The Group decided to enter into exclusive negotiations with one of them.
Therefore, pursuant to IFRS 5, the assets and liabilities of Crédit Agricole Consumer Finance Nederland are classified as
at 31 December 2020 in the balance sheet under “Non-current assets held for sale” for the sum of €1,704 million and
under “Liabilities associated with non-current assets held for sale” for the sum of €477 million. The net income is classified
under “Net income from operations discontinued or being sold” for an amount of -€189.8 million.
The impact on the income statement includes the impact of the reclassification as Non-current assets held for sale of
the share of goodwill of the CGU to which CACF NL is attached, as well as the estimated loss on that transaction.
2.2.4.3 CRÉDIT AGRICOLE CIB (MIAMI) ET CA INDOSUEZ WEALTH (BRAZIL) S.A. DTVM
Crédit Agricole CIB (Miami) is a branch of Crédit Agricole CIB (CACIB), which is in turn 97.8% controlled by Crédit
Agricole S.A.
CA Indosuez Wealth (Brazil) S.A. DTVM is a subsidiary 97.8% controlled by Crédit Agricole S.A. The shares of this company
are wholly owned by Crédit Agricole CIB (CACIB), which in turn is 97.8% controlled by Crédit Agricole S.A.
In 2020, the Executive Management of Crédit Agricole S.A. and CACIB began the process of putting the entity CA
Indosuez Wealth (Brazil) S.A. DTVM and the goodwill of the Crédit Agricole CIB (Miami) branch of Crédit Agricole CIB
(CACIB) up for sale.
A programme to actively search for a potential buyer was launched, leading to the receipt in the fourth quarter of
2020 of several binding offers, leading to negotiations of contractual documentation.
Therefore, pursuant to IFRS 5, the assets and liabilities of Crédit Agricole CIB (Miami) and CA Indosuez Wealth (Brazil)
are reclassified as at 31 December 2020 in the balance sheet under “Non-current assets held for sale” for the sum of
€503.8 million and under “Liabilities associated with non-current assets held for sale” for the sum of €450.9 million.
The impact on the income statement, amounting to -€23.5 million euros, is classified under "Net income after tax on
activities discontinued or in the process of being sold”.
2.2.5 Creation of a joint venture between Amundi and BOC Wealth Management
Following the 20 December 2019 approval of the China Banking and Insurance Regulatory Commission, Amundi, a
subsidiary of Crédit Agricole S.A., and BOC Wealth Management, a subsidiary of Bank of China, obtained a licence
on 30 September 2020 for their joint venture in China, Amundi BOC Wealth Management Company Limited.
The new company, registered in the Lingang Free Zone in Shanghai, is owned 55% by Amundi and 45% by BOC Wealth
Management. It is the first management company with an international majority shareholder to be able to develop
and market an offer in China under “asset management” product rules.
The savings solutions offered by the joint venture will benefit from Amundi’s expertise in asset allocation and its rigorous
risk management processes and tools and from Bank Of China’s support in brand strategy and distribution in branches
and online.
Amundi BOC Wealth Management Company Limited is under the exclusive control of Amundi and is therefore fully
consolidated (FC) by Crédit Agricole S.A.
2.3 Benchmark bond issue on the Panda market
On 11 September 2020, following its inaugural Panda Bond issuance in December 2019, Crédit Agricole S.A. has
successfully issued its second CNY 1 billion (equivalent to €125 million) senior preferred bond with a maturity of 3 years
and a 3.5% fixed rate. Crédit Agricole S.A. thus becomes a repeat issuer in the fast paced developing Panda Bond
market, with the view to fund its activities in China and further diversify its long-term funding.
The proceeds will be used to finance its wholly-owned banking subsidiary Crédit Agricole CIB (China) Limited in order
to support its international client base through financing and capital market transactions.
This successful benchmark issuance was bought by Chinese and International institutional investors on the Chinese
bond market and the Hong Kong Bond Connect exchange. The order book was 1.64 times oversubscribed, illustrating
the investors’ continuous confidence in Crédit Agricole S.A. and recognition to its CNY 5 billion bonds issuance
programme, the foremost one issued by a French bank and a European G-SIB (global systemically important banks)
financial institution.
Crédit Agricole S.A., the issuer, as the Central Body and member of the Crédit Agricole Network, and its Panda Bonds
have obtained a domestic rating of AAA from China Chengxin International Credit Rating.

Consolidated financial statements of Credit Agricole S.A. 31 December 2020
61
2.4 Social bond issuance
In the context of the current crisis, which is severely affecting the most fragile, the Crédit Agricole S.A. is resolutely
pursuing its mutualist commitment to promote development for all. On 2 December 2020, Crédit Agricole S.A.
successfully carried out its first social bond issuance for €1 billion.
The framework of these social bonds issuances aims to reduce social inequalities by revitalising the most vulnerable
territories and by promoting employment, solidarity initiatives and access to essential goods and services.
A key issuer in the green bond market, Crédit Agricole S.A. is today naturally broadening the field of its sustainable
finance initiatives with this inaugural social bond issue.
This theme-based issuance contributes to the Group’s ambition, included in its Societal Project, to pursue its mutualist
commitment to promote development for all. This issuance will be focused in particular on financing professionals and
SME customers of the Regional Banks and LCL in territories where the unemployment rate is higher than the national
average.
2.5 New definition of default
At 31 December 2020, Crédit Agricole S.A. had implemented the new rules relating to the application of the definition
of default (EBA Guidelines (EBA/GL/2016/7) and thresholds defined by the European Union (Article 1 of Regulation (EU)
2018/1845 ECB of 21 November 2018).
This change in defaults is classified as a change in accounting estimates. Its impact amounts to -€56 million and is
recognised as an expense in the income statement under “Cost of risk”.
2.6 “Switch” guarantee mechanism
The “Switch” guarantee mechanism represents a transfer to the Regional Banks of a share of the regulatory
requirements that apply to Crédit Agricole S.A. for its insurance activities in return for a fixed remuneration from the
Regional Banks.
2.6.1 Unwinding of 35% of the “Switch” guarantee mechanism
On 2 March 2020, Crédit Agricole S.A. unwound 35% of the “Switch” guarantee mechanism set up between the
Regional Banks and Crédit Agricole S.A.
The partial unwinding of this intra-group transaction strengthens Crédit Agricole S.A.’s earning power with an accretive
impact of €70 million in 2020. It is in line with the Medium-Term Plan’s objective of unwinding 50% of the switch by 2022.
For Crédit Agricole S.A., this transaction resulted in a 35% reduction in commitments given (€3.2 billion) and a 35%
reduction in the security deposit received from the Regional banks (approximately €1 billion).
This transaction has no impact on the results nor on the solvency ratios of Crédit Agricole Group.
2.6.2 Triggering of the “Switch” guarantee mechanism
The “Switch” guarantee mechanism hedges the Equity-Accounted Value of Crédit Agricole Assurances. It is activated
in the event of a decrease in its value.
If the mechanism is activated, the Regional Banks will be required to pay Crédit Agricole S.A. the proceeds of the half-
yearly reduction in the equity-accounted value adjusted by the coverage ratio, which has stood at 44.51% since 2
March 2020, the date on which the 35% guarantee was unwound.
At 30 June 2020, as a result of the tensions in the equity and bond markets in the first half of 2020, the Crédit Agricole
Assurances adjusted estimated equity-accounted value had fallen by €147 million in the first half of 2020. It triggered
the guarantee mechanism in the amount of €65.4 million. In the Crédit Agricole S.A. financial statements, this resulted
in the recognition in the income statement of income under Cost of risk of €65.4 million.
At 30 September 2020, the Crédit Agricole Assurances adjusted final equity-accounted value for the first half of 2020
was determined. As a result, the indemnity received by Crédit Agricole S.A. from the Regional Banks’ security deposit,
which was immediately reconstituted by a payment of funds, was adjusted.
At 30 September 2020, €37.6 million was recognised in the Crédit Agricole S.A. financial statements as income under
cost of risk for the triggering of the Switch guarantee.

Consolidated financial statements of Credit Agricole S.A. 31 December 2020
62
2.6.3 “Switch” guarantee mechanism - Claw-back
At 31 December 2020, the increase in the Equity-Accounted Value adjusted for Crédit Agricole Assurances' distributions
in the second half of 2020 offset the decline observed in June 2020.
This increase in equity-accounted value resulted in the implementation of a full claw-back of the guarantee in the
fourth quarter of 2020, leading to the recognition of an accrued expense of €37.6 million euros in the Crédit Agricole
S.A. financial statements.
As a result, for the whole of 2020, the Switch guarantee was neutral in the Crédit Agricole S.A. financial statements.
2.7 Depreciation of goodwill on CA Italia
As part of the preparing the publication of its consolidated financial statements, Crédit Agricole S.A. conducted the
annual valuation tests of the goodwill recorded in its balance sheet during the fourth quarter of 2020. In accordance
with IFRS accounting standards, these tests are based on a comparison between the value recorded in the assets of
the consolidated balance sheet of Crédit Agricole S.A. and the value in use. The calculation of the value in use is
based on discounting the future cash flows.
Due to an anticipated prolonged period of very low interest rates, which is weighing on Crédit Agricole Italia's interest
margins and therefore on its value in use for Crédit Agricole S.A. and Crédit Agricole Group, on 15 December 2020,
Crédit Agricole S.A.'s Board of Directors decided to impair the goodwill carried on Crédit Agricole Italia. This non-
deductible impairment has an impact on net income Group share of €778 million in the consolidated financial
statements for the fourth quarter of 2020 of Crédit Agricole S.A.
This charge does not affect the solvency of Crédit Agricole S.A., as the goodwill has already been fully deducted from
the prudential capital, nor its liquidity.
2.8 Capital increase reserved for employees
The capital increase of Crédit Agricole S.A. reserved for employees, with the subscription period running from 12 to 25
November 2020, was completed definitively on 22 December 2020. 47,113 Crédit Agricole Group employees, in France
and 17 other countries, subscribed for a total amount of €162.9 million.
The proposed investment scheme was a standard offer with a subscription price including a 30% rebate on the share
price. The issue and delivery of the new shares to employees took place on 22 December 2020.
This capital increase created 31,999,928 new shares, thereby bringing the total number of shares comprising the share
capital of Crédit Agricole S.A. to 2,916,688,640.
2.9 Voluntary public cash tender offer by Crédit Agricole Italia for all shares of Credito Valtellinese
On 23 November 2020, Crédit Agricole Italia S.p.A. (Crédit Agricole Italia), a 75.6%-owned subsidiary of Crédit Agricole
S.A., launched a voluntary public all-cash tender offer (the “Offer”) for all ordinary shares of Credito Valtellinese S.p.A.
(Credito Valtellinese).
The acquisition of Credito Valtellinese will strengthen Crédit Agricole competitive positioning in Italy, its second
domestic market, thus confirming our continued and longstanding commitment in supporting our clients and local
communities in Italy.
The Offer price equals to € 10.50 for each Credito Valtellinese’s share. This corresponds to a total investment of €737mm
by Credit Agricole Italia to acquire 100% of Credito Valtellinese’s shares.
In the context of the Offer, Crédit Agricole Assurances (a subsidiary of Crédit Agricole S.A.) will sell to Crédit Agricole
Italia its stake in Credito Valtellinese, equal to 9.8% of the share capital. The Offer is conditional upon Crédit Agricole
Italia’s acquisition of at least 66.67% of the share capital with voting rights of Credito Valtellinese. In addition, Crédit
Agricole Italia retains the discretionary right to waive the above condition if at least 50% of the share capital with voting
rights of Credito Valtellinese +1 share is acquired.
2.10 Cheque Image Exchange dispute
In its judgment of 21 December 2017, the Paris Court of Appeal upheld the decision of the French Competition
Authority (ADLC), which in 2010 had fined the major French banks for colluding to fix the price and terms of clearing
cheques.

Consolidated financial statements of Credit Agricole S.A. 31 December 2020
63
Just as the other banks party to this procedure, the Crédit Agricole Group has filed an appeal with France’s Supreme
Court (Cour de cassation).
The Supreme Court ruled in favour of the banks in the Cheque Image Exchange case on 29 January 2020 and referred
the case back to the Paris Court of Appeal, with a change in the composition of the Court.
This decision returns the case and the parties to their status before the Court of Appeal’s decision of 21 December
2017. The banks are therefore once again subject to the French Competition Authority’s unfavourable decision of 20
September 2010.
In practice, as a result of the French Supreme Court’s decision, Crédit Agricole S.A. will be required to pay the French
State Treasury the difference between the fine imposed by the French Competition Authority in September 2010 (€82.9
million) and the reduced fine imposed by the Paris Court of Appeal in December 2017 (€76.6 million), i.e. €6.4 million.
On 7 April 2020, the sum of €6.4 million was paid to the French State Treasury.
Based on the same principle as the fine paid in December 2017, this additional charge is shared equally between
Crédit Agricole S.A. and the Regional Banks and is recognised in the consolidated financial statements.

Consolidated financial statements of Credit Agricole S.A. 31 December 2020
64
NOTE 3 Financial management, risk exposure and hedging policy
Crédit Agricole S.A.’s Financial Management department is responsible for organising financial flows within Crédit
Agricole S.A., defining and implementing refinancing rules, asset and liability management, and managing regulatory
prudential ratios. It sets out the principles and ensures a cohesive financial management system throughout the Group.
The Group’s management of banking risks is handled by the Group Risk Management and Permanent Controls
department. This department reports to the Chief Executive Officer of Crédit Agricole S.A. and its task is to control
credit, financial and operational risks.
A description of these processes and commentary now appear in the chapter on “Risk factors” in the management
report, as allowed by IFRS 7. Nonetheless, the accounting breakdowns are still presented in the financial statements.
3.1 Credit risk
3.1.1 CHANGE IN CARRYING AMOUNTS AND VALUE ADJUSTMENTS FOR LOSSES DURING THE PERIOD
Value adjustments for losses correspond to the impairment of assets and to provisions for off-balance sheet
commitments recognised in net income (Cost of risk) relating to credit risk.
The following tables present a reconciliation of the opening and closing balances of value adjustments for losses
recognised under Cost of risk and associated carrying amounts, by accounting category and type of instrument.

Consolidated financial statements of Credit Agricole S.A. 31 December 2020
65
FINANCIAL ASSETS AT AMORTISED COST: DEBT SECURITIES
Performing assets
Assets subject to 12-month ECL (Bucket 1) Assets subject to lifetime ECL (Bucket 2)
Credit-impaired assets (Bucket 3) Total
(in millions of euros) Gross carrying
amount Loss allowance
Gross carrying
amount Loss allowance
Gross carrying
amount Loss allowance
Gross carrying amount
(a) Loss allowance (b)
Net carrying amount (a)
+ (b)
Balance at 31 december 2019 72,170 (27) 380 (12) 23 (15) 72,572 (53) 72,519
Transfers between buckets during the period (18) ‑ 18 ‑ ‑ ‑ ‑ ‑
Transfers from Bucket 1 to Bucket 2 (20) ‑ 20 ‑ ‑ ‑ ‑
Return from Bucket 2 to Bucket 1 2 ‑ (2) ‑ ‑ ‑ ‑
Transfers to Bucket 3 ¹ ‑ ‑ ‑ ‑ ‑ ‑ ‑ ‑
Return from Bucket 3 to Bucket 2 / Bucket 1 ‑ ‑ ‑ ‑ ‑ ‑ ‑ ‑
Total after transfers 72,152 (27) 398 (12) 23 (15) 72,572 (53) 72,519
Changes in gross carrying amounts and loss allowances 11,403 (8) (36) 8 21 (25) 11,389 (25)
New financial production : purchase, granting, origination,… ² 45,500 (29) 324 (3) ‑ 45,825 (32)
Derecognition : disposal, repayment, maturity... (32,169) 20 (358) 10 ‑ ‑ (32,527) 30
Write-offs ‑ ‑ ‑
Changes of cash flows resulting in restructuring due to financial difficulties ‑ 1 ‑ ‑ ‑ ‑ ‑ 1
Changes in models' credit risk parameters during the period ‑ 1 (26) ‑ (25)
Changes in model / methodology ‑ ‑ ‑ ‑ ‑
Changes in scope ‑ ‑ ‑ ‑ ‑ ‑ ‑ ‑
Other ⁴ (1,928) 1 (2) ‑ 21 1 (1,909) 2
Total 83,555 (35) 362 (4) 44 (40) 83,961 (78) 83,883
Changes in carrying amount due to specific accounting assessment methods (with no significant
impact on loss allowance) ³ 910 ‑ ‑ 910
Balance at 31 december 2020 84,465 (35) 362 (4) 44 (40) 84,871 (78) 84,794
Contractual amount outstanding of financial assets written off during the period, that are still subject to
enforcement measures ‑ ‑ ‑ ‑
¹ Transfers to Bucket 3 correspond to outstanding amounts initially classified as Bucket 1 which, during the year, were downgraded directly to Bucket 3, or to Bucket 2 and later to Bucket 3.
² Originations in Bucket 2 could include some originated loans in Bucket 1 reclassified in Bucket 2 during the period.
³ Includes the impacts of fair value adjustments of micro-hedged instruments, the impacts relating to the use of the EIR method (notably the amortisation of premiums/discounts), the impacts of the accretion of discounts on restructured loans (recovered as revenue over the remaining term of the asset), the changes in related
receivables and in the currency impact.
4 The items in the “Others” line are mainly translation adjustments and reclassifications under IFRS 5

Consolidated financial statements of Credit Agricole S.A. 31 December 2020
66
FINANCIAL ASSETS AT AMORTISED COST: LOANS AND RECEIVABLES DUE FROM CREDIT INSTITUTIONS (EXCLUDING CRÉDIT AGRICOLE INTERNAL TRANSACTIONS)
Performing assets
Assets subject to 12-month ECL (Bucket 1) Assets subject to lifetime ECL (Bucket 2)
Credit-impaired assets (Bucket 3) Total
(in millions of euros) Gross carrying
amount Loss allowance
Gross carrying
amount Loss allowance
Gross carrying
amount Loss allowance
Gross carrying amount
(a) Loss allowance (b)
Net carrying amount
(a) + (b)
Balance at 31 december 2019 103,931 (27) 26 ‑ 505 (389) 104,464 (416) 104,048
Transfers between buckets during the period (61) ‑ 62 ‑ ‑ ‑ ‑ ‑
Transfers from Bucket 1 to Bucket 2 (63) ‑ 64 ‑ ‑ ‑
Return from Bucket 2 to Bucket 1 2 ‑ (2) ‑ ‑ ‑ ‑ ‑
Transfers to Bucket 3 ¹ ‑ ‑ ‑ ‑ ‑ ‑ ‑ ‑
Return from Bucket 3 to Bucket 2 / Bucket 1 ‑ ‑ ‑ ‑ ‑ ‑ ‑ ‑
Total after transfers 103,870 (27) 88 ‑ 505 (389) 104,464 (416) 104,048
Changes in gross carrying amounts and loss allowances (12,532) 2 (27) ‑ (100) 33 (12,659) 35
New financial production : purchase, granting, origination,… ² 46,595 (21) 9 ‑ 46,604 (21)
Derecognition : disposal, repayment, maturity... (58,216) 11 (34) ‑ (66) 5 (58,316) 16
Write-offs (3) 3 (3) 3
Changes of cash flows resulting in restructuring due to financial difficulties ‑ (4) ‑ ‑ ‑ ‑ ‑ (4)
Changes in models' credit risk parameters during the period 10 ‑ (1) ‑ 9
Changes in model / methodology ‑ ‑ ‑ ‑ ‑
Changes in scope (180) ‑ ‑ ‑ ‑ ‑ (180) ‑
Other ⁴ (731) 6 (2) ‑ (31) 26 (764) 32
Total 91,338 (25) 61 ‑ 405 (356) 91,805 (381) 91,424
Changes in carrying amount due to specific accounting assessment methods (with no significant
impact on loss allowance) ³ 1,364 ‑ 2 1,366
Balance at 31 december 2020 92,702 (25) 61 ‑ 407 (356) 93,171 (381) 92,790
Contractual amount outstanding of financial assets written off during the period, that are still subject
to enforcement measures ‑ ‑ ‑ ‑
¹ Transfers to Bucket 3 correspond to outstanding amounts initially classified as Bucket 1 which, during the year, were downgraded directly to Bucket 3, or to Bucket 2 and later to Bucket 3.
² Originations in Bucket 2 could include some originated loans in Bucket 1 reclassified in Bucket 2 during the period.
³ Includes the impacts of fair value adjustments of micro-hedged instruments, the impacts relating to the use of the EIR method (notably the amortisation of premiums/discounts), the impacts of the accretion of discounts on restructured loans (recovered as revenue over the remaining term of the asset), the changes in
related receivables and in the currency impact.
4 The items in the “Others” line are mainly translation adjustments and reclassifications under IFRS 5

Consolidated financial statements of Credit Agricole S.A. 31 December 2020
67
FINANCIAL ASSETS AT AMORTISED COST: LOANS AND RECEIVABLES DUE FROM CUSTOMERS
Performing assets
Assets subject to 12-month ECL (Bucket 1) Assets subject to lifetime ECL (Bucket 2)
Credit-impaired assets (Bucket 3) Total
(in millions of euros)
Gross carrying
amount Loss allowance
Gross carrying
amount Loss allowance
Gross carrying
amount Loss allowance
Gross carrying
amount (a) Loss allowance (b)
Net carrying amount
(a) + (b)
Balance at 31 december 2019 360,437 (743) 30,825 (1,277) 13,130 (7,192) 404,392 (9,212) 395,180
Transfers between buckets during the period (13,335) (20) 9,828 22 3,506 (1,273) ‑ (1,270)
Transfers from Bucket 1 to Bucket 2 (22,199) 59 22,199 (478) ‑ (418)
Return from Bucket 2 to Bucket 1 10,346 (91) (10,346) 287 ‑ ‑ ‑ 196
Transfers to Bucket 3 ¹ (1,582) 13 (2,372) 238 3,953 (1,376) ‑ (1,125)
Return from Bucket 3 to Bucket 2 / Bucket 1 100 (1) 347 (25) (447) 103 ‑ 77
Total after transfers 347,102 (765) 40,653 (1,252) 16,636 (8,465) 404,392 (10,482) 393,911
Changes in gross carrying amounts and loss allowances 16,359 (154) (1,440) (472) (4,044) 1,528 10,875 902
New financial production : purchase, granting, origination,… ² ⁴ 204,892 (657) 11,317 (796) 216,209 (1,453)
Derecognition : disposal, repayment, maturity... (181,558) 482 (11,639) 741 (1,716) 431 (194,913) 1,655
Write-offs (2,012) 1,879 (2,012) 1,879
Changes of cash flows resulting in restructuring due to financial difficulties (1) ‑ (10) 3 (16) 4 (27) 6
Changes in models' credit risk parameters during the period ⁶ (20) (497) (1,049) ‑ (1,566)
Changes in model / methodology ‑ 17 ‑ ‑ 17
Changes in scope 272 (3) 28 (3) 40 (31) 340 (37)
Other ⁷ (7,246) 44 (1,136) 63 (340) 294 (8,722) 401
Total 363,461 (919) 39,213 (1,724) 12,592 (6,937) 415,267 (9,580) 405,686
Changes in carrying amount due to specific accounting assessment methods (with no significant
impact on loss allowance) ³ (565) 3 812 250
Balance at 31 december 2020 ⁵ 362,896 (919) 39,216 (1,724) 13,404 (6,937) 415,517 (9,580) 405,937
Contractual amount outstanding of financial assets written off during the period, that are still
subject to enforcement measures ‑ ‑ ‑ ‑
¹ Transfers to Bucket 3 correspond to outstanding amounts initially classified as Bucket 1 which, during the year, were downgraded directly to Bucket 3, or to Bucket 2 and later to Bucket 3.
² Originations in Bucket 2 could include some originated loans in Bucket 1 reclassified in Bucket 2 during the period.
³ Includes the impacts of fair value adjustments of micro-hedged instruments, the impacts relating to the use of the EIR method (notably the amortisation of premiums/discounts), the impacts of the accretion of discounts on restructured loans (recovered as revenue over the remaining term of the asset), the changes in
accrued interests.
⁴ At 31 December 2020, the amount of French state-guaranteed loans (SGL) granted to customers of the Group as part of measures to support the economy in the wake of the COVID-19 health crisis amounted to €9.5 billion.
⁵ Outstanding loans to customers in France with non-contractual due date postponements amounted to €16.6 billion in 2020, including €0.9 billion still outstanding as at 31 December 2020 at Crédit Agricole S.A. level.
⁶ Concerning Bucket 3 - this line corresponds to the change in the assessment of the credit risk on files already in default.
7 The items in the “Others” line are mainly translation adjustments and reclassifications under IFRS 5

Consolidated financial statements of Credit Agricole S.A. 31 December 2020
68
FINANCIAL ASSETS AT FAIR VALUE THROUGH OTHER COMPREHENSIVE INCOME: DEBT SECURITIES
Performing assets
Assets subject to 12-month ECL (Bucket 1) Assets subject to lifetime ECL (Bucket 2) Credit-impaired assets (Bucket 3) Total
(in millions of euros) Carrying amount Loss allowance Carrying amount Loss allowance Carrying amount Loss allowance Carrying amount Loss allowance
Balance at 31 december 2019 256,189 (135) 2,614 (34) ‑ (4) 258,803 (173)
Transfers between buckets during the period (350) ‑ 346 (5) (4) (4)
Transfers from Bucket 1 to Bucket 2 (357) ‑ 353 (5) (4) (4)
Return from Bucket 2 to Bucket 1 7 ‑ (7) ‑ ‑ ‑ ‑ ‑
Transfers to Bucket 3 ¹ ‑ ‑ ‑ ‑ ‑ ‑ ‑ ‑
Return from Bucket 3 to Bucket 2 / Bucket 1 ‑ ‑ ‑ ‑ ‑ ‑ ‑ ‑
Total after transfers 255,839 (135) 2,960 (39) ‑ (4) 258,799 (177)
Changes in gross carrying amounts and loss allowances 6,692 43 (598) ‑ ‑ ‑ 6,094 42
Fair value revaluation during the period 3,605 (34) ‑ 3,572
New financial production : purchase, granting, origination,… ² 40,660 (29) 8,353 (9) 49,013 (38)
Derecognition : disposal, repayment, maturity... (37,171) 29 (8,869) 8 ‑ ‑ (46,040) 36
Write-offs ‑ ‑ ‑ ‑
Changes of cash flows resulting in restructuring due to financial difficulties ‑ ‑ 4 4 ‑ ‑ 3 3
Changes in models' credit risk parameters during the period 43 (3) ‑ ‑ 39
Changes in model / methodology ‑ ‑ ‑ ‑ ‑
Changes in scope 7 ‑ ‑ ‑ ‑ ‑ 7 ‑
Other ⁴ (409) ‑ (52) ‑ ‑ ‑ (461) 2
Total 262,531 (92) 2,362 (39) ‑ (4) 264,893 (135)
Changes in carrying amount due to specific accounting assessment methods (with no significant impact on
loss allowance) ³ (1,021) (16) ‑ (1,037)
Balance at 31 december 2020 261,510 (92) 2,346 (39) ‑ (4) 263,856 (135)
Contractual amount outstanding of financial assets written off during the period, that are still subject to
enforcement measures ‑ ‑ ‑ ‑
¹ Transfers to Bucket 3 correspond to outstanding amounts initially classified as Bucket 1 which, during the year, were downgraded directly to Bucket 3, or to Bucket 2 and later to Bucket 3.
² Originations in Bucket 2 could include some originated loans in Bucket 1 reclassified in Bucket 2 during the period.
³ Includes the impacts of the use of the EIR method (notably the amortisation of premiums/discounts)
4 The items in the “Others” line are mainly translation adjustments and reclassifications under IFRS 5

Consolidated financial statements of Credit Agricole S.A. 31 December 2020
69
FINANCING COMMITMENTS (EXCLUDING CRÉDIT AGRICOLE INTERNAL OPERATIONS)
Performing commitments
Commitments subject to 12-month ECL
(Bucket 1)
Commitments subject to lifetime ECL
(Bucket 2)
Provisioned commitments (Bucket 3) Total
(in millions of euros)
Amount of
commitment Loss allowance
Amount of
commitment Loss allowance
Amount of
commitment Loss allowance
Amount of commitment
(a) Loss allowance (b)
Net amount of
commitment (a) + (b)
Balance at 31 december 2019 148,020 (169) 5,097 (181) 481 (58) 153,598 (409) 153,189
Transfers between buckets during the period (3,764) 7 3,687 (52) 78 (27) ‑ (71)
Transfers from Bucket 1 to Bucket 2 (4,745) 19 4,745 (89) ‑ (69)
Return from Bucket 2 to Bucket 1 1,020 (12) (1,020) 32 ‑ 20
Transfers to Bucket 3 ¹ (61) ‑ (62) 5 123 (28) ‑ (23)
Return from Bucket 3 to Bucket 2 / Bucket 1 22 ‑ 24 ‑ (45) 1 ‑ 1
Total after transfers 144,256 (162) 8,784 (233) 559 (85) 153,598 (480) 153,117
Changes in commitments and loss allowances 11,216 (19) (684) 13 (242) 27 10,291 21
New commitments given ² 105,568 (322) 2,981 (332) 108,549 (655)
End of commitments (96,887) 294 (3,343) 375 (344) 44 (100,573) 714
Write-offs (1) 2 (1) 2
Changes of cash flows resulting in restructuring due to financial difficulties ‑ ‑ ‑ ‑ ‑ ‑ ‑ ‑
Changes in models' credit risk parameters during the period 9 (42) (20) (53)
Changes in model / methodology ‑ ‑ ‑ ‑
Changes in scope 604 ‑ 2 ‑ ‑ ‑ 606 ‑
Other ⁴ 1,931 ‑ (324) 12 103 1 1,710 13
Balance at 31 december 2020 155,472 (181) 8,100 (220) 317 (58) 163,889 (459) 163,430
¹ Transfers to Bucket 3 correspond to outstanding amounts initially classified as Bucket 1 which, during the year, were downgraded directly to Bucket 3, or to Bucket 2 and later to Bucket 3.
² New commitments given in Bucket 2 could include some originations in Bucket 1 reclassified in Bucket 2 during the period.
4 The items in the “Others” line are mainly translation adjustments and reclassifications under IFRS 5

Consolidated financial statements of Credit Agricole S.A. 31 December 2020
70
GUARANTEE COMMITMENTS (EXCLUDING CRÉDIT AGRICOLE INTERNAL OPERATIONS)
Performing commitments
Commitments subject to 12-month ECL
(Bucket 1)
Commitments subject to lifetime ECL
(Bucket 2)
Provisioned commitments (Bucket 3) Total
(in millions of euros)
Amount of
commitment Loss allowance
Amount of
commitment Loss allowance
Amount of
commitment Loss allowance
Amount of commitment
(a) Loss allowance (b)
Net amount of
commitment (a) + (b)
Balance at 31 december 2019 80,129 (48) 4,578 (112) 3,094 (339) 87,800 (498) 87,304
Transfers between buckets during the period (771) (10) 691 9 80 (10) ‑ (11)
Transfers from Bucket 1 to Bucket 2 (1,223) 3 1,223 (9) ‑ (6)
Return from Bucket 2 to Bucket 1 495 (13) (495) 17 ‑ 4
Transfers to Bucket 3 ¹ (107) ‑ (38) 1 145 (15) ‑ (14)
Return from Bucket 3 to Bucket 2 / Bucket 1 64 ‑ 1 ‑ (65) 5 ‑ 5
Total after transfers 79,358 (58) 5,269 (105) 3,174 (349) 87,801 (512) 87,289
Changes in commitments and loss allowances (1,406) (5) (584) (22) (76) 88 (2,066) 61
New commitments given ² 48,164 (96) 3,298 (97) 51,462 (193)
End of commitments (44,708) 85 (3,717) 75 (737) 170 (49,162) 330
Write-offs ‑ ‑ ‑ ‑ (14) 14 (14) 14
Changes of cash flows resulting in restructuring due to financial difficulties ‑ ‑ ‑ ‑ ‑ ‑ ‑ ‑
Changes in models' credit risk parameters during the period 6 (3) (109) ‑ (106)
Changes in model / methodology ‑ ‑ ‑ ‑ ‑
Changes in scope ‑ ‑ ‑ ‑ ‑ ‑
Other ³ (4,862) ‑ (165) 3 675 13 (4,352) 16
Balance at 31 december 2020 77,952 (63) 4,685 (127) 3,098 (261) 85,735 (451) 85,284
¹ Transfers to Bucket 3 correspond to outstanding amounts initially classified as Bucket 1 which, during the year, were downgraded directly to Bucket 3, or to Bucket 2 and later to Bucket 3.
² New commitments given in Bucket 2 could include some originations in Bucket 1 reclassified in Bucket 2 during the period.
3 The items in the “Others” line are mainly translation adjustments and reclassifications under IFRS 5

Consolidated financial statements of Credit Agricole S.A. 31 December 2020
71
3.1.2 MAXIMUM EXPOSURE TO CREDIT RISK
An entity’s maximum exposure to credit risk represents the carrying amount, net of any impairment loss recognised and without taking account of any collateral held or other credit enhancements (e.g.
netting agreements that do not qualify for offset in accordance with IAS 32).
The tables below show the maximum exposures as well as the amount of collateral held and other credit enhancements allowing this exposure to be reduced.
Impaired assets at the end of the reporting period constitute the impaired assets (Bucket 3).
FINANCIAL ASSETS NOT SUBJECT TO IMPAIRMENT REQUIREMENTS (ACCOUNTED AT FAIR VALUE THROUGH PROFIT OR LOSS)
(in millions of euros)
31/12/2020
Maximum
exposure to
credit risk
Credit risk mitigation
Collateral held as security Other credit enhancement
Financial instruments
provided as collateral Mortgages Pledged
securities
Financial
guarantees
Credit
derivatives
Financial assets at fair value through
profit or loss (excluding equity
securities and assets backing unit-
linked contracts) 327,258 ‑ 3,864 702 112 ‑
Held for trading financial assets 255,747 ‑ ‑ 691 ‑ ‑
Debt instruments that do not meet the
conditions of the “SPPI” test 71,510 ‑ 3,864 11 112 ‑
Financial assets designated at fair
value through profit or loss 1 ‑ ‑ ‑ ‑ ‑
Hedging derivative Instruments 21,745 ‑ ‑ 1,329 ‑ ‑
TOTAL 349,003 ‑ 3,864 2,031 112 ‑
(in millions of euros)
31/12/2019
Maximum
exposure to
credit risk
Credit risk mitigation
Collateral held as security Other credit enhancement
Financial instruments
provided as collateral Mortgages Pledged
securities
Financial
guarantees
Credit
derivatives
Financial assets at fair value through
profit or loss (excluding equity
securities and assets backing unit-
linked contracts) 296,409 ‑ 3,327 1,798 79 ‑
Held for trading financial assets 223,820 ‑ ‑ 1,769 ‑ ‑
Debt instruments that do not meet the
conditions of the “SPPI” test 72,588 ‑ 3,327 29 79 ‑
Financial assets designated at fair
value through profit or loss 1 ‑ ‑ ‑ ‑ ‑
Hedging derivative Instruments 19,368 ‑ ‑ 1,298 ‑ ‑
Total 315,777 ‑ 3,327 3,096 79 ‑

Consolidated financial statements of Credit Agricole S.A. 31 December 2020
72
FINANCIAL ASSETS SUBJECT TO IMPAIRMENT REQUIREMENTS
(in millions of euros)
31/12/2020
Maximum
exposure to
credit risk
Credit risk mitigation
Collateral held as security Other credit enhancement
Financial instruments
provided as collateral Mortgages Pledged
securities
Financial
guarantees
Credit
derivatives
Financial assets at fair value through
other comprehensive income that may
be reclassified to profit or loss 263,856 ‑ ‑ ‑ ‑ ‑
of which impaired assets at the
reporting date ‑ ‑ ‑ ‑ ‑ ‑
Loans and receivables due from credit
institutions ‑ ‑ ‑ ‑ ‑ ‑
of which impaired assets at the
reporting date ‑ ‑ ‑ ‑ ‑ ‑
Loans and receivables due from
customers ‑ ‑ ‑ ‑ ‑ ‑
of which impaired assets at the
reporting date ‑ ‑ ‑ ‑ ‑ ‑
Debt securities 263,856 ‑ ‑ ‑ ‑ ‑
of which impaired assets at the
reporting date ‑ ‑ ‑ ‑ ‑ ‑
Financial assets at amortised cost 583,521 12,680 81,488 9,996 132,740 700
of which impaired assets at the
reporting date 6,525 76 604 119 1,426 ‑
Loans and receivables due from credit
institutions (excluding Crédit Agricole
internal transactions) 92,790 4,632 ‑ 921 3,190 700
of which impaired assets at the
reporting date 50 ‑ ‑ ‑ 28 ‑
Loans and receivables due from
customers 405,937 8,048 81,488 9,075 129,550 ‑
of which impaired assets at the
reporting date 6,470 76 604 119 1,398 ‑
Debt securities 84,794 ‑ ‑ ‑ ‑ ‑
of which impaired assets at the
reporting date 5 ‑ ‑ ‑ ‑ ‑
Total 847,377 12,680 81,488 9,996 132,740 700
of which impaired assets at the
reporting date 6,525 76 604 119 1,426 ‑

Consolidated financial statements of Credit Agricole S.A. 31 December 2020
73
(in millions of euros)
31/12/2019
Maximum
exposure to
credit risk
Credit risk mitigation
Collateral held as security Other credit enhancement
Financial instruments
provided as collateral
Mortgages Pledged
securities
Financial
guarantees
Credit
derivatives
Financial assets at fair value through
other comprehensive income that may
be reclassified to profit or loss 258,803 ‑ ‑ ‑ ‑ ‑
of which impaired assets at the
reporting date ‑ ‑ ‑ ‑ ‑ ‑
Loans and receivables due from credit
institutions ‑ ‑ ‑ ‑ ‑ ‑
of which impaired assets at the
reporting date ‑ ‑ ‑ ‑ ‑ ‑
Loans and receivables due from
customers ‑ ‑ ‑ ‑ ‑ ‑
of which impaired assets at the
reporting date ‑ ‑ ‑ ‑ ‑ ‑
Debt securities 258,803 ‑ ‑ ‑ ‑ ‑
of which impaired assets at the
reporting date ‑ ‑ ‑ ‑ ‑ ‑
Financial assets at amortised cost 571,730 12,087 77,551 7,564 114,228 288
of which impaired assets at the
reporting date 6,066 103 703 116 887 ‑
Loans and receivables due from credit
institutions (excluding Crédit Agricole
internal transactions) 104,030 4,030 ‑ 81 5,157 ‑
of which impaired assets at the
reporting date 115 ‑ ‑ ‑ 77 ‑
Loans and receivables due from
customers 395,181 8,057 77,551 7,483 109,071 288
of which impaired assets at the
reporting date 5,942 103 703 116 810 ‑
Debt securities 72,519 ‑ ‑ ‑ ‑ ‑
of which impaired assets at the
reporting date 9 ‑ ‑ ‑ ‑ ‑
Total 830,533 12,087 77,551 7,564 114,228 288
of which impaired assets at the
reporting date 6,066 103 703 116 887 ‑

Consolidated financial statements of Credit Agricole S.A. 31 December 2020
74
OFF-BALANCE SHEET COMMITMENTS SUBJECT TO PROVISION REQUIREMENTS
(in millions of euros)
31/12/2020
Maximum
exposure to
credit risk
Credit risk mitigation
Collateral held as security Other credit enhancement
Financial instruments
provided as collateral Mortgages Pledged
securities
Financial
guarantees
Credit
derivatives
Guarantee commitments (excluding
Crédit Agricole internal transactions) 85,284 ‑ 37 408 4,360 553
of which provisioned commitments at
the reporting date 2,837 ‑ ‑ 93 14 ‑
Financing commitments (excluding
Crédit Agricole internal transactions) 163,430 ‑ 943 918 17,177 7,827
of which provisioned commitments at
the reporting date 259 ‑ 1 5 12 ‑
Total 248,714 ‑ 980 1,326 21,536 8,380
of which provisioned commitments at
the reporting date 3,096 ‑ 1 98 26 ‑
(in millions of euros)
31/12/2019
Maximum
exposure to
credit risk
Credit risk mitigation
Collateral held as security Other credit enhancement
Financial instruments
provided as collateral
Mortgages Pledged
securities
Financial
guarantees
Credit
derivatives
Guarantee commitments (excluding
Crédit Agricole internal transactions) 87,302 ‑ 23 434 5,980 784
of which provisioned commitments at
the reporting date 2,755 ‑ ‑ 64 14 ‑
Financing commitments (excluding
Crédit Agricole internal transactions) 153,187 2 1,146 1,173 17,315 7,785
of which provisioned commitments at
the reporting date 423 ‑ 2 13 61 ‑
Total 240,490 2 1,169 1,606 23,295 8,569
of which provisioned commitments at
the reporting date 3,178 ‑ 2 76 75 ‑
A description of the assets held as collateral is provided in Note 9 “Commitments given and received and other guarantees”.

Consolidated financial statements of Credit Agricole S.A. 31 December 2020
75
3.1.3 MODIFIED FINANCIAL ASSETS
Modified financial assets are those assets that have been restructured due to financial difficulties. Loans for which the entity changed the initial financial terms (interest rate, term) for economic or legal
reasons connected with the borrower’s financial difficulties, in a manner that would not have been considered under other circumstances. They thus consist of loans classified as in default and performing
loans at the date they are restructured. (A more detailed definition of restructured loans and their accounting treatment can be found in Note 1.2 “Accounting policies and principles”, Chapter entitled
“Financial instruments – Credit risk”).
For assets restructured during the period, the carrying amount following restructuring consists of:
Performing assets
Credit-impaired
assets (Bucket 3)
(in millions of euros)
Assets subject to
12-month ECL
(Bucket 1)
Assets subject to
lifetime ECL
(Bucket 2)
Loans and receivables due from credit institutions 9 ‑ ‑
Gross carrying amount before modification 9 ‑ ‑
Net gains (losses) resulting from the modification ‑ ‑ ‑
Loans and receivables due from customers 7 1,189 649
Gross carrying amount before modification 8 1,199 665
Net gains (losses) resulting from the modification (1) (10) (16)
Debt securities ‑ 4 ‑
Gross carrying amount before modification ‑ ‑ ‑
Net gains (losses) resulting from the modification ‑ 4 ‑
In accordance with the principles set out in Note 1.2 “Accounting policies and principles”, Chapter entitled “Financial instruments – Credit risk”, restructured assets at a stage of impairment corresponding
to that of Bucket 2 (performing assets) or Bucket 3 (impaired assets) may go back into Bucket 1 (performing assets). The carrying amount of modified assets affected by this reclassification during the period
is:
(in millions of euros)
Gross carrying amount
Assets subject to 12-month ECL
(Bucket 1)
Restructured assets previously classified in bucket 2 or bucket 3 and reclassified in
bucket 1 during the period
Loans and receivables due from credit institutions ‑
Loans and receivables due from customers 17
Debt securities ‑
TOTAL 17

Consolidated financial statements of Credit Agricole S.A. 31 December 2020
76
3.1.4 CREDIT RISK CONCENTRATIONS
The carrying amounts and commitments are presented net of impairment and provisions.
EXPOSURE TO CREDIT RISK BY CATEGORY OF CREDIT RISK
The credit risk categories are presented by probability of default intervals. The correspondence between internal ratings and probability of default intervals is discussed in the Chapter entitled “Risk Factors
and Pillar 3 – Credit Risk Management”.
Financial assets at amortised cost (excluding Crédit Agricole internal transactions)
Credit risk rating
grades
At 31 december 2020
Carrying amount
Performing assets Credit-impaired
assets (Bucket
3)
Total
(in millions of euros)
Assets subject to
12-month ECL
(Bucket 1)
Assets subject to
lifetime ECL
(Bucket 2)
Retail customers PD ≤ 0,5% 128,413 628 ‑ 129,041
0,5% < PD ≤ 2% 24,965 1,498 ‑ 26,463
2% < PD ≤ 20% 7,599 8,324 ‑ 15,923
20% < PD < 100% ‑ 970 ‑ 970
PD = 100% ‑ ‑ 4,703 4,703
Total Retail customers 160,977 11,420 4,703 177,100
Non-retail customers PD ≤ 0,6% 326,390 5,243 ‑ 331,633
0,6% < PD < 12% 52,697 17,483 ‑ 70,180
12% ≤ PD < 100% ‑ 5,494 ‑ 5,494
PD = 100% ‑ ‑ 9,156 9,156
Total Non-retail customers 379,087 28,220 9,156 416,463
Impairment (980) (1,729) (7,333) (10,042)
TOTAL 539,084 37,911 6,526 583,521

Consolidated financial statements of Credit Agricole S.A. 31 December 2020
77
Credit risk rating
grades
At 31 december 2019
Carrying amount
Performing assets Credit-impaired
assets (Bucket
3)
Total
(in millions of euros)
Assets subject to
12-month ECL
(Bucket 1)
Assets subject to
lifetime ECL
(Bucket 2)
Retail customers PD ≤ 0,5% 94,933 339 ‑ 95,272
0,5% < PD ≤ 2% 38,733 844 ‑ 39,577
2% < PD ≤ 20% 20,707 11,430 ‑ 32,137
20% < PD < 100% ‑ 1,479 ‑ 1,479
PD = 100% ‑ ‑ 4,623 4,623
Total Retail customers 154,373 14,092 4,623 173,088
Non-retail customers PD ≤ 0,6% 334,149 4,712 ‑ 338,861
0,6% < PD < 12% 48,015 7,993 ‑ 56,008
12% ≤ PD < 100% ‑ 4,434 ‑ 4,434
PD = 100% ‑ ‑ 9,038 9,038
Total Non-retail customers 382,164 17,139 9,038 408,341
Impairment (800) (1,287) (7,595) (9,682)
TOTAL 535,737 29,944 6,066 571,747

Consolidated financial statements of Credit Agricole S.A. 31 December 2020
78
Financial assets at fair value through other comprehensive income that may be reclassified to profit or loss
Credit risk rating
grades
At 31 december 2020
Carrying amount
Performing assets
Credit-impaired
assets (Bucket
3)
Total
(in millions of euros)
Assets subject to
12-month ECL
(Bucket 1)
Assets subject to
lifetime ECL
(Bucket 2)
Retail customers PD ≤ 0,5% ‑ ‑ ‑ ‑
0,5% < PD ≤ 2% ‑ ‑ ‑ ‑
2% < PD ≤ 20% ‑ ‑ ‑ ‑
20% < PD < 100% ‑ ‑ ‑ ‑
PD = 100% ‑ ‑ ‑ ‑
Total Retail customers ‑ ‑ ‑ ‑
Non-retail customers PD ≤ 0,6% 260,838 1,156 ‑ 261,994
0,6% < PD < 12% 672 1,190 ‑ 1,862
12% ≤ PD < 100% ‑ ‑ ‑ ‑
PD = 100% ‑ ‑ ‑ ‑
Total Non-retail customers 261,510 2,346 ‑ 263,856
TOTAL 261,510 2,346 ‑ 263,856

Consolidated financial statements of Credit Agricole S.A. 31 December 2020
79
Credit risk rating
grades
At 31 december 2019
Carrying amount
Performing assets
Credit-impaired
assets (Bucket
3)
Total
(in millions of euros)
Assets subject to
12-month ECL
(Bucket 1)
Assets subject to
lifetime ECL
(Bucket 2)
Retail customers PD ≤ 0,5% 49 3 ‑ 52
0,5% < PD ≤ 2% ‑ ‑ ‑ ‑
2% < PD ≤ 20% ‑ ‑ ‑ ‑
20% < PD < 100% ‑ ‑ ‑ ‑
PD = 100% ‑ ‑ ‑ ‑
Total Retail customers 49 3 ‑ 52
Non-retail customers PD ≤ 0,6% 255,790 1,188 ‑ 256,978
0,6% < PD < 12% 349 1,424 ‑ 1,773
12% ≤ PD < 100% ‑ ‑ ‑ ‑
PD = 100% ‑ ‑ ‑ ‑
Total Non-retail customers 256,139 2,612 ‑ 258,751
TOTAL 256,188 2,615 ‑ 258,803

Consolidated financial statements of Credit Agricole S.A. 31 December 2020
80
Financing commitments (excluding Crédit Agricole internal operations)
Credit risk rating
grades
At 31 december 2020
(in millions of euros)
Amount of commitment
Performing commitments
Provisioned
commitments
(Bucket 3)
Total Commitments
subject to 12-
month ECL
(Bucket 1)
Commitments
subject to lifetime
ECL
(Bucket 2)
Retail customers PD ≤ 0,5% 15,686 76 ‑ 15,762
0,5% < PD ≤ 2% 2,553 270 ‑ 2,823
2% < PD ≤ 20% 799 411 ‑ 1,210
20% < PD < 100% ‑ 34 ‑ 34
PD = 100% ‑ ‑ 22 22
Total Retail customers 19,038 791 22 19,851
Non-retail customers PD ≤ 0,6% 122,971 1,431 ‑ 124,402
0,6% < PD < 12% 13,463 5,032 ‑ 18,495
12% ≤ PD < 100% ‑ 846 ‑ 846
PD = 100% ‑ ‑ 295 295
Total Non-retail customers 136,434 7,309 295 144,038
Provisions ¹ (181) (220) (58) (459)
TOTAL 155,291 7,880 259 163,430
¹ Expected or proven losses in respect of off-balance sheet commitments are covered by provisions recognised as
liabilities on the balance sheet.

Consolidated financial statements of Credit Agricole S.A. 31 December 2020
81
Credit risk rating
grades
At 31 december 2019
(in millions of euros)
Amount of commitment
Performing commitments
Provisioned
commitments
(Bucket 3)
Total Commitments
subject to 12-
month ECL
(Bucket 1)
Commitments
subject to lifetime
ECL
(Bucket 2)
Retail customers PD ≤ 0,5% 10,880 29 ‑ 10,909
0,5% < PD ≤ 2% 4,520 63 ‑ 4,583
2% < PD ≤ 20% 3,139 825 ‑ 3,964
20% < PD < 100% ‑ 45 ‑ 45
PD = 100% ‑ ‑ 36 36
Total Retail customers 18,539 962 36 19,537
Non-retail customers PD ≤ 0,6% 115,700 1,486 ‑ 117,186
0,6% < PD < 12% 13,780 2,006 ‑ 15,786
12% ≤ PD < 100% ‑ 643 ‑ 643
PD = 100% ‑ ‑ 445 445
Total Non-retail customers 129,480 4,135 445 134,060
Provisions ¹ (171) (181) (58) (410)
TOTAL 147,848 4,916 423 153,187
¹ Expected or proven losses in respect of off-balance sheet commitments are covered by provisions recognised as
liabilities on the balance sheet.

Consolidated financial statements of Credit Agricole S.A. 31 December 2020
82
Guarantee commitments (excluding Crédit Agricole internal operations)
Credit risk rating
grades
At 31 december 2020
(in million of euros)
Amount of commitment
Performing commitments
Provisioned
commitments
(Bucket 3)
Total Commitments
subject to 12-
month ECL
(Bucket 1)
Commitments
subject to lifetime
ECL
(Bucket 2)
Retail customers PD ≤ 0,5% 910 36 ‑ 946
0,5% < PD ≤ 2% 81 1 ‑ 82
2% < PD ≤ 20% 53 24 ‑ 77
20% < PD < 100% ‑ 1 ‑ 1
PD = 100% ‑ ‑ 87 87
Total Retail customers 1,044 62 87 1,193
Non-retail customers PD ≤ 0,6% 71,160 1,831 ‑ 72,991
0,6% < PD < 12% 5,748 1,229 ‑ 6,977
12% ≤ PD < 100% ‑ 1,563 ‑ 1,563
PD = 100% ‑ ‑ 3,011 3,011
Total Non-retail customers 76,908 4,623 3,011 84,542
Provisions ¹ (63) (127) (261) (451)
TOTAL 77,889 4,558 2,837 85,284
¹ Expected or proven losses in respect of off-balance sheet commitments are covered by provisions recognised as
liabilities on the balance sheet.

Consolidated financial statements of Credit Agricole S.A. 31 December 2020
83
Credit risk rating
grades
At 31 december 2019
(in million of euros)
Amount of commitment
Performing commitments
Provisioned
commitments
(Bucket 3)
Total Commitments
subject to 12-
month ECL
(Bucket 1)
Commitments
subject to lifetime
ECL
(Bucket 2)
Retail customers PD ≤ 0,5% 881 18 ‑ 899
0,5% < PD ≤ 2% 160 ‑ ‑ 160
2% < PD ≤ 20% 19 23 ‑ 42
20% < PD < 100% ‑ ‑ ‑ ‑
PD = 100% ‑ ‑ 83 83
Total Retail customers 1,060 41 83 1,184
Non-retail customers PD ≤ 0,6% 73,213 2,158 ‑ 75,371
0,6% < PD < 12% 5,855 1,154 ‑ 7,009
12% ≤ PD < 100% ‑ 1,226 ‑ 1,226
PD = 100% ‑ ‑ 3,011 3,011
Total Non-retail customers 79,068 4,538 3,011 86,617
Provisions 1 (47) (113) (339) (499)
TOTAL 80,081 4,466 2,755 87,302
¹ Expected or proven losses in respect of off-balance sheet commitments are covered by provisions recognised as
liabilities on the balance sheet.

Consolidated financial statements of Credit Agricole S.A. 31 December 2020
84
CREDIT RISK CONCENTRATIONS BY CUSTOMER TYPE
FINANCIAL ASSETS DESIGNATED AT FAIR VALUE THROUGH PROFIT OR LOSS BY CUSTOMER TYPE
31/12/2020 31/12/2019
Carrying
amount
Amount of changes in fair
value resulting from changes
in credit risk Carrying
amount
Amount of changes in fair
value resulting from changes
in credit risk
(in millions of euros) During the
period Cumulative During the period Cumulative
General administration ‑ ‑ ‑ ‑ ‑ ‑
Central banks ‑ ‑ ‑ ‑ ‑ ‑
Credit institutions ‑ ‑ ‑ ‑ ‑ ‑
Large corporates 1 ‑ ‑ 1 ‑ ‑
Retail customers ‑ ‑ ‑ ‑ ‑ ‑
Total Financial assets designated
at fair value through profit or loss 1
‑ ‑ 1
‑ ‑
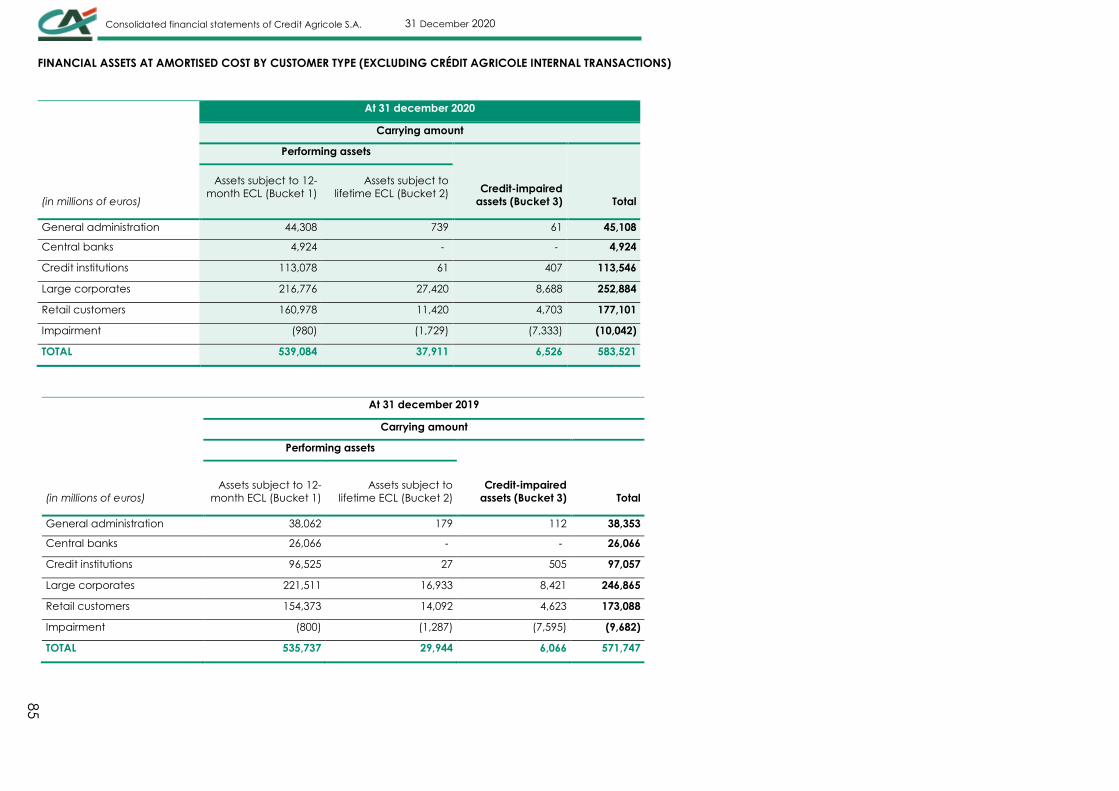
Consolidated financial statements of Credit Agricole S.A. 31 December 2020
85
FINANCIAL ASSETS AT AMORTISED COST BY CUSTOMER TYPE (EXCLUDING CRÉDIT AGRICOLE INTERNAL TRANSACTIONS)
At 31 december 2020
Carrying amount
Performing assets
Credit-impaired
assets (Bucket 3) Total (in millions of euros)
Assets subject to 12-
month ECL (Bucket 1)
Assets subject to
lifetime ECL (Bucket 2)
General administration 44,308 739 61 45,108
Central banks 4,924 ‑ ‑ 4,924
Credit institutions 113,078 61 407 113,546
Large corporates 216,776 27,420 8,688 252,884
Retail customers 160,978 11,420 4,703 177,101
Impairment (980) (1,729) (7,333) (10,042)
TOTAL 539,084 37,911 6,526 583,521
At 31 december 2019
Carrying amount
Performing assets
Credit-impaired
assets (Bucket 3) Total (in millions of euros)
Assets subject to 12-
month ECL (Bucket 1)
Assets subject to
lifetime ECL (Bucket 2)
General administration 38,062 179 112 38,353
Central banks 26,066 ‑ ‑ 26,066
Credit institutions 96,525 27 505 97,057
Large corporates 221,511 16,933 8,421 246,865
Retail customers 154,373 14,092 4,623 173,088
Impairment (800) (1,287) (7,595) (9,682)
TOTAL 535,737 29,944 6,066 571,747

Consolidated financial statements of Credit Agricole S.A. 31 December 2020
86
FINANCIAL ASSETS AT FAIR VALUE THROUGH OTHER COMPREHENSIVE INCOME THAT MAY BE RECLASSIFIED TO PROFIT OR LOSS BY CUSTOMER TYPE
At 31 december 2020
Carrying amount
Performing assets
Credit-impaired
assets (Bucket 3) Total (in millions of euros)
Assets subject to 12-
month ECL (Bucket 1)
Assets subject to
lifetime ECL (Bucket 2)
General administration 124,162 693 ‑ 124,855
Central banks 372 378 ‑ 750
Credit institutions 65,091 4 ‑ 65,095
Large corporates 71,885 1,271 ‑ 73,156
Retail customers ‑ ‑ ‑ ‑
TOTAL 261,510 2,346 ‑ 263,856
At 31 december 2019
Carrying amount
Performing assets
Credit-impaired
assets (Bucket 3) Total
Assets subject to 12-
month ECL (Bucket 1)
Assets subject to
lifetime ECL (Bucket 2)
General administration 116,377 700 ‑ 117,077
Central banks 384 544 ‑ 928
Credit institutions 67,951 4 ‑ 67,955
Large corporates 71,428 1,363 ‑ 72,791
Retail customers 49 3 ‑ 52
TOTAL 256,189 2,614 ‑ 258,803

Consolidated financial statements of Credit Agricole S.A. 31 December 2020
87
DUE TO CUSTOMERS BY CUSTOMER TYPE
(in millions of euros) 31/12/2020 31/12/2019
General administration 10,550 25,015
Large corporates 279,949 219,466
Retail customers 428,889 402,433
TOTAL AMOUNT DUE TO CUSTOMERS 719,388 646,914
FINANCING COMMITMENTS BY CUSTOMER TYPE (EXCLUDING CRÉDIT AGRICOLE INTERNAL TRANSACTIONS)
At 31 december 2020
Amount of commitment
Performing commitments
Provisioned
commitments
(Bucket 3) Total (in millions of euros)
Commitments subject
to 12-month ECL
(Bucket 1)
Commitments subject
to lifetime ECL (Bucket
2)
General administration 3,113 748 ‑ 3,861
Central banks ‑ ‑ ‑ ‑
Credit institutions 15,009 ‑ ‑ 15,009
Large corporates 118,311 6,561 295 125,167
Retail customers 19,039 791 22 19,852
Provisions ¹ (181) (220) (58) (459)
TOTAL 155,291 7,880 259 163,430
¹ Expected or proven losses in respect of off-balance sheet commitments are covered by provisions recognised as
liabilities on the balance sheet.

Consolidated financial statements of Credit Agricole S.A. 31 December 2020
88
At 31 december 2019
(in millions of euros)
Amount of commitment
Performing commitments
Provisioned
commitments
(Bucket 3) Total
Commitments subject
to 12-month ECL
(Bucket 1)
Commitments subject
to lifetime ECL (Bucket
2)
General administration 2,669 214 31 2,914
Central banks 94 ‑ ‑ 94
Credit institutions 12,144 ‑ 1 12,145
Large corporates 114,573 3,921 414 118,908
Retail customers 18,540 961 35 19,536
Provisions ¹ (171) (181) (58) (410)
TOTAL 147,849 4,915 423 153,187
¹Expected or proven losses in respect of off-balance sheet commitments are covered by provisions recognised as
liabilities on the balance sheet.

Consolidated financial statements of Credit Agricole S.A. 31 December 2020
89
GUARANTEE COMMITMENTS BY CUSTOMER TYPE (EXCLUDING CRÉDIT AGRICOLE INTERNAL TRANSACTIONS)
At 31 december 2020
(in millions of euros)
Amount of commitment
Performing commitments
Provisioned
commitments
(Bucket 3) Total
Commitments subject
to 12-month ECL
(Bucket 1)
Commitments subject
to lifetime ECL (Bucket
2)
General administration 230 ‑ ‑ 230
Central banks 465 ‑ ‑ 465
Credit institutions 7,568 32 23 7,623
Large corporates 68,645 4,591 2,987 76,223
Retail customers 1,044 62 88 1,194
Provisions ¹ (63) (127) (261) (451)
TOTAL 77,889 4,558 2,837 85,284
¹ Expected or proven losses in respect of off-balance sheet commitments are covered by provisions recognised as
liabilities on the balance sheet.
At 31 december 2019
(in millions of euros)
Amount of commitment
Performing commitments Provisioned
commitments
(Bucket 3)
Total Commitments subject
to 12-month ECL
(Bucket 1)
Commitments subject
to lifetime ECL (Bucket
2)
General administration 291 6 ‑ 297
Central banks 511 ‑ ‑ 511
Credit institutions 7,874 28 47 7,949
Large corporates 70,393 4,504 2,964 77,861
Retail customers 1,060 41 83 1,184
Provisions ¹ (48) (113) (339) (500)
TOTAL 80,081 4,466 2,755 87,302
¹Expected or proven losses in respect of off-balance sheet commitments are covered by provisions recognised as
liabilities on the balance sheet.

Consolidated financial statements of Credit Agricole S.A. 31 December 2020
90
CREDIT RISK CONCENTRATIONS BY GEOGRAPHICAL AREA
FINANCIAL ASSETS AT AMORTISED COST BY GEOGRAPHICAL AREA (EXCLUDING CRÉDIT AGRICOLE INTERNAL TRANSACTIONS)
At 31 december 2020
Carrying amount
Performing assets
Credit-impaired
assets (Bucket 3) Total (in millions of euros)
Assets subject to 12-
month ECL (Bucket 1)
Assets subject to lifetime
ECL (Bucket 2)
France (including overseas
departments and territories) 286,538 18,914 4,890 310,342
Other European Union
countries 146,708 9,078 5,548 161,334
Other European countries 17,698 712 259 18,669
North America 28,732 3,351 295 32,378
Central and South America 6,870 2,075 1,211 10,156
Africa and Middle East 17,025 2,492 1,126 20,643
Asia-Pacific (ex. Japan) 30,388 1,822 299 32,509
Japan 4,328 1,196 231 5,755
Supranational organisations 1,777 ‑ ‑ 1,777
Impairment (980) (1,729) (7,333) (10,042)
TOTAL 539,084 37,911 6,526 583,521

Consolidated financial statements of Credit Agricole S.A. 31 December 2020
91
At 31 december 2019
Carrying amount
Performing assets
Credit-impaired
assets (Bucket 3) Total (in millions of euros)
Assets subject to 12-
month ECL (Bucket 1)
Assets subject to lifetime
ECL (Bucket 2)
France (including overseas
departments and territories) 273,736 15,968 4,800 294,504
Other European Union
countries 142,978 7,899 6,015 156,892
Other European countries 18,480 750 265 19,495
North America 34,898 964 392 36,254
Central and South America 9,465 1,219 692 11,376
Africa and Middle East 17,289 2,228 1,241 20,758
Asia-Pacific (ex. Japan) 31,083 1,717 256 33,056
Japan 5,938 486 ‑ 6,424
Supranational organisations 2,670 ‑ ‑ 2,670
Impairment (800) (1,287) (7,595) (9,682)
TOTAL 535,737 29,944 6,066 571,747

Consolidated financial statements of Credit Agricole S.A. 31 December 2020
92
FINANCIAL ASSETS AT FAIR VALUE THROUGH OTHER COMPREHENSIVE INCOME THAT MAY BE RECLASSIFIED TO PROFIT OR LOSS BY GEOGRAPHICAL AREA
At 31 december 2020
Carrying amount
Performing assets
Credit-impaired
assets (Bucket 3) Total (in millions of euros)
Assets subject to 12-
month ECL (Bucket 1)
Assets subject to lifetime
ECL (Bucket 2)
France (including overseas
departments and territories) 129,904 747 ‑ 130,651
Other European Union
countries 97,281 952 ‑ 98,233
Other European countries 3,784 ‑ ‑ 3,784
North America 20,465 6 ‑ 20,471
Central and South America 371 ‑ ‑ 371
Africa and Middle East 690 641 ‑ 1,331
Asia-Pacific (ex. Japan) 5,203 ‑ ‑ 5,203
Japan 1,432 ‑ ‑ 1,432
Supranational organisations 2,380 ‑ ‑ 2,380
TOTAL 261,510 2,346 ‑ 263,856

Consolidated financial statements of Credit Agricole S.A. 31 December 2020
93
At 31 december 2019
Carrying amount
Performing assets
Credit-impaired
assets (Bucket 3) Total (in millions of euros)
Assets subject to 12-
month ECL (Bucket 1)
Assets subject to lifetime
ECL (Bucket 2)
France (including overseas
departments and territories) 127,049 893 ‑ 127,942
Other European Union
countries 96,721 917 ‑ 97,638
Other European countries 4,055 ‑ ‑ 4,055
North America 18,695 ‑ ‑ 18,695
Central and South America 333 ‑ ‑ 333
Africa and Middle East 546 804 ‑ 1,350
Asia-Pacific (ex. Japan) 5,522 ‑ ‑ 5,522
Japan 634 ‑ ‑ 634
Supranational organisations 2,634 ‑ ‑ 2,634
TOTAL 256,189 2,614 ‑ 258,803
DUE TO CUSTOMERS BY GEOGRAPHICAL AREA
(in millions of euros) 31/12/2020 31/12/2019
France (including overseas departments and territories) 498,725 442,439
Other European Union countries 135,624 127,097
Other European countries 16,441 14,387
North America 22,844 14,448
Central and South America 5,464 4,435
Africa and Middle East 13,852 17,939
Asia-Pacific (ex. Japan) 13,813 12,889
Japan 12,620 13,271
Supranational organisations 5 9
TOTAL AMOUNT DUE TO CUSTOMERS 719,388 646,914

Consolidated financial statements of Credit Agricole S.A. 31 December 2020
94
FINANCING COMMITMENTS BY GEOGRAPHICAL AREA (EXCLUDING CRÉDIT AGRICOLE INTERNAL TRANSACTIONS)
At 31 december 2020
(in millions of euros)
Amount of commitment
Performing commitments Provisioned
commitments
(Bucket 3) Total
Commitments
subject to 12-month
ECL (Bucket 1)
Commitments subject to
lifetime ECL (Bucket 2)
France (including overseas
departments and territories) 63,881 2,376 95 66,352
Other European Union
countries 48,607 1,381 197 50,185
Other European countries 6,383 178 2 6,563
North America 22,711 2,483 3 25,197
Central and South America 1,941 1,231 1 3,173
Africa and Middle East 4,875 433 ‑ 5,308
Asia-Pacific (ex. Japan) 6,205 18 20 6,243
Japan 869 ‑ ‑ 869
Supranational organisations ‑ ‑ ‑ ‑
Provisions ¹ (181) (220) (59) (460)
TOTAL 155,291 7,880 259 163,430
¹ Expected or proven losses in respect of off-balance sheet commitments are covered by provisions recognised as
liabilities on the balance sheet.

Consolidated financial statements of Credit Agricole S.A. 31 December 2020
95
At 31 december 2019
(in millions of euros)
Amount of commitment
Performing commitments Provisioned
commitments
(Bucket 3) Total
Commitments
subject to 12-month
ECL (Bucket 1)
Commitments subject to
lifetime ECL (Bucket 2)
France (including overseas
departments and territories) 57,698 1,912 152 59,763
Other European Union
countries 41,492 1,493 163 43,148
Other European countries 6,565 172 69 6,806
North America 26,025 1,102 80 27,207
Central and South America 3,391 63 17 3,471
Africa and Middle East 5,323 240 ‑ 5,563
Asia-Pacific (ex. Japan) 6,566 85 ‑ 6,651
Japan 959 29 ‑ 988
Supranational organisations ‑ ‑ ‑ ‑
Provisions ¹ (171) (181) (58) (410)
TOTAL 147,849 4,915 423 153,187
¹ Expected or proven losses in respect of off-balance sheet commitments are covered by provisions recognised as
liabilities on the balance sheet.

Consolidated financial statements of Credit Agricole S.A. 31 December 2020
96
GUARANTEE COMMITMENTS BY GEOGRAPHICAL AREA (EXCLUDING CRÉDIT AGRICOLE INTERNAL TRANSACTIONS)
At 31 december 2020
(in millions of euros)
Amount of commitment
Performing commitments Provisioned
commitments
(Bucket 3) Total
Commitments
subject to 12-month
ECL (Bucket 1)
Commitments subject to
lifetime ECL (Bucket 2)
France (including overseas
departments and territories) 34,143 1,040 353 35,536
Other European Union
countries 16,272 1,698 2,611 20,581
Other European countries 3,254 127 ‑ 3,381
North America 11,447 1,268 52 12,767
Central and South America 1,341 2 18 1,361
Africa and Middle East 2,523 108 46 2,677
Asia-Pacific (ex. Japan) 6,945 334 18 7,297
Japan 2,027 108 ‑ 2,135
Supranational organisations ‑ ‑ ‑ ‑
Provisions ¹ (63) (127) (261) (451)
TOTAL 77,889 4,558 2,837 85,284
¹ Expected or proven losses in respect of off-balance sheet commitments are covered by provisions recognised as
liabilities on the balance sheet.

Consolidated financial statements of Credit Agricole S.A. 31 December 2020
97
At 31 december 2019
(in millions of euros)
Amount of commitment
Performing commitments Provisioned
commitments
(Bucket 3) Total
Commitments
subject to 12-month
ECL (Bucket 1)
Commitments subject to
lifetime ECL (Bucket 2)
France (including overseas
departments and territories) 35,531 1,133 459 37,123
Other European Union
countries 16,054 1,626 2,132 19,814
Other European countries 4,346 697 ‑ 5,044
North America 10,243 635 397 11,275
Central and South America 1,059 1 29 1,089
Africa and Middle East 3,318 66 76 3,461
Asia-Pacific (ex. Japan) 6,732 235 ‑ 6,966
Japan 2,845 185 ‑ 3,031
Supranational organisations ‑ ‑ ‑ ‑
Provisions ¹ (47) (113) (339) (500)
TOTAL 80,082 4,466 2,755 87,302
¹ Expected or proven losses in respect of off-balance sheet commitments are covered by provisions recognised as
liabilities on the balance sheet.

Consolidated financial statements of Credit Agricole S.A. 31 December 2020
98
3.1.5 INFORMATION ON WATCH LIST OR INDIVIDUALLY IMPAIRED FINANCIAL ASSETS
ANALYSIS OF WATCH LIST OR INDIVIDUALLY IMPAIRED FINANCIAL ASSETS BY CUSTOMER TYPE
(in millions of euros)
Carrying amount at 31/12/2020
Assets without significant
increase in credit risk since
initial recognition (Bucket
1)
Assets with significant
increase in credit risk since
initial recognition but not
impaired (Bucket 2) Credit-impaired assets
(Bucket 3)
≤ 30
days
> 30 days
up to
≤ 90 days
> 90
days
≤ 30
days
> 30 days
up to
≤ 90 days
> 90
days
≤ 30
days
> 30 days
up to
≤ 90 days
> 90
days
Debt securities 577 ‑ ‑ ‑ 313 ‑ ‑ ‑ ‑
General administration ‑ ‑ ‑ ‑ ‑ ‑ ‑ ‑ ‑
Central banks ‑ ‑ ‑ ‑ ‑ ‑ ‑ ‑ ‑
Credit institutions ‑ ‑ ‑ ‑ ‑ ‑ ‑ ‑ ‑
Large corporates 577 ‑ ‑ ‑ 313 ‑ ‑ ‑ ‑
Retail customers ‑ ‑ ‑ ‑ ‑ ‑ ‑ ‑ ‑
Loans and receivables 1,988 320 ‑ 3,126 860 13 148 253 3,810
General administration 20 45 ‑ 19 1 ‑ ‑ ‑ 32
Central banks ‑ ‑ ‑ ‑ ‑ ‑ ‑ ‑ ‑
Credit institutions 6 65 ‑ ‑ ‑ ‑ ‑ ‑ 41
Large corporates 1,213 147 ‑ 1,253 425 10 31 145 2,501
Retail customers 749 63 ‑ 1,854 434 3 117 108 1,236
TOTAL 2,565 320 ‑ 3,126 1,173 13 148 253 3,810
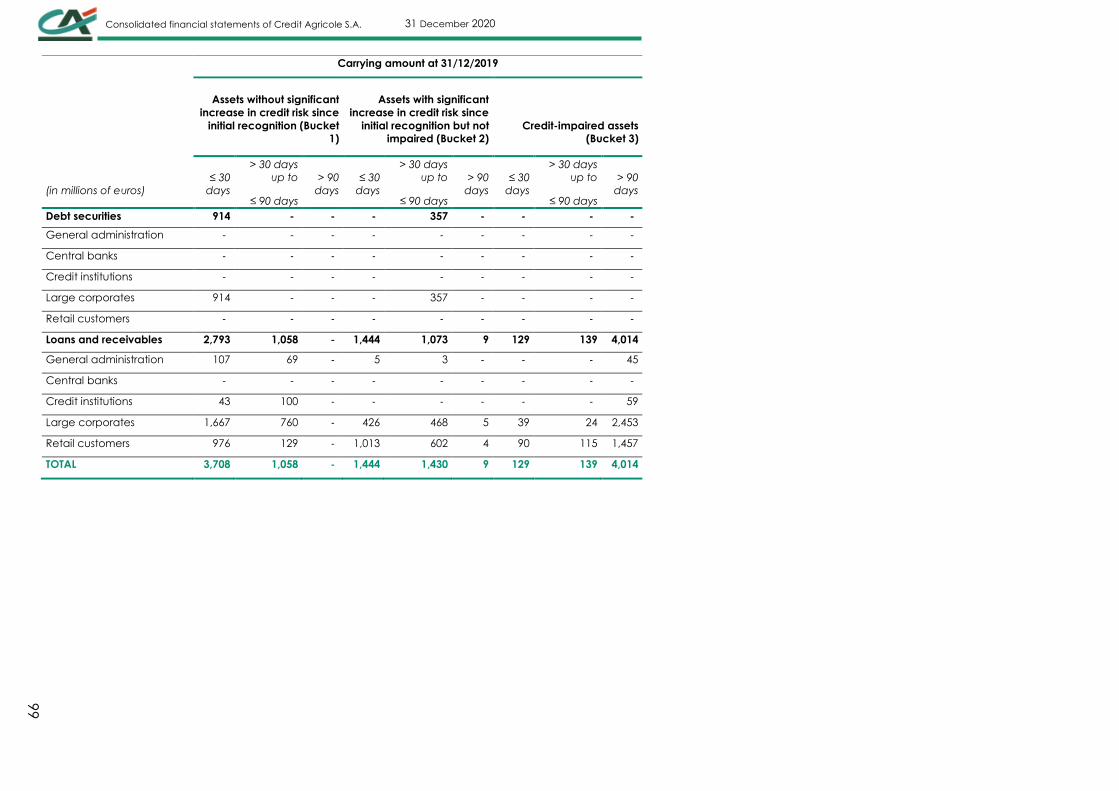
Consolidated financial statements of Credit Agricole S.A. 31 December 2020
99
(in millions of euros)
Carrying amount at 31/12/2019
Assets without significant
increase in credit risk since
initial recognition (Bucket
1)
Assets with significant
increase in credit risk since
initial recognition but not
impaired (Bucket 2)
Credit-impaired assets
(Bucket 3)
≤ 30
days
> 30 days
up to
≤ 90 days
> 90
days
≤ 30
days
> 30 days
up to
≤ 90 days
> 90
days
≤ 30
days
> 30 days
up to
≤ 90 days
> 90
days
Debt securities 914 ‑ ‑ ‑ 357 ‑ ‑ ‑ ‑
General administration ‑ ‑ ‑ ‑ ‑ ‑ ‑ ‑ ‑
Central banks ‑ ‑ ‑ ‑ ‑ ‑ ‑ ‑ ‑
Credit institutions ‑ ‑ ‑ ‑ ‑ ‑ ‑ ‑ ‑
Large corporates 914 ‑ ‑ ‑ 357 ‑ ‑ ‑ ‑
Retail customers ‑ ‑ ‑ ‑ ‑ ‑ ‑ ‑ ‑
Loans and receivables 2,793 1,058 ‑ 1,444 1,073 9 129 139 4,014
General administration 107 69 ‑ 5 3 ‑ ‑ ‑ 45
Central banks ‑ ‑ ‑ ‑ ‑ ‑ ‑ ‑ ‑
Credit institutions 43 100 ‑ ‑ ‑ ‑ ‑ ‑ 59
Large corporates 1,667 760 ‑ 426 468 5 39 24 2,453
Retail customers 976 129 ‑ 1,013 602 4 90 115 1,457
TOTAL 3,708 1,058 ‑ 1,444 1,430 9 129 139 4,014
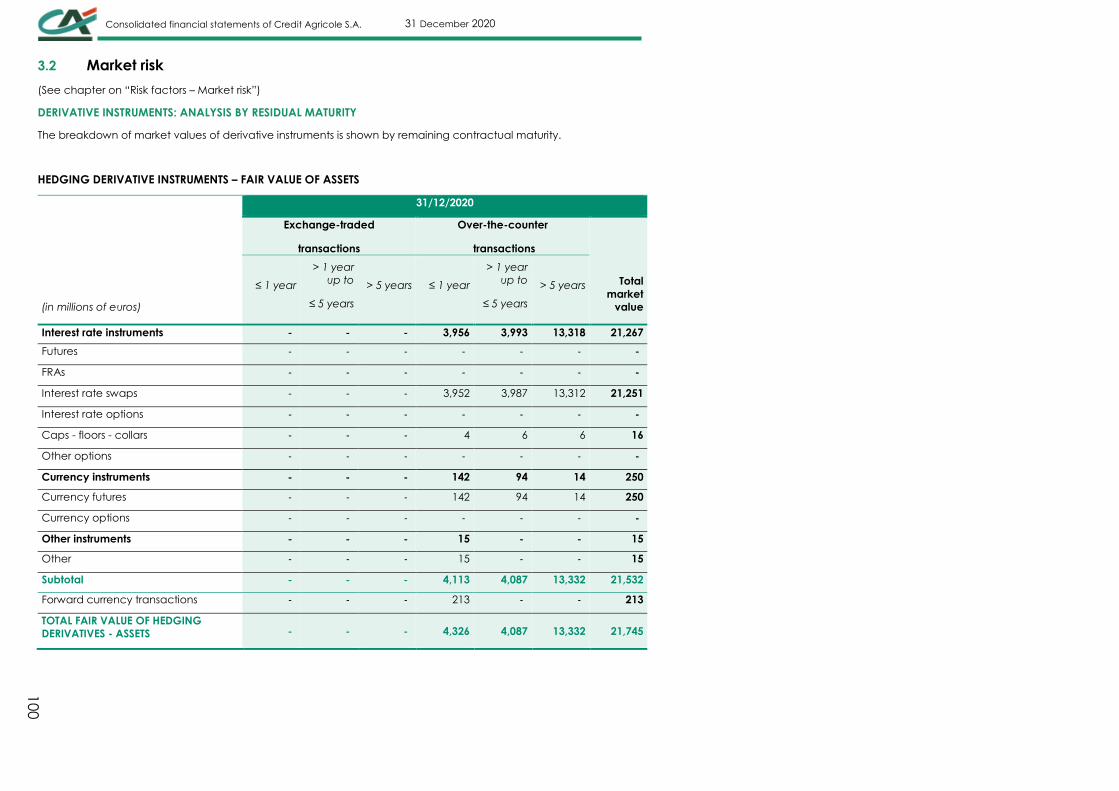
Consolidated financial statements of Credit Agricole S.A. 31 December 2020
10
0
3.2 Market risk
(See chapter on “Risk factors – Market risk”)
DERIVATIVE INSTRUMENTS: ANALYSIS BY RESIDUAL MATURITY
The breakdown of market values of derivative instruments is shown by remaining contractual maturity.
HEDGING DERIVATIVE INSTRUMENTS – FAIR VALUE OF ASSETS
(in millions of euros)
31/12/2020
Exchange-traded
transactions
Over-the-counter
transactions
Total
market
value
≤ 1 year
> 1 year
up to
≤ 5 years
> 5 years ≤ 1 year
> 1 year
up to
≤ 5 years
> 5 years
Interest rate instruments ‑ ‑ ‑ 3,956 3,993 13,318 21,267
Futures ‑ ‑ ‑ ‑ ‑ ‑ ‑
FRAs ‑ ‑ ‑ ‑ ‑ ‑ ‑
Interest rate swaps ‑ ‑ ‑ 3,952 3,987 13,312 21,251
Interest rate options ‑ ‑ ‑ ‑ ‑ ‑ ‑
Caps - floors - collars ‑ ‑ ‑ 4 6 6 16
Other options ‑ ‑ ‑ ‑ ‑ ‑ ‑
Currency instruments ‑ ‑ ‑ 142 94 14 250
Currency futures ‑ ‑ ‑ 142 94 14 250
Currency options ‑ ‑ ‑ ‑ ‑ ‑ ‑
Other instruments ‑ ‑ ‑ 15 ‑ ‑ 15
Other ‑ ‑ ‑ 15 ‑ ‑ 15
Subtotal ‑ ‑ ‑ 4,113 4,087 13,332 21,532
Forward currency transactions ‑ ‑ ‑ 213 ‑ ‑ 213
TOTAL FAIR VALUE OF HEDGING
DERIVATIVES - ASSETS ‑ ‑ ‑ 4,326 4,087 13,332 21,745

Consolidated financial statements of Credit Agricole S.A. 31 December 2020
10
1
(in millions of euros)
31/12/2019
Exchange-traded
transactions
Over-the-counter
transactions
Total
market
value
≤ 1 year
> 1 year
up to
≤ 5 years
> 5 years ≤ 1 year
> 1 year
up to
≤ 5 years
> 5 years
Interest rate instruments ‑ ‑ ‑ 2,581 4,000 12,033 18,614
Futures ‑ ‑ ‑ ‑ ‑ ‑ ‑
FRAs ‑ ‑ ‑ ‑ ‑ ‑ ‑
Interest rate swaps ‑ ‑ ‑ 2,553 3,992 12,025 18,570
Interest rate options ‑ ‑ ‑ ‑ ‑ ‑ ‑
Caps - floors - collars ‑ ‑ ‑ 28 8 8 44
Other options ‑ ‑ ‑ ‑ ‑ ‑ ‑
Currency instruments ‑ ‑ ‑ 150 56 13 219
Currency futures ‑ ‑ ‑ 150 56 13 219
Currency options ‑ ‑ ‑ ‑ ‑ ‑ ‑
Other instruments ‑ ‑ ‑ 36 ‑ ‑ 36
Other ‑ ‑ ‑ 36 ‑ ‑ 36
Subtotal ‑ ‑ ‑ 2,767 4,056 12,046 18,869
Forward currency transactions ‑ ‑ ‑ 498 1 ‑ 499
TOTAL FAIR VALUE OF HEDGING
DERIVATIVES - ASSETS ‑ ‑ ‑ 3,265 4,057 12,046 19,368

Consolidated financial statements of Credit Agricole S.A. 31 December 2020
10
2
HEDGING DERIVATIVE INSTRUMENTS – FAIR VALUE OF LIABILITIES
(in millions of euros)
31/12/2020
Exchange-traded
transactions
Over-the-counter
transactions
Total
market
value ≤ 1 year
> 1 year
up to
≤ 5 years > 5 years ≤ 1 year
> 1 year
up to
≤ 5 years > 5 years
Interest rate instruments ‑ ‑ ‑ 1,932 4,813 7,827 14,572
Futures ‑ ‑ ‑ ‑ ‑ ‑ ‑
FRAs ‑ ‑ ‑ ‑ ‑ ‑ ‑
Interest rate swaps ‑ ‑ ‑ 1,929 4,806 7,823 14,558
Interest rate options ‑ ‑ ‑ ‑ ‑ ‑ ‑
Caps - floors - collars ‑ ‑ ‑ 3 7 4 14
Other options ‑ ‑ ‑ ‑ ‑ ‑ ‑
Currency instruments ‑ ‑ ‑ 141 10 24 175
Currency futures ‑ ‑ ‑ 141 10 24 175
Currency options ‑ ‑ ‑ ‑ ‑ ‑ ‑
Other instruments ‑ ‑ ‑ 35 ‑ ‑ 35
Other ‑ ‑ ‑ 35 ‑ ‑ 35
Subtotal ‑ ‑ ‑ 2,108 4,823 7,851 14,782
Forward currency transactions ‑ ‑ ‑ 436 ‑ ‑ 436
TOTAL FAIR VALUE OF HEDGING
DERIVATIVES - LIABILITIES ‑ ‑ ‑ 2,544 4,823 7,851 15,218

Consolidated financial statements of Credit Agricole S.A. 31 December 2020
10
3
(in millions of euros)
31/12/2019
Exchange-traded
transactions
Over-the-counter
transactions
Total
market
value ≤ 1 year
> 1 year
up to
≤ 5 years > 5 years ≤ 1 year
> 1 year
up to
≤ 5 years > 5 years
Interest rate instruments ‑ ‑ ‑ 1,664 3,985 7,174 12,823
Futures ‑ ‑ ‑ ‑ ‑ ‑ ‑
FRAs ‑ ‑ ‑ ‑ ‑ ‑ ‑
Interest rate swaps ‑ ‑ ‑ 1,664 3,977 7,174 12,815
Interest rate options ‑ ‑ ‑ ‑ ‑ ‑ ‑
Caps - floors - collars ‑ ‑ ‑ ‑ 8 ‑ 8
Other options ‑ ‑ ‑ ‑ ‑ ‑ ‑
Currency instruments ‑ ‑ ‑ 154 3 16 173
Currency futures ‑ ‑ ‑ 154 3 16 173
Currency options ‑ ‑ ‑ ‑ ‑ ‑ ‑
Other instruments ‑ ‑ ‑ 24 ‑ ‑ 24
Other ‑ ‑ ‑ 24 ‑ ‑ 24
Subtotal ‑ ‑ ‑ 1,842 3,988 7,190 13,020
Forward currency transactions ‑ ‑ ‑ 273 ‑ ‑ 273
TOTAL FAIR VALUE OF HEDGING
DERIVATIVES - LIABILITIES ‑ ‑ ‑ 2,115 3,988 7,190 13,293

Consolidated financial statements of Credit Agricole S.A. 31 December 2020
10
4
DERIVATIVE INSTRUMENTS HELD FOR TRADING – FAIR VALUE OF ASSETS
(in millions of euros)
31/12/2020
Exchange-traded
transactions
Over-the-counter
transactions
Total
market
value ≤ 1 year
> 1 year
up to
≤ 5 years > 5 years ≤ 1 year
> 1 year
up to
≤ 5 years > 5 years
Interest rate instruments 5 ‑ ‑ 4,957 16,993 53,300 75,255
Futures ‑ ‑ ‑ ‑ ‑ ‑ ‑
FRAs ‑ ‑ ‑ 3 ‑ ‑ 3
Interest rate swaps ‑ ‑ ‑ 4,231 13,651 38,590 56,472
Interest rate options ‑ ‑ ‑ 159 2,233 13,430 15,822
Caps - floors - collars ‑ ‑ ‑ 564 1,109 1,280 2,953
Other options 5 ‑ ‑ ‑ ‑ ‑ 5
Currency instruments and gold ‑ ‑ ‑ 6,640 3,538 3,904 14,082
Currency futures ‑ ‑ ‑ 4,349 2,885 3,566 10,800
Currency options ‑ ‑ ‑ 2,291 653 338 3,282
Other instruments 724 671 128 1,812 5,444 1,956 10,735
Equity and index derivatives 724 671 128 1,511 5,298 1,066 9,398
Precious metal derivatives ‑ ‑ ‑ 96 2 ‑ 98
Commodities derivatives ‑ ‑ ‑ ‑ ‑ ‑ ‑
Credit derivatives ‑ ‑ ‑ 18 80 51 149
Other ‑ ‑ ‑ 187 64 839 1,090
Subtotal 729 671 128 13,409 25,975 59,160 100,072
Forward currency transactions ‑ ‑ ‑ 14,836 1,154 175 16,165
TOTAL FAIR VALUE OF TRANSACTION
DERIVATIVES - ASSETS 729 671 128 28,245 27,129 59,335 116,237

Consolidated financial statements of Credit Agricole S.A. 31 December 2020
10
5
(in millions of euros)
31/12/2019
Exchange-traded
transactions
Over-the-counter
transactions
Total
market
value ≤ 1 year
> 1 year
up to
≤ 5 years > 5 years ≤ 1 year
> 1 year
up to
≤ 5 years > 5 years
Interest rate instruments 9 2 ‑ 2,441 18,234 51,172 71,858
Futures 2 ‑ ‑ ‑ ‑ ‑ 2
FRAs ‑ ‑ ‑ 3 45 ‑ 48
Interest rate swaps ‑ ‑ ‑ 1,856 14,315 38,027 54,198
Interest rate options ‑ ‑ ‑ 122 2,455 11,868 14,445
Caps - floors - collars ‑ ‑ ‑ 460 1,419 1,277 3,156
Other options 7 2 ‑ ‑ ‑ ‑ 9
Currency instruments and gold ‑ ‑ ‑ 4,217 3,053 2,934 10,204
Currency futures ‑ ‑ ‑ 3,366 2,047 2,384 7,797
Currency options ‑ ‑ ‑ 851 1,006 550 2,407
Other instruments 352 451 71 1,598 4,944 1,483 8,899
Equity and index derivatives 352 451 71 1,324 4,815 1,113 8,126
Precious metal derivatives ‑ ‑ ‑ 43 ‑ ‑ 43
Commodities derivatives ‑ ‑ ‑ ‑ ‑ ‑ ‑
Credit derivatives ‑ ‑ ‑ 35 99 54 188
Other ‑ ‑ ‑ 196 30 316 542
Subtotal 361 453 71 8,256 26,231 55,589 90,961
Forward currency transactions ‑ ‑ ‑ 8,672 1,110 52 9,834
TOTAL FAIR VALUE OF TRANSACTION
DERIVATIVES - ASSETS 361 453 71 16,928 27,341 55,641 100,795

Consolidated financial statements of Credit Agricole S.A. 31 December 2020
10
6
DERIVATIVE INSTRUMENTS HELD FOR TRADING – FAIR VALUE OF LIABILITIES
(in millions of euros)
31/12/2020
Exchange-traded
transactions
Over-the-counter
transactions
Total
market
value ≤ 1 year
> 1 year
up to
≤ 5 years > 5 years ≤ 1 year
> 1 year
up to
≤ 5 years > 5 years
Interest rate instruments ‑ ‑ ‑ 3,712 16,093 54,021 73,826
Futures ‑ ‑ ‑ ‑ ‑ ‑ ‑
FRAs ‑ ‑ ‑ ‑ ‑ ‑ ‑
Interest rate swaps ‑ ‑ ‑ 3,211 12,660 36,934 52,805
Interest rate options ‑ ‑ ‑ 180 2,370 15,247 17,797
Caps - floors - collars ‑ ‑ ‑ 319 1,063 1,840 3,222
Other options ‑ ‑ ‑ 2 ‑ ‑ 2
Currency instruments and gold 1 ‑ ‑ 4,803 3,310 3,443 11,557
Currency futures ‑ ‑ ‑ 2,860 2,771 3,254 8,885
Currency options 1 ‑ ‑ 1,943 539 189 2,672
Other instruments 449 750 185 1,431 3,332 1,011 7,158
Equity and index derivatives 449 750 185 896 2,979 778 6,037
Precious metal derivatives ‑ ‑ ‑ 85 2 ‑ 87
Commodities derivatives ‑ ‑ ‑ ‑ ‑ ‑ ‑
Credit derivatives ‑ ‑ ‑ 195 318 30 543
Other ‑ ‑ ‑ 255 33 203 491
Subtotal 450 750 185 9,946 22,735 58,475 92,541
Forward currency transactions ‑ ‑ 15,604 1,324 (47) 16,881
TOTAL FAIR VALUE OF TRANSACTION
DERIVATIVES - LIABILITIES 450 750 185 25,550 24,059 58,428 109,422

Consolidated financial statements of Credit Agricole S.A. 31 December 2020
10
7
(in millions of euros)
31/12/2019
Exchange-traded
transactions
Over-the-counter
transactions
Total
market
value ≤ 1 year
> 1 year
up to
≤ 5 years > 5 years ≤ 1 year
> 1 year
up to
≤ 5 years > 5 years
Interest rate instruments 143 ‑ ‑ 2,271 17,649 52,459 72,522
Futures 140 ‑ ‑ ‑ ‑ ‑ 140
FRAs ‑ ‑ ‑ 24 ‑ ‑ 24
Interest rate swaps ‑ ‑ ‑ 1,904 13,788 37,895 53,587
Interest rate options ‑ ‑ ‑ 231 2,358 12,696 15,285
Caps - floors - collars ‑ ‑ ‑ 112 1,503 1,868 3,483
Other options 3 ‑ ‑ ‑ ‑ ‑ 3
Currency instruments and gold ‑ ‑ ‑ 4,431 2,668 2,609 9,708
Currency futures ‑ ‑ ‑ 3,500 2,145 2,317 7,962
Currency options ‑ ‑ ‑ 931 523 292 1,746
Other instruments 230 422 102 807 3,233 916 5,710
Equity and index derivatives 230 422 102 355 2,773 802 4,684
Precious metal derivatives ‑ ‑ ‑ 30 1 ‑ 31
Commodities derivatives ‑ ‑ ‑ 1 ‑ ‑ 1
Credit derivatives ‑ ‑ ‑ 226 406 38 670
Other ‑ ‑ ‑ 195 53 76 324
Subtotal 373 422 102 7,509 23,550 55,984 87,940
Forward currency transactions ‑ ‑ ‑ 8,553 1,704 221 10,478
TOTAL FAIR VALUE OF TRANSACTION
DERIVATIVES - LIABILITIES 373 422 102 16,062 25,254 56,205 98,418

Consolidated financial statements of Credit Agricole S.A. 31 December 2020
10
8
DERIVATIVE INSTRUMENTS: AMOUNT OF COMMITMENT
(in millions of euros)
31/12/2020 31/12/2019
Total notional
amount outstanding
Total notional
amount
outstanding
Interest rate instruments 11,804,270 11,697,571
Futures 115,284 155,872
FRAs 2,561,506 2,671,646
Interest rate swaps 7,785,348 7,306,091
Interest rate options 723,595 838,944
Caps - floors - collars 518,130 515,490
Other options 100,407 209,528
Currency instruments and gold 469,713 498,095
Currency futures 253,263 285,714
Currency options 216,450 212,381
Other instruments 176,663 159,995
Equity and index derivatives 117,820 104,119
Precious metal derivatives 3,863 3,848
Commodities derivatives 4 21
Credit derivatives 20,620 25,089
Other 34,356 26,918
Subtotal 12,450,646 12,355,661
Forward currency transactions 1,890,121 2,055,565
TOTAL NOTIONAL AMOUNT 14,340,767 14,411,226
Foreign exchange risk
(See chapter on “Risk management – Foreign exchange risk”)

Consolidated financial statements of Credit Agricole S.A. 31 December 2020
10
9
3.3 Liquidity and financing risk
(See chapter on “Risk factors – Balance sheet management”)
LOANS AND RECEIVABLES DUE FROM CREDIT INSTITUTIONS AND DUE FROM CUSTOMERS BY RESIDUAL MATURITY
(in millions of euros)
31/12/2020
≤ 3
months
> 3 months
to ≤ 1 year
> 1 year to
≤ 5 years > 5 years Indefinite Total
Loans and receivables due from credit
institutions (including Crédit Agricole
internal transactions) 82,369 79,813 219,775 81,593 ‑ 463,550
Loans and receivables due from customers
(including finance leases) 84,957 54,943 149,623 122,481 3,513 415,517
Total 167,326 134,756 369,398 204,074 3,513 879,067
Impairment (9,961)
TOTAL LOANS AND RECEIVABLES DUE FROM
CREDIT INSTITUTIONS AND FROM CUSTOMERS 869,106
(in millions of euros)
31/12/2019
≤ 3
months
> 3 months
to ≤ 1 year
> 1 year to
≤ 5 years > 5 years Indefinite Total
Loans and receivables due from credit
institutions (including Crédit Agricole
internal transactions) 100,183 94,240 160,197 84,376 ‑ 438,996
Loans and receivables due from customers
(including finance leases) 95,047 44,711 140,161 119,609 4,865 404,393
Total 195,230 138,951 300,358 203,985 4,865 843,389
Impairment (9,628)
TOTAL LOANS AND RECEIVABLES DUE FROM
CREDIT INSTITUTIONS AND FROM CUSTOMERS 833,761

Consolidated financial statements of Credit Agricole S.A. 31 December 2020
11
0
DUE TO CREDIT INSTITUTIONS AND TO CUSTOMERS BY RESIDUAL MATURITY
(in millions of euros)
31/12/2020
≤ 3
months
> 3 months
to ≤ 1 year
> 1 year to
≤ 5 years > 5 years Indefinite Total
Due to credit institutions (including Crédit
Agricole internal transactions) 96,706 8,684 148,029 11,500 ‑ 264,919
Due to customers 663,902 35,835 15,905 3,746 ‑ 719,388
TOTAL AMOUNT DUE TO CREDIT INSTITUTIONS
AND TO CUSTOMERS 760,608 44,519 163,934 15,246 ‑ 984,307
(in millions of euros)
31/12/2019
≤ 3
months
> 3 months
to ≤ 1 year
> 1 year to
≤ 5 years > 5 years Indefinite Total
Due to credit institutions (including Crédit
Agricole internal transactions) 80,562 18,248 30,550 12,681 ‑ 142,041
Due to customers 583,850 40,840 17,212 5,012 ‑ 646,914
TOTAL AMOUNT DUE TO CREDIT INSTITUTIONS
AND TO CUSTOMERS 664,412 59,088 47,762 17,693 ‑ 788,955

Consolidated financial statements of Credit Agricole S.A. 31 December 2020
11
1
DEBT SECURITIES AND SUBORDINATED DEBT
(in millions of euros)
31/12/2020
≤ 3 months > 3 months to
≤ 1 year
> 1 year to ≤ 5
years > 5 years Indefinite Total
Debt securities
Interest bearing notes ‑ ‑ ‑ ‑ ‑ ‑
Interbank securities 986 300 5,847 1,945 ‑ 9,078
Negotiable debt securities 34,140 13,783 1,275 30 ‑ 49,228
Bonds 4,387 7,789 49,344 39,860 ‑ 101,380
Other debt securities 559 723 1,458 121 ‑ 2,861
TOTAL DEBT SECURITIES 40,072 22,595 57,924 41,956 ‑ 162,547
Subordinated debt
Dated subordinated debt 274 1,603 5,942 15,482 ‑ 23,301
Undated subordinated debt 1 ‑ ‑ ‑ 510 511
Mutual security deposits ‑ ‑ ‑ ‑ 180 180
Participating securities and loans 60 ‑ ‑ ‑ ‑ 60
TOTAL SUBORDINATED DEBT 335 1,603 5,942 15,482 690 24,052

Consolidated financial statements of Credit Agricole S.A. 31 December 2020
11
2
(in millions of euros)
31/12/2019
≤ 3 months > 3 months to
≤ 1 year
> 1 year to ≤ 5
years > 5 years Indefinite Total
Debt securities
Interest bearing notes ‑ ‑ ‑ ‑ ‑ ‑
Interbank securities 706 835 6,195 1,553 ‑ 9,289
Negotiable debt securities 52,497 30,249 3,495 31 ‑ 86,272
Bonds 3,454 4,904 51,156 42,224 ‑ 101,738
Other debt securities 592 794 2,322 ‑ ‑ 3,708
TOTAL DEBT SECURITIES 57,249 36,782 63,168 43,808 ‑ 201,007
Subordinated debt
Dated subordinated debt 229 1,205 1,938 17,450 ‑ 20,822
Undated subordinated debt 12 1 ‑ ‑ 734 747
Mutual security deposits ‑ ‑ ‑ ‑ 167 167
Participating securities and loans 60 ‑ ‑ 1 ‑ 61
TOTAL SUBORDINATED DEBT 301 1,206 1,938 17,451 901 21,797
FINANCIAL GUARANTEES AT RISK GIVEN BY EXPECTED MATURITY
The amounts presented correspond to the expected amount of the call of financial guarantees at risk, i.e. guarantees that have been impaired or are on a watch-list.
(in millions of euros)
31/12/2020
≤ 3
months
> 3 months to
≤ 1 year
> 1 year to ≤
5 years
> 5 years Indefinite Total
Financial guarantees given 56 2,439 ‑ ‑ ‑ 2,495
(in millions of euros)
31/12/2019
≤ 3
months
> 3 months to
≤ 1 year
> 1 year to ≤
5 years
> 5 years Indefinite Total
Financial guarantees given 110 443 ‑ ‑ ‑ 553
Contractual maturities of derivative instruments are given in Note 3.2 “Market risk”.

Consolidated financial statements of Credit Agricole S.A. 31 December 2020
11
3
3.4 Hedge accounting
(See chapter 3.2 “Market risk” and chapter on “Risk management – Balance sheet management”)
FAIR VALUE HEDGES
A fair value hedge modifies the risk caused by changes in the fair value of a fixed-rate financial instrument as a result of changes in interest rates. Fair value hedges transform fixed-rate assets or liabilities
into floating-rate assets or liabilities.
Items hedged are principally fixed-rate loans, securities, deposits and subordinated debt.
FUTURE CASH FLOW HEDGES
A cash flow hedge modifies the risk related to variability in cash flows arising from floating-rate financial instruments.
Items hedged are principally floating-rate loans and deposits.
HEDGE OF NET INVESTMENT IN FOREIGN CURRENCY
A hedge of a net investment in foreign currency modifies the risk inherent in exchange rate fluctuations connected with foreign currency investments in subsidiaries.
HEDGING DERIVATIVES
(in millions of euros)
31/12/2020 31/12/2019
Market value
Notional amount
Market value
Notional
amount positive negative positive negative
Fair value hedges 19,607 15,002 807,514 17,323 13,030 820,803
Interest rate 19,396 14,567 786,419 16,877 12,797 779,632
Foreign exchange 211 435 21,095 446 233 41,171
Other ‑ ‑ ‑ ‑ ‑ ‑
Cash flow hedges 2,099 210 59,025 2,035 230 64,832
Interest rate 1,872 6 25,059 1,737 25 27,095
Foreign exchange 212 169 33,838 262 181 37,613
Other 15 35 128 36 24 124
Hedges of net investments in foreign operations 39 6 2,910 11 33 2,879
TOTAL HEDGING DERIVATIVE INSTRUMENTS 21,745 15,218 869,449 19,368 13,293 888,514

Consolidated financial statements of Credit Agricole S.A. 31 December 2020
11
4
DERIVATIVE INSTRUMENTS: ANALYSIS BY RESIDUAL MATURITY (NOTIONALS)
The breakdown of notionals values of derivative instruments is shown by remaining contractual maturity.
(in millions of euros)
31/12/2020
Exchange-traded Over-the-counter
Total
notional ≤ 1 year > 1 year up
to ≤ 5 years > 5 years ≤ 1 year > 1 year up
to ≤ 5 years > 5 years
Interest rate instruments ‑ ‑ ‑ 380,520 235,074 195,884 811,478
Futures ‑ ‑ ‑ ‑ ‑ ‑ ‑
FRAs ‑ ‑ ‑ ‑ ‑ ‑ ‑
Interest rate swaps ‑ ‑ ‑ 380,100 234,463 192,821 807,384
Interest rate options ‑ ‑ ‑ ‑ ‑ ‑ ‑
Caps - floors - collars ‑ ‑ ‑ 420 611 3,063 4,094
Other options ‑ ‑ ‑ ‑ ‑ ‑ ‑
Currency instruments ‑ ‑ ‑ 8,218 1,558 9 9,785
Currency futures ‑ ‑ ‑ 8,218 1,558 9 9,785
Currency options ‑ ‑ ‑ ‑ ‑ ‑ ‑
Other instruments ‑ ‑ ‑ 128 ‑ ‑ 128
Other ‑ ‑ ‑ 128 ‑ ‑ 128
Subtotal ‑ ‑ ‑ 388,866 236,632 195,893 821,391
Forward currency transactions ‑ ‑ ‑ 44,426 1,683 1,949 48,058
TOTAL NOTIONAL OF HEDGING DERIVATIVES ‑ ‑ ‑ 433,292 238,315 197,842 869,449

Consolidated financial statements of Credit Agricole S.A. 31 December 2020
11
5
(in millions of euros)
31/12/2019
Exchange-traded Over-the-counter
Total
notional ≤ 1 year
> 1 year up
to ≤ 5 years > 5 years ≤ 1 year
> 1 year up
to ≤ 5 years > 5 years
Interest rate instruments ‑ ‑ ‑ 355,048 221,898 229,781 806,727
Futures ‑ ‑ ‑ ‑ ‑ ‑ ‑
FRAs ‑ ‑ ‑ ‑ ‑ ‑ ‑
Interest rate swaps ‑ ‑ ‑ 354,994 220,867 226,530 802,391
Interest rate options ‑ ‑ ‑ ‑ ‑ ‑ ‑
Caps - floors - collars ‑ ‑ ‑ 54 1,031 3,251 4,336
Other options ‑ ‑ ‑ ‑ ‑ ‑ ‑
Currency instruments ‑ ‑ ‑ 9,658 1,051 ‑ 10,709
Currency futures ‑ ‑ ‑ 9,658 1,051 ‑ 10,709
Currency options ‑ ‑ ‑ ‑ ‑ ‑ ‑
Other instruments ‑ ‑ ‑ 124 ‑ ‑ 124
Other ‑ ‑ ‑ 124 ‑ ‑ 124
Subtotal ‑ ‑ ‑ 364,830 222,949 229,781 817,560
Forward currency transactions ‑ ‑ ‑ 68,264 785 1,905 70,954
TOTAL NOTIONAL OF HEDGING DERIVATIVES ‑ ‑ ‑ 433,094 223,734 231,686 888,514
Note 3.2 “Market risk – Derivative instruments: analysis by residual maturity” breaks down the market value of hedging derivative instruments by remaining contractual maturity.

Consolidated financial statements of Credit Agricole S.A. 31 December 2020
11
6
FAIR VALUE HEDGES
HEDGING DERIVATIVES
31/12/2020
Carrying amount Changes in fair value during the
period (including end of
hedges during the period)
Notional
Amount (in millions of euros) Assets Liabilities
Fair value hedges
Exchange-traded ‑ ‑ ‑ ‑
Interest rate ‑ ‑ ‑ ‑
Futures ‑ ‑ ‑ ‑
Options ‑ ‑ ‑ ‑
Foreign exchange ‑ ‑ ‑ ‑
Futures ‑ ‑ ‑ ‑
Options ‑ ‑ ‑ ‑
Other ‑ ‑ ‑ ‑
Over-the-counter markets 7,132 6,418 379 261,908
Interest rate 6,921 5,983 829 240,813
Futures 6,921 5,983 855 240,813
Options ‑ ‑ (26) ‑
Foreign exchange 211 435 (450) 21,095
Futures 211 435 (450) 21,095
Options ‑ ‑ ‑ ‑
Other ‑ ‑ ‑ ‑
Total Fair value micro-hedging 7,132 6,418 379 261,908
Fair value hedges of the interest
rate exposure of a portfolio of
financial instruments 12,475 8,584 558 545,606
TOTAL FAIR VALUE HEDGES 19,607 15,002 937 807,514

Consolidated financial statements of Credit Agricole S.A. 31 December 2020
11
7
31/12/2019
Carrying amount Changes in fair value during the
period (including end of
hedges during the period)
Notional
Amount (in millions of euros) Assets Liabilities
Fair value hedges
Exchange-traded ‑ ‑ ‑ ‑
Interest rate ‑ ‑ ‑ ‑
Futures ‑ ‑ ‑ ‑
Options ‑ ‑ ‑ ‑
Foreign exchange ‑ ‑ ‑ ‑
Futures ‑ ‑ ‑ ‑
Options ‑ ‑ ‑ ‑
Other ‑ ‑ ‑ ‑
Over-the-counter markets 6,111 4,781 1,867 279,122
Interest rate 5,665 4,548 1,722 237,951
Futures 5,665 4,548 1,756 237,950
Options ‑ ‑ (34) 1
Foreign exchange 446 233 145 41,171
Futures 446 233 145 41,171
Options ‑ ‑ ‑ ‑
Other ‑ ‑ ‑ ‑
Total Fair value micro-hedging 6,111 4,781 1,867 279,122
Fair value hedges of the interest
rate exposure of a portfolio of
financial instruments 11,212 8,249 1,910 541,681
TOTAL FAIR VALUE HEDGES 17,323 13,030 3,777 820,803
Changes in the fair value of hedging derivatives are recognised under “Net gains (losses) on financial instruments at fair value through profit or loss” in the income statement.

Consolidated financial statements of Credit Agricole S.A. 31 December 2020
11
8
HEDGED ITEMS
Micro-hedging 31/12/2020
Present hedges Ended hedges Fair value hedge
adjustments
during the period
(including
termination of
hedges during
the period)
(in millions of euros) Carrying
amount
of which
accumulated
fair value
hedge
adjustments
Accumulated fair
value hedge
adjustments to be
adjusted for
hedging remaining
to be amortised
Debt instruments at fair value through other
comprehensive income that may be
reclassified to profit or loss 32,615 730 ‑ 147
Interest rate 32,615 730 ‑ 147
Foreign exchange ‑ ‑ ‑ ‑
Other ‑ ‑ ‑ ‑
Debt instruments at amortised cost 80,931 2,286 83 965
Interest rate 76,019 2,030 83 664
Foreign exchange 4,912 256 ‑ 301
Other ‑ ‑ ‑ ‑
Total Fair value hedges on assets items 113,546 3,016 83 1,112
Debt instruments at amortised cost 153,186 5,842 1 1,493
Interest rate 142,106 5,800 1 1,640
Foreign exchange 11,080 42 ‑ (147)
Other ‑ ‑ ‑ ‑
Total Fair value hedges on liabilities items 153,186 5,842 1 1,493

Consolidated financial statements of Credit Agricole S.A. 31 December 2020
11
9
Micro-hedging 31/12/2019
Present hedges Ended hedges
Fair value hedge
adjustments
during the period
(including
termination of
hedges during
the period)
(in millions of euros) Carrying
amount
of which
accumulated
fair value
hedge
adjustments
Accumulated fair
value hedge
adjustments to be
adjusted for
hedging remaining
to be amortised
Debt instruments at fair value through other
comprehensive income that may be
reclassified to profit or loss 26,669 66 ‑ 38
Interest rate 26,669 66 ‑ 40
Foreign exchange ‑ ‑ ‑ (2)
Other ‑ ‑ ‑ ‑
Debt instruments at amortised cost 88,997 1,316 ‑ 668
Interest rate 75,570 1,307 ‑ 755
Foreign exchange 13,427 9 ‑ (87)
Other ‑ ‑ ‑ ‑
Total Fair value hedges on assets items 115,666 1,382 ‑ 706
Debt instruments at amortised cost 158,351 4,578 3 2,573
Interest rate 136,324 4,520 3 2,532
Foreign exchange 22,027 58 ‑ 41
Other ‑ ‑ ‑ ‑
Total Fair value hedges on liabilities items 158,351 4,578 3 2,573
The fair value of the hedged portions of macro-hedged financial instruments at fair value is recognised under “Revaluation adjustment on interest rate hedged portfolios” on the balance sheet. Changes
in the fair value of the hedged portions of macro-hedged financial instruments at fair value are recognised under “Net gains (losses) on financial instruments at fair value through profit or loss” in the income
statement.

Consolidated financial statements of Credit Agricole S.A. 31 December 2020
12
0
Macro-hedging 31/12/2020
(in millions of euros)
Carrying amount
Accumulated fair value hedge
adjustments to be adjusted for hedging
remaining to be adjusted, on ended
hedges
Debt instruments at fair value through
other comprehensive income that may
be reclassified to profit or loss 5,874 ‑
Debt instruments at amortised cost 342,226 (3)
Total - Assets 348,100 (3)
Debt instruments at amortised cost 216,910 58
Total - Liabilities 216,910 58
Macro-hedging 31/12/2019
(in millions of euros)
Carrying amount Accumulated fair value hedge
adjustments to be adjusted for hedging
remaining to be adjusted, on ended
hedges
Debt instruments at fair value through
other comprehensive income that may
be reclassified to profit or loss 6,424 ‑
Debt instruments at amortised cost 292,921 59
Total - Assets 299,345 59
Debt instruments at amortised cost 244,959 24
Total - Liabilities 244,959 24
The fair value of the hedged portions of macro-hedged financial instruments at fair value is recognised under “Revaluation adjustment on interest rate hedged portfolios” on the balance sheet. Changes
in the fair value of the hedged portions of macro-hedged financial instruments at fair value are recognised under “Net gains (losses) on financial instruments at fair value through profit or loss” in the income
statement.

Consolidated financial statements of Credit Agricole S.A. 31 December 2020
12
1
GAINS (LOSSES) FROM HEDGE ACCOUNTING
(in millions of euros)
31/12/2020
Net Income (Total Gains (losses) from hedge accounting)
Change in fair value of hedging
derivatives (including
termination of hedges)
Change in fair value of hedged
items (including termination of
hedges)
Hedge
ineffectiveness
portion
Interest rate 1,387 (1,411) (24)
Foreign exchange (450) 448 (2)
Other ‑ ‑ ‑
TOTAL 937 (963) (26)
(in millions of euros)
31/12/2019
Net Income (Total Gains (losses) from hedge accounting)
Change in fair value of hedging
derivatives (including
termination of hedges)
Change in fair value of hedged
items (including termination of
hedges)
Hedge
ineffectiveness
portion
Interest rate 3,632 (3,652) (19)
Foreign exchange 145 (131) 13
Other ‑ ‑ ‑
TOTAL 3,777 (3,783) (6)

Consolidated financial statements of Credit Agricole S.A. 31 December 2020
12
2
CASH FLOW HEDGES AND HEDGES OF NET INVESTMENTS IN FOREIGN OPERATION (NIH)
HEDGING DERIVATIVES
31/12/2020
Carrying amount Changes in fair value during the
period (including termination of
hedges during the period)
Notional
amount (in millions of euros) Assets Liabilities
Cash flow hedges
Exchange-traded ‑ ‑ ‑ ‑
Interest rate ‑ ‑ ‑ ‑
Futures ‑ ‑ ‑ ‑
Options ‑ ‑ ‑ ‑
Foreign exchange ‑ ‑ ‑ ‑
Futures ‑ ‑ ‑ ‑
Options ‑ ‑ ‑ ‑
Other ‑ ‑ ‑ ‑
Over-the-counter markets 946 191 (189) 31,626
Interest rate 726 3 (229) 3,562
Futures 726 3 (229) 3,561
Options ‑ ‑ ‑ 1
Foreign exchange 205 153 40 27,936
Futures 205 153 40 27,936
Options ‑ ‑ ‑ ‑
Other 15 35 ‑ 128
Total Cash flow micro-hedging 946 191 (189) 31,626
Cash flow hedges of the interest
rate exposure of a portfolio of
financial instruments 1,146 3 385 21,497
Cash flow hedges of the foreign
exchange exposure of a portfolio
of financial instruments 7 16 (83) 5,902
Total Cash flow macro-hedging 1,153 19 302 27,399
Total Cash flow hedges 2,099 210 113 59,025
HEDGES OF NET INVESTMENTS IN
FOREIGN OPERATIONS 39 6 45 2,910

Consolidated financial statements of Credit Agricole S.A. 31 December 2020
12
3
31/12/2019
Carrying amount Changes in fair value during the
period (including termination of
hedges during the period)
Notional
amount (in millions of euros) Assets Liabilities
Cash flow hedges
Exchange-traded ‑ ‑ ‑ ‑
Interest rate ‑ ‑ ‑ ‑
Futures ‑ ‑ ‑ ‑
Options ‑ ‑ ‑ ‑
Foreign exchange ‑ ‑ ‑ ‑
Futures ‑ ‑ ‑ ‑
Options ‑ ‑ ‑ ‑
Other ‑ ‑ ‑ ‑
Over-the-counter markets 1,237 172 79 37,605
Interest rate 952 ‑ 90 7,010
Futures 952 ‑ 90 7,010
Options ‑ ‑ ‑ ‑
Foreign exchange 249 148 (11) 30,470
Futures 249 148 (11) 30,470
Options ‑ ‑ ‑ ‑
Other 36 24 ‑ 125
Total Cash flow micro-hedging 1,237 172 79 37,605
Cash flow hedges of the interest
rate exposure of a portfolio of
financial instruments 785 25 163 20,085
Cash flow hedges of the foreign
exchange exposure of a portfolio
of financial instruments 13 33 (2) 7,142
Total Cash flow macro-hedging 798 58 161 27,227
Total Cash flow hedges 2,035 230 240 64,832
HEDGES OF NET INVESTMENTS IN
FOREIGN OPERATIONS 11 33 (13) 2,879
Changes in the fair value of hedging derivatives are recognised under “Other comprehensive income” save for the ineffective portion of the hedging relationship which is recognised under “Net gains
(losses) on financial instruments at fair value through profit or loss” in the income statement.

Consolidated financial statements of Credit Agricole S.A. 31 December 2020
12
4
GAINS (LOSSES) FROM HEDGE ACCOUNTING
(in millions of euros)
31/12/2020
Other comprehensive income on items that may be
reclassified to profit and loss
Net income
(Hedge accounting income or
loss)
Effective portion of the
hedge recognised during
the period
Amount reclassified from
other comprehensive
income into profit or loss
during the period
Hedge ineffectiveness portion
Cash flow hedges ‑ ‑ ‑
Interest rate 157 ‑ ‑
Foreign exchange (44) ‑ ‑
Other ‑ ‑ ‑
Total Cash flow hedges 113 ‑ ‑
Hedges of net investments in foreign operations 45 ‑ ‑
TOTAL CASH FLOW HEDGES AND HEDGES OF NET
INVESTMENTS IN FOREIGN OPERATIONS 158 ‑ ‑
(in millions of euros)
31/12/2019
Other comprehensive income on items that may be
reclassified to profit and loss
Net income
(Hedge accounting income or
loss)
Effective portion of the
hedge recognised during
the period
Amount reclassified from
other comprehensive
income into profit or loss
during the period Hedge ineffectiveness portion
Cash flow hedges ‑ ‑ ‑
Interest rate 258 ‑ ‑
Foreign exchange (6) ‑ ‑
Other ‑ ‑ ‑
Total Cash flow hedges 252 ‑ ‑
Hedges of net investments in foreign operations (10) ‑ ‑
TOTAL CASH FLOW HEDGES AND HEDGES OF NET
INVESTMENTS IN FOREIGN OPERATIONS 242 ‑ ‑

Consolidated financial statements of Credit Agricole S.A. 31 December 2020
12
5
3.5 Operational risks
(See chapter on “Risk factors – Operational risks”)
3.6 Capital management and regulatory ratios
The Crédit Agricole S.A. Finance department is tasked with ensuring the adequacy of liquidity and capital between the requirements generated by the Group’s global operations and its liquidity and
capital financial resources. It is responsible for monitoring the prudential and regulatory ratios (solvency, liquidity, leverage, resolution) of Crédit Agricole Group and of Crédit Agricole S.A. To this end, it sets
out the principles and ensures a cohesive financial management system throughout the Group.
Information on capital management and compliance with regulatory ratios as required by IAS 1 is presented in the Chapter “Risk factors and Pillar 3”.
The Group’s management of banking risks is handled by the Group Risk Management and Permanent Controls department. This department reports to the Chief Executive Officer of Crédit Agricole S.A.
and its task is to control credit, financial and operational risks.
A description of these processes and commentary appear in the chapter on “Risk management” in the management report, as allowed by IFRS 7. Nonetheless, the accounting breakdowns are still
presented in the financial statements.

Consolidated financial statements of Credit Agricole S.A. 31 December 2020
126
NOTE 4 Notes on net income and other comprehensive income
4.1 Interest income and expenses
(in millions of euros) 31/12/2020 31/12/2019
On financial assets at amortised cost 16,100 17,407
Interbank transactions 1,856 1,702
Crédit Agricole internal transactions 2,790 2,877
Customer transactions 10,196 11,429
Finance leases 700 610
Debt securities 558 789
On financial assets recognised at fair value through other comprehensive income 4,919 5,312
Interbank transactions ‑ ‑
Customer transactions ‑ ‑
Debt securities 4,919 5,312
Accrued interest receivable on hedging instruments 2,455 2,351
Other interest income 60 37
INTEREST AND SIMILAR INCOME ¹ ² 23,534 25,107
On financial liabilities at amortised cost (10,734) (12,706)
Interbank transactions (1,103) (1,376)
Crédit Agricole internal transactions (1,282) (1,008)
Customer transactions (4,665) (6,016)
Finance leases (194) (68)
Debt securities (2,944) (3,605)
Subordinated debt (546) (633)
Accrued interest receivable on hedging instruments (908) (872)
Other interest expenses (74) (85)
INTEREST AND SIMILAR EXPENSES ³ (11,716) (13,663)
¹ Of which €185 million for impaired receivables (Bucket 3) at 31 December 2020 versus €136 million at 31 December 2019.
² Of which €991 million for negative interest on financial liabilities at 31 December 2020 (€288 million at 31 December 2019)
3 Of which -€1.08 billion for negative interest on financial assets at 31 December 2020 (-€434 million at 31 December 2019)

Consolidated financial statements of Credit Agricole S.A. 31 December 2020
127
4.2 Fees and commissions income and expense
31/12/2020 31/12/2019
(in millions of euros) Income Expense Net Income Expense Net
Interbank transactions 239 (52) 187 261 (43) 218
Crédit Agricole internal transactions 973 (403) 570 803 (477) 326
Customer transactions 1,188 (185) 1,003 1,763 (211) 1,552
Securities transactions 54 (149) (95) 49 (99) (50)
Foreign exchange transactions 42 (39) 3 41 (44) (3)
Derivative instruments and other off-balance sheet items 384 (201) 183 342 (249) 93
Payment instruments and other banking and financial
services 2,982 (4,013) (1,031) 2,506 (3,762) (1,256)
Mutual funds management, fiduciary and similar operations 4,817 (1,416) 3,401 4,792 (1,616) 3,176
TOTAL FEES AND COMMISSIONS INCOME AND EXPENSE 10,679 (6,458) 4,221 10,556 (6,500) 4,057
Large customers and Retail banking (French and International) are the main contributors of the commission income
from the Savings Management and Insurance and Specialized Financial Services businesses.
Commission income from managing Mutual funds, trusts and similar activities are mainly related to savings and
insurance management activities.
4.3 Net gains (losses) on financial instruments at fair value through profit or loss
(in millions of euros) 31/12/2020 31/12/2019
Dividends received 937 1,505
Unrealised or realised gains (losses) on held for trading assets/liabilities 2,853 3,878
Unrealised or realised gains (losses) on equity instruments at fair value through profit or loss (2,770) 3,462
Unrealised or realised gains (losses) on debt instruments that do not meet the conditions of the
“SPPI” test 716 2,860
Net gains (losses) on assets backing unit-linked contracts 1,153 6,440
Unrealised or realised gains (losses) on assets/liabilities designated at fair value through profit or
loss ¹ (647) (1,771)
Net gains (losses) on Foreign exchange transactions and similar financial instruments (excluding
gains or losses on hedges of net investments in foreign operations) 40 713
Gains (losses) from hedge accounting (26) (6)
NET GAINS (LOSSES) ON FINANCIAL INSTRUMENTS AT FAIR VALUE THROUGH PROFIT OR LOSS 2,256 17,082
¹ Except spread of issuer loan for liabilities at fair value through equity non-recyclable

Consolidated financial statements of Credit Agricole S.A. 31 December 2020
128
Analysis of net gains (losses) from hedge accounting:
(in millions of euros)
31/12/2020
Gains Losses Net
Fair value hedges 5,208 (5,210) (2)
Changes in fair value of hedged items attributable to hedged risks 2,069 (2,450) (381)
Changes in fair value of hedging derivatives (including termination of hedges) 3,139 (2,760) 379
Cash flow hedges ‑ ‑ ‑
Changes in fair value of hedging derivatives - ineffective portion ‑ ‑ ‑
Hedges of net investments in foreign operations ‑ ‑ ‑
Changes in fair value of hedging derivatives - ineffective portion ‑ ‑ ‑
Fair value hedges of the interest rate exposure of a portfolio of financial
instruments 6,600 (6,624) (24)
Changes in fair value of hedged items 3,122 (3,704) (582)
Changes in fair value of hedging derivatives 3,478 (2,920) 558
Cash flow hedges of the interest rate exposure of a portfolio of financial
instruments ‑ ‑ ‑
Changes in fair value of hedging instrument - ineffective portion ‑ ‑ ‑
TOTAL GAINS (LOSSES) FROM HEDGE ACCOUNTING 11,808 (11,834) (26)
(in millions of euros)
31/12/2019
Gains Losses Net
Fair value hedges 6,362 (6,363) (1)
Changes in fair value of hedged items attributable to hedged risks 2,283 (4,151) (1,868)
Changes in fair value of hedging derivatives (including termination of hedges) 4,079 (2,212) 1,867
Cash flow hedges ‑ ‑ ‑
Changes in fair value of hedging derivatives - ineffective portion ‑ ‑ ‑
Hedges of net investments in foreign operations ‑ ‑ ‑
Changes in fair value of hedging derivatives - ineffective portion ‑ ‑ ‑
Fair value hedges of the interest rate exposure of a portfolio of financial
instruments 10,837 (10,842) (5)
Changes in fair value of hedged items 4,401 (6,316) (1,915)
Changes in fair value of hedging derivatives 6,436 (4,526) 1,910
Cash flow hedges of the interest rate exposure of a portfolio of financial
instruments ‑ ‑ ‑
Changes in fair value of hedging instrument - ineffective portion ‑ ‑ ‑
TOTAL GAINS (LOSSES) FROM HEDGE ACCOUNTING 17,199 (17,205) (6)
Details of gains (losses) from hedge accounting by type of relationship (fair value hedges, cash flow hedges, etc.) are
presented in Note 3.4 “Hedge accounting”.

Consolidated financial statements of Credit Agricole S.A. 31 December 2020
129
4.4 Net gains (losses) on financial instruments at fair value through other
comprehensive income
(in millions of euros) 31/12/202
0
31/12/2019
Net gains (losses) on debt instruments at fair value through other comprehensive
income that may be reclassified subsequently to profit or loss ¹ 524 47
Remuneration of equity instruments measured at fair value through other
comprehensive income that will not be reclassified subsequently to profit or loss
(dividends) ² 62 115
NET GAINS (LOSSES) ON FINANCIAL INSTRUMENTS AT FAIR VALUE THROUGH OTHER
COMPREHENSIVE INCOME 586 162
¹ Excluding realised gains or losses from impaired debt instruments (Bucket 3) mentioned in Note 4.9 “Cost of
risk”.
² Of which €19 million dividends on equity instruments at fair value through non-recyclable equity derecognised
during the period.
4.5 Net gains (losses) arising from the derecognition of financial assets at
amortised cost
(in millions of euros) 31/12/2020 31/12/2019
Debt securities 29 8
Loans and receivables due from credit institutions ‑ ‑
Loans and receivables due from customers ‑ 1
Gains arising from the derecognition of financial assets at amortised cost 29 9
Debt securities ‑ (1)
Loans and receivables due from credit institutions ‑ ‑
Loans and receivables due from customers (4) (17)
Losses arising from the derecognition of financial assets at amortised cost (4) (18)
NET GAINS (LOSSES) ARISING FROM THE DERECOGNITION OF FINANCIAL ASSETS AT
AMORTISED COST ¹ 25 (9)
¹ Excluding realised gains or losses from the derecognition of impaired debt instruments (Bucket 3) mentioned in Note
4.9 "Cost of risk"
4.6 Net income (expenses) on other activities
(in millions of euros) 31/12/2020 31/12/2019
Gains (losses) on fixed assets not used in operations (18) (15)
Other net income from insurance activities ¹ 5,674 13,800
Change in insurance technical reserves ² (4,373) (26,163)
Net income from investment property 165 140
Other net income (expense) (46) 100
INCOME (EXPENSE) RELATED TO OTHER ACTIVITIES 1,402 (12,139)
¹ The €8,126 million decrease in other net income from insurance activities was mainly due to a decrease in net inflows
in the amount of €8,100 million on the Retirement Savings activity.
² The €21,790 million decrease in insurance company technical reserves is due in the main to the net positive inflows
and the adjustments evolution of the value on the unit-linked policies.

Consolidated financial statements of Credit Agricole S.A. 31 December 2020
130
4.7 Operating expenses
(in millions of euros) 31/12/2020 31/12/2019
Employee expenses (7,234) (7,147)
Taxes other than on income or payroll-related and regulatory contributions ¹ (924) (816)
External services and other operating expenses (3,590) (3,749)
OPERATING EXPENSES (11,748) (11,713)
¹ Of which -€444 million recognised in relation to the Single Resolution Fund at 31 december 2020 (-€342 million at 31
december 2019)
FEES PAID TO STATUTORY AUDITORS
The breakdown of fees paid to Statutory Auditors by firm and type of engagement by fully consolidated Crédit
Agricole S.A. companies was as follows in 2020:
BOARD OF AUDITORS OF CRÉDIT AGRICOLE S.A.:
(in millions of euros excluding taxes)
Ernst & Young PricewaterhouseCoopers
Total 2020 2020 2019 2020 2019
Statutory audit, certification, review of
individual and consolidated financial
statements 15.89 16.45 14.82 14.79 30.71
Issuer 2.17 1.90 2.19 1.92 4.36
Fully consolidated subsidiaries 13.72 14.55 12.63 12.87 26.35
Non audit services 4.45 5.53 7.61 6.04 12.06
Issuer 0.48 0.46 0.94 0.96 1.42
Fully consolidated subsidiaries 3.97 5.07 6.67 5.08 10.64
TOTAL 20.34 21.98 22.43 20.83 42.77
The total sum of fees paid to PricewaterhouseCoopers Audit, Statutory Auditor of Crédit Agricole S.A., appearing in
the consolidated income statement for the year, amounts to €10.7 million, of which €9 million relates to the
certification of the accounts of Crédit Agricole S.A. and its subsidiaries, and €1.7 million relates to non-audit services
(comfort letters, agreed-upon procedures, responsibility statements, services relating to social and environmental
information, consultations, etc.).
The total sum of fees paid to Ernst & Young & Autres, Statutory Auditor of Crédit Agricole S.A., appearing in the
consolidated income statement for the year, amounts to €7.2 million, of which €6.1 million relates to the certification
of the accounts of Crédit Agricole S.A. and its subsidiaries, and €1.1 million relates to non-audit services (comfort
letters, agreed-upon procedures, responsibility statements, review of tax returns, consultations, etc.).
OTHER STATUTORY AUDITORS ENGAGED IN THE AUDIT OF FULLY CONSOLIDATED CRÉDIT AGRICOLE S.A. SUBSIDIARIES
(in millions of euros excluding taxes) Mazars KPMG Deloitte Autres Total
2020 2020 2019 2020 2019 2020 2019 2020 2019
Statutory audit, certification, review of
individual and consolidated financial
statements 1.35 1.12 0.21 0.38 0.22 0.18 0.48 0.30 2.26
Non audit services ¹ 0.09 0.06 0.09 0.01 0.01 0.01 0.01 ‑ 0.20
TOTAL 1.44 1.18 0.30 0.39 0.23 0.19 0.49 0.30 2.46
¹ Non audit services identified in this table correspond to assigments performed by these firms in the companies where
they are statutory auditors.

Consolidated financial statements of Credit Agricole S.A. 31 December 2020
131
4.8 Amortisation of intangible assets and depreciation of property, plant and
equipment
(in millions of euros) 31/12/2020 31/12/2019
Depreciation and amortisation (1,142) (1,047)
Property, plant and equipment ¹ (744) (678)
Intangible assets (398) (369)
Impairment losses (reversals) (1) (1)
Property, plant and equipment 1 (1)
Intangible assets (2) ‑
DEPRECIATION, AMORTISATION AND IMPAIRMENT OF PROPERTY, PLANT & EQUIPMENT AND
INTANGIBLE ASSETS (1,143) (1,048)
¹ Of which -€380 million accounted for under the depreciation of the right-of-use asset at 31 December 2020 and -€307 million at 31
December 2019.

Consolidated financial statements of Credit Agricole S.A. 31 December 2020
132
4.9 Cost of risk
(in millions of euros) 31/12/2020 31/12/2019
Charges net of reversals to impairments on performing assets (Bucket 1 or Bucket 2) (A) (817) 216
Bucket 1 : Loss allowance measured at an amount equal to 12-month expected credit
loss (246) 24
Debt instruments at fair value through other comprehensive income that may be
reclassified to profit or loss (5) (1)
Debt instruments at amortised cost (214) 24
Commitments by signature (27) 1
Bucket 2 : Loss allowance measured at an amount equal to lifetime expected credit
loss (571) 192
Debt instruments at fair value through other comprehensive income that may be
reclassified to profit or loss (2) (1)
Debt instruments at amortised cost (502) 129
Commitments by signature (67) 64
Charges net of reversals to impairments on credit-impaired assets (Bucket 3) (B) (1,733) (1,326)
Debt instruments at fair value through other comprehensive income that may be
reclassified to profit or loss ‑ ‑
Debt instruments at amortised cost (1,780) (1,195)
Commitments by signature 47 (131)
Other assets (C) (11) (164)
Risks and expenses (D) (13) (15)
Charges net of reversals to impairment losses and provisions (E) = (A)+(B)+(C)+(D) (2,574) (1,289)
Realised gains (losses) on disposal of impaired debt instruments at fair value through other
comprehensive income that may be reclassified to profit or loss ‑ ‑
Realised gains (losses) on impaired debt instruments at amortised cost ‑ ‑
Losses on non-impaired loans and bad debt (184) (223)
Recoveries on loans and receivables written off 186 345
recognised at amortised cost 186 345
recognised in other comprehensive income that may be reclassified to profit or loss ‑ ‑
Discounts on restructured loans (27) (29)
Losses on commitments by signature (1) ‑
Other losses (75) (74)
Other gains 69 14
COST OF RISK (2,606) (1,256)

Consolidated financial statements of Credit Agricole S.A. 31 December 2020
133
4.10 Net gains (losses) on other assets
(in millions of euros) 31/12/2020 31/12/2019
Property, plant & equipment and intangible assets used in operations 62 51
Gains on disposals 87 59
Losses on disposals (25) (8)
Consolidated equity investments 1 22
Gains on disposals 11 25
Losses on disposals (10) (3)
Net income (expense) on combinations 12 (19)
NET GAINS (LOSSES) ON OTHER ASSETS 75 54
4.11 Income tax charge
INCOME TAX CHARGE
(in millions of euros) 31/12/2020 31/12/2019
Current tax charge (1,485) (464)
Deferred tax charge 254 (43)
Reclassification of current tax charge (income) related to overlay approach 102 51
TOTAL TAX CHARGE (1,129) (456)
RECONCILIATION OF THEORETICAL TAX RATE AND EFFECTIVE TAX RATE
As at 31 December 2020
(in millions of euros) Base Tax rate Tax
Pre-tax income, goodwill impairment, discontinued operations and share of net
income of equity-accounted entities 5,078 32.02% (1,626)
Impact of permanent differences (5.30)% 269
Impact of different tax rates on foreign subsidiaries (2.88)% 146
Impact of losses for the year, utilisation of tax loss carryforwards and temporary
differences (0.18)% 9
Impact of reduced tax rate (0.66)% 34
Impact of other items (0.76)% 39
EFFECTIVE TAX RATE AND TAX CHARGE 22.23% (1,129)
The theoretical tax rate is the standard tax rate (including the additional social contribution) on taxable profits in
France at 31 December 2020.

Consolidated financial statements of Credit Agricole S.A. 31 December 2020
134
AT 31 DECEMBER 2019
(in millions of euros) Base Tax rate Tax
Pre-tax income, goodwill impairment, discontinued operations and share of net
income of equity-accounted entities 6,190 34.43% (2,131)
Impact of permanent differences (21.87)% 1,354
Impact of different tax rates on foreign subsidiaries (3.28)% 203
Impact of losses for the year, utilisation of tax loss carryforwards and temporary
differences (0.10)% 6
Impact of reduced tax rate (0.99)% 61
Impact of other items (0.82)% 51
EFFECTIVE TAX RATE AND TAX CHARGE ¹ 7.37% (456)
¹ Excluding Emporiki tax income, the effective tax rate was 24.59% at 31 December 2019.
The theoretical tax rate is the standard tax rate (including the additional social contribution) on taxable profits in France
at 31 December 2019.

Consolidated financial statements of Credit Agricole S.A. 31 December 2020
135
4.12 Changes in other comprehensive income
The breakdown of income and expenses recognised for the period is presented below:
BREAKDOWN OF TOTAL OTHER COMPREHENSIVE INCOME
(in millions of euros) 31/12/2020 31/12/2019
Other comprehensive income on items that may be reclassified subsequently to profit or loss net of
income tax
Gains and losses on translation adjustments (805) 301
Revaluation adjustment of the period (805) 301
Reclassified to profit or loss ‑ ‑
Other changes ‑ ‑
Gains and losses on debt instruments at fair value through other comprehensive income that may
be reclassified to profit or loss 549 1,189
Revaluation adjustment of the period 712 1,181
Reclassified to profit or loss (121) (38)
Other changes (42) 46
Gains and losses on hedging derivative instruments 323 361
Revaluation adjustment of the period 326 364
Reclassified to profit or loss ‑ ‑
Other changes (3) (3)
Reclassification of net gains (losses) of designated financial assets applying the overlay approach (197) 434
Revaluation adjustment of the period (197) 445
Reclassified to profit or loss ‑ ‑
Other changes ‑ (11)
Pre-tax other comprehensive income on items that may be reclassified to profit or loss on equity-
accounted entities (136) 9
Income tax related to items that may be reclassified to profit or loss excluding equity-accounted
entities (277) (481)
Income tax related to items that may be reclassified to profit or loss on equity-accounted entities ‑ 1
Other comprehensive income on items that may be reclassified to profit or loss from discontinued
operations (10) (12)
Other comprehensive income on items that may be reclassified subsequently to profit or loss net of
income tax (553) 1,802
Other comprehensive income on items that will not be reclassified subsequently to profit or loss net
of income tax
Actuarial gains and losses on post-employment benefits (93) (162)
Other comprehensive income on financial liabilities attributable to changes in own credit risk (149) (74)
Revaluation adjustment of the period (155) (86)
Reclassified to reserves 6 12
Other changes ‑ ‑
Other comprehensive income on equity instruments that will not be reclassified to profit or loss (81) 53
Revaluation adjustment of the period (118) 77
Reclassified to reserves 45 20
Other changes (8) (44)
Pre-tax other comprehensive income on items that will not be reclassified to profit or loss on equity-
accounted entities 3 (30)
Income tax related to items that will not be reclassified to profit or loss excluding equity-accounted
entities 94 71
Income tax related to items that will not be reclassified to profit or loss on equity-accounted entities (2) 8
Other comprehensive income on items that will not be reclassified to profit or loss from discontinued
operations ‑ 3
Other comprehensive income on items that will not be reclassified subsequently to profit or loss net
of income tax (228) (131)
OTHER COMPREHENSIVE INCOME NET OF INCOME TAX (781) 1,671
Of which Group share (678) 1,620
Of which non-controlling interests (103) 51

Consolidated financial statements of Credit Agricole S.A. 31 December 2020
13
6
BREAKDOWN OF TAX IMPACTS RELATED TO OTHER COMPREHENSIVE INCOME
31/12/2019 Changes 31/12/2020
(in millions of euros) Gross
Income tax
charges
Net of
income tax
Net of
income tax
of which
Group Share
Gross
Income tax
charges
Net of
income tax
Net of
income tax
of which
Group Share
Gross
Income tax
charges
Net of
income tax
Net of
income tax
of which
Group Share
Other comprehensive income on items that may be reclassified subsequently to profit
or loss
Gains and losses on translation adjustments 57 (4) 53 117 (805) (2) (807) (762) (748) (6) (754) (645)
Gains and losses on debt instruments at fair value through other comprehensive
income that may be reclassified to profit or loss 3,666 (954) 2,712 2,699 549 (134) 415 410 4,215 (1,088) 3,127 3,109
Gains and losses on hedging derivative instruments 848 (259) 589 582 323 (41) 282 277 1,171 (300) 871 859
Reclassification of net gains (losses) of designated financial assets applying the
overlay approach 587 87 674 674 (197) (100) (297) (298) 390 (13) 377 376
Other comprehensive income on items that may be reclassified to profit or loss
excluding equity-accounted entities 5,158 (1,130) 4,028 4,072 (130) (277) (408) (373) 5,028 (1,407) 3,620 3,699
Other comprehensive income on items that may be reclassified to profit or loss on
equity-accounted entities (13) 2 (11) (8) (136) ‑ (135) (100) (149) 3 (146) (108)
Other comprehensive income on items that may be reclassified to profit or loss on
equity-accounted entities on discontinued operations ‑ (1) (1) (1) (10) ‑ (10) (10) (10) (1) (11) (11)
Other comprehensive income on items that may be reclassified subsequently to profit
or loss
5,145 (1,129) 4,016 4,063 (276) (277) (553) (483) 4,869 (1,405) 3,463 3,580
Other comprehensive income on items that will not be reclassified subsequently to
profit or loss
Actuarial gains and losses on post-employment benefits (863) 193 (670) (624) (93) 19 (74) (68) (956) 212 (744) (691)
Other comprehensive income on financial liabilities attributable to changes in own
credit risk (214) 57 (157) (153) (149) 40 (109) (106) (363) 97 (266) (260)
Other comprehensive income on equity instruments that will not be reclassified to
profit or loss (309) (45) (354) (381) (81) 35 (46) (22) (390) (10) (400) (403)
Other comprehensive income on items that will not be reclassified to profit or loss
excluding equity-accounted entities (1,386) 205 (1,181) (1,158) (323) 94 (229) (196) (1,709) 299 (1,410) (1,354)
Other comprehensive income on items that will not be reclassified to profit or loss on
equity-accounted entities (57) (7) (63) (62) 3 (2) 1 1 (54) (9) (62) (61)
Other comprehensive income on items that will not be reclassified to profit or loss from
discontinued operations 1 ‑ 1 ‑ ‑ ‑ ‑ ‑ 1 ‑ 1 ‑
Other comprehensive income on items that will not be reclassified subsequently to
profit or loss (1,442) 198 (1,243) (1,220) (320) 92 (228) (195) (1,762) 290 (1,471) (1,415)
OTHER COMPREHENSIVE INCOME 3,703 (931) 2,773 2,843 (596) (185) (781) (678) 3,107 (1,115) 1,992 2,165

Consolidated financial statements of Credit Agricole S.A. 31 December 2020
13
7
(in millions of euros) 12/31/2018 Changes 12/31/2019
Gross
Income tax
charges
Net of
income tax
Net of
income tax
of which
Group Share
Gross
Income tax
charges
Net of
income tax
Net of
income tax
of which
Group Share
Gross
Income tax
charges
Net of
income tax
Net of
income tax
of which
Group Share Other comprehensive income on items that may be reclassified subsequently to profit or
loss
Gains and losses on translation adjustments (244) (4) (248) (158) 301 ‑ 301 275 57 (4) 53 117
Gains and losses on debt instruments at fair value through other comprehensive income
that may be reclassified to profit or loss 2,477 (653) 1,824 1,848 1,189 (301) 888 851 3,666 (954) 2,712 2,699
Gains and losses on hedging derivative instruments 487 (143) 344 339 361 (116) 245 243 848 (259) 589 582
Reclassification of net gains (losses) of designated financial assets applying the overlay
approach 153 151 304 304 434 (64) 370 370 587 87 674 674
Other comprehensive income on items that may be reclassified to profit or loss excluding
equity-accounted entities 2,873 (649) 2,224 2,333 2,285 (481) 1,804 1,739 5,158 (1,130) 4,028 4,072
Other comprehensive income on items that may be reclassified to profit or loss on equity-
accounted entities (22) 1 (21) (16) 9 1 10 9 (13) 2 (11) (8)
Other comprehensive income on items that may be reclassified to profit or loss on equity-
accounted entities on discontinued operations 12 (1) 11 11 (12) ‑ (12) (12) ‑ (1) (1) (1)
Other comprehensive income on items that may be reclassified subsequently to profit or
loss 2,863 (649) 2,214 2,328 2,282 (480) 1,802 1,735 5,145 (1,129) 4,016 4,063
Other comprehensive income on items that will not be reclassified subsequently to profit
or loss ‑ ‑ ‑ ‑ ‑ ‑ ‑ ‑ ‑ ‑ ‑ ‑
Actuarial gains and losses on post-employment benefits (701) 166 (535) (504) (162) 27 (135) (120) (863) 193 (670) (624)
Other comprehensive income on financial liabilities attributable to changes in own credit
risk (140) 37 (103) (100) (74) 20 (54) (53) (214) 57 (157) (153)
Other comprehensive income on equity instruments that will not be reclassified to profit or
loss (362) (69) (431) (457) 53 24 77 76 (309) (45) (354) (381)
Other comprehensive income on items that will not be reclassified to profit or loss
excluding equity-accounted entities (1,203) 134 (1,069) (1,061) (183) 71 (113) (97) (1,386) 205 (1,181) (1,158)
Other comprehensive income on items that will not be reclassified to profit or loss on
equity-accounted entities (27) (15) (42) (42) (30) 8 (21) (21) (57) (7) (63) (62)
Other comprehensive income on items that will not be reclassified to profit or loss from
discontinued operations (2) ‑ (2) (2) 3 ‑ 3 3 1 ‑ 1 ‑
Other comprehensive income on items that will not be reclassified subsequently to profit
or loss (1,232) 119 (1,112) (1,105) (210) 79 (131) (115) (1,442) 198 (1,243) (1,220)
OTHER COMPREHENSIVE INCOME 1,631 (530) 1,102 1,223 2,072 (401) 1,671 1,620 3,703 (931) 2,773 2,843

Consolidated financial statements of Credit Agricole S.A. 31 December 2020
138
NOTE 5 Segment reporting
DEFINITION OF OPERATING SEGMENTS
According to IFRS 8, information disclosed is based on the internal reporting that is used by the Executive Committee
to manage Crédit Agricole S.A., to assess performance, and to make decisions about resources to be allocated to the
identified operating segments.
Operating segments according to the internal reporting consist of the business lines of the Group.
At 31 December 2020, Crédit Agricole S.A.’s business activities were organised into six operating segments:
the following five business lines:
Asset gathering,
French Retail banking – LCL,
International Retail banking,
Specialised financial services,
Large customers
as well as the “Corporate Centre”.
PRESENTATION OF BUSINESS LINES
Asset gathering
This business line brings together:
insurance activities (savings solutions and property and casualty insurance):
life insurance and personal insurance, conducted mainly by Predica in France and CA Vita in Italy,
property & casualty insurance, conducted primarily by Pacifica,
creditor insurance, conducted by Crédit Agricole Creditor Insurance and group insurance conducted
mainly by Predica in France;
asset management activities of the Amundi Group, offering savings solutions for retail clients and investment
solutions for institutionals. Following its acquisition by Amundi, Sabadell Asset Management, Banco Sabadell’s
asset management subsidiary, was integrated into this division in the third quarter of 2020. In addition, Amundi,
and BOC Wealth Management, the subsidiary of Bank of China, announced on 30 September 2020 that they
have obtained their license from the China Banking and Insurance Regulatory Commission for their joint
venture in China, Amundi BOC Wealth Management Company Limited,
as well as wealth management activities conducted mainly by Crédit Agricole Indosuez Wealth
Management subsidiaries (CA Indosuez Switzerland S.A. CA Indosuez Wealth Europe, CFM Indosuez Wealth,
CA Indosuez Wealth France).
French retail banking - LCL
LCL is a French retail banking network with a strong presence in urban areas. It is organised into four business lines: retail
banking for individual customers, retail banking for small businesses, private banking and corporate banking.
LCL offers a full range of banking products and services, together with asset management, insurance and wealth
management products.
International Retail banking
This business line encompasses foreign subsidiaries and investments that are mainly involved in Retail banking.
These subsidiaries and equity investments are primarily located in Europe: with Gruppo Bancario, CA Italia, Crédit
Agricole Polska in Poland and others in Ukraine and Serbia.
Other subsidiaries operate around the Mediterranean, e.g. Crédit du Maroc and Crédit Agricole Egypt.

Consolidated financial statements of Credit Agricole S.A. 31 December 2020
139
Finally, this division also includes banks that are not significant in size. For this reason, Crédit Agricole Bank Romania is
in the process of being sold.
On 4 January 2021, Crédit Agricole S.A. announced that it had signed a sale contract for Crédit Agricole Bank Romania
S.A. The completion of this transaction, which is subject to the approval of the competent Romanian regulatory
authorities and is expected to take place in the first half of 2021.
Foreign consumer credit, leasing and factoring subsidiaries (subsidiaries of Crédit Agricole Consumer Finance, Crédit
Agricole Leasing & Factoring and EFL in Poland, etc.) are not included in this segment, but in “Specialised financial
services”, except Calit in Italy.
Specialised financial services
Specialised financial services comprises the Group subsidiaries that provide financial products and services to
individual customers, small businesses, corporates and local authorities in France and abroad. These concerns:
consumer finance companies around Crédit Agricole Consumer Finance in France and through its
subsidiaries or partnerships outside France (Agos, FCA Bank, Creditplus Bank, Ribank, Credibom, Interbank
Group and Bankia). Following its acquisition by Crédit Agricole Consumer Finance, Menafinances was
integrated into that division in the second quarter of 2020.
specialised financial services for companies such as factoring and lease finance (Crédit Agricole Leasing &
Factoring Group, EFL).
Large customers
The Large Customers division includes the Corporate and Investment bank, which itself consists of two main lines of
business most of which are carried out by Crédit Agricole CIB, and Asset servicing for institutions realised by CACEIS:
financing activities, which include corporate banking in France and internationally and structured finance.
Structured Finance consists of originating, structuring and real assets and projects, often collateralised by
physical assets (planes, boats, office buildings, commodities, etc.) and complex and structured credit
instruments;
capital markets and investment banking activities bring together capital market activities (treasury, foreign
exchange, interest rate derivatives, debt markets), and investment banking activities (mergers and
acquisitions consulting and primary equity advisory);
asset servicing: CACEIS Bank for custody and CACEIS Fund Administration for fund administration. Following
its acquisition by CACEIS during the third quarter of 2019, KAS Bank was integrated into this division in
September 2019. And as part of the merger of the activities of CACEIS and Santander Securities Services
(“S3”) finalized in December 2019, S3’s activities in Spain and 49.99% of its activities in Latin America were
integrated into this division in December 2019.
Corporate Centre
This segment encompasses:
Crédit Agricole S.A.’s central body function, asset and liability management and management of debt
connected with acquisitions of subsidiaries or equity investments and the net impact of tax consolidation for
Crédit Agricole S.A.;
the results of the private equity business and results of various other Crédit Agricole S.A. companies (including
CA Immobilier, Uni-médias, Foncaris, etc.);
the results from management companies including computing and payment companies and real-estate
companies.
The division also includes the technical and volatile impacts related to intragroup transactions.

Consolidated financial statements of Credit Agricole S.A. 31 December 2020
140
5.1 Operating segment information
Transactions between operating segments are effected at arm’s length.
Segment assets are determined based on balance sheet elements for each operating segment.
31/12/2020
Asset
gathering
French retail
banking -
LCL
International
retail banking
Specialised
financial services
Large
customers
Corporate
center Total (in millions of euros)
Revenues 5,735 3,521 2,659 2,526 6,297 (238) 20,500
Operating expenses (2,870) (2,319) (1,753) (1,288) (3,783) (878) (12,891)
Gross operating income 2,865 1,202 906 1,238 2,514 (1,116) 7,609
Cost of risk (56) (390) (570) (732) (829) (29) (2,606)
Operating income 2,809 812 336 506 1,685 (1,145) 5,003
Share of net income of
equity-accounted entities 66 ‑ ‑ 344 7 (4) 413
Net gains (losses) on other
assets 3 2 72 (3) 1 ‑ 75
Change in value of goodwill ‑ ‑ ‑ ‑ ‑ (903) (903)
Pre-tax income 2,878 814 408 847 1,693 (2,052) 4,588
Income tax (770) (252) (101) (69) (278) 341 (1,129)
Net income from
discontinued operations (24) ‑ (8) (134) ‑ (55) (221)
Net income 2,084 562 299 644 1,415 (1,766) 3,238
Non-controlling interests 378 25 92 85 85 (119) 546
NET INCOME GROUP SHARE 1,706 537 207 559 1,330 (1,647) 2,692
31/12/2020
Asset
gathering
French retail
banking -
LCL
International
retail banking
Specialised
financial services
Large
customers
Corporate
center Total (in millions of euros)
Segment assets
Of which investments in
equity-accounted entities 4,422 72 ‑ 2,642 262 252 7,650
Of which goodwill 7,193 4,161 792 1,119 1,394 ‑ 14,659
TOTAL ASSETS 515,737 182,304 90,472 85,375 900,834 186,340 1,961,062

Consolidated financial statements of Credit Agricole S.A. 31 December 2020
141
31/12/2019
Asset
gathering
French retail
banking -
LCL
International
retail banking
Specialised
financial services
Large
customers
Corporate
center Total (in millions of euros)
Revenues 6,077 3,457 2,796 2,716 5,603 (497) 20,152
Operating expenses (2,905) (2,371) (1,753) (1,362) (3,498) (872) (12,761)
Gross operating income 3,172 1,086 1,043 1,354 2,105 (1,369) 7,391
Cost of risk (19) (217) (335) (497) (160) (28) (1,256)
Operating income 3,153 869 708 857 1,945 (1,397) 6,135
Share of net income of
equity-accounted entities 46 ‑ ‑ 295 5 6 352
Net gains (losses) on other
assets 32 2 2 ‑ 6 12 54
Change in value of goodwill ‑ ‑ ‑ ‑ 22 (611) (589)
Pre-tax income 3,231 871 710 1,152 1,978 (1,990) 5,952
Income tax (881) (274) (199) (233) (407) 1,538 (456)
Net income from
discontinued operations 8 ‑ (46) ‑ ‑ ‑ (38)
Net income 2,358 597 465 919 1,571 (452) 5,458
Non-controlling interests 325 27 132 104 33 (7) 614
NET INCOME GROUP SHARE 2,033 570 333 815 1,538 (445) 4,844
31/12/2019
Asset
gathering
French retail
banking -
LCL
International
retail banking
Specialised
financial services
Large
customers
Corporate
center Total (in millions of euros)
Segment assets
Of which investments in
equity-accounted entities 4,277 ‑ ‑ 2,344 350 261 7,232
Of which goodwill 6,908 4,161 1,698 1,128 1,385 ‑ 15,280
TOTAL ASSETS 501,631 164,417 80,283 77,642 826,550 117,120 1,767,643

Consolidated financial statements of Credit Agricole S.A. 31 December 2020
142
5.2 Segment information: geographical analysis
The geographical analysis of segment assets and results is based on the place where operations are booked for
accounting purposes.
(in millions of euros)
31/12/2020 31/12/2019
Net income
Group Share
Of which
Revenues
Segment
assets
Of which
goodwill
Net income
Group Share
Of which
Revenues
Segment
assets
Of which
goodwill
France (including overseas
departments and territories)
1,385 10,888 1,589,508 9,530 2,425 10,688 1,409,567 9,470
Italy (67) 3,102 110,037 1,201 703 3,158 97,737 2,082
Other European Union
countries 600 3,244 92,246 2,712 791 3,023 88,412 2,465
Other European countries 81 699 19,751 705 152 725 20,550 704
North America 271 1,110 65,364 430 210 1,146 61,570 472
Central and South America 74 104 1,391 ‑ 15 50 641 ‑
Africa and Middle East 85 471 10,126 35 158 490 9,348 38
Asia-Pacific (ex. Japan) 215 590 27,838 25 285 561 26,693 27
Japan 48 292 44,801 21 105 311 53,125 22
TOTAL 2,692 20,500 1,961,062 14,659 4,844 20,152 1,767,643 15,280
5.3 Insurance specificities
(See chapter on “Risk factors – Insurance sector risks” on managing this sector risk.)
GROSS INCOME FROM INSURANCE ACTIVITIES

Consolidated financial statements of Credit Agricole S.A. 31 December 2020
143
31/12/2020 31/12/2019
(in millions of euros)
Income statement prior to
reclassification of overlay
approach
Reclassification related
to overlay approach
Income statement post-
reclassification of overlay
approach
Recognition in accordance
with IFRS 9 excluding effect
of overlay approach
Effect of overlay
approach
Recognition after
effect of overlay
approach
Written premium 29,440 ‑ 29,440 36,967 ‑ 36,967
Change in unearned premiums (224) ‑ (224) (225) ‑ (225)
Earned premiums 29,216 ‑ 29,216 36,742 ‑ 36,742
Other operating income 232 ‑ 232 (124) ‑ (124)
Investment income 7,154 (6) 7,148 7,737 (4) 7,733
Investment expenses (588) 2 (586) (457) 1 (456)
Gains (losses) on disposals of investments net of impairment and
amortisation reversals 426 484 910 72 103 175
Change in fair value of investments at fair value through profit or loss (1,779) 2,422 645 12,405 (4,041) 8,364
Change in impairment on investments 27 (483) (456) (39) (112) (151)
Investment income net of expenses 5,242 2,419 7,661 19,718 (4,053) 15,666
Claims expenses ¹ (27,996) (2,227) (30,223) (49,154) 3,608 (45,546)
Revenue from reinsurance operations 666 ‑ 666 693 ‑ 693
Expenses from reinsurance operations (842) ‑ (842) (736) ‑ (736)
Net reinsurance income (expense) (176) ‑ (176) (43) ‑ (43)
Contract acquisition costs (2,180) ‑ (2,180) (2,021) ‑ (2,021)
Amortisation of investment securities and similar ‑ ‑ ‑ ‑ ‑ ‑
Administration costs (2,222) ‑ (2,222) (2,163) ‑ (2,163)
Other current operating income (expense) (491) ‑ (491) (416) ‑ (416)
Other operating income (expense) ‑ ‑ ‑ 7 ‑ 7
Operating income 1,625 192 1,817 2,547 (445) 2,102
Financing expenses (225) ‑ (225) (238) ‑ (238)
Share of net income of associates ‑ ‑ ‑ ‑ ‑ ‑
Income tax charge (558) 102 (456) (591) 51 (540)
Net income from discontinued or held-for-sale operations ‑ ‑ ‑ 8 ‑ 8
Consolidated net income 842 294 1,136 1,726 (394) 1,332
Non-controlling interests 80 ‑ 80 3 ‑ 3
NET INCOME GROUP SHARE 762 294 1,056 1,723 (394) 1,329
¹ Including -€23 billion of cost of claims at 31 December 2020 (-€23 billion at 31 December 2019), -€1 billion of changes in policyholder profit-sharing at 31 December 2020 (-€1 billion at 31 December
2019) and -€6 billion of changes in technical reserves at 31 December 2020 (-€21 billion at 31 December 2019).

Consolidated financial statements of Credit Agricole S.A. 31 December 2020
144
BREAKDOWN OF INSURANCE COMPANY INVESTMENTS
(in millions of euros) 31/12/2020 31/12/2019
Financial assets at fair value through profit or loss 175,671 173,352
Held for trading financial assets 936 776
Treasury bills and similar securities ‑ ‑
Bonds and other fixed income securities ‑ ‑
Equities and other variable income securities ‑ ‑
Derivative instruments 936 776
Other financial instruments at fair value through profit or loss 174,735 172,576
Equity instruments 31,166 33,178
Equities and other variable income securities 11,150 9,774
Non-consolidated equity investments 5,556 4,501
Designated financial assets applying the overlay approach 14,460 18,903
Debt instruments that do not meet the conditions of the “SPPI” test 69,140 70,263
Loans and receivables 831 718
Debt securities 68,309 69,545
Treasury bills and similar securities 175 171
Bonds and other fixed income securities 4,987 4,781
Mutual funds 43,448 44,078
Designated financial assets applying the overlay approach 19,699 20,515
Assets backing unit-linked contracts 74,429 69,135
Treasury bills and similar securities 498 457
Bonds and other fixed income securities 14,912 13,819
Equities and other variable income securities 8,377 6,822
Mutual funds 50,642 48,037
Financial assets designated at fair value through profit or loss ‑ ‑
Loans and receivables ‑ ‑
Debt securities ‑ ‑
Treasury bills and similar securities ‑ ‑
Bonds and other fixed income securities ‑ ‑
Hedging derivative Instruments 710 929
Financial assets at fair value through other comprehensive income 229,726 227,570
Debt instruments at fair value through other comprehensive income that may be reclassified to profit or loss 229,508 227,393
Debt securities 229,508 227,393
Treasury bills and similar securities 74,462 68,474
Bonds and other fixed income securities 155,046 158,919
Equity instruments at fair value through other comprehensive income that will not be reclassified to profit or loss 218 177
Equities and other variable income securities ‑ ‑
Non-consolidated equity investments 218 177
Financial assets at amortised cost 5,588 4,772
Loans and receivables 4,287 3,815
Debt securities 1,301 957
Treasury bills and similar securities 117 76
Bonds and other fixed income securities 1,185 881
Impairment (1) ‑
Investment property 6,355 6,410
Investments in associates and joint venture 4,127 4,002
TOTAL INSURANCE COMPANY INVESTMENTS 422,177 417,035
As of 31 December 2020, investments in Insurance entities accounted for by the equity method amount to
€4,127 million compared with €4,002 million at 31 December 2019.

Consolidated financial statements of Credit Agricole S.A. 31 December 2020
145
(in millions of euros)
31/12/2020 31/12/2019
Carrying
amount
Unrealised
gains
Unrealised
losses
Carrying
amount
Unrealised
gains
Unrealised
losses
Debt instruments at fair value through other comprehensive
income that may be reclassified to profit or loss 229,508 23,448 (24) 227,393 20,456 (128)
Debt securities 229,508 23,448 (24) 227,393 20,456 (128)
Treasury bills and similar securities 74,462 10,169 ‑ 68,474 7,560 (69)
Bonds and other fixed income securities 155,046 13,279 (24) 158,919 12,896 (59)
Equity instruments at fair value through other comprehensive
income that will not be reclassified to profit or loss 218 21 (10) 177 ‑ (23)
Equities and other variable income securities ‑ ‑ ‑ ‑ ‑ ‑
Non-consolidated equity investments 218 21 (10) 177 ‑ (23)
Total of financial assets at fair value through other
comprehensive income 229,726 23,469 (34) 227,570 20,456 (151)
Income tax charge (6,132) 9 (5,354) 39
OTHER COMPREHENSIVE INCOME ON FINANCIAL ASSETS AT FAIR
VALUE THROUGH OTHER COMPREHENSIVE INCOME (NET OF
INCOME TAX) 17,337 (25) 15,102 (112)
RECLASSIFICATION BETWEEN NET INCOME AND OTHER COMPREHENSIVE INCOME FOR FINANCIAL ASSETS
DESIGNATED UNDER THE OVERLAY APPROACH
31/12/2020 31/12/2019
(in millions of euros)
Amount
reported for
the
designated
financial
assets
applying
IFRS9
Amount that
would have
been
reported for
the
designated
financial
assets
applying
IAS39
Amount
reclassified in
other
comprehensi
ve income
applying the
overlay
approach
Amount
reported for
the
designated
financial
assets
applying
IFRS9
Amount that
would have
been
reported for
the
designated
financial
assets
applying
IAS39
Amount
reclassified in
other
comprehensi
ve income
applying the
overlay
approach
Investment income 756 750 (6) 1,029 1,025 (4)
Investment expenses (10) (8) 2 (7) (6) 1
Gains (losses) on disposals of investments net of
impairment and amortisation reversals (1) 483 484 71 174 103
Change in fair value of investments at fair value
through profit or loss (2,422) - 2,422 4,041 ‑ (4,041)
Change in impairment on investments - (483) (483) ‑ (112) (112)
Investment income net of expenses (1,677) 742 2,419 5,134 1,081 (4,053)
Claims expenses (2,227) 3,608
Operating income 192 (445)
Income tax charge 102 51
NET INCOME GROUP SHARE 294 (394)

Consolidated financial statements of Credit Agricole S.A. 31 December 2020
146
NOTE 6 Notes to the balance sheet
6.1 Cash, central banks
(in millions of euros)
31/12/2020 31/12/2019
Assets Liabilities Assets Liabilities
Cash 1,593 1,656
Central banks 192,676 864 91,423 1,896
CARRYING AMOUNT 194,269 864 93,079 1,896
6.2 Financial assets and liabilities at fair value through profit or loss
FINANCIAL ASSETS AT FAIR VALUE THROUGH PROFIT OR LOSS
(in millions of euros) 31/12/2020 31/12/2019
Held for trading financial assets 261,968 230,721
Other financial instruments at fair value through profit or loss 170,494 168,756
Equity instruments 34,183 36,293
Debt instruments that do not meet the conditions of the “SPPI” test 72,410 72,942
Assets backing unit-linked contracts 63,900 59,520
Financial assets designated at fair value through profit or loss 1 1
CARRYING AMOUNT 432,462 399,477
Of which lent securities 666 615
HELD FOR TRADING FINANCIAL ASSETS
(in millions of euros) 31/12/2020 31/12/2019
Equity instruments 6,221 6,901
Equities and other variable income securities 6,221 6,901
Debt securities 18,522 18,380
Treasury bills and similar securities 13,081 13,665
Bonds and other fixed income securities 5,389 4,607
Mutual funds 52 108
Loans and receivables 120,987 104,645
Loans and receivables due from credit institutions ‑ 61
Loans and receivables due from customers 872 894
Securities bought under repurchase agreements 120,116 103,690
Pledged securities ‑ ‑
Derivative instruments 116,237 100,795
CARRYING AMOUNT 261,968 230,721
Securities acquired under repurchase agreements include those that the entity is authorised to use as collateral.

Consolidated financial statements of Credit Agricole S.A. 31 December 2020
147
EQUITY INSTRUMENTS AT FAIR VALUE THROUGH PROFIT
OR LOSS
(in millions of euros) 31/12/2020 31/12/2019
Equities and other variable income securities 21,898 24,753
Non-consolidated equity investments 12,285 11,540
TOTAL EQUITY INSTRUMENTS AT FAIR VALUE THROUGH PROFIT OR LOSS 34,183 36,293
DEBT INSTRUMENTS THAT DO NOT MEET THE CONDITIONS OF THE “SPPI” TEST
(in millions of euros) 31/12/2020 31/12/2019
Debt securities 68,966 68,733
Treasury bills and similar securities 178 252
Bonds and other fixed income securities 13,660 13,152
Mutual funds 55,128 55,329
Loans and receivables 3,444 4,209
Loans and receivables due from credit institutions ‑ ‑
Loans and receivables due from customers 3,444 4,209
Securities bought under repurchase agreements ‑ ‑
Pledged securities ‑ ‑
TOTAL DEBT INSTRUMENTS THAT DO NOT MEET THE CONDITIONS OF THE “SPPI”
TEST 72,410 72,942
FINANCIAL ASSETS DESIGNATED AT FAIR VALUE THROUGH PROFIT OR LOSS
(in millions of euros) 31/12/2020 31/12/2019
Loans and receivables ‑ ‑
Loans and receivables due from credit institutions ‑ ‑
Loans and receivables due from customers ‑ ‑
Debt securities 1 1
Treasury bills and similar securities ‑ ‑
Bonds and other fixed income securities 1 1
TOTAL FINANCIAL ASSETS DESIGNATED AT FAIR VALUE THROUGH PROFIT OR
LOSS 1 1
FINANCIAL LIABILITIES AT FAIR VALUE THROUGH PROFIT OR LOSS
(in millions of euros) 31/12/2020 31/12/2019
Held for trading financial liabilities 229,265 206,708
Financial liabilities designated at fair value through profit or loss 35,908 39,961
CARRYING AMOUNT 265,173 246,669
This table includes liabilities to holders of mutual funds consolidated in Insurance.

Consolidated financial statements of Credit Agricole S.A. 31 December 2020
148
FINANCIAL LIABILITIES HELD FOR TRADING
(in millions of euros) 31/12/2020 31/12/2019
Securities sold short 37,179 33,472
Securities sold under repurchase agreements 82,662 74,763
Debt securities 2 55
Due to customers ‑ -
Due to credit institutions ‑ -
Derivative instruments 109,422 98,418
CARRYING AMOUNT 229,265 206,708
Detailed information on derivative transaction instruments is provided in Note 3.2 relating to market risk, in particular
on interest rates.
FINANCIAL LIABILITIES DESIGNATED AT FAIR VALUE THROUGH PROFIT OR LOSS
FINANCIAL LIABILITIES FOR WHICH CHANGES IN ISSUER SPREAD ARE RECOGNISED IN OTHER COMPREHENSIVE
INCOME AND WILL NOT BE RECLASSIFIED
31/12/2020
(in millions of euros)
Carrying
amount
Difference between
carrying amount and
amount contractually
required to pay at
maturity
Accumulated
amount of change
in fair value
attributable to
changes in own
credit risk
Amount of change
in fair value during
the period
attributable to
changes in own
credit risk
Amount
realised at
derecognition 1
Deposits and subordinated
liabilities 3,629 ‑ ‑ ‑ ‑
Deposits 3,629 ‑ ‑ ‑ ‑
Subordinated liabilities ‑ ‑ ‑ ‑ ‑
Debt securities 21,637 385 363 154 (6)
Other financial liabilities ‑ ‑ ‑ ‑ ‑
TOTAL 25,266 385 363 154 (6)
¹ The amount realised upon derecognition is transferred to consolidated reserves.
(in millions of euros)
31/12/2019
Carrying
amount
Difference between
carrying amount and
amount contractually
required to pay at
maturity
Accumulated
amount of change
in fair value
attributable to
changes in own
credit risk
Amount of change
in fair value during
the period
attributable to
changes in own
credit risk
Amount
realised at
derecognition 1
Deposits and subordinated
liabilities 3,993 ‑ ‑ ‑ ‑
Deposits 3,993 ‑ ‑ ‑ ‑
Subordinated liabilities ‑ ‑ ‑ ‑ ‑
Debt securities 25,942 (110) 214 86 (11)
Other financial liabilities ‑ ‑ ‑ ‑ ‑
TOTAL 29,935 (110) 214 86 (11)
¹ The amount realised upon derecognition is transferred to consolidated reserves.

Consolidated financial statements of Credit Agricole S.A. 31 December 2020
149
Pursuant to IFRS 9, Crédit Agricole S.A. calculates changes in fair value attributable to changes in own credit risk using
a methodology that allows for them to be separated from changes in value attributable to changes in market
conditions.
Basis for calculating own credit risk
The source taken into account for the calculation of own credit risk may vary from one issuer to another. Within Crédit
Agricole S.A., the source used is the change in its cost of market refinancing based on the type of issuance.
Calculation of unrealised gains/losses on own credit adjustment (recognised in other comprehensive income)
Crédit Agricole S.A. preferred approach is based on the liquidity component of issues. All issues are replicated by a
group of vanilla loans/borrowings. Changes in fair value attributable to changes in own credit risk of all issues therefore
correspond to those of said loans. These are equal to the changes in fair value of the loan book caused by changes
in the cost of refinancing.
Calculation of realised gains/losses on own credit risk (recognised in consolidated reserves)
The Group has elected to transfer fair value changes attributable to changes in own credit risk upon unwinding to
consolidated reserves. Accordingly, when there is a total or partial early redemption, a sensitivity-based calculation is
done. This consists of measuring the change in fair value attributable to the changes in own credit risk of a given
issuance as being the sum of the credit spread sensitivities multiplied by the change in this spread between the
issuance date and the redemption date.
FINANCIAL LIABILITIES FOR WHICH CHANGES IN ISSUER SPREAD ARE RECOGNISED IN NET INCOME
(in millions of euros)
31/12/2020
Carrying amount
Difference
between carrying
amount and due
on maturity
Accumulated amount of
change in fair value
attributable to changes
in own credit risk
Amount of change in fair
value during the period
attributable to changes
in own credit risk
Deposits and subordinated liabilities 10,642 ‑ ‑ ‑
Deposits 10,642 ‑ ‑ ‑
Subordinated liabilities ‑ ‑ ‑ ‑
Debt securities ‑ ‑ ‑ ‑
Other financial liabilities ‑ ‑ ‑ ‑
TOTAL 10,642 ‑ ‑ ‑
(in millions of euros)
31/12/2019
Carrying amount
Difference between
carrying amount and
due on maturity
Accumulated amount of
change in fair value
attributable to changes in
own credit risk
Amount of change in fair value
during the period attributable
to changes in own credit risk
Deposits and
subordinated liabilities 10,026 152 ‑ ‑
Deposits 10,026 152 ‑ ‑
Subordinated liabilities ‑ ‑ ‑ ‑
Debt securities ‑ ‑ ‑ ‑
Other financial liabilities ‑ ‑ ‑ ‑
TOTAL 10,026 152 ‑ ‑

Consolidated financial statements of Credit Agricole S.A. 31 December 2020
150
6.3 Hedging derivatives
Detailed information is provided in Note 3.4 on “Hedge accounting”.
6.4 Financial assets at fair value through other comprehensive income
31/12/2020
(in millions of euros) Carrying
amount
Unrealised
gains
Unrealised
losses
Debt instruments at fair value through other comprehensive
income that may be reclassified to profit or loss 263,856 23,689 (379)
Equity instruments at fair value through other comprehensive
income that will not be reclassified to profit or loss 2,216 497 (887)
TOTAL 266,072 24,186 (1,266)
31/12/2019
(in millions of euros) Carrying
amount
Unrealised
gains
Unrealised
losses
Debt instruments at fair value through other comprehensive
income that may be reclassified to profit or loss 258,803 20,348 (290)
Equity instruments at fair value through other comprehensive
income that will not be reclassified to profit or loss 2,518 617 (938)
TOTAL 261,321 20,965 (1,228)
DEBT INSTRUMENTS AT FAIR VALUE THROUGH OTHER COMPREHENSIVE INCOME THAT MAY BE RECLASSIFIED TO
PROFIT OR LOSS
31/12/2020
(in millions of euros) Carrying
amount
Unrealised
gains
Unrealised
losses
Treasury bills and similar securities 88,142 10,417 (75)
Bonds and other fixed income securities 175,714 13,272 (303)
Total Debt securities 263,856 23,689 (378)
Loans and receivables due from credit institutions ‑ ‑ ‑
Loans and receivables due from customers ‑ ‑ ‑
Total Loans and receivables ‑ ‑ ‑
Total Debt instruments at fair value through other comprehensive
income that may be reclassified to profit or loss 263,856 23,689 (379)
Income tax charge (6,163) 63
OTHER COMPREHENSIVE INCOME ON DEBT INSTRUMENTS THAT WILL NOT
BE RECLASSIFIED TO PROFIT OR LOSS (NET OF INCOME TAX) 17,526 (316)

Consolidated financial statements of Credit Agricole S.A. 31 December 2020
151
31/12/2019
(in millions of euros) Carrying
amount
Unrealised
gains
Unrealised
losses
Treasury bills and similar securities 82,684 7,806 (151)
Bonds and other fixed income securities 176,119 12,542 (140)
Total Debt securities 258,803 20,348 (291)
Loans and receivables due from credit institutions ‑ ‑ ‑
Loans and receivables due from customers ‑ ‑ ‑
Total Loans and receivables ‑ ‑ ‑
Total Debt instruments at fair value through other comprehensive
income that may be reclassified to profit or loss 258,803 20,348 (290)
Income tax charge (5,341) 81
OTHER COMPREHENSIVE INCOME ON DEBT INSTRUMENTS THAT WILL NOT
BE RECLASSIFIED TO PROFIT OR LOSS (NET OF INCOME TAX) 15,007 (209)
EQUITY INSTRUMENTS AT FAIR VALUE THROUGH OTHER COMPREHENSIVE INCOME THAT WILL NOT BE RECLASSIFIED
TO PROFIT OR LOSS
OTHER COMPREHENSIVE INCOME ON EQUITY INSTRUMENTS THAT CANNOT BE RECLASSIFIED
(in millions of euros)
31/12/2020
Carrying amount Unrealised
gains
Unrealised
losses
Equities and other variable income securities 515 8 (88)
Non-consolidated equity investments 1,701 489 (799)
Total Equity instruments at fair value through other
comprehensive income that will not be reclassified to profit
or loss 2,216 497 (887)
Income tax charge (29) 17
OTHER COMPREHENSIVE INCOME ON EQUITY INSTRUMENTS
THAT WILL NOT BE RECLASSIFIED TO PROFIT OR LOSS (NET OF
INCOME TAX)
468 (870)
(in millions of euros)
31/12/2019
Carrying amount Unrealised
gains
Unrealised
losses
Equities and other variable income securities 802 29 (33)
Non-consolidated equity investments 1,716 588 (905)
Total Equity instruments at fair value through other
comprehensive income that will not be reclassified to profit
or loss 2,518 617 (938)
Income tax charge (65) 19
OTHER COMPREHENSIVE INCOME ON EQUITY INSTRUMENTS
THAT WILL NOT BE RECLASSIFIED TO PROFIT OR LOSS (NET OF
INCOME TAX)
552 (919)

Consolidated financial statements of Credit Agricole S.A. 31 December 2020
152
EQUITY INSTRUMENTS DERECOGNISED DURING THE PERIOD
(in millions of euros)
31/12/2020
Fair value at the date
of derecognition
Cumulative gains
realised ¹
Cumulative losses
realised ¹
Equities and other variable income securities 332 ‑ (10)
Non-consolidated equity investments 7 ‑ (28)
Total Investments in equity instruments 339 ‑ (37)
Income tax charge ‑ 6
OTHER COMPREHENSIVE INCOME ON EQUITY
INSTRUMENTS THAT WILL NOT BE RECLASSIFIED TO
PROFIT OR LOSS (NET OF INCOME TAX) ¹
‑ (32)
¹ Realised gains and losses are transferred to consolidated reserves.
(in thousands of euros)
31/12/2019
Fair value at the date
of derecognition
Cumulative gains
realised ¹
Cumulative losses
realised ¹
Equities and other variable income securities (1) ‑ (4)
Non-consolidated equity investments 1,058 47 (65)
Total Investments in equity instruments 1,057 47 (69)
Income tax charge ‑ ‑
OTHER COMPREHENSIVE INCOME ON EQUITY
INSTRUMENTS THAT WILL NOT BE RECLASSIFIED TO
PROFIT OR LOSS (NET OF INCOME TAX) ¹
47 (69)
¹ Realised gains and losses are transferred to consolidated reserves.
6.5 Financial assets at amortised cost
(in millions of euros) 31/12/2020 31/12/2019
Loans and receivables due from credit institutions 463,169 438,580
Loans and receivables due from customers ¹ 405,937 395,181
Debt securities 84,794 72,519
CARRYING AMOUNT 953,900 906,280
¹ Outstanding loans to customers in France with non-contractual due date postponements amounted to €16.6 billion
in 2020, including €0.9 billion still outstanding as at 31 December 2020 at Crédit Agricole S.A. level.
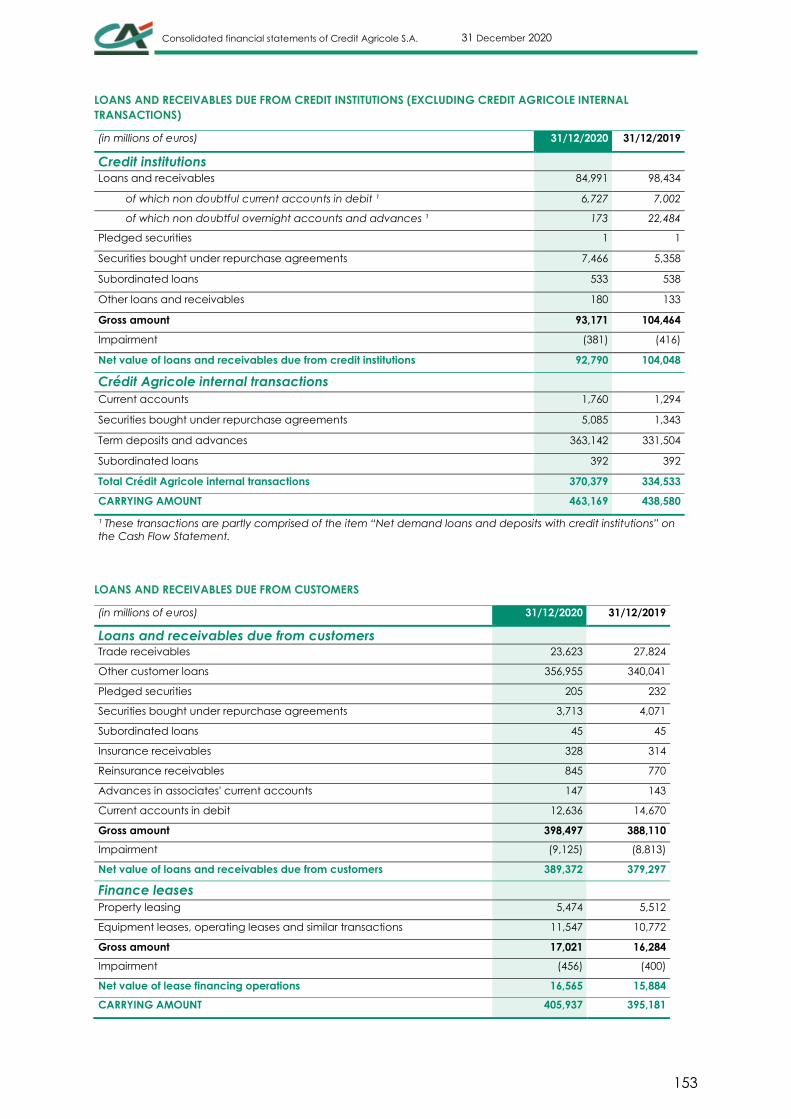
Consolidated financial statements of Credit Agricole S.A. 31 December 2020
153
LOANS AND RECEIVABLES DUE FROM CREDIT INSTITUTIONS (EXCLUDING CREDIT AGRICOLE INTERNAL
TRANSACTIONS)
(in millions of euros) 31/12/2020 31/12/2019
Credit institutions
Loans and receivables 84,991 98,434
of which non doubtful current accounts in debit ¹ 6,727 7,002
of which non doubtful overnight accounts and advances ¹ 173 22,484
Pledged securities 1 1
Securities bought under repurchase agreements 7,466 5,358
Subordinated loans 533 538
Other loans and receivables 180 133
Gross amount 93,171 104,464
Impairment (381) (416)
Net value of loans and receivables due from credit institutions 92,790 104,048
Crédit Agricole internal transactions
Current accounts 1,760 1,294
Securities bought under repurchase agreements 5,085 1,343
Term deposits and advances 363,142 331,504
Subordinated loans 392 392
Total Crédit Agricole internal transactions 370,379 334,533
CARRYING AMOUNT 463,169 438,580
¹ These transactions are partly comprised of the item “Net demand loans and deposits with credit institutions” on
the Cash Flow Statement.
LOANS AND RECEIVABLES DUE FROM CUSTOMERS
(in millions of euros) 31/12/2020 31/12/2019
Loans and receivables due from customers
Trade receivables 23,623 27,824
Other customer loans 356,955 340,041
Pledged securities 205 232
Securities bought under repurchase agreements 3,713 4,071
Subordinated loans 45 45
Insurance receivables 328 314
Reinsurance receivables 845 770
Advances in associates' current accounts 147 143
Current accounts in debit 12,636 14,670
Gross amount 398,497 388,110
Impairment (9,125) (8,813)
Net value of loans and receivables due from customers 389,372 379,297
Finance leases
Property leasing 5,474 5,512
Equipment leases, operating leases and similar transactions 11,547 10,772
Gross amount 17,021 16,284
Impairment (456) (400)
Net value of lease financing operations 16,565 15,884
CARRYING AMOUNT 405,937 395,181

Consolidated financial statements of Credit Agricole S.A. 31 December 2020
154
DEBT SECURITIES
(in millions of euros) 31/12/2020 31/12/2019
Treasury bills and similar securities 29,906 23,590
Bonds and other fixed income securities 54,967 48,983
Total 84,873 72,573
Impairment (79) (53)
CARRYING AMOUNT 84,794 72,519

Consolidated financial statements of Credit Agricole S.A. 31 December 2020
15
5
6.6 Transferred assets not derecognised or derecognised with on‑ going involvement
TRANSFERRED ASSETS NOT DERECOGNISED IN FULL AT 31 DECEMBER 2020
Transferred assets but still fully recognized Transferred assets recognised to the extent of on
the entity's continuing involvement
Transferred assets Associated liabilities Assets and
associated
liabilities
Initial total
carrying
amount of
assets prior to
transfer
Carrying amount
of assets still
recognised
(continuing
involvement)
Carrying
amount of
associated
liabilities (in millions of euros)
Carrying
amount
Of which
securitisation
(non-
deconsolidating)
Of which
securities
sold/bought
under
repurchase
agreements
Of
which
other 1
Fair
value 2
Carrying
amount
Of which
securitisation
(non-
deconsolidating)
Of which
securities
sold/bought
under
repurchase
agreements
Of
which
other 1
Fair
value 2 Net fair value 2
Held for trading financial assets 14,130 ‑ 14,130 ‑ 14,130 13,908 ‑ 13,908 ‑ 13,908 222 ‑ ‑ ‑
Equity instruments 3,173 ‑ 3,173 ‑ 3,173 3,123 ‑ 3,123 ‑ 3,123 50 ‑ ‑ ‑
Debt securities 10,957 ‑ 10,957 ‑ 10,957 10,785 ‑ 10,785 ‑ 10,785 172 ‑ ‑ ‑
Loans and receivables ‑ ‑ ‑ ‑ ‑ ‑ ‑ ‑ ‑ ‑ ‑ ‑ ‑ ‑
Other financial instruments at fair value through profit or loss ‑ ‑ ‑ ‑ ‑ ‑ ‑ ‑ ‑ ‑ ‑ ‑ ‑ ‑
Equity instruments ‑ ‑ ‑ ‑ ‑ ‑ ‑ ‑ ‑ ‑ ‑ ‑ ‑ ‑
Debt securities ‑ ‑ ‑ ‑ ‑ ‑ ‑ ‑ ‑ ‑ ‑ ‑ ‑ ‑
Loans and receivables ‑ ‑ ‑ ‑ ‑ ‑ ‑ ‑ ‑ ‑ ‑ ‑ ‑ ‑
Financial assets at fair value through other comprehensive
income 28,826 ‑ 28,673 154 28,766 28,642 ‑ 28,642 ‑ 28,642 124 ‑ ‑ ‑
Equity instruments ‑ ‑ ‑ ‑ ‑ ‑ ‑ ‑ ‑ ‑ ‑ ‑ ‑ ‑
Debt securities 28,826 ‑ 28,673 154 28,766 28,642 ‑ 28,642 ‑ 28,642 124 ‑ ‑ ‑
Loans and receivables ‑ ‑ ‑ ‑ ‑ ‑ ‑ ‑ ‑ ‑ ‑ ‑ ‑ ‑
Financial assets at amortised cost 15,054 11,406 3,642 5 15,054 13,050 9,456 3,594 ‑ 13,050 2,004 ‑ ‑ ‑
Debt securities 3,647 ‑ 3,642 5 3,647 3,594 ‑ 3,594 ‑ 3,594 53 ‑ ‑ ‑
Loans and receivables 11,407 11,406 ‑ ‑ 11,407 9,456 9,456 ‑ ‑ 9,456 1,951 ‑ ‑ ‑
Total Financial assets 58,010 11,406 46,445 159 57,950 55,600 9,456 46,144 ‑ 55,600 2,350 ‑ ‑ ‑
Finance leases ‑ ‑ ‑ ‑ ‑ ‑ ‑ ‑ ‑ ‑ ‑ ‑ ‑ ‑
TOTAL TRANSFERRED ASSETS 58,010 11,406 46,445 159 57,950 55,600 9,456 46,144 ‑ 55,600 2,350 ‑ ‑ ‑
¹ Including securities lending without cash collateral.
² When the “counterparty” (counterparties) to the associated liabilities has (have) recourse only to the transferred assets (IFRS 7.42D. (d))".

Consolidated financial statements of Credit Agricole S.A. 31 December 2020
15
6
TRANSFERRED ASSETS NOT DERECOGNISED IN FULL AT 31 DECEMBER 2019
Transferred assets but still fully recognized Transferred assets recognised to the extent of on
the entity's continuing involvement
Transferred assets Associated liabilities Assets and
associated
liabilities
Initial total
carrying
amount of
assets prior to
transfer
Carrying amount
of assets still
recognised
(continuing
involvement)
Carrying
amount of
associated
liabilities (in millions of euros)
Carrying
amount
Of which
securitisation
(non-
deconsolidating)
Of which
securities
sold/bought
under
repurchase
agreements
Of
which
other 1
Fair
value 2
Carrying
amount
Of which
securitisation
(non-
deconsolidating)
Of which
securities
sold/bought
under
repurchase
agreements
Of
which
other 1
Fair
value 2 Net fair value 2
Held for trading financial assets 14,139 ‑ 14,139 ‑ 14,139 13,331 ‑ 13,331 ‑ 13,331 808 ‑ ‑ ‑
Equity instruments 3,911 ‑ 3,911 ‑ 3,911 3,688 ‑ 3,688 ‑ 3,688 223 ‑ ‑ ‑
Debt securities 10,228 ‑ 10,228 ‑ 10,228 9,643 ‑ 9,643 ‑ 9,643 585 ‑ ‑ ‑
Loans and receivables ‑ ‑ ‑ ‑ ‑ ‑ ‑ ‑ ‑ ‑ ‑ ‑ ‑ ‑
Other financial instruments at fair value through profit or loss ‑ ‑ ‑ ‑ ‑ ‑ ‑ ‑ ‑ ‑ ‑ ‑ ‑ ‑
Equity instruments ‑ ‑ ‑ ‑ ‑ ‑ ‑ ‑ ‑ ‑ ‑ ‑ ‑ ‑
Debt securities ‑ ‑ ‑ ‑ ‑ ‑ ‑ ‑ ‑ ‑ ‑ ‑ ‑ ‑
Loans and receivables ‑ ‑ ‑ ‑ ‑ ‑ ‑ ‑ ‑ ‑ ‑ ‑ ‑ ‑
Financial assets at fair value through other comprehensive
income 24,802 ‑ 24,502 300 24,437 24,458 ‑ 24,458 ‑ 24,458 (21) ‑ ‑ ‑
Equity instruments ‑ ‑ ‑ ‑ ‑ ‑ ‑ ‑ ‑ ‑ ‑ ‑ ‑ ‑
Debt securities 24,802 ‑ 24,502 300 24,437 24,458 ‑ 24,458 ‑ 24,458 (21) ‑ ‑ ‑
Loans and receivables ‑ ‑ ‑ ‑ ‑ ‑ ‑ ‑ ‑ ‑ ‑ ‑ ‑ ‑
Financial assets at amortised cost 14,620 13,261 1,271 88 14,620 12,547 11,322 1,225 ‑ 12,547 2,073 ‑ ‑ ‑
Debt securities 1,359 ‑ 1,271 88 1,359 1,225 ‑ 1,225 ‑ 1,225 134 ‑ ‑ ‑
Loans and receivables 13,261 13,261 ‑ ‑ 13,261 11,322 11,322 ‑ ‑ 11,322 1,939 ‑ ‑ ‑
Total Financial assets 53,561 13,261 39,912 388 53,196 50,336 11,322 39,014 ‑ 50,336 2,860 ‑ ‑ ‑
Finance leases ‑ ‑ ‑ ‑ ‑ ‑ ‑ ‑ ‑ ‑ ‑ ‑ ‑ ‑
TOTAL TRANSFERRED ASSETS 53,561 13,261 39,912 388 53,196 50,336 11,322 39,014 ‑ 50,336 2,860 ‑ ‑ ‑
¹ Including loans of securities without cash collateral.
² In the event that “the counterparty (counterparties) to the associated liabilities has(have) recourse only to the transferred assets” (IFRS 7.42D. (d))”.

Consolidated financial statements of Credit Agricole S.A. 31 December 2020
15
7
Securitisations
Consolidated securitisations with external investors are a transfer of assets within the meaning of the amendment to IFRS 7. The Group effectively has an indirect contractual obligation
to deliver to external investors the cash flows from assets sold to the securitisation fund (although these assets are recorded in the Group balance sheet through the consolidation of
the fund). Receivables assigned to the securitisation fund are used as collateral for investors.
Fully self-subscribed consolidated securitisations do not constitute a transfer of assets within the meaning of IFRS 7.
Crédit Agricole Consumer Finance Securitisations
At 31 December 2020, Crédit Agricole Consumer Finance managed 17 consolidated vehicles for securitisation of retail consumer loans and car dealer financing in Europe.
Securitisation transactions carried out within Crédit Agricole Consumer Finance Group are not considered to form part of a deconsolidation transaction under IFRS and have therefore
been reintegrated into Crédit Agricole S.A. consolidated financial statements.
The carrying amounts of the relevant assets (net of related liabilities) amounted to €2,831 million at 31 December 2020. They include, in particular, outstanding customer loans with a
net carrying amount of €4,221 million. The amount of securities mobilised on the market stood at €4,221 million. The value of securities still available to be mobilised stood at €5,301 million.
CA Italia Securitisations
At 31 December 2020, Crédit Agricole Italia managed one home loan securitisation vehicle. This securitisation transaction is not considered to form part of a deconsolidation transaction
under IFRS and has therefore been reintegrated into the Crédit Agricole S.A. consolidated financial statements.
The carrying amounts of the relevant assets amounted to €10.611 million at 31 December 2020.

Consolidated financial statements of Credit Agricole S.A. 31 December 2020
158
6.7 Exposure to sovereign risk
The scope of sovereign exposures recorded covers exposures to Governments, but does not include local authorities.
Tax debt is excluded from these amounts.
Exposure to sovereign debt corresponds to an exposure net of impairment (carrying amount) presented both gross
and net of hedging.
The Group’s exposure to sovereign risk is as follows:
BANKING ACTIVITY
31/12/2020 Exposures Banking activity net of impairment
(in millions of euros)
Other financial instruments at fair
value through profit or loss
Financial assets at
fair value through
other
comprehensive
income that may
be reclassified to
profit or loss
Financial assets
at amortised
cost
Total banking
activity before
hedging
Hedging Total banking
activity after
hedging
Held-for-trading
financial assets
Other financial
instruments at fair
value through
profit or loss
Saudi Arabia ‑ ‑ ‑ 890 890 ‑ 890
Argentina ‑ ‑ ‑ 44 44 ‑ 44
Austria 119 ‑ ‑ 198 317 (2) 315
Belgium ‑ 14 2,405 1,552 3,971 (209) 3,762
Brazil 8 ‑ 112 158 278 ‑ 278
China 189 ‑ 34 136 359 (2) 357
Egypt 1 7 641 347 996 ‑ 996
Spain ‑ ‑ 1,303 2,034 3,337 (119) 3,218
United States 1,721 ‑ 68 819 2,608 (7) 2,601
France 35 285 3,712 12,528 16,560 (706) 15,854
Greece ‑ ‑ ‑ ‑ ‑ ‑ ‑
Hong Kong 58 ‑ ‑ 880 938 (1) 937
Iran ‑ ‑ ‑ ‑ ‑ ‑ ‑
Ireland ‑ ‑ ‑ ‑ ‑ ‑ ‑
Italy ‑ 43 3,066 8,075 11,184 (285) 10,899
Japan ‑ ‑ 246 1,435 1,681 1 1,682
Lebanon ‑ ‑ ‑ ‑ ‑ ‑ ‑
Lithuania ‑ ‑ ‑ ‑ ‑ ‑ ‑
Morocco 11 23 244 ‑ 278 ‑ 278
Poland ‑ ‑ 950 229 1,179 ‑ 1,179
United Kingdom ‑ ‑ ‑ ‑ ‑ ‑ ‑
Russia ‑ ‑ ‑ ‑ ‑ ‑ ‑
Syria ‑ ‑ ‑ ‑ ‑ ‑ ‑
Turkey ‑ ‑ ‑ ‑ ‑ ‑ ‑
Ukraine ‑ ‑ 78 208 286 ‑ 286
Venezuela ‑ ‑ ‑ 30 30 ‑ 30
Yemen ‑ ‑ ‑ ‑ ‑ ‑ ‑
Other sovereign
countries 1,086 195 808 4,401 6,490 (26) 6,464
TOTAL 3,228 567 13,667 33,964 51,426 (1,356) 50,070

Consolidated financial statements of Credit Agricole S.A. 31 December 2020
159
31/12/2019 Exposures Banking activity net of impairment
(in millions of euros)
Other financial instruments at fair
value through profit or loss
Financial assets at
fair value through
other
comprehensive
income that may
be reclassified to
profit or loss
Financial assets
at amortised
cost
Total banking
activity before
hedging
Hedging Total banking
activity after
hedging
Held-for-trading
financial assets
Other financial
instruments at fair
value through
profit or loss
Saudi Arabia ‑ ‑ ‑ 899 899 ‑ 899
Argentina ‑ - - - - - -
Austria 68 4 ‑ 16 88 (1) 87
Belgium ‑ ‑ 2,412 671 3,083 (206) 2,877
Brazil 57 ‑ 77 191 325 ‑ 325
China 12 ‑ 36 ‑ 48 ‑ 48
Egypt 2 8 804 ‑ 814 ‑ 814
Spain ‑ 7 1,290 612 1,909 (2) 1,907
United States 4,083 ‑ 205 2,858 7,146 (21) 7,125
France 41 195 4,724 10,559 15,519 (1,015) 14,504
Greece ‑ ‑ ‑ ‑ ‑ ‑ ‑
Hong Kong 46 ‑ ‑ 890 936 ‑ 936
Iran ‑ ‑ ‑ ‑ ‑ ‑ ‑
Ireland 1 6 ‑ ‑ 7 ‑ 7
Italy 24 96 2,821 4,921 7,862 (452) 7,410
Japan ‑ ‑ ‑ 889 889 8 897
Lebanon ‑ ‑ ‑ ‑ ‑ ‑ ‑
Lithuania ‑ ‑ ‑ ‑ ‑ ‑ ‑
Morocco 68 7 258 ‑ 333 ‑ 333
Poland 14 ‑ 722 242 978 ‑ 978
United Kingdom ‑ ‑ ‑ ‑ ‑ ‑ ‑
Russia 1 ‑ ‑ ‑ 1 ‑ 1
Syria ‑ ‑ ‑ ‑ ‑ ‑ ‑
Turkey ‑ ‑ ‑ ‑ ‑ ‑ ‑
Ukraine ‑ ‑ 55 148 203 ‑ 203
Venezuela ‑ ‑ ‑ 42 42 ‑ 42
Yemen ‑ ‑ ‑ ‑ ‑ ‑ ‑
Other sovereign
countries 993 31 699 4,783 6,506 (345) 6,161
Total 5,410 354 14,103 27,721 47,588 (2,034) 45,554

Consolidated financial statements of Credit Agricole S.A. 31 December 2020
160
INSURANCE ACTIVITY
For the insurance activity, exposure to sovereign debt is presented as net of impairment, before hedging, and
corresponds to an exposure before application of sharing mechanisms between insurer and policyholder specific to
life insurance.
Gross exposures
31/12/2020 31/12/2019 (in millions of euros)
Saudi Arabia 1 6
Argentina ‑ 1
Austria 2,484 3,036
Belgium 4,152 3,299
Brazil ‑ ‑
China ‑ ‑
Egypt ‑ ‑
Spain 3,777 1,318
United States 50 131
France 54,004 52,216
Greece ‑ 4
Hong Kong ‑ ‑
Iran ‑ ‑
Ireland 200 725
Italy 9,103 7,602
Japan 132 97
Lebanon ‑ ‑
Lithuania 77 ‑
Morocco ‑ ‑
Poland 325 363
United Kingdom 6 15
Russia ‑ ‑
Syria ‑ ‑
Turkey ‑ 2
Ukraine ‑ ‑
Venezuela 1 1
Yemen ‑ ‑
Other sovereign countries 3,020 2,219
TOTAL EXPOSURES 77,332 71,035
6.8 Financial liabilities at amortised cost
(in millions of euros) 31/12/2020 31/12/2019
Due to credit institutions 264,919 142,041
Due to customers 719,388 646,914
Debt securities 162,547 201,007
CARRYING AMOUNT 1,146,854 989,962

Consolidated financial statements of Credit Agricole S.A. 31 December 2020
161
DUE TO BANKS
(in millions of euros) 31/12/2020 31/12/2019
Credit institutions
Accounts and borrowings 179,458 74,133
of which current accounts in credit ¹ 9,167 10,137
of which overnight accounts and deposits ¹ 1,953 2,359
Pledged securities ‑ ‑
Securities sold under repurchase agreements 21,575 27,169
Total 201,033 101,302
Crédit Agricole internal transactions
Current accounts in credit ¹ 39,899 18,794
Term deposits and advances 18,903 20,876
Securities sold under repurchase agreements 5,084 1,069
Total 63,886 40,739
CARRYING AMOUNT 264,919 142,041
¹ Ces opérations composent pour partie la rubrique ”Solde net des comptes, prêts/emprunts à vue auprès des
établissements de crédit” du Tableau des flux de trésorerie
DUE TO CUSTOMERS
(in millions of euros) 31/12/2020 31/12/2019
Current accounts in credit 291,807 228,339
Special savings accounts 324,407 302,424
Other amounts due to customers 98,927 112,020
Securities sold under repurchase agreements 1,520 1,569
Insurance liabilities 872 940
Reinsurance liabilities 590 467
Cash deposits received from ceding and retroceding companies against technical
insurance commitments 1,265 1,155
CARRYING AMOUNT 719,388 646,914
DEBT SECURITIES ISSUED
(in millions of euros) 31/12/2020 31/12/2019
Interest bearing notes ‑ ‑
Interbank securities 9,078 9,289
Negotiable debt securities 49,228 86,272
Bonds ¹ 101,380 101,738
Other debt securities 2,861 3,708
CARRYING AMOUNT 162,547 201,007
¹ Includes issues of Covered Bonds and issues of senior non-preferred bonds.
Debt notes issued by Crédit Agricole S.A. and hold by Insurance entities of the Crédit Agricole S.A. Group are
eliminated for euro accounts. They were eliminated for the portion backing unit-linked contracts with financial risk
borne by the policyholder.

Consolidated financial statements of Credit Agricole S.A. 31 December 2020
162
6.9 Information on the offsetting of financial assets and financial liabilities
OFFSETTING – FINANCIAL ASSETS
Type of financial
instrument
(in millions of euros)
31/12/2020
Offsetting effects on financial assets covered by master netting agreements and similar agreements
Gross
amounts of
recognised
financial
assets before
offsetting
Gross amounts of
recognised
financial liabilities
set off in the
financial
statements
Net amounts of
financial assets
presented in the
financial
statements ³
Other amounts that can be offset
under given conditions
Net
amount
after all
offsetting
effects
Gross amounts
of financial
liabilities
covered by
master netting
agreements
Amounts of
other financial
instruments
received as
collateral,
including
security
deposits
Derivatives ¹ ² 138,368 10 138,358 120,742 11,398 6,218
Reverse repurchase
agreements ⁴ 203,785 67,200 136,585 10,600 125,271 714
Securities lent 12,909 ‑ 12,909 ‑ ‑ 12,909
Other financial instruments ‑ ‑ ‑ ‑ ‑ ‑
TOTAL FINANCIAL ASSETS
SUBJECT TO OFFSETTING 355,062 67,210 287,852 131,342 136,669 19,841
¹ Including margin calls but before any XVA impact.
² 96% of derivatives on the asset side at the reporting date were subject to offsetting.
³ The net amount of financial liabilities shown in the summary statements is equal to the amount shown on the balance sheet as
liabilities.
⁴ 99% of repurchase agreements on the liabilities side at the reporting date were subject to offsetting.
At 31 December 2020, derivative instruments were not subject to accounting clearing within the meaning of IAS 32R,
but daily settlement (application of the so-called “settlement to market” mechanism).
Type of financial
instrument
(in millions of euros)
31/12/2019
Offsetting effects on financial assets covered by master netting agreements and similar agreements
Gross
amounts of
recognised
financial
assets before
offsetting
Gross amounts of
recognised
financial liabilities
set off in the
financial
statements
Net amounts of
financial assets
presented in the
financial
statements ²
Other amounts that can be offset
under given conditions
Net
amount
after all
offsetting
effects
Gross amounts
of financial
liabilities
covered by
master netting
agreements
Amounts of
other financial
instruments
received as
collateral,
including
security
deposits
Derivatives ¹ 120,534 21 120,513 104,711 15,533 269
Reverse repurchase
agreements 177,596 62,900 114,696 10,756 103,279 661
Securities lent 2,817 ‑ 2,817 ‑ ‑ 2,817
Other financial instruments ‑ ‑ ‑ ‑ ‑ ‑
TOTAL FINANCIAL ASSETS
SUBJECT TO OFFSETTING 300,947 62,921 238,026 115,467 118,812 3,747
¹ Including margin calls but before any XVA impact
² The net amount of financial assets shown in the summary statements is equal to the amount shown on the balance sheet as assets
At 31 December 2019, derivative instruments were not subject to accounting clearing within the meaning of IAS 32R,
but daily settlement (application of the so-called “settlement to market” mechanism).

Consolidated financial statements of Credit Agricole S.A. 31 December 2020
163
OFFSETTING – FINANCIAL LIABILITIES
Type of financial
instrument
(in millions of euros)
31/12/2020
Offsetting effects on financial liabilities covered by master netting agreements and similar agreements
Gross
amounts of
recognised
financial
assets before
offsetting
Gross amounts of
recognised
financial assets set
off in the financial
statements
Net amounts of
financial
liabilities
presented in the
financial
statements ²
Other amounts that can be offset
under given conditions
Net
amount
after all
offsetting
effects
Gross amounts
of financial
assets covered
by master
netting
agreements
Amounts of
other financial
instruments
received as
collateral,
including
security
deposits
Derivatives ¹ ² 124,664 10 124,654 120,742 2,647 1,265
Repurchase agreements ⁴ 178,064 67,200 110,864 10,600 99,380 884
Securities borrowed ‑ ‑ ‑ ‑ ‑ ‑
Other financial instruments ‑ ‑ ‑ ‑ ‑ ‑
TOTAL FINANCIAL
LIABILITIES SUBJECT TO
OFFSETTING 302,728 67,210 235,518 131,342 102,027 2,149
¹ Including margin calls but before any XVA impact.
² 99% of derivatives on the asset side at the reporting date were subject to offsetting.
³ The net amount of financial liabilities shown in the summary statements is equal to the amount shown on the balance sheet as
liabilities.
⁴ 99% of repurchase agreements on the liabilities side at the reporting date were subject to offsetting.
At 31 December 2020, derivative instruments were not subject to accounting clearing within the meaning of IAS 32R,
but daily settlement (application of the so-called “settlement to market” mechanism).
Type of financial
instrument
(in millions of euros)
31/12/2019
Offsetting effects on financial liabilities covered by master netting agreements and similar agreements
Gross
amounts of
recognised
financial
liabilities
before
offsetting
Gross amounts of
recognised
financial assets set
off in the financial
statements
Net amounts of
financial
liabilities
presented in the
financial
statements ²
Other amounts that can be offset
under given conditions
Net
amount
after all
offsetting
effects
Gross amounts
of financial
assets covered
by master
netting
agreements
Amounts of
other financial
instruments
received as
collateral,
including
security
deposits
Derivatives ¹ 111,711 ‑ 111,711 103,048 6,819 1,844
Repurchase agreements 167,552 62,900 104,652 10,756 89,108 4,788
Securities borrowed 6,060 ‑ 6,060 ‑ ‑ 6,060
Other financial instruments ‑ ‑ ‑ ‑ ‑ ‑
TOTAL FINANCIAL
LIABILITIES SUBJECT TO
OFFSETTING 285,323 62,900 222,423 113,804 95,927 12,692
¹ Including margin calls mais avant tout impact XVA
² The net amount of financial liabilities shown in the summary statements is equal to the amount shown on the balance sheet as
liabilities
At 31 December 2019, derivative instruments were not subject to accounting clearing within the meaning of IAS 32R,
but daily settlement (application of the so-called “settlement to market” mechanism).

Consolidated financial statements of Credit Agricole S.A. 31 December 2020
164
6.10 Current and deferred tax assets and liabilities
(in millions of euros) 31/12/2020 31/12/2019
Current tax 1,335 1,233
Deferred tax 2,969 3,067
TOTAL CURRENT AND DEFERRED TAX ASSETS 4,304 4,300
Current tax 1,363 1,626
Deferred tax 1,971 2,140
TOTAL CURRENT AND DEFERRED TAX LIABILITIES 3,334 3,766
TAX AUDITS
Crédit Agricole S.A. tax audit
After an audit of accounts for the 2014 and 2015 financial years, Crédit Agricole S.A. was the subject of adjustments
as part of a proposed correction received at the end of December 2018. Crédit Agricole S.A. paid the sums due in this
regard and reversed the related provision.
Crédit Agricole CIB Paris tax audit
After an audit of accounts for the 2013, 2014 and 2015 financial years, Crédit Agricole CIB was the subject of
adjustments as part of a proposed correction received at the end of December 2018. Crédit Agricole CIB has
challenged the proposed adjustments with stated arguments. A provision has been recognised to cover the estimated
risk.
Crédit Agricole CIB Milan tax audit regarding transfer pricing
Following audits, Crédit Agricole CIB Milan received adjustment notices from the Italian tax authorities regarding
transfer pricing for the 2005 to 2014 financial years. Crédit Agricole CIB has challenged the proposed adjustments with
stated arguments. At the same time, the case has been referred to the competent French-Italian authorities for all
financial years. A provision has been recognised to cover the estimated risk.
CLSA liability guarantee
In 2013, Crédit Agricole Group sold the CLSA entities to the Chinese group CITICS.
Following tax adjustments made on some CLSA entities in India and the Philippines, CITICS invoked the liability
guarantee against Crédit Agricole Group. The adjustments have been challenged with stated arguments. A provision
has been recognised to cover the estimated risk.
Crédit Agricole Consumer Finance tax audit
Crédit Agricole Consumer Finance was the subject of an audit of accounts for the 2016 and 2017 financial years. It
received an adjustment notice in late 2019. Crédit Agricole Consumer Finance has recorded a provision in its accounts
for the adjustments that have been in dispute since 2018 and an additional provision in 2019.
Earlier, Crédit Agricole Consumer Finance had been the subject of a different audit of accounts for the 2014 and 2015
financial years. A proposed rectification was received at the end of 2017 and a provision was booked for that amount.
In 2020, Crédit Agricole Consumer Finance paid the amounts due and reversed the related provision.
PREDICA tax audit
Predica was the subject of an audit of accounts for the 2015 and 2016 financial years. It received an adjustment notice
in early 2019. Predica has recorded a provision in its accounts for the adjustments that are disputed.

Consolidated financial statements of Credit Agricole S.A. 31 December 2020
165
AGOS DUCATO tax audit
AGOS DUCATO received a rectification proposal for the 2014 financial year from the Italian tax authorities following a
tax audit. AGOS DUCATO s challenging the notified adjustments on grounds. A tax audit is also under way for the 2015
to 2018 financial years. A provision has been recognised to cover the estimated risk.
Net deferred tax assets and liabilities break down as follows:
(in millions of euros) 31/12/2020 31/12/2019
Temporary timing differences - tax 2,275 2,208
Non-deductible accrued expenses 324 339
Non-deductible provisions for liabilities and charges 2,172 2,163
Other temporary differences ¹ (221) (294)
Deferred tax on reserves for unrealised gains or losses (1,181) (662)
Financial assets at fair value through other comprehensive income (1,115) (551)
Cash flow hedges (291) (388)
Gains and losses/Actuarial differences 134 115
Other comprehensive income attributable to changes in own credit risk 91 71
Reclassification of net gains (losses) of designated financial assets applying the overlay
approach ‑ 91
Deferred tax on income and reserves (96) (619)
of which Reclassification of net gains (losses) of designated financial assets applying the
overlay approach ‑ (91)
TOTAL DEFERRED TAX 998 927
¹ The portion of deferred tax related to tax loss carryforwards was €361 million for 2020 compared to €380 million for 2019.
Deferred tax assets are netted on the balance sheet by taxable entity.
In order to assess the level of deferred tax assets to be recognised, Crédit Agricole S.A. takes into account for each
company or tax group concerned the dedicated tax status and the earnings projections established during the
budgetary process.

Consolidated financial statements of Credit Agricole S.A. 31 December 2020
166
6.11 Accrued income and expenses and other assets and liabilities
ACCRUALS, PREPAYMENTS AND SUNDRY ASSETS
(in millions of euros) 31/12/2020 31/12/2019
Other assets 33,160 31,789
Inventory accounts and miscellaneous 217 195
Collective management of Livret de Développement Durable (LDD) savings
account ‑ ‑
Sundry debtors ¹ 29,585 27,608
Settlements accounts 706 1,531
Due from shareholders - unpaid capital 29 29
Other insurance assets 327 329
Reinsurer's share of technical reserves 2,296 2,097
Accruals and deferred income 7,147 6,560
Items in course of transmission 2,702 2,355
Adjustment and suspense accounts 269 230
Accrued income 3,021 2,623
Prepaid expenses 548 525
Other accruals prepayments and sundry assets 607 827
CARRYING AMOUNT 40,307 38,349
¹ Including €72 million in respect of the contribution to the Single Resolution Fund in the form of a security deposit at
31 December 2020. The Single Resolution Fund may use the security deposit to provide funding unconditionally and
at any time.
ACCRUALS, DEFERRED INCOME AND SUNDRY LIABILITIES
(in millions of euros) 31/12/2020 31/12/2019
Other liabilities ¹ 41,283 36,426
Settlements accounts 1,769 2,504
Sundry creditors 37,541 32,254
Liabilities related to trading securities 204 230
Lease liabilities 3 1,757 1,407
Other insurance liabilities 12 31
Accruals and deferred income 11,658 12,859
Items in course of transmission ² 3,250 3,473
Adjustment and suspense accounts 1,120 1,609
Unearned income 1,233 1,317
Accrued expenses 5,266 5,492
Other accrual prepayments and sundry liabilities 789 968
Carrying amount 52,941 49,285
1 The amounts shown include related debts. 2 Net amounts are shown. 3 Taking into account the effects of first-time adoption of the IFRS IC decision of 26 November 2019 respecting the
duration of IFRS 16 leases, the balance of rental liabilities in the balance sheet would have been €1,801 million at 31
December 2019 (see Note 1.1 Applicable standards and comparability).

Consolidated financial statements of Credit Agricole S.A. 31 December 2020
167
6.12 Non-current assets held for sale and discontinued operations
BALANCE SHEET OF DISCONTINUED OR HELD FOR SALE OPERATIONS
(in millions of euros) 31/12/2020 31/12/2019
Cash, central banks 50 55
Financial assets at fair value through profit or loss 5 ‑
Hedging derivative Instruments ‑ ‑
Financial assets at fair value through other comprehensive income 32 40
Financial assets at amortised cost 2,597 370
Revaluation adjustment on interest rate hedged portfolios ‑ ‑
Current and deferred tax assets 26 ‑
Accruals, prepayments and sundry assets 24 1
Investments in equity-accounted entities ‑ ‑
Investment property ‑ ‑
Property, plant and equipment 13 5
Intangible assets (13) 4
Goodwill ‑ ‑
Total Assets 2,734 475
Central banks ‑ ‑
Financial liabilities at fair value through profit or loss ‑ ‑
Hedging derivative Instruments ‑ ‑
Financial liabilities at amortised cost 1,254 420
Revaluation adjustment on interest rate hedged portfolios ‑ ‑
Current and deferred tax liabilities 2 ‑
Accruals, prepayments and sundry liabilities 25 5
Provisions 16 1
Subordinated debt ‑ 9
Adjustment to fair value of assets held for sale and discontinued operations
(excluding taxes) 133 43
Total Liabilities and equity 1,430 478
NET ASSET FROM DISCONTINUED OR HELD-FOR-SALE OPERATIONS 1,304 (3)

Consolidated financial statements of Credit Agricole S.A. 31 December 2020
168
INCOME STATEMENT FROM DISCONTINUED OPERATIONS
(in millions of euros) 31/12/2020 31/12/2019
Revenues 17 12
Operating expenses (63) (12)
Depreciation, amortisation and impairment of property, plant & equipment and
intangible assets (32) (2)
Cost of risk 4 (1)
Pre-tax income (74) (3)
Share of net income of equity-accounted entities ‑ ‑
Net gains (losses) on other assets ‑ ‑
Change in value of goodwill (55) ‑
Income tax charge (4) ‑
Net income (133) (3)
Income associated with fair value adjustments of discontinued operations (88) (43)
Net income from discontinued operations (221) (46)
Non-controlling interests ‑ ‑
NET INCOME FROM DISCONTINUED OPERATIONS - GROUP SHARE (221) (46)
DISCONTINUED OPERATIONS CASH FLOW STATEMENT
(in millions of euros) 31/12/2020 31/12/2019
Net cash flows from (used by) operating activities 97 (23)
Net cash flows from (used by) investment activities (2) ‑
Net cash flows from (used by) financing activities (125) 7
TOTAL (30) (16)

Consolidated financial statements of Credit Agricole S.A. 31 December 2020
169
6.13 Joint ventures and associates
FINANCIAL INFORMATION OF JOINT VENTURES AND ASSOCIATES
At 31 December 2020,
the equity-accounted value of joint ventures totalled €3,081 million (€2,845 million at 31 December 2019),
the equity-accounted value of associates totalled €4,569 million (€4,387 million at 31 December 2019).
FCA Bank is a joint venture created with the Fiat Chrysler Automobiles Group. In 2019, Crédit Agricole S.A., Crédit
Agricole Consumer Finance and Fiat Chrysler Automobiles (formerly Fiat Group Automobiles) renewed their agreement
to extend their 50/50 joint venture until 31 December 2024. The company operates in 18 European countries and
manages all financing operations for dealers and customers of 18 brands: Fiat, Fiat Professional, Lancia, Alfa Roméo,
Abarth, Maserati, Chrysler, Jeep, Ferrari, Aston Martin, Morgan, Dodge, RAM, Harley, MV Agusta and Hymer in Europe,
and Jaguar Land Rover in Continental Europe. As such, it is strategic for the development of the JV Automobiles
business.
Material associates and joint ventures are presented in the table below. These are the main joint ventures and
associates that make up the “Equity-accounted value on the balance sheet”.
(in millions of euros)
% of
interest
Equity-
accounted
value
Share of
market
value
Dividends
paid to
Group’s
entities
Share of
net
income 1
Share of
shareholders’
equity 2
Joint ventures
Fca Bank 50.0% 2,117 ‑ ‑ 307 1,811
S3 Latam Holdco 1 34.8% 262 ‑ ‑ 7 525
Others 702 ‑ 22 (14) 910
Net carrying amount of investments in equity-accounted
entities (Joint ventures) 3,081 300 3,246
Associates
Icade 19.0% 935 892 56 49 544
Korian 24.3% 768 801 ‑ 18 728
Ramsay Generale De Sante 39.6% 669 785 ‑ 5 401
Altarea 24.7% 583 613 37 5 486
Gac Sofinco Auto Finance Co (Ex Gac Cacf) 50.0% 375 ‑ 26 52 375
Sci Heart Of La Defense 33.3% 264 230 10 4 264
Frey 19.4% 146 143 7 6 144
Abc-Ca Fund Management Co 22.7% 143 16 143
Wafasalaf 49.0% 127 ‑ ‑ (9) 71
Sbi Funds Management Private Limited 25.2% 123 ‑ 6 39 99
Others 436 16 251
Net carrying amount of investments in equity-accounted
entities (Associates) 4,569 200 3,506
NET CARRYING AMOUNT OF INVESTMENTS IN EQUITY-
ACCOUNTED ENTITIES 7,650 501 6,752
¹ The share of income of insurance activities and associates as well as the related share of benefits are classified as Net Banking Income in the income
statement. ² Shareholders’ equity Group share in the financial statements of the joint venture or associate when the joint venture or associate is a sub-group.
The market value shown in the table above is the quoted price of the shares on the market at 31 December 2020. This
value may not be representative of the selling value since the value in use of equity-accounted entities may be
different from the equity-accounted value determined pursuant to IAS 28. Investments in equity-accounted entities
were subject to impairment tests, in case of an indication of impairment, using the same methodology as for goodwill.

Consolidated financial statements of Credit Agricole S.A. 31 December 2020
170
(in millions of euros)
31/12/2019
% of
interest
Equity-
accounted
value
Share of
market
value
Dividends
paid to
Group’s
entities
Share of
net
income 1
Share of
shareholders’
equity 2
Joint ventures
Fca Bank 50.0% 1,818 ‑ 90 232 1,572
S3 Latam Holdco1 34.8% 234 357
Others 792 ‑ 34 62 1,088
Net carrying amount of investments in equity-accounted
entities (Joint ventures) 2,845 294 3,016
Associates
Icade 19.0% 929 1,372 63 32 539
Ramsay Generale De Sante 39.6% 663 735 ‑ 3 395
Korian 24.4% 650 838 11 29 610
Altarea 24.7% 596 835 51 65 497
Gac Sofinco Auto Finance Co (Ex Gac Cacf) 50.0% 358 ‑ 6 51 358
Sci Heart Of La Defense 33.3% 269 266 14 11 269
Frey 19.3% 146 156 4 7 113
Wafasalaf 49.0% 139 ‑ 13 15 81
Abc-Ca Fund Management Co 22.8% 131 ‑ ‑ 9 131
Sbi Funds Management Private Limited 25.3% 103 ‑ 5 24 76
Others 404 67 184
Net carrying amount of investments in equity-accounted
entities (Associates) 4,387 313 3,253
NET CARRYING AMOUNT OF INVESTMENTS IN EQUITY-
ACCOUNTED ENTITIES 7,232 607 6,269
¹ The share of income of insurance activities and associates as well as the related share of benefits are classified as Net Banking Income in the income
statement.
² Shareholders’ equity Group share in the financial statements of the joint venture or associate when the joint venture or associate is a sub-group.

Consolidated financial statements of Credit Agricole S.A. 31 December 2020
171
Condensed financial information for the material associates and joint ventures of the Crédit Agricole S.A. Group is
shown below:
(in millions of euros)
31/12/2020
Revenues Net income Total assets Total Equity
Joint ventures
Fca Bank 836 501 25,767 3,622
S3 Latam Holdco 1 77 29 1,182 1,049
Associates
Icade 258 258 12,429 3,715
Korian 74 74 11,884 2,620
Ramsay Generale De Sante 13 13 6,715 1,037
Altarea 19 19 9,114 2,939
Gac Sofinco Auto Finance Co (Ex Gac Cacf) 233 104 6,338 789
Sci Heart Of La Defense 13 13 1,880 795
Frey 31 31 1,430 743
Abc-Ca Fund Management Co 98 48 512 430
Wafasalaf 102 (18) 1,224 145
Sbi Funds Management Private Limited 170 104 301 269
(in millions of euros)
31/12/2019
Revenues Net income Total assets Total Equity
Joint ventures
Fca Bank 1,018 467 31,582 3,143
S3 Latam Holdco 1 ‑ ‑ 715 714
Associates
Icade 175 175 11,828 3,596
Ramsay Generale De Sante 8 8 4,361 1,039
Korian 119 119 10,720 2,478
Altarea 263 263 8,563 3,187
Gac Sofinco Auto Finance Co (Ex Gac Cacf) 217 101 5,214 1,471
Sci Heart Of La Defense 33 33 1,881 816
Frey 35 35 1,056 583
Wafasalaf 103 30 1,244 332
Abc-Ca Fund Management Co 80 28 461 785
Sbi Funds Management Private Limited 150 66 254 413
SCI Heart of La Défense entered the scope of consolidation under the equity method in 2018.

Consolidated financial statements of Credit Agricole S.A. 31 December 2020
172
SIGNIFICANT RESTRICTIONS ON JOINT VENTURES AND ASSOCIATES
Crédit Agricole S.A. has the following restrictions:
REGULATORY CONSTRAINTS
The subsidiaries of Crédit Agricole S.A. are subject to prudential regulation and regulatory capital requirements in their
host countries. The minimum equity capital (solvency ratio), leverage ratio and liquidity ratio requirements limit the
capacity of these entities to pay dividends or to transfer assets to Crédit Agricole S.A. Group.
LEGAL CONSTRAINTS
The subsidiaries of Crédit Agricole S.A. are subject to legal provisions concerning the distribution of capital and
distributable earnings. These requirements limit the ability of the subsidiaries to distribute dividends. In the majority of
cases, these are less restrictive than the regulatory limitations mentioned above.
RESTRICTION ON ASSETS BACKING UNIT-LINKED CONTRACTS FOR THE INSURANCE BUSINESS
Assets backing unit-linked contracts of Crédit Agricole S.A. are held for the benefit of policyholders. Assets of the
insurance subsidiaries of Crédit Agricole S.A. are mainly held for satisfying their obligation towards their policyholders.
Assets transfers to other entities are possible following the legal conditions. However, in case of a transfer, a part of the
profit due to the transfer must be intended for the policyholders.
6.14 Investment property
(in millions of euros) 31/12/2019
Changes in
scope
Increases
(acquisitions)
Decreases
(disposals)
Translation
adjustments
Other
movements 31/12/2020
Gross amount 6,673 ‑ 253 (308) ‑ 7 6,625
Depreciation and
impairment (97) ‑ (5) 4 ‑ (5) (103)
CARRYING AMOUNT ¹ 6,576 ‑ 248 (304) ‑ 2 6,522
1 Including investment property let to third parties
(in millions of euros) 31/12/2018
Changes
in scope
Increases
(acquisitions)
Decreases
(disposals)
Translation
adjustments
Other
movements 31/12/2019
Gross amount 6,492 ‑ 555 (388) ‑ 14 6,673
Depreciation and
impairment (84) ‑ (4) 7 ‑ (16) (97)
CARRYING AMOUNT ¹ 6,408 ‑ 551 (381) ‑ (2) 6,576
1 Including investment property let to third parties
FAIR VALUE OF INVESTMENT PROPERTIES
The market value of investment property recorded at cost, as valued by “expert appraisers”, was €9,955 million at
31 December 2020 compared to €9,784 million at 31 December 2019.
(in millions of euros) 31/12/2020 31/12/2019
Quoted prices in active markets for identical instruments Level 1 ‑ ‑
Valuation based on observable data Level 2 9,823 9,639
Valuation based on unobservable data Level 3 132 145
MARKET VALUE OF INVESTMENT PROPERTIES 9,955 9,784
All investment property are recognised at cost in the balance sheet.

Consolidated financial statements of Credit Agricole S.A. 31 December 2020
173
6.15 Property, plant & equipment and intangible assets (excluding goodwill)
Property, plant and equipment used in operations includes the rights of use of assets leased as lessee.
Depreciation and impairment of property, plant and equipment is presented including depreciation on property, plant
and equipment leased under operating leases.
(in millions of
euros) 31/12/2019
Changes
in scope
Increases
(acquisitions)
Decreases
(disposals and
redemptions)
Translation
adjustments
Other
movements 1 31/12/2020
Property, plant & equipment used in operations
Gross amount 10,249 99 831 (517) (118) 434 10,978
Depreciation
and impairment (4,651) (30) (742) 213 60 (49) (5,199)
Carrying amount 5,598 69 89 (304) (58) 385 5,779
Intangible assets
Gross amount 7,808 84 601 (236) (27) (16) 8,214
Depreciation
and impairment (4,645) ‑ (476) 154 15 (66) (5,018)
Carrying amount 3,163 84 125 (82) (12) (82) 3,196
1 Taking into account the effects of first-time adoption of the IFRS IC decision of 26 November 2019 respecting the duration of IFRS
16 leases, the balance of rights of use in the balance sheet would have been €1,762 million at 31 December 2019 (versus
€1,371 million before application of the IFRS IC decision) (see Note 1.1 “Applicable standards and comparability”).
(in millions of euros) 31/12/2018 01/01/2019¹
Changes
in scope 2
Increases
(acquisitions)
Decreases
(disposals)
Translation
adjustments
Other
movements 31/12/2019
Property, plant & equipment used in operations
Gross amount 8,466 9,968 (190) 769 (575) 56 221 10,249
Depreciation and
impairment (4,397) (4,451) 129 (707) 461 (25) (58) (4,651)
CARRYING AMOUNT 4069 5,517 (61) 62 (114) 31 163 5,598
Intangible assets
Gross amount 6,985 6,926 697 586 (411) 11 (1) 7,808
Depreciation and
impairment (4,698) (4,644) 80 (442) 390 (6) (23) (4,645)
CARRYING AMOUNT 2,287 2,282 777 144 (21) 5 (24) 3,163
1 Right of use impact recognised in First Time Application of the IFRS 16 standard.
2 Essentially related to the entries of Agos S.p.A and Santander Securities Services S.A.

Consolidated financial statements of Credit Agricole S.A. 31 December 2020
174
6.16 Goodwill
(in millions of euros) 31/12/2019
GROSS 31/12/2019 NET Increases
(acquisitions)
Decreases
(Divestments)
Impairment losses during
the period
Translation
adjustments Other movements 31/12/2020
GROSS 31/12/2020 NET
Asset gathering 6,908 6,908 335 ‑ ‑ (50) ‑ 7,192 7,193
of which insurance 1,214 1,214 ‑ ‑ ‑ ‑ ‑ 1,213 1,214
of which asset
management ¹ 4,868 4,868 335 ‑ ‑ (51) ‑ 5,152 5,152
of which international
wealth management 826 826 ‑ ‑ ‑ 1 ‑ 827 827
French Retail Banking -
LCL 5,263 4,161 ‑ ‑ ‑ ‑ ‑ 5,263 4,161
International retail
banking 3,239 1,698 ‑ ‑ (903) (3) ‑ 3,208 792
of which Italy ³ 2,872 1,660 ‑ ‑ (903) ‑ ‑ 2,871 757
of which Poland 221 ‑ ‑ ‑ ‑ ‑ ‑ 207 ‑
of which Ukraine 39 ‑ ‑ ‑ ‑ ‑ ‑ 38 ‑
of which other countries 97 38 ‑ ‑ ‑ (3) ‑ 92 35
Specialised financial
services 2,819 1,128 47 (55) ‑ (1) ‑ 2,810 1,119
of which Consumer
finance (excl.Agos) ² 1,694 956 25 (55) ‑ ‑ ‑ 1,664 926
of which Consumer
finance-Agos 672 103 ‑ ‑ ‑ ‑ ‑ 672 103
of which Factoring ⁴ 453 69 22 ‑ ‑ (1) ‑ 474 90
Large customers 2,610 1,385 17 ‑ ‑ (1) (7) 2,620 1,394
of which Corporate and
investment banking 1,711 486 ‑ ‑ ‑ (1) ‑ 1,711 485
of which Asset servicing 899 899 17 ‑ ‑ ‑ (7) 909 909
Corporate Centre ‑ ‑ ‑ ‑ ‑ ‑ ‑ ‑ ‑
Total 20,839 15,280 400 (55) (903) (55) (7) 21,093 14,659
Group Share 18,959 13,570 289 (55) (778) (39) (29) 19,096 12,957
Non-controlling interests 1,880 1,710 111 ‑ (125) (16) 22 1,997 1,702
¹ Goodwill of €335 million at 31 December 2020 following the acquisition of Sabadell Asset Management by the AMUNDI Group.
² Goodwill of €25 million at 31 December 2020 following the additional acquisition of Ménafinance shares by the CACF Group, resulting in a change in
consolidation method from equity-accounted to full consolidation.
³ Following the annual valuation tests of the goodwill recorded in its balance sheet during the fourth quarter of 2020, CA Italia recognised an
impairment of €903 million at 31 December 2020.
⁴ Goodwill of €21 million at 31 December 2020 following the acquisition of Hama POLSKA by the Crédit Agricole Leasing & Factoring Group.
Determining the value in use of the CGUs
Goodwill was subject to impairment tests based on the assessment of the value in use of the cash generating units
(CGU) with which it is associated. Determining the value in use was based on discounting the CGUs’ estimated future
cash flows calculated from activities forecasts over a period over three years (2021-2023) developed for Group
management purposes, extrapolated over a fourth and fifth year in order to merge towards a standardized final year
integrating the catch-up effects expected after COVID.
Following the evolution of the health situation, the economic scenario serving as a basis for projected financial
trajectories was adjusted. However, this remains particularly difficult this year because it depends on how the
pandemic evolves, which is still very uncertain.
This scenario is based on an economy heavily impacted by the health crisis in 2020 which resulted in a significant drop
in GDP. Business was strongly impacted for almost nine months by periods when entire sections of the economy were
brought to a standstill alternating with phases of partial recovery when health constraints were relaxed. The scenario
assumes that the epidemic will persist in 2021, prolonging this alternation of restrictions and short periods of confinement
and lifting of constraints during the first half of the year, but exerting a less violent impact and penalizing the economy
less than in 2020 through better control of the epidemic, less severe restrictions on mobility and production and a
generally well preserved productive system. It assumes a gradual and moderate recovery in 2021: i) linked to
controlling the spread of the virus through vaccination campaigns, ii) yet limited due to the behaviour of agents who

Consolidated financial statements of Credit Agricole S.A. 31 December 2020
175
will likely remain more cautious (precautionary savings, postponement of investments) and due to the aftermath of
the crisis (rise in unemployment, rise in bankruptcies). Against this backdrop, the growth forecasts are moderately
dynamic for 2021 with a very low level of expected inflation.
States will continue to implement policies to support the economy in order to limit damage to the productive apparatus
and the labour market, and launch recovery plans to stimulate investment and support household consumption.
However, certain sectors will remain weakened and subject to certain restrictions including automotive, commerce,
tourism, hotels, restaurants, culture, etc.
To stimulate growth and inflation, while preserving financial stability, central banks will gradually move towards
accommodating monetary policies that maintain interest rates at a low level for an extended period of time, negative
even for short-term Euro rates. In Europe, asset purchase programmes should help avoid fragmentation (limiting the
widening of spreads). Under these conditions, the prospect of a rise in interest rates appears to be more distant than
previously anticipated, this having a more significant impact on International CGU Retail Banking - Italy, whose
sensitivity to these changes is more marked.
As of 31 December 2020, perpetual growth rates, discount rates and capital allocated rates as a proportion of risk-
weighted assets were distributed by business lines as shown in the table below:
In 2020 (for Crédit Agricole S.A. fully consolidated
entities)
Perpetual growth
rates
Discount
rates
Capital
allocated
French retail banking – LCL 2.0%. 7.6%. 8.85%.
International retail banking – Italy 2.0%. 8.8%. 8.99%.
International retail banking – Others 5.0%. 17.0%. 9.50%.
Specialised financial services1 2.0%. 7.6% to 9.3% 8.84% to 9.13%
Asset gathering 2.0%. 7.6% to 8.5% 8.89% to 9.13%
80% of the
solvency margin
(Insurance)
Large customers 2.0%. 8% to 9.4% 8.88% to 8.93%
1 The Consumer Credit CGU (excluding Agos) now excludes CACF NL which was classified under IFRS 5 “assets held for
sale” last September, resulting in an impairment of the CGU's goodwill in the amount of €55 million.
The increase by the European Central Bank (ECB) of regulatory prudential requirements under Pillar 1 and Pillar 2 with
effect from 2016 led Crédit Agricole S.A. progressively to raise the level of capital allocated to CGUs as a percentage
of risk-weighted assets for certain entities. Last year this allowance was between 9.50% and 9.75% of weighted uses for
all CGUs including counter-cyclical buffers, a rate to which the various applicable contra-cyclical buffers should be
added, in particular the one that the High Council for Financial Stability (HCSF) had set up in France.
Following the health crisis, the High Council for Financial Stability in its decision of June 18, 2020, announced the
elimination of certain counter-cyclical buffers as well as the early application of article 104a of CRD 5 which authorizes
the coverage of requirements pillar 2 (P2R) with 56.25% of CET1 capital, thus reducing the CET1 requirement for Crédit
Agricole SA by 66 basis points in both P2R and P2G. Due to a higher P2R requirement in Italy, this gain is 77 basis points
for the International Retail Banking CGT - Italy. Certain counter-cyclical cushions imposed by foreign supervisors have
also been reduced to zero.
Compared to the previous year all of these measures lead to a reduction in the allocation of CET1 capital of between
77 and 115 bp, depending on the CGU considered.
Valuation parameters, in particular the discount rates, were updated to 31 December 2020.
Perpetual growth rates as of 31 December 2020 remain unchanged from those used as of 31 December 2019.
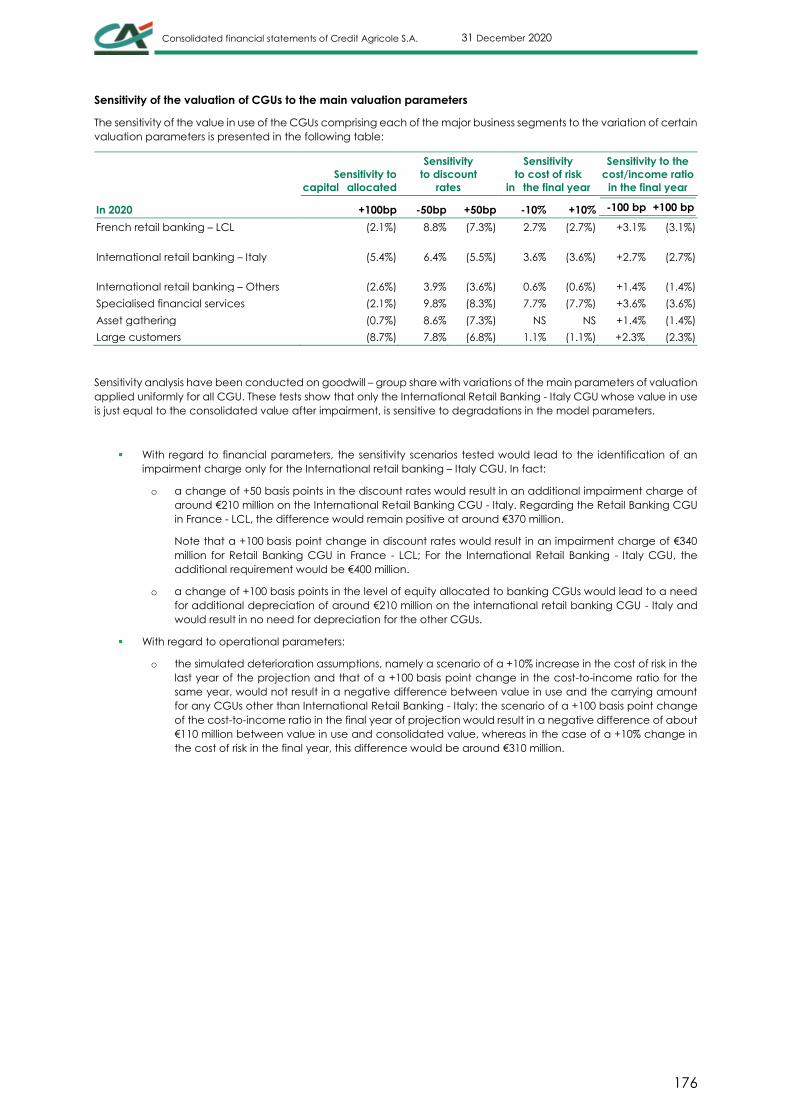
Consolidated financial statements of Credit Agricole S.A. 31 December 2020
176
Sensitivity of the valuation of CGUs to the main valuation parameters
The sensitivity of the value in use of the CGUs comprising each of the major business segments to the variation of certain
valuation parameters is presented in the following table:
In 2020
Sensitivity to
capital allocated
Sensitivity
to discount
rates
Sensitivity
to cost of risk
in the final year
Sensitivity to the
cost/income ratio
in the final year
+100bp -50bp +50bp -10% +10% -100 bp +100 bp
French retail banking – LCL (2.1%) 8.8% (7.3%) 2.7% (2.7%) +3.1% (3.1%)
International retail banking – Italy (5.4%) 6.4% (5.5%) 3.6% (3.6%)
+2.7%
(2.7%)
International retail banking – Others (2.6%) 3.9% (3.6%) 0.6% (0.6%)
+1.4%
(1.4%)
Specialised financial services (2.1%) 9.8% (8.3%) 7.7% (7.7%) +3.6% (3.6%)
Asset gathering (0.7%) 8.6% (7.3%) NS NS +1.4% (1.4%)
Large customers (8.7%) 7.8% (6.8%) 1.1% (1.1%) +2.3% (2.3%)
Sensitivity analysis have been conducted on goodwill – group share with variations of the main parameters of valuation
applied uniformly for all CGU. These tests show that only the International Retail Banking - Italy CGU whose value in use
is just equal to the consolidated value after impairment, is sensitive to degradations in the model parameters.
With regard to financial parameters, the sensitivity scenarios tested would lead to the identification of an
impairment charge only for the International retail banking – Italy CGU. In fact:
o a change of +50 basis points in the discount rates would result in an additional impairment charge of
around €210 million on the International Retail Banking CGU - Italy. Regarding the Retail Banking CGU
in France - LCL, the difference would remain positive at around €370 million.
Note that a +100 basis point change in discount rates would result in an impairment charge of €340
million for Retail Banking CGU in France - LCL; For the International Retail Banking - Italy CGU, the
additional requirement would be €400 million.
o a change of +100 basis points in the level of equity allocated to banking CGUs would lead to a need
for additional depreciation of around €210 million on the international retail banking CGU - Italy and
would result in no need for depreciation for the other CGUs.
With regard to operational parameters:
o the simulated deterioration assumptions, namely a scenario of a +10% increase in the cost of risk in the
last year of the projection and that of a +100 basis point change in the cost-to-income ratio for the
same year, would not result in a negative difference between value in use and the carrying amount
for any CGUs other than International Retail Banking - Italy: the scenario of a +100 basis point change
of the cost-to-income ratio in the final year of projection would result in a negative difference of about
€110 million between value in use and consolidated value, whereas in the case of a +10% change in
the cost of risk in the final year, this difference would be around €310 million.

Consolidated financial statements of Credit Agricole S.A. 31 December 2020
177
6.17 Insurance company technical reserves
BREAKDOWN OF INSURANCE TECHNICAL RESERVES
31/12/2020
(in millions of euros) Life Non-Life International Creditor Total
Insurance contracts 215,228 6,802 24,857 2,066 248,953
Investment contracts with discretionary profit-sharing 67,321 ‑ 16,155 ‑ 83,476
Investment contracts without discretionary profit-sharing 2,608 ‑ 1,637 ‑ 4,245
Deferred participation benefits (liability) 25,556 ‑ 1,284 ‑ 26,840
Total Technical reserves 310,713 6,802 43,933 2,066 363,514
Deferred participation benefits (asset) ‑ ‑ ‑ ‑ ‑
Reinsurer's share of technical reserves (1,255) (617) (73) (351) (2,296)
NET TECHNICAL RESERVES 309,458 6,185 43,860 1,715 361,218
31/12/2019
(in millions of euros) Life Non-Life International Creditor Total
Insurance contracts 208,188 6,092 24,167 2,005 240,452
Investment contracts with discretionary profit-sharing 70,161 ‑ 15,284 ‑ 85,445
Investment contracts without discretionary profit-sharing 2,420 ‑ 1,694 ‑ 4,114
Deferred participation benefits (liability) 25,824 ‑ 763 ‑ 26,587
Total Technical reserves 306,593 6,092 41,909 2,005 356,599
Deferred participation benefits (asset) ‑ ‑ ‑ ‑ ‑
Reinsurer's share of technical reserves (1,151) (579) (86) (280) (2,096)
NET TECHNICAL RESERVES 305,442 5,513 41,823 1,725 354,503
Reinsurers’ share in technical reserves and other insurance liabilities is recognised under “Accruals, prepayments and
sundry liabilities”. The breakdown of insurance company technical reserves is presented before elimination of issues in
euro and in units of account subscribed by insurance companies.
Deferred policyholders’ profit sharing, before tax, at 31 December 2020 and 31 December 2019 breaks down as follows:

Consolidated financial statements of Credit Agricole S.A. 31 December 2020
178
Deferred participation benefits 31/12/2020 31/12/2019
(in millions of euros)
Deferred participation
benefits in liabilities (in
assets when appropriate)
Deferred
participation benefits
in liabilities (in assets
when appropriate)
Deferred participation on revaluation of financial assets at fair
value through other comprehensive income and hedging
derivatives (22,768) (22,550)
of which deferred participation on revaluation of financial
assets at fair value through other comprehensive income ¹ (23,371) (23,322)
of which deferred participation hedging derivatives 603 772
Deferred participation on financial assets at fair value through
profit or loss adjustement (1,611) (1,783)
Other deferred participation (2,461) (2,254)
TOTAL PRE-TAX OTHER DEFERRED PARTICIPATION BENEFITS (26,840) (26,587)
¹ See Note 6.4 "Assets at fair value through other comprehensive income"

Consolidated financial statements of Credit Agricole S.A. 31 December 2020
179
6.18 Provisions
(in millions of euros) 31/12/2019
Changes in
scope Additions
Reversals,
amounts
used
Reversals,
amounts not
used
Translation
adjustments
Other
movements 31/12/2020
Home purchase
schemes risks 367 ‑ 78 ‑ ‑ ‑ ‑ 445
Execution risks of
commitments by
signature 910 2 815 (17) (769) (28) (4) 909
Operational risks 103 ‑ 53 (23) (15) (2) (16) 100
Employee
retirement and
similar benefits ¹ 1,667 ‑ 159 (125) (89) (5) 89 1,696
Litigation 607 ‑ 66 (55) (29) (3) (3) 583
Equity investments ‑ ‑ ‑ ‑ ‑ ‑ ‑ ‑
Restructuring 33 ‑ 7 (3) (9) ‑ (1) 27
Other risks 677 ‑ 148 (56) (232) (3) (97) 437
TOTAL 4,364 2 1,326 (279) (1,143) (41) (32) 4,197
1 Of which €1,350 million for post-employment benefits under defined-benefit schemes, as detailed in Note 7.4,
including €149 million for the provision for long-service awards.
At 31 December 2020, employee retirement and similar benefits included €71 million (€103 million at 31 December
2019) of provisions arising from social costs of the adaptation plans. The provision for restructuring includes the non-
social costs of those plans.
(in millions of euros) 31/12/2018 1/1/2019 1
Changes in
scope Additions
Reversals,
amounts used
Reversals, amounts
unused
Translation
adjustments
Other
movements 31/12/2019
Home purchase
schemes risks 245 245 ‑ 122 ‑ ‑ ‑ ‑ 367
Execution risks of
commitments by
signature 872 872 ‑ 776 (41) (710) 8 5 910
Operational risks 68 68 ‑ 35 (11) (9) ‑ 20 103
Employee
retirement and
similar benefits
1,709 1,709 (5) 151 (226) (87) 8 117 1,667
Litigation 2,132 521 2 52 (39) (27) 2 96 607
Equity investments 1 1 ‑ 2 (1) (2) ‑ ‑ ‑
Restructuring 24 24 2 12 (2) (1) ‑ (2) 33
Other risks 758 758 3 132 (72) (120) ‑ (24) 677
TOTAL 5,809 4,198 2 1,282 (392) (956) 18 212 4,364
1 Reclassification of provisions for tax risks relating to income tax from “Provisions” to “Current and deferred tax liabilities” at 1 January
2019 for €1,611 million.

Consolidated financial statements of Credit Agricole S.A. 31 December 2020
180
INQUIRIES AND REQUESTS FOR REGULATORY INFORMATION
The main files linked to inquiries and requests for regulatory information are:
Strauss/Wolf/Faudem
US citizens and members of their families who were victims of terrorist attacks attributed to Hamas and committed in
Israel between 2001 and 2004 have brought proceedings against Crédit Lyonnais and another bank before a New York
court.
They claim that these banks gave support to terrorists as they each kept an account opened (in 1990 in the case of
Crédit Lyonnais) by a charity providing aid to Palestinians. The plaintiffs allege that the account was used to transfer
funds to Palestinian entities accused of financing Hamas. The plaintiffs, who have not put a figure on the damages
they have suffered, are claiming compensation for “injury, anguish and emotional pain”.
As the matter and the proceedings currently stand, the plaintiffs have not provided proof that the charity was actually
linked to terrorists, nor that Crédit Lyonnais was aware that its client could have been involved (if it were to be proven)
in financing terrorism. The Court nonetheless demanded that this be demonstrated by the plaintiffs if they are to win
their case. Crédit Lyonnais vigorously denies the plaintiffs’ allegations.
Under a ruling made on 28 February 2013, the judge issued a Summary Judgement referring Crédit Lyonnais and the
plaintiffs to a jury trial on the merits.
In February 2018, Crédit Lyonnais filed a new motion for a summary judgement based on a recent case-law so that
the plaintiffs’ claims can be dismissed without such a jury trial.
On January 2019 the plaintiffs tried to modify their briefs in order to add new plaintiffs before their action be time-
barred. The judge refused this request and two new actions (Fisher and Miller) have been filed before the same court
as the one in charge of the procedures Strauss /Wolf. They are similar to the pending actions, their legal analysis are
identical and their result will depend on the outcome of the motion for a summary judgement filed by Crédit Lyonnais
in February 2018. From a procedural standpoint they will remain outstanding until then.
On 31 March 2019 the court upheld in its entirety the “motion for summary judgement” filed by Crédit Lyonnais in
February 2018. It considered that no reasonable jury could find in favour of the plaintiffs and dismissed all their claims.
The plaintiffs appealed against this decision.
CIE case (Cheque Image Exchange)
In March 2008, LCL and Crédit Agricole S.A. and ten other banks were served notice of grievances on behalf of the
Conseil de la concurrence i.e. the French Competition Council (now the Autorité de la concurrence).
They are accused of colluding to implement and apply interchange fees for cashing cheques, since the passage of
the Cheque Image Exchange system, i.e. between 2002 and 2007. In the opinion of the Autorité de la concurrence,
these fees constitute anti-competitive price agreements in the meaning of Articles 81 paragraph 1 of the treaty
establishing the European Community and Article L. 420-1 of the French Commercial Code, and allegedly caused
damage to the economy.
In their defence, the banks categorically refuted the anticompetitiveness of the fees and contested the legality of the
proceedings.
In a decision published on 20 September 2010, the Autorité de la concurrence stated that the Cheque Image
Exchange fee (CEIC) was anti-competitive by its very aim and that it artificially increased the costs borne by remitting
banks, which resulted in an unfavourable impact on the prices of banking services. Concerning one of the fees for
related services, the fee for cancellation of wrongly cleared transactions (AOCT), the Autorité de la concurrence
called on the banks to revise their amount within six months of the notification of the decision.
The accused banks were sanctioned for an overall amount of €384.92 million.
LCL and Crédit Agricole were respectively sentenced to pay €20.7 million and €82.1 million for the CEIC and €0.2 million
and €0.8 million for the AOCT.
All of the banks appealed the decision to the Paris Court of Appeal. By a decree of 23 February 2012, the Court
overruled the decision, stating that the Autorité de la concurrence had not proven the existence of competition
restrictions establishing the agreement as having an anti-competitive purpose.
The Autorité de la concurrence filed an appeal with the Supreme Court on 23 March 2012.
On 14 April 2015, the French Supreme Court (Cour de cassation) overruled the Paris Court of Appeal’s decision dated
23 February 2012 and remanded the case to the Paris Court of Appeal with a change in the composition of the Court
on the sole ground that the Paris Court of Appeal declared the UFC-Que Choisir and ADUMPE’s interventions in the
proceedings devoid of purpose without having considered their arguments.

Consolidated financial statements of Credit Agricole S.A. 31 December 2020
181
The Supreme Court did not rule on the merits of the case and Crédit Agricole has brought the case before the Paris
Court of Appeal.
The Paris Court of Appeal issued a decree on 21 December 2017. It confirmed the decision of the Autorité de la
concurrence dated 20 September 2010 but reduced from €82,940,000 to €76,560,000 the sanction on Crédit Agricole.
LCL’s sanction remains unchanged, at an amount of €20,930,000.
As well as the other banks parties to this procedure, LCL and Crédit Agricole filed an appeal with the Supreme Court.
On 29 January 2020, the French Supreme Court (Cour de cassation) overruled the Paris Court of Appeal’s decision
dated 21 December 2017 and referred the case to the same Court with a different composition on the ground that
the Paris Court of Appeal had not characterized the existence of restrictions of competition by object.
Office of Foreign Assets Control (OFAC)
In October 2015, Crédit Agricole S.A. and its subsidiary Crédit Agricole Corporate and Investment Bank (Crédit Agricole
CIB) reached agreements with the US and New York authorities that had been conducting investigations regarding US
dollar transactions with countries subject to US economic sanctions. The events covered by this agreement took place
between 2003 and 2008.
Crédit Agricole CIB and Crédit Agricole S.A., which cooperated with the US and New York authorities in connection
with their investigations, have agreed to pay a total penalty amount of $787.3 million (i.e. €692.7 million). The payment
of this penalty has been allocated to the pre-existing reserve that had already been taken and, therefore, has not
affected the accounts for the second half of 2015.
The agreements with the Board of Governors of the Federal Reserve System (Fed) and the New York State Department
of Financial Services (NYDFS) are with CASA and Crédit Agricole CIB. The agreement with the Office of Foreign Assets
Control (OFAC) of the US Department of the Treasury is with Crédit Agricole CIB. Crédit Agricole CIB also entered into
separate deferred prosecution agreements (DPAs) with the United States Attorney’s Office for the District of Columbia
(USAO) and the District Attorney of the County of New York (DANY), the terms of which are three years. On 19 October
2018 the two deferred prosecution agreements with USAO and DANY ended at the end of the three year period,
Crédit Agricole CIB having complied with all its obligations under the DPAs.
Crédit Agricole continues to strengthen its internal procedures and its compliance programs regarding laws on
international sanctions and will continue to cooperate fully with the US and New York authorities with its home
regulators, the European Central Bank and the French Regulatory and Resolution Supervisory Authority (ACPR), and
with the other regulators across its worldwide network.
Pursuant to the agreements with NYDFS and the US Federal Reserve, Crédit Agricole’s compliance program is subject
to regular reviews to evaluate its effectiveness, including a review by an independent consultant appointed by NYDFS
for a term of one year and annual reviews by an independent consultant approved by the Federal Reserve.
Euribor/Libor and other indexes
Crédit Agricole S.A. and its subsidiary Crédit Agricole CIB, in their capacity as contributors to a number of interbank
rates, have received requests for information from a number of authorities as part of investigations into: (i) the
calculation of the Libor (London Interbank Offered Rates) in a number of currencies, the Euribor (Euro Interbank Offered
Rate) and certain other market indices; and (ii) transactions connected with these rates and indices. These demands
covered several periods from 2005 to 2012.
As part of its cooperation with the authorities, Crédit Agricole S.A. and its subsidiary Crédit Agricole CIB carried out
investigations in order to gather the information requested by the various authorities and in particular the American
authorities – the DOJ (Department of Justice) and CFTC (Commodity Future Trading Commission) – with which they are
in discussions. It is currently not possible to know the outcome of these discussions, nor the date when they will be
concluded.
Furthermore, Crédit Agricole CIB is currently under investigation opened by the Attorney General of the State of Florida
on both the Libor and the Euribor.
Following its investigation and an unsuccessful settlement procedure, on 21 May 2014, the European Commission sent
a statement of objection to Crédit Agricole S.A. and to Crédit Agricole CIB pertaining to agreements or concerted
practices for the purpose and/or effect of preventing, restricting or distorting competition in derivatives related to the
Euribor.
In a decision dated 7 December 2016, the European Commission jointly fined Crédit Agricole S.A. and Crédit Agricole
CIB €114,654,000 for participating in a cartel in euro interest rate derivatives. Crédit Agricole S.A. and Crédit Agricole
CIB are challenging this decision and have asked the European Court of Justice to overturn it.
Additionally, the Swiss competition authority, COMCO, is conducting an investigation into the market for interest rate
derivatives, including the Euribor, with regard to Crédit Agricole S.A. and several Swiss and international banks. This

Consolidated financial statements of Credit Agricole S.A. 31 December 2020
182
investigation was closed following a transaction, under the terms of which Crédit Agricole SA agreed to pay a penalty
of CHF 4,465,701 and procedural costs in the amount of CHF 181,012, without any acknowledgement of guilt.
Moreover, in June 2016 the South Korean competition authority (KFTC) decided to close the investigation launched in
September 2015 into Crédit Agricole CIB and the Libor index on various currencies, Euribor and Tibor indices. The
investigation into certain foreign exchange derivatives (ABS-NDF) has been closed by the KFTC according to a decision
notified to Crédit Agricole CIB on 20 December 2018.
Concerning the two class actions in the United States of America in which Crédit Agricole S.A. and Crédit Agricole CIB
have been named since 2012 and 2013 along with other financial institutions, both as defendants in one (“Sullivan” for
the Euribor) and only Crédit Agricole S.A. as defendant for the other (“Lieberman” for Libor), the “Lieberman” class
action is at the preliminary stage that consists in the examination of its admissibility; proceedings are still suspended
before the US District Court of New York State. Concerning the “Sullivan” class action, Crédit Agricole S.A. and Crédit
Agricole CIB introduced a motion to dismiss the applicants’ claim. The US District Court of New York State upheld the
motion to dismiss regarding Crédit Agricole S.A. and Crédit Agricole CIB in first instance. On 14 June 2019, the plaintiffs
appealed this decision.
Since 1 July 2016, Crédit Agricole S.A. and Crédit Agricole CIB, together with other banks, are also party to a new class
action suit in the United States (“Frontpoint”) relating to the SIBOR (Singapore Interbank Offered Rate) and SOR
(Singapore Swap Offer Rate) indices. After having granted a first motion to dismiss filed by Crédit Agricole S.A. and
Crédit Agricole CIB, the New York Federal District Court, ruling on a new request by the plaintiffs, excluded Crédit
Agricole S.A. from the Frontpoint case on the grounds that it had not contributed to the relevant indexes. The Court
considered, however, taking into account recent developments in case law, that its jurisdiction could apply to Crédit
Agricole CIB, as well as to all the banks that are members of the SIBOR index panel. The allegations contained in the
complaint regarding the SIBOR/USD index and the SOR index were also rejected by the court, therefore the index
SIBOR/Singapore dollar alone is still taken into account. On 26 December 2018, the plaintiffs filed a new complaint
aimed at reintroducing into the scope of the Frontpoint case the alleged manipulations of the SIBOR and SOR indexes
that affected the transactions in US dollars. Crédit Agricole CIB, alongside the other defendants, objected to this new
complaint at the hearing held on 2 May 2019 before the New York Federal District Court. On July 26, 2019, the Federal
Court granted the defendants’ motion to dismiss. The plaintiffs filed a notice of appeal on August 26, 2019.
These class actions are civil actions in which the plaintiffs claim that they are victims of the methods used to set the
Euribor, Libor, SIBOR and SOR rates, and seek repayment of the sums they allege were unlawfully received, as well as
damages and reimbursement of costs and fees paid.
Banque Saudi Fransi
Crédit Agricole Corporate Investment Bank (Crédit Agricole CIB) had received in 2018 a request for arbitration
submitted by Banque Saudi Fransi (BSF) before the International Chamber of Commerce (ICC). The dispute related to
the performance of a technical services agreement between BSF and Crédit Agricole CIB that is no longer in force.
BSF had quantified its claim at SAR 1,023,523,357, the equivalent of about €242 million. Crédit Agricole CIB and BSF
have recently entered into an agreement effectively ending the ICC arbitration proceedings. This agreement has no
significant impact on Crédit Agricole CIB’s Financial Statements.
SSA Bonds
Several regulators made requests of information to Crédit Agricole S.A. and to Crédit Agricole CIB for investigations
relating to activities of different banks involved in the secondary trading of SSA bonds (Supranational, Sub-Sovereign
and Agencies) denominated in American dollars. Through the cooperation with these regulators, Crédit Agricole CIB
proceeded to internal inquiries to gather the required information available. On 20 December 2018, the European
Commission issued a Statement of Objections to a number of banks including Crédit Agricole S.A. and Crédit Agricole
CIB within its inquiry on a possible infringement of rules of European Competition law in the secondary trading of Bonds
SSA denominated in American dollars. Crédit Agricole S.A. and Crédit Agricole CIB became aware of these objections
and issued a response on 29 March 2019, followed by an oral hearing on 10-11 July 2019.
Crédit Agricole CIB is included with other banks in a putative consolidated class action before the United States District
Court for the Southern District of New York. That action was dismissed on 29 August 2018 on the basis that the plaintiffs
failed to allege an injury sufficient to give them standing. However the plaintiffs have been given an opportunity to
attempt to remedy that defect. The plaintiffs filed an amended complaint on 7 November 2018. Crédit Agricole CIB
as well as the other defendants have filed motions to dismiss the amended complaint. As regards CACIB, the complaint
was ruled inadmissible on 30 September 2019 for lack of jurisdiction of the New York court and, in a subsequent decision,
the Court ruled that the plaintiffs had in any event failed to establish a violation of US antitrust law. In June 2020 the
plaintiffs appealed these two decisions.
On 7 February 2019, another class action was filed against CACIB and the other defendants named in the class action
already pending before the United States District Court for the Southern District of New York. In July 2020 the plaintiffs
voluntarily halted the class action but it may be taken up again.

Consolidated financial statements of Credit Agricole S.A. 31 December 2020
183
On 11 July 2018, Crédit Agricole S.A. and Crédit Agricole CIB were notified with other banks of a class action filed in
Canada, before the Ontario Superior Court of Justice. Another action was filed the same day in Federal Court. The
action in the Ontario Superior Court of Justice was dismissed on 19 February 2020.
It is not possible at this stage to predict the outcome of these investigations, proceedings or class actions or the date
on which they will end.
O’Sullivan and Tavera
On 9 November 2017, a group of individuals, (or their families or estates), who claimed to have been injured or killed in
attacks in Iraq filed a complaint (“O’Sullivan I”) against several banks including Crédit Agricole S.A., and its subsidiary
Crédit Agricole Corporate Investment Bank (Crédit Agricole CIB), in US Federal District Court in New York.
On 29 December 2018, the same group of individuals, together with 57 new plaintiffs, filed a separate action
(“O’Sullivan II”) against the same defendants.
On 21 December 2018, a different group of individuals filed a complaint (“Tavera”) against the same defendants.
All three complaints allege that Crédit Agricole S.A., Crédit Agricole CIB, and other defendants conspired with Iran
and its agents to violate US sanctions and engage in transactions with Iranian entities in violation of the US Anti-Terrorism
Act and the Justice Against Sponsors of Terrorism Act. Specifically, the complaints allege that Crédit Agricole S.A.,
Crédit Agricole CIB, and other defendants processed US dollar transactions on behalf of Iran and Iranian entities in
violation of sanctions administered by the US Treasury Department’s Office of Foreign Assets Control, which allegedly
enabled Iran to fund terrorist organizations that, as is alleged, attacked plaintiffs. The plaintiffs are seeking an
unspecified amount of compensatory damages.
On 2 March 2018, Crédit Agricole CIB and other defendants filed a motion to dismiss the O’ Sullivan I Complaint. On
28 March 2019, the Court granted defendants’ motion to dismiss. On 22 April 2019, the plaintiffs filed a motion to amend
their complaint. Defendants submitted an opposition to that motion on 20 May 2019 and plaintiffs filed a reply on
10 June 2019. On 25 February 2020 the plaintiffs’ motion to amend their complaint was denied and their original
complaint dismissed with prejudice.
On 28 May 2020, the plaintiffs filed a new motion for a final decision with right of appeal. On 11 June 2020, the
defendants opposed this motion and on 18 June 2020 the plaintiffs responded. The Tribunal has yet to rule on the
petition.
Italian Competition Authority
(“CACF”) and its subsidiary FCA Bank S.p.A. received – together with several other banks and certain car
manufacturers – a statement of objections from the Autorità Garante della Concorrenza e del Mercato (Italian
Competition Authority). It was alleged in this statement of objections that several banks offering financing solutions for
vehicles commercialized by certain car manufacturers have restricted competition as a result of certain exchanges of
information, in particular within two professional associations.
In a decision notified on 9 January 2019 the Autorità Garante della Concorrenza e del Mercato considered that FCA
Bank S.p.A. had participated in this alleged infringement and this infringement was also attributable to CACF.
FCA Bank S.p.A. has been fined €178.9 million. FCA Bank S.p.A. and CACF appealed this decision with the Regional
Administrative Court (TAR) of Lazio. On 4 April 2019, the TAR of Lazio issued an interim relief order staying the execution
of the obligation to pay the fine imposed on FCA Bank S.p.A. subject to the provision by FCA Bank S.p.A. of a guarantee
covering the amount of the fine.
The Lazio TAR dismissed the decision of the Autorità Garante della Concorrenza e del Mercato in a judgment on 24
November 2020. On 23 December 2020, the Autorità Garante della Concorrenza e del Mercato appealed this decision
before the Italian Council of State.
Intercontinental Exchange, Inc. (“ICE”)
On 15 January 2019 a class action (“Putnam Bank”) was filed before a federal court in New York (US District Court
Southern District of New York) against the Intercontinental Exchange, Inc. (“ICE”) and a number of banks including
Crédit Agricole S.A., Crédit Agricole CIB and Crédit Agricole Securities-USA. This action has been filed by plaintiffs who
allege that they have invested in financial instruments indexed to the USD ICE Libor. They accuse the banks of having
collusively set the index USD ICE Libor at artificially low levels since February 2014 and made thus illegal profits.
On 31 January 2019 a similar action (“Livonia”) has been filed before the US District Court Southern District of New York,
against a number of banks including Crédit Agricole S.A., Crédit Agricole CIB and Crédit Agricole Securities-USA. On
1 February 2019, these two class actions were consolidated.

Consolidated financial statements of Credit Agricole S.A. 31 December 2020
184
On 4 March 2019, a third class action (“Hawaii Sheet Metal Workers retirement funds”) was filed against the same banks
in the same court and consolidated with the two previous actions on 26 April 2019. On 1 July 2019, the plaintiffs filed a
“Consolidated Class Action Complaint”.
On 30 August 2019, the Defendants filed a motion to dismiss against this consolidated complaint.
On 26 March 2020, the judge granted the defendants' motion to dismiss. On 14 June 2019, the plaintiffs appealed this
decision.
On 30 November 2020, the plaintiffs' lawyers informed the defendants of the wish of the named plaintiffs to desist during
the filing phase of the briefs and on 1 December 2020 filed a request for a stay of proceedings which the defendants
opposed. On 7 December 2020, the court rejected this request and the plaintiffs responded on 15 December 2020.
On 28 December 2020, DYJ Holdings Inc made a request to intervene to replace the named plaintiffs. On 7 January
2021, the defendants objected and also filed a motion to dismiss the appeal.
Crédit Agricole Consumer Finance Nederland B.V.
The conditions for the review of the interest rates of revolving loans marketed by Crédit Agricole Consumer Finance
Nederland BV, a fully owned subsidiary of Crédit Agricole Consumer Finance S.A., and its subsidiaries are the subject
of borrowers’ claims relating to the criteria for revising these rates and possible overpayments of interests.
On 21 January 2019, in two individual cases concerning two subsidiaries of Crédit Agricole Consumer Finance
Nederland BV, the Appeals Committee of KIFID (the Financial Services Complaints Authority) in the Netherlands
decided that in case the consumers had no or insufficient information on the specific factors that determine the interest
rate, the individual interest rate needed to follow the movement of market interest rates on consumer loans.
Crédit Agricole Consumer Finance Nederland BV implemented a compensation plan for the benefit of the borrowers
during 2020 which will take into account the aforementioned decisions of KIFID.
CACEIS Germany
CACEIS Germany has received from the Bavarian tax authorities a request for the reimbursement of taxes on dividends
repaid to some of its customers in 2010.
The request amounts to €312 million. In addition, CACEIS is requested to pay €148 million late interest (calculated at a
rate of 6% p.a.).
CACEIS Germany vigorously contests this request, which it regards as completely unfounded. Moreover, CACEIS
appealed on the merits and has requested a suspension of execution of the payment order pending a ruling in the
substantive proceedings. A suspension of execution was granted for the payment of the €148 million late interest but
was dismissed for the €312 million principal repayment requested. CACEIS has lodged an appeal against this ruling. As
the decision dismissing the appeal was immediately enforceable, CACEIS made the €312 million payment and
considering the appeal proceedings in progress, recorded a receivable of an equivalent amount.
Amundi – AMF procedure
Following an investigation conducted from 2017 to 2019, the Autorité des Marchés Financiers (AMF) notified Amundi
of grievances on 12 June 2020. The grievances concern the management of certain transactions carried out by two
Amundi employees between 2014 and 2015. This file has been transmitted to a reporting judge who will present his
findings to the Sanctions Commission upon completion of the investigation of the file. Amundi is cooperating fully
under this procedure. To date, no sanction has been imposed on Amundi.

Consolidated financial statements of Credit Agricole S.A. 31 December 2020
185
HOME PURCHASE SAVINGS PLAN PROVISION
DEPOSITS COLLECTED IN HOME PURCHASE SAVINGS ACCOUNTS AND PLANS DURING THE SAVINGS PHASE
(in millions of euros) 31/12/2020 31/12/2019
Home purchase savings plans
Under 4 years old 6,398 6,407
Between 4 and 10 years old 52,627 48,251
Over 10 years old 48,490 49,359
Total home purchase savings plans 107,515 104,017
Total home purchase savings accounts 12,637 11,929
TOTAL DEPOSITS COLLECTED UNDER HOME PURCHASE SAVINGS CONTRACTS 120,152 115,946
Customer deposits outstanding, excluding government subsidies, are based on the carrying amount at the end of
November 2020 for the financial statements at 31 December 2020 and at the end of November 2019 for the financial
statements at 31 December 2019.
OUTSTANDING LOANS GRANTED TO HOLDERS OF HOME PURCHASE SAVINGS ACCOUNTS AND PLANS
(in millions of euros) 31/12/2020 31/12/2019
Home purchase savings plans 2 3
Home purchase savings accounts 12 18
TOTAL OUTSTANDING LOANS GRANTED UNDER HOME PURCHASE SAVINGS CONTRACTS 14 21
PROVISION FOR HOME PURCHASE SAVINGS ACCOUNTS AND PLANS
(in millions of euros) 31/12/2020 31/12/2019
Home purchase savings plans
Under 4 years old 1 ‑
Between 4 and 10 years old 35 35
Over 10 years old 409 332
Total home purchase savings plans 445 367
Total home purchase savings accounts ‑ ‑
TOTAL PROVISIONS FOR HOME PURCHASE SAVINGS CONTRACTS 445 367
(in millions of euros) 31/12/2019 Additions Reversals Other
movements 31/12/2020
Home purchase savings plans 367 78 ‑ ‑ 445
Home purchase savings accounts ‑ ‑ ‑ ‑ ‑
TOTAL PROVISIONS FOR HOME PURCHASE SAVINGS
CONTRACTS 367 78 ‑ ‑ 445
Age plan is determined based on the date of the midway point in the generation of plans to which they belong.
All of the home purchase savings plans and accounts collected by the Regional Banks are recognised at 100% as
liabilities in the consolidated financial statements of Crédit Agricole S.A.
Half of the amount of outstanding loans related to home purchase savings plans and accounts is recognised by
Crédit Agricole S.A. and the other half by the Regional Banks in the tables above.

Consolidated financial statements of Credit Agricole S.A. 31 December 2020
186
The amounts recognised under provisions represent the portion of risk borne by Crédit Agricole S.A. and LCL.
Consequently, the ratio between the provision booked and the outstanding amounts shown on Crédit Agricole S.A.’s
balance sheet is not representative of the level of provisioning for home purchase savings risk.
6.19 Subordinated debt
(in millions of euros) 31/12/2020 31/12/2019
Dated subordinated debt ¹ 23,301 20,822
Undated subordinated debt ² 511 747
Mutual security deposits 179 167
Participating securities and loans 61 61
CARRYING AMOUNT 24,052 21,797
¹ Includes issues of dated subordinated notes “TSR”.
² incudes issues of deeply subordinated notes "TSR" and undated subordinated notes "TSDI".
At 31 December 2020, outstanding deeply subordinated notes amounted to €247 million compared to €472 million at
31 December 2019.
Debt notes issued by Crédit Agricole S.A. and hold by Insurance entities of Crédit Agricole S.A. are eliminated for euro
accounts. They were eliminated for the portion backing unit-linked contracts with financial risk borne by the
policyholder.
SUBORDINATED DEBT
The issue of subordinated debt plays a part in regulatory capital management while contributing to refinancing all of
Crédit Agricole S.A.’s operation.
The Capital Requirements Regulation and Directive CRD/CRR1 (as last amended by Directive (EU) 2019/878, called
CRD V, and Regulation (EU) 2019/876 of 20 May 2019, called CRR2) define, among other things, the conditions under
which subordinated instruments qualify as regulatory capital and set out the terms and conditions for the phase-out of
old instruments that do not meet these requirements, between 1 January 2014 (first effective date of the CRD Directive
and the CRR Regulation) and 1 January 2022, and, for instruments issued before 27 June 2019 (date of entry into force
of the CRD V Directive and the CRR2 Regulation amending CRD IV and CRR), until 28 June 2025 and subject to certain
criteria.
All subordinated debt issuance, whether new or old, is likely to be subject to Bail-in in certain circumstances, particularly
in the event of resolution of the issuing bank, in accordance with applicable French law transposing Directive
2014/59/EU of the European Parliament and of the Council on the reorganisation and resolution of credit institutions
and investment firms of 15 May 2014 (as amended, inter alia, by Directive (EU) 2019/879 of 20 May 2019 on the loss-
absorption capacity and recapitalisation of credit institutions and investment firms) (the “BRRD Directive”).
The different types of subordinated debt issued by Crédit Agricole S.A. and still outstanding are detailed below: these
are undated deeply subordinated notes and dated subordinated notes.
Deeply subordinated notes (TSS)
TSS – Volumes issued before CRD 4/CRR
Credit Agricole has issued several generations of undated deeply subordinated notes, given the various regulations
and legislation applicable at the time of their issuance.
The common feature of these securities is that they are all issued for an indefinite period of time. They may be
redeemed under the conditions that are contractually defined, subject to certain specific conditions related in
particular to their original eligibility as Tier 1 equity.
New issuances of TSS are only made on international markets for institutional investors under English, French or State of
New York (United States) law.

Consolidated financial statements of Credit Agricole S.A. 31 December 2020
187
TSS differ from other debt securities by virtue of their ranking in liquidation (principal and interest) contractually defined
by their deep subordination clause, which refers explicitly to applicable French law, depending on the date on which
they were issued.
Dated subordinated notes (TSR) and contingent capital securities
Dated subordinated notes (TSR) issued by Crédit Agricole S.A. are loans with a fixed term (maturity). They may be
redeemed prior to maturity under the conditions that are contractually defined, subject to certain conditions related
in particular to their original eligibility as Tier 2 equity.
TSR are issued either on the French market under French law or on the international markets under French, UK, State of
New York (United States) or Japanese law.
TSR differ from preferred or non-preferred senior bonds by virtue of ranking in liquidation (principal and interest)
contractually defined by their subordination clause, which refers explicitly to applicable French law, depending on the
date on which they were issued (TSR are junior to non-preferred and preferred senior bonds).
Early redemption as part of the conditions for all subordinated note issues (TSR or TSS)
Depending on the conditions determined at the time of their issue, the aforementioned TSR or TSS may be the subject
of:
on-market or off-market buy-back transactions or through public takeover bids or exchange offers subject to
approval by the competent regulator and/or supervisory authority, and/or at the initiative of Crédit Agricole
S.A., in accordance with the contractual clauses applicable to each issuance;
the exercise of an early redemption option at the initiative of Crédit Agricole S.A. (“call option”), under the
conditions and subject to approval by the competent regulator, where appropriate, at the times defined by
the contractual terms of the issue, in the event that the issuance agreement for the securities contains such
a clause.
SENIOR NON-PREFERRED DEBT ISSUES
With the law on transparency, the fight against corruption and the modernisation of the economy (also referred to as
the “Sapin 2 Law”) of 10 December 2016, France created a new category of senior debt – senior “non-preferred” debt
– meeting the eligibility criteria of the TLAC and MREL ratios (as they are presently defined) (codified in Articles L613-
30-3-I-4° and R613-28 of the French Monetary and Financial Code). This category of debt is also covered in the BRRD
Directive.
Senior non-preferred securities differ from senior preferred securities by virtue of their ranking in liquidation contractually
defined by reference to Articles L613-30-3-I-4° and R613-28 of the French Monetary and Financial Code referred to
above (senior non-preferred securities are junior to senior preferred securities and senior to subordinated securities
[including the TSS and TSR referred to above]).
The outstanding amount of senior non-preferred securities of Crédit Agricole S.A. and Crédit Agricole Group thus stood
at €24.1 billion at 31 December 2020, compared to €18.5 billion in euro equivalent at 31 December 2019.
COVERED BOND-TYPE ISSUES
In order to increase the amount of medium and long-term financing, the Group issues Covered Bonds through two
subsidiaries in France, one subsidiary in Italy and one subsidiary in Switzerland:
Crédit Agricole Home Loan SFH, whose initial issue was launched in January 2009. The total amount
outstanding, in euro equivalent, was €33 billion at 31 December 2020;
Crédit Agricole Public Sector SCF, whose initial issue was launched in October 2012. The total amount issued
and outstanding was €4 billion at 31 December 2020;
Crédit Agricole Italia: the total amount issued and outstanding at 31 December 2020 was €10 billion in OBG
(covered bonds), including €1.750 billion held at 31 December 2020.
Crédit Agricole Nextbank, the inaugural issuance of which was in September 2020 for €184 million in euro
equivalent.

Consolidated financial statements of Credit Agricole S.A. 31 December 2020
188
6.20 Capital
OWNERSHIP STRUCTURE AT 31 DECEMBER 2020
At 31 December 2020, to the knowledge of Crédit Agricole S.A., the distribution of capital and voting rights is as follows:
Shareholders Number of shares at 31/12/2020 % of the share capital % of voting rights
SAS Rue La Boétie 1,612,517,290 55.29% 55.30%
Treasury shares 1,090,000 0.04% ‑
Employees (ESOP) 169,020,958 5.79% 5.80%
Public 1,134,060,392 38.88% 38.90%
TOTAL 2,916,688,640 100.00% 100.00%
At 31 December 2020, Crédit Agricole S.A.’s share capital stood at €8.750.065.920 divided into 2.916.688.640 fully paid
up ordinary shares each with a par value of €3.
SAS Rue La Boétie is wholly-owned by the Crédit Agricole Regional Banks.
Concerning Crédit Agricole S.A. stock, a liquidity agreement was signed on 25 October 2006 with Crédit Agricole
Cheuvreux S.A., purchased by Kepler, and renamed Kepler Cheuvreux in 2013.
This agreement is automatically renewed every year. So that the operator can conduct the operations stipulated in
the agreement with complete independence, and in accordance with the provisions of Regulations EU 596/2014 and
2016/908 and AMF Decision No 2018-01, the agreement has been allocated a maximum amount of €50 million.
To the Company’s knowledge, no other shareholder owns 5% or more of the share capital or voting rights, either directly
or indirectly or with others.
EARNING PER SHARE
31/12/2020 31/12/2019
Net income Group share during the period (in millions of euros) 2,692 4,844
Net income attributable to undated deeply subordinated securities (in millions of euros) (373) (587)
Net income attributable to holders of ordinary shares (in millions of euros) 2,319 4,257
Weighted average number of ordinary shares in circulation during the period 2,885,319,047 2,873,414,500
Adjustment ratio 1.000 1.000
Weighted average number of ordinary shares for calculation of diluted earnings
per share 2,885,319,047 2,873,414,500
BASIC EARNINGS PER SHARE (in euros) 0.804 1.482
Basic earnings per share from ongoing activities (in euros) 0.880 1.495
Basic earnings per share from discontinued operations (in euros) (0.077) (0.013)
DILUTED EARNINGS PER SHARE (IN EUROS) (in euros) 0.804 1.482
Diluted earnings per share from ongoing activities (in euros) 0.880 1.495
Diluted earnings per share from discontinued operations (in euros) (0.077) (0.013)
Net income attributable to subordinated and deeply subordinated securities corresponds to the issuance costs and
interest accrued on subordinated and deeply subordinated Additional Tier 1 bond issues. This amounts to -
€373 million at 31 December 2020.
Taking into consideration the change in the average price of the Crédit Agricole S.A. share, all Crédit Agricole S.A.
stock option plans are non-dilutive.
In the absence of any dilutive issue by Crédit Agricole S.A., basic earnings per share are identical to diluted earnings
per share.

Consolidated financial statements of Credit Agricole S.A. 31 December 2020
189
DIVIDENDS
For the 2020 financial year, Crédit Agricole S.A.’s Board of Directors’ Meeting of 10 February 2021 decided to
recommend to the General Meeting of Shareholders of 12 May 2021 the payment of a dividend of €0.80 per share.
The proposal is to offer each shareholder a choice of payment method for the dividend – in cash or in new Crédit
Agricole S.A. share(s). This choice relates to the dividend in its entirety. The price of new shares cannot be less than 90%
of the weighted average of the prices listed in the 20 trading days prior to the decision of the General Meeting, less
the net amount of the dividend.
Proposal in respect of the year
(in euros) 2020 2019 2018 2017 2016
Ordinary dividend 0,8 - 0.69 0.63 0.60
Loyalty dividend N/A N/A N/A 0.693 0.660
DIVIDENDS PAID DURING THE REPORTING PERIOD
In accordance with the decision of the Crédit Agricole S.A. General Meeting of 13 May 2020, all income for the 2019
financial year has been allocated to reserves. There was no vote on a dividend distribution.
APPROPRIATION OF NET INCOME
The proposed appropriation of net income is set out in the draft resolutions to be presented by the Board of Directors
at Crédit Agricole S.A.’s Combined General Meeting on Tuesday 12 May 2021.
Crédit Agricole S.A. parent company posted positive net income of €245,175,099.26 in the 2020 financial year.
The Board of Directors decided to propose that the combined General Meeting of Shareholders agree:
to record that the profit for the financial year amounts to €245,175,099.26;
to allocate the amount of €9,599,978.40 to the legal reserve to bring it up to 10% of the share capital, which
amounts to €8,750,065,920.00;
to record that the distributable earnings amounts to €14,832,826,141.94, taking into account retained earnings
of €14,597,251,021.08;
to establish the amount of the regular dividend at €0.80 per share;
to distribute the dividend paid out of distributable earnings in the amount of €2,332,478,912.00*;
to allocate the undistributed balance of €12,500,347,229.94* to retained earnings.
*This amount will be adjusted where appropriate to reflect the following events: (a) creation of new shares eligible for
dividends before the ex-dividend date, (b) change in the number of treasury shares at ex-dividend date.
UNDATED SUBORDINATED AND DEEPLY SUBORDINATED DEBT
At 31 December 2020, Crédit Agricole S.A. reviewed the accounting treatment of coupons paid to investors relating
to RT1 (Restricted Tier 1) subordinated financial instruments issued by Crédit Agricole Assurances (CAA) and subscribed
by investors outside the Group.
Since the compensation of these instruments is classified as “cumulative”, it is vested in the holders of those instruments,
who are thus allocated a portion of the income.
This has the following consequences:
- coupons are allocated to non-controlling interests in the income statement by deducting them from the
Group share of income
- at the time of their payment, coupons are deducted from equity relating to non-controlling interests.

Consolidated financial statements of Credit Agricole S.A. 31 December 2020
190
The main issues of undated subordinated and deeply subordinated debt classified in shareholders’ equity Group share
are:
Issue date Currency
Amount in
currency at 31
december 2020
At 31 december 2020
Amount in
currency at
31
december
2019
Partial
repurchases
and
redemptions
Amount in euros
at inception rate
Interests paid
Group share
Issuance
costs net of
taxes
Shareholders’
equity Group
share
(in millions of
units)
(in millions of
units)
(in millions of
units)
(in millions of
euros)
(in millions of
euros)
(in millions of
euros)
(in millions of
euros)
1/23/2014 USD 1,750 ‑ 1,750 1,283 (827) (8) 448
4/8/2014 GBP 500 ‑ 500 607 (300) (4) 303
4/8/2014 EUR 1,000 ‑ 1,000 1,000 (436) (6) 558
1/19/2016 USD 1,250 ‑ 1,250 1,150 (440) (8) 702
2/26/2019 USD 1,250 ‑ 1,250 1,098 (121) (7) 970
10/14/2020 EUR ‑ 750 750 (6) (5) 739
Crédit Agricole
S.A. Issues 5,888 (2,130) (38) 3,720
Insurance Issues ‑ ‑ ‑ ‑
Issues subscribed in-house :
Group share / Non controlling
interests effect ‑ 89 ‑ 89
Issues subscribed by Crédit
Agricole CIB for currency
regulation ‑ ‑ ‑ ‑
TOTAL 5,888 (2,041) (38) 3,809
The main issues of undated subordinated and deeply subordinated debt classified in shareholder’s equity – Non
controlling interests share (insurance) are:
Issue date
Currenc
y
Amount in
currency at
31 december
2019
Partial
repurchases and
redemptions
Amount in
currency at 31
december
2020
At 31
december
2020
Amount in
euros at
inception rate
At 31
december 2020
Income – Non
controlling
interests
(in millions of
units)
(in millions of
units)
(in millions of
units)
(in millions of
euros)
(in millions of
euros)
10/14/2014 EUR 745 ‑ 745 745 (203)
01/13/2015 EUR 1,000 ‑ 1,000 1,000 (213)
Insurance Issues 1745 (416)
TOTAL 1,745 (416)
Changes relating to undated subordinated and deeply subordinated debt affecting shareholders’ equity Group share
are as follows:
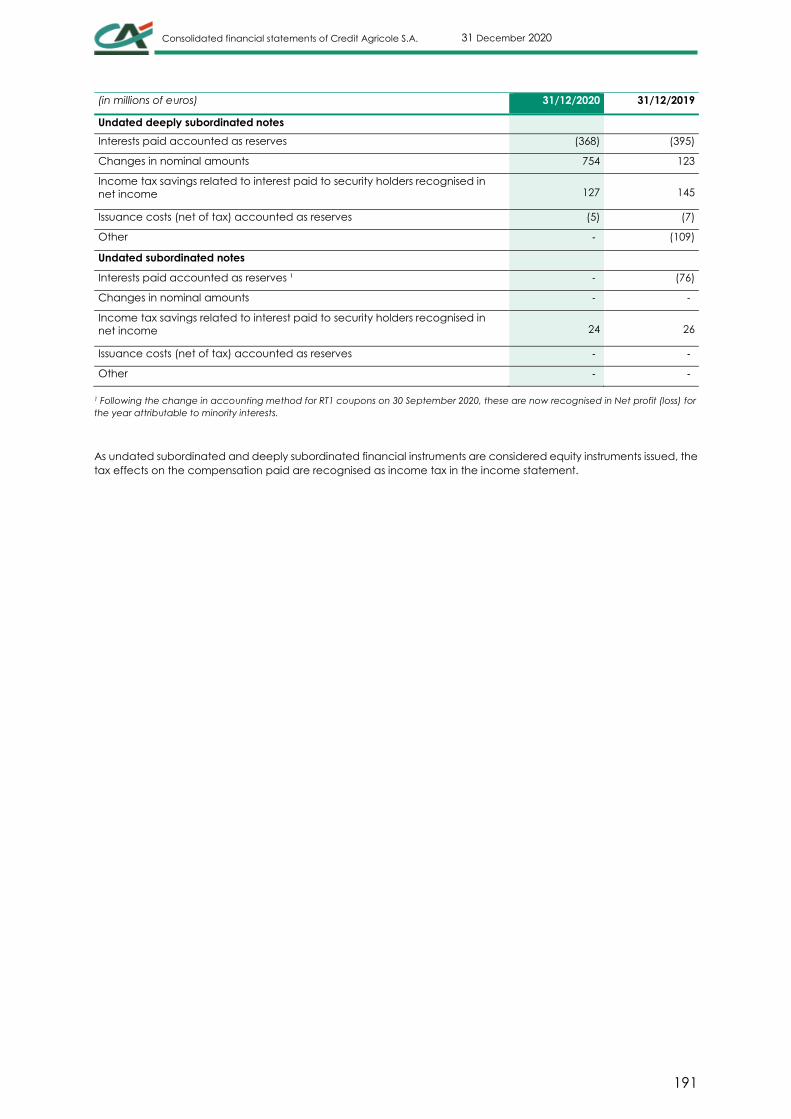
Consolidated financial statements of Credit Agricole S.A. 31 December 2020
191
(in millions of euros) 31/12/2020 31/12/2019
Undated deeply subordinated notes
Interests paid accounted as reserves (368) (395)
Changes in nominal amounts 754 123
Income tax savings related to interest paid to security holders recognised in
net income 127 145
Issuance costs (net of tax) accounted as reserves (5) (7)
Other ‑ (109)
Undated subordinated notes
Interests paid accounted as reserves ¹ ‑ (76)
Changes in nominal amounts ‑ ‑
Income tax savings related to interest paid to security holders recognised in
net income 24 26
Issuance costs (net of tax) accounted as reserves ‑ ‑
Other ‑ ‑
1 Following the change in accounting method for RT1 coupons on 30 September 2020, these are now recognised in Net profit (loss) for
the year attributable to minority interests.
As undated subordinated and deeply subordinated financial instruments are considered equity instruments issued, the
tax effects on the compensation paid are recognised as income tax in the income statement.

Consolidated financial statements of Credit Agricole S.A. 31 December 2020
192
6.21 Net profit (loss) for the year attributable to minority interests
INFORMATION ON SIGNIFICANT NON-CONTROLLING INTERESTS
The table below presents information on the consolidated subsidiaries and structured entities with significant non-
controlling interests in relation to the total equity of the Group or of the sub-group level or where the total balance
sheet of the entities held by the non-controlling interests is significant.
(in millions of euros)
31/12/2020
% of voting
rights held by
non-controlling
interests
% of ownership
interests held by
non-controlling
interests
Net income
allocated to non-
controlling
interests during the
reporting period
Accumulated
non-controlling
interests at the
end of the
reporting period
Dividends paid
to non-
controlling
interests
Amundi Group 32% 32% 288 2,518 1
Crédit Agricole Italia Group 24% 24% (71) 1,305 ‑
CACEIS Group 30% 30% 58 1,030 ‑
AGOS SPA 39% 39% 82 376 64
CA Egypte 40% 40% 26 145 23
Other entities 1 163 2,904 21
TOTAL 546 8,278 109
¹ Of which €1,745 million related to the issuance of Additional Tier 1 undated subordinated bonds realised on 14 October 2014 and 13
January 2015 by Crédit Agricole Assurances, accounted for in equity of non-controlling interests.
(in millions of euros)
31/12/2019
% of voting
rights held by
non-controlling
interests
% of ownership
interests held by
non-controlling
interests
Net income
allocated to non-
controlling
interests during the
reporting period
Accumulated
noncontrolling
interests at the
end of the
reporting period
Dividends paid
to non-
controlling
interests
Amundi Group 31% 32% 294 2,186 180
Crédit Agricole Italia Group 24% 24% 83 1,379 40
CACEIS Group 30% 30% ‑ 1,010 2
AGOS SPA 39% 39% 104 363 106
CA Egypte 40% 40% 43 155 25
Other entities 1 89 2,828 23
TOTAL 612 7,921 376
¹ Of which €1,745 million related to the issuance of Additional Tier 1 undated subordinated bonds realised on 14 October 2014 and 13
January 2015 by Crédit Agricole Assurances, accounted for in equity of non-controlling interests.

Consolidated financial statements of Credit Agricole S.A. 31 December 2020
193
INDIVIDUAL SUMMARY FINANCIAL INFORMATION ON SIGNIFICANT NON-CONTROLLING INTERESTS
The table below presents summary information on subsidiaries with significant non-controlling interests for Crédit
Agricole S.A. Group on the basis of the IFRS financial statements.
(in millions of euros)
31/12/2020
Total assets Revenues Net income Net income and other
comprehensive income
Amundi Group 28,888 2,521 907 757
Crédit Agricole Italia Group 76,328 1,891 217 240
CACEIS Group 120,695 1,129 189 156
AGOS SPA 17,309 809 223 222
CA Egypte 2,704 197 66 65
TOTAL 245,924 6,547 1,602 1,440
(in millions of euros)
31/12/2019
Total assets Revenues Net income Net income and other
comprehensive income
Amundi Group 24,261 2,636 959 966
Crédit Agricole Italia Group 64,231 1,950 326 401
CACEIS Group 88,015 939 158 205
AGOS SPA 18,180 868 267 266
CA Egypte 2,850 216 108 122
TOTAL 197,538 6,609 1,818 1,960

Consolidated financial statements of Credit Agricole S.A. 31 December 2020
194
6.22 Breakdown of financial assets and financial liabilities by contractual
maturity
The breakdown of balance sheet financial assets and liabilities is made according to contractual maturity date.
The maturities of derivative instruments held for trading and for hedging correspond to their date of contractual
maturity.
Equities and other variable-income securities are by nature without maturity; they are classified “Indefinite”.
(in millions of euros)
31/12/2020
≤ 3 months > 3 months up to
≤ 1 year
> 1 year up to ≤
5 years > 5 years Indefinite Total
Cash, central banks 194,269 ‑ ‑ ‑ ‑ 194,269
Financial assets at fair value through profit
or loss 118,218 30,371 41,300 82,034 160,539 432,462
Hedging derivative Instruments 1,526 2,799 4,087 13,333 ‑ 21,745
Financial assets at fair value through other
comprehensive income 8,929 14,559 95,767 144,523 2,294 266,072
Financial assets at amortised cost 180,604 147,308 398,885 224,604 2,499 953,900
Revaluation adjustment on interest rate
hedged portfolios 7,463 ‑ ‑ ‑ ‑ 7,463
TOTAL FINANCIAL ASSETS BY MATURITY 511,009 195,037 540,039 464,494 165,332 1,875,911
Central banks 864 ‑ ‑ ‑ ‑ 864
Financial liabilities at fair value through
profit or loss 108,784 20,661 42,541 93,187 ‑ 265,173
Hedging derivative Instruments 1,946 598 4,824 7,850 ‑ 15,218
Financial liabilities at amortised cost 800,678 67,115 221,858 57,203 ‑ 1,146,854
Subordinated debt 335 1,603 5,942 15,483 689 24,052
Revaluation adjustment on interest rate
hedged portfolios 10,380 ‑ ‑ ‑ ‑ 10,380
TOTAL FINANCIAL LIABILITIES BY MATURITY 922,987 89,977 275,165 173,723 689 1,462,541
(in millions of euros)
31/12/2019
≤ 3 months > 3 months up to
≤ 1 year
> 1 year up to ≤
5 years > 5 years Indefinite Total
Cash, central banks 93,079 93,079
Financial assets at fair value through profit
or loss 94,533 25,421 44,405 79,628 155,490 399,477
Hedging derivative Instruments 2,831 434 4,057 12,046 ‑ 19,368
Financial assets at fair value through other
comprehensive income 8,573 16,519 94,771 138,824 2,634 261,321
Financial assets at amortised cost 201,912 153,737 326,542 220,653 3,436 906,280
Revaluation adjustment on interest rate
hedged portfolios 7,145 ‑ ‑ ‑ ‑ 7,145
TOTAL FINANCIAL ASSETS BY MATURITY 408,074 196,110 469,775 451,151 161,560 1,686,670
Central banks 1,896 ‑ ‑ ‑ ‑ 1,896
Financial liabilities at fair value through
profit or loss 100,314 11,579 43,840 90,937 ‑ 246,669
Hedging derivative Instruments 1,542 573 3,988 7,190 ‑ 13,293
Financial liabilities at amortised cost 721,662 95,870 110,929 61,502 ‑ 989,962
Subordinated debt 301 1,206 1,938 17,451 901 21,797
Revaluation adjustment on interest rate
hedged portfolios 9,182 ‑ ‑ ‑ ‑ 9,182
TOTAL FINANCIAL LIABILITIES BY MATURITY 834,897 109,228 160,695 177,078 901 1,282,799

Consolidated financial statements of Credit Agricole S.A. 31 December 2020
195
NOTE 7 Employee benefits and other compensation
7.1 Analysis of employee expenses
(in millions of euros) 31/12/2020 31/12/2019
Salaries ¹ (4,987) (4,899)
Contributions to defined-contribution plans (402) (394)
Contributions to defined-benefit plans (69) (97)
Other social security expenses (1,195) (1,165)
Profit-sharing and incentive plans (237) (256)
Payroll-related tax (343) (336)
TOTAL EMPLOYEE EXPENSES (7,233) (7,147)
1 Regarding deferred variable compensation paid to market professionals, Crédit Agricole S.A. booked a charge for
share-based payments of €70 million at 31 December 2020 compared to €51 million at 31 December 2019.
Retirement-related indemnities amounted to €165 million at 31 December 2020, compared with €132 million at 31
December 2019.
7.2 Average headcount
Average headcount 31/12/2020 31/12/2019
France 35,201 34,980
International 37,319 37,544
TOTAL 72,520 72,524
7.3 Post-employment benefits, defined-contribution plans
“Employers” contribute to a variety of compulsory pension schemes. Plan assets are managed by independent
organisations and the contributing companies have no legal or implied obligation to pay additional contributions if
the funds do not have sufficient assets to cover all benefits corresponding to services rendered by employees during
the year and during prior years. Consequently, Crédit Agricole S.A. Group companies have no liability in this respect
other than the contributions payable.
Within the Group, there are several compulsory defined-contribution plans, the main ones being Agirc/Arrco, which
are French supplementary retirement plans, and some supplementary plans in place notably within UES Crédit Agricole
S.A.

Consolidated financial statements of Credit Agricole S.A. 31 December 2020
196
ANALYSIS OF SUPPLEMENTARY PENSION PLANS IN FRANCE
Business Line Entity
Compulsory supplementary
pension plans
Number of
employees
covered
Estimation
at 31/12/2020
Number of
employees
covered
Estimation
at 31/12/2019
Central Support functions UES Crédit Agricole S.A. Agriculture industry plan
1.24% 1.750 1.745
Central Support functions UES Crédit Agricole S.A. “Article 83” Group Executive
managers plan 219 192
French retail banking –
LCL LCL “Article 83” Group Executive
managers plan 292 303
Large customers Crédit Agricole CIB “Article 83” type plan 5.032 4.925
Asset gathering CAAS/Pacifica/SIRCA/LA MDF Agriculture industry plan
1.24% 4.443 4.189
Asset gathering CAAS/Pacifica/CACI/LA MDF “Article 83” Group Executive
managers plan 79 65
Asset gathering CACI/CA Indosuez Wealth
(France)/CA Indosuez
Wealth (Group)/Amundi
“Article 83” type plan 3.725 3.456
7.4 Post-employment benefits, defined-benefit plans
CHANGE IN ACTUARIAL LIABILITY
(in millions of euros)
31/12/2020 31/12/2019
Eurozone Outside Eurozone All Zones All Zones
Actuarial liability at 31/12/N-1 1,611 1,725 3,336 3,072
Exchange difference ‑ (55) (55) 66
Cost of service rended during the period 58 37 95 94
Financial cost 14 21 35 49
Employee contributions 1 13 14 16
Benefit plan changes, withdrawals and settlement (1) (17) (18) (100)
Changes in scope 6 ‑ 6 (1)
Benefits paid (mandatory) (90) (75) (165) (132)
Tax, administrative costs and bonuses ‑ ‑ ‑ ‑
Actuarial gains/(losses) arising from changes in
demographic assumptions ¹ (23) 33 10 (11)
Actuarial gains/(losses) arising from changes in
financial assumptions ¹ 100 87 187 283
ACTUARIAL LIABILITY AT 31/12/N 1,676 1,769 3,445 3,336
¹ Of which actuarial gains/losses related to experience adjustment.

Consolidated financial statements of Credit Agricole S.A. 31 December 2020
197
BREAKDOWN OF NET CHARGE RECOGNISED IN THE INCOME STATEMENT
(in millions of euros)
31/12/2020 31/12/2019
Eurozone Outside Eurozone All Zones All Zones
Service cost (57) (21) (78) 7
Net interest income (expense) (7) (3) (10) (11)
IMPACT ON PROFIT OR LOSS AT 31/12/N (64) (24) (88) (4)
BREAKDOWN OF INCOME RECOGNISED IN OCI THAT WILL NOT BE RECLASSIFIED TO PROFIT AND LOSS
(in millions of euros)
31/12/2020 31/12/2019
Eurozone Outside Eurozone All Zones All Zones
Revaluation from net liabilities (from net assets)
Total amount of actuarial gains or losses recognised
in other comprehensive income that will not be
reclassified to profit or loss at 31/12/N-1 512 316 828 674
Exchange difference ‑ (4) (4) 7
Actuarial gains/(losses) on assets (14) (83) (97) (112)
Actuarial gains/(losses) arising from changes in
demographic assumptions ¹ (23) 32 9 (11)
Actuarial gains/(losses) arising from changes in
financial assumptions ¹ 100 87 187 283
Adjustment of assets restriction's 7 1 8 ‑
IMPACT IN OTHER COMPREHENSIVE INCOME AT
31/12/N 70 33 103 167
¹ Of which actuarial gains/losses related to experience adjustment.
CHANGE IN FAIR VALUE OF ASSETS
(in millions of euros)
31/12/2020 31/12/2019
Eurozone Outside Eurozone All Zones All Zones
Fair value of assets at 31/12/N-1 576 1,477 2,053 1,800
Exchange difference ‑ (51) (51) 60
Interests on asset (income) 5 20 25 35
Actuarial gains/(losses) 14 83 97 112
Employer contributions 35 27 62 102
Employee contributions ‑ 14 14 16
Benefit plan changes, withdrawals and settlement ‑ ‑ ‑ ‑
Changes in scope ‑ ‑ ‑ 6
Tax, administrative costs and bonuses ‑ (1) (1) (1)
Benefits paid out under the benefit plan (16) (72) (88) (77)
FAIR VALUE OF ASSETS AT 31/12/N 614 1,497 2,111 2,053

Consolidated financial statements of Credit Agricole S.A. 31 December 2020
198
CHANGE IN FAIR VALUE OF REIMBURSEMENT RIGHTS
(in millions of euros)
31/12/2020 31/12/2019
Eurozone Outside Eurozone All Zones All Zones
Fair value of reimbursement rights at 31/12/N-1 338 ‑ 338 337
Exchange difference ‑ ‑ ‑ ‑
Interests on reimbursement rights (income) 2 ‑ 2 4
Actuarial gains/(losses) ‑ ‑ ‑ 1
Employer contributions 7 ‑ 7 ‑
Employee contributions ‑ ‑ ‑ ‑
Benefit plan changes, withdrawals and settlement ‑ ‑ ‑ ‑
Changes in scope 7 ‑ 7 5
Tax, administrative costs and bonuses ‑ ‑ ‑ ‑
Benefits paid out under the benefit plan (37) ‑ (37) (9)
FAIR VALUE OF REIMBURSEMENT RIGHTS AT 31/12/N 317 ‑ 317 338
NET POSITION
(in millions of euros)
31/12/2020 31/12/2019
Eurozone Outside Eurozone All Zones All Zones
Closing actuarial liability (1,676) (1,769) (3,445) (3,336)
Impact of asset restriction (7) (9) (16) (9)
Fair value of assets at end of period 614 1,497 2,111 2,053
NET POSITION OF ASSETS/(LIABILITIES) AT END OF
PERIOD (1,069) (281) (1,350) (1,292)
DEFINED-BENEFIT PLANS: MAIN ACTUARIAL ASSUMPTIONS
(in millions of euros)
31/12/2020 31/12/2019
Eurozone Outside Eurozone Eurozone Outide Eurozone
Discount rate ¹ 0.35% 0.99% 0.84% 1.27%
Actual return on plan assets and on
reimbursement rights 2.39% 7.34% 3.83% 8.56%
Expected salary increase rates ² 1.40% 1.74% 1.36% 1.80%
Rate of change in medical costs 0.00% 0.00% 0.00% 0.00%
1 Discount rates are determined as a function of the average duration of the commitment, that is, the arithmetic
mean of durations calculated between the assessment date and the payment date weighted by assumptions of
staff turnover. The underlying used is the discount rate by reference to the iBoxx AA.
2 Depending on the employees concerned (managers or non-managers).

Consolidated financial statements of Credit Agricole S.A. 31 December 2020
199
INFORMATION OF PLAN ASSETS: ALLOCATION OF ASSETS 1
(in millions of euros)
Eurozone Outside Eurozone All Zones
% Amount of which
listed % Amount of which
listed % Amount of which
listed
Equities 9.4% 87 86 24.2% 362 362 18.5% 449 448
Bonds 41.1% 382 371 49.9% 746 746 46.5% 1,128 1,117
Property/Real estate 3.2% 30 11.3% 169 8.2% 199
Other assets 46.4% 432 14.7% 220 26.8% 651
1 Of which fair value of reimbursement rights.
At 31 December 2020, the sensitivity analysis showed that:
a 50 basis point increase in discount rates would reduce the commitment by 6.68%;
a 50 basis point decrease in discount rates would increase the commitment by 7.66%.
The benefits expected to be paid in respect of post-employment plans for 2020 are as follows:
benefits paid by the employer or by reimbursement rights funds: €77 million (compared to €55 million paid in
2019).
benefits paid by plan assets: €88 million (compared to €77 million paid in 2019).
Crédit Agricole S.A.’s policy on covering employee benefit obligations reflects local rules on funding post-employment
benefits in countries with minimum funding requirements. Overall, commitments arising from the Group’s post-
employment obligations were 70% covered at 31 December 2020 (including reimbursement rights).
7.5 Other employee benefits
In France, the Group’s main entities pay long-service awards. The amounts vary according to practices and collective
bargaining agreements in place.
The provisions funded by Crédit Agricole S.A. Group for these other employee benefit obligations amounted to
€346 million at 31 December 2020.
7.6 Share-based payments
7.6.1 STOCK OPTION PLAN
No new plan was implemented in 2020.
7.6.2 DEFERRED VARIABLE COMPENSATION SETTLED EITHER IN SHARES OR IN CASH INDEXED
TO THE SHARE PRICE
The deferred variable compensation plans implemented by the Group take two forms:
equity-settled plans;
cash-settled plans indexed to the Crédit Agricole S.A. share price.
Since 1 January 2016, all existing and future deferred variable compensation plans are now cash-settled plans indexed
to the Crédit Agricole S.A. share price. The impact of the revaluation of the commitment on the basis of the Crédit
Agricole S.A. share price, which is not material, was recognised in equity.
This deferred variable compensation is subject to continued employment and a performance condition. It is broken
down into thirds that are payable in March 2021, March 2022 and March 2023.
The expense related to these plans is recognised in compensation expenses. It is spread on a straight-line basis over
the vesting period to factor in continued employment, and a liability is recorded in employee expenses, the amount
of which is subject to periodical revaluation through profit or loss until the settlement date, depending on the evolution
of the share price of Crédit Agricole S.A. and on vesting conditions (continued employment and performance).

Consolidated financial statements of Credit Agricole S.A. 31 December 2020
200
7.7 Executive compensation
Senior management includes all members of the Executive Committee, namely the Chief Executive Officer, Deputy
Chief Executive Officer, Deputy Chief Executive Officers for the Group’s different divisions, Chief Executive Officers of
the main subsidiaries and the Heads of the Group’s core business activities.
Compensation and benefits paid to the members of the Executive Committee in 2020 were as follows:
short-term benefits: €25.2 million for fixed and variable compensation (of which €3.2 million paid in share-
indexed instruments), including social security expenses and benefits in kind;
post-employment benefits: €3.5 million for end-of-career allowances and for the supplementary pension plan
for Group executive managers;
other long-term employee benefits: the amount of long-service awards granted was not material;
employment contract termination indemnities: not material;
other share-based payment: not applicable.
Total compensation paid to members of Crédit Agricole S.A.’s Board of Directors in 2020 in consideration for serving as
Directors of Crédit Agricole S.A. amounted to €1,566,200. After tax deductions, the net amount received was
€1,144,990.
These amounts included the compensation and benefits paid to the Chief Executive Officer and Deputy Chief
Executive Officer of Crédit Agricole S.A.

Consolidated financial statements of Credit Agricole S.A. 31 December 2020
201
NOTE 8 Lease contracts
8.1 Leases for which the Group is the lessee
The item “Property, plant and equipment” in the balance sheet consists of own and leased assets that do not meet
the definition of investment properties.
(in millions of euros) 31/12/2020 31/12/2019
Owned property, plant & equipment 4,104 4,226
Right-of-use on lease contracts 1,675 1,371
Total Property, plant & equipment used in operations 5,779 5,597
Crédit Agricole is also a lessee under lease agreements for IT equipment (photocopiers, computers, etc.) with terms of
one to three years. These are low-value and/or short-term leases. Crédit Agricole S.A. has opted to apply the
exemptions provided for in IFRS 16 and not to recognise the right-of-use asset and the lease liability for these leases in
the balance sheet.
CHANGE IN RIGHT OF USE ASSETS
Crédit Agricole is the taker of many assets including offices, agencies and computer equipment.
Information relating to the contracts of which Crédit Agricole S.A. is a taker is presented below:
(in millions of euros) 31/12/2019
Changes in
scope
Increases
(acquisitions)
Decreases
(disposals)
Translation
adjustments
Other movements
(1) 31/12/2020
Property/Real estate
Gross amount 1,687 ‑ 463 (294) (31) 431 2,256
Depreciation and
impairment (344) ‑ (332) 69 9 (46) (644)
Total Property/Real estate 1,343 ‑ 131 (225) (22) 385 1,612
Equipment
Gross amount 43 78 10 (24) (6) ‑ 101
Depreciation and
impairment (15) (16) (14) 4 2 1 (38)
Total Equipment 28 62 (4) (20) (4) 1 63
Total Right-of-use 1,371 62 127 (245) (26) 386 1,675
(1) Taking into account the effects of first-time adoption of the IFRS IC decision of 26 November 2019 respecting the duration of IFRS
16 leases, the balance of rights of use in the balance sheet would have been €1,762 million at 31 December 2019 (see Note 1.1
Applicable standards and comparability).

Consolidated financial statements of Credit Agricole S.A. 31 December 2020
202
(in millions of
euros) 31/12/2018 01/01/2019
Changes in
scope
Increases
(acquisitions)
Decreases
(disposals)
Translation
adjustments
Other
movements 31/12/2019
Property/Real
estate
Gross amount ‑ 1,476 14 269 (74) 10 (8) 1,687
Depreciation
and
impairment
‑ (54) (2) (294) 6 ‑ ‑ (344)
Total
Property/Real
estate - 1,422 12 (25) (68) 10 (8) 1,343
Equipment
Gross amount 4 31 ‑ 16 (4) ‑ ‑ 43
Depreciation
and
impairment (2) (2) ‑ (14) 1 ‑ ‑ (15)
Total Equipment 2 29 ‑ 2 (3) ‑ ‑ 28
Total Right-of-
use 2 1,451 12 (23) (71) 10 (8) 1,371
MATURITY SCHEDULE OF RENTAL DEBTS
(in millions of euros)
31/12/2020
≤ 1 year > 1 year up to ≤ 5
years > 5 years Total Lease
liabilities
Lease liabilities 316 884 557 1,757
(in millions of euros)
31/12/2019
≤ 1 year > 1 year up to ≤ 5
years > 5 years Total Lease
liabilities
Lease liabilities 285 732 390 1,407
DETAILS OF RENTAL CONTRACT INCOME AND EXPENSES
(in millions of euros) 31/12/2020 31/12/2019
Interest expense on lease liabilities (27) (24)
Total Interest and similar expenses (Revenues) (27) (24)
Expense relating to short-term leases (15) (81)
Expense relating to leases of low-value assets (21) (28)
Expense relating to variable lease payments not included in the
measurement of lease liabilities (15) (8)
Income from subleasing right-of-use assets 1 1
Gains or losses arising from leaseback transactions ‑ ‑
Gains or losses arising from lease modifications 1 ‑
Total Operating expenses (49) (115)
Depreciation for right-of-use (380) (308)
Total Depreciation and amortisation of property, plant & equipment (380) (308)
Total Expense and income on lease contracts (456) (447)
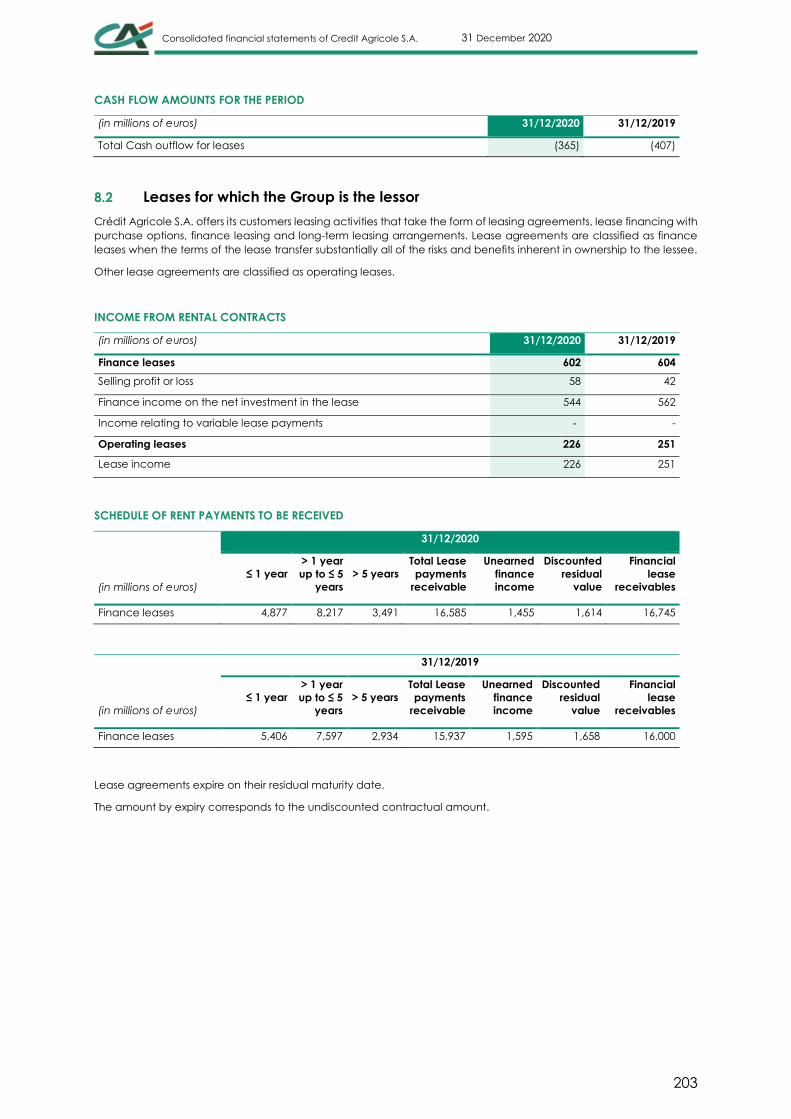
Consolidated financial statements of Credit Agricole S.A. 31 December 2020
203
CASH FLOW AMOUNTS FOR THE PERIOD
(in millions of euros) 31/12/2020 31/12/2019
Total Cash outflow for leases (365) (407)
8.2 Leases for which the Group is the lessor
Crédit Agricole S.A. offers its customers leasing activities that take the form of leasing agreements, lease financing with
purchase options, finance leasing and long-term leasing arrangements. Lease agreements are classified as finance
leases when the terms of the lease transfer substantially all of the risks and benefits inherent in ownership to the lessee.
Other lease agreements are classified as operating leases.
INCOME FROM RENTAL CONTRACTS
(in millions of euros) 31/12/2020 31/12/2019
Finance leases 602 604
Selling profit or loss 58 42
Finance income on the net investment in the lease 544 562
Income relating to variable lease payments ‑ -
Operating leases 226 251
Lease income 226 251
SCHEDULE OF RENT PAYMENTS TO BE RECEIVED
(in millions of euros)
31/12/2020
≤ 1 year
> 1 year
up to ≤ 5
years
> 5 years
Total Lease
payments
receivable
Unearned
finance
income
Discounted
residual
value
Financial
lease
receivables
Finance leases 4,877 8,217 3,491 16,585 1,455 1,614 16,745
(in millions of euros)
31/12/2019
≤ 1 year
> 1 year
up to ≤ 5
years
> 5 years
Total Lease
payments
receivable
Unearned
finance
income
Discounted
residual
value
Financial
lease
receivables
Finance leases 5,406 7,597 2,934 15,937 1,595 1,658 16,000
Lease agreements expire on their residual maturity date.
The amount by expiry corresponds to the undiscounted contractual amount.

Consolidated financial statements of Credit Agricole S.A. 31 December 2020
204
NOTE 9 Commitments given and received and other guarantees
Financing and guarantee commitments and other guarantees include discontinued operations.
COMMITMENTS GIVEN AND RECEIVED
(in millions of euros) 31/12/2020 31/12/2019
Commitments given
Financing commitments 165,035 154,791
Commitments given to credit institutions 16,155 13,433
Commitments given to customers 148,880 141,358
Confirmed credit lines 120,012 112,825
Documentary credits 4,543 4,282
Other confirmed credit lines 115,469 108,543
Other commitments given to customers 28,869 28,533
Guarantee commitments 85,784 87,884
Credit institutions 8,169 8,542
Confirmed documentary credit lines 2,925 3,372
Other garantees 5,244 5,170
Customers 77,615 79,342
Property guarantees 1,967 2,168
Other customer guarantees 75,648 77,175
Securities commitments 4,487 4,765
Securities to be delivered 4,487 4,765
Commitments received
Financing commitments 138,092 84,102
Commitments received from credit institutions 1 133,940 81,155
Commitments received from customers 4,152 2,946
Guarantee commitments 334,668 327,988
Commitments received from credit institutions 94,136 94,670
Commitments received from customers 240,532 233,318
Guarantees received from government bodies or similar institutions 2 33,501 25,934
Other guarantees received 207,031 207,385
Securities commitments 4,095 4,556
Securities to be received 4,095 4,556
¹ At 31 December 2020, following the activation of the Switch Assurance guarantee on 30 June 2020 and the claw-back of 31
December, the guarantee amounts to €5.9 billion. The security deposit is €2 billion.
² As part of the economic support measures in the wake of the COVID-19 health crisis, Crédit Agricole S.A. granted loans for which it
received guarantee commitments from the French State (SGL). At 31 December 2020, these guarantee commitments received
amounted to €8.5 billion.

Consolidated financial statements of Credit Agricole S.A. 31 December 2020
205
FINANCIAL INSTRUMENTS GIVEN AND RECEIVED AS COLLATERAL
(in millions of euros) 31/12/2020 31/12/2019
Carrying amount of financial assets provided as collateral (including transferred
assets)
Securities and receivables provided as collateral for the refinancing structures
(Banque de France, CRH, etc.) 397,564 189,444
Securities lent 12,904 8,874
Security deposits on market transactions 19,087 18,155
Other security deposits ‑ ‑
Securities sold under repurchase agreements 110,863 104,627
TOTAL CARRYING AMOUNT OF FINANCIAL ASSETS PROVIDED AS COLLATERAL 540,418 321,099
Carrying amount of financial assets received in garantee
Other security deposits ¹ 2,017 3,102
Fair value of instruments received as reusable and reused collateral
Securities borrowed 7 4
Secutities bought under repurchase agreements 434,708 275,463
Securities sold short 37,172 33,468
TOTAL FAIR VALUE OF INSTRUMENTS RECEIVED AS REUSABLE AND REUSED
COLLATERAL 471,887 308,935
¹ As part of the Switch Assurance guarantees, following the partial early termination on 2 March 2020, Crédit Agricole S.A. received
a deposit of €2 billion
RECEIVABLES PLEDGED AS COLLATERAL
At 31 December 2020, Crédit Agricole S.A. deposited €271.2 billion of receivables (mainly on behalf of the Regional
Banks and LCL) for refinancing transactions to the Banque de France, compared to €81.9 billion at 31 December 2019,
and €81.9 billion of receivables were deposited directly by others subsidiaries.
At 31 December 2020, Crédit Agricole S.A. deposited €12.1 billion of receivables for refinancing transactions to the
Caisse de Refinancement de l’Habitat on behalf of the Regional Banks, compared to €12.3 billion at 31 December
2019, and €1.2 billion of receivables were deposited directly by LCL.
On 31 December 2020, €2.9 billion receivables of the Regional Banks had been pledged as collateral for the covered
bonds issued by European Secured Notes Issuer (ESNI), a French securitisation company formed by five banks including
Crédit Agricole Group.
At 31 December 2020, €38.3 billion of Regional Bank and €9.3 billion of LCL receivables had been pledged as collateral
for the covered bond issues of Crédit Agricole Home Loan SFH, a financial company wholly owned by Crédit Agricole
S.A.
As at 31 December 2020, in the context of transactions with EIB/CEB supranationals, Crédit Agricole S.A. deposited
€2.8 billion in receivables on behalf of the Regional Banks.
As at 31 December 2020, in the context of refinancing transactions with CDC, Crédit Agricole S.A. deposited €2.6 billion
in receivables on behalf of the Regional Banks.
These processes, for which there is no transfer of contractual cash flows, do not form part of the asset transfers.
GUARANTEES HELD
Guarantees held and assets received as collateral by Crédit Agricole S.A. which it is allowed to sell or to use as
collateral are mostly held within Crédit Agricole S.A. for €297,5 billion and within Crédit Agricole CIB for €178 billion. The
majority of these are receivables pledged as collateral by the Regional Banks to Crédit Agricole S.A., the latter acting
as the central body with regard to the external refinancing organisations, in order to obtain refinancing. These
receivables (property-related, or loans to businesses or local authorities) are selected and rated for their quality and
retained on the balance sheet of the Regional Banks.

Consolidated financial statements of Credit Agricole S.A. 31 December 2020
206
The majority of these guarantees consist of mortgage liens, collateral or guarantees received, regardless of the quality
of the assets guaranteed. They are mainly related to repurchase agreements and securities pledged to guarantee
brokerage transactions.
Crédit Agricole S.A. Group policy is to sell seized collateral as soon as possible. Crédit Agricole CIB and Crédit Agricole
S.A. had no such assets at 31 December 2020.

Consolidated financial statements of Credit Agricole S.A. 31 December 2020
207
NOTE 10 Reclassification of financial instruments
PRINCIPLES APPLIED BY THE CRÉDIT AGRICOLE S.A. GROUP
Reclassifications are performed only under exceptional circumstances and following a decision by the Executive
Management of the entity as a result of internal or external changes: significant changes in the entity’s activity.
RECLASSIFICATION PERFORMED BY THE CRÉDIT AGRICOLE S.A. GROUP
In 2020, Crédit Agricole S.A. did not carry out any reclassification pursuant to paragraph 4.4.1 of IFRS 9.

Consolidated financial statements of Credit Agricole S.A. 31 December 2020
208
NOTE 11 Fair value of financial instruments
Fair value is the price that would be received at the sale of an asset or paid to transfer a liability in a standard
transaction between market participants at the measurement date.
Fair value is defined on the basis of the exit price.
The fair values shown below are estimates made on the reporting date using observable market data wherever
possible. These are subject to change in subsequent periods due to developments in market conditions or other factors.
The calculations represent best estimates. They are based on a number of assumptions. It is assumed that market
participants act in their best economic interest.
To the extent that these models contain uncertainties, the fair values shown may not be achieved upon actual sale or
immediate settlement of the financial instruments concerned.
The fair value hierarchy of financial assets and liabilities is broken down according to the general observability criteria
of the valuation inputs, pursuant to the principles defined under IFRS 13.
Level 1 of the hierarchy applies to the fair value of financial assets and liabilities quoted in active markets.
Level 2 of the hierarchy applies to the fair value of financial assets and liabilities with observable inputs. This agreement
includes market data relating to interest rate risk or credit risk when the latter can be revalued based on Credit Default
Swap (CDS) spreads. Securities bought or sold under repurchase agreements with underlyings quoted in an active
market are also included in Level 2 of the hierarchy, as are financial assets and liabilities with a demand component
for which fair value is measured at unadjusted amortised cost.
Level 3 of the hierarchy is used for financial instruments at fair value for which the valuation draws upon, exclusively or
for a significant part, unobservable market parameters.
Parameters for which no market information is available, or for which the available market information is considered
insufficient, are regarded as unobservable. This qualification may call upon expert opinion. The information examined
may include transactions actually concluded, firm or indicative quotations and information resulting from market
consensus.
In some cases, market values are close to carrying amounts. These include:
assets or liabilities at variable rates for which interest rate changes do not have a significant influence on the
fair value, since the rates on these instruments frequently adjust themselves to the market rates;
short-term assets or liabilities where the redemption value is considered to be close to the market value;
instruments executed on a regulated market for which the prices are set by the public authorities;
demand assets and liabilities.

Consolidated financial statements of Credit Agricole S.A. 31 December 2020
209
11.1 Fair value of financial assets and liabilities recognised at amortised cost
Amounts presented below include accruals and prepayments and are net of impairment.
FINANCIAL ASSETS RECOGNISED AT COST AND MEASURED AT FAIR VALUE ON THE BALANCE SHEET
(in millions of euros)
Value at
31/12/2020
Estimated fair
value at
31/12/2020
Quoted prices in active
markets for identical
instruments:
Level 1
Valuation
based on
observable
data:
Level 2
Valuation based
on unobservable
data:
Level 3
Financial assets not measured at fair value on
balance sheet
Loans and receivables 869,106 912,066 ‑ 559,762 352,304
Loans and receivables due from credit institutions 463,169 477,113 ‑ 476,319 794
Current accounts and overnight loans 8,660 8,825 ‑ 8,706 119
Accounts and long-term loans 440,878 454,463 ‑ 454,018 445
Pledged securities ‑ ‑ ‑ ‑ ‑
Securities bought under repurchase agreements 12,551 12,608 ‑ 12,608 ‑
Subordinated loans 925 1,038 ‑ 808 230
Other loans and receivables 155 179 ‑ 179 ‑
Loans and receivables due from customers 405,937 434,953 ‑ 83,443 351,510
Trade receivables 40,064 40,267 ‑ 21,403 18,864
Other customer loans 349,072 376,748 ‑ 46,807 329,941
Pledged securities 205 205 ‑ 205 ‑
Securities bought under repurchase agreements 3,713 3,713 ‑ 3,460 253
Subordinated loans 44 45 ‑ 6 39
Insurance receivables 328 328 ‑ 4 324
Reinsurance receivables 845 845 ‑ 5 840
Advances in associates' current accounts 146 148 ‑ 18 130
Current accounts in debit 11,520 12,654 ‑ 11,535 1,119
Debt securities 84,794 86,402 57,496 12,952 15,954
Treasury bills and similar securities 29,887 30,500 25,536 4,735 229
Bonds and other fixed income securities 54,907 55,902 31,960 8,217 15,725
TOTAL FINANCIAL ASSETS OF WHICH FAIR VALUE IS
DISCLOSED 953,900 998,468 57,496 572,714 368,258

Consolidated financial statements of Credit Agricole S.A. 31 December 2020
210
(in millions of euros)
Value at
31/12/2019
Estimated fair
value at
31/12/2019
Quoted prices in active
markets for identical
instruments:
Level 1
Valuation
based on
observable
data :
Level 2
Valuation based
on unobservable
data :
Level 3
Financial assets not measured at fair value on
balance sheet
Loans and receivables 833,761 858,085 ‑ 529,155 328,930
Loans and receivables due from credit institutions 438,580 448,243 ‑ 447,039 1,204
Current accounts and overnight loans 30,780 30,793 ‑ 30,618 175
Accounts and long-term loans 400,063 409,649 ‑ 408,849 800
Pledged securities 1 1 ‑ ‑ 1
Securities bought under repurchase agreements 6,701 6,707 ‑ 6,707 ‑
Subordinated loans 929 966 ‑ 738 228
Other loans and receivables 106 127 ‑ 127 ‑
Loans and receivables due from customers 395,180 409,842 ‑ 82,116 327,726
Trade receivables 43,563 42,854 ‑ 20,832 22,022
Other customer loans 332,629 346,991 ‑ 44,075 302,916
Pledged securities 232 232 ‑ 232 ‑
Securities bought under repurchase agreements 4,071 4,073 ‑ 4,073 ‑
Subordinated loans 44 44 ‑ 4 40
Insurance receivables 314 314 ‑ 9 305
Reinsurance receivables 770 770 ‑ 1 769
Advances in associates' current accounts 142 143 ‑ 10 133
Current accounts in debit 13,415 14,421 ‑ 12,880 1,541
Debt securities 72,519 72,706 48,164 7,138 17,404
Treasury bills and similar securities 23,578 23,672 21,996 1,435 241
Bonds and other fixed income securities 48,942 49,034 26,169 5,703 17,162
TOTAL FINANCIAL ASSETS OF WHICH FAIR VALUE IS
DISCLOSED 906,280 930,791 48,164 536,293 346,334

Consolidated financial statements of Credit Agricole S.A. 31 December 2020
211
FINANCIAL LIABILITIES RECOGNISED AT AMORTISED COST AND MEASURED AT FAIR VALUE ON THE BALANCE
SHEET
(in millions of euros)
Value at
31/12/2020
Estimated fair
value at
31/12/2020
Quoted prices in active
markets for identical
instruments:
Level 1
Valuation
based on
observable
data:
Level 2
Valuation based
on unobservable
data:
Level 3
Financial liabilities not measured at fair value on
balance sheet
Due to credit institutions 264,919 277,020 ‑ 275,768 1,252
Current accounts and overnight borrowings 51,019 51,055 ‑ 51,055 ‑
Accounts and term deposits 187,241 199,274 ‑ 198,136 1,138
Pledged securities ‑ ‑ ‑ ‑ ‑
Securities sold under repurchase agreements 26,659 26,691 ‑ 26,577 114
Due to customers 719,388 719,762 ‑ 392,282 327,480
Current accounts in credit 291,807 291,822 ‑ 291,822 ‑
Special savings accounts 324,407 324,408 ‑ ‑ 324,408
Other amounts due to customers 98,927 99,280 ‑ 98,867 413
Securities sold under repurchase agreements 1,520 1,520 ‑ 1,520 ‑
Insurance liabilities 872 872 ‑ 67 805
Reinsurance liabilities 590 595 ‑ 6 589
Cash deposits received from ceding and
retroceding companies against technical insurance
commitments 1,265 1,265 ‑ ‑ 1,265
Debt securities 162,547 167,751 85,192 81,912 647
Subordinated debt 24,052 24,626 6,650 17,870 106
TOTAL FINANCIAL LIABILITIES OF WHICH FAIR VALUE IS
DISCLOSED 1,170,906 1,189,159 91,842 767,832 329,485
(in millions of euros)
Value at
31/12/2019
Estimated fair
value at
31/12/2019
Quoted prices in active
markets for identical
instruments:
Level 1
Valuation
based on
observable
data:
Level 2
Valuation based
on unobservable
data:
Level 3
Financial liabilities not measured at fair value on
balance sheet
Due to credit institutions 142,041 142,755 ‑ 142,723 32
Current accounts and overnight borrowings 31,290 31,287 ‑ 31,287 ‑
Accounts and term deposits 82,514 83,207 ‑ 83,175 32
Pledged securities ‑ ‑ ‑ ‑ ‑
Securities sold under repurchase agreements 28,237 28,261 ‑ 28,261 ‑
Due to customers 646,914 647,017 ‑ 341,395 305,622
Current accounts in credit 228,338 228,337 ‑ 228,301 37
Special savings accounts 302,423 302,425 ‑ 281 302,144
Other amounts due to customers 112,020 112,125 ‑ 111,173 952
Securities sold under repurchase agreements 1,569 1,568 ‑ 1,568 ‑
Insurance liabilities 942 940 ‑ 61 878
Reinsurance liabilities 467 467 ‑ 11 456
Cash deposits received from ceding and
retroceding companies against technical insurance
commitments 1,155 1,155 ‑ ‑ 1,155
Debt securities 201,007 204,181 71,169 132,308 703
Subordinated debt 21,797 22,119 5,754 16,182 183
TOTAL FINANCIAL LIABILITIES OF WHICH FAIR VALUE IS
DISCLOSED 1,011,759 1,016,071 76,922 632,609 306,540

Consolidated financial statements of Credit Agricole S.A. 31 December 2020
212
11.2 Information about financial instruments measured at fair value
VALUATION MECHANISM
Financial instruments are valued by management information systems and checked by a team that reports to the Risk
Management department and is independent from the market operators.
Valuations are based on the following:
prices or inputs obtained from independent sources and/or validated by the Market Risk department using a
series of available sources such as pricing service vendors, market consensus data and brokers;
models approved by the quantitative teams in the Market Risk department.
The valuation produced for each instrument is a mid-market valuation, which does not take account of the direction
of the trade, the bank’s aggregate exposure, market liquidity or counterparty quality. Adjustments are then made to
the market valuations to incorporate those factors, as well as the potential uncertainties inherent in the models or inputs
used.
The main types of valuation adjustments are the following:
Mark-to-Market adjustments
These adjustments correct any potential variance between the mid-market valuation of an instrument obtained using
internal valuation models and the associated inputs and the valuation obtained from external sources or market
consensus data. These adjustments can be either positive or negative;
Bid/ask reserves
These adjustments incorporate the bid/ask spread for a given instrument in order to reflect the price at which the
position could be reversed. These adjustments are always negative;
Uncertainty reserves
These adjustments constitute a risk premium taken into account by all market participants. These adjustments are
always negative:
input uncertainty reserves seek to incorporate in the valuation of an instrument any uncertainty that might
exist as regards one or more of the inputs used;
model uncertainty reserves seek to incorporate in the valuation of an instrument any uncertainty that might
exist due to the choice of model used.
In addition, in accordance with IFRS 13 “Fair value measurement”, Crédit Agricole S.A. prices in to the fair value
calculated for its OTC derivatives (i.e. those traded over the counter) various adjustments linked to:
default risk or credit rating (Credit Valuation Adjustment/Debit Valuation Adjustment)
future funding costs and benefits (Funding Valuation Adjustment)
liquidity risk associated with collateral (Liquidity Valuation Adjustment).
Credit Valuation Adjustment (CVA)
The CVA (Credit Valuation Adjustment) is a mark-to-market adjustment to incorporate the market value of the default
risk (risk of non-payment of amounts due in the event of default or deterioration in credit quality) in the value of OTC
derivatives of our counterparties. This adjustment is calculated per counterparty based on the positive future exposure
of the trading portfolio (taking into account any netting or collateral agreements, where such exist) weighted by the
probabilities of default and losses given default.
The methodology used maximises the use of market inputs/prices (probabilities of default are derived in priority directly
from any existing listed CDS, proxies of listed CDS and other credit instruments where these are deemed sufficiently
liquid). This adjustment is always negative and reduces the fair value of the OTC derivative assets held in the portfolio.

Consolidated financial statements of Credit Agricole S.A. 31 December 2020
213
Credit Valuation Adjustment (DVA)
The Debit Valuation Adjustment (DVA) is a mark-to-market adjustment that aims to incorporate the market value of
the default risk (potential losses to which Crédit Agricole S.A. may expose its counterparties in the event of default or
a deterioration in its creditworthiness) in the value of perfectly collateralised OTC derivatives. This adjustment is
calculated by collateral contract type on the basis of negative future exposure profiles of the trading portfolio
weighted by default probabilities (Crédit Agricole S.A.) and losses incurred in the event of default.
The methodology used maximises the use of market inputs/prices (use of Crédit Agricole S.A. CDS to determine default
probabilities). This adjustment is always positive and reduces the fair value of the OTC derivative liabilities held in the
portfolio.
Credit Valuation Adjustment (FVA)
The Funding Valuation Adjustment (FVA) is a mark-to-market adjustment that aims to incorporate the additional future
funding costs and benefits based on ALM (Asset & Liability Management) funding costs in the value of not collateralised
or imperfectly collateralised OTC derivatives. This adjustment is calculated per counterparty based on the future
exposure of the trading portfolio (taking into account any netting or collateral agreements, where such exist) weighted
by ALM funding spreads.
As regards the scope of “clear” derivatives, an FVA adjustment called IMVA (Initial Margin Value Adjustment) is
calculated to take into account the future financing costs and gains of the initial margins to be posted with the main
derivatives clearing houses until the portfolio matures.
Credit Valuation Adjustment (LVA)
The LVA (Liquidity Valuation Adjustment) is the positive or negative valuation adjustment intended to reflect both the
potential absence of collateral payments for counterparties with a CSA (Credit Support Annex), as well as the non-
standard remuneration of CSAs.
Therefore, the LVA reflects the profit or loss resulting from additional liquidity costs. It is calculated on the scope of OTC
derivatives with CSAs.

Consolidated financial statements of Credit Agricole S.A. 31 December 2020
214
BREAKDOWN OF FINANCIAL INSTRUMENTS AT FAIR VALUE BY VALUATION MODEL
Amounts presented below include accruals and prepayments and are net of impairment.
On the asset side, transfers from Level 2 to Level 3 essentially result from a better identification of the level of fair value
of transactions present at 31 December 2019 (€138 million). Transfers from Level 3 to Level 2 mainly result from positions
that have become observable in line with the observability mapping (€1.3 billion).
On the liabilities side, transfers observed from Level 2 to Level 3 mainly result from a more accurate identification of the
fair value levels of transactions as at 31/31/2019 (€425 million) and from a review of the mapping of 'observability (€624
million). Transfers from Level 3 to Level 2 mainly result from positions that have become observable in line with the
observability mapping (€500 million).
Financial assets measured at fair value
(in millions of euros) 31/12/2020
Quoted prices in
active markets for
identical instruments:
Level 1
Valuation
based on
observable
data: Level 2
Valuation based
on unobservable
data: Level 3
Held for trading financial assets 261,968 22,633 233,963 5,372
Loans and receivables due from credit institutions ‑ ‑ ‑ ‑
Loans and receivables due from customers 872 ‑ 141 731
Securities bought under repurchase agreements 120,116 ‑ 118,489 1,627
Pledged securities ‑ ‑ ‑ ‑
Held for trading securities 24,743 22,541 1,775 427
Treasury bills and similar securities 13,081 11,774 1,307 ‑
Bonds and other fixed income securities 5,389 4,767 466 156
UCITS 52 52 ‑ ‑
Equities and other variable income securities 6,221 5,948 2 271
Derivative instruments 116,237 92 113,558 2,587
Other financial assets at fair value through profit or loss 170,494 108,855 50,714 10,925
Equity instruments at fair value through profit or loss 34,183 21,410 7,170 5,603
Equities and other variable income securities 21,898 18,823 2,126 949
Non-consolidated equity investments 12,285 2,587 5,044 4,654
Debt instruments that do not meet the conditions of the “SPPI” test 72,410 43,018 24,102 5,290
Loans and receivables due from credit institutions ‑ ‑ ‑ ‑
Loans and receivables due from customers 3,444 ‑ 3,443 1
Debt securities 68,966 43,018 20,659 5,289
Treasury bills and similar securities 178 4 174 ‑
Bonds and other fixed income securities 13,660 2,003 10,951 706
UCITS 55,128 41,011 9,534 4,583
Assets backing unit-linked contracts 63,900 44,426 19,442 32
Treasury bills and similar securities 498 489 9 ‑
Bonds and other fixed income securities 4,382 1,145 3,237 ‑
Equities and other variable income securities 8,378 1,543 6,835 ‑
UCITS 50,642 41,249 9,361 32
Financial assets designated at fair value through profit or loss 1 1 ‑ ‑
Loans and receivables due from credit institutions ‑ ‑ ‑ ‑
Loans and receivables due from customers ‑ ‑ ‑ ‑
Securities designated at fair value through profit or loss 1 1 ‑ ‑
Treasury bills and similar securities ‑ ‑ ‑ ‑
Bonds and other fixed income securities 1 1 ‑ ‑
Financial assets at fair value through other comprehensive income 266,072 246,573 19,264 235
Equity instruments at fair value through other comprehensive income that
will not be reclassified to profit or loss 2,216 956 1,025 235
Equities and other variable income securities 515 15 460 40
Non-consolidated equity investments ¹ 1,701 941 565 195
Debt instruments at fair value through other comprehensive income that
may be reclassified to profit or loss 263,856 245,617 18,239 ‑
Loans and receivables due from credit institutions ‑ ‑ ‑ ‑
Loans and receivables due from customers ‑ ‑ ‑ ‑
Debt securities 263,856 245,617 18,239 ‑
Treasury bills and similar securities 88,142 87,838 304 ‑
Bonds and other fixed income securities 175,714 157,779 17,935 ‑
Hedging derivative Instruments 21,745 16 21,729 ‑
TOTAL FINANCIAL ASSETS MEASURED AT FAIR VALUE 720,279 378,077 325,670 16,532
Transfers from Level 1: Quoted prices in active markets for identical
instruments
1,532 12

Consolidated financial statements of Credit Agricole S.A. 31 December 2020
215
Transfers from Level 2: Valuation based on observable data 154 183
Transfers from Level 3: Valuation based on unobservable data 1 1,319
TOTAL TRANSFERS TO EACH LEVEL 155 2,851 195
1 SAS Rue La Boétie shares held by the Caisse régionale de la Corse have been included in Non-consolidated equity
investments in Level 2 for €66 million.
Level 1 to Level 2 transfers mainly involve options listed on the underlying equity.
Level 1 to Level 3 transfers involve bonds and other fixed-income securities.
Level 2 to Level 1 transfers mainly involve treasury bills, bonds and other fixed-income securities.
Level 2 to Level 3 transfers mainly involve securities bought/sold under repurchase agreements and trading derivative
instruments.
Level 3 to Level 1 transfers involve bonds and other fixed-income securities.
Level 3 to Level 2 transfers mainly involve securities bought/sold under repurchase agreements from credit institutions,
from the customers and trading derivative instruments. Several positions can now be observed.
(in millions of euros) 31/12/2019
Quoted prices in
active markets for
identical instruments:
Level 1
Valuation
based on
observable
data: Level 2
Valuation based
on unobservable
data: Level 3
Held for trading financial assets 230,721 23,646 201,576 5,499
Loans and receivables due from credit institutions 61 ‑ 61 ‑
Loans and receivables due from customers 894 ‑ ‑ 894
Securities bought under repurchase agreements 103,690 ‑ 101,771 1,919
Pledged securities ‑ ‑ ‑ ‑
Held for trading securities 25,281 22,762 1,740 779
Treasury bills and similar securities 13,665 12,494 1,170 1
Bonds and other fixed income securities 4,607 3,878 568 161
UCITS 108 84 ‑ 24
Equities and other variable income securities 6,901 6,305 2 594
Derivative instruments 100,795 884 98,004 1,907
Other financial assets at fair value through profit or loss 168,756 113,114 46,358 9,284
Equity instruments at fair value through profit or loss 36,293 25,070 6,852 4,371
Equities and other variable income securities 24,754 21,726 2,027 1,001
Non-consolidated equity investments 11,539 3,344 4,825 3,370
Debt instruments that do not meet the conditions of the “SPPI” test 72,942 45,690 22,535 4,717
Loans and receivables due from credit institutions ‑ ‑ ‑ ‑
Loans and receivables due from customers 4,209 ‑ 3,847 362
Debt securities 68,733 45,690 18,688 4,355
Treasury bills and similar securities 252 111 139 2
Bonds and other fixed income securities 13,152 1,995 10,578 579
UCITS 55,329 43,584 7,971 3,774
Assets backing unit-linked contracts 59,520 42,352 16,972 196
Treasury bills and similar securities 457 444 13 ‑
Bonds and other fixed income securities 4,204 1,218 2,986 ‑
Equities and other variable income securities 6,822 1,287 5,351 184
UCITS 48,037 39,403 8,622 12
Financial assets designated at fair value through profit or loss 1 1 ‑ ‑

Consolidated financial statements of Credit Agricole S.A. 31 December 2020
216
Loans and receivables due from credit institutions ‑ ‑ ‑ ‑
Loans and receivables due from customers ‑ ‑ ‑ ‑
Securities designated at fair value through profit or loss 1 1 ‑ ‑
Treasury bills and similar securities ‑ ‑ ‑ ‑
Bonds and other fixed income securities 1 1 ‑ ‑
Financial assets at fair value through other comprehensive income 261,321 243,263 17,772 286
Equity instruments at fair value through other comprehensive income that
will not be reclassified to profit or loss 2,518 1,367 884 267
Equities and other variable income securities 802 457 309 36
Non-consolidated equity investments ¹ 1,716 910 575 231
Debt instruments at fair value through other comprehensive income that
may be reclassified to profit or loss 258,803 241,895 16,888 20
Loans and receivables due from credit institutions ‑ ‑ ‑ ‑
Loans and receivables due from customers ‑ ‑ ‑ ‑
Debt securities 258,803 241,895 16,888 20
Treasury bills and similar securities 82,684 82,361 323 ‑
Bonds and other fixed income securities 176,119 159,534 16,565 20
Hedging derivative Instruments 19,368 34 19,334 ‑
TOTAL FINANCIAL ASSETS MEASURED AT FAIR VALUE 680,166 380,057 285,040 15,069
Transfers from Level 1: Quoted prices in active markets for identical
instruments
4,420 106
Transfers from Level 2: Valuation based on observable data 474 2,119
Transfers from Level 3: Valuation based on unobservable data 72 1,820
TOTAL TRANSFERS TO EACH LEVEL 546 6,240 2,225
1 SAS Rue La Boétie shares have been included in Non-consolidated equity investments in Level 2 for €70 million.
Level 1 to Level 2 transfers concern the reclassification of derivatives instruments from organised markets to over the
counter.
Level 1 to Level 3 transfers involve bonds and other fixed-income securities.
Level 2 to Level 1 transfers mainly involve treasury bills, bonds and other fixed-income securities.
Level 2 to Level 3 transfers mainly involve securities received under repurchase agreements from credit institutions and
interest rate swaps.
Level 3 to Level 1 transfers mainly involve treasury bills.
Level 3 to Level 2 transfers mainly involve securities received under repurchase agreements from customers and
trading derivatives including -€0,3 billion related to the review of the derivatives observability analysis.

Consolidated financial statements of Credit Agricole S.A. 31 December 2020
217
Financial liabilities measured at fair value
(in millions of euros) 31/12/2020
Quoted prices in
active markets for
identical instruments:
Level 1
Valuation
based on
observable
data: Level 2
Valuation based
on unobservable
data: Level 3
Held for trading financial liabilities 229,265 37,022 190,351 1,892
Securities sold short 37,179 36,931 248 ‑
Securities sold under repurchase agreements 82,662 ‑ 81,925 737
Debt securities 2 ‑ 2 ‑
Due to credit institutions ‑ ‑ ‑ ‑
Due to customers ‑ ‑ ‑ ‑
Derivative instruments 109,422 91 108,176 1,155
Financial liabilities designated at fair value through profit or loss 35,908 9,943 20,255 5,710
Hedging derivative Instruments 15,218 ‑ 14,607 611
TOTAL FINANCIAL LIABILITIES MEASURED AT FAIR VALUE 280,391 46,965 225,213 8,213
Transfers from Level 1: Quoted prices in active markets for identical
instruments 1,057 ‑
Transfers from Level 2: Valuation based on observable data 1 64 1,136
Transfers from Level 3: Valuation based on unobservable data ‑ 628
TOTAL TRANSFERS TO EACH LEVEL 64 1,685 1,136
1 Liabilities tranfers to and from Level 3 mainly involve securities received under repurchase agreements from credit institutions, trading derivatives and financial
liabilities designated at fair value trough profit or loss.
Level 1 to Level 2 transfers mainly involve options listed on the underlying equity.
Level 2 to Level 1 transfers mainly involve negotiable debt securities.
Level 3 to Level 1 transfers had no impact in 2020.
Level 3 to Level 2 transfers mainly involve securities received under repurchase agreements and interest rate swaps.
The review of the observability analysis of the derivatives and the financial liabilities measured at fair value by option
amounts to -€500 million.
(in millions of euros) 31/12/2019
Quoted prices in
active markets for
identical instruments:
Level 1
Valuation
based on
observable
data: Level 2
Valuation based
on unobservable
data: Level 3
Held for trading financial liabilities 206,708 34,018 171,104 1,586
Securities sold short 33,473 33,259 214 ‑
Securities sold under repurchase agreements 74,762 ‑ 73,842 920
Debt securities 55 ‑ 55 ‑
Due to credit institutions ‑ ‑ ‑ ‑
Due to customers ‑ ‑ ‑ ‑
Derivative instruments 98,418 759 96,993 666
Financial liabilities designated at fair value through profit or loss 39,961 8,763 23,683 7,515
Hedging derivative Instruments 13,293 ‑ 12,981 312
TOTAL FINANCIAL LIABILITIES MEASURED AT FAIR VALUE 259,962 42,781 207,768 9,413
Transfers from Level 1: Quoted prices in active markets for identical
instruments
4,023 ‑
Transfers from Level 2: Valuation based on observable data 35 605
Transfers from Level 3: Valuation based on unobservable data 241 4,676
TOTAL TRANSFERS TO EACH LEVEL 275 8,699 605

Consolidated financial statements of Credit Agricole S.A. 31 December 2020
218
Level 1 to Level 2 transfers concern the reclassification of derivatives instruments from organised markets to over the
counter.
Level 2 to Level 1 transfers concern short sales.
Level 2 to Level 3 transfers mainly involve securities delivered under repurchase agreements to credit institutions.
Level 3 to Level 1 transfers mainly involve short sales of treasury bills.
Level 3 to Level 2 transfers mainly involve securities delivered under repurchase agreements to clients, negotiable debt
securities accounted at fair value through profit or loss and trading derivatives. The review of the observability analysis
of the derivatives and the financial liabilities measured at fair value by option amounts to -€2.1 billion.
Financial instruments classified in Level 1
Level 1 comprises all derivatives quoted in an active market (options, futures, etc.), regardless of their underlying
(interest rate, exchange rate, precious metals, major stock indexes), as well as equities and bonds quoted in an active
market.
A market is considered as being active if quoted prices are readily and regularly available from exchange, brokers,
dealers, pricing services or regulatory agencies, and those prices represent actual and regularly occurring market
transactions on an arm’s length basis.
Corporate, government and agency bonds that are valued on the basis of prices obtained from independent sources,
deemed to be enforceable and updated regularly, are classified in Level 1. This covers the bulk of sovereign and
agency bonds and corporate securities held. Issuers whose bonds are not quoted are classified in Level 3.
Financial instruments classified in Level 2
The main financial instruments classified in Level 2 are:
Liabilities designated at fair value
Liabilities designated at fair value. Financial liabilities designated at fair value are classified in Level 2 when
their embedded derivative is deemed to be classified in Level 2;
Over-the-counter derivatives
The main OTC derivatives classified in Level 2 are those valued using inputs considered to be observable and where
the valuation technique does not generate any significant exposure to a model risk.
Level 2 therefore mainly includes:
Linear derivative products such as interest rate swaps, currency swaps and forward FX. They are valued using
simple models widely used in the market, based either on directly observable inputs (foreign exchange rates,
interest rates), or inputs derived from observable market prices (currency swaps);
non-linear vanilla instruments such as caps, floors, swaptions, currency options, equity options and credit
default swaps, including digital options. They are valued using simple models widely used in the market, based
either on directly observable inputs (foreign exchange rates, interest rates, share prices) or inputs that can be
derived from observable market prices (volatilities);
certain structured products on which market quotations exist and on an ongoing basis and valued in a market
consensus model;
securities listed on a market deemed inactive and for which independent valuation data are available.
futures and options listed on shares with insufficient volumes.
Financial instruments classified in Level 3
Financial instruments classified in Level 3 are those which do not meet the conditions for classification in Level 1 or 2.
They are therefore mainly financial instruments with a high model risk whose valuation requires substantial use of
unobservable inputs.

Consolidated financial statements of Credit Agricole S.A. 31 December 2020
219
All or part of the initial margin on all new transactions classified in Level 3 is reserved at the date of initial recognition. It
is written back into the profit or loss account either spread over the period during which the inputs are considered to
be unobservable or in full on the date when the inputs become observable, or when the transaction is completed.
Level 3 therefore mainly includes:
Securities
Securities classified in Level 3 mainly include:
unlisted shares or bonds for which no independent valuation is available;
ABSs and CLOs for which there are indicative independent quotes but which are not necessarily executable;
ABSs, CLOs and super senior and mezzanine CDO tranches where it cannot be demonstrated that the market
is active.
Liabilities designated at fair value
Financial liabilities designated at fair value are classified in Level 3 when their embedded derivative is deemed to
be classified in Level 3.
Over-the-counter derivatives
Unobservable income includes complex financial instruments that are significantly exposed to model risk or that
involve parameters that are considered unobservable.
The aggregate of these principles is mapped for observability according to the three levels indicating for each
product, currency and maturity the classification used.
The following are classified mainly in Level 3:
interest rate exposures or very long-dated currency swaps or covering emerging currencies;
equity exposures, mainly through products traded on overly shallow option markets or indexed to volatility or
equity/equity correlations and long-dated;
exposures to non-linear long-dated products (interest rate or currency) on major currencies/indexes;
non-linear exposures to emerging market currencies;
complex derivatives.
The main exposures involved are:
structured interest rates products known as “path dependent”, whose future cash flows depend on past
fixings observed on IR swap rates. These products valuation resort to complex models;
securitisation swaps generating an exposure to the prepayment rate. The prepayment rate is determined on
the basis of historical data on similar portfolios. The assumptions and inputs used are checked regularly on the
basis of actual prepayments;
hybrid products: those products flow depend on correlation between two different types of underlying
products, such as interest rates, indexes, FX rate, credit spread;
CDOs based on corporate credit baskets. These are no longer significant;
certain portfolios of complex equity derivatives;
securities under repurchase agreements, for long maturities or in emerging currencies, or related to complex
underlying securities.

Consolidated financial statements of Credit Agricole S.A. 31 December 2020
22
0
NET CHANGE IN FINANCIAL INSTRUMENTS MEASURED AT FAIR VALUE ACCORDING TO LEVEL 3
Financial assets measured at fair value according to Level 3
(in millions of euros)
Total Financial assets
measured at fair
value according to
level 3
Held for trading financial assets
Loans and
receivables due
from credit
institutions
Loans and
receivable
s due from
customers
Securities
bought
under
repurchase
agreements
Pledged
securities
Held for trading securities
Derivative
instruments
Treasury bills
and similar
securities
Bonds and other
fixed income
securities
Mutual
funds
Equities and other
variable income
securities
Held for
trading
securities
Closing balance (31/12/2019) 15,069 ‑ 892 1,919 ‑ ‑ 161 23 594 779 1,907
Gains or losses during the period ¹ (691) ‑ (46) 84 ‑ ‑ (6) ‑ (327) (334) (7)
Recognised in profit or loss (629) ‑ (21) 82 ‑ ‑ (6) ‑ (327) (334) (6)
Recognised in other comprehensive
income (62) ‑ (25) 2 ‑ ‑ ‑ ‑ ‑ ‑ (1)
Purchases 5,559 ‑ 415 748 ‑ ‑ 12 ‑ 4 17 911
Sales (2,159) ‑ (779) (15) ‑ ‑ (8) (23) ‑ (32) (190)
Issues 4 ‑ ‑ ‑ ‑ ‑ ‑ ‑ ‑ ‑ 4
Settlements (106) ‑ (21) (5) ‑ ‑ (1) ‑ ‑ (2) (16)
Reclassifications ‑ ‑ 275 ‑ ‑ ‑ ‑ ‑ ‑ ‑ ‑
Changes associated with scope during the
period (19) ‑ ‑ ‑ ‑ ‑ ‑ ‑ ‑ ‑ ‑
Transfers (1,125) ‑ (5) (1,104) ‑ ‑ (2) ‑ ‑ (2) (22)
Transfers to Level 3 195 ‑ ‑ 80 ‑ ‑ 6 ‑ ‑ 6 97
Transfers from Level 3 (1,320) ‑ (5) (1,184) ‑ ‑ (8) ‑ ‑ (8) (119)
CLOSING BALANCE (31/12/2020) 16,532 ‑ 731 1,627 ‑ ‑ 156 ‑ 271 427 2,587

Consolidated financial statements of Credit Agricole S.A. 31 December 2020
22
1
(in millions of euros)
Other financial instruments at fair value through profit or loss
Equity instruments at fair value
through profit or loss Debt instruments that do not meet the conditions of the “SPPI” test
Equity and other
variable income
securities
Non-
consolidated
equity
investments
Loans and
receivables due from
credit institutions
Loans and
receivables due
from customers
Securities
bought
under
repurchase
agreements
Pledged
securities
Debt securities
Treasury bills
and similar
securities
Bonds and other
fixed income
securities
Mutual
funds
Debt
securities
Closing balance (31/12/2019) 1,000 3,374 ‑ 362 ‑ ‑ 2 579 3,774 4,354
Gains or losses during the period ¹ (69) (220) ‑ (12) ‑ ‑ (1) 6 35 41
Recognised in profit or loss (68) (214) ‑ ‑ ‑ ‑ (1) 6 35 41
Recognised in other comprehensive income (1) (6) ‑ (12) ‑ ‑ ‑ ‑ ‑ ‑
Purchases 102 1,816 ‑ (5) ‑ ‑ 2 138 1,468 1,608
Sales (84) (311) ‑ (18) ‑ ‑ ‑ (22) (694) (716)
Issues ‑ ‑ ‑ ‑ ‑ ‑ ‑ ‑ ‑ ‑
Settlements ‑ ‑ ‑ (42) ‑ ‑ ‑ ‑ ‑ ‑
Reclassifications ‑ ‑ ‑ (275) ‑ ‑ ‑ ‑ ‑ ‑
Changes associated with scope during the period ‑ ‑ ‑ (10) ‑ ‑ (2) (7) ‑ (9)
Transfers ‑ (5) ‑ ‑ ‑ ‑ ‑ 12 ‑ 12
Transfers to Level 3 ‑ ‑ ‑ ‑ ‑ ‑ ‑ 12 ‑ 12
Transfers from Level 3 ‑ (5) ‑ ‑ ‑ ‑ ‑ ‑ ‑ ‑
CLOSING BALANCE (31/12/2020) 949 4,654 ‑ ‑ ‑ ‑ 1 706 4,583 5,290

Consolidated financial statements of Credit Agricole S.A. 31 December 2020
22
2
(in millions of euros)
Other financial instruments at fair value through profit or loss
Assets backing unit-linked contracts Financial assets designated at fair value through profit or loss
Treasury bills and
similar securities
Bonds and other
fixed income
securities
Equities and other
variable income
securities Mutual funds
Loans and
receivables due
from credit
institutions
Loans and
receivables due
from customers
Debt securities
Treasury bills and
similar securities
Bonds and other
fixed income
securities
Debt
securities
Closing balance (31/12/2019) 184 ‑ 184 12 ‑ ‑ ‑ ‑ ‑
Gains or losses during the period ¹ (184) ‑ (184) ‑ ‑ ‑ ‑ ‑ ‑
Recognised in profit or loss (184) ‑ (184) ‑ ‑ ‑ ‑ ‑ ‑
Recognised in other comprehensive income ‑ ‑ ‑ ‑ ‑ ‑ ‑ ‑ ‑
Purchases ‑ ‑ ‑ 25 ‑ ‑ ‑ ‑ ‑
Sales ‑ ‑ ‑ (5) ‑ ‑ ‑ ‑ ‑
Issues ‑ ‑ ‑ ‑ ‑ ‑ ‑ ‑ ‑
Settlements ‑ ‑ ‑ ‑ ‑ ‑ ‑ ‑ ‑
Reclassifications ‑ ‑ ‑ ‑ ‑ ‑ ‑ ‑ ‑
Changes associated with scope during the
period ‑ ‑ ‑ ‑ ‑ ‑ ‑ ‑ ‑
Transfers ‑ ‑ ‑ ‑ ‑ ‑ ‑ ‑ ‑
Transfers to Level 3 ‑ ‑ ‑ ‑ ‑ ‑ ‑ ‑ ‑
Transfers from Level 3 ‑ ‑ ‑ ‑ ‑ ‑ ‑ ‑ ‑
CLOSING BALANCE (31/12/2020) ‑ ‑ ‑ 32 ‑ ‑ ‑ ‑ ‑

Consolidated financial statements of Credit Agricole S.A. 31 December 2020
22
3
(in millions of euros)
Financial assets at fair value through other comprehensive income
Hedging
derivative
instruments
Equity instruments at fair value through other
comprehensive income that will not be reclassified
to profit or loss
Debt instruments at fair value through other comprehensive income that may be reclassified to profit
or loss
Loans and
receivables due
from credit
institutions
Loans and
receivables due from
customers
Debt Securities
Equities and other
variable income securities
Non-consolidated
equity investments
Treasury bills and
similar securities
Bonds and other
fixed income
securities
Debt
securities
Closing balance (31/12/2019) 35 231 ‑ ‑ ‑ 20 20 ‑
Gains or losses during the period ¹ (2) (17) ‑ ‑ 21 54 75 ‑
Recognised in profit or loss ‑ ‑ ‑ ‑ 21 54 75 ‑
Recognised in other comprehensive income (2) (17) ‑ ‑ ‑ ‑ ‑ ‑
Purchases 7 (10) ‑ ‑ (21) (54) (75) ‑
Sales ‑ (9) ‑ ‑ ‑ ‑ ‑ ‑
Issues ‑ ‑ ‑ ‑ ‑ ‑ ‑ ‑
Settlements ‑ ‑ ‑ ‑ ‑ (20) (20) ‑
Reclassifications ‑ ‑ ‑ ‑ ‑ ‑ ‑ ‑
Changes associated with scope during the period ‑ ‑ ‑ ‑ ‑ ‑ ‑ ‑
Transfers ‑ ‑ ‑ ‑ ‑ ‑ ‑ ‑
Transfers to Level 3 ‑ ‑ ‑ ‑ ‑ ‑ ‑ ‑
Transfers from Level 3 ‑ ‑ ‑ ‑ ‑ ‑ ‑ ‑
CLOSING BALANCE (31/12/2020) 40 195 ‑ ‑ ‑ ‑ ‑ ‑

Consolidated financial statements of Credit Agricole S.A. 31 December 2020
224
1 This balance includes the gains and losses of the period made on assets reported on the balance sheet at the closing
date, for the following amounts:
Gains/ losses for the period from level 3 assets held at the end of the period (779)
Recognised in profit or loss (762)
Recognised in other comprehensive income (17)
Financial liabilities measured at fair value according to Level 3
Total
Held for trading financial liabilities Financial
liabilities
designated at
fair value
through profit or
loss
Hedging
derivative
instruments (in millions of euros)
Securities
sold short
Securities
sold under
repurchase
agreements
Debt
securities
Due to credit
institutions
Due to
customers
Derivative
Instruments
Closing balance (31/12/2019) 9,413 ‑ 920 ‑ ‑ ‑ 666 7,514 313
Gains or losses during the period ¹ (381) ‑ (104) ‑ ‑ ‑ 185 (432) (30)
Recognised in profit or loss (378) ‑ (104) ‑ ‑ ‑ 188 (432) (30)
Recognised in other
comprehensive income (3) ‑ ‑ ‑ ‑ ‑ (3) ‑ ‑
Purchases 273 ‑ 129 ‑ ‑ ‑ 143 1 ‑
Sales (191) ‑ ‑ ‑ ‑ ‑ (6) (185) ‑
Issues 1,868 ‑ ‑ ‑ ‑ ‑ ‑ 1,509 359
Settlements (3,277) ‑ ‑ ‑ ‑ ‑ (77) (3,169) (31)
Reclassifications ‑ ‑ ‑ ‑ ‑ ‑ ‑ ‑ ‑
Changes associated with scope
during the period ‑ ‑ ‑ ‑ ‑ ‑ ‑ ‑ ‑
Transfers 508 ‑ (208) ‑ ‑ ‑ 244 472 ‑
Transfers to Level 3 1,136 ‑ 225 ‑ ‑ ‑ 261 650 ‑
Transfers from Level 3 (628) ‑ (433) ‑ ‑ ‑ (17) (178) ‑
CLOSING BALANCE (31/12/2020) 8,213 ‑ 737 ‑ ‑ ‑ 1,155 5,710 611
1 This balance includes the gains and losses of the period made on liabilities reported on the balance sheet at the
closing date, for the following amounts:
Gains/ losses for the period from level 3 assets held at the end of the period (348)
Recognised in profit or loss (348)
Recognised in other comprehensive income ‑
Gains and losses recognised in profit or loss relating to financial instruments held for trading and designated at fair
value through profit or loss and derivative instruments are recognised in “Net gains (losses) on financial instruments at
fair value through profit or loss”; gains and losses recognised in profit or loss relating to financial assets at fair value
through equity are recognised in “Net gains (losses) on financial instruments at fair value through profit or loss through
other comprehensive income”.

Consolidated financial statements of Credit Agricole S.A. 31 December 2020
225
SENSITIVITY ANALYSIS FOR FINANCIAL INSTRUMENTS MEASURED USING THE LEVEL 3 VALUATION MODEL
The use of unobservable inputs introduces uncertainty, which we have assessed below using a sensitivity calculation on
instruments valued using these inputs.
SCOPE OF INTEREST RATE DERIVATIVES
As regards interest rate derivatives, two key inputs are considered to be unobservable and of such a type that they result
in the classification of the associated products in Level 3: correlation and prepayment rates (i.e. early redemption).
Correlation
Many products are sensitive to a correlation parameter. However, this parameter is not unique and there are many
different types of correlation, including:
forward correlation between two successive indices in the same currency, e.g.: 2-year CMS/10-year CMS;
interest rate/interest rate correlation (different indices), e.g. Libor 3M USD/Libor 3M EUR;
interest rate/FX correlation (or Quanto), e.g. USD/JPY – USD;
equity/equity correlation;
equity/FX correlation;
equity/interest rate correlation;
FX/FX correlation.
Prepayment rate
The prepayment rate is the rate of early repayment on securitisation portfolios, whether voluntary or involuntary (default).
Exposure to this risk factor may stem from two types of source: direct exposure to these asset classes, or certain
“securitisation” swaps, i.e. where the variations in their nominal amounts are adjusted automatically to the nominal amount
of the underlying portfolio, with no mark-to-market payment. The prepayment rate plays a significant part in their valuation.
CALCULATION OF IMPACT
WITH RESPECT TO CORRELATION
The results presented below have been obtained by applying the following distinct risk shocks:
correlations between successive indices in the same currency (i.e. CMS correlations);
cross assets correlations (e.g.: Equity/FX or IR/ Equity) and between two interest-rate curves in different currencies.
The result of the stress test is the sum of the absolute values obtained. For each type of correlation we considered absolute
values by currency, maturity and portfolio, thus making a conservative assumption. For the CMS correlations, we
considered the various underlyings independently (e.g. 1y10y, 2y10y).
As at 31 December 2019, the sensitivity to the parameters used in interest rate derivative models was therefore +/-
€12 million.
The quantity expressed is a sensitivity for a normalised market variation assumption that is not intended to measure the
impact of extreme variations.
WITH RESPECT TO THE PREPAYMENT RATE
Direct exposure to assets comprising a pre-payment risk concerns securitisations such as RMBS and CLO and mezzanine
CDO tranches. These exposures are marginal. They can be taken into account through sensitivity to a 1 bp change in
credit spreads. This sensitivity being very low (<€50 thousand/bp), exposure to pre-payment rate is thus considered to be
negligible.

Consolidated financial statements of Credit Agricole S.A. 31 December 2020
226
The pre-payment rate is not an observable market parameter and the valuation model used for the securitisation swaps
is particularly conservative. The valuation used is defined as the lower of the valuation obtained using a very fast pre-
payment rate and using a very slow pre-payment rate. A “normal” variation in the pre-payment rate will therefore have
no material impact on M-to-M, no Day One thus being used for these products.
11.3 Estimated impact of inclusion of the margin at inception
(in millions of euros) 31/12/2020 31/12/2019
Deferred margin at 1st January 66 61
Margin generated by new transactions during the period 40 36
Recognised in net income during the period ‑ ‑
Amortisation and cancelled / reimbursed / matured transactions (28) (24)
Effects of inputs or products reclassified as observable during the period ‑ (7)
Other movements ¹ 80
DEFERRED MARGIN AT THE END OF THE PERIOD 158 66
¹ The amount of €80 million recorded in Other movements is linked to the revision of the historical method for calculating
Day One on the non-linear scope during fiscal year 2020.
The first day margin on market transactions falling within Level 3 of fair value is reserved for the balance sheet and
recognised in profit or loss as time passes or when unobservable parameters become observable again.

Consolidated financial statements of Credit Agricole S.A. 31 December 2020
227
NOTE 12 Scope of consolidation at 31 December 2020
12.1 Information on subsidiaries
12.1.1 RESTRICTIONS ON ENTITIES
Regulatory, legal or contractual provisions may limit Crédit Agricole S.A.’s ability to have free access to the assets of its
subsidiaries and to settle the Group’s liabilities.
Crédit Agricole S.A. has the following restrictions:
Regulatory constraints
The subsidiaries of Crédit Agricole S.A. are subject to prudential regulation and regulatory capital requirements in their
host countries. The minimum equity capital (solvency ratio), leverage ratio and liquidity ratio requirements limit the
capacity of these entities to pay dividends or to transfer assets to Crédit Agricole S.A. Group.
Legal constraints
The subsidiaries of Crédit Agricole S.A. are subject to legal provisions concerning the distribution of capital and
distributable earnings. These requirements limit the ability of the subsidiaries to distribute dividends. In the majority of
cases, these are less restrictive than the regulatory limitations mentioned above.
Contractual constraints
Constraints related to guarantees: Crédit Agricole S.A. encumbers certain financial assets to raise funds through
securitisation or refinancing with central banks. Once pledged as guarantees, the assets can no longer be used by
Crédit Agricole S.A. This mechanism is described in Note 9 “Commitments given and received and other guarantees”.
Restriction on assets backing unit-linked contracts for the Insurance business
Assets backing unit-linked contracts of Crédit Agricole S.A. are held for the benefit of policyholders. Assets of the
insurance subsidiaries of Crédit Agricole S.A. Group are mainly held for satisfying their obligation towards their
policyholders. Assets transfers to other entities are possible following the legal conditions. However, in case of a transfer,
a part of the profit due to the transfer must be intended for the policyholders.
Other constraints
Crédit Agricole CIB Algérie must subject its dividend distribution to the prior approval of its regulatory authority (Bank
of Algeria).
The dividend payment of CA Égypte is subject to the prior approval of the local regulator.
12.1.2 SUPPORT FOR STRUCTURED ENTITIES UNDER GROUP CONTROL
Crédit Agricole CIB has contractual arrangements with some consolidated structured entities that equate to
commitments to provide financial support.
To meet its funding needs, Crédit Agricole CIB uses structured debt issuance vehicles to raise cash on financial markets.
Securities issued by these entities are fully underwritten by Crédit Agricole CIB.
At 31 December 2020, the outstanding volume of these issues was €7 billion.
As part of its third-party securitisation business, Crédit Agricole CIB provides liquidity lines to its ABCP conduits for which
outstanding issues amount to €23 billion. At 31 December 2020, these liquidity lines totalled €35 billion.
Crédit Agricole S.A. provided no other financial support for any structured entities consolidated at 31 December 2020
and 31 December 2019.
12.1.3 SECURITISATION TRANSACTIONS AND DEDICATED FUNDS
Various Group entities conduct securitisation operations on their own account as part of collateralised refinancing
transactions. Depending on the circumstances, these transactions can be wholly or partially placed with investors, sold
under repurchase agreements or kept on the issuer’s balance sheet as liquid securities reserves that can be used to
manage refinancing.
Following the IFRS 9 decision tree, these transactions are considered to form part of deconsolidating or non-
deconsolidating transactions: for non-deconsolidating transactions, the assets are retained on the consolidated
balance sheet of Crédit Agricole S.A.
Consolidated financial statements of Credit Agricole S.A. 31 December 2020
228
For more details on these securitisation transactions and on the indication of the carrying amount of the assets
concerned and associated liabilities, see Note 6.6 “Transferred assets not derecognised or derecognised
with on‑ going involvement”.

Consolidated financial statements of Credit Agricole S.A. 31 December 2020
229
12.2 Composition of the scope
Crédit Agricole S.A. Group
Scope of consolidation
Consolidation
method
Scope changes
(a)
Principal place
of business
Country of
incorporation
if different from the
principal place of
business
Nature of control
(b)
% control % interest
12/31/2020 12/31/2019 12/31/2020 12/31/2019
SAVINGS MANAGEMENT
Banking and financial institutions
ABC-CA Fund Management CO Equity
Accounted China Associate 33.3 33.3 22.7 22.8
AMUNDI Full France Subsidiary 68.3 68.6 68.1 68.4
AMUNDI (UK) Ltd. Full United Kingdom Subsidiary 100.0 100.0 68.1 68.4
AMUNDI ASSET MANAGEMENT Full France Subsidiary 100.0 100.0 68.1 68.4
AMUNDI ASSET MANAGEMENT AGENCIA
EN CHILE Full Chile Branch 100.0 100.0 68.4 68.4
AMUNDI ASSET MANAGEMENT BELGIUM Full Belgium Branch 100.0 100.0 68.4 68.4
AMUNDI ASSET MANAGEMENT DUBAI (OFF
SHORE) BRANCH Full United Arab
Emirates Branch 100.0 100.0 68.4 68.4
AMUNDI ASSET MANAGEMENT HONG
KONG BRANCH Full Hong Kong Branch 100.0 100.0 68.4 68.4
AMUNDI ASSET MANAGEMENT LONDON
BRANCH Full United Kingdom Branch 100.0 100.0 68.1 68.4
AMUNDI ASSET MANAGEMENT MEXICO
BRANCH Full Mexico Branch 100.0 100.0 68.4 68.4
AMUNDI ASSET MANAGEMENT NEDERLAND Full Netherlands Branch 100.0 100.0 68.4 68.4
Amundi Asset Management S.A.I SA Full Romania Subsidiary 100.0 100.0 68.1 68.4
Amundi Austria GmbH Full Austria Subsidiary 100.0 100.0 68.1 68.4
Amundi BOC Wealth Management Co.
Ltd Full E2 France Subsidiary 55.0 37.5
Amundi Czech Republic Asset
Management Bratislava Branch Full Slovakia Branch 100.0 100.0 68.4 68.4
Amundi Czech Republic Asset
Management Sofia Branch Full Bulgaria Branch 100.0 100.0 68.4 68.4
Amundi Czech Republic Asset
Management, A.S. Full Czech Republic Subsidiary 100.0 100.0 68.1 68.4
Amundi Czech Republic, Investicni
Spolecnost, A.S. Full Czech Republic Subsidiary 100.0 100.0 68.1 68.4
Amundi Deutschland GmbH Full Germany Subsidiary 100.0 100.0 68.1 68.4
AMUNDI Finance Full France Subsidiary 100.0 100.0 68.1 68.4
AMUNDI Finance Emissions Full France Subsidiary 100.0 100.0 68.1 68.4
AMUNDI GLOBAL SERVICING Full Luxembourg Subsidiary 100.0 100.0 68.1 68.4
AMUNDI Hellas MFMC S.A. Full Greece Subsidiary 100.0 100.0 68.1 68.4
AMUNDI Hong Kong Ltd. Full Hong Kong Subsidiary 100.0 100.0 68.1 68.4
AMUNDI Iberia S.G.I.I.C S.A. Full Spain Subsidiary 100.0 100.0 68.1 68.4
AMUNDI Immobilier Full France Subsidiary 100.0 100.0 68.1 68.4
AMUNDI India Holding Full France Subsidiary 100.0 100.0 68.1 68.4
AMUNDI Intermédiation Full France Subsidiary 100.0 100.0 68.1 68.4
Amundi Intermédiation Asia PTE Ltd Full Singapore Subsidiary 100.0 100.0 68.1 68.4
Amundi Intermédiation Dublin Branch Full Ireland Branch 100.0 100.0 68.1 68.4
Amundi Intermédiation London Branch Full United Kingdom Branch 100.0 100.0 68.1 68.4
Amundi Investment Fund Management
Private Limited Company Full Hungary Subsidiary 100.0 100.0 68.1 68.4
Amundi Ireland Ltd Full Ireland Subsidiary 100.0 100.0 68.1 68.4
AMUNDI Issuance Full France Subsidiary 100.0 100.0 68.1 68.4
AMUNDI Japan Full Japan Subsidiary 100.0 100.0 68.1 68.4
AMUNDI Japan Holding Full S4 Japan Subsidiary 100.0 68.4
Amundi Luxembourg SA Full Luxembourg Subsidiary 100.0 100.0 68.1 68.4
AMUNDI Malaysia Sdn Bhd Full Malaysia Subsidiary 100.0 100.0 68.1 68.4

Consolidated financial statements of Credit Agricole S.A. 31 December 2020
230
Crédit Agricole S.A. Group
Scope of consolidation
Consolidation
method
Scope changes
(a)
Principal place
of business
Country of
incorporation
if different from the
principal place of
business
Nature of control
(b)
% control % interest
12/31/2020 12/31/2019 12/31/2020 12/31/2019
Amundi Pioneer Asset Management Inc Full United States Subsidiary 100.0 100.0 68.1 68.4
Amundi Pioneer Asset Management USA
Inc Full United States Subsidiary 100.0 100.0 68.1 68.4
Amundi Pioneer Distributor Inc Full United States Subsidiary 100.0 100.0 68.1 68.4
Amundi Pioneer Institutional Asset
Management Inc Full United States Subsidiary 100.0 100.0 68.1 68.4
AMUNDI Polska Full Poland Subsidiary 100.0 100.0 68.1 68.4
AMUNDI Private Equity Funds Full France Subsidiary 100.0 100.0 68.1 68.4
AMUNDI Real Estate Italia SGR S.p.A. Full Italy Subsidiary 100.0 100.0 68.1 68.4
AMUNDI SGR S.p.A. Full Italy Subsidiary 100.0 100.0 68.1 68.4
AMUNDI Singapore Ltd. Full Singapore Subsidiary 100.0 100.0 68.1 68.4
AMUNDI Suisse Full Switzerland Subsidiary 100.0 100.0 68.1 68.4
Amundi Taïwan Limited Full Taiwan Subsidiary 100.0 100.0 68.1 68.4
AMUNDI Tenue de Comptes Full France Subsidiary 100.0 100.0 68.1 68.4
AMUNDI USA Inc Full United States Subsidiary 100.0 100.0 68.1 68.4
AMUNDI Ventures Full France Subsidiary 100.0 100.0 68.1 68.4
BFT INVESTMENT MANAGERS Full France Subsidiary 100.0 100.0 68.1 68.4
CA Indosuez (Switzerland) S.A. Hong Kong
Branch Full France Switzerland Branch 100.0 100.0 97.8 97.8
CA Indosuez (Suisse) S.A. Singapore
Branch Full Singapore Switzerland Branch 100.0 100.0 97.8 97.8
CA Indosuez (Suisse) S.A. Switzerland
Branch Full Switzerland Branch 100.0 100.0 97.8 97.8
CA Indosuez (Switzerland) S.A. Full Switzerland Subsidiary 100.0 100.0 97.8 97.8
CA Indosuez Finanziaria S.A. Full Switzerland Subsidiary 100.0 100.0 97.8 97.8
CA Indosuez Gestion Full France Subsidiary 100.0 100.0 97.8 97.8
CA Indosuez Wealth (Brazil) S.A. DTVM Full D4 Brazil Subsidiary 100.0 100.0 97.8 97.8
CA Indosuez Wealth (Europe) Full Luxembourg Subsidiary 100.0 100.0 97.8 97.8
CA Indosuez Wealth (Europe) Belgium
Branch Full Belgium Luxembourg Branch 100.0 100.0 97.8 97.8
CA Indosuez Wealth (Europe) Spain
Branch Full Spain Luxembourg Branch 100.0 100.0 97.8 97.8
CA Indosuez Wealth (France) Full France Subsidiary 100.0 100.0 97.8 97.8
CA Indosuez Wealth (Group) Full France Subsidiary 100.0 100.0 97.8 97.8
CA Indosuez Wealth Italy S.P.A. Full Italy Subsidiary 100.0 100.0 97.8 97.8
CA Luxembourg (succursale Italie) Full S2 France Luxembourg Branch 100.0 97.8
CFM Indosuez Conseil en Investissement Full France Subsidiary 70.2 70.2 67.5 67.5
CFM Indosuez Conseil en Investissement,
Succursale de Noumea Full France Branch 70.2 70.2 69.0 67.5
CFM Indosuez Gestion Full Monaco Subsidiary 70.2 70.2 66.6 66.1
CFM Indosuez Wealth Full Monaco Subsidiary 70.2 70.2 67.5 67.5
CPR AM Full France Subsidiary 100.0 100.0 68.1 68.4
Etoile Gestion Full France Subsidiary 100.0 100.0 68.1 68.4
Fund Channel Full D2 Luxembourg Subsidiary 100.0 50.0 68.1 34.3
Fund Channel Singapore Branch Full D2 Singapore Luxembourg Subsidiary 50.0 50.0 34.2 34.2
KBI Fund Managers Limited Full Ireland Subsidiary 87.5 87.5 68.1 68.4
KBI Global Investors (North America)
Limited Full Ireland Subsidiary 87.5 87.5 68.1 68.4
KBI Global Investors Limited Full Ireland Subsidiary 87.5 87.5 68.1 68.4
LCL Emissions Full France Subsidiary 100.0 100.0 68.1 68.4
NH-AMUNDI ASSET MANAGEMENT Equity
Accounted South Korea Associate 30.0 30.0 20.4 20.5

Consolidated financial statements of Credit Agricole S.A. 31 December 2020
231
Crédit Agricole S.A. Group
Scope of consolidation
Consolidation
method
Scope changes
(a)
Principal place
of business
Country of
incorporation
if different from the
principal place of
business
Nature of control
(b)
% control % interest
12/31/2020 12/31/2019 12/31/2020 12/31/2019
Pioneer Global Investments LTD Buenos
Aires Branch Full S1 Argentina Branch 100.0 68.4
Pioneer Global Investments LTD Mexico
city Branch Full Mexico Branch 100.0 100.0 68.4 68.4
Sabadell Asset Management, S.A.,
S.G.I.I.C. Full E3 France Subsidiary 100.0 68.1
Société Générale Gestion (S2G) Full France Subsidiary 100.0 100.0 68.1 68.4
SAS DEFENSE CB3 Equity
Accounted E1 France Joint venture 25.0 25.0
Investment companies
State Bank of India Fund Management Equity
Accounted India Associate 37.0 37.0 25.2 25.3
Vanderbilt Capital Advisors LLC Full United States Subsidiary 100.0 100.0 68.1 68.4
WAFA Gestion Equity
Accounted Morocco Associate 34.0 34.0 23.2 23.3
Insurance
ASSUR&ME Full France Consolidated
structured entity 100.0 100.0 100.0 100.0
CA Assicurazioni Full Italy Subsidiary 100.0 100.0 100.0 100.0
CACI DANNI ¹ Full France Ireland Branch 100.0 100.0 100.0 100.0
CACI LIFE LIMITED Full Ireland Subsidiary 100.0 100.0 100.0 100.0
CACI NON LIFE LIMITED Full Ireland Subsidiary 100.0 100.0 100.0 100.0
CACI NON VIE ¹ Full France Ireland Branch 100.0 100.0 100.0 100.0
CACI Reinsurance Ltd. Full Ireland Subsidiary 100.0 100.0 100.0 100.0
CACI VIE ¹ Full France Ireland Branch 100.0 100.0 100.0 100.0
CACI VITA ¹ Full France Ireland Branch 100.0 100.0 100.0 100.0
CALIE Europe Succursale France ¹ Full France Luxembourg Branch 100.0 100.0 100.0 100.0
CALIE Europe Succursale Pologne ¹ Full France Luxembourg Branch 100.0 100.0 100.0 100.0
Crédit Agricole Assurances (CAA) Full France Subsidiary 100.0 100.0 100.0 100.0
Crédit Agricole Creditor Insurance (CACI) Full France Subsidiary 100.0 100.0 100.0 100.0
Crédit Agricole Life Full Greece Subsidiary 100.0 100.0 100.0 100.0
Crédit Agricole Life Insurance Company
Japan Ltd. Full Japan Subsidiary 100.0 100.0 100.0 100.0
Crédit Agricole Life Insurance Europe Full Luxembourg Subsidiary 100.0 100.0 99.9 99.9
Crédit Agricole Vita S.p.A. Full Italy Subsidiary 100.0 100.0 100.0 100.0
Finaref Risques Divers Full France Subsidiary 100.0 100.0 100.0 100.0
Finaref Vie Full S5 France Subsidiary 100.0 100.0
GNB SEGUROS Full Portugal Subsidiary 100.0 75.0 100.0 75.0
Médicale de France Full France Subsidiary 100.0 100.0 100.0 100.0
Pacifica Full France Subsidiary 100.0 100.0 100.0 100.0
Predica Full France Subsidiary 100.0 100.0 100.0 100.0
Predica - Prévoyance Dialogue du Crédit
Agricole ¹ Full France Branch 100.0 100.0 100.0 100.0
Space Holding (Ireland) Limited Full Ireland Subsidiary 100.0 100.0 100.0 100.0
Space Lux Full Luxembourg Subsidiary 100.0 100.0 100.0 100.0
Spirica Full France Subsidiary 100.0 100.0 100.0 100.0
UCITS
37785 QXEURC ¹ Full E2 France Consolidated
structured entity 93.4 93.4
ACAJOU Full France Consolidated
structured entity 100.0 100.0 68.4 68.4
AGRICOLE RIVAGE DETTE ¹ Full France Consolidated
structured entity 100.0 100.0 100.0 100.0
AIJPMGBIGOAHE Full E1 Luxembourg Consolidated
structured entity 82.3 82.3
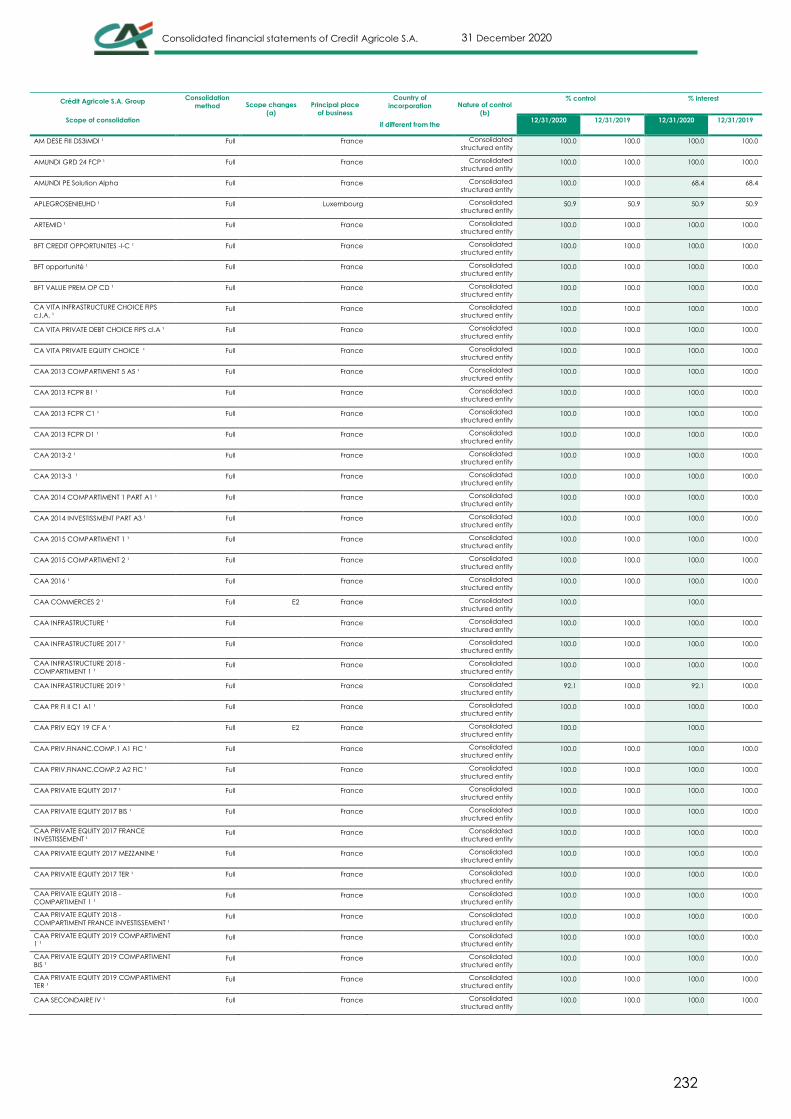
Consolidated financial statements of Credit Agricole S.A. 31 December 2020
232
Crédit Agricole S.A. Group
Scope of consolidation
Consolidation
method
Scope changes
(a)
Principal place
of business
Country of
incorporation
if different from the
principal place of
business
Nature of control
(b)
% control % interest
12/31/2020 12/31/2019 12/31/2020 12/31/2019
AM DESE FIII DS3IMDI ¹ Full France Consolidated
structured entity 100.0 100.0 100.0 100.0
AMUNDI GRD 24 FCP ¹ Full France Consolidated
structured entity 100.0 100.0 100.0 100.0
AMUNDI PE Solution Alpha Full France Consolidated
structured entity 100.0 100.0 68.4 68.4
APLEGROSENIEUHD ¹ Full Luxembourg Consolidated
structured entity 50.9 50.9 50.9 50.9
ARTEMID ¹ Full France Consolidated
structured entity 100.0 100.0 100.0 100.0
BFT CREDIT OPPORTUNITES -I-C ¹ Full France Consolidated
structured entity 100.0 100.0 100.0 100.0
BFT opportunité ¹ Full France Consolidated
structured entity 100.0 100.0 100.0 100.0
BFT VALUE PREM OP CD ¹ Full France Consolidated
structured entity 100.0 100.0 100.0 100.0
CA VITA INFRASTRUCTURE CHOICE FIPS
c.I.A. ¹ Full France Consolidated
structured entity 100.0 100.0 100.0 100.0
CA VITA PRIVATE DEBT CHOICE FIPS cl.A ¹ Full France Consolidated
structured entity 100.0 100.0 100.0 100.0
CA VITA PRIVATE EQUITY CHOICE ¹ Full France Consolidated
structured entity 100.0 100.0 100.0 100.0
CAA 2013 COMPARTIMENT 5 A5 ¹ Full France Consolidated
structured entity 100.0 100.0 100.0 100.0
CAA 2013 FCPR B1 ¹ Full France Consolidated
structured entity 100.0 100.0 100.0 100.0
CAA 2013 FCPR C1 ¹ Full France Consolidated
structured entity 100.0 100.0 100.0 100.0
CAA 2013 FCPR D1 ¹ Full France Consolidated
structured entity 100.0 100.0 100.0 100.0
CAA 2013-2 ¹ Full France Consolidated
structured entity 100.0 100.0 100.0 100.0
CAA 2013-3 ¹ Full France Consolidated
structured entity 100.0 100.0 100.0 100.0
CAA 2014 COMPARTIMENT 1 PART A1 ¹ Full France Consolidated
structured entity 100.0 100.0 100.0 100.0
CAA 2014 INVESTISSMENT PART A3 ¹ Full France Consolidated
structured entity 100.0 100.0 100.0 100.0
CAA 2015 COMPARTIMENT 1 ¹ Full France Consolidated
structured entity 100.0 100.0 100.0 100.0
CAA 2015 COMPARTIMENT 2 ¹ Full France Consolidated
structured entity 100.0 100.0 100.0 100.0
CAA 2016 ¹ Full France Consolidated
structured entity 100.0 100.0 100.0 100.0
CAA COMMERCES 2 ¹ Full E2 France Consolidated
structured entity 100.0 100.0
CAA INFRASTRUCTURE ¹ Full France Consolidated
structured entity 100.0 100.0 100.0 100.0
CAA INFRASTRUCTURE 2017 ¹ Full France Consolidated
structured entity 100.0 100.0 100.0 100.0
CAA INFRASTRUCTURE 2018 -
COMPARTIMENT 1 ¹ Full France Consolidated
structured entity 100.0 100.0 100.0 100.0
CAA INFRASTRUCTURE 2019 ¹ Full France Consolidated
structured entity 92.1 100.0 92.1 100.0
CAA PR FI II C1 A1 ¹ Full France Consolidated
structured entity 100.0 100.0 100.0 100.0
CAA PRIV EQY 19 CF A ¹ Full E2 France Consolidated
structured entity 100.0 100.0
CAA PRIV.FINANC.COMP.1 A1 FIC ¹ Full France Consolidated
structured entity 100.0 100.0 100.0 100.0
CAA PRIV.FINANC.COMP.2 A2 FIC ¹ Full France Consolidated
structured entity 100.0 100.0 100.0 100.0
CAA PRIVATE EQUITY 2017 ¹ Full France Consolidated
structured entity 100.0 100.0 100.0 100.0
CAA PRIVATE EQUITY 2017 BIS ¹ Full France Consolidated
structured entity 100.0 100.0 100.0 100.0
CAA PRIVATE EQUITY 2017 FRANCE
INVESTISSEMENT ¹ Full France Consolidated
structured entity 100.0 100.0 100.0 100.0
CAA PRIVATE EQUITY 2017 MEZZANINE ¹ Full France Consolidated
structured entity 100.0 100.0 100.0 100.0
CAA PRIVATE EQUITY 2017 TER ¹ Full France Consolidated
structured entity 100.0 100.0 100.0 100.0
CAA PRIVATE EQUITY 2018 -
COMPARTIMENT 1 ¹ Full France Consolidated
structured entity 100.0 100.0 100.0 100.0
CAA PRIVATE EQUITY 2018 -
COMPARTIMENT FRANCE INVESTISSEMENT ¹ Full France Consolidated
structured entity 100.0 100.0 100.0 100.0
CAA PRIVATE EQUITY 2019 COMPARTIMENT
1 ¹ Full France Consolidated
structured entity 100.0 100.0 100.0 100.0
CAA PRIVATE EQUITY 2019 COMPARTIMENT
BIS ¹ Full France Consolidated
structured entity 100.0 100.0 100.0 100.0
CAA PRIVATE EQUITY 2019 COMPARTIMENT
TER ¹ Full France Consolidated
structured entity 100.0 100.0 100.0 100.0
CAA SECONDAIRE IV ¹ Full France Consolidated
structured entity 100.0 100.0 100.0 100.0

Consolidated financial statements of Credit Agricole S.A. 31 December 2020
233
Crédit Agricole S.A. Group
Scope of consolidation
Consolidation
method
Scope changes
(a)
Principal place
of business
Country of
incorporation
if different from the
principal place of
business
Nature of control
(b)
% control % interest
12/31/2020 12/31/2019 12/31/2020 12/31/2019
CAREPTA R 2016 ¹ Full France Consolidated
structured entity 100.0 100.0 100.0 100.0
CEDAR Full France Consolidated
structured entity 100.0 100.0 68.4 68.4
Chorial Allocation Full France Consolidated
structured entity 99.7 99.7 68.2 68.2
CNP ACP 10 FCP ¹ Full France Consolidated
structured entity 100.0 100.0 100.0 100.0
COMPARTIMENT DS3 - IMMOBILIER
VAUGIRARD ¹ Full France Consolidated
structured entity 100.0 100.0 100.0 100.0
COMPARTIMENT DS3 - VAUGIRARD ¹ Full France Consolidated
structured entity 100.0 100.0 100.0 100.0
CORSAIR 1.52% 25/10/38 ¹ Full Luxembourg Consolidated
structured entity 100.0 100.0 100.0 100.0
CORSAIR 1.5255% 25/04/35 ¹ Full Ireland Consolidated
structured entity 100.0 100.0 100.0 100.0
CORSAIRE FINANCE IRELAND 0.83% 25-10-
38 ¹ Full Ireland Consolidated
structured entity 100.0 100.0 100.0 100.0
CORSAIRE FINANCE IRELAND 1.24 % 25-10-
38 ¹ Full Ireland Consolidated
structured entity 100.0 100.0 100.0 100.0
CORSAIRE FINANCE IRELANDE 0.7% 25-10-
38 ¹ Full Ireland Consolidated
structured entity 100.0 100.0 100.0 100.0
EFFITHERMIE FPCI ¹ Full France Consolidated
structured entity 100.0 100.0 100.0 100.0
FCPR CAA 2013 ¹ Full France Consolidated
structured entity 100.0 100.0 100.0 100.0
FCPR CAA COMP TER PART A3 ¹ Full France Consolidated
structured entity 100.0 100.0 100.0 100.0
FCPR CAA COMPART BIS PART A2 ¹ Full France Consolidated
structured entity 100.0 100.0 100.0 100.0
FCPR CAA COMPARTIMENT 1 PART A1 ¹ Full France Consolidated
structured entity 100.0 100.0 100.0 100.0
FCPR CAA France croissance 2 A ¹ Full France Consolidated
structured entity 100.0 100.0 100.0 100.0
FCPR PREDICA 2007 A ¹ Full France Consolidated
structured entity 100.0 100.0 100.0 100.0
FCPR PREDICA 2007 C2 ¹ Full France Consolidated
structured entity 100.0 100.0 100.0 100.0
FCPR PREDICA 2008 A1 ¹ Full France Consolidated
structured entity 100.0 100.0 100.0 100.0
FCPR PREDICA 2008 A2 ¹ Full France Consolidated
structured entity 100.0 100.0 100.0 100.0
FCPR PREDICA 2008 A3 ¹ Full France Consolidated
structured entity 100.0 100.0 100.0 100.0
FCPR PREDICA SECONDAIRE I A1 ¹ Full France Consolidated
structured entity 100.0 100.0 100.0 100.0
FCPR PREDICA SECONDAIRE I A2 ¹ Full France Consolidated
structured entity 100.0 100.0 100.0 100.0
FCPR PREDICA SECONDAIRES II A ¹ Full France Consolidated
structured entity 100.0 100.0 100.0 100.0
FCPR PREDICA SECONDAIRES II B ¹ Full France Consolidated
structured entity 100.0 100.0 100.0 100.0
FCPR UI CAP AGRO ¹ Full France Consolidated
structured entity 100.0 100.0 100.0 100.0
FCPR UI CAP SANTE A ¹ Full France Consolidated
structured entity 99.8 100.0 99.8 100.0
FCT BRIDGE 2016-1 ¹ Full France Consolidated
structured entity 100.0 100.0 100.0 100.0
FCT CAA COMPARTIMENT CESSION DES
CREANCES LCL Full E2 France Consolidated
structured entity 100.0 100.0
FCT CAA – Compartment 2017-1 ¹ Full France Consolidated
structured entity 100.0 100.0 100.0 100.0
FCT CAREPTA - COMPARTIMENT 2014-1 ¹ Full France Consolidated
structured entity 100.0 100.0 100.0 100.0
FCT CAREPTA - COMPARTIMENT 2014-2 ¹ Full France Consolidated
structured entity 100.0 100.0 100.0 100.0
FCT CAREPTA - COMPARTIMENT RE-2016-1 ¹ Full France Consolidated
structured entity 100.0 100.0 100.0 100.0
FCT CAREPTA - RE 2015 -1 ¹ Full France Consolidated
structured entity 100.0 100.0 100.0 100.0
FCT CAREPTA 2-2016 ¹ Full S1 France Consolidated
structured entity 100.0 100.0
FCT MID CAP 2 05/12/22 ¹ Full France Consolidated
structured entity 100.0 100.0 100.0 100.0
FDA 18 FCP 2 DEC ¹ Full S1 France Consolidated
structured entity 100.0 100.0
FDC A3 P ¹ Full France Consolidated
structured entity 100.0 100.0 100.0 100.0
FEDERIS CORE EU CR 19 MM ¹ Full France Consolidated
structured entity 43.7 43.7 43.7 43.7
Federval ¹ Full France Consolidated
structured entity 97.9 97.9 97.9 97.9
FPCI Cogeneration France I ¹ Full France Consolidated
structured entity 100.0 100.0 100.0 100.0

Consolidated financial statements of Credit Agricole S.A. 31 December 2020
234
Crédit Agricole S.A. Group
Scope of consolidation
Consolidation
method
Scope changes
(a)
Principal place
of business
Country of
incorporation
if different from the
principal place of
business
Nature of control
(b)
% control % interest
12/31/2020 12/31/2019 12/31/2020 12/31/2019
FR0010671958 PREDIQUANT A5 ¹ Full France Consolidated
structured entity 100.0 100.0 100.0 100.0
GRD 44 ¹ Full France Consolidated
structured entity 100.0 100.0 100.0 100.0
GRD 44 N°3 ¹ Full France Consolidated
structured entity 100.0 100.0 100.0 100.0
GRD 44 N2 ¹ Full France Consolidated
structured entity 100.0 100.0 100.0 100.0
GRD 44 N4 PART CD ¹ Full France Consolidated
structured entity 100.0 100.0 100.0 100.0
GRD 44 N5 ¹ Full France Consolidated
structured entity 100.0 100.0 100.0 100.0
GRD 54 ¹ Full France Consolidated
structured entity 100.0 100.0 100.0 100.0
GRD02 ¹ Full France Consolidated
structured entity 100.0 100.0 100.0 100.0
GRD03 ¹ Full France Consolidated
structured entity 100.0 100.0 100.0 100.0
GRD05 ¹ Full France Consolidated
structured entity 100.0 100.0 100.0 100.0
GRD07 ¹ Full France Consolidated
structured entity 100.0 100.0 100.0 100.0
GRD08 ¹ Full France Consolidated
structured entity 100.0 100.0 100.0 100.0
GRD09 ¹ Full France Consolidated
structured entity 100.0 100.0 100.0 100.0
GRD10 ¹ Full France Consolidated
structured entity 100.0 100.0 100.0 100.0
GRD11 ¹ Full France Consolidated
structured entity 100.0 100.0 100.0 100.0
GRD12 ¹ Full France Consolidated
structured entity 100.0 100.0 100.0 100.0
GRD13 ¹ Full France Consolidated
structured entity 100.0 100.0 100.0 100.0
GRD14 ¹ Full France Consolidated
structured entity 97.8 97.8 97.8 97.8
GRD17 ¹ Full France Consolidated
structured entity 100.0 100.0 100.0 100.0
GRD18 ¹ Full France Consolidated
structured entity 100.0 100.0 100.0 100.0
GRD19 ¹ Full France Consolidated
structured entity 100.0 100.0 100.0 100.0
GRD20 ¹ Full France Consolidated
structured entity 100.0 100.0 100.0 100.0
GRD21 ¹ Full France Consolidated
structured entity 100.0 100.0 100.0 100.0
IAA CROISSANCE INTERNATIONALE ¹ Full France Consolidated
structured entity 100.0 100.0 100.0 100.0
LF PRE ZCP 12 99 LIB ¹ Full France Consolidated
structured entity 100.0 100.0 100.0 100.0
Londres Croissance C16 Full France Consolidated
structured entity 100.0 100.0 68.4 68.4
LRP - CPT JANVIER 2013 0.30 13-21 11/01A ¹ Full Luxembourg Consolidated
structured entity 84.2 84.2 84.2 84.2
OBJECTIF LONG TERME FCP ¹ Full France Consolidated
structured entity 100.0 100.0 100.0 100.0
OPCI GHD SPPICAV PROFESSIONNELLE ¹ Full France Consolidated
structured entity 90.0 90.0 90.0 90.0
Peg - Portfolio Eonia Garanti Full France Consolidated
structured entity 97.2 97.2 66.5 66.5
Predica 2005 FCPR A ¹ Full France Consolidated
structured entity 100.0 100.0 100.0 100.0
Predica 2006 FCPR A ¹ Full France Consolidated
structured entity 100.0 100.0 100.0 100.0
Predica 2006-2007 FCPR ¹ Full France Consolidated
structured entity 100.0 100.0 100.0 100.0
PREDICA 2010 A1 ¹ Full France Consolidated
structured entity 100.0 100.0 100.0 100.0
PREDICA 2010 A2 ¹ Full France Consolidated
structured entity 100.0 100.0 100.0 100.0
PREDICA 2010 A3 ¹ Full France Consolidated
structured entity 100.0 100.0 100.0 100.0
PREDICA SECONDAIRES III ¹ Full France Consolidated
structured entity 100.0 100.0 100.0 100.0
Predicant A1 FCP ¹ Full France Consolidated
structured entity 100.0 100.0 100.0 100.0
Predicant A2 FCP ¹ Full France Consolidated
structured entity 100.0 100.0 100.0 100.0
Predicant A3 FCP ¹ Full France Consolidated
structured entity 100.0 100.0 100.0 100.0
Prediquant Eurocroissance A2 ¹ Full France Consolidated
structured entity 100.0 100.0 100.0 100.0
Prediquant opportunité ¹ Full France Consolidated
structured entity 100.0 100.0 100.0 100.0

Consolidated financial statements of Credit Agricole S.A. 31 December 2020
235
Crédit Agricole S.A. Group
Scope of consolidation
Consolidation
method
Scope changes
(a)
Principal place
of business
Country of
incorporation
if different from the
principal place of
business
Nature of control
(b)
% control % interest
12/31/2020 12/31/2019 12/31/2020 12/31/2019
PREDIQUANT PREMIUM ¹ Full France Consolidated
structured entity 100.0 100.0 100.0 100.0
PREMIUM GR 0% 28 ¹ Full Ireland Consolidated
structured entity 100.0 100.0 100.0 100.0
PREMIUM GREEN 0.508% 25-10-38 ¹ Full Ireland Consolidated
structured entity 100.0 100.0 100.0 100.0
PREMIUM GREEN 0.63% 25-10-38 ¹ Full Ireland Consolidated
structured entity 100.0 100.0 100.0 100.0
PREMIUM GREEN 1.24% 25/04/35 ¹ Full Ireland Consolidated
structured entity 100.0 100.0 100.0 100.0
PREMIUM GREEN 1.531% 25-04-35 ¹ Full Ireland Consolidated
structured entity 100.0 100.0 100.0 100.0
PREMIUM GREEN 1.55% 25-07-40 ¹ Full Ireland Consolidated
structured entity 100.0 100.0 100.0 100.0
PREMIUM GREEN 4.52%06-21 EMTN ¹ Full Ireland Consolidated
structured entity 100.0 100.0 100.0 100.0
PREMIUM GREEN 4.54%06-13.06.21 ¹ Full Ireland Consolidated
structured entity 100.0 100.0 100.0 100.0
PREMIUM GREEN 4.5575%21 EMTN ¹ Full Ireland Consolidated
structured entity 100.0 100.0 100.0 100.0
PREMIUM GREEN 4.56%06-21 ¹ Full Ireland Consolidated
structured entity 100.0 100.0 100.0 100.0
PREMIUM GREEN 4.7% EMTN 08/08/21 ¹ Full Ireland Consolidated
structured entity 100.0 100.0 100.0 100.0
PREMIUM GREEN 4.72%12-250927 ¹ Full Ireland Consolidated
structured entity 100.0 100.0 100.0 100.0
PREMIUM GREEN PLC 1.095% 25-10-38 ¹ Full Ireland Consolidated
structured entity 100.0 100.0 100.0 100.0
PREMIUM GREEN PLC 4.30%2021 ¹ Full Ireland Consolidated
structured entity 100.0 100.0 100.0 100.0
PREMIUM GREEN TV 06/22 ¹ Full Ireland Consolidated
structured entity 100.0 100.0 100.0 100.0
PREMIUM GREEN TV 07/22 ¹ Full Ireland Consolidated
structured entity 100.0 100.0 100.0 100.0
PREMIUM GREEN TV 07-22 ¹ Full Ireland Consolidated
structured entity 100.0 100.0 100.0 100.0
PREMIUM GREEN TV 22 ¹ Full Ireland Consolidated
structured entity 100.0 100.0 100.0 100.0
PREMIUM GREEN TV 26/07/22 ¹ Full Ireland Consolidated
structured entity 100.0 100.0 100.0 100.0
PREMIUM GREEN TV2027 ¹ Full Ireland Consolidated
structured entity 100.0 100.0 100.0 100.0
PREMIUM GREEN TV23/05/2022 EMTN ¹ Full Ireland Consolidated
structured entity 100.0 100.0 100.0 100.0
PREMIUM GREEN4.33%06-29/10/21 ¹ Full Ireland Consolidated
structured entity 100.0 100.0 100.0 100.0
PurpleProtAsset 1,36% 25/10/2038 ¹ Full Luxembourg Consolidated
structured entity 100.0 100.0 100.0 100.0
PurpleProtAsset 1.093% 20/10/2038 ¹ Full Luxembourg Consolidated
structured entity 100.0 100.0 100.0 100.0
RED CEDAR Full France Consolidated
structured entity 100.0 100.0 68.4 68.4
UI CAP SANTE 2 ¹ Full France Consolidated
structured entity 100.0 100.0 100.0 100.0
Unit-linked funds (Fonds UC)
58 fonds UC dont le taux de détention est
supérieur ou égal à 95% Full France Consolidated
structured entity > 95 % > 95 % > 95 % > 95 %
0057514 AUC ¹ Full Luxembourg Consolidated
structured entity 59.2 58.1 59.2 58.1
1827 A2EURC ¹ Full E2 Luxembourg Consolidated
structured entity 62.7 62.7
56055 A5 EUR ¹ Full E2 Luxembourg Consolidated
structured entity 99.5 99.5
5880 AEURC ¹ Full E2 Luxembourg Consolidated
structured entity 59.2 59.2
5884 AEURC ¹ Full E2 Luxembourg Consolidated
structured entity 46.8 46.8
5922 AEURHC ¹ Full Luxembourg Consolidated
structured entity 54.0 51.6 54.0 51.6
78752 AEURHC ¹ Full Luxembourg Consolidated
structured entity 41.1 40.2 41.1 40.2
A FD EQ E CON AE(C) ¹ Full Luxembourg Consolidated
structured entity 59.3 58.3 59.3 58.3
A FD EQ E FOC AE (C) ¹ Full Luxembourg Consolidated
structured entity 67.4 76.3 67.4 76.3
ACTICCIA VIE ¹ Full France Consolidated
structured entity 99.1 99.1 99.1 99.1
ACTICCIA VIE 3 ¹ Full France Consolidated
structured entity 99.3 99.4 99.3 99.4
ACTICCIA VIE 90 C ¹ Full France Consolidated
structured entity 100.0 100.0 100.0 100.0
ACTICCIA VIE 90 N2 ¹ Full France Consolidated
structured entity 100.0 100.0 100.0 100.0

Consolidated financial statements of Credit Agricole S.A. 31 December 2020
236
Crédit Agricole S.A. Group
Scope of consolidation
Consolidation
method
Scope changes
(a)
Principal place
of business
Country of
incorporation
if different from the
principal place of
business
Nature of control
(b)
% control % interest
12/31/2020 12/31/2019 12/31/2020 12/31/2019
ACTICCIA VIE 90 N3 C ¹ Full France Consolidated
structured entity 100.0 100.0 100.0 100.0
ACTICCIA VIE 90 N4 ¹ Full France Consolidated
structured entity 100.0 99.9 100.0 99.9
ACTICCIA VIE 90 N6 C ¹ Full France Consolidated
structured entity 100.0 99.9 100.0 99.9
ACTICCIA VIE N2 C ¹ Full France Consolidated
structured entity 99.3 99.3 99.3 99.3
ACTICCIA VIE N4 ¹ Full France Consolidated
structured entity 99.7 99.7 99.7 99.7
ACTIONS 50 3DEC ¹ Full France Consolidated
structured entity 100.0 100.0 100.0 100.0
AF INDEX EQ JAPAN AE CAP ¹ Full Luxembourg Consolidated
structured entity 88.0 17.7 88.0 17.7
AF INDEX EQ USA A4E ¹ Full Luxembourg Consolidated
structured entity 63.0 70.2 63.0 70.2
AFCPRGLLIFEAEC ¹ Full Luxembourg Consolidated
structured entity 42.2 47.3 42.2 47.3
AIMSCIWOAE ¹ Full Luxembourg Consolidated
structured entity 7.2 30.9 7.2 30.9
AM AC FR ISR PC 3D ¹ Full France Consolidated
structured entity 40.3 58.1 40.3 58.1
AM.AC.EU.ISR-P-3D ¹ Full France Consolidated
structured entity 43.0 44.0 43.0 44.0
AM.AC.MINER.-P-3D ¹ Full France Consolidated
structured entity 83.2 73.7 83.2 73.7
AM.AC.USA ISR P 3D ¹ Full France Consolidated
structured entity 50.7 54.5 50.7 54.5
AM.ACT.EMER.-P-3D ¹ Full France Consolidated
structured entity 42.8 43.4 42.8 43.4
AM.RDT PLUS -P-3D ¹ Full France Consolidated
structured entity 46.2 41.3 46.2 41.3
AMIRAL GROWTH OPP A ¹ Full E2 France Consolidated
structured entity 51.1 51.1
AMUN TRESO CT PC 3D ¹ Full France Consolidated
structured entity 100.0 85.8 100.0 85.8
AMUN.ACT.REST.P-C ¹ Full France Consolidated
structured entity 68.6 70.7 68.6 70.7
AMUN.TRES.EONIA ISR E FCP 3DEC ¹ Full France Consolidated
structured entity 47.5 85.2 47.5 85.2
AMUNDI AC.FONC.PC 3D ¹ Full France Consolidated
structured entity 64.2 56.3 64.2 56.3
AMUNDI ACTIONS FRANCE C 3DEC ¹ Full France Consolidated
structured entity 56.0 56.6 56.0 56.6
AMUNDI AFD AV DURABL P1 FCP 3DEC ¹ Full France Consolidated
structured entity 78.8 78.4 78.8 78.4
AMUNDI ALLOCATION C ¹ Full France Consolidated
structured entity 99.3 97.7 99.3 97.7
AMUNDI B GL AGG AEC ¹ Full Luxembourg Consolidated
structured entity 8.4 55.3 8.4 55.3
AMUNDI BGEB AEC ¹ Full Luxembourg Consolidated
structured entity 45.5 43.7 45.5 43.7
AMUNDI EQ E IN AHEC ¹ Full Luxembourg Consolidated
structured entity 39.6 37.4 39.6 37.4
AMUNDI GBL MACRO MULTI ASSET P ¹ Full France Consolidated
structured entity 70.1 69.6 70.1 69.6
AMUNDI GLB MUL-ASSET-M2EURC ¹ Full Luxembourg Consolidated
structured entity 47.5 67.9 47.5 67.9
AMUNDI GLO M/A CONS-M2 EUR C ¹ Full Luxembourg Consolidated
structured entity 76.2 66.0 76.2 66.0
AMUNDI HORIZON 3D ¹ Full France Consolidated
structured entity 66.3 66.0 66.3 66.0
AMUNDI KBI ACTION PC ¹ Full France Consolidated
structured entity 87.7 87.4 87.7 87.4
AMUNDI KBI ACTIONS C ¹ Full France Consolidated
structured entity 53.8 25.2 53.8 25.2
AMUNDI KBI AQUA C ¹ Full E2 France Consolidated
structured entity 83.5 83.5
AMUNDI OBLIG EURO C ¹ Full France Consolidated
structured entity 49.6 48.5 49.6 48.5
AMUNDI PATRIMOINE C 3DEC ¹ Full France Consolidated
structured entity 85.7 85.5 85.7 85.5
AMUNDI PULSACTIONS ¹ Full France Consolidated
structured entity 57.5 57.6 57.5 57.6
AMUNDI SONANCE VIE 7 3DEC ¹ Full France Consolidated
structured entity 97.4 97.4 97.4 97.4
AMUNDI SONANCE VIE N8 3DEC ¹ Full France Consolidated
structured entity 98.6 98.7 98.6 98.7
AMUNDI TRANSM PAT C ¹ Full France Consolidated
structured entity 98.6 98.1 98.6 98.1
AMUNDI VALEURS DURAB ¹ Full France Consolidated
structured entity 63.3 67.9 63.3 67.9
AMUNDI-CSH IN-PC ¹ Full France Consolidated
structured entity 100.0 76.0 100.0 76.0

Consolidated financial statements of Credit Agricole S.A. 31 December 2020
237
Crédit Agricole S.A. Group
Scope of consolidation
Consolidation
method
Scope changes
(a)
Principal place
of business
Country of
incorporation
if different from the
principal place of
business
Nature of control
(b)
% control % interest
12/31/2020 12/31/2019 12/31/2020 12/31/2019
AMUNDI-EUR EQ GREEN IM-IEURC ¹ Full Luxembourg Consolidated
structured entity 69.1 80.2 69.1 80.2
AMUNDI-GL INFLAT BD-MEURC ¹ Full Luxembourg Consolidated
structured entity 54.8 60.4 54.8 60.4
AMUNDIOBLIGMONDEP ¹ Full France Consolidated
structured entity 72.6 68.3 72.6 68.3
AMUNDI-VOLATILITY WRLD-IUSDC ¹ Full S1 Luxembourg Consolidated
structured entity 69.7 69.7
AMUNDI-VOLATILITY WRLD-OUSDC ¹ Full S1 Luxembourg Consolidated
structured entity 64.5 64.5
ANTINEA FCP ¹ Full France Consolidated
structured entity 30.5 55.2 30.5 55.2
ARC FLEXIBOND-D ¹ Full France Consolidated
structured entity 7.6 49.6 7.6 49.6
ATOUT EUROPE C FCP 3DEC ¹ Full France Consolidated
structured entity 82.3 82.4 82.3 82.4
ATOUT FRANCE C FCP 3DEC ¹ Full France Consolidated
structured entity 41.8 41.9 41.8 41.9
ATOUT PREM S ACTIONS 3DEC ¹ Full France Consolidated
structured entity 99.9 100.0 99.9 100.0
ATOUT VERT HORIZON FCP 3 DEC ¹ Full France Consolidated
structured entity 35.2 35.2 35.2 35.2
AXA EUR.SM.CAP E 3D ¹ Full France Consolidated
structured entity 93.0 82.4 93.0 82.4
BA-FII EUR EQ O-GEUR ¹ Full Luxembourg Consolidated
structured entity 50.3 50.7 50.3 50.7
BFT FRAN FUT-C SI.3D ¹ Full France Consolidated
structured entity 51.5 49.2 51.5 49.2
BFT SEL RDT 23 PC ¹ Full France Consolidated
structured entity 99.6 100.0 99.6 100.0
BFT STATERE P (C) ¹ Full France Consolidated
structured entity 44.4 43.6 44.4 43.6
BNP PAR.CRED.ERSC ¹ Full S2 France Consolidated
structured entity 60.8 60.8
CA MASTER EUROPE ¹ Full France Consolidated
structured entity 46.1 46.6 46.1 46.6
CA MASTER PATRIMOINE FCP 3DEC ¹ Full France Consolidated
structured entity 98.6 98.5 98.6 98.5
CADEISDA 2DEC ¹ Full France Consolidated
structured entity 40.0 40.0 40.0 40.0
CALIFORNIA 09 ¹ Full E2 France Consolidated
structured entity 67.3 67.3
CHORELIA N2 PART C ¹ Full France Consolidated
structured entity 87.8 87.8 87.8 87.8
CHORELIA N3 PART C ¹ Full Luxembourg Consolidated
structured entity 86.3 86.5 86.3 86.5
CHORELIA N4 PART C ¹ Full France Consolidated
structured entity 88.5 88.6 88.5 88.6
CHORELIA N5 PART C ¹ Full France Consolidated
structured entity 77.7 77.9 77.7 77.9
CHORELIA N6 PART C ¹ Full France Consolidated
structured entity 81.8 58.9 81.8 58.9
CHORELIA N7 C ¹ Full E2 France Consolidated
structured entity 85.9 85.9
CHORELIA PART C ¹ Full France Consolidated
structured entity 85.1 85.2 85.1 85.2
CPR CONSO ACTIONNAIRE FCP P ¹ Full France Consolidated
structured entity 51.8 51.8 51.8 51.8
CPR CROIS.REA.-P ¹ Full France Consolidated
structured entity 28.3 39.1 28.3 39.1
CPR EUR.HI.DIV.P 3D ¹ Full France Consolidated
structured entity 44.3 43.2 44.3 43.2
CPR EUROLAND ESG P ¹ Full E2 France Consolidated
structured entity 54.7 54.7
CPR FOCUS INF.-P-3D ¹ Full France Consolidated
structured entity 30.3 19.6 30.3 19.6
CPR GLO SILVER AGE P ¹ Full France Consolidated
structured entity 95.1 96.9 95.1 96.9
CPR I-SM B C-AEURA ¹ Full Luxembourg Consolidated
structured entity 60.0 61.1 60.0 61.1
CPR OBLIG 12 M.P 3D ¹ Full France Consolidated
structured entity 88.0 90.5 88.0 90.5
CPR REF.ST.EP.R.0-100 FCP 3DEC ¹ Full France Consolidated
structured entity 100.0 100.0 100.0 100.0
CPR REFL RESP 0-100 I 3DEC ¹ Full France Consolidated
structured entity 99.3 97.0 99.3 97.0
CPR REFL.RESP.0-100 P FCP 3DEC ¹ Full France Consolidated
structured entity 85.4 85.6 85.4 85.6
CPR REFLEX STRATEDIS 0-100 P 3D ¹ Full France Consolidated
structured entity 99.8 99.8 99.8 99.8
CPR RENAI.JAP.-P-3D ¹ Full France Consolidated
structured entity 33.9 66.1 33.9 66.1
CPR SILVER AGE P 3DEC ¹ Full France Consolidated
structured entity 55.7 52.6 55.7 52.6

Consolidated financial statements of Credit Agricole S.A. 31 December 2020
238
Crédit Agricole S.A. Group
Scope of consolidation
Consolidation
method
Scope changes
(a)
Principal place
of business
Country of
incorporation
if different from the
principal place of
business
Nature of control
(b)
% control % interest
12/31/2020 12/31/2019 12/31/2020 12/31/2019
CPR-CLIM ACT-AEURA ¹ Full Luxembourg Consolidated
structured entity 46.6 53.3 46.6 53.3
CPRGLODISOPARAC ¹ Full Luxembourg Consolidated
structured entity 46.6 47.0 46.6 47.0
ECOFI MULTI OPPORTUN.FCP 3DEC ¹ Full S2 France Consolidated
structured entity 83.3 83.3
EPARINTER EURO BD ¹ Full France Consolidated
structured entity 47.4 44.7 47.4 44.7
EXAN.PLEI.FD P ¹ Full S1 France Consolidated
structured entity 4.2 4.2
EXANE 1 OVERDR CC ¹ Full Luxembourg Consolidated
structured entity 72.1 63.8 72.1 63.8
FE AMUNDI INC BLDR-IHE C ¹ Full Luxembourg Consolidated
structured entity 80.2 77.8 80.2 77.8
FONDS AV ECHUS FIA A ¹ Full France Consolidated
structured entity 100.0 0.2 100.0 0.2
FONDS AV ECHUS FIA B ¹ Full S2 France Consolidated
structured entity 100.0 100.0
FRANKLIN DIVER-DYN-I ACC EU ¹ Full Luxembourg Consolidated
structured entity 50.2 50.1 50.2 50.1
FRANKLIN GLB MLT-AS IN-IAEUR ¹ Full Luxembourg Consolidated
structured entity 80.8 75.1 80.8 75.1
GRD CAR 39 FCP ¹ Full France Consolidated
structured entity 100.0 100.0 100.0 100.0
GRD FCR 99 FCP ¹ Full France Consolidated
structured entity 100.0 100.0 100.0 100.0
GRD IFC 97 FCP ¹ Full France Consolidated
structured entity 100.0 100.0 100.0 100.0
HASTINGS PATRIM AC ¹ Full France Consolidated
structured entity 43.3 41.0 43.3 41.0
HYMNOS P 3D ¹ Full France Consolidated
structured entity 50.3 46.5 50.3 46.5
IGSF-GBL GOLD FD-I C ¹ Full Luxembourg Consolidated
structured entity 42.7 46.3 42.7 46.3
IND.CAP EMERG.-C-3D ¹ Full France Consolidated
structured entity 46.6 80.6 46.6 80.6
INDO ALLOC MANDAT C ¹ Full France Consolidated
structured entity 96.8 2.0 96.8 2.0
INDO-FII EUR CP-IEUR ¹ Full S2 Luxembourg Consolidated
structured entity 51.7 51.7
INDOFIIFLEXEG ¹ Full E2 Luxembourg Consolidated
structured entity 53.1 53.1
INDO-GBL TR-PE ¹ Full Luxembourg Consolidated
structured entity 47.8 41.0 47.8 41.0
INDOS.EURO.PAT.PD 3D ¹ Full France Consolidated
structured entity 43.2 43.1 43.2 43.1
INDOSUEZ ALLOCATION ¹ Full France Consolidated
structured entity 99.5 81.6 99.5 81.6
INDOSUEZ EURO DIV G ¹ Full S2 Luxembourg Consolidated
structured entity 75.8 75.8
INDOSUEZ NAVIGATOR G ¹ Full Luxembourg Consolidated
structured entity 38.5 40.9 38.5 40.9
INDOSUEZSWZOPG ¹ Full S1 Luxembourg Consolidated
structured entity 50.8 50.8
INVEST RESP S3 3D ¹ Full France Consolidated
structured entity 74.6 74.1 74.6 74.1
JPM US EQY ALL CAP-C HDG ¹ Full Luxembourg Consolidated
structured entity 88.7 88.9 88.7 88.9
JPM US SEL EQ PLS-CA EUR HD ¹ Full Luxembourg Consolidated
structured entity 49.8 57.0 49.8 57.0
JPMORGAN F-JPM US VALUE-CEHA ¹ Full Luxembourg Consolidated
structured entity ‑ 59.3 ‑ 59.3
JPMORGAN F-US GROWTH-C AHD ¹ Full Luxembourg Consolidated
structured entity 0.5 49.4 0.5 49.4
LCF CREDIT ERSC 3D ¹ Full S2 France Consolidated
structured entity 54.7 54.7
LCL 3 TEMPO AV 11/16 ¹ Full France Consolidated
structured entity 100.0 100.0 100.0 100.0
LCL 6 HORIZ. AV 0615 ¹ Full France Consolidated
structured entity 100.0 100.0 100.0 100.0
LCL AC.DEV.DU.EURO ¹ Full France Consolidated
structured entity 84.6 71.3 84.6 71.3
LCL AC.EMERGENTS 3D ¹ Full France Consolidated
structured entity 50.0 54.2 50.0 54.2
LCL AC.MDE HS EU.3D ¹ Full France Consolidated
structured entity 38.1 41.2 38.1 41.2
LCL ACT RES NATUREL ¹ Full France Consolidated
structured entity 45.7 45.3 45.7 45.3
LCL ACT.E-U ISR 3D ¹ Full France Consolidated
structured entity 57.6 55.5 57.6 55.5
LCL ACT.IMMOBI.3D ¹ Full S2 France Consolidated
structured entity 49.3 49.3
LCL ACT.OR MONDE ¹ Full France Consolidated
structured entity 49.5 46.8 49.5 46.8

Consolidated financial statements of Credit Agricole S.A. 31 December 2020
239
Crédit Agricole S.A. Group
Scope of consolidation
Consolidation
method
Scope changes
(a)
Principal place
of business
Country of
incorporation
if different from the
principal place of
business
Nature of control
(b)
% control % interest
12/31/2020 12/31/2019 12/31/2020 12/31/2019
LCL ACT.USA ISR 3D ¹ Full France Consolidated
structured entity 87.0 85.6 87.0 85.6
LCL ACTIONS EURO C ¹ Full France Consolidated
structured entity 64.0 64.3 64.0 64.3
LCL ACTIONS EURO FUT ¹ Full France Consolidated
structured entity 77.5 73.9 77.5 73.9
LCL ACTIONS MONDE FCP 3 DEC ¹ Full France Consolidated
structured entity 43.3 51.6 43.3 51.6
LCL ALLOCATION DYNAMIQUE 3D FCP ¹ Full France Consolidated
structured entity 95.4 95.4 95.4 95.4
LCL AUTOCALL VIE 17 ¹ Full S2 France Consolidated
structured entity 96.6 96.6
LCL DEVELOPPEM.PME C ¹ Full France Consolidated
structured entity 67.9 68.5 67.9 68.5
LCL DOUBLE HORIZON A ¹ Full France Consolidated
structured entity 100.0 100.0 100.0 100.0
LCL FLEX 30 ¹ Full France Consolidated
structured entity 49.4 45.7 49.4 45.7
LCL FO.SE.FR.AV(AV11) FCP 3DEC ¹ Full S1 France Consolidated
structured entity 100.0 100.0
LCL INVEST.EQ C ¹ Full France Consolidated
structured entity 93.4 92.9 93.4 92.9
LCL INVEST.PRUD.3D ¹ Full France Consolidated
structured entity 92.7 92.1 92.7 92.1
LCL L.GR.B.AV 17 C ¹ Full France Consolidated
structured entity 100.0 100.0 100.0 100.0
LCL MGEST 60 3DEC ¹ Full France Consolidated
structured entity 88.1 87.9 88.1 87.9
LCL MGEST FL.0-100 ¹ Full France Consolidated
structured entity 92.5 92.0 92.5 92.0
LCL OBL.CREDIT EURO ¹ Full France Consolidated
structured entity 82.1 81.4 82.1 81.4
LCL OPTIM II VIE 17 ¹ Full S2 France Consolidated
structured entity 97.4 97.4
LCL PREMIUM VIE 2015 ¹ Full S1 France Consolidated
structured entity 98.4 98.4
LCL TRI ESC AV 0118 ¹ Full S2 France Consolidated
structured entity 100.0 100.0
LCL TRIPLE TE AV OC ¹ Full S2 France Consolidated
structured entity 100.0 100.0
LCL TRIPLE TEMPO AV (FEV.2015) ¹ Full France Consolidated
structured entity 100.0 100.0 100.0 100.0
LCL TRP HOZ AV 0117 ¹ Full S2 France Consolidated
structured entity 100.0 100.0
LOUVOIS PLACEMENT ¹ Full E2 France Consolidated
structured entity 40.1 40.1
M.D.F.89 FCP ¹ Full France Consolidated
structured entity 100.0 100.0 100.0 100.0
OBJECTIF DYNAMISME FCP ¹ Full France Consolidated
structured entity 98.3 98.5 98.3 98.5
OBJECTIF MEDIAN FCP ¹ Full France Consolidated
structured entity 100.0 100.0 100.0 100.0
OBJECTIF PRUDENCE FCP ¹ Full France Consolidated
structured entity 80.1 80.1 80.1 80.1
OPCIMMO LCL SPPICAV 5DEC ¹ Full France Consolidated
structured entity 97.5 97.4 97.5 97.4
OPCIMMO PREM SPPICAV 5DEC ¹ Full France Consolidated
structured entity 95.0 94.7 95.0 94.7
OPTALIME FCP 3DEC ¹ Full France Consolidated
structured entity 99.6 99.6 99.6 99.6
PIMCO GLOBAL BND FD-CURNC EX ¹ Full E2 Ireland Consolidated
structured entity 41.2 41.2
PORT EX ABS RET P ¹ Full E2 France Consolidated
structured entity 99.6 99.6
PORT.METAUX PREC.A-C ¹ Full France Consolidated
structured entity 99.4 100.0 99.4 100.0
PORTF DET FI EUR AC ¹ Full France Consolidated
structured entity 98.9 99.8 98.9 99.8
RAVIE FCP 5DEC ¹ Full France Consolidated
structured entity 100.0 100.0 100.0 100.0
RETAH PART C ¹ Full France Consolidated
structured entity 100.0 100.0 100.0 100.0
RSD 2006 FCP 3DEC ¹ Full France Consolidated
structured entity 100.0 100.0 100.0 100.0
SCI TANGRAM ¹ Full E2 France Subsidiary 100.0 100.0
SCI VICQ D'AZIR VELLEFAUX ¹ Full France Consolidated
structured entity 100.0 100.0 100.0 100.0
SCPI LFP MULTIMMO ¹ Full France Consolidated
structured entity 40.9 100.0 40.9 100.0
SOLIDARITE AMUNDI P ¹ Full France Consolidated
structured entity 74.7 68.6 74.7 68.6
SOLIDARITE INITIATIS SANTE ¹ Full France Consolidated
structured entity 79.6 82.1 79.6 82.1

Consolidated financial statements of Credit Agricole S.A. 31 December 2020
240
Crédit Agricole S.A. Group
Scope of consolidation
Consolidation
method
Scope changes
(a)
Principal place
of business
Country of
incorporation
if different from the
principal place of
business
Nature of control
(b)
% control % interest
12/31/2020 12/31/2019 12/31/2020 12/31/2019
SONANCE VIE 2 FCP 3DEC ¹ Full S1 France Consolidated
structured entity 100.0 100.0
SONANCE VIE 3 3DEC ¹ Full S2 France Consolidated
structured entity 100.0 100.0
SONANCE VIE 3DEC ¹ Full S1 France Consolidated
structured entity 100.0 100.0
SONANCE VIE 4 FCP ¹ Full France Consolidated
structured entity 100.0 100.0 100.0 100.0
SONANCE VIE 5 FCP 3DEC ¹ Full France Consolidated
structured entity 100.0 100.0 100.0 100.0
SONANCE VIE 6 FCP ¹ Full France Consolidated
structured entity 100.0 100.0 100.0 100.0
SONANCE VIE 9 ¹ Full France Consolidated
structured entity 98.2 98.1 98.2 98.1
TRIAN 6 ANS N10 C ¹ Full France Consolidated
structured entity 82.1 63.2 82.1 63.2
TRIANANCE 6 ANS ¹ Full France Consolidated
structured entity 61.9 61.8 61.9 61.8
TRIANANCE 6 ANS 5 C ¹ Full France Consolidated
structured entity 79.2 79.2 79.2 79.2
TRIANANCE 6 ANS N 11 ¹ Full E2 France Consolidated
structured entity 81.8 81.8
TRIANANCE 6 ANS N 4 ¹ Full S1 France Consolidated
structured entity 74.7 74.7
TRIANANCE 6 ANS N 9 ¹ Full France Consolidated
structured entity 79.7 79.9 79.7 79.9
TRIANANCE 6 ANS N2 C ¹ Full France Consolidated
structured entity 74.8 75.0 74.8 75.0
TRIANANCE 6 ANS N3 ¹ Full France Consolidated
structured entity 70.5 70.7 70.5 70.7
TRIANANCE 6 ANS N6 ¹ Full France Consolidated
structured entity 84.6 84.5 84.6 84.5
TRIANANCE 6 ANS N7 C ¹ Full France Consolidated
structured entity 82.1 82.2 82.1 82.2
TRIANANCE 6 ANS N8 C ¹ Full France Consolidated
structured entity 86.6 86.9 86.6 86.9
TRIANANCE 6 AN 12 C Full E1 France Consolidated
structured entity 84.4 84.4
UNIPIERRE ASSURANCE ( SCPI ) ¹ Full France Consolidated
structured entity 100.0 100.0 100.0 100.0
VENDOME INV.FCP 3DEC ¹ Full France Consolidated
structured entity 92.0 91.2 92.0 91.2
Real estate collective investment fund (OPCI)
Nexus 1 ¹ Full Italy Consolidated
structured entity 78.5 98.5 78.5 98.5
OPCI CAA CROSSROADS Full France Consolidated
structured entity 100.0 100.0
OPCI Camp Invest ¹ Full France Consolidated
structured entity 100.0 80.1 100.0 80.1
OPCI ECO CAMPUS SPPICAV ¹ Full France Consolidated
structured entity 100.0 100.0 100.0 100.0
OPCI Immanens Full France Consolidated
structured entity 100.0 100.0 68.4 68.4
OPCI Immo Emissions Full France Consolidated
structured entity 100.0 100.0 68.4 68.4
OPCI Iris Invest 2010 ¹ Full France Consolidated
structured entity 100.0 80.1 100.0 80.1
OPCI MASSY BUREAUX ¹ Full France Consolidated
structured entity 100.0 100.0 100.0 100.0
OPCI Messidor ¹ Full France Consolidated
structured entity 100.0 100.0 100.0 100.0
Predica OPCI Bureau ¹ Full France Consolidated
structured entity 100.0 100.0 100.0 100.0
Predica OPCI Commerces ¹ Full France Consolidated
structured entity 100.0 100.0 100.0 100.0
Predica OPCI Habitation ¹ Full France Consolidated
structured entity 100.0 100.0 100.0 100.0
Non-trading real estate investment company (SCI)
B IMMOBILIER ¹ Full France Subsidiary 100.0 100.0 100.0 100.0
DS Campus ¹ Full France Consolidated
structured entity 100.0 100.0 100.0 100.0
FREY RETAIL VILLEBON Equity
Accounted France Joint venture 47.5 47.5 47.5 47.5
HDP BUREAUX ¹ Full France Subsidiary 95.0 95.0 95.0 95.0
HDP HOTEL ¹ Full France Subsidiary 95.0 95.0 95.0 95.0
HDP LA HALLE BOCA ¹ Full France Subsidiary 95.0 95.0 95.0 95.0
IMEFA 177 ¹ Full France Consolidated
structured entity 100.0 100.0 100.0 100.0

Consolidated financial statements of Credit Agricole S.A. 31 December 2020
241
Crédit Agricole S.A. Group
Scope of consolidation
Consolidation
method
Scope changes
(a)
Principal place
of business
Country of
incorporation
if different from the
principal place of
business
Nature of control
(b)
% control % interest
12/31/2020 12/31/2019 12/31/2020 12/31/2019
IMEFA 178 ¹ Full France Consolidated
structured entity 100.0 100.0 100.0 100.0
IMEFA 179 ¹ Full France Consolidated
structured entity 100.0 100.0 100.0 100.0
Issy Pont ¹ Full France Consolidated
structured entity 75.0 75.0 75.0 75.0
RUE DU BAC (SCI) Equity
Accounted France Joint venture 50.0 50.0 50.0 50.0
SCI 1 TERRASSE BELLINI Equity
Accounted France Joint venture 33.3 33.3 33.3 33.3
SCI BMEDIC HABITATION ¹ Full France Subsidiary 100.0 100.0 100.0 100.0
SCI CAMPUS MEDICIS ST DENIS ¹ Full France Subsidiary 70.0 70.0 70.0 70.0
SCI CAMPUS RIMBAUD ST DENIS ¹ Full France Subsidiary 70.0 70.0 70.0 70.0
SCI CARPE DIEM Equity
Accounted France Joint venture 50.0 50.0 50.0 50.0
SCI EUROMARSEILLE 1 Equity
Accounted France Joint venture 50.0 50.0 50.0 50.0
SCI EUROMARSEILLE 2 Equity
Accounted France Joint venture 50.0 50.0 50.0 50.0
SCI FEDERALE PEREIRE VICTOIRE ¹ Full France Subsidiary 99.0 99.0 99.0 99.0
SCI FEDERALE VILLIERS ¹ Full France Subsidiary 100.0 100.0 100.0 100.0
SCI FEDERLOG ¹ Full France Subsidiary 99.9 99.9 99.9 99.9
SCI FEDERLONDRES ¹ Full France Subsidiary 100.0 100.0 100.0 100.0
SCI FEDERPIERRE ¹ Full France Subsidiary 100.0 100.0 100.0 100.0
SCI FONDIS Equity
Accounted France Associate 25.0 25.0 25.0 25.0
SCI GRENIER VELLEF ¹ Full France Consolidated
structured entity 100.0 100.0 100.0 100.0
SCI HEART OF LA DEFENSE Equity
Accounted France Associate 33.3 33.3 33.3 33.3
SCI Holding Dahlia ¹ Full France Consolidated
structured entity 100.0 100.0 100.0 100.0
SCI ILOT 13 Equity
Accounted France Joint venture 50.0 50.0 50.0 50.0
SCI IMEFA 001 ¹ Full France Subsidiary 100.0 100.0 100.0 100.0
SCI IMEFA 002 ¹ Full France Subsidiary 100.0 100.0 100.0 100.0
SCI IMEFA 003 ¹ Full France Subsidiary 100.0 100.0 100.0 100.0
SCI IMEFA 004 ¹ Full France Subsidiary 100.0 100.0 100.0 100.0
SCI IMEFA 005 ¹ Full France Subsidiary 100.0 100.0 100.0 100.0
SCI IMEFA 006 ¹ Full France Subsidiary 100.0 100.0 100.0 100.0
SCI IMEFA 008 ¹ Full France Subsidiary 100.0 100.0 100.0 100.0
SCI IMEFA 009 ¹ Full France Subsidiary 100.0 100.0 100.0 100.0
SCI IMEFA 010 ¹ Full France Subsidiary 100.0 100.0 100.0 100.0
SCI IMEFA 011 ¹ Full France Subsidiary 100.0 100.0 100.0 100.0
SCI IMEFA 012 ¹ Full France Subsidiary 100.0 100.0 100.0 100.0
SCI IMEFA 013 ¹ Full France Subsidiary 100.0 100.0 100.0 100.0
SCI IMEFA 016 ¹ Full France Subsidiary 100.0 100.0 100.0 100.0
SCI IMEFA 017 ¹ Full France Subsidiary 100.0 100.0 100.0 100.0
SCI IMEFA 018 ¹ Full France Subsidiary 100.0 100.0 100.0 100.0
SCI IMEFA 020 ¹ Full France Subsidiary 100.0 100.0 100.0 100.0
SCI IMEFA 022 ¹ Full France Subsidiary 100.0 100.0 100.0 100.0
SCI IMEFA 025 ¹ Full France Consolidated
structured entity 100.0 100.0 100.0 100.0
SCI IMEFA 032 ¹ Full France Subsidiary 100.0 100.0 100.0 100.0
SCI IMEFA 033 ¹ Full France Subsidiary 100.0 100.0 100.0 100.0
SCI IMEFA 034 ¹ Full France Subsidiary 100.0 100.0 100.0 100.0

Consolidated financial statements of Credit Agricole S.A. 31 December 2020
242
Crédit Agricole S.A. Group
Scope of consolidation
Consolidation
method
Scope changes
(a)
Principal place
of business
Country of
incorporation
if different from the
principal place of
business
Nature of control
(b)
% control % interest
12/31/2020 12/31/2019 12/31/2020 12/31/2019
SCI IMEFA 035 ¹ Full France Subsidiary 100.0 100.0 100.0 100.0
SCI IMEFA 036 ¹ Full France Subsidiary 100.0 100.0 100.0 100.0
SCI IMEFA 037 ¹ Full France Subsidiary 100.0 100.0 100.0 100.0
SCI IMEFA 038 ¹ Full France Subsidiary 100.0 100.0 100.0 100.0
SCI IMEFA 039 ¹ Full France Subsidiary 100.0 100.0 100.0 100.0
SCI IMEFA 042 ¹ Full France Subsidiary 100.0 100.0 100.0 100.0
SCI IMEFA 043 ¹ Full France Subsidiary 100.0 100.0 100.0 100.0
SCI IMEFA 044 ¹ Full France Subsidiary 100.0 100.0 100.0 100.0
SCI IMEFA 047 ¹ Full France Subsidiary 100.0 100.0 100.0 100.0
SCI IMEFA 048 ¹ Full France Subsidiary 100.0 100.0 100.0 100.0
SCI IMEFA 051 ¹ Full France Subsidiary 100.0 100.0 100.0 100.0
SCI IMEFA 052 ¹ Full France Subsidiary 100.0 100.0 100.0 100.0
SCI IMEFA 054 ¹ Full France Subsidiary 100.0 100.0 100.0 100.0
SCI IMEFA 057 ¹ Full France Subsidiary 100.0 100.0 100.0 100.0
SCI IMEFA 058 ¹ Full France Subsidiary 100.0 100.0 100.0 100.0
SCI IMEFA 060 ¹ Full France Subsidiary 100.0 100.0 100.0 100.0
SCI IMEFA 061 ¹ Full France Subsidiary 100.0 100.0 100.0 100.0
SCI IMEFA 062 ¹ Full France Subsidiary 100.0 100.0 100.0 100.0
SCI IMEFA 063 ¹ Full France Subsidiary 100.0 100.0 100.0 100.0
SCI IMEFA 064 ¹ Full France Subsidiary 100.0 100.0 100.0 100.0
SCI IMEFA 067 ¹ Full France Subsidiary 100.0 100.0 100.0 100.0
SCI IMEFA 068 ¹ Full France Subsidiary 100.0 100.0 100.0 100.0
SCI IMEFA 069 ¹ Full France Subsidiary 100.0 100.0 100.0 100.0
SCI IMEFA 072 ¹ Full France Subsidiary 100.0 100.0 100.0 100.0
SCI IMEFA 073 ¹ Full France Subsidiary 100.0 100.0 100.0 100.0
SCI IMEFA 074 ¹ Full France Subsidiary 100.0 100.0 100.0 100.0
SCI IMEFA 076 ¹ Full France Subsidiary 100.0 100.0 100.0 100.0
SCI IMEFA 077 ¹ Full France Subsidiary 100.0 100.0 100.0 100.0
SCI IMEFA 078 ¹ Full France Subsidiary 100.0 100.0 100.0 100.0
SCI IMEFA 079 ¹ Full France Subsidiary 100.0 100.0 100.0 100.0
SCI IMEFA 080 ¹ Full France Subsidiary 100.0 100.0 100.0 100.0
SCI IMEFA 081 ¹ Full France Subsidiary 100.0 100.0 100.0 100.0
SCI IMEFA 082 ¹ Full France Subsidiary 100.0 100.0 100.0 100.0
SCI IMEFA 083 ¹ Full France Subsidiary 100.0 100.0 100.0 100.0
SCI IMEFA 084 ¹ Full France Subsidiary 100.0 100.0 100.0 100.0
SCI IMEFA 085 ¹ Full France Subsidiary 100.0 100.0 100.0 100.0
SCI IMEFA 089 ¹ Full France Subsidiary 100.0 100.0 100.0 100.0
SCI IMEFA 091 ¹ Full France Subsidiary 100.0 100.0 100.0 100.0
SCI IMEFA 092 ¹ Full France Subsidiary 100.0 100.0 100.0 100.0
SCI IMEFA 096 ¹ Full France Subsidiary 100.0 100.0 100.0 100.0
SCI IMEFA 100 ¹ Full France Subsidiary 100.0 100.0 100.0 100.0
SCI IMEFA 101 ¹ Full France Subsidiary 100.0 100.0 100.0 100.0

Consolidated financial statements of Credit Agricole S.A. 31 December 2020
243
Crédit Agricole S.A. Group
Scope of consolidation
Consolidation
method
Scope changes
(a)
Principal place
of business
Country of
incorporation
if different from the
principal place of
business
Nature of control
(b)
% control % interest
12/31/2020 12/31/2019 12/31/2020 12/31/2019
SCI IMEFA 102 ¹ Full France Subsidiary 100.0 100.0 100.0 100.0
SCI IMEFA 103 ¹ Full France Subsidiary 100.0 100.0 100.0 100.0
SCI IMEFA 104 ¹ Full France Subsidiary 100.0 100.0 100.0 100.0
SCI IMEFA 105 ¹ Full France Subsidiary 100.0 100.0 100.0 100.0
SCI IMEFA 107 ¹ Full France Subsidiary 100.0 100.0 100.0 100.0
SCI IMEFA 108 ¹ Full France Subsidiary 100.0 100.0 100.0 100.0
SCI IMEFA 109 ¹ Full France Subsidiary 100.0 100.0 100.0 100.0
SCI IMEFA 110 ¹ Full France Subsidiary 100.0 100.0 100.0 100.0
SCI IMEFA 112 ¹ Full France Subsidiary 100.0 100.0 100.0 100.0
SCI IMEFA 113 ¹ Full France Subsidiary 100.0 100.0 100.0 100.0
SCI IMEFA 115 ¹ Full France Subsidiary 100.0 100.0 100.0 100.0
SCI IMEFA 116 ¹ Full France Subsidiary 100.0 100.0 100.0 100.0
SCI IMEFA 117 ¹ Full France Subsidiary 100.0 100.0 100.0 100.0
SCI IMEFA 118 ¹ Full France Subsidiary 100.0 100.0 100.0 100.0
SCI IMEFA 120 ¹ Full France Subsidiary 100.0 100.0 100.0 100.0
SCI IMEFA 121 ¹ Full France Subsidiary 100.0 100.0 100.0 100.0
SCI IMEFA 122 ¹ Full France Subsidiary 100.0 100.0 100.0 100.0
SCI IMEFA 123 ¹ Full France Subsidiary 100.0 100.0 100.0 100.0
SCI IMEFA 126 ¹ Full France Subsidiary 100.0 100.0 100.0 100.0
SCI IMEFA 128 ¹ Full France Subsidiary 100.0 100.0 100.0 100.0
SCI IMEFA 129 ¹ Full France Subsidiary 100.0 100.0 100.0 100.0
SCI IMEFA 131 ¹ Full France Subsidiary 100.0 100.0 100.0 100.0
SCI IMEFA 132 ¹ Full France Subsidiary 100.0 100.0 100.0 100.0
SCI IMEFA 140 ¹ Full France Consolidated
structured entity 100.0 100.0 100.0 100.0
SCI IMEFA 148 ¹ Full France Subsidiary 100.0 100.0 100.0 100.0
SCI IMEFA 149 ¹ Full France Subsidiary 100.0 100.0 100.0 100.0
SCI IMEFA 150 ¹ Full France Subsidiary 100.0 100.0 100.0 100.0
SCI IMEFA 155 ¹ Full France Subsidiary 100.0 100.0 100.0 100.0
SCI IMEFA 156 ¹ Full France Subsidiary 90.0 90.0 90.0 90.0
SCI IMEFA 157 ¹ Full France Subsidiary 90.0 90.0 90.0 90.0
SCI IMEFA 158 ¹ Full France Subsidiary 100.0 100.0 100.0 100.0
SCI IMEFA 159 ¹ Full France Subsidiary 100.0 100.0 100.0 100.0
SCI IMEFA 164 ¹ Full France Subsidiary 100.0 100.0 100.0 100.0
SCI IMEFA 169 ¹ Full France Subsidiary 100.0 100.0 100.0 100.0
SCI IMEFA 170 ¹ Full France Subsidiary 100.0 100.0 100.0 100.0
SCI IMEFA 171 ¹ Full France Consolidated
structured entity 100.0 100.0 100.0 100.0
SCI IMEFA 172 ¹ Full France Consolidated
structured entity 100.0 100.0 100.0 100.0
SCI IMEFA 173 ¹ Full France Subsidiary 100.0 100.0 100.0 100.0
SCI IMEFA 174 ¹ Full France Subsidiary 100.0 100.0 100.0 100.0
SCI IMEFA 175 ¹ Full France Subsidiary 100.0 100.0 100.0 100.0
SCI IMEFA 176 ¹ Full France Subsidiary 100.0 100.0 100.0 100.0
SCI LE VILLAGE VICTOR HUGO ¹ Full France Subsidiary 100.0 100.0 100.0 100.0

Consolidated financial statements of Credit Agricole S.A. 31 December 2020
244
Crédit Agricole S.A. Group
Scope of consolidation
Consolidation
method
Scope changes
(a)
Principal place
of business
Country of
incorporation
if different from the
principal place of
business
Nature of control
(b)
% control % interest
12/31/2020 12/31/2019 12/31/2020 12/31/2019
SCI MEDI BUREAUX ¹ Full France Subsidiary 100.0 100.0 100.0 100.0
SCI PACIFICA HUGO ¹ Full France Subsidiary 100.0 100.0 100.0 100.0
SCI PORTE DES LILAS - FRERES FLAVIEN ¹ Full France Subsidiary 100.0 100.0 100.0 100.0
SCI VALHUBERT ¹ Full France Subsidiary 100.0 100.0 100.0 100.0
SCI VAUGIRARD 36-44 ¹ Full France Subsidiary 100.0 100.0 100.0 100.0
SCI WAGRAM 22/30 Equity
Accounted France Joint venture 50.0 50.0 50.0 50.0
SCI WASHINGTON Equity
Accounted France Associate 34.0 34.0 34.0 34.0
SCI ACADEMIE MONTROUGE Equity
Accounted E2 France Joint venture 50.0 50.0
TOUR MERLE (SCI) Equity
Accounted France Joint venture 50.0 50.0 50.0 50.0
Other
56055 AEURHC Full E1 Luxembourg Consolidated
structured entity 51.6 51.4
ALTA VAI HOLDCO P Full France Subsidiary 100.0 100.0 100.0 100.0
ALTAREA Equity
Accounted France Associate 24.7 24.7 24.7 24.7
AMUNDI EMERG MKT BD-M2EURHC Full E1 Luxembourg Consolidated
structured entity 63.2 63.2
AMUNDI IT Services Full France Subsidiary 99.6 99.6 69.1 69.4
ARCAPARK SAS Equity
Accounted France Joint venture 50.0 50.0 50.0 50.0
Azqore Full Switzerland Subsidiary 80.0 80.0 78.2 78.2
Azqore SA Singapore Branch Full Singapore Switzerland Branch 80.0 80.0 80.0 78.2
CA Indosuez Wealth (Asset Management) Full Luxembourg Subsidiary 100.0 100.0 97.8 97.8
Crédit Agricole Assurances Solutions Full France Subsidiary 100.0 100.0 100.0 100.0
EUROPEAN CDT SRI PC Full E1 France Consolidated
structured entity 44.6 43.8
EUROPEAN MOTORWAY INVESTMENTS 1 ¹ Full Luxembourg Subsidiary 60.0 60.0 60.0 60.0
FIXED INCOME DERIVATIVES - STRUCTURED
FUND PLC Full D2 Ireland Consolidated
structured entity 100.0 97.8
FONCIERE HYPERSUD Equity
Accounted France Joint venture 51.4 51.4 51.4 51.4
FREY Equity
Accounted France Associate 19.4 19.3 19.4 19.3
GRD ACT.ZONE EURO Full E1 France Consolidated
structured entity 100.0 100.0
HOLDING EUROMARSEILLE Full France Subsidiary 100.0 100.0 100.0 100.0
Icade Equity
Accounted France Associate 19.0 19.0 19.0 19.0
INDOSUEZ CAP EMERG.M Full E1 France Consolidated
structured entity 100.0 100.0
INFRA FOCH TOPCO Equity
Accounted France Associate 35.7 36.9 35.7 36.9
IRIS HOLDING FRANCE Full France Subsidiary 80.1 80.1 80.1 80.1
KORIAN Equity
Accounted France Associate 24.3 24.4 24.3 24.4
PATRIMOINE ET COMMERCE Equity
Accounted France Associate 20.8 20.3 20.8 20.3
PED EUROPE Full France Subsidiary 100.0 100.0
PREDICA ENERGIES DURABLES ¹ Full France Subsidiary 89.2 99.9 89.2 99.9
PREDICA INFRASTRUCTURE SA Full Luxembourg Subsidiary 100.0 100.0 100.0 100.0
PREDIPARK ¹ Full France Subsidiary 100.0 100.0 100.0 100.0
PREDIWATT ¹ Full E2 France Consolidated
structured entity 100.0 100.0
RAMSAY – GENERALE DE SANTE Equity
Accounted France Associate 39.6 39.6 39.6 39.6
SA RESICO ¹ Full France Subsidiary 100.0 100.0 100.0 100.0
SAS CRISTAL Equity
Accounted France Associate 46.0 46.0 46.0 46.0
SAS PARHOLDING Equity
Accounted France Associate 50.0 50.0 50.0 50.0

Consolidated financial statements of Credit Agricole S.A. 31 December 2020
245
Crédit Agricole S.A. Group
Scope of consolidation
Consolidation
method
Scope changes
(a)
Principal place
of business
Country of
incorporation
if different from the
principal place of
business
Nature of control
(b)
% control % interest
12/31/2020 12/31/2019 12/31/2020 12/31/2019
SAS PREDI-RUNGIS ¹ Full France Subsidiary 85.0 85.0 85.0 85.0
SH PREDICA ENERGIES DURABLES SAS ¹ Full France Subsidiary 99.9 99.9 99.9 99.9
VAUGIRARD AUTOVIA SLU ¹ Full Spain Subsidiary 100.0 100.0 100.0 100.0
Vaugirard Infra S.L. Full Spain Subsidiary 100.0 100.0 100.0 100.0
VENDOME SEL EURO PC Full E1 France Consolidated
structured entity 43.6 43.6
Via Vita Full France Subsidiary 100.0 100.0 100.0 100.0
FRENCH RETAIL BANKING
Banking and financial institutions
FIMO Courtage Full France Subsidiary 100.0 100.0 94.6 94.6
Interfimo Full France Subsidiary 99.0 99.0 94.6 94.6
LCL Full France Subsidiary 95.6 95.6 95.6 95.6
LCL succursale de Monaco Full Monaco France Branch 95.6 95.6 95.6 95.6
Bforbank S.A. Equity
Accounted E3 France Associate 50.0 50.0
Lease financing companies
Investment companies
Tourism - property development
Angle Neuf Full France Subsidiary 100.0 100.0 95.6 95.6
Other
C.L. Verwaltungs und
Beteiligungsgesellschaft GmbH Full S3 Germany Subsidiary 100.0 95.6
Crédit Lyonnais Développement
Économique (CLDE) Full France Subsidiary 100.0 100.0 95.6 95.6
FCT True Sale (Compartiment LCL) Full France Consolidated
structured entity 100.0 100.0 95.6 95.6
INTERNATIONAL RETAIL BANKING
Banking and financial institutions
Arc Broker Full Poland Subsidiary 100.0 100.0 100.0 100.0
CREDIT AGRICOLE BANK Full Ukraine Subsidiary 100.0 100.0 100.0 100.0
Crédit Agricole Bank Polska S.A. Full Poland Subsidiary 100.0 100.0 100.0 100.0
Crédit Agricole Banka Srbija a.d. Novi Sad Full Serbia Subsidiary 100.0 100.0 100.0 100.0
Crédit Agricole Egypt S.A.E. Full Egypt Subsidiary 60.5 60.5 60.2 60.2
Crédit Agricole Friuladria S.p.A. Full Italy Subsidiary 82.4 81.8 62.3 61.9
Crédit Agricole Group Solutions Full Italy Consolidated
structured entity 100.0 100.0 74.4 74.4
Crédit Agricole Italia Full Italy Subsidiary 75.6 75.6 75.6 75.6
Crédit Agricole Leasing Italia Full Italy Subsidiary 100.0 100.0 79.3 79.3
Crédit Agricole Polska S.A. Full Poland Subsidiary 100.0 100.0 100.0 100.0
Credit Agricole Romania Full D4 Romania Subsidiary 100.0 100.0 100.0 100.0
Credit Agricole Service sp z o.o. Full Poland Subsidiary 100.0 100.0 100.0 100.0
Crédit du Maroc Full Morocco Subsidiary 78.7 78.7 78.7 78.7
SIFIM Full Morocco Subsidiary 100.0 100.0 78.7 78.7
Other
IUB Holding Full France Subsidiary 100.0 100.0 100.0 100.0
SPECIALISED FINANCIAL SERVICES
Banking and financial institutions
AD SUCCURSALE Full D1 Morocco Branch 100.0 100.0 100.0 100.0

Consolidated financial statements of Credit Agricole S.A. 31 December 2020
246
Crédit Agricole S.A. Group
Scope of consolidation
Consolidation
method
Scope changes
(a)
Principal place
of business
Country of
incorporation
if different from the
principal place of
business
Nature of control
(b)
% control % interest
12/31/2020 12/31/2019 12/31/2020 12/31/2019
Agos Full Italy Subsidiary 61.0 61.0 61.0 61.0
Alsolia Full France Subsidiary 100.0 100.0 100.0 100.0
CACF BANKIA sa Equity
Accounted Spain Joint venture 51.0 51.0 51.0 51.0
Crealfi Full France Subsidiary 51.0 51.0 51.0 51.0
Credibom Full Portugal Subsidiary 100.0 100.0 100.0 100.0
Crediet Maatschappij " De Ijssel" B.V. Full S1 Netherlands Subsidiary 100.0 100.0
Crédit Agricole Consumer Finance Full France Subsidiary 100.0 100.0 100.0 100.0
Crédit Agricole Consumer Finance
Nederland Full D4 Netherlands Subsidiary 100.0 100.0 100.0 100.0
Crédit LIFT Full France Subsidiary 100.0 100.0 100.0 100.0
Creditplus Bank AG Full Germany Subsidiary 100.0 100.0 100.0 100.0
De Kredietdesk B.V. Full Netherlands Subsidiary 100.0 100.0 100.0 100.0
DE NEDERLANDSE VOORSCHOTBANK BV Full S1 Netherlands Subsidiary 100.0 100.0
EFL Services Full Poland Subsidiary 100.0 100.0 100.0 100.0
EUROFACTOR GmbH Full Germany Subsidiary 100.0 100.0 100.0 100.0
Eurofactor Italia S.p.A. Full Italy Subsidiary 100.0 100.0 100.0 100.0
EUROFACTOR NEDERLAND Full Netherlands Germany Branch 100.0 100.0 100.0 100.0
EUROFACTOR POLSKA S.A. Full Poland Subsidiary 100.0 100.0 100.0 100.0
Eurofactor SA - NV (Benelux) Full Belgium Branch 100.0 100.0 100.0 100.0
Eurofactor S.A. (Portugal) Full D2 Portugal Branch 100.0 100.0 100.0 100.0
HAMA POLSKA Full E2 Poland Subsidiary 70.0 70.0
Eurofintus Financieringen B.V. Full S1 Netherlands Subsidiary 100.0 100.0
FCA Automotive Services UK Ltd Equity
Accounted United Kingdom Joint venture 50.0 50.0 50.0 50.0
FCA Bank Equity
Accounted Italy Joint venture 50.0 50.0 50.0 50.0
FCA Bank Gmbh, Hellenic Branch Equity
Accounted Greece Joint venture 50.0 50.0 50.0 50.0
FCA Bank Germany GmbH Equity
Accounted Germany Joint venture 50.0 50.0 50.0 50.0
FCA Bank GmbH Equity
Accounted Austria Joint venture 50.0 50.0 50.0 50.0
FCA BANK S.P.A, BELGIAN BRANCH Equity
Accounted D1 Belgium Joint venture 50.0 50.0 50.0 50.0
FCA BANK SPA, IRISH BRANCH Equity
Accounted Ireland Joint venture 50.0 50.0 50.0 50.0
FCA BANK SPA ODDZIAL W POLSCE, Polska
Branch
Equity
Accounted D1 Poland Joint venture 50.0 50.0 50.0 50.0
FCA Capital Danmark A/S Equity
Accounted Denmark Joint venture 50.0 50.0 50.0 50.0
FCA Capital España EFC S.A. Equity
Accounted Spain Joint venture 50.0 50.0 50.0 50.0
FCA CAPITAL France SA Equity
Accounted D1 France Joint venture 50.0 50.0 50.0 50.0
FCA Capital Hellas S.A. Equity
Accounted Greece Joint venture 50.0 50.0 50.0 50.0
FCA Capital IFIC Equity
Accounted Portugal Joint venture 50.0 50.0 50.0 50.0
FCA Capital Nederland B.V. Equity
Accounted Netherlands Joint venture 50.0 50.0 50.0 50.0
FCA Capital Norge AS Equity
Accounted Norway Joint venture 50.0 50.0 50.0 50.0
FCA Capital Re Limited Equity
Accounted D2 Ireland Joint venture 50.0 50.0 50.0 50.0
FCA Capital Suisse S.A. Equity
Accounted Switzerland Joint venture 50.0 50.0 50.0 50.0
FCA Capital Sverige Equity
Accounted Sweden Joint venture 50.0 50.0 50.0 50.0
FCA DEALER SERVICES ESPANA SA,
Morocco Branch
Equity
Accounted Morocco Spain Joint venture 50.0 50.0 50.0 50.0
FCA Dealer services España, S.A. Equity
Accounted Spain Joint venture 50.0 50.0 50.0 50.0
FCA Dealer Services Portugal S.A. Equity
Accounted D2 Portugal Joint venture 50.0 50.0 50.0 50.0

Consolidated financial statements of Credit Agricole S.A. 31 December 2020
247
Crédit Agricole S.A. Group
Scope of consolidation
Consolidation
method
Scope changes
(a)
Principal place
of business
Country of
incorporation
if different from the
principal place of
business
Nature of control
(b)
% control % interest
12/31/2020 12/31/2019 12/31/2020 12/31/2019
FCA Dealer Services UK Ltd Equity
Accounted United Kingdom Joint venture 50.0 50.0 50.0 50.0
FCA Insurance Hellas S.A. Equity
Accounted Greece Joint venture 50.0 50.0 50.0 50.0
FCA Leasing France Equity
Accounted France Joint venture 50.0 50.0 50.0 50.0
FCA Leasing GmbH Equity
Accounted Austria Joint venture 50.0 50.0 50.0 50.0
LEASYS POLSKA Equity
Accounted D1 Poland Joint venture 50.0 50.0 50.0 50.0
FERRARI FINANCIAL SERVICES GMBH Equity
Accounted Germany Joint venture 50.0 50.0 25.0 25.0
FERRARI FINANCIAL SERVICES GMBH, UK
Branch
Equity
Accounted United Kingdom Joint venture 50.0 50.0 50.0 50.0
FCA CAPITAL DANMARK A/S, Finland
Branch
Equity
Accounted D1 Finland Joint venture 50.0 50.0 50.0 50.0
Financierings Data Netwerk B.V. Equity
Accounted Netherlands Joint venture 50.0 50.0 50.0 50.0
Finaref Assurances S.A.S. Full France Subsidiary 100.0 100.0 100.0 100.0
Finata Zuid-Nederland B.V. Full Netherlands Subsidiary 98.1 98.1 98.1 98.1
GAC - Sofinco Auto Finance Co. Equity
Accounted China Associate 50.0 50.0 50.0 50.0
GSA Ltd Full Mauritius Subsidiary 100.0 100.0 100.0 100.0
IDM Finance B.V. Full S1 Netherlands Subsidiary 100.0 100.0
IDM Financieringen B.V. Full S1 Netherlands Subsidiary 100.0 100.0
IDM lease maatschappij B.V. Full Netherlands Subsidiary 100.0 100.0 100.0 100.0
Iebe Lease B.V. Full Netherlands Subsidiary 100.0 100.0 100.0 100.0
INTERBANK NV Full Netherlands Subsidiary 100.0 100.0 100.0 100.0
INTERMEDIAIRE VOORSCHOTBANK BV Full S1 Netherlands Subsidiary 100.0 100.0
Krediet '78 B.V. Full Netherlands Subsidiary 100.0 100.0 100.0 100.0
Leasys Equity
Accounted D2 Italy Joint venture 50.0 50.0 50.0 50.0
LEASYS DANMARK, FILIAL AF LEASYS SPA Equity
Accounted E2 Denmark Joint venture 100.0 100.0
LEASYS France S.A.S Equity
Accounted D2 France Joint venture 50.0 50.0 50.0 50.0
LEASYS Nederland Equity
Accounted D2 Netherlands Joint venture 50.0 50.0 50.0 50.0
LEASYS SPA Belgian Branch Equity
Accounted D2 Belgium Joint venture 50.0 50.0 50.0 50.0
LEASYS SPA GERMAN BRANCH Equity
Accounted D2 Germany Joint venture 50.0 50.0 50.0 50.0
LEASYS SPA, Spanish Branch Equity
Accounted D2 Spain Joint venture 50.0 50.0 50.0 50.0
Leasys UK Ltd Equity
Accounted D2 United Kingdom Joint venture 50.0 50.0 50.0 50.0
Mahuko Financieringen B.V. Full S1 Netherlands Subsidiary 100.0 100.0
Menafinance Full S5 France Subsidiary 50.0 50.0
NL Findio B.V Full Netherlands Subsidiary 100.0 100.0 100.0 100.0
RIBANK NV Full Netherlands Subsidiary 100.0 100.0 100.0 100.0
Sofinco Participations Full France Subsidiary 100.0 100.0 100.0 100.0
Ste Européenne de Développement
d'Assurances Full France Subsidiary 100.0 100.0 100.0 100.0
Ste Européenne de Développement du
Financement Full France Subsidiary 100.0 100.0 100.0 100.0
Themis Courtage Equity
Accounted Morocco Associate 49.0 49.0 48.9 48.9
Ucafleet Equity
Accounted France Associate 35.0 35.0 35.0 35.0
VoordeelBank B.V. Full S1 Netherlands Subsidiary 100.0 100.0
Wafasalaf Equity
Accounted Morocco Associate 49.0 49.0 49.0 49.0
LEASYS RENT SPA Equity
Accounted D2 Italy Joint venture 50.0 50.0 50.0 50.0
Lease financing companies
Auxifip Full France Subsidiary 100.0 100.0 100.0 100.0

Consolidated financial statements of Credit Agricole S.A. 31 December 2020
248
Crédit Agricole S.A. Group
Scope of consolidation
Consolidation
method
Scope changes
(a)
Principal place
of business
Country of
incorporation
if different from the
principal place of
business
Nature of control
(b)
% control % interest
12/31/2020 12/31/2019 12/31/2020 12/31/2019
Carefleet S.A. Full Poland Subsidiary 100.0 100.0 100.0 100.0
Crédit Agricole Leasing & Factoring Full France Subsidiary 100.0 100.0 100.0 100.0
Crédit Agricole Leasing & Factoring,
Sucursal en Espana Full Spain France Branch 100.0 100.0 100.0 100.0
Crédit du Maroc Leasing et Factoring Full Morocco Subsidiary 100.0 100.0 85.8 85.8
Europejski Fundusz Leasingowy (E.F.L.) Full Poland Subsidiary 100.0 100.0 100.0 100.0
Finamur Full France Subsidiary 100.0 100.0 100.0 100.0
Lixxbail Full France Subsidiary 100.0 100.0 100.0 100.0
Lixxcourtage Full France Subsidiary 100.0 100.0 100.0 100.0
Lixxcredit Full France Subsidiary 100.0 100.0 100.0 100.0
Unifergie Full France Subsidiary 100.0 100.0 100.0 100.0
Investment companies
Insurance
ARES Reinsurance Ltd. Full Ireland Subsidiary 100.0 100.0 61.0 61.0
Other
A-BEST EIGHTEEN Equity
Accounted E2 Italy Structured joint
venture 50.0 50.0
A-BEST ELEVEN UG Equity
Accounted Germany Structured joint
venture 50.0 50.0 50.0 50.0
A-BEST FIFTEEN Equity
Accounted Italy Structured joint
venture 50.0 50.0 50.0 50.0
A-BEST FOURTEEN Equity
Accounted Italy Structured joint
venture 50.0 50.0 50.0 50.0
A-BEST SEVENTEEN Equity
Accounted Italy Structured joint
venture 50.0 50.0 50.0 50.0
A-BEST SIXTEEN Equity
Accounted Germany Structured joint
venture 50.0 50.0 50.0 50.0
A-BEST THIRTEEN Equity
Accounted Spain Structured joint
venture 50.0 50.0 50.0 50.0
A-BEST TWELVE Equity
Accounted Italy Structured joint
venture 50.0 50.0 50.0 50.0
CLICKAR SRL Equity
Accounted D2 Italy Structured joint
venture 50.0 50.0 50.0 50.0
EFL Finance S.A. Full Poland Subsidiary 100.0 100.0 100.0 100.0
EFL Lease Abs 2017-1 Designated Activity
Company Full Ireland Consolidated
structured entity 100.0 100.0 100.0 100.0
ERASMUS FINANCE Equity
Accounted Ireland Structured joint
venture 50.0 50.0 50.0 50.0
FAST THREE SRL Equity
Accounted Italy Structured joint
venture 50.0 50.0 50.0 50.0
FCT GINGKO DEBT CONSO 2015-1 Full France Consolidated
structured entity 100.0 100.0 100.0 100.0
FCT GINGKO PERSONAL LOANS 2016-1 Full France Consolidated
structured entity 100.0 100.0 100.0 100.0
FCT GINKGO PERSONAL LOANS 2020-01 Full E2 France Consolidated
structured entity 100.0 100.0
FCT GINKGO MASTER REVOLVING LOANS Full France Consolidated
structured entity 100.0 100.0 100.0 100.0
FCT GINGKO SALES FINANCE 2015-1 Full France Consolidated
structured entity 100.0 100.0 100.0 100.0
FCT GINKGO SALES FINANCE 2017-1 Full France Consolidated
structured entity 100.0 100.0 100.0 100.0
GAC - SOFINCO 2014-01 Equity
Accounted China Structured
associate 50.0 50.0 50.0 50.0
HUI JU TONG 2019-1 Equity
Accounted China Structured joint
venture 50.0 50.0 50.0 50.0
HUI TONG 2018-2 Equity
Accounted E2 China Consolidated
structured entity 50.0 50.0
HUI TONG 2018-3 Equity
Accounted E2 China Consolidated
structured entity 50.0 50.0
HUI TONG 2019-1 Equity
Accounted E2 China Consolidated
structured entity 50.0 50.0
HUI JU TONG 2020-2 Equity
Accounted E2 China Consolidated
structured entity 50.0 50.0
MAGOI BV Full Netherlands Consolidated
structured entity 100.0 100.0 100.0 100.0
MATSUBA BV Full Netherlands Consolidated
structured entity 100.0 100.0 100.0 100.0
NIXES SEVEN SRL Equity
Accounted Netherlands Structured joint
venture 50.0 50.0 50.0 50.0

Consolidated financial statements of Credit Agricole S.A. 31 December 2020
249
Crédit Agricole S.A. Group
Scope of consolidation
Consolidation
method
Scope changes
(a)
Principal place
of business
Country of
incorporation
if different from the
principal place of
business
Nature of control
(b)
% control % interest
12/31/2020 12/31/2019 12/31/2020 12/31/2019
NIXES SIX (LTD) Equity
Accounted Italy Structured joint
venture 50.0 50.0 50.0 50.0
RETAIL AUTOMOTIVE CP GERMANY 2016
UG Full D1 Germany Consolidated
structured entity 100.0 100.0 100.0 100.0
SUNRISE SPV 20 SRL Full Italy Consolidated
structured entity 100.0 100.0 61.0 61.0
SUNRISE SPV 30 SRL Full Italy Consolidated
structured entity 100.0 100.0 61.0 61.0
SUNRISE SPV 40 SRL Full Italy Consolidated
structured entity 100.0 100.0 61.0 61.0
SUNRISE SPV 50 SRL Full Italy Consolidated
structured entity 100.0 100.0 61.0 61.0
SUNRISE SPV Z60 Srl Full Italy Consolidated
structured entity 100.0 100.0 61.0 61.0
SUNRISE SPV Z70 Srl Full Italy Consolidated
structured entity 100.0 100.0 61.0 61.0
SUNRISE SPV Z80 Srl Full Italy Consolidated
structured entity 100.0 100.0 61.0 61.0
SUNRISE SPV Z90 Srl Full E2 Italy Consolidated
structured entity 100.0 61.0
SUNRISE SRL Full Italy Consolidated
structured entity 100.0 100.0 61.0 61.0
THETIS FINANCE 2015-1 Full Portugal Consolidated
structured entity 100.0 100.0 100.0 100.0
LEASYS RENT FRANCE SAS Equity
Accounted D2 France Joint venture 100.0 50.0
CORPORATE AND INVESTMENT BANKING
Banking and financial institutions
Banco Crédit Agricole Brasil S.A. Full Brazil Subsidiary 100.0 100.0 97.8 97.8
Banco Santander CACEIS México, S.A.,
Institución de Banca Múltiple
Equity
Accounted D1 Mexico Joint venture 50.0 50.0 34.7 34.7
BTN Förvaltning AB Equity
Accounted S2 Sweden Netherlands Associate 19.5 13.6
CACEIS Bank Full France Subsidiary 100.0 100.0 69.5 69.5
CACEIS Bank S.A., Germany Branch Full Germany Branch 100.0 100.0 69.5 69.5
CACEIS Bank, Belgium Branch Full Belgium Branch 100.0 100.0 69.5 69.5
CACEIS Bank, Ireland Branch Full Ireland Branch 100.0 100.0 69.5 69.5
CACEIS Bank, Italy Branch Full Italy Branch 100.0 100.0 69.5 69.5
CACEIS Bank, Luxembourg Branch Full Luxembourg Branch 100.0 100.0 69.5 69.5
CACEIS Bank, Netherlands Branch Full D2 Netherlands Branch 100.0 100.0 69.5 69.5
CACEIS Bank, Switzerland Branch Full Switzerland Branch 100.0 100.0 69.5 69.5
CACEIS Bank, UK Branch Full United Kingdom Branch 100.0 100.0 69.5 69.5
CACEIS Belgium Full Belgium Subsidiary 100.0 100.0 69.5 69.5
CACEIS Corporate Trust Full France Subsidiary 100.0 100.0 69.5 69.5
CACEIS Fund Administration Full France Subsidiary 100.0 100.0 69.5 69.5
CACEIS FUND ADMINISTRATION SPAIN
S.A.U Full D1 Spain Subsidiary 100.0 100.0 69.5 69.5
CACEIS Ireland Limited Full Ireland Subsidiary 100.0 100.0 69.5 69.5
CACEIS S.A. Full France Subsidiary 69.5 69.5 69.5 69.5
CACEIS Switzerland S.A. Full Switzerland Subsidiary 100.0 100.0 69.5 69.5
Crédit Agriciole CIB (Belgium) Full Belgium France Branch 97.8 97.8 97.8 97.8
Crédit Agricole CIB (ABU DHABI) Full United Arab
Emirates France Branch 97.8 97.8 97.8 97.8
Crédit Agricole CIB (Germany) Full Germany France Branch 97.8 97.8 97.8 97.8
Crédit Agricole CIB (Canada) Full Canada France Branch 97.8 97.8 97.8 97.8
Crédit Agricole CIB (Corée du Sud) Full South Korea France Branch 97.8 97.8 97.8 97.8
Crédit Agricole CIB (Dubai DIFC) Full United Arab
Emirates France Branch 97.8 97.8 97.8 97.8
Crédit Agricole CIB (Dubai) Full United Arab
Emirates France Branch 97.8 97.8 97.8 97.8
Crédit Agricole CIB (Spain) Full Spain France Branch 97.8 97.8 97.8 97.8

Consolidated financial statements of Credit Agricole S.A. 31 December 2020
250
Crédit Agricole S.A. Group
Scope of consolidation
Consolidation
method
Scope changes
(a)
Principal place
of business
Country of
incorporation
if different from the
principal place of
business
Nature of control
(b)
% control % interest
12/31/2020 12/31/2019 12/31/2020 12/31/2019
Crédit Agricole CIB (Etats-Unis) Full United States France Branch 97.8 97.8 97.8 97.8
Crédit Agricole CIB (Finlande) Full Finland France Branch 97.8 97.8 97.8 97.8
Crédit Agricole CIB (Hong-Kong) Full Hong Kong France Branch 97.8 97.8 97.8 97.8
Crédit Agricole CIB (Inde) Full India France Branch 97.8 97.8 97.8 97.8
Crédit Agricole CIB (Italie) Full Italy France Branch 97.8 97.8 97.8 97.8
Crédit Agricole CIB (Japon) Full Japan France Branch 97.8 97.8 97.8 97.8
Crédit Agricole CIB (Miami) Full D4 United States France Branch 97.8 97.8 97.8 97.8
Crédit Agricole CIB (Royaume-Uni) Full United Kingdom France Branch 97.8 97.8 97.8 97.8
Crédit Agricole CIB (Singapour) Full Singapore France Branch 97.8 97.8 97.8 97.8
Crédit Agricole CIB (Suède) Full Sweden France Branch 97.8 97.8 97.8 97.8
Crédit Agricole CIB (Taipei) Full Taiwan France Branch 97.8 97.8 97.8 97.8
Crédit Agricole CIB Algeria Bank Spa Full Algeria Subsidiary 100.0 100.0 97.8 97.8
Crédit Agricole CIB AO Full Russia Subsidiary 100.0 100.0 97.8 97.8
Crédit Agricole CIB Australia Ltd. Full Australia Subsidiary 100.0 100.0 97.8 97.8
Crédit Agricole CIB China Ltd. Full China Subsidiary 100.0 100.0 97.8 97.8
Crédit Agricole CIB China Ltd. Chinase
Branch Full China Branch 100.0 100.0 97.8 97.8
Crédit Agricole CIB S.A. Full France Subsidiary 97.8 97.8 97.8 97.8
Crédit Agricole CIB Services Private Ltd. Full India Subsidiary 100.0 100.0 97.8 97.8
ESTER FINANCE TECHNOLOGIES Full D1 France Subsidiary 100.0 100.0 97.8 97.8
KAS Bank N.V. Full S4 Netherlands Subsidiary 97.4 67.7
KAS Bank N.V. Frankfurt branch Full S4 Germany Netherlands Branch 97.4 67.7
KAS Bank N.V. London branch Full S4 United Kingdom Netherlands Branch 97.4 67.7
KAS Trust & Depositary Services B.V.
Amsterdam Full S4 Netherlands Subsidiary 97.4 67.7
S3 Latam Holdco 1 Equity
Accounted Spain Joint venture 50.0 50.0 34.7 34.7
S3 Latam Holdco 2 Equity
Accounted Spain Joint venture 50.0 50.0 34.7 34.7
SANTANDER CACEIS BRASIL DTVM S.A. Equity
Accounted D1 Brazil Joint venture 50.0 50.0 34.7 34.7
SANTANDER CACEIS BRASIL
PARTICIPACOES S.A
Equity
Accounted D1 Brazil Joint venture 50.0 50.0 34.7 34.7
SANTANDER CACEIS COLOMBIA S.A,
SOCIEDAD FIDUCIARIA
Equity
Accounted D1 Colombia Joint venture 50.0 50.0 34.7 34.7
CACEIS BANK SPAIN, S.A.U. Full D1 Spain Subsidiary 100.0 100.0 69.5 69.5
UBAF Equity
Accounted France Joint venture 47.0 47.0 46.0 46.0
UBAF (Corée du Sud) Equity
Accounted South Korea France Joint venture 47.0 47.0 47.0 46.0
UBAF (Japon) Equity
Accounted Japan France Joint venture 47.0 47.0 47.0 46.0
UBAF (Singapour) Equity
Accounted Singapore France Joint venture 47.0 47.0 47.0 46.0
Stockbrokers
Credit Agricole Securities (Asia) Limited
Hong Kong Full Hong Kong Subsidiary 100.0 100.0 97.8 97.8
Credit Agricole Securities (Asia) Limited
Seoul Branch Full South Korea Branch 100.0 100.0 97.8 97.8
Crédit Agricole Securities (USA) Inc Full D2 United States Subsidiary 100.0 100.0 97.8 97.8
Crédit Agricole Securities Asia BV (Tokyo) Full Japan Netherlands Branch 100.0 100.0 97.8 97.8
Investment companies
Compagnie Française de l’Asie (CFA) Full France Subsidiary 100.0 100.0 97.8 97.8
Crédit Agricole CIB Air Finance S.A. Full France Subsidiary 100.0 100.0 97.8 97.8
Crédit Agricole CIB Holdings Ltd. Full United Kingdom Subsidiary 100.0 100.0 97.8 97.8

Consolidated financial statements of Credit Agricole S.A. 31 December 2020
251
Crédit Agricole S.A. Group
Scope of consolidation
Consolidation
method
Scope changes
(a)
Principal place
of business
Country of
incorporation
if different from the
principal place of
business
Nature of control
(b)
% control % interest
12/31/2020 12/31/2019 12/31/2020 12/31/2019
Crédit Agricole Global Partners Inc. Full United States Subsidiary 100.0 100.0 97.8 97.8
Crédit Agricole Securities Asia BV Full Netherlands Subsidiary 100.0 100.0 97.8 97.8
Doumer Finance S.A.S. Full France Subsidiary 100.0 100.0 97.8 97.8
Fininvest Full France Subsidiary 98.3 98.3 96.2 96.1
Fletirec Full France Subsidiary 100.0 100.0 97.8 97.8
Insurance
CAIRS Assurance S.A. Full France Subsidiary 100.0 100.0 97.8 97.8
Other
Atlantic Asset Securitization LLC Full United States Consolidated
structured entity 100.0 100.0 ‑ ‑
Benelpart Full Belgium Subsidiary 100.0 100.0 97.4 95.3
Calixis Finance Full S4 France Consolidated
structured entity 100.0 97.8
Calliope SRL Full S2 Italy Consolidated
structured entity 100.0 97.8
Clifap Full France Subsidiary 100.0 100.0 97.8 97.8
Crédit Agricole America Services Inc. Full United States Subsidiary 100.0 100.0 97.8 97.8
Crédit Agricole Asia Shipfinance Ltd. Full Hong Kong Subsidiary 100.0 100.0 97.8 97.8
Crédit Agricole CIB Finance (Guernsey)
Ltd. Full Guernsey Consolidated
structured entity 99.9 99.9 97.7 97.7
Crédit Agricole CIB Finance Luxembourg
S.A. Full Luxembourg Consolidated
structured entity 100.0 100.0 97.8 97.8
Crédit Agricole CIB Financial Solutions Full France Consolidated
structured entity 99.9 99.9 97.7 97.7
Crédit Agricole CIB Global Banking Full France Subsidiary 100.0 100.0 97.8 97.8
Crédit Agricole CIB Pension Limited
Partnership Full United Kingdom Consolidated
structured entity 100.0 100.0 97.8 97.8
Crédit Agricole CIB Transactions Full France Subsidiary 100.0 100.0 97.8 97.8
Crédit Agricole Leasing (USA) Corp. Full United States Subsidiary 100.0 100.0 97.8 97.8
DGAD International SARL Full S2 Luxembourg Subsidiary 100.0 97.8
Elipso Finance S.r.l Equity
Accounted S2 Italy Structured joint
venture 50.0 48.9
ESNI (compartiment Crédit Agricole CIB) Full France Consolidated
structured entity 100.0 100.0 97.8 97.8
Eucalyptus FCT Full France Consolidated
structured entity 100.0 100.0 ‑ ‑
FCT CFN DIH Full France Consolidated
structured entity 100.0 100.0 ‑ ‑
FIC-FIDC Full Brazil Consolidated
structured entity 100.0 100.0 100.0 97.8
Financière des Scarabées Full Belgium Subsidiary 100.0 100.0 98.7 96.5
Financière Lumis Full France Subsidiary 100.0 100.0 97.8 97.8
Fundo A De Investimento Multimercado Full D2 Brazil Consolidated
structured entity 100.0 100.0 97.8 97.8
Héphaïstos EUR FCC Full S1 France Consolidated
structured entity 100.0 ‑
Héphaïstos GBP FCT Full S1 France Consolidated
structured entity 100.0 ‑
Héphaïstos Multidevises FCT Full France Consolidated
structured entity 100.0 100.0 ‑ ‑
Héphaïstos USD FCT Full S1 France Consolidated
structured entity 100.0 ‑
Investor Service House S.A. Full Luxembourg Subsidiary 100.0 100.0 69.5 69.5
ItalAsset Finance SRL Full Italy Consolidated
structured entity 100.0 100.0 97.8 97.8
La Fayette Asset Securitization LLC Full United States Consolidated
structured entity 100.0 100.0 ‑ ‑
La Route Avance Full France Consolidated
structured entity 100.0 100.0 ‑ ‑
Lafina Full Belgium Subsidiary 100.0 100.0 97.7 95.6
LMA SA Full France Consolidated
structured entity 100.0 100.0 ‑ ‑
Merisma Full France Consolidated
structured entity 100.0 100.0 97.8 97.8

Consolidated financial statements of Credit Agricole S.A. 31 December 2020
252
Crédit Agricole S.A. Group
Scope of consolidation
Consolidation
method
Scope changes
(a)
Principal place
of business
Country of
incorporation
if different from the
principal place of
business
Nature of control
(b)
% control % interest
12/31/2020 12/31/2019 12/31/2020 12/31/2019
Molinier Finances Full France Subsidiary 100.0 100.0 97.1 95.0
Pacific EUR FCC Full France Consolidated
structured entity 100.0 100.0 ‑ ‑
Pacific IT FCT Full France Consolidated
structured entity 100.0 100.0 ‑ ‑
Pacific USD FCT Full France Consolidated
structured entity 100.0 100.0 ‑ ‑
Partinvest S.A. Full Luxembourg Subsidiary 100.0 100.0 69.5 69.5
Placements et réalisations immobilières
(SNC) Full S5 France Subsidiary 100.0 95.3
Sagrantino Italy SRL Full S2 Italy Consolidated
structured entity 100.0 97.8
Shark FCC Full France Consolidated
structured entity 100.0 100.0 ‑ ‑
Sinefinair B.V. Full Netherlands Subsidiary 100.0 100.0 97.8 97.8
SNGI Full France Subsidiary 100.0 100.0 97.8 97.8
SNGI Belgium Full Belgium Subsidiary 100.0 100.0 97.8 97.8
Sococlabecq Full S5 Belgium Subsidiary 100.0 95.6
Sofipac Full Belgium Subsidiary 98.6 98.6 96.0 93.9
Sufinair B.V. Full Netherlands Subsidiary 100.0 100.0 97.8 97.8
TCB Full France Subsidiary 98.7 98.7 97.4 95.3
Triple P FCC Full France Consolidated
structured entity 100.0 100.0 ‑ ‑
TSUBAKI OFF (FCT) Full France Consolidated
structured entity 100.0 100.0 ‑ ‑
TSUBAKI ON (FCT) Full France Consolidated
structured entity 100.0 100.0 ‑ ‑
Vulcain EUR FCT Full S1 France Consolidated
structured entity 100.0 ‑
Vulcain Multi-Devises FCT Full S1 France Consolidated
structured entity 100.0 ‑
Vulcain USD FCT Full S1 France Consolidated
structured entity 100.0 ‑
CACIB Qatar Financial Center Branch Full E2 Qatar Branch 100.0 97.8
CORPORATE CENTRE
Crédit Agricole S.A.
Crédit Agricole S.A. Parent France Parent 100.0 100.0 100.0 100.0
Succursale Credit Agricole SA Full United Kingdom France Branch 100.0 100.0 100.0 100.0
Banking and financial institutions
Caisse régionale de Crédit Agricole
mutuel de la Corse Full France Subsidiary 99.9 99.9 49.9 49.9
CL Développement de la Corse Full France Subsidiary 99.9 99.9 99.9 99.9
Crédit Agricole Home Loan SFH Full France Consolidated
structured entity 100.0 100.0 100.0 100.0
Foncaris Full France Subsidiary 100.0 100.0 100.0 100.0
Investment companies
Crédit Agricole Capital
Investissement et Finance (CACIF) Full France Subsidiary 100.0 100.0 100.0 100.0
Delfinances Full France Consolidated
structured entity 100.0 100.0 100.0 100.0
Sodica Full France Subsidiary 100.0 100.0 100.0 100.0
Other
CA Grands Crus Full France Subsidiary 77.9 77.9 77.9 77.9
Cariou Holding Full France Subsidiary 50.0 50.0 50.0 50.0
Crédit Agricole - Group Infrastructure
Platform
Equity
Accounted France Joint venture 57.7 57.7 53.7 53.7
Crédit Agricole Agriculture Full France Subsidiary 100.0 100.0 100.0 100.0
Crédit Agricole Immobilier Equity
Accounted France Joint venture 50.0 50.0 50.0 50.0
Crédit Agricole Payment Services Full France Consolidated
structured entity 51.3 50.2 50.3 50.3

Consolidated financial statements of Credit Agricole S.A. 31 December 2020
253
Crédit Agricole S.A. Group
Scope of consolidation
Consolidation
method
Scope changes
(a)
Principal place
of business
Country of
incorporation
if different from the
principal place of
business
Nature of control
(b)
% control % interest
12/31/2020 12/31/2019 12/31/2020 12/31/2019
Crédit Agricole Public Sector SCF Full France Consolidated
structured entity 100.0 100.0 100.0 100.0
Crédit Agricole Régions Développement Full France Subsidiary 76.3 75.7 76.3 75.7
ESNI (compartiment Crédit Agricole S.A.) Full France Consolidated
structured entity 100.0 100.0 100.0 100.0
FCT Crédit Agricole Habitat 2015
Compartiment Corse Full France Consolidated
structured entity 100.0 100.0 49.9 49.9
FCT Crédit Agricole Habitat 2017
Compartiment Corse Full France Consolidated
structured entity 100.0 100.0 99.9 99.9
FCT Crédit Agricole Habitat 2018
Compartiment Corse Full France Consolidated
structured entity 100.0 100.0 99.9 99.9
FCT Crédit Agricole Habitat 2019
Compartiment Corse Full France Consolidated
structured entity 100.0 100.0 99.9 99.9
FCT Crédit Agricole Habitat 2020
Compartiment Corse Full E2 France Consolidated
structured entity 100.0 99.9
FIRECA Full France Subsidiary 51.0 51.0 51.0 51.0
Grands Crus Investissements (GCI) Full France Subsidiary 52.1 52.1 52.1 52.1
IDIA Full France Subsidiary 100.0 100.0 100.0 100.0
IDIA DEVELOPPEMENT Full France Subsidiary 100.0 100.0 100.0 100.0
IDIA PARTICIPATIONS Full France Subsidiary 100.0 100.0 100.0 100.0
S.A.S. Evergreen Montrouge Full France Consolidated
structured entity 100.0 100.0 100.0 100.0
SCI D2 CAM Equity
Accounted France Joint venture 50.0 50.0 50.0 50.0
SCI Quentyvel Full France Subsidiary 100.0 100.0 100.0 100.0
SNC Kalliste Assur Full France Subsidiary 100.0 100.0 49.9 49.9
Société d'Epargne Foncière Agricole
(SEFA) Full France Subsidiary 100.0 100.0 100.0 100.0
Uni-medias Full France Subsidiary 100.0 100.0 100.0 100.0
Tourism - property development
Crédit Agricole Immobilier Promotion Equity
Accounted France Joint venture 50.0 50.0 50.0 50.0
Crédit Agricole Immobilier Services Equity
Accounted France Joint venture 50.0 50.0 50.0 50.0
SO.GI.CO Equity
Accounted France Joint venture 50.0 50.0 50.0 50.0
(a) Scope changes
Inclusions (E) into the scope of consolidation
E1: Breach of threshold
E2: Creation
E3: Acquisition (including controlling interests)
Exclusions (S) from the scope of consolidation:
S1: Discontinuation of business (including dissolution and liquidation)
S2: Sale to non-Group companies or deconsolidation following loss of control
S3: Deconsolidated due to non-materiality
S4: Merger or takeover
S5: Transfer of all assets and liabilities
Other (D):
D1: Change of company name
D2: Change in consolidation method
D3: First time listed in the Note on scope of consolidation

Consolidated financial statements of Credit Agricole S.A. 31 December 2020
254
D4: IFRS 5 entities
(b) Nature of control
S: Subsidiary
B: Branch
CSE: Consolidated structured entity
JV: Joint venture
SJV: Structured joint venture
JO: Joint operation
A: Associate
SA: Structured associate
(1): UCITS, unit funds and SCIs held by insurance entities

Consolidated financial statements of Credit Agricole S.A. 31 December 2020
255
NOTE 13 Investments in non-consolidated companies and structured
entities
13.1 Information on subsidiaries
These securities, which are recorded at fair value through profit or loss or fair value through non-recyclable equity, are
variable-income securities representing a significant portion of the share capital of the companies that issued them
and are intended to be held on a long-term basis.
This line item amounted to €13,986 million at 31 December 2020, compared with €13,256 million at 31 December 2019.
At 31 December 2020, the main investment in non-consolidated companies where percentage of control is greater
than 20% and which have significant value on the balance sheet is Crédit Logement (shares A and B). The Group’s
investment represents 32.50% of Crédit Logement’s capital and amounts to €509 million but does not confer any
significant influence over this entity, which is jointly held by various French banks and companies.
13.1.1 NON-CONSOLIDATED CONTROLLED ENTITIES
Information relating to conventional entities under exclusive control, under joint control and subject to significant
influence, and to controlled structured entities not included in the scope of consolidation are available on the Crédit
Agricole S.A. website at the time of publication of the Universal Registration Document.
13.1.2 MATERIAL NON-CONSOLIDATED EQUITY INVESTMENTS
Material equity investments accounting for a fraction of capital greater than or equal to 10% and not included in the
scope of consolidation are presented in a table available online on the Crédit Agricole website at the time of
publication of the Universal Registration Document.
13.2 Non-consolidated structured entities
IFRS 12 defines a structured entity as an entity that has been designed so that voting or similar rights are not the
dominant factor in deciding who controls the entity, such as when any voting rights relate to the administrative tasks
only and the relevant activities are directed by means of contractual arrangements.
INFORMATION ON THE NATURE AND EXTENT OF INTERESTS HELD
At 31 December 2020, Crédit Agricole S.A. Group entities had interests in certain non-consolidated structured entities,
the main characteristics of which are presented below on the basis of their type of activity:
Securitisation
Crédit Agricole S.A., mainly through its subsidiaries in the Large customers business line, is tasked with structuring
securitisation vehicles through the purchase of trade or financial receivables. The vehicles fund such purchases by
issuing multiple tranches of debt and equity investments, with repayment being linked to the performance of the assets
in such vehicles. It invests in and provides liquidity facilities to the securitisation vehicles it has sponsored on behalf of
customers.
Asset management
Crédit Agricole S.A., through its subsidiaries in the Asset gathering business line, structures and manages entities on
behalf of customers wishing to invest in specific assets in order to obtain the best possible return having regard to the
chosen level of risk. Crédit Agricole S.A. entities may thus either be required to hold interests in such entities in order to
ensure a successful launch or to guarantee the performance of such structures.
Consolidated financial statements of Credit Agricole S.A. 31 December 2020
256
Investment funds
Entities in the Crédit Agricole S.A. Asset Gathering business line invest in companies established to meet investor
demand in connection with treasury management and with the investment of insurance premiums received from
insurance company customers, in accordance with the regulatory provisions in the French Insurance Code. Insurance
company investments cover commitments to policyholders over the life of insurance policies. Their value and returns
are correlated to these commitments.
Structured finance
Lastly, Crédit Agricole S.A., via its subsidiaries in the Large customers business line, is involved in special purpose asset
acquisition entities. These entities may take the form of asset financing companies or lease financing companies. In
structured entities, the financing is secured by the asset. The Group’s involvement is often limited to the financing or to
financing commitments.
Sponsored entities
Crédit Agricole S.A. sponsors structured entities in the following instances:
Crédit Agricole S.A. is involved in establishing the entity and that involvement, which is remunerated, is
deemed essential for ensuring the proper completion of transactions;
structuring takes place at the request of Crédit Agricole S.A. and it is the main user thereof;
Crédit Agricole S.A. transfers its own assets to the structured entity;
Crédit Agricole S.A. is the manager;
the name of a subsidiary or of the parent company of Crédit Agricole S.A. is linked to the name of the
structured entity or of the financial instruments issued by it.
Crédit Agricole S.A. has sponsored non-consolidated structured entities in which it does not hold an interest at 31
December 2020.
Gross revenues from sponsored entities mainly comprise interest expense and income in securitisation and investment
funds, in which Crédit Agricole Assurances and Crédit Agricole CIB do not hold any interests at the reporting date. For
Crédit Agricole Assurances, these amount to €18 million.
INFORMATION ON THE RISKS RELATED TO INTERESTS
Financial support for structured entities
In 2020, Crédit Agricole S.A. did not provide financial support to any non-consolidated structured entities.
At 31 December 2020, Crédit Agricole S.A. did not intend to provide financial support to any non-consolidated
structured entities.

Consolidated financial statements of Credit Agricole S.A. 31 December 2020
25
7
Interests in non-consolidated structured entities by type of activities
At 31 December 2020 and 31 December 2019, the Group’s involvement in non-consolidated structured entities is disclosed in the following tables, for each group of sponsored
structured entities that are significant to the Group.
(in millions of euros)
31/12/2020
Securitisation Asset management Investments funds 1 Structured finance 1
Maximum loss Maximum loss Maximum loss Maximum loss
Carrying
amount
Maximum exposure
to losses
Guarantees
received and
other credit
enhancements
Net
exposure
Carrying
amount
Maximum
exposure
to losses
Guarantees
received and
other credit
enhancements
Net
exposure
Carrying
amount
Maximum
exposure
to losses
Guarantees
received and
other credit
enhancements
Net
exposure
Carrying
amount
Maximum
exposure
to losses
Guarantees
received and
other credit
enhancements
Net
exposure
Financial assets at fair
value through profit or loss
6 6 ‑ 6 3,179 3,179 ‑ 3,179 43,077 43,077 ‑ 42,918 17 ‑ ‑ ‑
Financial assets at fair
value through other
comprehensive income ‑ ‑ ‑ ‑ ‑ ‑ ‑ ‑ ‑ ‑ ‑ ‑ ‑ ‑ ‑ ‑
Financial assets at
amortised cost ‑ ‑ ‑ ‑ ‑ ‑ ‑ ‑ 207 207 ‑ 207 1,860 1,860 ‑ 1,860
Total Assets recognised
relating to non-
consolidated structured
entities 6 6 ‑ 6 3,179 3,179 ‑ 3,179 43,284 43,284 ‑ 43,126 1,877 1,860 ‑ 1,860
Equity instruments ‑ ‑ ‑ ‑ ‑ ‑ ‑ ‑ ‑ ‑ ‑ ‑ ‑ ‑ ‑ ‑
Financial liabilities at fair
value through profit or loss 21 1 ‑ 1 799 799 ‑ 799 33 2 ‑ 2 ‑ ‑ ‑ ‑
Liabilities 11 ‑ ‑ ‑ ‑ ‑ ‑ ‑ ‑ ‑ ‑ ‑ 416 ‑ ‑ ‑
Total Liabilities recognised
relating to non-
consolidated structured
entities 31 1 ‑ 1 799 799 ‑ 799 33 2 ‑ 2 416 ‑ ‑ ‑
Commitments given ‑ 75 ‑ 75 ‑ 18,210 399 17,843 ‑ 277 ‑ 277 ‑ 1,044 ‑ 1,044
Financing commitments ‑ 18 ‑ 18 ‑ ‑ ‑ ‑ ‑ ‑ ‑ ‑ ‑ 974 ‑ 974
Guarantee commitments ‑ ‑ ‑ ‑ ‑ 18,242 399 17,843 ‑ ‑ ‑ ‑ ‑ 70 ‑ 70
Other ‑ 57 ‑ 57 ‑ ‑ ‑ ‑ ‑ 277 ‑ 277 ‑ ‑ ‑ ‑
Provisions for execution
risks - commitments given ‑ ‑ ‑ ‑ ‑ (32) ‑ ‑ ‑ ‑ ‑ ‑ ‑ ‑ ‑ ‑
Total Commitments (net of
provision) to non-
consolidated structured
entities ‑ 75 ‑ 75 ‑ 18,210 399 17,843 ‑ 277 ‑ 277 ‑ 1,044 ‑ 1,044
Total Balance sheet
relating to non-
consolidated structured
entities 25 ‑ ‑ ‑ 113,940 ‑ ‑ ‑ 362,928 ‑ ‑ ‑ 1,461 ‑ ‑ ‑
¹ 1 Non-sponsored structured entities generate no specific risk related to the nature of the entity. Information concerning these exposures is set out in Note 3.1 "Credit risk" and Note " 3.2 "Market risk". These are investment funds in which the Group is not a manager, and structured financing entities in
which the Group has only granted a loan.

Consolidated financial statements of Credit Agricole S.A. 31 December 2020
25
8
(in millions of euros)
31/12/2019
Securitisation Asset management Investments funds 1 Structured finance 1
Maximum loss Maximum loss Maximum loss Maximum loss
Carrying
amount
Maximum exposure
to losses
Guarantees
received and
other credit
enhancements
Net
exposure
Carrying
amount
Maximum
exposure
to losses
Guarantees
received and
other credit
enhancements
Net
exposure
Carrying
amount
Maximum
exposure
to losses
Guarantees
received and
other credit
enhancements
Net
exposure
Carrying
amount
Maximum
exposure
to losses
Guarantees
received and
other credit
enhancements
Net
exposure
Financial assets at fair
value through profit or loss 8 8 ‑ 8 1,898 1,898 ‑ 1,898 45,705 45,705 ‑ 45,583 20 20 ‑ 20
Financial assets at fair
value through other
comprehensive income ‑ ‑ ‑ ‑ ‑ ‑ ‑ ‑ 1 1 ‑ 1 ‑ ‑ ‑ ‑
Financial assets at
amortised cost 2,351 2,351 ‑ 2,351 ‑ ‑ ‑ ‑ ‑ ‑ ‑ ‑ 2,261 2,261 ‑ 2,261
Total Assets recognised
relating to non-
consolidated structured
entities 2,360 2,360 ‑ 2,360 1,898 1,898 ‑ 1,898 45,706 45,706 ‑ 45,584 2,281 2,281 ‑ 2,281
Equity instruments ‑ ‑ ‑ ‑ ‑ ‑ ‑ ‑ ‑ ‑ ‑ ‑ ‑ ‑ ‑ ‑
Financial liabilities at fair
value through profit or loss ‑ ‑ ‑ ‑ 1,010 1,010 ‑ 1,010 ‑ ‑ ‑ ‑ ‑ ‑ ‑ ‑
Liabilities 128 ‑ ‑ ‑ ‑ ‑ ‑ ‑ ‑ ‑ ‑ ‑ 492 ‑ ‑ ‑
Total Liabilities recognised
relating to non-
consolidated structured
entities 128 ‑ ‑ ‑ 1,010 1,010 ‑ 1,010 ‑ ‑ ‑ ‑ 492 ‑ ‑ ‑
Commitments given ‑ 1,608 ‑ 1,608 ‑ 20,311 ‑ 20,336 ‑ ‑ ‑ ‑ ‑ 1,380 ‑ 1,380
Financing commitments ‑ 1,551 ‑ 1,551 ‑ ‑ ‑ ‑ ‑ ‑ ‑ ‑ ‑ 1,216 ‑ 1,216
Guarantee commitments ‑ ‑ ‑ ‑ ‑ 20,336 ‑ 20,336 ‑ ‑ ‑ ‑ ‑ 164 ‑ 164
Other ‑ 57 ‑ 57 ‑ ‑ ‑ ‑ ‑ ‑ ‑ ‑ ‑ ‑ ‑ ‑
Provisions for execution
risks - commitments given ‑ ‑ ‑ ‑ ‑ (25) ‑ ‑ ‑ ‑ ‑ ‑ ‑ ‑ ‑ ‑
Total Commitments (net of
provision) to non-
consolidated structured
entities ‑ 1,608 ‑ 1,608 ‑ 20,311 ‑ 20,336 ‑ ‑ ‑ ‑ ‑ 1,380 ‑ 1,380
Total Balance sheet
relating to non-
consolidated structured
entities 2,232 ‑ ‑ ‑ 76,800 ‑ ‑ ‑ 328,635 ‑ ‑ ‑ 2,262 ‑ ‑ ‑
¹ Non-sponsored structured entities generate no specific risk related to the nature of the entity. Information concerning these exposures is set out in Note 3.1 "Credit risk" and Note " 3.2 "Market risk". These are
investment funds in which the Group is not a manager, and structured financing entities in which the Group has only granted a loan.

Consolidated financial statements of Credit Agricole S.A. 31 December 2020
259
MAXIMUM EXPOSURE TO LOSSES
The maximum exposure to loss risk on financial instruments corresponds to the value recognised on the balance sheet,
with the exception of option sale derivatives and credit default swaps for which the exposure corresponds to assets for
the notional amount and to liabilities for the notional amount less the mark-to-market. The maximum exposure to loss
risk on commitments given corresponds to the notional amount and the provision for commitments given in the amount
recognised on the balance sheet.

Consolidated financial statements of Credit Agricole S.A. 31 December 2020
260
NOTE 14 Events subsequent to 31 December 2020
14.1 Unwinding of 15% of the switch guarantee mechanism
On 1 March 2021, Crédit Agricole S.A. unwound 15% of the switch guarantee mechanism set up between the Regional
Banks and Crédit Agricole S.A.
For Crédit Agricole S.A., this transaction will result in a decrease in commitments received from the Regional Banks
amounting to €1,375 million and a decrease in the security deposit of €465 million.
14.2 Redemption by Crédit Agricole Consumer Finance of 49% of the capital of the joint
venture CACF Bankia S.A.
On 3 February 2021, Crédit Agricole Consumer Finance (CACF) entered into a redemption agreement with Bankia for
49% of the capital held by the latter in the joint venture CACF Bankia S.A.
At the close of the transaction, the entity will be wholly owned by CACF and will be fully consolidated in the
Crédit Agricole S.A. financial statements.
The transaction is suspended with the agreement of Banco de España (Bank of Spain).