KLEEMANN HELLAS S.A.-
65
KLEEMANN HELLAS S.A. Registration No. 10920/06/Β/86/40 Head Offices: Industrial area of Stavrochori, Kilkis KLEEMANN HELLAS S.A.- MECHANICAL CONSTRUCTIONS SOCIETE ANONYME INDUSTRIAL TRADING COMPANY S.A Financial Statements (Individual and Consolidated) of 31 December 2006 According to International Financial Reporting Standards The attached Financial Statements are the ones approved by the KLEEMANN HELLAS S.A Board of Directors, on 19 March 2007 and have been announced by their release at the Internet, in the web site address www.kleemann.gr
-
Upload
khangminh22 -
Category
Documents
-
view
0 -
download
0
Transcript of KLEEMANN HELLAS S.A.-

KLEEMANN HELLAS S.A. Registration No. 10920/06/Β/86/40
Head Offices: Industrial area of Stavrochori, Kilkis
KLEEMANN HELLAS S.A.-
MECHANICAL CONSTRUCTIONS SOCIETE ANONYME INDUSTRIAL TRADING COMPANY S.A
Financial Statements (Individual and Consolidated) of 31 December 2006
According to International Financial Reporting Standards
The attached Financial Statements are the ones approved by the KLEEMANN HELLAS S.A Board of Directors, on 19 March 2007 and have been announced by their release at the
Internet, in the web site address www.kleemann.gr

KLEEMANN HELLAS S.A. Financial Statements of 31 December 2006
2
CONTENTS
Page
Report of Board of Directors 3 Balance Sheet (Individual and Consolidated) 15 Income Statements (Individual and Consolidated) 16 Statements of Change in Equity Capital (Individual and Consolidated) 17 Cash Flow Statements (Individual and Consolidated) 19 Notes on Financial Statements 20 Certified Auditor’s Audit Report 64

KLEEMANN HELLAS S.A. Financial Statements of 31 December 2006
3
REPORT OF BOARD OF DIRECTORS
Ladies and Gentlemen Shareholders, With this management report, we present a total analysis of the financial statements, as these have been prepared, according to I.F.R.S. and have been published, as defined in Article ν. 2190/1920. INFORMATION ABOUT THE GROUP
General Information Parent Company «KLEEMANN HELLAS MECHANICAL CONSTRUCTIONS SOCIETE ANONYME INDUSTRIAL TRADING COMPANY S.A.» with distinctive title «KLEEMANN HELLAS S.A.» was legally established in June 1983 (Government Paper 2308/27.7.1983) and its S.A. registration number is 10920/06/Β/86/40. Its operating duration has been defined until 31.12.2027. Head offices of the Parent Company are located in the Industrial area of Stavrochori, Kilkis.
Group structure Company Head Offices ParticipationKLEEMANN HELLAS S.A. Industr. area of Kilkis,Greece Parent CompanyKLEFER S.A. Industr. area of Kilkis,Greece 50%KLEEMANN ASANSOR S.A. Istanbul, Turkey 70%KLEEMANN LIFTOVI D.o.o Belgrade, Serbia 60%KLEEMANN LIFTOVI Ro SRL Bucharest, Romania 70%
Description of Activity Main activity of both the Group and the Company is the manufacturing and trading of elevator systems, such as: • Hydraulic elevating mechanisms (piston, power unit, Car frame) • Electromechanical elevating mechanisms (machine, Car frame, counterweights) • Cabins (Passenger, Cargo, Panoramic). • Electronic controllers and electronic systems. • Compact type elevators for elevating cargos.
The new products complete the range and cover all possible requirements of every construction: • Hydraulic elevator without machine room (ARION Hydro MRL) • Electromechanical elevator without machine room (APOLLO Traction MRL, ATLAS Traction MRL) • Hydraulic elevator without machine room (MISTRAL Traction MRL) • Hydraulic elevator maisonLift and • Elevator for smaller cargos DUMBWAITER. • Seismic elevator The main components that the Group and the Company trade are: • Automatic, semi-automatic and BUS type doors • Electromechanical motors • Guide rails • Hydraulic oil • Wires, Buffers, Ropes and other mechanical components.

KLEEMANN HELLAS S.A. Financial Statements of 31 December 2006
4
The above components are designed for housing elevators and elevators in commercial buildings, for panoramic elevators in shopping centers and hotels and for freight elevators. Complete Elevator Systems The necessity for immediate adjustment of the Group to the changes of the sector and the demands of the clients, led to the creation of a new entrepreneurial activity, which is the supply of “Complete elevator systems”.
Tangible Fixed Assets –Insurance Contracts – Guarantees and Pledge Insurances of the Group Main facilities of the Company are situated in the Industrial area of Stavrochori, Kilkis, in a privately owned plot. The Company’s Real Estate assets are as follows: a) Land 1. Sites in the Industrial area of Kilkis, of 53.631,04 m2 total surface. 2. Plots of 66.258,00 m2 total surface, abutted on the border of the industrial area of Kilkis and the Land of the Company. 3. Plots of 11.893,44 m2 total surface in Aspropyrgos, Attica, which comprise an indiscrete entity. b) Buildings in industrial area of Kilkis 1. Manufacturing and storage building, of 21.294 m2 total coverage. 2. Manufacturing building (Controller-Electronics) and offices, opposite the main facilities of the Company, 2.054 m2. 3. Manufacturing and storage building (Cabin-Traction) close to the main group of buildings , of 9.330 m2 total surface, together with an administration building, with a surface of 1.000 m2 4. Manufacturing and storage building, of 66.258 m2 total surface, 15.511,19 m2 , together with the administration building. 5. Also, a fully furnished home for security, of 52,82 m2 total surface. c) Buildings in Athens 1. Semi – underground warehouse 174 m², in Lesvou 13 street, in Galatsi, Athens, which is currently leased. 2. Ground floor store of 122,25 m², which is currently leased, in Nestoros 23 street and Akropoleos 52 street, in Nikaia, Piraeus. 3. Distribution center, of 3.572 m² total surface, in a privately owned plot, in Aspropyrgos, Attica, next to Attica Highway. d) Buildings in Kilkis 1. The (5/8) of a 81 m² apartment, in Kilkis, which remains unoccupied. e) The Company leases the following properties: 1. Warehouse in Egaleo, Attica, totally surfaced 1.262 m², for the period 1.2.2006 – 31.1.2008 . 2. Office – showroom in Municipality of Athens, in Alkifronos 81 street, of 190 m² total surface, for the period 30.05.2003 – 30.05.2009 3. Office – showroom in Municipality of Polichni, Thessaloniki, 600 m². Real Estate Assets of KLEFER S.A. are as follows : Facilities of the Company are situated in the Industrial area of Stavrochori, Kilkis, in a privately owned plot and they include: a) Land Plots in the Industrial area of Stavrochori, Kilkis, of 19.561 m² total surface. b) Buildings in the Industrial area of Kilkis Manufacturing and storage building, totally surfaced 11.547 m² , 1.736 m² of which include administration buildings.
KLEEMANN HELLAS S.A. Financial Statements of 31 December 2006
5
Real Estate Assets of KLEEMANN LIFTOVI D.o.o are as follows : a) Land A plot in Simanovci of Pecinci Municipality, in Belgrade, Serbia in Golubinacka bb street, with a total surface of 10.000 m². b) Buildings Office and storage buildings, totally surfaced 1.028 m², 288 m² of which include administration buildings. KLEEMANN ASANSOR S.A. has no privately owned Real Estate (Land or Buildings), its facilities are located on a third parties’ property , 1.880 m², which are used as warehouses and offices. For the lease of these facilities, the company pays € 72.274,14, on an annual basis. KLEEMANN LIFT Ro SRL has no privately owned Real Estate (Land or Buildings), its facilities are located on a property, provided by the other partner, which are used temporarily as an office. Machinery equipment Companies of the Group are equipped with machinery of latest technology, with high grade of automation and capability of high productivity. Means of transportation The privately owned transportation fleet of the Group, consists of nineteen trucks for transportation of cargo, of various capability (small – large), ten professional cars – vans, used at service operation, six buses, six private cars and six motorcycles for personnel transportation and twenty five internal transportation forklift trucks, automatically or manually operated. Furniture & other equipment Furniture & other equipment include the equipment with all the necessary furniture, office devices and machines, computers and information systems, telecommunication systems equipment and all manufactured showroom exhibits located both in our facilities and third parties-customers’ facilities. Insurance Contracts – Guarantees Group Companies have contracted a range of Insurance contracts, such as contracts for fire protection, civil responsibility on products, profit loss, credits and civil responsibility on transferred freights. It is mentioned that both the Group and the Company have not given any guarantees on third parties.
Management of the Company – Internal auditing Management’s philosophy is: emphasis on the application of operational rules and the adoption of principles concerning management of the Company. The Company is supported operationally by: • Experienced and highly educated senior management • Network of Managerial Information and Communication Systems • Internal Audit Processes • Employment Regulation

KLEEMANN HELLAS S.A. Financial Statements of 31 December 2006
6
Apart from the above, the Company has also developed: • Department of Internal Auditing • Service of Company Statements • Investor Relations Service
Personnel The development of the average personnel number for the examined 3-year period 2004-2006 is presented in the following table
DEVELOPMENT OF GROUP PERSONNEL Expertise 2004 2005 2006 Management – Technical personnel 254 277 289 Labor workers 438 445 469 TOTAL 692 722 758
It is obvious that the employed personnel presents a constant increase, due to the huge development of the Group activities. The Group executives are highly educated and qualified. More specifically, the Company insists on continuous training of its personnel, in order to successfully meet with the increasing market requirements. Moreover, the Management makes efforts and has managed to retain intact relations with its personnel, a fact that contributes to the harmonic operation of the Group.
Investments of the period The Group makes a lot of investments, in order to satisfy successfully all the constantly increasing requirements. In 2006, total investments summed up to 4,227 million Euros. These funds were invested in the enhancement and quality production of the products and they were aimed on the creation of building facilities, enhancement of computer systems and the purchase of mechanical and technical equipment, in general. Both Group and the Company continue to invest in research and development.
INFORMATION ABOUT THE LIFTS MARKET
General Information About The Market Group is activated in the industrial field that is referred to manufacturing and trading lift components. The demand of these products is related directly with the building activity, as well as the number and the type of buildings that are constructed. Based on their business operation, companies of the field may be separated in four categories: Companies producing components This category refers to a large number of small companies, which produce lift components. Companies of lift installation and maintenance These Companies supply the building contractor with the elevator and they undertake its installation as well as its maintenance. Commercial companies of lift components These companies are activated between companies that produce lift components and those that do the installation of the lift systems.

KLEEMANN HELLAS S.A. Financial Statements of 31 December 2006
7
Companies-Suppliers of complete lift systems This is a developed kind of companies that trade components. They can supply the installation companies with a complete package of components.
Competition The market of hydraulic and mechanic elevators, in European level, is controlled by enterprises of two categories: a) Enterprises that produce components, where Kleemann Hellas belongs to, and b) Multinational enterprises which, except for the production of specific components, they take on the installation and maintenance of lift systems, offering completed services. Perspectives of the market The European market seems to be growing rapidly over the last decades, mainly due to the intense building activation. More specifically, future group perspectives are forecasted to be very positive, for the following reasons: 1. The domestic building activity increased significantly during the last years and is still increasing because of the decrease of interest rates and the increase of investments in real estate. 2. The use of elevators has also expanded in small size buildings. 3. The growth of Eastern Europe and Balkan countries, which comprise a brand new and very hopeful market for the Group. 4. The improvement and the expansion of the range of the products. 5. The directive 95/16 by Ε.U. , which inflicts the partial or total replacement of old elevators, due to safety regulations in E.U. 6. The ability of selling Complete Elevator Systems.
Position of Parent Company in the branch Currently, the Company is the largest Company in the sector of main elevator components industrial production in Greece, based on both volume of production and total turnover. Moreover, based on the volume of production, it belongs to the first three places of the corresponding branch in the European market. Competition of internal market mainly comes from importing Companies and small handicrafts that deal with the production of elevator components. Comments and information on Financial Statements The comments and information on financial statements are deduced by the data of the financial statements of the years 2006 & 2005. a) Total Assets of the Group, for the year 2006, summed up to 105,84 mil. € compared to 93,06 mil. € in 2005, showing an increase of 13,7%, which resulted from the increase of 0,41 mil. € in non-current assets and the increase of 12,36 mil. € in current assets. Correspondingly, in 2006, total Assets of the Company summed up to 93,00 mil. €, compared to 82,35 mil € in 2005, showing an increase of 12,9%. This is due to the increase of 0,75 mil. € in non-current assets and the increase of 9,90 mil € in current assets. b) Capital and Liabilities were increased equally in total. The Group presented an increase of 8,78 mil €, in Equity Capital, a decrease of 2,36 mil. € in long-term liabilities and an increase of 6,36 mil. € in short-term liabilities. The corresponding alterations in the accounts of the Company were the increase of 6,32 mil €, in Equity Capital, the decrease of 1,37 mil. € in long-term liabilities and the increase of 5,70 mil. € in short-term liabilities. The following numerical data for the balance sheet accounts for 2006 & 2005, provide a percentage briefing and present the alterations that have occurred during the fiscal year 2006.
KLEEMANN HELLAS S.A. Financial Statements of 31 December 2006
8
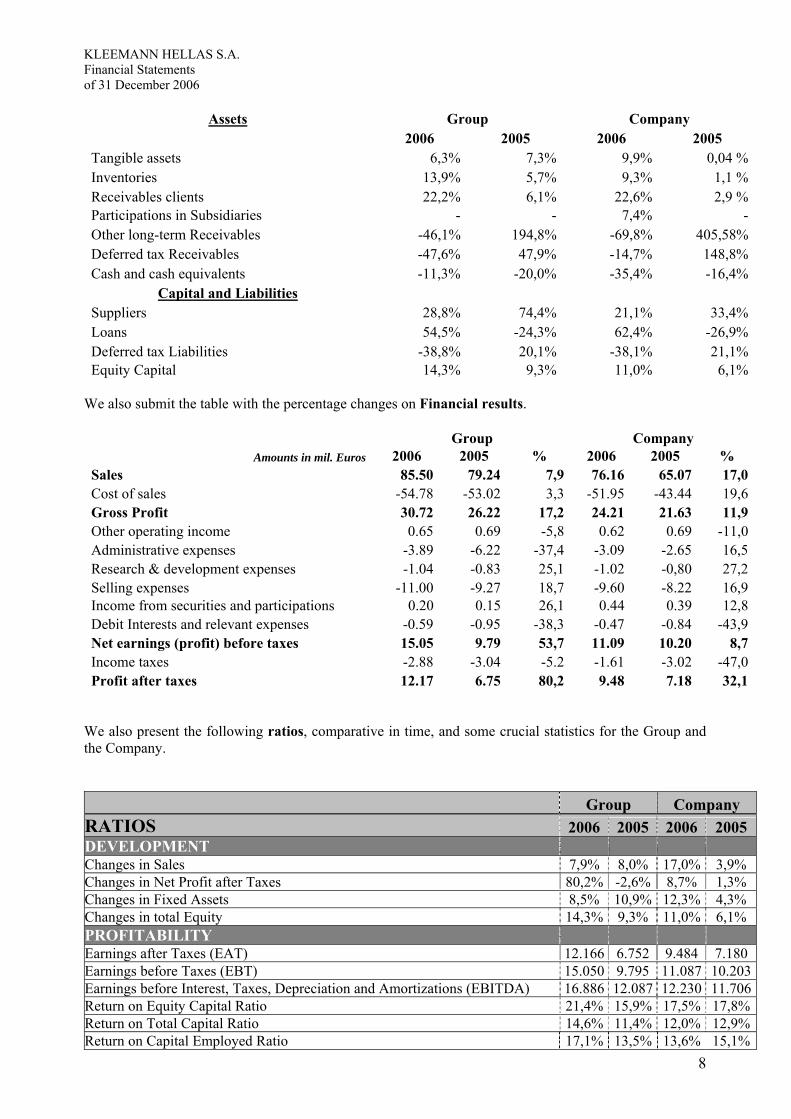
Assets Group Company
2006 2005 2006 2005 Tangible assets 6,3% 7,3% 9,9% 0,04 %Inventories 13,9% 5,7% 9,3% 1,1 %Receivables clients 22,2% 6,1% 22,6% 2,9 %Participations in Subsidiaries - - 7,4% -Other long-term Receivables -46,1% 194,8% -69,8% 405,58%Deferred tax Receivables -47,6% 47,9% -14,7% 148,8%Cash and cash equivalents -11,3% -20,0% -35,4% -16,4%
Capital and Liabilities Suppliers 28,8% 74,4% 21,1% 33,4%Loans 54,5% -24,3% 62,4% -26,9%Deferred tax Liabilities -38,8% 20,1% -38,1% 21,1%Equity Capital 14,3% 9,3% 11,0% 6,1%
We also submit the table with the percentage changes on Financial results. Group Company
Amounts in mil. Euros 2006 2005 % 2006 2005 % Sales 85.50 79.24 7,9 76.16 65.07 17,0Cost of sales -54.78 -53.02 3,3 -51.95 -43.44 19,6Gross Profit 30.72 26.22 17,2 24.21 21.63 11,9Other operating income 0.65 0.69 -5,8 0.62 0.69 -11,0Administrative expenses -3.89 -6.22 -37,4 -3.09 -2.65 16,5Research & development expenses -1.04 -0.83 25,1 -1.02 -0,80 27,2Selling expenses -11.00 -9.27 18,7 -9.60 -8.22 16,9Income from securities and participations 0.20 0.15 26,1 0.44 0.39 12,8Debit Interests and relevant expenses -0.59 -0.95 -38,3 -0.47 -0.84 -43,9Net earnings (profit) before taxes 15.05 9.79 53,7 11.09 10.20 8,7Income taxes -2.88 -3.04 -5.2 -1.61 -3.02 -47,0Profit after taxes 12.17 6.75 80,2 9.48 7.18 32,1
We also present the following ratios, comparative in time, and some crucial statistics for the Group and the Company. Group Company RATIOS 2006 2005 2006 2005 DEVELOPMENT Changes in Sales 7,9% 8,0% 17,0% 3,9% Changes in Net Profit after Taxes 80,2% -2,6% 8,7% 1,3% Changes in Fixed Assets 8,5% 10,9% 12,3% 4,3% Changes in total Equity 14,3% 9,3% 11,0% 6,1% PROFITABILITY Earnings after Taxes (EAT) 12.166 6.752 9.484 7.180 Earnings before Taxes (EBT) 15.050 9.795 11.087 10.203Earnings before Interest, Taxes, Depreciation and Amortizations (EBITDA) 16.886 12.087 12.230 11.706Return on Equity Capital Ratio 21,4% 15,9% 17,5% 17,8%Return on Total Capital Ratio 14,6% 11,4% 12,0% 12,9%Return on Capital Employed Ratio 17,1% 13,5% 13,6% 15,1%

KLEEMANN HELLAS S.A. Financial Statements of 31 December 2006
9
ACTIVITY Receivables turnover Ratio (Clients+Notes+Checks) in days 186,7 174,7 188,4 194,0 Liabilities turnover Ratio (Suppliers+ Notes + Checks.) in days 65,7 46,5 56,5 50,3 Inventories turnover Ratio (in days) 117,5 110,4 106,0 120,5 Operating turnover average duration 304,1 285,1 294,4 314,6 Commercial turnover average duration 238,4 238,6 237,9 264,3 CAPITAL STRUCTURE Ratio of Equity Capital to Total Capital 0,7 0,7 0,7 0,7 Ratio of Owned Liabilities to Total Liabilities 2,0 1,9 2,2 2,3 Banking Loans to Equity capital 0,2 0,2 0,2 0,2 LIQUIDITY Total Liquidity 2,4 2,6 2,8 2,8 Short-term Liabilities to Net Profits 2,6 3,8 2,8 3,0 Short-term Liabilities to Equity Capital 0,5 0,4 0,4 0,4 INVESTING Earnings per Share (EPS) 1,0 0,6 0,8 0,6 Circulating Fund per Share (CFPS) 3,9 3,4 3,5 3,2 Book Value per Share (BVPS) 5,9 5,2 5,4 4,8 Share Price per Share (P/E) 11,3 9,8 13,4 8,9 Estimations for Financial Figures of the Group Turnover Management estimates that consolidated turnover of the year 2007, will reach the level of 97,80 mil. €. For the estimation of sales, which will be increased by approximately 14,4%, the improvement and enlargement in the range of products provided, in combination with the increasing penetration in foreign markets, have been taken into consideration. Moreover, the Group is significantly favored by the E. U. 95/16 Guidance, which will inflict the replacement of old elevators, according to the latest safety rules. According to our estimation, we believe that the optimistic figures of the current year, in combination with a) the integration of productive investments of the 3-year period 2006-2008, which will exceed 11 mil. Euros, b) the penetration into new foreign markets, c) the manufacture of new technologically advanced and innovative products, d) the restructuring of the Company organization, and eventually e) the evolution of wider entrepreneurial cooperations with other Companies of the sector internationally, will affect in an equally significant way the results of next year. Gross Profit Margin Gross Profit margin for 2007 is estimated to be in the same levels, which is more than 30% on sales. Earnings before Taxes Earnings before Taxes, for the year 2007, also taking the previously mentioned parameters into consideration, are expected to reach 15,90 mil. Euros and will mainly come from operating profitability. It has to be mentioned that the maintenance of high profitability is favored by timeless stabilization in the mixture of sales and operating expenses. Long term targets and perspectives The maintenance and enforcement of the leading position of the Group, both in the Greek and European market, as well as its further expansion and the improvement in production and the services offered, are strategic targets of the management. The strategy to accomplish these targets is defined by the following factors: • Cooperation agreements both in home country and overseas. • Restructure of the Company organization and improvement of its information systems.

KLEEMANN HELLAS S.A. Financial Statements of 31 December 2006
10
• Expansion of its international presence, aiming at taking advantage of opportunities that arise
overseas. • Improvement of personnel and cooperators’ information systems. • Fulfillment of its significant investing plan. • Extensive program for investments in Research and Development.
The direct targets of Group’s senior management include: Evolution in home market The Group aims at the expansion of its home market through the increase of its market share.
Increase in Exports International sales of the Group, in 2006, represent 41% of total sales. Parent Company has developed a significant export activity, which represents 35% of its turnover, in 2006. Exports occur in many countries around the world. England, Germany, Belgium, Turkey, Cyprus, Serbia, Ireland, Australia, Russia, Hungary, Estonia, Bulgaria, Poland, Albania, France, Romania, Egypt, Lebanon, Arabian Emirates, Iran, Ukraine etc. are countries in which a large number of elevators of the Company exist and there is a continuous demand for orders. Indicative of the quality and the acceptance of Company products is the fact that the largest part of its exports is directed to England, Germany, Denmark and Belgium, which are the most highly developed European countries, with the strictest specifications in the quality of materials and services.
Penetration in the market of upgrading of old elevator systems Management of KLEEMANN HELLAS processes plans of replacing the mechanisms of existing old elevators, (currently, there are approximately 300.000 elevators, more than 30 years old, a significant part of which requires partial or total replacement), with corresponding hydraulic elevators, offering an improved and safe solution to the market. The proposed package aims to combine flawless operation, low levels of noise, credibility and passenger evacuation, when electricity stops (characteristics of hydraulic elevators), offering reasonable prices for replacement. This fact is expected to be positively accepted by the domestic market. Investing policy Investing policy of the Group is determined by the entrepreneurial plan that has been prepared and the management of the group aims to fulfill. The planned productive investments of the 3-year period 2006-2008 are expected to surpass the amount of 11 mil. Euros. Investing policy of the Group concerns manufacturing of new industrial building facilities, acquisition of advanced technological machinery, acquisition of computer and information systems, installation of systems for saving energy, evolution of an innovative system for electronic sales, acquisition of up to date systems for inventories management and construction of a high trial tower which will help the evolution of high velocity elevating systems. This investing policy aims at:
1. The increase of productive capability of group Companies. 2. The enlargement of produced products. 3. The enhancement in quality of products and services. 4. The better and faster response to the demands of the clients. 5. The improvement in the organization and computerization of the Company.
Distant target of the investing policy that the management of the Group has formed, is the establishment of the already leading position that the company maintains, in the international market of elevators, exploiting the business opportunities that our era offers.

KLEEMANN HELLAS S.A. Financial Statements of 31 December 2006
11
EXPLANATORY REPORT
TO THE ORDINARY GENERAL SHAREHOLDERS’ MEETING OF KLEEMANN HELLAS S.A. ACCORDING TO ARTICLE 11α Ν. 3371/2005
Article 30 of Law 3461/30-5-2006 refers to the adjustment of the existing legislation to the provisions of the 2004/25/ΕΚ regulation by European Board, the new Article 11
α was added to Law Ν.3371/2005,
stating that companies with shares that are listed in the stock exchange are obliged to submit explanatory report to the Ordinary General Shareholders’ Meeting, including analytical information about specific issues. The current explanatory report of the General Meeting to the Ordinary General Shareholders’ Meeting, contains analytical information related with the issues of the first paragraph of 11a Article of Law Ν. 3371/2005. a) Structure of Share Capital of KLEEMANN HELLAS S.A. Share Capital of KLEEMANN HELLAS S.A. comes up to Three Million Nine Hundred Two Thousand Thirty Five Euros and Fifty Cents (3.902.035,50€), divided by eleven million eight hundred twenty four thousand three hundred fifty (11.824.350) ordinary registered shares, with one voting right and nominal value of thirty three cents (0,33€) each. Shares of the Company are listed for negotiation in the Value Market of the Athens Stock Exchange. Each Share of the Company includes all benefits and obligations defined by the Law and Article of Association of the Company, which does not include provisions, more restrictive than what the Law defines. The maintenance of a share title implies by right its owners’ acceptance of the Article of Association of the Company and all the legal decisions of the General Shareholders’ Meetings, even if they have not participated. Article of Association of the Company does not include any special rights in favor of specific shareholders. All shares of the Company are liberally negotiable. Shareholders’ responsibility is restricted to the amount of the nominal value of the shares that they retain and they participate proportionally in the management and the profits of the Company, according to the provisions of the Law and the Article of Association . The benefits and obligations that arise from every share are followed on any total or particular shareholders’ successor. Shareholders can exercise their rights regarding the Management of the Company only through General Meetings. Shareholders hold the right of preference on any future increase of Share Capital of the Company, depending on their participation in the existing share capital, as this is defined in Article 13, paragraph 5 of the Encoded Law 2190/1920. Shareholders’ borrowers and their total or particular successors, can neither cause, under any condition, any abduction or inactivation of any property or the Company logs, nor ask for its settlement and distribution and be involved in any way in its management or its administration. Every shareholder, wherever he may live, concerning his relationship with the Company, is considered to be a permanent resident in its Head Offices and he is liable to Greek Legislation. Any difference between the Company and the shareholders or any other third party is subject to the exclusive responsibility of Greek Courts, while the Company is subject only to the Courts of its Head Offices.

KLEEMANN HELLAS S.A. Financial Statements of 31 December 2006
12
Common shares provide only one voting right. All co-owners of a share, should present a common representative for that share, literally, to the Company, in order to retain the voting right. This representative will stand for them in the General Meeting. Until the representative is appointed, the execution of their rights is postponed. According to the Legislation and the Article of Association of the Company and based on Article 51 of the Law ν. 2396/96, Shareholders that are willing to participate in General Meeting, are: a. All shareholders (owners of de-materialized shares) that have an administrator (Bank or A.S.E.) are obliged to engage their shares, through their administrator and submit the relevant guarantee of share commitment for participation in General Meeting, which is issued by Central Value Warrant, together with any possible documents of representation. b. All shareholders (owners of de-materialized shares) that do not have an administrator, but are enrolled in the special account of the ration, which is operated by Central Value Warrant, are obliged to engage their shares, with a relevant statement directly sent to the Central Value Warrant and submit the above guarantee to the same address, together with any possible documents of representation. c. All shareholders that have not de-materialized their shares are obliged to submit the depository titles to the Head Offices of the Company or to the Deposit and Loans Fund or to any recognized Greek Bank.
The supporting documents of all the above cases should be submitted to the Company at least five (5) working days before the defined assembly of the General Meeting. Shareholders that do not comply with the above, may participate in General Meeting, only with its permission. Shareholders that represent 5% of the deposited Share Capital: a. They have the right to ask the Court of first instance of the Company Head Offices, for the appointment of one or more auditors, especially for the auditing of the Company, according to Articles 40, 40e of Law Ν.2190/1920 and b. They can request the convocation of Irregular Shareholders’ General Meeting. The Board of Directors is obliged to convoke this Meeting in a time period of no more than thirty (30) days from the day that the application to the President of the B.o.D. was submitted. In this application, applicant shareholders are compelled to mention all the issues that the General Meeting will decide for. Ten (10) days before the Ordinary General Meeting, every shareholder can ask for the annual Financial Statements and the relevant reports of the Board of Directors and the Auditors of the Company. The dividend of each share is paid to the Shareholders of the Company, within two (2) months from the date of the Ordinary General Meeting, which approved the annual Financial Statements. The payment is held with the presentation of the Guarantee of Dividend Beneficiary of Anonymous Values in the Offices of the Company or wherever else defined. The method of deposit is announced in the Press. Dividends that are not demanded for more than five years, are statute-barred in favor of State. As far as the procedure of depositing the shares is concerned, the shareholders’ participation to the General Shareholders’ Meetings of the Company and the process of dividend payment, requires the application of everything that the Regulation for the Operation and Liquidation of Immaterial Titles System of the Central Value Warrant defines, as these are in force on any time. b) Restrictions to the transfer of the Company shares. The transfer of the Company shares is held as the Law defines, there are no restrictions, impelled by the Article of Association.
c) Significant direct or indirect participations as these are defined by P.D. 51/1992 The following shareholders hold significant direct or indirect participations, as these are defined by P.D. 51/1992, owning directly or indirectly more than 5% of the total number of Company shares:

KLEEMANN HELLAS S.A. Financial Statements of 31 December 2006
13
SHAREHOLDERS WITH PERCENTAGE >=5% ON 31/12/2006
WITH TOTAL SHARE CAPITAL 11.824.350
A/A NAME NUMBER PERCENTAGE%
1 KOUKOUNTZOS K. NIKOLAOS 2.068.779 17,50
2 KOUKOUNTZOS N. KONSTANTINOS 1.403.500 11,87
3 KOUKOUNTZOS N. NIKOLAOS 1.265.200 10,70
4 KOUKOUNTZOS K. MENELAOS 1.252.250 10,59
5 KOUKOUNTZOU N. EKATERINI 1.096.970 9,28
SUB TOTAL 7.086.699 59,94
REMAINING INVESTORS 4.737.651 40,06
TOTAL NUMBER OF SHARES 11.824.350 100,00 d) Shares that provide special auditing rights. There are not any Company shares that offer special auditing rights to their owners. e) Restriction on voting right. The Article of Association does not inflict any restrictions on the voting right that arises from shares of the Company. f) Agreements between Shareholders The Company is not aware of the existence of any possible agreements between its shareholders, which imply restrictions in the transfer of its shares or the execution of the voting rights that arise from its shares. g) Rules about the appointment and replacement of Board of Directors members and about the Modification of the Article of Association . The rules that the Article of Association of the Company define with respect to the appointment and replacement of Board of Directors members and about the modification of its provisions, are not different from the definitions of Κ.Ν.2190/1920.
h) Authority of the Board of Directors for the issue of new shares or the purchase of owned shares a) According to the provisions of Article 13 Par. 1 Elem. B of Κ.Ν. 2190/1920 and Article 6 of the Article of Association of the Company, after a relevant decision by General Meeting, which is subject to the publicity formalities of the 7b Article of Κ.Ν. 2190/1920, Board of Directors are entitled to increase the share capital of the Company , by issuing new shares, with a decision that requires the priority of at least two thirds (2/3) of total members. In this case, and according to Article 6 of the Article of Association, share capital can be increased up to five times more than its paid up capital or two times more than the approval of the relevant modification of Article 5 of the Article of Association.

KLEEMANN HELLAS S.A. Financial Statements of 31 December 2006
14
b) According to the provisions of Paragraphs 5 through 13, Article 16 of Κ.Ν. 2190/1920, with a decision of their General Shareholders’ Meeting, all listed in Athens Stock Exchange companies can acquire owned shares, up to 10% of their total shares, through Athens Stock Exchange, aiming at the support of their stock price, under special terms and processes as the above paragraphs define. For the implemantation of the relevant decisions taken by the General Meeting, before the commencement of any time period of transactions, with a relevant decision, Board of Directors of the Company defines the basic terms of the transaction and especially the highest number of owned shares that will be purchased, the highest and lowest price and the time period, at which the purchases of the shares will be held. i) Important agreements that come into force, are modified, or expire in the occasion of change of auditing, after public proposal. There are no important agreements that come into force, are modified, or expire in the occasion of change of auditing, after public proposal. j) Agreements with the members of Board of Directors or the personnel of the Company. There are not any special agreements between the Company and the members of its’ Board of Directors or its personnel, which define the deposit of any compensation, especially on the occasion of resignation or dismissal, without reasonable cause for termination either of duty or of employment, because of public proposal. Kilkis, 19 March 2007 President of Board of Directors. Nikolaos K. Koukountzos

KLEEMANN HELLAS S.A. Financial Statements of 31 December 2006 Balance Sheet
15
GROUP COMPANY
NOTE 2006 2005 2006 2005 ASSETS Non-current Assets Tangible Assets 6 26.062.923,36 24.524.034,77 21.092.337,19 19.198.659,36 Intangible Assets 7 168.878,62 109.846,29 148.584,39 52.981,78 Participations in Subsidiaries 9 - - 1.962.390,50 1.826.448,47 Other long-term receivables 12 564.471,76 1.046.338,20 542.706,76 1.794.334,02 Deferred tax receivables 10 773.008,17 1.475.802,06 700.881,17 821.417,49 27.569.281,91 27.156.021,32 24.446.900,01 23.693.841,12 Current Assets Inventories 11 18.772.071,69 16.483.906,20 15.765.881,59 14.423.408,35 Receivable clients 13 53.318.088,78 43.620.085,92 48.639.006,98 39.661.418,06 Other receivables 14 1.564.737,05 544.833,05 1.229.674,51 297.078,54 Investments 8 806.034,96 964.933,88 781.710,96 960.577,88 Cash and cash equivalents 15 3.807.043,40 4.292.926,56 2.140.975,59 3.314.675,03 78.267.975,88 65.906.685,61 68.557.249,63 58.657.157,86 Total Assets 105.837.257,79 93.062.706,93 93.004.149,64 82.350.998,98 EQUITY CAPITAL Equity Capital granted to shareholders Share Capital 16 3.902.035,50 3.902.035,50 3.902.035,50 3.902.035,50 Reserve above par value 16 26.173.118,12 26.173.118,12 26.173.118,12 26.173.118,12 Other Reserves 16 20.484.826,46 18.411.680,79 19.559.907,87 17.735.759,82 Profit carried forward 15.493.250,85 9.369.954,91 13.895.210,66 9.399.318,30 Exchange Rate differences from consolidation of foreign Subsidiaries -2.104,58 99.835,83 - - Total 66.051.126,35 57.956.625,15 63.530.272,15 57.210.231,74 Minority Rights 4.179.092,97 3.497.484,47 - - Total Equity Capital 70.230.219,32 61.454.109,62 63.530.272,15 57.210.231,74 Long-term Liabilities Liabilities from employees’ termination benefits 19 1.225.113,00 1.086.921,01 1.125.607,00 920.357,00 Provisions - 663.711,52 - 663.711,52 Other long-term liabilities 22 780.605,28 1.685.493,38 49.236,20 134.887,88 Deferred tax liabilities 10 1.461.065,44 2.389.029,44 1.337.110,37 2.160.315,45 3.466.783,72 5.825.155,35 2.511.953,57 3.879.271,85 Short-term liabilities Suppliers 20 12.544.867,27 9.739.772,38 9.533.627,24 7.871.098,65 Current tax liabilities 1.342.504,62 3.138.167,79 809.039,56 2.838.121,45 Other liabilities 21 1.425.294,90 2.014.081,78 1.163.169,62 1.032.478,74 Loans 17 16.827.587,96 10.891.420,01 15.456.087,50 9.519.796,55 32.140.254,75 25.783.441,96 26.961.923,92 21.261.495,39 Total liabilities 35.607.038,47 31.608.597,31 29.473.877,49 25.140.767,24 TOTAL EQUITY CAPITAL AND LIABILITIES 105.837.257,79 93.062.706,93 93.004.149,64 82.350.998,98
The notes that are included in pages 20 to 63 are integral part of these Financial Statements.

KLEEMANN HELLAS S.A. Financial Statements of 31 December 2006 Income Statement
16
The notes that are included in pages 20 to 63 are integral part of these Financial Statements.
GROUP COMPANY
NOTE 1 Jan. 06 - 31 Dec. 06
1 Jan. 05 - 31 Dec. 05
1 Jan. 06 - 31 Dec. 06
1 Jan. 05 - 31 Dec. 05
Sales 23 85.500.571,18 79.244.900,68 76.164.744,89 65.074.520,71 Cost of sales 25 -54.778.384,31 -53.028.990,90 -51.955.433,67 -43.444.931,69 Gross Profit 30.722.186,87 26.215.909,78 24.209.311,22 21.629.589,02 Other income / (expenses) (net) 24 651.063,89 693.745,25 618.670,99 694.891,95 Selling Expenses 25 -11.000.878,28 -9.266.852,51 -9.601.275,94 -8.215.343,54 Administration Expenses 25 -3.894.996,29 -6.223.005,66 -3.085.170,68 -2.648.063,57 Research and Development Expenses 25 -1.037.267,15 -829.127,39 -1.019.504,67 -801.690,64 Operating Income 15.440.109,04 10.590.669,47 11.122.030,92 10.659.383,22 Financial income / (expenses) (net) 27 -588.106,25 -953.232,36 -472.067,91 -841.896,89 Income from dividends - 7.664,00 238.518,66 236.127,38 Profit / (loss) from sale of securities 198.111,54 149.802,20 198.111,54 149.802,20 Profit before Taxes 15.050.114,33 9.794.903,31 11.086.593,21 10.203.415,91 Income Tax 28 -2.883.966,08 -3.042.541,98 -1.602.965,30 -3.023.063,19
Net profit of the period from continued operations 12.166.148,25 6.752.361,33 9.483.627,91 7.180.352,72
Attributable to Shareholders of parent company 11.255.588,85 6.536.821,40 9.483.627,91 7.180.352,72 Minority Rights 910.559,40 215.539,93 - - 12.166.148,25 6.752.361,33 9.483.627,91 7.180.352,72
Earnings per share attributed to the shareholders of the parent company for the year (expressed in Euros per share) - Basic 31 0,95 0,55 0,80 0,61

KLEEMANN HELLAS S.A. Financial Statements of 31 December 2006 Statement of changes in Equity Capital
17
The notes that are included in pages 20 to 63 are integral part of these Financial Statements.
GROUP
Reserve Total Share Above Regular Reserves & Exchange rate Profit carried Minority Equity
capital par value reserve readjustment
differences differences forward Total rights Capital Balance 1 January 2005 3.902.035,50 26.173.118,12 1.296.195,63 14.411.060,97 17.182,27 8.186.414,05 53.986.006,54 2.250.374,97 56.236.381,51Amounts directly registered in Equity Capital 1.108.315,41 1.108.315,41 498.499,41 1.606.814,82Profit of the year 6.536.821,40 6.536.821,40 215.539,93 6.752.361,33Tax Auditing differences -388.216,51 -388.216,51 -388.216,51Dividends 2005 -3.145.673,52 -3.145.673,52 -3.145.673,52Regular Reserve 120.049,20 -120.049,20 - -Reserves 2.972.591,50 -3.202.272,41 -229.680,91 229.680,91 -Exchange rate differences from Subsidiaries 82.653,56 6.399,18 89.052,74 39.389.25 128.441,99
Issue of Share Capital - 264.000,00 264.000,00Balance 31 December 2005 3.902.035,50 26.173.118,12 1.416.244,83 16.995.435,96 99.835,83 9.369.954,91 57.956.625,15 3.497.484,47 61.454.109,62 Balance 1 January 2006 3.902.035,50 26.173.118,12 1.416.244,83 16.995.435,96 99.835,83 9.369.954,91 57.956.625,15 3.497.484,47 61.454.109,62Amounts directly registered in Equity Capital 494.678,74 494.678,74 -494.678,74 -Profit of the year 11.255.588,85 11.255.588,85 910.559,40 12.166.148,25Dividends -3.137.439,50 -3.137.439,50 -3.137.439,50Rewards of B.oD. members -207.500,00 -207.500,00 -207.500,00Regular Reserve 36.229,19 -62.863,17 -26.633,98 26.633,98 -Tax-free Reserves 636.916,48 -846.089,98 -209.173,50 209.173,50 -Other Reserves 1.400.000,00 -1.400.000,00 - -Exchange rate differences from Subsidiaries -101.940,41 26.921,00 -75.019,41 -40.079,64 -115.099,05Issue of Share Capital - 70.000,00 70.000,00Balance 31 December 2006 3.902.035,50 26.173.118,12 1.452.474,02 19.032.352,44 -2.104,58 15.493.250,85 66.051.126,35 4.179.092,97 70.230.219,32
KLEEMANN HELLAS S.A. Financial Statements of 31 December 2006 Statement of changes in Equity Capital
18
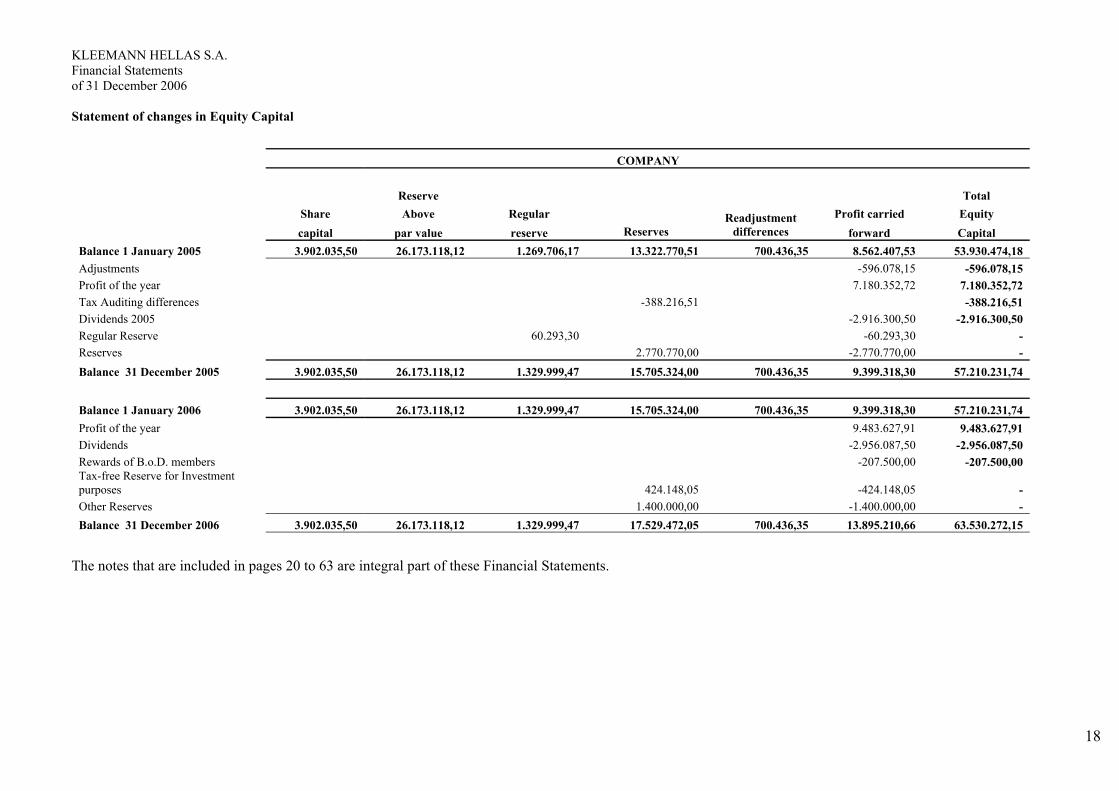
COMPANY
Reserve Total Share Above Regular Profit carried Equity capital par value reserve Reserves
Readjustment differences forward Capital
Balance 1 January 2005 3.902.035,50 26.173.118,12 1.269.706,17 13.322.770,51 700.436,35 8.562.407,53 53.930.474,18 Adjustments -596.078,15 -596.078,15 Profit of the year 7.180.352,72 7.180.352,72 Tax Auditing differences -388.216,51 -388.216,51 Dividends 2005 -2.916.300,50 -2.916.300,50 Regular Reserve 60.293,30 -60.293,30 - Reserves 2.770.770,00 -2.770.770,00 - Balance 31 December 2005 3.902.035,50 26.173.118,12 1.329.999,47 15.705.324,00 700.436,35 9.399.318,30 57.210.231,74 Balance 1 January 2006 3.902.035,50 26.173.118,12 1.329.999,47 15.705.324,00 700.436,35 9.399.318,30 57.210.231,74 Profit of the year 9.483.627,91 9.483.627,91 Dividends -2.956.087,50 -2.956.087,50 Rewards of B.o.D. members -207.500,00 -207.500,00 Tax-free Reserve for Investment purposes 424.148,05 -424.148,05 - Other Reserves 1.400.000,00 -1.400.000,00 - Balance 31 December 2006 3.902.035,50 26.173.118,12 1.329.999,47 17.529.472,05 700.436,35 13.895.210,66 63.530.272,15
The notes that are included in pages 20 to 63 are integral part of these Financial Statements.

KLEEMANN HELLAS S.A. Financial Statements of 31 December 2006 Cash Flow statement
19
Note: The difference that appears between cash and cash equivalents of the Group, in the end of 2005 and cash and cash equivalents in the beginning of 2006, of € 207.302,90 total value, concerns cash and cash equivalents of Leistritz Gmbh Company, which are not consolidated in the current year. The notes that are included in pages 20 to 63 are integral part of these Financial Statements.
GROUP COMPANY
NOTE 1 Jan. 06 - 31 Dec. 06
1 Jan. 05 - 31 Dec. 05
1 Jan. 06 - 31 Dec. 06
1 Jan. 05 - 31 Dec. 05
Cash Flows from operating activities Cash generated from operations 29 5.166.481,49 10.456.138,09 3.308.130,30 9.120.555,91 Interests paid -585.608,36 -452.669,66 -512.180,25 -398.071,30 Income tax paid -4.836.925,72 -2.679.497,39 -4.323.062,18 -2.139.861,81
Net Cash Flows from operating activities -256.052,59 7.323.971,04 -1.527.112,13 6.582.622,80 Cash Flows from investing activities Sales (Purchases) of Tangible Fixed Assets -3.090.430,43 -2.909.159,77 -2.897.817,02 -921.399,65 Sales (Purchases) of Intangible Fixed Assets -126.852,87 -11.019,38 -126.373,38 -16.361,01 Sales (Purchases) of Shares of foreign Subsidiaries - 4.209,13 -135.942,03 -159.673,90 Sales (Purchases) of Securities 357.009,46 21.892,00 376.978,46 - Interests/ Dividends received 380.501,17 259.299,50 379.782,73 259.299,50
Net Cash Flows from investing activities -2.479.772,67 -2.634.778,52 -2.403.371,24 -838.135,06
Cash Flows from financing activities Increase (Decrease) of Bank Loans 5.931.520,36 -3.497.280,06 5.936.290,95 -3.496.753,06 Increase (Decrease) of Share Capital 64.057,97 1.246.116,97 - - Sale (Purchase) of owned Shares - - - - Dividends paid -3.360.859,36 -3.305.285,93 -3.179.507,02 -2.899.931,93 Interests paid -1.238,26 - - -
Net Cash Flows from financing activities 2.633.480,71 -5.556.449,02 2.756.783,93 -6.396.684,99 Inflows/ Outflows from Companies that are not consolidated in the current period - -267.173,00 - - Influence from Exchange Rate differences -176.235,71 60.539,36 - - Net increase / (decrease) in cash and cash equivalents -278.580,26 -1.073.890,14 -1.173.699,44 -652.197,25 Cash and cash equivalents in the beginning of the year 4.085.623,66 5.366.816,70 3.314.675,03 3.966.872,28
Cash and cash equivalents in the end of the year 3.807.043,40 4.292.926,56 2.140.975,59 3.314.675,03

KLEEMANN HELLAS S.A. Financial Statements of 31 December 2006 Notes on Financial Statements of 31 December 2006 (Amounts in Euros, unless otherwise stated). Differences in the total amounts are due to rounding off.
20
1. The Group’s Incorporation and Business: 'KLEEMANN HELLAS S.A. («The Company») was incorporated in 1983 and is registered in the Register of Societes Anonymes under No. 10920/06/Β/86/40. The Company duration is set to 50 years from the date of publication of its Articles of Association, i.e. up to 2027. It has been listed on the Athens Stock Exchange since April 1999. Total number of shares in circulation ,in 31 December 2006, comes up to 11.824.350 and they are all common registered shares . Main activity of KLEEMANN HELLAS S.A. is the manufacturing and trading of complete elevating systems. Company holds a leading position in the manufacturing and trading of complete elevating systems. The Company’s Head Offices and its communication address are located in Greece, in the Industrial Area of Stavrochori, Kilkis, Postal Code 61100. Web site address of the Company is www.kleemann.gr. Financial Statements of the Company for the year that ended in 31 December 2006 include the Individual Financial Statements of KLEEMANN HELLAS and Consolidated Financial Statements of the Company and the Subsidiaries (together referred to as the «Group»). The names of subsidiaries included in consolidation are the following:
Name of Subsidiary Activity
Head Offices
Participation Percentages
31/12/2006
KLEFER S.A. Company that manufactures and trades automatic elevator doors
Industrial area of Kilkis Greece 50%
KLEEMANN ASANSOR S.Α.
Company that trades complete elevator systems Istanbul Turkey 70%
KLEEMANN LIFTOVI D.O.O Company that trades complete elevator systems Belgrade Serbia 60%
KLEEMANN LIFT RO S.R.L. Company that trades complete elevator systems Bucharest Romania 70%
Group is activated in Greece, Turkey, Serbia and Romania. On 16 February 2006, Parent Company sold its 50% share to the corporate capital of "Leistritz Hydraulik GmbH" Company, that held until 31 December 2005. Therefore, the financial results of this Company are not included in the consolidated financial statements of the Group of 31 December 2006. “Kleemann Lift Ro S.R.L” subsidiary was incorporated on 23 November 2006. Parent Company holds a 70% share in its subsidiary, “Kleemann Lift Ro S.R.L”. Financial results of this Company are included, for the first time, in the consolidated financial statements of the Group on 31 December 2006. The Individual and Consolidated Financial Statements as of 31 December 2006 attached were approved for publication by the Company’s Board of Directors on 19 March, 2007 while they stand for approval by the Annual General Shareholders’ Meeting.

KLEEMANN HELLAS S.A. Financial Statements of 31 December 2006 Notes on Financial Statements of 31 December 2006 (Amounts in Euros, unless otherwise stated). Differences in the total amounts are due to rounding off.
21
2. Financial Statements’ basis of preparation (a) Note of Compliance The Financial Statements have been drawn up in accordance with the International Financial Reporting Standards (I.F.R.S.) as they have been adopted by the European Union. (b) Basis of Valuation The Financial Statements were drawn up on the basis of the historical cost principle with the exception of Land and Securities that are recorded at their fair value. The Financial Statements are presented in Euros, unless otherwise stated. (c) Operating Exchange Rate and Presentation The financial statements are expressed in Euros (€), which constitutes the company’s operating currency. All the financial figures are presented in Euros (€). (d) Application of Evaluations and Judgments When drawing up financial statements in accordance with the I.F.R.S. it is necessary for the management to resort to evaluations and judgments that affect the application of accounting policies, as well as the recorded figures regarding assets, liabilities, income and expenses. Actual results may differ from those calculations. The evaluations and the relative assumptions are revised on a continuous basis. These revisions are recognized in the period in which they were made and in future periods if there are any. In the areas where there is uncertainty regarding the evaluations and the decisive judgments concerning the application of accounting policies, with significant impact on the figures recorded in the financial statements, special information is given in the following notes: • Fixed Assets (Note 6) • Intangible Assets (Note 7) • Inventories (Note 11) • Trade and other receivables (Note 13) The accounting policies that are presented below have been consistently applied in all the periods that are presented in these Financial Statements and have been consistently applied by all of the Group’s companies. Some comparative figures have been reclassified, so as to be easily compared with the corresponding figures of the previous year. In the consolidated figures of the Balance Sheet, for the year 2005, there has been reclassification of specific funds. Under Assets, the amount of Euros 1.075.297,54 (Clients’ prepayments) has been transferred from Other Liabilities to Receivables Clients. The amount of Euros 1.405.045,79 (Income tax Prepayments) has been transferred from Other Receivables to current Tax Liabilities and the amount of Euros 286.784,29 ( Suppliers’ Prepayments) has been transferred from other Receivables to Suppliers. With respect to Capital and Liabilities, the remaining reclassifications are as follows: The amount of Euros 4.580.364, (checks payable, notes payable, other trade liabilities) has been transferred from Other Liabilities and placed under Suppliers, the amount of Euros 513.711,52 (Long-term Liability) has been transferred from current tax Liabilities to Provisions and the amount of Euros 74.071,71 (Long-term Notes payable) has been transferred from Other Liabilities to Other Long-term Liabilities.

KLEEMANN HELLAS S.A. Financial Statements of 31 December 2006 Notes on Financial Statements of 31 December 2006 (Amounts in Euros, unless otherwise stated). Differences in the total amounts are due to rounding off.
22
In Company’s Balance Sheet and more specifically in the Assets, there are reclassifications in the amount of Euros 882.620,56 (Clients’ Prepayments) which was transferred from Other Liabilities to Receivables Clients, the amount of Euros 1.179.924,35 (Income taxes Prepayments) that was transferred from Other Receivables to Current Tax Liabilities and Euros 285.449,95 ( Suppliers’ Prepayments) which was transferred from Other Receivables to Suppliers. In the field of Equity Capital and Liabilities, there is a reclassification in the amount of Euros 1.612.225,46 (Checks payables, Long-term Notes) which was transferred from Other Liabilities to Suppliers, the amount of Euros 13.711,52 (long-term Liability) that was transferred from current tax liabilities to Provisions and the amount of Euros 74.071,71 (long-term Notes payable) which was transferred from Other Liabilities to long-term Liabilities. In consolidated results, the account of other operating income is altered into other income / expenses (net), causing some reclassifications of funds and it is finally altered from 981.413,79 Euros to 725.919,54 Euros. This decrease is due to the transfers of Euros 71.755,70 (various irregular expenses) from Administration expenses to other income / expenses (net ), the amount of Euros 60.137,55 (financial revenues) from other income / expenses (net) to financing cost and eventually the amount of Euros 162.601 (debit exchange rate differences) from administration expenses to other income / expenses (net ) and the amount of Euros 39.000 (provision for doubtful receivables) from other income / expenses (net) to selling expenses. In the results of Parent Company, the account of other operating income is altered into other income / expenses (net), causing some reclassifications of funds. Other income / expenses (net) is formed into Euros 694.891,95 from Euros 826.785,20. This decrease is due to the transfer of an amount of Euros 71.755,70 (various irregular expenses) from Administration expenses to other income / expenses (net ) and an amount of Euros 60.137,55 (financial revenues) from other income / expenses (net) to financing cost. In the consolidated Statement of Changes in Equity Capital for the year 2005 and more specifically in the column of Total Equity Capital, the existing amounts are presented together with minority rights, contrary to the released statement of last year, in which minority rights were presented separately and cumulatively. The reclassifications concern a) Amounts straightly registered in Equity Capital from Euros 479.634,90 into Euros 1.606.814,82 , b)Profit of the Year from Euros 6.536.821,40 into Euros 6.364.144,82 , c) Exchange rate differences from Subsidiaries from Euros 99.835,84 into Euros 128.441,99 and d) Issue of Share Capital of Subsidiary from Euros 0 into Euros 264.000,00. In total, Equity Capital and relevant accounts remain equal. In consolidated Cash Flow Statement, reclassifications concern the above amounts for the following a) Increase in Provisions Euros 37.737,68, b) Decrease / (Increase) in Receivables: Euros (67.219,11) c) Increase / (Decrease) in Liabilities Euros (47.702,27) and d) Increase / (Decrease) in Banking Loans Euros 77.183,70. In Company’s Cash Flow Statement, the corresponding reclassifications refer to a) (Increase) / Decrease of Receivables: Euros (177.873,11) ,b) Increase / (Decrease) of Liabilities Euros 100.689,41 and c) Increase / (Decrease) of Banking Loans: Euros 77.183,70.

KLEEMANN HELLAS S.A. Financial Statements of 31 December 2006 Notes on Financial Statements of 31 December 2006 (Amounts in Euros, unless otherwise stated). Differences in the total amounts are due to rounding off.
23
3. Basic Accounting Policies 3.1 Consolidation basis (a) Subsidiary Companies Subsidiaries are the companies controlled by the parent company. Control is exercised when the parent company has the power to reach decisions, directly or indirectly, that concern the subsidiaries’ principles of financial management with the purpose of benefiting from them. The existence of any potential voting rights which may be exercised at the drawing up of the financial statements is taken into account in order to ascertain whether the parent company controls the subsidiaries. The subsidiaries are consolidated in full (integrated consolidation) from the date control over them is acquired and cease to be consolidated from the date that such control ceases to exist. The Company records investments in subsidiaries in the Individual Financial Statements at their acquisition cost less any possible impairment of their value. (b) Transactions Eliminated during Consolidation Inter-group balances and transactions, as well as profits and losses which occurred from inter-group transactions are eliminated during the composition of the consolidated financial statements. Non-realized profits from transactions between the group and its affiliated companies are eliminated by the percentage of the Group’s holding in the affiliated companies. Non-realized losses are eliminated accordingly, unless the transaction provides indications of impairment in the transferred asset. 3.2 Information by sector A business sector is defined as a group of assets and operations providing goods and services which are subject to risks and returns different from those of other business sectors. A geographic sector is defined as a geographical area where goods and services subject to risks and returns different from other areas are provided. 3.3 Foreign Currency (a) Transactions in Foreign Currency Transactions in foreign currency are converted into the operational currency based on the foreign currency’s official rate that prevails on the date the transaction took place. Profits and losses from currency differences deriving after the clearing of such transactions during the fiscal year and after the conversion of currency items expressed in foreign currency at the parity rates prevailing on the date of the balance sheet are recorded in the Profit and Loss Statement. (b) Transactions with Foreign Companies Conversion of the Group’s companies’ financial statements (none of which is in the currency of a hyper inflated economy), that are in a different operational currency than the group’s presentation currency are converted as follows:

KLEEMANN HELLAS S.A. Financial Statements of 31 December 2006 Notes on Financial Statements of 31 December 2006 (Amounts in Euros, unless otherwise stated). Differences in the total amounts are due to rounding off.
24
Assets and liabilities of activities that are carried out abroad, including the goodwill and readjustment of reasonable values that arise during consolidation, are converted to Euros based on the foreign currency’s official rate that prevails on the date of the Balance Sheet. Income and expenses are converted to Euros based on the foreign currency’s average rate during the fiscal year, which reflects the foreign exchange parity that prevails on the date the relative transaction took place. Foreign exchange differences arising from the conversion of the net investment in a foreign business and of the relative offsets are recognized in a different line in the Equity account.
3.4 Tangible Fixed Assets Tangible fixed assets are shown at acquisition cost less accumulated depreciation and any impairment of the value there of., except for Land which is evaluated in fair value. Acquisition cost includes all expenditures that are directly associated with the acquisition of the fixed asset. Later expenditures are recorded as an increase in the accounting value of the tangible fixed assets or as a separate fixed asset only where there is a possibility that the future financial benefits shall flow into the group and their cost may be reliably accounted. Repairs and maintenance costs are recorded in the Profits and Loss Statement when they are carried out. Land is not depreciated. Depreciation on other tangible fixed asset items is calculated by the straight line method during the estimated useful lives of these assets and of their sections thereof. Useful lives range is estimated as follows: Buildings 20-50 years Mechanical equipment 6-20 years Automobiles 10-25 years Other equipment 5-20 years The residual values and the useful life of tangible fixed assets are subject to review on every balance sheet date, if this is deemed necessary. When the accounting values of tangible fixed assets exceed their estimated replacement cost the difference (impairment) is recorded as an expenses in the Profits and Loss Statement. When tangible fixed assets are sold, the differences arising between the proceeds received and their accounting value is recorded as a profit or loss in the Profit and Loss Statement. 3.5. Intangible Fixed Assets
Intangible Fixed Assets concern software licenses. Software licenses are evaluated at acquisition cost less accumulated depreciation, less any accumulated impairment. They are depreciated by the straight line method over their useful life, which is from 3 to 10 years. Expenditure necessary for the development and maintenance of software is recognized as an expense in the Profit and Loss Statement for the year in which it occurs.

KLEEMANN HELLAS S.A. Financial Statements of 31 December 2006 Notes on Financial Statements of 31 December 2006 (Amounts in Euros, unless otherwise stated). Differences in the total amounts are due to rounding off.
25
3.6. Impairment in value of assets
The book value of the Group’s assets is checked for impairment when there are indications that their book value will not be recovered. In this case, the asset’s recoverable amount is determined and if the book value thereof exceeds the estimated recoverable value, an impairment loss is recognized, which is recorded directly in the Profit and Loss Statement. The recoverable value is the greater amount between an asset’s fair value, less the cost that is required for the sale thereof, and the value of the use thereof. In order to estimate the use value, the estimated future cash flows are discounted to the asset’s present value with the use of a discount rate that reflects the market’s current estimations for the cash’s temporal value and for the risks that are associated with these assets. If an asset does not bring significant independent cash flows, the recoverable amount is determined for the cash flow production unit to which the asset belongs. If an impairment loss is recognized, on each balance sheet date the Group examines if the conditions that led to the recognition thereof continue to exist. In this case, the asset’s recoverable value is re-determined and the impairment loss is offset restoring the asset’s book value to its recoverable amount to the extent that this does not exceed its book value (net of depreciation) that would have been determined if an impairment loss had not been recorded. 3.7 Investments Investments are classified according to the purpose for which they were acquired. Management decides on the appropriate classification of the investment when the investment is acquired and reviews the classification at every presentation date. (a) Financial assets at a reasonable value through the Profit and Loss Statement This category includes financial assets acquired for the purpose of being resold soon. Assets in this category are classified as Current Assets if they are held to be traded or if it is expected that they shall be sold within 12 months from the balance sheet date. In this category, owned shares of both Group and Company are included. (b) Investments held till expiry This category includes investments with fixed or pre-determined payments and a specific expiry date which the Group and the Company are intending as far as possible to hold onto until their expiry. (c) Financial assets available for sale This category includes assets which are either designated for this category or cannot be classified in one of the above categories. They are included in non-Current Assets provided Management does not intent to liquidate them within 12 months form the balance sheet date Purchases and sales of investments are recognized on the date of the transaction which is the date the Group and the Company commit themselves to buy or sell the item. Investments are initially recognized at their fair value plus transaction costs. Investments are eliminated when the rights to collect cash flows from the investments expire or are transferred and the Group has materially transferred all risks and benefits inherent in their ownership.

KLEEMANN HELLAS S.A. Financial Statements of 31 December 2006 Notes on Financial Statements of 31 December 2006 (Amounts in Euros, unless otherwise stated). Differences in the total amounts are due to rounding off.
26
3.8 Inventories Inventories are evaluated at the lower, per item, price between the acquisition cost and net liquidation value. Acquisition cost is designated by the FIFO method. Net liquidation value is evaluated on the basis of current stock sale prices in the context of usual business after subtracting any cost of completion and sale where there is such a case. Eliminations are recognized in the Profit and Loss Statement of the year in which they occur. 3.9 Customers and Other Current Receivables Customer account receivables are recorded at cost and are controlled on an annual basis for impairment. Impairment losses are recorded when there is an objective indication that the Group and the Company are not in a position to collect all the sums owed on the basis of contractual terms. The provision figure is recorded as an expense in the Profit and Loss Statement. Possible deletions of receivables from accounts receivables are effected through the provision that has been formed. Receivables that are deemed as doubtful are deleted. 3.10 Cash and Cash Equivalents Cash and cash equivalents include cash balance and short term bank deposits. 3.11 Loans Loans are initially recorded at their fair value. Following their initial recording they are monitored at their outstanding balance. Loans are classified as Current Liabilities unless the Group and the Company have the right to postpone final settlement of the liability for at least 12 months from the date of the balance sheet. In this case they are classified as Long-term Liabilities. 3.12 Income Tax Income tax of the fiscal year is comprised of both current and deferred tax. Income tax is recorded in the Profit and Loss Statement unless it concerns amounts that are directly recorded in Equity, in which case it is recorded in Equity.
Current income tax is the expected payable tax against taxable income of the fiscal year, based on the instituted tax rates on the balance sheet date, as well as any readjustment to the payable tax of previous fiscal years. Deferred income tax is calculated by the balance sheet method, based on the balance sheet, which derives from the provisional differences between the accounting value and the tax base of assets and liabilities. Deferred income tax is not accounted for if it derives from the initial recognition of an asset or liability item in a transaction, apart from a business merger, which when the transaction took place, affected neither the accounting nor the taxation profit or loss. Deferred tax is calculated using the tax rates which are expected to be in force in the period when the asset shall be liquidated or the liability settled. The usage of future tax rates is based on laws which have been passed at the date of drawing up the financial statements.

KLEEMANN HELLAS S.A. Financial Statements of 31 December 2006 Notes on Financial Statements of 31 December 2006 (Amounts in Euros, unless otherwise stated). Differences in the total amounts are due to rounding off.
27
Deferred tax claims are recognized in the extent to which there shall be a future tax profit for the use of the provisional difference establishing the deferred tax claim. Deferred tax claims are reduced when the respective tax benefit is materialized. Additional income taxes which emerge from the distribution of dividends are set in the same time with the obligatory payment of the relevant dividend. 3.13 Personnel Fringe Benefits (a) Liabilities arising from the provisions of the Law 2112/1920, according to IAS 19. The liability recorded in financial statements with regard to established benefit plans is the present value of the accrued benefits, taking any adjustments for potential actuarial results (profits/losses) and the cost of previous service into consideration. The sum of the liability is calculated annually by an actuarial project, which is executed by independent actuarial company, applying the projected unit credit method. The present value is defined by discounting the estimated future cash flows with the rate of a high credibility-grading bond, which is issued in the same currency as the one of the benefit and its remaining duration approaches the duration of the relevant liability. Accumulated actuarial profits / losses that arise from the deviation between estimations and experience and from the alteration in the actuarial assumptions applied, are depreciated in a period equal to the employees’ average remaining working life, to the extent that they do not exceed 10% of the higher between accrued liabilities and the fair value of the fixed assets of the plan. The actuarial profit and loss arising for the adjustments based on historical data over or under 10% margin of the accumulated liability is recorded in the Profit and Loss Statement within the expected average insurance time of the plan’s participants. The cost of previous service is recorded directly in the Profit and Loss Statement with the exception of the case where variations in the plan depend on the remaining time of service of employees. In this case the cost of previous service is recorded in the Profit and Loss Statement by the straight line method over the maturity period. (b) Defined Contribution Plan The duties towards benefits in Defined Contribution Plan are registered as an expense in the profits and loss statement during their year of realization. 3.14 State Subsidies State subsidies are recognized at their fair value when it is expected with certainty that they shall be collected and the Group and the Company shall comply with all terms provided. State subsidies regarding expenses, are deferred and recognized in the Profit and Loss Statement so as to correspond to the expenses they are designated to indemnify. State subsidies related to the purchase of tangible fixed assets are included in Long-term Liabilities as deferred state subsidies and are transferred as gains to the Profit and Loss Statement by the straight line method over the expected useful life of the relative assets.

KLEEMANN HELLAS S.A. Financial Statements of 31 December 2006 Notes on Financial Statements of 31 December 2006 (Amounts in Euros, unless otherwise stated). Differences in the total amounts are due to rounding off.
28
3.15 Provisions Provisions are recognized when the Group has a present commitment (legal or justified) for which a cash outflow may arise for its settlement. Moreover, the amount of this commitment must be able to be determined with a significant degree of reliability. Provisions are re-examined on each balance sheet date and if it is deemed that no cash outflow shall arise for the commitment’s settlement, a reverse entry must be made for these provisions. Provisions are used solely for the purposes for which they were initially formed. Provisions for future losses are not recognized. Contingent claims and liabilities are not recognized in the Financial Statements.
3.16 Recognition of Income Income includes the fair value of sales of goods and services, net of Value Added Tax, discounts and returns. The Group’s inter-company income is fully eliminated. Income is recognized as follows: (a) Sale of goods The sale of goods is recognized when the significant risks and property benefits have been transferred to the buyer, the collection of the amount to be received is deemed reasonably ensured, the relevant expenses and possible returns of goods can be reliably evaluated and there is no continuing involvement in the management of goods. (b) Services Income from services is recognized in the period in which these services are rendered, on the basis of the completion stage of the service provided with relation to services provided overall. (c) Interest income Interest income is recognized when interest is rendered accrued (based on the actual interest rate method). (d) Income from dividends Dividends are accounted as income upon the approval of their distribution by the General Shareholders’ Meeting 3.17 Financial income-expenses (net) Net financial expenditures are comprised of debit interest on loans as well as foreign exchange profits/losses that arise from the companies’ lending. In addition, they also include income from accrued credit interest from invested cash. 3.18 Leases Leases where the material risks and benefits of ownership are preserved by the leaser are classified as operational leases. Payments for operational leases are recognized in the Profit and Loss Statement on a fixed basis throughout the life of the lease. 3.19 Dividends Dividends that are distributed to the parent Company’s shareholders are recognized as a Liability in the Financial Statements when the distribution is approved by the General Shareholders’ Meeting.

KLEEMANN HELLAS S.A. Financial Statements of 31 December 2006 Notes on Financial Statements of 31 December 2006 (Amounts in Euros, unless otherwise stated). Differences in the total amounts are due to rounding off.
29
3.20 Earnings per share The basic earnings per share are estimated by dividing the earnings or losses, which correspond to the common shares holders, with the weighted average number of common shares that stand over during the period. 3.21 Report per Sector A business sector is defined as a part of the Group that is active either in the production of relevant goods or services (activity sector) or in the provision goods or services in a specific financial environment (geographical sector) which are subject to risks and returns different from those of other business sectors. The basic Group financial reporting as per sector is based on activities. 3.22 Financial Risk Sector The Group and the Company are exposed to financial risk, such as market risks (fluctuations in exchange rates, interest rates, and market prices), credit risk and liquidation risk. The general risk management program of the Group and the Company focus on the unpredictability of the financial markets and attempts to minimize their possible negative influence on the financial performance of the Group and the Company. The risk management is processed centrally by a qualified service of the Group KLEEMANN, which operates under specific orders that have been approved by the Operational Regulation. The Board of directors offers instructions and guidance, for the general management of risk, as well as special instructions for the management of specific risks such as exchange rate risk, interest rate risk and credit risk. (a) Market Risk The Group and the Company are mainly active in Europe and thus the largest part of its transactions takes place in Euros (€).However, they are exposed to restricted exchange rate risk, which principally arises from US Dollars. This risk mainly comes from future transactions, receivables and liabilities in foreign currency. (b) Credit Risk The Group and the Company have established and implemented credit control procedures which aim in minimizing any bad debt and the immediate cover of demands through securities. No client surpasses 5% of turnover and thus the trade risk is spread-out over a large number of clients. Wholesales are made to clients with an evaluated credit history. The Company sets credit limits per client and certain sales and collection terms are applied. Where this is possible, real or other securities are asked for. (c) Liquidity Risk Liquidity risk is held at low levels through the availability of adequate cash and credit lines in the associate banks. (d) Interest Rates Fluctuation Risk The loans of the Group and the Company are connected with floating rates which according to market conditions can either remain floating or be converted into fixed rates.

KLEEMANN HELLAS S.A. Financial Statements of 31 December 2006 Notes on Financial Statements of 31 December 2006 (Amounts in Euros, unless otherwise stated). Differences in the total amounts are due to rounding off.
30
3.23 New Standards and Interpretations Which Have Not Yet Been Adopted The new standards, standards’ amendments and interpretations which are not in effect by 31 December 2006, and have not been implemented in the preparation of the financial statements are as follows: • IFRS 7 Financial Instruments: Disclosures and adjustment in IAS 1 Presentation of Financial Statements: Capital Disclosures require thorough disclosures regarding the significance of financial instruments in the financial position and the performance of an entity, as well as the qualitative and quantitative information on the nature and extent of the risks. I.F.R.S. 7 and the amended IAS 1, which will be compulsory for the Group’s financial statements of 2007, will require extensive additional disclosure regarding the financial instruments and the share capital of the Group. • IFRS 8 Operational Activity Sectors: IFRS 8 replaces IAS 14 and specifies how an entity must present information regarding the operating sectors in the Financial Statements and following the revision of IAS 34 Interim Financial Presentation, requires an entity to present selectively information relevant to its operating sectors in the Interim Financial Statements. Furthermore it sets the requirements of relevant disclosures for the products and services, the geographical area and the significant clients. IFRS 8 is compulsory for the Group’s financial statements of 2009. • IFRIC 7: Applying the Restatement Approach under IAS 29 Financial Reporting in Hyperinflationary Economies, refers to IAS 29, when an economy becomes hyper-inflated for the first time and specifically the accounting for deferred taxes. IFRIC 7, which will become compulsory for the Group’s financial statements in 2007, is not expected to have an effect on the consolidated financial statements. • IFRIC 8 Scope of IFRS 2 Payments in Shares refers to the accounting for payment transactions in shares where some or all of the goods and services which were acquired cannot be specified. IFRIC 8 will be compulsory for the Group’s financial statements of 2007 and is not expected to have a significant effect on the consolidated financial statements. • IFRIC 9 Re-measurement of embedded derivatives requires the redefinition of whether an embedded derivative has to be separated from the basic contract, when there are modifications to the contract. IFRIC 9 which will be compulsory for the Group’s financial statements of 2007 and is not expected to have a significant effect on the consolidated financial statements. • IFRIC 10 Interim Financial Statements and Impairment, prohibits the reversal of impairments which were recognized in a previous intermediary period regarding goodwill, investment in holding titles or financial instrument evaluated at cost. IFRIC 10 will be compulsory for the Group’s financial statements of 2007. • IFRIC 11 – IFRS 2 Group and Treasury Share Transactions, refers to the accounting treatment of specific, relevant transactions and whether these should be presented as transactions through a cash or share settlement, as is specified by IFRS 2. The application of IFRIC 11 concerns the fiscal year 2008. • IFRIC 12 Services Concession Arrangements, refers to the concession of services between public and private entities and concerns fiscal year 2008.

KLEEMANN HELLAS S.A. Financial Statements of 31 December 2006 Notes on Financial Statements of 31 December 2006 (Amounts in Euros, unless otherwise stated). Differences in the total amounts are due to rounding off.
31
4. Report per Sector The reports per sector concern the business and geographical sectors of the Group. The main business sectors of the Group are Manufacture, Trade and Other Revenues. Activities in Home country and Overseas are considered to be Geographical sectors of the Group.

KLEEMANN HELLAS S.A. Financial Statements of 31 December 2006
Notes on Financial Statements of 31 December 2006 (Amounts in Euros, unless otherwise stated). Differences in the total amounts are due to rounding off.
32
Business activity sectors of the Group Total Total
Manufacture Trade Other Consolidation Registrations
1 Jan - 31 December 06
Manufacture Trade Other Consolidation Registrations
1 Jan - 31 December 05
Proceeds from Group Clients 61.246.531,53 31.925.020,72 3.842.434,15 97.013.986,40
55.923.468,17 30.531.562,38 3.593.307,86 90.048.338,41
Inter-company sales -10.355.295,17 -670.542,18 -487.577,87 -11.513.415,22 -11.513.415,22 -9.080.070,37 -992.396,87 -730.970,49 -10.803.437,73 -10.803.437,73
Total Sales 50.891.236,36 31.254.478,54 3.354.856,28 - 85.500.571,18 46.843.397,80 29.539.165,51 2.862.337,37 - 79.244.900,68 Cost of Sales -41.944.643,40 -22.689.322,91 -2.636.879,45 -67.270.845,77 -38.368.504,85 -21.764.981,31 -2.422.874,00 -62.556.360,16
Inter-company cost of Sales 11.235.860,37 727.561,91 529.039,18 12.492.461,46 12.492.461,46
8.007.560,69 875.178,04 644.630,53 9.527.369,26 9.527.369,26
Gross Profit 20.182.453,33 9.292.717,54 1.247.016,01 - 30.722.186,87 16.482.453,65 8.649.362,23 1.084.093,90 - 26.215.909,78
Other income / (expenses) (net) 702.547,41 -51.483,52 651.063,89
709.890,15 -16.144,90 693.745,25
Selling expenses -7.103.838,59 -3.450.483,34 -446.556,35 -11.000.878,28
-6.093.187,64 -2.761.859,90 -427.949,86 16.144,90 -9.266.852,51
Administration expenses -3.940.537,78 45.541,49 -3.894.996,29
-6.223.005,66 -6.223.005,66 Research and development expenses -1.037.267,15 -1.037.267,15
-829.127,39 -829.127,39
Operating income 12.041.347,59 5.842.234,19 -2.437.530,71 -5.942,03 15.440.109,04
9.560.138,62 5.887.502,33 -4.856.971,48 - 10.590.669,47
Financial income / (expenses) (net) -588.106,25 -588.106,25
-953.232,36 -953.232,36
Income from dividends 238.518,66 -238.518,66 - 236.127,38 -228.463,38 7.664,00
Profit / (loss) from sale of securities 198.111,54 198.111,54
149.802,20 149.802,20
Profit before Taxes 12.041.347,59 5.842.234,19 -2.589.006,76 -244.460,69 15.050.114,33 9.560.138,62 5.887.502,33 -5.424.274,26 -228.463,38 9.794.903,31
Income Tax -2.883.966,08 -2.883.966,08 -3.536.379,25 493.837,27 -3.042.541,98
Profit after Taxes 12.041.347,59 5.842.234,19 -5.472.972,84 -244.460,69 12.166.148,25 9.560.138,62 5.887.502,33 -8.960.653,51 265.373,89 6.752.361,33

KLEEMANN HELLAS S.A. Financial Statements of 31 December 2006
Notes on Financial Statements of 31 December 2006 (Amounts in Euros, unless otherwise stated). Differences in the total amounts are due to rounding off.
33
Business activity sectors of the Company
Total Total
Manufacture Trade Other 1 Jan -
31 December 06
Manufacture Trade Other 1 Jan -
31 December 05 Proceeds from Company Clients 51.423.312,20 21.501.240,29 3.240.192,40 76.164.744,89
43.486.140,50 18.469.482,96 3.118.897,25 65.074.520,71
Cost of Sales -35.076.494,71 -14.663.131,84 -2.215.807,12 -51.955.433,67 -29.203.589,28 -12.158.055,87 -2.083.286,54 -43.444.931,69
Gross Profit 16.346.817,49 6.838.108,45 1.024.385,28 24.209.311,22 14.282.551,22 6.311.427,09 1.035.610,71 21.629.589,02 Other income / (expenses) (net) 618.670,99 618.670,99
694.891,95 694.891,95
Selling expenses -6.482.387,76 -2.710.431,73 -408.456,45 -9.601.275,94 -5.489.914,94 -2.331.682,91 -393.745,69 -8.215.343,54
Administration expenses -3.085.170,68 -3.085.170,68
-2.648.063,57 -2.648.063,57 Research and development expenses -1.019.504,67 -1.019.504,67
-801.690,64 -801.690,64
Operating income 8.844.925,06 4.127.676,72 -1.850.570,86 11.122.030,92
7.990.945,64 3.979.744,18 -1.311.306,61 10.659.383,22 Financial income / (expenses) (net) -472.067,91 -472.067,91
-841.896,89 -841.896,89
Income from dividends 238.518,66 238.518,66
236.127,38 236.127,38
Profit / (loss) from sale of securities 198.111,54 198.111,54
149.802,20 149.802,20
Profit before Taxes 8.844.925,06 4.127.676,72 -1.886.008,57 11.086.593,21 7.990.945,64 3.979.744,18 -1.767.273,92 10.203.415,91
Income Tax -1.602.965,30 -1.602.965,30 -3.023.063,19 -3.023.063,19
Profit after Taxes 8.844.925,06 4.127.676,72 -3.488.973,87 9.483.627,91 7.990.945,64 3.979.744,18 -4.790.337,11 7.180.352,72

KLEEMANN HELLAS S.A. Financial Statements of 31 December 2006
Notes on Financial Statements of 31 December 2006 (Amounts in Euros, unless otherwise stated). Differences in the total amounts are due to rounding off.
34
Geographical activity sectors of the Group Total Total
Home country Overseas Other Consolidation Registrations
1 Jan - 31 December 06
Home country Overseas Other Consolidation Registrations
1 Jan - 31 December 05
Proceeds from Group Clients 55.672.066,77 41.341.919,63 97.013.986,40
49.853.322,86 40.195.015,55 90.048.338,41
Inter-company sales -5.634.765,35 -5.878.649,87 -11.513.415,22 -11.513.415,22 -4.375.205,88 -6.428.231,85 -10.803.437,73 -10.803.437,73 Total Sales 50.037.301,42 35.463.269,76 - - 85.500.571,18 45.478.116,98 33.766.783,70 - - 79.244.900,68 Cost of Sales -38.072.966,90 -29.197.878,87 -67.270.845,77 -33.490.544,27 -29.065.815,89 -62.556.360,16 Inter-company cost of Sales 6.113.919,08 6.378.542,38 12.492.461,46 12.492.461,46
3.858.420,17 5.668.949,09 9.527.369,26 9.527.369,26
Gross Profit 18.078.253,60 12.643.933,27 - - 30.722.186,87 15.845.992,88 10.369.916,90 - - 26.215.909,78 Other income / (expenses) (net) 702.547,41 -51.483,52 651.063,89
709.890,15 -16.144,90 693.745,25
Selling expenses -6.662.963,19 -4.337.915,09 -11.000.878,28 -6.060.537,70 -3.222.459,71 16.144,90 -9.266.852,51
Administration expenses -3.940.537,78 45.541,49 -3.894.996,29
-6.223.005,66 -6.223.005,66 Research and development expenses -679.072,82 -358.194,33 -1.037.267,15
-576.768,51 -252.358,88 -829.127,39
Operating income 10.736.217,59 7.947.823,85 -3.237.990,37 -5.942,03 15.440.109,04
9.208.686,67 6.895.098,31 -5.513.115,51 - 10.590.669,47 Financial income / (expenses) (net) -588.106,25 -588.106,25
-953.232,36 -953.232,36
Income from dividends 238.518,66 -238.518,66 -
236.127,38 -228.463,38 7.664,00
Profit / (loss) from sale of securities 198.111,54 198.111,54
149.802,20 149.802,20
Profit before Taxes 10.736.217,59 7.947.823,85 -3.389.466,42 -244.460,69 15.050.114,33
9.208.686,67 6.895.098,31 -6.080.418,29 -228.463,38 9.794.903,31
Income Tax -2.883.966,08 -2.883.966,08
-3.536.379,25 493.837,27 -3.042.541,98
Profit after Taxes 10.736.217,59 7.947.823,85 -6.273.432,50 -748.360,62 12.166.148,25
9.208.686,67 6.895.098,31 -9.616.797,54 265.373,89 6.752.361,33
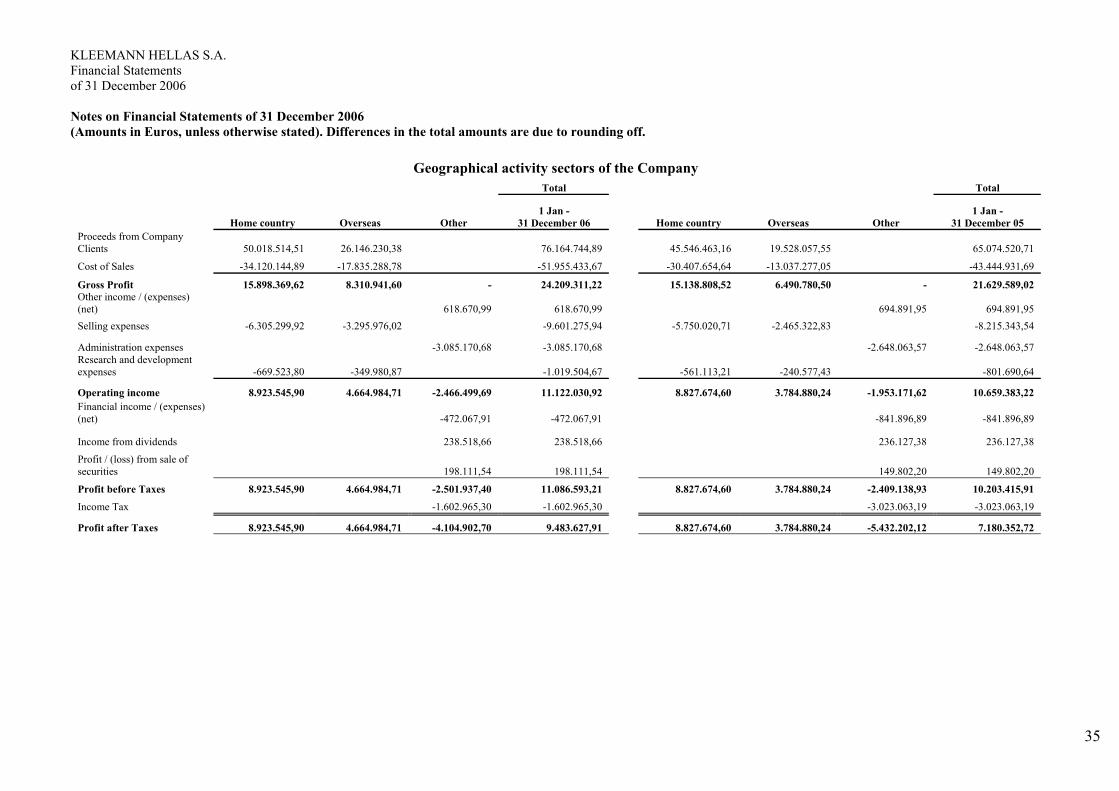
KLEEMANN HELLAS S.A. Financial Statements of 31 December 2006
Notes on Financial Statements of 31 December 2006 (Amounts in Euros, unless otherwise stated). Differences in the total amounts are due to rounding off.
35
Geographical activity sectors of the Company Total Total
Home country Overseas Other 1 Jan -
31 December 06
Home country Overseas Other 1 Jan -
31 December 05 Proceeds from Company Clients 50.018.514,51 26.146.230,38 76.164.744,89
45.546.463,16 19.528.057,55 65.074.520,71
Cost of Sales -34.120.144,89 -17.835.288,78 -51.955.433,67 -30.407.654,64 -13.037.277,05 -43.444.931,69
Gross Profit 15.898.369,62 8.310.941,60 - 24.209.311,22 15.138.808,52 6.490.780,50 - 21.629.589,02 Other income / (expenses) (net) 618.670,99 618.670,99
694.891,95 694.891,95
Selling expenses -6.305.299,92 -3.295.976,02 -9.601.275,94 -5.750.020,71 -2.465.322,83 -8.215.343,54
Administration expenses -3.085.170,68 -3.085.170,68
-2.648.063,57 -2.648.063,57 Research and development expenses -669.523,80 -349.980,87 -1.019.504,67
-561.113,21 -240.577,43 -801.690,64
Operating income 8.923.545,90 4.664.984,71 -2.466.499,69 11.122.030,92
8.827.674,60 3.784.880,24 -1.953.171,62 10.659.383,22 Financial income / (expenses) (net) -472.067,91 -472.067,91
-841.896,89 -841.896,89
Income from dividends 238.518,66 238.518,66
236.127,38 236.127,38
Profit / (loss) from sale of securities 198.111,54 198.111,54
149.802,20 149.802,20
Profit before Taxes 8.923.545,90 4.664.984,71 -2.501.937,40 11.086.593,21 8.827.674,60 3.784.880,24 -2.409.138,93 10.203.415,91
Income Tax -1.602.965,30 -1.602.965,30 -3.023.063,19 -3.023.063,19
Profit after Taxes 8.923.545,90 4.664.984,71 -4.104.902,70 9.483.627,91 8.827.674,60 3.784.880,24 -5.432.202,12 7.180.352,72

KLEEMANN HELLAS S.A. Financial Statements of 31 December 2006
Notes on Financial Statements of 31 December 2006 (Amounts in Euros, unless otherwise stated). Differences in the total amounts are due to rounding off.
36
Business activity sectors of the Group Total Total
Manufacture Trade Other Consolidation Registrations
1 Jan - 31 December 06
Manufacture Trade Other Consolidation Registrations
1 Jan - 31 December 05
ASSETS
Tangible Assets 11.297.645,40 4.288.171,04 10.477.106,92 26.062.923,36 10.050.629,62 4.026.776,58 10.446.628,57 24.524.034,77
Intangible Assets 35.671,21 13.414,19 119.793,22 168.878,62 33.967,02 17.071,40 58.807,87 109.846,29
Inventories 13.685.537,55 5.670.199,92 -583.665,78 18.772.071,69 7.837.508,58 10.189.639,09 -1.543.241,47 16.483.906,20
Receivables 57.172.371,45 -3.854.282,67 53.318.088,78 47.329.366,59 -3.709.280,67 43.620.085,92
Investments 806.034,96 806.034,96 964.933,88 964.933,88
Other figures of assets 8.671.650,88 -1.962.390,50 6.709.260,38 9.462.271,89 -2.102.372,02 7.359.899,88
Total Assets 25.018.854,16 9.971.785,15 77.246.957,43 -6.400.338,95 105.837.257,79
17.922.105,22 14.233.487,06 68.262.008,80 -7.354.894,16 93.062.706,94
CAPITAL AND LIABILITIES
Suppliers 16.399.149,94 -3.854.282,67 12.544.867,27 13.449.053,05 -3.709.280,67 9.739.772,38
Profit of the period 11.588.134,32 5.812.887,02 -4.990.412,40 -1.155.020,09 11.255.588,85 9.560.138,62 5.887.502,34 -8.960.653,51 49.603,59 6.536.591,04
Profit carried forward 4.400.502,84 3.328.348,98 -3.309.960,04 -1.028.008,97 3.390.882,81
2.171.441,86 1.737.367,90 -2.367.427,53 463.557,52 2.004.939,75 Other figures of Capital and Liabilities 83.338.375,06 -4.692.456,20 78.645.918,86
77.664.570,63 -2.883.166,86 74.781.403,77
Total Capital and Liabilities 15.988.637,16 9.141.236,00 91.437.152,56 -10.729.767,93 105.837.257,79
11.731.580,48 7.624.870,24 79.785.542,64 -6.079.286,43 93.062.706,94

KLEEMANN HELLAS S.A. Financial Statements of 31 December 2006
Notes on Financial Statements of 31 December 2006 (Amounts in Euros, unless otherwise stated). Differences in the total amounts are due to rounding off.
37
Business activity sectors of the Company Total Total
Manufacture Trade Other 1 Jan -
31 December 06
Manufacture Trade Other 1 Jan -
31 December 05
ASSETS
Tangible Assets 7.537.453,27 3.312.327,99 10.242.555,93 21.092.337,19 6.015.756,36 2.978.385,57 10.204.517,43 19.198.659,36 Intangible Assets 35.671,21 9.473,19 103.439,99 148.584,39 13.101,98 39.879,80 52.981,78 Inventories 10.902.097,11 4.863.784,48 15.765.881,59 5.446.998,06 8.976.410,29 14.423.408,35 Receivables 48.639.006,98 48.639.006,98 39.661.418,06 39.661.418,06 Investments 781.710,96 781.710,96 960.577,88 960.577,88 Other figures of assets 6.576.628,53 6.576.628,53 8.053.953,55 8.053.953,55
Total Assets 18.475.221,59 8.185.585,66 66.343.342,39 93.004.149,64 11.475.856,40 11.954.795,86 58.920.346,72 82.350.998,98
CAPITAL AND LIABILITIES Suppliers 9.533.627,24 9.533.627,24 7.871.098,65 7.871.098,65 Profit of the period 8.844.925,06 4.127.676,72 -3.488.973,87 9.483.627,91 7.990.945,64 3.979.744,18 -4.790.337,11 7.180.352,72
Profit carried forward 4.614.772,79 2.298.303,10 -2.766.420,69 4.146.655,21
2.174.630,18 1.083.034,75 -1.303.626,90 1.954.038,04 Other figures of Capital and Liabilities 69.840.239,28 69.840.239,28 65.345.509,57 65.345.509,57
Total Capital and Liabilities 13.459.697,85 6.425.979,83 73.118.471,96 93.004.149,64 10.165.575,83 5.062.778,93 67.122.644,22 82.350.998,98

KLEEMANN HELLAS S.A. Financial Statements of 31 December 2006
Notes on Financial Statements of 31 December 2006 (Amounts in Euros, unless otherwise stated). Differences in the total amounts are due to rounding off.
38
Geographical activity sectors of the Group Total Total
Home
country Overseas Other Consolidation Registrations
1 Jan - 31 December 06
Home country Overseas Other Consolidation Registrations
1 Jan - 31 December 05
ASSETS
Tangible Assets 26.062.923,36 26.062.923,36 24.524.034,77 24.524.034,77 Intangible Assets 168.878,62 168.878,62 109.846,29 109.846,29 Inventories 19.355.737,47 -583.665,78 18.772.071,69 18.027.147,67 -1.543.241,47 16.483.906,20 Receivables 43.744.350,66 13.428.020,79 -3.854.282,67 53.318.088,78 35.862.115,07 11.467.251,52 -3.709.280,67 43.620.085,92 Investments 781.710,96 24.324,00 806.034,96 960.577,88 4.356,00 964.933,88 Other figures of assets 8.671.650,88 -1.962.390,50 6.709.260,38 9.462.271,89 -2.102.372,02 7.359.899,87
Total Assets 44.526.061,62 13.452.344,79 54.259.190,33 -6.400.338,95 105.837.257,79 36.822.692,95 11.471.607,52 52.123.300,62 -7.354.894,16 93.062.706,93
CAPITAL AND LIABILITIES Suppliers 6.412.269,47 9.986.880,47 -3.854.282,67 12.544.867,27 4.370.888,51 9.078.164,54 -3.709.280,67 9.739.772,38 Profit of the period 10.489.604,59 7.690.536,92 -5.769.532,57 -1.155.020,09 11.255.588,85 9.208.686,67 6.895.098,31 -9.616.797,54 49.603,59 6.536.591,03
Profit carried forward 4.965.214,97 3.119.434,20 -3.665.757,39 -1.028.008,97 3.390.882,81
2.001.170,63 2.082.314,21 -2.542.102,61 463.557,52 2.004.939,75 Other figures of Capital and Liabilities 83.338.375,06 -4.692.456,20 78.645.918,86
77.664.570,63 -2.883.166,86 74.781.403,77
Total Capital and Liabilities 21.867.089,03 20.796.851,59 73.903.085,10 -10.729.767,93 105.837.257,79 15.580.745,81 18.055.577,06 65.505.670,48 -6.079.286,43 93.062.706,93

KLEEMANN HELLAS S.A. Financial Statements of 31 December 2006
Notes on Financial Statements of 31 December 2006 (Amounts in Euros, unless otherwise stated). Differences in the total amounts are due to rounding off.
39
Geographical activity sectors of the Company Total
Total
Home country Overseas Other 1 Jan -
31 December 06
Home country Overseas Other 1 Jan -
31 December 05
ASSETS
Tangible Assets 21.092.337,19 21.092.337,19 19.198.659,36 19.198.659,36
Intangible Assets 148.584,39 148.584,39 52.981,78 52.981,78
Inventories 15.765.881,59 15.765.881,59 14.423.408,35 14.423.408,35
Receivables 41.341.206,07 7.297.800,91 48.639.006,98 34.007.580,94 5.653.837,12 39.661.418,06
Investments 781.710,96 781.710,96 960.577,88 960.577,88
Other figures of assets 6.576.628,53 6.576.628,53
8.053.953,55 8.053.953,55
Total Assets 42.122.917,03 7.297.800,91 43.583.431,70 93.004.149,64
34.968.158,82 5.653.837,12 41.729.003,04 82.350.998,98
CAPITAL AND LIABILITIES
Suppliers 4.832.204,07 4.701.423,17 9.533.627,24 3.375.998,16 4.495.100,49 7.871.098,65
Profit of the period 8.923.545,90 4.664.984,71 -4.104.902,70 9.483.627,91 8.827.674,60 3.784.880,24 -5.432.202,12 7.180.352,72 Profit carried forward 5.097.983,94 2.185.769,14 -3.137.097,87 4.146.655,21 2.402.334,91 1.030.005,11 -1.478.301,97 1.954.038,04
Other figures of Capital and Liabilities 69.840.239,28 69.840.239,28
65.345.509,57 65.345.509,57
Total Capital and Liabilities 18.853.733,92 11.552.177,01 62.598.238,71 93.004.149,64
14.606.007,66 9.309.985,84 58.435.005,48 82.350.998,98

KLEEMANN HELLAS S.A. Financial Statements of 31 December 2006 Notes on Financial Statements of 31 December 2006 (Amounts in Euros, unless otherwise stated). Differences in the total amounts are due to rounding off.
40
5. Incorporation of Subsidiary On 23 November 2006, in cooperation with another partner, the company incorporated the Romanian Company KLEEMANN LIFT Ro SRL. Its share capital comes up to 100.000 Euros, in which the Parent Company participates, with a share of 70%. The Company’s main activity is the trade of complete elevator systems. During the two months of its operation, until 31.12.2006, the Company was not activated at all.

KLEEMANN HELLAS S.A. Financial Statements of 31 December 2006 Notes on Financial Statements of 31 December 2006 (Amounts in Euros, unless otherwise stated). Differences in the total amounts are due to rounding off.
41
6. Tangible Fixed Assets Tangible Fixed Assets are analyzed below:
GROUP Land Buildings Mechanical equipment
Means of transportation
Furniture and Fixtures
Fixed Assets in course of
construction TOTAL Balance as of 1 January 2005 3.065.473,90 12.891.530,36 8.611.811,25 1.719.986,01 2.226.831,64 100.821,71 28.616.454,87
Additions 283.923,22 1.813.424,31 661.526,28 71.434,52 323.719,45 11.787,83 3.165.815,61 Sales -3.658,94 -10.158,28 -40.874,56 -54.691,78
Balance as of 31 December 2005 3.349.397,12 14.701.295,73 9.273.337,53 1.781.262,25 2.509.676,53 112.609,54 31.727.578,70
Accumulated Depreciation Balance as of 1 January 2005 - 983.152,84 3.297.863,28 466.647,16 906.456,29 - 5.654.119,57 Depreciation of the year 253.278,74 874.802,34 118.338,07 325.252,10 1.571.671,25 Sales -2.224,06 -5.731,32 -14.291,51 -22.246,89
Balance as of 31 December 2005 - 1.234.207,52 4.172.665,62 579.253,91 1.217.416,88 - 7.203.543,93
Undepreciated Value as of 31 December 2005 3.349.397,12 13.467.088,21 5.100.671,91 1.202.008,34 1.292.259,65 112.609,54 24.524.034,77

KLEEMANN HELLAS S.A. Financial Statements of 31 December 2006 Notes on Financial Statements of 31 December 2006 (Amounts in Euros, unless otherwise stated). Differences in the total amounts are due to rounding off.
42
GROUP Land Buildings Mechanical equipment
Means of transportation
Furniture and Fixtures
Fixed Assets in course of
construction TOTAL Balance as of 1 January 2006 3.349.397,12 14.701.295,73 9.273.337,53 1.781.262,25 2.509.676,53 112.609,54 31.727.578,70
Adjustment for company which is not consolidated in the current year -240.886,37 -294.505,93 -535.392,30
Additions 114.077,33 387.683,61 1.090.785,82 276.833,90 803.890,66 1.416.619,32 4.089.890,64 Sales -854.460,98 -4.962,00 -40.638,55 -14.609,62 -914.671,15
Exchange Rate differences 3.445,11 55.418,49 -6.502,00 2.065,67 -2.477,90 2.796,42 54.745,79
Balance as of 31 December 2006 3.466.919,56 14.289.936,85 10.111.772,98 2.019.523,27 3.001.973,74 1.532.025,28 34.422.151,68
Accumulated Depreciation Balance as of 1 January 2005 - 1.234.207,52 4.172.665,62 579.253,91 1.217.416,88 - 7.203.543,93
Adjustment for company which is not consolidated in the current year -102.263,49 -154.072,62 -256.336,11 Depreciation of the year 290.357,31 706.011,18 100.633,97 329.141,79 1.426.144,25 Sales -971,00 -24,43 -8.062,58 -9.058,01
Exchange Rate differences 149,36 -1.344,00 48,54 -3.919,64 -5.065,74
Balance as of 31 December 2005 - 1.524.714,19 4.774.098,31 679.911,99 1.380.503,83 - 8.352.228,32
Undepreciated Value as of 31 December 2006 3.466.919,56 12.765.222,66 5.337.674,67 1.339.611,28 1.621.469,91 1.532.025,28 26.062.923,36

KLEEMANN HELLAS S.A. Financial Statements of 31 December 2006 Notes on Financial Statements of 31 December 2006 (Amounts in Euros, unless otherwise stated). Differences in the total amounts are due to rounding.
43
COMPANY Land Buildings Mechanical equipment
Means of transportation
Furniture and Fixtures
Fixed Assets in course of
construction TOTAL Balance as of 1 January 2005 2.616.656,05 11.339.337,77 6.757.325,75 1.518.375,97 1.610.572,09 100.821,71 23.943.089,34
Additions 242.051,87 219.932,63 278.298,61 54.089,31 281.874,19 -22.199,48 1.054.047,13 Sales -2.224,06 -6.324,28 -21.449,56 -29.997,90 Balance as of 31 December 2005 2.858.707,92 11.557.046,34 7.035.624,36 1.566.141,00 1.870.996,72 78.622,23 24.967.138,57 Accumulated Depreciation Balance as of 1 January 2005 - 802.275,22 2.534.542,08 414.072,36 733.520,21 - 4.484.409,87 Depreciation of the year 233.051,81 643.334,78 118.338,07 308.699,53 1.303.424,19 Sales -2.224,06 -2.839,28 -14.291,51 -19.354,85 Balance as of 31 December 2005 - 1.033.102,97 3.177.876,86 529.571,15 1.027.928,23 - 5.768.479,21 Undepreciated Value as of 31 December 2005 2.858.707,92 10.523.943,37 3.857.747,50 1.036.569,85 843.068,49 78.622,23 19.198.659,36 Balance as of 1 January 2006 2.858.707,92 11.557.046,34 7.035.624,36 1.566.141,00 1.870.996,72 78.622,23 24.967.138,57
Additions 96.102,65 385.647,88 1.036.179,77 181.972,77 690.418,32 1.443.417,54 3.833.738,93 Sales -854.460,98 -8.925,18 -4.852,62 -868.238,78 Balance as of 31 December 2006 2.954.810,57 11.088.233,24 8.071.804,13 1.739.188,59 2.556.562,42 1.522.039,77 27.932.638,72 Accumulated Depreciation Balance as of 1 January 2006 - 1.033.102,97 3.177.876,86 529.571,15 1.027.928,23 - 5.768.479,21 Depreciation of the year 225.368,84 511.825,92 88.228,15 251.276,42 1.076.699,33 Sales -24,43 -4.852,58 -4.877,01 Balance as of 31 December 2006 - 1.258.471,81 3.689.702,78 617.774,87 1.274.352,07 - 6.840.301,53 Undepreciated Value as of 31 December 2006 2.954.810,57 9.829.761,43 4.382.101,35 1.121.413,72 1.282.210,35 1.522.039,77 21.092.337,19

KLEEMANN HELLAS S.A. Financial Statements of 31 December 2006 Notes on Financial Statements of 31 December 2006 (Amounts in Euros, unless otherwise stated). Differences in the total amounts are due to rounding off.
44
Use of fair value as revaluation method: In 2004, the Group and the Company performed an appraisal of the value of Land, on 1st January 2004 (date of transition to IFRS). For the evaluation of the value of Land, the method of market value was applied. Every 3-5 years, the Group and the Company performs a revaluation of its Fixed Assets. On 31 December 2006, they did not perform revaluation of the value of Land, because its value in the period between 1.1.2006 and 31.12.2006, was not significantly altered.
7. Intangible Fixed Assets
Intangible Fixed Assets for the year ended on 31 December 2006 were the following:
GROUP COMPANY Balance as of 1 January 2005 316.844,47 207.680,55
Additions 39.381,44 16.361,01 Balance as of 31 December 2005 356.225,91 224.041,56 Accumulated Depreciation Balance as of 1 January 2005 246.379,62 203.495,29 Depreciation of the year 48.931,29 - Sales -48.931,29 -32.435,51 Balance as of 31 December 2005 246.379,62 171.059,78 Undepreciated Value as of 31 December 2005 109.846,29 52.981,78 Balance as of 1 January 2006 356.225,91 224.041,56 Adjustment for company which is not consolidated in the current year -37.936,44 -
Additions 136.768,36 126.373,38 Balance as of 31 December 2006 455.057,83 350.414,94 Accumulated Depreciation Balance as of 1 January 2006 246.379,62 171.059,78 Depreciation of the year 40.379,59 30.770,77 Exchange Rate differences -580,00 - Balance as of 31 December 2005 286.179,21 201.830,55 Undepreciated Value as of 31 December 2006 168.878,62 148.584,39
8. Investments Other Investments of the Group and the Company were attributed as below:
GROUP COMPANY 2006 2005 2006 2005 Investments held until expiry 6.006,00 6.006,00 6.006,00 6.006,00 Financial Assets in fair values through profit and losses 800.028,96 958.927,88 775.704,96 954.571,88 Total 806.034,96 964.933,88 781.710,96 960.577,88

KLEEMANN HELLAS S.A. Financial Statements of 31 December 2006 Notes on Financial Statements of 31 December 2006 (Amounts in Euros, unless otherwise stated). Differences in the total amounts are due to rounding off.
45
9. Participations Participations are analyzed with the following:
2005
Corporate Name Country
Value at the beginning of the period Additions Sales Impairment
Value at the end of the period
Direct Holding
Percentage KLEFER S.A GREECE 1.173.881,21 1.173.881,21 50% LEISTRITZ HYDRAULIC Gmbh GERMANY 1.011.292,00 1.244.500,00 -380.187,00 -1.875.605,00 - 50% KLEEMANN ASANSOR San. Ve Tic As TURKEY 232.206,36 232.206,36 70% KLEEMANN LIFTOVI D.o.o. SERBIA 396.000,00 24.360,90 420.360,90 60% 2.813.379,57 1.268.860,90 -380.187,00 -1.875.605,00 1.826.448,47
2006
Corporate Name Country
Value at the beginning of the period Additions Sales Impairment
Value at the end of the period
Direct Holding
Percentage KLEFER S.A. GREECE 1.173.881,21 1.173.881,21 50% KLEEMANN ASANSOR San. Ve Tic As TURKEY 232.206,36 232.206,36 70% KLEEMANN LIFTOVI D.o.o. SERBIA 420.360,90 65.801,03 486.161,93 60% KLEEMANN LIFT RO S.R.L. ROMANIA 70.141,00 70.141,00 70% 1.826.448,47 135.942,03 - - 1.962.390,50

KLEEMANN HELLAS S.A. Financial Statements of 31 December 2006 Notes on Financial Statements of 31 December 2006 (Amounts in Euros, unless otherwise stated). Differences in the total amounts are due to rounding off.
46
10. Deferred Tax Receivables and Liabilities The deferred taxation Receivables and Liabilities are set off when there exists an applicable legal right to set off the current taxation demands with the current taxation liabilities when the deferred income taxes concern the same tax authority. The deferred tax receivables and liabilities for the Group and the Company, of the year 2006 are mentioned below :
Receivables Liabilities Net Amount GROUP 31 Dec. 06 31 Dec. 05 31 Dec. 06 31 Dec. 05 31 Dec. 06 31 Dec. 05 Tangible Fixed Assets 7.336,81 124.635,43 1.534.087,76 2.294.508,59 -1.526.750,95 -2.169.873,16 Intangible Fixed Assets 6.437,30 70.281,05 -180.823,10 54.819,42 187.260,40 15.461,63
Provisions for devaluated inventories 32.614,15 -1.019,78 -198,00 33.633,93 198,00 Receivables clients 355.000,00 368.170,65 65.284,35 289.715,65 368.170,65
Provisions for employees’ termination benefits 328.480,44 356.111,92 13.998,37 328.480,44 342.113,55 Consolidation Reformations 493.837,27 - 493.837,27 Readjustment of Fixed Assets 1.489,24 - -1.489,24 Subsidies for Fixed Assets 1.996,92 1.535,60 -1.535,60 1.996,92 Other Provisions 43.139,47 57.454,84 42.000,61 23.045,23 1.138,86 34.409,61 Other 3.313,98 1.366,59 - 1.947,39
Total deferred tax 773.008,17 1.475.802,06 1.461.065,44 2.389.029,44 -688.057,27 -913.227,38
Correspondingly, the amounts for the Company are mentioned below
Receivables Liabilities Net Amount COMPANY 31 Dec. 06 31 Dec. 05 31 Dec. 06 31 Dec. 05 31 Dec. 06 31 Dec. 05 Tangible Fixed Assets 17.367,00 1.293.574,16 1.857.392,79 -1.293.574,16 -1.840.025,79 Intangible Fixed Assets 6.437,30 70.281,05 263.022,53 6.437,30 -192.741,48 Provisions for devaluated inventories 32.614,15 32.614,15 - Receivables clients 355.000,00 396.900,00 355.000,00 396.900,00 Provisions for employees’ termination benefits 281.401,75 331.558,54 37.044,30 281.401,75 294.514,24 Readjustment of Fixed Assets 1.489,24 - -1.489,24 Subsidies for Fixed Assets 1.996,92 1.535,60 -1.535,60 1.996,92 Other Provisions 25.427,97 42.000,61 -16.572,64 - Other 3.313,98 1.366,59 - 1.947,39 Total deferred tax 700.881,17 821.417,49 1.337.110,37 2.160.315,45 -636.229,20 -1.338.897,96

KLEEMANN HELLAS S.A. Financial Statements of 31 December 2006 Notes on Financial Statements of 31 December 2006 (Amounts in Euros, unless otherwise stated). Differences in the total amounts are due to rounding off.
47
Regarding deferred taxation, movements of the year were the following:
GROUP Balance 1 Jan. 05
Charge in Results
Charge in Equity Capital
Balance 31 Dec. 05
Charge in Results
Change of Tax Rate
Exchange rate
difference Balance
31 Dec. 06
Tangible Fixed Assets -2.101.107,18 -68.765,98 -2.169.873,16 6.458,11 635.673,27 990,88 -1.526.750,90 Intangible Fixed Assets 35.533,67 -20.072,04 15.461,63 -42.111,15 213.529,92 380,00 187.260,40
Provisions for devaluated inventories 4.152,00 -3.954,00 198,00 33.407,93 28,00 33.633,93
Provisions for employees’ termination benefits -6.590,60 348.704,15 342.113,55 165.895,79 -179.015,90 -513,00 328.480,44 Deprofitization of Inventories 808.487,54 429.046,76 -743.697,03 493.837,27 -493.837,27 - Readjustment of Fixed Assets -1.489,24 -1.489,24 546,10 943,14 - Subsidies for Fixed Assets 1.552,29 444,63 1.996,92 -1.535,65 -1.996,92 -1.535,65
Provisions for doubtful receivables 276.643,65 91.527,00 368.170,65 -85.768,03 12.525,03 -5.212,00 289.715,65
Other -10.470,00 46.827,00 36.357,00 -29.481,14 -5.737,00 1.138,86
Total deferred tax -991.798,63 822.268,28 -743.697,03 -913.227,38 -446.425,31 681.658,54 -10.063,12 -688.057,27

KLEEMANN HELLAS S.A. Financial Statements of 31 December 2006 Notes on Financial Statements of 31 December 2006 (Amounts in Euros, unless otherwise stated). Differences in the total amounts are due to rounding off.
48
COMPANY Balance 1 Jan. 05
Charge in Results
Charge in Equity Capital
Balance 31 Dec. 05
Charge in Results
Change of Tax Rate
Balance 31 Dec. 06
Tangible Fixed Assets -1.741.235,59 -98.790,20 -1.840.025,79 -89.221,59 635.673,27 -1.293.574,11 Intangible Fixed Assets -98.539,08 -94.202,40 -192.741,48 29.682,43 213.529,92 50.470,87
Transfer from Intangible Fixed Assets - -44.033,57 -44.033,57
Provisions for devaluated inventories - 32.614,15 32.614,15
Provisions for employees’ termination benefits -8.646,29 303.160,53 294.514,24 165.903,41 -179.015,90 281.401,75 Readjustment of Fixed Assets -1.489,24 -1.489,24 546,10 943,14 - Subsidies for Fixed Assets 1.552,29 444,63 1.996,92 -1.535,65 -1.996,92 -1.535,65
Provisions for doubtful receivables 262.500,00 134.400,00 396.900,00 -54.425,03 12.525,03 355.000,00 Other 130.978,67 1.947,39 -130.978,67 1.947,39 -18.520,03 -16.572,64
Total deferred tax -1.453.390,00 245.470,71 -130.978,67 -1.338.897,96 21.010,22 681.658,54 -636.229,20

KLEEMANN HELLAS S.A. Financial Statements of 31 December 2006 Notes on Financial Statements of 31 December 2006 (Amounts in Euros, unless otherwise stated). Differences in the total amounts are due to rounding off.
49
The rate with which the deferred taxation is calculated is equal to the one which is estimated to be in force during the moment of reversal of the temporary taxation differences. For the company and its Subsidiary in Greece, this rate is set at 25%. 11.Inventories The inventories of the Group and the Company are analyzed below:
GROUP COMPANY
31/12/2006 31/12/2005
31/12/2006 31/12/2005 Finished and semi-finished products 2.484.223,11 2.789.060,42
2.445.252,01 1.825.187,73
Raw material and other production materials 9.316.953,14 8.577.860,39
8.587.301,70 7.151.222,56
Commodities 7.687.512,96 6.660.226,86
4.863.784,48 5.446.998,06
Minus: Intercompany Inventories -583.665,78 -1.543.241,47
- -
Minus: Provision for devaluation of Inventories -132.951,74 -
-130.456,60 -
Total 18.772.071,69 16.483.906,20
15.765.881,59 14.423.408,35
Inventories of commodities that belong to Parent Company totaled approximately € 130,5 thousands and others that belong to KLEFER S.A, ssubsidiary, totaled approximately € 2,5 thousands, remain unmoved for more than one year and therefore a provision for their devaluation has been calculated. In the current period, KLEEMANN ASANSOR, subsidiary, has reversed a corresponding provision of approximately € 10,2 thousands, which concerned previous years.
12.Other long-term receivables Other long-term receivables of the Group and the Company are analyzed below:
GROUP COMPANY
31/12/2006 31/12/2005 31/12/2006 31/12/2005 Notes Receivables of long-term expiry 454.360,79 681.377,23 454.360,79 681.377,23
Long-term Receivables against affiliated Companies - - - 1.025.260,82
Other long-term receivables 110.110,97 364.960,97 88.345,97 87.695,97
Total 564.471,76 1.046.338,20 542.706,76 1.794.334,02
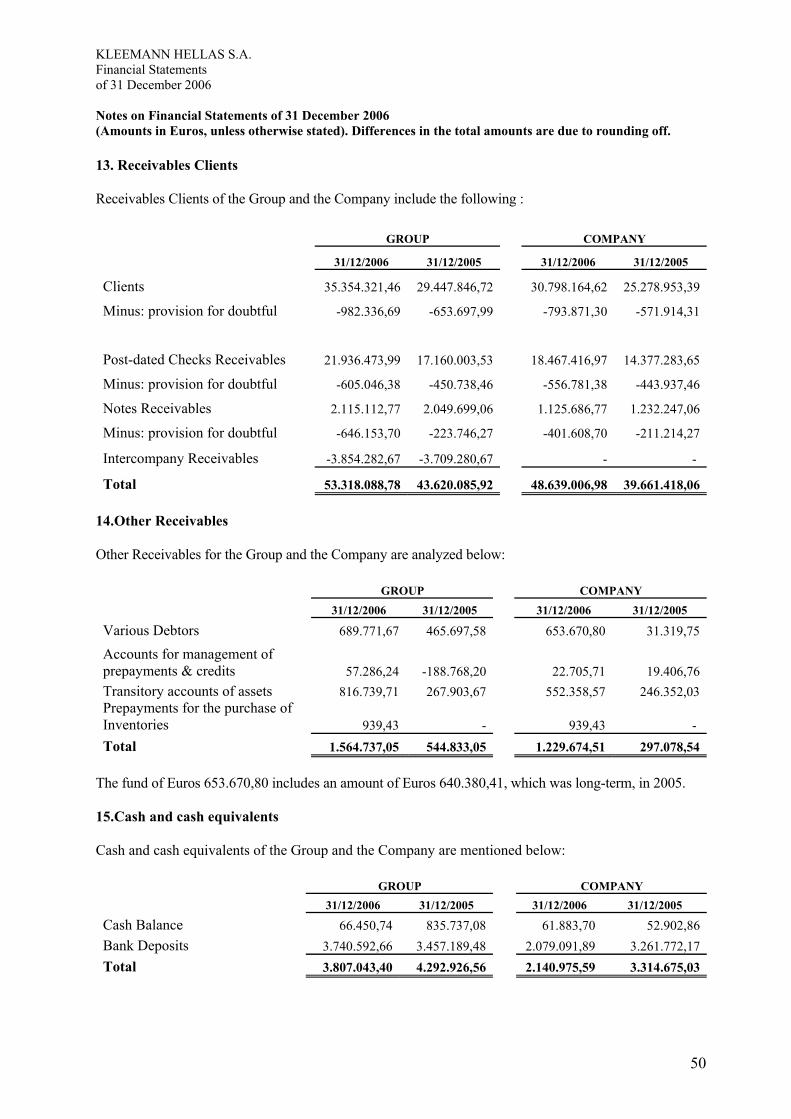
KLEEMANN HELLAS S.A. Financial Statements of 31 December 2006 Notes on Financial Statements of 31 December 2006 (Amounts in Euros, unless otherwise stated). Differences in the total amounts are due to rounding off.
50
13. Receivables Clients Receivables Clients of the Group and the Company include the following :
GROUP COMPANY
31/12/2006 31/12/2005 31/12/2006 31/12/2005
Clients 35.354.321,46 29.447.846,72 30.798.164,62 25.278.953,39
Minus: provision for doubtful -982.336,69 -653.697,99 -793.871,30 -571.914,31
Post-dated Checks Receivables 21.936.473,99 17.160.003,53 18.467.416,97 14.377.283,65
Minus: provision for doubtful -605.046,38 -450.738,46 -556.781,38 -443.937,46
Notes Receivables 2.115.112,77 2.049.699,06 1.125.686,77 1.232.247,06
Minus: provision for doubtful -646.153,70 -223.746,27 -401.608,70 -211.214,27
Intercompany Receivables -3.854.282,67 -3.709.280,67 - -
Total 53.318.088,78 43.620.085,92 48.639.006,98 39.661.418,06
14.Other Receivables Other Receivables for the Group and the Company are analyzed below:
GROUP COMPANY 31/12/2006 31/12/2005 31/12/2006 31/12/2005
Various Debtors 689.771,67 465.697,58 653.670,80 31.319,75
Accounts for management of prepayments & credits 57.286,24 -188.768,20 22.705,71 19.406,76 Transitory accounts of assets 816.739,71 267.903,67 552.358,57 246.352,03 Prepayments for the purchase of Inventories 939,43 - 939,43 - Total 1.564.737,05 544.833,05 1.229.674,51 297.078,54
The fund of Euros 653.670,80 includes an amount of Euros 640.380,41, which was long-term, in 2005. 15.Cash and cash equivalents Cash and cash equivalents of the Group and the Company are mentioned below:
GROUP COMPANY 31/12/2006 31/12/2005 31/12/2006 31/12/2005
Cash Balance 66.450,74 835.737,08 61.883,70 52.902,86 Bank Deposits 3.740.592,66 3.457.189,48 2.079.091,89 3.261.772,17 Total 3.807.043,40 4.292.926,56 2.140.975,59 3.314.675,03

KLEEMANN HELLAS S.A. Financial Statements of 31 December 2006 Notes on Financial Statements of 31 December 2006 (Amounts in Euros, unless otherwise stated). Differences in the total amounts are due to rounding off.
51
16. Share Capital and Reserves On 31st December 2006, Share Capital of the Company amounts to € 3.902.035,50 and consists of 11.824.350 common registered shares with a nominal value of € 0,33 each. Reserves of the Group and the Company were formed as below:
Regular Reserve According to Hellenic Commercial Legislation, the companies are obliged, from their FY profits, to form 5% as an ordinary reserve until it reaches 1/3 of their initial paid-up share capital. During a company’s life-cycle the distribution of its ordinary reserve is prohibited. Specially taxed and tax-free Reserves Specially taxed and tax-free Reserves concern undistributed earnings of which: a) applying the provisions of the Law ν. 3299/04, an amount of 1,4 mil. Euros refers to a taxed Reserve and it was used for the cover of owned participation in a subsidized investing plan, which is included in the provisions of this law and b) an amount of 730 thnds. Euros concerns tax-free Reserve of the Law ν. 3220/03 for investment purposes of at least equal value, within the next three years from the time that it was formed. Contingency Reserve Contingency Reserve concerns undistributed, untaxed earnings and it was formed according to the provisions of the Law ν. 1892/90, for the purpose of covering owned participation in subsidized investing plans, which are included in the provisions of this Law.
Differences from readjustment in the value of other assets It concerns a Reserve which aroused from the readjustment in the value of Real Estate (Land) at fair value, according to IAS 16.
GROUP COMPANY
31/12/2006 31/12/2005 31/12/2006 31/12/2005
Reserves from issue of shares above par value 26.173.118,12 26.173.118,12 26.173.118,12 26.173.118,12
Regular Reserve 1.452.474,01 1.416.244,83 1.329.999,47 1.329.999,47
Specially taxed and tax-free Reserves 2.130.428,61 730.428,60 2.130.428,60 730.428,60
Contingency Reserve 65.856,02 65.856,02 65.856,02 65.856,02
Differences from readjustment in the value of other assets 765.499,83 754.715,02 700.436,35 700.436,35
Tax-free Reserves of developmental Laws 15.164.566,62 14.541.044,20 14.429.795,31 14.005.647,26
Reserves free of income taxation 837.751,17 835.141,92 835.141,92 835.141,92
Reserves from specially taxed Revenues 68.250,20 68.250,20 68.250,20 68.250,20
Total 20.484.826,46 18.411.680,79 19.559.907,87 17.735.759,82

KLEEMANN HELLAS S.A. Financial Statements of 31 December 2006 Notes on Financial Statements of 31 December 2006 (Amounts in Euros, unless otherwise stated). Differences in the total amounts are due to rounding off.
52
Tax-free Reserves of developmental Laws Tax-free Reserves concern undistributed earnings, which, according to developmental laws, are free of taxation, for investments which were taken place, based on the provisions of the Laws ν.1828/89, ν. 1892/90, ν. 2601/98 and ν. 3299/04 (on the condition that there are adequate earnings, for the creation of these Reserves, remaining from the earnings balance, after the dividend distribution and their proportionate taxes) Reserves free of income taxation Reserves that are free of income taxation concern revenues from bank interests. These Reserves are liable to taxation, in case of their distribution. Reserves from specially taxed Revenues Reserves from specially taxed Revenues concern revenues from interests and tax withholding has been applied in source. Further than the potential prepaid taxes, these Reserves are liable to taxation, in case of their distribution. For the above untaxed Reserves, there are not any deferred taxes to be recorded, in case they are distributed. Board of Directors proposes to the Ordinary General Shareholders’ Meeting, the creation of a specially taxed Reserve, which amounts to 3,5 mil.. €, for the financing of new productive investments. 17.Loans The Company and the Group keep only short-term loans. The terms and the balances of these loans are the following :
COMPANY
31/12/2006 31/12/2005
Bank Company of the Group Currency Amount (In Euros) Amount (In Euros)
PIRAEUS BANK KLEEMANN HELLAS Euro 2.956.087,50
PIRAEUS BANK KLEEMANN HELLAS Euro 8.000.000,00 5.000.000,00
EFG EUROBANK KLEEMANN HELLAS Euro 4.500.000,00 3.500.000,00
NATIONAL BANK KLEEMANN HELLAS Euro 1.019.796,55
Total 15.456.087,50 9.519.796,55
GROUP
PIRAEUS BANK KLEFER Euro 1.369.552,46 1.369.552,46 TURKISH BANK OF EMPLOYMENT KLEEMANN ASANSOR Turkish Liras 1.948,00 2.071,00
Total 16.827.587,96 10.891.420,01

KLEEMANN HELLAS S.A. Financial Statements of 31 December 2006 Notes on Financial Statements of 31 December 2006 (Amounts in Euros, unless otherwise stated). Differences in the total amounts are due to rounding off.
53
Real weighted average rates, on the Balance Sheet date are the following: GROUP COMPANY 31/12/2006 31/12/2005 31/12/2006 31/12/2005 Banking Loans (short-term) 4,39% 3,77% 4,36% 3,75%
18.Operating Leases Liabilities of the group and the Company that arise from operating leases that can not be cancelled are mentioned below:
GROUP COMPANY
31/12/2006 31/12/2005 31/12/2006 31/12/2005 Between one and five years 161.759,84 116.687,30 105.738,08 94.379,25
More than five years 46.476,22 77.349,37 46.476,22 77.349,37
Total 208.236,06 194.036,67 152.214,30 171.728,62
19.Liabilities from employees’ termination benefits Liabilities of the Group and the Company that arise from employees’ termination benefits are the following:
GROUP COMPANY 31/12/2006 31/12/2005 31/12/2006 31/12/2005 Liabilities of Balance Sheet for: Retirement benefits 1.225.113,00 1.086.921,01 1.125.607,00 920.357,00 Charges in Results: Retirement benefits 250.966,76 191.554,26 213.586,89 168.510,00 Present value of non-financed liabilities 1.377.648,00 1.218.886,01 1.266.212,00 1.044.665,00 Non-registered actuarial (profits) / losses -152.535,00 -131.965,00 -140.605,00 -124.308,00 1.225.113,00 1.086.921,01 1.125.607,00 920.357,00 Liability in Balance Sheet 1.225.113,00 1.086.921,01 1.125.607,00 920.357,00 Alterations in net liability recognized in Balance Sheet Net liability in the beginning of the year 1.086.921,01 909.785,75 920.357,00 766.012,00 Benefits paid -112.774,77 -14.419,00 -8.336,89 -14.165,00 Total expense recognized in Results 250.966,76 191.554,26 213.586,89 168.510,00 Net liability in the end of the year 1.225.113,00 1.086.921,01 1.125.607,00 920.357,00 Actuarial loss or (gain) Present value of liability in the end of the period 1.225.113,00 1.086.921,01 1.125.607,00 920.357,00 Cost of current employment 201.475,76 151.102,26 166.825,89 129.945,00 Interest in liability 48.442,00 39.422,00 45.794,00 37.617,00 Expenses & depreciation of actuarial loss 1.049,00 1.030,00 967,00 948,00 Total expense recognized in Results 250.966,76 191.554,26 213.586,89 168.510,00

KLEEMANN HELLAS S.A. Financial Statements of 31 December 2006 Notes on Financial Statements of 31 December 2006 (Amounts in Euros, unless otherwise stated). Differences in the total amounts are due to rounding off.
54
Acceptances on which the actuarial plan was based, for the calculation of provision, are mentioned below: GROUP COMPANY 31/12/2006 31/12/2005 31/12/2006 31/12/2005 Discounting Rate 4,5% 4,5% 4,5% 4,5% Future increases of salaries 5% 5% 5% 5%Average future duration of working life 20,46 20,52 20,46 20,52
20.Suppliers Dues to Suppliers for the Group and the Company are the following:
GROUP COMPANY
31/12/2006 31/12/2005 31/12/2006 31/12/2005
Suppliers 11.903.806,19 11.090.025,06 6.636.481,62 6.184.803,48
Checks payables 4.430.742,27 2.337.448,99 2.866.272,14 1.686.295,17
Notes payables 64.601,48 21.579,00 30.873,48 -
Intercompany liabilities -3.854.282,67 -3.709.280,67 - -
Total 12.544.867,27 9.739.772,38 9.533.627,24 7.871.098,65
21.Other Short-term Liabilities Other short-term liabilities are analyzed below:
GROUP COMPANY
31/12/2006 31/12/2005 31/12/2006 31/12/2005
Various Creditors 310.546,23 973.557,27 207.298,29 94.353,56 Dividends 86.468,31 100.087,83 86.468,31 100.087,83
Insurance Organizations 954.866,15 769.074,62 819.990,58 669.948,53 Transitory accounts of Capital and Liabilities 73.414,21 171.362,06 49.412,44 168.088,82
Total 1.425.294,90 2.014.081,78 1.163.169,62 1.032.478,74
22. Other long-term Liabilities Other long-term liabilities for the Group and the Company are formed as below:
GROUP COMPANY 31/12/2006 31/12/2005 31/12/2006 31/12/2005 Notes payables (Long-term) 73.657,24 114.218,20 14.458,37 74.071,71 Subsidies for investments in Fixed Assets 706.948,04 801.514,35 34.777,83 60.816,17 Interest bearing Loans - 1.539.521,65 - - Minus: Intercompany reformation of Loans - -769.760,82 - - Total 780.605,28 1.685.493,38 49.236,20 134.887,88

KLEEMANN HELLAS S.A. Financial Statements of 31 December 2006 Notes on Financial Statements of 31 December 2006 (Amounts in Euros, unless otherwise stated). Differences in the total amounts are due to rounding off.
55
23.Sales Sales of the Group and the Company, excluding intercompany amounts, consist of the following figures:
GROUP COMPANY
31/12/2006 31/12/2005 31/12/2006 31/12/2005 Sales of finished and semi-finished products 50.891.236,36 46.843.397,80 51.423.312,20 43.486.140,50
Sales of commodities 31.254.478,54 29.539.165,51 21.501.240,29 18.469.482,96
Sales of Inventories 2.981.152,39 2.508.071,99 2.947.950,25 2.682.921,15
Sales of Services 373.703,89 354.265,38 292.242,15 435.976,10
Total 85.500.571,18 79.244.900,68 76.164.744,89 65.074.520,71
24.Other income / (expenses) (net) Other income / (expenses) (net) of the Group and the Company are analyzed below :
GROUP COMPANY
31/12/2006 31/12/2005 31/12/2006 31/12/2005
Subsidies & Revenues from various sales 252.935,24 552.578,42 232.889,48 507.906,24 Revenues from subsequent activities 396.786,20 274.125,23 296.201,57 253.586,42
Capital Revenues - 382,28 - - Revenues from provisions of previous years 172.048,41 5.154,99 172.048,41 5.154,99
Other Revenues 1.423,40 - - -
Total Income 823.193,25 832.240,92 701.139,46 766.647,65 Revenues & Expenses of previous years -60.360,33 -66.411,75 -28.117,09 -64.857,07
Total Expenses -60.360,33 -66.411,75 -28.117,09 -64.857,07 Extraordinary & non-organic results -133.968,51 67.661,98 -54.351,38 -6.898,63
Exchange Rate differences 73.683,00 -123.601,00 - -
Consolidation Registrations -51.483,52 -16.144,90 - -
Total Other income / (expenses) (net) 651.063,89 693.745,25 618.670,99 694.891,95

KLEEMANN HELLAS S.A. Financial Statements of 31 December 2006 Notes on Financial Statements of 31 December 2006 (Amounts in Euros, unless otherwise stated). Differences in the total amounts are due to rounding off.
56
25.Expenses The expenses that are included in the Financial Statements of the Group and the Company are as follows:
GROUP 2005
Cost of Sales Selling Expenses Administration
Expenses
Research & Development
Expenses Total Employees’ Benefits 8.662.898,02 4.130.829,80 4.736.935,37 607.325,93 18.137.989,12 Cost of consumption of inventories 41.074.029,11 - - - 41.074.029,11 Depreciation 852.484,10 457.703,58 161.149,87 25.327,79 1.496.665,34 Other Expenses 1.163.511,20 4.678.319,13 1.324.920,42 196.473,67 7.363.224,42 De-profitization of inventories 1.276.068,47 - - - 1.276.068,47 Total 53.028.990,90 9.266.852,51 6.223.005,66 829.127,39 69.347.976,46
2006
Cost of Sales Selling Expenses Administration
Expenses
Research & Development
Expenses Total Employees’ Benefits 10.555.826,96 5.292.768,64 2.340.193,60 638.608,16 18.827.397,36 Cost of consumption of inventories 42.793.861,71 - - - 42.793.861,71 Depreciation 926.506,83 390.956,30 104.483,06 24.282,91 1.446.229,10 Other Expenses 1.481.235,05 5.317.153,34 1.444.377,60 374.376,08 8.617.142,07 De-profitization of inventories -979.046,24 - 5.942,03 - -973.104,21 Total 54.778.384,31 11.000.878,28 3.894.996,29 1.037.267,15 70.711.526,03

KLEEMANN HELLAS S.A. Financial Statements of 31 December 2006 Notes on Financial Statements of 31 December 2006 (Amounts in Euros, unless otherwise stated). Differences in the total amounts are due to rounding off.
57
COMPANY 2005
Cost of Sales Selling Expenses Administration
Expenses
Research & Development
Expenses Total Employees’ Benefits 7.377.525,68 3.752.389,87 1.503.570,47 607.325,93 13.240.811,95 Cost of consumption of inventories 34.383.068,95 - - - 34.383.068,95 Depreciation 572.232,68 370.175,44 80.643,60 23.892,81 1.046.944,53 Other Expenses 1.112.104,38 4.092.778,23 1.063.849,50 170.471,90 6.439.204,01 Total 43.444.931,69 8.215.343,54 2.648.063,57 801.690,64 55.110.029,44 2006
Cost of Sales Selling Expenses Administration
Expenses
Research & Development
Expenses Total Employees’ Benefits 8.765.002,53 4.721.079,08 1.896.112,69 638.608,16 16.020.802,46 Cost of consumption of inventories 41.504.052,76 - - - 41.504.052,76 Depreciation 672.806,03 332.781,68 81.214,94 20.667,47 1.107.470,12 Other Expenses 1.013.572,35 4.547.415,18 1.107.843,05 360.229,04 7.029.059,62 Total 51.955.433,67 9.601.275,94 3.085.170,68 1.019.504,67 65.661.384,96

KLEEMANN HELLAS S.A. Financial Statements of 31 December 2006 Notes on Financial Statements of 31 December 2006 (Amounts in Euros, unless otherwise stated). Differences in the total amounts are due to rounding off.
58
26.Personnel Expenses Payment Cost included in Financial Statements is analyzed below:
GROUP COMPANY 31/12/2006 31/12/2005 31/12/2006 31/12/2005 Wages and salaries 14.547.209,86 13.476.616,46 12.318.888,28 10.264.686,78 Employers’ contributions 3.758.553,38 4.801.360,50 3.251.392,58 2.712.747,06 Other benefits granted to employees 468.867,40 306.028,21 415.246,18 254.367,36 Compensations due to dismissal 40.412,09 9.270,04 35.275,42 9.010,46 Total payment cost 18.815.042,73 18.593.275,21 16.020.802,46 13.240.811,66 Provision for employees' termination benefits 250.966,76 191.554,26 213.586,89 168.510,00 Total Payment Expenses 19.066.009,49 18.784.829,47 16.234.389,35 13.409.321,66 Expenses included in production cost 10.670.444,23 10.327.436,76 8.881.856,20 7.471.415,57 Expenses included in selling & distribution cost 5.370.922,97 5.002.504,36 4.784.019,79 3.800.145,36 Expenses included in administration cost 2.376.249,09 2.848.306,37 1.921.391,38 1.522.705,45 Expenses included in Research & Development cost 648.393,19 606.581,98 647.121,99 615.055,28 Total 19.066.009,49 18.784.829,47 16.234.389,35 13.409.321,66
27.Financial income / (expenses) (net) Financial income / (expenses) (net) of the Group and the Company were formed as below :
GROUP COMPANY 31/12/2006 31/12/2005 31/12/2006 31/12/2005 Income from Interests 142.063,26 60.137,55 141.264,07 60.137,55 Other financial Income (expenses) -28.074,02 -25.301,00 - - Losses form sale of subsidiaries - -380.187,00 - -380.187,00 Interest expenses -702.095,49 -607.881,91 -613.331,98 -521.847,44 Total -588.106,25 -953.232,36 -472.067,91 -841.896,89
28.Income Tax Both the Hellenic Tax Legislation and relative provisions are subject to interpretations by Tax authorities. Income tax statements are filed on an annual basis, but profits or losses that are declared for tax purposes are deemed temporary until the tax authorities audit the tax payer’s tax statements and logs, at which point all relative tax liabilities are settled. Tax losses, to the extent that they are recognised by tax authorities, may be used in order to offset profits that will be realised in the five years that follow the fiscal year that they concern.

KLEEMANN HELLAS S.A. Financial Statements of 31 December 2006 Notes on Financial Statements of 31 December 2006 (Amounts in Euros, unless otherwise stated). Differences in the total amounts are due to rounding off.
59
Pursuant to the provisions of the Hellenic Tax Legislation, companies pay an income tax down payment each year, which is estimated at 65% on the income tax of the current fiscal year. When the tax is settled in the next fiscal year, any excess amount that is paid in advance is returned to the company after the tax audit. Pursuant to Law 3296/2004 the income tax rate was decreased from 35% in 2004 to 32% in 2005, 29% in 2006 and 25% from FY 2007 and thereafter. For the years 2006 and 2005, Income Tax for the Group and the Company is mentioned below:
GROUP COMPANY
31/12/2006 31/12/2005 31/12/2006 31/12/2005
Current Income Tax 3.109.136,19 3.724.591,25 2.305.634,06 3.220.348,89
Deferred tax -225.170,11 -822.268,28 -702.668,76 -245.470,71
Tax auditing differences - 140.219,01 - 48.185,01
Total 2.883.966,08 3.042.541,98 1.602.965,30 3.023.063,19
The Company and its subsidiary KLEFER have been audited by tax authorities until 31st December 2004. As far as the other companies are concerned, Kleemann Asansor in Turkey has not been audited from 2001 to the year 2006, Kleemann Liftovi in Serbia began its activation in 2005 and has not been audited by tax authorities since its incorporation. Agreement of Real Tax Rate:
GROUP COMPANY 31/12/2006 31/12/2005 31/12/2006 31/12/2005 Earnings before taxes 15.050.114,33 9.794.903,31 11.086.593,21 10.203.415,91 Tax Rate 29% 32% 29% 32%
Theoretical Tax, calculated applying the tax Rate (32% and 29% for the years 2005, 2006 correspondingly) 4.364.533,16 3.134.369,06 3.215.112,03 3.265.093,09 Plus / Minus:
Impact of foreign tax Rates (decrease of tax Rates) -110.996,77 -23.275,27 - - Non – deducted expenses 122.428,92 201.943,12 107.018,41 190.059,60 Tax-free Revenues -810.340,69 -410.713,94 -1.037.506,60 -480.274,51 Tax auditing differences - 140.219,01 - 48.185,01 Alteration in tax Rate -681.658,54 - -681.658,54 - Real tax encumbrance 2.883.966,08 3.042.541,98 1.602.965,30 3.023.063,19
Real tax encumbrance Rate 19,16% 31,06% 14,46% 29,63%

KLEEMANN HELLAS S.A. Financial Statements of 31 December 2006 Notes on Financial Statements of 31 December 2006 (Amounts in Euros, unless otherwise stated). Differences in the total amounts are due to rounding off.
60
29.Cash flows from operating activities Cash generated from operations, which is included in cash flows statement, is analyzed in the table below:
GROUP COMPANY
1 Jan. 06 - 31 Dec. 06
1 Jan. 05 - 31 Dec. 05
1 Jan. 06 - 31 Dec. 06
1 Jan. 05 - 31 Dec. 05
Profit of the year 15.050.114,33 9.794.903,31 11.086.593,21 10.203.415,91 Adjustments for: Depreciation 1.446.229,11 1.496.665,38 1.107.470,12 1.046.944,25 Increase / (decrease) in provisions 167.383,10 739.661,63 116.620,05 644.845,01 Increase / (decrease) in the liability for employees’ termination benefits 250.966,76 191.554,26 213.586,89 168.510,00 Tax auditing differences - 528.435,52 - 436.401,52 (Profits) / losses from sale of Fixed Assets 86.923,17 1.876,71 83.888,99 1.876,71 (Profits) / losses from sale of Participation & Securities -198.111,54 380.187,00 -198.111,54 380.187,00 Interest Expenses 690.050,26 498.925,27 613.257,98 438.594,32 (Income) from Dividends -380.501,17 -259.299,50 -379.782,73 -259.299,50 Subsidies for Fixed Assets of the period -94.566,31 -131.967,45 -26.038,34 -29.744,77 Evaluation of Securities - -149.802,90 - -149.802,90 17.018.487,71 13.091.139,23 12.617.484,63 12.881.927,55 Alterations of operating items (Increase) / Decrease of Inventories -3.564.665,55 1.176.680,94 -1.342.473,24 -156.561,09 (Increase) / Decrease of Receivables -11.256.865,60 -4.939.848,67 -9.183.752,97 -3.439.189,61 Increase / (decrease) of Liabilities 2.969.524,93 1.128.166,59 1.216.871,88 -165.620,94 -11.852.006,22 -2.635.001,14 -9.309.354,33 -3.761.371,64
Cash flows from operating activities 5.166.481,49 10.456.138,09 3.308.130,30 9.120.555,91
30.Commitments Operating leases concerning automobile leases. According to the contracts, the Group is obliged to fulfill the duration of the lease, as this is determined by every contract. On a different occasion, it will be encumbered with the relevant clauses for premature cease. 31.Earnings per share Basic Earnings per share are calculated by dividing net profit, attributable to shareholders of the Parent Company, with the weighted average number of common shares, in circulation, during the year, excluding the owned common shares that were purchased by the company (owned shares).
GROUP COMPANY 31/12/2006 31/12/2005 31/12/2006 31/12/2005 Earnings attributed to shareholders of Parent Company 11.255.588,85 6.536.821,40 9.483.627,91 7.180.352,72 Weighted average number of shares (in thousands) 11.824.350 11.824.350 11.824.350 11.824.350 Basic Earnings per share 0,95 0,55 0,80 0,61

KLEEMANN HELLAS S.A. Financial Statements of 31 December 2006 Notes on Financial Statements of 31 December 2006 (Amounts in Euros, unless otherwise stated). Differences in the total amounts are due to rounding off.
61
32.Dividends Pursuant to Hellenic Legislation, companies are obligated to distribute to their shareholders a dividend equal to at least 6% of their paid-up capital or 35% of the profits that arise from their accounting logs (published financial statements) after the relative income tax and statutory reserve is deducted, provided this is greater than 6% of the paid-up capital. In spite of the above, companies may not distribute dividends following the congruent opinion of their shareholders. A dividend, which is lower than 35% of profit after taxes, but higher than 6% of paid up share capital can be announced and be paid, with the approval of 70% of shareholders. Following the congruent opinion of its shareholders, it is not necessary for the Company to announce a dividend. Dividends that were distributed in 2006 (from the profits of 2005) amounted to Euros 2.956.087,50 or Euros 0,25 per share. The proposed dividend from the profits of fiscal year 2006 amounts to Euros 0,30 per Share or Euros 3.547.305,00. 33. Possible Liabilities / Receivables Due to a judgment ruled by the authorities of E.U. (formation was ruled as illegal), it is possible that an income tax amount will arise for the already formed Reserve of Law 3220/04, which totaled to Euros 730.428,60 for the year 2003 and 2004. For that reason, E.U. is in discussion with Greek authorities to decide the way that this difference will be settled. There are no banking guarantees for the security of liabilities of both the Group and the Company. Moreover, the company has not provided any guarantees for Liabilities of its subsidiaries. There are no pending legal actions, which may cause significant consequences for the Group and Company’s financial status. There are not any possible Receivables, which may cause significant consequences for the Group and Company’s financial status. 34. Transactions with Affiliated Entities The Company, its subsidiaries, relative companies, management with the highest officials and their direct relatives are considered to be the affiliated entities of the Group. Affiliated entities concern companies with common ownership status and/or management, with the Company and Companies that are related with it. The Company purchases goods and services from affiliated entities, while it offers and sells services to affiliated entities, as well. Sales of goods to affiliated entities, by the Company, mainly concern sales of commodities and products. Usually, selling prices are offered on cost basis plus profit. Purchases from affiliated entities are usually received on cost basis plus profit margin and they mainly concern automatic elevator doors. Transactions with Related Entities are presented in the following table:

KLEEMANN HELLAS S.A. Financial Statements of 31 December 2006 Notes on Financial Statements of 31 December 2006 (Amounts in Euros, unless otherwise stated). Differences in the total amounts are due to rounding off.
62
COMPANY Purchases - Expenses Sales - Revenues
31.12.2006 31.12.2005 31.12.2006 31.12.2005 Group Companies 5.506.677,51 4.417.913,58 4.480.112,93 5.502.120,74 Rewards of B.o.D Members. 239.377,51 205.076,00 5.662,89 4.385,26 Rewards of Highest Officials 927.064,40 834.483,57 1.611,84 4.284,48 Affiliated Companies 842.970,30 1.597.841,25 3.171.321,43 2.739.410,07 Total 7.516.089,72 7.055.314,40 7.658.709,09 8.250.200,55 GROUP Purchases - Expenses Sales - Revenues 31.12.2006 31.12.2005 31.12.2006 31.12.2005 Rewards of B.o.D Members. 277.357,23 237.673,05 5.662,89 4.385,26 Rewards of Highest Officials 1.214.134,56 951.307,63 1.611,84 4.284,48 Affiliated Companies 2.153.747,31 1.574.283,71 2.223.572,91 1.358.185,81 Total 3.645.239,10 2.763.264,39 2.230.847,64 1.366.855,55 COMPANY Liabilities to: Receivables from : 31.12.2006 31.12.2005 31.12.2006 31.12.2005 Group Companies KLEFER S.A. 261.807,97 366.225,70 1.406,20 64.331,55 KLEEMANN ASANSOR S.A. 14.145,67 2.247.317,98 1.923.644,67 KLEEMANN LIFTOVI D.o.o. 425.468,11 431.280,00 B.o.D Members 11,88 18.745,43 Highest Officials 879,07 3.111,78 Affiliated Companies AMETAL 228.866,18 5.059,21 TECHNOLAMA 42.403,47 187.332,98 SKY LIFT 641.609,18 891.856,36 Total 318.357,11 782.424,86 3.321.751,63 3.332.969,79 GROUP Liabilities to: Receivables from : 31.12.2006 31.12.2005 31.12.2006 31.12.2005 B.o.D Members 11,88 18.745,43 Highest Officials 6.955,75 879,07 3.111,78 Affiliated Companies AMETAL 54.830,00 86.021,00 GROSSI 472.464,24 373.787,24 TECHNOLAMA 535.116,26 518.643,58 Total 542.072,01 518.643,58 528.185,19 481.665,45

KLEEMANN HELLAS S.A. Financial Statements of 31 December 2006 Notes on Financial Statements of 31 December 2006 (Amounts in Euros, unless otherwise stated). Differences in the total amounts are due to rounding off.
63
35. Subsequent events There are no important events, which affect the financial status and results of the Group and the Company, occurring after 31st December 2006.
Kilkis 19 March 2007
President of the Board of General Manager Financial Manager Directors
NIKOLAOS K. KOUKOUNTZOS MENELAOS K. KOUKOUNTZOS CHRISTOS N. PETRIDES

64
Independent Auditor's Report
To the Shareholders of KLEEMANN HELLAS S.A. Report on the Financial Statements We have audited the accompanying Financial Statements and Consolidated Financial Statements (the Financial Statements) of KLEEMANN HELLAS S.A. (the Company), which comprise the balance sheet as at 31 December 2006, and the statements of income, changes in equity and cash flows for the year then ended, as well as a summary of significant accounting policies and other explanatory notes. Management's responsibility for the Financial Statements Management is responsible for the preparation and the fair presentation of these Financial Statements in accordance with International Financial Reporting Standards as they have been adopted by the European Union. This responsibility includes designing, implementing and maintaining internal control relevant to the preparation and fair presentation of financial statements that are free from material misstatement, whether due to fraud or error. This responsibility also includes selecting and applying appropriate accounting policies and making accounting estimates that are reasonable in the circumstances Auditors' responsibility Our responsibility is to express an opinion on these Financial Statements based on our audit. We conducted our audit in accordance the Greek Auditing Standards which are in line with International Standards on Auditing. Those Standards require that we comply with ethical requirements and plan and perform the audit to obtain reasonable assurance whether the financial statements are free from material misstatement. An audit involves performing procedures to obtain audit evidence about the amounts and disclosures in the financial statements. The procedures selected depend on the auditor's judgment, including the assessment of the risks of material misstatement of the financial statements, whether due to fraud or error. In making those risk assessments, the auditor considers internal control relevant to the entity's preparation and fair presentation of the financial statements in order to design audit procedures that are appropriate in the circumstances, but not for the purpose of expressing an opinion on the effectiveness of the entity's internal control. An audit also includes evaluating the appropriateness of accounting policies used and the reasonableness of accounting estimates made by management, as well as evaluating the overall presentation of the financial statements. We believe that the audit evidence we have obtained is sufficient and appropriate to provide a basis for our audit opinion. Opinion In our opinion, the accompanying Financial Statements give a true and fair view of the financial position of the Company as of 31 December 2006, and of its financial performance and its cash flows for the year then ended in accordance with International Financial Reporting Standards as they have been adopted by the European Union.

65
KPMG Kyriacou Certified Auditors AE 3 Stratigou Tombra Street 153 42 Aghia Paraskevi Greece
Emphasis of matter Without qualifying our report, we draw attention to Note 28 of the Financial Statements which states that the tax obligations of the Company and the subsidiaries of the Company have not been audited by the tax authorities for certain years and consequently, have not been finalized. The outcome of the tax audits cannot be foreseen at the present time. Report on other legal and regulatory requirements The contents of the Report of the Board of Directors is consistent with the Financial Statements
Αθήνα, 20 Μαρτίου 2007 KPMG Kyriacou Certified Auditors A.E.
John A. Achilas, Certified Auditor Accountant AM SOEL 12831