How Well Will the IAEA Be Able To Safeguard More Nuclear Materials in More States
Upload
khangminh22Category
view
5download
0
Be More Digital_
2013 Integrated report

1 _ 4 _2 _
3 _
5 _
6 _07 Letter from the Chairman
10 Management and Governance bodies
12 Board of Directors
14 Board members
16 Board of Directors’ Committees
18 Top management
42 Be More_ Profitable
44 Be More_ to the customers
50 Be More_ Digital
56 Be More_ Global
64 Be More_ Engaged
68 Be More_ Recognized
74 Be More_ Innovative 80 Be More_ to entrepenurials
86 Be More_ Sustainable
90 Be More_ to society
Contents
22 Telefónica in the world
24 Telefónica in figures
26 Telefónica’s economic impact
27 Fiscal transparency
30 Sector
34 Vision
36 Stategy
38 Public position
94 Performance indicators
From Telefónica
Be More_ Performance indicators
Telefónica in 2013
Accelerating towards a Digital Telco
Appendices
The Telefónica Annual Report 2013 is made up of the Integrated report, Annual corporate governance report’, Financial report and the Corporate Sustainability report.If you wish to access any of the component books, capture the corresponding BIDI code with your smartphone or tablet. You can also access more information of interest by capturing the BIDI codes inserted on certain pages.
101 2013 fiscal year results
154 Risk Management policy
The Telefónica Annual Report 2013 is available in an online version for smartphone and tablet.
Be More Digital_
2013 Integrated report
2013
| In
tegr
ated
repo
rt
Libro cubiertas.indb 4 26/05/14 19:37
Be More transparent_
2013 Annual corporate governance reportAnnual report on the remuneration
of Directors
2013
| A
nnua
l cor
pora
te g
over
nanc
e re
port
/ A
nnua
l rep
ort o
n th
e re
mun
erat
ion
of D
irect
ors
Libro cubiertas.indb 4 26/05/14 19:37
Be More Solid_
2013 Financial report
Libro cubiertas.indb 4 26/05/14 19:37
2013 Corporate Sustainability report
Be More Sustainable_
2013
| C
orpo
rate
Sus
tain
abili
ty re
port
Libro cubiertas.indb 4 26/05/14 19:37

Telefónica | Annual Report 2013 Telefónica | Annual Report 2013
1. Letter from the ChairmanTelefónica Integrated report 2013
Telefónica advanced significantly toward becoming a Digital Telco and an industry benchmark for growth and efficiency
“ ““Improvements in economic, business sentiment and consequently market indicators justify greater optimism across the countries whereTelefónica operates”
Letter from the Chairman _César Alierta IzuelExecutive Chairman
ultrabroadband, the number of connected households now comes to 1.5 million, for a penetration of 34%. As a result, the Company’s total accesses continued to grow yet another year, reaching 323 million.
In Europe, with the transactions announced in the Czech Republic, Germany and Ireland, we are pioneering in-market consolidation. Our achievement in Spain has made us an industry benchmark of efficiency and profitability. And Latin America, where our growth continues to climb at a good pace, has consolidated its position as the number one source of revenue for Telefónica, whose leading position in Brazil, the region’s largest market, is indisputable.
We have also reinforced our digital capacities, developing new products, implementing new business models and establishing key alliances with other ecosystem agents. Moreover, we have made a huge effort to transform networks and systems and taken significant steps to capture economies of scale.
These accomplishments are all the outcome of the transformational driving force that has energised each and every one of the Company’s areas.
Our revenues amounted to 57.1 billion euros in 2013, with organic growth accelerating at a rate of 0.7%. A substantial contribution to that upward trend came from Latin America, where organic sales rose by 9.6%.
Dear shareholders: I am delighted, once again, to give you an account of Company performance and results, on this occasion for 2013. I am also pleased to share with you the major steps taken early this year that will make Telefónica a leading Digital Telco in an industry that continues to hold huge growth opportunities.
The year 2013 proved to be a turning point and a time to prepare for worldwide economic recovery in the months ahead. Improvements in economic, business sentiment and consequently market indicators justify greater optimism across the countries where Telefónica operates.
Institutional progress in European integration continues forward, while the reformist agenda designed to enhance the competitiveness of most European countries, Spain among them, is also on track. These two factors have been and will continue to be the keys to future growth in the region and especially in Spain in the years to come.
Now that economic growth in Latin America has stabilised at around 3%, microeconomic and institutional reforms will also be needed if the region is to surpass its growth potential. Its growing middle class, the removal of former constraints and its demographic bonus make it one of the world’s most promising economic development areas.
Return to organic revenue growth and margin stabilisation In 2013 Telefónica has advanced significantly in its transformation, achieving the targets set for the year, including: the return to organic revenue growth, sustained margin stabilisation and greater financial flexibility. At the same time, the company’s growth potential was strengthened thanks to active portfolio management.
Allow me to stress that this year we consolidated our commitment to a sustainable long-term growth model, reinforcing our competitive position in higher value segments and markets. Our contract mobile accesses, at over 89 million, were up by 9% vs. 2012, driven primarily by the rise in smartphone use, whose penetration is now 27%, with our proactive promotion of
At the same time, advances in efficiency resulting from ongoing efforts in simplification and cost-cutting brought Operating Income Before Depreciation and Amortisation (OIBDA) to 19.1 billion euros, remaining organically stable with respect to the preceding year. Profitability also held at a steady 33.4%, while net income came to 4.6 billion euros, up by 17% over 2012.
The Company’s significant investment efforts in 2013 translated into a total volume of more than 9.3 billion euros, including spectrum. More specifically, aiming at assuring future Company growth, most of our investment was targeted at transforming our networks, primarily our fixed and mobile high speed broadband facilities, into clearly distinctive assets.
Allow me to close this brief summary of Company performance with a word about our record debt reduction, due to an active portfolio management, that enabled us to focus on key markets and reinforce our growth profile. I am pleased to report that with our more than 5.8 billion-euro deleverage, we were the European telco that lowered its debt most steeply in 2013, for the second year in a row.
Attractive remuneration for shareholdersThe year 2013 likewise constituted a turning point for stock markets, with the main European exchanges up at year-end after three consecutive years of declines. This rise was driven by less concern about the euro zone crisis, greater investor confidence and the maintenance of stimulus packages in the United States.
In this context, Telefónica’s share price climbed by a sharp 16.1%, to 11.84 euros. This good performance, in conjunction with our dividend policy, brought total shareholder return in 2013 to 19.6%.
In 2014, the Company will stand by its commitment to its shareholders, with a proposed dividend of 0.75 euros per share, 0.35 euros of which will be distributed in the fourth quarter of 2014 as a “scrip dividend”, further to the proposal submitted to the General Shareholders’
5,878 M€record on debt reduction
9.6%increase of revenues in Latin America
0.75€dividend per share in 2014
1.5 Mhouseholds connected with ultrabroadband
27%Smartphone penetration over mobile
9,395 M€Capital Expediture
16.1%share appreciation
54

Telefónica | Annual Report 2013 Telefónica | Annual Report 2013
1. Letter from the ChairmanTelefónica Integrated report 2013
Meeting. The proposal also includes payment of the remaining 0.40 euros in cash in the second quarter of 2015.
At the present share price (12.07 euros on 30/04/14), the remuneration announced for 2014 constitutes a 6.2- per cent yield. This is the highest dividend yield forecast for 2014 offered by top telco players, in terms of market capitalisation. Yet another year, Telefónica is honouring its firm commitment to remunerate its shareholders.
A major leap forward in our transformation into a Digital TelcoIn early 2014, Telefónica advanced significantly toward becoming a Digital Telco and an industry benchmark for growth and efficiency. A Digital Telco combines traditional and digital assets to help people access and enjoy the best that technology can offer.
The Company pioneered focus on the digital world in 2011, and we are now speeding up our transformation with a new operating model. To that end, Telefónica has defined four strategic pillars, positioning its digital offering at the core of its commercial activity.
First of all, we want to grow revenues, focusing on monetising data traffic and digital services.
Secondly, we are going to become a more technologically-minded Company, furthering networks and systems modernisation.
Thirdly, we are going to become more efficient thanks to simplification and increased leverage on our scale, within a context of strict financial discipline.
Lastly, we are going to strengthen our leadership in the digital ecosystem, pursuing a new public positioning from which to regain the balance in the hypersector value chain, focusing particularly on privacy and security as key elements in the digital world’s new rules.
In keeping with these priorities, and to quicken our transformation into a Digital Telco, we have implemented a new, more agile and more customer-oriented organisational structure.
In parallel, a global synergy plan has been designed to generate savings worth 1.5 billion euros in the next years, to be derived primarily from significant savings in networks, IT and our support and commercial areas.
In addition to operating more efficiently, the Company is going to grow its investments to speed up network and system modernisation to drive future growth. More specifically, Telefónica has announced a significant increase in its capital expenditure volumes in 2014, which will raise its capex-to-sales ratio to 15.5-16%. Transformation and growth will account for 75% of the total, with sharp rises in investments in fibre and LTE.
The Digital Revolution: transformation of all spheres of societyAllow me now to address the prospects for our industry, positioned as it is at the very core of the deep Digital Revolution that is transforming every aspect of our lives.
This wave of digitisation offers vast growth opportunities for society and all sectors of the economy, particularly, new opportunities to create companies and jobs.
Connectivity has advanced rapidly and has recently reached what I believe is a key milestone: for the first time, there are more mobile connections than people. Smartphone penetration, however, the main driver of mobile access growth, stands at around 34%, an indication of the enormous opportunity that lies ahead for the industry.
Nonetheless, let me say that all of the above is only the “tip of the iceberg”, and that the Digital Revolution in which we are immersed is going to bring unprecedented change in society as we know it.
The “Internet of things”, for instance, has enormous potential, especially bearing in mind that 99% of today’s objects are unconnected and that by 2020, according to some estimates, there will be 50 billion “connected things”.
This explosion in connectivity entails disruptive change in the present production model, through Big Data, cloud computing and even 3D printers, which are fuelling reinvention and transformation in many industries. Financial services, security, health, education, advertising, government and media content are some of the sectors where efficiency is rising and new business opportunities are appearing in today’s digital world.
Commitment to societyTelefónica’s commitment to society led to our distinction by Fortune magazine in 2013 as the most admired telco in Europe and the second worldwide.
That distinction rests on four major factors. The first is our firm commitment to innovation, as reflected in our substantial investment in R&D+i, which amounted to over 6.1 billion euros in 2013, up by 6.5 % on the preceding year. In fact, based on the latest data available, the European Commission reported that Telefónica invested more in R&D than any other European telco, and ranked second worldwide.
Secondly, in 2013 our Company was the main promoter of entrepreneurship worldwide, with a unique model built on open innovation. We have recently launched Open Future, a programme that integrates all initiatives that we have been fostering for some time such as Think Big, Talentum, Wayra, Telefónica Ventures and Amérigo.
The third factor that merits mention is our engagement with social projects. Channelled essentially through Fundación Telefónica, these projects favour youth, further education, art and culture, pursue social development and implement social programmes.
Lastly, our corporate sustainability policy focuses on seizing opportunities and effectively managing the risk inherent in economic, environmental and social development. Proof of this lies in our Company’s prominent position in a number of corporate sustainability rankings.
I would like to close by underscoring our Company’s position as a key industry player. And counting as we do on a reputed team of professionals, I feel confident that Telefónica will play an increasingly decisive role in the digital world, because we are convinced that technology should be open to people, companies and governments so they can all BE MORE.
On behalf of Telefónica and its Board of Directors, I take this opportunity to thank you again for your support and trust.
2013 Var. vs. 2012 Organic
0.7%57,061Revenues
0.0%19,077Operating Income Before Depreciation and Amortisation (OIBDA)
-0.2 p.p.33.4%OIBDA margin
“To quicken our transformation into a Digital Telco, we have implemented a new, more agile and more customer- oriented organisational structure”
Four axes of transformation
Grow revenuesMonetising data traffic and digital services
1
Become a more technologically- minded CompanyNetworks and systems modernisation
2
Become more efficientSimplification and financial discipline
3
4
Strengthen our leadership in the digital ecosystemRegain the balance in the hypersector value chain
César Alierta IzuelExecutive Chairman
76
1. From Telefónica_A more agile organisation

Telefónica | Annual Report 2013 Telefónica | Annual Report 2013
Telefónica Integrated report 2013
With the support of its Committees, the Board of Directors of Telefónica, S.A. conducted its operations in accordance with standards of Corporate Governance contained mainly in the Bylaws, the Regulations of the General Meeting of Shareholders and the Regulations of the Board of Directors.
The Board of Directors is the supervisory and control body for the operations of the Company, with exclusive jurisdiction, among other decisions, over the policies and strategies of the Company, including those related to Corporate Governance, Corporate Responsibility, remuneration of Directors and Senior Executives and returns for shareholders; as well as any strategic investments. To reinforce the Corporate Governance of the Company,
the Board of Directors of Telefónica, S.A. has seven Committees, which are entrusted to the examination and monitoring of areas of particular relevance.
In addition, under its own Regulations, the Board of Directors entrusts the ordinary management of business to the executive bodies and to the management team of Telefónica, S.A.
More detailed information on this matter is contained in the Annual Corporate Governance Report and in the Annual Report for Remuneration of Directors. These documents are available at:www.telefonica.com/accionistaseinversores
MANAGEMENT AND GOVERNANCE BODIES
Board of Directors _The Board of Directors of Telefónica responds to the needs of an international company, which operates worldwide to transform the possibilities being offered by the new digital world into reality.
More informationfound at the 'Shareholders and Investors' section of the corporate website.
1. From Telefónica
Composition of the Board of Directors and its Board Committees Ex
ecut
ive C
omm
issio
n
Audi
t and
Con
trol
Com
mitt
ee
Nom
inat
ing,
Com
pens
atio
n an
d Co
rpor
ate
Gove
rnan
ce C
omm
ittee
Inst
itutio
nal A
ffairs
Com
mitt
ee
Regu
latio
n Co
mm
ittee
Serv
ice Q
ualit
y an
d Cu
stom
er S
ervi
ce C
omm
ittee
Inno
vatio
n Co
mm
ittee
Stra
gety
Com
mitt
ee
Mr. César Alierta Izuel (Chairman)
Mr. Isidro Fainé Casas (Vice-Chairman)
Mr. José María Abril Pérez (Vice-Chairman)
Mr. Julio Linares López (Vice-Chairman)
Mr. José María Álvarez-Pallete López (Chief Operating Officer)
Mr. José Fernando de Almansa Moreno-Barreda
Ms. Eva Castillo Sanz
Mr. Carlos Colomer Casellas
Mr. Peter Erskine
Mr. Santiago Fernández Valbuena
Mr. Alfonso Ferrari Herrero
Mr. Luiz Fernando Furlán
Mr. Gonzalo Hinojosa Fernández de Angulo
Mr. Pablo Isla Álvarez de Tejera
Mr. Antonio Massanell Lavilla
Mr. Ignacio Moreno Martínez
Mr. Francisco Javier de Paz Mancho
Mr. Chang Xiaobing
Mr. Ramiro Sánchez de Lerín García-Ovies (Secretary, non-director)
Ms. María Luz Medrano Aranguren (Vice Secretary, non-director)
1110

Telefónica | Annual Report 2013 Telefónica | Annual Report 2013
Telefónica Consolidated Report 2013
MANAGEMENT AND GOVERNANCE BODIES
Board Members _A solid government body based on experience and diversity
Mr. César Alierta IzuelExecutive ChairmanDegree in Law from the University of Zaragoza and a Masters in Business Administration from Columbia University.Director of China UniCom (Hong Kong) Limited and International Consolidated Airlines Group (IAG). Member of the Columbia Business School Board of Overseers and Chairman of the Social Council of the Universidad Nacional de Educación a Distancia (UNED).Among other positions held, he was the Founding President of the Beta Capital Company, President of the Spanish Institute of Financial Analysts and President of Tabacalera, S.A.
Mr. Isidro Fainé CasasVice-ChairmanPhD in Economics. Qualified in High Level Management from the IESE Business School. ISMP (International Senior Managers Program) in Business Administration from Harvard University. Financial analyst and permanent member of the Royal Academy of Economics and Finance.He is the Chairman of the 'Caja de Ahorros y Pensiones de Barcelona' (“la Caixa”), of Caixabank, S.A., of Criteria Caixaholding, S.A., and of the Confederación Española de Cajas de Ahorros; Vice-President of Abertis Infraestructuras, S.A., AGBAR, Sociedad General de Aguas de Barcelona, S.A., and Repsol, S.A. Furthermore, he is a Director of the Banco Português de Investimento, S.A. (BPI) and Non-Executive Director of The Bank of East Asia.
Mr. José María Abril PérezVice-ChairmanDegree in Economics from the University of Deusto and Professor at said university for 9 years.Some of his other roles in the past include being the General Director of Wholesale and Investment Banking at the BBVA, S.A. and member of the Steering Committee. Furthermore was Financial Director of SAAL and of Sancel-Scott Ibérica, Executive Coordinator of Banco Español de Crédito, S.A., General Director of Grupo Industrial de BBV, Director of Repsol, Iberia and Corporación IBV, as well as Vicepresident of Bolsas y Mercados Españoles (BME).
Mr. Julio Linares LópezVice-ChairmanTelecommunications Engineer, he joined the Telefónica Group in May of 1970, in the Centre for Reaserch and Development. Since then, he has held numerous positions at Telefónica, for example CEO at Telefónica Multimedia, Executive Chairman of Telefónica España, President of the Supervisory Board of Cesky Telecom, General Director of Coordination, Business Development and Synergies, and COO of Telefónica, S.A. He is a member of the Board and the Executive Committee of the GSM Association and Patron of the Mobile World Capital Barcelona Foundation. He is also a Board Member for the Asociación para el Progreso de la Dirección and the Consejo Social of the Complutense University of Madrid.
Mr. José María Álvarez-Pallete LópezCHIEF OPERATING OFFICER (COO)Degree in Economics from the Complutense University of Madrid. Economic studies at the Université Libre de Belgique. International Management Program (IMP) from the Pan American Institute for Executive Management Development (IPADE). DEA (Advanced Studies Diploma) from the Chair of Financial Economics and Accounting from the Complutense University.Currently holds a post as Chief Operating Officer (C.O.O), after having had various roles in the Telefónica Group since 1999. He has been Chairman of Telefónica Europe, Chairman of Telefónica Latin America, Director-General of Corporate Finance in Telefónica, S.A.. He previously worked at Arthur Young Auditors, Benito & Monjardín/Kidder, Peabody & Co. and Cementos Portland (Cemex). He was a Director at Cemex Singapur, China Netcom Group Corporation Limited, and Portugal Telecom SGPS, S.A.
Mr. José Fernando de Almansa Moreno-BarredaBoard MemberDegree in Law from the University of Deusto (Bilbao).Started his diplomatic career in 1974. Ever since then, he has occupied various diplomatic roles for Spain: in Brussels, Mexico, the Atlantic Alliance and the USSR, until he was appointed Chief of the Royal Household, with ministerial rank by His Majesty the King.He is currently a Personal Advisor to his Majesty the King.Furthermore, he is Director of Telefónica Brazil, S.A. and of Telefónica Móviles Mexico, S.A. for C.V. In addition, he is an Alternate Director of the Financial Group of BBVA Bancomer, S.A. of C.V. and BBVA Bancomer, S.A.
Ms. Eva Castillo SanzBoard MemberDegree in Law and Business from the Comillas Pontifical University, ICADE (E-3) of Madrid.She is currently the President of the Supervisory Board of Telefónica Deutschland Holding, AG; Director of Bankia, and member of the Comillas-ICAI Foundation.Among her other positions, she was Chairman and CEO of Telefónica Europe, President of the Supervisory Board of Telefónica Czech Republic, a.s. and Director of Old Mutual, Plc.She carried out various roles at Merrill Lynch until she was appointed Director of Merrill Lynch Banca Privada for Europe, the Middle East and Africa (EMEA), a position she held until December 2009.
Mr. Carlos Colomer CasellasBoard MemberDegree in Economics from the University of Barcelona and a graduate of Business Administration for Companies from the IESE (Barcelona).He is the Chairman of Ahorro Bursátil, S.A. SICAV, Inversiones Mobiliarias Urquiola, S.A. SICAV, and Haugron Holdings, S.L.Furthermore, he is an Independent Director of Abertis Infraestructuras, S.A. and MDF Family Partners.Up until 2013, he was Chairman and Managing Director of The Colomer Group, having previously carried out other roles, such as President General Director at Henry Colomer, S.A. and Haugron Cientifical S.A., President at Revlon Europe and International, and Executive Vice-President and COO at Revlon in New York.
1. From Telefónica
Mr. Peter ErskineBoard MemberDegree in Psychology from the University of Liverpool.He is the Chairman of Ladbrokes, Plc., and on the Advisory Board of Henley Management Centre, and Board Member of the University of Reading.He worked at Polycell, Colgate Palmolive, at the Mars Group and UNITEL.He additionally had various roles at BT Mobile until he was appointed CEO and Chairman of O2, Plc., a position he held until December 2007.
Mr. Santiago Fernández ValbuenaBoard MemberDegree in Economics from the Complutense University and PhD and Masters in Economics from the Northeastern University of Boston.He is the General Director of Strategy. Furthermore, he is the Vice-President of Telefónica de Brasil, S.A. and Director at Ferrovial, S.A.Previously, he was Chairman of Telefónica Latinoamércia, General Director of Finance and Strategy, and General Director of Finance and Corporate Development. He was also Managing Director of Fonditel, the Group's pension fund manager.Before starting at Telefónica, he was General Director of the Société Générale Valores and Head of Equities at Beta Capital. He was Head Professor for Applied Economics at the Complutense University of Madrid and of Murcia, and Professor at the IE Business School.
Mr. Alfonso Ferrari HerreroBoard MemberPhD in Industrial Engineering, specialised in Electronics at the Superior Technical School of Industrial Engineers from the Politécnica University of Madrid. Masters in Business Administration for Companies at Harvard University (USA).He is Director of Telefónica Peru, S.A. and Alternate Director of Telefónica Chile, S.A.He was Joint Financial Director of the Hidroeléctrica del Cantábrico, S.A. (hydro-power plant), Director of Industrial Investments at the Urquijo Bank, and founding partner, President and CEO of Beta Capital, S.A.
Mr. Luiz Fernando FurlánBoard MemberDegree in Chemical Engineering at the FEI (Faculty of Industrial Engineering in Sao Paulo) and Business from the University of Santanta in São Paulo, specialising in Financial Administration for the Getúlio Vargas Foundation of São Paulo.He is Chairman of the Board of Directors for the Amazonas Sustainable Foundation and member of the Board of Directors for Brasil Foods, S.A., Telefónica Brazil, S.A., AGCO Corporation, and member of the Advisory Council for Panasonic (Japan), McLarty & Associates (USA), Wal-Mart Stores Inc. (USA) and Abertis Infrastructure, S.A.From 2003 to 2007 he was Minister of Industry, Development and Commerce of Brazil. Previously, he was member of the Board of Directors and Advisor for numerous companies, such as Sadia, S.A., Panamco, and ABN Amro Bank in Brasil.
Mr. Gonzalo Hinojosa Fernández de AnguloBoard MemberPhD in Industrial Engineering from the Superior School of Industrial Engineers in Madrid. He is Director of Telefónica Peru, S.A.A. He was the General Director, CEO and Chairman of Grupo Cortefiel until the year 2006. He was also a Director of the Banco Central Hispano Americano, of Portland Valderribas and of Altadis, S.A.
Mr. Pablo Isla Álvarez de TejeraBoard MemberDegree in Law from the Complutense University of Madrid and Former State Attorney.He is the Chairman and CEO of the INDITEX Group since 2011. Since the year 2005 he had been Vice-Chairman and CEO.Previously Director of Legal Services at Banco Popular, General Director of State Assets at the Ministry of Economy and Finances, and President of the Altadis Group (2000-2005).
Mr. Antonio Massanell LavillaBoard MemberDegree in Economics and Business from the University of Barcelona. He is the General Director of Caixabank. He is also the Head of the Barcelona Digital Centre Tecnològic (formerly the Digital Barcelona Foundation) and Non-Executive Chairman of Cecabank. In addition, he is Director for Boursorama, S.A., Mediterranea Beach & Golf Community, S.A., and SAREB (Asset management company from Bank Restructuring).During his professional carreer, he has been a Board Member at several companies, such as Visa Spain, Inmobiliaria Colonial, and Chairman of Port Aventura Entertainment, S.A.
Mr. Ignacio Moreno MartínezBoard MemberDegree in Economics and Business from the University of Bilbao.Masters in Marketing and Business Management from the IE Business School. Masters in Business Administrations (MBA) at INSEAD.He is currently CEO for N+1 PRIVATE EQUITY and Non-Executive Chairman of Metrovacesa, S.A. He is also a Director at Secuoya, Grupo de Comunicación, S.A.He has worked at Banco de Vizcaya, Banco Santander de Negocios, Mercapital, Corporación Bancaria de España, S.A., Argentaria Bolsa, Sociedad de Valores and Banco Bilbao Vizcaya Argentaria, S.A., where he was the General Director of the Chairman's Office.
Mr. Francisco Javier de Paz ManchoBoard Member Degree in Information and Advertising Studied Law. Senior Management Program from the IESE (University of Navarre).He is the Director of Telefónica Argentina, S.A. and Telefónica Brazil., S.A., and member of the Executive Committee of Cámaras.Among other positions, he has been the Chairman of Atento Inversiones y Teleservicios, S.A.U., of Empresa Nacional MERCASA, Director of Tabacalera, S.A., Deputy President and Director of Corporate Strategy of Grupo Panrico Donuts, General Director of Domestic Trade at the Ministry of Domestic Trade and Tourism, and Board Member of Grupo Panrico.
Mr. Chang XiaobingBoard MemberProfessor in Advanced Engineering. Degree in Telecommunications Engineering from the Nanjing Institute of Posts and Telecommunications, Masters in Business Administration from Tsinghua University in 2001 and PhD in Business Administration from Hong Kong Polytechnic University.He is Chairman of the China United Telecommunications Corporation and President and CEO of China Unicom (Hong Kong) Limited.
1312

Telefónica | Annual Report 2013 Telefónica | Annual Report 2013
Telefónica Integrated report 2013
Executive CommissionRoles. Subject to the legal provisions in force, the Board of Directors has its powers and duties delegated, except for those that may not be transferred by law or statute, to an Executive Commission. This Commission provides the Board of Directors with an improved operating capacity and effectiveness in the performance of its duties, providing the required support through the carrying out of its tasks, especially to the extent that its membership is lower than that of the Board, and that it meets more frequently than such.
The relationship between both bodies is based upon the principle of transparency, so that the Board is always aware of the decisions adopted by this Commission. Thus, the Board of Directors is informed at each of its meetings of all resolutions adopted by the Executive Commission, for which effect it shall submit a summary of the minutes of any meetings held by the Commission to each and every Director, proceeding further to ratify such agreements.
MembershipMr. César Alierta Izuel Chairman Mr. Isidro Fainé Casas Vice-ChairmanMr. José María Abril Pérez Vice-ChairmanMr. José María Álvarez-Pallete López Chief Executive OfficerMr. Carlos Colomer Casellas MemberMr. Peter Erskine MemberMr. Alfonso Ferrari Herrero MemberMr. Gonzalo Hinojosa Fernández de Angulo MemberMr. Francisco Javier de Paz Mancho MemberMr. Ramiro Sánchez de Lerín García-Ovies Secretary
Audit and Control CommitteeRoles. Among other roles, it serves to support the Board of Directors in its supervisory duties and assumes the responsibilities in reporting on the issues raised by shareholders regarding the jurisdiction of the Committee; to propose the appointment and terms of engagement by the auditor; to supervise the internal audit and the process of preparation and presentation of regulated financial information; to propose control and risk management policy, and to establish and maintain an appropriate relationship with the auditor.
Membership
Date of AppointmentMr. Carlos Colomer Casellas (Chairman) 24 April, 2013Mr. Alfonso Ferrari Herrero 27 February, 2008Mr. Gonzalo Hinojosa Fernández de Angulo 26 June, 2002Mr. Antonio Massanell Lavilla 30 August, 2000Mr. Ignacio Moreno Martínez 31 May, 2013
Nominating, Compensation and Corporate Governance CommitteeRoles. Assumes the task of informing, based on criteria of objectivity and company interests, the proposals for appointment, reappointment and removal of Directors and Senior Executives of the Company and its subsidiaries, by evaluating the competencies, knowledge and experience required of the candidates to fill any vacancies. Also, it proposes to the Board of Directors, within the framework established in the bylaws, the extent and amounts of remuneration, rights and economic rewards of the Chairman, Executive Directors and Senior Executives of the Company, including the basic terms and conditions of their contracts for the purposes of their written contracts. It also supervises the compliances of the internal codes of conduct of Telefónica and the rules of Corporate Governance in force at all times.
Membership Date of AppointmentMr. Alfonso Ferrari Herrero (Chairman) 30 May, 2001 Mr. Carlos Colomer Casellas 23 January, 2008 Mr. Peter Erskine 27 February, 2008 Mr. Pablo Isla Álvarez de Tejera 26 June, 2002 Mr. Gonzalo Hinojosa Fernández de Angulo 30 November, 2005
MANAGEMENT AND GOVERNANCE BODIES
Committees of the Board of Directors _
1. From Telefónica
Institutional Affairs CommitteeRoles. Notwithstanding other duties entrusted to the Board of Directors, the Institutional Affairs Committee assumes the roles to analyse, report and propose to the Board of Directors of any principles that must accommodate patronage and sponsorship policy for the Group, monitor and individually approve any individual patronage or sponsorship, whereby the sum or importance exceeds the amount or value set by the Council and that must be approved by such. Also, it promotes the development of the project for Corporate Reputation and Responsibility of the Telefónica Group, along with the implementation of the core values of such Group.
Membership Date of AppointmentMr. Julio Linares López (Chairman) 31 May, 2013Mr. José Fernando de Almansa Moreno-Ba-rreda 31 May, 2013Mr. Alfonso Ferrari Herrero 31 May, 2013Mr. Gonzalo Hinojosa Fernández de Angulo 31 May, 2013Mr. Antonio Massanell Lavilla 31 May, 2013Mr. Francisco Javier de Paz Mancho 31 May, 2013
Regulation CommitteeRoles. Among its other duties, it assumes the function of conducting ongoing monitoring of the main topics and regulatory issues that affect the Telefónica Group at all times. Also, it serves as a channel for communication and information between the Management Team and the Board of Directors in regards to regulatory matters and, where appropriate, making such aware of any matters that are considered as important or relevant to any of the the companies of its Group, and for those where it is necessary or appropriate to adopt a decision or to establish a particular strategy.
Membership Date of AppointmentMr. Gonzalo Hinojosa Fernández de Angulo (Chairman) 24 April, 2013 Mr. José Fernando de Almansa Moreno-Ba-rreda 25 January, 2006 Ms. Eva Castillo Sanz 16 December, 2009 Mr. Alfonso Ferrari Herrero 5 July, 2007 Mr. Pablo Isla Álvarez de Tejera 23 January, 2008 Mr. Ignacio Moreno Martínez 31 May, 2013 Mr. Francisco Javier de Paz Mancho 23 January, 2008
Service Quality and Customer Service CommitteeRoles. Among other aspects, it undertakes the regular examination, analysis and monitoring of the quality indices of the key services provided by the companies of the Telefónica Group. It also assesses the level of customer service by these companies.
Membership Date of AppointmentMr. Antonio Massanell Lavilla (Chairman) 26 March, 1999Ms. Eva Castillo Sanz 16 December, 2009Mr. Carlos Colomer Casellas 26 June, 2002Mr. Alfonso Ferrari Herrero 16 December, 2009Mr. Gonzalo Hinojosa Fernández de Angulo 26 June, 2002Mr. Ignacio Moreno Martínez 31 May, 2013Mr. Francisco Javier de Paz Mancho 31 May, 2013
Strategy CommitteeRoles. Among other functions, it assumes as its main task to support the Board of Directors in the analysis and monitoring of the strategic policy of the the Telefonica Group on a worldwide basis.
Membership Date of AppointmentMr. Peter Erskine (Chairman) 17 December, 2008 Mr. José Fernando de Almansa Moreno-Barreda 17 December, 2008 Ms. Eva Castillo Sanz 17 December, 2008 Mr. Alfonso Ferrari Herrero 23 June, 2010 Mr. Gonzalo Hinojosa Fernández de Angulo 17 December, 2008 Mr. Julio Linares López 31 May, 2013
Innovation CommissionRoles. Its underlying mission is to advise and provide support in all matters related to innovation, by periodically analysing, investigating and monitoring any innovation projects of the Company, providing criteria and support to ensure the their proper implementation and development throughout the Telefónica Group.
Membership Date of AppointmentMr. Carlos Colomer Casellas (Chairman) 30 July, 2008 Mr. José María Abril Pérez 18 May, 2011 Mr. Antonio Massanell Lavilla 30 July, 2008 Mr. Peter Erskine 30 July, 2008 Mr. Julio Linares López 18 December, 2013
1514

Telefónica | Annual Report 2013 Telefónica | Annual Report 2013
1. From TelefónicaTelefónica Integrated report 2013
MANAGEMENT AND GOVERNANCE BODIES
Management Team _Telefonica is led by a group of committed professionals with a new operational model to take advantage of digital opportunities and become a more efficient Digital Telco.
Strategy Santiago Fernández Valbuena
Finance and Corporate DevelopmentÁngel Vilá
Public Affairs and RegulationCarlos López Blanco
General CounselRamiro Sánchez de Lerín
Chief Operating Officer José María Álvarez-Pallete
Executive Chairman
César Alierta
More informationunder 'Corporate Governance' section of the Company website
Control and PlanningLaura Abasolo Chief Global
Resources OfficerGuillermo Ansaldo
Chief Commercial Digital OfficerEduardo Navarro
HispAm *
Eduardo Caride
Telefónica BrazilPaulo César Texeira
Telefónica GermanyMarkus Haas
Telefónica GermanyRachel Empey
Telefónica SpainLuis Miguel Gilpérez
Telefónica United Kingdom Ronan Dunne
Telefónica has implemented a new customer-oriented model. The framework provides greater visibility to local operators, by bringing them closer to the centre of corporate decisions, simplifies and strengthens the overall transversal areas in order to improve
flexibility and agility in decision making. The organization evolves around a management team, whose vision is to define strategy and monitor the evolution of business.
* All Latin American countries in which Telefónica is present, except Brazil.
1716

A year in numbers
2. Telefónica in 2013_

Telefónica | Annual Report 2013 Telefónica | Annual Report 2013
2. Telefónica in 2013Telefónica Integrated report 2013
Spain
Revenues* 13,143.4Investment* 1,529Work Force 34,604
Accesses** 41,653.6
CZECH REP +SLOVAKIA (1)
Revenues* 1,787.3Investment* 218
Work Force 6,011Accesses** 9,341.7
ARGENTINA
Revenues* 3,871.6Investment* 574
Work Force 17,139Accesses** 26,650.7
BRAZIL
Revenues* 12,378.3Investment* 2,127Work Force 20,878
Accesses** 92,748.9
CHILE
Revenues* 2,477.9Investment* 488Work Force 4,911Accesses** 13,630.2
COLOMBIA
Revenues* 1,689.7Investment* 457Work Force 3,613Accesses** 14,782
ECUADOR
Revenues* 489.9Investment* 94Work Force 1,365Accesses** 5,151.3
MEXICO
Revenues* 1,613.1Investment* 242
Work Force 2,969Accesses** 21,891.7
PERU
Revenues* 2,499.1€Investment* 479Work Force 9,824Accesses** 20,898
URUGUAY
Revenues* 256.2Investment* 46Work Force 408
Accesses** 1,843.9
VENEZUELA + CENTRAL AMERICA
Revenues* 4,228€Investment* 739
Work Force 8,826Accesses** (23)
GERMANY
Revenues* 5,154.9Investment* 666
Work Force 5,735 Accesses** 25,166.9
IRELAND (1)
Revenues* 538.2Investment* 56Work Force 967
Accesses** 1,552
UNITED KINGDOM
Revenues* 6,651.7Investment* 1,385
Work Force 7,833Accesses** 23,903.6
Telefónica in the world _
2nd global operator for investment in R+D
57,061 M€of joint income
9,395 M€of total investment
126,730 work force95% in permanent employment
323.1 Millonof accesses
2nd European operatorper revenues
* Millions of Euros** Unit expressed in thousands
(2)Telecom Italia doesn’t include Brazil.
Strategic & Industrial Alliances
+Stake5.02 %
> 1,000 million combined customers(2)
~13 mn. customers
~148 mn. customers
~3 mn. customers
~70 mn. customers
Stake10.28 %
Partners Program
(1) As post-closing events, the disposals of Telefónica Czech Republic and Telefónica Ireland were completed in January 2014.
2120

Telefónica | Annual Report 2013 Telefónica | Annual Report 2013
2. Telefónica in 2013Telefónica Integrated report 2013
20122012 20132013
3,928
4,593
2012 2013
6,9515,391
62,35657,061 315,820
323,118
2012 2013
Millions of Euros Millions of EurosMillions of Euros Thousands
Telefónica in figures (2013) _
Includes spectrum payments by 1,499 million Euros (632 million Euros in 2012.) Excluding this effect, the free cash flow would total 6,890 million € (-9.1% compared to the previous year). It is noteworthy that the free cash flow per share for the full year totaled 1.19 € per share, representing a wide coverage in respect of dividends for 2013 (€ 0.75 per share).
Cash Flows -22.4%
51,25945,381
2012 2013
Millions of Euros
In 2013 Telefónica has largely met the target of 47,000 million less net debt. Including management operations of the portfolio of assets not included at the end of 2013 (sale of T. Czech Republic, completed in January 2014, and the sale of T. Ireland) the debt would be 42,325 million € and the debt ratio to 2.31 times, implying a reduction in net debt of 15,985 million € since June, 2012.
Debt -11.5%
Growth of 2% as compared with the previous year, driven by mobile customer contracts, especially mobile broadband and pay TV. The evolution of accesses in Latin America (68% of the total) stands out, which increased by 4% yoy despite the most restrictive criteria in the calculation of prepaid customers. It is important to remember that the variation of accesses is impacted by the sale of assets of residential landline business in the UK.
Total Accesses 2.3%
Revenues increased by 0.7% yoy in 2013 in organic terms (+2.3% yoy excluding the negative impact of regulation) -in line with the goal back to growth set for 2013. Latin America (+9.6%) and mobile data revenues (+9.3%) were the main growth drivers
Revenues -8,5%
Reported net profit has grown nearly 17%, but it should be noted that this was affected by extraordinary charges in both years, among which Telco value adjustment (-245 million Euros in 2013 and -949 million Euros in 2012), Telefónica Ireland value (-513 million Euros in 2013) and the provision of net financial assets in Venezuelan Bolivars (-417 million Euros in 2013).
Net Income 16,9%
Rest of Latam 30.1%
Rest of Europe 24.9%
Spain 23.1%
Brazil 21.8%
Debt reduction
Jun. 12
ND/OIBDA: 2.65x
Dec. 12 Jun. 13 Dec. 13 Dec. 13*
2.31x
58.349.851.3
45.4 42.3
Rest of Latam 39.8% Rest of
Europe 18.6%
Spain 12.9%
Brazil 28.7%
16,000 M€ ~(-30%)
* Including post-closing events (disposal of T. Czech Republic, completed in January 2014, and T. Ireland)
57,061 M€ 323.2 M
2322

Telefónica | Annual Report 2013 Telefónica | Annual Report 2013
2. Telefónica in 2013Telefónica Integrated report 2013
Telefónica in figures (2013) _
2012 2013
21,231
19,077
2012 2013
9,4589,395
27,95826,537
2012 2013
133,263
126,730
2012 2013
Millions of Euros Millions of Euros Millions of Euros People
Foreign currency movements also reduces payments in Euros for CapEx . In organic terms, investment increased by 3.8% yoy (-0.7% reported) engaging about 68% of total investment to business transformation and growth. Note that this includes 1,224 million € of spectrum acquisition, mainly in the UK, Brazil, Peru, Colombia, Spain and Uruguay.
Investment -0.7%
The workforce was reduced in size by 4.9% as compared to the previous year due to the drive for efficiency in the organization, thereby keeping Telefónica innovation capacity given the difficult environment that the sector faces.
Work Force -4.9%
In 2013, Telephone services contracted 15,727 different suppliers of which 83.5% were local suppliers of the several communities in which Telefónica is present. The total number of contracts in Euros is also negatively influenced by the evolution of the exchange rate.
Suppliers -5,1%
In organic terms, the generation of efficiencies and strict cost control remains stable supported by growth in income, a reflection of progress in the transformation strategy of the Company.
OIBDA -10.1%
The fulfillment of the targets set for 2013 has enabled Telefónica to spend 0.35 Euros per share in cash to pay shareholders as a first payment of €0.75 in cash engaged by the company, chargeable to 2013 (second cash payment in the second quarter of 2014). Thus, the total shareholder return of Telefónica in 2013 stood at 19.6%.
2012 2013
Percentage
-19.6%
-17.8%
Improvement of earnings per share (EPS)
Rest of Latam 28.2%
Rest of Europe 19.4%
Spain 32.3%
Brazil 20.1%
Rest of Latam 34.3%
Rest of Europe 25.5%
Spain 16.8%
Brazil 23.4%
Rest of Latam 39.2%
Rest of Europe 16.4%
Spain 27.7%
Brazil 16.7%
19,077 M€ 9,395 M€ 126,730
2524

Telefónica Integrated report 2013
Telefónica | Annual Report 201326
2. Telefónica in 2013
Telefónica | Annual Report 2013 27
Telefónica making an economic impact: driving force of progress _Despite the return to organic growth or revenue obtained in 2013, the effects of the decline of exchang rates for Latin American currencies against the euro has resulted in reduction reported revenues by 8.5%. This, along with the smaller divestments during the financial year (-68.8% compared to the previous year, during which there were permanent financial divestitures in China Unicom and Atento), has resulted in a smaller share of the Company in the global economy when compared to the previous year (-11.1%).
In this manner, the value in which Telefónica has distributed in 2013 has decreased for all its stakeholders , except for public authorities (due to tighter fiscal policy, for both taxes being collected and taxes being paid).
Total inflows
€70,069M-11.1%
Note: The information on this graph is calculated on the basis of payments and takes into account the scope of consolidation of the consolidated statements of cash flows for the financial years ending on December 31.(1) Includes all providers for operating expenses, including interconnection and operating leasing. (2) Includes both dividends and capital increases.
Receivables from operations
€69,149M-9%
Customers Others Latam 37.6%
Customer Rest of Europe 18.6%
Customers Spain 12,9%
Customers Brazil 28.7%
Divestments
€870M-68.8%
Financial Entities 35.6%
Tangibles and Intagibles 64.4%
Total outflows
€70,069M-11.1%
Others (Contains financial expenses, fluctuations in exchange rates, transactions involving treasury shares, charges from holdings, etc.)
€4,697 M-46.9%
Shareholders(2)
€2,559 M-2.2%
Public Authorities
€14,060 M1.6%
Others Latam 27%
Others Europe 10%
Brazil 39%
Spain 24%
Employees
€6,690M-13.2%
Others Latam 38.7%
Others Europe 0.2%
Spain 3.3%
Brazil 8.5%
Investment
€9,395M-0.7%
Others Latam 33.2%
Others Europe 24.7%
Spain 16.3%
Brazil 24.7%
Suppliers (1)
€32,992 M-9%
Others Latam 33.9%
Others Europe 21.7%
Spain 0.2%
Brazil. 26.0%

Telefónica | Annual Report 2013 Telefónica | Annual Report 2013
Telefónica Integrated report 2013 2. Telefónica in 2013
Corporate Income Taxes accounted for 38% of borne tax, while 32% refers to other taxes and fees associated with our economic activity
Telefónica makes quantifiable economic and social contributions by paying taxes to the authorities of the different countries where it operates. The countries where tax payments are largest are precisely the jurisdictions in which Telefónica obtains its main income, namely Brazil, Spain and Argentina.
The total tax contributions of Telefónica in the financial year 2013 were 14,060 million euros, 4,792 million euros of which corresponds to taxes borne and 9,267 million euros to taxes collected. This means that for every 100 euros of Company turnover, 24.6 euros was dedicated to the payment of taxes, or 8.4 to taxes borne and 16.2 to taxes collected. These figures include the payment of taxes and other local fees such as operator general taxes, numbering fees, charges for using the public domain, fees to finance the Public Radio and Television in Spain, and other similar taxes in other countries. Payments
spectrum is not included due to their different classification and accounting treatment.
Taxes on profits represent 38% of the total tax borne. Taxes on goods and services, which are mostly special levies on the telecoms sector, made up 32%, and taxes associated to employment made up 21%. Among the taxes collected, VAT stands out, representing 83% of the total.
The Company's tax contributions in Spain in 2013 were 3,443 million euros, or 24.5% of the total. The tax contribution ratio for Telefónica in Spain was 35.67%: that is, during 2013, Telefónica paid 36 euros out of every 100 euros of pre-tax profits generated in Spain, in taxes.
Out of every 100 euros of Total Value Distributed (*) by Telefonica in 2013, 51 euros were used to taxes.
FISCAL TRANSPARENCY
Contributions to public administrations _A total of 24.6 euros out of every 100 that Telefónica collects overall is paid in taxes
Breakdown of Telefónica’s global tax contributionThousand euros
Taxes borne (1) Taxes collected (2) Total contribution (3)CountryBrazil 1,197,612 4.222,062 5,419,674Spain 1,094,284 2,349,171 3,443,455Argentina 507,294 687,723 1,195,017Central America 774,087 221,836 995,922Germany 170,834 454,200 625,034Peru 299,364 299,648 599,012United Kingdom 43,742 319,308 363,050Chile 158,961 192,036 350,997Colombia 160,654 170,907 331,561Czech Republic 130,231 200,423 330,653Ecuador 84,650 20,536 105,186Mexico 47,035 48,044 95,079Ireland 38,494 38,154 76,648Uruguay 41,047 16,719 57,767Slovakia 7,377 19,021 26,398Luxembourg 18,394 2 18,396Puerto Rico 7,881 8,220 16,101Netherlands 7,203 146 7,349Israel 1,826 1,534 3,359Others 1,951 2,191 240Total 4,792,921 9,267,499 14,060,419
Breakdown of the total tax contribution in the worldDistribution of taxes paid by geographical areas
Taxes borne (1)
Thousand euros Thousand euros
Taxes collected (2)
Brazil 39%
Taxes on profits
1,805,801
Taxes onprofits588,621
Spain 24%
Taxes on propriety465,433
Taxes on propriety 11,308
Rest of Latam27%
Taxes associated to employment996,836
Taxes associated to employment
940,794
Rest of Europe10%
Taxes on products and services1,524,850
Taxes on products and services7,726,777
14,060 M€ 4,792 M€ 9,267 M€
(*) According to the methodology of the CTT of Price Waterhouse Cooper, distributed tax value of a company consists of the sum of the following elements: shareholder value (dividends, reserves, etc.), wages and salaries (net of tax raised to employees), net interest and tax (borne and collected).
(1) Taxes borne. Those taxes paid by Telefonica to the administrations of the various states in which it operates, and have been a cash cost to the Company.(2) Taxes collected. Those taxes collected by Telefonica that have been entered on behalf of other taxpayers as a result of the economic activity of the Company,
i.e. tax revenues are obtained thanks to the economic value generated by it.(3) Total contribution. CT measures the total impact represented by taxes.
2928

A new digital model throughout all the commercial offering
3. Accelerating towards a Digital Telco_

Telefónica | Annual Report 2013 Telefónica | Annual Report 2013
Telefónica Integrated report 2013
In 2013 the figure of 7,000 million mobiles was reached. Already there are more devices than people
The Digital Revolution is coming rapidly and in large numbers. And connectivity, which is at the core of this Revolution and makes it possible, is also advancing. In 2013, the figure of 2,800 million Internet users, 40% of the world's population, was reached. All of them access the Internet via telecoms networks. With 760 million homes connected and 2,200 million mobile broadband connections, we live in a completely connected world.
Social networks reach almost the equivalent of the population of Brazil instantly, and have been decisive in certain recent and deep social and political movements.
Innovation cycles are shorter and consumers want the latest thing. New connected personal devices that are wearable (watches, glasses, bracelets, heart rate monitors...), a connected car, meters or smart houses, control drones and the new services that make a city smart... the Internet of things is taking off.
We are also on the threshold of disruptive change in the model of production, with big data and cloud computing, and even 3D printers that delocalise production like never before. All this is possible thanks to broadband connectivity and it creates opportunities for reinvention and transformation in multiple sectors and industries. Financial services, security, healthcare, education, advertising, public administrations and content provision are among the sectors that are increasing their efficiency and opening up new markets in this new digital world.
Internet traffic has shot up in the era of smartphones, with video being the service that has most influenced its growth. One fifth of all Internet traffic is now generated from mobile devices. And users and companies demand ever more.
To make this Revolution and the opportunity it represents real, networks need to be renewed and transformed. More than 50% of the people in the
THE DIGITAL REVOLUTION
The opportunities of a sector in permanent innovation _Telecoms are at the centre of the Digital Revolution. They let everyone and everything be connected, generating immense opportunities for the sector.
3. Accelerating towards a Digital Telco
world already enjoy 3G coverage. And users await the speeds offered by LTE . Asia is already thinking of the fifth generation. The technology is available and network renovation is vital to keep up with demand and realise the opportunities in the sector.
And all this is only the begining. In 2013 we reached 7,000 million mobiles worldwide, but in 2014 there are already more mobiles than people. If only 30% of these devices have broadband connectivity, the potential for growth is enormous. Traffic per user will pass from 440 MB in 2013 to 3.8 GB in 2018, and total traffic is expected to multiply by 11.
The Internet of things will be superseded by the Internet of everything and according to forecasts, there will be 50,000 million connections by 2020. 99% of these connections are still pending.
There is no doubt: the opportunities generated by the Digital Revolution are real and awaiting the telecoms sector that makes them possible,
1,770million smartphones
in the world
2,800million
Internet surfers on the planet
2,200million
mobile broadband connections
The digital revolution in figures
50,000million
connections by 2020
50%of people worldwide
have 3G coverage
11-foldgrowth in traffic over
next five years
Telcos make the Internet and new digital services possible
Operating systems
Content
Devices
Applications
Telecoms
3332

Telefónica | Annual Report 2013 Telefónica | Annual Report 2013
Telefónica Integrated report 2013 3. Accelerating towards a Digital Telco
Telefónica helps people to access, understand and enjoy what technology can offer them
Technology is amazing and it’s getting more amazing every day. But technology is nothing without people. What is important is how it improves people’s lives. Technology transforms the way in which people are in touch, keep up to date, enjoy, buy, share and learn. Technology also strengthens businesses, providing them with opportunities and increasing their productivity.
Why do we work every day?As a consequence of this reality, at Telefónica we believe that technology should be open to everyone so that we can all be more_. In this way, we can all do more, live better, be more_. We believe in this for three reasons:
➜ Firstly, because Digital Technology provides new opportunites for people and holds the power to transform the Company in a positive light. Due to this, we take the lead in this
transformation, creating opportunities for the many and not the few.
➜ Secondly, because bringing technology to people requires a number of special capabilities; Telefónica is uniquely positioned to make a difference. We can bring technology to people through our networks and our commercial capabilities. This is what we know how to do best.
➜ And thirdly, because technology is creating an unstoppable and irreversible revolution within our industry. We can take advantage of arising opportunites for those companies that best respond to the needs of customers.
How do we work every day?Discover, Disrupt, Deliver define the way we work. These three key attitudes summarise our existing corporate behaviour and brand values as well as
‘COMPANY BELIEF’
...the vision of the Company starts from the conviction..._...that technology should be within reach of people, companies and public administrations so that they can BE MORE_
the insights we gathered from our customers, employees and analysts.
What do we do for our customers?Connectivity is the first step into the digital world. To be a Digital Telco means taking another step. Our mission is to act as a guide for people and businesses. We help people to access, better understand and enjoy what technology can offer them. This means that we will use our consumer knowledge, our networks, our technology and our commercial experience to deliver simple digital services that are smart, safe and enjoyable. In summary, a Digital Telco brings the best of technology to people.
‘Discover’. We have always known the importance of being focused on our customers. However, it is now up to us to discover what it is they need in the digital world.
‘Disrupt’. We anticipate this change and will be innovative using our knowledge of the digital world and our spirit of openness. Disrupt means to improve the rules of the game to generate greater value for our customers and for Telefónica.
‘Deliver’. We take advantage of our global presence, while remaining agile, allowing us to fulfil our commitment of carrying affordable technology to people.
The digital world creates opportunites for companies. We want our shareholders to be more_ by capitalising on the new revenue streams that flow in from our digital future.
We all aim to develop our potential as professionals. We want our employees to be more, achieving the best for themselves, their teams and their clients. We are all committed to being a Great Place to Work.
Technology changes the way in which people live. We want our customers to be more_, discovering, understanding and making the most of technology.
We can all BE MORE_
Technology offers new business opportunities and increases productivity. We want businesses to be more_ thanks to the tools and knowledge in order to stay at the cutting edge of the latest digital innovations.
Institutions are challenged to accelerate socio-economic development. We want institutions to be more_ transformational and for this reason we are openly collaborating with them.
In the digital world, businesses cannot do everything on their own. We want our partners, startups and entrepreneurs to be more_ thanks to our scope, vision and experience.
Society seeks socio-economic progress and the protection of the natural environment. We want it to be more_ by making the most out of technology.
How do we work?
Shareholders Employees Consumers Businesses Institutions Partners Company
3534

Telefónica | Annual Report 2013 Telefónica | Annual Report 2013
Telefónica Integrated report 2013 3. Accelerating towards a Digital Telco
Telefónica pioneered focus on the digital world in 2011, and now is speeding up its transformation with a new operating model
Telefónica has taken another step in its march towards becoming a Digital Telco, namely, a company that combines traditional telco assets with digital assets to help people to access and enjoy the best that technology can offer. A Digital Telco that is a point of reference in the sector for growth and efficiency that will let it capture digital opportunities.
The Company pioneered focus on the digital world in 2011. Telefónica is now speeding up its transformation with a new operating model. To that end, Telefónica has defined four strategic pillars, positioning its digital offering at the core of its commercial activity.
First of all, the company will generate more revenues, focusing on monetising data traffic and digital services. Secondly, the Company is going to become a more technologically minded Company, furthering networks and systems modernisation.
Thirdly, Telefónica is going to become more efficient thanks to simplification and increased leverage on its scale, within a context of strict financial discipline.
Finally, the Company is going to strengthen its leadership in the digital ecosystem, pursuing a new public positioning from which to regain the balance in the hypersector value chain, focusing particularly on privacy and security as key elements in the digital world’s new rules. So, Telefónica wants to be sure that its customers have access to all the innovation and options that the new digital world offers them.
Specifically, to monetize the digital opportunities, the figure of Chief Commercial Digital Officer has been created, with overall responsibility for the revenues of the Group in all market segments. From this department, Telefónica is going to leverage greater and better awareness of customers and more sophisticated commercial activity, offering proposals of greater value and taking a great leap forward in the personalization and experience of the client.
STRATEGY
A major leap forward in our transformation into a Digital Telco _A Digital Telco combines traditional and digital assets to help people access and enjoy the best that technology can offer
Telefónica is focused on customer and revenue growth through simplification and innovation
On the other hand, the figure of the Chief Global Resources Officer has been enhanced, so as to have overall responsibility for technology management. To advance in network modernisation while continuing to improve efficiency, simplification will be a key lever.
In parallel, a global synergy plan has been designed to generate savings worth 1.5 billion euros in the next years. With this plan, significant savings on networks, IT and the support and commercial departments will be achieved.
In addition to operating more efficiently, the Company is going to increase its investment to position itself as a Digital Telco leader. More specifically, Telefónica has announced a significant increase in its capital expenditure volumes in 2014, which will raise its capex-to-sales ratio to 15.5-16%. Transformation and growth will account for 75% of the total, with sharp rises in investments in fibre and LTE.
Telefónica has designed a clear plan to advance in its transformation into a Digital Telco, and a new
organisational structure totally oriented towards the client and boosting revenues. An organisation that will let it be more agile in taking decisions and faster to implement strategy, as well as more flexible in responding to the needs of clients and more efficient in the use of resources.
With this change, Telefónica aspires to grow, accelerate, innovate and reinvent itself. This is our vision: we are convinced that technology should be open to people, companies and governments so they can all BE MORE_. In this way, we will all be able to do more, live better, BE MORE_.
A new operating model to capture the digital opportunity and be “Best in class” most efficient Digital Telco
Monetize of data traffic and digital services
Best in class all IP Networks and IT
Strategic management=Operational execution Maximum leverage our scale Maintaining of financial
discipline
New Public Positioning
Accelerate sustainable growth and maximize value
+ Revenues + Technology + Execution and efficiency
+ Sector leadership
3736

Telefónica | Annual Report 2013 Telefónica | Annual Report 2013
3. Accelerating towards a Digital TelcoTelefónica Integrated report 2013
Economies, societies and companies that embrace the change can prosper. It is those who stand still who will be left behind
At Telefónica we want the possibilities of technology to be available for everyone. Telefónica contributes to this in a fundamental way, as we are at the forefront of the offer for high-speed Internet connectivity and innovative products and services that are the catalysts of the Digital Revolution. And this Digital Revolution has only just begun: it is expected that during the next five years the digital economy will grow annually by 5% in the G-20 countries, a rate that will reach up to 18% per year in developing countries.
New technologies based on mobile connectivity, social media, Cloud Computing and Big Data are leading the transformation processes that drive innovation and increased efficiency. The concept of innovestment, innovation and investment, is the fuel of a new digital virtuous circle. In short, this positive dynamic within the economy is based on the idea that the attractive digital technologies drive consumer demand, fostering growth and job creation, which in turn, allows societies a more efficient use of their resources while making their economies more competitive and productive.
Moreover, digital technology has modified economic cycles and has blurred geographical boundaries. Everything has accelerated to the point that today’s successes or failures do not last very long. The low barriers to entry, the minimal cost of innovation, and the speed with which customers adopt new products, have given the Digital Revolution an unstoppable momentum. Society and business will change whether we like it or not. Economies, societies and companies that embrace the change can prosper. It is those who stand still who will be left behind.
Policies and regulations are key to an enormously complex and competitive environment,
characterized by a rapid evolution over the entire value chain of the Internet. It is essential that these are all a reflection of the ever-changing digital reality in which we are immersed and that they are maintained in order to unleash the full potential of the digital world for the benefit of consumers, businesses and government administration. It is therefore vital that policymakers focus on the right issues, this is to say in promoting investments, competition and innovation. Even still, we must ensure that all policies anchored in the twentieth century are not an obstacle to favour growth, innovation and consumer protection in the twenty-first century. We are well aware of the difficulties of adapting to the rules while moving at the pace of technology and the markets. Therefore, more than ever, we should strengthen the public-private partnership to define a common vision in order to combine our efforts in the same direction.
Telefónica, a Digital Telco, is ready to lead and assist this process of digital transformation. Technology provides us with unimaginable possibilities and can improve our lives in thousands of ways. Therefore, we want to be players in this new ecosystem and provide everyone the best that technology can offer, so that everyone can enjoy this fascinating world.
Telefónica has defined a Digital Manifesto advocating for an open and secure Internet experience for all. The Digital Manifesto highlights the challenges we face and its conclusions have been summarised in a Decalogue of recommendations to improve the Internet experience of consumers and generate more investment in digital infrastructures.
The Digital Manifesto focuses on four main areas that affect everyone who uses Digital and Internet Services.
PUBLIC POSITIONING
Towards a new Public Position to lead the industry revolution _We believe that our customers must enjoy an open and safe Internet experience.
1. An Open Agenda for a digital future, based on customer’s expectations and wishes in order to have the freedom to choose their digital experience and have control over their digital life. Open systems are the best model to drive innovation and therefore the portability of a digital life becomes a critical element in the Internet experience.
2. Consumers’ Digital Confidence turns into the willingness of people to share online information, being an essential prerequisite of a data-driven economy. Thus, it is critical to establish and sustain customer confidence on the use of Digital Services and Internet Services. This requires that individuals feel in control of their personal data, on how and for what purpose it is used for, and that their identity is kept private and their personal information is secure.
3. Global Internet Governance: the global scope of the Internet, both in economic terms and in its reach and use (most Internet users are currently outside the United States and the European Union), has placed Internet Governance in a matter of great relevance in the international public agenda. The current multi-stakeholder model is the best model for Internet governance, but it needs to evolve and improve.
4. Adapt Public Policies to the new Digital Markets: policy makers and regulators have a difficult task keeping track of the fast-moving changing Internet environment. However, it is imperative that any regulation is tailored to reflect the new realities of the digital economy, where increased competition and dynamic markets should reduce the need for specific regulation. Given the difficulty of anticipating the future in an ever so changing environment, new policies must be flexible and must ensure a level playing field.
The 10 recommendations
Build Digital Confidence through a safer Internet experience and by empowering citizens to be in control of their personal data.
Create a Portable Digital Life for consumers by allowing them to use their data, information and applications regardless of their devices or platforms.
Open up mobile Operating Systems, App Stores and other digital platforms to increase users’ freedom, choice and competition.
Promote interoperable Internet applications, communication and messaging services to improve consumer experience and foster competition.
Improve transparency about the conditions of use for Internet services and the distinction between information and advertisement in online search results.
Transform education, learning and teaching by widely adopting digital technologies and services based on Open Resources and Standards.
Promote Open Innovation and Open Standards principles and prevent that undue Intellectual Property protection restricts innovation in the Digital Economy.
Create fairer policy frameworks by establishing the same rules for the same digital services and smarter regulation by relying more on outcome-based policy making and case-by-case supervision.
Make the Internet available to everyone by establishing adequate conditions for private investment in broadband infrastructure.
Evolve the policy models of Global Internet Governance by building on its existing foundations and through involvement of all stakeholders in an open manner and on equal footing.
1
2
3
4
5
6
7
8
9
10
Our Digital Manifesto
More informationIn the website ‘A Digital Manifesto’of Telefónica.
3938

A customer-oriented structure
4. Be more_

4. Be More_
Telefónica | Annual Report 2013 Telefónica | Annual Report 2013
Telefónica Integrated report 2013
In 2014, the dividend remains at €0.75 per share, payable in two installments
Share priceIn mid-2014, Telefónica ranks sixth in the telecommunications industry worldwide per market capitalization, as the first as European integrated operator and in the twentieth in the Eurostoxx 50 ranking, which includes the largest companies in the Euro zone. The average daily volume of Telefónica trading in the Spanish continuous market was 35.8 million shares during the whole 2013 (42,9 million shares in 2012)
ProfitabilityDuring the fiscal year 2013, in line with the transformation plan initiated last year, Telefónica consolidated its commitment to a sustainable long-term growth, increasing their competitive positioning in segments and higher value markets, enhancing their efficiency level through continuous effort of simplification and cost reduction, focusing investment in growth areas, managing the asset portfolio proactively, and increasing the Company financial flexibility. This has enabled Telefónica to spend in November 0.35 Euros per share in cash to pay shareholders as a first payment of €0.75 in cash engaged by the company, chargeable to 2013 (second cash payment in the second quarter of 2014). Thus, the total shareholder return of Telefónica in 2013 stood at 19.6% (once included dividends distributed throughout the year).
Targets for 2014In 2014 Telefónica will accelerate this transformation. Among our objectives, we wish to continue accelerating revenue growth while we continue generating efficiencies to proceed in margin stabilization; at the same time we will increase investment to anticipate the growth of
demand derived from increasingly intensive use of data services, and the expected recovery of demand in some of our major markets.
This intensification of investment is consistent with our commitment to continuous improvement of financial flexibility as well as an attractive payment to our shareholders. Among the objectives of 2014, further reduction in net debt is found, maintaining the dividend at € 0.75 per share paid in the fourth quarter of 2014 (0.35 euros per share in the form of scrip dividend and in the second quarter of 2015 (EUR 0.40 per share in cash). For such purpose, we will continue to execute our strategy to optimize the asset portfolio, releasing no strategic resources that would allow us to further improve our position and growth potential in key markets, both in organic and inorganic form, through an increase in investment in 2014.
Telefónica has always been a reference in terms of efficiency, and the technological revolution, the strengthening our technological position and infrastructure is consistent with the increase in our efficiency. For this, we launched a new plan to generate synergies in order to generate savings amounting to 1,500 million Euros annually in the coming years.
ShareholdersAt March 21 2014 Telefónica, S.A.’s share capital amounted to 4,551,024,586 ordinary shares per value of 1 euro and grant the same rights and obligations to all shareholders. All the Telefónica shares are ordinary, of a sole class, and are represented by account entries and grant the same rights and obligations to all shareholders. Telefónica’s shares do not have any accessory liabilities whatsoever. Likewise, the Articles of Association of Telefónica contain no provision on privileges, special powers or rights arising from the holding of shares.
Moreover, there are no statutory provision articles that impose any restriction or limitation on the free transfer of Telefónica’s shares. According to the information coming from CNMV, the most relevant participations above 3% are:
BE MORE_PROFITABLE
Shareholder return _The total shareholder return of Telefónica in 2013 stood at 19.6%, once included dividends distributed throughout the year.
More informationIn the ‘Shareholders and investors’ section of the corporate website.
The shares of Telefónica, S.A. are traded in the Continuous Market of the Spanish Stock Exchanges, as well as in the markets of New York, London, Buenos Aires and Lima, and they have all the same features, rights and obligations. In the New York and Lima Stock Exchange, shares of Telefónica, S.A. are listed through American Depositary Shares (ADSs), each ADS representing one share of the Company.
In compliance with the obligation to communicate the purchase of treasury stock, Telefónica notified the Spanish stock market regulator, the CNMV, on January 29, 2014, the acquisition of a total of 47,122,215 shares of treasury stock (cumulative gross purchases since the previous notification submitted to the CNMV on July 25, 2013), representing 1.035% of share capital. Telefónica s treasury stock position as of January 29, 2014 was 38,326,031 shares representing 0.842% of its share capital.
According to the information obtained from “Sociedad de Gestión de los Sistemas de Registro, Compensación y Liquidación de Valores” (Securities, Recording, Clearing and Settlement
Systems Management Company) (Iberclear), dated on April, 2014, the number of shareholders of Telefónica, according to separate records in favour of individuals and corporations, amounted to approximately 1,419,053 shareholders.
Shareholder’s OfficeFrom the Office of the Shareholder, Telefónica ensures smooth and transparent communication with individual shareholders, providing the same information in a timely manner that is provided to institutional shareholders. At the end of 2013, more than 200,000 shareholders are registered in the Shareholder Services, and are receiving card identifying them as such. We distribute among them the quarterly magazine Acción Telefónica, a publication with financial news reports and exclusive information on campaigns that can be accessed. During 2013, about 600,000 copies were sent to the address of the shareholders.
The Shareholder’s Office of Telefónica has a free phone number (900 111 004), from which have been attended a total of 49,780 calls during 2013, with a monthly average of 4,148. In the period coinciding with the GSM it increased to reach the 16,900 calls per month. In addition, the Shareholder’s Office attended nearly 4,000 inquiries received via email ([email protected]) and mailing.
A leader Corporation
6th Telco in the Global ranking by market capitalization
20th in the Eurostoxx ranking
2nd European Telco by revenues
2014 Commitment0.75 euro/share
0.35 scrip dividend 0.40 cash
19.6% Total Shareholder Return in 2013
Evolution of Total Return for Telefónica shareholders2013 19.4%2012 -17.8%2011 -12.1%
Significant shareholders
Number of shares %
Banco Bilbao Vizcaya Argentaria, S.A.(1)
313,707,133 6,89%
Caja de Ahorros y Pensiones de Barcelona (la Caixa)(2)
246,977,147 5,43%
Blackrock, Inc.(3) 177,257,649 3,89%
(1) According to the information provided by Banco Bilbao Vizcaya Argentaria, S.A. (BBVA) for the Annual Corporate Governance Report of Telefónica, S.A. regarding the 2013 financial year.(2) According to the information provided by Caja de Ahorros y Pensiones de Barcelona, “la Caixa” for the Annual Corporate Governance Report of Telefónica, S.A. regarding the 2013 financial year.(3) According to the communication filed with the National Stock Exchange Commission (CNMV) as of February 4, 2010.
4342

Telefónica | Annual Report 2013 Telefónica | Annual Report 2013
4. Be More_Telefónica Integrated report 2013
Lines of progressAt Telefónica, we have proposed to better understand our customers, discover their expectations and to be more disruptive and innovative in our interaction with them and increase our service commitment through out all our brands.
Therefore, we have placed the customer at the center of everything that we do during our daily work, with the conviction that only through the satisfaction of our users and by building strong relationships of trust can our growth targets set by the Company be reached.
Achievements 2013During 2013, Telefónica has improved its business with a renewed offer that has enabled us to accelerate the recovery of differential growth.
In this manner, the total accesses for Telefónica reached 323.1 million at the end of 2013, which represents 2% more than the previous year. This growth has been mainly driven by mobile
ago), bringing out the emphasis on growth among high-value clients. Also for this segment, T. Latin America accelerated its YoY growth during the last quarter (+18% in December compared to +16% in September) and set a record for annual net profit (7 million accesses in 2013, representing 1.6 times more than the previous year).
Mobile broadband accesses totalled 72.8 million at the end of 2013 (+38% YoY) and accounted for 29% of total mobile accesses, 7 p.p. more than in December 2012. This growth is mostly explained by the strong performance of smartphones , reaching a penetration of 27% (+8 p.p. YoY), with an annual net profit of 20.7 million (+35% YoY) and 5.7 millon during the quarter (+6% YoY), all of which with an associated data plan.
2013 was a pivotal year with the renewal of the commercial offer by Telefónica Europe, with the launch of simple, innovative charges, focusing on capturing growth of data for fixed business (fiber) and mobile business (4G). In this sense, the consolidation of Móvistar Fusión as leverage
contract customers, especially mobile broadband, and pay TV. Specifically, it highlights the evolution of accesses for Telefónica Latin America (68% of the total) stands out. These rose by 4% YoY and their growth accelerated for the fourth consecutive quarter, despite the more restrictive criteria that is being applied on the calculations for prepay clients. This growth is more relevant if we consider that the YoY variation of accesses is impacted by the sale of the assets of residential landline business in the United Kingdom.
Mobile accesses reached 254.7 million by the end of the finacial year. It is noteworthy that the growth in numbers had accelerated at the end of the year, being the fourth quarter which saw the greatest YoY increase in the last four quarters (+3%), with a quarterly net profit in Latin America that doubled compared to the same period in 2012, and considering the additions in Europe during the Christmas campaign, these increased by 11% when compared to the fourth quarter of last year. Contract accesses rose by 9% to to reach 89.2 million and now make up 35% of the total mobile portfolio (2 p.p. more than a year
for the recovery in Spain, the commitment by Refresh to enhance supply rationalisation and improve the dynamics of distribution channels in the United Kingdom, and the impetus of the O2 Blue All-in rates in Germany, are highlighted as the basis for growth in mobile data.
The new rates launched by O2 Refresh in April is a innovative cost proposition for the customer, aimed at strengthening our market position, strengthening our non-subsidised data-focused, improving the mix of distribution channels and offering our customers more flexibility "to change phones as often as they change their phones." The O2 Blue All-in charges in Germany are rates that are focused on mobile data.
Retail fixed broadband accesses were 18.4 million in December 2013, which implies an increase of 2% when compared to December 2012, excluding the sale of fixed assets of fixed business in the United Kingdom, due to a growth of 7% of customers in Latin America and the net gain in Europe for the first time since the fourth quarter of 2012.
BE MORE_FOR THE CUSTOMER
Making the digital offer the core of commercial activity _Shorten the time it takes to better understand our customers and to offer greater added value to improve their experience as consumers
2013 brought the renewal of the commercial offer of Telefónica Europe and Movistar Fusión underpinned the recovery in Spain
Total Accesses by Country (thousands)
2012 2013
Brazil
20.,3
26.9
21,8
91.7
Mexico
43,1
40.3
41,6
53.6
Spain
20,2
99.9
20,8
98.0
Peru
24,1
36.0
26,6
50.7
Argentina
14,1
26.1
14,7
82.0
Colombia
5,01
9.6
5,15
1.3
Ecuador
25,3
72.8
25,1
66.9
Germany
13,1
47.0
13,6
30.2
Chile
1,84
3.5
1,84
3.9
Uruguay
21,3
78.5
23,4
91.6
CAM + Venezuela
9,25
4.3
9,34
1.7
Czech Rep + Slovakia
1,57
2.7
1,55
2.0
Ireland
91,3
69.8
92,7
48.9
23,9
0323
,842
United Kingdom
4544

Telefónica | Annual Report 2013 Telefónica | Annual Report 2013
4. Be More_Telefónica Integrated report 2013
Country Achievements Challenges
Spain
2.9 million Movistar Fusión clients
The best network in Spain combining a wide deploy of fibre and LTE
Significant increase in customer satisfaction, due to the transformation of processes
We doubled the fibre clients and the home coverage from the previous year
Improve revenues Commercial momentum of fibre, TV and convergence products
United Kingdom
During 2013, Telefónica United Kingdom achieved significant commercial momentum with a strong growth in contracts. Customer base driven by strong launches, including Refresh
Holding a position as operator with the least churn in the marketplace
Telefónica United Kingdom released services in 4G, at 13 major cities and with a coverage of 38% of the population by the end of 2013
Telefónica United Kingdom continues to receive the least number of complaints in the sector, according to the industry regulator, Ofcom. During Q4, 2013 Telefónica United Kingdom received 0.03 complaints for every 1,000 customers, half of the industry average (0.06)
Maintain the momentum of the major offers in the marketplace, strengthen customer relationships and best experience on the 3G network
Germany
Monetization of mobile data, growth by 22% for mobile data revenue.
Over 40% LTE Coverage
Telefónica Germany carried out an important number of commercial initiatives, such as the launch of the first all-in portfolio smartphone
The trial version for O2 Wallet was released. This is a digital card that allows customers to use its payment and credit services.
Continue increasing market competition and continuing trends for OTT.
Brazil
Launch of Multi Vivo, a ground-breaking service that allows up to five devices to share an Internet plan
73 cities with 4G, which represents 30% of the covered population
Recovery of the fixed line business, increasing the access base to more than 123M, when compared to 68M from the previous year
Start-up of the Firefox operating system
133.9 km of fibre installed enabling speeds of up to 200Mbps
Client list and catalogue of exclusive products for fixed and mobile operations
Match capacity to long-term demand, based on regional segmentation
Capture and retain the most valuable clients through a differentiated quality network
Offer faster broad band speed, allowing us to provide more differentiated services
Pay-TV accesses reached 3.6 million, with a YoY growth of 8%, after reaching a total net profit in 2013 of 266,000 accesses, being tenfold of what was obtained the previous year. This growth has been possible due to the acceleration of commercial performance in the second half of the year, mainly in Spain and Brazil.
In terms of consumption, it is worth noting an increased traffic of 9% in Latin America, highlighting YoY increase for the year in all countries of the region. ARPU in the region continues its trend of acceleration for YoY growth, reaching 5.7%, despite the reduction in interconnection rates. Thus, outbound ARPU increased during the year by 8.4% YoY, mainly driven by the acceleration of non-SMS data and voice traffic growth.
ChallengesThe increased penetration of 4G services in the United Kingdom and Germany, and acceleration in the rolling out of fibre and development of pay television in Spain were the pillars of growth for 2014.
In Spain, the Company strategy focused on accelerating the rolling out of fibre as a key impetus for differentiation and of growth in 2014, as reflected in the goal of reaching 7.1 million households after the end of the year. In comparison with ADSL customers, fibre customers represent a higher ARPU, by 1.5 times, and a higher level of satisfaction and therefore a lower churn (by 0.5 times).
The roll out of 4G services in the United Kingdom and Germany, and for fibre and Pay TV in Spain were essential for 2014
Access Types (thousands)
Fixed line accesses
2012
2013
40,002 39,338
Data and Internet accesses
2012
2013
19,402 19,102
2012
2013
247,346254,717
Mobile accesses
2012
2013
3,336 3,602
Pay TV
2012
2013
5,731 6,358
Wholesale Accesses
315,819
2012
323,118
2013TOTAL
4746

Telefónica | Annual Report 2013 Telefónica | Annual Report 2013
4. Be More_Telefónica Integrated report 2013
Country Achievements Challenges
Peru
Renewal of three mobile concessions for 18 years and 10 months First to launch the commercial pre-pay of 4G services that will be in operation from 02 January, 2014
Leaders in telecommunication services: fixed voice 81%, broadband 86%, TV 58% and mobile voice 57%
20,9 million customers Increase of 55% for average speed for fixed broadband, with an offer of up to 60 Mbps
Market leader in mobile data: acceleration of 4G LTE and mass use of prepaid data Great speeds for fixed broadband to maintain competitive advantage Accelerate simplification (products and networks)
Argentina
Improvements to the mobile network quality, driven by the reduction of unavailability (from 0.14% to 0.04%) and increased sites for 2G and 3G (2G: +270 and 3G: +650)
Multichannel online with a strong drive towards digital invoicing (Electronic invoicing from 1.8M to 4.4 M). 20.7 million accesses, with a YoY growth of 14.4%. Strong growth in contents (+90%) and Digital Services (+70%)
Reaching higher quality for mobile network focused on data New model for customer service Monetization of mobile data and broadband speeds Implementation of T3.0 for fixed products and mobile contracts
Uruguay
Launching of telephones with Firefox operating system We integrated the first solution for e-health orientated towards images services Growth in customer contract portfolio for voice, by 6% YoY, improving commercial business and reducing churn
.32% of customers have a contract line The percentage of the contract portfolio grew 2.3 p.p. We duplicated the penetration of smartphones from our customer base, reaching 17% from within the voice portfolio
Captured and lead growth for mobile data services, launching new services and the LTE network Maintained leadership in customer service, expanding the development of new digital customer service channels and improving our systems Duplicated the penetration of smartphones within the voice portfolio Rebalancing of revenues for SMS towards data
Ecuador
Reaching an CSI of 8.3 Momentum for change from traditional customer service to digital customer service channels
The CSI closed the year with a 8.4 in compliance, reaching an achievement Percentage of 101%
Growth of 44% for online channel participation in the channel mix for customer service
Reaching an CSI of 9 for the High Value segment Boosting electronic sales to facilitate the arrival of product and services to customers
Venezuela
Simplification of the commercial offer for mobile services Maintained leadership in smartphone segment segment leadership. Continuous momentum in TV business 4.1 million smartphone customers (+28% compared to 2012). This
represents 53.6% of market share 41% of our smartphone portfolio with comprehensive plans 135% growth for TV business revenue, when compared to the
previous year
Development of smartphone and mobile internet on LTE Growth in TV portfolio and
revenues Management of ARPU growth
through the monetization of data
Country Achievements Challenges
Chile
New call centre customer service model and office, developing a customer experience model that improved customer satisfaction Beginning of the LTE (4G) offer at 2,600 Mhz, reaching 10,000
customers by the end of the year Mobile growth leveraged from prepaid growth of 6.4% and of
smartphones Strong growth on the fixed network, boosted by 21% for TV
(compared to 8% from the previous year) and 7.8% in BAF
Improvements in satisfaction and transforming the online company
Colombia
First mobile operator to offer 4G in the country, with the service being launched in December 2013 1.45 million basic lines, with YoY growth of 2%, due to fixed-mobile packeting Growth of broadband customer base (21%) and contracts (9%) Broadband service experienced a YoY growth of 21% at the parc and overreached the budget by 102% The broadband service for 2013 grew at 107% of the budget and had a YoY growth of 14%
Capitalizing on data market growth with an emphasis on 4G LTE
Central America
Promotion of electronic invoicing between customers, reaching very positive results for the entire region
The Central American Network was deployed using the latest generation of optical fibre infrastructure, which is interconnected overland from Mexico to Panama
Net increase of 18.3% of total accesses, reaching a customer base of nearly 12 million
Launch of the 4G Network in Costa Rica, Guatemala and Panama for 2014. To consolidate the 4G Network in Central America, in 2015 it will be launched in El Salvador and Nicaragua
Mexico
Development of virtual operator business, with five new types of Contracts, new pre-pay model and a new model for partner prospection
5 MOU and contracts, excluding roaming agreements with other mobile operators
The highest Customer Satisfaction Index (CSI) in the marketplace (8.8 for TEF compared to 8.0 for Telcel in December de 2013)
Development of wholesale market (Virtual operators and national roaming agreements)
Create a competitive advantage through a better experience of data usage (LTE deployment)
Monetize data through differential offers
Efficient delivery of services through a review of the operating model and shutdown of legacy systems
4948
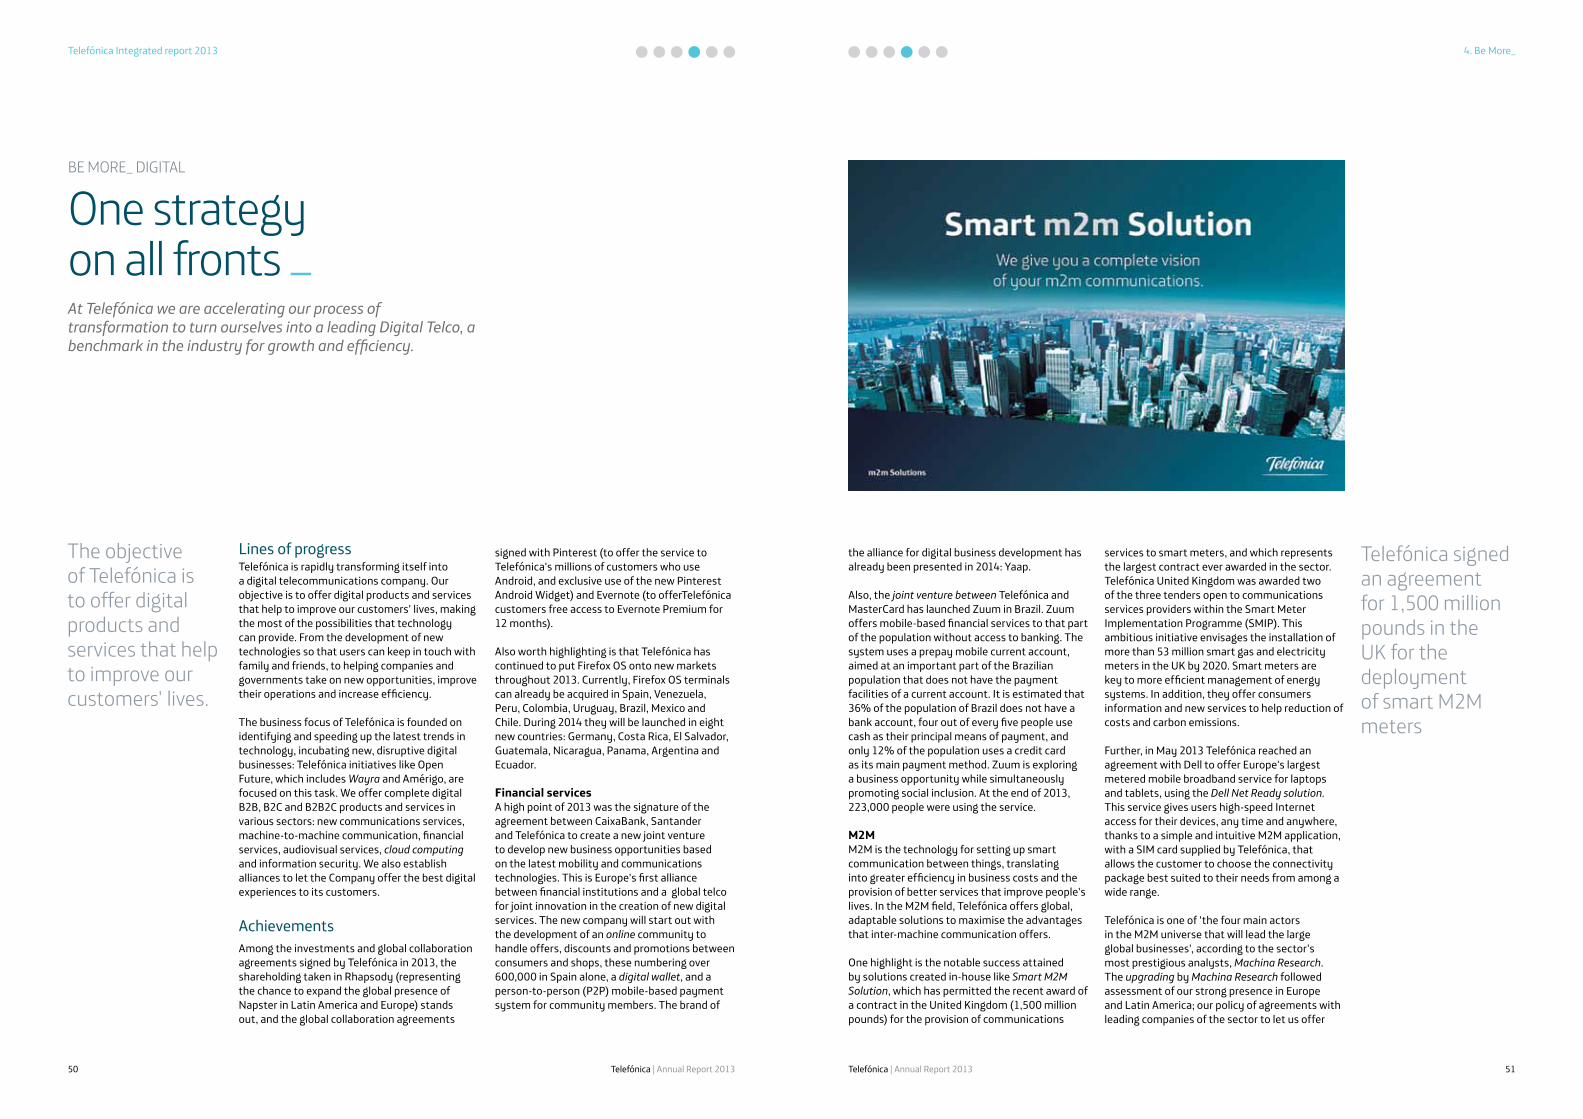
Telefónica | Annual Report 2013 Telefónica | Annual Report 2013
4. Be More_Telefónica Integrated report 2013
The objective of Telefónica is to offer digital products and services that help to improve our customers' lives.
Lines of progressTelefónica is rapidly transforming itself into a digital telecommunications company. Our objective is to offer digital products and services that help to improve our customers' lives, making the most of the possibilities that technology can provide. From the development of new technologies so that users can keep in touch with family and friends, to helping companies and governments take on new opportunities, improve their operations and increase efficiency.
The business focus of Telefónica is founded on identifying and speeding up the latest trends in technology, incubating new, disruptive digital businesses: Telefónica initiatives like Open Future, which includes Wayra and Amérigo, are focused on this task. We offer complete digital B2B, B2C and B2B2C products and services in various sectors: new communications services, machine-to-machine communication, financial services, audiovisual services, cloud computing and information security. We also establish alliances to let the Company offer the best digital experiences to its customers.
AchievementsAmong the investments and global collaboration agreements signed by Telefónica in 2013, the shareholding taken in Rhapsody (representing the chance to expand the global presence of Napster in Latin America and Europe) stands out, and the global collaboration agreements
signed with Pinterest (to offer the service to Telefónica's millions of customers who use Android, and exclusive use of the new Pinterest Android Widget) and Evernote (to offerTelefónica customers free access to Evernote Premium for 12 months).
Also worth highlighting is that Telefónica has continued to put Firefox OS onto new markets throughout 2013. Currently, Firefox OS terminals can already be acquired in Spain, Venezuela, Peru, Colombia, Uruguay, Brazil, Mexico and Chile. During 2014 they will be launched in eight new countries: Germany, Costa Rica, El Salvador, Guatemala, Nicaragua, Panama, Argentina and Ecuador.
Financial servicesA high point of 2013 was the signature of the agreement between CaixaBank, Santander and Telefónica to create a new joint venture to develop new business opportunities based on the latest mobility and communications technologies. This is Europe's first alliance between financial institutions and a global telco for joint innovation in the creation of new digital services. The new company will start out with the development of an online community to handle offers, discounts and promotions between consumers and shops, these numbering over 600,000 in Spain alone, a digital wallet, and a person-to-person (P2P) mobile-based payment system for community members. The brand of
BE MORE_ DIGITAL
One strategy on all fronts _At Telefónica we are accelerating our process of transformation to turn ourselves into a leading Digital Telco, a benchmark in the industry for growth and efficiency.
Telefónica signed an agreement for 1,500 million pounds in the UK for the deployment of smart M2M meters
the alliance for digital business development has already been presented in 2014: Yaap.
Also, the joint venture between Telefónica and MasterCard has launched Zuum in Brazil. Zuum offers mobile-based financial services to that part of the population without access to banking. The system uses a prepay mobile current account, aimed at an important part of the Brazilian population that does not have the payment facilities of a current account. It is estimated that 36% of the population of Brazil does not have a bank account, four out of every five people use cash as their principal means of payment, and only 12% of the population uses a credit card as its main payment method. Zuum is exploring a business opportunity while simultaneously promoting social inclusion. At the end of 2013, 223,000 people were using the service.
M2MM2M is the technology for setting up smart communication between things, translating into greater efficiency in business costs and the provision of better services that improve people's lives. In the M2M field, Telefónica offers global, adaptable solutions to maximise the advantages that inter-machine communication offers.
One highlight is the notable success attained by solutions created in-house like Smart M2M Solution, which has permitted the recent award of a contract in the United Kingdom (1,500 million pounds) for the provision of communications
services to smart meters, and which represents the largest contract ever awarded in the sector. Telefónica United Kingdom was awarded two of the three tenders open to communications services providers within the Smart Meter Implementation Programme (SMIP). This ambitious initiative envisages the installation of more than 53 million smart gas and electricity meters in the UK by 2020. Smart meters are key to more efficient management of energy systems. In addition, they offer consumers information and new services to help reduction of costs and carbon emissions.
Further, in May 2013 Telefónica reached an agreement with Dell to offer Europe's largest metered mobile broadband service for laptops and tablets, using the Dell Net Ready solution. This service gives users high-speed Internet access for their devices, any time and anywhere, thanks to a simple and intuitive M2M application, with a SIM card supplied by Telefónica, that allows the customer to choose the connectivity package best suited to their needs from among a wide range.
Telefónica is one of 'the four main actors in the M2M universe that will lead the large global businesses', according to the sector's most prestigious analysts, Machina Research. The upgrading by Machina Research followed assessment of our strong presence in Europe and Latin America; our policy of agreements with leading companies of the sector to let us offer
5150

Telefónica | Annual Report 2013 Telefónica | Annual Report 2013
4. Be More_Telefónica Integrated report 2013
the best products and services (like Masternaut and Generali Seguros), and our leadership in the largest global alliance of M2M operators, which allows us to offer global coverage.
In 2014, we are continuing to make steady progress on turning M2M into reality. Indeed, Telefónica will be the company responsible for providing permanent Internet connection to electric cars made by Tesla Motors in some thirty European countries.
e-HealthThe e-Health portfolio of Telefónica was strengthened in 2013 through acquisitions, among which that of Axismed, at the start of the year, stands out. This is the largest company in Brazil in the area of assistance to chronic patients, and the aim is to offer integrated e-Health services to private health service providers and corporations, as well as to the 90 million customers of Vivo in Brazil.
Axismed has wide experience in the sector, the result of monitoring over 180,000 patients all over the country, by means of a proprietary system based on advanced clinical protocols. Axismed will be able to broaden its assistance model, thanks to Telefónica's in-house
multichannel remote management platform for patients, and its sales capacity. The combination of Axismed's knowledge of chronic illness management, together with Telefónica Group's experience in ICT technology and services will allow the development of innovative services for health providers and the corporate market.
Another highlight of 2013 was the presentation of the Company's new service for monitoring patients with chronic conditions, at the 'e-Health' event held in Cantabria. This platform, which was one of the outstanding services of the last Mobile World Congress in Barcelona, is arousing more and more interest among health professionals, who see in it a way to offer patients an independent and autonomous life in their own homes. The system has been developed so as to facilitate complete and continuous health assistance outside the hospital environment. Chronic illnesses currently account for about 80% of health spending. Indeed, Telefónica has identified e-Health as one of its R&D priority areas for innovative applications that contribute to improving the quality of people's lives and the productivity of the system.
Signing of the agreement between CaixaBank, Santander and Telefónica to develop digital businesses: Yaap
Launch of Zuum in Brazil by the joint venture between Telefónica and MasterCard
“Smart M2M” for providing communications services for smart meters in the UK
Agreement with Dell to offer the “Dell Net Ready” solution for high-speed Internet access
Acquisition of Axismed in Brazil.
Service for ongoing monitoring of chronic patients
Product / Business area
Progress 2013
VideoIn September 2013, Telefónica launched Telefónica Studios, its global producer of audiovisual content, which will group all the projects of the Company under its name. In the next three years it will produce 25 quality feature-length films and various TV series. Telefónica Studios maintains links with figures of recognised prestige in the world of cinema and coproduces with some of the principal partnersof each region, such as Tele5, TVE, Antena 3, El Deseo, 100 Bares, Plural, Nostromo Films, K&S, Historias and Tornasol, among many others.
In addition, Telefónica has launched its Global Video Platform, that allows provision of TV services over various networks to a wide range of devices. In fact, fibre customers in Brazil and Spain can already access new, advanced video functionality, such as on-demand OTT video.
SecurityEleven Paths is the Telefónica company created to innovate in the design of security products. The company was born in mid-2013 to unite professionals with wide experience and very deep knowledge of security threats so as to create a dynamic and multidisciplinary team. But
above all, capable of transforming the concept of security so as to protect our customers.
In December 2013, it launched Latch, a revolutionary new security service developed in-house that allows clients "to turn their digital services on or off" remotely, so adding an extra layer of security to their digital identity. In barely three months, the Latch ecosystem has already been integrated into the control panel of Acens, Telefónica's cloud services company, and at movistar.es, the online channel of Movistar Spain which is used by over eight million of the operator's customers, and also by Tuenti, lthe social, MVNO and communications multiplatform, that over the next few months will integrate Latch into its web configuration panel.
The University of Salamanca (USAL), the International University of La Rioja (UNIR), the bank Cajamar Caja Rural and Cortefiel Group have begun to integrate Latch with their services. Banking and ecommerce are precisely two of the sectors which record the highest incidence of online fraud, explaining why banks and shops are interested in offering their customers the best possible protection. In addition, Eleven Paths is currently in negotiations with other Spanish and international financial entities and retailers about
Launch of the global producer Telefónica Studios
Launch of the Global Video Platform in Brazil and Spain
Launch of the digital security company Eleven Paths
Launch of the security service Latch
Launch of ‘Mobile Device Management’ (MDM) in Germany
Strategic investment in the leading cloud collaboration and storage company, Box
The‘ e-Health‘ portfolio was strengthened in 2013 through alliances and acquisitions, standing out the purchase of the Brazilian company Axismed
In December 2013, Latch, a revolutionary security service that allows clients "to turn their digital services on or off" remotely, so adding an extra layer of security to their digital identity was launched.
Finance VideoM2M Securitye-Health Cloud
5352

Telefónica | Annual Report 2013 Telefónica | Annual Report 2013
4. Be More_Telefónica Integrated report 2013
integrating Latch into the online services they offer their customers.
Cloud computingA further high point was the launch of Mobile Device Management (MDM) in Germany, which aims to offer companies a secure way to manage the different mobile devices currently used through cloud solutions. With the proliferation of tablets and smartphones, offices have been turned into mobile workplaces. That is why it is increasingly important for businesses to have a complete solution that gives them this flexibility. Telefónica Germany, can, as of now, offer its clients MDM solutions which are capable of integrating these kinds of devices with the different operating systems used in the business. MDM expanded rapidly to the Czech Republic and will soon be launched in Spain.
Acens, the Telefónica Spain subsidiary that offers cloud solutions to its clients, announced the launch of Respaldo Cloud, in September. This is an intuitive automated cloud backup solution for safeguarding the critical information from the main server on client premises. Respaldo Cloud makes a contingency plan for unexpected critical incidents, so guaranteeing business continuity. Recovery can be partial or total, and can cover any of the preceding 30 days' activity, so it is the ideal solution for preventing accidental –or deliberate– deletion of information; damage caused by viruses, malware or security failures; incidents arising from loss of power or natural disasters. Respaldo Cloud makes a backup copy of the data from the main server on client premises in the cloud, with up to 100 GB of space and measures to optimize the network traffic burden. The launch was accompanied by a promotional
price of 99 euros/month, with free installation until December 4.
In December of last year, Telefónica made a strategic investment in Box, a leading company in cloud collaboration and storage. Telefónica will work with Box as investor and partner to offer the best possible cloud-based services.
Smart CitiesAt Telefónica we have a global Smart Cities model using the technological platform SBC (Smart Business Center), developed by Telefónica and the first to comply with Fi-WARE (European platform of the Internet of Things). SBC is an ICT platform developed in the cloud, open, able to manage from individual devices to entire systems of the city, with flexibility, reliability, security and efficiency, with a single point of access, through a control panel.
It hosts the different management layers (devices, communications, systems and services) to guarantee interoperability between the different public services of different departments and bodies. And it has an important Big Data module to convert data into information and knowledge for the various agents (managers, the public, tourists, businesses, service concessionaires, local companies, entrepreneurs).
The traditional services –traffic, transport, parking, water management and treatment, parks and gardens, cleaning, waste management, shopping, lighting, emergencies, security, health, etc. – can be solved, provided and optimized from any device, at any time or place.
With tablets and smartphones, the mobile-office is born. To meet the new needs Telefónica acquired Box, a leader in cloud storage
At Telefónica we are pushing forward a European strategy together with other companies like IBM, Oracle, Atos and France Telecom. We are leading the FI-WARE project to boost R&D+I in the Internet of Things, and whose outstanding application is Smart Cities. Cities like Malaga, Seville, Santander, Las Palmas de Gran Canaria, Sabadell and Turin are already participating.
Following this line of innovation, in 2013, SmartSantander, a European Internet of Things project led by Telefónica R&D, presented the final results of three years' work , which have turned Santander into the first complete smart city in Europe and an international benchmark. SmartSantander has created the largest intelligent urban infrastructure existing in the world. With over 20,000 devices, it offers a battery of tests which the European Union has categorised as essential, because it means a unique platform for experimentation on a large scale under real conditions.
Also in Spain, Telefónica has promoted its Smart Citiesmodel by supporting the consolidation of RECI (Spanish Network of Intelligent Cities), as well as participating in the Smart Cities Standardization Committees, both national (Aenor) and international (ITU), to measure the impact of ICT services on the sustainability of the city, and supporting the most important events and meetings such as Greencities and Foro Tikal in Malaga, the ITU Green Standards Week and Smart City Expo.
Beyond Spain, we are participating in the city of Sao Paulo's pilot scheme for the services of education, tourism, health and public services
of lighting, security, traffic and parking. And the government of the United Kingdom has designed one of the most important projects, with an intelligent sensor network supplied by Telefónica, which will yield efficiencies and important savings in the supply and management of energy.
Telefónica stand at MWC14
At Telefónica we have a global Smart Cities model on a technological platform, the first to meet Fi-WARE (the European Internet of Things) requirements
5554

Telefónica | Annual Report 2013 Telefónica | Annual Report 2013
4. Be More_Telefónica Integrated report 2013
During 2013 Global Resources has contributed to the operational transformation of Telefónica, accelerating our networks modernization while increasing their coverage, simplifying and transforming our IT and creating value through an end to end global procurement model
During 2013 Global Resources has contributed to the operational transformation of Telefónica, accelerating our networks modernization while increasing their coverage, simplifying and transforming our IT and creating value through an end to end global procurement model. It has been two years since Telefonica Global Resources (TGR) was created. Indeed, 2013 has been a key period, in which the global operating unit focused on the execution of a few but markedly relevant transverse projects. By and large, this set of initiatives have pursued to promote Telefonica transformation, seeking maximum efficiency through simplification, standardization and consolidation. Furthermore, TGR has also contributed to the improvement of overall operational and business processes, which have a direct impact on our customers’ experience. Finally, Global Resources has properly managed some of the Company commitments and agreements with third parties in order to ensure its compliance while avoiding penalties.
Lines of progress
During 2013, Telefónica Global Resources has contributed to our operating businesses results through initiatives aimed at increasing efficiency,
with an emphasis on simplification, consolidation and accelerating our infrastructures evolution. All these initiatives are set to foster Telefónica transformation into a Digital Telco, along with technological modernization, leveraging our Company scale to increase and optimize the benefits. Thus, efficiency and execution have been two principles applied throughout TGR six global areas: Network and Operations, IT, Procurement, Global Services, Human Resources(1) and MSA Atento/Global CRM(2).
Global Network and Operations Area The global network area is working, jointly with all of our operating businesses, with all the technological levers in order to provide Telefónica with the best network, in a sustainable way both in terms of investment and operating costs, and with an emphasis on simplification (architectures, processes and supplier map). Our key global network and operations priorities already identified are the following ones:
➜ Accelerate ultra-fast network deployment making hyper-connectivity easier to our customers.
BE MORE_ GLOBAL
Transform Telefónica through simplification _As a major catalyst to Telefónica’s transformation into a Digital Telco, Global Resources is working on our infrastructure adaptation and executing a range of simplification projects set to maximize efficiencies while increasing the benefits from our economies of scale
(1) The issues related to global Human Resources area are described in a separate chapter of this report.(2) MSA (Master Service Agreement) Atento/GCRM: Global Customer Relationship Management.
Action priorities Achievements Challenges
Model for management, processes and global systems for Telefónica purchases
€26,000M volume for procurement
Implementation and development of the strategic transformation project for end-to-end procurement (End to end Strategic Sourcing)
Enhancing service levels
Creating sustainable value
Transform the traditional purchasing process:
- Working in transversal teams - Global category focus
Consolidation of the end-to-end procurement model
Expansion of the scope of procurement throughout the entire supply chain
Global management of the networks and operations, which has made possible:
- Maintaining common requirements for next generation network procurement technologies
- Standardising and simplify solutions and processes
60% of investment in ultra-broadband (LTE, FTTH, etc.) deployment.
More than 5 million homes with fibre optics
60% of mobile network locations connected to the UBB backhaul
Network sharing in five operations (Czech Republic, Colombia, United Kingdom, Spain and Brazil)
First Network Virtualisation pilot in Brazil
Installation of the first customer home equipment, defined and approved by Telefónica
Reduction in operating costs
Accelerating the modernisation towards ultra-fast broadband networks that facilitate hyper-connectivity
Reduction of legacy networks and an evolution towards all-IP networks
Continuous improvement in the efficiency of networks and operations
Transformation of network infrastructure in order to increase agility, flexibility and malleability
Adaptation of network capabilities so as to provide support to the changing needs of customer and digital services that make virtualisation reality
Brilliant IT that Powers a Digital Telefónica
- 6 DC - 1,150 Applications and- 2,700 served
decommissioned
An Bold business transformation launched
Simplifying the legacy applications to obtain operating stability and to reduce complexity and redundancy
Find a balance between business transformation and internal IT transformation
Having a single customer database a 360° vision of them
Be an online self-service company
First worldwide Telco in network virtualisation
5756

Telefónica | Annual Report 2013 Telefónica | Annual Report 2013
4. Be More_Telefónica Integrated report 2013
➜ Legacy reduction (obsolete and expensive equipment) combined with a transition to an All IP network.
➜ Simplification and Transformation of Operation Support Systems (OSS).
➜ Network virtualization, curbing the restrictions that are now imposed us by hardware, thanks to the decoupling of the physical from the controlling layer.
Global IT Area With a stronger Global agenda, IT has focused in 2013 on setting the right foundation for a deeper Digital and Business Transformation in 2014 while providing at the same time efficiencies through consolidating infrastructure and operations. Intense execution in all pillars of the strategy has translated in a year of accelerated transformation beating objectives while improving service levels.
➜ Consolidate to become more efficient by taking advantage of our global scope, focusing on the consolidation of infrastructure in strategic Data Centres, the unification of operations, the unified experience for all employees and the
standardisation of corporate applications for back-office.
➜ Applications. Automate, standardise and modernise business through simplification and transformation of business processes and applications, standardising our own integrations and those with third parties and ensuring maximum reuse of the Group's experience (learn & leverage) to become a Digital Telco so that our customer value proposition is simple to understand and appealing, providing the business with agility and the digital capabilities that it requires.
➜ Drive the transformation of Telefónica into a Digital Telco, paving the way from traditional IT to i3, this being, to focus on product innovation, integration with services and take full advantage of customer information.
Global Procurement AreaManages Telefónica sourcing by means of global processes and systems, centralising negotiations with suppliers in Telefónica Global Services, headquartered in Munich. The new end to end Sourcing strategic model enables the
The first step towards a Digital Telco is the Business transformation based on standardized systems and processes
Network and
operations
Global IT
Global purchases
transformation of the traditional procurement process, introducing new levers to generate further savings, with the contribution of cross-functional teams focused on global categories.
Global Services AreaThe Global Services Area contributes to the support services transformation, by promoting a global shared services model. This evolution is based on a global approach to processes, building upon already existing service capabilities in both Latin America and Europe. The aim is to achieve processes consistency and control, increased efficiency and cost reduction, while fully benefiting from the usage of new technologies.
MSA Atento/Global CRM area seeks to ensure compliance with the Master Service Agreement signed with Atento when the Company sold it, while aiming to improve efficiency, effectiveness and quality of our customer service and sales channels (mostly telephone).
Achievements
Telefónica Global Resources has contributed to the steady improvement of the Company performance indicators, making progress, on the one hand, in the transformation of infrastructure and applications and, on the other hand, in the implementation of simplification projects, to maximize efficiencies and optimize the benefits of Telefónica’s scale. In addition, Global Resources plays a major role in the 10+2 initiatives from the transformation agenda, defined by the Company, leading three of them:
➜ Have the best network
➜ Transform our IT
➜ Refresh and merit our talent
Network optimisation and evolution is another keys objetives due to is relavance for services and contents distribution
Closure of 6 data centres
A reduction of 12% of physical servers
34% of virtualized servers
More than 1,150 applications removed
E2E Sourcing. A new framework to gain efficiencies and transform: specs standardization, evolved vendor map
Over 60% of all global procurement processes are now run under the model End-to-end strategic sourcing
~7% of average savings
5 million homes passed with fibre optics
More than 9,000 LTE sites in service
More than2,000 sites shared with Vodafone in the United Kingdom
~60% of sites connected with UBB to the (backhaul)
Network sharing with: United Kingdom, Brazil, Colombia, Czech Republic and Spain
More than 60% of the investment dedicated to UBB to satisfy the growing demand of data traffic by our Customers (~25% YoY growth)
Global RAN: First Telco in Europe to use a 4G solution by Alcatel Lucent and the first Telco in Latin America to use the 4G solution by Samsung
29 patents in network technology
71 Technical contributions to standardisation bodies for issues of evolution of transport networks, intelligence and network virtualisation and access technologies
83 publications of papers at major technical conferences and journals in the field of Telecommunications
9.395 M€
2013 Investment distribution
Run32%
Grow and transf.68%
5958

Telefónica | Annual Report 2013 Telefónica | Annual Report 2013
4. Be More_Telefónica Integrated report 2013
Global Network and Operations AreaThis has driven a transformation towards a Digital Telco and also the improvement of efficiency, developing a series of capabilities that enable Telefónica's network to be a differential element, due to the services that can be offered from it. Some of the most important initiatives in 2013 were:
➜ Optimising and driving the deployment of FTTH and LTE in the various operations of Telefónica, resting upon, when it has been necessary, any infrastructure sharing agreements.
There have been deployments of LTE in the United Kingdom, Germany, Spain, Brazil, Chile, Mexico, Colombia and Peru.
Currently, over 60% of the base stations are connected to the transport network (backhaul) with ultra broadband connections (UBB).
Regarding FTTH, Spain has over 3.5 million homes passed and in Brazil over 1.4 million.
On the other hand, the Networks sharing has gained momentum in five countries: Czech Republic, Colombia, United Kingdom, Spain and Brazil, through respective agreements with
America Movil in LatAm, with Vodafone in the United Kingdom and in Spain with Yoigo for mobile networks.
➜ Launching of the first network virtualisation pilot in Brazil. First works on Customer Premises Equipment virtualisation has began. Telefónica is the first Telco in the world to do so.
➜ Evolution and optimization of architecture of the transport network from a global perspective.
➜ Global definition of the specifications of fixed access equipment at customer premises and the first installation within the various operations of the Group. Also, it has been approved the high performance platforms with full FTTH and VDSL support.
➜ Global homogenization 0of solutions and processes for network operations. A global agreement has been utilised to make use of a tool for dispatch and management of activities concerning technicians in the field. It has deployed a comprehensive tool to automate part of the activities of the network operations centre. It has implemented a standard technical support model in all the operations for the six major network providers.
In 2013, procurement globally negotiated €22,000M of the €26,000M awarded to providers
(3) Full-Stack is the term used to refer to pre-integrated IT market solutions that provide the core of BSS/OSS (Business Support Systems/Operating Support Systems) applications and that follow the TM Forum standards.
Global IT AreaIn 2013, established the foundation so that in 2014 it could be developed into the business transformation towards a Digital Telco. All this brought about the committed efficiencies, due to the initiatives that enabled the consolidation of infrastructure and operations. During the year, it had been focusing on the execution, in hastening the transformation, exceeding the set targets and at the same time improving service levels. In short, some of the most important achievements in IT, during 2013 were:
➜ Improved Improved operational performance with higher availability ratios and reduced number of critical incidents.
➜ Set the strategy and path for bold Global business transformation with IT applications at the core. Argentina Full Stack launched with prepay already in production and plan agreed to launch several other countries in 2014
➜ Simplified IT landscape with 1,150 Applications and 2.700 physical servers decommissioned.
➜ Strategic DC’s live & driving transformation with Europe midrange already launched, 6 DCs released in LatAm and increasing the overall Virtualization ratios.
➜ For t Reduced IT Costs for the first time.
➜ Extended production Shared Services to Chile and aligned in UK through TEF shared services company (TGT) and plan agreed to expand to several other countries in 2014.
Global Procurement AreaIn 2013, over €26,000M were attributed, of which over €22,000M were traded globally. Furthermore, Global Purchasing area made significant progress in the implementation and development of the strategic transformation project for end-to-end sourcing, looking for a complete vision of purchasing management, from the needs assessment phase, influencing specifications and model definition, until the formalisation of commitments with suppliers (issuing orders / reception / acceptance, etc.). During 2013, this model was applied to the main products and services that we purchase (radio access network, or RAN, client devices, call centre services, maintenance of applications, etc.) focusing on the application of non-traditional negotiation leverage, standardisation and simplification of specifications, and the compliance of the model (with fully integrated systems).
Also, as part of the end-to-end sourcing (E2E sourcing), and contributing to the transformation towards a Digital Telco, in 2013 Telefonica progressed in the use of electronic processing tools with our suppliers, issuing more than
Distribution of procurement allocationsEnd-to-end procurement
A total of €18,500M were electronically negotiated with the with suppliers
Optimisation and standardisation of specifications
Redefining the price model
Optimisation of the demand
Objective supplier map
Multi-provider focus
Development of suppliers
Price benchmarks and indices
Swapability
Maximisation of the scope
Responsibilities
Price reviews
Digital catalogues
Improve forecasts and anticipate demand
TCO analysis
Issues related to demand
and specifications
Commercial issues
Proactive focus towards sellers
RCP negotiation and management
Traditional purchasing
Contract management
End-to-end monitoring
(downstream)
Spain 4,83018%
Others Europe: 5,75322%
Others Latam 9,06334%
Brazil 6,89026%
26.537 M€
6160

Telefónica | Annual Report 2013 Telefónica | Annual Report 2013
4. Be More_Telefónica Integrated report 2013
€18,500M in electronic ordering and receiving more than 1.4 million electronic invoices, which totalled 28,500M electronically traded euros.
Global Services AreaIn 2013, it decisively pushed forward the global project of shared services. New Economic-Financial (accounting and fixed assets) services were launched for operators in Latin America (Chile, Mexico, Ecuador, Uruguay and CAM) and for Human Resources (Help Desk, Payroll and Staff Administration, Training and Selection) from regional centres in Argentina and Peru, generating higher average savings of 25% on the originating cost of the activity. Additionally, in 2013 we continued with the deployment of the of the Zero Back Office (ZBO) operation model, which attempts to minimize as much as possible the internal dedication needs for administrative activities.
ChallengesTelefónica has a unique position to capture opportunities of growth from the digital world, increasing our relevance in the digital lives of customers. For this, a relevant pillar will be our key assets, such as networks, our infrastructure, IT, etc. Global Resources will contribute to this ambition to drive our technological transformation through three priorities:
(i) Accelerate the modernisation of our network.
(ii) Simplify operations.
(iii) Reduce technological obsolescence (networks, systems, etc.).
We also have a synergy plan that will significantly enhance our operating efficiency, in order to achieve gross long-term savings of up to €1,500M, through a new well-defined operational model for three major areas:
➜ Network: A more integrated plant, that generates efficiencies and delivers the highest quality.
➜ IT: Implementing shared services and global management initiatives to reduce costs and to support business.
➜ Support and Business: Adopt global processes and concentrate operations in regional centres. Reduce business costs by being more digital.
The Networks are essential so that Telefónica can progress in its transformation into a Digital Telco, monetize growth in data traffic and, in turn, be able to adequately manage any associated costs to deal with this growth. In order to do this, we must continue to advance the deployment of an ultra-fast broadband network that facilitates hyper-connectivity, reduce our technological obsolescence (legacy) to offer excellent quality to our customers, services such as on an all-IP network and also offer to simplify and transform systems support for operations.
In addition, Telefónica must continue to support common models and common processes that achieve efficiencies through our scope. Finally,
Savings from the new operating model
20142015
2016
Long-Term
Millions of Euros
The proper exploitation of the synergies may cut costs by about €1,500M
NetworkOpEx-CapEx 55-65%
ITOpEx-CapEx 10-15%
Business and Support (OpEx) 20-30%
250
1,500
1,500millions of Euros in gross savings
in the long-term (ex-Venezuela and synergies
from Germany)
network virtualisation is another essential tool that will allow the network architectures to evolve in order to provide more efficient and flexible networks, by allowing network functions to become more independent from hardware and also facilitate the consolidation of infrastructure.
From Continuity and consistency in Strategy & Execution is giving us the momentum that will enable a deeper transformation in the business in terms of Digital capabilities (customer 360º view, omni-channel, data-sharing, bundling, real-time marketing, etc.) and efficiencies. IT will continue increasing Transformation investment in 2014 while containing Run & Grow costs.
The main challenges that we face in the IT field, with the support of the Company's leaders, and those that are key to the successful implementation of the projects are:
➜ Business Leadership appetite for transformation is key for the successful execution of the projects. We must balance transforming Infrastructure & Applications at the same time to ensure minimal duplicated & wasted effort.
➜ This intensity of change will create operational challenges and we must be rational and see these in the long term
During 2014, Global Procurement area will increase its scope including all aspects related with Supply Chain, managing all their activities in an integrated way, from the demand side to the logistical management. They will also consolidate
the E2E Sourcing model, with focus on global electronic portfolio development .
Some of the key Global Procurement area challenges for 2014 include the E2E Sourcing model consolidation, through a better alignment with the operators and the technical areas and, simultaneously, expanding the Procurement scope to the whole supply chain.
Finally, Global Services main challenges for 2014 are to increase transfer volumes and centralization of activities on already migrated processes, and also identify new opportunities in processes and territories so our global model gets more consistency and extend its scope that allows us to accelerate further efficiencies while becoming a benchmark for BPO (Business Process Outsourcing), without deteriorating Telefónica’s processes quality and control. Additionally, we want to get deeper in value creation models through an end-to-end processes vision we operate, in order to maximize our scope, while considering the whole ecosystem (internal and outsourced operations, managed budgets and suppliers).
Telefónica wishes to convert itself into a player that is even more integrated in the ‘digital life’ of its customers
Inauguración de ‘Alcalá Data Center’.
6362

Telefónica | Annual Report 2013 Telefónica | Annual Report 2013
4. Be More_Telefónica Consolidated Report 2013
In 2013, the Commitment Index reached 77.7% with 79% of employees participating
This statement is evident in the information technology sector where knowledge is key for the development of business and becomes a competitive advantage. This is where Telefónica, in its objective of turning into a Digital Telco, is making its biggest effort: execution is achieved through people.
The communications sector continues to face challenges and unceasing changes that have made it completely redefine in a short period of time, with new business ecosystems appearing which oblige companies to adapt and transform in view of new realities. This peremptory need for transformation is linked to that for innovation and companies have to create ecosystems which promote innovation to ensure long-term success and that means putting people at the heart of the business.
Lines of progressThese new environmental realities, plus the transformation process of Telefónica into a Digital Telco, have made us focus on three clearly defined areas in our management of people: to have the best team, the most effective company culture and the simplest organisational structure possible, making us able to adapt to the changing needs of our customers. These three people-based priorities support the implementation of the strategic transformation programme of Telefónica, Be More_, a crystal-clear company programme to accelerate transformation, focusing on execution, with three attitudes reflecting our working philosophy:
➜ Discover. We have always been aware of the importance of being focused on our customers. However, it is now up to us to discover what it is they need in the digital world.
➜ Disrupt. We anticipate this change and will be innovative, using our knowledge of the digital world and our open-mindedness. Disrupt means to improve the rules of the game to create greater value for our customers and for Telefónica.
➜ Deliver. We will take advantage of our global presence, while remaining agile, allowing us to fulfill our commitment of taking technology to people.
AchievementsThe best teamHaving the best team is achieved through recruitment and personnel development in areas which are crucial to the business at that moment and ensuring that we are attractive to a diverse range of new talent. During 2013, 5,700 new employees aged below 30 were recruited through the Talentum programme.
In addition, training is still a key lever for the development and generation of talent. During 2013, we provided more than 2.9 million hours of training within the Group. The opportunities are structured at a global level through different tools: classroom training (Universitas and specialised courses) and online training (e-learning programmes).
The employees trained at Universitas Telefónica have increased by 64.8%, totalling 4,610 employees, with 55% of the teachers being employees of Telefónica (in 2011, this number stood at 5%). Additionally, an offshore Universitas has been created for the classroom training in other locations: China, United Kingdom, Ireland, Brazil, Peru and Germany.
BE MORE_COMMITTED
The people at the heart of the transformation _What differentiates one company from another is the people who make things happen
The e-learning offer is a fundamental formative lever that aims at encouraging the digital evolution of our professionals through the A+ training model, which is dynamic and collaborative with unique access for all users fostering the self-development of our employees.
In 2013, the e-learning model has been consolidated, with more than forty-seven thousand unique users (47,109) and almost three hundred and eighty-three thousand (382,982) accesses in corporate schools. The growth in unique users in comparison to the number in 2012 (29,017) stands at 62%.
The most effective cultureDuring 2013, Telefónica focused its effort on communicating the critical need for transformation throughout the organisation, ensuring the commitment and alignment of the employees with the global transformation programme Be More_.
This transformation involves the solid maintenance of the Global Index of Climate and Commitment (ICC) of employees as an objective.
In 2013, this index reached 77.7%, with the participation of 92,550 employees, which represents 79%+. Telefónica also remained part of the Great Place to Work ranking, ranked for the third consecutive year among the 20 best multinational companies to work for worldwide (16th place), the fourth best in Latin America.
Aiming at increasing awareness of the transformation programme Be More_ amongst all employees, there have been workshops to train our people to take a fresh perspective on the Company, introducing the new ‘Company Belief’, and allowing them to take on board what it means to Be More_ on a daily basis. More than 200 workshops took place up to December, in 20 countries. 150 trainers were trained to prepare more than 12,000 employees. The satisfaction surveys answered by 50% of the participants gave an average of points of 9.2 out of 10.
As part of this transformation, the global model of goal achievement measurement has been consolidated, differentiating between performance and potential and joining it to variable incentives. The performance model measures not only the achievement of Company and individual goals (What), but the way (How) these goals have been
More informationin the ‘Sponsorship’ section of the corporate website.
Telefónica is one of the 20 companies worldwide that most promotes talent
Action priorities Achievements Challenges
The best team 700 new employees within the Talentum programme.
More than 2.9 millions of training hours provided.
4,610 employees trained at Universitas.
The Global Index of Climate and Commitment 2013 (ICC) reached 77.7%, with 79% of participation.
For the third consecutive year, among the 20 best multinational companies to work for worldwide (16th place), and 4th in Latin America.
To keep the commitment to training and development of internal talent (Universitas and A+) .
To incorporate external talent with the correct capacities.
To develop the digital capacities of the personnel.
A suitable education
Global launching of the transformation programme Be More_, and its defining attitudes, Discover, Disrupt and Deliver (3Ds) , to contribute to Be More_ with them.
More than 200 workshops to promote the internalisation of the Company transformation programme Be More_.
Consolidated the global model of goal achievement measurement, measuring not only the objective attainment (What) of the Company and individual ones, but the way (How).
To ensure knowledge of the Be More_ programme_ and the 3Ds, mobilising the organisation in the transformation into a Digital Telco.
To keep promoting the Diversity agenda.
To encourage the global agenda of the Group in projects of Corporate Welfare (Workplace Wellness).
To define new programmes of long-term remuneration and bonuses.
A simple organisation
We simplify the global organisational chart and reinforce the transversal areas to improve flexibility and agility in decision-making.
More than 126,000 employees of whom less than 1% were managers.
105 different nationalities across the Group, distributed in 24 countries.
To lead the transformation and simplification of the organisation.
To define global people management policies.
6564

Telefónica | Annual Report 2013 Telefónica | Annual Report 2013
4. Be More_Telefónica Consolidated Report 2013
achieved using the 3Ds (attitudes defined in the Be More_ programme, as elements of evaluation).
Other initiatives such as the Be More_ Experience or Recognise D, reinforce the Company program-me by helping employees bond with the three attitudes, acknowledging when they successfully practised them. This acknowledgement comes from the employees themselves who, through a simple tool, can give ‘virtual awards’ to those whose daily attitude at work fits in with Discover, Disrupt and Deliver.
Be More_ TV is a new communication channel trying to bring the personnel all the Be More_ related happenings across the Company: it reports on programmes, actions, attitudes... but mainly, people.
Additonally in 2013, a policy of international mobility consistent across the Group was implemented, offering an international professional career to the employees.
A simple organisationThe Be More_ programme has materialised in the transformation of the Company’s organisational structure. This organisational transformation totally responds to the 12 strategic priorities defined in the Be More_ programme. The objectives pursued with this new structure, announced in February 2014, are to increase our income, modernise the networks and systems,
obtain higher efficiency, and reinforce our leadership in the digital ecosystem. For that reason, the Company has decided to give more visibility to local operators, approaching them to the corporate decision centre, simplifying the global organisational chart and reinforcing the transversal areas to improve flexibility and agility in decision-making. To maintain the capacity for innovation within Telefónica, it is imperative to promote simplification in the organisation, optimising its design.
At the end of 2013, Grupo Telefónica had more than 126,000 employees, of whom less than 1% were managers. Personnel were streamlined by 4.9% compared to the previous year, in accordance with the transformation of the Company into a simpler structure.
Telefónica also supports fixed employment: 94% of the personnel have indefinite employment contracts and the number of women in the staff stands at 38%. Moreover, the number of directives increases each year, reaching 21% in 2013 - an increase of 1.7 percentage points since last year.
Diversity is another key factor, Telefónica counts on more than 105 different nationalities across the Group, who are distributed in 24 countries, with Latin America still contributing the highest percentage of personnel. The individual country with the most employees is Spain, with 34,602; followed by Brazil, with 20,878; Argentina, with 17,139; and Peru, with 9,824.
ChallengesThe first challenge is to attract new talent and to develop internal talent, in order to guarantee that the business will have the necessary profile to compete in 5 or 10 years, and excellent leadership is the first element needed. In this sense, we are working on capturing young, talented professionals. We are on course to recruit 14,000 people younger than 30 to new positions by 2016 and, at the same time, we are focusing on the the training and development of internal talent to extend their capacity, empowerment and commitment. This, we believe, is the only way to compete in the future.
The second working focus is to continue with the development of the new corporate culture, responding to the transformation programme of Telefónica: Be More_ and the 3D’s (Discover, Dis-rupt and Deliver). We have to accelerate and adapt the programme to create true alignment amongst our 125,000 employees. Another priority regar-ding Group culture is to provide our managers with
the skills they need to lead during change; and we are supporting them in developing adaptability, flexibility, innovation and supporting diversity and developing of new models of remuneration. Fina-lly, we are enhancing the global Corporate Welfare plan(Workplace Wellness), which looks at how to stimulate our employees and improve their envi-ronment to actively increase their level of welfare and health. We mean to promote the adoption of new healthy habits into their lives and others close to them through four fundamental axes: nutrition, physical activity, person and health.
Together with the right people and corporate culture, we need to have a simpler and more efficient organisation that offers us the necessary flexibility to keep competing. The future is yet to be defined, and therefore we need to provide the staff with the flexibility they need to be their best whatever comes.
94% of employees have indefinite contracts and women represent 38% of the workforce
Telefónica will incorporate into its personnel, by 2016, 14,000 highly-qualified youngsters aged below 30
Externally, we have opted for GPTW as the referenceEvolution of the comparative chart of participation and ranking in the last five years
1 Nicaragua1 Uruguay1 Venezuela2 Ecuador3 TM Argentina4 El Salvador4 Chile5 Colombia5 Panama6 Ireland8 TISA11 Guatemala12 TASA13 Mexico13 TGSC Peru14 TGSC Argentina15 Peru22 Vivo78 Telesp
2011
2nd place GPTW in Latin America
1 Uruguay1 Ecuador1 Venezuela4 Chile4 TM Colombia10 Telecom11 TM Argentina11 CAM13 TM Peru18 TSC25 Mexico41 TASA
2009
Four companies among the 100 GPTW in Latin America
1 Panama1 Venezuela1 Uruguay1 Ecuador2 Nicaragua3 Chile3 Colombia3 Germany4 TISA6 Ireland7 El Salvador8 United Kingdom9 Argentina11 TGSC Argentina12 TGSC Peru13 Guatemala18 Mexico18 Vivo18 Peru
2012
2nd place GPTW in Latin America
1 Venezuela2 Ecuador2 TM Colombia2 Ireland3 TM Argentina6 Telecom7 TISA8 CAM9 Chile10 Mexico13 TM Peru17 TSC
2010
Eight companies among the 100 GPTW in Latin America
1 Venezuela1 Ecuador2 Colombia2 Panama2 Nicaragua5 Germany7 El Salvador7 TGSC Argentina8 Guatemala10 Argentina10 TGSC Peru13 T. Vivo15 Costa Rica15 CAM16 Peru17 Mexico
2013
4th place GPTW in Latin America
Distribution of the personnel by age
men women
13,02813,056
Employees <30
10,8839,285
Employees (34)34
25,827
16,030
Employees 35-44
23,108
8,836
Employees 45-54
5,331
1,346
Employees >54
Others Latam 38.7%
Others Europe 16.2%
Spain 27.3%
Brazil 16.5%
Geographical distribution of the personnel
126,730
6766

Telefónica | Annual Report 2013 Telefónica | Annual Report 2013
4. Be More_Telefónica Integrated report 2013
BE MORE_ BRAND EXPERIENCE
We build strong brands to compete and succeed in the digital environment _At Telefónica, our brands are living and evolving, responding to the customer-centric business strategy
The brand portfolio has evolved, giving new digital resources to the main brands as well as creating new ones
Movistar, O2 and Vivo figure among the brands most highly rated by consumers in their respective markets
We move forwardWithin the process of transforming the Company to bring the possibilities of technology to all people and companies, the brand portfolio has evolved, giving new digital resources to the main brands as well as creating new ones, to offer digital services beyond mere connectivity. In addition to building strong, trustworthy and distinctive brands that create emotional bonds with customers.
It is not for nothing that Movistar, O2 and Vivo are considered among the most important brands in the world.
The brand model defines an institutional role for the masterbrand Telefónica that is responsible for leading relationships with
employees, shareholders and investors, large clients and multinationals, providers, institutional audiences and society in general. While Movistar, O2 and Vivo are the commercial, customer-facing brands.
In addition, Telefónica has other independent brands for businesses or specific initiatives in the digital environment such as: Tuenti, Terra and TU; low-cost mobile operators: 48, Fonic, Tuenti mobile; and in innovation, start-up accelerators such as Wayra.
This portfolio has been expanded with the brands created in 2013 and which are described below.
AchievementsTelefónica defined its Company Belief, which is the raison d’être of the Company and what motivates employees to work each day. The concept Be More_ was created as an internal slogan and the basis for communication of our brands with their different audiences.
Company Belief: “We believe that the possibilities of technology should be open to everyone. That way, we can all do more, live better, be more.”
The visual identity of the Telefónica brand evolved, giving it more digital elements such as Blue Light, the underscore, increasing the colour palette, new forms of communication and new styles of photography and illustration.
In 2013, the need for the O2 brand to evolve was identified. The way people work and live has changed greatly since 2002, and it was necessary to create a more flexible brand and adapt it to the digital world.
O2 is now a fresher brand: the bubbles now radiate more energy, the colour palette is more luminous, the typography stronger and the gradient more flexible. O2 now surprises us with a photo and a
more unexpected and vibrant style of illustration. O2 is now a more dynamic and personal brand.
With clear determination to grasp the opportunities in video and digital content on offer, the first sub-brand of Movistar, Movistar TV, was created, with the aim of building credibility in the new video category that goes beyond thecore business and has a clear identity in the market.
Movistar TV was launched in Spain, taking advantage of the relaunch of the television service with a new, simpler and more innovative interface as well as new content.
Moreover, the brand Telefónica Studios was created with the objective of capitalizing on our image as a producer of audiovisual content. It will host all the Company’s audiovisual projects under its name, and during the next three years will produce 25 feature-length films and TV series for its TV services.
Elsewhere, responding to a business need, a new brand, Eleven Paths, was created. It is dedicated to the development of new and innovative products, challenging the current landscape, and
Institutional brand
Commercial brand
Current Brand Architecture map
Social commitment and innovation
Other brands
reconsidering the relationship between security and people.
The aim is to satisfy, simply and rapidly, the needs that arise in this new digital world - ensuring that security is always present in technology; alert to protect daily life; but without getting in the way of the professional or personal activities of our customers.
Brand percepción Movistar, O2 and Vivo are among the most highly rated brands by customers, obtainng high brand recognition in all the markets in which they operate.
Studies such as the 2013 TPSM by Millward Brown show us that the purchasing preference for our brands is higher among those consumers that relate them with that of Telefónica, as the brands then benefit from the solidity and trustworthiness of a global company. This association of brands is achieved through the endorsement of the commercial brands by Telefonica. In 2013 the average level of brand association between the two was 32% for
More informationIn the ‘Our Brands’ section of the corporate website
6968

Telefónica | Annual Report 2013 Telefónica | Annual Report 2013
4. Be More_Telefónica Integrated report 2013
Movistar (14 countries), 37% in O2 (5 countries) and 16% in Vivo (1 country).
In addition, Millward Brown’s 2013 BrandZ: Top 100 Most Valuable Global Brands ranked Movistar 66th. Movistar was also placed No.1 in Interbrand’s 2013 Best Spanish brands ranking. Similarly, Vivo obtained recognition as the most valuable telecoms sector brand in Brazil for the ninth year running, according to the study of Brand Finance 2013, as well as being considered the most trustworthy telecoms operator in Brazil, according to Ibope 2013.
Brand managementTelefónica continues to consolidate the global process of Brand Guardianship that seeks coherence and consistency in the implantation of our brands, so as to achieve maximum recognition and relevance among their audiences at global, regional and local levels. In 2013 more than 74,000 pieces of branded content were revised, representing a weekly volume of 1,420
pieces, with the result that over 95% of the work that completed the process had exit code on-brand, or 2% more than the previous year (93%)
In 2013, the new Brand Room was launched, the online brand tool aimed at our employees, agencies and providers, with some 300 visits (daily mean), where the rules and assets for all our brands can be found. This integrates the Image Room, available to all users, our corporate image bank containing some 40,000 photos of the brands Telefónica, Movistar and Vivo, with some 3,300 downloads (monthly mean).
Our next stepsGet to know our clients better - to understand their needs, desires and behaviours in a world that is without geographical barriers and is ever more digital - so that the commercial brands Movistar, O2 and Vivo can offer them a distinctive and relevant brand experience, using new technology in how they communicate, showcase their services, sell and provide support.
BE MORE_ is the internal slogan of Telefónica and the basis for communication with the audiences for its brands
Spontaneous brand recognitionTotal accumulated data 2012
Data obtained from the TPSM of Milward Brown, total accumulated for 2012. Mobile category.
SpainChilePeru
ArgentinaMexico
UruguayEl SalvadorGuatemalaNicaraguaVenezuelaColombiaEcuadorPanama
Costa RicaBrazil
UKGermany
Top of mind (percentage) Total mentions (percentage) Ranking
9288979393999998999287949991797666
11212123211222122
3531653824472831405047383311303020
ChallengesIntegration of the operations of E-Plus with O2 in Germany.
Evolution of the brand identities of Movistar and O2 to position them and implant them in new digital environments.
Evolution of the ‘Brand Guardianship’ process with the digital environment development teams to improve the brand experience of users in these environments.
Ongoing monitoring of the trends and insights of consumers that contribute to the building of our brands.
Eleven Paths and Telefónica Studios are brands created in 2013 to respond to new digital opportunities
Séptimo
Mariah Mundi
Las aventuras de Tadeo Jones
Grand Piano
Futbolín
A night in old Mexico
Wakolda
1 OSCAR 4 GOYAS+14 MILL. DE ENTRADAS+40 PAÍSES
En Telefónica Studios hemos logrado más de lo que soñamos con nuestras producciones. Ahora, con el impulso y la ilusión que nos acompañan, vamos a seguir trabajando para hacer el mejor cine español y latinoamericano para el mundo entero: 25 nuevos estrenos en los próximos 3 años.
TENEMOSMUCHO CINEPOR DELANTE_
74,000pieces of branded content
were revised in 2013 via the Brand Guardian process
1,420 pieces of branded content
revised per week to comply with brand requirements
95% of Marketing and
Communication items had an on-brand issue code
7170

Telefónica | Annual Report 2013 Telefónica | Annual Report 2013
Telefónica Integrated Report 2013 4. Be More_
Our sponsorships are ever more aimed at digital development for the benefit of our clients
In 2013, Telefónica began to align its sponsorships with its vision and strategic idea of being a Digital Telco. The first step was the digital activation of sponsorship for the benefit of our clients, so that any programme in the real world is also developed in the digital world (digital content, social networks, etc.).
SportTelefónica has concentrated on team sports played by famous entities with many fans. Following this criterion, our sponsorship of national football teams (Spain, Brazil, Colombia and Mexico); national rugby teams (the UK and Ireland); the women’s volleyball team of Peru, and important teams in the principal leagues of the world in football, basketball, rugby, baseball and cycling, all stand out.
In cycling, we sponsor the Movistar Team, the best team in the world in 2013. For digital activation, we have developed apps for mobile devices and online content for social networks.
Telefónica AmbassadorsTelefónica and the Ambassadors carry out joint actions, each bringing the strengths of their field of work, allowing design of innovative projects, content, and online presence, under the slogan “Partners for transformation”.
Ferran Adrià. The best chef of the last decade and considered ‘one of the 100 most influential people in the world’ by the magazine Time, and a leader in innovation and transformation. Ferran
is a Telefónica Ambassador and Telefónica is the technological partner for all Ferran’s projects. Lang Lang. He is “the leading artist in the world of current classical music” (The New York Times). He has brought classical music to millions of people, especially the young, combining the classicism of his pieces with the most absolute modernity and innovation. Gastón Acurio. One of the most important chefs of Latin America. Telefónica and Gastón Acurio seek to promote integration opportunities through gastronomy and ICT.
Institutions and patronageIn this area, outstanding projects are the digitalization of the National Library of Spain, allowing free consultation of tens of thousands of its holdings; the visitor assistance programme at the Prado Museum, from which 13 million visitors have already benefited; Cine Tela, which brings cinematographic exhibitions to the periphery of Brazil; and the Orchestra Tour Brazil, a circuit of 16 concerts given by young musicians without resources.
Innovation and technologyCampus Party Under the slogan ‘Internet is not a network of computers; Internet is a network of people’, this is the most important Internet event in the world in the areas of Digital Innovation, Creativity, Science and Leisure. In 2013 we sponsored the Campus Parties of Rio de Janeiro, Recife, Ecuador and London.
‘Mobile World Capital’. Barcelona is positioning itself as the capital of the mobile, broadening the initial concept of the GSMA Mobile World Congress
to other axes, like the Mobile World Center, the Mobile World Festival and the Mobile World Hub, which will take place throughout the year and will be directed at the general public.
ArenasIn 2013, Telefónica, through its brands O2 and Movistar, sponsored the multiuse pavilions equipped with the latest technologies in London, Hamburg, Berlin, Prague, Dublin and Santiago. In these spaces special perks for our customers are offered.
MusicWe sponsor tours, concerts and festivals of massive scope, managing online participation so as to keep up a continuous interactive dialogue with our customers.
‘Movistar Free Music’ (in Argentina). Free concerts for Movistar customers which bring together various bands on a single day and where the audience contributes to the design of the show .
‘Eu Vivo Música’ (in Brazil). Our own concerts, open and free, where important Brazilian artists perform. They allow the Vivo brand to be brought close to a young public and generate content for social networks, Vivo TV and Vivo Play. ‘O2 Academies’. These are 15 emblematic spaces for music in 12 UK cities, exclusive for our customers. In 2013 more than 3.5 million people attended.
BE MORE_ RECOGNISED
Our sponsoships are becoming more digital _In line with the Company’s new strategy, in recent months Telefónica has been working to define a new sponsorship policy which will give an important role to digital activation so as to reach the largest number of clients around the world. Be... more
Ferran Adrià (L) and the pianist Lang Lang, Telefónica ambassadors along with Gastón Acurio.
Campus Party participants pitching tents. The O2 World Arena in Berlin.The members of Movistar Team, which in 2013 was proclaimed the greatest cycling team in the world.
More informationat the ‘Sponsorship’ section of the corporate website.
Distribution of sponsorship investment
Innovation and technology5%
Institutions and patronage13%
Music9%
Ambassadors2%
Arenas22%
Sport49%
100%
(Percentages)
7372

Telefónica | Annual Report 2013 Telefónica | Annual Report 2013
4. Be More_Telefónica Integrated report 2013
In 2013, Telefonica's efforts in technological innovation rose to 6,142 M€ (+6.4%)
TV and video services, M2M, 'Big Data', 'Cloud', Communications, Security, Applications, Financial services, Networks... are the focal points of innovation
Lines of progressInnovation is the key Telefonica works with to improve its customers' lives. It is also the tool which enables sustainable competitive advantages to be maintained, and to differentiate oneself in its commercial offer, evolve in business and contribute to progress and social wellbeing.
It is a permanent bet of the operator, which dedicates part of its yearly efforts to investing in this concept, convinced that only investments related to innovation are capable of achieving viable sustainability and competition within the company and a good vantage point to evolve, anticipate and manage to leave customers satisfied. In 2013, Telefonica's efforts in technological innovation rose to 6,142 million Euros, in relation to the 5,770 million in 2012. In terms of R&D, in 2013, the total expense was 1,046 million Euros. The latest report published by the European Commission, referring to 2012, confirms Telefonica as the telecoms company in Europe that most invests in R&D. Telefonica also ranks second in the world in relation to this. In Spain, Telefonica's R&D investment represents 8% of total corporate investment.
BE MORE_INNOVATIVE
We innovate to bring our customers closer to the digital future. _Telefónica ranks as the primary European telecom operator investing in R&D and the second globally.
The investment for innovation started out in 1998, when Telefonica created R&D. In 2013, the company celebrated this company's 25th
anniversary, focused on supporting competition and modernisation within the company. Telefonica R&D is still developing most of the applied research and the R&D carried out at Telefonica, is the main catalyst for the operator's innovation, along with other areas of the company. It constitutes of one of the largest private R&D centres in Spain and one of the main in the new technology sector in Europe: It encompasses a network of centres for technological excellence located in Barcelona, Granada, Huesca, Madrid, Valladolid, Sao Paulo and London. Its employees – 689 in December 2013– are mostly made up of high-level scientists and technicians from almost 20 different nationalities.
Achievements With the focus being centred around becoming a leading digital telecoms company, and by offering the best service and most advanced digital products, Telefonica focused its innovative activity mainly on Media Services, Communications, M2M, Big Data, Cloud,
Applications, Financial Services and Innovation in networks, among others.
The Global Video Platform (GVP), set up in five countries which offers IPTV, Cable, Satellite and non-liner video services, has been one of the achievements of 2013, along with other video and multimedia services that combine text, audio, images and videos. With the aim of improving efficiency in video distribution, new more efficient video and audio codifiers (HWVC, AC) have been incorporated into the GVP. In this way, for the distribution infrastructure new internal transfer mechanisms have been designed and investigations have been carried out on video services based on distribution capacities of the LTE mobile network.
The commercialisation of the communications service TuGo was another milestone in 2013. This service converts the handset into an app which the user can install in any device: tablets, PCs or in the phone itself.
Security products gathered momentum. Through Telefonica's company, Eleven Paths, a service called Latch was created and is was
able to be launched on the market before the end of the year. Furthermore, various services were launched for companies to ensure traffic integrity in its networks. Faast helps companies detect security breaches from an attackers point of view. Metashield Protector makes it easier for organisations to eliminate the metadata associated to the documents and prevents the leakage of information. The Vigilancia Digital service allows companies to protect themselves from cyber attacks.
Along with Mozilla, it started the commercialisation of devices with operative systems open in Firefox OS. The ZTE Open was launched in July in Spain, and consequently in Colombia and Venezuela, along with Alcatel One Touch Fire. In October it was launched in Brazil the first terminal with Firefox OS 1.1: the LG Fireweb.
In Machine-to-Machine (M2M), innovation was centred around service management related to Smart Cities, energy efficiency and mobility, above all. It also focused on the Internet of Things (IoT) and of its adoption into the urban and industrial areas as well as being issuers for the creation of services.
More informationVideo of Telefonica R&D's 25th anniversary.
25th anniversary of Telefónica R&D.
7574

Telefónica | Annual Report 2013 Telefónica | Annual Report 2013
4. Be More_Telefónica Integrated report 2013
The Smart Santander project, co-funded by the European Union and headed by Telefónica R&D, constructed the largest existing urban infrastructure in the world, capable of providing Smart City services to citizens and to simultaneously support scientific research in future internet technologies. At the end of 2013, Telefónica created Santander a Centre for Innovation in Smart Cities.
Another European project which Telefónica R&D also heads is the development of the Europe's experimental internet platform for the future FI-WARE. The cities which use this platform create an ecosystem where open data and the Internet of Things allow entrepreneurs to create new services. In September, FI-Lab - an experimentation lab in the cloud open to any entrepreneur - was inaugurated. This lab is used to develop new services for intelligent cities, uban security, energy management, health, logistics and content distribution in the most time and cost-effective way possible.
The smart meter system for connected households, designed by Telefonica, was the technology that was selected by the British government to set up a network of smart metering systems in that country. These metres manage energy systems more efficiently and provide new and innovative services for consumers.
Pago como Conduzco (Pay as you drive) is another M2M product that was launched in Spain. With this solution, each driver pays according to their driving habits.
In the Big Data sector, innovation has mainly been reflected in the launch of the Smart Steps product, which analyses population fluxes on a large scale to better decision-making in the retail sector. Data sharing models for social networks, mobility patterns and navigation interest patterns were also developed to improve the selection of audiences for customer communications.
Innovation for Cloud resulted in OpenAppsCloud, a new Cloud operating system based in Linux, which will be used in the new generation of Telefonica Cloud services.
In a bid to achieve open and interoperable surroundings, a reference architecture was designed based on OpenStack, which included innovation in three areas: defined networks for SDN software, IT centred around (Storlets) storage and platform capacities such as the (PaaS) service.
Telefónica R&D also dedicates some of its efforts towards applied research, with a mid and long-term vision. RADIO ME is a service which allows voice messages to be sent and received through messenger apps without needing to know how to use a smartphone. Awazza is a mobile traffic accelerator for 3G/4G and In-Store Retail, a solution which helps us understand customer activity within the shop and to optimise the business. Furthermore, R&D works with Scientific Groups that publish their investigations in the
most prestigious forums and international publications.
Telefónica also innovates the modernisation of networks and systems. The strategic network virtualization project and setting-up of fibre-optic and LTE technologies is going to allow for an in-depth transformation and simplification of the systems.
Telefonica's innovation does not just focus on products. It also innovates by transforming its processes with new ways of organising, transforming its relationship with the customer and improving practices and its commercial offer which is added to the acquisition of technology.
Wayra, the global accelerator from Telefonica's technological start-ups, forms part of another of its large investments to support creativity, business ventures and entrepreneurs. A major part of the projects which accelerate are focused on OTT applications, financial services, cloud
Action priorities Achievements Challenges
Global effort in R&D 1,046 million Euros in R&D, which represents 1.8% of the revenue (+0.1p.p. in 2012).
6,142 million Euros in R&D+ which represents 10.8% of the revenue (+1.5p.p. in 2012).
Orient R&D more towards the client and its digital products as an element of excellence and differentiation and to apply it to networks, technologies and processes to multiply its efficiency and capacity.
Number of new patents in the portfolio of intangible assets
82 new patents Make all of the company's developers and inventors aware of the relevance of intellectual property and patents.
Start-ups acceleration through Wayra
Support and collaboration in R&D for 14 academies, in seven countries in Latin American and five in Europe: R&D collaboration with a portfolio with over315companies grouped in 20 digital industries
Toast to new tools for acadamies to be able to speed up their projects as swiftly as possible, in line with the speed new technologies emerge and to increase its influence and implication with the main players in business ventures.
Its investment in business ventures, developing talent, generating ideas and giving people opportunities reflects it innovative vocation
Telefónica was one of the 20 companies worldwide that most promotes talent
A smartphone with Firefox OS 1.1, now available in Spain.
7776

Telefónica | Annual Report 2013 Telefónica | Annual Report 2013
4. Be More_Telefónica Integrated report 2013
computing... It already relies on 14 academies for entrepreneurs in 12 countries. Its presence in Germany, Argentina, Brazil, Colombia, Chile, Spain (Madrid and Barcelona), Ireland, Mexico, Peru, the UK, the Czech Republic and Venezuela, makes Wayra an accelerator with a truly global spirit. Wayra has already accelerated over 315 companies, which are speeding up both employment and commercial activity. In 2013, Wayra called on venture capitalists from over ten cities to demonstrate the potential of the companies. In second place, demoDay international, simultaneously celebrated in London and São Paulo. Over 100 investors, business angels and entrepreneurs from across Europe, Latin America and the USA turned up. Participants from nine countries, 16 start-ups could present their products and look for finance opportunities in the international investment community.
During 2013, innovation works have received various and significant recognition.
All of these actions has meant that is, according to Fortune magazine, the most admired non-American telecoms operator in the world and the fourth worldwide, according to an edition published in The World’s Most Admired Companies which includes the most admired companies in the world from 30 countries and 57 different sectors.
➜ In May 2013, Analysys Mason and Machina Research analysts named Telefonica 'global leader in the provision of M2M services': “Telefónica is the company which has done the most in the last 12 months to strengthen its position in M2M".
ChallengesIt's investment in business ventures, developing talent and for creating opportunities for people is another reflection of its innovation. The operator is aware that in order to successfully carry out a good idea, an ecosystem of partners to share that process with. In order to drive innovation in third-parties it acts as the catalyst of R&D's national system, through its open innovation policies; its Amérigo and Innvierte (the latter is collaborating with the CDTI) venture capital funds; Wayra, its business accelerator; contributions from various Campus Party; and programmes such as Millenium, Talentum, , Think Big and WARE, celebrated in the Campus Party. Some of these lead into the OpenFuture initiative aimed at encouraging entrepreneurial activity. In addition to opening the door to global talent and reflecting on the early investment of new digital products, these programmes facilitate the process of delivering new digital services to customers in a simpler more flexible way.
The collaboration of other European operators and institutions in the framework of project participation driven by the EU and collaboration with universities and research centres in Spain and abroad has generated one of the most outstanding networks for innovation in the new technology sector worldwide. Only Telefónica R&D collaborates with over 50 universities. At the same time, the organisation of open competitions and hackathons has reunited thousands of developers across the globe. Among other things, Telefonica highlights those related to Firefox OS and FI-WARE.
Telefonica's innovation thinks globally. It focuses on all the customers and countries it
operates in. In 2013, Telefónica Chile decided to open a centre for innovation in its capital, Santiago. In addition to innovation drivers, we are model examples in the way we innovate. Telefónica R&D has always been at the forefront, evolving its model to adapt it to the company's objectives. In 2013, while it was working on the concept of open innovation, it was a pioneer in applying a concept of systematic and disruptive innovation based on l start-up and customer discovery to a large company.
The Internet of Things forms part of its next policy objectives, mainly focusing on the creation of devices and sensors, connectivity and apps for Smart Cities. It also keeps working on future networks to make them more efficient and capable, and to facilitate and simplify its transformation process. Open technologies are still one of the company's investments, firstly with Firefox OS, and then with TokBox and its activity with web Real-Time Communication.
Personal data privacy to meet social demands for greater protection of digital identity, activity in the area of security (one of the results have been Latch) and providing Digital Peace of Mind to customers also form part of Telefonica's challenges with innovation. Big Data application to retail, tourism, risk prevention and studies and application of social and human interest constitute other lines which are still being focused on.
The main challenge in innovation is to satisfy the customer and capture new ones, by launching digital products that will resolve their current and future needs and leave them satisfied. The
Telefónica knows that in order to triumph, ‘a good idea’ is key in the ecosystem of partners that share the process adnd a vision of the future
Development of services and sensors for smart cities and creation of more efficient and easier future networks are challenges for Telefónica
54partner universities around
the world
6,142million euros in technology
innovation
315'accelerated' companies
in 20 digital industries
Number 1European operator in R&D investment.
689scientists and technicians
from 20 nationalities in R&D
1,046million euros in R&D
user's needs, interests and preferences are also a key element for inspiration in order to define and create new products. Telefonica R&D's User Experience lab works on finding out and understanding customers by using them to define new services and product designs.
In order to guide the right innovation strategy, Telefonica measures the return of its efforts in R&D from its products and platforms and its intangible technological assets. The main strategies involve patents, a heritage generated from knowledge and inventions that have derived from innovation, which are there to protect and differentiate its products and technologies.
In 2013, Telefónica registered 82 patents; 70 were registered through the Spanish Patents and Trade Marks Office (OEPM) and 12 in the USPTO. From the patents made through the OEPM, 57 were European (EP) and 13 were international (PCT).
All R&D activity comes together for one single aim: to keep on transforming and building Telefonica into a leading Digital Telecoms company which brings people closer to the digital future and improves their lives.
7978
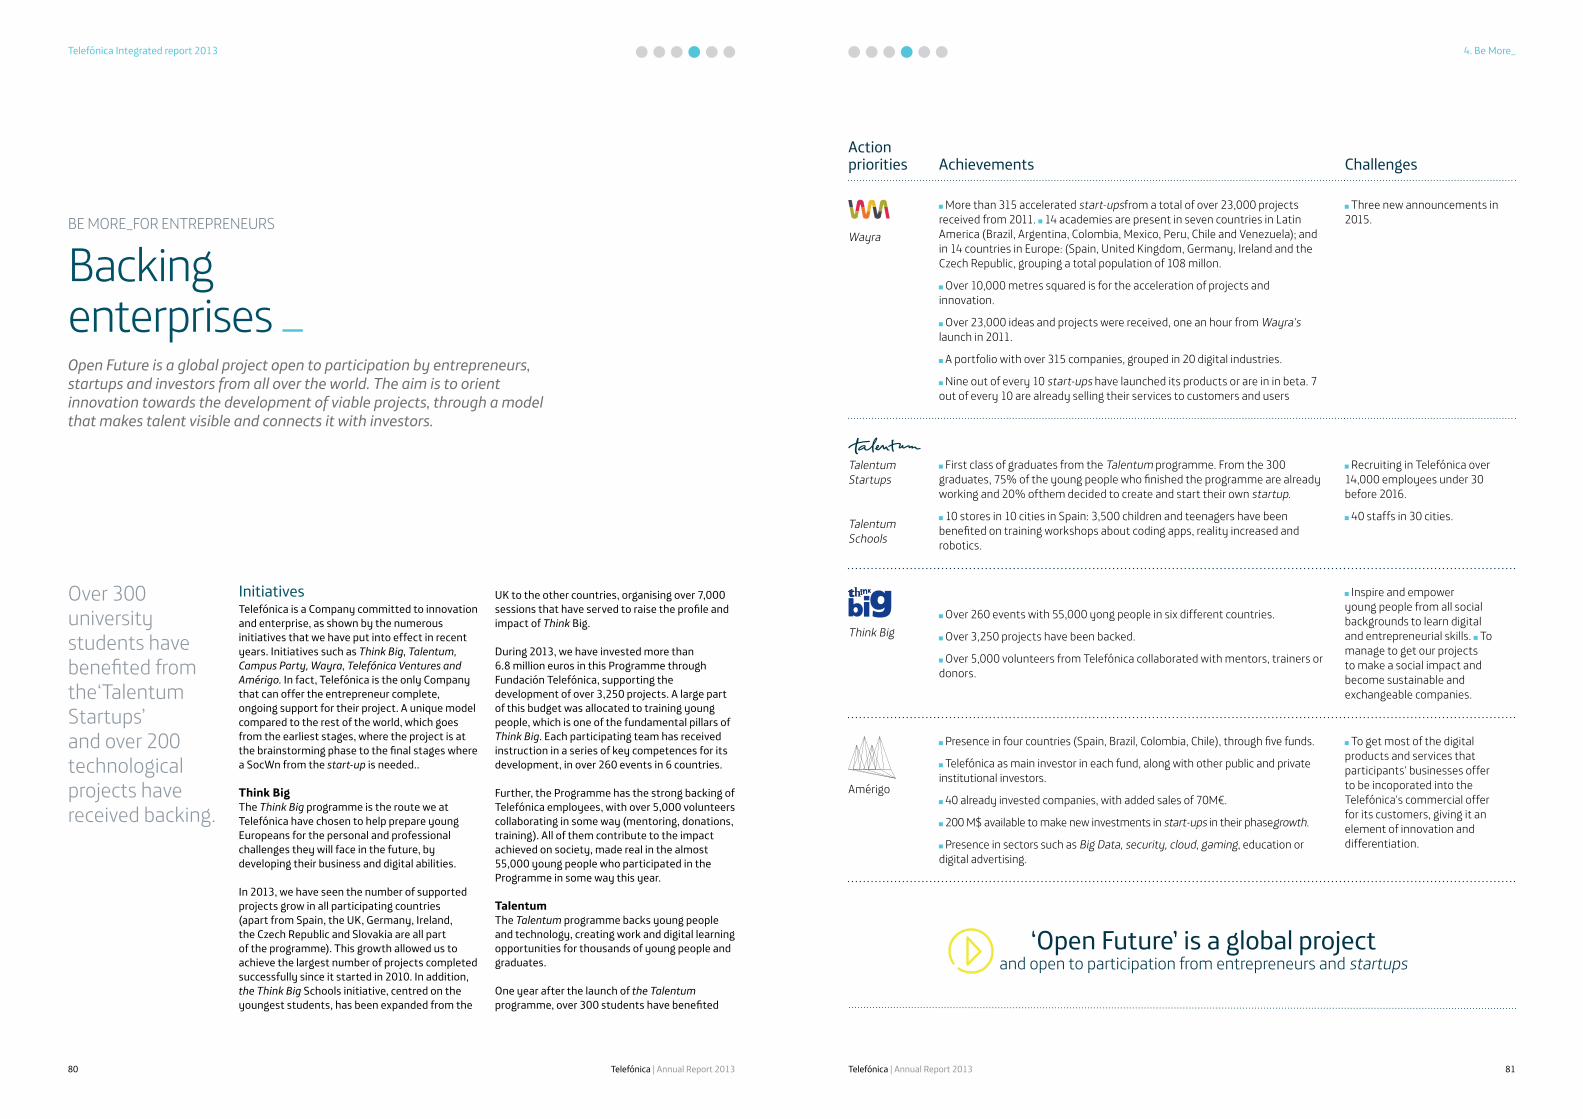
Telefónica | Annual Report 2013 Telefónica | Annual Report 2013
4. Be More_Telefónica Integrated report 2013
Over 300 university students have benefited from the‘Talentum Startups’ and over 200 technological projects have received backing.
InitiativesTelefónica is a Company committed to innovation and enterprise, as shown by the numerous initiatives that we have put into effect in recent years. Initiatives such as Think Big, Talentum, Campus Party, Wayra, Telefónica Ventures and Amérigo. In fact, Telefónica is the only Company that can offer the entrepreneur complete, ongoing support for their project. A unique model compared to the rest of the world, which goes from the earliest stages, where the project is at the brainstorming phase to the final stages where a SocWn from the start-up is needed..
Think BigThe Think Big programme is the route we at Telefónica have chosen to help prepare young Europeans for the personal and professional challenges they will face in the future, by developing their business and digital abilities.
In 2013, we have seen the number of supported projects grow in all participating countries (apart from Spain, the UK, Germany, Ireland, the Czech Republic and Slovakia are all part of the programme). This growth allowed us to achieve the largest number of projects completed successfully since it started in 2010. In addition, the Think Big Schools initiative, centred on the youngest students, has been expanded from the
UK to the other countries, organising over 7,000 sessions that have served to raise the profile and impact of Think Big.
During 2013, we have invested more than 6.8 million euros in this Programme through Fundación Telefónica, supporting the development of over 3,250 projects. A large part of this budget was allocated to training young people, which is one of the fundamental pillars of Think Big. Each participating team has received instruction in a series of key competences for its development, in over 260 events in 6 countries.
Further, the Programme has the strong backing of Telefónica employees, with over 5,000 volunteers collaborating in some way (mentoring, donations, training). All of them contribute to the impact achieved on society, made real in the almost 55,000 young people who participated in the Programme in some way this year.
TalentumThe Talentum programme backs young people and technology, creating work and digital learning opportunities for thousands of young people and graduates.
One year after the launch of the Talentum programme, over 300 students have benefited
BE MORE_FOR ENTREPRENEURS
Backing enterprises _Open Future is a global project open to participation by entrepreneurs, startups and investors from all over the world. The aim is to orient innovation towards the development of viable projects, through a model that makes talent visible and connects it with investors.
Action priorities Achievements Challenges
Wayra
More than 315 accelerated start-upsfrom a total of over 23,000 projects received from 2011. 14 academies are present in seven countries in Latin America (Brazil, Argentina, Colombia, Mexico, Peru, Chile and Venezuela); and in 14 countries in Europe: (Spain, United Kingdom, Germany, Ireland and the Czech Republic, grouping a total population of 108 millon.
Over 10,000 metres squared is for the acceleration of projects and innovation.
Over 23,000 ideas and projects were received, one an hour from Wayra's launch in 2011.
A portfolio with over 315 companies, grouped in 20 digital industries.
Nine out of every 10 start-ups have launched its products or are in in beta. 7 out of every 10 are already selling their services to customers and users
Three new announcements in 2015.
Talentum Startups
Talentum Schools
First class of graduates from the Talentum programme. From the 300 graduates, 75% of the young people who finished the programme are already working and 20% ofthem decided to create and start their own startup.
10 stores in 10 cities in Spain: 3,500 children and teenagers have been benefited on training workshops about coding apps, reality increased and robotics.
Recruiting in Telefónica over 14,000 employees under 30 before 2016.
40 staffs in 30 cities.
Think Big
Over 260 events with 55,000 yong people in six different countries.
Over 3,250 projects have been backed.
Over 5,000 volunteers from Telefónica collaborated with mentors, trainers or donors.
Inspire and empower young people from all social backgrounds to learn digital and entrepreneurial skills. To manage to get our projects to make a social impact and become sustainable and exchangeable companies.
Amérigo
Presence in four countries (Spain, Brazil, Colombia, Chile), through five funds.
Telefónica as main investor in each fund, along with other public and private institutional investors.
40 already invested companies, with added sales of 70M€.
200 M$ available to make new investments in start-ups in their phasegrowth.
Presence in sectors such as Big Data, security, cloud, gaming, education or digital advertising.
To get most of the digital products and services that participants' businesses offer to be incoporated into the Telefónica's commercial offer for its customers, giving it an element of innovation and differentiation.
‘Open Future’ is a global project and open to participation from entrepreneurs and startups
8180

Telefónica | Annual Report 2013 Telefónica | Annual Report 2013
4. Be More_Telefónica Integrated report 2013
from Talentum Startups, more than 200 startups have seen their technological solutions backed, over 50 new projects have been created, and all this with the support of 50 institutions:
Within the programme, a very poignant section 2013 were the Talentum Startups y Talentum Universities.
Talentum Startups ccreations, a programme for open innovation whose fundamental pillars involve young talen, technology and entrepreneurship. This programme is an important boost for the entrepreneur ecosystem, as the programme startups receive strong backing for their technological aspects, with, what they currently value most, technological resources.
Talentum Universities is a long-term grants programme that is an opportunity for young graduates, by means of practical training, to become familiar with the business reality, encouraging their integration into the jobs market.
Objectives (2000-2015). Also at the Campus Party in London, we organised the datathon Data for Social Good. On this occasion, participants had access to aggregated, anonymised data of flows of people in the London area, together with other data from the UK Open Data Institute. Participants could use this information to invent and create applications for the good of society. For instance, the risk to people who visit a certain area, arising from the closure of fire stations, was studied.
At the Campus Party in Sao Paulo, the competition Transforming Technologies Challenge stood out, as a way to support business ideas related to healthcare, education, volunteering, income generation, natural disasters and NGOs. From among all the projects, 10 were selected, which received a grant of up to 5,000 dollars to bring their idea to fruition.
Telefônica Vivo has also worked on the theme of Smart Cities at its hackathons (hacker marathons) during 2013, in 3 celebrations: Vivo Hackathon Intelligent Cities (at Campus Party Brazil 2013), Firefox OS Pernambuco for All (Campus Party Recife 2013) and Hackathon USP Cities. About 100 developers presented projects and 9 received prizes.
Campus Party was the ideal scenario to share initiatives like FI-WARE and hold a competition to develop FI-WARE app hackathons , at which major prizes were given to the winners. Participants were also given a presentation about Wayra and different startups were able to show off their successes and experiences.
WayraWayra is the accelerator of technology startups set up by Telefónica. In operation since 2011, it was created to seek out and nurture the best ideas and the best talents in the technology area. Through Wayra, we back the efforts and creativity of digital entrepreneurs, investing in a new venture somewhere in the world every three days on average since we began operations, and creating nearly three new jobs a day. For Telefónica, Wayra is the perfect environment to identify and help talent to be competitive in as short a time as possible. A large portion of these projects that Wayra accelerates focus on key strategy areas for business, ranging from
OTT applications and financial services to cloud computing.
. Within a short space of time of completing three years of operations, Wayra was already working with 14 academiesfor fully operating entrepreneurs in 12 countries. So, our presence in Argentina, Brazil, Colombia, Chile, the Czech Republic, Germany, Ireland, Mexico, Peru, Spain (Madrid and Barcelona), the UK and Venezuela, makes Wayra an accelerator with a truly global spirit. So far, Wayra has already accelerated over 315 companies during its operations, that is, one every three days on average. These companies are simultaneously drivers of employment and commercial activity, since they rapidly seek out technical resources and new professionals, like developers and specialists in design and user experience.
During 2013, Wayra has shown off the potential of the companies in its portfolio to hundreds of risk capital investors in over ten cities at various events. In November, its second international demoDay was held simultaneously in London and Sao Paulo, attended by over one hundred investors, business angels and outstanding entrepreneurs from Europe, Latin America and the USA. There, 16 startups representing nine countries had the chance to present their products and investment opportunities to points of reference in the international investment community.
As of 2013, Wayra recruits startups and entrepreneurs by a new system of competitions that is no longer on a per-country basis. Wayra will have three annual competitions that will offer, openly and simultaneously, places in the different academies to any entrepreneur in the world who wishes to propose their project. This new model arises from the need to match the rhythm and speed at which new technologies emerge –these days decentralised and from anywhere in the world– and to offer more tools so our academies can accelerate these projects with more agility and flexibility.
The funds committed by Telefónica to early stage companies accelerated by Wayra now exceed 12.6 million euros, while third-party funds (public or private funds and angel investors) have awarded financing of over 32.3 million euros.
With the help of its 'partners', Telefónica aspires to create a global 'hub' to promote talent and innovation
315projects accelerated by ‘Wayra’
200‘hackers’ supported by ‘Talentum Startups’
200startups supported by ‘Talentum’
55,000young people attracted by ‘Think Big’ events
Additionally, the MBA programme has been launched, focussed on professionals with several years' work experience, and aiming to attract the best talent with the profiles and capacities we need at a Digital Telco.
Campus PartyCampus Party is an event sponsored by Telefónica since 1999, which is recognised as the greatest online electronic entertainment event in the world, and at which the most brilliant young digital minds gather to innovate for Europe. In 2013 we sponsored meetings in Sao Paulo (Brazil), Boyacá (Colombia) and London (UK) so as to bring disruptive talent together and closer to Telefónica.
Among the activities of Campus Party in London, the H4SB took place. The objective of Hacking For Something Better (H4SB) is to help to build a better and more sustainable world thanks to the use of technology. Its inspiration arises out of the Sustainable Development Objectives (2015-2030) promoted by the United Nations which continue the work started by the Millennium
Talentum Startups Demo Day, 2013.
8382

Telefónica | Annual Report 2013 Telefónica | Annual Report 2013
4. Be More_Telefónica Integrated report 2013
Telefónica Ventures This corporate fund in operation since 2007 is a programme that takes place outside Telefónica to broaden our innovation capabilities.
This venture capital programme's objectives are aligned with those strategic priorities of the Company that cannot be addressed in other ways, accelerating our entry into innovative spaces of private individuals, and leveraging know-how to which there is no other effective access.
The strategy of the fund is to make investments in late stages of maturity, buying minority stakes in companies (from 5% to 10%). The mean value of the investment is 3 to 5 million dollars. Rights to influence the roadmap of the companies are acquired, as observers on the Boards of Directors of the startups..
The geographical scope is global, with special emphasis on the USA and Israel. Currently, there are holdings in 19 companies, with capital invested of 65 million euros.
AmérigoAmérigo is the international network of technological venture capital funds, that are part of Telefónica's efforts to boost technological innovation all over the world.
The Amérigo Funds are allocated to projects in their expansion phase. It has been in operation since July 2012. Each fund is managed by an independent expert manager, chosen following a selection process in each country, and who works completely autonomously, although with objectives aligned with the strategy of Telefónica.
The project was initially launched in four countries (Spain, Brazil, Chile and Colombia) and has five funds, so sowing the seeds of a global network of investment in innovation that boosts companies and their new digital services all over the world, especially in regions like Latin America that are not a main focus of attention for risk capital.
Currently, there are investments in 31 companies, and capital of over 200 million euros for new projects.
ChallengesNow, Telefónica wants to make another move, and share its strategy and model with other partners. So, we are launching Open Future, a programme that covers all the open innovation initiatives of the Group and makes them available to strategic partners, for development of specific programmes of assistance to entrepreneurs, jointly with these partners.
The programme envisages both public and private partners, and is structured through two tools:
A global open cloud platform, where all our initiatives and lots of resources for entrepreneurs can be found. The platform will function as a tool for capture and boosting of talent, creating a global community of entrepreneurs around our initiatives and those of our partners.
A network of crowdworking centres, associated to our Wayra academies and our Amérigo funds, which will be spaces for collaborative working for young entrepreeneurs, shared with our partners, where activities linked to Telefónica's
enterprise network will be developed, and where resources and networking will be at hand for the entrepreneurs.
With the help of our partners, Telefónica aspires to create a great global hub of open innovation, where talent and technological innovation are promoted.
The objectives Telefónica is pursuing with this project are several:
Through alliances with our partners we can reach more people, make our initiatives more global, generate more impact and multiply the intake of talent. With all this, our investment decisions will also be better, attracting the best projects and so being able to offer the best of the digital world to our clients.
On the other hand, Telefónica has the firm conviction that technological innovation and promoting talent are the best weapons for driving economic growth and employment in all markets. All the agents, among those Telefónica, that operate in this market, will benefit from this growth.
Telefónica has already committed to 12.6 M€ for companies accelerated by ‘Wayra’
Currently, ‘Amérigo’ has invested in 40 companies and has capital of more than EUR 200 million for new investments
Más informaciónen la web ‘Open Future’ de Telefónica.
8584

Telefónica | Annual Report 2013 Telefónica | Annual Report 2013
4. Be More_Telefónica Integrated report 2013
The Telefonica Group believes that it is a priority for its employees to be aware of the spirit and content of the Company’s Code of Ethics
Lines of progressAt Telefonica we know that corporate sustainability is a clear source of competition and progress: in markets, it reduces the risk premium; from a customer viewpoint, it increases the value of the brand and sets it apart; it helps make employees loyal, because it guarantees a stable image of the Company; and from society’s viewpoint, it guarantees legitimacy to operate and allow the sustainable development of the communities we operate in and get our resources from, and revenue is generated.
AchievementsEconomic impactTelefonica believes that it is a priority for our employees to be aware of the spirit and content of our Code of Ethics. Because of this, during 2013, our Business Principles were ratified in Costa Rica, the latest country we started operating in and we activated the mechanisms to ensure compliance. In December 2013, almost 71,000 professionals - 62% of the workforce - had passed the Business Principles course.
➜ Business Principles Office registered, through the Business Principles Compliance Channel, a total of 77 communications. From the 63 with closed investigation, 14 resulted in being deemed appropriate, one of them being for corruption and
none for discrimination. Among the measures adopted in these cases, three disciplinary dismissals were included.
➜ Suppliers’ sustainability: at Telefónica, we audit the sustainability principles of our suppliers’ performance. For prior knowledge, we use the Ecovadis platform, based on international standards and where there are currently 86 assessed suppliers and 36 undergoing assessment. In the whole relationship and afterwards, Allies, our Regional Programme in Latam is the largest of its kind in the region, and along with the Group’s Annual Audit Plan, we were able to carry out over 14,400 administrative audits and over 1,760 of Risk suppliers, where 757 improvement plans came out of it.
➜ Privacy policy: user privacy and confidence are crucial for Telefónica. In early 2013, the Company approved the Privacy Policy, which establishes guidelines which any Telefónica Group company must follow to protect our clients’ privacy and all the interest groups that entrust their personal data to Telefónica. This policy is built on three pillars: self-regulation which goes further than international and local laws; privacy as a driver for increasing confidence and strengthening Telefónica’s reputation; and privacy as a key element for encouraging innovation, well-being and prosperity in the Digital World.
BE MORE_ SUSTAINABLE
An intangible asset which guarantees Company legitimacy _At Telefonica we understand corporate sustainability in the same way as the Dow Jones Sustainability Index does. This means...
To facilitate the development and compliance of this Policy, a Privacy Committee for the Group has been created which is headed by the Chief Privacy Officer and formed by representatives of key areas of the Group, both in business and Security and Infrastructures. In order to guarantee that Telefónica local businesses are aligned, as well as the communication, and the suitability of actions at local level, a Data Privacy Officer role has been created in each country.
➜ Protection of minors: at Telefonica we are committed to promoting environments where children can use ICT avoiding misuses. In order to do this, in 2013, we made progress with product and service such as Familia Digital, along with the Forum of Interactive Generations to foster digital education and help parents and educators resolve the doubts they have about new technologies. We have also contributed to the implementation of hotlines such as Te Protejo in Colombia, and we
have made progress with the implementation of the commitments of the ICT coalition for a better use of the Internet by children.
Environmental impactWe have a global strategy for Green ICT and the Environment with three convergent objectives: to manage the environmental risks of our operations, to promote internal eco-efficiency and to make the most of business opportunities in order to provide integrated telecommunications services that promote a low carbon economy.
➜ Environmental management: we rely on an environmental policy and a global environmental management system which is applied to all of the Group’s companies. We promote a shared infrastructure - over 34,400 sites towards the end of 2013 - and the development of the technical assessments to reduce the visual impact of our
MaterialityAt Telefónica we wanted to go one step further in terms of our materiality matrix in order to identify those issues that are key to our business and our core stakeholders.
Thus, Telefónica has conducted a materiality analysis that has allowed us to understand the most significant material aspects for the Organization and which are highly relevant for the evaluations and decisions of stakeholders. Theresult is a more comprehensive overall matrix reflecting what matters are being reported and a specific matrix for each relevant material aspect. For such, the following process was conducted:
1. Identification of overall relevant issues
2. Identification of specific relevant issues
3. Identification of affected stakeholders
4. Evaluation of the impact on Management of the Company
5. Evaluation of the Relevance to interest groups.
Materiality Matrix
Impact on strategy
Transparency
Ethics & Compliance
Human Rights
Social inclusionAccessibility
Work practices
Diversity
Environmental management
Electromagnetic fields
Quality of the service
Privacy and freedom of expression
‘Green’ ICT Services
Energy and CO2Sustainability in the supply chain
Good use of the Internet by children
Inte
rest
gro
ups r
elev
ance
More informationon Telefonica’s ‘CR and sustainability’ website.
Low Medium High
Low
Med
ium
High
+
+
-
-
Member of World Index
Chosen for 12 years in a row
5th in the sector
Excellence Investment Register
5th out of 112 operators
8786

Telefónica | Annual Report 2013 Telefónica | Annual Report 2013
4. Be More_Telefónica Integrated report 2013
base stations. The waste that is generated by our technical and commercial operations is managed by qualified agents and in compliance with the environmental legislation. On average, the waste management processes generated, in 2013, revenues for the Company of around 40 million euros.
➜ Energy and CO2: we have made progress in the achievement of our corporate targets to reduce energy consumption and emissions: to reduce electricity use in the network by 30% by 2015 and 30% less in CO2 emissions by 2020; both by equivalent client access. Thanks to energy efficiency measures, electricity consumption in our network only grew 2% annually since the year 2010 and our CO2 emissions have basically remained stable in the last three years. In 2013, 16 global energy efficiency projects were carried out which reduced our bill by 47 million euros.
➜ Green Services to Customers: residential customers are provided with e-billing services (43.6 million end customers in 2013) or recycling and reuse services for unused mobile devices (231 tonnes of managed waste in 2013). In terms of corporate clients, we provide services that efficiently use resources such as Fleet Management, Inmotics for energy efficiency and Smart Metering, among others. In 2013, the British government awarded Telefonica 02 UK authorisation for connectivity management of the biggest Smart Metering programme in Europe, where it is expected to generate revenues of 1.8 billion Euros in the next 15 years. In 2013, the SmartSantander project led by Telefónica was successfully concluded as the largest Smart Cities platform in Europe with 20,000 sensors connected sensors to improve the sustainability of the Spanish city and to be a model of management at global level.
Social impact➜ Wayra UnLtd: in the UK, Wayra and UnLtd
(The Foundation for Social Entrepreneurs), a foundation which promotes social entrepreneurship, joined forces to set up Wayra UnLtd, in a bid to support innovative companies aiming to improve society. The objective of this new initiative was to develop 10 social companies by the end of 2013.
➜ Campus Party: as part of the Campus Party activities in London, Hacking For Something Better (H4SB) took place, aiming to bring together two types of social hackers: Social Challengers, that is, people familiar with and aware of social problems such as youth and unemployment, disabilities, active ageing and new forms of social participation and Social Makers (those who help us build solutions.
➜ Accessible products and services: during 2013 services were developed such as RADIO ME, which allows people to receive and send voice messages through a messenger app such as Whatsapp or Line through a familiar radio-like device and by simply pressing two buttons. It was thought up for the older generation, which is not so adept with new technologies. And Whatscine, a tool that allows the deaf and the blind to enjoy films through an accessibility system.
➜ M-Inclusion. M-Inclusion is a project which is co-funded by the European Commission and set up by a consortium led by Telefónica that in 2013 developed a road map in which the key elements were identified to make inclusion a reality through mobile solutions for users, developers and private and public bodies.
ChallengesThe aim of Telefonica’s Sustainability Policy is its integration into the DNA of all of its businesses. To do this, the Company has to move forward with sustainability management in the value chain. Furthermore, considering the fundamental character of issues such as data protection, it is important to spread and set up policies related to this. The Company also has to continue working in the development of accessible services, and on the realisation of Green ICT services which contribute to positioning the sector and Telefónica as a centre for climate change solutions.
The Company’s work for contributing to mitigation activities and adapting to climate change and the support of initiatives that will encourage competition in strategic cities and sectors of the economy through efficient communication networks and Green ICT solutions.
16 globalenergy efficiency projects with savings of 9.1 GWh and 4.7 M€
95%of the workforce will recieve Ethics and Compliance courses
40 M€in revenue for sale of waste
757improvement plans arising from audits
1,760risk supplier audits
Action priorities Achievements ChallengesEconomic
Ethics and compliance Over 60% of employees trained. New obligatory training actions on the Code of Ethics at global level
A single and global Business Principles Compliance Channel for all operations
95% of the workforce to be trained by the end of 2015
Global standards linked to ethical principles
Privacy Creation of the global Privacy Committee headed by the Chief Privacy Officer
Reinforcement of the commitment with participation from the Industry Dialogue Group for Privacy and Freedom of Expression
Definition and agreement of public commitment to privacy; construction of Privacy Center
Minors Development of products and services like Familia Digital, together with the Forum for Interactive Generations
Contribution to implementation of hotlines like Te Protejo
Adoption of Familia Digital portal in six countries Implementarion of internal regulations on minors for the operators, with the alert button on the web
Supply chain Over 14,400 administrative audits and over 1,760 in situ ones for potentially doubtful suppliers from which 757 plans for improvement emerged
Setting up of the EcoVadis tool in 150 risk suppliers; annual audit plan focussing on global suppliers
Social
Management of Diversity
Constitution of the European Diversity Committee First edition of the Women in Leadership programme: launch of the second edition in Europe and the first in Latin America.
Creation of the Global Work Group and setting-up of regional initiatives in the Group
Development and approval of Corporate Diversity Policy
Digital inclusion Connection of 70 isolated Amazonian communities with broadband internet services and 3G mobile technology
Creation of M-Inclusion road map
Creation of collaborations between agents and institutions in the public, private and third sectors, as a source of opportunities in social innovation
Social innovation Wayra Unltd.: Accelerator for projects seeking to improve society
Accessibility: development of Walker and Whatscine products
Launch of the third edition of the Ability Awards for 2014
Progress towards an accessible Digital Telco Presentation of the Ability Awards in 2015
Environment
Environmental management
Economic value assessment of electric and electronic waste, e-waste
34,000 sites shared minimising the environmental impact
Encourage customer e-waste programmes Implement environmental management systems in countries with high impact: Brazil and Chile
Energy and climate change
16 energy efficiency projects 4.7 million Euros in economic savings
Energy consumption target to achieve the 2015 reduction
Account for scope 3 emissions Increase the number of energy efficiency projects
Green ICT services Smart Metering in the United Kingdom Consolidation of the Smart Cities sustainability model
Increase the Green ICT services market Consolidation of Green ICT services standardization
8988

Telefónica | Annual Report 2013 Telefónica | Annual Report 2013
4. Be More_Telefónica Integrated report 2013
Innovation in 21st century skills is the educational innovation space where the most relevant experiences of new educational models for the century are demonstrated. It deals with learning methodologies that encourage 21st century skills, especially digital skills. This covers the projects that encourage the use of new forms of learning in society and digital education, and the training and collaboration environments of leading educators.
Learning Labs is a space belonging to the Telefónica Foundation where educational proposals that promote the acquisition of skills in the 21st century are developed and evaluated. This involves– the student body in its own learning process in an effective way–. It allows activities in the innovative classrooms and the work of the teachers to be monitored transparently, by assessing and quantifying the results obtained, in collaboration with academic agents external to the project. The ultimate aim is for any teacher to be able to adapt and adopt the new system in his/her own classroom. The project managed to successfully set up the El Tiempo and My mobile helping the community labs and turn them into activities that can be replicated in other educational centres.
During 2013, we trained 7,986 teachers through the Aulas Fundación Telefónica (AFT) - Telefonica Foundation Classrooms - and 14,537 teachers received extensive training in educational innovation (not AFT). Members of the general public who received training in digital culture numbered 50,820.
The latest report from the International Labour Organization (ILO), published in 2013, estimates that 168 million children in the world are involved in child labour, amounting to around 11% of all children.
Of this figure, nearly 18 million children are from Latin America and the Caribbean, more than 9.5 million of whom perform work considered as hazardous.
At the Telefónica Foundation we contribute via the Proniño program to the eradication of child labour in Latin America, supporting quality schooling using the support of technology.
We protect children and prepare future citizens for the digital society. In ten years we have assisted 471,848 children and teenagers and we have trained 1,932 people at NGOs to address these issues.
Digital Art and Culture creates, publicises and shares cultural and technological knowledge related to the content, languages, formats and channels of the digital society. Furthermore, we support knowledge through our publications and bring art exhibitions closer to different parts of society for educational purposes.
Among the most relevant projects that came out in 2013 were the World Press Photo 2013 exhibition in Chile; the Art and optics ; event The speed of communications, in Lima; the Technology Fair in Buenos Aires and numerous other debates and conferences related to economic and social aspects of the Digital Revolution we are experiencing (Cycle of Debates on Open Government, Empresa 2000 cycle, Digital Culture and SMEs, etc.).
In 2013, 29 exhibitions took place in the Telefonica Foundation Space and 18 other sites, and there were 282 events related to digital culture. In total, we have had almost 1.2 million attendees at our various exhibitions and events.
The Corporate Volunteer programme of Telefonica is an opportunity for our employees to turn solidarity initiatives into reality, in 27 countries. Telefónica Volunteers channels and promotes social action by the Group’s employees who want to contribute some of their resources, knowledge, time and enthusiasm to benefit the community and more disadvantaged groups.
The programme is managed by the Telefónica Foundation in collaboration with areas of Sustainability, Human Resources and Communication, and corporate as well as local level in different countries where the Telefónica Group is present.
In 2013, there were 26,614 active volunteers from Telefónica with a total of 195,906 hours of dedication.
In 2013, Telefónica allocated 129 million Euros to social action, according to the externally verified LBG standard methodology. The LBG Model is an innovative methodology which allows a measurement, management, evaluation and communication of the contributions, achievements and impact of social action in the Company that can be compared with other entities. From this 129 million euros, almost 72% corresponds to Telefónica Foundation projects. The Telefónica Foundation has been developing projects for social development and the creation of opportunities in Europe and Latin America for the last 15 years.
More informationon the Telefónica Foundation’s website.
BE MORE_ FOR SOCIETY
The Social Action and Telefónica Foundation_Social solidarity is one of the distinct roots of Telefónica which in 2013 allocated 129 million Euros to helping the most disadvantaged areas in the countries it has presence in
471,848 children and teenagers assisted
in 10 years
7,986 teachers trained at the AFT (Telefónica
Foundation Classrooms)
1.2 M attendees at exhibitions and events
26,614 active volunteers at Telefónica
Social action investment by Telefónica
Distribution by item Distribution by company
Foundation71.6%
Education and youth69.7%
Art and culture13.5%
Socioeconomic development7.8%
Social wellbeing8.3%
Environment 0.2% Others 0.5%
Rest of Telefónica28.4%
129 M€129 M€
Eradication of child labour
Education and learning
Digital Art and Culture Volunteering
23.99 M€ 26 M€ 10.12 M€ 3.55 M€
9190

Integrated answers to global challenges
5. Performance Indicators_

9594
Integrated indicator scoreboard _The main values of Telefonica in 2013, which show the triple scope of results and how the company understands Corporate Culture, are:
Financial indicators (data at 31 December, 2013)Economic efficiencyin millions of euros
2012 2013
RevenuesTotal of all income from product sales and services, financial and non-financial investment, and sales from tangible and intangible assets.
62,356 57,061
Supplier expenses Expenses for sales and other concepts to third parties 18,074 (17,041)
Added Value Operating margin: income - supplier expenses 44,282 40,020
Employee compensation Employee compensatipn expenses (includes, salaries, wages and social security contributions) 8,569 7,208
Gross operating profit OIBDA 21,231 19,077
Financial expenses Amount of interests accrued by external financing -3,659 -2,866
Owners' salary Approved shareholder dividends for the period - 2,182
Tax on profits Tax on profits -1,461 -1,311
Economic contribution to the community Contributions to the community (LGB) 158 129
Contributions to public administrations Total paymnets to public bodies (taxes, fees, VAT, Social Security, etc.) 13,806 14,060
R&D&I investment Total expeses and investment for R&D&I 5,771 6,142
Total investment Capex 9,458 9,395
Profitability Net profits after taxes 3,928 4,593
Indebtedness Net debt 51,259 45,381
Treasury stock Percentage of own shares in treasury stock 0.64% 1.05%
Environmental indicators (data at 31 December, 2013)Energy efficiency and climate change 2012 2013 units
Energy consumption* Direct renewable and non-renewable energy cosumption in operations, offices and car fleets. 23,117,501 23,934,022 GJ
Greenhouse gas emmissions (GHG)* Total direct and indirect GHG emissions in tonnes of CO2 equivalents. 1,824,520 1,889,465 t/CO2 eq
Eco-Eficiency and waste management
Water consumption Total water consumption in operations and offices 5,581,053 4,447,574 m³
Managed waste Managed waste in operations, offices and clientes, through recycling, reuse and landfill operations. 30,581 31,275 t
Reused waste Reused waste in operations and clients, following specific procedures 195 231 t
* Information during the specialized verification phase
Social indicators (data at 31 December, 2013)Human capital 2012 2013
Employees Number of employees with a contract at the end of the fiscal year 133,263 126,730
Employee gender diversity Number of women with a contract at the end of the fiscal year 50,507 48,513
Management positions Number of executives with a contract at the end of the fiscal year 1,234 1,255
Geneder diversity in management Number of women in executive positions with a contract at the end of the fiscal year 239 262
Employment stability Number of employees with an indefinite contract at the end of the fiscal year 124,134 118,937
Absenteeism Number of days lost due to absences during the period / Number of days worked by all employees during the same period ) x 200,000 5,569 6,105
Employee rotationEmployees who leave the organization The causes that lead to job desertion are dismissals, voluntary, retirement or death while on duty. All employees will be taken into account regardless of the type of contract in force.
21.77
Employee training Total training hours recieved by the employees during the fiscal year 3,912,000 2,859,751
Capital stock
Payment to suppliers Average pay period for suppliers in days 75 60
Corporate Governance indicators (data at 31 December, 2013)Good Corporate Governance 2012 2013
Directors Total number of directors 18 18
Independent directors Number of independent directors 7 8
Advisors on Corporate Social Responsibility (CSR) Number of independent directors specifically responsible for CSR matters 4 5
Executive Committee Number of directors specifically responsible for Company strategy. 9 5
Audit Committee Number of directors specifically responsible for economic and financial control 3 5
Appointment Committee Number of independent directors specifically responsible for appointments. 5 5
Board Meetings Number of Board meetings during the fiscal year 14 14
Gender diversity in the Board Number of female Board members 1 1
Telefónica | Annual Report 2013Telefónica | Annual Report 2013
5. Performance indicatorsTelefónica Integrated report 2013

2013 fiscal year results Risk Management policy
6. Appendices_

Telefónica | Annual Report 2013 Telefónica | Annual Report 201398 99
Telefónica Integrated report 2013 6. Appendices
“In 2013, Telefónica has advanced significantly...in its transformation process, achieving the targets set for the year; return to organic revenue growth, progressive margin stabilisation and improvement in financial flexibility compatible with the strengthening of the Company’s growth potential.
We will accelerate this transformation in 2014. Among our targets, we will continue accelerating revenue growth while generating synergies to advance in margin stabilisation. At the same time, we will increase investments to anticipate to the growing demand from the increasingly intensive data service usage, as well as the recovery of demand expected in some of our main markets.
As a result, Telefónica will reinforce the differentiation of its products and services through a non-replicable infrastructure. In 2014 Telefónica will double the fibre coverage in Spain to 7.1 million homes passed, reaching the highest coverage levels among the largest economies in Europe. In Brazil we
will also increase fibre coverage to 2.5 million homes. In the mobile business, we will expand 4G usage in Europe reaching an average coverage of more than 50%, while we continue leading the mobile data market in Latin America with the progressive launch of 4G.
This intensification in investments is compatible with our commitments to continue improving financial flexibility and to offer an attractive remuneration for our shareholders. Our targets for 2014 include an additional reduction of net debt, maintaining our dividend in €0.75 per share. For that purpose, we will continue executing our asset portfolio optimisation strategy, freeing non-strategic resources that will allow us to improve our positioning and growth potential in key markets, both inorganically and organically, through the increased investment in 2014.
In parallel and in order to accelerate growth, we have announced a deep organizational transformation. The
Digital revolution entails a huge opportunity and at the same time requires an evolution to take advantage of its full potential. Telefónica pioneered the movement towards a Digital world and now, we will accelerate this transformation. The new operating structure will enable us to reinforce our commercial and technological profile, as well as to increase our differentiation thanks to the modernisation of our infrastructures, targeting revenue growth acceleration and data monetization.
Telefónica has always been a reference in terms of efficiency, and technological revolution, the strengthening of our technologic positioning and infrastructures, is compatible with the increase in our efficiency. As a result, we are launching a new synergy plan to generate savings totalling 1.5 billion euros per year in the following years.
Overall, this new organisational structure implies one step further in the already defined strategy, being possible thanks
to the goals achieved, and allowing us to be; more agile in decision making, faster in the implementation of the strategy, more flexible in satisfying our client needs and more efficient in the use of our resources, maximising this way the returns offered by the Digital revolution.” Comments from César Alierta, Executive Chairman

Telefónica | Annual Report 2013 Telefónica | Annual Report 2013100
Telefónica Integrated report 2013 6. Appendices6. Appendices6. Informe Integrado 2013
Contents
1_
101 Financial highlights
104 Telefónica S.A.
104 Consolidated Results
109 Telefónica Digital
110 Telefónica Global Resources
114 Results by regional business units
114 Telefónica Latin America
116 Telefónica Brazil
118 Telefónica Argentina
120 Telefónica Chile
121 Telefónica Peru
123 Telefónica Colombia
124 Telefónica Mexico
125 Telefónica Venezuela and Central America
136 Telefónica Europe
138 Telefónica España
141 Telefónica UK
142 Telefónica Deutschland
143 Telefónica Czech Republic
152 Addenda
152 Key Holdings of Telefónica and its Subsidiaries
153 Changes to the Perimeter
2013 Financial year results 2_Risk Management policy
The financial information contained in this document has been prepared under International Financial Reporting Standards (IFRS), as adopted by the European Union, which do not differ for the purposes of the Telefónica Group, from IFRS as issued by the International Accounting Standards Board (IASB). This financial information is unaudited.
Telefónica’s management model, regional and integrated, means that the legal structure of the companies is not relevant for the release of Group financial information, and therefore, the operating results of each of these business units are presented independently, regardless of their legal structure. For the purpose of presenting information on a regional basis, revenue and expenses arising from invoicing among companies within Telefónica’s perimeter of consolidation for the use of the brand and management contracts have been excluded from the operating results for each Group region, while centrally-managed projects are included at the regional level. This breakdown of the results does not affect Telefónica’s consolidated earnings.
The English language translation of the consolidated financial statements originally issued in Spanish has been prepared solely for the convenience of English speaking readers. Despite all the efforts devoted to this translation, certain omissions or approximations may subsist. Telefónica, its representatives and employees decline all responsibility in this regard. In the event of a discrepancy, the Spanish-language version prevails.
Financial highlights➜ Organic revenue growth, in line with the return-to-growth target
for 2013.
➜ Revenues amounted to 57,061 million euros and increased 0.7% year-on-year in 2013 in organic terms (+2.3% year-on-year excluding the negative impact of regulation).
➜ Telefónica Latinoamérica (51% of revenues; +9.6% year-on-year) and mobile data revenues (+9.3%) remained as main growth drivers during the year, more than offsetting revenue pressure at T. Europa (-8.6%), impacted by regulation and a highly competitive environment.
➜ In the fourth quarter revenues posted positive growth for the third quarter in a row (+1.8% year-on-year organic).
➜ OIBDA stabilisation in 2013:
➜ OIBDA totalled 19,077 million euros and remained stable in organic terms compared with 2012, on the back of revenue growth, strict cost control and efficiencies reflecting the progress of the Company’s transformation strategy.
➜ OIBDA margin stood at 33.4% and posted a year-on-year erosion of 0.2 p.p. in organic terms, 1.1 p.p. lower than the decline posted in 2012, consistent with the target for 2013.
➜ In the fourth quarter, OIBDA continued posting a sequential year-on-year organic improvement trend, and grew 1.2% year-on-year (-0.3% in the third quarter; -0.7% in the second).
➜ Exchange rate evolution deducted 7.5 p.p. to year-on-year revenue and OIBDA growth in 2013. This evolution also reduced payments in euros related to CapEx, interests, taxes and minorities, offsetting almost two thirds of the negative impact of exchange rates on OIBDA and significantly mitigating their effect on cash flow generation.
➜ Solid free cash flow generation of 5,391 million euros in 2013, 6,890 million euros excluding spectrum payments.
➜ Free cash flow per share in the year reached 1.19 euros per share, allowing for an ample coverage of dividend commitments for 2013 (0.75 euros per share). The Company paid a dividend of 0.35 euros per share on November 6th and will pay the remaining 0.40 euros per share in cash in the second quarter of 2014.
➜ Enhanced financial flexibility and strengthened balance sheet, with a net financial debt reduction of 5,878 million euros in 2013:
➜ Net debt amounted to 45,381 million euros as of December, comfortably achieving the target of net debt below 47,000 million euros in 2013.
➜ Including post-closing events (disposal of T. Czech Republic, completed in January 2014, and T. Ireland), net debt stood at 42,325 million euros, bringing the debt ratio to 2.31x, and implying a net debt reduction of 15,985 million euros since June 2012.
➜ Net profit in 2013 amounted to 4,593 million euros (+16.9% year-on-year) and basic earnings per share totalled 1.01 euros (+15.6%), progressively improving throughout the year.
➜ CapEx (excluding spectrum)/sales organic ratio in 2013 (14.5%) was slightly higher than in 2012 (14.1%).
➜ Telefónica España showed a gradual business recovery in 2013. It should be highlighted the strong commercial momentum in the last quarter of the year, mainly in fibre and pay TV, with record quarterly net additions, and the slight improvement in the mobile contract segment. Total revenues fell 13.6% year-on-year in 2013 and 11.9% in the fourth quarter, with the year-on-year decline trend easing for the third quarter in a row. Profitability remained strong, reflecting the benefits and savings from the operational transformation, with an OIBDA margin of 48.9% at the end of the year (+3.3 percentage points year-on-year organic).
➜ Telefónica Brasil strengthened its competitive position in 2013 both in the mobile business, reinforcing its leadership in high-value segments, and in the fixed business, thanks to the new commercial proposition and the rollout of fibre. As a result, contract segment reached again record net additions in the fourth quarter (1.6 million accesses). Operating performance in the fixed business continued to improve in 2013, registering positive net additions across the board (traditional business, broadband and pay TV). Revenues maintained in 2013 a solid year-on-year growth of 3.7% in organic terms excluding the negative impact of regulation. The OIBDA margin stood at 32.3% up to December (-2.6 percentage points compared with 2012) as a result of the commercial focus on high-value customers.
More informationIn the ‘Shareholders and investors’ section of the corporate website.
154 Risk Management policy
101
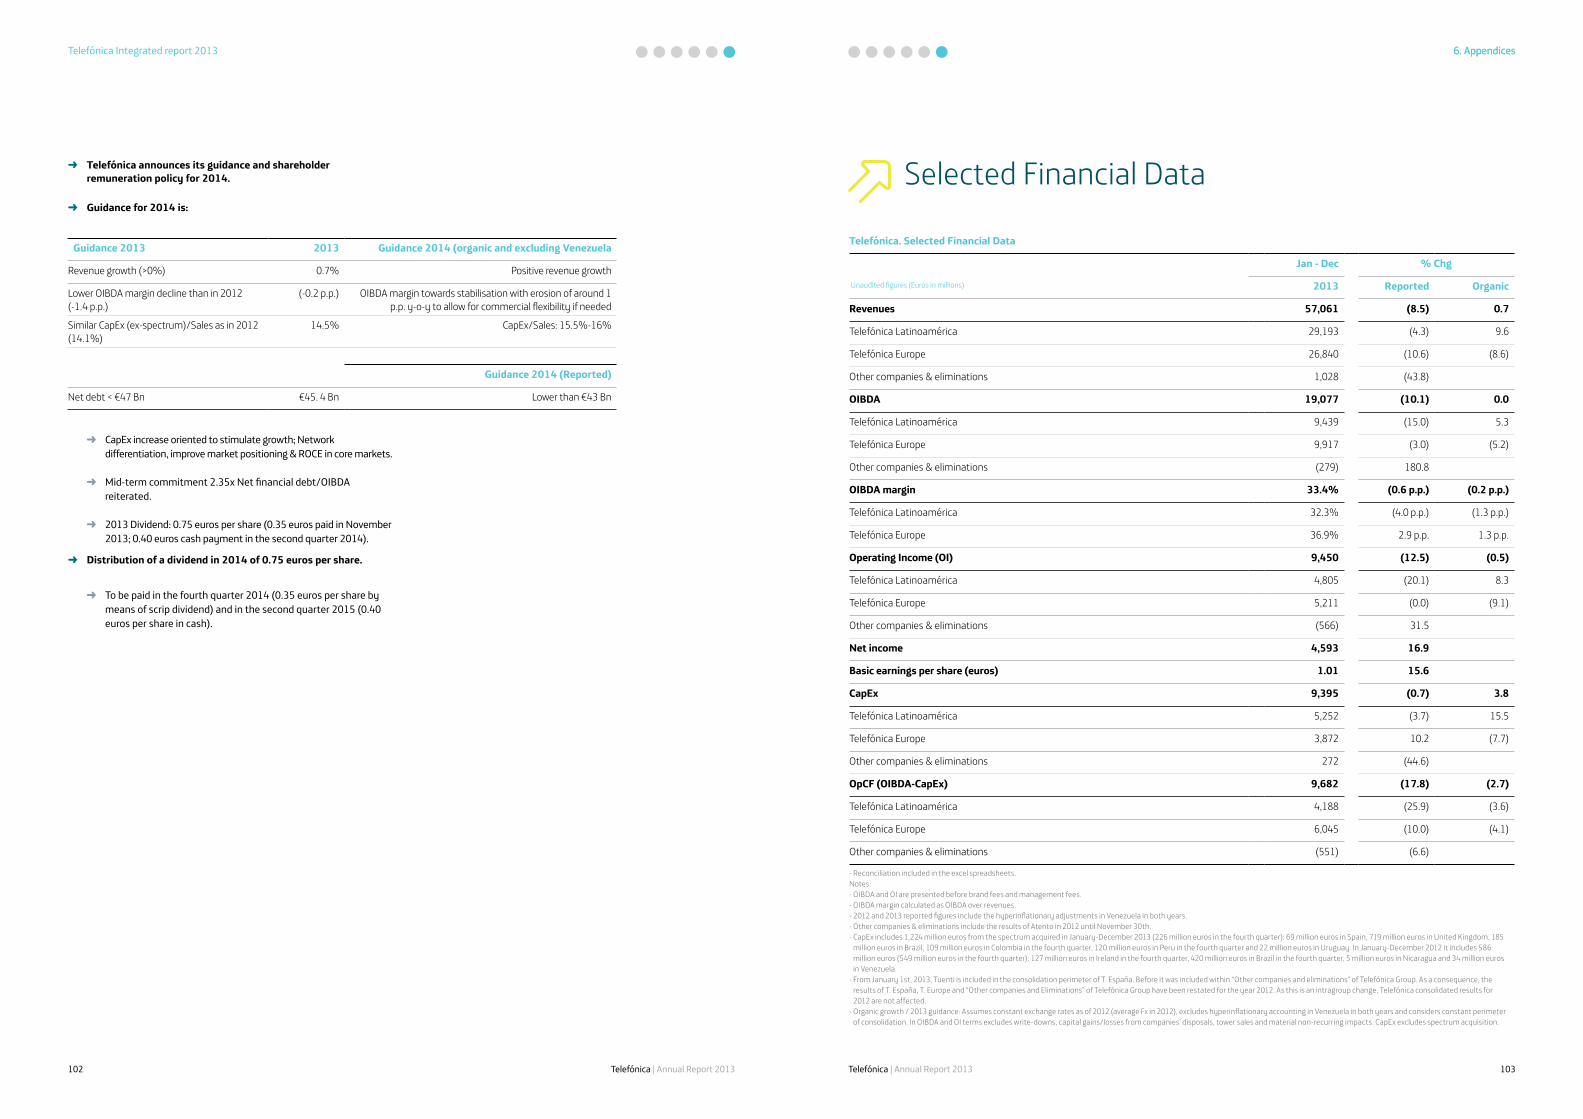
Telefónica | Annual Report 2013 Telefónica | Annual Report 2013
Telefónica Integrated report 2013 6. Appendices6. Appendices
➜ Telefónica announces its guidance and shareholder remuneration policy for 2014.
➜ Guidance for 2014 is:
➜ CapEx increase oriented to stimulate growth; Network differentiation, improve market positioning & ROCE in core markets.
➜ Mid-term commitment 2.35x Net financial debt/OIBDA reiterated.
➜ 2013 Dividend: 0.75 euros per share (0.35 euros paid in November 2013; 0.40 euros cash payment in the second quarter 2014).
➜ Distribution of a dividend in 2014 of 0.75 euros per share.
➜ To be paid in the fourth quarter 2014 (0.35 euros per share by means of scrip dividend) and in the second quarter 2015 (0.40 euros per share in cash).
Guidance 2013 2013 Guidance 2014 (organic and excluding Venezuela
Revenue growth (>0%) 0.7% Positive revenue growth
Lower OIBDA margin decline than in 2012 (-1.4 p.p.)
(-0.2 p.p.) OIBDA margin towards stabilisation with erosion of around 1 p.p. y-o-y to allow for commercial flexibility if needed
Similar CapEx (ex-spectrum)/Sales as in 2012 (14.1%)
14.5% CapEx/Sales: 15.5%-16%
Guidance 2014 (Reported)
Net debt < €47 Bn €45. 4 Bn Lower than €43 Bn
Selected Financial Data
Telefónica. Selected Financial Data
Jan - Dec % Chg
Unaudited figures (Euros in millions) 2013 Reported Organic
Revenues 57,061 (8.5) 0.7
Telefónica Latinoamérica 29,193 (4.3) 9.6
Telefónica Europe 26,840 (10.6) (8.6)
Other companies & eliminations 1,028 (43.8)
OIBDA 19,077 (10.1) 0.0
Telefónica Latinoamérica 9,439 (15.0) 5.3
Telefónica Europe 9,917 (3.0) (5.2)
Other companies & eliminations (279) 180.8
OIBDA margin 33.4% (0.6 p.p.) (0.2 p.p.)
Telefónica Latinoamérica 32.3% (4.0 p.p.) (1.3 p.p.)
Telefónica Europe 36.9% 2.9 p.p. 1.3 p.p.
Operating Income (OI) 9,450 (12.5) (0.5)
Telefónica Latinoamérica 4,805 (20.1) 8.3
Telefónica Europe 5,211 (0.0) (9.1)
Other companies & eliminations (566) 31.5
Net income 4,593 16.9
Basic earnings per share (euros) 1.01 15.6
CapEx 9,395 (0.7) 3.8
Telefónica Latinoamérica 5,252 (3.7) 15.5
Telefónica Europe 3,872 10.2 (7.7)
Other companies & eliminations 272 (44.6)
OpCF (OIBDA-CapEx) 9,682 (17.8) (2.7)
Telefónica Latinoamérica 4,188 (25.9) (3.6)
Telefónica Europe 6,045 (10.0) (4.1)
Other companies & eliminations (551) (6.6)
- Reconciliation included in the excel spreadsheets. Notes: - OIBDA and OI are presented before brand fees and management fees. - OIBDA margin calculated as OIBDA over revenues. - 2012 and 2013 reported figures include the hyperinflationary adjustments in Venezuela in both years. - Other companies & eliminations include the results of Atento in 2012 until November 30th. - CapEx includes 1,224 million euros from the spectrum acquired in January-December 2013 (226 million euros in the fourth quarter): 69 million euros in Spain, 719 million euros in United Kingdom, 185
million euros in Brazil, 109 million euros in Colombia in the fourth quarter, 120 million euros in Peru in the fourth quarter and 22 million euros in Uruguay. In January-December 2012 it includes 586 million euros (549 million euros in the fourth quarter): 127 million euros in Ireland in the fourth quarter, 420 million euros in Brazil in the fourth quarter, 5 million euros in Nicaragua and 34 million euros in Venezuela.
- From January 1st, 2013, Tuenti is included in the consolidation perimeter of T. España. Before it was included within “Other companies and eliminations” of Telefónica Group. As a consequence, the results of T. España, T. Europe and “Other companies and Eliminations” of Telefónica Group have been restated for the year 2012. As this is an intragroup change, Telefónica consolidated results for 2012 are not affected.
- Organic growth / 2013 guidance: Assumes constant exchange rates as of 2012 (average Fx in 2012), excludes hyperinflationary accounting in Venezuela in both years and considers constant perimeter of consolidation. In OIBDA and OI terms excludes write-downs, capital gains/losses from companies’ disposals, tower sales and material non-recurring impacts. CapEx excludes spectrum acquisition.
103102

Telefónica | Annual Report 2013 Telefónica | Annual Report 2013
Telefónica Integrated report 2013 6. Appendices
Telefónica S.A. _
Consolidated resultsIn 2013, in line with the transformation strategy started last year, Telefónica strengthened its commitment to a sustainable long-term growth model, reinforcing its competitive position in high value segments and markets, improving efficiency thanks to on-going simplification and cost reduction efforts, focusing investment on growth areas, proactively managing its portfolio and enhancing the Company’s financial flexibility.
Commercial momentum improved through a new offer, accelerating the recovery of Telefónica’s differential growth. Thus, revenues rose 0.7% in 2013 year-on-year in organic terms, with Latin America (+9.6%) and mobile data revenue (+9.3%) as main growth drivers, more than offsetting revenue pressure in Europe (-8.6%). This improved sales performance coupled with on-going efficiency gains and strict cost control, resulted in OIBDA stabilisation (0.0% year-on-year organic) and a 0.2 percentage point OIBDA margin erosion in organic terms, 1.1 percentage points lower than the margin erosion registered in 2012.
Financial flexibility enhancement was reflected in the on-going debt reduction reported in every quarter of the year (-5,878 million euros in 2013, representing 11% of net debt registered in December 2012), thanks to solid cash flow generation and active asset portfolio management aimed at strengthening the Company’s growth profile. Also, Telefónica continued the significant investment effort to ensure future growth, prioritising investment in the rollout of new generation networks and improving service quality and customer satisfaction, while at the same time the Company acquired spectrum in key markets and reached further network sharing agreements to optimise its resources.
Telefónica managed a total of 323.1 million accesses at the end of 2013, up 2% year-on-year, driven by contract mobile customers, in particular the mobile broadband segment, and pay TV accesses. It is worth to mention T. Latinoamérica (68% of the total) outstanding access performance, posting growth acceleration for the fourth quarter in a row to 4% year-on-year despite the more restrictive criteria for the basis of calculation of prepay customers. It is important to note that access evolution is impacted by the disposal of assets relating to the fixed consumer business in the United Kingdom.
➜ Mobile accesses stood at 254.7 million at the end of December and posted the highest year-on-year growth in the last four quarters (+3%), reflecting the increased commercial momentum at both T. Latinoamérica (quarterly net additions doubled the figure for the same period in 2012) and T. Europe (mainly associated with the Christmas campaign, with gross additions up 11% compared with the last quarter of 2012). Contract accesses rose by 9% to 89.2 million euros and now account for 35% of the total mobile customer base (+2 percentage points year-on-year), reflecting the focus on growing high-value customers. Once again, T. Latinoamérica accelerated year-on-year growth in the contract segment (+18% in December compared with +16% in September), posting a new annual record for net additions (7.0 million accesses in 2013; 1.6 times the figure reported last year).
➜ Mobile broadband accesses reached 72.8 million in December 2013 (+38% year-on-year) and now account for 29% of total mobile accesses (+7 percentage points year-on-year), driven by the strong smartphone performance. Thus, smartphone penetration stood at 27% (+8 percentage points year-on-year), posting net additions of 20.7 million (+35% year-on-year) and of 5.7 million in the quarter (+6% year-on-year), all of them with a data plan attached.
➜ Retail broadband accesses totalled 18.4 million, up 2% compared with December 2012 excluding the sale of assets related to the fixed consumer business in the United Kingdom, driven by a 7% growth at T. Latinoamérica and positive net additions at T. Europe for the first time since the fourth quarter of 2012.
➜ Pay TV accesses (3.6 million) rose 8% year-on-year, posting 266 thousand net additions in 2013 (161 thousand in the fourth quarter; 114 thousand in the third) a tenfold increase on the 2012 figure, fuelled by the intensification of commercial activity in the second half of the year mainly in Spain and Latin America (commercial repositioning in Brazil).
Atento Group results were deconsolidated from Telefónica Group as of the end of November 2012 (following the disposal of the Company during the fourth quarter of 2012), therefore affecting year-on-year comparisons of Telefónica’s reported financial results. The results of the disposed assets relating to the fixed consumer business in the United Kingdom are also excluded as from May 1, 2013.
In 2013 exchange rate fluctuations have negatively impacted main metrics year-on-year performance, mainly due to the devaluation of the Venezuelan bolivar and the depreciations of the Brazilian reais and the Argentine peso against the euro. Thus, exchange rates reduced both revenue and OIBDA year-on-year growth by 7.5 percentage points in 2013, and by 9.2 and 9.4 percentage points respectively in the last quarter. In the fourth quarter, the negative impact on revenue and OIBDA growth was lesser compared with the third quarter in 0.6 and 0.2 percentage points respectively, mainly due to the evolution of Brazilian reais and sterling pound.
It is important to note that exchange rate fluctuations also reduced payments in euros related to CapEx, interests, taxes and minorities, offsetting almost two thirds of the negative impact of exchange rates on OIBDA and significantly mitigating their effect on cash flow generation.
Moreover, changes in the perimeter of consolidation reduced revenue growth by 1.7 percentage points and OIBDA growth by 1.0 percentage point, though the impact eased in the fourth quarter both on revenues (-1.3 percentage points) and OIBDA (-0.7 percentage points), mainly as a result of the deconsolidation of the Atento group from end of November 2012.
Revenues totalled 57,061 million euros in 2013, with growth accelerating to 0.7% year-on-year in organic terms (-8.5% in reported terms) following a 1.8% year-on-year increase in the fourth quarter in organic terms (-8.9% in reported terms). Excluding the negative impact of regulation, organic revenues grew 2.3% compared with 2012 and 3.2% year-on-year in the fourth quarter.
Telefónica Latinoamérica remained the Group’s main growth driver, with revenues up 9.6% in organic terms compared with 2012 and by 10.3% compared with October-December 2012. Telefónica Digital also continued improving its organic growth (+19.4% year-on-year in the fourth quarter, +17.9% in the third quarter) taking into account both digital services, already included in the regions of T. Latinoamérica and T. Europe, and subsidiaries and other businesses
of T. Digital. Telefónica Europe’s organic revenues fell 8.6% year-on-year in 2013 (-7.9% in the fourth quarter).
Revenue structure reflected the Company’s strong diversification and thus, despite the abovementioned exchange rate impact, Telefónica Latinoamérica accounted for 51% of total revenues in 2013 (+2.2 percentage points compared with 2012), whilst revenues from European operations fell 1.1 percentage points year-on-year (47% of the total). Telefónica España’s contribution to consolidated revenues decreased 1.3 percentage points to less than 23% of the total.
By services, mobile data revenues continued as one of the Company’s main growth drivers in 2013 (+9.3% year-on-year in organic terms; +7.8% in the fourth quarter) and now account for 37% of mobile service revenues, +3 percentage points compared with 2012. Especially noteworthy is the strong growth in non-SMS data revenues (+22.2% in the year; +22.4% in the fourth quarter), which accounted for 64% of total data revenues in the year (+7 percentage points year-on-year).
Consolidated operating expenses amounted to 39,112 million euros, up 1.4% year-on-year in organic terms (-7.6% reported) mainly on the back of strong commercial momentum at T. Latinoamérica related to the strategic focus on capturing high-value customers. In the fourth quarter, year-on-year organic growth (+2.8%; -8.0% reported) slowed by 0.2 percentage points compared with the previous quarter, despite the intensification of commercial activity.
105104

Telefónica | Annual Report 2013 Telefónica | Annual Report 2013
Telefónica Integrated report 2013 6. Appendices
Breakdown by components:
➜ Supplies grew 2.0% year-on-year in organic terms (-5.7% reported) in 2013 mainly as a result of the increased commercial momentum at T. Latinoamérica both in the mobile segment, with an increase in the weighting of smartphone sales, and in the fixed business, mainly pay TV, which offset the decline in handset purchases in Europe and the lower interconnection costs at Group level. In the fourth quarter organic growth eased to 4.3% (+7.0% in the third quarter).
➜ Personnel costs increased 4.5% in organic terms compared with 2012 (-15.9% reported), reflecting the negative impact of inflation in some Latin American countries, despite the higher reduction registered at T. Europe (savings from restructuring programmes, mainly in Spain, Czech Republic and the United Kingdom). This item also reflected non-recurrent restructuring expenses amounting to 156 million euros in 2013 (52 million euros in the fourth quarter, primarily in Brazil) compared with 67 million euros in 2012 (42 million euros in the fourth quarter). Year-on-year organic growth in personnel costs slowed to 4.2% in the fourth quarter.
The average headcount in 2013 was 129,893 employees, 3.9% lower than the average in 2012 excluding the impact of the deconsolidation of Atento.
➜ Subcontract expenses fell 1.4% year-on-year in 2013 in organic terms (-4.9% reported) due to the reduction in commercial costs in Europe (mainly commercial, IT and network costs) thanks to the efficiency measures implemented, and despite the increased commercial activity and higher network costs at T. Latinoamérica. Subcontract expenses advanced by 0.3% year-on-year in organic terms in the fourth quarter (-6.7% reported).
Gains on sales of fixed assets in 2013 totalled 161 million euros (58 million euros in the fourth quarter) mainly associated with the sale of non-strategic towers in Latin America and Spain (111 million euros of impact on OIBDA in 2013; 71 million euros in the fourth quarter, mainly in Spain); the capital gain from the disposal of the assets relating to the fixed consumer business in the United Kingdom (83 million euros, mainly in the second quarter); the capital gain from the sale of assets in Germany (76 million euros in the fourth quarter); the capital gain from the sale of the stake in Hispasat (21 million euros in the second quarter); the value adjustment of Telefónica Ireland (-16 million euros in the second quarter); and the value adjustment of Telefónica Czech Republic (-176 million euros in 2013; -120 million euros in the fourth quarter).
In 2012 this item amounted to 782 million euros (493 million euros in the fourth quarter), mainly explained by the sale of non-strategic towers in Latin America and Spain with an impact on OIBDA of 643 million euros (354 million euros in the fourth quarter); the gain from
the sale of applications in the second quarter (39 million euros); the capital loss from the sale of the stake in China Unicom in the third quarter (-97 million euros); and the capital gains in the fourth quarter from the sale of the Atento group (61 million euros), of Rumbo (27 million euros) and the partial sale of Hispasat (26 million euros).
Impairment of goodwill and other assets amounted to -39 million euros, and included the value adjustment of certain assets of T. Digital for a total of -25 million euros. In 2012 this item amounted to -564 million euros, mainly explained by a value adjustment in relation to Telefónica Ireland amounting to -527 million euros.
Operating income before depreciation and amortisation (OIBDA) in 2013 amounted to 19,077 million euros, stable in organic terms compared with 2012 (-10.1% reported). In the fourth quarter, OIBDA grew 1.2% year-on-year in organic terms and continued the sequential year-on-year organic improvement (-0.3% in the third quarter; -0.7% in the second), resulting from steady revenue growth and on-going cost containment, along with efficiency improvements stemming from the operational transformation process. By region and in organic terms, T. Latinoamérica year-on-year OIBDA growth accelerated in the fourth quarter to 6.1% (+4.8% in the third quarter; +2.7% in the second) while T.Europe fell 6.4% year-on-year in the fourth quarter (-5.2% in 2013) in a context of increased commercial effort in the period.
The OIBDA margin stood at 33.4% at the end of 2013 and at 34.5% in the fourth quarter, both figures virtually stable year-on-year in organic terms (-0.2 percentage points in the year and in the fourth quarter).
Depreciation and amortisation totalled 9,627 million euros in 2013, up 0.6% year-on-year in organic terms (-7.7% reported) mainly due to higher depreciation on new spectrum, to accelerated amortization of MMDS TV assets in Brazil and to higher depreciable and amortisable assets in Venezuela, the United Kingdom and Argentina. In the fourth quarter depreciation and amortisation fell 3.6% year-on-year in organic terms (-16.8% reported). The total depreciation and amortisation charges arising from purchase price allocation processes amounted to 856 million euros in 2013 (-11.1% year-on-year).
Operating income (OI) in 2013 stood at 9,450 million euros, virtually unchanged year-on-year (-0.5% in organic terms; -12.5% reported), while in the fourth quarter, operating income growth accelerated to 5.5% year-on-year in organic terms (-0.9% reported).
Share of profit (loss) of investments accounted for by the equity method totalled -304 million euros in 2013 (-186 million euros in the fourth quarter) and it is mainly explained by Telco, S.p.A.’s adjustments of the value of its investment in Telecom Italia (-350 million euros). In 2012 losses amounted to 1,275 million euros (-789 million euros in the fourth quarter), with Telco, S.p.A.’s adjustments of the value of its investment in Telecom Italia and the recovery of all the operating synergies considered at the time of the investment, amounting to 1,355 million euros. It should be pointed out that these effects were non-cash impacts.
Net financial expenses amounted to 2,866 million euros in 2013, of which 111 million euros were due to net negative foreign exchange differences. Excluding this effect, net financial expenses fell 11.8% year-on-year, mainly due to a 11.4% reduction in the average debt.
The effective cost of debt over the last twelve months, excluding exchange rate differences was 5.34%, 3 b.p. lower than December 2012, with savings from management improvements over the gross cost of debt in euros offsetting the impact on the effective cost from the fact that most of the debt reduction has been in euros (with below-average costs).
Corporate income tax in 2013 stood at 1,311 million euros, implying an effective tax rate of 20.9%, 4.0 percentage points lower year-on-year. This is mainly due to the accounting in 2012 of tax assessments in Spain.
Profit attributable to minority interests reduced net income in 2013 by 376 million euros, down 20.7% year-on-year, mainly as a result of the lower profit attributed to minority interests in Brazil, affected by the exchange rate. In the fourth quarter this item grew 1.4%, mainly due to the higher profit attributed to minority interests in the Czech Republic and the impact of minority interests in Central America.
As a result, consolidated net income in 2013 totalled 4,593 million euros (+16.9% year-on-year; -8.1% underlying) and basic earnings per share amounted to 1.01 euros per share (+15.6% year-on-year; -9.0% underlying). In the fourth quarter of 2013, net income totalled 1,448 million euros and basic earnings per share stood at 0.31 euros, nearly tripling the figures registered in the same period of 2012. In underlying terms net income fell 7.1% and basic earnings per share fell 9.9%.
It is important to note that year-on-year comparisons are affected by extraordinary impacts including, in 2013 the Telco impairment (-245 million euros) and, in 2012 the Telco impairment (-949 million euros), the value adjustment of Telefónica Ireland (-513 million euros) and the provision of net financial assets in Venezuelan bolivars (-417 million euros).
CapEx in 2013 amounted to 9,395 million euros and included 1,224 million euros relating to the acquisition of spectrum, primarily in the United Kingdom, Brazil, Peru, Colombia, Spain and Uruguay (226 million euros in the fourth quarter, mainly in Peru and Colombia). In organic terms, investments rose 3.8% year-on-year (-0.7% reported) with nearly 68% of total investments devoted to business transformation and growth.
Thus, CapEx (excluding spectrum) to sales organic ratio stood at 14.5% in 2013, 0.4 percentage point higher than in 2012 mainly due to higher investments devoted to network quality improvements in Venezuela.
Operating cash flow (OIBDA-CapEx) totalled 9,682 million euros in 2013, down 2.7% year-on-year in organic terms (-17.8% reported).
Interest payments in 2013 stood at 2,415 million euros, down 15.8% year-on-year mainly due to the aforementioned 11.4% reduction in average debt and other one-off impacts.
Payment of taxes amounted to 1,806 million euros, down 10.8% year-on-year, affected by exchange rates and non-recurrent new Spanish tax measures, which over an income before taxes of 6,280 million euros implied a cash tax rate of 28.8% up to December.
Working capital made a positive contribution of 656 million euros to cash flow generation in 2013, thanks to the management measures implemented. 935 million euros were due to proceeds from asset sales and OIBDA monetisation, on the back of factoring deferred payments from handset sales, generating savings in VAT payments by anticipating savings from Corporate Income Tax, and managing collection and payment periods. Furthermore, the Company managed to equal CapEx (excluding licenses) payments to accruals, resulting in nil working capital from CapEx, despite the lower CapEx accrued in 2013 vs. 2012 (700 million euros). This impact was lessened due to the payment of 275 million euros for the acquisition of licenses, as payments were higher than accruals due to payments pending from the previous year. The strong working capital generation in the fourth quarter of 2013 (1,805 million euros) was driven by the seasonality of investments and the measures implemented in this period, with CapEx payments lower than accruals for a total of 1,219 million euros.
The positive contribution to annual cash generation was less than in 2012 (772 million euros), mainly due to the acquisition of licenses (with accruals 46 million euros lower than payments in 2012 vs. 275 million in 2013) and the lower activity (less supplier and client financing, and lower inventories, with a 2013 vs. 2012 differential of 112 million euros).
Operations with minority shareholders in 2013 totalled 604 million euros, 119 million euros more than in the same period of 2012 due to the payment of the Telefónica Deutschland dividend in the second quarter of 2013.
As a result, free cash flow amounted to 5,391 million euros in 2013 (6,951 million in 2012), including spectrum payments of 1,499 million euros (632 million in 2012). Excluding this impact, free cash flow totalled 6,890 million euros (-9.1% year-on-year).
Net financial debt was reduced by 5,878 million euros in 2013 to 45,381 million euros at year-end as a result of the Company’s focus on enhancing financial flexibility. Including post-closing events (disposal of T. Czech Republic, completed in January 2014, and of T. Ireland), net debt stood at 42,325 million euros.
107106

Telefónica | Annual Report 2013 Telefónica | Annual Report 2013
Telefónica Integrated report 2013 6. Appendices
Debt reduction in 2013 was mainly due to free cash flow generation before spectrum payments of 6,890 million euros, the placement of Undated Deeply Subordinated Securities in the amount of 2,466 million euros considered as equity instruments, the lower valuation in euros of net financial debt in foreign currencies for an amount of 1,041 million euros and other factors totalling an additional 314 million euros, mainly the decrease in the present value of obligations due to fixed rate derivative transactions. In contrast, factors that increased debt in 2013 include spectrum payments (1,499 million euros), the payment of labour commitments mainly associated with early retirements (789 million euros), the payment of dividends (1,588 million euros), the provision of net financial assets in Venezuelan bolivars (873 million euros) and financial investments (84 million euros).
The leverage ratio (net debt over OIBDA) for the past 12 months stood at 2.36 times at the end of December 2013. If aforementioned post-closing events were considered, the leverage ratio would stand at 2.31 times.
During 2013, Telefónica’s financing activity, has been intense through bond and loan markets executing operations for nearly 12,000 million equivalent euros. The financing activity was mainly focused on financing in advance debt maturing in 2014 and beyond, smoothing the debt maturity profile at the Holding level for the following years while strengthening liquidity position. Therefore, as of December the Company maintains a comfortable liquidity position to accommodate next debt maturities.
The main financing transactions of 2013 included:
➜ In January, Telefónica issued a 10-year bond in the euro market for an amount of 1,500 million euros.
➜ In February, a refinancing deal was signed with 23 banks relating to the tranche of the Vivo syndicated loan maturing in July 2014 for an amount totalling 1,400 million euros. 700 million euros have been extended to February 2017 and 700 million euros to February 2018.
➜ Also in February, two deals were signed to finance the purchase of equipment from Canadian and Swedish suppliers for 206 million euros and 1,001 million dollars, respectively.
➜ In March, the Company issued an 8-year bond for an amount of 1,000 million euros, linked to an exchange of two Telefónica bonds maturing in 2015 and 2016 for an amount of 605 million euros. Additionally, the company repurchased 204 million GBP of a bond maturing in January 2014.
➜ In April, the Company launched a US dollar-denominated bond for an amount of 2,000 million US dollars, distributed in two tranches: a 5-year tranche of 1,250 million US dollars and a 10-year tranche of 750 million US dollars.
➜ In May Telefónica issued a 6-year bond for an amount of 750 million euros.
➜ During August, the Company signed an agreement for an amount of 734 million US dollars to finance the acquisition of equipment from Finnish suppliers.
➜ In September, Telefonica Europe B.V. the Dutch subsidiary of Telefónica S.A., printed two issuances of Undated Deeply Subordinated Securities, with the subordinated guarantee of Telefónica, one of them for a nominal amount of 1,125 million euros subject to a call option exercisable by the Issuer from the fifth anniversary of the issuance date and the other for a nominal amount of 625 million euros subject to a call option exercisable by the Issuer from the eighth anniversary of the issuance date.
➜ In October, Telefonica issued a 7- year bond for an amount of 225 million Swiss francs.
➜ Finally, in November, Telefonica Europe B.V. printed its first Sterling pound Undated Deeply Subordinated Security with the subordinated guarantee of Telefónica, for a nominal amount of 600 million sterling pounds subject to a call option exercisable by the Issuer from the seventh anniversary of the issuance date.
After December 31st 2013, in February 2014, a syndicated revolving credit facility was signed with 26 banks amounting 3,000 million euros and maturing in February 2019.
Telefónica Deutschland, in November, launched its debut bond issuance for 600 million euros and 5 year tenor. After year 2013 closing, in February, Telefónica Deutschland issued a 7-year bond in the euro market for an amount of 500 million euros.
In Latin America, Telefónica’s subsidiaries tapped capital markets for an amount above 1,000 million equivalent euros in January-December 2013 period. Particularly noteworthy are:
In April, Telefonica Brazil issued a 5-year bond for an amount of 1,300 million Brazilian reais.
In October, Telefónica Brazil and Telefónica Moviles Chile printed an approximate aggregate amount of additional 300 million euros.
Telefónica S.A. and its holding companies have remained active under the various Commercial Paper Programmes (Domestic and European), with an outstanding balance of approximately 1,281 million euros at the end of December.
Telefónica maintains total undrawn committed credit lines for an amount close to 13,200 million euros, with around 11,830 million maturing in more than 12 months.
At the end of December 2013, bonds and commercial paper represented 69% of the consolidated gross financial debt breakdown, while debt with financial institutions represented 31%.
Telefónica Digital
Telefónica Digital continued to deliver on its priorities for 2013, building powerful propositions through partnerships and fostering digital products and services in several markets to gradually enhance year-on-year revenue trend (+19.4% year-on-year in organic terms in the fourth quarter; +17.9% in the third quarter). Along the year main highlights at T. Digital include the following:
➜ Telefónica launched its Global Video Platform, which allows the delivery of TV services across various networks to a wide range of devices. As a result, new advanced video features like video-on-demand OTT services are already available to fibre customers in Brazil and Spain.
➜ Telefónica demonstrated its strong position in M2M, with a portfolio that includes both M2M connectivity services and end-to-end products in different industries. Especially noteworthy is the significant success of in-house developments, as the “Smart M2M” Solution, which enabled the recent contract awarded in the UK (£1.5bn) to deliver smart meter communications services, representing the industry’s largest contract win to date.
➜ eHealth capabilities were bolstered through acquisitions in 2013, like Axismed in the first quarter, Brazil’s largest chronic care management company, to provide integrated eHealth services.
➜ Financial services also posted a strong delivery. As such, Telefónica established in Spain, jointly with Santander and Caixabank, the first JV in Europe to develop a new Financial Services proposal. Additionally, the Company launched “Zuum” in Brazil through a joint venture between Telefónica and Mastercard, giving unbanked people access to Financial Services through their mobile.
➜ Investments and global partnerships made by Telefónica Digital in 2013 included the equity stake in Rhapsody and the global partnerships signed with Pinterest and Evernote.
➜ In December “ElevenPaths”, a T. Digital company, launched “Latch” a revolutionary new Security service developed in-house, which allows consumers to remotely “switch their digital services on and off”, adding an additional layer of security to their digital identity.
➜ Telefónica made a strategic investment in Box, the leading Cloud collaboration and storage company, in December. Telefónica will work with Box as an investor and partner to bring the best possible cloud-based services.
➜ Telefónica continued driving innovation in its core communications services introducing along 2013 Firefox OS in new markets. Currently the Firefox OS handsets are available in Spain, Venezuela, Peru, Colombia, Uruguay, Brazil, Mexico and Chile. In 2014 they will be launched in eight new countries: Germany, Costa Rica, El Salvador, Guatemala, Nicaragua, Panama, Argentina and Ecuador.
109108

Telefónica | Annual Report 2013 Telefónica | Annual Report 2013
Telefónica Integrated report 2013 6. Appendices
Organic growth / 2013 guidance: Assumes constant exchange rates as of 2012 (average FX in 2012), excludes hyperinflationary accounting in Venezuela in both years and considers a constant perimeter of consolidation. In OIBDA and OI terms, excludes write-downs, capital gains/losses from the sale of companies, tower sales and material non-recurring impacts. CapEx also excludes spectrum acquisition.
Underlying growth: Considers constant perimeter of consolidation and excludes the impact on net profit of write-downs, capital gains/losses from companies’ disposals, tower sales, and material non-recurring impacts, as well as depreciation and amortisation charges arising from purchase price allocation processes.
Definitions
Telefónica Global Resources
In the fourth quarter of 2013, Telefónica Global Resources continued advancing in infrastructure transformation and in the execution simplification of projects in order to maximise efficiencies and scale benefits.
The Network and Operations global unit, to anticipate to the growing demand for data (network traffic grew 26% year-on-year in 2013), continued expanding ultra-broadband coverage and all IP. In terms of the fixed network, fibre investments accelerated, mainly in Spain and Brazil. As such, FTTH coverage in Spain grew significantly, with more than 3.5 million homes passed, while Brazil ended the year with 1.4 million homes passed.
In terms of the mobile network, there was an acceleration in the LTE rollout across all European markets (Spain, the UK and Germany) and in the main Latin American markets (Brazil, Mexico, Colombia, Peru and Chile). Additionally, the Company invested in the connection of mobile base stations to high-speed fixed networks to increase mobile network capacity. As such, the Company continued advancing in the mobile network transmission and around 60% of the mobile base stations are now connected with UBB, mainly in the areas with higher traffic volumes. In addition, in the main mobile-only markets, like the UK or Germany, the Company has reached agreements with the incumbent fixed operator to connect base stations with UBB.
Transformation of the Global IT unit is key to become a Digital Telco. Accordingly, from an IT infrastructure consolidation perspective, the Company closed six data centres in 2013 while at the same time created a benchmark global data centre in Spain. In addition, the simplification and transformation efforts put in place resulted into the switch-off of 1,150 applications and a 12% reduction in physical servers. This, together with a 7 percentage point increase in the volume of virtualised IT servers, will improve time-to-market and facilitate the process of integrating new products and digital services.
The global procurement unit continued creating value, capturing the benefits of the Group’s scale. In 2013 the new end-to-end sourcing model was consolidated, with significant quarter-on-quarter improvement. This translated into 60% of global procurement processes now executed under the end-to-end strategic sourcing model. The global procurement unit manages over 25 billion euros annually and has achieved savings of 7% on a volume of more than 13 billion euros executed by this unit in 2013.
Finally, the mobile devices unit, progressed in rebalancing the vendors and operating systems in 2013 thanks to the agreements reached with leading industry players, while at the same time accelerated smartphone penetration among our customers, leveraging the Group’s scale to obtain more competitive prices.
Accesses
Telefónica. Accesses
Unaudited figures (thousands) 2012 2013 % Chg
Final Clients Accesses 310,088.3 316,759.9 2.2
Fixed telephony accesses (1) (2) (3) 40,002.6 39,338.5 (1.7)
Internet and data accesses 19,402.6 19,102.0 (1.5)
Narrowband 653.2 510.8 (21.8)
Broadband (4) (5) 18,596.2 18,447.8 (0.8)
Other (6) 153.1 143.4 (6.3)
Mobile accesses (7) 247,346.9 254,717.2 3.0
Prepay (8) 165,821.9 165,557.0 (0.2)
Contract (2) (9) 81,525.0 89,160.3 9.4
Contract (2) (9) 3,336.2 3,602.2 8.0
Wholesale Accesses 5,731.3 6,358.5 10.9
Unbundled loops 3,308.8 3,833.4 15.9
Shared ULL 183.5 130.6 (28.9)
Full ULL 3,125.3 3.702.9 18.5
Wholesale ADSL 845.4 866.9 2.5
Other 1,577.1 1,658.2 5.1
Total Accesses 315,819.6 323,118.4 2.3
Telefónica. Mobile Accesses
Unaudited figures (thousands) 2012 2013 % Chg
Prepay percentage (%) 67.0% 65.0% (2.0 p.p.)
Contract percentage (%) 33.0% 35.0% 2.0 p.p.
MBB accesses (‘000) 52,774.9 72,844.0 38.0%
MBB penetration (%) 21% 29% 7.3 p.p.
Smartphone penetration (%) 19% 27% 8.2 p.p.
Notes:- Telefónica España mobile accesses include since 2013 the accesses of Tuenti and in 2012 they have been restated with the same criteria.(1) PSTN (including Public Use Telephony) x1; ISDN Basic access x1; ISDN Primary access; 2/6 Access x30. Company’s accesses for internal use and total fixed wireless included. Includes VoIP and Naked ADSL.(2) Fixed telephony accesses include the reclassification in the fourth quarter of 2012 in Argentina of 157 thousand “fixed wireless” accesses previously recognized as mobile accesses of the contract segment.(3) In the second quarter of 2013, 209 thousand accesses were disconnected due to the disposal of the assets of the fixed business in UK.(4) ADSL, satellite, optical fiber, cable modem and broadband circuits. (5) In the second quarter of 2013, 511 thousand accesses were disconnected due to the disposal of the assets of the fixed business in UK. (6) Retail circuits other than broadband.(7) First quarter of 2012 includes the disconnection of 2.0 million inactive accesses in Spain and first quarter of 2013 includes the disconnection of 114 thousand inactive accesses in Czech Republic.(8) First quarter of 2012 includes the disconnection of 1.2 million inactive accesses in Spain. Second quarter of 2012 includes the disconnection of 1.6 million inactive accesses in Brazil.(9) First quarter of 2012 includes the disconnection of 800 thousand inactive accesses in Spain. First quarter of 2013 includes the disconnection of 114 thousand inactive accesses in Czech Republic.
111110

Telefónica | Annual Report 2013 Telefónica | Annual Report 2013
Telefónica Integrated report 2013 6. Appendices
Consolidated Income Statement
Guidance 2013
Telefónica. Consolidated Income Statement
Jan - Dec % VariaciónUnaudited figures (Euros in millions) 2013 2012 Reportado OrgánicoRevenues 57.061 62.356 (8,5) 0,7 Operating expenses 794 822 (3.5) (0.2) Gastos por operaciones (39,112) (42,343) (7.6) 1.4
Supplies (17,041) (18,074) (5.7) 2.0 Personnel expenses (7,208) (8,569) (15.9) 4.5 Subcontracts (12,827) (13,487) (4.9) (1.4) Bad debt provisions (701) (777) (9.8) (3.4) Taxes (1,335) (1,436) (7.0) 7.5
Other net operating income (expense) 212 177 19.7 50.5 Gain (loss) on sale of fixed assets 161 782 (79.4) 49.8 Impairment of goodwill and other assets (39) (564) (93,0) 8,0 Operating income before D&A (OIBDA) 19,077 21,231 (10.1) 0.0 OIBDA Margin 33.4% 34.0% (0.6 p.p.) (0.2 p.p.) Depreciation and amortization (9,627) (10,433) (7.7) 0.6 Operating income (OI) 9,450 10,798 (12.5) (0.5) Profit from associated companies (304) (1,275) (76.2) Net financial income (expense) (2,866) (3,659) (21.7) Income before taxes 6,280 5,864 7.1 Income taxes (1,311) (1,461) (10.3) Income from continuing operations 4,969 4,403 12.9 Non-controlling interests (376) (475) (20.7) Net income 4,593 3,928 16.9 Weighted average number of ordinary shares outstanding during the period (millions)
4,520 4,496 0.5
Basic earnings per share (euros) 1.01 0.87 15.6 Notes:- Basic earnings per share amounts are calculated by dividing net profit for the period attributable to ordinary equity holders of the parent, adjusted for the net coupon corresponding to “Other equity
instruments”, by the weighted average number of ordinary shares outstanding during the period.- For the basic earnings per share calculation purposes, the weighted average number of ordinary shares outstanding during the period have been obtained applying IAS rule 33 “Earnings per share”.
Thereby, the weighted average number of shares held as treasury stock during the period has not been taken into account as outstanding shares.- 2012 and 2013 reported figures include the hyperinflationary adjustments in Venezuela in both years.- 2012 reported figures include the results of Atento until November 30th.
Telefónica. Guidance 2013
2013
Unaudited figures (Euros in millions) Jan-March Jan-Jun Jan-Sep Jan-Dec Guidance 2013 Base 2012
Growth in revenues -1.6% -0.5% 0.4% 0.7% Growth in revenues 61,089OIBDA Margin growth 0.5 p.p. 0.0 p.p. (0.2 p.p.) (0.2 p.p.) Lower decrease than 2012 (1.4 p.p.)CapEx / Revenues 8.8% 10.7% 11.9% 14.5% CapEx / Revenues similar to 2012 14.1%Net Fiancnial Debt 51,809 49,793 46,101 45,381 Net financial debt < 47.000 51,259Guidance criteria 2014: 2014 guidance assumes constant exchange rates as of 2013 (average FX in 2013), excludes Venezuela in both years and considers constant perimeter of consolidation. OIBDA level guidance for 2014 excludes write-offs, capital gains/losses from companies’ disposals, towers sales and other significant exceptionals such as restructuring costs, etc. CapEx excludes spectrum acquisition. 2013 adjusted bases exclude: Telefónica Venezuela, Homogeneous perimeter: Group Telefónica Czech Republic (excluding results from January-December 2013); Telefónica Ireland (excluding results from July-December 2013), Tower sales, Capital gains/losses from companies’ disposals: Capital gains from the sale of Hispasat and Telefónica Móviles Aplicaciones y Soluciones. Value adjustments of Telefónica Ireland and Telefónica Czech Republic 2013 Bases for 2014 targets: – Revenues: 51,580 million euros. – OIBDA margin: 32.5%. – CapEx/Sales: 14.2%.
Consolidated Statement of Financial PositionTelefónica. Consolidated Statement of Financial Position
Unaudited figures (Euros in millions) December 2013 December 2012 % Var
Non-current assets 89,597 104,177 (14.0)
Intangible assets 18,548 22,078 (16.0)
Goodwill 23,434 27,963 (16.2)
Property, plant and equipment 31,038 35,019 (11.4)
Investment properties 2 2 8.8
Investments accounted for by the equity method 2,424 2,468 (1.7)
Non-current financial assets 7,775 9,339 (16.7)
Deferred tax assets 6,376 7,308 (12.8)
Current assets 29,265 25,596 14.3
Inventories 985 1,188 (17.1)
Trade and other receivables 9,640 10,711 (10.0)
Current financial assets 2,117 1,872 13.1
Tax receivables 1,664 1,828 (9.0)
Cash and cash equivalents 9,977 9,847 1.3
Non-current assets classified as held for sale 4,882 150 n.s.
Total Assets = Total Equity and Liabilities 118,862 129,773 (8.4)
Equity 27,482 27,661 (0.6)
Equity attributable to equity holders of the parent and to other
holders of equity instruments
21,185 20,461 3.5
Non-controlling interests 6,297 7,200 (12.5)
Non-current liabilities 62,236 70,601 (11.8)
Non-current interest-bearing debt 51,172 56,608 (9.6)
Non-current trade and other payables 1,701 2,141 (20.5)
Deferred tax liabilities 3,063 4.788 (36.0)
Non-current provisions 6,300 7,064 (10.8)
Current liabilities 29,144 31,511 (7.5)
Current interest-bearing debt 9,527 10,245 (7.0)
Current trade and other payables 15,221 17,089 (10.9)
Current tax payables 2,203 2,522 (12.6)
Current provisions 1,271 1,651 (23.0)
Liabilities associated with non-current assets held for sale 922 4 n.s
Financial Data
Net Financial Debt (1) 45,381 51,259 (11.5)
Notes:- 2012 figures have been grouped following the format of the consolidated annual accounts. Main changes are: the breakdown within assets of “Property, plant and equipment and investment
properties” and “Non-current financial assets and investments accounted for by the equity method” in different lines, and within total equity and liabilities the item “Current Other Payables” has been included in “Current trade and other payables”, to report separately the amount that corresponds to “Current provisions”.”
- 2012 and 2013 reported figures include the hyperinflationary adjustments in Venezuela in both years. (1) Figures in million euros. Net financial debt in December 2013 includes: Non current interest-bearing debt + Non-current trade and other payables (1,145) + Current interest-bearing debt + current trade
and other payables (99) - non-current financial assets (4,468) - current financial assets - cash and cash equivalents.
113112

Telefónica | Annual Report 2013 Telefónica | Annual Report 2013
Telefónica Integrated report 2013 6. Appendices
In 2013 Telefónica Latinoamérica strengthened its competitive positioning in higher value segments, consolidating its focus on a sustainable long-term growth.
Noteworthy achievements in 2013 include a new record high in capturing contract customers (7.0 million net additions), which is underpinning the acceleration in smartphone penetration (22%; +9 percentage points year-on-year). This focus on quality is reflected in the steady acceleration in year-on-year revenue growth in organic terms.
The fourth quarter provided further confirmation of the intensity of commercial activity, both at the mobile business, where the volume of net contract additions in the third quarter was maintained (high-ever record for the Company); and at the fixed business, where the clear improvement in the trend of all services in the second half of the year was consolidated.
Thus, at the end of 2013 Telefónica Latinoamérica managed 221.1 million accesses, up 4% year-on-year, despite the application of more restrictive reporting criteria in the prepay segment.
The main trends in the mobile business include the following:
➜ Estimated penetration in Latin America at the end of December 2013 was 118% (+3 percentage points year-on-year).
➜ Mobile accesses reached 184.5 million (+4% year-on-year), with notable growth in accesses in the contract segment (+18%) and despite the impact of the application of more restrictive reporting criteria for the prepay segment (+1%). Thus, contract accesses now represent 25% (+3 percentage points year-on-year) of total mobile accesses, further strengthening the Company’s leadership in the region, after reaching 46.4 million accesses.
➜ Moreover, the sharp increase in the contract segment is the main driver of mobile broadband accesses growth, which advanced
by 60% year-on-year to 43.6 million. Smartphones with data attached plans remained the key driver of this growth, rising by 75% year-on-year to represent 22% of mobile accesses (+9 percentage points).
➜ Net additions reached 2.8 million accesses in the fourth quarter (7.9 million in 2013), boosted by net additions in the contract segment, reaching 2.0 million accesses in the fourth quarter (+60% year-on-year) for a new record of 7.0 million accesses in the year (+64% year-on-year).
➜ Churn stood at 3.5% in the quarter (stable year-on-year) and at 3.4% in 2013 (+0.2 percentage points), affected by the application of more restrictive reporting criteria for prepay customers. On the other hand, contract churn stood at 1.5% in the quarter and at 1.6% in 2013, down significantly year-on-year (-0.3 percentage points and -0.2 percentage points respectively).
➜ Traffic grew by 12% year-on-year in the fourth quarter and by 9% in the year (in homogenous terms after eliminating duplicated traffic following the integration of fixed and mobile businesses in Brazil), with all the countries in the region posted year on year growth in 2013.
➜ ARPU continued posting a solid year-on-year growth (+5.7% in 2013; +5.4% in the quarter), despite the reduction of mobile termination rates. Thus, outgoing ARPU posted year-on-year growth of 8.4% (+8.5% in the fourth quarter), driven by the consistent acceleration in non-SMS data and the growth in voice traffic.
Highlights in the fixed business include:
➜ Total accesses reached 36.6 million in December 2013, up 3% year-on-year.
➜ Traditional business accesses stood at 24.5 million, up 2%
Results of Business Units
Telefónica Latinoamérica(1) _
(1) Organic growth: In financial terms, it assumes constant average exchange rates as of January-December 2012, and excludes hyperinflation accounting in Venezuela. At OIBDA level, it excludes the sale of towers and the impact of the contractual change for new contract additions in Chile. CapEx excludes spectrum investments.
year-on-year, reflecting the acceleration in the capture of new accesses in the quarter, with net additions of 144 thousand accesses (373 thousand in 2013).
➜ Retail broadband accesses posted solid 7% year-on-year growth, reaching 9.0 million accesses, with net additions of 98 thousand accesses in the quarter (596 thousand in the year). Thus, broadband accesses accounted for 37% of traditional business accesses, increasing 2 percentage points year-on-year.
➜ Pay TV accesses reached 2.8 million, up 14% year-on-year, with net additions of 131 thousand accesses in the quarter (347 thousand in the year), as the acceleration of commercial activity that started in the third quarter was maintained. Thus, net additions in the second half of 2013 were 2.5 times higher year-on-year, mainly as a result of the commercial repositioning in Brazil.
Revenues amounted to 29,193 million euros in 2013, up 9.6% year-on-year in organic terms (+10.3% in the quarter), with growth far outstripping the rate of increase in accesses (+4%). This reflects the strategic focus on capturing and retaining high-value customers, with especially noteworthy year-on-year growth acceleration in the quarter in Peru, Colombia, Mexico, Central America and Argentina.
The reduction in mobile termination rates dragged year-on-year growth by 1.1 percentage point in 2013 and by 0.9 percentage point in the quarter. It is also worth noting that the year-on-year comparison in reported terms (-4.3% in the year; -6.7% in the quarter) was negatively impacted by the exchange rate depreciations mainly in Brazil and Argentina and the devaluation in Venezuela in February 2013.
➜ Revenue growth was underpinned by the strong growth in mobile service revenues, which advanced by 11.8% year-on-year in organic terms in 2013 (+12.7% in the fourth quarter) boosted by the growing contribution of data revenues, which rose by 20.7% year-on-year in 2013 and by 18.1% in the fourth quarter and accounted for 32% of mobile service revenues in the year (+2 percentage points year-on-year).
This growth was driven by the explosion of data in the region, reflected in a 37.8% rise in 2013 in non-SMS data revenues (+40.1%
in the fourth quarter), which increased their contribution to data revenues to 68% in the quarter (+11 percentage points year-on-year). Moreover, voice revenues posted solid growth (+8.4% year-on-year in 2013; +10.2% in the quarter) thanks to the sharp increase in traffic and despite the negative impact of regulation.
➜ Handset revenues advanced by 44.5% in 2013, with year-on-year growth slowing to 25.5% in the fourth quarter, despite the continued strength of commercial activity, mainly due to the lower contribution to growth of Brazil, Venezuela and Chile.
➜ Fixed business revenues remained stable in the year (-0.1% year-on-year), with a clear improvement in the year-on-year evolution in the fourth quarter (+3.0%), with all countries contributing to this acceleration.
Operating expenses amounted to 20,011 million euros in 2013 (+11.4% year-on-year in organic terms; +12.3% in the fourth quarter):
➜ Supplies reached 8,104 million euros, +17.7% year-on-year in organic terms (+19.7% in the quarter). This growth reflects an increased commercial activity both in the mobile business, with a higher weight of smartphone sales; and in the fixed business, with higher content costs associated to the strong rise in pay TV accesses; and increased expenses associated with the provision of data services. On the other hand, this growth is partly offset by the lower costs resulting from the reduction in termination rates.
➜ Subcontract expenses amounted to 7,712 million euros, up 5.9% year-on-year in organic terms (+8.3% year-on-year in the fourth quarter) due to the widespread increase in prices in some countries of the region, the higher sales commissions and customer service expenses associated with increased commercial activity, and higher network costs, impacted by the growth in mobile data and the larger number of leased sites.
➜ Personnel expenses amounted to 2,840 million euros, up 12.4% year-on-year in organic terms, with the pace of growth easing in the quarter (+9.1%) despite the negative impact of workforce restructuring and incentivised redundancy programmes carried out (negative impact of 69 million euros in 2013, of which 34 million euros were recorded in the fourth quarter, compared with 54 million euros in the first quarter.
115114

Telefónica | Annual Report 2013 Telefónica | Annual Report 2013
Telefónica Integrated report 2013 6. Appendices
Thus, OIBDA totalled 9,439 million euros in 2013, up 5.3% year-on-year in organic terms, with growth accelerating in the quarter (+6.1%) despite the strong increase in commercial activity was maintained throughout the year.
In reported terms, the year-on-year change (-15.0% in 2013; -20.3% in the fourth quarter) reflected the negative impact of the abovementioned fluctuation in exchange rates and the sale of non-strategic towers (40 million euros in 2013, virtually all reported in the first nine months of the year; 583 million euros in 2012, of which 338 million euros were recorded in the fourth quarter of 2012).
The OIBDA margin stood at 32.3% in 2013 and at 34.4% in the fourth quarter, down 1.3 percentage points and 1.4 percentage points year-on-year respectively in organic terms, mainly as a result of the higher commercial intensity.
CapEx amounted to 5,252 million euros in 2013, up 15.5% in organic terms, reflecting the significant investment efforts in the region in order to continue increasing differentiation in terms of innovation and service quality. It should also be noted that the year-on-year change in organic terms excludes the spectrum acquisition, which amounted to 436 million euros in 2013 (120 million in Peru and 109 million in Colombia, both recorded in the fourth quarter; 185 million in Brazil in the second and third quarters; and 22 million in Uruguay in the first quarter). In addition, in 2012 a total of 459 million euros were recorded (420 million in Brazil in the fourth quarter; 34 million in Venezuela and 0.4 million in Chile in the third quarter; and 5 million in Nicaragua in the first quarter).
Thus, operating cash flow stood at 4,188 million euros in 2013, down 3.6% year-on-year in organic terms.
Telefónica Brasil (year-on-year changes in organic terms)
Telefónica Brasil strengthened its competitive position in the market throughout 2013; reinforcing its leadership in high value segments of the mobile business through on-going service innovation and differential coverage and network quality; and in the fixed business through a renewed commercial offer and the deployment of the fibre network.
Thus, it should be highlighted that in the fourth quarter the Company launched new value-added services at the mobile business as “Vivo Música”, “Vivo Sync” or “Vivo Mobile”, while at the same time continued to boost “Multivivo”, a product which allows data and/or voice to be shared between several devices and that already had 1.4 million users. Meanwhile, the Company also continued with the rollout of the 4G network, which now covers 73 cities, maintaining its leadership in this technology with a 41.1% of market share.
At the same time, the Company also reached agreements to provide wholesale voice and data services with Nextel and Virgin, with the aim of increasing assets efficiency, progressing towards a more efficient and faster network deployment model, along with a healthier competitive dynamic.
In the fixed business, it is worth noting the fibre rollout in Sao Paulo, which reached 1.4 million households passed at the end of 2013, and the development of the Fixed Wireless technology, which enables fixed services to be offered in areas where the copper network has not been rolled out. Thus, with the aim of strengthening the portfolio and broadband services, “Vivo Internet Box” was relaunched, providing mobile internet associated with a WiFi modem with a capacity of up to 40 GB.
On the other hand, on 1 July 2013 final approval was secured for the reorganisation process entailing the integration of all companies into Telefónica Brasil (except Telefónica Data).
As a result, Telefónica managed 92.7 million accesses in Brazil at the end of 2013 (+2% year-on-year) despite the more restrictive reporting criteria for prepay customers.
Mobile business performance highlights:
➜ Penetration in Brazil increased to 137% (+4 percentage points year-on-year).
➜ Market share to December stood at 28.5% (-0.6 percentage points year-on-year; stable in the quarter). The Company further strengthened its leadership in the contract segment once again in the quarter, achieving a market share of 39.8% in December (+2.9 percentage points compared with 2012, +0.9 percentage points vs. the previous quarter), after capturing 60.0% of market contract net additions in the fourth quarter (57.1% in 2013).
➜ Mobile accesses stood at 77.2 million at the end of December, up 1% year-on-year, with outstanding growth in the contract segment (+26% year-on-year), now accounting for 31% of mobile accesses (+6 percentage points year-on-year). In the prepay segment, the application of more restrictive reporting criteria resulted in a year-on-year decrease of 7%.
➜ Mobile broadband accesses increased by 65% year-on-year and now account for 27% of mobile accesses in 2013 (+10 percentage points year-on-year), boosted by the growth in smartphones with attached data plans (+83% year-on-year), which accounted for 24% of mobile accesses (+11 percentage points year-on-year).
➜ Net additions in the fourth quarter stood at 626 thousand accesses (1.1 million accesses in 2013) and, although this is the largest net addition figure in the last five quarters, it was still affected by the aforementioned application of more restrictive criteria for registering inactive accesses in the prepay segment, which translated into an increase in churn to 4.1% in the quarter (3.8% in 2013).
➜ The Company achieved for the third quarter in a row a new record high in contract net additions, after reaching 1.6 million in the quarter (+83% year-on-year) and 4.9 million in 2013 (+82% year-on-year). This differential evolution reflects the Company’s focus on network quality and innovative services, which affected to both year-on-year growth in gross additions (+19% in the quarter; +21% 2013) and on-going reduction in churn, which decreased to 1.5% in the quarter (-0.3 percentage points year-on-year) and to 1.7% up to December (-0.3 percentage points year-on-year).
➜ The improved quality of the customer base resulted in a 6% year-on-year increase in traffic in 2013 (+8% in the quarter) in homogenous terms after eliminating duplicated traffic in both periods following the integration of fixed and mobile companies.
➜ ARPU grew by 2.3% year-on-year in 2013 (+0.2% in the quarter) as a result of the improved quality of the customer base and despite the reduction in mobile termination rates. Thus, outgoing ARPU increased by 6.7% in the year (+4.8% in the quarter), mainly driven by the growth in data ARPU, which grew by 18.9% year-on-year in 2013 (+17.9% in the quarter).
Regarding commercial activity at the fixed business in 2013:
➜ Traditional accesses maintained its quarter on quarter enhanced trend, posting positive net additions for the third quarter in a row (+124 thousand in the fourth quarter, +61 thousand in the third quarter, +13 thousand in the second quarter and -92 thousand in the first quarter). As a result, total customer base stood at 10.7 million. Thus, accesses posted year-on-year positive growth (+1%) after decreasing year-on-year for 10 consecutive quarters. This improvement was underpinned by the expansion of the fibre network, the Fixed Wireless technology (341 thousand new customers in 2013), the development of more segmented commercial offers and the strengthening of sale channels.
➜ Retail broadband accesses stood at 3.9 million at the end of 2013 (+5% year-on-year), after posting 39 thousand net additions in the fourth quarter (-20 thousand accesses in the fourth quarter of 2012) and 188 thousand accesses in the year (+100 thousand accesses in 2012). At the end of 2013, households passed with fibre stood at 1.4 million, the uptake in the fourth quarter increased to 204 thousand households already connected (+82% year-on-year).
➜ Pay TV accesses continued their recovery in the quarter after the commercial repositioning carried out in the middle of 2013 and, for the second consecutive quarter, posted positive net additions (52 thousand accesses; 50 thousand accesses in the third quarter). Net additions in 2013 totalled 39 thousand accesses (-97 thousand accesses in 2012) impacted by the disconnection in MMDS technology accesses in the first half of the year associated with the return of the licence. Thus, total accesses stood at 640 thousand (+6% year-on-year).
117116

Telefónica | Annual Report 2013 Telefónica | Annual Report 2013
Telefónica Integrated report 2013 6. Appendices
Revenues in 2013 amounted to 12,217 million euros, up 2.2% year-on-year (+1.3% in the fourth quarter), despite the impact of the reduction in mobile termination rates from April. The main reason for the deceleration in year-on-year growth in the quarter was the decline in handset sales at the mobile business, which was partly offset by the improvement at the fixed business.
Note that the reduction in mobile termination rates (VUM: -11.84%) and in the fixed-mobile retail tariff (VC: -8.77%) came into effect on 6 April 2013, reducing year-on-year growth by 1.5 percentage points in the quarter and in the year. Excluding these impacts, revenues would have increased by 3.7% in the year (+2.9% in the quarter).
Mobile revenues stood at 8,092 million euros in 2013, up 7.5% year-on-year (+4.5% in the fourth quarter).
➜ Mobile service revenues grew by 6.1% year-on-year (+5.3% in the quarter). Excluding the impact of the reduction in mobile termination rates, service revenues would have grown by 8.0% year-on-year in 2013 (+7.2% year-on-year in the quarter). On the other hand, service revenues reflected a tax reversal with a positive impact in the quarter of 58 million euros.
➜ Data revenues maintained a strong pace of year-on-year growth, increasing by 20.9% in 2013 (+19.5% in the fourth quarter), and accounted for 30% of mobile service revenues in 2013 (+4 percentage points year-on-year). This rise was underpinned by the sharp increase in non-SMS data revenues, which accelerated to 35.8% year-on-year in the fourth quarter (+30.6% year-on-year in 2013). As a result, non-SMS data revenues accounted for 67% of total data revenues in the year (+5 percentage points year-on-year).
➜ Revenues from handset sales rose by 35.4% year-on-year in 2013, reflecting the higher weighting of smartphone sales and the different commercial model for small and medium-sized enterprises since the third quarter of 2012. However, revenues fell by 7.6% year-on-year in the fourth quarter due to the decline in gross additions and upgrades with handset sales.
Fixed revenues stood at 4,125 million euros, down 6.8% year-on-year, following an improved year-on-year performance in the quarter to -4.6% (-8.4% in the third quarter) thanks to the improvement in voice, broadband and new business revenues. Revenues were also impacted by the decline in the fixed-mobile retail tariff, which reduced year-on-year growth by 1.1 percentage points in both the year and the fourth quarter.
➜ Growth in broadband and new service revenues accelerated to 3.8% (+0.7% year-on-year in 2013) thanks to higher broadband and IT revenues and the improved performance of pay TV revenues.
Voice and access revenues declined by 10.9% year-on-year in 2013 and by 9.4% in the fourth quarter as a result of the improvement in commercial activity following the transformation process carried out by the Company. Excluding the reduction in retail prices, revenues would have fallen by 9.2% in 2013 (-7.6% in the fourth quarter).
Operating expenses rose by 6.0% year-on-year in 2013 (+3.6% in the fourth quarter) mainly as a result of the commercial effort at the fixed and mobile business, which enabled the Company to strengthen its leadership in high-value segments. In addition, higher network and site rental costs associated with the rollout of the mobile network were recorded, allowing to address the growing demand for data.
Note that the year-on-year comparison is also affected by expenses related to the headcount restructuring programme and the incentivised redundancy plan in 2013 (25 million euros in the fourth quarter and 51 million euros in the year). In 2012, the year-on-year comparison was affected by other non-recurrent expenses associated with another headcount restructuring programme and incentivised redundancies, the brand unification process and the reversal of a provision, with a total positive impact of 11 million euros (all recorded in the first half of 2012).
Besides, it is worth to mention that during the second quarter of 2013 the sale of non-strategic towers for 29 million euros was recorded, while in 2012 a total of 445 million euros was recorded (269 million euros in the fourth quarter).
OIBDA stood at 3,940 million euros in 2013, down 5.5% year-on-year in 2013 (-0.9% year-on-year in the quarter). The OIBDA margin stood at 35.7% in the fourth quarter (-0.8 percentage points year-on-year) and at 32.3% in 2013 (-2.6 percentage points compared with 2012) as a result of the commercial effort in capturing high-value mobile customers and the transformation process of the fixed business.
On the other hand, the reduction in mobile termination rates and in the fixed-mobile retail tariff reduced year-on-year OIBDA growth by 1.4 percentage points in both the year and the fourth quarter.
CapEx amounted to 2,127 million euros (+9.3% year-on-year in organic terms), mainly devoted to the expansion and improvement of the mobile networks, both 3G and 4G, as well as the rollout of the fibre network. A total of 185 million euros was reported in 2013 associated with the acquisition of spectrum licences (transfer of frequency from 1,900 MHz to 2,100 MHz and an additional part of the spectrum acquired in the fourth quarter of 2012 to offer LTE services), all recorded in the first nine months of the year.
Operating cash flow (OIBDA-CapEx) amounted to 1,813 million euros in 2013, decreasing by 16.7% year-on-year.
Telefónica Argentina (year-on-year changes in local currency)
In 2013 Telefónica Argentina maintained its market leadership thanks to its competitive positioning and the on-going improvement on quality and innovation in its products and services.
Thus, in November, the Company launched “Quam”, a secondary brand to “Movistar” for mobile, allowing the Company the access to new market segments with a simple proposal that bundles minutes, SMS and data, and aiming to ensure that the youngest customers in the prepay segment are always connected.
The Company managed 26.7 million accesses at the end of December 2013, up 10% year-on-year.
The main highlights of the operating performance of the mobile business included:
➜ The estimated penetration rate at the end of 2013 stood at 158% (+13 percentage points year-on-year).
➜ Mobile accesses stood at 20.0 million, with solid growth (+13% year-on-year) in both the prepay segment (+17%) and the contract segment (+7%) after posting record-high net additions in the year (2.4 million accesses; 2.8 times the figure of 2012). This positive performance was underpinned by the strong rise in gross additions (+20% year-on-year) and the reduction of churn to 2.3% (-0.4 percentage points year-on-year).
On the other hand, the Company posted a net loss of 376 thousand accesses (+308 thousand in the fourth quarter of 2012) due to the disconnection of low value customers in the prepay segment, though it should be highlighted the good performance at the contract segment, posting net additions of 97 thousand customers in the quarter (-15 thousand in the fourth quarter of 2012).
➜ Also noteworthy was the strong growth in smartphones (+84% year-on-year), which now account for 29% of accesses (+11 percentage points year-on-year), underpinned by the marketing campaigns implemented in both prepay and contract segments to expand data services.
➜ Traffic rose by 6% year-on-year in 2013 thanks to the strong growth in accesses. Traffic declined by 2% year-on-year in the fourth quarter mainly as a result of the commercial campaigns carried out in the prepay segment in the fourth quarter of 2012.
➜ Thus, ARPU increased by 5.9% year-on-year (+3.7% in the fourth quarter) boosted by the steady adoption of smartphones.
Regarding commercial activity at the fixed business the main highlights were:
➜ Traditional fixed accesses stood at 4.8 million (+1% year-on-year) after posting net additions of 71 thousand accesses in the year (14 thousand in the quarter) thanks to the growth in fixed wireless accesses (+46% year-on-year) and the successful bundling strategy.
➜ Retail broadband accesses totalled 1.8 million as of December 2013, up 6% year-on-year, with 99 thousand net additions in 2013 (17 thousand in the quarter).
Revenues stood at 3,681 million euros in 2013, up 23.2% year-on-year, with growth accelerating to 24.9% in the fourth quarter thanks to the improved performance of both, the fixed and the mobile businesses.
Thus, mobile revenues totalled 2,470 million euros in 2013, up 25.8% year-on-year (+26.3% year-on-year in the quarter).
➜ Mobile service revenues rose by 21.2% year-on-year in 2013 (+21.9% in the quarter) thanks to both, customer base growth and a higher consumption level (mainly of data).
Data revenues increased by 30.8% year-on-year in 2013 (+26.9% in the fourth quarter), and now account for 48% of service revenues (+3 percentage points year-on-year). This performance was mainly underpinned by the growth in non-SMS data revenues (+60.8% and +50.4% year-on-year in the year and the quarter respectively), accounting for 49% of mobile data (+9 percentage points year-on-year).
Fixed revenues totalled 1,332 million euros in 2013, with growth accelerating to 18.6% year-on-year (+21.8% in the fourth quarter).
➜ Voice and access revenues rose by 7.0% year-on-year in 2013 (+6.8% in the fourth quarter) as a result of access growth and the success of the bundling strategy.
➜ Broadband and new service revenues growth accelerated to 29.4% in 2013 (+34.8% year-on-year in the fourth quarter) mainly due to the strong growth in broadband ARPU (+20.7% year-on-year in 2013). As a result, broadband and new service revenues now account for 50% of fixed revenues (+4 percentage points year-on-year).
Operating expenses increased by 27.7% year-on-year to 2,715 million euros in 2013, mainly impacted by higher personnel costs associated with the widespread increase in prices, higher commercial costs linked to the strong increase in commercial activity over the year and increased content costs associated to the growth in mobile data.
Operating expenses in the quarter consolidated the deceleration trend in the year-on-year growth (+25.2%), thanks to the measures implemented to improve the efficiency of the Company, with slower growth in personnel, commercial expenses (due to the lower commercial activity compared with the first quarters of the year) and lower growth in customer service expenses (homogeneous comparisons following the customer service improvements introduced in the second half of 2012).
119118

Telefónica | Annual Report 2013 Telefónica | Annual Report 2013
Telefónica Integrated report 2013 6. Appendices
OIBDA amounted to 977 million euros in 2013, growing by 12.4% year-on-year, after year-on-year growth accelerated to 18.5% in the quarter. Thus, the OIBDA margin stood at 26.1% in 2013 (-2.5 percentage points year-on-year) with a strong improvement in the fourth quarter (30.1%; -1.3 percentage points year-on-year) on the back of the cost containment efforts to ease the impact of inflation.
CapEx amounted to 574 million euros in 2013 (+36.9% year-on-year), reflecting the Company’s focus on maintaining the quality leadership through the on-going improvement on the fixed and mobile network, developing new technologies for fixed connectivity and providing new sites, systems and platforms to expand mobile data capacity.
Thus, operating cash flow (OIBDA-CapEx) in 2013 amounted to 403 million euros, down 10.5% year-on-year.
Telefónica Chile (year-on-year changes in organic terms)
Telefónica strengthened its leadership position in Chile during 2013 thanks to its innovative services and the on-going improvement in the quality of its fixed and mobile network.
Thus, on 15 November, Telefónica Chile announced the launch of nationwide LTE services, reinforcing the commitment to the development of telecommunications in the country.
On the commercial front, the mobile service offering was reshaped during 2013 with the aim of boosting the usage of mobile broadband leveraged on multimedia plans with bundle voice, SMS and data.
In the fixed business, the deployment of VDSL and fibre optic networks was continued, offering speeds of up to 150 Mbps and a differential pay TV product.
To correctly interpret these financial results note that in the fourth quarter of 2012 and due to a contractual change, all contract handset sales started to be recorded as expenses and not as CapEx. In order to have a like-for-like comparison, organic year-on-year growth is done in homogenous terms.
Telefónica managed a total of 13.6 million accesses in Chile at the end of 2013, posting year-on-year growth of 4%.
Operating performance highlights in the mobile business were:
➜ Estimated penetration of the mobile market stood at 154% (+6 percentage points year-on-year).
➜ Mobile accesses stood at 10.5 million at the end of 2013, up 4% year-on-year. Especially noteworthy was the strong growth in smartphones, which totalled 2.2 million as of December and now account for 22% of accesses (+10 percentage points compared with 2012), after doubling accesses figure in 2013.
➜ Net additions in the quarter totalled 170 thousand accesses (450 thousand accesses in 2013), highlighting the better performance of contract net additions during the year, thanks to the success of multimedia plans and the good performance of portability, which posted a growing positive balance for a second quarter in a row. Thus, net contract additions reverted
the negative trend posted in 2012 (net loss of 160 thousand customers) and totalled 29 thousand new accesses in 2013 (20 thousand in the fourth quarter).
➜ Churn stood at 2.7% in the year (+0.4 percentage points year-on-year and +0.7 percentage points in the quarter) as a result of the increase in churn in the prepay segment associated with low-value customers. However, it should be highlighted the efforts made to retain customers and to improve customer satisfaction levels, resulting in a reduction of contract churn (-0.3 percentage points year-on-year in the quarter and the year).
➜ Traffic increased by 2% year-on-year in 2013, with a year-on-year decline in the fourth quarter (-4%) stemming from the strong increase reported in the fourth quarter of 2012 driven by commercial campaigns in the prepay segment.
➜ On the other hand, ARPU decreased by 4.6% year-on-year in 2013 but continued posting a steady pace of improvement over the year (-0.5% in the quarter) boosted by mobile data growth in both, prepay and contract.
Regarding commercial activity in the fixed business, highlights were:
➜ Traditional accesses stood at 1.7 million (-5% year-on-year), with a net loss of 84 thousand accesses in the year (-20 thousand in the fourth quarter), though this represents a slight improvement versus 2012 (-110 thousand accesses) thanks to the success of customer retention campaigns (churn reduced by 0.1 percentage points year-on-year).
➜ Retail broadband accesses amounted to 970 thousand, up 4% year-on-year. Net additions in the year totalled 38 thousand accesses (5 thousand in the quarter), highlighting the steady decline in churn (-0.2 percentage points year-on-year in 2013). Also noteworthy was the continued improvement on the speed portfolio with on-going customer upgrades to higher value plans. At the end of 2013, 63% of customers were in plans with speeds of more than 4 Mbps (+6 percentage points year-on-year).
➜ Pay TV accesses stood at 503 thousand, maintaining the growth accelerating trend (+19% year-on-year). Net additions stood at 79 thousand accesses in 2013 and at 23 thousand in the fourth quarter, improving significantly versus 2012. The improvement in pay TV was fostered by the focus on quality carried out throughout 2013, offering high-definition service and a wide range of interactive features and applications, resulting in a reduction of churn levels (-0.9 percentage points year-on-year in 2013) and an increase of the average consumption per customer.
Revenues totalled 2,483 million euros in 2013, up 1.5% year-on-year in the year and in the quarter, with growth accelerating both, in mobile service revenues and in the fixed business in the final quarter of the year.
Mobile revenues increased by 3.2% year-on-year to 1,534 million euros (+2.1% in the final quarter).
➜ Mobile service revenues increased in 2013 by 1.8% year-on-year and by 5.8% in the fourth quarter thanks to the Company’s strategy of innovation and quality, which enabled to boost growth of high-value customers, with an improvement in voice and mainly, in data revenues.
Thus, data revenues advanced by 8.5% year-on-year in 2013 (+13.7% in the quarter) and now account for 20% of service revenues (+1 percentage points year-on-year), underpinned by the strong non-SMS revenues momentum (+23.7%), with growth accelerating to 31.1% in the fourth quarter, already accounting for 84% of data revenues in 2013 (+10 percentage points year-on-year).
➜ Handset revenues advanced 17.6% year-on-year in 2013, despite the year-on-year decline in the fourth quarter (-25.9%) mainly due to lower handset sales associated to higher subsidy levels to capture value customers.
Fixed revenues reached 1,049 million euros in 2013, slightly decreasing year-on-year (-1.0%) after maintaining this quarter the enhanced year-on-year trend (+2.2% year-on-year in the fourth quarter; +1.3% in the third; -2.2% in the second; -5.3% in the first).
➜ Broadband and new service revenues advanced by 8.0% year-on-year in 2013, with growth accelerating to 10.0% in the quarter. Particularly noteworthy was the year-on-year growth in pay TV based on the abovementioned increase in the customer base. Thus, broadband and new service revenues accounted for 57% of fixed revenues in the year (+5 percentage points year-on-year).
➜ Voice and access revenues decreased by 10.4% year-on-year as a result of access loss in a more mature market environment, though the trend also improved in the quarter (-6.3% year-on-year), mainly as a result of services bundling.
Operating expenses increased by 1.5% year-on-year in 2013 due to the higher expenses associated with increased commercial activity, virtually offset by the savings achieved on the efficiency measures executed by the Company, mainly in personnel expenses, and by the lower level of bad debt recorded in the year. Growth in operating expenses accelerated in the quarter (+7.5% year-on-year) due to the commercial activity momentum, with an increase in subsidies associated with the capture of value customers.
Thus, OIBDA totalled 818 million euros in 2013 (+1.6% year-on-year and -2.8% in the final quarter). The OIBDA margin stood at 32.9% in the year, stable year-on-year, and at 33.8% in the quarter (-1.5 percentage points year-on-year).
It is also worth noting that the year-on-year OIBDA margin comparison in reported terms (-7.3 percentage points in the year) was impacted by the contractual change affecting contract handset sales, which are now considered as an expense rather than CapEx following the contractual change implemented in the fourth quarter of 2012, while like-for-like criteria were used for organic change.
In addition, the sale of non-strategic towers for 9 million euros was recorded in 2013 (all recorded in the first nine months of the year).
CapEx amounted to 488 million euros in the year, up 17.0% year-on-year, mainly devoted to the deployment of the 3G and 4G networks, the improvement of fixed and mobile broadband services and the development of new services. CapEx in reported terms (-19.5%) was affected by the abovementioned contractual change, which reduced investment by 168 million euros in the year, though there was no impact on cash flow generation.
Operating cash flow (OIBDA-CapEx) amounted to 330 million euros in 2013, a year-on-year decrease of 15.4%.
Telefónica Perú (year-on-year changes in organic terms)
In 2013, Telefónica Perú strengthened its integrated services offer, with a clear focus towards the on-going improvement of service quality and the simplification of plans and tariffs, enabling the Company to deliver a solid operating and financial performance.
This focus on quality was reflected in the fixed business by doubling the fixed broadband speed (increasing to 4, 8 and 15 Mb) while fostering the migration of customers to pay TV bundles with high definition channels. At the mobile business, it should be outlined the on-going restructuring of the tariffs portfolio of voice and data plans in order to drive increased smartphone adoption.
Additionally, it’s worth highlighting in the year the Company’s commitment to continue expanding telecommunications in the country, with the acquisition in the fourth quarter of 2013 of one of the two blocks of radioelectric spectrum for LTE auctioned on 22 July in the AWS band (2x20 MHz) for a period of 20 years (120 million euros). Thus, the 4G network rollout plan aims to reach 234 district capitals (around 50% of the population) over the next five years. According to this plan, Telefónica Perú commercially launched 4G services in 7 districts of Lima at the end of November. At present, it is the only company in Peru providing this service.
The Company managed 20.9 million accesses at the end of December, up 3% year-on-year.
Operating performance highlights in the mobile business were:
➜ The estimated penetration rate in the mobile market stood at 89% (+4 percentage points year-on-year).
➜ Mobile accesses totalled 15.8 million, up 4% year-on-year, despite being affected by the application of more restrictive reporting criteria for prepay customers. Even though, contract accesses maintained a strong growth of 24% year-on-year, representing now 29% of total mobile accesses (+5 percentage points year-on-year), standing as the main growth driver of mobile broadband accesses (+65% year-on-year). Thus, smartphone customers almost doubled compared with 2012, with penetration of 12% (+5 percentage points year-on-year).
➜ Net additions in 2013 totalled 565 thousand accesses (+40 thousand in the quarter) largely as a result of the strong performance of contract net additions, which stood at 862
121120

Telefónica | Annual Report 2013 Telefónica | Annual Report 2013
Telefónica Integrated report 2013 6. Appendices
thousand accesses (+19% year-on-year) and offset the application of more restrictive reporting criteria for prepay customers, which had a negative impact on total churn trend (4.4% in the year and 4.5% in the quarter; +0.8 percentage points year-on-year in both, 2013 and the quarter).
➜ In the fourth quarter, traffic grew by 17% year-on-year (+14% in the full year), reflecting the quality of the customer base growth.
➜ The performance of ARPU reflected once again this quarter the higher quality of the customer base (+4.5% year-on-year in 2013 and +4.6% in the quarter), despite the impact of the change in the fixed-mobile tariff and the mobile termination rates reduction applied in October 2012 and October 2013. Thus, outgoing ARPU posted year-on-year growth of 6.4% in the year and in the fourth quarter, underpinned by both the strong growth of data and the higher volume of traffic.
Regarding commercial activity at the fixed business:
➜ Traditional accesses at the end of 2013 totalled 2.8 million (-3% year-on-year), following a net loss of 82 thousand accesses in the year (-43 thousand in the quarter), with a lower activity in the fixed wireless technology over the year.
➜ Retail broadband accesses grew by 10% year-on-year to 1.4 million customers, following net additions of 123 thousand accesses in the year (12 thousand in the quarter), in a highly competitive environment. Particularly noteworthy was the steady improvement in the portfolio of speeds with on-going customer upgrade to higher value plans, with 42% of customers already in plans with speeds of more than 4 Mb at the end of 2013 (25% in December 2012).
➜ Pay TV accesses stood at 897 thousand at the end of 2013, stable year-on-year despite a net loss of 8 thousand accesses in the quarter following the application of more restrictive activation criteria for new customers.
Revenues in 2013 totalled 2,454 million euros after increasing by 8.1% year-on-year, consolidating in the fourth quarter the solid trend of year-on-year growth acceleration (+10.6% in the fourth quarter; +8.2% in the third quarter; +7.6% in the second quarter; +6.0% in the first quarter) and driven by the faster pace of growth at both the fixed and mobile businesses.
It should be noted that revenues were adversely impacted by regulatory changes affecting fixed-mobile calls in 2013 and by the mobile termination rate reductions in October 2012 and October 2013. Excluding these impacts, revenues would have risen by 10.0% year-on-year in 2013 (+12.0% year-on-year in the fourth quarter).
Mobile revenues stood at 1,393 million euros in January-December, up 12.1% year-on-year, after growth accelerated again in the fourth quarter (+14.5% year-on-year):
➜ Mobile service revenues posted strong growth once again this quarter (+10.8% year-on-year in 2013), with a strong improvement in the fourth quarter (+13.3% year-on-year) despite the negative impact of the abovementioned regulatory changes. Excluding these effects, growth would have been 13.4% year-on-year in 2013 (+15.1% year-on-year in the fourth quarter).
Data revenues were the main driver of this trend, advancing by 35.8% year-on-year in the January-December period, with growth accelerating to 39.1% in the fourth quarter. Furthermore, they continued to offer clear scope for further growth as they still account for a limited percentage of service revenues (22%; +4 percentage points year-on-year) and as non-SMS data revenues posted a solid growth of 64.7% year-on-year in 2013 (+73.9% in the fourth quarter), already accounting for 81% of mobile data revenues (+14 percentage points year-on-year).
Fixed revenues stood at 1,239 million euros in 2013, up 6.9% year-on-year, with growth accelerating significantly in the quarter (+9.4%):
➜ Broadband and new services revenues advanced by 15.5% year-on-year in 2013 (+18.5% in the fourth quarter), underpinned by the solid performance of internet, TV and business services revenues, standing again this quarter as the main driver of fixed revenue growth, and now accounting for 65% of fixed revenues (+5 percentage points year-on-year).
➜ Voice and access revenues decreased by 5.6% year-on-year in 2013 (-4.2% in the fourth quarter) and were still affected by the regulatory changes. Excluding these factors, they would have declined by 2.5% in 2013 (-0.9% in the quarter) mainly due to lower consumption as a consequence of the fixed-mobile substitution effect.
Operating expenses in 2013 amounted to 1,610 million euros, up 9.7% year-on-year, though increasing by 18.5% in the fourth quarter, mainly due to the increased commercial costs related to capturing and retaining high-value customers and the commercial launch of the 4G service, together with higher personnel expenses associated with employee participation in the results of the Company and one-off workforce restructuring expenses in the fourth quarter (6 million euros). In contrast, it should be mentioned the decrease in interconnection costs following the reduction in mobile termination rates implemented in October 2013.
As a result, OIBDA totalled 875 million euros in 2013, up 4.4% year-on-year, though it declined by 2.6% year-on-year in the fourth quarter due to the abovementioned increase in expenses. The OIBDA margin stood at 35.6% in 2013 (-1.3 percentage points year-on-year) and at 36.3% in the fourth quarter (-4.9 percentage points year-on-year) owing to the higher commercial effort previously commented. It should be noted the sale of non-strategic towers for 23 million euros recorded in 2012 (3 million euros in the fourth quarter).
CapEx stood at 479 million euros in 2013 (+0.4% excluding 120 million euros from the spectrum acquired in the fourth quarter of 2013) and was mainly devoted to the expansion and improvement of the network and the development of new services.
As a result, operating cash flow (OIBDA-CapEx) for 2013 amounted to 396 million euros, up 7.4% year-on-year.
Telefónica Colombia (year-on-year changes in organic terms)
In 2013 Telefónica Colombia maintained the steady commercial and financial improving trend initiated in June 2012, following the merger between Telefónica Móviles Colombia, S.A. and Colombia Telecomunicaciones S.A. that strengthened the Company’s position in the country’s telecommunications sector.
It is worth noting that the structural changes implemented by the Colombian regulator (“CRC”) in the first half of 2013 continued to boost the telecommunications market through the application of asymmetric mobile termination rates between the dominant operator and the rest of the companies (including Telefónica). In order to adapt to the new regulatory backdrop and to progress with its commercial repositioning, throughout 2013 the Company focused on higher-value customers, strengthening the marketing of integrated services.
Moreover, the Company reflected once again in the fourth quarter its commitment to the sector’s development by securing 30 MHz of spectrum in the AWS band (2x15 MHz) at the auction on 26 June to provide LTE services at a total cost of 109 million euros, becoming the first mobile operator launching commercially LTE services in December.
Also it is worth to mention the agreement signed with Millicom in the fourth quarter for the joint rollout of the 4G network, enabling Telefónica Colombia to obtain the benefits of optimising infrastructure investments.
Telefónica Colombia managed 14.8 million accesses at the end of 2013, up 5% year-on-year, and reversed the year-on-year declining trend reported throughout the year after achieving positive net additions in all services for the third quarter in a row.
Operating performance highlights in the mobile business were:
➜ The estimated mobile penetration rate in the market stood at 106% (+2 percentage points year-on-year).
➜ Mobile accesses stood at 12.1 million at the end of December 2013, up 4% year-on-year, with the contract segment standing out, growing by 9% year-on-year and accounting for 27% of the mobile customer base (+1 percentage points year-on-year). Mobile broadband accesses, which totalled 3 million accesses (+104% year-on-year), and in particular smartphones, which stood at 2.6 million (more than double December 2012 figure) are the main drivers of this growth. As a result, smartphone penetration increased by 14 percentage points to 23% of the total mobile access base.
Net additions reverted the trend in the fourth quarter, returning to positive again after reaching 488 thousand new accesses, the largest net additions in the last seven quarters (418 thousand in the year). This improvement was mainly driven by the growth recovery in the prepay segment, which posted net additions of 449 thousand accesses in the last quarter of the year (143 thousand in 2013) following the introduction of plans that encouraged top-ups and the easing of the impact of the disconnection of low-value customers, which affected its trend in recent quarters.
The contract segment, on the other hand, continued to post steady growth, with net additions of 39 thousand accesses in the fourth quarter (275 thousand accesses in 2013), driven by growth in gross additions (+13% year-on-year in 2013; +9% year-on-year in the fourth quarter), though churn increased by 0.4 percentage points in the quarter.
Traffic year-on-year growth accelerated in the fourth quarter (+26%; +16% in the year), boosted by the prepay segment and the significant improvement in the quality of the customer base.
Once again, ARPU reflected the Company’s strategy of maximising customer value, rising by 7.3% in the fourth quarter (+5.7% in the year) despite the impact of the mobile termination rate cuts. Also noteworthy is the performance of outgoing ARPU, which increased by 11.8% year-on-year in both the fourth quarter and the year thanks to the steady improvement in the customer mix, with increases in both voice and data traffic and despite the tariff reduction derived from the transfer to customers of the benefits from the mobile termination rates asymmetry.
Regarding commercial activity in the fixed business:
➜ Traditional fixed accesses totalled 1.4 million as of December 2013, consolidating the year-on-year growth trend (+2%) thanks to net additions of 1 thousand accesses in the fourth quarter (-11 thousand in the same period of 2012) and 27 thousand in the year (-60 thousand in 2012). This improvement is underpinned by service bundling and in clear contrast with the loss of lines in recent years.
➜ Retail broadband accesses stood at 854 thousand, up 21% year-on-year, with net additions of 148 thousand accesses in 2013 (+59% year-on-year) and 26 thousand in the fourth quarter in a highly competitive environment.
➜ Pay TV accesses stood at 348 thousand at the end of 2013, up a solid 22% year-on-year, following net additions of 15 thousand accesses in the quarter and 63 thousand in the year, more than doubling net additions in the same period of 2012. The marketing of the stand-alone service since July 2012 was the main driver of the growth in gross additions.
Revenues in 2013 totalled 1,705 million euros, up 3.7% year-on-year, with pace of growth improving throughout the year (+8.5% year-on-year in the fourth quarter; +6.5% in the third; +2.6% in the second; -2.7% in the first); boosted by the improvement of both the mobile and the fixed businesses and despite the negative impact of the reduction in mobile termination rates (+5.2% year-on-year in 2013; +10.2% in the fourth quarter, excluding this effect).
123122

Telefónica | Annual Report 2013 Telefónica | Annual Report 2013
Telefónica Integrated report 2013 6. Appendices
Thus, mobile revenues rose by 5.7% year-on-year to 1,052 million euros in 2013, with growth ramping up in the fourth quarter to 11.4%.
➜ Mobile service revenues rose by 4.6% year-on-year in January-December 2013, with pace of growth improving for the third consecutive quarter (+10.0% year-on-year in the fourth quarter) thanks to the abovementioned strong increase in traffic and the larger contribution of data revenues. Excluding the impact of the reduction in mobile termination rates, revenues would have grown by 7.1% year-on-year in 2013 and by 12.9% in the fourth quarter.
Data revenues rose by 6.2% year-on-year in 2013, improving their growth in the fourth quarter (+8.7% year-on-year) and accounting for 25% of service revenues in the year (+0.4 percentage points year-on-year). Non-SMS revenues, which now account for 92% of data revenues (+2 percentage points year-on-year), advanced by 8.9% year-on-year in 2013, with growth accelerating to 11.5% year-on-year in the fourth quarter.
Fixed revenues totalled 652 million euros, up 0.7% year-on-year and consolidating once again this quarter the year-on-year growth trend that began in the second quarter of 2013 (+4.0% year-on-year in the fourth quarter).
➜ Broadband and new service revenues advanced 5.5% year-on-year in 2013 (+7.5% in the fourth quarter) leveraged on the good performance of internet revenues, and now account for 54% of fixed revenues (+2 percentage points year-on-year), underpinned by the strong growth in the broadband customer base.
➜ Voice and access revenues decreased by 4.6% compared with January-December 2012, though remained stable in the fourth quarter (-0.1% year-on-year) despite the reduction in termination rates (-4.1% in the year and +0.5% in the fourth quarter, excluding this effect).
Operating expenses increased by 4.0% year-on-year in 2013 (+11.6% in the fourth quarter) mainly due to the higher commercial activity and the growth in gross additions of high-value customers, despite the synergies captured from the integration of the mobile and fixed businesses and the retroactive application from February 2013 of asymmetric charges, which implies a 43% reduction in the rate to pay to the dominant operator.
Thus, OIBDA in 2013 totalled 580 million euros (+2.7% year-on-year; +2.3% in the fourth quarter) with an OIBDA margin of 34.0% (-0.3 percentage points year-on-year) and of 35.3% in the fourth quarter (-2.1 percentage points year-on-year), reflecting the impact of higher commercial activity partly offset by the benefits from the merger of the fixed and mobile businesses. It should be noted that the sale of non-strategic towers for 2 million euros was recorded in the third quarter of 2012.
CapEx in 2013 totalled 457 million euros (+6.4% year-on-year excluding 109 million euros of the spectrum acquired in the fourth quarter of 2013), with investment focused on both the improvement of the fixed broadband service quality and rolling out and increasing the capacity of 3G and 4G networks at the mobile business.
As a result, operating cash flow (OIBDA-CapEx) for 2013 amounted to 123 million euros, down 2.4% year-on-year.
Telefónica México (year-on-year changes in organic terms)
2013 was a key year for the Mexican telecommunications market following the approval in June of the new Telecommunications Law. Details of the changes that the regulatory reform will bring about and the execution of its implementation are expected to be set out in the first half of 2014, initiating a process of structural transformation in the sector.
Meanwhile, the Company’s focus on the on-going transformation of its commercial offer aiming to improve its competitive positioning, resulted in record-high net additions posted in the fourth quarter of the year. Thus, Telefónica México commercial highlights in the quarter included the launch of the “Prepago Doble” plan in October, which offers double the balance topped up for all top-ups. Additionally, in December the Company further strengthened its commercial offer with the launch of “Plan GigaMove”, a new contract campaign more competitive in data plans aimed at capturing high value customers. Depending on the plan chosen, the customer benefits from up to 3 GB of browsing, 1,500 SMS to any company, Spotify Premium, Twitter, Whatsapp, Facebook and unlimited email.
Moreover, Telefónica continued to make the most efficient use of its network and in January, 2014, the Company signed a new deal with the distributor MAZ Tiempo following the agreements reached with the mobile virtual network operators Coppel and Virgin. Additionally, an agreement was also signed in January with NII Holdings whereby Telefónica will provide Nextel with nationwide voice and data coverage services through its 3G mobile network. This deal provides Telefónica México with an additional lever to strengthen its wholesale services strategy in the country.
Highlights of the business operating performance included:
➜ Estimated mobile penetration stood at 89% the end of December (+1 percentage point year-on-year).
➜ Accesses reached 21.9 million at the end of the year (+8% year-on-year).
➜ Mobile accesses totalled 20.3 million, up 6% year-on-year. In the fourth quarter, the Company posted record high net additions (1.2 million in the quarter and the year), thanks to the abovementioned commercial repositioning, resulting in both a marked improvement in the volume of gross additions, with the Company setting a best-ever figure in the quarter (+38% year-on-year; +20% in the year). Commercial improvement also leveraged in churn, which stood at 2.5% in the quarter (-0.7 percentage points year-on-year) and at 2.9% in the year (-0.2 percentage points year-on-year). In addition, the mobile portability consolidated the positive trend that started in the third quarter with a positive balance of 98 thousand accesses in the quarter (26 thousand in the third quarter; -4 thousand accesses in the year).
➜ The Company’s focus on expanding the data business is reflected in the mobile broadband accesses trend, which advanced by 46% year-on-year in the fourth quarter thanks to the strong growth of smartphones with attached data plans (+60% year-on-year), which reached a penetration of 15% (+5 percentage points year-on-year), reinforced as the main driver of mobile accesses growth.
➜ Traffic continued its positive trend, showing a strong acceleration in the quarter (+38% year-on-year; +16% in the year), resulting in the highest volume managed by the Company in the last 15 quarters thanks mainly to the strong uptake of its new commercial offers.
➜ ARPU decreased by 10.7% year-on-year in the quarter (-8.9% in 2013) impacted by customer repositioning to the more attractive tariff plans launched over the year, the intense strength of competition and the mobile termination rate cuts in both voice, effective from January 2013, and SMS, effective from the fourth quarter of 2012, which affected the year-on-year comparison.
➜ Fixed accesses through fixed wireless technology continued the positive trend of previous quarters, posting a solid 35% year-on-year growth, after reaching net additions of 400 thousand accesses in 2013 (83 thousand accesses in the quarter), already totalling 1.6 million accesses at the end of December.
Revenues in 2013 stood at 1,580 million euros, down 0.8% year-on-year, though the negative trend in the third quarter was reversed in the fourth quarter (+0.3% year-on-year; -2.6% in the third quarter). Thus, mobile service revenues decreased by 5.1% year-on-year (-5.0% in the fourth quarter) mainly as a result of the reduction in SMS prices and the process of replacing SMS with other alternative forms of communication fostered by the steady adoption of smartphones. The reduction in mobile termination rates also had a negative impact on revenue trend. Excluding this effect, mobile service revenues would have decreased by 3.1% year-on-year (-4.3% in the quarter).
Data revenues decreased by 19.9% year-on-year (-20.6% in the quarter) and accounted for 28% of mobile service revenues, with their composition having changed radically in 2013. SMS revenues declined by 42.8% year-on-year both in the year and in the fourth quarter due to the reduction in prices, the abovementioned reduction in termination rates and the effect of substitution for alternative forms of communication, a process in which Movistar has served as a catalyst. As a result, the weighting of SMS revenues as a share of data revenues fell by 15 percentage points, from 54% at the end of the fourth quarter of 2012 to 39% at the end of 2013. This decline was only partly offset in 2013 by the rise in non-SMS data revenues, which advanced by 15.8% year-on-year (+6.0% in the fourth quarter).
Operating expenses grew by 5.8% year-on-year in 2013 (+12.6% in the fourth quarter) mainly due to higher commercial costs related to the higher volume of gross additions and the increased customer care indexes due to the strategic efforts to improve customer satisfaction. Also noteworthy were the efficiencies achieved in network, systems and other non-commercial costs.
OIBDA stood at 266 million euros in 2013 (-25.0% year-on-year; -34.8% year-on-year in the fourth quarter) with an OIBDA margin of 16.9% and of 14.9% in the fourth quarter (-5.4 percentage points year-on-year and -8.0 percentage points in the fourth quarter) impacted by the acceleration in commercial activity over the year and in the last quarter in particular. OIBDA and the OIBDA margin in 2012 were also affected by the recording of 77 million euros from the sale of non-strategic towers (35 million euros in the fourth quarter of 2012).
CapEx amounted to 242 million euros in 2013 (-43.2% year-on-year) as a result of the higher commercial efficiency and the investment and focus on areas of higher value for customers, enabling the increase in resources for improving network quality and the distribution channel.
As a result, operating cash flow (OIBDA-CapEx) amounted to 24 million euros in 2013.
Telefónica Venezuela and Central America (year-on-year changes in organic terms)
During 2013, Telefónica continued strengthening its differential positioning thanks to its integrated services offer and the on-going improvements in network quality and coverage, showing a positive trend both in operational and financial terms along the year.
Commercial activity in 2013 was focused on addressing the demand of data plans, launching new offerings adapted to customer needs depending on voice, SMS and data demand.
Underlining its commitment to innovation and to maintain a greater access to technology and comfort to its customers, the Company in Venezuela began a nationwide rollout of WiFi infrastructure in the fourth quarter of 2013. The goal is to install 1,000 hotspots by 2016, aiming to place Telefónica as the telecommunications company with the largest WiFi network in the country.
Note also that 2013 economic-financial results in reported terms were affected by the devaluation of the bolivar which was announced on February 8, 2013 by the Venezuelan government, devaluating the bolivar from 4.3 strong bolivars per US dollar to 6.3 strong bolivars per US dollar. In the same way, the Venezuelan government announced on January 22, 2014 a new exchange rate to be established and a general foreign exchange plan by which specific transactions will be managed by an auction system at SICAD exchange rate. That exchange rate was fixed at roughly 11.4 bolivars per US dollar over the last auctions. Additionally, the Venezuelan government issued an “Organic Law on Fair Pricing” that might affect Company’s results trend.
Highlights of the operating performance in Venezuela and Central America include:
➜ Estimated mobile penetration stood at 101% at the end of December 2013 (+2 percentage points year-on-year).
➜ Telefónica managed 23.5 million accesses at the end of 2013 (+8% year-on-year), reaching 11.7 million accesses in Venezuela (stable year-on-year) and 11.8 million in Central America (+18% year-on-year).
125124

Telefónica | Annual Report 2013 Telefónica | Annual Report 2013
Telefónica Integrated report 2013 6. Appendices
➜ Mobile accesses totalled 21.7 million, and grew by 9% year-on-year. It should be highlighted the increase in contract accesses (+16%), with net additions of 40 thousand accesses in the quarter and of 308 thousand in the year. Mobile accesses totalled 10.5 million in Venezuela (stable year-on-year) and 11.2 million in Central America (+19% year-on-year), highlighting the introduction of the portability in costa Rica from November 30th, 2013, with positive results one month after its launch.
➜ Mobile broadband accesses posted a solid 30% year-on-year growth in the fourth quarter of the year, thanks to the smartphones momentum, which grew by 36% year-on-year to reach a penetration of 24% (+5 percentage points year-on-year). It should be highlighted smartphones penetration in the Venezuelan market which reached 42% (+9 percentage points year-on-year), a benchmark in the region.
➜ Churn stood at 2.8% in the fourth quarter (+0.3 percentage points year-on-year) and at 2.6% in the year (+0.4 percentage points year-on-year), while contract churn stood at 1.2% in the fourth quarter (stable year-on-year) and at 1.1% in the year (-0.2 percentage points year-on-year).
➜ Traffic continued the strong year-on-year growth trend of previous quarters and grew by 17% year-on-year both in the quarter and in the year, highlighting the year-on-year performance in Venezuela (+18% in the quarter, +20% in the year) and Central America (+15% in the quarter, +13% in the year).
➜ Meanwhile, pay TV accesses in Venezuela continued their positive trend, rising by 79% year-on-year to reach 386 thousand at the end of December 2013, with net additions of 48 thousand accesses in the quarter (170 thousand in the year).
Revenues in 2013 amounted to 4,228 million euros, with year-on-year growth of 38.7% (+39.4% in the quarter). In Venezuela, revenues totalled 3,537 million euros after growing 45.5% year-on-year both in the year and in the quarter, and in Central America revenues reached 691 million euros growing 7.6% year-on-year (+8.6% in the quarter). Thus, mobile service revenues grew by 36.2% year-on-year in the quarter (+34.6% in the year), boosted by the expansion of mobile data services and the abovementioned growth in voice traffic. In Venezuela mobile service revenues grew by 42.1% year-on-year in the quarter (+40.0% in the year), while in Central America they increased by 9.4% year-on-year in the quarter (+10.1% year-on-year in 2013).
Thus, data revenues accounted for 30% of mobile service revenues and grew by 32.7% year-on-year in 2013 (+21.9% in the quarter). This performance was driven by the sharp growth in non-SMS data revenues (+56.1% year-on-year in 2013; +58.4% in the fourth quarter), which now account for 64% of data revenues (+7 percentage points year-on-year).
Operating expenses increased by 33.8% year-on-year in 2013 (+37.8% in the fourth quarter), growing by 1.2% year-on-year in Central America (+0.8% in the quarter) and by 44.5% year-on-year in Venezuela (+48.3% in the fourth quarter), mainly impacted by higher commercial expenses and the widespread price increase and higher expenses paid in US dollars for services and equipment purchases due to the negative impact of the devaluation in
Venezuela. These costs are partly offset by the efficiency effort in certain cost items, which delivered significant savings.
OIBDA totalled 1,739 million euros, up 44.3% year-on-year in 2013 (+39.5% in the quarter) due to higher revenues and cost efficiencies. Thus, the OIBDA margin stood at 41.1% in January-December (+1.6 percentage points year-on-year) and 43.5% in the fourth quarter (+0.1 percentage points year-on-year).
CapEx amounted to 739 million euros in 2013 (+87.7% year-on-year excluding the spectrum acquired, 34 million euros in Venezuela and 5 million euros in Nicaragua in 2012), mainly due to the acceleration and development of the 3G network capacity and coverage after the spectrum acquired in 2012, as well as investments for conditioning and expanding the network, thus continuing the Company’s commitment to providing the best communications experience.
As a result, operating cash flow (OIBDA-CapEx) totalled 1,000 million euros in 2013 (+22.6% year-on-year).
Telefónica Latin America. Accesses
Unaudited figures (thousands) 2012 2013 % Var
Final Clients Accesses 211,908.0 221,046.7 4.3
Fixed telephony accesses (1)(2) 24,153.3 24,526.3 1.5
Internet and data accesses 8,732.5 9,239.7 5.8
Narrowband 209.1 125.5 (40.0)
Broadband (3) 8,415.3 9,011.7 7.1
Other (4) 108.0 102.6 (5.0)
Mobile accesses 176,595.4 184,507.0 4.5
Prepay (5) 137,141.5 13,076.0 0.7
Contract (2) 39,453.9 46,431.0 17.7
Pay TV 2,426.8 2,773.6 14.3
Wholesale Accesses 47.0 41.5 (11.7)
Total Accesses T. Latam 211,955.1 221,088.2 4.3
Terra accesses 604.7 412.5 (31.8)
Total Accesses in Latin America 212,559.8 221,500.7 4.2 (1) PSTN (including Public Use Telephony) x1; ISDN Basic access x1; ISDN Primary access; 2/6 Access x30. Company’s accesses for internal use included. Total “fixed wireless” accesses included.(2) Fixed telephony accesses include the reclassification in the fourth quarter of 2012 in Argentina of 157 thousand “fixed wireless” accesses previously recognized as mobile accesses of the contract segment.(3) Includes ADSL, optical fiber, cable modem and broadband circuits. (4) Retail circuits other than broadband.(5) In Brazil, 1.6 million inactive accesses were disconnected in the second quarter of 2012.
Telefónica Latin America. Mobile Accesses
Unaudited figures (thousands) 2012 2013 % Var
Prepay percentage (%) 77.7% 74.8% (2.8 p.p.)
Contract percentage (%) 22.3% 25.2% 2.8 p.p.
MBB accesses (‘000) 27,275.8 43,625.0 59.9
MBB penetration (%) 15% 24% 8.2 p.p.
Smartphone penetration (%) 13% 22% 8.9 p.p.
127126

Telefónica | Annual Report 2013 Telefónica | Annual Report 2013
Telefónica Integrated report 2013 6. Appendices
Telefónica Latin America. Consolidated Income Statement
Jan - Dec % Variación
Unaudited figures (Euros in millions) 2013 2012 Reportado Orgánico
Revenues 29,193 30,520 (4.3) 9.6
Internal exp. capitalized in fixed assets 156 171 (8.9) (0.7)
Operating expenses (20,011) (20,305) (1.4) 11.4
Supplies (8,104) (7,670) 5.7 17.7
Personnel expenses (2,840) (2,908) (2.4) 12.4
Subcontracts (7,712) (8,259) (6.6) 5.9
Bad debt provision (444) (489) (9.3) (1.4)
Taxes (912) (978) (6.8) 10.9
Other net operating income (expense) 44 139 (68.7) (54.4)
Gain (loss) on sale of fixed assets 60 574 (89.6) 53.9
Impairment of goodwill and other assets (2) 2 c.s. c.s.
Operating income before D&A (OIBDA) 9,439 11,103 (15.0) 5.3
OIBDA Margin 32.3% 36.4% (4.0 p.p.) (1.3 p.p.)
Depreciation and amortization (4,634) (5,088) (8.9) 1.9
Operating income (OI) 4,805 6,015 (20.1) 8.3
Notes: - OIBDA and OI before management and brand fees.”- 2012 and 2013 reported figures include the hyperinflationary adjustments in Venezuela.
Telefónica Latin America. Accesses By Country (I)
Unaudited figures (Thousands) 2012 2013 % Var
Brazil
Final Clients Accesses 91,345.4 92,730.0 1.5
Fixed telephony accesses (1) 10,642.7 10,747.8 1.0
Internet and data accesses 3,964.3 4,102.0 3.5
Narrowband 137.9 92.1 (33.2)
Broadband (2) 3,748.4 3,936.7 5.0
Other (3) 78.1 73.2 (6.2)
Mobile accesses 76,137.3 77,240.2 1.4
Prepay (4) 57,335.1 53,551.9 (6.6)
Contract 18,802.2 23,688.3 26.0
Pay TV 601.2 640.1 6.5
Wholesale Accesses 24.4 18.8 (22.8)
Total Accesses 91,369.8 92,748.9 1.5
ArgentinaFinal Clients Accesses 24,121.9 26,636.7 10.4
Fixed telephony accesses (1) 4,762.4 4,833.5 1.5
Fixed wireless (5) 234.6 342.7 46.0
Internet and data accesses 1,755.5 1,848.5 5.3
Narrowband 19.3 12.9 (32.8)
Broadband (2) 1,736.3 1,835.5 5.7
Mobile accesses 17,604.0 19,954.7 13.4
Prepay 11,000.0 12,916.6 17.4
Contract (5) 6,604.0 7,038.1 6.6
Wholesale Accesses 14.1 14.0 (0.4)
Total Accesses 24,136.0 26,650.7 10.4
ChileFinal Clients Accesses 13,142.1 13,625.2 3.7
Fixed telephony accesses (1) 1,737.9 1,654.2 (4.8)
Internet and data accesses 940.1 977.5 4.0
Narrowband 5.5 5.2 (5.5)
Broadband (2) 932.0 969.9 4.1
Other (3) 2.5 2.4 (6.5)
Mobile accesses 10,040.1 10,490.3 4.5
Prepay 7,385.0 7,806.5 5.7
Contract 2,655.1 2,683.8 1.1
Pay TV 424.0 503.2 18.7
Wholesale Accesses 4.9 5.0 2.6
Total Accesses 13,147.0 13,630.2 3.7 (1) PSTN (including Public Use Telephony) x1; ISDN Basic access x1; ISDN Primary access; 2/6 Access x30. Company’s accesses for internal use included. Total “fixed wireless” accesses included.(2) Includes ADSL, optical fiber, cable modem and broadband circuits.(3) Retail circuits other than broadband.(4) In Brazil, 1.6 million inactive accesses were disconnected in second quarter of 2012.(5) Includes the reclassification in the fourth quarter of 2012 in Argentina of 157 thousand “fixed wireless” accesses previously recognized as mobile accesses of the contract segment.
129128

Telefónica | Annual Report 2013 Telefónica | Annual Report 2013
Telefónica Integrated report 2013 6. Appendices
Telefónica Latin America. Accesses By Country (II)
Unaudited figures (Thousands) 2012 2013 % Var
Peru
Final Clients Accesses 20,299.5 20,897.6 2.9
Fixed telephony accesses (1) 2,883.4 2,801.5 (2.8)
Fixed wireless 580.3 313.5 (46.0)
Internet and data accesses 1,317.6 1,437.1 9.1
Narrowband 8.2 5.0 (38.7)
Broadband (2) 1,288.3 1,411.1 9.5
Other (3) 21.0 21.0 0.0
Mobile accesses 15,196.9 15,762.0 3.7
Prepay 11,555.3 11,258.7 (2.6)
Contract 3,641.6 4,503.3 23.7
Pay TV 901.6 897.1 (0.5)
Wholesale Accesses 0.4 0.4 (8.7)
Total Accesses 20,299.9 20,898.0 2.9
ColombiaFinal Clients Accesses 14,122.8 14,778.7 4.6
Fixed telephony accesses (1) 1,420.4 1,447.1 1.9
Internet and data accesses 714.0 862.2 20.8
Narrowband 8.5 8.5 (0.0)
Broadband (2) 705.4 853.7 21.0
Mobile accesses 11,703.6 12,121.7 3.6
Prepay 8,675.2 8,818.5 1.7
Contract 3,028.4 3,303.2 9.1
Pay TV 284.8 347.6 22.1
Wholesale Accesses 3.3 3.3 0.0
Total Accesses 14,126.1 14,782.0 4.6
MexicoMobile accesses 19,168.0 20,332.8 6.1
Prepay 17,668.3 18,863.2 6.8
Contract 1,499.7 1,469.7 (2.0)
Fixed wireless 1,158.9 1,558.9 34.5
Total Accesos 20,326.9 21,891.7 7.7 (1) PSTN (including Public Use Telephony) x1; ISDN Basic access x1; ISDN Primary access; 2/6 Access x30. Company’s accesses for internal use included. Total “fixed wireless” accesses included.(2) Includes ADSL, optical fiber, cable modem and broadband circuits. (3) Retail circuits other than broadband.
Telefónica Latin America. Accesses By Country (III)
Unaudited figures (Thousands) 2012 2013 % Var
Venezuela and Central America (4)
Fixed telephony accesses (1) 1,500.7 1,426.7 (4.9)
Fixed wireless (5) 1,340.5 1,168.7 (12.8)
Internet and data accesses 41.0 12.4 (69.8)
Narrowband 29.7 1.7 (94.3)
Broadband (2) 4.9 4.7 (3.9)
Other (3) 6.4 6.0 (6.4)
Mobile accesses 19,929.3 21,666.8 8.7
Prepay 18,060.2 19,485.4 7.9
Contract 1,869.1 2,177.0 16.5
Pay TV 215.3 385.6 79.1
Total Accesses 21,686.3 23,491.6 8.3
EcuadorMobile accesses 4,972.8 5,094.6 2.5
Prepay 4,169.5 4,120.9 (1.2)
Contract 803.3 973.7 21.2
‘Fixed wireless’ 46.9 56.6 20.8
Total Accesses 5,019.6 5,151.3 2.6
UruguayMobile accesses 1,843.5 1,843.9 0.0
Prepay 1,292.9 1,250.0 (3.3)
Contract 550.6 593.9 7.9
Total Accesses 1,843.5 1,843.9 0.0 (1) PSTN (including Public Use Telephony) x1; ISDN Basic access x1; ISDN Primary access; 2/6 Access x30. Company’s accesses for internal use included. Total “fixed wireless” accesses included.(2) Includes ADSL, optical fiber, cable modem and broadband circuits. (3) Retail circuits other than broadband. (4) Central America includes Guatemala, Panama, El Salvador, Nicaragua and Costa Rica. (5) Fixed Wireless accesses exclude since the first quarter of 2013, 58 thousand accesses included as fixed telephony accesses.
131130

Telefónica | Annual Report 2013 Telefónica | Annual Report 2013
Telefónica Integrated report 2013 6. Appendices
132
Telefónica Latin America Cumulative Selected Mobile Business Operating Data by Country
Unaudited figures 2012 2013 % Var M local
Brazil (1)
Traffic (Million minutes) (2) 113,955 115,698 n.s.
ARPU (EUR) 8.9 8.0 2.3
ArgentinaTraffic (Million minutes) 21,201 22,540 6.3
ARPU (EUR) 11.0 9.4 5.9
ChileTraffic (Million minutes) 13,064 13,339 2.1
ARPU (EUR) 12.0 10.9 (4.6)
PeruTraffic (Million minutes) 21,149 24,193 14.4
ARPU (EUR) 6.7 6.6 4.5
ColombiaTraffic (Million minutes) 17,656 20,551 16.4
ARPU (EUR) (3) 7.0 6.9 5.7
MexicoTraffic (Million minutes) 17,746 20,598 16.1
ARPU (EUR) 5.6 5.1 (8.9)
Venezuela and Central America (4)
Traffic (Million minutes) 27,536 32,304 17.3
ARPU (EUR) (5) 13.8 11.6 19.5
EcuadorTraffic (Million minutes) 4,291 4,482 4.5
ARPU (EUR) 7.5 7.3 (0.2)
UruguayTraffic (Million minutes) 3,403 3,440 1.1
ARPU (EUR) 10.8 10.6 1.7
Notes:- ARPU calculated as a monthly average of the quarter for each period.- Traffic is defined as minutes used by the company customers, both outbound and inbound. On-net traffic is only included once (outbound), and promotional traffic is included. Traffic not associated to
the Company’s mobile customers (roaming-in, MVNOs, interconnection of third parties and other business lines) is excluded. Traffic volume non rounded.
(1) ARPU affected by the disconnection 1.6 million acceses in the second quarter of 2012 in Brazil.(2) From the third quarter of 2013, duplicated traffic was deleted following the integration of fixed and mobile companies.(3) First quarter and second quarter of 2012 figures were reclassified according to a proforma criteria regarding the integration of the fixed and mobile businesses.(4) Central America includes Guatemala, Panama, El Salvador, Nicaragua and Costa Rica.(5) For comparative purposes and in order to facilitate the interpretation of the year-on-year change versus 2012 results, the variation in local currency of the ARPU in Venezuela is reported excluding the
impact of the hyperinflation adjustment.
Telefónica Latin America. Selected Financial Data by Country (I)
Jan - Dec
Unaudited figures (Euros in millions) 2012 2013 % Var % Var M local
BrazilRevenues 12,217 13,618 (10.3) 2.2
Wireline Business 8,092 8,573 (5.6) 7.5
FBB and new services (1) 7,608 8,167 (6.8) 6.1
Voice & access revenues 2,259 2,130 6.1 20.9
Others 484 407 18.9 35.4
Wireless Business 4,125 5,045 (18.2) (6.8)
Mobile service revenues 1,540 1,742 (11.6) 0.7
Data revenues 2,545 3,254 (21.8) (10.9)
Handset revenues 40 49 (18.6) (7.3)
OIBDA 3,940 5,161 (23.7) (13.0)
OIBDA margin 32.3% 37.9% (5.6 p.p.)
CapEx (2) 2,127 2,444 (13.0) (0.9)
OpCF (OIBDA-CapEx) (2) 1,813 2,717 (33.3) (24.0)
ArgentinaRevenues 3,681 3,697 (0.4) 23.2
Wireline Business 2,470 2,431 1.6 25.8
FBB and new services (1) 2,154 2,200 (2.1) 21.2
Voice & access revenues 1,023 968 5.7 30.8
Others 316 231 36.9 69.4
Wireless Business 1,332 1,390 (4.2) 18.6
Mobile service revenues 669 640 4.5 29.4
Data revenues 610 706 (13.6) 7.0
Handset revenues 53 44 19.2 47.6
OIBDA 977 1,076 (9.2) 12.4
OIBDA margin (3) 26.1% 28.5% (2.5 p.p.)
CapEx 574 519 10.6 36.9
OpCF (OIBDA-CapEx) 403 557 (27.6) (10.5)
ChileRevenues 2,483 2,569 (3.3) 1.6
Wireline Business 1,534 1,559 (1.6) 3.4
FBB and new services (1) 1,385 1,429 (3.1) 1.8
Voice & access revenues 281 272 3.3 8.5
Others 149 130 14.4 20.2
Wireless Business 1,049 1,113 (5.8) (1.0)
Mobile service revenues 594 577 2.8 8.0
Data revenues 432 507 (14.7) (10.4)
Handset revenues 23 29 (19.9) (15.8)
OIBDA 818 1,033 (20.8) (16.8)
OIBDA margin 32.9% 40.2% (7.3 p.p.)
CapEx 488 606 (19.5) (15.4)
OpCF (OIBDA-CapEx) 330 427 (22.7) (18.8) Notes:- OIBDA is presented before management and brand fees.(1) Includes FBB connectivity services (retail and wholesale), including value added services, TV services, ICT revenues and other services over connectivity.(2) CapEx includes 420 million euros from the acquisition of spectrum in the fourth quarter of 2012, 28 million euros in the second quarter of 2013 and 161 million euros in the third quarter of 2013.(3) Margin over revenues includes fixed to mobile interconnection.
133132

Telefónica | Annual Report 2013 Telefónica | Annual Report 2013
Telefónica Integrated report 2013 6. Appendices
Telefónica Latin America. Selected Financial Data by Country (II)
Jan - Dec
Unaudited figures (Euros in millions) 2012 2013 % Var % Var M local
PeruRevenues 2,454 2,400 2.3 8.1
Wireline Business 1,393 1,314 6.0 12.1
FBB and new services (1) 1,220 1,164 4.8 10.8
Voice & access revenues 265 206 28.4 35.8
Others 174 151 15.2 21.8
Wireless Business (4) 1,239 1,226 1.1 6.9
Mobile service revenues (4) 807 738 9.3 15.5
Data revenues 413 463 (10.8) (5.6)
Handset revenues 19 24 (20.4) (15.9)
OIBDA 875 909 (3.7) 1.8
OIBDA margin 35.6% 37.9% (2.2 p.p.) CapEx (5) 479 378 26.8 34.1
OpCF (OIBDA-CapEx) (5) 396 531 (25.5) (21.2)
Colombia (6)
Revenues 1,705 1,765 (3.4) 3.7
Wireline Business 1,052 1,069 (1.6) 5.7
FBB and new services (1) 969 994 (2.5) 4.6
Voice & access revenues 240 242 (1.1) 6.2
Others 84 75 10.9 19.1
Wireless Business 652 695 (6.2) 0.7
Mobile service revenues 349 355 (1.8) 5.5
Data revenues 300 338 (11.2) (4.6)
Handset revenues 3 2 65.9 78.1
OIBDA 580 607 (4.6) 2.5
OIBDA margin 34.0% 34.4% (0.4 p.p.)
CapEx (7) 457 352 29.9 39.5
OpCF (OIBDA-CapEx) (7) 123 256 (52.0) (48.5)
MexicoRevenues 1,580 1,596 (1.0) (0.8)
Mobile service revenues 1,340 1,416 (5.3) (5.1)
Data revenues 375 469 (20.1) (19.9)
Handset revenues 240 180 33.1 33.3
OIBDA 266 432 (38.3) (38.2)
OIBDA margin 16.9% 27.0% (10.2 p.p.)
CapEx 242 427 (43.3) (43.2)
OpCF (OIBDA-CapEx) 24 5 n.s. n.s. Notes:- OIBDA is presented before management and brand fees.(1) Includes FBB connectivity services (retail and wholesale), including value added services, TV services, ICT revenues and other services over connectivity.(2) CapEx includes 420 million euros from the acquisition of spectrum in the fourth quarter of 2012, 28 million euros in the second quarter of 2013 and 161 million euros in the third quarter of 2013.(3) Margin over revenues includes fixed to mobile interconnection.(4) Includes revenues from fixed wireless.(5) CapEx includes 120 million euros from the spectrum acquired in the fourth quarter of 2013.(6) First quarter and second quarter of 2012 figures were reclassified according to a proforma criteria regarding the integration of the fixed and mobile businesses.(7) CapEx includes 109 million euros from the spectrum acquired in the fourth quarter of 2013.
Telefónica Latin America. Selected Financial Data by Country (III)
Jan - Dec
Unaudited figures (Euros in millions) 2012 2013 % Var % Var M local
Venezuela And Central America (1) (2)
Revenues 4,228 4,009 5.5 38.7
Mobile service revenues 3,738 3,581 4.4 34.6
Data revenues (3) 1,117 1,190 (6.1) 32.7
Handset revenues 490 428 14.4 70.8
OIBDA 1,739 1,640 6.0 43.8
OIBDA margin 41.1% 40.9% 0.2 p.p.
CapEx (4) 739 594 24.3 75.2
OpCF (OIBDA-CapEx) (4) 1,000 1,046 (4.4) 26.6
EcuadorRevenues 505 491 2.8 6.2
Mobile service revenues 460 443 3.7 7.2
Data revenues 145 135 6.9 10.5
Handset revenues 45 48 (5.8) (2.7)
OIBD 182 176 3.4 6.9
OIBDA margin 36.1% 35.9% 0.2 p.p.
CapEx 94 85 10.0 13.7
OpCF (OIBDA-CapEx) 89 91 (2.7) 0.5
UruguayRevenues 256 254 1.0 4.9
Mobile service revenues 244 243 0.4 4.3
Data revenues 93 89 3.9 7.9
Handset revenues 13 11 14.2 18.6
OIBDA 105 114 (7.7) (4.2)
OIBDA margin 40.9% 44.8% (3.9 p.p.)
CapEx (5) 46 28 65.3 71.7
OpCF (OIBDA-CapEx) (5) 59 86 (31.4) (28.8) Notes:- OIBDA is presented before management and brand fees.(1) Reported figures include the hyperinflationary adjustments in Venezuela in both years.(2) Central America includes Guatemala, Panama, El Salvador, Nicaragua and Costa Rica. (3) Data revenues do not include hyperinflationary adjustments.(4) CapEx includes 32 million euros from the spectrum acquired in Venezuela in the third quarter of 2012 and 5 million euros from the spectrum acquired in Nicaragua in the first quarter of 2012.(5) CapEx includes 24 million euros from the spectrum acquired in the first quarter of 2013.
135134

Telefónica | Annual Report 2013 Telefónica | Annual Report 2013
Telefónica Integrated report 2013 6. Appendices
Telefónica Europe executed its transformation strategy towards a more sustainable business model in 2013, in a very dynamic and competitive market environment. Against this backdrop, the Company has been able to enhance its competitiveness, accelerate its commercial momentum and, despite the pressure on revenues, to improve efficiency and profitability levels, thanks to its on-going efforts on simplification and costs reduction.
2013 was a key year in the renewal of Telefónica Europe’s commercial offer, with the launch of simple and innovative tariffs, focused on the capture of data growth, both in the fixed (fibre) and mobile (4G) businesses. In this context, it should be highlighted the consolidation of “Movistar Fusión” as the driver of recovery in Spain, the commitment on “Refresh” to increase the offer rationality and improve the distribution channels dynamics in the United Kingdom, and the boost of “O2 Blue All-in” tariffs in Germany as the basis for the growth in mobile data.
As a result, commercial activity showed an improvement in the fourth quarter of 2013, especially in Spain, following the launching of the higher-value proposition at the end of September and the successful Christmas campaign. Another highlight was the solid performance of the mobile contract segment in the rest of European operations, driven by the growing penetration of smartphones, the adoption of data tariffs and the development of 4G services.
On the other hand, in 2013 Telefónica Europe’s portfolio was reshaped through the sale of operations in the Czech Republic, completed in January 2014 after obtaining regulatory approval, and in Ireland, and with the announcement of the acquisition of E-Plus by Telefónica Deutschland to form a leading operator in the major European market.
4G services penetration increase in the United Kingdom and Germany, and the acceleration in the deployment of fibre and Pay TV in Spain will be the main pillars of growth in 2014.
Total accesses stood at 101.6 million at the end of December (-2% year-on-year) impacted by the disposal of assets relating to the fixed consumer business in Telefónica UK in the second quarter of 2013 (720 thousand accesses) and the disconnection of 114 thousand accesses of inactive mobile contract customers in the first quarter of 2013 in the Czech Republic.
➜ Mobile accesses totalled 70.2 million at year end (-1% year-on-year) with the contract segment continuing to increase its weight over the total (61% of the base; +1 percentage points vs. 2012). Quarterly contract net additions maintained a positive evolution to reach 149 thousand, despite the extraordinary disconnection of accesses in the business segment in Telefónica Germany as well as a change of platform in some partners. Net contract additions in the year totalled 772 thousand (excluding the disconnection of inactive customers in the Czech Republic).
Total net mobile loss in 2013, excluding disconnections in the Czech Republic, stood at 427 thousand accesses (-293 thousand in the fourth quarter) due to the loss of prepay customers.
➜ Mobile broadband accesses continued to post a solid performance and totalled 29.2 million at the end of the quarter (+15% year-on-year growth), driven by growing data demand and the strong increase in smartphones adoption (42% penetration to December; +7 percentage points year-on-year).
➜ Retail fixed telephony accesses fell by 7%, year-on-year, to reach 14.8 million at year end; affected by the disposal of assets in the fixed business in Telefónica UK in the second quarter (-209 thousand accesses).
(1) Organic growth: In financial terms, it assumes constant average exchange rates of 2012, the sale of non-strategic towers in Spain, the value adjustment of Telefónica Ireland and Telefónica Czech Republic. CapEx excludes spectrum investments.
Results of Business units
Telefónica Europe(1) _
➜ Retail fixed broadband accesses fell to 9.0 million at year end (-6% year-on-year), also impacted by the above mentioned effect in the UK business (-511 thousand accesses). However, in the fourth quarter there was a change in the trend of net adds (+9 thousand vs. -13 thousand in the third quarter) driven by strong growth in fibre in Spain.
It should be noted that from May 1st, 2013 Telefónica Europe excludes the financial results of Telefónica UK’s fixed consumer business.
Revenues totalled 26,840 million euros, 8.6% down on 2012 in organic terms (-10.6% reported). In the fourth quarter revenues posted a lower decline of 7.9% year-on-year in organic terms (-10.0% in reported terms).
Excluding the impact of regulation (mobile termination and roaming rates cuts), revenues fell by 6.4% year-on-year in 2013 and by 6.0% in the fourth quarter in organic terms.
Mobile data revenues accounted for 45% of mobile service revenues in 2013 (+4 percentage points vs. 2012), virtually flat year-on-year (-0.5% in organic terms, -1.5% in the quarter). However, non-SMS data revenues in 2013 grew by 9.1% year-on-year in organic terms (+6.6% in the quarter), driven by mobile data tariffs. As a result, non-SMS data revenues represent 64% of total data revenues at year end 2013 (+6 percentage points year-on-year).
Operating expenses amounted to 17,607 million euros in 2013, 8.6% less than in 2012 in organic terms (-11.1% reported) and reflect the introduction of various efficiency programmes associated with resource optimisation and simplification of the operating model. In the fourth quarter, the pace of year-on-year decline in costs eased (-4.4% organic; -7.1% reported), mainly due to higher costs related with the strong increase in commercial activity during the quarter. Breakdown by components:
➜ Supplies declined 10.6% year-on-year in organic terms in 2013, mainly due to lower interconnection costs and, to a lesser extent the new commercial strategy of subsidies in Spain. In the fourth quarter, supplies fell 6.8% in organic terms.
➜ Personnel expenses dropped by 2.9% in organic terms compared with January-December 2012, as a result of the savings obtained from the restructuring programmes in Spain, Czech Republic and the UK. However, in the fourth quarter they rose by 1.2%, impacted by the change in the pension plan model in the United Kingdom in the fourth quarter of 2012 (94 million euros).
Regarding restructuring expenses, 62 million euros were booked in 2013 (UK: 8 million euros in the first quarter and 40 million euros in the second quarter; Czech Republic: 14 million euros in the first quarter) vs. 16 million euros in 2012 (Czech Republic: 7 million euros in the first quarter and 2 million euros in the second quarter, and Ireland: 1 million euros in the first quarter and 6 million euros in the second quarter).
➜ Subcontract expenses fell 8.8% year-on-year in 2013 in organic terms reflecting the reduction of commercial costs and savings in IT and networks. In the fourth quarter their year-on-year declined slowed to 2.9%, mainly due to lower commercial cost savings in Spain (more homogeneous year-on-year comparison regarding the commercial model).
OIBDA reached 9,917 million euros in January-December, down 5.2% year-on-year in organic terms (-3.0% reported) and 6.4% in the fourth quarter (+11.0% reported).
OIBDA in 2013 was affected by: i) the capital gain from the disposal of non-strategic towers and the recognition of Universal Service in Spain (70 million euros and 7 million euros in the fourth quarter, respectively); ii) the capital gain from the sale of assets in Germany (76 million euros in the fourth quarter); iii) the value adjustment of Telefónica Czech Republic (-176 million euros in 2013; -120 million euros in the fourth quarter); iv) the value adjustment of Telefónica Ireland (-16 million euros in the second quarter); v) the capital gain from the disposal of assets relating to the fixed consumer business in the UK (83 million euros in the second quarter of 2013), vi) the gain associated with a network sharing agreement in the Czech Republic (25 million euros in the fourth quarter) and vii) the restructuring expenses mentioned above.
137136

Telefónica | Annual Report 2013 Telefónica | Annual Report 2013
Telefónica Integrated report 2013 6. Appendices
With respect to 2012, OIBDA was impacted by: i) the capital gain from the sale of non-strategic towers in Spain (28, 16 and 16 million euros in the first, third and fourth quarter respectively) and from the sale of applications (18 million euros in the second quarter); ii) the disposal of non-strategic assets in the Czech Republic (9 million euros in the first quarter); iii) the value adjustment for the impairment of goodwill in Telefónica Ireland (-527 million euros in the fourth quarter); iv) the Universal Service in Spain (9 million euros in the fourth quarter) and v) the aforementioned restructuring expenses and the change in the pension plan in UK.
OIBDA margin for the period January-December was 36.9%, and for October-December 37.8%, showing a year-on-year improvement in organic terms of 1.3 percentage points and 0.6 percentage points, as a result of strict cost control and the operating model transformation, in spite of the pressure on revenues.
CapEx amounted to 3,872 million euros in 2013 and included the acquisition of spectrum in the UK (719 million euros) and the extension of spectrum licences in Spain (69 million euros). In organic terms, CapEx fell 7.7% vs. 2012, reflecting the prioritisation in investment allocation, with a notable increase taking place in growth services such as fibre, 3G and 4G, the cost savings from network sharing agreements and a higher efficiency level.
Operating cash flow (OIBDA-CapEx) reached 6,045 million euros in January-December (-4.1% in organic terms).
Telefónica España
Telefónica España’s 2013 results confirm the gradual recovery of the business, underpinned by the deep transformation process undertaken by the Company, allowing it to strengthen its competitive positioning, maintain its market leadership and improve its financial and commercial performance. Throughout 2013 revenues stabilised the pace of year-on-year decline and profitability remained high, amid a very competitive backdrop in which convergence continues to lead market dynamics.
Commercial activity intensified in the final quarter of the year, in particular in fibre and pay TV, key differentiation drivers in Telefónica España’s offer. In the fourth quarter, fibre and pay TV net additions reached record high levels (100 thousand and 63 thousand customers, respectively), reflecting the success of the new portfolio, focused on increasing the value for the customer, and of the Christmas campaign to attract new customers with “Movistar TV” (from 1 December to 31 January all customers subscribing “Movistar Fusión” or an additional mobile line enjoyed the complete “Movistar TV” package free of charge until May 2014).
This improved commercial performance was also reflected in the mobile contract segment, particularly in mobile portability, which improved despite the high competition and the strategy of eliminating mobile handset subsidies.
At the end of 2013, “Movistar Fusión” reached 2.9 million customers, and more than one million additional mobile lines, which in the consumer segment accounted for 52% of fixed broadband and 45% of mobile contract customers. Noteworthy another quarter was the continued improvement in the percentage of new customers and/or customers taking new services, reaching 64% of “Movistar Fusión” gross additions and reflecting the positive impact of the Company’s convergent offer on the capture of new services (30% in the same quarter of 2012). On the other hand, it is worth to mention that “Movistar Fusión” customers’ churn is also lower than the average for the rest of services.
However, the improvement in commercial activity was progressive along the quarter, so its impact is not entirely reflected in the fourth quarter financial performance.
Total revenues fell by 11.9% year-on-year in the fourth quarter and by 13.6% in 2013, maintaining the stabilisation trend in the year-on-year decline compared with the previous quarter, and reflecting the increased commercial activity and the lower decline in mobile handset revenues.
The OIBDA margin stood at 50.2% in the last quarter and 48.9% in January-December, up respectively 1.2 percentage points and 3.3 percentage points year-on-year in organic terms (excluding tower sales), thanks to the benefits and savings derived from the Company’s transformation process (simplification of the commercial and operating model, improvement in service quality and customer satisfaction, containment of personnel expenses and benefits of Telefónica’s scale).
At the end of 2013, Telefónica España managed 41.7 million accesses (-4% year-on-year). In the fixed business it should be highlighted:
➜ Retail fixed telephony accesses (-5% year-on-year) posted a quarterly net loss of 171 thousand accesses, slightly higher than the loss registered in the same quarter of 2012, impacted by the intense competition in the market.
➜ Retail fixed broadband accesses grew 2% year-on-year in 2013, with net additions of 35 thousand in the fourth quarter, doubling previous quarter figure thanks to a higher volume of gross additions (+16% quarter-on-quarter), fostered by the strong take-up of the new portfolio and the Christmas campaign. As such, gross additions positive performance along with churn improvement (1.6% in 2013 and 1.7% in the fourth quarter, down 0.2 percentage points year-on-year in both cases) led net additions to total 137 thousand customers in the year (+36% year-on-year).
Fibre customers posted record growth in the fourth quarter, with net additions of 100 thousand customers. As a result, the number of households connected reached 594 thousand at the end of December, virtually double the number in 2012 and accounting for 17% of households passed with this technology (3.5 million). The Company’s strategic focus on the acceleration of fibre rollout as the key lever to drive differentiation and growth in 2014, is reflected in its target of achieving 7.1 million households passed by the end of the year. Fibre customers have 1.5 times higher ARPU than ADSL customers and a higher level of customer satisfaction, and therefore a lower churn rate (0.5 times).
Effective broadband ARPU stood at 25.5 euros in 2013 (-8.9% year-on-year; -10.2% in October-December). ARPU performance in the fourth quarter was impacted by the Christmas campaign, which offered for free “Movistar TV”. Note that since the launch of “Movistar Fusión”, the ARPU of individual services is less representative, as it is affected by the defined allocation of convergent product revenues between the fixed and mobile businesses.
➜ Pay TV accesses (673 thousand) showed a significant improvement in the fourth quarter, reversing a downward trend and posting a quarterly positive net addition for the first time in 2013 of 63 thousand customers, underpinned by the successful Christmas campaign aimed at boosting the uptake of this service.
Highlights at the wireless business:
➜ Total mobile accesses stood at 19.0 million (-8% year-on-year), with the contract segment now accounting for 78% of the total (+3 percentage points year-on-year) and smartphone penetration reaching 50% of the mobile access base (+12 percentage points year-on-year).
The contract net loss in the fourth quarter improved significantly (-129 thousand accesses; -29% year-on-year; -11% quarter-on-quarter) and was the smallest in 2013 due to the better portability trend and the higher customer gross additions. The portability balance narrowed to -159 thousand accesses (-211 thousand in the third quarter), thanks to the success of the new portfolio (4G services, a new offer for the average market segment for 20 euros/month) and the Christmas campaign, which boosted the number of additional mobile lines contracted.
Total churn stood at 2.3% in the fourth quarter and at 2.2% in 2013, stable year-on-year. Contract churn stood at 1.9% in both the fourth quarter and in 2013 (stable year-on-year; +0.2 percentage points year-on-year respectively).
ARPU in the fourth quarter declined by 17.0% year-on-year (-18.8% in the third quarter), impacted by the 60% cut in the mobile termination rate since 1 July, additional to the cuts implemented in April 2013 (-13%) and October 2012 (-8%). The performance of ARPU also reflected lower customer usage and the lower prices of the new tariff portfolio. The smaller year-on-year decline in ARPU compared with the third quarter is due to a more homogeneous year-on-year comparison following the launch of “Movistar Fusión” in October 2012. However, it is worth noting that the ARPU of individual services is less representative following the launch of “Movistar Fusión”, as it is affected by the defined allocation of convergent product revenues between the fixed and mobile businesses.
Revenues at Telefónica España amounted to 12,959 million euros, down 13.6% vs. 2012, partly as a result of the sharp drop in revenues from handset sales (-46.4% year-on-year) due to the removal of subsidies in March 2012. In the fourth quarter, revenue year-on-year performance improved slightly (-11.9%), mainly due to a lower decline in handset revenues (-13.0%), which reflected a more homogeneous year-on-year comparison, and the better revenue performance in the fixed business.
Excluding handset sales, revenues in 2013 amounted to 12,417 million euros (-11.2%), with the pace of year-on-year decline stabilising in the final quarter (-11.8%). Excluding the impact of regulation (interconnection and roaming), these revenues fell 9.6% year-on-year both in the year and in the fourth quarter.
➜ Fixed line revenues fell by 7.1% year-on-year in 2013 and 4.8% in the last quarter, reducing their pace of year-on-year decline for the fourth quarter in a row, on the back of the improved commercial activity, especially in fibre. The fourth quarter of 2013 includes the booking of Universal Service revenues of 19 million euros (31 million euros in the fourth quarter of 2012).
139138

Telefónica | Annual Report 2013 Telefónica | Annual Report 2013 141
Telefónica Integrated report 2013 6. Appendices
140
➜ Mobile business revenues declined 20.8% year-on-year in January-December and 18.9% in the fourth quarter, posting a slight improvement vs. the previous quarter (-19.7% year-on-year) thanks to the improved performance of handset revenues (more homogeneous year-on-year comparison).
Mobile service revenues declined by 16.0% year-on-year vs. 2012 and by 19.8% in the fourth quarter, a slightly worse performance than in the previous quarter (-18.3% year-on-year), mainly due to the lower impact from the loyalty programme savings, though this impact was offset by the smaller decline of handset revenues in the quarter.
Operating expenses amounted to 7,042 million euros in 2013, down 17.6% year-on-year (-11.5% in the fourth quarter), on the back of a noteworthy continued reduction in commercial costs (-31.3% year-on-year) mainly as a result of the elimination of handset subsidies and other savings from the various efficiency improvement programmes. In the fourth quarter, commercial costs fell by 20.8% year-on-year, reflecting a more homogeneous year-on-year comparison following the change in the Company’s commercial model and the more intense commercial effort in the period.
Breakdown by components:
➜ Supplies (2,486 million euros) fell by 23.9% vs. 2012 due to lower mobile handset costs as a consequence of the new commercial policy and lower mobile interconnection costs. In the fourth quarter supplies fell by 14.2% year-on-year, reflecting a higher handset and content cost.
➜ Subcontract expenses (2,033 million euros) up to December fell by 20.9%, reflecting lower commercial expenses and the savings from the Company’s simplification, as well as the redefinition of the distribution channel and call centres and the insourcing of activities. In the fourth quarter the pace of decline eased (-11.5% year-on-year), reflecting increased commercial costs associated with advertising and commissions, and the improved operating performance.
➜ Personnel expenses in January-December totalled 2,113 million euros, down 6.1% year-on-year (-7.2% in the quarter) as a result of the savings derived from the redundancy programme (171 million euros, 45 million euros in the quarter) and from the temporary suspension of the Company’s contribution to the pension plan since April (63 million euros, 19 million euros in the quarter). The quarterly performance is impacted by the higher number of employees that left the Company compared with previous quarters. At the end of December, Telefónica España’s headcount totalled 29,764 employees (-5.3% year-on-year).
OIBDA in 2013 totalled 6,340 million euros, down 7.2% year-on-year in organic terms, reaching an OIBDA margin of 48.9% (+3.3 percentage points year-on-year in organic terms) despite the pressure on revenues. In the fourth quarter, the OIBDA fell by 9.6% in organic terms and the OIBDA margin stood at 50.2% (+1.2 percentage points year-on-year in organic terms).
It should be noted that the year-on-year performance of OIBDA was affected by the sale of non-strategic towers for 70 million euros in the fourth quarter of 2013 in comparison with 60 million euros in 2012 (28, 16 and 16 million euros in the first, third and fourth quarter respectively); by the Universal Service in the fourth quarter of this year (7 million euros) and of 2012 (9 million euros); and by the sale of applications in the second quarter of 2012 (18 million euros).
CapEx amounted to 1,529 million euros in 2013 (-13.6% year-on-year in organic terms), reflecting the high level of investment efficiency, as a result of the improvements in quality indexes, the reduction of complaints (-63% year-on-year) and the enhanced efficiency in IT. However, CapEx grew by 21.2% year-on-year in the fourth quarter due to the acceleration in the rollout of fibre, and the boost of LTE deployment to cover around 40% of the population at the end of 2013. Both services are key differentiation drivers for Telefónica España’s offer in 2014.
In organic terms, the extension of spectrum licenses for the 900 MHz band, booked in the second and third quarters of 2013 (65 and 4 million euros, respectively) is excluded.
Operating cash flow (OIBDA-CapEx) totalled 4,811 million euros in 2013, down 5.0% year-on-year in organic terms.
Telefónica UK (year-on-year changes in local currency)
In the fourth quarter of 2013, Telefónica UK posted another set of strong commercial results. Contract net additions maintained a solid momentum driven by the success of the “Refresh” proposition, enabling Telefónica UK to differentiate itself in a highly competitive market.
Telefónica UK continued working on the deployment of its LTE network reaching 38% outdoor coverage at the end of 2013, keeping the focus on offering an outstanding network experience and an exclusive content proposition to 4G customers. The first 4G adopters are showing encouraging results in terms of data consumption (up to 2 times higher average data consumption than 3G customers), demonstrating the ARPU uplift opportunity of this technology.
Telefónica UK maintained strong commercial traction on the back of the solid momentum of the “Refresh” offer. In the last quarter, 56% of contract commercial activity has been done under the “Refresh” proposition (+3 percentage points quarter-on-quarter). “Refresh” has become the vehicle to move towards a more rational commercial approach while the Company improves distribution dynamics in the market towards more efficient channels.
From the 1st of May 2013, Telefónica UK excludes the financial results of its fixed consumer business (122 million euros in revenues and 3 million euros in OIBDA in the period January-December 2012 vs. 35 million euros of revenues with no relevant OIBDA contribution in January-April 2013).
Total accesses reached 23.9 million at the end of December 2013 (+0.3% year-on-year) despite the impact from the disposal of the fixed assets (720 thousand accesses: 209 thousand in fixed telephony accesses and 511 thousand in fixed broadband accesses).
Operating highlights are:
➜ Total mobile customers grew 3% year-on-year to 23.6 million at the end of December driven by the consistent growth of the mobile contract customer base (+8% year-on-year). The contract mix increased 2 percentage points year-on-year to account for 54% of the mobile base.
➜ Contract net additions totalled 983 thousand in 2013 (+2% year-on-year) with 222 thousand net additions in the fourth quarter (the eight quarter in a row above the 200 thousand level) driven by solid gross additions (+3% in 2013), despite the highly competitive environment.
➜ Contract churn remained at market-leading levels of 1.0% for the fourth consecutive quarter, demonstrating the successful management of its customer base. In 2013, contract churn improved by 0.1 percentage points to 1.0%. Total churn was 0.2 percentage points lower than in the fourth quarter of 2012 to 2.2% and 0.4 percentage points better than in 2012, closing at 2.3%.
➜ Smartphone penetration grew 4 percentage points year-on-year and reached 49% by the end of December.
Blended ARPU1 declined 9.7% year-on-year in the fourth quarter and 8.8% year-on-year in 2013, impacted by the “Refresh” model (higher handset revenues are recorded upfront and as a result, impact on lower service revenues). Voice ARPU declined 8.7% year-on-year in the quarter excluding MTRs (-8.4% in the January-December period). Data ARPU was down 7.4% in the fourth quarter (-4.5% year-on-year in 2013).
Revenue grew 0.3% year-on-year in the fourth quarter and decreased slightly in the January-December period (-0.5% year-on-year) to 6,692 million euros. Revenue evolution reflects the disposal of the fixed consumer business, in addition to the contribution of “Refresh” (+5.8 percentage points to revenue growth in the twelve months to December and 8.5 percentage points in the last quarter).
Mobile service revenue totalled 5,461 million euros in 2013, 5.7% lower than a year ago (-6.1% in the fourth quarter). Excluding the impact of mobile termination rate cuts and roaming regulation, as well as the impact of the new commercial model, mobile service revenues would have decreased 0.8% in the fourth quarter year-on-year (-1.3% in 2013), maintaining the improving trend.
Non-SMS data revenue in the quarter decreased 1.0% but showed strong growth of 5.5% year-on-year up to December, accounting for 50% of data revenues (+3 percentage points year-on-year).
Data revenue declined 1.2% year-on-year in the twelve months to December (-3.7% in the fourth quarter). In 2013, data revenue accounted for 53% of mobile service revenues, 2 percentage points higher vs. previous year.
Operating expenses year-on-year declined 1.2% to 5,256 million euros (-3.2% in the fourth quarter). Efficiency accelerated in the last quarter of the year on lower commissions and the benefits of “Refresh” proposition and the outsourcing the customer service activities in the first quarter of 2013. Expenses during 2013 were affected by restructuring expenses (40 million euros recorded in the second quarter and 8 million euros in the first quarter).
OIBDA grew 7.0% year-on-year in 2013 and totalled 1,637 million euros (+11.8% year-on-year in the fourth quarter). Year-on-year evolution is positively affected by the capital gain of 83 million euros from the fixed consumer business disposal recorded in the second quarter and negatively impacted by restructuring expenses previously mentioned. In addition, OIBDA performance reflects the acceleration in the accounting of handset sales from “Refresh” model, partially mitigated by the negative impact from higher upfront commercial costs of moving volumes towards direct channels.
As a result, OIBDA margin stood at 25.4% in the fourth quarter (+2.6 percentage points year-on-year) and 24.5% in the twelve months to December (+1.7 percentage points year-on-year).
CapEx amounted to 1,385 million euros up to December (-6.7% year-on-year excluding spectrum acquisition of 719 million euros).
Operating cash-flow (OIBDA-CapEx) totalled 252 million euros in 2013 (+19.0% excluding the spectrum acquisition).
Telefónica Deutschland
The German mobile market remained very dynamic and competitive, with differentiated value propositions across segments, channels and regions and increasing commercial spend.
In the fourth quarter of 2013, the Company continued pushing data monetisation within its innovative multibrand and data centric strategy. At the same time, the Company continued the densification of its mobile data networks while accelerating the deployment of LTE.
Telefónica Germany’s total access base reached 25.2 million at the end of December 2013, decreasing 1% year-on-year.
(2) Revenues from the “Refresh” model are not being reported under mobile service revenues and are instead reported in hardware revenues, thus smartphone device sales are not being reflected in ARPU.

Telefónica | Annual Report 2013 Telefónica | Annual Report 2013142
Telefónica Integrated report 2013 6. Appendices
Main operating highlights are:
➜ Contract customer base grew 2% year-on-year driving mobile accesses to 19.4 million (+1% year-on-year) and contract mix improved 1 percentage point year-on-year to 53%.
➜ Smartphone penetration reached 31% at the end of 2013 (+5 percentage points year-on-year), with an encouraging adoption of LTE-enabled handsets (approximately 80% of total shipments in the fourth quarter vs. 55% in the third quarter).
➜ Total net additions amounted 101 thousand in 2013 and -175 thousand in the fourth quarter. Contract net additions reached 178 thousand in 2013 (-30 thousand in the fourth quarter, affected by the disconnection of customers in the business segment as well as a change of platform in some partners). Prepay net losses totalled -76 thousand in 2013 and -146 thousand in the quarter due to usual seasonal behaviours in the segment.
➜ Contract churn was affected by the above mentioned impacts in the October-December period and reached 2.1% in the fourth quarter (+0.6 percentage points year-on-year), driving 2013 churn to 1.6% (+0.1 percentage points year-on-year). Prepay churn was 3.6% in the quarter (+0.1 percentage points year-on-year) and 3.2% in 2013 (+0.2 percentage points vs. 2012).
➜ Mobile ARPU declined 7.9% year-on-year in 2013 (-8.0% in the fourth quarter). Excluding mobile termination rate cuts, ARPU declined 4.3% in 2013 and 5.1% in the quarter, on the back of tariff migrations, acceleration of the decrease in SMS volumes and an increasing share of discounted online channel activities, which was partly offset by the increasing demand for mobile data services.
➜ Data ARPU grew 0.7% in the year (+0.3% year-on-year in the fourth quarter) despite the negative impact of further deceleration in SMS volumes, while voice ARPU maintained its trend, declining -14.9% year-on-year, both in the year and in the quarter, on the back of regulatory impacts and customers renewing their tariffs to current price points.
➜ Retail broadband fixed internet accesses amounted to 2.2 million at the end of December (-6% year-on-year), declining by 22 thousand in the fourth quarter, but maintaining their improving trend vs. previous quarters (-29 thousand in the third quarter, -40 thousand in the second quarter) showing the good acceptance of the new “O2 DSL All-in” portfolio and the increasing customer demand for speed.
Revenues up to December totalled 4,914 million euros (-5.7% year-on year; -7.4% year-on-year in the fourth quarter). Excluding the impact from mobile termination rate cuts, revenues declined 3.5% in 2013 and 5.7% in the fourth quarter, continuing previous quarters trends with on-going headwinds coming from customer base repositioning and the acceleration of SMS volume decline.
Mobile service revenue reached 2,989 million euros in 2013 (-5.2% year-on-year; -6.3% year-on-year in the fourth quarter). Excluding mobile termination rate cuts, mobile service revenue declined by 1.5% in 2013 (-3.4% in the fourth quarter) explained by the previously mentioned impacts from tariff migrations and lower SMS volumes, not fully offset by the further expansion of mobile data business.
Non-SMS data revenue grew 21.7% year-on-year in 2013 and 18.6% year-on-year in the fourth quarter, representing 67% of total data revenues in 2013 (+10 percentage points year-on-year). As a result, mobile data revenues grew 3.7% in the year (+2.1% in October-December period), accounting for 48% of 2013 mobile service revenues (+4 percentage points year-on-year).
Handset revenues decreased by 1.4% year-on-year in 2013 and by 8.9% year-on-year in the fourth quarter. This is mostly explained by the lower number of devices sold in the quarter as well as an increasing share of attractive affordable handsets, including selective bundled offers of selected smartphones with high value mobile data tariffs.
Fixed revenues declined by 9.4% year-on-year in 2013 to reach 1,235 million euros and 9.2% year-on-year in the fourth quarter. This is mainly the result of the decline in DSL customer base (mitigated by an increasing uptake of VDSL) and a further reduction of revenues from the low margin voice transit business.
Operating expenses declined 2.1% year-on-year in 2013 driven by lower interconnection costs for mobile voice and SMS and lower costs associated with the fixed business and declining personnel expenses due to different phasing of activities vs. the previous year. These efficiencies offset higher commercial costs associated with retention activities and promotions.
OIBDA totalled 1,308 million euros in 2013, declining 3.2% year-on-year and growing 6.5% year-on-year in the fourth quarter. The fourth quarter of the year was positively impacted by capital gains obtained from the sale of assets of 76 million euros (46 million euros for fibre assets and 30 million euros for its hosting business Telefónica Online Services). Excluding these effects, OIBDA in the fourth quarter declined by 14.3% year-on-year as a result of revenue flow-through, higher commercial investments and specific handset promotions.
OIBDA margin reached 26.6% in 2013 (+0.7 percentage points year-on-year) and 31.4% in the fourth quarter (+4.1 percentage points year-on-year). Excluding the above mentioned sale of assets, OIBDA margin stood at 25.2% (-2.0 percentage points year-on-year) in the fourth quarter and at 25.1% in 2013 (-0.9 percentage points year-on-year).
CapEx in 2013 totalled 666 million euros, increasing 9.4% compared to 2012, with the Company focusing its efforts on network quality while accelerating investment in LTE network deployment (population coverage above 40% at the end of the year) to support future mobile data growth.
Operating cash flow (OIBDA-CapEx) amounted to 642 million euros in 2013, -13.5% year-on-year (-23.8% year-on-year excluding previously mentioned asset sales).
Telefónica Czech Republic (year-on-year changes in constant currency)
In the fourth quarter of 2013, Telefónica Czech Republic sustained a sound commercial momentum on the back of the success of the “FREE” tariffs together with the delivery of its efficiency agenda execution. Telefónica Slovakia kept its double digit subscriber’s growth and increasing further its contribution to the Group financial performance.
Telefónica Czech Republic and Telefónica Slovakia participated in the LTE auctions that took place in the last quarter, securing the frequencies required to roll-out their new generation LTE network and cope with the future data customers demand. As such, T. Czech Republic acquired 2 blocks in the attractive 800 MHz band and further acquired 3 blocks in the 1800 MHz and 4 blocks in the 2600 MHz band. The total cost of the frequencies was 108 million euros and will enable a fast and efficient expansion of LTE. Meanwhile, Telefónica Slovakia acquired the frequencies in 800 MHz and 1800 MHz band, allowing the Company to build a high speed and high quality LTE network by an amount of 40 million euros.
Total accesses, including Slovakia, totalled 9.3 million at the end of 2013 (+1% year-on-year) affected by the disconnection of 114 thousand accesses of inactive mobile contract customers in the first quarter of 2013 in Czech Republic.
Operating highlights in the mobile business include:
➜ Total mobile customer base in the Czech Republic stood at 5.1 million at the end of the year (stable year-on-year), despite the above mentioned disconnections. The contract base increased its weight over the total base by 0.6 percentage points year-on-year to 63%.
Success of the “FREE” tariffs resulted into increasing gross additions in the October-December period (+4% year-on-year) and led to a sequential improvement of contract net additions, which reached 41 thousand (22 thousand in the third quarter) to amount 158 thousand in 2013, when excluding disconnections. Total net additions stood at 133 thousand in the year, excluding the adjustment, and 27 thousand in the fourth quarter, improving vs. previous quarter (-7 thousand) driven by the already commented improvement in contract.
➜ The total number of customers in Slovakia maintained its growth trend at 14% reaching 1.5 million customers at the end of 2013, with contract base growing at 17% year-on-year to 50% of the base (+2 percentage points year-on-year). Total net additions in 2013 reached 185 thousand (62% in contract) and 68 thousand in the last quarter (half of them in contract).
➜ Smartphone penetration grew 11 percentage points year-on-year to 25% at the end of 2013 in the Czech Republic, with smartphone sales representing 65% of total handset sales in the quarter.
➜ Contract churn in the quarter stood at 1.2% (+0.2 percentage points year-on-year) and total churn at 2.1% (+0.3 percentage points year-on-year) in the Czech Republic. In 2013, contract churn totalled 1.4% (+0.4 percentage points year-on-year) affected by the previously mentioned disconnections, driving total churn to 2.2% (+0.4 percentage points year-on-year).
➜ ARPU in the Czech Republic improved its trend compared with the previous quarter (-16.9% year-on-year in the fourth quarter vs. -18.7% year-on-year in the third quarter) and declined 16.3% in 2013 mainly explained by the ARPU dilution in the business and consumer segment due to customer optimization and migrations to “FREE” and “Vario” tariffs and the negative impact of mobile termination rate cuts.
143142

Telefónica | Annual Report 2013 Telefónica | Annual Report 2013
Telefónica Integrated report 2013 6. Appendices
Highlights of fixed business were:
➜ Fixed telephony accesses losses continued to ease (-23 thousand vs. -26 in the third quarter) to 111 thousand in 2013 and totalled 1.4 million (-7.4% year-on-year).
➜ Retail broadband internet accesses stood at 883 thousand at year-end (-1.8% year-on-year). VDSL continued growing and accounted for 87% of addressable xDSL residential base. The number of VDSL customers added 26 thousand in the quarter and 102 thousand in 2013.
➜ Pay TV customers grew 10% year-on-year (156 thousand at the end of the year), after accelerating net additions in the last quarter to 8 thousand (vs. 5 thousand in the third quarter) showing the success of the new O2 TV proposition leveraged on the new IPTV platform.
Revenues for the Czech Republic and Slovakia reached 1,818 million euros in 2013 (-6.8% year-on-year; -9.3% in the fourth quarter). Excluding mobile termination rate cuts, quarterly revenues were -6.7% year-on-year and -3.1% in 2013.
Mobile service revenues amounted to 960 million euros in 2013 (-10.1% year-on-year; -12.9% in the fourth quarter). Excluding the impact of regulation, mobile service revenues declined 3.6% year-on-year in 2013 and 8.2% year-on-year in the fourth quarter. Year-on-year performance was affected by an intensification of contract renegotiations in the business segment to “vario tariffs” in an aggressive market and consumer segment further optimization and migration to the attractive “FREE” tariffs. However, these tariffs are fostering mobile data revenue growth, accelerating their year-on-year trend (+9.0% year-on-year in October-December; +5.5% in 2013) on the back of the solid performance of non-SMS data revenues (+33.0% year-on-year in the fourth quarter; +24.9% in 2013).
Fixed revenues totalled 780 million euros in 2013 (-5.2% year-on-year; -8.5% year-on-year in the October-December period) driven mainly by lower ICT and fixed retail voice revenues.
Operating expenses declined 5.3% in 2013 explained by the further benefits of the efficiency agenda, with lower network & IT costs, decreasing personnel expenses as the Group continued its restructuring programme, focused on building leaner and efficient organisational structure and declining spend in commissions and marketing on the back of the simplified business model since the launch of the FREE tariffs.
OIBDA reached 754 million euros in 2013 decreasing by 6.6% year-on-year (+1.4% year-on-year in the quarter). As a result, OIBDA margin totalled 41.5% in 2013 (+0.1 percentage points year-on-year) and 47.8% in the quarter (+5.2 percentage points). It should be highlighted that the first quarter of the year was negatively impacted by restructuring expenses of 14 million euros (9 million euros in the first half of 2012 which was offset by the positive impact of 9 million euros from the sale of non-core assets). In the fourth quarter of 2013 the company recorded a non-recurrent gain from the compensation from T-Mobile for Telefónica’s contribution to network sharing partnership of 25 million euros.
CapEx totalled 218 million up to December (-9.4% year-on-year). The Company continued to direct investments into further capacity expansion, improvement of the quality of its mobile broadband network and growth areas as 3G, LTE, IPTV and VDSL.
Operating cash flow (OIBDA-CapEx) totalled 536 million in 2013 (-5.5% year-on-year).
Telefónica Europe. Accesses
Unaudited figures (Thousands) 2012 2013 % Var
Final Clients Accesses 97,575.5 95,300.7 (2.3)
Fixed telephony accesses (1) (2) 15,849.3 14,812.2 (6.5)
Internet and data accesses 10,065.4 9,449.7 (6.1)
Narrowband 444.1 385.3 (13.2)
Broadband (3) 9,576.2 9,023.6 (5.8)
Other (4) 45.1 40.8 (9.4)
Mobile accesses (5) 70,751.5 70,210.2 (0.8)
Prepay (6) 28,680.4 27,480.9 (4.2)
Contract (7) 42,071.1 42,729.2 1.6
Pay TV 909.3 828.6 (8.9)
Wholesale Accesses 5,684.3 6,317.0 11.1
Total Accesses 103,259.8 101,617.7 (1.6)
Telefónica Europe. Mobile Accesses
Unaudited figures (Thousands) 2012 2013 % Var
Prepay percentage (%) 40.5% 39.1% (1.4 p.p.)
Contract percentage (%) 59.5% 60.9% 1.4 p.p.
MBB accesses (‘000) 25,499.1 29,219.0 14.6
MBB penetration (%) 36% 42% 5.6 p.p.
Smartphone penetration (%) 35% 42% 7.1 p.p.
Notes: - Telefónica España mobile accesses include since 2013 the accesses of Tuenti and in 2012 they have been restated with the same criteria.(1) PSTN (including Public Use Telephony) x1; ISDN Basic access x1; ISDN Primary access; 2/6 Access x30. Company’s accesses for internal use included. Includes VoIP and Naked ADSL.(2) In the second quarter of 2013, 209 thousand accesses were disconnected due to the disposal of the assets of the fixed business in UK.(3) In the second quarter of 2013, 511 thousand accesses were disconnected due to the disposal of the assets of the fixed business in UK.(4) Retail circuits other than broadband.(5) First quarter of 2012 includes the disconnection of 2.0 million inactive accesses in Spain.(6) First quarter of 2012 includes the disconnection of 1.2 million inactive accesses in Spain.(7) First quarter of 2012 includes the disconnection of 800 thousand inactive accesses in Spain. First quarter of 2013 includes the disconnection of 114 thousand inactive accesses in Czech Republic.
145144

Telefónica | Annual Report 2013 Telefónica | Annual Report 2013
Telefónica Integrated report 2013 6. Appendices
Telefónica Europe. Consolidated Income Statement
Jan-Dec % Variación
Unaudited figures (Euros in millions) 2013 2012 Reportado
Revenues 26,840 30,006 (10.6)
Internal expenditure capitalized in fixed assets 500 478 4.6
Operating expenses (17,607) (19,807) (11.1)
Supplies (8,413) (9,825) (14.4)
Personnel expenses (3,372) (3,514) (4.0)
Subcontracts (5,253) (5,854) (10.3)
Bad debt provision (220) (250) (12.1)
Taxes (349) (364) (4.3)
Other net operating income (expense) 122 (56) c.s.
Gain (loss) on sale of fixed assets 71 173 (58.8)
Impairment of goodwill and other assets (10) (565) (98.3)
Operating income before D&A (OIBDA) 9,917 10,228 (3.0)
OIBDA Margin 36.9% 34.1% 2.9 p.p.
Depreciation and amortization (4,706) (5,014) (6.2)
Operating income (OI) 5,211 5,214 (0.0)
Note: - OIBDA and OI before management and brand fees.- From January 1st, 2013, Tuenti is included in the consolidation perimeter of T. España. Before it was included within “Other companies and eliminations” of Telefónica Group.
As a consequence, the results of T. España, T. Europe and “Other companies and Eliminations” of Telefónica Group have been restated for the fiscal year 2012. As this is an intragroup change, Telefónica consolidated results for 2012 are not affected.
Telefónica Europe. Accesses by Country
Unaudited figures (Thousands) 2012 2013 % Var
Telefónica España
Final Clients Accesses 38,821.7 36,663.6 (5.6)
Fixed telephony accesses (1) 11,723.0 11,089.8 (5.4)
Naked ADSL 25.0 22.8 (9.1)
Internet and data accesses 5,779.3 5,899.0 2.1
Narrowband 54.0 38.5 (28.7)
Broadband (2) 5,709.3 5,846.8 2.4
Other (3) 16.0 13.7 (14.2)
Mobile accesses (4) 20,608.7 19,002.1 (7.8)
Prepay (5) 5,180.5 4,262.7 (17.7)
Contract (6) 15,428.2 14,739.3 (4.5)
Pay TV 710.7 672.7 (5.4)
Wholesale Accesses 4,396.0 4,990.1 13.5
WLR (7) 481.2 525.8 9.3
Unbundled loops 3,262.0 3,787.1 16.1
Shared ULL 183.5 130.6 (28.9)
Full ULL (8) 3,078.5 3,656.5 18.8
Wholesale ADSL 652.3 676.8 3.8
Others (9) 0.5 0.4 (23.9)
Total Accesses 43,217.8 41,653.6 (3.6)
Telefónica UKFinal Clients Accesses 23,801.7 23,872.0 0.3
Fixed Telephony Accesses (1) (10) 377.4 208.2 (44.8)
Internet and data accesses 560.1 14.8 (97.4)
Broadband (11) 560.1 14.8 (97.4)
Mobile accesses 22,864.2 23,649.0 3.4
Prepay 10,962.9 10,764.7 (1.8)
Contract 11,901.3 12,884.3 8.3
Wholesale Accesses 40.5 31.6 (22.1)
Total Accesses 23,842.2 23,903.6 0.3
Telefónica GermanyFinal Clients Accesses 24,284,9 24,042.0 (1.0)
Fixed Telephony Accesses (1) 2,249,0 2,124.9 (5.5)
Internet and data accesses 2,678,9 2,516,1 (6.1)
Narrow band 302,6 271.7 (10.2)
Broadband 2,376,3 2,244.3 (5.6)
Mobile accesses 19,299,9 19,401.0 0.5
Prepay 9,191,3 9,114.9 (0.8)
Contract 10,108,5 10,286.1 1.8
Pay TV (12) 57,2 0.0 n.s.
Wholesale Accesses 1,087,9 1,125.0 3.4
Total Accesses 25,372,8 25,166.9 (0.8)
147146

Telefónica | Annual Report 2013 Telefónica | Annual Report 2013
Telefónica Integrated report 2013 6. Appendices
Telefónica Europe. Accesses by Country
Unaudited figures (Thousands) 2012 2013 % Var
Telefónica Ireland
Internet and data accesses 31.0 34.8 12.2
Broadband 31.0 34.8 12.2
Mobile accesses 1,541.7 1,517.2 (1.6)
Prepay 759.7 706.9 (7.0)
Contract 782.0 810.3 3.6
Total Accesses 1,572.7 1,552.0 (1.3)
Telefónica Czech RepublicFinal Clients Accesses 7,740.3 7,631.8 (1.4)
Fixed telephony accesses (1) 1,499.9 1,389.3 (7.4)
Naked ADSL 285.9 324.9 13.7
VoIP 76.7 86.4 12.7
Internet and data accesses 1,016.1 985.0 (3.1)
Narrowband 87.6 75.1 (14.3)
Broadband 899.4 882.9 (1.8)
Other 29.1 27.1 (6.8)
Mobile accesses 5,082.9 5,101.5 0.4
Prepay 1,891.1 1,866.1 (1.3)
Contract (13) 3,191.7 3,235.4 1.4
Pay TV 141.4 156.0 10.3
Wholesale Accesses 159.9 170.4 6.6
Total Accesses 7,900.1 7,802.2 (1.2)
Telefónica slovakiaMobile accesses 1,354.2 1,539.5 13.7
Prepay 694.9 765.6 10.2
Contract 659.3 773.9 17.4
Total Accesses 1,354.2 1,539.5 13.7
“Note:-Telefónica España mobile accesses include since 2013 the accesses of Tuenti and in 2012 they have been restated with the same criteria.”(1) PSTN (including Public Use Telephony) x1; ISDN Basic access x1; ISDN Primary access; 2/6 Access x30. Company’s accesses for internal use included. Includes VoIP and Naked ADSL.(2) ADSL, satellite, optical fiber and broadband circuits.(3) Leased lines.(4) First quarter of 2012 includes the disconnection of 2.0 million inactive accesses.(5) First quarter of 2012 includes the disconnection of 1.2 million inactive accesses.(6) First quarter of 2012 includes the disconnection of 800 thousand inactive accesses.(7) Wholesale Line Rental.(8) Includes naked shared loops.(9) Wholesale circuits.(10) In the second quarter of 2013, 209 thousand accesses were disconnected due to the disposal of the assets of the fixed business in UK.(11) In the second quarter of 2013, 511 thousand accesses were disconnected due to the disposal of the assets of the fixed business in UK.(12) In the fourth quarter of 2013, all TV accesses were disconnected.(13) First quarter of 2013 includes the disconnection of 114 thousand inactive accesses.
Telefónica Europe. Cumulative Selected Operating Mobile Business Data by Country
Unaudited Figures 2012 2013 % Var M local
Telefónica España
Traffic (Million minutes) 36,382 34,428 (5.4)
ARPU (EUR) (1) 20.6 17.7 (14.3)
Prepay (2) 8.8 7.3 (17.8)
Contract (3) 24.7 21.0 (15.0)
Data ARPU (EUR) (1) 6.5 6.8 4.4
% non-SMS over data revenues (4) 85.2% 92.1% 7.0 p.p.
Telefónica UKTraffic (Million minutes) 48,250 48,479 0.5
ARPU (EUR) 22.5 19.6 (8.8)
Prepay 9.6 7.7 (16.0)
Contract 35.0 29.9 (10.4)
Data ARPU (EUR) 11.4 10.4 (4.5)
% non-SMS over data revenues 46.8% 50.0% 3.2 p.p.
Telefónica GermanyTraffic (Million minutes) 29,519 30,152 2.1
ARPU (EUR) 13.8 12.7 (7.9)
Prepay 5.5 5.1 (6.8)
Contract 21.5 19.4 (9.8)
Data ARPU (EUR) 6.2 6.2 0.7
% non-SMS over data revenues 56.7% 66.5% 9.8 p.p.
Telefónica IrelandTraffic (Million minutes) 3,896 3,756 (3.6)
ARPU (EUR) 29.4 26.4 (10.1)
Prepay 20.2 18.3 (9.0)
Contract 39.0 33.8 (13.3)
Data ARPU (EUR) 13.4 13.5 1.2
% non-SMS over data revenues 47.7% 53.3% 5.6 p.p.
Telefónica Czech Republic (5)
Traffic (Million minutes) 9,592 10,782 12.4
ARPU (EUR) (6) 15.5 12.5 (16.3)
Prepay 6.9 5.5 (17.1)
Contract (6) 20.6 16.7 (16.4)
Data ARPU (EUR) 4.4 4.2 (1.5)
% non-SMS over data revenue 46.3% 55.4% 9.1 p.p.(1) ARPU and year-on-year change affected by the disconnection of 2.0 million inactive accesses in the first quarter of 2012.(2) ARPU and year-on-year change affected by the disconnection of 1.2 million inactive accesses in the first quarter of 2012.(3) ARPU and year-on-year change affected by the disconnection of 0.8 million inactive accesses in the first quarter of 2012.(4) Non-SMS revenues include in 2013 the minimum consumption part of contract customers that corresponds to data revenues and Tuenti. Thus, 2012 figures have been restated.(5) KPIs for mobile business in Czech Republic do not include Slovakia.(6) ARPU and year-on-year change affected by the disconnection of 114 thousand inactive accesses in the first quarter of 2013.Notes: - ARPU calculated as a monthly average of the quarter for each period.- Traffic is defined as minutes used by the company customers, both outbound and inbound. On-net traffic is only included once (outbound), and promotional traffic is included.
Traffic not associated to the Company’s mobile customers (roaming-in, MVNOs, interconnection of third parties and other business lines) is excluded. Traffic volume non rounded.- Telefónica España ARPU and traffic are affected by the entrance of Tuenti in its consolidation perimeter in 2013, and in 2012 they have been restated with the same criteria.
149148

Telefónica | Annual Report 2013 Telefónica | Annual Report 2013
Telefónica Integrated report 2013 6. Appendices
Telefónica Europe. Selected Financial Data by Country (I)
Jan-Dec
Unaudited figures (Euros in millions) 2012 2013 % Var % Var M local
Teléfonica EspañaRevenues 12,959 14,996 (13.6)
Revenues ex-handset revenues 12,417 13,984 (11.2)
Wireline Business 5,121 6,464 (20.8)
FBB and new services (1) 4,580 5,453 (16.0)
Voice & access revenues 1,606 1,666 (3.6)
Others 542 1,011 (46.4)
Wireless Business 8,861 9,541 (7.1)
Mobile service revenues 4,312 4,431 (2.7)
Data revenues (2) 4,091 4,628 (11.6)
Handset revenues 458 481 (4.9)
OIBDA 6,340 6,815 (7.0)
OIBDA margin 48.9% 45.4% 3.5 p.p.
CapEx (3) 1,529 1,692 (9.6)
OpCF (OIBDA-CapEx) (3) 4,811 5,123 (6.1)
Teléfonica UKRevenues 6,692 7,042 (5.0) (0.5)
Mobile service revenues 5,461 6,060 (9.9) (5.7)
Data revenues 2,897 3,070 (5.6) (1.2)
Handset revenues and other 1,231 981 25.4 31.3
OIBDA 1,637 1,601 2.2 7.0
OIBDA Margin 24.5% 22.7% 1.7 p.p.
CapEx (4) 1,385 748 85.3 94.0
OpCF (OIBDA-CapEx) (4) 252 854 (70.5) (69.1)
Telefónica GermanyRevenues 4,914 5,213 (5.7)
Wireline Business 3,673 3,845 (4.5)
FBB and new services (1) 2,989 3,152 (5.2)
Voice & access revenues 1,443 1,391 3.7
Others 684 693 (1.4)
Wireless Business 1,235 1,363 (9.4)
Mobile service revenues 869 977 (11.0)
Data revenues 355 372 (4.4)
Handset revenues 11 15 (27.1)
OIBDA 1,308 1,351 (3.2)
OIBDA margin 26.6% 25.9% 0.7 p.p.
CapEx 666 609 9.4
OpCF (OIBDA-CapEx) 642 743 (13.5) Notes: - OIBDA before management and brand fees.- From January 1st, 2013, Tuenti is included in the consolidation perimeter of T. España. Before it was included within “Other companies and eliminations” of Telefónica Group. As a consequence, the
results of Telefónica España, Telefónica Europe and “Other companies and Eliminations” of Telefónica Group have been restated for the fiscal year 2012. As this is an intragroup change, Telefónica consolidated results for 2012 are not affected.
(1) Includes FBB connectivity services (retail and wholesale), including value added services, TV services, ICT revenues and other services over connectivity.(2) Telefónica España wireless data revenues include in 2013 the minimum consumption part of contract customers that corresponds to data revenues. Thus, 2012 figures have been restated.(3) CapEx includes 65 million euros from the spectrum acquired in the second quarter of 2013 and 4 million euros in the third quarter of 2013.(4) CapEx includes 671 million euros from the spectrum acquired in the first quarter of 2013 and 47 million euros in the second quarter of 2013.(5) CapEx includes 1 million euros from the spectrum acquired in the first quarter of 2012 and 126 million euros in fourth quarter of 2012.(6) Includes Slovakia.
Telefónica Europa. Datos financieros seleccionados por país (II)
Enero-diciembre
(millones de euros) 2012 2013 % Var % Var M local
Telefónica Ireland Revenues 556 629 (11.6)
Mobile service revenues 496 567 (12.6)
Data revenues 248 252 (1.8)
Handset revenues and other 60 62 (2.7)
OIBDA 110 130 (15.2)
OIBDA Margin 19.8% 20.7% (0.8 p.p.)
CapEx (5) 56 192 (70.6)
OpCF (OIBDA-CapEx) (5) 54 (62) c.s.
Telefónica Czech Republic Group (6)
Revenues 1,818 2.010 (9.5) (6.8)
Wireline Business 1,038 1,159 (10.4) (8.0)
FBB and new services (1) 960 1,097 (12.5) (10.1)
Voice & access revenues 313 305 2.6 5.5
Others 78 62 25.6 28.9
Wireless Business 780 851 (8.3) (5.2)
Mobile service revenues 398 408 (2.5) 0.7
Data revenues 377 438 (13.9) (11.0)
Handset revenues and other 6 5 15.7 19.6
OIBDA 754 832 (9.4) (6.6)
OIBDA margin 41.5% 41.4% 0.1 p.p.
CapEx 218 248 (12.1) (9.4)
OpCF (OIBDA-CapEx) 536 584 (8.3) (5.5) Notes: - OIBDA before management and brand fees.- From January 1st, 2013, Tuenti is included in the consolidation perimeter of Telefónica España. Before it was included within “Other companies and eliminations” of Telefónica Group. As a consequence,
the results of Telefónica España, Telefónica Europe and “Other companies and Eliminations” of Telefónica Group have been restated for the fiscal year 2012. As this is an intragroup change, Telefónica consolidated results for 2012 are not affected.
(1) Includes FBB connectivity services (retail and wholesale), including value added services, TV services, ICT revenues and other services over connectivity.(2) Telefónica España wireless data revenues include in 2013 the minimum consumption part of contract customers that corresponds to data revenues. Thus, 2012 figures have been restated.(3) CapEx includes 65 million euros from the spectrum acquired in the second quarter of 2013 and 4 million euros in the third quarter of 2013.(4) CapEx includes 671 million euros from the spectrum acquired in the first quarter of 2013 and 47 million euros in the second quarter of 2013.(5) CapEx includes 1 million euros from the spectrum acquired in the first quarter of 2012 and 126 million euros in fourth quarter of 2012.(6) Includes Slovakia.
151150

Telefónica | Annual Report 2013 Telefónica | Annual Report 2013
Telefónica Integrated report 2013 6. Appendices
Telefónica Latinoamérica
% Par T.
Telefónica de Argentina 100.0
Telefónica Móviles Argentina 100.0
Telefónica Móviles Chile 100.0
Telefónica Móviles México 100.0
Telefónica Venezuela 100.0
Telefónica Ecuador 100.0
Telefónica Móviles Uruguay 100.0
Telefónica Costa Rica 100.0
Telefónica del Perú 98.5
Telefónica Móviles Perú 98.5
Telefónica Chile 97.9
Telefónica Brasil 73.9
Telefónica Colombia 70.0
Telefónica Móviles El Salvador 60.0
Telefónica Móviles Guatemala 60.0
Telefonía Celular Nicaragua 60.0
Telefónica Móviles Panamá 60.0
Telefónica Europa
% Par T.
Telefónica de España 100.0
Telefónica Móviles España 100.0
Telefónica Reino Unido 100.0
Telefónica Irlanda (1) 100.0
Telefónica Alemania 100.0
Telefónica República Checa (2) (3) 100.0
Telyco 100.0
Telefonica Soluciones de Informática y Comunicaciones de España
100.0
Telefónica Telecomunic. Públicas 98.5
Iberbanda 98.5
Acens Technologies 97.9
Tuenti 73.9(1) Esta compañía se encuentra en proceso de desinversión.(2) 72,1% incluyendo la autocartera. El 5 de noviembre de 2013 Telefónica anunció la venta
manteniendo una participación del 4,9% en la Compañía. El 28 de enero de 2014 Telefónica anunció que tras la obtención de la autorización regulatoria pertinente se ha procedido al cierre de la operación.
(3) Incluye el 100% de Telefónica Eslovaquia.
Otras participaciones
% Par T.
Telefónica de Contenidos 100.0
Telefonica Intern. Wholesale Serv. (TIWS) 100.0
Telco SpA (1) 66.0
DTS, Distribuidora de Televisión Digital 22.0
China Unicom 5.0
BBVA 0.8(1) 66,0% de los derechos económicos. Si computáramos las acciones de ahorro (‘azioni di
risparmio’), que no confieren derechos políticos, la participación indirecta de Telefónica sobre Telecom Italia sería de un 10,28%.
Addenda _Key Holdings of the Telefónica Group Changes to the Perimeter
This document contains statements that constitute forward looking statements about Telefónica Group (going forward, “the Company” or Telefónica) including financial projections and estimates and their underlying assumptions, statements regarding plans, objectives and expectations which may refer, among others, to the intent, belief or current prospects of the customer base, estimates regarding, among others, future growth in the different business lines and the global business, market share, financial results and other aspects of the activity and situation relating to the Company.
The forward-looking statements in this document can be identified, in some instances, by the use of words such as “expects”, “anticipates”, “intends”, “believes”, and similar language or the negative thereof or by forward-looking nature of discussions of strategy, plans or intentions. Such forward-looking statements, by their nature, are not guarantees of future performance and involve risks and uncertainties, and other important factors that could cause actual developments or results to differ from those expressed in our forward looking statements. These risks and uncertainties include those discussed or identified in fuller disclosure documents filed by Telefónica with the relevant Securities Markets Regulators, and in particular, with the Spanish Market Regulator.
Analysts and investors, and any other person or entity that may need to take decisions, or prepare or release opinions about the securities issued by the Company, are cautioned not to place undue reliance on those forward looking statements, which speak only as of the date of this presentation.
Except as required by applicable law, Telefónica undertakes no obligation to release publicly the results of any revisions to these forward looking statements which may be made to reflect events and circumstances after the date of this presentation, including, without limitation, changes in Telefónica’s business or acquisition strategy or to reflect the occurrence of unanticipated events.
This document may contain summarized information or information that has not been audited. In this sense, this information is subject to, and must be read in conjunction with, all other publicly available information, including if it is necessary, any fuller disclosure document published by Telefónica.
Finally, it is stated that neither this presentation nor any of the information contained herein constitutes an offer of purchase, sale or exchange, nor a request for an offer of purchase, sale or exchange of securities, or any advice or recommendation with respect to such securities.
Disclaimer
During 2013 the main changes in the perimeter of consolidation were as follows:
➜ In June 2013 Telefónica reached an agreement to sell its entire stake in the share capital of Telefónica Ireland, Ltd. The transaction is subject, among other conditions, to obtaining the pertinent authorizations from the competition authorities. On November 5, 2013, Telefónica also signed an agreement to sell 65.9% of the share capital of Telefónica Czech Republic, a.s. to PPF Group N.V.I.. The transaction was completed on January 28, 2014 once the pertinent regulatory authorization was obtained.
Both companies continued to be included in the consolidations scope of the Telefónica Group in 2013, although the consolidated assets and liabilities included in the sale were recognized under “Non-current assets held for sale” and “Liabilities associated with non-current assets held for sale”, respectively, in the consolidated statement of financial position at December 31, 2013.
➜ On 2 August Telefónica S.A completed the sale of 40% of its assets in Guatemala, El Salvador, Nicaragua and Panama for 500 million US dollars (equivalent to 377 million euros on the date of execution of the sale). The Telefónica Group retains control over these assets, which are still fully consolidated.
➜ On 24 September 2013, Telefónica and the remaining shareholders of Telco, S.p.A reached an agreement by virtue of which Telefónica subscribed for and paid out a capital increase in Telco, S.p.A. through the contribution of 324 million euros in cash, receiving in return non-voting shares of Telco, S.p.A.. As a result of this capital increase, the interest held by Telefónica in the voting share capital of Telco, S.p.A. remains unchanged (i.e. 46.18 %, as Telefónica currently holds), although its interest in the total share capital of Telco, S.p.A. is increased to 66%. The current governance at Telco, S.p.A.’s level remains unaffected, including the obligation by Telefónica of abstaining from participating in or influencing in any decisions which could affect the markets in which both companies are present. This company is still included in the perimeter of consolidation using the equity method.
➜ In April Telefónica de Contenidos, S.A. completed the sale of its remaining stake in Hispasat S.A., i.e. 19,359 shares, to Eutelsat Services & Beteiligungen, GmbH.
➜ On 31 October the sale of T. Germany Online Services GmbH was registered. This company, which was fully consolidated, has been removed from the consolidation perimeter.
➜ In December the sale of Estrella Soluciones Prácticas, S.A., established from the business of Telefónica Móviles Soluciones y Aplicaciones, S.A., to Amdocs Chile SpA was formalised. This company has been removed from the consolidation perimeter.
153152

Telefónica | Annual Report 2013 Telefónica | Annual Report 2013
Telefónica Integrated report 2013 6. Appendices
Risk Management policy _
The Telefónica Group actively manages these risks through the use of derivatives (primarily on exchange rates, interest rates and share prices) and by incurring debt in local currencies, where appropriate, with a view to stabilizing cash flows, the income statement and investments. In this way, it attempts to protect the Telefónica Group’s solvency, facilitate financial planning and take advantage of investment opportunities.
The Telefónica Group manages its exchange rate risk and interest rate risk in terms of net debt and net financial debt as calculated by them. The Telefónica Group believes that these parameters are more appropriate to understanding its debt position. Net debt and net financial debt take into account the impact of the Group’s cash balance and cash equivalents including derivatives positions with a positive value linked to liabilities. Neither net debt nor net financial debt as calculated by the Telefónica Group should be considered an alternative to gross financial debt (the sum of current and non-current interest-bearing debt) as a measure of liquidity.
For a more detailed description on reconciliation of net debt and net financial debt to gross financial debt, see Note 2 of the Financial Report.
Exchange rate risk
The fundamental objective of the exchange rate risk management policy is that, in event of depreciation in foreign currencies relative to the euro, any potential losses in the value of the cash flows generated by the businesses in such currencies, caused by depreciation in exchange rates of a foreign currency relative to the euro, are offset (to some extent) by savings from the reduction in the euro value of debt denominated in such currencies. The degree of exchange rate hedging employed varies depending on the type of investment.
At December 31, 2013, net debt in Latin American currencies was equivalent to approximately 4,326 million euros. However, the Latin American currencies in which this debt is denominated is not distributed in proportion to the cash flows generated in each currency. The future effectiveness of the strategy described above as a hedge of exchange rate risks therefore depends on which currencies depreciate relative to the euro.
The Telefónica Group aims to protect itself against declines in Latin American currencies relative to the euro affecting asset values through the use of dollar-denominated debt, incurred either in Spain (where such debt is associated with an investment as long as it is considered to be an effective hedge) or in the country itself, where the market for local currency financing or hedges may be inadequate or non-existent. At December 31, 2013, the Telefónica Group’s net debt denominated in dollars was equivalent to 1,326 million euros.
At December 31, 2013, pound sterling-denominated net debt was approximately 2.31 times the value of the 2013 operating income before depreciation and amortization (OIBDA) from the Telefónica Europe business unit in the United Kingdom. The Telefónica Group’s aim is to maintain a similar proportion of pound sterling-denominated net debt to OIBDA as the Telefónica Group’s net debt to OIBDA ratio, on a consolidated basis, to reduce its sensitivity to changes in the pound sterling to euro exchange rate. Pound sterling-denominated net debt at December 31, 2013, was equivalent to 3,342 million euros, greater than the 2,629 million euros at December 31, 2012.
Until the sale agreement of Telefónica Czech Republic (see Note 21.b of the Financial Report), the risk-management objective to protect the investment in the Czech Republic was similar to that described for the investment in the UK, where the amount of Czech crown-denominated debt is proportional to the OIBDA of the “Telefónica Europe” business unit in the Czech Republic. Czech crown-denominated net debt at December 31, 2013 was 2.65 times OIBDA in Czech crown (2.10 times in 2012) on a consolidated basis and 3.85 times (2.97 times in 2012) on a proportional basis. An explanation for why this value is notably higher than the target of 2 times OIBDA is that once the sale of that company had been negotiated and agreed, the management target was changed to take into consideration the new position of the asset in the Group’s portfolio. It was therefore decided to hedge the collection in Czech crown from this sale.
The Telefónica Group also manages exchange rate risk by seeking to minimize the negative impact of any remaining exchange rate exposure on the income statement, regardless of whether there are open positions. Such open position exposure can arise for any of three reasons: (i) a thin market for local derivatives or difficulty in sourcing local currency finance which makes it impossible to arrange a low-cost hedge (as in Argentina and Venezuela), (ii) financing through intra-group loans, where the accounting treatment of exchange rate risk is different from that for financing through capital contributions, and (iii) as the result of a deliberate policy decision, to avoid the high cost of hedges that are not warranted by expectations or high risk of depreciation.
The following table illustrates the sensitivity of foreign currency gains and losses and of equity to changes in exchange rates, where: (i) in calculating the impact on the income statement, the exchange
rate position affecting the income statement at the end of 2014 was considered constant during 2013; (ii) in calculating the impact on equity, only monetary items have been considered, namely debt and derivatives such as hedges of net investment and loans and credits to subsidiaries considered as part of the net investment, whose breakdown is considered constant in 2014 and identical to that existing at the end of 2013. In both cases, Latin American currencies are assumed to depreciate against the dollar and the rest of the currencies against the euro by 10%.
Currency (Millions of euros) Change
Impact on the consolidated
income statement
Impact on consolidated
equity
All currencies vs EUR 10% 42 (245)
USD vs EUR 10% (1) 14European currencies vs EUR 10% 1 (460)Latin American currencies vs USD 10% 42 201
All currencies vs EUR (10)% (42) 245
USD vs EUR (10)% 1 (14)European currencies vs EUR (10)% (1) 460Latin American currencies vs USD (10)% (42) (201)
The Group’s monetary position in Venezuela at December 31, 2013 is a net debtor position of 1,716 million Venezuelan bolivars (equivalent to approximately 198 million euros). It had an average debtor position in 2013, leading to a higher financial expense in the amount of 59 million euros for the effect of inflation.
Interest rate riskThe Telefónica Group’s financial expenses are exposed to changes in interest rates. In 2013, the rates applied to the largest amount of short-term debt were mainly based on the Euribor, the Czech crown Pribor, the Brazilian SELIC, the US dollar and pound sterling Libor, and the Colombian UVR. In nominal terms, at December 31, 2013, 71% of Telefónica’s net debt (or 68% of long-term net debt) was pegged to fixed interest rates for a period greater than one year, compared to 74% of net debt (73% of long-term net debt) in 2012. Of the remaining 29% (net debt at floating rates or at fixed rates maturing in under one year), 11 percentage points had interest rates collared in a period over one year (or 3% of long-term debt), while at December 31, 2012 this was the case for 10 percentage points of net debt at floating rates or with fixed rates maturing within one year (3% of long-term net debt).
In addition, early retirement liabilities were discounted to present value over the year, based on the curve for instruments with very high credit quality. The increase in interest rates has decreased the market value of these liabilities. However, this decrease was nearly completely offset by the decrease in the value of the hedges on these positions.
Net financial expense totaled 2,866 million euros in 2013, of which 111 million related to exchange losses (without considering the effect of monetary adjustments). Stripping out this effect, net financial expense fell by 11.8% year on year, primarily due to the 11.4% decrease in average debt. Stripping out the effect of exchange differences, the effective cost of debt of the last twelve months is t 5.34%, 3 b.p. below the prior year, as the impact to the effective cost of debt derived from the fact that the majority of the average debt reduction is in euros (at less than average costs) was compensated by savings made on the gross cost of debt in euros through better management.
To illustrate the sensitivity of financial expenses to variability in short-term interest rates, a 100 basis points increase in interest rates in all currencies in which Telefónica has financial positions at December 31, 2013 has been assumed, and a 100 basis points decrease in interest rates in all currencies except those currencies with low interest rates, in order to avoid negative rates (euro, pound sterling and the US dollar) and a constant position equivalent to that prevailing at the end of 2013.
To illustrate the sensitivity of equity to variability in interest rates, a 100 basis point increase in interest rates in all currencies and terms of the curve, in which Telefónica holds financial positions at December 31, 2013 was assumed, as well as a 100 basis point decrease in all currencies and terms (except those below 1% in order to avoid negative rates). Cash flow hedge positions were also considered as they are fundamentally the only positions where changes in market value due to interest-rate fluctuations are recognized in equity.
Change in basis points (bp)
Impact on consolidated income
statement
Impact on consolidated
equity
+100bp (118) 741
-100bp 55 (632)
155154

Telefónica | Annual Report 2013 Telefónica | Annual Report 2013
Telefónica Integrated report 2013 6. Appendices
Share price riskThe Telefónica Group is exposed to changes in the value of equity investments that may be bought, sold or otherwise involved in transactions, from changes in the value of derivatives associated with such investments, from treasury shares and from equity derivatives.
According to the Telefónica, S.A. share option plan, Performance & Investment Plan (PIP) (see Note 19 of the Financial Report) the shares to be delivered to employees under such plan may be either the parent company treasury shares, acquired by them or any of its Group companies; or newly-issued shares. The possibility of delivering shares to beneficiaries of the plan in the future, in accordance with relative total shareholders’ return, implies a risk since there could be an obligation to hand over a maximum number of shares at the end of each phase, whose acquisition (in the event of acquisition in the market) in the future could imply a higher cash outflow than required on the start date of each phase if the share price is above the corresponding price on the phase start date. In the event that new shares are issued for delivery to the beneficiaries of the plan, there would be a dilutive effect for ordinary shareholders as a result of the higher number of shares delivered under such plan outstanding.
To reduce the risk associated with variations in share price under these plans, Telefónica has acquired instruments that replicate the risk profile of some of these plans as explained in Note 19 of the Financial Report.
In 2012, the second Global Employee Share Plan was launched, in accordance with approval given at the 2011 Ordinary General Shareholders’ Meeting.
In addition, the Group may use part of the treasury shares of Telefónica, S.A. held at December 31, 2013 to cover shares deliverable under the PIP or the Global Employee Share Plan. The net asset value of the treasury shares could increase or decrease depending on variations in Telefónica, S.A.’s share price.
Liquidity risk The Telefónica Group seeks to match the schedule for its debt maturity payments to its capacity to generate cash flows to meet these maturities, while allowing for some flexibility. In practice, this has been translated into two key principles:
1. The Telefónica Group’s average maturity of net financial debt is intended to stay above 6 years, or be restored above that threshold in a reasonable period of time if it eventually falls below it. This principle is considered as a guideline when managing debt and access to credit markets, but not a rigid requirement. When calculating the average maturity for the net financial debt and part of the undrawn credit lines can be considered as offsetting the shorter debt maturities, and extension options on some financing facilities may be considered as exercised, for calculation purposes.
2. The Telefónica Group must be able to pay all commitments over the next 12 months without accessing new borrowing or tapping the capital markets (although drawing upon firm credit lines arranged with banks), assuming budget projections are met. Throughout 2013, due to the financial market crisis, the Group decided to apply a substantially greater hedging policy for these commitments.
At December 31, 2013, the average maturity of net financial debt (45,381 million euros) was 6.79 years.
At December 31, 2013, gross financial debt scheduled to mature in 2014 amounted to approximately 9,214 million euros (which includes: (i) the net position of derivative financial instruments and certain current payables and (ii) 582 million euros of notes with an option of early repayment option and no contractual obligation to be repaid). These maturities are lower than the amount of funds available, calculated as the sum of: a) current financial assets and cash at December 31, 2013 (11,682 million euros excluding derivative financial instruments), b) annual cash generation projected for 2014; and c) undrawn credit facilities arranged with banks whose original maturity is over one year (an aggregate of more than 11,831 million euros at December 31, 2013), providing flexibility to the Telefónica Group with regard to accessing capital or credit markets in the next 12 months. For a further description of the Telefónica Group’s liquidity and capital resources in 2013, see Note 13.2 Financial Liabilities and Appendix V of the Financial Report.
Country riskThe Telefónica Group managed or mitigated country risk by pursuing two lines of action (in addition to its normal business practices):
1. Partly matching assets to liabilities (those not guaranteed by the parent company) in the Telefónica Group’s Latin American companies such that any potential asset impairment would be accompanied by a reduction in liabilities; and,
2. Repatriating funds generated in Latin America that are not required for the pursuit of new, profitable business development opportunities in the region.
Regarding the first point, at December 31, 2013, the Telefónica Group’s Latin American companies had net financial debt not guaranteed by the parent company of 2,499 million euros, which represents 5.5% of consolidated net financial debt.
Regarding the repatriation of funds to Spain, 1,640 million euros from Latin America companies have been received in 2013, of which 1,434 million euros were from dividends, 118 million euros were from intra-group loans (payments of interest and repayments of principal) and 88 million euros were for other items.
In this regard, it is worth noting that since February 2003, Venezuela has had an exchange control mechanism in place, managed by the Currency Administration Commission (CADIVI). The body has issued a number of regulations (“providencias”) governing the modalities of currency sales in Venezuela at official exchange rates. Foreign companies which are duly registered as foreign investors are entitled to request approval to acquire currencies at the official exchange rate by the CADIVI, in line with regulation number 029, article 2, section c) “Remittance of earnings, profits, income, interest and dividends from international investment.” Telefónica Venezolana, C.A. (formerly Telcel, C.A.), a Telefónica Group subsidiary in Venezuela, obtained the aforementioned requested approval on 295 million Venezuelan bolivars in 2006, 473 million Venezuelan bolivars in 2007 and 785 million Venezuelan Bolivars in 2008. At December 31, 2013, payment of two dividends agreed by the company in the amount of 5,882 million Venezuelan bolivars is pending approval by the CADIVI.
Credit riskThe Telefónica Group trades in derivatives with creditworthy counterparties. Therefore, Telefónica, S.A. generally trades with credit entities whose “senior debt” ratings are of at least “A”. In Spain, where most of the Group’s derivatives portfolio is held, there are netting agreements with financial institutions, with debtor or creditor positions offset in case of bankruptcy, limiting the risk to the net position. In addition, since Lehman went bankrupt, the credit ratings of rating agencies have proved to be less effective as a credit risk management tool. Therefore, the 5-year CDS (Credit Default Swap) of credit institutions has been added. This way, the CDS of all the counterparties with which Telefónica, S.A. operates is monitored at all times in order to assess the maximum allowable CDS for operating at any given time. Transactions are generally only carried out with counterparties whose CDS is below the threshold.
For other subsidiaries, particularly those in Latin America, assuming a stable sovereign rating provides a ceiling which is below “A”, trades are with local financial entities whose rating by local standards is considered to be of high creditworthiness.
Meanwhile, with credit risk arising from cash and cash equivalents, the Telefónica Group places its cash surpluses in high quality and highly liquid money-market assets. These placements are regulated by a general framework, revised annually. Counterparties are chosen according to criteria of liquidity, solvency and diversification based on the conditions of the market and countries where the Group operates. The general framework sets: (i) the maximum amounts to be invested by counterparty based on its rating (long-term debt rating); (ii) the maximum tenor of the investment, set at 180 days; and (iii) the instruments in which the surpluses may be invested (money-market instruments).
The Telefónica Group considers credit risk management as a key element to achieve its sustainable business and customer base growth targets in a manner that is consistent with Telefónica Corporate Risk Management Policy.
This management approach relies on the continuous monitoring of the risk assumed and the resources necessary to optimize the risk-reward balance to grant the adequate separation between the risk ownership areas and risk management areas. Customer-financing products and those debtors that could cause a material impact on the Group’s consolidated financial statements are subject to specific management practices to mitigate exposure to credit risk, according to the segment and risk profile of the customer.
Uniform policies, procedures, delegation of authority and management practices are established in all Group companies, taking into account benchmark risk management techniques but adapted to the local characteristics of each market. This commercial credit risk management model is embedded into the Group’s decision-making processes, both from a strategic and, especially, day-to-day operating perspective, where credit risk assessment guides the product and services available for the different customer profiles.
The Telefónica Group’s maximum exposure to credit risk is initially represented by the carrying amounts of the financial assets (Notes 11 and 13 of the Financial Report) and the guarantees given by the Telefónica Group.
Several Telefónica Group companies provide operating guarantees granted by external counterparties, which are offered during their normal commercial activity, in bids for licenses, permits and concessions, and spectrum acquisitions. At December 31, 2013, these guarantees amounted to approximately 3,964 million euros.
Capital managementTelefónica’s corporate finance department, which is in charge of Telefónica’s capital management, takes into consideration several factors when determining Telefónica’s capital structure, with the aim of ensuring sustainability of the business and maximizing the value to shareholders.
Telefónica monitors its cost of capital with a goal of optimizing its capital structure. In order to do this, Telefónica monitors the financial markets and updates to standard industry approaches for calculating weighted average cost of capital, or WACC. Telefónica also uses a net financial debt ratio below 2.35x OIBDA in the medium term (excluding items of a non-recurring or exceptional nature), enabling to obtain and maintain the desired credit rating over the medium term, and with which the Telefónica Group can match the potential cash flow generation with the alternative uses that could arise at all times.
These general principles are refined by other considerations and the application of specific variables, such as country risk in the broadest sense, or the volatility in cash flow generation, when determining the Telefónica Group’s financial structure.
157156
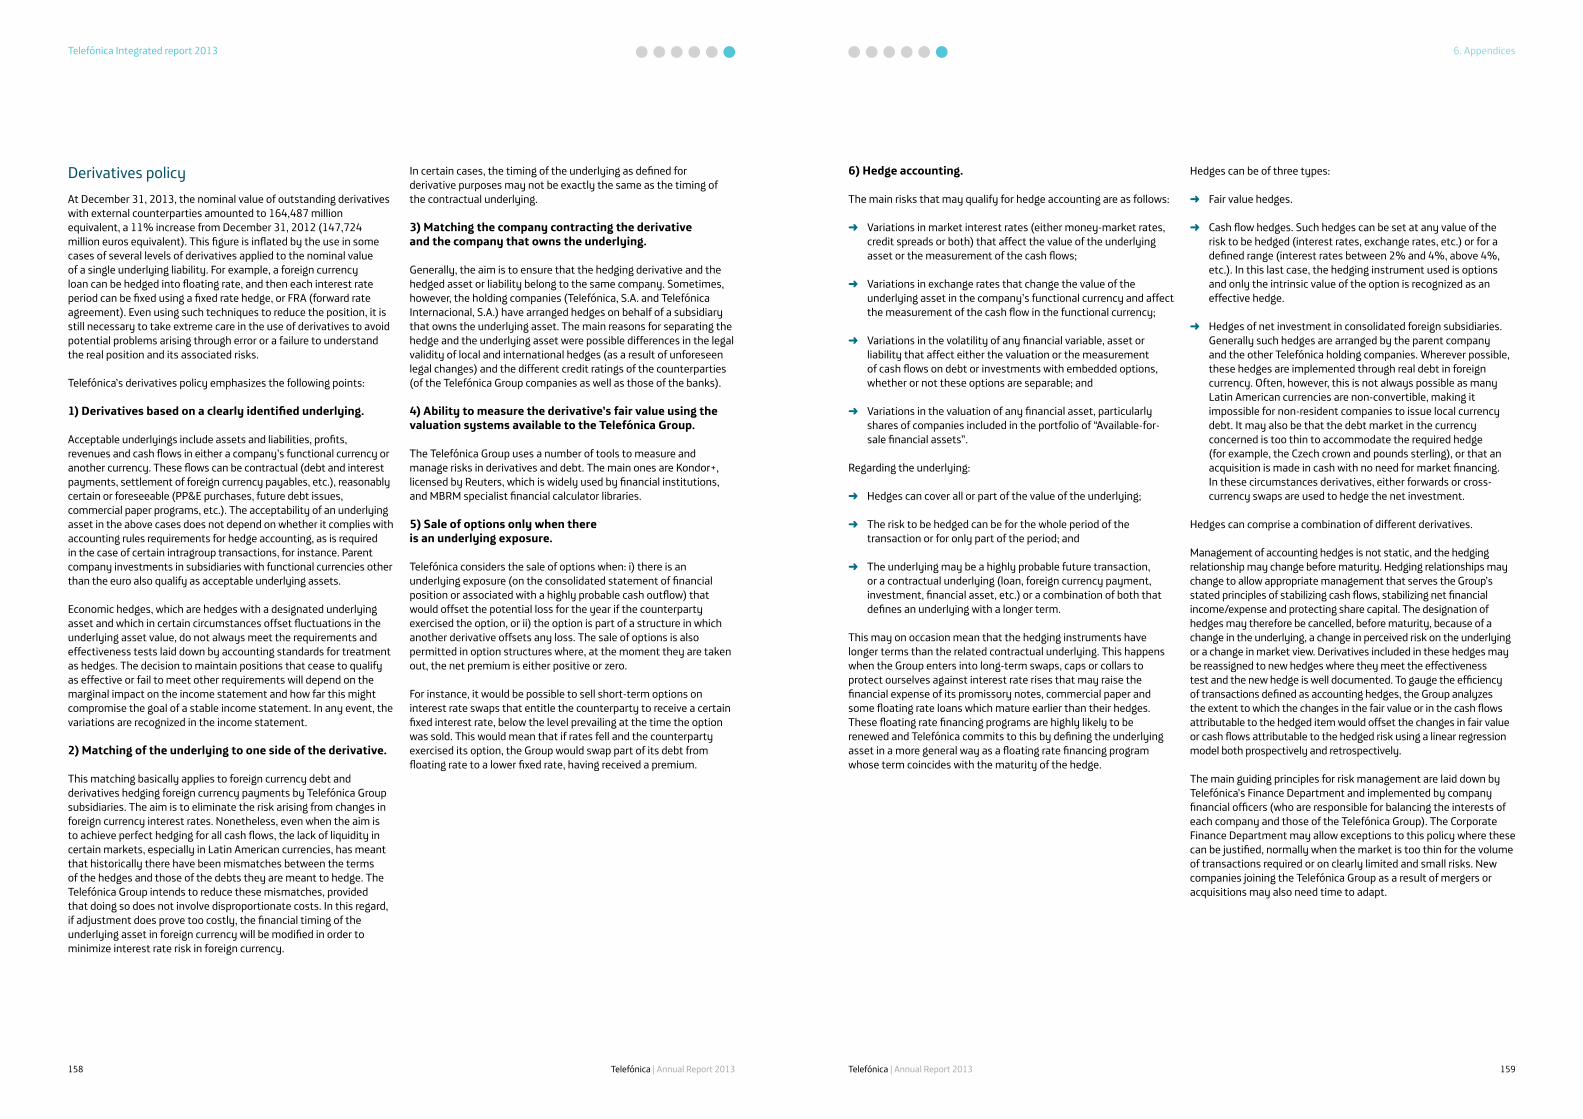
Telefónica | Annual Report 2013 Telefónica | Annual Report 2013
Telefónica Integrated report 2013 6. Appendices
159158
Derivatives policyAt December 31, 2013, the nominal value of outstanding derivatives with external counterparties amounted to 164,487 million equivalent, a 11% increase from December 31, 2012 (147,724 million euros equivalent). This figure is inflated by the use in some cases of several levels of derivatives applied to the nominal value of a single underlying liability. For example, a foreign currency loan can be hedged into floating rate, and then each interest rate period can be fixed using a fixed rate hedge, or FRA (forward rate agreement). Even using such techniques to reduce the position, it is still necessary to take extreme care in the use of derivatives to avoid potential problems arising through error or a failure to understand the real position and its associated risks.
Telefónica’s derivatives policy emphasizes the following points:
1) Derivatives based on a clearly identified underlying.
Acceptable underlyings include assets and liabilities, profits, revenues and cash flows in either a company’s functional currency or another currency. These flows can be contractual (debt and interest payments, settlement of foreign currency payables, etc.), reasonably certain or foreseeable (PP&E purchases, future debt issues, commercial paper programs, etc.). The acceptability of an underlying asset in the above cases does not depend on whether it complies with accounting rules requirements for hedge accounting, as is required in the case of certain intragroup transactions, for instance. Parent company investments in subsidiaries with functional currencies other than the euro also qualify as acceptable underlying assets.
Economic hedges, which are hedges with a designated underlying asset and which in certain circumstances offset fluctuations in the underlying asset value, do not always meet the requirements and effectiveness tests laid down by accounting standards for treatment as hedges. The decision to maintain positions that cease to qualify as effective or fail to meet other requirements will depend on the marginal impact on the income statement and how far this might compromise the goal of a stable income statement. In any event, the variations are recognized in the income statement.
2) Matching of the underlying to one side of the derivative.
This matching basically applies to foreign currency debt and derivatives hedging foreign currency payments by Telefónica Group subsidiaries. The aim is to eliminate the risk arising from changes in foreign currency interest rates. Nonetheless, even when the aim is to achieve perfect hedging for all cash flows, the lack of liquidity in certain markets, especially in Latin American currencies, has meant that historically there have been mismatches between the terms of the hedges and those of the debts they are meant to hedge. The Telefónica Group intends to reduce these mismatches, provided that doing so does not involve disproportionate costs. In this regard, if adjustment does prove too costly, the financial timing of the underlying asset in foreign currency will be modified in order to minimize interest rate risk in foreign currency.
In certain cases, the timing of the underlying as defined for derivative purposes may not be exactly the same as the timing of the contractual underlying.
3) Matching the company contracting the derivative and the company that owns the underlying.
Generally, the aim is to ensure that the hedging derivative and the hedged asset or liability belong to the same company. Sometimes, however, the holding companies (Telefónica, S.A. and Telefónica Internacional, S.A.) have arranged hedges on behalf of a subsidiary that owns the underlying asset. The main reasons for separating the hedge and the underlying asset were possible differences in the legal validity of local and international hedges (as a result of unforeseen legal changes) and the different credit ratings of the counterparties (of the Telefónica Group companies as well as those of the banks).
4) Ability to measure the derivative’s fair value using the valuation systems available to the Telefónica Group.
The Telefónica Group uses a number of tools to measure and manage risks in derivatives and debt. The main ones are Kondor+, licensed by Reuters, which is widely used by financial institutions, and MBRM specialist financial calculator libraries.
5) Sale of options only when there is an underlying exposure.
Telefónica considers the sale of options when: i) there is an underlying exposure (on the consolidated statement of financial position or associated with a highly probable cash outflow) that would offset the potential loss for the year if the counterparty exercised the option, or ii) the option is part of a structure in which another derivative offsets any loss. The sale of options is also permitted in option structures where, at the moment they are taken out, the net premium is either positive or zero.
For instance, it would be possible to sell short-term options on interest rate swaps that entitle the counterparty to receive a certain fixed interest rate, below the level prevailing at the time the option was sold. This would mean that if rates fell and the counterparty exercised its option, the Group would swap part of its debt from floating rate to a lower fixed rate, having received a premium.
6) Hedge accounting.
The main risks that may qualify for hedge accounting are as follows:
➜ Variations in market interest rates (either money-market rates, credit spreads or both) that affect the value of the underlying asset or the measurement of the cash flows;
➜ Variations in exchange rates that change the value of the underlying asset in the company’s functional currency and affect the measurement of the cash flow in the functional currency;
➜ Variations in the volatility of any financial variable, asset or liability that affect either the valuation or the measurement of cash flows on debt or investments with embedded options, whether or not these options are separable; and
➜ Variations in the valuation of any financial asset, particularly shares of companies included in the portfolio of “Available-for-sale financial assets”.
Regarding the underlying:
➜ Hedges can cover all or part of the value of the underlying;
➜ The risk to be hedged can be for the whole period of the transaction or for only part of the period; and
➜ The underlying may be a highly probable future transaction, or a contractual underlying (loan, foreign currency payment, investment, financial asset, etc.) or a combination of both that defines an underlying with a longer term.
This may on occasion mean that the hedging instruments have longer terms than the related contractual underlying. This happens when the Group enters into long-term swaps, caps or collars to protect ourselves against interest rate rises that may raise the financial expense of its promissory notes, commercial paper and some floating rate loans which mature earlier than their hedges. These floating rate financing programs are highly likely to be renewed and Telefónica commits to this by defining the underlying asset in a more general way as a floating rate financing program whose term coincides with the maturity of the hedge.
Hedges can be of three types:
➜ Fair value hedges.
➜ Cash flow hedges. Such hedges can be set at any value of the risk to be hedged (interest rates, exchange rates, etc.) or for a defined range (interest rates between 2% and 4%, above 4%, etc.). In this last case, the hedging instrument used is options and only the intrinsic value of the option is recognized as an effective hedge.
➜ Hedges of net investment in consolidated foreign subsidiaries. Generally such hedges are arranged by the parent company and the other Telefónica holding companies. Wherever possible, these hedges are implemented through real debt in foreign currency. Often, however, this is not always possible as many Latin American currencies are non-convertible, making it impossible for non-resident companies to issue local currency debt. It may also be that the debt market in the currency concerned is too thin to accommodate the required hedge (for example, the Czech crown and pounds sterling), or that an acquisition is made in cash with no need for market financing. In these circumstances derivatives, either forwards or cross-currency swaps are used to hedge the net investment.
Hedges can comprise a combination of different derivatives.
Management of accounting hedges is not static, and the hedging relationship may change before maturity. Hedging relationships may change to allow appropriate management that serves the Group’s stated principles of stabilizing cash flows, stabilizing net financial income/expense and protecting share capital. The designation of hedges may therefore be cancelled, before maturity, because of a change in the underlying, a change in perceived risk on the underlying or a change in market view. Derivatives included in these hedges may be reassigned to new hedges where they meet the effectiveness test and the new hedge is well documented. To gauge the efficiency of transactions defined as accounting hedges, the Group analyzes the extent to which the changes in the fair value or in the cash flows attributable to the hedged item would offset the changes in fair value or cash flows attributable to the hedged risk using a linear regression model both prospectively and retrospectively.
The main guiding principles for risk management are laid down by Telefónica’s Finance Department and implemented by company financial officers (who are responsible for balancing the interests of each company and those of the Telefónica Group). The Corporate Finance Department may allow exceptions to this policy where these can be justified, normally when the market is too thin for the volume of transactions required or on clearly limited and small risks. New companies joining the Telefónica Group as a result of mergers or acquisitions may also need time to adapt.

Telefónica | Annual Report 2013 Telefónica | Annual Report 2013
Telefónica Integrated report 2013 6. Appendices
The breakdown of the financial results recognized in 2013, 2012 and 2011 is as follows:
Millions of euros 2013 2012 2011Interest income 613 557 586
Dividends received 11 28 42
Other financial income 203 276 181
Subtotal 827 861 809
Changes in fair value of financial assets at fair value through profit or loss (427) 648 573
Changes in fair value of financial liabilities at fair value through profit or loss 388 (550) (808)
Transfer from equity to profit and loss from cash flow hedges (121) (173) (210)
Transfer from equity to profit and loss from available-for-sale assets and others (52) (50) (3)
Gain/(loss) on fair value hedges (935) 198 908
(Loss)/gain on adjustment to items hedged by fair value hedges 961 (145) (747)
Subtotal (186) (72) (287)
Interest expenses (2,898) (3,094) (2,671)
Ineffective portion of cash flow hedges − 1 1
Accretion of provisions and other liabilities (201) (469) (106)
Other financial expenses (238) (289) (528)
Subtotal (3,337) (3,851) (3,304)Net finance costs excluding foreign exchange differences and hyperinflationary adjustments (2,696) (3,062) (2,782)
The breakdown of Telefónica’s derivatives at December 31, 2013, their fair value at year-end and the expected maturity schedule is as set forth in the table below:
2013
Millions of euros Fair value (**) Notional amount MATURITIES (*)
Derivatives 2014 2015 2016Subsequent
years TotalInterest rate hedges 456 (4,266) 1,934 845 (2,079) (3,566)
Cash flow hedges 758 (3,462) 2,099 (96) 8,143 6,684
Fair value hedges (302) (804) (165) 941 (10,222) (10,250)
Exchange rate hedges 355 (467) 1,551 3,128 4,709 8,921
Cash flow hedges 357 (330) 1,551 3,128 4,709 9,058
Fair value hedges (2) (137) (137)Interest and exchange rate hedges (233) (468) (321) 465 1.923 1.599
Cash flow hedges (58) (383) (200) 566 2,779 2,762
Fair value hedges (175) (85) (121) (101) (856) (1,163)
Hedge of net investment (277) (1,992) (162) (1,151) (60) (3,365)Derivatives not designated as hedges (434) 1,918 (63) (710) (1,928) (783)
Interest rate (359) 2,353 (141) (710) (1,941) (439)
Exchange rate (75) (435) 78 13 (344)
Interest and exchange rate −(*) For interest rate hedges, the positive amount is in terms of fixed payment. For foreign currency hedges, a positive amount means payment in functional vs. foreign currency.(**) Positive amounts indicate payables.
The breakdown of Telefónica’s derivatives at December 31, 2012, their fair value at year-end and the expected maturity schedule are as set forth in the table below:
2012
Millions of euros Fair value (**) Notional amount MATURITIES (*)
Derivatives 2013 2014 2015Subsequent
years TotalInterest rate hedges 367 (1,241) (844) 2,552 3,306 3,773
Cash flow hedges 1,405 (1,048) (353) 2,547 8,222 9,368
Fair value hedges (1,038) (193) (491) 5 (4,916) (5,595)
Exchange rate hedges (443) 792 (158) 1,558 6,344 8,536
Cash flow hedges (441) 1,057 (158) 1,558 6,344 8,801
Fair value hedges (2) (265) (265)Interest and exchange rate hedges (389) (8) 38 27 2,468 2,525
Cash flow hedges (248) (53) 89 90 2,478 2,604
Fair value hedges (141) 45 (51) (63) (10) (79)
Hedge of net investment (140) (1.330) (280) (162) (1,211) 3,180Derivatives not designated as hedges (534) 11,366 (13) (467) (1,406) 9,480
Interest rate (384) 8,796 (13) (545) (2,133) 6,105
Exchange rate (150) 2,570 78 727 3,375
Interest and exchange rate −(*) For interest rate hedges, the positive amount is in terms of fixed payment. For foreign currency hedges, a positive amount means payment in functional vs. foreign currency.(**) Positive amounts indicate payables.
More informationIn the ‘Fninancial report 2013’.
161160

This report was printed on environmentally-friendly paper, as certified by FSC.
Telefónica, S.A.2013 Integrated report
This report is available on the Telefónica website at: annualreport2013.telefonica.com
Shareholders may also request copies of this report from the Shareholders’ Office by using the free phone number 900 111 004 (in Spain), or by sending an email to: [email protected]
Since June 2014, this report is also multi-platform/cross-platform available
This report is also available multi-platform/cross-platform.
Mandatory information which has to be provided under prevailing legislation is also available to shareholders and the general public.
Edited by:Direction of Public and Corporate Affairs of Telefónica, S.A.
Design and layout:MRM Worldwide Spain, S.A.
Printed by:Egraf, S.A.
Date of publication:May 2014
Legal deposit:M-15663-2014

Copyright © 2022 FDOKUMEN