Do People Want to Be More Moral? - Jessie Sun
44
Psychological Science 2020, Vol. 31(3) 243–257 © The Author(s) 2019 Article reuse guidelines: sagepub.com/journals-permissions DOI: 10.1177/0956797619893078 www.psychologicalscience.org/PS ASSOCIATION FOR PSYCHOLOGICAL SCIENCE Research Article Most people want to change some aspects of their personality—across adulthood, more than 78% of peo- ple express desires to be more extraverted, emotionally stable, conscientious, agreeable, or open to experience (Hudson & Fraley, 2016b). To date, personality change goals have primarily been examined through the lens of the Big Five framework and the goals that people have for themselves (Baranski, Morse, & Dunlop, 2017; Hudson & Fraley, 2015; Hudson & Roberts, 2014). Here, we examined whether the common desire for personal- ity change extends to moral character and to close others. In other words, do people want to be more moral, and do people who know us well want us to change in similar ways? Personality traits describe relatively stable, enduring pat- terns of thoughts, feelings, and behaviors that make people different from one another (DeYoung, 2015). Moral char- acter traits are personality traits that capture individual differences in the tendency to follow relevant moral standards—essentially, the extent to which someone is a “good” or “bad” person (Fleeson, Furr, Jayawickreme, Meindl, & Helzer, 2014). Traits differ in the degree to which they are seen as being relevant to moral character (but note that such judgments can vary across cultures and individuals; Meindl & Graham, 2014). For example, at least in Western contexts, extraversion is considered a nonmoral trait (i.e., not particularly morally relevant), whereas hon- esty is considered a moral trait (i.e., highly morally rele- vant; Meindl & Graham, 2014). Thus, being generally introverted does not make someone a “bad” person, whereas being generally dishonest might. People place great value on morality in themselves and in others; indeed, some research suggests that feel- ing moral might be a basic psychological need (Prentice, Jayawickreme, et al., 2019). Moral character traits are also among the most powerful determinants of the over- all impressions we form of other people (Goodwin, 2015; Goodwin, Piazza, & Rozin, 2014; Hartley et al., 2016). Thus, if people recognize that their moral 893078PSS XX X 10.1177/0956797619893078Sun, GoodwinMoral Change Goals research-article 2019 Corresponding Author: Jessie Sun, University of California, Davis, Department of Psychology, 200 East Quad, Davis, CA 95616 E-mail: [email protected] Do People Want to Be More Moral? Jessie Sun 1 and Geoffrey P. Goodwin 2 1 Department of Psychology, University of California, Davis, and 2 Department of Psychology, University of Pennsylvania Abstract Most people want to change some aspects of their personality, but does this phenomenon extend to moral character and to close others? Targets (n = 800) rated their personality traits and reported how much they wanted to change on each trait; well-acquainted informants (n = 958) rated targets’ personality traits and how much they wanted the targets to change on those same traits. Targets and informants reported a lower desire to change more morally relevant traits (e.g., honesty, compassion, fairness) compared with less morally relevant traits (e.g., anxiety, sociability, productiveness)—even after we controlled for current trait levels. Moreover, although targets generally wanted to improve more on traits that they had less desirable levels of, and informants wanted their targets to improve more on those traits as well, targets’ moral change goals were less calibrated to their current trait levels. Finally, informants wanted targets to change in similar ways, but to a lesser extent, than targets themselves did. These findings suggest that moral considerations take a back seat when it comes to self-improvement. Keywords volitional personality change, moral character, self-improvement, moral motivations, self–other agreement, open data, open materials, preregistered Received 5/10/19; Revision accepted 10/16/19 TC
-
Upload
khangminh22 -
Category
Documents
-
view
2 -
download
0
Transcript of Do People Want to Be More Moral? - Jessie Sun

https://doi.org/10.1177/0956797619893078
Psychological Science2020, Vol. 31(3) 243 –257© The Author(s) 2019Article reuse guidelines: sagepub.com/journals-permissionsDOI: 10.1177/0956797619893078www.psychologicalscience.org/PS
ASSOCIATION FORPSYCHOLOGICAL SCIENCEResearch Article
Most people want to change some aspects of their personality—across adulthood, more than 78% of peo-ple express desires to be more extraverted, emotionally stable, conscientious, agreeable, or open to experience (Hudson & Fraley, 2016b). To date, personality change goals have primarily been examined through the lens of the Big Five framework and the goals that people have for themselves (Baranski, Morse, & Dunlop, 2017; Hudson & Fraley, 2015; Hudson & Roberts, 2014). Here, we examined whether the common desire for personal-ity change extends to moral character and to close others. In other words, do people want to be more moral, and do people who know us well want us to change in similar ways?
Personality traits describe relatively stable, enduring pat-terns of thoughts, feelings, and behaviors that make people different from one another (DeYoung, 2015). Moral char-acter traits are personality traits that capture individual differences in the tendency to follow relevant moral standards—essentially, the extent to which someone is a “good” or “bad” person (Fleeson, Furr, Jayawickreme, Meindl, & Helzer, 2014). Traits differ in the degree to which
they are seen as being relevant to moral character (but note that such judgments can vary across cultures and individuals; Meindl & Graham, 2014). For example, at least in Western contexts, extraversion is considered a nonmoral trait (i.e., not particularly morally relevant), whereas hon-esty is considered a moral trait (i.e., highly morally rele-vant; Meindl & Graham, 2014). Thus, being generally introverted does not make someone a “bad” person, whereas being generally dishonest might.
People place great value on morality in themselves and in others; indeed, some research suggests that feel-ing moral might be a basic psychological need (Prentice, Jayawickreme, et al., 2019). Moral character traits are also among the most powerful determinants of the over-all impressions we form of other people (Goodwin, 2015; Goodwin, Piazza, & Rozin, 2014; Hartley et al., 2016). Thus, if people recognize that their moral
893078 PSSXXX10.1177/0956797619893078Sun, GoodwinMoral Change Goalsresearch-article2019
Corresponding Author:Jessie Sun, University of California, Davis, Department of Psychology, 200 East Quad, Davis, CA 95616 E-mail: [email protected]
Do People Want to Be More Moral?
Jessie Sun1 and Geoffrey P. Goodwin21Department of Psychology, University of California, Davis, and 2Department of Psychology, University of Pennsylvania
AbstractMost people want to change some aspects of their personality, but does this phenomenon extend to moral character and to close others? Targets (n = 800) rated their personality traits and reported how much they wanted to change on each trait; well-acquainted informants (n = 958) rated targets’ personality traits and how much they wanted the targets to change on those same traits. Targets and informants reported a lower desire to change more morally relevant traits (e.g., honesty, compassion, fairness) compared with less morally relevant traits (e.g., anxiety, sociability, productiveness)—even after we controlled for current trait levels. Moreover, although targets generally wanted to improve more on traits that they had less desirable levels of, and informants wanted their targets to improve more on those traits as well, targets’ moral change goals were less calibrated to their current trait levels. Finally, informants wanted targets to change in similar ways, but to a lesser extent, than targets themselves did. These findings suggest that moral considerations take a back seat when it comes to self-improvement.
Keywordsvolitional personality change, moral character, self-improvement, moral motivations, self–other agreement, open data, open materials, preregistered
Received 5/10/19; Revision accepted 10/16/19
TC

244 Sun, Goodwin
character influences how much other people like and respect them, they might want to become more moral not only to reach their own moral standards but also to attain the reputational benefits of being viewed as a moral person.
However, there are equally compelling reasons to believe that people might be less motivated to change their moral traits (compared with their nonmoral traits). First, because people appear to inaccurately inflate their positive moral qualities to a greater extent compared with their nonmoral qualities (Tappin & McKay, 2017), they might see no need to further enhance their moral traits. Second, people might typically be more inclined to make changes that will assuage their dissatisfaction with aspects of their lives (Baumeister, 1994; Hudson & Fraley, 2016a). For example, people who are dissatis-fied with their friendships might strive to become more extraverted to overcome these social difficulties (Hudson & Roberts, 2014). In contrast, insofar as morality involves overcoming selfish impulses for the benefit of other people (Baumeister & Exline, 1999), the perceived costs of becoming more moral might outweigh its reputational benefits, dissuading people from striving for moral self-improvement.
Further complicating the picture is the fact that moral traits are seen as especially central to personal identity (for a review, see Strohminger, Knobe, & Newman, 2017). Whereas some research suggests that people are (hypothetically) less willing to take pharmaceuticals to enhance traits that are more fundamental to identity (e.g., empathy, kindness; Riis, Simmons, & Goodwin, 2008), other studies suggest that hypothetical improve-ments to moral traits might be seen as bringing people closer to their “true selves” (Bench, Schlegel, Davis, & Vess, 2015; Christy, Kim, Vess, Schlegel, & Hicks, 2017).
Little empirical evidence addresses the question of whether people prefer to change moral or nonmoral traits. In one study, in which participants selected five characteristics that they most wanted to improve, the probability of wanting a moral trait to improve was 21% (vs. 47% for nonmoral traits; Molouki & Bartels, 2017). However, because the researchers did not design the study to compare moral and nonmoral personality change goals, they did not comprehensively sample moral and nonmoral traits. Therefore, our primary aim was to comprehensively examine the extent to which people want to change more or less morally relevant traits.
Our second goal was to document the ways in which other people want us to change our personality traits (interpersonal change goals). Because people who know us well have a unique perspective on our person-alities (Vazire & Carlson, 2011), these close others could shape our personality change goals—and ultimately our
personalities—by pointing out areas for improvement that may or may not have occurred to us (Bollich, Johannet, & Vazire, 2011). Consistent with this idea, past research found that when informants agreed with tar-gets’ assessments of themselves as having low levels of agreeableness and extraversion, targets reported stron-ger desires to improve these traits, compared with when informants disagreed with targets’ assessments of their current levels of these traits (Quintus, Egloff, & Wrzus, 2017). However, to our knowledge, no study has asked informants about how they would like targets to change. Doing so would shed light on whether the people who know us well want us to change in ways that are similar to how we want ourselves to change. Evidence of self–other agreement on personality change goals would show that close others can corroborate our own assess-ments of which traits are most in need of improvement, whereas self–other disagreement might suggest that close others either have unique insight into our short-comings or want us to improve in ways that would benefit them.
Our final goal was to explore individual differences in the desire for moral self-improvement. People who have less desirable levels of a given Big Five trait gen-erally want to improve more on that trait (Baranski et al., 2017; Hudson & Fraley, 2015; Hudson & Roberts, 2014), but these correlations have been more consistent for extraversion, conscientiousness, and emotional stabil-ity than for agreeableness and openness. Here, we exam-ined whether less desirable trait levels are associated with a greater desire to improve moral traits or whether, alternatively, the most moral people are the ones who most want to improve their moral traits (i.e., whether virtue begets virtue in the moral domain).
Method
We recruited two samples of participants. We preregis-tered stopping rules for both samples and an initial exploratory analysis plan for Sample 1 on the Open Science Framework (OSF) at https://osf.io/qjfnw/. After freely exploring the data in Sample 1, we preregistered our analysis plan for Sample 2 at https://osf.io/6mdwp/ and directly replicated our Sample 1 analyses. We deter-mined our sample sizes (300 targets in Sample 1; 500 targets in Sample 2) on the basis of time and budget constraints (and however many informants would respond); the resulting sample sizes exceeded recom-mendations for obtaining stable estimates of the aver-age published effect in personality and social psychology (N > 250; Schönbrodt & Perugini, 2013). We report all data exclusions and all measures (measures not included in the current article are reported in our OSF reposi-tory). All materials and the data and scripts needed to

Moral Change Goals 245
reproduce the analyses are available at https://osf.io/cbxjh.
Participants and procedure
We recruited two samples of target participants from the undergraduate psychology research pools at the Univer-sity of Pennsylvania (Sample 1) and the University of California, Davis (Sample 2). Apart from minor differ-ences described below, we used the same data-collection procedures for the two samples. Targets completed an online questionnaire (implemented using Qualtrics soft-ware; https://www.qualtrics.com/) in which they nomi-nated up to four informants who knew them well, then self-reported their personality traits and change goals (described below). When nominating informants, tar-gets were asked to choose at least two people who were not current romantic partners or family members. We invited informants to participate in the study by e-mailing them a unique link to an online question-naire. Informants rated their target’s personality traits and reported the personality changes they wanted to see in their target. We sent informants who had not yet completed the survey three (Sample 1) to six (Sample 2) e-mail reminders, spaced approximately 1 week apart. In both samples, we used all available data for analyses involving only target self-reports (even if the target had no informant reports).
Targets participated in exchange for course credit. Informants who completed the survey were entered into a prize drawing for a 1 in 10 chance of winning a $20 Amazon.com gift card. In Sample 2, informants could also ask to be entered into the prize drawing even if they did not participate (in compliance with California law). Data-collection procedures were approved by the institutional review board (IRB) at the University of Pennsylvania (Sample 1; IRB ID: 831767) and the University of California, Davis (Sample 2; IRB ID: 1328211-2).
Sample 1. In Sample 1, 300 targets (224 female, 74 male, 2 other or not disclosed) between the ages of 18 and 29 years (age: M = 19.57, SD = 1.29) completed the study and met our preregistered inclusion criteria (we excluded 4 participants who were under the age of 18). Targets identi-fied as White/Caucasian (n = 143), Asian (n = 85), Hispanic/Latino (n = 24), Black/African American (n = 20), Pacific Islander (n = 1), other/multiple (n = 25), or did not dis-close their ethnicity (n = 2). Targets successfully nomi-nated 1,023 informants, of whom 417 (288 female, 124 male, 5 other or not disclosed; age: range = 18–98 years, M = 28.54, SD = 15.22) completed the study (response rate = 41%). Of the 221 targets who had informants, 92 had 1 informant and 129 had 2 or more informants.
Informants reported being friends of the target (n = 234), parents (n = 97), current romantic partners (n = 37), sib-lings (n = 32), other family members (n = 8), former romantic partners (n = 3), or coworkers (n = 1), and 5 reported their relationship with the target as “other.” On average, informants reported having known their targets for 9.39 years (SD = 8.17). Following our preregistered stopping rules, we ended data collection for targets when 300 targets (who met our inclusion criteria) completed the study and ended data collection for informants 1 week after the third e-mail reminder had been sent to the last informants who were nominated.
Sample 2. Because informant response rates were lower in Sample 2, we deviated from our preregistered sam-pling plan by (a) sending three more e-mail reminders to informants nominated by the first 300 targets and (b) recruiting 200 more targets (prior to analyzing the Sam-ple 2 data). Thus, Sample 2 comprised 500 targets (404 female, 93 male, 3 other or not disclosed; age: range = 18–47, M = 19.85, SD = 2.55) who completed the study and met our preregistered inclusion criteria (none were excluded). Targets identified as White/Caucasian (n = 102), Asian (n = 236), Hispanic/Latino (n = 89), Black/African American (n = 3), Pacific Islander (n = 3), other/multiple (n = 64), or did not disclose their ethnicity (n = 3). Targets successfully nominated 1,464 informants, of whom 541 (396 female, 135 male, 10 other or not dis-closed; age: range = 18–81, M = 25.63, SD = 12.56) com-pleted the study (response rate = 37%). Of the 288 targets who had informants, 122 had 1 informant and 166 had 2 or more informants. Informants reported being friends of the target (n = 334), parents (n = 80), current romantic partners (n = 30), siblings (n = 57), other family members (n = 20), former romantic partners (n = 3), or coworkers (n = 1), and 8 reported their relationship with the target as “other.” On average, informants reported having known their targets for 8.95 years (SD = 7.85). We ended data collection 1 week after we sent the third e-mail reminder to the informants who were nominated by the last 200 targets.
Measures
Targets rated their current standing on 21 personality traits and reported the extent to which they wanted to change on each of these traits, using the measures described below. Informants rated their target’s person-ality traits and reported the extent to which they wanted their target to change on each of these traits, using the same measures.
Personality traits.Big Five facets. The Big Five Inventory-2 (BFI-2; Soto
& John, 2017) measures 15 facets—3 facets for each of the

246 Sun, Goodwin
Big Five personality domains (extraversion: sociability, asser-tiveness, energy level; agreeableness: compassion, respectful-ness, trust; conscientiousness: organization, productiveness, responsibility; negative emotionality: anxiety, depression, emotional volatility; and open-mindedness: intellectual curi-osity, aesthetic sensitivity, creative imagination). Each facet is measured with four items (60 items total). We also assessed an additional facet of negative emotionality (anger), using two items from the Big Five Aspects Scale (DeYoung, Quilty, & Peterson, 2007): “Gets angry easily” and “Is not easily annoyed” (the latter was reverse scored). Targets rated the extent to which they agreed with 62 statements (e.g., “I am someone who is outgoing, sociable”) on a 5-point scale (1 = disagree strongly, 5 = agree strongly). Informants rated the extent to which they agreed with the same statements about the target (e.g., “[target’s name] is someone who is out-going, sociable”). We dropped one item from the aesthetic-sensitivity measure (“Values art and beauty”) for reasons described in the next section.
Moral Characteristics Questionnaire (MCQ). The BFI-2 contains some morally relevant content, especially for the agreeableness (e.g., “Is helpful and unselfish with oth-ers”) and conscientiousness (e.g., “Is reliable, can always be counted on”) domains. However, other aspects of moral character are not well captured by the BFI-2. Thus, we used the MCQ (Prentice, Furr, & Hawkins, 2019) to measure general morality (e.g., “I am a person of strong moral character”; four items) and the specific domains of honesty (e.g., “I consistently tell the truth”), fairness (e.g., “I treat people fairly”), loyalty (e.g., “I shift my loyalties easily”; reverse scored), and purity (“I would say that I’m a wholesome person, relatively ‘pure’”; two items per domain). Targets rated the extent to which they agreed with such statements about themselves, and informants rated the extent to which they agreed with such state-ments about the target, on a 5-point scale (1 = strongly disagree, 5 = strongly agree).
The original measures included two additional items for each domain (i.e., six items for general morality and four items for each of the other domains). However, whereas all but one of the BFI-2 items describe current tendencies, two items from each of the MCQ scales captured values and moral strivings (e.g., “I don’t believe that honesty is that important,” “I want to be honest even when it’s hard”). To avoid a confound when examining the correlations between traits and change goals (which, by definition, capture strivings), we dropped the MCQ items that captured values and strivings (and the “values art and beauty” BFI-2 item) and included only the items that described current ten-dencies (e.g., “I tend to act morally”) and overall self-perceptions (e.g., “I am an honest person”), as described in the Sample 2 preregistration.
Personality change goals.Change-goals scale. We measured change goals by
modifying two items for each of the 21 personality traits (16 Big Five facets and 5 MCQ domains) described above. Following Hudson and Roberts (2014), we reworded the instructions, items, and response scales in terms of how much targets wanted to change, and how much infor-mants wanted targets to change, on each personality trait (see the codebooks at https://osf.io/rbeuw/ and https://osf.io/87dkh/ for full item wordings). For example, “I am someone who is helpful and unselfish with others” was reworded to “I want to be helpful and unselfish with others” (self-report) or “I want [target’s name] to be help-ful and unselfish with others” (informant report), with response options indicating the magnitude and direction of the desired changes (–2 = much less than I currently am, −1 = less than I currently am, 0 = I do not want to change in this trait, 1 = more than I currently am, 2 = much more than I currently am; we adjusted the pro-nouns and grammar as needed for different items and for the informant reports).
We computed the mean of the two change-goal items for each trait, separately for targets and informants. We also extracted an index of the overall desire for change by taking the average of the absolute scores across the 42 change-goal items, separately for targets and infor-mants (resulting in a continuous measure that had a possible range of 0, no change desired on any of the 42 items, to 2, “much more” or “much less” on all 42 items).
Change-goal priorities. To get a better sense of which personality changes people would most prioritize, we showed targets and informants all of the desired changes they had selected from the full set of change goals (i.e., excluding the items for which they selected the response, “I do not want [target’s name] to change in this trait”) and asked them to select the top three most desired changes (“Which three changes would you most like to see in yourself/[target’s name]?”). On average, targets selected priorities out of a list of 26.44 desired changes (Sample 1; SD = 8.44) and 27.63 desired changes (Sample 2; SD = 9.32), and informants selected priorities out of a list of 12.40 desired changes (Sample 1; SD = 7.95) and 12.86 desired changes (Sample 2; SD = 9). See the Supplemen-tal Material (Section 1) for a description of the order in which this list was presented.
From the top three priorities, we computed 42 binary variables that represented whether or not a target or informant (respectively) prioritized a goal to improve each of the 21 traits as one of their top three priorities. Each of these 21 traits has an unambiguous “positive pole.” For instance, previous research shows that most people want to be more extraverted, conscientious, agreeable, and open to experience and to be less

Moral Change Goals 247
neurotic—and fewer than 3% want to change in the oppo-site direction (Hudson & Roberts, 2014). This indicates that most people think that low neuroticism and high levels of the other Big Five traits are desirable and that changes toward these positive poles are improvements. Similarly, our moral-valence norms (described in the next section) showed that people generally consider general morality, honesty, fairness, loyalty, and purity to be morally posi-tive. Thus, we operationalized “improvements” as change goals in the desirable direction (i.e., decreases on facets of negative emotionality and increases on all other traits), which were coded as 1. Not prioritizing a goal was coded as 0, as were goals to change in the undesirable direction (because very few participants prioritized goals to change in the undesirable direction). Out of these top three priorities, we also asked targets and informants to select and provide an open-ended justification for their top change goal (which we used in supplemental analy-ses; see the Supplemental Material, Section 7).
Moral relevance. To examine whether change goals and other effects varied depending on the trait’s moral relevance, we obtained norming data for the 42 items included in our change-goals scale. We recruited two separate samples of trait raters from the same subject pools that the targets were drawn from (and prevented target participants from signing up for the trait-norming study). Each trait rater was randomly assigned to one of two versions of the norming task (for a description of additional exploratory dimensions, see https://osf.io/me9yp/). Only the first version of the task involved rating moral relevance. Thus, the trait raters included in this study were 114 University of Pennsylvania undergradu-ates (81 female, 32 male, 1 not disclosed; age: M = 19.53 years, SD = 1.20) and 203 University of California, Davis, undergraduates (165 female, 36 male, 2 not disclosed; age: M = 20.30 years, SD = 3.32).
Trait raters rated the moral valence of the 42 items in our change-goals scale. Specifically, after reading a brief explanation of moral traits, participants were asked, “How morally good or morally bad is it to be high on each of the following traits?” (e.g., “Having a forgiving nature”; −3 = very morally bad, −2 = moder-ately morally bad, −1 = slightly morally bad, 0 = neither morally good nor morally bad, 1 = slightly morally good, 2 = moderately morally good, 3 = very morally good). To index the moral relevance of each of the 21 traits, we computed the absolute value of the moral-valence rating for each item for each rater (0 = not morally relevant, 3 = very morally relevant). We then averaged the two items for each trait before computing the aver-age moral-relevance rating for each trait across all rat-ers. The raters also rated the perceived changeability of each trait, which we used for supplemental analyses
(described in the Supplemental Material, Section 3). Descriptive statistics for the norming data are reported in Table S1 in the Supplemental Material.
We conducted analyses for each sample using the norms for that sample. The between-traits analyses (e.g., correlations between moral relevance and average absolute change goals) involved a relatively small set of 21 traits. This provided 80% power to detect correla-tions greater than |.57| but limited our ability to detect smaller correlations (and therefore to draw conclusions about null effects for the between-traits analyses).
Data analyses
Most analyses were conducted in the R programming environment (R Core Team, 2018); for some supplemental analyses, we used Mplus Version 8.3 (Muthén & Muthén, 2017). We used two complementary approaches: (a) the full change-goals scale and (b) the top three priorities. The first method captures the direction and amount of change that participants desired for each trait, whereas the second method summarizes the improvements that participants most prioritized. For each approach, we report descriptive statistics (means for the scale, frequen-cies for the priorities) and examine the associations between trait levels and change goals (correlations for the full scale are presented below; odds ratios for the priorities are in the Supplemental Material, Section 5).
For analyses involving informant reports, we com-puted an aggregate score across all informants for a given target, with two exceptions for our supplemental analyses: (a) We used all open-ended responses when examining reasons for the personality change that infor-mants most prioritized, and (b) we randomly selected one informant per target for the logistic regression analyses predicting informant-reported priorities from trait levels. For scale-reliability estimates, we computed the ω coefficient for scales that had three or more items and α for scales that had two items (using the MBESS package for R; Kelley, 2018). We repeated this proce-dure to compute scale reliabilities for the informant reports after aggregating scores for each item across all informants for a given target. For the informant-reported measures, we computed the intraclass correlation coef-ficient, ICC(1), from a random-effects model for targets who had two or more informants (using the lme4 pack-age; Bates, Mächler, Bolker, & Walker, 2015). This rep-resents the proportion of variation in the informant reports due to variation between targets.
For most of the key analyses (described below), we estimated latent correlations using structural equation models, implemented via lavaan (Rosseel, 2012), to ensure that any differences in effect sizes across traits were not due to differences in measurement reliability

248 Sun, Goodwin
(because some traits were measured with two items and others with four items). For these structural equa-tion models, when there were only two indicators, we constrained their factor loadings to be equal. Average effect sizes and comparisons of effect sizes were com-puted after appropriate transformations (described in the Supplemental Material, Section 1).
Results
Descriptive statistics and self–other agreement correla-tions for the key measures are shown in Table 1 (for personality traits) and Table 2 (for change goals). The full correlation matrices for personality traits (Tables S6–S7) and change goals (Tables S8–S9) are available in our OSF repository (https://osf.io/cybtx/).
Do people want to be more moral?
As shown in Table 2 and Figures 1 and 2, targets showed the strongest desires to be less anxious, depressed, emo-tionally volatile, and angry (i.e., all the facets of negative
emotionality that we measured) and to be more creative, productive, and sociable. In contrast, targets reported weaker desires to change on traits that were more morally relevant (e.g., honesty, general morality, compassion, fair-ness). To further understand this pattern, we converted each participant’s change goal for each trait into an abso-lute value, then averaged those values across participants to compute the average amount of desired change for each trait. This procedure placed equal weight on goals to change in either direction (e.g., goals to become more or less compassionate both contributed to higher average absolute change goals for this analysis). We then corre-lated the average absolute change goal for each trait with the traits’ moral-relevance scores (rated by a separate sample of participants). This showed that on average, targets showed a weaker desire to change on traits that were more morally relevant, Sample 1: r(19) = –.69, 95% confidence interval (CI) = [−.86, −.37], p < .001; Sample 2: r(19) = −.62, 95% CI = [−.83, −.26], p = .003.
Figure 2, which summarizes participants’ top three most desired changes for the target, makes the targets’ personality-change priorities even clearer. For these
Own Goals Informant GoalsSample 1
Own Goals Informant GoalsSample 2
General MoralityRespectfulness
FairnessHonestyLoyalty
CompassionResponsibility
PurityTrust
ProductivenessAnger
Intellectual CuriosityEmotional Volatility
OrganizationDepression
Energy LevelCreative Imagination
AnxietyAesthetic Sensitivity
AssertivenessSociability
0 020 2040 4060 6080 80100 0 020 2040 4060 6080 80100Cumulative Percentage of Goals Cumulative Percentage of Goals
Wanted to Stay the Same Wanted Lower Levels Wanted Higher Levels
Fig. 1. Categorical summary of ratings on the change-goals scale, separately for Samples 1 and 2. Stacked bars on the left of each graph show the percentage of targets who wanted higher levels, lower levels, or the same level of each trait. Stacked bars on the right of each graph show the percentage of individual (i.e., not aggregated) informants who wanted their target to have higher levels, lower levels, or the same level of each trait. To facilitate visual comparison, we have ordered the traits from least to most morally relevant on the basis of the average of the moral-relevance norms across the two samples (weighted equally). However, in the analyses for each sample, we used the moral-relevance norms for the respective sample.

249
Tab
le 1
. D
escr
iptive
Sta
tist
ics
for
Per
sonal
ity
Tra
its Sa
mpl
e 1
Sam
ple
2
Se
lf-re
port
Info
rman
t re
port
Self-
repo
rtIn
form
ant re
port
Trai
tM
SDRe
l.M
SDRe
l.IC
C(1
)r
MSD
Rel.
MSD
Rel.
ICC(1
)r
Soci
abili
ty3.
091.
01.8
63.
490.
94.8
8.6
1.7
4***
2.82
0.91
.82
3.18
0.86
.84
.46
.63*
**A
sser
tiven
ess
3.36
0.88
.80
3.52
0.80
.83
.40
.55*
**3.
030.
90.7
93.
230.
74.7
9.4
3.5
1***
Ener
gy le
vel
3.70
0.78
.72
4.04
0.69
.73
.43
.58*
**3.
430.
79.6
63.
790.
72.7
5.3
5.5
0***
Com
pass
ion
3.93
0.72
.57
4.10
0.70
.72
.16
.54*
**3.
780.
69.4
74.
000.
61.6
1.1
2.3
9***
Resp
ectfu
lnes
s3.
980.
67.6
24.
260.
62.7
5.2
8.5
6***
3.97
0.65
.59
4.22
0.64
.76
.26
.18*
Trus
t3.
180.
79.7
03.
610.
73.7
7.1
8.4
8***
3.27
0.75
.63
3.55
0.72
.75
.28
.44*
**O
rgan
izat
ion
3.80
0.90
.82
3.79
0.95
.90
.51
.66*
**3.
830.
85.8
13.
830.
90.8
9.4
0.5
7***
Prod
uctiv
enes
s3.
510.
86.7
64.
120.
71.7
8.4
0.5
9***
3.31
0.79
.71
3.90
0.72
.77
.35
.56*
**Re
spon
sibi
lity
3.56
0.69
.59
4.00
0.67
.74
.25
.24*
*3.
520.
66.5
13.
910.
69.7
0.2
6.3
3***
Anx
iety
3.66
0.86
.79
3.35
0.87
.84
.31
.57*
**3.
640.
84.7
43.
290.
75.7
8.2
6.4
7***
Dep
ress
ion
2.73
0.93
.80
2.39
0.91
.88
.45
.62*
**2.
860.
93.7
92.
500.
82.8
4.2
7.4
0***
Emot
iona
l vol
atili
ty2.
910.
98.8
42.
630.
96.8
7.4
1.5
5***
2.97
0.95
.81
2.58
0.94
.89
.25
.43*
**A
nger
2.94
1.02
.62
2.60
0.94
.73
.31
.60*
**2.
941.
01.5
62.
680.
91.7
1.2
8.4
4***
Inte
llect
ual c
urio
sity
4.08
0.66
.68
4.13
0.65
.76
.25
.52*
**3.
790.
73.7
23.
900.
66.7
5.3
3.6
2***
Aes
thet
ic s
ensi
tivity
3.61
1.00
.73
3.69
0.88
.82
.44
.71*
**3.
440.
94.6
23.
570.
81.7
0.3
9.6
5***
Cre
ativ
e im
agin
atio
n3.
760.
76.7
83.
980.
60.7
8.2
0.4
4***
3.56
0.76
.68
3.91
0.62
.73
.18
.20*
*G
ener
al m
oral
ity4.
060.
60.7
74.
470.
46.7
3.0
5.1
53.
990.
57.6
94.
350.
47.7
0.1
2.1
0H
ones
ty3.
940.
69.7
54.
370.
58.7
6.0
5.2
9***
3.89
0.74
.77
4.31
0.59
.74
.13
.13
Fairne
ss4.
160.
54.6
74.
470.
50.7
5.1
7.1
24.
180.
59.6
84.
440.
50.7
4.1
3.1
0Lo
yalty
4.25
0.62
.49
4.41
0.55
.68
.06
.24*
4.15
0.67
.48
4.27
0.60
.60
.11
−.02
Purity
2.87
0.81
.40
3.85
0.84
.70
.19
.31*
2.96
0.75
.16
3.84
0.74
.64
.14
.39*
Not
e: “
Rel.”
den
otes
the
rel
iabi
lity
estim
ate
for
each
tra
it. W
e us
ed α
for
the
tw
o-ite
m h
ones
ty, f
airn
ess,
loya
lty, a
nd p
urity
sca
les
and ω
for
the
rem
aini
ng thr
ee- to
fou
r-ite
m s
cale
s.
The
intrac
lass
cor
rela
tion
coef
ficie
nt, I
CC(1
), s
how
s th
e pr
opor
tion
of v
aria
bilit
y in
info
rman
t ra
tings
due
to
variab
ility
bet
wee
n ta
rget
s (c
ompu
ted
acro
ss in
form
ant ra
tings
for
ta
rget
s w
ho h
ad tw
o or
mor
e in
form
ants
). L
aten
t se
lf–ot
her
agre
emen
t co
rrel
atio
ns (
rs)
wer
e es
timat
ed u
sing
struc
tura
l equ
atio
n m
odel
s.*p
< .0
5. *
*p <
.01.
***
p <
.001
. (un
corr
ecte
d fo
r m
ultip
le c
ompa
riso
ns)

250
Tab
le 2
. D
escr
iptive
Sta
tist
ics
for
the
Chan
ge-G
oal
s Sc
ale
Sam
ple
1Sa
mpl
e 2
Se
lf-re
port
Info
rman
t re
port
Self-
repo
rtIn
form
ant re
port
Trai
t M
SDα
MSD
αIC
C(1
)r
MSD
αM
SDα
ICC(1
)r
Anx
iety
−1.1
80.
63.5
6−0
.79
0.61
.79
.30
.59*
**−1
.25
0.67
.65
−0.7
80.
58.7
0.1
6.4
6***
Dep
ress
ion
−1.1
20.
61.5
3−0
.77
0.59
.60
.29
.61*
**−1
.19
0.67
.58
−0.8
30.
59.6
2.2
2.5
2***
Prod
uctiv
enes
s0.
990.
64.6
80.
240.
43.6
0.3
0.3
0**
1.12
0.67
.50
0.35
0.45
.59
.09
.25*
*Cre
ativ
e im
agin
atio
n1.
040.
57.7
80.
300.
41.8
2.0
2.1
31.
070.
63.7
50.
320.
39.7
4.1
0.1
2Ang
er−0
.90
0.66
.69
−0.4
00.
49.7
9.1
8.3
3***
−1.0
30.
74.7
5−0
.42
0.52
.80
.13
.31*
**Em
otio
nal v
olat
ility
−0.9
60.
64.5
6−0
.47
0.54
.70
.29
.59*
**−0
.98
0.73
.52
−0.4
60.
53.6
2.0
6.4
6***
Soci
abili
ty0.
880.
61.6
90.
410.
52.8
0.3
4.3
7***
1.00
0.67
.63
0.55
0.50
.73
.15
.23*
*O
rgan
izat
ion
0.79
0.65
.84
0.33
0.47
.72
.20
.39*
**0.
840.
66.8
10.
350.
52.8
9.2
7.3
3***
Ener
gy le
vel
0.74
0.55
.66
0.30
0.43
.77
.25
.40*
**0.
840.
64.6
70.
380.
45.7
3.1
8.2
9***
Inte
llect
ual c
urio
sity
0.69
0.60
.59
0.30
0.41
.68
.08
.10
0.77
0.62
.46
0.33
0.42
.57
.11
.31*
*Ass
ertiv
enes
s0.
670.
61.6
20.
340.
51.7
5.2
2.4
1***
0.75
0.64
.53
0.44
0.52
.71
.16
.18*
Resp
onsi
bilit
y0.
620.
60.7
90.
210.
38.8
6.1
3.0
80.
760.
64.6
40.
230.
38.7
5.1
3.1
8*H
ones
ty0.
600.
58.6
80.
170.
36.7
8.0
1.0
70.
690.
65.7
50.
210.
37.7
9.1
3.2
9***
Aes
thet
ic s
ensi
tivity
0.65
0.53
.59
0.27
0.40
.84
.01
.13
0.67
0.63
.69
0.32
0.42
.81
.16
.16*
Trus
t0.
600.
60.4
30.
270.
46.6
9.1
2.4
3***
0.56
0.67
.36
0.24
0.43
.60
.07
.22*
Resp
ectfu
lnes
s0.
570.
60.6
40.
160.
33.6
1.1
0.2
2*0.
690.
67.5
90.
200.
40.6
6.1
3.3
0***
Gen
eral
mor
ality
0.59
0.55
.75
0.08
0.30
.79
.17
.03
0.61
0.61
.69
0.15
0.34
.76
.17
.20*
*Com
pass
ion
0.53
0.60
.62
0.22
0.40
.67
.15
.28*
*0.
570.
64.5
40.
180.
37.6
5.1
6.2
7**
Fairne
ss0.
520.
55.7
80.
120.
26.7
1.0
7−.
020.
580.
60.7
70.
150.
33.8
1.1
1.2
6***
Loya
lty0.
400.
54.6
60.
120.
27.8
4.0
1−.
000.
520.
63.7
50.
160.
36.8
4.1
2.1
6*Pu
rity
0.26
0.50
.24
0.01
0.25
.21
.08
−.26
0.32
0.57
.08
0.03
0.31
.31
.10
.23
Not
e: T
he in
trac
lass
cor
rela
tion
coef
ficie
nt, I
CC(1
), s
how
s th
e pr
opor
tion
of v
aria
bilit
y in
info
rman
t ra
tings
due
to
variab
ility
bet
wee
n ta
rget
s (c
ompu
ted
acro
ss in
form
ant ra
tings
for
tar
gets
w
ho h
ad tw
o or
mor
e in
form
ants
). L
aten
t se
lf–ot
her
agre
emen
t co
rrel
atio
ns (
rs)
wer
e es
timat
ed u
sing
struc
tura
l equ
atio
n m
odel
s. T
raits
are
ord
ered
fro
m the
hig
hest
to
low
est m
ean
abso
lute
des
ired
cha
nge
(ave
rage
d ac
ross
bot
h sa
mpl
es). T
he m
eans
rep
orte
d in
thi
s ta
ble
wer
e co
mpu
ted
from
the
raw
cha
nge
goal
s, b
ut w
e us
ed m
ean
abso
lute
cha
nge
goal
s fo
r th
e co
rrel
atio
ns w
ith m
oral
rel
evan
ce (
repo
rted
in the
tex
t) a
nd p
erce
ived
cha
ngea
bilit
y (r
epor
ted
in the
Sup
plem
enta
l Mat
eria
l, Se
ctio
n 3)
.*p
< .0
5. *
*p <
.01.
***
p <
.001
. (un
corr
ecte
d fo
r m
ultip
le c
ompa
riso
ns)

Moral Change Goals 251
analyses, change goals that reflected a “worsening” of the trait (which fewer than 2% of participants prioritized for each trait) were not included. By focusing on par-ticipants’ desires to improve each trait, these analyses directly addressed the main question of whether people want to be more moral. We found that targets were less inclined to prioritize more morally relevant improve-ments, Sample 1: r(19) = −.56, 95% CI = [−.80, −.17], p = .009; Sample 2: r(19) = −.57, 95% CI = [−.80, −.18], p = .007. Instead, they focused on reducing negative emotionality. For example, a large proportion of the targets reported that becoming less anxious (Sample 1: 47.67%; Sample 2: 41.80%) or less depressed (Sam-ple 1: 44.33%; Sample 2: 37.60%) were among their top three personality change goals. These were fol-lowed by goals to become more sociable (Sample 1: 25.67%; Sample 2: 30.80%), less emotionally volatile (Sample 1: 19%; Sample 2: 21.40%), and more produc-tive (Sample 1: 19%; Sample 2: 21.20%). Moral improve-ments were rarely prioritized; for example, only about 9% and about 3% of targets prioritized a goal to become more compassionate or more generally moral, respectively.
Do close others want us to be more moral?
Next, we examined whether close others wanted their targets to change to a similar extent and in similar ways as the targets themselves did. First, we compared tar-gets’ and informants’ average absolute change goals across the 42 items (scores on this index ranged from 0 to 2). Paired-samples t tests showed that on average, targets wanted to change themselves more (Sample 1: M = 0.79, SD = 0.33; Sample 2: M = 0.86, SD = 0.38) than their close others wanted them to change (Sample 1: M = 0.35, SD = 0.22, g = 1.55, 95% CI = [1.33, 1.77]; Sample 2: M = 0.38, SD = 0.25, g = 1.50, 95% CI = [1.31, 1.68]). This pattern can be seen most clearly in Figure 1: The gray bars (depicting the percentage of targets who did not want to change on each trait and the per-centage of informants who did not want the target to change on each trait) are much larger for the informants across all traits. In addition, the average extent to which close others wanted the target to change was descrip-tively very similar for both friends (Sample 1: M = 0.33, SD = 0.23; Sample 2: M = 0.36, SD = 0.27) and parents
Own Priorities Informant PrioritiesSample 1
More MoralMore Respectful
More FairMore Honest
More LoyalMore Compassionate
More ResponsibleMore Pure
More TrustingMore Productive
Less AngryMore Intellectually Curious
Less Emotionally VolatileMore OrganizedLess DepressedMore Energetic
More Creative/ImaginativeLess Anxious
More Aesthetically SensitiveMore AssertiveMore Sociable
Percentage Who Prioritized Each Improvementin Top Three Change Goals
Own Priorities Informant PrioritiesSample 2
Percentage Who Prioritized Each Improvementin Top Three Change Goals
50 40 5030 4020 30010 2010 50 40 5030 4020 30010 2010
Fig. 2. Percentage of targets and informants who prioritized an improvement on each trait as one of their top three most desired changes in themselves or in their targets, respectively. Results are shown separately for Samples 1 and 2. To facilitate visual comparison, we have ordered the change goals from least to most morally relevant on the basis of the average of the moral-relevance norms across the two samples (weighted equally). However, in the analyses for each sample, we used the moral-relevance norms for the respective sample. Error bars depict 95% confidence intervals.

252 Sun, Goodwin
(Sample 1: M = 0.34, SD = 0.23; Sample 2: M = 0.30, SD = 0.23).
Although informants typically wanted the targets to change less than the targets themselves did, they reported a similar pattern of change goals across traits, across targets, and within targets. Across traits, targets and informants showed a similar pattern of personality-change priorities: The two sets of percentages (which included goals to change in the undesirable direction) were almost perfectly correlated, Sample 1: r(40) = .95, 95% CI = [.90, .97], p < .001; Sample 2: r(40) = .93, 95% CI = [.87, .96], p < .001. Crucially, informants also had lower desires to change more morally relevant traits, Sample 1: r(19) = −.68, 95% CI = [−.86, −.35], p < .001; Sample 2: r(19) = −.71, 95% CI = [−.87, −.40], p < .001, and were less likely to prioritize more morally relevant improvements for their targets, Sample 1: r(19) = −.46, 95% CI = [−.74, −.03], p = .037; Sample 2: r(19) = −.53, 95% CI = [−.78, −.13], p = .013.
We used two additional methods to examine the similarity between self- and informant-reported change goals. First, for each trait, we computed the latent cor-relation between self-reported change goals and informant-reported change goals (i.e., self−other agree-ment; see Table 2). These estimates were generally moderately positive (Sample 1: mean r = .26; Sample 2: mean r = .28), suggesting that targets and informants agreed to some extent on how much they wanted the target to be higher or lower on each trait. For example, if targets reported that they wanted to become much less anxious, their informants also tended to report greater goals to reduce the targets’ anxiety (compared with targets who reported not wanting to reduce their anxiety).
Second, we computed profile correlations. Profile correlations describe the similarity between two sets of goals (i.e., across all 21 traits) as opposed to the between-persons agreement for a given trait. They therefore allow us to examine the extent of similarity between targets’ idiosyncratic profiles of change goals and their informants’ profiles of change goals for them. However, profile correlations can be positive simply because of normativeness effects (e.g., because the average person wants to be less depressed and more sociable; Furr, 2008). Because of such effects, it is theo-retically possible that an “informant” who had never met a given target could report change goals that sub-stantially overlap with that target’s goals. Therefore, we compared the average overall profile correlation with a baseline based on many pseudosamples in which we randomly paired up each target’s profile of 21 change goals with the profile of 21 change goals reported by a different target’s informant (or informants). We then recomputed the profile correlations on the basis of 1,000 such pseudosamples (using the multicon
package; Sherman & Serfass, 2015). From this, we found that the mean overall correlation (r) for both samples was .65, p < .001. After removing normativeness effects (i.e., agreement due to the average change-goal pro-file), we still found a small amount of distinctive profile agreement (Sample 1: r = .20, p < .001; Sample 2: r = .12, p < .001). That is, targets and informants showed some agreement on the profile of changes that they wanted to see, over and above mere normativeness effects.
Who wants to be more moral?
Although people were generally less inclined to change on more morally relevant traits, some people showed a greater desire to change on more morally relevant traits (relative to other people). Thus, we explored the correlates of these individual differences in moral change goals.
Associations between traits and change goals. First, we examined whether change goals were generally cali-brated to the targets’ current traits. Figure 3 shows the latent correlations between current levels and change goals for each trait (see also Table S10 at https://osf.io/cybtx/). The correlations replicated the pattern observed in previous studies (e.g., Hudson & Roberts, 2014): In general, targets who reported having lower levels of a given trait wanted to increase more on that trait (Sample 1: mean r = −.52; Sample 2: mean r = −.35). However, the negative association between traits and change goals was smaller for more morally relevant traits, as shown by a strong positive association between moral-relevance scores and (Fisher r-to-z transformed) correlations between traits and change goals, Sample 1: r(19) = .55, 95% CI = [.16, .79], p = .010; Sample 2: r(19) = .49, 95% CI = [.07, .76], p = .026. That is, knowing someone’s current standing on a more morally relevant trait provides relatively little infor-mation about whether they want to have higher or lower levels of that trait.
We then examined the associations between informant-reported current traits and change goals. A paired-sam-ples t test showed that the negative association between traits and change goals was even stronger when both were informant-reported, compared with when both were self-reported, Sample 1: mean r = −.79, t(20) = 5.97, p < .001; Sample 2: mean r = −.69, t(20) = 11.39, p < .001. In addition, there was no evidence that the association between informant-reported traits and change goals was weaker for more morally relevant traits, Sample 1: r(19) = .29, 95% CI = [−.16, .64], p = .198; Sample 2: r(19) = .33, 95% CI = [−.12, .67], p = .142 (but note that we had relatively low power to detect these effects). However, there was no significant

Moral Change Goals 253
Sample 1Self-Reported Traits and Change Goals Informant-Reported Traits and Change Goals
TraitSociabilityAssertivenessAesthetic SensitivityAnxietyOrganizationCreative ImaginationEnergy LevelDepressionEmotional VolatilityIntellectual CuriosityAngerProductivenessTrustPurityResponsibilityCompassionLoyaltyHonestyRespectfulnessFairnessGeneral Morality
Sample 2Self-Reported Traits and Change Goals Informant-Reported Traits and Change Goals
TraitSociabilityAesthetic SensitivityAssertivenessIntellectual CuriosityAnxietyDepressionCreative ImaginationEmotional VolatilityEnergy LevelOrganizationAngerProductivenessTrustPurityResponsibilityCompassionGeneral MoralityHonestyLoyaltyFairnessRespectfulness
–1 –.90 –.80 –.70 –.60 –.50 –.40 –.30 –.20 –.10 0 .10 .20 .30r
–1 –.90 –.80 –.70 –.60 –.50 –.40 –.30 –.20 –.10 0 .10 .20 .30r
Fig. 3. Associations between current traits and change goals, separately for targets and informants and for Samples 1 and 2. The traits are ordered from least to most morally relevant on the basis of the moral-relevance norms for each respective sample. Error bars depict 95% confidence intervals.

254 Sun, Goodwin
interaction between moral relevance and whether traits and change goals were both self-reported (the refer-ence category) or both informant-reported (Sample 1: b = −0.17, 95% CI = [−0.34, 0.01], p = .083; Sample 2: b = −0.05, 95% CI = [−0.18, 0.09], p = .507).
We conducted conceptually similar logistic regres-sion analyses, predicting change-goal priorities from current levels. This alternative approach (see the Sup-plemental Material, Section 5) showed that targets who had less desirable levels of a trait were more likely to prioritize improving that trait as one of their top three change goals and that informants’ change goals remained relatively calibrated to their perceptions of targets’ deficits, even for morally relevant traits.
Associations with additional individual differ-ences. The above results showed that self-reported moral change goals were, at best, only weakly negatively correlated with self-reported levels of the respective traits. To find out whether moral change goals are related to other aspects of moral character and values, we used semipartial correlations to examine the associations that each self-reported moral change goal had with a number of additional individual differences relating to moral character and values, controlling for self-reported levels of the trait in question. Two replicable and theoretically noteworthy findings were that more religious targets tended to report greater desires to be more compassion-ate and loyal (when analyses controlled for self-reported compassion and loyalty, respectively) and that targets who valued impartially maximizing the greater good (Kahane et al., 2018) reported greater desires to become fairer and more compassionate (when analyses con-trolled for self-reported fairness and compassion, respec-tively; see the Supplemental Material, Section 6, and Tables S3 and S4 in the Supplemental Material for full details).
Do high trait levels explain why people do not want to be more moral?
Finally, because ratings tended to be quite high for most of the morally relevant traits, we explored the possibil-ity that people are less motivated to improve moral traits because they already see themselves or their close others as having relatively high levels of such traits (compared with less morally relevant traits). To test this idea, we conducted supplemental within-persons analy-ses using multilevel models. Across both samples, person-mean-centered trait levels and moral relevance independently predicted lowered change goals for both the continuous and priority-based measures and for both self- and informant perspectives (these analyses were not preregistered; for details, see the Supplemen-tal Material, Section 3 and Table S2). In other words,
people were less inclined to change on the traits that they saw themselves as having relatively more desirable levels of (compared with their other traits)—but even after we controlled for targets’ perceptions of their cur-rent levels, they were still less inclined to change on more morally relevant traits (and the same was true from the perspective of informants).
Discussion
We examined whether people want to be more moral and whether close others also want our moral qualities to improve. Two findings stand out. First, people were less interested in changing the levels of moral traits (e.g., honesty, fairness, compassion), compared with nonmoral traits (e.g., anxiety, sociability, productive-ness), in themselves and in close others. Second, targets and informants showed similar patterns of change goals, but targets wanted to change themselves to a much greater extent than their informants wanted them to change.
Why do people not particularly want to be more moral? Although self-ratings tended to be high for moral traits, ceiling effects cannot explain our main result, because our measure of change goals allowed partici-pants to report how much they wanted to increase, decrease, or stay the same on each trait, independently of how they currently rated themselves. A more psy-chologically interesting possibility is that people see less room for improvement on moral traits. Because we did not measure where people thought they stood rela-tive to the extremes of each trait, our data cannot speak directly to this idea (i.e., people might not have been claiming that they had the lowest or highest possible levels of each trait when they “strongly disagreed” or “strongly agreed” with each trait description; Blanton & Jaccard, 2006). A related possibility is that people are less motivated to improve on moral traits because they already see themselves as having quite high levels of such traits and therefore morally “good enough”—even if they think they could be morally better (see Schwitz-gebel, 2019). However, even after controlling for current levels, we found that people were still less inclined to change more morally relevant traits, suggesting that additional psychological factors might reduce people’s desires to change morally relevant traits.
One such possibility is that people are typically moti-vated to change in ways that will improve their own well-being (Hudson & Fraley, 2016a). Whereas becom-ing less anxious has obvious personal benefits, people might believe that becoming more moral would result in few personal benefits (or even some costs). Support-ing this idea, targets’ and informants’ justifications for their top change goal suggest that nonmoral improve-ments would primarily benefit the target, whereas moral

Moral Change Goals 255
improvements would primarily benefit other people (see the Supplemental Material, Section 7). Our findings are also consistent with the idea that people are reluc-tant to change moral traits because those traits are fundamental to their identity (e.g., Riis et al., 2008).
Considering how much people value morality in oth-ers (Goodwin, 2015; Goodwin et al., 2014; Hartley et al., 2016), it is perhaps more surprising that people do not want their close others to improve their moral qualities. Instead, like targets, informants prioritized wanting targets to become less anxious and depressed—and their open-ended justifications for these goals over-whelmingly reflected a concern for the targets’ well-being (see the Supplemental Material, Section 7). Similar mechanisms might explain why people do not want themselves and close others to become more moral. An additional possible explanation—specific to interpersonal change goals—is that people are less likely to become or stay close with social partners who have very different moral values in the first place (Haidt, Rosenberg, & Hom, 2003; Skitka, 2010).
Finally, targets who had less desirable levels of a given trait wanted to improve more on that trait, but this was less true for more morally relevant traits. For example, self-perceived deficiencies in compassion and general morality were not particularly indicative of how much targets wanted to improve on these traits. Inter-estingly, however, informants’ change goals were gener-ally well calibrated to their perceptions of targets’ deficits—including moral deficits. This suggests that close others might have unique insight into not only our trait levels (Quintus et al., 2017; Vazire & Carlson, 2011) but also which of our traits are most in need of improvement.
Constraints on generality
Our goal in asking targets to self-nominate well-acquainted informants was to understand interpersonal change goals in the context of real-world relationships. Thus, we do not expect our findings regarding inter-personal change goals to generalize beyond people who already like and are close to their targets. We would likely see a greater overall desire to change targets—and perhaps a greater desire to change moral traits specifically—if we recruited informants who dis-liked the targets (Leising, Erbs, & Fritz, 2010). Likewise, our results do not speak to the moral change goals that people might have for abstract entities, such as out-groups or people in general.
Does our main finding—that people are relatively unenthusiastic about moral self-improvement—generalize beyond the unique developmental context of young adulthood? For example, given that concerns for
nurturing and guiding the next generation tend to peak in midlife (McAdams, de St. Aubin, & Logan, 1993), midlife adults might be more likely to prioritize moral improvements that serve these goals. We conducted another preregistered replication, which showed that relatively older adults (mean age = 45.4 years) are also less inclined to improve more morally relevant traits (see Supplemental Material, Section 8). Thus, we con-clude that across the adult life span, people in Western cultures deprioritize moral self-improvements. Future research should investigate how other people want tar-gets of different ages to change. For example, although parents of our young adult targets wanted them to change less than the targets themselves did, we specu-late that parents might want to see greater moral devel-opment in younger children, even before children start thinking about changing their own personalities (but we have no idea what age range this might apply to).
Conclusion
People care a lot about morality, but does that mean that they want themselves and close others to be more moral? We found that North American college students might not value moral improvements as much as nonmoral improve-ments in themselves and that their close others typically feel the same way. This suggests that personality change goals might be primarily motivated by the desire to improve one’s own life rather than by more noble con-siderations. Still, on an uplifting note, close others gener-ally accept us for who we are but overwhelmingly want us to change in ways that are in our best interests.
Action Editor
Michael Inzlicht served as action editor for this article.
Author Contributions
J. Sun conceptualized the study, collected and analyzed the data, and drafted the manuscript. G. P. Goodwin provided extensive feedback on the study design, analyses, and inter-pretations of the results. Both authors revised the manuscript and approved the final version for submission.
ORCID iD
Jessie Sun https://orcid.org/0000-0001-6764-0721
Acknowledgments
We are grateful to Ted Schwaba, Luke Smillie, and Joshua Wilt for comments on an earlier draft of this article; to col-leagues at the University of California, Davis, and the Uni-versity of Pennsylvania for insightful conversations; and to Rebecca Neufeld and Nicholas Hunt for assistance with data collection and coding.

256 Sun, Goodwin
Declaration of Conflicting Interests
The author(s) declared that there were no conflicts of interest with respect to the authorship or the publication of this article.
Supplemental Material
Additional supporting information can be found at http://journals.sagepub.com/doi/suppl/10.1177/0956797619893078
Open Practices
TC
All measures, data, R scripts, and Mplus input and output files required to reproduce the results are publicly available on the Open Science Framework (OSF) and can be accessed at https://osf.io/cbxjh. We preregistered the analyses for Sample 2 at https://osf.io/6mdwp/. The analyses for Sample 1 were exploratory, but we preregistered stopping rules and an initial exploratory analysis plan at https://osf.io/qjfnw/. The com-plete Open Practices Disclosure for this article can be found at http://journals.sagepub.com/doi/suppl/10.1177/0956797 619893078. This article has received the badges for Open Data, Open Materials, and Preregistration. More information about the Open Practices badges can be found at http://www .psychologicalscience.org/publications/badges.
References
Baranski, E. N., Morse, P. J., & Dunlop, W. L. (2017). Lay conceptions of volitional personality change: From strat-egies pursued to stories told. Journal of Personality, 85, 285–299. doi:10.1111/jopy.12240
Bates, D., Mächler, M., Bolker, B., & Walker, S. (2015). Fitting linear mixed-effects models using lme4. Journal of Statistical Software, 67(1). doi:10.18637/jss.v067.i01
Baumeister, R. F. (1994). The crystallization of discontent in the process of major life change. In T. F. Heatherton & J. L. Weinberger (Eds.), Can personality change? (pp. 281–297). Washington, DC: American Psychological Association. doi:10.1037/10143-012
Baumeister, R. F., & Exline, J. J. (1999). Virtue, personality, and social relations: Self-control as the moral muscle. Journal of Personality, 67, 1165–1194. doi:10.1111/1467-6494.00086
Bench, S. W., Schlegel, R. J., Davis, W. E., & Vess, M. (2015). Thinking about change in the self and others: The role of self-discovery metaphors and the true self. Social Cognition, 33, 169–185. doi:10.1521/soco.2015.33.3.2
Blanton, H., & Jaccard, J. (2006). Arbitrary metrics in psy-chology. The American Psychologist, 61(1), 27–41. doi:10.1037/0003-066X.61.1.62
Bollich, K. L., Johannet, P. M., & Vazire, S. (2011). In search of our true selves: Feedback as a path to self-knowledge. Frontiers in Psychology, 2, Article 312. doi:10.3389/fpsyg.2011.00312
Christy, A. G., Kim, J., Vess, M., Schlegel, R. J., & Hicks, J. A. (2017). The reciprocal relationship between perceptions
of moral goodness and knowledge of others’ true selves. Social Psychological and Personality Science, 8, 910–917. doi:10.1177/1948550617693061
DeYoung, C. G. (2015). Cybernetic Big Five Theory. Journal of Research in Personality, 56, 33–58. doi:10.1016/j .jrp.2014.07.004
DeYoung, C. G., Quilty, L. C., & Peterson, J. B. (2007). Between facets and domains: 10 aspects of the Big Five. Journal of Personality and Social Psychology, 93, 880–896. doi:10.1037/0022-3514.93.5.880
Fleeson, W., Furr, R. M., Jayawickreme, E., Meindl, P., & Helzer, E. G. (2014). Character: The prospects for a personality-based perspective on morality. Social and Personality Psychology Compass, 8, 178–191. doi:10.1111/spc3.12094
Furr, R. M. (2008). A framework for profile similarity: Inte-grating similarity, normativeness, and distinctiveness. Journal of Personality, 76, 1267–1316. doi:10.1111/j.1467-6494.2008.00521.x
Goodwin, G. P. (2015). Moral character in person perception. Current Directions in Psychological Science, 24, 38–44. doi:10.1177/0963721414550709
Goodwin, G. P., Piazza, J., & Rozin, P. (2014). Moral charac-ter predominates in person perception and evaluation. Journal of Personality and Social Psychology, 106, 148–168. doi:10.1037/a0034726
Haidt, J., Rosenberg, E., & Hom, H. (2003). Differentiating diversities: Moral diversity is not like other kinds. Journal of Applied Social Psychology, 33, 1–36. doi:10.1111/ j.1559-1816.2003.tb02071.x
Hartley, A. G., Furr, R. M., Helzer, E. G., Jayawickreme, E., Velasquez, K. R., & Fleeson, W. (2016). Morality’s cen-trality to liking, respecting, and understanding others. Social Psychological and Personality Science, 7, 648–657. doi:10.1177/1948550616655359
Hudson, N. W., & Fraley, R. C. (2015). Volitional personality trait change: Can people choose to change their person-ality traits? Journal of Personality and Social Psychology, 109, 490–507. doi:10.1037/pspp0000021
Hudson, N. W., & Fraley, R. C. (2016a). Changing for the better? Longitudinal associations between volitional personality change and psychological well-being. Personality and Social Psychology Bulletin, 42, 603–615. doi:10.1177/0146167216637840
Hudson, N. W., & Fraley, R. C. (2016b). Do people’s desires to change their personality traits vary with age? An examination of trait change goals across adulthood. Social Psychological and Personality Science, 7, 847–856. doi:10.1177/1948550616657598
Hudson, N. W., & Roberts, B. W. (2014). Goals to change personality traits: Concurrent links between personality traits, daily behavior, and goals to change oneself. Journal of Research in Personality, 53, 68–83. doi:10.1016/j .jrp.2014.08.008
Kahane, G., Everett, J. A. C., Earp, B. D., Caviola, L., Faber, N. S., Crockett, M. J., & Savulescu, J. (2018). Beyond sacrifi-cial harm: A two-dimensional model of utilitarian psychol-ogy. Psychological Review, 125, 131–164. doi:10.1037/rev0000093

Moral Change Goals 257
Kelley, K. (2018). MBESS (Version 4.4.3) [R package]. Retrieved from https://cran.r-project.org/web/packages/MBESS/index.html
Leising, D., Erbs, J., & Fritz, U. (2010). The letter of rec-ommendation effect in informant ratings of personality. Journal of Personality and Social Psychology, 98, 668–682. doi:10.1037/a0018771
McAdams, D. P., de St. Aubin, E., & Logan, R. L. (1993). Generativity among young, midlife, and older adults. Psychology and Aging, 8, 221–230. doi:10.1037/0882-7974.8.2.221
Meindl, P., & Graham, J. (2014). Know thy participant: The trouble with nomothetic assumptions in moral psychol-ogy. In H. Sarkissian & J. C. Wright (Eds.), Advances in experimental moral psychology (pp. 233–252). London, England: Bloomsbury. doi:10.5040/9781472594150.ch-012
Molouki, S., & Bartels, D. M. (2017). Personal change and the continuity of the self. Cognitive Psychology, 93, 1–17. doi:10.1016/j.cogpsych.2016.11.006
Muthén, L., & Muthén, B. O. (2017). Mplus user’s guide (8th ed.). Los Angeles, CA: Author.
Prentice, M., Furr, R. M., & Hawkins, A. (2019). Introducing the Moral Characteristics Questionnaire. Manuscript in preparation.
Prentice, M., Jayawickreme, E., Hawkins, A., Hartley, A., Furr, R. M., & Fleeson, W. (2019). Morality as a basic psycho-logical need. Social Psychological and Personality Science, 10, 449–460. doi:10.1177/1948550618772011
Quintus, M., Egloff, B., & Wrzus, C. (2017). Predictors of volitional personality change in younger and older adults: Response surface analyses signify the complementary perspectives of the self and knowledgeable others. Journal of Research in Personality, 70, 214–228. doi:10.1016/j.jrp.2017.08.001
R Core Team. (2018). R: A language and environment for statistical computing. Vienna, Austria: R Foundation for Statistical Computing.
Riis, J., Simmons, J. P., & Goodwin, G. P. (2008). Preferences for enhancement pharmaceuticals: The reluctance to enhance fundamental traits. Journal of Consumer Research, 35, 495–508. doi:10.1086/588746
Rosseel, Y. (2012). lavaan: An R package for structural equa-tion modeling. Journal of Statistical Software, 48(2). doi:10.18637/jss.v048.i02
Schönbrodt, F. D., & Perugini, M. (2013). At what sample size do correlations stabilize? Journal of Research in Personality, 47, 609–612. doi:10.1016/j.jrp.2013.05.009
Schwitzgebel, E. (2019). Aiming for moral mediocrity. Res Philosophica, 96, 347–368.
Sherman, R. A., & Serfass, D. G. (2015). The comprehensive approach to analyzing multivariate constructs. Journal of Research in Personality, 54, 40–50. doi:10.1016/j .jrp.2014.05.002
Skitka, L. J. (2010). The psychology of moral conviction. Social and Personality Psychology Compass, 4, 267–281. doi:10.1111/j.1751-9004.2010.00254.x
Soto, C. J., & John, O. P. (2017). The next Big Five Inventory (BFI-2): Developing and assessing a hierarchical model with 15 facets to enhance bandwidth, fidelity, and predic-tive power. Journal of Personality and Social Psychology, 113, 117–143. doi:10.1037/pspp0000096
Strohminger, N., Knobe, J., & Newman, G. (2017). The true self: A psychological concept distinct from the self. Perspectives on Psychological Science, 12, 551–560. doi:10.1177/1745691616689495
Tappin, B. M., & McKay, R. T. (2017). The illusion of moral superiority. Social Psychological and Personality Science, 8, 623–631. doi:10.1177/1948550616673878
Vazire, S., & Carlson, E. N. (2011). Others sometimes know us better than we know ourselves. Current Directions in Psychological Science, 20, 104–108. doi:10.1177/ 0963721411402478

Supplemental Material for “Do People Want to Be More Moral?” 1
1. Additional Methodological Details
Preregistration Details
Prior to collecting any data, we preregistered stopping rules for both samples and a
preliminary analysis plan for Sample 1. Data collection for the two samples occurred around the
same time, but we only conducted analyses for Sample 2 after preregistering the replication
analysis code. Prior to uploading this preregistration, we only accessed the Sample 2 data for the
purposes of extracting the informant contact information (to contact the informants that the
targets nominated), and tracking how many informants had completed the study (which was
handled by research assistants who were not involved in data analytic decisions).
Successful Nominations
A nomination was “unsuccessful” if the target nominated themselves, provided a name
but no email address, provided an email address of a different person than the one they
nominated (and we noticed), or nominated people who informed us that they did not know the
target.
Randomization Procedures for Change Goals Priorities
The order of the list was randomized, but due to human error in programming the survey,
it was presented in a fixed order for all targets, and different fixed orders for the three (male,
female, and gender-neutral) versions of the informant survey (as the randomization had been
conducted separately for these surveys). For Sample 1, rank-order Spearman correlations
between the order in which a trait was presented and the probability that it was selected as one of
the top three priorities did not support the idea that targets and informants were systematically
selecting change goals that were closer to the top of the list (!s > –.22, ps > .156). For Sample 2,
this error also applied to the first 300 targets and their informants, but we subsequently corrected

Supplemental Material for “Do People Want to Be More Moral?” 2
the issue such that the traits were presented in a randomized order for the last 200 targets and
their informants. This error did not apply to Sample 3.
Procedures for Effect Size Comparisons
We computed average correlations by applying the Fisher r-to-z transformation, taking
the mean of the resulting z statistics, then transforming the mean z back to a r. We computed
average ORs by computing the mean of the unstandardized b coefficients, then exponentiating
the mean b. When comparing the relative size of sets of correlations depending on whether they
were based on self-reports, informant-reports, or across methods (as in Figure 3), we applied the
Fisher r-to-z transformation, before conducting parametric analyses on the resulting z values.
Similarly, when comparing the sizes of estimates from the logistic regression results or
correlating these effects with other variables, we used the unstandardized b coefficients.

Supplemental Material for “Do People Want to Be More Moral?” 3
2. Descriptive Statistics for Moral Relevance and Changeability Norms
Table S1 Trait and Item Norms for Moral Relevance and Changeability Sample 1 Sample 2 Moral Relevance Changeability Moral Relevance Changeability M SD α M SD α M SD α M SD α General Morality 2.67 0.56 .63 4.60 1.32 .69 2.22 0.86 .68 4.67 1.23 .49 Being a person of strong moral character 2.65 0.69 4.34 1.47 2.25 0.98 4.52 1.50 Acting morally 2.68 0.61 4.85 1.54 2.19 0.98 4.83 1.52 Respectfulness 2.34 0.55 .56 5.55 1.21 .82 2.44 0.64 .67 5.39 1.28 .65 Being respectful, treating others with respect 2.66 0.58 5.58 1.28 2.63 0.69 5.40 1.47 Being rude to others 2.03 0.73 5.53 1.35 2.25 0.79 5.38 1.51 Fairness 2.51 0.66 .82 4.78 1.24 .70 2.26 0.74 .69 4.96 1.19 .59 Treating everyone as fairly as possible 2.56 0.67 5.11 1.39 2.32 0.82 5.12 1.45 Being a fair person 2.46 0.75 4.45 1.44 2.19 0.87 4.80 1.38 Honesty 2.33 0.72 .73 4.78 1.42 .87 2.23 0.75 .71 4.92 1.32 .78 Being an honest person 2.34 0.81 4.77 1.47 2.25 0.87 4.95 1.45 Being honest even when it's hard 2.32 0.81 4.79 1.55 2.22 0.83 4.90 1.47 Loyalty 2.32 0.75 .82 4.67 1.38 .75 2.23 0.79 .75 4.69 1.35 .71 Being a loyal person 2.35 0.79 4.74 1.53 2.32 0.85 4.81 1.61 Being loyal even when it's hard 2.28 0.85 4.60 1.55 2.15 0.92 4.57 1.45 Compassion 2.26 0.68 .58 4.38 1.17 .42 2.15 0.74 .56 4.58 1.19 .52 Being helpful and unselfish with others 2.49 0.69 4.94 1.46 2.33 0.84 4.95 1.51 Being compassionate, having a soft heart 2.03 0.92 3.82 1.50 1.98 0.92 4.22 1.37 Responsibility 1.85 0.81 .71 4.68 1.37 .81 2.02 0.81 .64 4.79 1.21 .71 Being reliable, can always be counted on 1.97 0.90 4.66 1.47 2.11 0.89 4.73 1.43 Being dependable, steady 1.72 0.95 4.71 1.52 1.93 0.99 4.85 1.32
(table continues)

Supplemental Material for “Do People Want to Be More Moral?” 4
Table S1 (continued) Sample 1 Sample 2 Moral Relevance Changeability Moral Relevance Changeability M SD α M SD α M SD α M SD α Purity 1.73 0.79 .49 4.13 1.33 .65 1.63 0.89 .57 4.40 1.27 .41 Thinking and acting without vulgarity or filth 1.79 0.96 4.54 1.52 1.67 1.07 4.74 1.65 Being wholesome and decent, relatively "pure" 1.68 0.97 3.72 1.55 1.60 1.07 4.05 1.54 Trust 1.68 0.64 .28 4.03 1.10 .42 1.62 0.73 .37 4.41 1.24 .59 Having a forgiving nature 1.94 0.85 3.97 1.44 1.72 0.98 4.25 1.51 Tending to find fault with others 1.41 0.83 4.09 1.33 1.52 0.89 4.57 1.43 Productiveness 1.01 0.79 .64 5.28 1.18 .65 1.31 0.84 .52 5.09 1.19 .59 Being persistent, working until the task is finished 1.18 1.05 5.31 1.27 1.60 1.08 5.09 1.37 Being lazy 0.84 0.76 5.25 1.47 1.01 0.97 5.09 1.46 Anger 0.98 0.66 .66 4.04 1.12 .63 1.20 0.8 .66 4.22 1.33 .71 Getting angry easily 1.16 0.88 4.09 1.33 1.39 0.98 4.24 1.52 Being easily annoyed 0.81 0.64 4.00 1.28 1.01 0.86 4.20 1.52 Intellectual Curiosity 0.72 0.77 .70 3.56 1.32 .64 0.87 0.93 .77 3.86 1.26 .56 Being complex, a deep thinker 0.79 0.90 3.35 1.51 0.91 1.04 3.72 1.49 Being curious about many different things 0.66 0.86 3.77 1.57 0.83 1.02 4.00 1.52 Emotional Volatility 0.64 0.66 .54 3.75 1.25 .61 0.93 0.82 .60 3.98 1.22 .60 Being emotionally stable, not easily upset 0.75 0.89 3.84 1.52 1.09 1.07 4.05 1.45 Being moody, having up and down mood swings 0.53 0.71 3.65 1.43 0.77 0.86 3.90 1.44 Organization 0.50 0.76 .84 5.45 1.13 .66 1.04 1.02 .81 5.23 1.31 .72 Being organized 0.50 0.86 5.39 1.36 1.11 1.17 5.19 1.47 Keeping things neat and tidy 0.49 0.77 5.50 1.26 0.96 1.06 5.27 1.50 Depression 0.60 0.71 .55 4.27 1.21 .47 0.90 0.88 .59 4.47 1.10 .32 Feeling secure, comfortable with self 0.95 1.05 4.65 1.38 1.25 1.19 4.95 1.41 Feeling depressed, blue 0.25 0.60 3.89 1.61 0.56 0.87 3.98 1.43
(table continues)
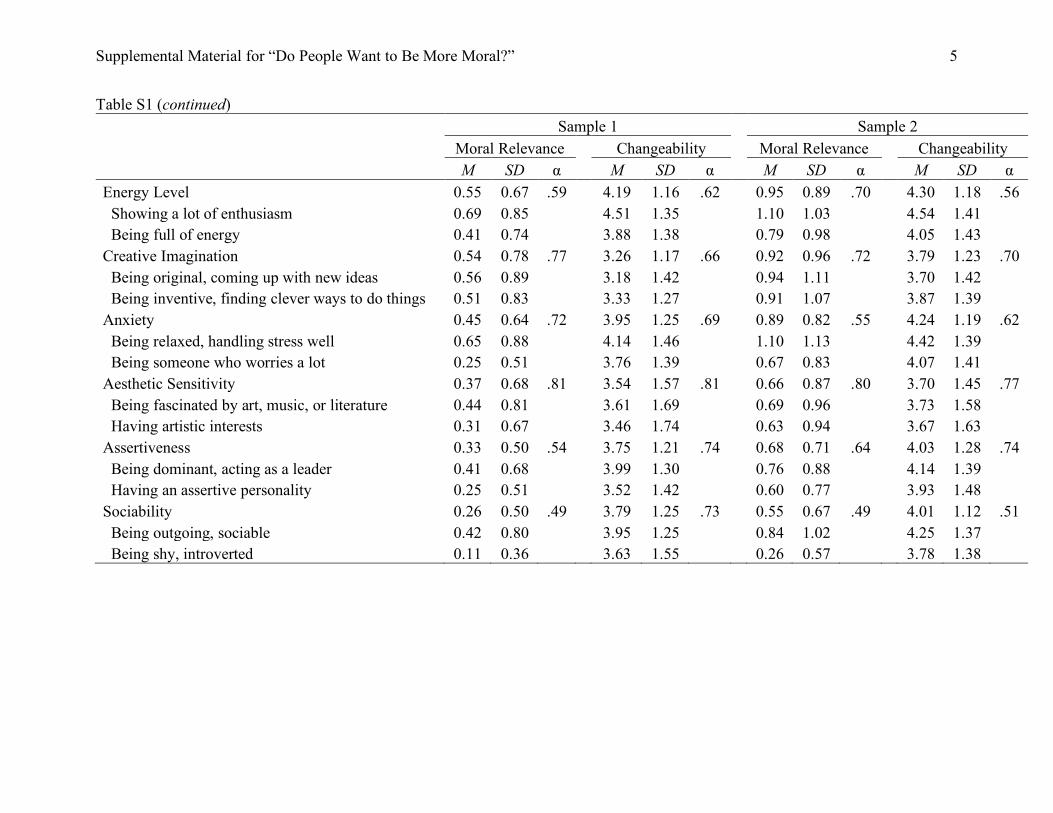
Supplemental Material for “Do People Want to Be More Moral?” 5
Table S1 (continued) Sample 1 Sample 2 Moral Relevance Changeability Moral Relevance Changeability M SD α M SD α M SD α M SD α Energy Level 0.55 0.67 .59 4.19 1.16 .62 0.95 0.89 .70 4.30 1.18 .56 Showing a lot of enthusiasm 0.69 0.85 4.51 1.35 1.10 1.03 4.54 1.41 Being full of energy 0.41 0.74 3.88 1.38 0.79 0.98 4.05 1.43 Creative Imagination 0.54 0.78 .77 3.26 1.17 .66 0.92 0.96 .72 3.79 1.23 .70 Being original, coming up with new ideas 0.56 0.89 3.18 1.42 0.94 1.11 3.70 1.42 Being inventive, finding clever ways to do things 0.51 0.83 3.33 1.27 0.91 1.07 3.87 1.39 Anxiety 0.45 0.64 .72 3.95 1.25 .69 0.89 0.82 .55 4.24 1.19 .62 Being relaxed, handling stress well 0.65 0.88 4.14 1.46 1.10 1.13 4.42 1.39 Being someone who worries a lot 0.25 0.51 3.76 1.39 0.67 0.83 4.07 1.41 Aesthetic Sensitivity 0.37 0.68 .81 3.54 1.57 .81 0.66 0.87 .80 3.70 1.45 .77 Being fascinated by art, music, or literature 0.44 0.81 3.61 1.69 0.69 0.96 3.73 1.58 Having artistic interests 0.31 0.67 3.46 1.74 0.63 0.94 3.67 1.63 Assertiveness 0.33 0.50 .54 3.75 1.21 .74 0.68 0.71 .64 4.03 1.28 .74 Being dominant, acting as a leader 0.41 0.68 3.99 1.30 0.76 0.88 4.14 1.39 Having an assertive personality 0.25 0.51 3.52 1.42 0.60 0.77 3.93 1.48 Sociability 0.26 0.50 .49 3.79 1.25 .73 0.55 0.67 .49 4.01 1.12 .51 Being outgoing, sociable 0.42 0.80 3.95 1.25 0.84 1.02 4.25 1.37 Being shy, introverted 0.11 0.36 3.63 1.55 0.26 0.57 3.78 1.38
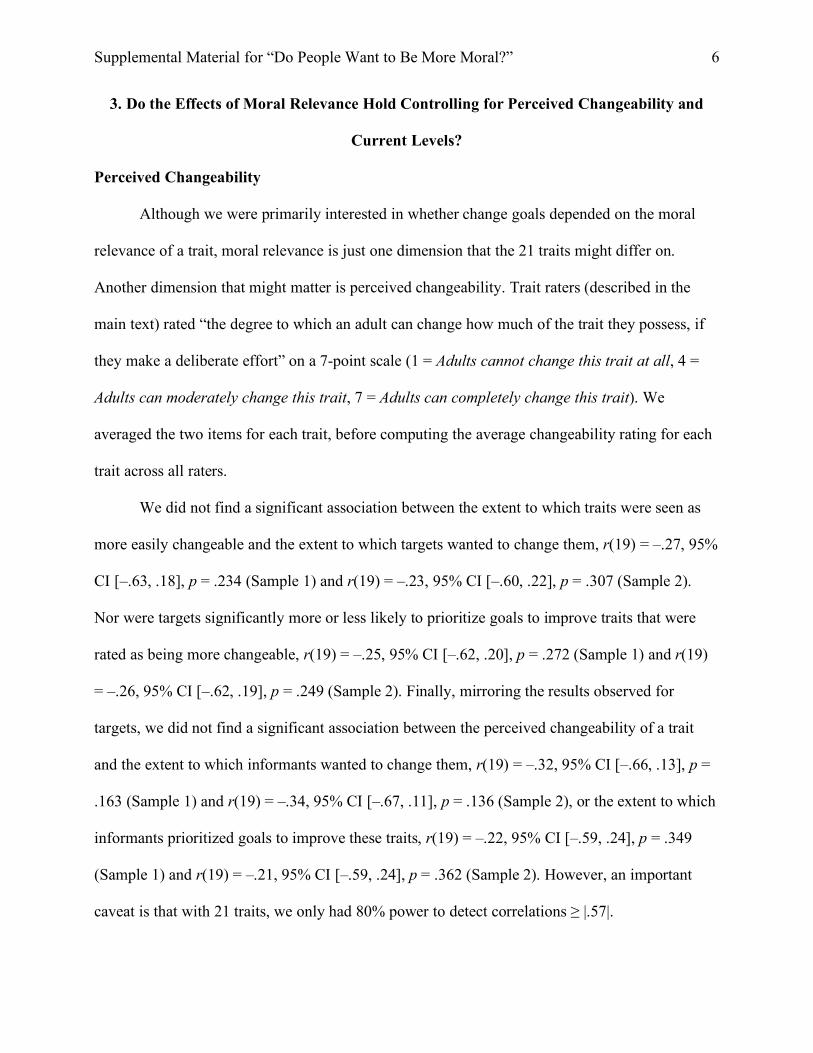
Supplemental Material for “Do People Want to Be More Moral?” 6
3. Do the Effects of Moral Relevance Hold Controlling for Perceived Changeability and
Current Levels?
Perceived Changeability
Although we were primarily interested in whether change goals depended on the moral
relevance of a trait, moral relevance is just one dimension that the 21 traits might differ on.
Another dimension that might matter is perceived changeability. Trait raters (described in the
main text) rated “the degree to which an adult can change how much of the trait they possess, if
they make a deliberate effort” on a 7-point scale (1 = Adults cannot change this trait at all, 4 =
Adults can moderately change this trait, 7 = Adults can completely change this trait). We
averaged the two items for each trait, before computing the average changeability rating for each
trait across all raters.
We did not find a significant association between the extent to which traits were seen as
more easily changeable and the extent to which targets wanted to change them, r(19) = –.27, 95%
CI [–.63, .18], p = .234 (Sample 1) and r(19) = –.23, 95% CI [–.60, .22], p = .307 (Sample 2).
Nor were targets significantly more or less likely to prioritize goals to improve traits that were
rated as being more changeable, r(19) = –.25, 95% CI [–.62, .20], p = .272 (Sample 1) and r(19)
= –.26, 95% CI [–.62, .19], p = .249 (Sample 2). Finally, mirroring the results observed for
targets, we did not find a significant association between the perceived changeability of a trait
and the extent to which informants wanted to change them, r(19) = –.32, 95% CI [–.66, .13], p =
.163 (Sample 1) and r(19) = –.34, 95% CI [–.67, .11], p = .136 (Sample 2), or the extent to which
informants prioritized goals to improve these traits, r(19) = –.22, 95% CI [–.59, .24], p = .349
(Sample 1) and r(19) = –.21, 95% CI [–.59, .24], p = .362 (Sample 2). However, an important
caveat is that with 21 traits, we only had 80% power to detect correlations ≥ |.57|.
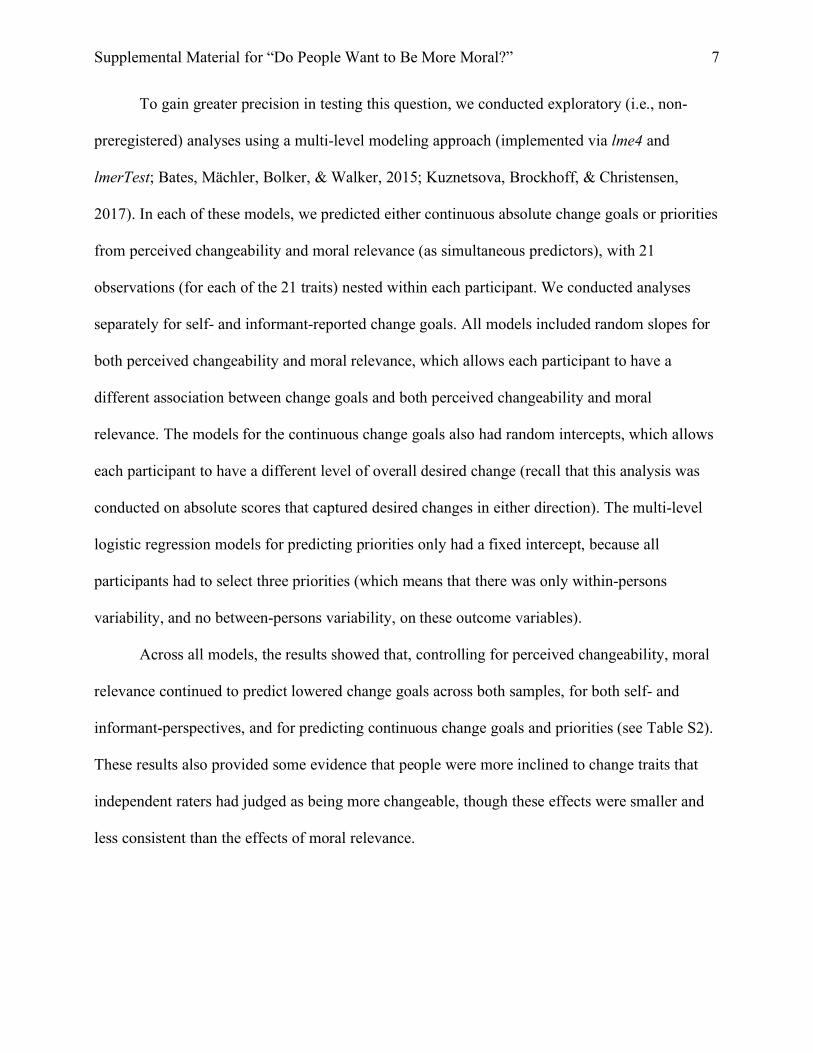
Supplemental Material for “Do People Want to Be More Moral?” 7
To gain greater precision in testing this question, we conducted exploratory (i.e., non-
preregistered) analyses using a multi-level modeling approach (implemented via lme4 and
lmerTest; Bates, Mächler, Bolker, & Walker, 2015; Kuznetsova, Brockhoff, & Christensen,
2017). In each of these models, we predicted either continuous absolute change goals or priorities
from perceived changeability and moral relevance (as simultaneous predictors), with 21
observations (for each of the 21 traits) nested within each participant. We conducted analyses
separately for self- and informant-reported change goals. All models included random slopes for
both perceived changeability and moral relevance, which allows each participant to have a
different association between change goals and both perceived changeability and moral
relevance. The models for the continuous change goals also had random intercepts, which allows
each participant to have a different level of overall desired change (recall that this analysis was
conducted on absolute scores that captured desired changes in either direction). The multi-level
logistic regression models for predicting priorities only had a fixed intercept, because all
participants had to select three priorities (which means that there was only within-persons
variability, and no between-persons variability, on these outcome variables).
Across all models, the results showed that, controlling for perceived changeability, moral
relevance continued to predict lowered change goals across both samples, for both self- and
informant-perspectives, and for predicting continuous change goals and priorities (see Table S2).
These results also provided some evidence that people were more inclined to change traits that
independent raters had judged as being more changeable, though these effects were smaller and
less consistent than the effects of moral relevance.

Supplemental Material for “Do People Want to Be More Moral?” 8
Table S2 Within-Person Analyses Predicting Change Goals from Moral Relevance, Trait Levels, and Perceived Changeability Sample 1 Sample 2 Changeability Moral Relevance Changeability Moral Relevance Continuous (β)
Self 0.06***
[0.03, 0.09] –0.33***
[–0.37, –0.29] 0.18***
[0.15, 0.2] –0.39***
[–0.42, –0.35] Informant 0.03*
[+0.00, 0.07] –0.34***
[–0.39, –0.30] 0.16***
[0.12, 0.2] –0.44***
[–0.49, –0.39] Priorities (OR)
Self 1.08 [0.99, 1.17]
0.43***
[0.39, 0.48] 1.31***
[1.22, 1.42] 0.40***
[0.37, 0.44] Informant 1.03
[0.92, 1.15] 0.36***
[0.29, 0.44] 1.55***
[1.39, 1.72] 0.23***
[0.18, 0.29] Trait Levels Moral Relevance Trait Levels Moral Relevance Continuous (β)
Self –0.34*** [–0.37, –0.31]
–0.19*** [–0.23, –0.16]
–0.29*** [–0.32, –0.26]
–0.15*** [–0.18, –0.13]
Informant –0.55*** [–0.59, –0.51]
–0.10*** [–0.13, –0.08]
–0.51*** [–0.55, –0.47]
–0.10*** [–0.13, –0.07]
Priorities (OR) Self 0.37***
[0.33, 0.41] 0.52***
[0.46, 0.59] 0.40***
[0.37, 0.43] 0.65***
[0.59, 0.71] Informant 0.31***
[0.28, 0.35] 0.75**
[0.63, 0.89] 0.34***
[0.30, 0.38] 0.68***
[0.59, 0.79] Note. Changeability and moral relevance were entered as simultaneous predictors in the first set of models. Trait levels and moral relevance were entered as simultaneous predictors in the second set of models. β = standardized within-person effect, OR = odds ratio computed from standardized multilevel logistic regression coefficients. *p < .05, **p < .01, ***p < .001. 95% confidence intervals are shown in brackets.
Trait Levels
Because ratings of most of the morally relevant traits tended to be quite high (on a 5-point
scale anchored by strongly disagree and strongly agree), one remaining question is how much
perceptions of current trait levels might play a role in explaining why people are less inclined to
change moral traits. One possibility is that people believe that there is less room for improvement
on moral traits. Because “agreeing strongly” with a given item (e.g., “Is compassionate, has a soft
heart”) is not the same as believing that you have the maximum possible levels of that trait, we

Supplemental Material for “Do People Want to Be More Moral?” 9
do not have the data to test this idea. Such a test would require more direct measures of people’s
perceptions of room for improvement (e.g., measuring current levels using a response scale that
ranges from 0 = lowest possible levels to 10 = highest possible levels).
A second possibility is that people are simply less motivated to improve moral traits
because they already see themselves as being relatively high on such traits (compared to less
morally relevant traits). This seems to be an inherently within-persons question, in contrast to the
between-persons correlations we reported in the main text. Between-persons correlations between
current levels and change goals for each trait ask whether people who are higher on a trait
(relative to other people) want to change more on that trait (relative to other people). The within-
persons approach answers a complementary question—how trait levels and change goals are
related at the within-person level (i.e., do people want to change less on traits that they see
themselves as being relatively high on, compared to their other traits?). We also wanted to test
whether people were still less inclined to change more morally relevant traits, controlling for their
perceptions of their current levels (using this within-persons approach).
We explored these questions using the multi-level modeling approach described above
(again, these analyses were not preregistered). The only difference was that we replaced
perceived changeability with current levels as a predictor; thus, we predicted continuous absolute
change goals or priorities from current levels and moral relevance (entered as simultaneous
predictors). We reverse-scored current levels for the negative emotionality facets (anxiety,
depression, emotionality, and anger), such that higher scores on all traits represent more desirable
levels. Then, we centered current level scores around each person’s mean, to ensure that all
effects were at the within-person level.
Across both samples, the results showed that current levels and moral relevance
independently predicted lowered change goals for both the continuous and priority-based

Supplemental Material for “Do People Want to Be More Moral?” 10
measures, and for both self- and informant-perspectives (see Table S2). For example, in Sample
1, each 1 SD increase in self-reported current levels and moral relevance (rated by independent
raters) predicted an average –0.34 SD and –0.19 SD decrease in absolute change goals,
respectively. In Sample 1, each 1 SD increase in self-reported current levels and moral relevance
also predicted an average decrease of 2.70 and 1.92, respectively, in the odds of prioritizing an
improvement on a given trait (these lowered odds were calculating by taking the inverse of 0.37
and 0.52, reported in Table S2). In other words, people were less inclined to change the traits that
they saw themselves as having relatively more desirable levels of (compared with their other
traits)—but even after controlling for targets’ perceptions of their current levels, they were still
less inclined to change more morally relevant traits (and the same was true from the perspective
of informants).

Supplemental Material for “Do People Want to Be More Moral?” 11
4. Associations Between Informant-Reported Current Levels and Self-Reported Change
Goals
Results for the associations between informant-reported current levels and self-reported
change goals are shown in Table S10 in the OSF repository. The calibration to current traits was
weaker (compared to the self-report-only correlations), but still generally held (Sample 1: mean r
= –.20; Sample 2: mean r = –.21). We also observed a substantial attenuation-by-morality effect
in Sample 1 (r(19) = .80, 95% CI [.56, .91], p < .001), though the 95% CI just captured zero in
Sample 2 (r(19) = .43, 95% CI [–.00, .73], p = .052). To examine whether the size of the moral
attenuation effect depended on whether current levels and change goals were both self-reported
(vs. when only change goals were self-reported), we fit a linear mixed-effects model (with
random intercepts for each trait) that regressed the Fisher r-to-z transformed correlation between
current levels and change goals for each trait onto the moral relevance of each trait, the method (0
= self-reported current levels and change goals, 1 = informant-reported current levels and self-
reported change goals), and the interaction between moral relevance and method. A non-
significant interaction in Sample 1 suggested that the size of the moral attenuation effect did not
differ significantly when current levels and change goals were both self-reported, compared to
when only change goals were self-reported, b = –0.07, 95% CI [–0.21, 0.07], p = .356; however,
this interaction was significant in Sample 2, suggesting that there was less of a moral attenuation
effect when current levels were reported by informants, b = –0.12, 95% CI [–0.23, –0.02], p =
.035.

Supplemental Material for “Do People Want to Be More Moral?” 12
5. Predicting Change Goal Priorities from Undesirable Current Levels
To complement the correlational analyses, we predicted change goal priorities from
undesirable current levels (modeled as latent variables) using logistic regression models
implemented in Mplus Version 8.3 (Muthén & Muthén, 1998–2017). We reversed the
coefficients for all facets apart from negative emotionality; thus, the resulting odds ratios (ORs)
reflect the extent to which each 1 SD difference towards the undesirable direction of a trait
predicted a goal to prioritize improving that trait.
Figure S1 shows that in general, targets who self-reported less desirable levels of a trait
were more likely to prioritize a goal to improve that trait (as one of their top three goals; Sample
1: mean OR = 2.13; Sample 2: mean OR = 2.10). These odds ratios trended towards being
smaller for more morally relevant traits in Sample 1 (r(19) = –.43, 95% CI [–.73, +.00], p =
.051), but not in Sample 2 (r(19) = –.00, 95% CI [–.43, .43], p = .999).
Next, we predicted self-reported priorities from informant-reported current levels. These
effects were smaller than for the self-report-only effects (Sample 1: mean OR = 1.38, t(20) =
4.38, p < .001; Sample 2: mean OR = 1.42, t(20) = 4.00, p < .001). These effects were also
smaller for more morally relevant traits in Sample 1 (r(19) = –.49, 95% CI [–.76, –.08], p = .023),
but not significantly so in Sample 2 (r(19)= –.37, 95% CI [–.69, .08], p = .101), and this moral
attenuation effect was similar compared to self-report-only effects (Sample 1: b = 0.06, 95% CI
[–0.17, 0.30], p = .603; Sample 2: b = –0.15, 95% CI [–0.45, 0.15], p = .341).
Finally, we predicted informant-reported priorities (from one randomly-selected
informant) from aggregated informant-reported current levels. Because only two informants
prioritized a goal to improve targets’ loyalty in Sample 2, this point estimate was implausibly
large (β = 20.34, OR > 680,000; with very wide confidence intervals). Therefore, to avoid biasing
the average odds ratios and other results reported here, we excluded this point estimate (for

Supplemental Material for “Do People Want to Be More Moral?” 13
Sample 2 only). Overall, these odds ratios were descriptively stronger for nearly all traits, and
were significantly larger compared to those obtained from self-reports only in Sample 1 (mean
OR = 2.76, t(20) = –2.17, p = .042), but not in Sample 2 (mean OR = 2.41, t(19) = –1.12, p =
.276). Replicating the correlational results, informants’ change goals remained calibrated to their
perceptions of targets’ current levels, even for more morally relevant traits (for correlations with
moral relevance, Sample 1: r(19) = .06, 95% CI [–.38, .48], p = .797; Sample 2: r(18) = –.03,
95% CI [–.46, .42], p = .908). The odds ratios for more morally relevant traits were larger when
current levels and priorities were both informant-reported (vs. both self-reported) in Sample 1 (b
= 0.28, 95% CI [0.03, 0.54], p = .041), but not in Sample 2 (b = –0.02, 95% CI [–0.47, 0.43], p =
.944).

Supplemental Material for “Do People Want to Be More Moral?” 14
Figure S1. Odds ratios representing the change in odds of prioritizing a given improvement (as one of their top three goals) for every 1 SD that a target was closer to the less desirable pole of that trait. Error bars depict the 95% confidence intervals. The traits are ordered from least to most morally relevant, based on the moral relevance norms for each respective sample.
Sample 1Self-Reported Traits and Change Priorities Informant-Reported Traits and Change Priorities
TraitSociabilityAssertivenessAesthetic SensitivityAnxietyOrganizationCreative ImaginationEnergy LevelDepressionEmotional VolatilityIntellectual CuriosityAngerProductivenessTrustPurityResponsibilityCompassionLoyaltyHonestyRespectfulnessFairnessGeneral Morality
0.12 0.25 0.50 1.0 2.0 4.0 8.0Odds Ratio
Sample 2Self-Reported Traits and Change Priorities Informant-Reported Traits and Change Priorities
TraitSociabilityAesthetic SensitivityAssertivenessIntellectual CuriosityAnxietyDepressionCreative ImaginationEmotional VolatilityEnergy LevelOrganizationAngerProductivenessTrustPurityResponsibilityCompassionGeneral MoralityHonestyLoyaltyFairnessRespectfulness
0.12 0.25 0.50 1.0 2.0 4.0 8.0Odds Ratio

Supplemental Material for “Do People Want to Be More Moral?” 15
6. Associations Between Moral Change Goals and Additional Individual Differences
Measures
Descriptive statistics for these measures are reported in Table S3.
Honesty-Humility. Honesty-Humility is the sixth major dimension of personality in the
HEXACO model (Ashton, Lee, & de Vries, 2014), capturing preferences for fairness (e.g., “If I
knew that I could never get caught, I would be willing to steal a million dollars” [r]), sincerity
(e.g., “I wouldn’t pretend to like someone just to get that person to do favors for me”), greed
avoidance (“Having a lot of money is not especially important to me”), and modesty (e.g., “I
think that I am entitled to more respect than the average person is” [r]). Targets and informants
rated the target’s Honesty-Humility using the 16-item subscale from the 100-item HEXACO
Personality Inventory–Revised (Lee & Ashton, 2018; 1 = Strongly disagree, 5 = Strongly agree).
We computed composites separately for self- and informant-rated Honesty-Humility.
Moral elevation. Moral elevation describes the tendency to be emotionally moved and to
feel inspired to be a better person when witnessing displays of moral excellence (Thomson &
Siegel, 2017). Targets self-reported their trait moral elevation using the six “Engagement with
Moral Beauty” items from the Engagement with Beauty Scale (Diessner, Solom, Frost, Parsons,
& Davidson, 2008). However, we replaced mentions of “moral beauty” with “moral excellence,”
as we thought this would improve the interpretability of the items (e.g., “When perceiving an act
of moral excellence I feel emotional, it “moves me,” such as feeling a sense of awe, or wonder or
excitement or admiration or upliftment”; 1 = Very unlike me, 7 = Very much like me).
Impartial beneficence. The Oxford Utilitarianism Scale (Kahane et al., 2018) assesses
individual differences in two dimensions of utilitarian thinking: instrumental harm (the
willingness to harm innocent people for the greater good) and impartial beneficence (impartial
concern for the greater good). Targets rated how much they endorsed five statements about the

Supplemental Material for “Do People Want to Be More Moral?” 16
impartial promotion of people’s welfare (e.g., “It is morally wrong to keep money that one
doesn’t really need if one can donate it to causes that provide effective help to those who will
benefit a great deal”; 1 = Strongly disagree, 7 = Strongly agree).
Moral foundations. Targets completed the 20-item version of the Moral Foundations
Questionnaire (Graham et al., 2011). This instrument assesses the extent to which people use and
endorse the moral foundations of Harm/Care, Fairness/Reciprocity, Ingroup/Loyalty,
Authority/Respect, and Purity/Sanctity (four items each). Ten items are worded in terms of the
moral relevance of each foundation (e.g., “Whether or not someone violated standards of purity
and decency”; 0 = Not at all relevant, 5 = Extremely relevant), and ten items ask participants to
indicate their agreement or disagreement with statements (e.g., “Compassion for those who are
suffering is the most crucial virtue”; 0 = Strongly disagree, 5 = Strongly agree).
Religiosity. Finally, targets completed a one-item measure of religiosity (“How religious
are you?”; 1 = Not at all religious, 7 = Extremely religious).
Results
We were primarily interested in how strongly these individual differences correlated with
highly morally relevant change goals (i.e., goals to change general morality, fairness,
respectfulness, honesty, loyalty, compassion, responsibility, purity, and trust), but we examined
all change goals to provide information on discriminant validity. We used semi-partial
correlations to estimate the unique association between each individual difference and change
goal, controlling for current levels on each respective trait. For example, to estimate the semi-
partial correlation between impartial beneficence and compassion change goals, we partialled out
self-reported trait compassion. Here, we summarize the associations that replicated across both
samples and that seemed theoretically noteworthy (but see Table S4 for all latent semi-partial
correlations).
Supplemental Material for “Do People Want to Be More Moral?” 17
The results for moral elevation and the moral foundations were somewhat ambiguous.
Although targets who self-reported a greater tendency to experience moral elevation also tended
to report greater desires to increase on almost all moral traits (across both samples), they also
tended to report goals to improve several non-moral traits (e.g., intellectual curiosity, energy
level, productiveness), controlling for current levels on these traits. Thus, moral elevation may be
linked with a general desire for self-improvement. The Purity foundation was especially strongly
associated with goals to become more pure, but the other foundations showed fewer, less specific,
or inconsistent associations with moral change goals.
Religiosity, impartial beneficence, and Honesty-Humility were more specifically linked
with moral change goals across both samples. More religious targets tended to report greater
desires to increase on compassion and loyalty. Impartial beneficence, the tendency to value
impartially maximizing the greater good, also showed theoretically sensible associations with
goals to become fairer and more compassionate. Finally, targets who self-reported being higher
on Honesty-Humility tended to report greater goals to increase on honesty.

Supplemental Material for “Do People Want to Be More Moral?” 18
Table S3 Descriptive Statistics for Additional Measures
Sample 1 Sample 2 Self-Report Informant-Report Self-Report Informant-Report Trait M SD ω M SD ω ICC(1) r M SD ω M SD ω ICC(1) r
Honesty-Humility 3.25 0.53 .78 3.49 0.57 .88 .35 .49*** 3.45 0.53 .78 3.62 0.53 .87 .35 .42*** Moral Elevation 5.16 0.91 .77 5.16 0.92 .79 Impartial Beneficence 3.67 1.06 .74 3.96 1.03 .73 Religiosity 3.25 1.75 2.99 1.88 Harm/Care Foundation 3.42 0.73 .59 3.52 0.70 .51 Fairness Foundation 3.65 0.63 .61 3.67 0.68 .62 Authority Foundation 2.36 0.83 .64 2.58 0.81 .54 Ingroup Foundation 2.48 0.85 .62 2.53 0.87 .58 Purity Foundation 2.69 0.86 .69 2.89 0.81 .60
Note. ω = omega reliability estimate, ICC(1) = proportion of variability in informant ratings due to variability between targets (computed across informant ratings for targets who had two or more informants) , r = latent self–other agreement correlations, estimated using structural equation models. ***p < .001.

Supplemental Material for “Do People Want to Be More Moral?” 19
Table S4 Semi-Partial Correlations Between Additional Moral Individual Differences and Self-Reported Moral Change Goals
Honesty–Humility General Morality Moral Excellence
Impartial Beneficence Religiosity
Moral Foundations Trait Self Other Self Other Harm Fairness Ingroup Authority Purity Gen. Morality .03/–.02 .15/–.02 .09/–.10 .29***/.23*** .11/.15* .12/.12* .16/.26*** .02/.21*** .04/.12 –.11/.00 .21**/.18** Respectful. .16*/.08 .12/–.02 .00/.11 .16/–.05 .31***/.27*** .27***/.09 .03/.09 .24**/.10 .15/.10 .10/.07 –.08/–.00 .22**/.14 Fairness .06/.13* .12/.04 .08/.06 .16/–.14 .37***/.18*** .20**/.15** .07/.06 .30***/.15* .09/.16** .05/.01 –.03/.03 .16*/.10 Honesty .15*/.14* .23**/.03 .10/.06 .32***/.00 .33***/.27*** .10/.08 .12/.09 .23**/.31*** .07/.31*** .11/.03 –.16/–.07 .16/.14* Loyalty .04/.07 .15/–.03 .14/.07 .13/–.13 .33***/.20*** .11/.10 .14*/.12* .25**/.16* .08/.19** .11/.11 –.03/.02 .21*/.26*** Compassion .11/.18** .15/.02 .10/.08 .16/.04 .25***/.27*** .27***/.21** .19**/.13* .35***/.33*** .25**/.23** .04/.09 –.05/–.04 .17*/.18* Responsibility .03/.09 .05/.01 .23**/.21*** .07/–.15 .24**/.20** .05/.03 –.00/.06 .04/.17* .07/.18** –.08/.14* –.13/.06 .09/.19** Purity .05/.18*** .03/–.02 .12/.23* .13/–.15 .33*/.27*** .22/.28*** .35*/.08 .25/.29*** .35*/.15* .16/.39*** .27/.41** .66***/.48*** Trust .23*/.23** .25*/.19* .24*/.09 .31**/.15 .40***/.37*** .25*/.24** .16/.14 .40***/.28** .46***/.10 .07/.12 –.11/.02 .33**/.02 Productiveness –.01/.16* –.11/–.05 .19/.19* .02/–.30** .36***/.27** .07/–.13 .09/.04 .14/.25* .16/.44*** .09/.04 –.28*/–.05 .27*/.20* Anger –.12/–.22** –.14/.00 –.06/–.15* –.19/.08 –.35***/–.27*** –.12/.01 –.04/–.02 –.23*/–.16 –.05/–.19* –.10/–.10 .10/–.07 –.13/–.04 Intel. Curiosity –.07/.18* –.04/.09 .03/.13 .01/–.08 .29***/.20** .05/.11 .02/.02 .11/.25** .01/.39*** .08/.01 –.10/–.01 .23**/.21* Emo. Volat. –.09/–.26** .09/.12 –.41**/–.25** –.27/.13 –.12/–.23** .00/.06 –.17/–.08 –.05/–.30** .04/–.28** .13/–.08 .04/.04 –.21/–.10 Organization .04/.03 .07/–.01 .15*/.21*** .14/–.05 .17*/.18*** .08/.06 .06/.08 .13/.16* .23**/.18** .16*/.07 –.02/.11 .19*/.18** Depression –.01/–.28*** –.01/–.03 –.41*/–.19* –.19/.15 –.29/–.34*** .08/–.09 –.15/–.03 –.37*/–.33*** –.09/–.40*** –.19/–.07 .19/.12 –.36*/–.14 Energy Level .06/.06 –.03/–.08 .21**/.30*** –.05/–.08 .21**/.31*** .12/.07 .08/.05 .13/.21** –.06/.23*** .14/.17* .06/.12 .18/.21** Creative Imagi. .04/.05 .08/–.08 .21**/.17** .12/–.12 .41***/.18** .04/–.01 .10/.02 .31***/.14* .19*/.16* .03/.02 –.04/–.01 .28***/.06 Anxiety .05/–.18* .17/.03 –.42**/–.14 –.17/.27** –.14/–.20** .24/.09 –.15/–.02 .05/–.24** –.03/–.19* –.25/–.02 .11/.07 –.26/–.08 Aesthetic Sens. –.01/.04 –.02/.08 .12/.12 –.03/–.10 .20*/.18** .02/.11 .06/.05 .15/.12 .09/.08 .04/.12 –.07/.17** .26**/.31*** Assertiveness –.18*/–.02 –.21*/–.03 .11/.15* .08/–.01 .18/.06 –.04/.02 .02/.04 –.07/.18* .05/.08 .15/.09 –.18/.01 .13/.09 Sociability –.39***/–.01 –.16/–.19* .16/.26*** –.01/.01 –.04/.17* –.18/.01 .01/.01 –.04/.11 –.01/.17* .21*/.04 .17/.00 .12/.06
Note. Values left and right of each forward slash are for Sample 1 and Sample 2, respectively. Latent semi-partial correlations were computed using a structural equation modeling framework, to account for measurement unreliability. However, for Sample 2 only, we modeled the purity change goals as a single-indicator latent variable (where the observed purity change goal composite was the indicator, which assumed perfect reliability), as the preregistered models did not converge. Blank cell indicates that the analysis was not conducted (because it was not applicable). *p < .05, **p < .01, ***p < .001 (uncorrected for multiple comparisons). The change goals are ordered from least to most morally relevant, based on the average of the moral relevance norms across the two samples (weighted equally).

Supplemental Material for “Do People Want to Be More Moral?” 20
7. Reasons for Personality Change Goals
We explored whether informants wanted to change targets’ traits primarily for the targets’
sake, or their own sake. To do so, we coded open-ended responses to one question about targets’
and informants’ top change goal for the target: “Why do you want [target’s name] to change this
aspect of your [their] personality?”. After removing invalid responses (e.g., “N/A” or responses
that stated that the participant didn’t want the target to change), two research assistants coded
whether targets’ responses (nSample1 = 296; nSample2 = 491) best reflected a concern for their own
well-being or others’ well-being, and whether informants’ responses (nSample1 = 367; nSample2 =
479) best reflected a concern for the target’s well-being or the informant’s own well-being.
Coders selected “other” when the reason did not clearly reflect either category. The three
categories were mutually-exclusive. Inter-rater agreement, as measured by the Cohen’s kappa (!;
Cohen, 1960), was moderate to substantial for both the informant (Sample 1: .69; Sample 2: .50)
and target (Sample 1: .62; Sample 2: .59) codings. The first author resolved discrepancies
between the two coders. The coding instructions and the de-identified open-ended responses are
available in the OSF repository.
As shown in Table S11, the majority of informants’ reasons (Sample 1: 74.66%; Sample
2: 78.91%) reflected a concern for the targets’ well-being (e.g., “She is way too nice to people
and I feel others can easily take advantage of her”), and relatively few reasons (Sample 1:
18.53%; Sample 2: 13.15%) reflected the informant’s self-interest (e.g., “[target’s name] always
sees the best in people - I, on the other hand, get annoyed with people easily and it’s hard to
complain about someone to [target’s name]…”).
Similarly, the majority of targets’ reasons (Sample 1: 84.46%; Sample 2: 83.10%)
reflected a concern for their own well-being (e.g., “I worry a lot about silly things, and it

Supplemental Material for “Do People Want to Be More Moral?” 21
prevents me from getting the most happiness out of my life”), and very few reasons (Sample 1:
12.16%; Sample 2: 12.02%) reflected a concern for others’ well-being (e.g., “…I want to be
there for my friends and family when they need someone”).
Finally, we explored whether these patterns varied depending on the moral relevance of
the change goals. Because some change goals were rarely prioritized (see Table S11), for these
low-frequency change priorities, the percentage of reasons that reflected a benefit to the self or to
others were unlikely to be reliable estimates (e.g., if only 4 people prioritized a goal to become
more honest, the estimates of 75% and 25% for reasons that benefit the self vs. benefit others
would be very unreliable). This makes it unwise to examine the effects of moral relevance in a
continuous way. Instead, we grouped the change goals into moral improvements (goals to be
more moral, fair, respectful, honest, loyal, compassionate, responsible, trusting, and pure) and
non-moral improvements (all other improvements), because there was a notable gap in moral
relevance ratings between the least morally relevant trait among the moral traits (Sample 1:
MPurity = 1.73; Sample 2: MTrust = 1.62) and the most morally relevant trait among the non-moral
traits (Sample 1: MProductiveness = 1.01; Sample 2: MProductiveness = 1.31).
We excluded the “Other” category and goals to change in the undesirable direction. Then,
we computed the odds ratios (using Fisher’s exact test) for 2 (moral or non-moral improvement)
× 2 (benefit target or benefit informant/others) contingency tables, separately for target- and
informant-reported reasons. For the target-reported reasons, the odds of stating that the change
would benefit others (vs. the target) were 98.11 (Sample 1; 95% CI [28.20, 448.50], p < .001)
and 59.12 (Sample 2; 95% CI [26.48, 141.25], p < .001) times higher for moral (vs. non-moral)
improvements. Similarly, for the informant-reported reasons, the odds of stating that the change
would benefit the informant (vs. the target) were 27.26 (Sample 1; 95% CI [11.44, 71.37], p <

Supplemental Material for “Do People Want to Be More Moral?” 22
.001) and 19.28 (Sample 2; 95% CI [9.11, 42.17], p < .001) times higher for moral (vs. non-
moral) improvements. Therefore, both targets and informants wanted the target to make non-
moral improvements for the target’s own sake, but moral improvements for the sake of others.
Supplemental Material for “Do People Want to Be More Moral?” 23
8. Replication Study Establishing Generalizability to Older Adults
Several readers and audiences have expressed curiosity about whether the key finding
(that people don’t particularly want to be more moral) generalizes beyond college students or
young adults. To address this question, we conducted another preregistered replication with a
sample of relatively older adults. Because we conducted this additional replication after the paper
was accepted, this section has not been peer-reviewed. The data, code, materials, and
preregistration can be accessed at https://osf.io/cbxjh.
Method
We aimed to recruit 220 participants from Amazon’s Mechanical Turk, who were
compensated with $2 USD. We restricted participation to US-based participants who had a HIT
approval rate ≥ 95%. To oversample for older adults, we recruited participants in three batches:
1) 50 participants who were between the ages of 45–55, 2) 50 participants who were age 55 or
older, and 3) 120 participants with no age restrictions. Following our preregistered exclusion
criteria, we excluded 23 incomplete responses and four participants who failed a simple attention
check (“Please select the Agree button”). After these exclusions, Sample 3 comprised 222 targets
(104 female, 117 male, 1 other or not disclosed) between the ages of 22 and 78 years (Mage =
45.4, SDage = 13.82). Targets identified as White/Caucasian (n = 180), Black/African American
(n = 18), Hispanic/Latino (n = 8), Asian (n = 4), or other/multiple (n = 12).
Targets self-reported their personality traits, change goals, and change goal priorities
using the same measures described in the paper (along with additional exploratory measures,
reported in the codebook). Targets also rated the moral relevance of the 42 items that were
included in the change goals survey, using the same measures described in the paper. Thus,
unlike the procedure in Samples 1 and 2, in which we obtained moral relevance ratings

Supplemental Material for “Do People Want to Be More Moral?” 24
from participants who were not involved in the main study, in Sample 3, the moral relevance
ratings were provided by the targets themselves. This provides person-specific moral relevance
ratings, which we use in the within-person analyses reported below. In addition, unlike Samples
1 and 2, we did not recruit informants. All other data analytic procedures for the analyses we
included in this replication study were identical to those reported in the main text.
Results and Discussion
Descriptive statistics for the key measures are shown in Table S5.
Table S5 Descriptive Statistics for Personality Traits, Change Goals, and Moral Relevance Norms Trait Levels Change Goals Moral Relevance Trait M SD ω M SD α M SD α General Morality 3.93 0.65 .67 0.61 0.71 .80 2.61 0.61 .74 Honesty 4.17 0.72 .77 0.60 0.70 .67 2.47 0.71 .76 Fairness 4.35 0.66 .76 0.61 0.70 .79 2.46 0.69 .78 Compassion 3.94 0.86 .77 0.63 0.68 .74 2.36 0.71 .65 Respectfulness 4.11 0.84 .83 0.55 0.76 .45 2.33 0.67 .55 Loyalty 4.07 0.81 .29 0.51 0.68 .74 2.10 0.88 .78 Purity 3.29 0.87 .11 0.40 0.67 .50 1.89 0.98 .77 Trust 3.44 0.93 .73 0.63 0.71 .23 1.87 0.76 .58 Responsibility 3.84 0.87 .70 0.69 0.75 .79 1.83 0.90 .73 Anger 2.40 1.04 .48 –0.66 1.09 .88 1.36 0.83 .66 Productiveness 3.82 0.93 .81 0.81 0.79 .39 1.21 0.90 .58 Emotional Volatility 2.37 0.99 .81 –0.77 0.83 .49 0.93 0.94 .72 Organization 3.79 0.98 .83 0.86 0.71 .72 0.74 0.97 .80 Depression 2.36 1.05 .84 –0.87 0.86 .56 0.73 0.94 .73 Anxiety 2.83 1.09 .83 –0.96 0.85 .49 0.68 0.90 .73 Energy Level 3.31 0.94 .71 0.95 0.67 .63 0.66 0.93 .79 Aesthetic Sensitivity 3.62 1.09 .77 0.70 0.68 .69 0.64 0.98 .87 Creative Imagination 3.86 0.96 .83 0.90 0.65 .67 0.63 0.95 .85 Intellectual Curiosity 3.87 0.93 .78 0.66 0.67 .46 0.62 0.92 .86 Assertiveness 3.04 0.93 .69 0.54 0.76 .71 0.57 0.82 .75 Sociability 2.91 1.09 .84 0.76 0.76 .33 0.54 0.82 .70
Note. ω = omega reliability estimates for three- to four-item scales or α reliability estimates for the two-item honesty, fairness, loyalty, and purity scales. Traits are ordered from most to least morally relevant. The means for the change goals (reported in this table) were computed from the raw change goals, but we used mean absolute change goals for the correlations with moral relevance (reported in the text).
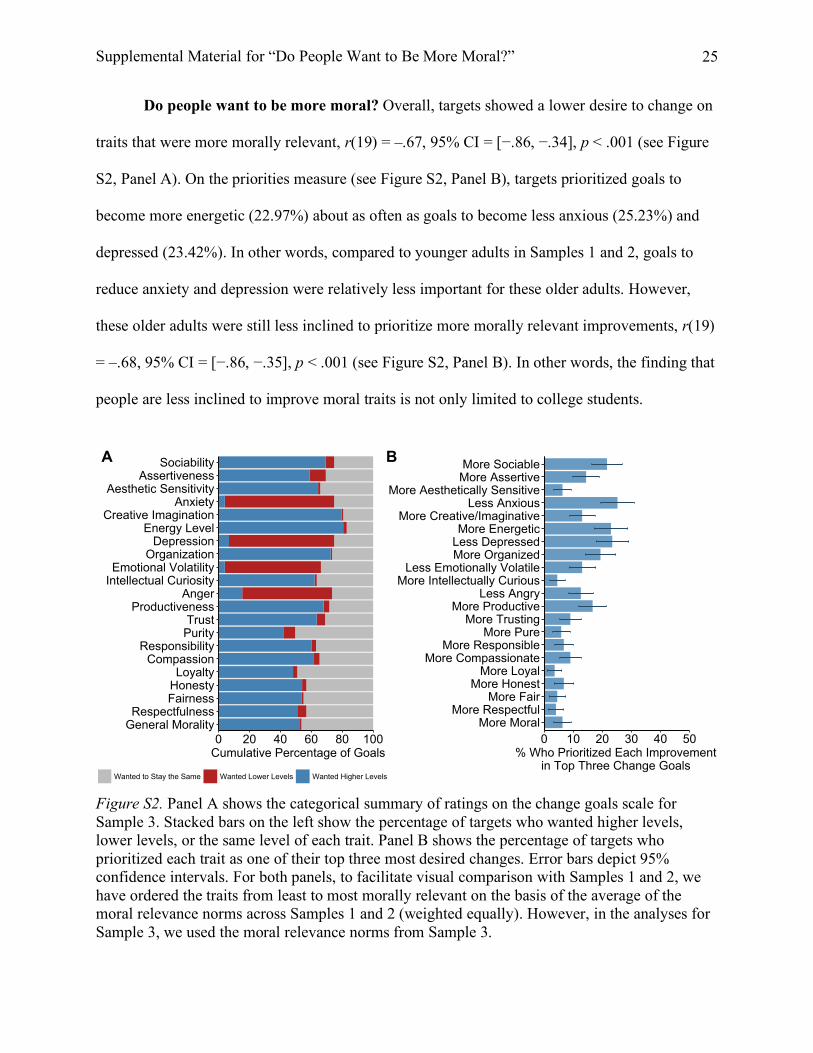
Supplemental Material for “Do People Want to Be More Moral?” 25
Do people want to be more moral? Overall, targets showed a lower desire to change on
traits that were more morally relevant, r(19) = –.67, 95% CI = [−.86, −.34], p < .001 (see Figure
S2, Panel A). On the priorities measure (see Figure S2, Panel B), targets prioritized goals to
become more energetic (22.97%) about as often as goals to become less anxious (25.23%) and
depressed (23.42%). In other words, compared to younger adults in Samples 1 and 2, goals to
reduce anxiety and depression were relatively less important for these older adults. However,
these older adults were still less inclined to prioritize more morally relevant improvements, r(19)
= –.68, 95% CI = [−.86, −.35], p < .001 (see Figure S2, Panel B). In other words, the finding that
people are less inclined to improve moral traits is not only limited to college students.
Figure S2. Panel A shows the categorical summary of ratings on the change goals scale for Sample 3. Stacked bars on the left show the percentage of targets who wanted higher levels, lower levels, or the same level of each trait. Panel B shows the percentage of targets who prioritized each trait as one of their top three most desired changes. Error bars depict 95% confidence intervals. For both panels, to facilitate visual comparison with Samples 1 and 2, we have ordered the traits from least to most morally relevant on the basis of the average of the moral relevance norms across Samples 1 and 2 (weighted equally). However, in the analyses for Sample 3, we used the moral relevance norms from Sample 3.
A
General MoralityRespectfulness
FairnessHonestyLoyalty
CompassionResponsibility
PurityTrust
ProductivenessAnger
Intellectual CuriosityEmotional Volatility
OrganizationDepression
Energy LevelCreative Imagination
AnxietyAesthetic Sensitivity
AssertivenessSociability
0 20 40 60 80 100Cumulative PercentDJH of Goals
Wanted to Stay the Same Wanted Lower Levels
B
More MoralMore Respectful
More FairMore Honest
More LoyalMore Compassionate
More ResponsibleMore Pure
More TrustingMore Productive
Less AngryMore Intellectually Curious
Less Emotionally VolatileMore OrganizedLess DepressedMore Energetic
More Creative/ImaginativeLess Anxious
More Aesthetically SensitiveMore AssertiveMore Sociable
0 10 20 30 40 50nt% Who Prioritized Each ImprovemeQW�
in Top Three Change GoalsWanted Higher Levels

Supplemental Material for “Do People Want to Be More Moral?” 26
Associations between traits and change goals. Figure S3 shows the latent correlations
between self-reported current levels and change goals for each trait. In general, targets who
reported having lower levels of a given trait wanted to increase more on that trait, mean r = –.27.
However, once again, the negative association between traits and change goals was smaller for
more morally relevant traits, as shown by a strong positive association between moral relevance
scores and (Fisher r-to-z transformed) correlations between traits and change goals, r(19) = .49,
95% CI [.07, .76], p = .025. In other words, the correlation between current levels and the desire
to improve shifted from moderately negative for the least morally relevant traits to essentially
zero for the most morally relevant traits.
Figure S3. Associations between self-reported current traits and change goals. The traits are ordered from least to most morally relevant on the basis of the moral relevance norms for Sample 3. Error bars depict 95% confidence intervals.
TraitSociabilityAssertivenessIntellectual CuriosityCreative ImaginationAesthetic SensitivityEnergy LevelAnxietyDepressionOrganizationEmotional VolatilityProductivenessAngerResponsibilityTrustPurityLoyaltyRespectfulnessCompassionFairnessHonestyGeneral Morality
‒1 ‒.90 ‒.80 ‒.70 ‒.60 ‒.50 ‒.40 ‒.30 ‒.20 ‒.10 0 .10 .20 .30r

Supplemental Material for “Do People Want to Be More Moral?” 27
Do high trait levels explain why people do not want to be more moral? Finally, we
used multi-level modeling to examine whether people are less motivated to change more morally
relevant traits, controlling for their perceptions of their current levels. We used the same
approach described above (see Section 3), except that we used person-specific measures of moral
relevance (rather than aggregate moral relevance scores), which were within-person-centered.
Once again, these within-person analyses showed that current levels and moral relevance scores
independently predicted lowered change goals for both the continuous and priority-based
measures. In other words, targets were less inclined to change on traits that they considered to be
more morally relevant (β = –0.13, 95% CI [–0.16, –0.09], p < .001), even controlling for current
levels (β = –0.15, 95% CI [–0.20, –0.09], p < .001). They were also less inclined to prioritize
improving traits that they considered to be more morally relevant (OR = 0.67, 95% CI [0.60,
0.76], p < .001), even controlling for current levels (OR = 0.56, 95% CI [0.51, 0.63], p < .001).

Supplemental Material for “Do People Want to Be More Moral?” 28
References
Ashton, M. C., Lee, K., & de Vries, R. E. (2014). The HEXACO honesty-humility,
agreeableness, and emotionality factors: A review of research and theory. Personality and
Social Psychology Review, 18(2), 139–152. https://doi.org/10.1177/1088868314523838
Bates, D., Mächler, M., Bolker, B., & Walker, S. (2015). Fitting linear mixed-effects models
using lme4. Journal of Statistical Software, 67(1), 1–48.
https://doi.org/10.18637/jss.v067.i01
Cohen, J. (1960). A coefficient of agreement for nominal scales. Educational and Psychological
Measurement, 20(1), 37–46. https://doi.org/10.1177/001316446002000104
Diessner, R., Solom, R. C., Frost, N. K., Parsons, L., & Davidson, J. (2008). Engagement with
beauty: Appreciating natural, artistic, and moral beauty. Journal of Psychology:
Interdisciplinary and Applied, 142(3), 303–329. https://doi.org/10.3200/JRLP.142.3.303-
332
Graham, J., Nosek, B. A., Haidt, J., Iyer, R., Koleva, S., & Ditto, P. H. (2011). Mapping the
moral domain. Journal of Personality and Social Psychology, 101(2), 366–385.
https://doi.org/10.1037/a0021847
Kahane, G., Everett, J. A. C., Earp, B. D., Caviola, L., Faber, N. S., Crockett, M. J., &
Savulescu, J. (2018). Beyond sacrificial harm: A two-dimensional model of utilitarian
psychology. Psychological Review, 125(2), 131–164. https://doi.org/10.1037/rev0000093
Kuznetsova, A., Brockhoff, P. B., & Christensen, R. H. B. (2017). lmerTest package: Tests in
linear mixed effects models. Journal of Statistical Software, 82(13), 1–26.
https://doi.org/10.18637/jss.v082.i13
Lee, K., & Ashton, M. C. (2018). Psychometric properties of the HEXACO-100. Assessment,

Supplemental Material for “Do People Want to Be More Moral?” 29
25(5), 543–556. https://doi.org/10.1177/1073191116659134
Muthén, L., & Muthén, B. O. (1998–2017). Mplus user’s guide (8th ed.). Los Angeles: Muthén &
Muthén.
Thomson, A. L., & Siegel, J. T. (2017). Elevation: A review of scholarship on a moral and other-
praising emotion. Journal of Positive Psychology, 12(6), 628–638.
https://doi.org/10.1080/17439760.2016.1269184