2018 Mail.ru Group Limited
136
ANNUAL REPORT 2018 Mail.ru Group Limited
-
Upload
khangminh22 -
Category
Documents
-
view
6 -
download
0
Transcript of 2018 Mail.ru Group Limited

OV
ERV
IEW
1Mail.ru Group Annual Report 2018
ANNUALREPORT
2018
Mail.ru Group Limited

OV
ERV
IEW
2Mail.ru Group Annual Report 2018
Contents
Section 1 Overview
03 Who we are05 Mail.ru Group in brief06 Our people08 Our history13 2018 key highlights21 Chairman and CEO's
statement
Section 2 Business review
25 Operating review46 Financial review
Section 3 Management
62 Management66 Corporate governance74 Risk management80 Board and management
remuneration82 Responsibility statement
Section 4 Financial statements
86 Independent auditors' report89 Consolidated statement
of financial position90 Consolidated statement
of comprehensive income91 Consolidated statement
of cash flows92 Consolidated statement
of changes in equity94 Notes to consolidated
financial statements
Section 5 Additional information
136 Cautionary statements

OV
ERV
IEW
3Mail.ru Group Annual Report 2018
Who we are
The Mail.ru team is composed of a group of experts in different areas who share the same goal: building and improving today’s environ-ment through technological leadership. Over the course of its history, Mail.ru Group has constantly evolved, identifying and adapting to new internet trends. The only thing that re-mains unchanged is that we are a team united by the same mission.
OUR MISSION We believe that technologies are created and developed for the good of society. Our mission is to improve people’s lives by making technologies simple and accessible to as many users as possible.
OUR STRATEGY People and their needs are at the heart of our ecosystem. We are constantly analyzing the needs of society in order to address them as quickly as we can. We provide services, platforms and technologies, bringing together people and businesses and helping them cooperate effectively.
We are experimenting with our ecosystem to tailor it to the challenges of today’s world. We are open-minded and for-ward-thinking. We aim for partnerships in which projects remain independent and their developers work in a friendly environment. This is pivotal to our corporate culture.
Supporting education and research is one of our strategic areas of focus, and for this reason we are cooperating with leading schools and universities and developing our own ed-ucation projects. We invest in scientific research and support innovators.
OV
ERV
IEW
4Mail.ru Group Annual Report 2018
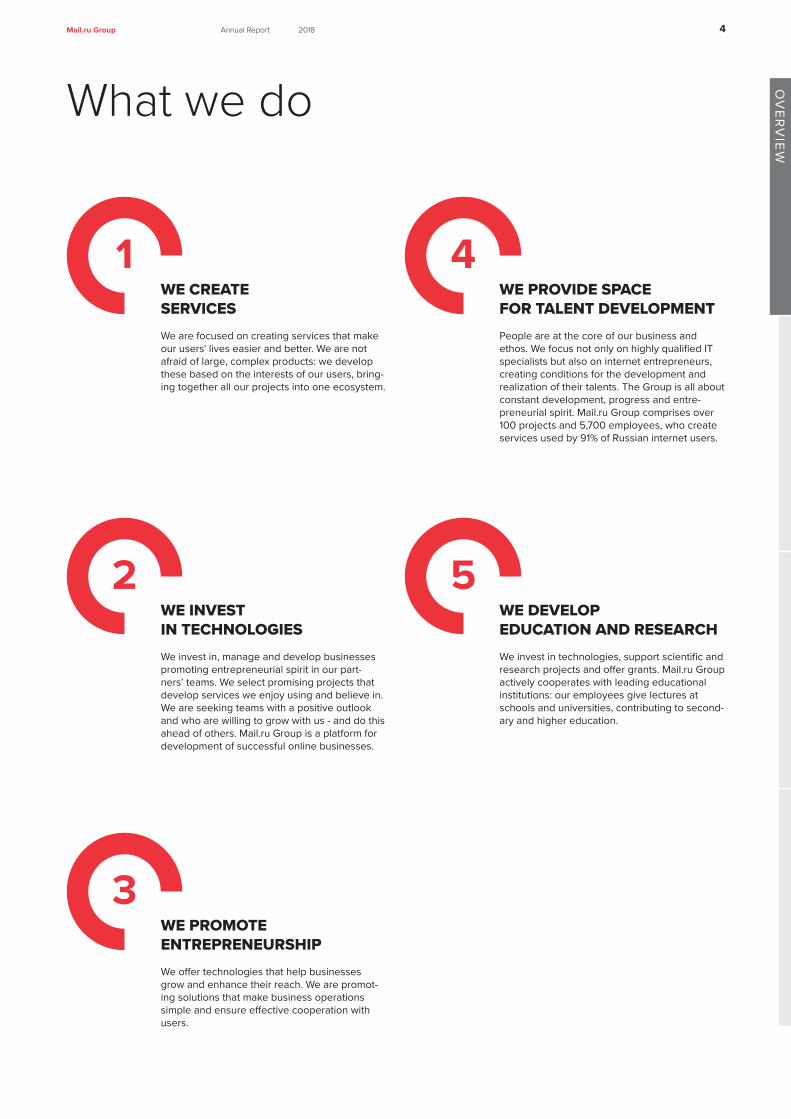
What we do
WE PROMOTE ENTREPRENEURSHIP We offer technologies that help businesses grow and enhance their reach. We are promot-ing solutions that make business operations simple and ensure effective cooperation with users.
WE CREATE SERVICES We are focused on creating services that make our users' lives easier and better. We are not afraid of large, complex products: we develop these based on the interests of our users, bring-ing together all our projects into one ecosystem.
1WE PROVIDE SPACE FOR TALENT DEVELOPMENT People are at the core of our business and ethos. We focus not only on highly qualified IT specialists but also on internet entrepreneurs, creating conditions for the development and realization of their talents. The Group is all about constant development, progress and entre-preneurial spirit. Mail.ru Group comprises over 100 projects and 5,700 employees, who create services used by 91% of Russian internet users.
4
WE INVEST IN TECHNOLOGIES We invest in, manage and develop businesses promoting entrepreneurial spirit in our part-ners’ teams. We select promising projects that develop services we enjoy using and believe in. We are seeking teams with a positive outlook and who are willing to grow with us - and do this ahead of others. Mail.ru Group is a platform for development of successful online businesses.
2WE DEVELOP EDUCATION AND RESEARCH We invest in technologies, support scientific and research projects and offer grants. Mail.ru Group actively cooperates with leading educational institutions: our employees give lectures at schools and universities, contributing to second-ary and higher education.
5
3

OV
ERV
IEW
5Mail.ru Group Annual Report 2018
Mail.ru Group in brief
Mail.ru Group offers a variety of online communication products, entertainment and e-commerce services.
Social Networks The two largest Russian language social networking services and communication plat-forms VKontakte (VK) and Odnoklassniki (OK)
Online Games Russia’s leading provider of MMO and mo-bile games with a portfolio of both internal-ly-developed and licensed titles, reaching for global gaming market
Email, Portal & IM The leading email service in Russia (Mail.ru), IM services (ICQ, Agent Mail.ru and TamTam) and media projects
E-commerce, Search and Other #1 food delivery company in Russia (Delivery Club and ZakaZaka brands), a location-based marketplace (Youla), an online learning platform for developers (GeekBrains), the 3rd-largest search engine in Russia, an offline mobile maps service (MAPS.ME)

OV
ERV
IEW
6Mail.ru Group Annual Report 2018
Our people
Our main asset is our people. Each year the best of them are recognized with People of the Year Award.
Mail.ru Group People Awards 2018 winners

OV
ERV
IEW
7Mail.ru Group Annual Report 2018
OV
ERV
IEW
8Mail.ru Group Annual Report 2018
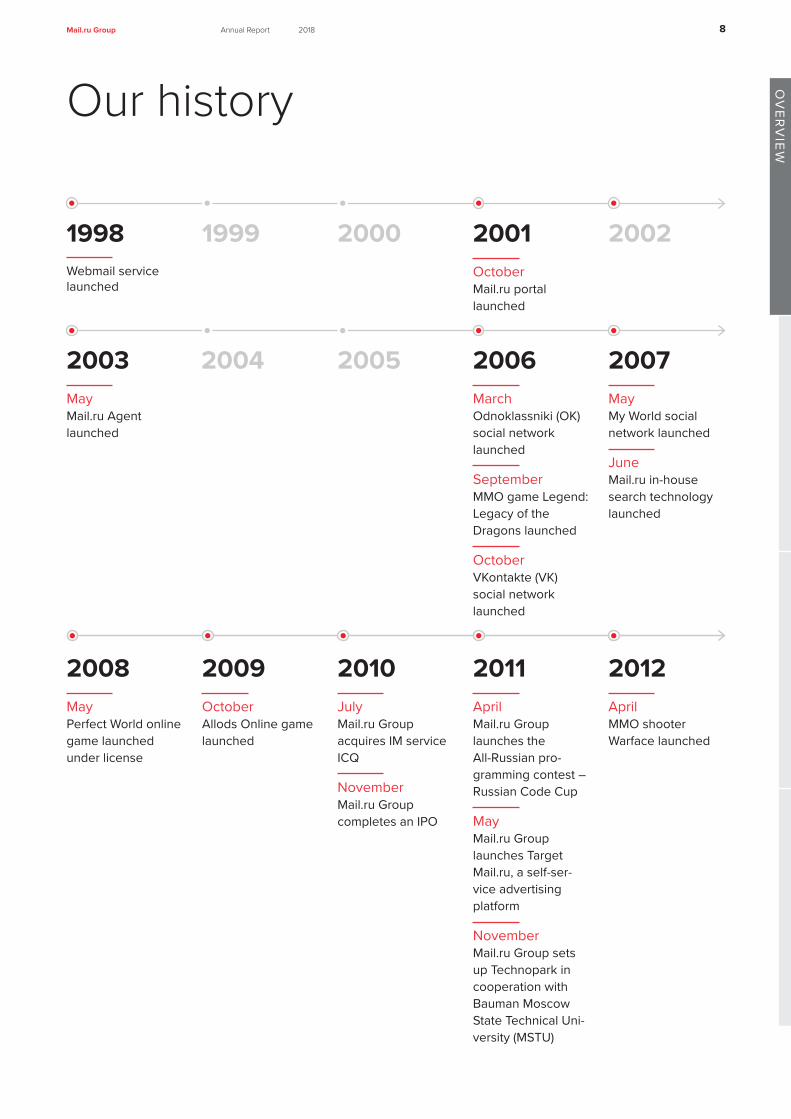
Our history
1998 2001
2003 2006
2008 2009 2010 2011 2012
20072004 2005
1999 2000 2002Webmail service launched
OctoberMail.ru portal launched
MayMail.ru Agent launched
MarchOdnoklassniki (OK) social network launched
SeptemberMMO game Legend: Legacy of the Dragons launched
OctoberVKontakte (VK) social network launched
MayPerfect World online game launched under license
OctoberAllods Online game launched
JulyMail.ru Group acquires IM service ICQ
NovemberMail.ru Group completes an IPO
AprilMail.ru Group launches the All-Russian pro-gramming contest – Russian Code Cup
MayMail.ru Group launches Target Mail.ru, a self-ser-vice advertising platform
NovemberMail.ru Group sets up Technopark in cooperation with Bauman Moscow State Technical Uni-versity (MSTU)
AprilMMO shooter Warface launched
MayMy World social network launched
June Mail.ru in-house search technology launched

OV
ERV
IEW
9Mail.ru Group Annual Report 2018
Alexander Dzyuba, Alexander Tobol,
Marianna KrasnovaOdnoklassniki
Feature of the Year Mail.ru People Awards

OV
ERV
IEW
10Mail.ru Group Annual Report 2018
2013 2014 2015 2016JuneMobile game Jungle Heat launched
JulyTarget Mail.ru launches a mobile ad platform
Launch of Mail.ru for Business, a free email service for business clients
AugustLaunch of cloud storage service Cloud Mail.ru
Launch of non-prof-it platform Dobro Mail.ru for charity crowdfunding
NovemberLaunch of myMail, a free email client app
JanuaryLaunch of mobile game Evolution: Battle for Utopia
FebruaryLaunch of MMORPG ArcheAge
Mail.ru Group sets up Technosphere in cooperation with Lomonosov Moscow State University (MSU)
NovemberAcquisition of offline mobile maps service MAPS.ME
MarchLaunch of myTar-get, an advertising platform combining all the Group's prop-erties.
AprilmyTarget launches an affiliate advertis-ing network
Launch of MMORPG Skyforge
JulyFirst VK Fest, a ma-jor offline festival in St. Petersburg
SeptemberLaunch of MMO game Armored Warfare
Mail.ru Group sets up Technotrack in cooperation with Moscow Institute of Physics and Tech-nology (MIPT)
OctoberLaunch of mobile location-based mar-ketplace Youla
NovemberEstablishment of VK University
JanuaryLaunch of Big Data business unit focused on B2B services
FebruaryMobile game Juggernaut Wars launched
AprilLaunch of a busi-ness unit offering a range of services powered by the Group's DBMS Tarantool
JulyOK Live streaming app released
AugustAcquisition of controlling stake in GeekBrains, an educational platform for developers
OK sets up the Technopolis edu-cational program in cooperation with Peter the Great St. Petersburg Poly-technic University
OctoberAcquisition of global game developer Pixonic
NovemberAcquisition of online food delivery com-pany Delivery Club
DecemberLaunch of Cloud for Business, a B2B service offering solutions for cold and hot data stor-age and storage for teamwork
MMORPG Revelation Online launched
VK Live streaming app released

OV
ERV
IEW
11Mail.ru Group Annual Report 2018
2017AprilMail.ru Group enters the console market for the first time with the release of Skyforge for PS4
Establishment of Mail.ru Games Ven-tures, an investment division with up to USD 100m of funding for gaming start-ups
Mail.ru Group and GeekBrains launched the first Russian online university for develop-ers (GeekUniversity)
MayAcquisition of Zaka-Zaka, Russia's number two food delivery com-pany; it was merged with Delivery Club
Acquisition of Am.ru, one of the major auto classifieds site in Rus-sia; it was merged with Youla
OK launches TamTam messenger
JuneLaunch of mobile game Hawk: Freedom Squadron
OctoberLaunch of Pandao, the cross-border online marketplace for Chi-nese goods
NovemberLaunch of mobile game Hustle Castle

OV
ERV
IEW
12Annual Report 2018Mail.ru Group
Ivan Pabiarzhyn,Andrey Leskov,Igor DeminWarface Team of the Year Mail.ru People Awards

OV
ERV
IEW
13Mail.ru Group Annual Report 2018
JanuaryVK launches an article editor offering users a convenient tool to assist in writing and editing "long reads."
OK launches proprietary post promotion system for small and medium businesses and content creators.
FebruaryVK launches face-recognition technology based on neural networks to automatically mark friends in photos.
VK introduces Community Stories, which can be uploaded by verified or large communities.
VK makes it possible for users to send and collect money in group chats on desktop and mobile versions of VK.
VK holds VK for Good, a charity auction where non-profit organizations can receive free digital promotion.
OK introduces OK Games, a desktop app for Windows with built-in Flash technology.
OK becomes an official live broadcaster of the 2018 Winter Olympics. The broadcasts gather 220m views and 33m unique viewers.
OK opens a long-read platform for all groups.
OK launches a video content line with different exclusive online shows.
Youla rolls out a loyalty program to retain users and stimulate their engagement.
Youla launches Youla Auto.
Mail.ru Games Ventures partners with Epic Games, the developer and publisher of games and creator of the Unreal Engine, to support game studios globally and finance the most promising projects.
Armored Warfare released on PS4 and Xbox One.
MarchMail.ru Group acquires esports company ESforce.
VK launches the Clever app, Russia’s first daily online quiz show with prizes.
VK updates the desktop VK Messenger app, adding an editing feature, dark theme, and an ability to pin messages and delete them for all chat members.
VK updates its messaging service and enables users to delete or edit their messages for all chat members within 24h.
OK launches face-recognition technology based on neural networks to automatically mark friends in photos.
OK relaunches voice and video calls with better connection quality based on AI and adds ability to share screen during video calls.
Delivery Сlub starts using Mail.ru Search data to provide personalization to Vendors app.
Evolution 2, a new mobile game developed by ITT Studio, is soft-launched in CIS.
2018 key highlights

OV
ERV
IEW
14Mail.ru Group Annual Report 2018
Vsevolod Zhidkov, Alina Bondarenko,Kirill Averyanov VK's Clever gameStartup of the Year Mail.ru People Awards

OV
ERV
IEW
15Mail.ru Group Annual Report 2018
AprilMail.ru Group and MegaFon acquire a minority stake in Citymobil, a Moscow-based ride-hailing app.
VK’s Suggestions Feed exceeds 1bn daily post views. Suggestions is a service for mobile devices that provides users with interesting content based on their personal preferences.
VK increases its group chat size limit to 500 members and makes it possible to grant chat management rights to chat members.
VK introduces secure video and voice calls with end-to-end encryption, which is built into the app and guarantees the security and confidentiality of calls.
OK introduces Moments, a neural network-based service that automatically creates videos capturing important moments shared on the social network.
OK launches a service for users to top up their phones.
OK releases a Recommendations Feed with neural network-based content algorithms and a protection system for content creators.
OK launches an online marketplace offering goods from China.
Mail.ru Group purchases digital retail agency 33 Slona.
Mail.ru Group announces plans to open a division investing in foodtech.
Mail.ru Group acquires a controlling stake in BIT.GAMES.
GeekBrains releases a mobile app for iOS.
Mail.ru Cloud Solutions launches a GPU cloud computing service in Russia, in cooperation with NVIDIA.
MayVK launches Direct Games platform on iOS: developers can create HTML-5 games which can be accessed from within the VK app.
VK adds Channels, public chats that form a one-way broadcast communication stream, currently in closed alpha testing.
VK launches Goals, a crowdfunding app for collecting money in communities.
OK adds a square video format for creators and advertisers.
OK launches cashback service for brand promotions.
Mail.ru Cloud Solutions enters the PaaS market with a new scalable PaaS service for big data analysis.
myTarget introduces a search-based context advertising tool that uses search queries in Mail.ru Group’s social networks and e-commerce projects.
JuneVK launches VK Pay, an online wallet that helps transform communities into full-fledged stores.
VK overhauls its polling service, making it eye-catching, easy-to-use and introducing a range of new features.
VK launches Nemesis, an AI-based algorithm protecting original content: it searches for duplicate posts and sends them to moderators for review.
OK launches AR masks in video calls.
Audiobook library becomes available on OK music service.
Youla launches a new Jobs vertical.
MRGV announces strategic partnership with Unity Technologies.
Mail.ru email service introduces EGO, the biggest update in years with a number of new features including smart email sorting, computer vision-based anti-phishing technology and a brand new UI.

OV
ERV
IEW
16Mail.ru Group Annual Report 2018
JulyVK introduces Business Pages with new features: addresses, working hours and a special call-to-action button.
VK holds VK Fest 2018, the largest festival in St. Petersburg and one of the largest in Russia, with over 90,000 attendees.
VK opens the Charity section on the VK Pay social commerce platform, where users can donate to charitable organizations.
OK launches live commenting on OK Live, a mobile live streaming app.
OK opens a 24/7 video store with goods reviews.
Mail.ru Group holds GameNode hackathon on blockchain game development.
Hustle Castle updated with anti-cheating initiatives, with captcha validation and suspicious player activity analysis.
DonationAlerts adds VK Pay support, allowing users to withdraw money through VK Pay for free until the end of 2018.
Mail.ru Cloud Solutions launches Sendbox and Askbox, paid SaaS services for creating newsletters and questionnaires.
myTarget introduces oCPM advertising strategy based on installs.
AugustVK significantly improves VK Music: all popular artists now have their own pages with a full collection of their songs and albums, including new releases. Search results now include artists’ albums and popular tracks as well.
VK launches Mini Apps, a platform for third-party developers to create any cross-platform services including gaming, social, e-com and O2O ones. These services work within the VK app and can help users buy food, schedule a doctor’s appointment, order a taxi and manage other daily tasks.
VK introduces privacy updates: users can set their profiles to private, making their profile info and content only visible to their friends.
VK holds its fifth VK Cup programming competition.
OK launches group voice and video calls up with to 100 participants.
Delivery Club announces a Promotions Center for restaurants.
Skyforge updated with a Battle Royale mode.
September
The Russian Direct Investment Fund (RDIF), Alibaba Group, MegaFon and Mail.ru Group announce a new joint venture in Russia and the CIS.
VK launches VK for Business, a useful and informative platform aimed at helping users create and develop their business community on VK.
VK updates and completely redesigns its video player.
VK launches Podcasts, a new platform with a wide selection of audio blogs and shows.
VK launches Game Store on its VK Pay social commerce platform. This is a PC and console game marketplace which offers exclusive discounts and cashback.
OK launches Instant Games Cup for mobile games developers.
Video content holders get the opportunity to create pay-per-view broadcasts on OK.
Warface online shooter launched on PS4 and Xbox One.
More than 13,000 guests attend a massive WARFEST gaming-centric festival.
Warface K.I.W.I. Tournament finals prize fund reaches record RUB 12.7m.
Mail.ru Cloud Solutions launches Database PaaS with quick access to popular databases and flexible scaling depending on business demands. The service supports open-source databases such as MySQL, PostgreSQL and Mongo.

Stanislav Osekin,Natalia Tyurina,
Alexander Ivanov Warface
Release of the Year Mail.ru People Awards
OV
ERV
IEW
17Mail.ru Group Annual Report 2018

OV
ERV
IEW
18Mail.ru Group Annual Report 2018
October
VK completely overhauls its Bookmarks section. Users can now easily save content and come back to it later, as well as add tags to their bookmarks and receive reminders about ones they have not taken a look at yet.
VK launches new user-friendly comment threads.
VK organizes the VK Mobile Challenge, a competition for mobile app developers.
OK adds background images for text posts in the News Feed.
OK starts testing its personal profiles promo system.
OK introduces a showcase for utility payments.
OK allows groups to publish native advertising.
OK opens a showcase for donations to charities.
Closed Siege Test held for medieval MMO action game Conqueror’s Blade.
Hustle Castle’s audience exceeds 26.5m on its launch anniversary.
Left to Survive zombie survival mobile shooter goes live worldwide on iOS and Android.
Donation Alerts successfully tests item sales during game streaming.
November
VK updates its mobile live streaming service with the ability to stream right from the VK app and a long-awaited feature: the ability to apply masks while streaming.
VK releases a feature that allows users to receive cashback on offline purchases using VK Pay. This can be done on VK mobile app Checkback by scanning QR codes on receipts.
VK holds VK Hackathon 2018, one of the largest hackathons in Russia.
VK introduces its new Stories format Narratives, a collection of up to 20 photos and videos with a cover and a name chosen by the user.
VK makes it possible for users to download a copy of their user data in one convenient file.
OK launches Photo Moments, a service that automatically creates photo albums.
OK introduces its own content award for movies, TV series, music etc.
OK announces a huge update of its Video platform: a "creative studio" with different interactive formats (voting, quizzes and others), a new video storefront with anonymous viewing, and filming of the series «5+».
Epic New Sulan update released for Revelation MMORPG.
December
VK launches Safety Guidelines. In this section, users can learn about what to do if they encounter threats, insults or false information on VK.
VK introduces community live covers on the VK mobile app. These contain up to five photos or short videos that are automatically cycled through.
VK starts beta testing of secure voice and video calls on the desktop VK Messenger app.
VK launches the new Website Ad format in the News Feed.
OK launches smart video feed on Android.
Delivery Club adds "happy hours" in the Promotions Center, which allows partners to boost sales during a specific hour.
MAPS.ME launches a UGC-platform for users to create and share travel routes.
OV
ERV
IEW
19Mail.ru Group Annual Report 2018
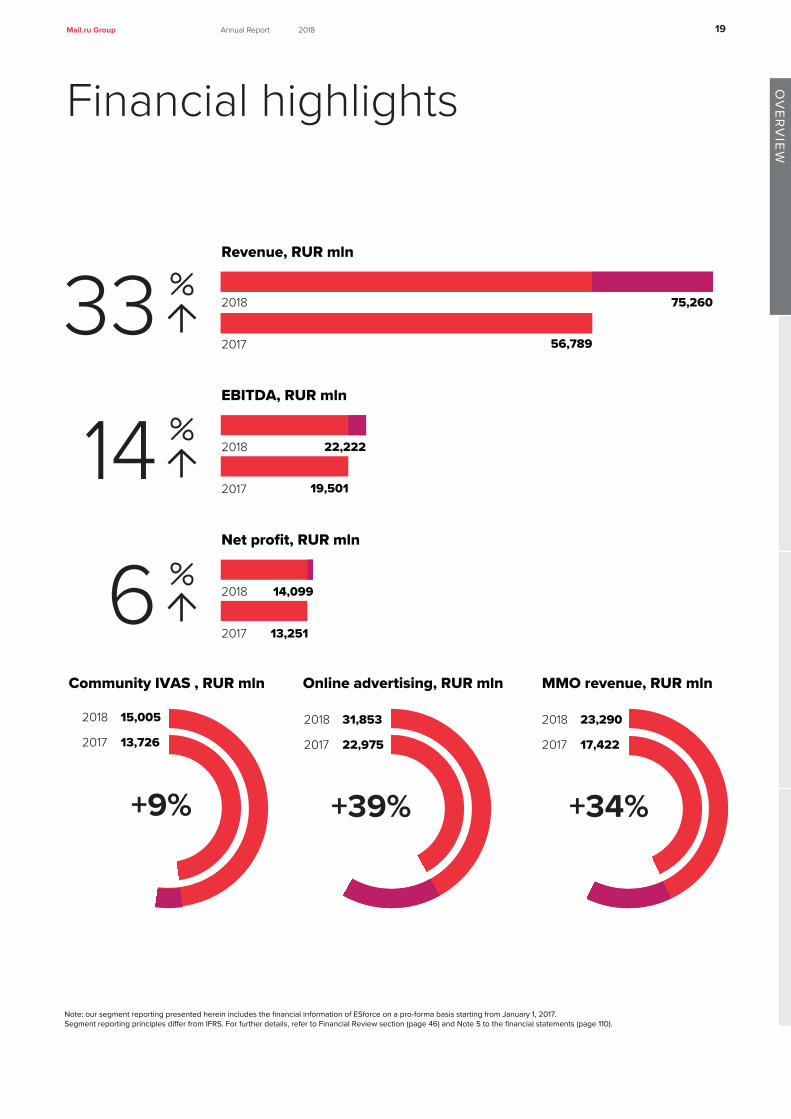
Revenue, RUR mln
2018
2017
75,260
56,789
EBITDA, RUR mln
2018
2017
22,222
19,501
33
14Net profit, RUR mln
2018 14,099
2017 13,251 6
Note: our segment reporting presented herein includes the financial information of ESforce on a pro-forma basis starting from January 1, 2017.Segment reporting principles differ from IFRS. For further details, refer to Financial Review section (page 46) and Note 5 to the financial statements (page 110).
2018 31,853
2017 22,975
+39%
Online advertising, RUR mln
2018 15,005
2017 13,726
+9%
Community IVAS , RUR mln
2018 23,290
2017 17,422
+34%
MMO revenue, RUR mln
Financial highlights

Mikhail Trifonov, Andrey Galkin, Vladimir Markov, Аrtemiy MyasnikovHustle Castle Release of the YearMail.ru People Awards
OV
ERV
IEW
20Mail.ru Group Annual Report 2018

OV
ERV
IEW
21Mail.ru Group Annual Report 2018
Chairman and CEO’s statement
In 2018 Mail.ru Group celebrated its 20th anniversary. Since our launch, we have turned from an e-mail service into a big online eco-system that includes a variety of products, which serve the ul-timate goal of improving the lifestyle of our users. The year 2018 marked a transformational year for Mail.ru Group, with significant prog-ress made on strengthening our overall offering across existing and new verticals.
Our core communication and social platforms remain among the most popular on the Russian and CIS markets. Our games continue to become more international and are expanding across platforms. Delivery Club maintained leadership on the Russian food delivery market, while Youla demonstrated accelerating growth, which is fast-er than other Russian classifieds at comparable stages. Pandao has continued to grow very rapidly, with strong ambitions from Mail.ru Group to participate in building a dominant e-commerce player on the Russian market under the planned AER JV with Alibaba, expect-ed to be completed during H1 2019.
We closed a number of acquisitions and investments which fit well with our strategy and our new projects like UMA or Citymobil are de-livering very strong user growth, with UMA being the largest music platform in Russia and Citymobil making strong inroads into the Mos-cow market with >16x growth in rides and set to expand regionally.
Additionally, Mail.ru Group helped educate over 1 million people through our GeekBrains platform and 180,000 people made dona-tions through our Dobro platform to reputable local charity funds.
Overall strategic focus remains very clear We continue to see the social networks and communications tools at the heart of our ecosystem where we aim to hold the users for significant, and rising, amount of time, including due to having a broader number of businesses which sit around the core, forming a broad ecosystem around the user. Some of these units will be 100% owned, others co-owned with partners. The partnerships will combine resources and expertise while providing investment capa-bilities to lead the digital transformation in various consumer-focused market segments. These partnerships will benefit from synergies with Mail.ru Group and will also allow us to offer the widest possible number of products to the user. Shareholders should expect to see further moves in terms of partnerships and in terms of us leveraging the wider ecosystem, be it in O2O services, distribution or content.

OV
ERV
IEW
22Mail.ru Group Annual Report 2018
Russian Internet market outlook The year 2019 marks 25 years since the introduction of the Russian internet, with internet penetration now reaching levels comparable to more mature markets, at 90m people as of FY 2018, rising by 3m Y-o-Y and reaching a 75.4% share of the adult (16+ years) population, versus 70% in 2015 and 25% in 20081. Mail.ru Group interacts with over 90% of these users on a monthly basis and c. 70% on a daily basis2. As such, there are very few users in Russia that we do not reach. The mobile market is also growing, with 61% of Russian adults using the internet on mobile in 2018, up from 56% a year ago3. More importantly, the mobile-only share of Russian internet users has dou-bled Y-o-Y from 18% to 35% in 20184, which places Mail.ru Group in an advantageous position as the number one destination for mobile traffic in the country. With this background we continue to develop our products and see a number of opportunities both domestically and internationally.
Performance review Social networks VK and OK were among the top 3 non-gaming apps by consumer spend in Russia in 20185.
Despite the very high hurdle rate from strong growth in both 2016 and 2017, VK, our core social network, expanded revenues by 45% in FY 2018. During 2018 we continued with the success seen in previ-ous periods, with further growth in total Russian users, both monthly and daily, in average daily reach and time spent per day.
Driving content consumption and user engagement remains key for VK. VK launched new user-friendly comment threads, which together with other improvements in the News Feed during 2018 led to a 20% Y-o-Y increase in daily comments in 2018. VK re-launched its Book-marks section, allowing users to save content and return to it later, as well as add tags to their bookmarks and receive reminders. VK updated its mobile live streaming service, enabling users to stream right from the main VK mobile app and apply masks while streaming. VK also introduced Narratives, a new story format for communi-ties. As a result, in FY 2018 the number of stories and video views increased by 92% and 40% Y-o-Y respectively.
Social commerce will form a key element of VK going forward with the ability to empower users, key opinion leaders, communities and merchants with tools to sell and shop online. As such, in 2019 VK will be launching a series of e-commerce integrations. Additionally there will be a drive to help SMEs with QR codes and their integration into the wider platform. In 2018, VK launched VK Pay, which together with Mini Apps, make for a solid foundation for development of the social commerce.
In September 2018 we hosted a VK strategy session, where we laid out our ongoing strategy. At the core of this is further growth in all key engagement metrics. In 2019 we will continue to support authors on the platform by providing new content creation and sharing tools. We are planning a series of product upgrades, including new
features in the News Feed and Discover as well as in stories and video streaming.
Odnoklassniki (OK) remains one of the leading social networks in Russia and CIS helping users maintain meaningful social relation-ships with their friends and family. OK started developing IVAS, primarily virtual gifts, as a communication tool in the first place. The shift to the communication aspect strengthened engagement and the total number of users sending virtual gifts in December 2018 grew 19% Y-o-Y. OK has also substantially updated its collection of stickers, following which the number of users sending stickers more than doubled and the number of stickers sent increased 13 times. One of the major launches in 2018 was an update for the AI-based voice- and video-call platform. Consequently, the number of calls made over the year increased 7 times to 2.2m per day.
One factor in the increase in engagement was the expansion of professional video content. Within the year the total amount of professional content views surged by 80%, with the video audience spending 66% more time on the social network than the rest of OK users. This all helped OK to remain a leader in video content consumption among social networks in Russia, with over 870m views daily in early 2019. At the end of the year all creators of video content have got access to the Creative Studio, a selection of tools (such as polls, quizzes, clickable descriptions, etc.) for interaction with viewers.
The main trend of the year for social game developers was the development of the OK mobile gaming platform. Over the year, the platform brought a revenue of more than RUB 300m to mobile game creators alone, with a monthly mobile gaming audience that grew 107% to more than 9m players.
Games & Esports Over the last 2 years our gaming division has more than doubled revenues as it continues to expand its pipeline and demonstrate success in both established and new titles, and as we broaden cross-platform reach. Our gaming business is becoming increasingly more international, with revenues outside Russia expanding to 63% as of Q4 2018, with the U.S., Germany and Japan being our largest non-Russian markets.
Hustle Castle is now the Group’s most successful in-house devel-oped gaming project, with the total number of installs reaching 30m in Q4 2018. There are further updates to the game expected in 2019 and we now expect that Hustle Castle will be a bigger revenue gen-erator over its lifespan than War Robots.
War Robots has also had another successful period: it continues to see solid growth and remains our second largest game. In 2019 there will be a series of further updates, including new robots and modules and an updated monetization system to be released in summer 2019.
The Warface franchise continues to perform well and remains our number three revenue generating game. In late Q3 the franchise was expanded to consoles, with PS4 and Xbox versions launched. Since then they have gathered over 6.5m registrations with 95% of
1 Source: GfK Omnibus, 2018, all Russia, age 16+.2 Source: Mediascope, Russia, cities 100k+, age 12-64, December 2018.3 Source: GfK Omnibus, 2018, all Russia, age 16+.4 Source: GfK Omnibus, 2018, all Russia, age 16+.5 Source: App Annie, The State of Mobile 2019 report, January 2019.

OV
ERV
IEW
23Mail.ru Group Annual Report 2018
these from international players. In January 2019, Warface became #3 free-to-play game on PS4 in the U.S. in terms of downloads. We expect to see further growth of the Warface game franchise through the release of the Warface mobile game in 2019, as well as effective continued support for the console versions of the game. As such, we continue to see Warface as a key ongoing franchise.
We have a full pipeline of further releases for 2019. We have already launched Space Justice, which is a mobile game based on the proven Hawk game mechanics and the monetization model from ITT Studio, and are releasing, among others, two licensed MMORPG titles: Conqueror’s Blade and Lost Ark. We believe that our games portfolio, both existing and new releases, is well positioned.
The focus for 2019, as it was in 2018, will be on the continued expansion of our international user base, allowing the building of a sustainable model with low to mid 20s sustainable EBITDA margin throughout the cycle and EBITDA doubling over the next 4 years, with more than twice as many users.
After closing the deal to buy ESforce in late March 2018, we have seen the business make considerable progress. For FY 2018 the business hit its forecast targets both in revenues and profitability. In Q4 we hosted a number of successful tournaments, including the Dota 2 Winter Clash in December. EPICENTER XL, held by ESforce, was the sixth most viewed esports tournament and the second most viewed Dota 2 tournament worldwide in 20186.
IVAS & Music We are pleased with the growth of the new mobile IVAS products and also music subscriptions, where the number of active paid and trial subscriptions on our platforms and in the integrated BOOM app by UMA reached 2.1m in December 2018. We believe this is currently the largest content subscription service in Russia. We see good on-going growth in subscriptions and will continue to add new features to our music offering.
Music, and increasingly content, is an important driver of user retention, building loyalty and creating an important element of our eco-system for users. The consolidation of UMA as of March 1, 2019 enables further development of our music offering across the board. We expect further growth in subscriptions to offset the decline in desktop IVAS. BOOM was among the top 3 non-gaming apps by consumer spend in Russia in 20187.
Classifieds Since its launch in October 2015, our location-based mobile market-place Youla has built significant and sustained user and listing bases. In February 2019 monthly active users on all platforms exceeded 27m, the number of active listings reached 32m and both metrics continue to grow.
Our team remains focused on user experience and content quality introducing automated moderation tools to delete duplicate listings and personalize the feed.
Another impressive milestone was reached in monetization, as Youla became the fastest classifieds in Russia to reach over RUR 1bn in an-nual revenues. During 2019 we plan to further increase monetization.
Food delivery Delivery Club maintains its market leadership, with the average number of mobile monthly active users growing by 67% Y-o-Y and the number of restaurants reaching about 8,300 in Q4 2018. The service is now available in 107 cities in Russia, with a plan to expand further in 2019.
During Q4 we launched a significant upgrade to our apps, with new navigation, resulting in materially increased traffic to search section and the promotions center. We also started to test new AI-based software to schedule couriers, leading to significant improvements in the efficiency and timing of deliveries. We also launched part-nerships with KFC, McDonald's and Burger King. We expect that quick service restaurants will form a large part of the business going forward.
2019 will see further product innovations, including courier tracking for orders placed on 1P delivery, integration of a new chat in the app and a courier ratings and loyalty program. Combined with the tar-geted expansion of own delivery courier network, we aim to achieve the fastest delivery time in Russia and maintain a leading market position, given our user offering and features for vendors.
We believe that by providing a wide variety of affordable inventory and fast delivery we not only enhance the lifestyle of our users, but also unlock a tremendous market opportunity.
E-commerce As was announced in September 2018, we have formed a new stra-tegic partnership with Alibaba, RDIF and MegaFon to launch a social commerce alliance in Russia and the CIS. Since then, negotiations have continued to progress well and we continue to see the transac-tion closing in H1 2019.
With unrivalled distribution capacity, merchant numbers and e-com-merce knowledge combined with a strong balance sheet, we believe that the new JV will extend its lead as the largest player in Russian/CIS e-commerce and see significant positive developments in 2019.
The new platform will be the leading cross-border marketplace and will further expand into domestic e-commerce. We will use the distri-bution capacity of our wider network to drive users to the platform. We will also look to integrate the new platform into social networks. As a first step in this direction, AliExpress is launching a VK mini-app to provide VK users with direct access to its full base of goods from VK.
Experiments In 2019 we plan to put more resources behind our initiatives in new technologies, especially in artificial intelligence, speech and visual recognition (including the use of these for voice-powered features and products), as well as behind the development of new experi-mental communication products. For this we have created MRG Tech Lab, which will include teams from various units inside the Group.
We have always focused on delivering the best possible user experi-ence and being on the edge of technological trends. MRG Tech Lab is accumulating expertise to develop technologies and come up with product solutions that will be paramount for our eco-system in the years to come.
6 Source: https://escharts.com/blog/top-tournaments-2018. 7 Source: App Annie, The State of Mobile 2019 report, January 2019.

OV
ERV
IEW
24Mail.ru Group Annual Report 2018
We do not expect these projects to produce any material revenues in 2019, and MRG Tech Lab will have costs of between RUR 1.0-1.5bn. Depending on the success of these projects, it is not anticipated that the scale of these investments will be repeated.
2018 financial performance FY 2018 revenue growth of 33% including UMA, or 31% ex UMA is above both our initial guidance of 23-28% and our revised guid-ance of 28-30%. EBITDA of RUR 22.2bn is in line with our guidance of RUR 22-22.5bn. Additionally we have hit or exceeded all of the individual business unit operating metrics that we committed to: spe-cifically the Q4 games margin of 33%, which is above the 27% of Q4 2017, Delivery Club Q4 and H2 growth of 71% and 56% respectively, and Youla seeing accelerating growth and increasing its revenues much faster than other classifieds at comparable stages.
In Q4 2018, the cash-generating capacity of our business remained unchanged and cash conversion was as expected. As a result, net cash position, post M&A costs, at the end of FY 2018 was RUR 11.7bn. With the M&A-related investment in UMA and performance-related payment on ESforce, we have utilized RUR 8.5bn in bank credit facilities in 2019 and with the upcoming investment in AER we may further utilize bank lines for near-term cash management.
Outlook 2018 was a successful year for us, with further strong growth across all areas as well as the JV agreement signed with Alibaba and prog-ress toward the full consolidation of UMA. While the macro remains somewhat unpredictable, we expect that social networks and games will have another solid year in 2019. Over the last 10 years we have grown Mail.ru 10x in terms of revenues, and grown our employee base nearly 6x. The strategy for the next few years is clear, with the core business, including international gaming, driving traffic and further strategic alliances in O2O and content to come. As such, we face the future with confidence.
With the Q3 2018 results, we also announced that we would look at options for both Delivery Club and Youla. There have been detailed discussions, and while no decisions have been made by the board, we will be pursuing all options in 2019. These assets have not been classified as assets held for sale but have been excluded from 2019 guidance. Guidance does not include any effects of the AER JV. We will continue to focus on further vertical opportunities in the future.
On a pro-forma basis we expect FY 2019 revenue growth of be-tween 18-22% or RUR 85-88bn. Even taking into account the effect on the margin of the mix shift in games, MRG Tech Lab and con-tent-related investments FY 2019 EBITDA under IFRS 16 is expected to be between RUR 32-34bn.
Post AER closing, our shareholder register will feature some of the largest and most successful internet companies in the world, with Naspers, Tencent and Alibaba as our three largest shareholders. Free float is expected to remain at the current 50% and we do not anticipate any further changes to the shareholder structure.
Our people and culture In every annual report we have said, and it is worth re-iterating, that our main asset is our people and the technology-driven culture which they create. Our unique culture remains one of the guiding principles for us, and Mail.ru Group's future success is very depen-dent on our ability to attract, retain and motivate the best engineers and other human talent. We continue to recognize this fact and very much value the contribution of every Mail.ru Group employee to the overall success of our business.
Thanks and appreciation For the last few years we have chosen to close this section with an acknowledgement to a number of key groups. With the success that we saw in 2018, it is quite right that there is no change to this. First off, our employees. Since the start of the Group, our success has been down to the dedication, commitment and passion that they show every day. Our employees are highly skilled and continue to show great loyalty to the Group. Underlying retention rates remain unchanged, and we believe that this is mainly a function of our continued focus on a tech-heavy culture. The Board is again happy to extend our thanks to all the Mail.ru Group staff and to recognize their contribution.
Secondly, on behalf of the Board, we want to thank our sharehold-ers. They continue to believe in, encourage and support us. The year 2018 saw a number of long-planned strategic initiatives continue to show very strong results, as well as a number of new initiatives with a lot of long-term potential. Despite the required investments, we were able to show very strong growth versus expectations and deliver on our EBITDA promises. We aim to build on the success of the past few years and expect 2019 to be a transformational year for some of our recently launched verticals like e-commerce and food delivery. We also continue to see many exciting opportunities for our business on the domestic internet market, and as such we approach 2019 with a high degree of optimism and confidence in both the near- and long-term success of our Group.
Dmitry Grishin Co-founder and Chairman
of the Board
Boris DobrodeevChief Executive Officer (Russia)

82%of Russian mobileinternetusers
91%of Russian internetusers
MAIL.RU GROUPMONTHLY REACH Mediascope, Russia, cities 100k+, age 12-64, Dec 2018
OPERATINGREVIEW

26Mail.ru Group Annual Report 2018
BU
SIN
ESS R
EV
IEW
Operating review
Our services attract millions of users each day. Whether they are using email, instant messag-ing (IM), our social networks or our games, we aim to increase time they spend on our sites and mobile applications by continuously offer-ing new features and services.
Rimma BakhaevaYoulaPerson of the Year Mail.ru People Awards
Social Networks We operate the two largest Russian language social networks, VKontakte (VK) and Odnoklassniki (OK). They enable users to find, connect and communicate with friends, families and colleagues. Our products include a newsfeed, messaging services, status updates, photos, videos, stories and other features. Users can play games to-gether, send each other online gifts, recommend websites and keep track of events, such as birthdays. We frequently add new products and services to maintain and increase users’ engagement.
VKVK unites tens of millions of users, gives them access to interesting content, helps creative minds share their work and provides entre-preneurs with new business opportunities. The company employs winners of international competitions, highly experienced develop-ers, and young talented programmers with a fresh perspective.
In 2018, the VK Team launched the following: • VK Pay, a social commerce platform • Secure voice and video calls • Article editor • Clever, an online quiz game• Mini Apps, a platform aggregating cross-platform services• Nemesis, an algorithm protecting original content • Comment threads • Podcast platform
Significant updates were made to the following: • Messaging service • Stories• Business tools • VK Music platform • Polls • Bookmarks • News Feed • Recommendations • iOS and Android VK apps • Videos • Live streams

27Mail.ru Group Annual Report 2018
BU
SIN
ESS R
EV
IEW
VK continues to be the most popular communication platform in Russia, with a monthly audience of 70m users1. 42% of Russian citi-zens use VK daily, with 81% of the Runet (Russian internet) audience reached every month2. VK’s messaging service is embedded into the VK app: in 2018, the number of messages delivered per day rose from 6.5bn to 10bn.
Improvements made to the smart feed have led to users spending increasingly more time on VK and more actively interacting with content and the News Feed. People go on VK 15 days a month on average3 — more than on other internet platforms in Russia — and view about 9bn posts every day in total. Daily comments increased by 20% Y-o-Y during 2018. Multimedia projects continue to show growth as well. In Q4 2018 the number of story views grew by 92% Y-o-Y and video views by 40% Y-o-Y. Updates to VK Music also led to successful results in 2018. More than 2.1m people are currently subscribed to one of the largest licensed digital music ecosystems in Russia4.
Clever, an online quiz game, reached record numbers of VK live-stream viewers, with up to 890,000 people watching the interactive show at a time. Clever ranked in the top 3 most-downloaded games of 2018 in Russia, combined on iOS and Android5.
The main iOS and Android VK apps are the most popular apps in Russia, with 46% of Russian citizens using them monthly6. The VK app was the top app by consumer spend in Russia in 2018, com-bined on iOS and Android7. The app became the most popular free app for iPad on iOS in Russia8.
In 2018, VK focused attention on safety issues. VK regularly blocks communities that encourage suicides, self-harm, school violence and child exploitation with its monitoring system, which uses a neural network to identify and block dangerous content. From January to No-vember 2018, more than 7.9m pieces of such content were removed
from VK, including texts, videos, photos and audio files. Over 1.8m unique profiles and 11,300 communities were blocked for distributing such kinds of content as well.
VK also introduced the Data Protection section and new Privacy Policy compliant with GDPR principles; this allowed users to better understand what happens with their data and how it is managed. The team reworked privacy settings and enhanced control over unauthorized access to user data. VK users now have the ability to adjust their privacy settings to make their profiles completely private. At the end of 2018, VK made it possible for users to download a copy of their user data in one convenient file. For additional security, VK added the ability to encrypt data copies before download using an OpenPGP personal key.
In H2 2018, VK publicly announced the release of the archive fea-ture, a way for users to hide irrelevant information from their pages. This function was made available to users at the beginning of 2019.
The two largest Russian language social networking services and communication platforms, VKontakte (VK) and Odnoklassniki (OK)
1 Monthly active users in Russia2 Source: Mediascope, Russia, population aged 12-64 in the cities 100k+, September 20183 Source: Mediascope, Russia, population aged 12-64 in the cities 100k+, September 20184 The number of paid and trial subscriptions on VK, OK and BOOM as of December 2018.5 Source: The state of mobile 2019 report, App Annie, January 20196 Source: Mediascope, Russia, population aged 12-64 in the cities 100k+, September 20187 Source: The state of mobile 2019 report, App Annie, January 20198 Source: Apple, December 2018
VK, mobile users, Russia, mlnDaily active users
Monthly active users
Dec '18
Dec '17
Dec '16
Sep '18
Sep '17
Sep '16
Jun '18
Jun '17
Jun '16
Mar '18
Mar '17
Mar '16
Source: Company dataFootnote: Mobile users include users who accessed the project solely via mobile applica-tions or mobile versions of the website as well as users who accessed the project from both mobile and desktop devices.
40.9
39.7
38.4
39.3
37.9
36.4
34.0
33.9
32.9
30.3
27.9
29.2
60.4
60.0
59.2
60.0
58.5
56.8
54.5
53.6
51.8
49.0
46.9
43.9

28Annual Report 2018
BU
SIN
ESS R
EV
IEW
Mail.ru Group
VK is also one of the largest business platforms in Russia. More than 500,000 companies conduct business on VK, receiving 40m messages from customers daily. To strengthen its lead, VK has intro-duced new business tools and improved advertising capabilities.
VK Business, a portal for users who want to create or are already developing their own business community on VK, was launched in September 2018. Business owners will find everything that they need to successfully operate on VK platform: a full selection of business tools, useful advice about setting up a community and ad-vertisements, as well as important updates. Additional features allow businesses to immediately begin creating a community and launch an ad campaign, ask Support any questions they have, and select partners and services to optimize work processes.
Anna ZubrilovaEmail&Portal Mentor of the Year Mail.ru People Awards
VK launched new Business Pages, to help businesses handle even more tasks on VK. Communities can now add a call-to-action button and customize it to their needs, as well as add a map, which can dis-play a list of the business’ addresses and working hours. These pages are convenient for business owners and are capable of completely replacing external websites and landing pages.
In 2018, VK further enhanced advertising accounts and added new promotion features. VK launched rewarded videos, a type of video ad shown in VK games that gives users the opportunity to earn in-game bonuses for watching it. The Advertiser community management role was introduced, allowing managers to appoint advertisers. This gives them the ability to launch ad campaigns for the community without permission to manage content or followers. VK also made it possible to set up an advertising schedule, allowing community managers to select the days and times they want their ad to be active. To help businesses easily create short video ads, a free video editor was launched. This editor has everything needed for an ad campaign, from an image gallery and various fonts to music and special effects.

29Mail.ru Group Annual Report 2018
BU
SIN
ESS R
EV
IEW
Additionally, VK organized a series of VK Digital Day events for business representatives, advertising agencies and VK partners. At these events, VK went over changes made to the business platform, answered questions and talked about useful business tools.
Product updates and new features led to a 30% increase in the num-ber of active SMB advertising accounts. The number of advertisers in the News Feed rose by 56%, with the number of special projects seeing an increase of 73%. Additionally, the total number of ad clicks in the News Feed rose by 25%. Updates also helped increase the income community administrators and content creators received. The number of communities that monetize their content using VK’s advertisement platform increased by 65%.
In Summer 2018, VK launched the VK Pay social commerce platform. The payment system expands communities’ abilities, allowing them to become stores. The launch of VK Pay led to the development of a full-scale e-commerce ecosystem. By combining payment capabil-ities with social features, VK has the potential to become a leading e-commerce platform in Russia. According to research data from Yandex.Checkout and Data Insight, VK has become the most popular platform for P2P purchases, with more than 44% of all Russian inter-net users using it for shopping. In six months, 3.6m users created VK Pay wallets and became active users of the payment platform. Over the course of the year, 155 brands launched special offers and sales on the VK Pay platform, exclusively for VK users. New features have been regularly introduced since it was launched, helping to make VK Pay a key part of e-commerce in Russia. These features include a marketplace for PC and console games and PC software; Checkback, a service that allows users to receive cashback on offline purchases; a service allowing users to donate to charitable organizations; and several special offers from partners.
In April, VK introduced a new way of staying in touch with friends: secure video and voice calling on the iOS and Android apps. The calling function is organically integrated into the interface of the mobile apps. While on a call, a user is able to use all the features of the app, such as replying to messages or browsing the News Feed. All calls use end-to-end encryption, which guarantees the security of conversations. The number of users making calls grew steadily over the year. In December 2018, 15m people regularly used this service.
In 2018, VK completely revamped its music section. VK Music is one of the largest music services in Russia. In 2018, VK continued to work on improving music experience, introducing artist overviews and a completely overhauled VK Music search feature. Finding interesting albums, finding out more about one’s favorite artists, and discovering new music became a lot easier. Now every popular artist and band has their own page with a complete collection of their songs and albums, including new releases. High-quality product updates have made VK a leader among music streaming services in Russia. More than 2.1m people are actively subscribed to one of the largest licensed digital music ecosystem in Russia.
Last year, VK actively developed its video and interactive live streaming platforms. VK videos receive more than 650m views daily, 80% of which are from mobile devices. For this reason the team concentrated their efforts on making the video viewing experience more enjoyable. In September 2018, a large update to the mobile video player was released, introducing video recommendations, double-tap fast-forwarding and rewinding, subtitles, zoom-to-fill mode, AirPlay support, playback speed adjustment and video quality settings. The video player was redesigned, with a new gray-colored menu, smoother screen rotation and full-screen mode transitions.
The VK team is continuing to experiment with various content formats to give creators more ways to express themselves. The podcast platform, launched in September, is a new tool for communities to interact with their audience. Podcasts are audio blogs and programs on various topics, which users can listen to whenever they want. For users, pod-casts are a great way to get to know VK content creators and discover something new every day. Interesting audio blogs and newly released shows can be found in a special podcast feed. The Podcasts section has appeared on the pages of the VK communities that have joined the platform. VK has also added a convenient catalogue to the mobile app to help users easily interact with the new format. Overall, the average podcast user spends more than 25 minutes a day listening to podcasts.
In August 2018, VK launched Mini Apps, a platform for third-party developers to create any cross-platform services including gaming, social, e-com and O2O ones. These services can help users buy food, sign up for services, order taxis, and manage other daily tasks, all without leaving the VK mobile app. The social network’s eco-system makes these services more than just Mini Apps; they have the unique ability to integrate with various VK systems, such as VK messages and notifications, and VK Pay.
In 2018, VK brought online and offline together through several big events. VK Fest, one of the largest open-air festivals in Russia, took place in July 2018 in St. Petersburg. Over 90,000 people attended the event, with an additional 1.7m people watching the live stream on the official VK community page. A total of 350 interactive sites were set up across an area the size of 50 football fields. More than 50 artists performed on the festival’s 4 music stages. In addition to the music lineup, VK Fest organizers prepared a unique entertainment and educational program. On the VK Team stage, lead VK developers and specialists talked about how they became part of the team and how the largest social network in Russia and the CIS works. Fans were able to meet popular bloggers. Many different organizations participated in the event, including St. Petersburg's museums and universities, as well as sports teams, charitable organizations, leading Russian and foreign companies, video game publishers and developers.
VK also held VK Hackathon 2018, a competition for programmers, designers and other software development specialists. More than 400 developers from 120 teams came to St. Petersburg to take part in the contest. The participants had 42 hours to develop prototypes of technology products from scratch. The tasks were divided into six different categories: culture, media, education, charity, technology and urban environment. Most projects were created using the Mini Apps platform. The total prize pool for the event was RUB 1.5m.
The finals of the VK Cup 2018 programming championship took place in August at VK headquarters in St. Petersburg. A total of 20 teams from various cities in Russia, Ukraine, and Belarus made it to the finals of the championship, which was being held for the fifth time. A record total of 3,279 teams participated in the event, 553 more than the pre-vious year. The winners shared a prize pool of RUB 2.5m.
average daily post views on VK

30Mail.ru Group Annual Report 2018
BU
SIN
ESS R
EV
IEW
VK also held the VK Mobile Challenge, a competition for mobile app developers. More than 1,000 people competed for a prize pool of RUB 2m. Over the course of a month, developers from Russia, the U.S., Germany, Singapore, Thailand and 16 other countries took part in the two stages of the competition. Four developers impressed the VK Team with their performance and were accepted into the company.
VK Media Day, VK Talents Event and VK Admin Day were special conferences for content creators, community managers and media outlets. During the conferences, VK introduced new platform tools, answered questions and discussed the features of the social net-work. About 300 specialists attended the events, and an additional 3m people watched live streams.
OKOne of the leading social networks in Russia and the CIS, Odnoklassniki (OK) has over 43m monthly active users in Russia alone. In 2018, OK saw a further increase in mobile users, with its mobile-only monthly audience setting a new record of 35m users worldwide, representing Y-o-Y growth of 9%.
OK users are typically distinguished by their high level of engagement with the content and meaningful communication with those close to them. Users actively communicate with their friends and relatives and OK's unique products allow the free expression of emotion in dozens of ways. In 2018, OK launched several new products and increased users’ engagement with communication services and content.
One of the major launches in 2018 was an update for the voice- and video-call platform. An AI-based algorithm selects optimal parame-ters for a network protocol to improve the quality of calls. Thanks to this technology all users, regardless of the quality of their internet connection and device model, can enjoy good-quality voice and video calls. Consequently, the number of calls made over the year increased seven times to 2.2m per day.
One of the main communication services on OK, virtual gifts, gained popularity in 2018. The share of OK users sending virtual gifts on na-tional holidays reached 75% last year, and the total number of users sending virtual gifts in December 2018 grew 19% Y-o-Y.
OK has also substantially updated its collection of stickers. In 2018, users gained access to dozens of new free stickers, as well as the ability to add stickers to their photos. As a result, the number of us-ers sending stickers more than doubled and the number of stickers sent increased more than 13 times during the year.
Growth of user engagement was driven by video content and the gaming platform. In 2018, OK announced one of the largest updates of its video platform in recent years. All creators of video content now have access to the Creative Studio, a selection of tools (such as such as polls, quizzes, clickable descriptions, etc.) for interaction with viewers. The video storefront now works as an online cinema: professional video content is conveniently structured and accessible even without login.
One of the key factors behind the increased engagement was the expansion of professional video content. In 2018, OK launched its own production of online shows, including a special New Year’s stream, announced production of its own series and streamed the most popular events of the year, such as the Winter Olympics, 2018 FIFA World Cup, Spanish La Liga, etc. Within the year the total amount of professional content views surged by 80%, with the video audience spending 66% more time on the social network than the rest of OK users.
Garik ShakhbazyanOdnoklassniki Intern of the YearMail.ru People Awards
31Mail.ru Group Annual Report 2018
BU
SIN
ESS R
EV
IEW
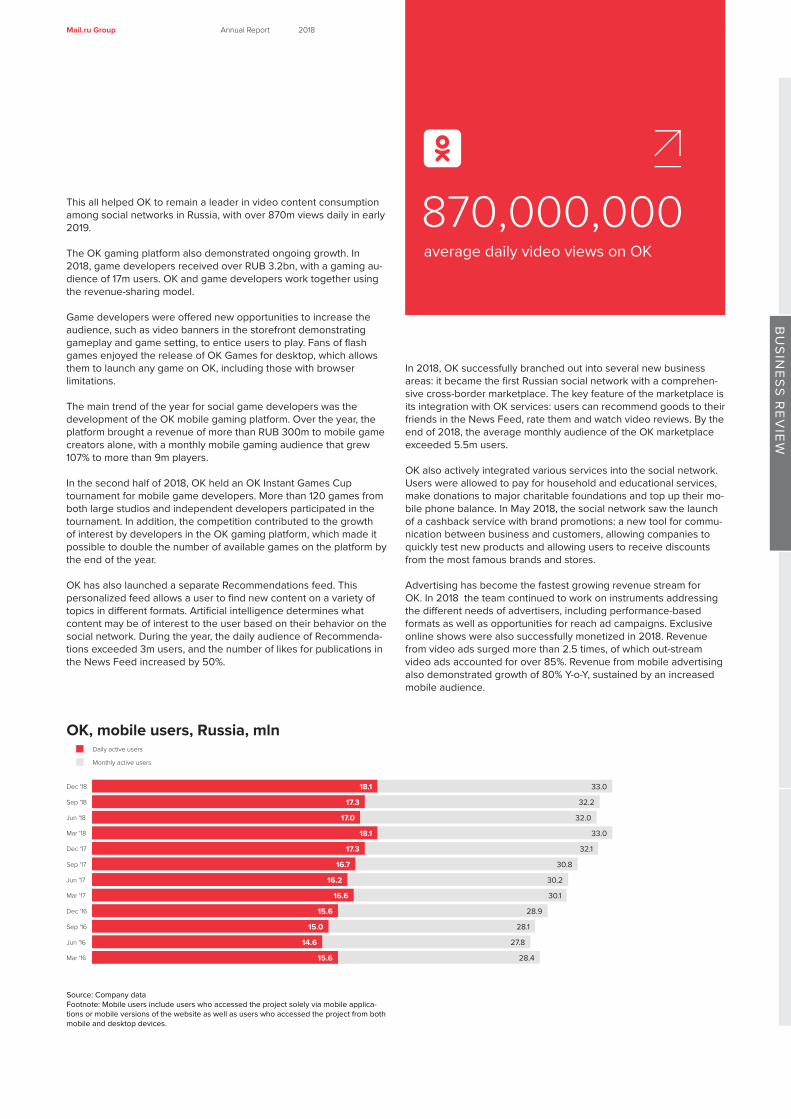
This all helped OK to remain a leader in video content consumption among social networks in Russia, with over 870m views daily in early 2019.
The OK gaming platform also demonstrated ongoing growth. In 2018, game developers received over RUB 3.2bn, with a gaming au-dience of 17m users. OK and game developers work together using the revenue-sharing model.
Game developers were offered new opportunities to increase the audience, such as video banners in the storefront demonstrating gameplay and game setting, to entice users to play. Fans of flash games enjoyed the release of OK Games for desktop, which allows them to launch any game on OK, including those with browser limitations.
The main trend of the year for social game developers was the development of the OK mobile gaming platform. Over the year, the platform brought a revenue of more than RUB 300m to mobile game creators alone, with a monthly mobile gaming audience that grew 107% to more than 9m players.
In the second half of 2018, OK held an OK Instant Games Cup tournament for mobile game developers. More than 120 games from both large studios and independent developers participated in the tournament. In addition, the competition contributed to the growth of interest by developers in the OK gaming platform, which made it possible to double the number of available games on the platform by the end of the year.
OK has also launched a separate Recommendations feed. This personalized feed allows a user to find new content on a variety of topics in different formats. Artificial intelligence determines what content may be of interest to the user based on their behavior on the social network. During the year, the daily audience of Recommenda-tions exceeded 3m users, and the number of likes for publications in the News Feed increased by 50%.
In 2018, OK successfully branched out into several new business areas: it became the first Russian social network with a comprehen-sive cross-border marketplace. The key feature of the marketplace is its integration with OK services: users can recommend goods to their friends in the News Feed, rate them and watch video reviews. By the end of 2018, the average monthly audience of the OK marketplace exceeded 5.5m users.
OK also actively integrated various services into the social network. Users were allowed to pay for household and educational services, make donations to major charitable foundations and top up their mo-bile phone balance. In May 2018, the social network saw the launch of a cashback service with brand promotions: a new tool for commu-nication between business and customers, allowing companies to quickly test new products and allowing users to receive discounts from the most famous brands and stores.
Advertising has become the fastest growing revenue stream for OK. In 2018 the team continued to work on instruments addressing the different needs of advertisers, including performance-based formats as well as opportunities for reach ad campaigns. Exclusive online shows were also successfully monetized in 2018. Revenue from video ads surged more than 2.5 times, of which out-stream video ads accounted for over 85%. Revenue from mobile advertising also demonstrated growth of 80% Y-o-Y, sustained by an increased mobile audience.
average daily video views on OK
OK, mobile users, Russia, mlnDaily active users
Monthly active users
Dec '18
Dec '17
Dec '16
Sep '18
Sep '17
Sep '16
Jun '18
Jun '17
Jun '16
Mar '18
Mar '17
Mar '16
Source: Company dataFootnote: Mobile users include users who accessed the project solely via mobile applica-tions or mobile versions of the website as well as users who accessed the project from both mobile and desktop devices.
33.0
32.2
32.0
33.0
32.1
30.8
30.2
30.1
28.9
28.1
27.8
28.4
18.1
17.3
17.0
18.1
17.3
16.7
16.2
16.6
15.6
15.0
14.6
15.6

32Mail.ru Group Annual Report 2018
BU
SIN
ESS R
EV
IEW
In mid-2018 OK launched an education portal for businesses, allowing advertisers to learn all the necessary information about promotion tools on the social network, as well as find out about the audience and their interests. The portal also gathers the most successful brand cases for OK, and beginners can take a training course on SMM.
Support for small and medium businesses was another new and highly promising business area for OK. In February 2018, OK launched its own system for the promotion of posts, which has been actively used by smaller companies and users starting their own business. As a result, OK’s revenue from this segment has doubled over the past six months.
Email, Portal & IM Email Mail.ru is the most popular email service on the Russian-speaking in-ternet in terms of monthly audience with 103m active accounts and 700m messages received daily. It is also the second largest internet portal in Russia.
In 2018 Mail.ru celebrated its 20th anniversary with a refreshed brand and a new strategy for its email service.
The new email strategy is underpinned by fundamental changes in the perception of an email service which has become a practical tool for handling a wide range of daily personal tasks.
Dealing with the need to manage an ever increasing flow of emails, Mail.ru's email service has started moving toward becoming smart, practical and secure:
• Smart — helps organize an overwhelming flow of emails effec-tively; sorts, hides and removes unwanted messages and brings important information to the foreground.
• Practical — upgrades from just notifying to handling daily tasks. • Secure — ensures data privacy and permanent access to emails.
In 2018 Mail.ru introduced various features aligned with the new strat-egy. Firstly, a new ML-based tool for email categorization and sorting. Newsletters and notifications from social networks are grouped in spe-cial folders, while transactional and other important emails remain in the Inbox. An "Unsubscribe" button has been added to all newsletters.
Secondly, Mail.ru launched the Subscriptions Manager. This displays a list of all subscriptions from the mailbox in a convenient interface. A user can delete unwanted emails, unsubscribe or report them as spam - all in one click.
In addition, the service now groups emails from e-commerce ser-vices by order ID. All email notifications about purchase are available in one thread. For AliExpress orders the team has also developed a customized email header with automatically extracted order informa-tion: order details, status, buyer protection etc.
Furthermore, the team has launched several useful features such as subscription to balance notifications and a payment block inside an email for mobile top-ups. The team is currently experimenting with pay-
Andrey IvvanOdnoklassniki Person of the YearMail.ru People Awards

33Mail.ru Group Annual Report 2018
BU
SIN
ESS R
EV
IEW
ment for different services in order to better understand users’ needs.
ML and AI are also increasingly being used for security. An AI-based detector of suspicious behavior protects users from intruders, while computer vision identifies phishing emails featuring the logos of large companies.
Mail.ru has also rolled out some new features that increase the level of email security: a sign-in history with a list of devices used to access the account and a warning system for potentially dangerous links.
Finally, the team released a brand new mailbox UI combining all the features mentioned above. The new UI is advanced, fast and adap-tive: Users can choose a three-column layout, write multiple messag-es in the same browser tab simultaneously by minimizing them in the bottom of the screen and enjoy all the other smart features launched as part of the update.
Instant messaging ICQ is a popular messaging service that is convenient and easy to use. Apart from the traditional messaging function, ICQ also features voice and video calls, virtual masks, and stickers.
2018 was an important year for ICQ in terms of product and technical updates and the overhaul of core functions. The team successively broke down a number of barriers that can get in the way of commu-nication, such as the requirement to add the contact to start chatting. For any message sent, the user will be able to see the delivery sta-tus and who has read it; this works for both private and group chats.
To make working with media content more convenient, the team have added a gallery and all photos, videos and other file attach-ments are displayed in a separate section of the chat. Other features rolled out include a chat history search in mobile apps, sticker sug-gestions and sending photos with text messages.
As far as technical updates are concerned, the team focused on the speed, stability and quality of the service. The app launch speed was increased by a factor of two, while traffic use at the app start saw a three-fold decrease. The dark theme mode, highly popular with users in recent months, also became available on iOS, Android and Web.
Media projects Mail.ru Group's media projects have a MAU of 76m worldwide and in-clude 10 thematic content verticals covering all aspects of human life.
In 2018, the team launched Vse Apteki, an aggregator that helps users find medicines for the best prices, collect orders from the nearest pharmacy. The pharmacies' info cards contain all the necessary de-tails, including directions, indications for use, contraindications etc.
Pets Mail.ru is a newly launched content vertical created in collab-oration with Purina, a producer of pet food. The project, aimed at promoting a responsible attitude to pets, combines information resources and a consultancy service for pet owners.
The leading email service in Russia (Mail.ru), IM services (ICQ, Agent Mail.ru and TamTam) and media projects
Mail.ru email, mobile users, Russia, mlnDaily active users
Monthly active users
Dec '18
Dec '17
Dec '16
Sep '18
Sep '17
Sep '16
Jun '18
Jun '17
Jun '16
Mar '18
Mar '17
Mar '16
Source: Company dataFootnote: Mobile users include users who accessed the project solely via mobile applica-tions or mobile versions of the website as well as users who accessed the project from both mobile and desktop devices.
13.5
12.9
12.1
11.6
11.0
9.9
9.6
9.4
9.1
7.7
7.5
7.8
25.8
24.1
23.6
23.3
22.3
21.2
19.9
19.8
20.1
18.5
17.9
17.4

34Mail.ru Group Annual Report 2018
BU
SIN
ESS R
EV
IEW
Auto Mail.ru has been transformed from a project about cars to a vertical about all means of transportation. The goal is to become a key source of reliable information not only about motor transport but also about other types of transport, new technol-ogies and modern means of travel.
Kids Mail.ru, both desktop and mobile ver-sions, has been relaunched and redesigned with more intuitive navigation and a custom-ized content feed to cater to the needs and interests of the audience.
Health Mail.ru achieved good results in big data and inter-project integration. Dis-ease trigger models, based on predictive analytics, have now been fully introduced; the consumer profile has been developed to integrate advertising by pharmaceutical companies.
Cinema Mail.ru has optimized the interface of its main website and updated it with new meta-data. The team has also introduced a new effective format for content distribution: a photo gallery. The team highlighted Cin-ema Mail.ru's own exclusive photo reports from major film festivals and the sets of popular movies and TV shows.
Lady Mail.ru successfully held the annual "Best Blogger" ceremony, which gathered many popular bloggers; over 1.1m users vot-ed for the best bloggers in 15 nominations. Among the social initiatives was #yesiamdi-vorced, a social project aimed at supporting divorced women.
Realty Mail.ru has integrated its database with Youla, an online location-based market-place of Mail.ru Group. All listings posted on either service automatically appear on the other, which has resulted in an increase in
Alexander TobolOdnoklassnikiExpert of the YearMail.ru People Awards

35Mail.ru Group Annual Report 2018
BU
SIN
ESS R
EV
IEW
reach for potential advertisers interested in cross-placement. Realty Mail.ru is now a single-entry point for professional market players: real-estate agencies and property developers.
News Mail.ru launched an ML-based algorithm for ranking news based on user interests. Moreover, the team started writing and publishing its own infotainment content, i.e. news, related stories, reviews and tests.
Sport Mail.ru launched several special projects to spotlight the main events of the year, i.e. the Winter Olympics and the FIFA World Cup, which had substantial audience reach. The team also received a sports media license, which made it possible to expand the pool of potential advertisers in the nearest future.
Hi-Tech Mail.ru set a new record in unique visitors and ranked in the top 10 websites globally in the Technology News category. The team also relaunched the product catalogue, which is now deeply integrat-ed into the content.
Online Games MMO PC games In 2018, the Group’s flagship free-to-play online first-person shooter Warface was still setting new records after six years in operation. In December 2018, monthly revenue across all territories and platforms reached RUB 700m.
In the fall of 2018, the Group held WARFEST, a pop-culture festival and esports event, which gathered over 13,000 guests. The LAN Final of the Warface K.I.W.I. Tournament, which took place during the WARFEST, had a prize pool of RUB 12.7m (USD 200,000).
In 2018, the Games division also held the 14th Open Cup season (October 2018 – February 2019) with esports teams from the U.S., Brazil, Europe, and Asia participating in the LAN Final in Moscow. The live online streaming of the final matches received 9m views.
In July 2018, the Group announced its partnership with Booming Games, a NetEase subsidiary, to publish its new sandbox PC game, Conqueror’s Blade, in Russia, the CIS, Europe, and North America. The game is outstanding in that it is an innovative hybrid of action and tactical gameplay; it combines smooth third-person action with sophisticated tactical control of the troops on the battlefield. The game comprehensively recreates weapons, armor, and warriors from many civilizations of the past. The release is expected in spring 2019.
In September 2018, in-house studio Owlcat Games released Pathfinder: Kingmaker, the first isometric role-playing video game set in the Pathfinder universe. Owlcat Games decided to raise
funds via crowdfunding on Kickstarter and reached its target of USD 500,000 15 days before the deadline, which was a sign of the immense fan support for the project. The video game is an adaptation of one of the most popular tabletop games, Pathfinder Adventure Paths. It combines a role-playing adventure with creat-ing a kingdom, taking the player on a journey through the infamous Stolen Lands. Pathfinder: Kingmaker was developed in consultation with game design legend Chris Avellone, renowned for his work on Fallout 2, Fallout: New Vegas and Planescape: Torment. The game was launched globally in September 2018 on Steam and GOG.com by publisher Deep Silver. It was featured among the best-selling new games on Steam.
In late 2018, Mail.ru Group also acquired a license for the Russia & CIS region for Lost Ark from Smilegate, the owner of the Crossfire franchise. This is an isometric fantasy MMORPG with hack-and-slash style combat and a huge world to explore. Players can navigate the world onboard their own ship to discover new regions and battle powerful bosses. Lost Ark offers a feature-rich gaming experience combined with stunning visuals and skill effects. Pre-sales started in 2018 and open beta testing is scheduled for 2019. Earlier, the game was launched in South Korea, and had over 350,000 PCU at launch. This is one of the most anticipated MMORPG titles in Russia.
MMO console games Mail.ru Group kicked off the development of the popular Warface franchise in 2018 with the successful launch on consoles: the game showed impressive results in the international market with 95% of players located outside Russia. Less than three months after launch the number of registered players exceeded 6.5m, which marked the most successful release on console among the Group’s projects. Moreover, the game was ranked #3 free-to-play title by downloads on Sony PS4 in the U.S. We expect to see further growth of the Warface franchise through the release of the Warface mobile game, as well as effective continued support for the console versions of the game.
Game Ownership Platform Launch date
Warface PS4 / Xbox In-house Console Aug / Sep 2018
Left to Survive In-house Mobile Oct 2018
Space Justice In-house Mobile Jan 2019
Major online games launches in FY2018-1Q2019
We continued our strategy of diversifying our games portfo-lio by distributing internation-ally and making major titles cross-platform. In Q4 2018, revenues outside Russia ac-counted for 63% of the Group's MMO revenue, or about 20% of the Group's total revenue.

36Mail.ru Group Annual Report 2018
BU
SIN
ESS R
EV
IEW
Mobile games Hustle Castle is the most successful game the Group has developed in-house. In 2018, its total number of players reached 35m, the game received positive reviews and high ratings in app stores, and PCU reached 1m players. Almost all of its audience (91%) live outside Russia. Hustle Castle was featured in Google Play’s top-grossing role playing games. The team is confident in the further success of Hustle Castle in 2019 thanks to further enhancements and promotion. More-over, the Group plans to release several new games inspired by the successful game mechanics of Hustle Castle and amplified with new features and environments.
War Robots, a third-person shooter with real-time PvP battles in Multiplayer Online Battle Arena (MOBA) mode, continues to achieve great results. The game developed by the Group's studio Pixonic recently hit 120m installs and reached RUB 14.6bn (US$218m) in revenue over five years in operation. Almost all of its audience (96%) live outside Russia. The interface has also been reworked, and the in-game balance improved; 19 new weapons, 13 new robots, 3 maps, and 2 modes have been introduced. The in-game economics have also fundamentally changed. New modules were introduced to make the robots even more customizable, adding abilities and skills to the robots, such as damage repair and invisible rival detection.
In 2018, Mail.ru Group purchased certain intangible assets from Glu Mobile, which were subsequently used in the development of the Group’s new mobile game Left to Survive. Left to Survive is a free-to-play zombie survival mobile shooter with modern graphics, dynamic gameplay and various PvE and PvP modes. The game was launched globally in July 2018. By the end of 2018, the total number of regis-tered users exceeded 4.5m. The game received positive feedback from players and is showing stable growth.
In April 2018, Mail.ru Group acquired a 51% stake in Bit.Games, one of Russia’s oldest mobile games studios. The developer enjoyed impressive growth over the past year, with its latest game Guild of Heroes reaching 7m installs and a monthly revenue of USD 1m.
In 2018, the team continued to develop Tacticool, a fast-paced multiplayer 5v5 tactical mobile shooter. The game is backed by Pan-zerdog studio, which received MRGV funding in 2017. The game’s central feature is the team deathmatch mode with intuitive controls, lots of weapons, realistic physics, and multi-purpose vehicles which can be used as a transport and a weapon. The game saw a soft launch and received very positive feedback. Its global release is planned for Q1 2019.
Another highlight of 2018 was the success of Hawk: Freedom Squadron, a mobile game also developed by the Group’s own studio IT Territory. In addition, the studio also completed the development of new mobile project Space Justice. The game expands the lineup of vertical scroll-shooters, a genre that has become a fan favorite around the globe. Space Justice was launched in January 2019.
Platforms and services In 2018, Mail.ru Group acquired ESforce, the largest esports com-pany in Russia and Eastern Europe, which has a full ecosystem of businesses critical for the industry: Epic Esports Events (organizer of EPICENTER tournaments), Virtus.pro (the leading esports team), RuHub (a broadcasting studio), cybersport.ru (the most popular es-ports online portal in the CIS), 220 communities with 5m subscribers in total etc.
Boris NikiforovInstant messagingLeader of the YearMail.ru People Awards
37Mail.ru Group Annual Report 2018
BU
SIN
ESS R
EV
IEW
Two flagship EPICENTER tournaments were held in 2018, including a major-class tournament in Dota2, with a total audience of 46m people; RuHub garnered a whopping 100m viewing hours the same year. Virtus.pro became the first team to win five major-class tournaments; in 2018 the team earned over USD 4.3m in prize money. The club also pre-sented its division team for one of the world’s most promising esports game – Fortnite . Two Virtus.pro players also became brand ambassa-dors of major international FMCG brands.
Our international esports platform PvP.gg became available on PC, consoles, and mobile devices. The platform brings together players and organizers and offers them all the necessary tools to run online tourna-ments of any scale in almost any esports game. The global launch of the platform is scheduled for June 2019.
In 2018, Mail.ru Games Ventures, a dedicated investment division of Mail.ru Group, announced a strategic partnership with two leading graphic engine developers: Epic Games (Unreal Engine) and Unity Tech-nologies (Unity). Under the agreement, both developers will help MRGV find the best teams to broaden cooperation and secure investment. MRGV-funded teams will also gain access to the Group’s analytical data and tools, marketing instruments, data security technologies, and various gaming services, including marketplaces. Epic Games and Unity Technologies will provide their expertise in technological aspects of game development, including the usage of graphic engines for building high-quality games across the PC, console and mobile platforms.
In March, the Group held its first gaming conference, The Big Deal, which gathered more than 900 industry experts. Among the guests were representatives of some of the leading companies in the sector, including Ubisoft, Riot Games, Tencent, Blizzard, Google, Unity Technol-ogies, iDreamSky, App Annie, and others. The Group sees a promising future for The Big Deal as a platform that would enable open communi-cation between developers, publishers, and investors alike – bringing together all the players shaping the gaming market.
In 2018, Russia’s biggest streaming add-on service DonationAlerts, backed by Mail.ru Group, went global by featuring new localizations for international audiences. The service empowers streamers (gamers, bloggers, celebrities, public figures etc.) around the globe with all the necessary tools to enhance their channels, such as widgets, polls, multi-chats and many other systems designed to provide more meaningful interaction with their audience. In 2018, the service introduced new technology that allowed bloggers to share personalized goodie boxes with their viewers, which helped build a loyal community of influencers for our gaming projects.
E-commerce, search & other Delivery Club Following the successful acquisition of Delivery Club, Russia's number 1 food delivery marketplace, in November 2016, the Group further consolidated its leading position in the market by acquiring ZakaZaka in May 2017, integrating both companies into one major food delivery business in Russia under the Delivery Club brand. The acquisition of ZakaZaka strengthened Delivery Club's nationwide leadership by adding a strong regional presence.
In Q4 2018, the mobile monthly audience surged by 67% Y-o-Y and the number of restaurants reached 8,300. Delivery Club is now avail-able in 107 cities across Russia.
To address the market growth in 2018, Delivery Сlub focused on areas which are crucial for successful long-term development:
• Supply: a strong portfolio of brands: the team entered into part-nerships with KFC and McDonald’s and is now the only platform in Russia having all largest quick service restaurant franchises.
• Coverage: expansion of own delivery network in new cities: the logistics team launched own delivery in 4 new cities, with more planned for 2019.
• Demand: improvement of customer delivery experience: delivery time reduced to 39 min on average in Moscow; the team aims to cut this to 30 min and establish it as standard.
In 2018, the team released some major updates, such as the Promotions Center section, for our partners to upload their promo offers using a special builder in the Vendor app. Another import-ant feature released last year was an ML-based search function providing a personalized list of restaurants based on user behavior. Delivery Club mobile apps were updated with improved navigation with tab bars, a new menu page, a checkout page and a rede-signed order screen which now displays a map with restaurants and address pins. These updates have significantly increased user engagement in discovering new restaurants and promo offers. Delivery Club also started testing new software that automates the scheduling process for couriers. Thanks to a ML-based algorithm predicting volume of orders on each delivery zone, the team ex-pects a decrease in delivery time.
In 2019, Delivery Club will continue working on the product and will redesign the app for couriers, as well launch chats and a courier rating, which should optimize communication and improve courier engagement. Combined with the significant increase in the number of own couriers since mid-2018, Delivery Club is well on the way to achieving the fastest delivery in Russia. Given the constant improve-ment of the product and its unique reach regarding user offering, vendor functionality and fast delivery, we expect Delivery Club to sustain its leading position in the market.
Youla Our location-based classified service Youla is the second-largest player in the Russian online classifieds market, with a strong focus on mobile. Its first year of monetization resulted in RUB 1bn of total revenue. This is an impressive achievement, as it was reached within three years of launch, twice faster than any competitor in Russia had done previously. Basic value added services piloted at the end of 2017 have now been complemented with listing fees and new services for C2C customers. Subscription fees aimed at monetizing professional sellers were introduced in Q4 2018 and were a good starting point for the development of the B2B business area.
Russia's #1 food delivery com-pany (Delivery Club), a loca-tion-based mobile marketplace (Youla), an online learning platform for developers (Geek-Brains), the 3rd-largest search engine in Russia, an offline mo-bile maps service (MAPS.ME).

38Mail.ru Group Annual Report 2018
BU
SIN
ESS R
EV
IEW
Listing base exceeded 32m (1.3x annual growth) driven mainly by growth in B2B client listings. In order to maintain the quality of the listing base while keeping moderation costs at reasonable levels, cutting-edge technologies, such as neural networks, have been introduced to detect photoduplicates.
Youla has taken the first step towards the verticalization of its busi-ness by separating the high-value segments, such as Auto & Auto Parts, Real Estate, Services, and Jobs, launched in mid-2018.
The Auto vertical now offers detailed car analytics based on a broad selection of parameters (price statistics, reviews, VIN checks, etc.). In addition, the Auto vertical introduced the New Cars section, where users can select configurations, special offers and discounts from dealers.
In the C2C segment, the team continued to focus on user experience and product customization by improving the feed relevance through machine learning algorithms and enhancing the loyalty program with gamification features. These initiatives have resulted in double-digit growth in user retention.
Search The Group's search service is the third-largest search service in the Russian internet market: in December 2018, it processed 2.9% (LiveInternet) of all web search queries. In addition to Russia, Mail.ru Group’s search has a large presence in other CIS countries.
In 2018, the team significantly redesigned search results and re-worked the core elements. Links to website subpages, shown below search results, make important results more noticeable and help users navigate the site. The search index was increased from 5 to 10bn documents, which has improved the quality of rare queries. The team also worked on information structuring due to both expanded coverage of existing categories and the addition of new catego-ries such as companies, rivers, mountains etc. Consequently, the coverage of search results with info cards has grown from 12 to 20%. Furthermore, Go Mail.ru now shows hints to certain short queries so that users do not have to open the link to get the answer.
In 2018, the team focused on the development of Pulse, our rec-ommendations feed. In mid-2018 the team started testing of Pulse on Mail.ru main page. While developing Pulse, the team pursued customizing the recommendations feed so that it displays only news and articles based on user interest, with no clickbait. The full-scale launch of Pulse on the Mail.ru main page was announced in January 2019.
MAPS.ME In 2018 MAPS.ME, an offline maps service based on OpenStreetMap data, hit 118m downloads globally and 14m monthly active users of mobile apps and web tools and services, with most of the audience coming from outside Russia. Thanks to the OpenStreetMap commu-nity, over 70m new objects and 3.5m miles of roads were added to MAPS.ME in 2018.
In 2018, MAPS.ME released a marketplace for multilingual digital guides, with complete routes featuring descriptions, photos, videos etc. All users can create travel guides with a new tool for web routes and share them with other MAPS.ME users in an integrated public catalogue. Over 12% of users download c. 300,000 travel guides per month and the number is growing.
Elena GlukhikhAccountingLeader of the Year Mail.ru People Awards

39Mail.ru Group Annual Report 2018
BU
SIN
ESS R
EV
IEW
Thanks to the OpenStreetMap community, the team has improved UI and data coverage of rapid transit and now MAPS.ME supports subway navigation in 150 cities in 50+ countries.
Other important updates included the improvement of search and filtering on the accommodation map: hotels, hostels, apartments etc.
Automatic backup using secure cloud storage was also launched for bookmarks created by users.
Additionally, MAPS.ME has added a Discovery button and its own ranking of popular places based on big geo-data to help travelers to quickly find interesting places to visit nearby.
A new division for B2B products development within MAPS.ME has already created and launched several GEO services: direct and reverse geocoding with backup support, address autocomplete and other functions based on OpenStreetMap.
In 2018, MAPS.ME won a nomination for Best Internet Service from National Geographic Traveler Awards (NGTA).
GeekBrains In April 2017, GeekUniversity, the first Russian online university for developers, was launched. In 2018, GeekUniversity introduced three new online programs: Information Security, Artificial Intelligence and Web. A total of 3,000 students are currently enrolled in all faculties.
GeekBrains started offering courses in new areas such as program-ming for product/project managers, game design and esports man-agement. The total number of registered users on the GeekBrains platform increased from 2.5 to 3.6m; overall, more than 33,000 users took online courses.
During 2018, the GeekBrains team held a conference with 20,000 participants online and 900 offline, and three Сareers Days for students of GeekUniversity, with 40 renowned employers (MegaFon, Alfa-Bank, Rostelecom, NVIDIA, VTB etc.).
At the end of 2018 GeekBrains became a resident of Skolkovo1, which provides further opportunities for business development with the help of Skolkovo's resources, such as partnership with other residents, PR, collaboration with the IT cluster and Skoltech etc.
Payment processing Payment processing of Mail.ru Group facilitates all of its projects and develops payment infrastructure for online payments within our products. Non-Banking Credit Organization (NBCO) Money Mail.ru, a company with a license from the Central Bank of Russia, extend-ed its license and became Non-bank Settlement Credit Institution. Money Mail.ru is now entitled to open accounts for companies and provide banking services.
Money Mail.ru provides e-wallet infrastructure for VK Pay. In addition to basic functions, such as creation, top-up, identification, money transfers and withdrawal, advanced features have been introduced, such as cashback for users and an open platform for merchants.
Money Mail.ru is now a principal member of the international pay-ment system Mastercard and Russia's National Payment Card System NSPK, and can issue pre-paid debit cards.
B2B services Big Data Analytics B2B services The Big Data team develops analytical services based on predictive models built with the help of machine learning methods. These proj-ects focus on improving process efficiency in sales and marketing, risk management, planning, personnel management etc. in compa-nies operating in different industries.
Clients of Big Data Analytics include established companies from finance, insurance, telecom and e-commerce industries, as well as advertising agencies and large retailers.
Data storage In 2018, the team focused on major product improvements like a new stable version of its open-source database featuring new stor-age technology for very large datasets, the first release of Tarantool Enterprise, featuring built-in horizontal scalability, carrier grade avail-ability, administrative GUI, and connectors for Enterprise databases and Tarantool 2.x beta release with ANSI SQL support.
The team also significantly increased the number and quality of B2B products for financial and telecom companies, i.e. omni-channel and control communications for VEON, an investment bank in-memory computing solution for Alfa-Bank, aviation fuel smart contracts based on blockchain technology for Gazpromneft-Aero, implementation of business-critical caching and increasing its availability and load capacity for MegaFon, important improvements for MasterCard including multi-currency support, distribution of CIS solutions, Apple Pay and Google Pay usage, and security improvements.
In 2019, the team will focus on further B2B portfolio growth by con-tinuing to work on developing its governance model, risks and stake-holder management as well as on product development, including core of Tarantool Enterprise, omni-channel, MDM, smart contracts and technical support excellence.
Mail.ru Cloud Solutions (MCS) In January 2018, Mail.ru Group merged its B2B IaaS products, includ-ing Infra, Hotbox and Icebox, into a new business segment under the brand name Mail.ru Cloud Solutions (MCS). MCS products cater to the needs of businesses in different areas, from agriculture to manufacturing industry and IT.
Infra is a cloud infrastructure service for creating virtual machines and getting access to computing power without complex settings. Hotbox and Icebox are object storage facilities for storing frequently used data (Hotbox) and rarely used data (Icebox), which can be easily integrated into apps written in any programming language.
1 Skolkovo Innovation Center, a scientific and technological center for the development and commercialization of advanced technologies in Moscow, Russia.

40Mail.ru Group Annual Report 2018
BU
SIN
ESS R
EV
IEW
In May 2018, MCS launched Containers, its first PaaS product for high-load IT systems and test-ing environments. Containers provide fault-toler-ant architecture, the efficient allocation of traffic with load balancers, and the quick creation of numerous testing environments and automatic CI/CD processes (continuous integration / continuous delivery).
In November 2018, MCS rolled out Mail.ru Cloud Marketplace, where partners offer their products on a subscription-based model.
MCS has also launched Cloud Machine Learning, a service for developers that allows them to build solutions without the need for their own infrastructure. Such solutions are widely used for the recognition of sounds, faces, and building trading bots and banking chatbots.
Mail.ru for Business In May 2018, Mail.ru for Business launched Sendbox, a service for creating B2B newsletters, sms and Viber messages. The service of-fers a visual text editor and tools for the customization and accurate targeting of newsletters. With the help of reports, businesses can track the CTR and conversion rates of their ad campaigns.
In July 2018, Mail.ru for Business launched Askbox, a service for cre-ating business surveys and testing via social networks, email, sms etc. Askbox has a very intuitive interface and requires no special skills from its users.
In 2018, Mail.ru for Business entered the B2B market in computer vision and launched Vision, a new service for conferences. The ML-based technology recognizes participants approaching Vision stands and sends relevant photos to their email addresses.
Mail.ru for Business also introduced Sounds, a new technology that can recognize certain sounds in audio files such as yelling, shooting, crying etc. Sound can also remove background noise, identify peo-ple by their voices and improve voice recordings.
Other activities IT infrastructure Our network infrastructure is designed to meet the requirements of our operations and to support the growth of our business. This infrastruc-ture includes services supplied internally as well as by third parties.
Our computer servers and networking equipment are located in our own data centers as well as in rented ones. Mail.ru Group also has a number of relationships with third-party IT providers, which provide it with a range of telecommunication services, including internet access and internet (traffic) transit.
In 2018, the peak network traffic increased to 5.86 terabits per second and the total amount of outgoing data reached 10,856 petabytes.
In Moscow and St. Petersburg, Mail.ru Group has 56,300 servers in 11 data centers. This ensures load balancing and protection against the loss of data caused by network or power failures.
Nikita LarichevEmail & PortalIntern of the YearMail.ru People Awards

41Mail.ru Group Annual Report 2018
BU
SIN
ESS R
EV
IEW
New optimized high-density server configurations and a well-organ-ised modernization process have contributed to increased efficiency in CAPEX and optimized operating costs.
Replacing old servers with new optimized ones has made it possible to reduce the number of servers in use by 15% while significantly increasing computing power.
In 2018, Mail.ru Group continued using 2 international data centers: in Amsterdam, the Netherlands, and San Jose, California, U.S. They are aimed at serving European and North American users and cur-rently host about 1,400 servers.
The ability to provide products and services depends on the contin-uous operation of our network and IT infrastructure. It also relies on the provision of network facilities by third-party IT providers and on the performance and reliability of the internet, power and telecom-munications infrastructure.
The team believes that the current access to network facilities and broadband capacity is sufficient to support its current operations and can meet the planned growth of its business for at least the next 12 months. A staff of full-time engineers administers the network infrastructure. They handle the day-to-day functioning of its system as well as hardware operations and maintenance.
Mail.ru Group's automation, dispatch and monitoring systems are be-ing continuously improved in all infrastructure divisions. The team is committed to increasing the level of autonomy of the systems while reducing the human role in the decision-making process.
The team pays close attention to the protection of user data. The Information Security department monitors the entire infrastructure and prevents, detects and responds to security threats.
To achieve the most efficient use of technical and material resourc-es, the team of engineers monitors the changes in load profiles and optimizes the infrastructure while ensuring a high level of availability of the Company’s products and services.
A high priority is placed on providing users with a consistently high-quality service and support through the technical support staff.
Sales and marketing Advertising is sold on our auction-based platforms. Mail.ru Group works on ad products, technologies, sales, marketing and client sup-port. The team's main focus is new technologies that drive effective-ness and improve ROI for clients.
In 2018, the team concentrated their efforts on four key improve-ments:
• Further development of ad products, technologies and targeting options.
• Inventory growth, mainly through the development of partner ad networks, especially video, both desktop and mobile.
• Traffic quality improvements, with a focus on traffic measurability and transparency.
• Development of the performance retail platform, an instrument for FMCG manufacturers to arrange personalized nationwide promo campaigns and gain insights into their customers.
Major highlights of ad product development and technology im-provement in 2018:
• Greatly improved different types of targeting, such as advanced social-demo (parents), intents (buyers of perfume and beauty products), personality types and context targeting.
• Local targeting was radically improved by using external (third-party) data sources and POI search in UI.
• Launch of a premium ad network for prominent publishers with good-quality traffic.
• myTarget grew significantly and became the largest video ad network in the Russian digital market2.
• Launch of VK partner ad network, with Youla as the first publisher.• Improvements of dynamic remarketing, including an overhaul
of the goods recommendation system, and auto generation of audience segments. Mobile traffic was also added to dynamic remarketing and support for deep links to app content.
• VK launched an ecosystem for SMBs (small and medium busi-nesses), integrated with its own payment system VK Pay.
• Further development of the partnership with X5 Retail Group now allows usage of partner data for campaign targeting and post-campaign analysis in terms of sales uplift.
• Integration of QR scan technologies from our inShopper service to our social networks: users are rewarded by advertisers only if they have made a purchase.
• Improvements of integration with verification partners, such as МОАТ, Weborama, AdLoox, Sizmek and simplified usage of these instruments in the myTarget user interface.
In 2018, the team aimed at transferring part of advertisers’ budgets from traditional to online media. The team managed to convince a number of brands to place their ads on the Digital-First principle, and some of them, such as Danone, even applied a Digital-only strategy, placing their ads only online. Such shifts in ad strategy resulted in equal ad budgets for TV and online ad placements in Russia, while the growth rate of online ad budgets exceeded TV ones.
Another focus was on attracting e-commerce advertisers, offering them new product solutions, such as oCPM/CPA pricing plans, lead ad formats and dynamic remarketing.
The oCPM/CPA strategy for purchasing app installs gained strong popularity in the system. The option of tracking events on apps and websites is planned to be introduced later.
In addition, the team enhanced context targeting with improved algo-rithms that search for keywords in user profiles and a more intuitive interface for working with context phrases.
Dynamic retargeting has been substantially reworked with improved product suggestions and data, completed with in-app events.
Other updates included the scaling of the ad system depending on the load and complexity of new models and targeting options. Addi-tionally, the team supported new ad formats such as square videos, interstitial full screen and 500x200 banners, and worked constantly on improving the display quality of existing ad formats.
In 2018, the team also worked on increasing the share of media cli-ents’ budgets for auction, striking private deals and reducing depen-dence on the monetization of residual traffic by third-party vendors.
2 Web-Index Report, Mediascope, April 2018

42Mail.ru Group Annual Report 2018
BU
SIN
ESS R
EV
IEW
Employees As of the end of 2018 the Group had 5,773 full-time employees. We highly value our employees and believe that our culture encourages individuality, creativity and a systematic approach to providing excel-lent service to our users.
A significant proportion of our employees possess a strong product and technical background, allowing them to contribute to our projects by generating new ideas and enhancing existing products. In 2018, our research and development activities were primarily focused on e-commerce, machine learning, ad tech, communica-tion products and mobile games. Our collaborative and innovative culture helped to launch new startups, supported the effective integration of new businesses and drove effective cross-product cooperation on new services among the e-commerce, messaging, search and social network teams.
Our structure by gender and position as of December 31, 2018 is presented in the chart below.
Our hiring policies are based on the principles of gender equality and equal opportunities for all candidates: we do not ask our candi-dates discriminatory questions or questions not relevant to the posi-tion in discussion; we have zero tolerance for derogatory comments about other candidates, employees or other employers; we use only highly qualified personnel to conduct job interviews.
36% WomenTotal headcount
64%MenTotal headcount
27% WomenMiddle management
73%MenMiddle management
11% WomenTop management
89%MenTop management
Gender diversity
Our recruitment strategy is to hire the most ambitious, competent, collaborative and innovative people. In 2018 we successfully hired more than 1,100 new employees with our in-house recruitment teams and through an efficient referral program. We also focused on time-to-hire ratio and dramatically improved it compared to 2017. We are striving to make our recruitment process more transparent and informative for our hiring managers and our in-house recruiters; our new applicant tracking system is helping us to keep building a world-class talent acquisition team with data-driven decisions and unique expertise.
In 2018 we arranged over 40 meetups for developers and enthusi-asts in various IT fields and 20 internal professional meetups and gatherings. We also continued to support independent communities and industry conferences, especially in data science, testing, back-end and mobile development.
Family values and traditions are an important part of our culture. We regularly organize family days in our office with a variety of family fun and kids' activities, from shows to coding classes. Our family programs are designed not only for kids but also for employees’ parents and partners: we have a variety of workshops, office tours and other events.

Alan Basishvili, Daniil Lysukhin, Eduard Tyantov, Vladimir Konev
VisionFeature of the Year
Mail.ru People Awards
43Mail.ru Group Annual Report 2018
BU
SIN
ESS R
EV
IEW

44Mail.ru Group Annual Report 2018
BU
SIN
ESS R
EV
IEW
Charity and social projects In 2018, Mail.ru Group approved a new social strategy: investing its technologies and experience in social projects.
Its social responsibility priorities include:
1. Developing social infrastructure projects
Today Dobro Mail.ru has 167 verified charity organizations from 46 Russian regions on its platform and allows users to participate in social projects as volunteers or with one-off or regular donations. Donations made in 2018 increased by 27% over the year.
Dobro Mail.ru launched Dobry Den’ ("Good Day"), a new volunteer fundraising service aimed at involving users’ friends in charity. Users can create special events and invite their friends to make donations to any Dobro Mail.ru charity project instead of gifts.
Dobro Mail.ru is making active use of new technologies: The Charity New Year Marathon, in partnership with popular streamers and the DonationAlerts service, raised over RUB 1m for seriously ill children.
VK launched VK for Good, a series of special events for non-profit organizations. As part of this project, VK held an annual conference on digital fundraising. At the event, 250 representatives of non-profit organizations and advertising agencies shared their best practices to identify the most effective ways for online fundraising. In Novem-ber 2018, VK held its 2nd annual charity auction of digital promo services.Consequently, social projects received 1,700 hours of free services in 2018 - nearly twice as much as in 2017.
July 2018 saw the launch of the "Good Deeds" section on VK Pay, meaning users can now donate to verified organizations directly on VK.
OK regularly supports charity and social projects, providing its tools and technologies for fundraising and drawing users’ attention to important social problems. In October 2018, OK opened a "charity corner" where users could make online donations to Russia’s largest and most respected charity foundations, including Gift of Life, AIDS Center, ORBI etc. Secured transactions are made with credit cards linked to users’ accounts.
In November 2018, OK, UNAIDS and UNESCO broadcasted "Frankly speaking," a live program dedicated to the 30th anniversary of World AIDS Day. Famous artists and journalists talked about the stigmatiza-tion of HIV and the role of films in AIDS education and the preven-tion of HIV. The broadcast was viewed 2 million times.
In December 2018, OK together with UN Women, the RTVI TV chan-nel and the Center Against Violence, held a special live broadcast dedicated to gender-based violence. The video gained over 2.3m views on OK.
2. Granting access to Mail.ru Group technologies to non-profit orga-nizations
Mail.ru Group offers its technologies to non-profit and social organi-zations either for free or on favorable terms.
Education We also continued expanding our range of training and develop-ment opportunities: over 3,000 employees attended 250 training activities focused on developing hard and soft skills. Our training and development policy states that training sessions are available to employees at all levels. This year we focused on talent devel-opment systems by creating career paths in departments with clear position requirements and personalized career development plans. More than 600 employees visited local and internation-al professional conferences, while we supported our internal speakers who presented at more than 50 events. We continued to develop an internal gamification platform with its own currency and Mail.ru Group’s merchandise store. The system supports our corporate culture and helps us to reward employees for activities that are important for the Group.
We launched 3 new educational programs: the Communications in IT program, created in cooperation with the Higher School of Economics (HSE) in Moscow, as well as two Igrosphere programs that proved to be valuable sources of new junior employees for our regional offices, launched with the assistance of the Voronezh and Penza state universities. More than 3,300 students attended full-time programming classes as part of our educational projects at universi-ties (including Technopark at BMSTU, Technosphere at Lomonosov MSU, Technotrack at MIPT, Technoatom at MEPhI and Technopolis at Peter the Great SPbPU). A total of 150 of them are now employed with Mail.ru Group.
In 2018 we launched Ambassador Program at 27 universities, and after careful selection, 40 students out of 2,500 candidates became our representatives and IT evangelists for our products at different universities and in different regions of Russia. As a result, more than 15,000 students now have better awareness about the Group, our educational projects and products. In the 2019 Most Attractive Employers in Russia ranking by FutureToday we have moved up 9 positions, to 4th place overall.
Furthermore, for the second time we organized Day of IT Studies for school students. This was a event where more than 170 of our employees, ambassadors and other industry IT specialists gave les-sons at 220 schools for more than 13,000 high school students in 54 Russian regions and 9 other countries. The live streams of this event on VK and OK were viewed 1.5m times. This project was awarded the 2018 HR Brand Prize by the biggest job board in Russia.
Alongside Sirius Educational Center and the Moscow Institute of Physics and Technology's Centre for the Support of IT Education we organized our second winter programming camp for 60 talented high school students.
Our Telecom Data Cup (machine learning and data mining champi-onship, organized in partnership with MegaFon), Highload Cup, ML Boot Camp, Russian AI Cup, Mail.ru Cup, Mail Design Cup, VK Cup, OK Instant Games Cup, Technocup are most prominent events of this kind in the Russian-speaking international internet community (over 30,000 participants from 30 countries, from school students to leading experts).
On our YouTube educational channel Technostream (over 110,000 subscribers) we made 2 seasons of our show about the lives of IT specialists, Oh, my code. In 2018, our programming courses in Py-thon, Go, and UX on Coursera attracted more than 30,000 students.

45Mail.ru Group Annual Report 2018
BU
SIN
ESS R
EV
IEW
One of the first projects in this domain was a cloud service for charity funds by Mail.ru Cloud Solutions. The company offered free cloud IT infrastructure to non-profit organizations verified by Dobro Mail.ru.
VK gives its full comprehensive support to non-profit organizations, providing an opportunity to use advertising products for free and organize events. During 2018, over 50 charitable organizations used VK ad products under this initiative. All campaigns were validated by VK experts for maximum efficiency.
3. Support of initiatives for Russia’s largest museums
In 2018, Mail.ru Group continued its partnership with the Pushkin State Museum and its project Pushkin Museum XXI. The first master-pieces for the collection of media art, the first collection of this kind in Russian state museums, have now been purchased. Additionally, the scientific conference "Classics and Modernity: Reflections" was held in a new format that allowed more than 40 specialists from all over the world to share their views on the place of contemporary art in a classical museum.
OK continued working with Russia’s largest museums by supporting their cultural and social initiatives. Starting in May, the Pushkin State Museum, the State Tretyakov Gallery, the State Russian Museum, the Garage Museum of Contemporary Art, the Moscow Museum of Modern Art and the Multimedia Art Museum launched sign language tours on OK using OK Live, a mobile streaming app. Together with myTarget, OK used big data to reach target audiences, bringing over 2.4m viewers to the first sign language tour of the Pushkin State Museum on OK. The project generated over 2.8m views in total.
4. Cybersecurity
One of Mail.ru Group's top priorities is security and user data protec-tion. The Group is working on social projects on data protection and the prevention of cyberbullying.
Mail.ru Group is developing and constantly updating effective security systems designed to protect user data for all of its projects, including email, social networks, games, instant messaging, e-com-merce, etc.
One of the key initiatives of last year was the launch of Safety Guidelines on VK, a section that teaches users how to react to online threats, insults or false information to stay safe. The main focus of the guidelines is related to child safety: how to deal with content encouraging school violence, suicides and child exploitation.
Alexey SennikovOdnoklassnikiInternal Solution of the Year Mail.ru People Awards

REVENUE & YOY GROWTH RUR MLN
75,2602018
56,7892017
33
FINANCIALREVIEW

47Mail.ru Group Annual Report 2018
BU
SIN
ESS R
EV
IEW
Financial review
This review reflects highlights of our financial performance for 2018. Full details can be found in the annual financial statements presented on pages 83 to 135 of this annual report.
Overview of consolidated results We are pleased to have demonstrated solid progress throughout 2018 in all key areas with total revenues growing by approximately a third, while we continued to put significant resources behind a number of our new projects, especially our O2O initiatives where we see significant potential. Online advertising showed strong growth, driven by growing user engagement, improved advertising tech-nologies and sales execution. Customer budgets continued shifting to online and towards mobile and social networks in particular. Our games business continues to produce a very strong performance, with the share of international increasing to over 60% of our MMO revenues. As in previous periods the OK desktop IVAS continued to decline, but it was compensated with the growth of the new mobile IVAS products and also the music subscriptions, where the number of active paid and trial subscriptions on our platforms and in the inte-grated BOOM app by UMA reached 2.1 million in December 2018.
Structure Our segment reporting is prepared on a pro forma basis, i.e. seg-ment financial information is presented for each period on the basis of an ownership interest as of the date hereof and consolidation of each of our subsidiaries, including for periods prior to the acquisition of control of the entities in question. The financial information of sub-sidiaries disposed of and operations classified as assets held for sale prior to the date hereof is excluded from the segment presentation starting from the beginning of the earliest period presented.
Nikita TeplovEmailInternal Solution of the Year Mail.ru People Awards

48Mail.ru Group Annual Report 2018
BU
SIN
ESS R
EV
IEW
Accordingly, our segment reporting presented herein includes the financial information of ZakaZaka, Am.ru (both acquired in 2017) and ESforce (acquired in 2018), UMA (control acquired in 2019) and ex-cludes the financial information of Pandao, all starting from January 1, 2017.
The structure of our segment reporting is based around the services we offer and includes the following reportable segments:
• Email, Portal and IM, • Social Networks (ex VK), • Online Games, • VK• E-Commerce, Search and Other Services.
The Email, Portal and IM segment includes email, our instant mes-saging services and the Mail.ru portal together with media projects; the Social Networks (ex VK) segment includes OK and My World social networks; the Online Games segment comprises our mobile, client-based, browser-based and social games. The VK segment includes the VK.com social network. E-Commerce, Search and Other Services includes search services, e-commerce (including O2O ser-vices), our esports business (ESforce) and certain other projects.
Please refer to “Operating segments performance – Basis of prepa-ration” below for more details on operating segments presentation.
Acquisitions and disposals in 2018 In January 2018, we acquired a leading esports group of companies operating under the ESforce brand (together “ESforce”) for a cash consideration of RUR 5,659 million and contingent consideration, measured at fair value, of RUR 1,132 million, based on ongoing finan-cial KPIs in a period of 1 year. The primary purpose of the acquisition of ESforce was to enhance our position on the esports market.
In April 2018, we acquired control in mobile games developer PBL Bitdotgames Publishing Limited (“BitGames”) by increasing our share to 51% (49% in addition to the previously held 2% stake). The primary purpose of the acquisition of BitGames was to enhance our position on the mobile games market.
Also in April 2018, we completed the acquisition of 100% in LLC “33 Slona” and LLC “Tekhnologii nedvizhimosti” (collectively, “33 Slona”), a digital real estate agency. The primary purpose of the acquisition of 33 Slona was to leverage our expertise and resources by achiev-ing substantial synergies with Youla, our general online classifieds product.
In June 2018, we completed the acquisition of 100% in Consult Universal Corp (“InShopper”), a cash-back technology provider. The primary purpose of the acquisition of InShopper was to leverage our expertise and resources by achieving substantial synergies with our payment technologies and solutions.
See also Notes 6 and 25 to our consolidated financial statements for further details on acquisitions and disposals.
Goodwill We account for business combinations by applying the acquisition method. As a result, we record goodwill as the fair value of the consideration transferred, including the recognised amount of any non-controlling interest in the acquiree, less the net recognised amount (generally fair value) of the identifiable assets acquired and
liabilities assumed, all measured as of the acquisition date. The significant goodwill recorded in connection with our acquisitions may lead to charges in future periods if the goodwill is impaired.
Total goodwill amounted to RUR 140,446 million as at December 31, 2018, and increased by RUR 7,408 million from December 31, 2017 mostly as a result of the ESforce acquisition. The goodwill is allocated to groups of cash-generating units (CGUs) – “Email, Portal and IM”, “Search”, “Online Games”, “Social Networks”, “VKontakte”, “Delivery Club”, “Pixonic” and “E-Commerce and Other” – in accor-dance with the operating segment structure of our business and IFRS requirements. Please see Note 11 to our consolidated financial statements for further details.
Operating segments performance Basis of preparation In reviewing our operational performance and allocating resources, our Chief Operating Decision Maker (CODM) reviews selected items of each segment's income statement, assuming 100% ownership in all of our key operating subsidiaries, based on management reporting.
Management reporting is different from IFRS, because it does not include certain IFRS adjustments that are not analysed by the CODM in assessing the core operating performance of the business. Such adjustments affect such major areas as revenue recognition, deferred tax on unremitted earnings of subsidiaries, share-based payment transactions, disposal of and impairment of investments, business combinations, fair value adjustments, amortisation and impairment thereof, net foreign exchange gains and losses, share in financial results of associates, as well as irregular non-recurring items that occur from time to time and are evaluated for adjustment as and when they occur. The tax effect of these adjustments is also excluded from management reporting.
The financial information of the key subsidiaries acquired during the reporting period or after the reporting period but prior to the date hereof is included into the segment disclosure starting from the beginning of the earliest comparative period included herein.
The financial information of subsidiaries disposed of and assets classified as held for sale prior to the date hereof is excluded from the segment presentation starting from the beginning of the earliest period presented.
Accordingly, segment reporting for the year ended December 31, 2018 and the respective comparative segment financial information has been retrospectively restated, as applicable, to include the finan-cial information of ZakaZaka, ESforce, Am.ru, UMA and to exclude Pandao, all starting from January 1, 2017.
We identify our operating segments based on the types of products and services we offer. We have identified the following reportable segments on this basis:
• Email, Portal and IM;• VK (Vkontakte);• Social Networks (ex VK);• Online Games; and• E-Commerce, Search and Other Services
The Email, Portal and IM segment includes email, instant messaging and portal (main page and verticals). It earns substantially all reve-nues from display and context advertising.

49Mail.ru Group Annual Report 2018
BU
SIN
ESS R
EV
IEW
The VK segment includes the Group's social network VKontakte (VK.com) and earns revenues from (i) online advertising, including display and context advertising, (ii) commission from application de-velopers based on the respective applications' revenue, and (iii) user payments for virtual gifts, stickers and other value-added services.
The Social Networks (excluding VK) segment includes the Group's two other social networks (OK and My World) and earns revenues from (i) user payments for virtual gifts, stickers and other value-add-ed services, (ii) commission from application developers based on the respective applications' revenue, and (iii) online advertising, including display and context advertising.
The Online Games segment includes online gaming services, including MMO, social and mobile games. It earns substantially all revenues from (i) sale of virtual in-game items to users, (ii) royalties for games licensed to third-party online game operators and (iii) in-game advertising.
The E-Commerce, Search and Other Services reportable segment represents separate operating segments aggregated in one report-able segment for presentation purposes only and primarily consists of search engine services earning substantially all revenues from context advertising, food delivery services earning substantially all revenue from restaurant's commission and our ESforce esports busi-ness earning substantially all revenues from sponsorship and other advertising. This segment also includes the Group’s Youla classifieds business earning substantially all revenues from advertising and listing fees, and a variety of other services, which are considered insignificant by the CODM for the purposes of performance review and resource allocation.
We measure the performance of our operating segments through a measure of earnings before interest, tax, depreciation and amorti-sation (EBITDA). Segment EBITDA is calculated as the respective segment’s revenue less operating expenses (excluding depreciation, amortisation and impairment of intangible assets), including our corporate expenses allocated to the respective segment.
Andrey Mareychev, Anastasia Fomina
Youla&Odnoklassniki Feature of the Year
Mail.ru People Awards

50Mail.ru Group Annual Report 2018
BU
SIN
ESS R
EV
IEW
EBITDA is not a measure of financial performance under IFRS. The calculation of EBITDA by us may be different from the calculations of similarly labeled measures used by other companies and it should therefore not be used to compare one company against another or as a substitute for analysis of our operating results as reported under IFRS.
EBITDA is not a direct measure of our liquidity, nor is it an alternative to cash flows from operating activities as a measure of liquidity, and it needs to be considered in the context of our financial commitments. EBITDA may not be indicative of our historical operating results, nor is it meant to be predictive of our potential future results. We believe that EBITDA provides useful information to the users of the consolidated financial statements because it is an indicator of the strength and per-formance of our ongoing business operations, including our ability to fund discretionary spending such as capital expenditure, acquisitions and other investments and our ability to incur and service debt.
Principal revenue drivers Organic growth in our revenue, including online advertising and IVAS, is primarily driven by the audience of our properties. Adver-tising revenues also depend on the pricing of our advertisements and availability and sell-through rates of our advertising inventory, while IVAS revenue is also driven by paying user engagement and average revenue per paying user (“ARPPU”).
Analysis of 2018 results compared with 2017 The discussion that follows is based on the analysis of segment and supporting management financial information according to the Group’s actual structure as of the date of this Annual Report. As discussed under “Basis of Preparation” above, this information differs in certain significant respects from information presented in accordance with IFRS.
RUR millions 2018 % of revenue 2017 restated**** % of revenue YoY, %
Group aggregate segment revenue (1)
Online advertising 31,853 42% 22,975 40% 38.6%
MMO games 23,290 31% 17,422 31% 33.7%
Community IVAS 15,005 20% 13,726 24% 9.3%
Other revenue** 5,112 7% 2,666 5% 91.7%
Total Group aggregate segment revenue 75,260 100% 56,789 100% 32.5%
Group aggregate operating expenses
Personnel expenses 15,379 20% 11,838 21% 29.9%
Office rent and maintenance 2,536 3% 2,257 4% 12.4%
Agent/partner fees 17,123 23% 9,865 17% 73.6%
Marketing expenses 12,844 17% 8,737 15% 47.0%
Server hosting expenses 1,955 3% 1,795 3% 8.9%
Professional services 546 1% 506 1% 7.9%
Other operating (income)/expenses, excluding amortisation and depreciation
2,656 4% 2,290 4% 16.0%
Total Group aggregate operating expenses 53,038 70% 37,288 66% 42.2%
Group aggregate segment EBITDA (2) 22,222 30% 19,501 34% 13.9%
margin, % 29.5% 34.3%
Depreciation and amortisation ***(3) 6,184 8% 3,678 6% 68.1%
Other non-operating income (expense), net 672 1% 539 1% 24.7%
Profit before tax (4) 16,710 22% 16,362 29% 2.1%
Income tax expense (5) 2,611 3% 3,111 5% -16.1%
Group aggregate net profit (6) 14,099 19% 13,251 23% 6.4%
margin, % 18.7% 23.3%
(*) The numbers in this table and further in the document may not exactly foot or cross-foot due to rounding.(**) Including Other IVAS revenues.(***) Including the impairment of Armored Warfare in the amount of RUR 1,698 million recognized in Q2 2018.(****) Certain amounts shown here do not correspond to the consolidated financial statements for the year ended December 31, 2018
and reflect full retrospective application of IFRS 15, refer to Note 2.3
Group aggregate segment financial information*

51Mail.ru Group Annual Report 2018
BU
SIN
ESS R
EV
IEW
Nadezhda Egorova, Alexander Kotlyarov, Valentin ChernavinVse Apteki Startup of the Year Mail.ru People Awards

52Mail.ru Group Annual Report 2018
BU
SIN
ESS R
EV
IEW
The income statement items for each segment for the year ended December 31, 2018, as presented to the CODM, are presented below:
The income statement items for each segment for the year ended December 31, 2017, as presented to the CODM, are presented below (all numbers include the effect of IFRS 15 adoption – please see Note 3.2 in the financial statement for details):
RUR millions
Email, Portal and
IM
Social Networks
(ex VK)Online Games VK
E-commerce, Search
and other Eliminations Group
Revenue
External revenue 5,684 16,456 24,743 18,380 9,997 - 75,260
Intersegment revenue 1 3 3 51 1,030 (1,088) -
Total revenue 5,685 16,459 24,746 18,431 11,027 (1,088) 75,260
Total operating expenses 3,748 6,944 20,481 7,706 15,247 (1,088) 53,038
EBITDA 1,937 9,515 4,265 10,725 (4,220) - 22,222
Net profit 14,099
RUR millions
Email, Portal and
IM
Social Networks
(ex VK)Online Games VK
E-commerce, Search
and other Eliminations Group
Revenue
External revenue 5,206 16,147 17,614 12,520 5,302 - 56,789
Intersegment revenue 3 33 - 156 586 (778) -
Total revenue 5,209 16,180 17,614 12,676 5,888 (778) 56,789
Total operating expenses 3,031 5,977 12,878 3,964 12,216 (778) 37,288
EBITDA 2,178 10,203 4,736 8,712 (6,328) - 19,501
Net profit 13,251
Online advertising Online advertising includes two major kinds of advertising technol-ogy: Display and Context. Display advertising revenue is generated from promo posts in social networks, video, banner and similar advertisements on our properties. Advertisements are sold either on the time that they last, or on the number of ad views. Our standard rates depend on a number of factors, including the property on which the advertisement appears, amount and the length of the con-tract, the season, and the advertisement’s format, size and position.
Context advertising revenue is earned with our myTarget technology, as well as through partnerships with third parties.
myTarget (formerly known as Target Mail.ru), is our proprietary self-service programmatic advertising technology, which sells the ad-vertisements through an online auction both on desktop and mobile using various pricing models. The technology is integrated in almost all advertising formats, so the advertiser can choose whether to pur-chase impressions via display ads based on fixed CPM or use online auction in myTarget programmatic system. The new improvements of the technology are new cross-device ad formats, integration of offline user experience and new targeting opportunities.
We generated revenue of RUR 31,853 million from online advertising in 2018 (2017: RUR 22,975 million). Our advertising revenue grew by 38.6%, ahead of the Russian online advertising market, even though we continued to invest in our new businesses and allocate part of our inventory to promote these new products, which had a limiting effect on inventory available for sale. The strong growth in our advertising revenues was driven by continued shift of adver-tising budgets to online from all other media and in online towards video, mobile and social networks in particular. In line with this trend, promo posts across our social networks and our native in-feed video formats were our fastest-growing advertising revenues. The growth of our advertising revenue was additionally supported by ongoing adtech development and launch of innovative ad products.
IVAS We generate a significant portion of our revenue from IVAS. This includes MMO games and Community IVAS.

Maxim Pchelin,Nina Guseva,Olga ZubovaGAMESTATInternal Solution of the Year Mail.ru People Awards
53Mail.ru Group Annual Report 2018
BU
SIN
ESS R
EV
IEW

54Mail.ru Group Annual Report 2018
BU
SIN
ESS R
EV
IEW
MMO games About a third of our total revenue is generated by MMO games, including client, browser and mobile titles. Players have the oppor-tunity to buy in-game enhancements for these free-to-play games; revenue is recognised net of any commissions of SMS operators, but gross of other revenue collection costs, including commissions paid to mobile app stores. In 2018, we generated revenues of RUR 23,290 million from MMO games (2017: RUR 17,422 million). The 33.7% increase in MMO revenues is primarily due to strong growth of Hustle Castle our most successful in-house developed game, as well as War Robots and Guild of Heroes.
In 2018 the average number of monthly MMO paying users in-creased, mainly as a result of organic growth in War Robots and Hustle Castle paying users, as well as new users of Guild of Heroes. MMO paying users data is presented in the chart below*:
MMO games, average monthly paying users, thsH2 '18
H1 '18
H2 '17
H1 '17
H2 '16
H1 '16
H2 '15
H1 '15
H2 '14
H1 '14
1,109
991
811
764
662
609
585
582
614
674
Source: Company dataFootnote: The numbers combine paying users of individual MMO and mobile games and may include overlap
Community IVAS Community IVAS revenue is driven by payments for features and virtual items sold primarily on our social networks. Such features and items include virtual gifts, stickers, premium music access and other paid features. Community IVAS revenue is also driven by revenues shared with application developers through our Application Pro-gramming Interface (“API”). A significant portion of these payments are paid via online payment systems.
The fees for such services are collected from customers using various payment channels, including bank cards, online payment systems and mobile operators and from the applications developers.
Aggregate segment Community IVAS revenue increased by 9.3% to RUR 15,005 million (2017: RUR 13,726 million), mostly driven by growth in music subscribers and by a 5% increase in Community IVAS ARPPU.
Costs and margins Our principal cost items include personnel expenses, office rent and maintenance expenses, agent/partner fees, marketing expenses, server hosting expenses, professional services and other operating expenses, excluding depreciation, amortisation and impairment.
Personnel expenses increased by 29.9% to RUR 15,379 million (2017: RUR 11,838 million), mainly driven by an increase in headcount, principally within our fast-growing O2O, clouds solutions and online games businesses.
While most of our office rent and maintenance expenses are de-nominated in USD but at a fixed rate to the RUR significantly below the actual exchange rate, those expenses increased by only 12.4% to RUR 2,536 million (2017: RUR 2,257 million), which was driven by additional office space rented as the headcount increased.
Agent/partner fees increased by 73.6% to RUR 17,123 million (2017: RUR 9,865 million). The increase in agent/partner fees was primarily driven by growth of revenue collection costs, development of our food delivery network, advertising commissions paid to group ad-ministrators in VKontakte and payments to music license owners.
Revenue collection costs represent fees to payment systems for processing payments for our games and Community IVAS. These costs also include the share of our mobile products’ revenue that we pay to mobile app stores (mainly Google Play and Apple’s App Store), as well as the share of our console gaming revenue paid to the respective console platforms (Sony’s PlayStation and Microsoft’s XBOX). The increase in revenue collection costs was mainly due to increased revenue from games, mostly mobile and console titles.
Advertising commissions represent arrangements where we share revenue from promotional posts on groups’ pages in VK with the respective groups’ administrators. The increase in commission is mainly due to the significant growth in related revenue in 2018.
Marketing expenses increased by 47.0% to RUR 12,844 million (2017: RUR 8,737 million), as we significantly stepped up the marketing effort to support the fast growth of our mobile games such as War Robots, Hustle Castle and Guild of Heroes, and as we invested behind our fast-growing e-commerce products, including Youla and Delivery Club.
Other operating expenses, excluding depreciation, amortisation and impairment, increased by 16.0% to RUR 2,656 million (2017: RUR 2,290 million), primarily due to expensed VAT increase, mostly driv-en by growth in CAPEX, marketing and business trip expenses.
In total, our aggregate segment operating expenses (excluding de-preciation, amortisation and impairment) increased by 42.2% to RUR 53,038 million (2017: RUR 37,288 million). As a result, our aggregate segment EBITDA increased by 13.9% to RUR 22,222 million (2017: RUR 19,501 million) and EBITDA margin decreased to 29.5% in 2018 (2017: 34,3%).
Depreciation, amortisation and impairment, other non-operating income, income tax and net income Depreciation, amortisation and impairment increased by 68.1% to RUR 6,184 million (2017: RUR 3,678 million) primarily as result of Armored Warfare impairment recognized in the amount of RUR 1,698 million (see also Note 7 to our consolidated financial statements).
Profit before income tax and net profit Profit before income tax expense increased by 2.1% to RUR 16,710 million (2017: RUR 16,362 million) as a result of the 32.5% increase of revenues offset by a 42.2% increase in expenses.
While profit before tax increased by 2.1%, income tax expense decreased by 16.1% to RUR 2,611 million (2017: RUR 3,111 million). This was primarily driven by the significant investment in our fast-growing O2O businesses being deductible at a higher applicable tax rate compared to our overall average effective tax rate.

Sergey Stavsky,Egor Danilov, Jekaterina Zaiceva Odnoklassniki Release of the Year Mail.ru People Awards
55Mail.ru Group Annual Report 2018
BU
SIN
ESS R
EV
IEW

56Mail.ru Group Annual Report 2018
BU
SIN
ESS R
EV
IEW
Group aggregate net profit increased by 6.4% to RUR 14,099 million (2017: RUR 13,251 million) as result of increased profit before tax and decreased income tax expense.
Consolidated results of operations in accordance with IFRS The following tables summarises the principal line items from our consolidated income statements under IFRS:
RUR millions 2018 2017Restated (Note 11)*
Total revenue 66,105 50,055
Other operating gain 565
Net gain/(loss) on venture capital investments 26 (27)
Total operating expenses (62,581) (37,620)
EBITDA 3,550 12,973
(Loss)/profit before income tax expense (7,517) 4,956
Income tax expense (546) (2,675)
Net (loss)/profit (8,063) 2,281
Attributable to:
Equity holders of the parent (7,991) 2,261
Non-controlling interest (72) 20
Our consolidated revenue increased by 32.1% to RUR 66,105 million (2017: RUR 50,055 million) in 2018 mostly due to organic growth. The primary drivers of the organic revenue growth are described under “Operating segments performance” above.
EBITDA under IFRS decreased by 72.6% to RUR 3,550 million (2017: RUR 12,973 million) and EBTDA margin decreased to 5.4% (2017: 25.9%) as a result of operating expenses (excluding depreciation, amortization and impairment) growing at a faster pace than reve-nues.
Operating expenses grew by 66.4% to RUR 62,581 million, or 94.6% of revenue (2017: RUR 37,620 million, or 75.2% of revenue).
The growth in operating expenses was primarily driven by a RUR 9,550 million increase in Personnel expenses, by a RUR 7,002 million increase in Agent/partner fees and by a RUR 6,946 million increase in Marketing expenses. Other than organic growth, the increase in Personnel expenses was mostly driven by a RUR 4,257 million increase in share-based payment expense, mainly due to the
acceleration of certain RSUs triggered by a change of control. The remaining key drivers and components of the growth in Personnel expenses, Agent/partner fees and Marketing expenses were mostly organic and are discussed in detail under “Operating segments performance” above.
Our loss before income tax expense under IFRS was RUR 7,517 million (2017: RUR 4,956 million profit) primarily due to an increase in amortisation of intangible assets, and a decrease in EBITDA as discussed above.
Our net loss under IFRS was RUR 8,063 million (2017: RUR 2,281 million profit), a combination of loss before tax and income tax expense.
The income tax expense under IFRS decreased to RUR 546 million (2017: RUR 2,675 million) mostly due to an increase in the effects of non-deductible expenses to RUR 1,723 million (2017: RUR 335 million) and unrecognized deferred tax assets RUR 618 million (2017: nil).
(*)Certain amounts shown here do not correspond to the consolidated financial statements for the year ended December 31, 2018 and reflect full retrospective application of IFRS 15, refer to Note 2.3

57Mail.ru Group Annual Report 2018
BU
SIN
ESS R
EV
IEW
Daria Tkachenko,Alexander Kruptsov, Julia Novikova Mall.my.comTeam of the Year Mail.ru People Awards

58Mail.ru Group Annual Report 2018
BU
SIN
ESS R
EV
IEW
The majority of our taxable profits as well as income tax expenses in 2018 and 2017 are generated in Russia. Pre-tax gains and losses in other jurisdictions mostly relate to share-based payment expenses, fair value revaluation, foreign exchange gains and losses, and other similar items which are generally non-taxable (non-deductible) in
RUR millions 2018 2017
Group aggregate segment revenuee, as presented to the CODM 75,260 56,789
Adjustments to reconcile revenue as presented to the CODM to consolidated revenue under IFRS:
Effect of difference in dates of acquisition,loss of control in subsidiaries and assets held for sale
(1,104) (1,007)
Differences in timing of revenue recognition (8,154) (5,181)
Barter revenue 74 10
Dividend revenue from venture capital investments 29 9
Difference in classification of revenue – (565)
Consolidated revenue under IFRS 66,105 50,055
Group aggregate segment EBITDA, as presented to the CODM 22,222 19,501
Adjustments to reconcile EBITDA as presented to the CODM to consolidated profit/(loss) before income tax expenses under IFRS: Effect of difference in dates of acquisition, loss of control in subsidiaries and assets held for sale (4,498) 1,051
Differences in timing of revenue recognition (7,464) (5,070)
Net gain/(loss) on venture capital investments 26 (27)
Share-based payment transactions (6,732) (2,475)
Other (4) (7)
EBITDA 3,550 12,973
Depreciation and amortisation (9,665) (8,931)
Impairment of intangible assets (1,711) –
Share of (loss)/profit of equity accounted associates (497) 15
Finance income 545 511
Finance expenses (17) (15)
Other non-operating loss (12) (21)
Net loss on derivative financial assets and liabilities at fair value through profit or loss (516) (30)
Impairment losses related to equity accounted associates (37) (273)
Net gain/(loss) on disposal of shares in subsidiaries 47 (15)
Net foreign exchange gain 796 742
Consolidated (loss)/profit before income tax expense under IFRS (7,517) 4,956
those jurisdictions. These items affect pre-tax profit, but do not have an influence on income tax expense, which has an effect on the blended tax rate.
A detailed reconciliation of our management reporting to IFRS is presented in the tables below.
Reconciliation of Management reporting to IFRS

59Mail.ru Group Annual Report 2018
BU
SIN
ESS R
EV
IEW
RUR millions 2018 2017
Group aggregate segment net profit, as presented to the CODM Adjustments to reconcile net profit as presented to the CODM to consolidated net profit/(loss) under IFRS:
14,099 13,251
Share-based payment transactions (6,732) (2,475)
Differences in timing of revenue recognition (7,464) (5,070)
Effect of difference in dates of acquisition, loss of control in subsidiaries and assets held for sale
(4,544) 993
Amortisation of fair value adjustments to intangible assets (5,174) (5,344)
Net loss on financial instruments at fair value through profit or loss (490) (57)
Net gain/(loss) on disposal of shares in subsidiaries 47 (15)
Net foreign exchange gain 796 742
Share of (loss)/profit of equity accounted associates (497) 15
Impairment losses related to equity accounted associates (37) (273)
Other (71) (15)
Tax effect of the adjustments and tax on unremitted earnings 2,004 529
Consolidated net (loss)/profit under IFRS (8,063) 2,281
Semi-annual analysis
RUR millions
2018 2017
H1 2018% of
revenue H2 2018% of
revenue H1 2017% of
revenue H2 2017% of
revenue
Group aggregate segment revenue
Online advertising 13,860 41.3% 17,993 43.2% 9,980 38.4% 12,995 42.2%
MMO games 10,445 31.1% 12,845 30.8% 7,834 30.1% 9,588 31.2%
Community IVAS 7,097 21.1% 7,908 19.0% 7,011 27.0% 6,715 21.8%
Other revenue* 2,174 6.5% 2,938 7.1% 1,195 4.6% 1,471 4.8%
Total Group aggregate segment revenue
33,577 41,683 26,020 30,769
Group aggregate segment EBITDA
7,652 22.8% 14,570 35.0% 9,218 35.4% 10,282 33.4%
Group aggregate net profit 3,039 9.1% 11,060 26.5% 6,230 23.9% 7,021 22.8%
*Other revenue includes Other IVAS
The table above represents our segment semi-annual results with a percentage of revenue for the four consecutive half-years ended December 31, 2018.
The majority of our revenues are affected by seasonality and as a result, revenues and operating profits are generally higher in the second half of the year than in the first six months:
• Advertising revenues are generally higher in the second half of each year since significant amounts of advertising budgets are typically spent in the last quarters of the year.
• MMO games revenues are generally higher during the second half of the year due to the end of the vacation period because users tend to play our MMO games more when not on vacation.
• Community IVAS revenues are generally higher ahead of, during and immediately after holiday and festivity periods.
In addition to seasonal fluctuations our semi-annual H2 2018 results were driven by strong growth in revenue from targeted advertising, music subscriptions and mobile games.
Most of the revenue growth in H2 2018 was concentrated in online advertising (38.5% vs H2 2017) and MMO games (34.0% vs H2 2017).
The growth in online advertising was primarily driven by myTarget on mobile and desktop applications. The growth in MMO games was mostly driven by mobile games such as Guild of Heroes, Left to Survive, Hustle Castle and other.
Aggregate segment EBITDA increased by 41.7% in H2 2018 vs H2 2017 due to revenue growth and operating leverage (i.e. expenses growing slower than revenues). Marketing expenses increased

60Mail.ru Group Annual Report 2018
BU
SIN
ESS R
EV
IEW
Stanislav Sychenkov, Timur Voloshin,Kamil NasroullaevmyTarget Advertising Network Team of the YearMail.ru People Awards

61Mail.ru Group Annual Report 2018
BU
SIN
ESS R
EV
IEW
significantly in H2 2018 due to the marketing support of our mobile games such as Hustle Castle, Guild of Heroes and continued invest-ment in the promotion of our fast-growing e-commerce products (including Youla, Delivery Club), but the growth rate slowed down to 26% compared to 72% in H1 2018 due to higher base effect, as the marketing of our fast-growing products was significantly ramped up in H2 2017. In line with the strong growth in revenue from mobile games, food delivery, VK ad network for groups and esport tour-naments, Agent/partner fees increased 65% in H2 2018, including respective growth in revenue collection costs, development of our food delivery network, advertising commissions paid to group ad-ministrators in VK and ESforce tournament organization.
Financial position Liquidity and capital resources As of 31 December 2018, the Group had RUR 11,723 million of cash and no debt outstanding. Our financial position remains stable due to stability in cash flows.
We have historically principally relied on our own cash flow as a source of financing our operations and capital expenditures. Consol-idated operations have been cash flow positive since 2009. In 2018, net cash provided by operating activities before interest and income tax decreased by 32.0% to RUR 14,887 million (2017: RUR 21,917 million). Net cash provided by operating activities before interest and income tax declined following a decrease in IFRS EBITDA (excluding the effect of share-based payment expense, which represents the most significant non-cash IFRS adjustments to EBITDA).
The ratio of net cash provided by operating activities to consolidated revenues decreased to 18.9% in 2018 (2017: 38.6%), in line with the IFRS EBITDA decrease as discussed above.
Capital expenditure to acquire property and equipment and intan-gible assets increased by 51.7% to RUR 6,648 million, driven by a 70.9% increase in fixed asset expenditure, mostly consisting of in-vestment in servers and infrastructure of our social networks mainly in order to comply with the recent changes in Russian legislation
regarding the storage of Internet traffic (Yarovaya package) and was otherwise in line with the organic growth of the business.
Net cash used in investing activities in 2018 also included a net RUR 8,031 million paid mainly for the 2018 acquisitions of ESforce, 33 Slona and Inshopper acquired in 2018.
In March 2019 we borrowed RUR 8,500 million from Raiffeisenbank to finance our investment transactions, including deferred con-sideration for ESforce and the acquisition of UMA. We may attract additional bank borrowing to finance our further investments and joint ventures.
Terms for RSU Plan On November 23, 2017, the Remuneration Committee of the Board of Directors of the Company approved New Terms for 2015 Restricted Stock Unit Plan (the “2017 RSU Plan”) setting out that RSUs vesting shall generally be conditional on meeting of certain performance KPIs. Please refer to Note 24 to our Consolidated Financial state-ments for further details.
In December 2018, an additional extension of the 2017 RSU Plan for 2,000,000 units and acquisition of required number of GDRs on the market were approved.

SHAREHOLDERS* ECONOMIC INTERESTSHAREHOLDERS` ECONOMIC INTEREST
MANAGEMENT
10.0%MegaFon
5.2%MF Technologies
27.6%Naspers
7.4%Tencent49.8%
Others incl.holders of GDRs

63Mail.ru Group Annual Report 2018
MA
NA
GEM
ENT
Management
Board of DirectorsDmitry Grishin, age 40Co-Founder and Chairman of the Board
Dmitry Grishin was appointed Chairman of the Board in March 2012. He co-founded Mail.ru Group in 2005 and served as Chief Executive Officer (Russia) from November 2010 to October 2016. Dmitry joined Mail.ru in 2000 and was promoted to Technical Director in 2001. From 2003 to 2010, he led the business as CEO. Dmitry graduated from the Faculty of Robotics and Complex Automation at Moscow State Technical University and in 2012 founded Grishin Robotics, a global investment company that is dedicated to supporting personal robotics around the world.
Charles St. Leger Searle, age 55Director
Charles Searle is currently Chief Executive Officer of Naspers Inter-net Listed Assets. He serves on the boards of a number of compa-nies associated with the Naspers Group, including Tencent Holdings Ltd and MakeMyTrip Limited. Prior to joining the Naspers Group, he held positions at Cable & Wireless plc and at Deloitte & Touche in London and Sydney. Mr. Searle is a graduate of the University of Cape Town and a member of the Institute of Chartered Accountants in Australia and New Zealand. Mr. Searle has more than 25 years of international corporate development experience in the telecommuni-cations and internet industries.
Vasileios Sgourdos, age 49Director
Vasileios Sgourdos was appointed to the Board in October 2010. A chartered accountant, he became Group Chief Financial Officer for MIH which owns South African listed Naspers’ Internet and Pay TV businesses in January 2009. On April 1, 2014 he was appointed as Naspers’ Group Chief Financial Officer. He was formerly director of Abril SA, Latin America’s leading magazine publisher and serves on the Board of a number of other companies in the Naspers Group. From 2007 he was General Manager for Business Development Pay Television and from 1997 to 2007, was CFO at Thai listed pay TV operator UBC. He graduated with a Bachelor of Commerce degree from the University of Witwatersrand, South Africa, and is an Hon-ours Bachelor in Accounting Science from the University of South Africa. He is a registered member of the South African Institute of Chartered Accountants.
Mark Remon Sorour, age 57Director
Mark Sorour was appointed to the Board in August 2010. As a qual-ified chartered accountant he transitioned from investment banking to join the Naspers Group in 1994 where he went on to become the Chief Investment Officer from 2002 to his retirement in 2018. During this time he led and held worldwide responsibility for the Naspers Group’s M&A, corporate finance and capital-market fundraising activ-ities. Mark’s 25 years of experience in internet, technology and video entertainment businesses include business development and deal making in Africa, the Middle East, Thailand, India, China, Europe, the USA, Latin America and South-East Asia. He currently serves as a non - executive director on the Naspers’ Board.
Jan Buné, age 66Independent Director
Jan Buné was appointed as Independent Director and Member of the Board in October 2013. In October 2014 he became Chairman of the Audit Committee. He has extensive experience in public accounting in both the technology, media & telecommunications and the financial services sector. He was a senior audit partner at Deloitte Netherlands until May 2013. Currently, he has a number of non-executive positions. He serves as Commissioner at the Media Supervisory Authority in the Netherlands. He is Chairman of the Au-dit Committee of the Supervisory Board at Citco Bank Netherlands. He is also independent Chairman of the Risk Advisory Committee at Naspers’ PayU internet payments. He has gained extensive knowl-edge on corporate governance, risk management and regulatory compliance. He has a qualification as Certified Board Member (CBM) in the Netherlands.
Sang Hun Kim, age 55Independent Director
Sang Hun Kim was appointed to the Board in February 2011. He was CEO of South Korea’s largest internet company, NAVER Corp, from April 2009 until March 2017, when he stepped down as CEO to be-come a senior advisor to the company. Since 2017 he has served as a non-executive director on the board of Woowa Brothers Company (Korean food delivery service operator). He has served as President of the Korean Internet Companies Association for 6 years and has contributed to the development of the internet industry in Korea. Sang Hun graduated from Seoul National University and received an LL.M. degree from Harvard Law School. He is admitted to both the Korean Bar Association and the New York Bar Association. He had served as a judge in the Seoul District Court and was General Counsel at LG Corp before joining NAVER Corp.
64Mail.ru Group Annual Report 2018
MA
NA
GEM
ENT
Alan Vaksman, age 41Director
Alan Vaksman was appointed to the Board in October 2018. In 2010 he joined the Board of Gazprombank as its Chief Risk Officer and in 2012 he became the Deputy Chairman of the Board. Currently, he is an independent strategic advisor, on all digital and technology investments, to the Chairman of the Board of Gazprombank group. Also he is the Chairman of the Boards of SpeechPro, Gazprombank Switzerland and Digital Horizon (early stage VC).
Prior to the above positions, Alan Vaksman was employed by inter-national banks and leading consulting companies in the Republic of South Africa, the United Kingdom and the Russian Federation and was a partner at PricewaterhouseCoopers, leading their Capital Markets and Risk Management division for Central and Eastern Eu-rope. He was awarded a Bachelor of Economic Science degree and a Bachelor of Laws degree from the University of the Witwatersrand (SA). Also he holds an MBA from NYU Stern School of Business (USA).
Sergey Mednov, age 52Director
Sergey Mednov was appointed to the Board in October 2018. The same year he also became the Senior Vice President of Gazprombank, where he is responsible for development of digital products and card processing. From 2000 till 2017 he served as a member of Executive Board at Alfa-Bank, Bank of Moscow and Bank Otkritie, where he was responsible for IT and digital divisions. He studied CAD in Moscow Aviation Institute, banking and finance in the Russian University of Economy. In 1997 he got the MBA degree in London Guildhall University. Also he graduated from business schools INSEAD (France) and Berkeley (USA)
Dmitry Sergeev, age 43Director
Dmitry Sergeev was appointed to the Board in October 2018. He is the Deputy CEO (Russia) of Mail.ru Group. He joined the Group in September 2014 when the Group fully consolidated VK and was appointed Deputy Chief Executive Officer (Russia) in October 2014. In VK Dmitry has been Chief Operating Officer since January 2014. Dmitry graduated from the Moscow State Institute of International Relations in 1998 with a law degree. He worked at several invest-ment companies, then at Alfa-Bank. From 2002 he was COO of Regional Media Group working on consolidation of media assets (TV, radio). From 2005 to 2006 Dmitry was a corporate director at TV-3 television network. In 2007 he was appointed COO of Media One Group, in 2009-2010 and 2011 he held positions of COO and CEO of UTH Holding respectively (Russian TV channels U Channel, Disney Channel Russia, a JV with The Walt Disney Company, and MUZ-TV). From 2012 to 2013 Dmitry was the President of Kommersant Publish-ing House, a major Russian business media including print, radio and digital media assets.
Vladimir Gabrielyan, age 36Director
Vladimir Gabrielyan began his career in IT as a system administrator at Russia Telecom. He later launched his own project Web-Hosting.ru. Vladimir joined Mail.ru Group in 2001 as a system administrator. He then moved on to head the development and technical support of one of the Group’s largest assets – the Mail.ru email service. Vladimir Gabrielyan has been Mail.ru’s Vice-President and CTO since 2005. For 13 years Vladimir runs a number of major projects and departments, leading all major technological initiatives. Vladimir is an established expert in machine learning and big data.

65Mail.ru Group Annual Report 2018
MA
NA
GEM
ENT
Senior managementMatthew Hammond, age 44Managing Director, Chief Financial Officer
Matthew Hammond was appointed to the Board in May 2010 and became Managing Director in April 2011. In June 2013 Matthew also became Chief Financial Officer. Matthew graduated from Bristol Uni-versity, UK, in 1996, with a degree in Economics and History. From 1997 to 2008, he was a technology analyst at Credit Suisse and was ranked number 1 in the Extell and Institutional Investor Survey eight times. Between 2008-2010 Matthew was Group Strategist at Metal-loinvest Holdings dealing with non-core investments. Matthew is a non-executive director of Strike Resources and Puricore.
Boris Dobrodeev, age 35Chief Executive Officer (Russia)
Boris Dobrodeev was appointed to the Board in February 2016 and became Chief Executive Officer (Russia) in October 2016. From 2014 to 2016 Boris held positions of Mail.ru Group’s Director for Strategy & Development and VKontakte’s CEO and from 2013 to 2014 he was Deputy CEO of VKontakte. Boris graduated from Moscow State University, Russia, in 2007, with a degree in History, and holds the Master in International Business Degree obtained from Moscow State University Business School in 2009. Boris worked as Analyst in Metalloinvest from 2006 to 2009, and occupied the position of a Business Development Director at an online video company Zoom-by.ru in 2009-2011. From 2011 to 2012 Boris worked as an Investment Analyst in DST Advisors and from 2012 to 2014 as the Head of the Internet Asset Management Department at USM Advisors.
Dmitry Sergeev, age 43Deputy Chief Executive Officer (Russia)
Dmitry Sergeev joined Mail.ru Group in September 2014 when the Group fully consolidated VK and was appointed Deputy Chief Executive Officer (Russia) in October 2014. In VK Dmitry has been Chief Operating Officer since January 2014. Dmitry graduated from the Moscow State Institute of International Relations in 1998 with a law degree. He worked at several investment companies, then at Alfa-Bank. From 2002 he was COO of Regional Media Group work-ing on consolidation of media assets (TV, radio). From 2005 to 2006 Dmitry was a corporate director at TV-3 television network. In 2007 he was appointed COO of Media One Group, in 2009-2010 and 2011 he held positions of COO and CEO of UTH Holding respectively (Russian TV channels U Channel, Disney Channel Russia, a JV with The Walt Disney Company, and MUZ-TV). From 2012 to 2013 Dmitry was the President of Kommersant Publishing House, a major Russian business media including print, radio and digital media assets.
Vladimir Nikolsky, age 46Chief Operating Officer (Russia)
Vladimir Nikolsky joined Mail.ru Group as Vice President of Online Games business in 2009 and became Chief Operating Officer (Rus-sia) in 2013. He was previously CEO of online game holding Astrum Online Entertainment (from 2007 to 2009) which subsequently became a part of Mail.ru Group, and co-founder and CEO of online game company IT Territory (from 2004 to 2007). Vladimir graduated from Ivanovo State Power Engineering University.
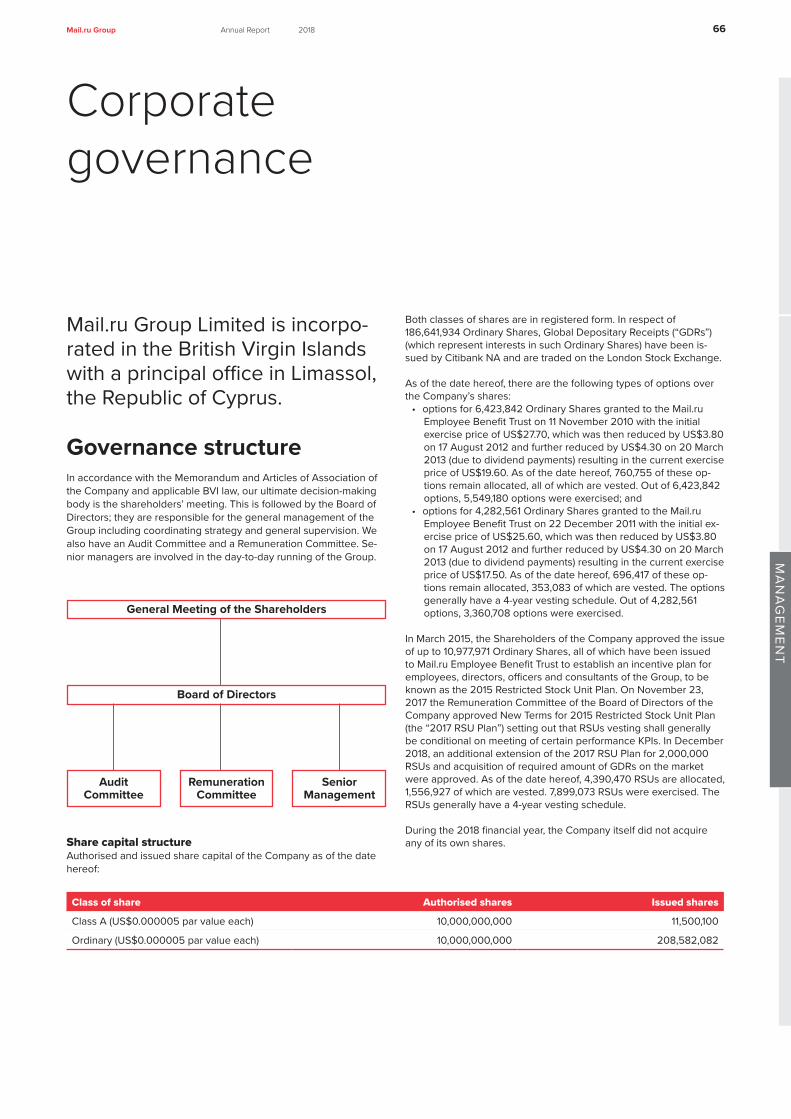
66Mail.ru Group Annual Report 2018
MA
NA
GEM
ENT
Corporate governance
Mail.ru Group Limited is incorpo-rated in the British Virgin Islands with a principal office in Limassol, the Republic of Cyprus.
Governance structure In accordance with the Memorandum and Articles of Association of the Company and applicable BVI law, our ultimate decision-making body is the shareholders’ meeting. This is followed by the Board of Directors; they are responsible for the general management of the Group including coordinating strategy and general supervision. We also have an Audit Committee and a Remuneration Committee. Se-nior managers are involved in the day-to-day running of the Group.
Share capital structureAuthorised and issued share capital of the Company as of the date hereof:
Both classes of shares are in registered form. In respect of 186,641,934 Ordinary Shares, Global Depositary Receipts (“GDRs”) (which represent interests in such Ordinary Shares) have been is-sued by Citibank NA and are traded on the London Stock Exchange.
As of the date hereof, there are the following types of options over the Company’s shares:
• options for 6,423,842 Ordinary Shares granted to the Mail.ru Employee Benefit Trust on 11 November 2010 with the initial exercise price of US$27.70, which was then reduced by US$3.80 on 17 August 2012 and further reduced by US$4.30 on 20 March 2013 (due to dividend payments) resulting in the current exercise price of US$19.60. As of the date hereof, 760,755 of these op-tions remain allocated, all of which are vested. Out of 6,423,842 options, 5,549,180 options were exercised; and
• options for 4,282,561 Ordinary Shares granted to the Mail.ru Employee Benefit Trust on 22 December 2011 with the initial ex-ercise price of US$25.60, which was then reduced by US$3.80 on 17 August 2012 and further reduced by US$4.30 on 20 March 2013 (due to dividend payments) resulting in the current exercise price of US$17.50. As of the date hereof, 696,417 of these op-tions remain allocated, 353,083 of which are vested. The options generally have a 4-year vesting schedule. Out of 4,282,561 options, 3,360,708 options were exercised.
In March 2015, the Shareholders of the Company approved the issue of up to 10,977,971 Ordinary Shares, all of which have been issued to Mail.ru Employee Benefit Trust to establish an incentive plan for employees, directors, officers and consultants of the Group, to be known as the 2015 Restricted Stock Unit Plan. On November 23, 2017 the Remuneration Committee of the Board of Directors of the Company approved New Terms for 2015 Restricted Stock Unit Plan (the “2017 RSU Plan”) setting out that RSUs vesting shall generally be conditional on meeting of certain performance KPIs. In December 2018, an additional extension of the 2017 RSU Plan for 2,000,000 RSUs and acquisition of required amount of GDRs on the market were approved. As of the date hereof, 4,390,470 RSUs are allocated, 1,556,927 of which are vested. 7,899,073 RSUs were exercised. The RSUs generally have a 4-year vesting schedule.
During the 2018 financial year, the Company itself did not acquire any of its own shares.
Class of share Authorised shares Issued shares
Class A (US$0.000005 par value each) 10,000,000,000 11,500,100
Ordinary (US$0.000005 par value each) 10,000,000,000 208,582,082
Audit Committee
Remuneration Committee
Senior Management
General Meeting of the Shareholders
Board of Directors

67Annual Report 2018
MA
NA
GEM
ENT
Mail.ru Group
At the beginning of 2019 the Group announced that in order to meet its ongoing commitments the Mail.ru Employee Benefit Trust would acquire on the market up to 1.8mln GDRs over the next 18 months. As of the date hereof, 332,998 GDRs were acquired at an average price of US$24.58 per GDR for the total amount of US$8.2mln.
Annual General Meeting (“AGM”) of shareholders The shareholders’ meeting is the Company’s supreme governing body. AGMs are convened by the Board of Directors or by a written request of shareholders who hold, in aggregate, 30% or more of the outstanding votes in the Company.
The share capital of the Company is divided into two classes of shares: Class A Shares and Ordinary Shares. Class A Shares each carry 25 votes at shareholders’ meetings while Ordinary Shares carry 1 vote per share.
The agenda for the shareholders’ meetings is determined by the Board of Directors. However, a shareholder or shareholders who hold, in aggregate, 10% or more of the outstanding voting shares of the Company may add items to the agenda in compliance with the following requirements:
I) no later than a week before the meeting;
II) at the meeting itself, with the consent of shareholders who hold, in aggregate, more than 50% of outstanding voting shares of the Company.
Transfer and conversion of shares Ordinary Shares are freely transferable. Class A shares are freely transferable save that a transfer of Class A Shares that would result in the proposed acquirer (other than a person who was already a member on 27 August 2010) and persons acting in concert with the acquirer holding 75% or more of the voting rights of the Company is subject to meeting mandatory offer requirements set out in the Articles.
At the request of any member holding any Class A shares, Class A shares, which are the subject of the request, are automatically con-verted into Ordinary shares. This is on the basis that each Class A Share automatically converts into one Ordinary Share and ranks pari passu in all respects with the existing Ordinary Shares in issue.
Yuriy Boldov,HRMentor of the YearMail.ru People Awards

68Mail.ru Group Annual Report 2018
MA
NA
GEM
ENT
Shareholders’ voting interest, %
Shareholders’ economic interest, %
27.6
49.8
10.0
4.5
3.3
58.4
21.5
12.3
5.2
7.4
* incl. 1% of economic interest held by Dmitry Grishin
as of the date hereof
as of the date hereof
Voting rights
• Each Class A Share has the right to 25 votes at a meeting of the shareholders of the Company or on any resolution of the share-holders of the Company.
• Each Ordinary Share has the right to 1 vote at a meeting of the shareholders of the Company or on any resolution of the share-holders of the Company.
Board of Directors The Board of Directors is responsible for the general management of the Group. This includes the co-ordination of strategy and general supervision.
The Memorandum and Articles of Association specify that there shall be ten Directors – eight of whom shall be nominated and elected by shareholders (the “Elected Directors”) and two of whom shall be independent directors (the “Independent Directors”).
The Elected Directors are appointed by a vote of the members, with each proposed candidate being put to the members for a vote, with voting on each candidate being treated as a separate vote and with each member being entitled to vote on each proposed candidate (to the effect that the eight candidates who attract the highest number of votes shall be elected as the eight Elected Directors) for a period from the date of their appointment until the second AGM after that date. On expiry of their term, Elected Directors must resign, but are eligible for re-election.
Any shareholder, or group of shareholders, who hold, in aggregate, not less than 5% of (a) the total number of votes attached to the is-sued shares; or (b) the total number of the issued shares, are entitled to nominate candidates for election by the shareholders as Elected Directors to the Board of Directors. Such nomination must be made not less than 21 days before any AGM at which any Elected Director is due to resign.
The two Independent Directors are nominated by the Board of Directors and appointed by a resolution of the Board of Directors. Independent Directors serve for the period fixed in their terms of appointment, as specified by the Board.
The Board of Directors elects one of its members to act as the Chair-man of the Board.
Powers of the Board of Directors The Board of Directors is granted the authority to manage the busi-ness affairs of the Group. They have the authority to make decisions relating to, among other things, the following:
• The right to issue shares and other securities (except as other-wise required by the Company’s Memorandum and Articles of Association).
• The approval of the annual budget and annual financial state-ments of the Group.
• The declaration of any dividend.• The convening of any shareholders’ meeting.• The appointment of the Group’s auditors.• The appointment of any committee of the Board of Directors,
including the Company’s Audit Committee and Remuneration Committee (see below).
• The exercise of all rights of the Company in relation to ICQ LLC.• The approval of any proposal under which the Company or any
MegaFonMF TechnologiesNaspersTencentOthers incl. holders of GDRs*
MegaFonMF TechnologiesNaspersTencentOthers incl. holders of GDRs

69Mail.ru Group Annual Report 2018
MA
NA
GEM
ENT
of its subsidiaries delegates any substantial management author-ity to any other entity.
• The approval of transactions which are not Substantial Transac-tions (as defined in the Memorandum and Articles of Association)
• The appointment and removal of any Officer of the Company, or any Officers or Directors of any direct subsidiary of the Company (including, but not limited to the Managing Director (being the chief executive officer of the Group), Chief Financial Officer or Chief Operating Officer) and the determination of the scope of authority of such Officers of the Group.
The Board of Directors, or any committees thereof, meet when and how the Directors determine to be necessary or desirable. Meetings are held in the Company’s principal office or wherever the majority of the Directors agree.
A resolution at a duly constituted meeting of the Board of Directors or of a committee of Directors is approved by a simple majority vote of the Directors. A resolution consented to in writing is approved by an absolute majority of all the Directors. For the purposes of es-tablishing a majority, the Chairman of the Board (or chairman of the meeting as the case may be) has a casting vote in the event of a tie.
Name Position Date of appointment Expiry of term
Dmitry Grishin Chairman June 2, 2017 2019 AGM
Alan Vaksman Elected Director October 19, 2018 2019 AGM
Sergey Mednov Elected Director October 19, 2018 2019 AGM
Dmitry Sergeev Elected Director October 19, 2018 2019 AGM
Charles Searle Elected Director June 2, 2017 2019 AGM
Mark Remon Sorour Elected Director June 2, 2017 2019 AGM
Vladimir Gabrielyan Elected Director December 21, 2018 2019 AGM
Vasileios Sgourdos Elected Director June 2, 2017 2019 AGM
Jan Buné Independent Director June 2, 2017 2019 AGM
Sang Hun Kim Independent Director June 2, 2017 2019 AGM
Senior managementThe senior management is involved in the day-to-day management of the Group.
Name Position Appointment
Matthew Hammond Managing Director; Chief Financial Officer
April 2011 June 2013
Boris Dobrodeev Chief Executive Officer, Russia October 2016
Dmitry Sergeev Deputy Chief Executive Officer, Russia October 2014
Vladimir Nikolsky Chief Operating Officer, Russia June 2013

70Mail.ru Group Annual Report 2018
MA
NA
GEM
ENT
Committees of the Board of Directors Mail.ru Group Limited has an Audit Committee and a Remuner-ation Committee.
Audit Committee The Audit Committee is appointed by the Company’s Board of Directors and meets on a regular basis, but not less than four times a year.
The purpose of the Audit Committee is to assist the Company’s Board of Directors in fulfilling its responsibilities in respect of:
• the quality and integrity of the Group’s integrated reporting including its financial statements;
• the Group’s compliance with key applicable legal and regu-latory requirements as relating to financial reporting;
• the quality and independence of the Group’s external auditors;
• the performance of the Group’s internal audit function and the external auditors;
• the adequacy and effectiveness of internal control mea-sures, accounting practices, risk management, information systems and audit procedures; and
• monitoring compliance with the Company’s code of ethics.
Alexander ChernyyPandaoMentor of the YearMail.ru People Awards

71Mail.ru Group Annual Report 2018
MA
NA
GEM
ENT
The Audit Committee is responsible, among other things, for: • reviewing annual financial statements and interim financial
results;• regular internal reports to management prepared by the internal
audit department and management’s response;• external auditors’ reports – including the receipt and review of
reports, which furnish, in a timely fashion, information relating to various accounting matters – and matters relating to internal controls if applicable;
• annually reviewing and reporting on the quality and effective-ness of the audit process; assessing the external auditors’ inde-pendence, deducing whether they have performed the audit as planned and establishing the reasons for any changes; obtaining feedback about the conduct of the audit from key members of the Group’s management, including the CFO;
• reviewing the performance of the external auditors and evaluat-ing the lead partner and discharging and replacing, in consul-tation with the Board, the external auditor or lead audit partner when circumstances warrant;
• presenting the Committee’s conclusions in respect of the exter-nal auditors to the Board;
• evaluating and providing commentary on the external auditors’ audit plans and scope of findings, identifying issues and reports, and approving non-audit services performed by the external auditor.
Members of the Committee Jan Buné, ChairmanSang Hun KimVasileios Sgourdos
Remuneration CommitteeThe Remuneration Committee is responsible for approving the terms of appointment and remuneration of the Group’s senior managers as well as for the approval of options or RSUs to be granted under the incentive plans.
The Remuneration Committee meets on as and when appropriate basis.
Members of the Committee Dmitry Grishin, ChairmanCharles SearleSang Hun KimAlan Vaksman
Internal control system in relation to the financial reporting processInternal control is exercised by the Board of Directors, executive bodies, officers and operational management of the Group. Their aim is to secure the achievement of goals set by the Company in the following areas:
• efficiency and effectiveness of business activity of the Group;• reliability and credibility of the Group’s reporting; and• compliance with the requirements of regulatory acts and internal
documents of the Group.
The following functions are performed by the Internal Audit Depart-ment:
• carrying out internal audits, reviews and other engagements with respect to the Company’s subsidiaries;
• assessing the effectiveness of the internal control system of the Company, including its subsidiaries and proposing recommenda-tions as a result of those assessments;
• assessing the effectiveness of the risk management process within the Group and proposing recommendations as a result of those assessments;
• providing necessary consultations to the management of the Company and its subsidiaries on appropriate corrective action plans flowing from internal audits.

72Mail.ru Group Annual Report 2018
MA
NA
GEM
ENT
Risk management system Mail.ru Group is subject to certain risks that affect our ability to operate, serve our clients, and protect our assets. Con-trolling these risks through a formal program is necessary for the well-being of Mail.ru Group. The Group is committed to identifying and managing risk, in line with international best corporate governance practice.
Effective and adequate risk management and internal control systems are crucial to the achievement of the business strat-egies. To ensure effectiveness and efficiency of both these systems the Group adopted the “Three lines of defence” model, which comprises day-to-day operations and manage-ment, risk management function and independent assurance. These lines are aimed at providing reasonable but not abso-lute assurance against material losses or failures to achieve strategic objectives.
Sergey ChurlyaevSupportPerson of the YearMail.ru People Awards

73Mail.ru Group Annual Report 2018
MA
NA
GEM
ENT
The existing risk management system operates as follows:• the board of directors has a responsibility to ensure that it has
dealt with the governance of risk comprehensively;• the Board is also responsible for overseeing the risk appetite, i.e.
the level of risk the Group is willing and is ready to take; • the CEO is accountable to the Board for the enterprise-wide
management of risk;• management is responsible for assessing and managing the
risks in accordance with approved plans and policies;• the Risk Management Committee assists the management in
carrying out its responsibility for the governance of risk, reviews and approves risk management policy, risk map and register, risk assessments and mitigation activities; ensuring that an appropri-ate enterprise-wide risk management system and process is in place with adequate and effective risk management processes that include strategy, ethics, operations, reporting, compliance, IT and sustainability;
• the Audit committee assists the Board in its responsibility for overseeing the risks, including financial reporting risks and inter-nal financial controls, as well as fraud and IT risks as they relate to financial reporting; overall adequacy and effectiveness of risk management;
• internal audit provides assurance on the adequacy and effective-ness of the risk management process across the Group.
The Risk Management Committee comprises principal operating managers of the Group (heads of principal business units) appoint-ed by the CEO or his Deputy. The Risk Management Committee is chaired by the Deputy CEO. Members of the Risk committee, taken as a whole, comprise individuals with risk management skills and experience.
Corporate governance code Mail.ru Group Limited, as a BVI incorporated limited company with a listing of Global Depositary Receipts on the Official List maintained by the UK Listing Authority, which are admitted to trading on the London Stock Exchange, is not subject to any corporate governance code, nor has it voluntarily decided to apply any corporate gover-nance code.
However, the Company does apply corporate governance standards, including: the appointment of two Independent Directors to its Board of Directors, the appointment of Remuneration and Audit Commit-tees, and periodic re-election of Directors. This goes beyond the requirements of national law.
The Board of Directors adopted various policies and charters relating to the Company’s governing bodies. These include the Board Char-ter, Code of Ethics and Business Conduct, Directors’ Right to Access Information/Documents Policy, Legal Compliance Policy, Charter of the Audit Committee, Internal Audit Charter, Remuneration Com-mittee Charter, Risk Committee Charter, Risk Management Policy, Data Protection Policy and the Trading Policy for Directors, Senior Managers and Employees. These are all followed by the Group in all material respects.
Policies and other details of the Company’s corporate governance practices can be found at http://corp.mail.ru/en/investors/manage-ment/.

74Mail.ru Group Annual Report 2018
MA
NA
GEM
ENT
Risk management
Summary The Group has developed risk management policy which covers the following major aspects: identification, mapping and analysis of the risks the Group faces, setting appropriate control frameworks, monitoring risks and ensuring that major risks are properly identified, assessed, reported, and adequately mitigated. Risk management procedures and systems are reviewed regularly. The Group, through its training and management standards and procedures, aims to maintain a disciplined and constructive control environment. The overall objective of the risk management is to minimise the risks to an acceptable level.
The Company’s Audit Committee has been established to oversee, among other things, how management monitors compliance with the Group’s risk management practices and procedures. Management regularly performs its assessment of the principal strategic, oper-ational and compliance risks that the Group faces and has proper mitigation plans developed. Management defines the risk appetite – the acceptable levels of risk the Group is ready to tolerate in its op-erational activities, which are the maximum performance variability and loss exposures with both qualitative and quantitative statements targeting parameters or acceptable boundaries when executing the business model for creating value to the Group’s stakeholders.
Further information on Risk management system can be found in the Corporate governance section on page 72.
We present below the major aspects of our financial risk manage-ment policies and objectives (see Note 23 to the financial statements for further details), as well as principal operating risks and uncertain-ties faced by the Group.
Anton LoskutovmyTrackerIntern of the YearMail.ru People Awards
75Mail.ru Group Annual Report 2018
MA
NA
GEM
ENT
Financial risk management The Group’s operations include strategic operations and venture capital investments. Its financial risk management objectives and policies for these operations are based on the significant difference in the degree of risk tolerance between strategic and venture capital operations.
Financial risk arising from the Group’s strategic operations is man-aged through regular in-depth reviews of all operational segments and day-to-day management of their financial and operating activ-ities by key management personnel. In contrast, management of the financial risk arising from its venture capital activities is primarily based on regular reviews of the effect of the existing and prospec-tive investees’ operating performance on their fair values, which serve as the foundation for the Group’s investment and divestment decisions as part of its venture capital operations.
The Group’s principal financial liabilities mainly comprise a contin-gent consideration liability and trade accounts payable. The main purposes of these financial liabilities are to finance the Group’s operations and, in the case of the contingent consideration, a busi-ness acquisition. The Group has short-term receivables, short-term time deposits, cash and cash equivalents and other current financial assets that arise directly from the Group’s operations.
The Group also has a venture capital investment portfolio consist-ing of equity investments in Internet start-ups and smaller Internet companies and derivative contracts over the equity of the Group’s venture capital investees.
Liquidity and financial resources The Group monitors its risk of a shortage of funds using a liquidity planning tool.
The Group’s objective is to maintain a balance between continuity of funding and flexibility through the use of operating cash flows and bank overdrafts. Other financial liabilities of the Group are mostly represented by trade payables with maturity less than one year.
Credit risk Credit risk is the risk that a counterparty will not meet its obliga-tions under a financial instrument or customer contract, leading to a financial loss.
Financial assets, which potentially subject the Company and its subsidiaries and associates to credit risk, consist principally of cash and cash equivalents, short-term time deposits, short-term receiv-ables and convertible loans. The total of these account balances represents the Group’s maximum exposure to credit risk.
The Group places its cash and cash equivalents with highly rated financial institutions, which are considered at the time of deposit to have minimal risk of default. The Group does not require collateral or other security to support the financial instruments subject to credit risk. Accounts receivable from the two largest customers collectively represented 12% of total trade accounts receivable of the Group as of December 31, 2018 and 21% as of December 31, 2017. No customer accounted for more than 10% of revenue in 2018 or 2017. The Group provides credit payment terms to its customers in accordance with market practices and based on thorough review of the customer’s profile and creditworthiness. Although collection of receivables could be influenced by economic factors, management believes that there is no significant risk of loss beyond the allowance already recorded.
Capital management policy For the purpose of the Group’s capital management, capital includes issued capital, share premium and all other equity reserves attribut-able to the equity holders of the parent. The primary objective of the Group’s capital management is to maximise the shareholder value. The Group manages its capital structure and makes adjustments in light of changes in economic conditions.
Market risk Market risk is the risk that the fair value of future cash flows of a financial instrument will fluctuate because of changes in market prices. The market risks the Group is exposed to comprise two types of risk: currency risk (Note 23.6) and equity risk. The Group’s financial instruments affected by market risk include payables, cash and cash equivalents, short-term time deposits, financial investments in associates and derivative financial instruments. The Group’s equity risk arises from uncertainties about future values of the investment into unlisted securities.
Foreign currency risk The functional currency of the Company and majority of its subsid-iaries and associates is the Russian rouble. The Group has, however, monetary assets and liabilities which are denominated in other cur-rencies, and changes in exchange rates can result in gains or losses. In 2018, the Group recorded a gain of RUR 796 million (2017: a gain of RUR 742 million).
Credit lines and covenants risk The Group does not believe it has a cash flow risk which is ma-terial for the assessment of its assets, liabilities, financial position and performance. The Group has opened loan facilities with major Russian banks which subject it to certain financial and non-financial covenants. The failure to comply with those covenants may give rise to a right by the non-breaching party to impose fines and perform other actions as agreed by the contracts.

76Mail.ru Group Annual Report 2018
MA
NA
GEM
ENT
Business risks Technological changes and development The Internet industry is characterised by constant and rapid change in technology, consumer preferences, the nature of services offered and business models. A failure to innovate, to provide popular products and services or to react quickly to changes in the market could affect the popularity of the Group’s sites and, in turn, could affect advertising revenue. If we are unable to respond effectively to change and to continue to offer attractive and innovative products to our users, the popularity of our websites and services may decline, which could adversely affect our business in a number of ways, including through lower revenues from advertising and IVAS.
Quality products for expansion to new markets The Group aims to continue its expansion to foreign markets of Eu-rope and the USA by offering innovative and competitive products to audiences. Should we fail to ensure sufficient supply of high quality game titles, mail services and social network features for our users, we may face decline in respective audiences and, subsequently, revenues.
Mobile distribution As we distribute our mobile products primarily via two app stores, we are dependent on the interoperability of our products with two major operating systems which we do not own or otherwise control – iOS and Android. If Google Play or Apple App Store alternate search mechanisms or otherwise give preferential treatment to competing apps, we may face decrease in ratings for our products and, subse-quently, changes in mobile market shares.
Mobile technology development Users tend to use mobile devices to access Internet services more and more every year. Mobile devices monetisation may not catch up with desktop monetisation rates. Manufacturers may introduce their own standards and technical requirements for their devices that may adversely affect performance and usability of our services and prod-ucts on these devices. If we fail to successfully develop or use new mobile technologies or adapt in a cost-effective and timely manner to changing industry standards or user preferences, whether due to legal, financial or technical reasons, our financial results could be ad-versely affected. An inability to develop products and services which are compatible with new mobile devices could result in a failure to capture a significant share of an increasingly important market.
Ad blocking technologies We earn significant portion of our revenues from displaying advertisements on our websites. Users tend to install ad blocking technologies to their browsers provided by third-party developers. Should this practice become more popular and effective, we may face decrease in our advertising revenues
Alexey MilevskiyM&AExpert of the YearMail.ru People Awards

77Mail.ru Group Annual Report 2018
MA
NA
GEM
ENT
Advertising market Advertisers expenditure depend on overall economic situation in Russia and might be negatively affected by recession or other economic factors. Advertisers may also re-distribute their budgets to other channels, such as TV should the latter offer favorable terms or additional inventory. Such decrease in online advertising expendi-ture due to any of those factors may negatively affect our revenues.
Underlying markets If penetration rates for Internet, spending on advertising and IVAS in Russia do not increase, our ability to increase revenue could be materially and adversely affected.
Competition The development of products, which compete with the services provided by the Group, by domestic and large international internet companies could decrease the Group’s user base and make it less attractive to advertisers.
Increased competition could result in a reduction in the number of users who buy the Group’s Community IVAS – including games – which, in turn, would result in lower revenue and net income. Similarly, the Group may be required to spend additional resources to promote or improve its services in order to compete effectively, which could require additional capital or adversely affect the Group’s profitability.
Delays in launch of new game titles We might face delays in the launch of new game titles due to insuf-ficient staffing and/or failures from third party developers. Delays in launch time may disappoint users and lead to loss of potential audience and revenue and/or result in higher-than-expected devel-opment spend.
Unsuccessful game titles User expectations regarding the quality, performance and gameplay of MMOs are high, though even the most successful titles remain in high demand only for a limited period of time, unless refreshed or otherwise enhanced with additional content. In order to remain competitive and attractive to our users we must constantly develop new products or enhance existing ones. There is a risk of failure of any of the major new MMO titles to gain traction with users, which would lead to underperformance of the online games business and lower-than-expected revenues. Mobile games might also be unsuc-cessful as they may fail to achieve the required profitability targets due to high cost of marketing and revenue share payable to mobile platforms.
Investments and acquisitions Investments to and acquisitions of other entities are an important part of our overall strategy. We have invested in a number of diverse businesses over the last years. We expect to continue to consider various businesses, technologies, services, products as potential investment targets pursuing our development strategy and use of capital. We may face difficulties in integrating those diverse corpo-rate cultures, technologies, business models, employees, internal controls, financial reporting, other policies and procedures into our existing business processes in effective and efficient manner. We may also encounter difficulties with those investments relating to
their underperformance relative to our initial expectations or acquisi-tion price or we may incur unexpected expenses pertaining to these integrations.
Online marketplace and e-commerce Products on our marketplace and verticals, as well as orders in food delivery service are provided by third-party sellers, which makes it more difficult for us to ensure the same high quality for our custom-ers for all products sold via our services. If any third-party seller does not control the quality, or delivers products which is significantly different from their description in our apps or on websites, or offers counterfeit goods, we may face damage to our reputation and, sub-sequently, to our revenues.
Personnel As competition in Russia’s internet industry increases, our business and operations could be adversely affected by difficulties in hiring, motivating and retaining highly skilled people. Our performance and future success depend on the talents and efforts of a large num-ber of highly skilled individuals within the Group. We will need to continue to identify, hire, develop, motivate and retain highly skilled personnel for all areas of our organisation, including those with programming skills on rare languages. Competition in the Internet industry, and in particular in Russia, for suitably qualified employees is high. As competition in the Internet industry in Russia increases, and in particular if larger multinational internet companies focus their attention on the Russian speaking market, it may be more difficult for us to motivate, retain and hire highly skilled personnel. If we do not succeed in retaining or motivating existing personnel or attracting additional highly skilled personnel, our business and results of oper-ations may be materially and adversely affected.
Our future success depends heavily upon the continuing services of our senior management team and a failure to retain those personnel could have a material adverse effect on our business.
In addition, even if sufficient numbers of highly skilled personnel can be retained, salaries may rise significantly due to competition within the Internet industry in Russia, increasing our costs, which could have a material adverse effect on our business, results of operations and financial condition.
Infrastructure and capacity If the infrastructure in Russia were not able to support increased demand, the Group’s services could be interrupted or the Group’s systems damaged. A limited availability of third-party providers of network and server capacity could limit the Group’s ability to offer certain services or to expand. Network or power failures could result in the loss of data and in a reduction in the number of users, which could have a material effect on the Group’s business, results of oper-ations and financial condition.
Cyber security Hackers and groups of hackers may create malicious software (mal-ware) to pursue their own criminal interests. These cyber criminals create Trojan programs and computer viruses, including adware and ransomware, aimed at stealing sensitive information or otherwise harm the users and their data.

Elena GrigoryanGamesLeader of the Year Mail.ru People Awards
78Mail.ru Group Annual Report 2018
MA
NA
GEM
ENT
Should those hackers aim at the Group's customer databases or on-line gamers' personal data, and we fail to appropriately and rapidly defend our servers, we may face serious reputational losses and material financial effects.
Private information To become registered on the website operated by the Group, users have to input their personal data, which is then protected by the Group from access by third parties. Should such data become avail-able to third parties as a result of hackers’ attacks, the Group may become a party to litigations from its users. Management believes it takes all necessary steps to reduce the related risk to an acceptable level.
Intellectual property rights The Group may be subject to infringement claims from third parties in the future resulting from the technology and intellectual property used in the provision and marketing of its services. If the Group is found liable for infringement, it may be required to pay significant damages, and if it is unable to license or develop non-infringing technology on a timely basis, it may be unable to continue offering the affected services without risk of liability.
Similarly, third parties may obtain and use the Group’s intellectual property without authorisation. The validity, application, enforceabil-ity and scope of protection of intellectual property rights for many Internet-related activities are uncertain and still evolving, which may make it more difficult for the Group to protect its intellectual property, which could have a material effect on its business, results of operations and financial condition. The Group and its associates have been subject to such proceedings in the past. Although none of them was individually significant, similar potential claims may potentially subject the Group to significant losses in the future, which currently cannot be reliably estimated.
Political, economic and social risks Political instability in Russia Political instability or changes and inconsistencies in government or in economic policy could adversely affect our business and the value of investments in the GDRs. The parliament may adopt and government officials may apply politically motivated or ambiguous legislative acts that would have unpredictable adverse effect on our business.
Economic and military conflicts The involvement of the Russian Federation in any economic and military conflicts could negatively affect the Group’s results of opera-tions and business prospects.
Economic instability in Russia Mail.ru Group Limited is registered in the BVI with the principal office of the Company in the Republic of Cyprus, whereas the operating business of the Company’s subsidiaries are mostly in Russia. Russia, as an emerging market, is generally more vulnerable to economic instability, market downturns and economic slowdowns elsewhere in the world, than more developed countries. Such risks whether

79Mail.ru Group Annual Report 2018
MA
NA
GEM
ENT
actual or perceived may negatively affect investors’ intentions and willingness to invest money into Russian economy.
Recent US, EU and certain other countries’ economic sanctions imposed on certain Russian companies, sectors and government of-ficials with respect to conflict in Ukraine have also added significant uncertainty to investment climate and overall economic situation. Since the ultimate outcome of the Ukrainian conflict as well as overall extent and depth of the trade sanctions are not known, there might be difficulties for national economy to properly develop, obtain sufficient liquidity, avoid volatility and for foreign investors to pursue confidence and expect returns on investments.
Management believes it is taking appropriate measures to support the sustainability of the Group’s business in the current circumstances.
Inflation High rates of inflation could increase our costs, and there can be no assurance that we will be able to maintain or increase our margins.
Legislative and legal risks Regulation The Group is subject to various specific Russian laws, such as so-called Anti-Piracy Law, Anti-extremism Law, Black List Law, Law on news aggregation services, Law on identification of messengers’ users, Law regulating aggregators of goods and services, etc.
Certain Group’s properties are subject to laws of non-Russian juris-dictions.
Our failure or the failure of our third party providers to accurately comply with the applicable laws and regulations could create liability for us, result in adverse publicity, or could otherwise have a material adverse effect on our business, results of operations and financial condition, including blocking of our properties.
Legal proceedings The Group has been and continues to be the subject of legal proceedings and adjudications from time to time, none of which has had, individually or in the aggregate, a material adverse impact on the Group. Management believes that the resolution of all current and potential legal matters will not have a material impact on the Group’s financial position or operating results.
Taxation Russian tax, currency and customs legislation is subject to varying interpretations, and changes, which can occur frequently. Manage-ment's interpretation of such legislation as applied to the transac-tions and activity of the Group may be challenged by the Russian tax authorities. Recent events within the Russian Federation suggest that the tax authorities are taking a more assertive position in their interpretation of the legislation and assessments and as a result, it is possible that transactions and activities that have not been chal-lenged in the past may be challenged. As such, significant additional taxes, penalties and interest may be assessed. Fiscal periods remain open to review by the authorities in respect of taxes for three calen-dar years preceding the year of review. Under certain circumstances reviews may cover longer periods.
The Group’s management believes that its interpretation of the rele-vant legislation is appropriate and is in accordance with the current industry practice and that the Group’s tax, currency and customs po-sitions will be sustained. However, the interpretations of the relevant authorities could differ and the effect of additional taxes, fines and penalties on these consolidated financial statements, if the authori-ties were successful in enforcing their different interpretations, could be significant.
The Russian Federation is actively considering measures that may be taken in order to prevent tax evasion, such as limiting the use of low tax jurisdictions and aggressive tax planning structures. Initiatives incorporated into Russian law and effective from 2015 include the concept of beneficial ownership, regulations relating to the tax residency of legal entities and the introduction of “controlled foreign companies” rules. The Russian tax authorities now more often pay a careful attention to any structure that contains a foreign element. They have more instruments now allowing them to identify risks, collect relevant tax information and impose tax than they had ever before, including international information exchange under the double tax treaty provisions or/and automatic international exchange (in effect from 2018 for Russia).
No assurance can currently be given as to how the above legislative changes will be interpreted by the Russian tax authorities and poten-tially impact the Group. The Group may be subject to additional tax liabilities as a result of such changes being applied to transactions carried out by the Group, which could have a material adverse effect on the Group’s business, financial condition and results of opera-tions.
Modifications of the Group’s legal structure made from time to time may result in additional taxes, interest, and penalties in various juris-dictions. Any such taxes or penalties caused by the Group’s structure or its modifications could have a material adverse effect on the Group’s business, operating results, financial condition or prospects.

80Mail.ru Group Annual Report 2018
MA
NA
GEM
ENT
Board and Management remuneration
The Remuneration Committee is responsible for approving the remuneration of the Directors and senior managers of the Group. It is also charged with reviewing and approving general policy relating to strategic compensation of the Group and the approval of grants under the incentive schemes.
Further information on the Remuneration Committee can be found in the Corporate governance section on page 71.
Interests of members of our Board of Directors and our employees Certain members of our Board of Directors have beneficial owner-ship interests in our Global Depositary Receipts. The table below includes information of their ownership. Furthermore, it highlights options and RSUs over Ordinary Shares of the Company held, direct-ly or indirectly, by each Director as of the date hereof.
The aggregate beneficial interest in the Company (excluding options granted over Ordinary Shares) held by senior managers and employ-ees of the Group (including Matthew Hammond) as of 4 April 2019 was about 1.3%.
Incentive scheme In November 2010, the Board of Directors of the Company adopted an equity-based long-term incentive scheme. Under the scheme, the Board, or its Remuneration Committee, is authorized to grant options to acquire Ordinary Shares to a broad base of employees, con-sultants and Directors. This can be direct or through an employee benefit trust or vehicles controlled by such persons.
The 2010 Option Plan comprised options over an aggregate of 10,706,403 Ordinary Shares. On the IPO date, the Company
Aram ArakelyanCitymobilStartup of the YearMail.ru People Awards

81Mail.ru Group Annual Report 2018
MA
NA
GEM
ENT
assigned options for 6,423,842 Ordinary Shares to the Mail.ru Employee Benefit Trust with an exercise price equal to the IPO price of US$27.70, which was reduced by US$3.80 on 17 August 2012 and then by US$4.30 on 20 March 2013 resulting in the exercise price of US$19.60. As of the date hereof, 760,755 of these options remain allocated, all of which are vested. Except for the options allocated for the benefit of the Directors, the options have generally a 4-year vesting schedule. Options allocated for the benefit of the Directors have a 2-year vesting schedule and are fully vested.
Subsequently, in December 2011 the Company assigned options for 4,282,561 Ordinary Shares to the Mail.ru Employee Benefit Trust with an exercise price equal to the then current market price of US$25.60, which was reduced by US$3.80 on 17 August 2012 and then by US$4.30 on 20 March 2013 resulting in the exercise price of US$17.50. As of the date hereof, 696,417 of these options remain allocated, 353,083 of which are vested. The options have generally a 4-year vesting schedule.
In March 2015, shareholders of the Company approved the issue of up to 10,977,971 Ordinary Shares to Mail.ru Employee Benefit Trust to establish an incentive plan for employees, directors, offices and consultants of the Group, to be known as the 2015 Restricted Stock Unit Plan. On November 23, 2017 the Remuneration Committee of the Board of Directors of the Company approved New Terms for 2015 Restricted Stock Unit Plan (the “2017 RSU Plan”) setting out that RSUs vesting shall generally be conditional on meeting of certain performance KPIs. In December 2018, an additional extension of the 2017 RSU Plan for 2,000,000 RSUs and acquisition of required amount of GDRs on the market were approved. As of the date here-of, 4,390,470 RSUs are allocated, 1,556,927 of which are vested. The RSUs have generally a 4-year vesting schedule.
Compensation Directors of the Company Total cash remuneration of the members of the Board of Directors (each a “Director” and collectively, “Directors”) of the Company amounted to RUR 144 million for the year ended December 31, 2018 (2017: RUR 130 million). In 2018, no RSUs out of 2017 RSU Plan were granted to Directors in their capacity as Directors (2017: 20,000). During the year ended December 31, 2018, Directors did not forfeit any options or RSUs (2017: nil) and exercised a combined 2,500 options and RSUs granted to them in their capacity as Directors. The corresponding share-based payment expense was a negative RUR 49 million for the year ended December 31, 2018 (2017: RUR 728 million).
Key Management of the Group Total cash remuneration of the key management of the Group (ex-cluding Directors) amounted to RUR 563 million for the year ended December 31, 2018 (2017: RUR 517 million). In addition to the cash remuneration for the year ended December 31, 2018, key executive employees of the Group were granted 200,000 RSUs out of 2017 RSU Plan in 2018 (2017: 3,335,000). During the year ended Decem-ber 31, 2018, key management of the Group (excluding Directors) did not forfeit any options or RSUs (2017: nil) and exercised a combined 3,082,500 RSUs and options over shares of the Company (2017: 1,465,865). Additionally in Q4 2018 3,535,000 RSUs held by key management of the Group were accelerated. The corresponding share-based payment expense amounted to RUR 3,405 million for year ended December 31, 2018 (2017: 998 million).
* 160,596 options granted to the Directors nominated by Naspers were assigned to the shareholder that nominated such Directors. **Granted to Directors in their capacity as Directors
Class A shares(direct and indirect)
Ordinary shares/GDRs(direct and indirect)
Total % of the Company's issued share capital represented by outstanding shares
Outstanding options and RSUs over Ordinary Shares**
Dmitry Grishin - 2,300 ,792 1.045% -
Alan Vaksman - - - -
Sergey Mednov - - - -
Dmitry Sergeev - 14,975 0.006% 250,000
Sang Hun Kim - - - 10,000
Charles Searle* - - - -
Vasileios Sgourdos* - - - -
Mark Remon Sorour* - - - -
Vladimir Gabrielyan - 40,000 0.018% 200,000
Jan Buné - 1,600 0.0007% 5,000

82Mail.ru Group Annual Report 2018
MA
NA
GEM
ENT
Responsibility statement
We confirm that, to the best of our knowledge:
• The consolidated financial statements, prepared in accordance with IFRS, give a true and fair view of the assets, liabilities, financial posi-tion and profit and loss of the Company and the undertakings included in the consolidation taken as a whole.
• This annual report includes a fair review of the development and performance of the business and the position of the Company and the undertakings included in the consolidation, taken as a whole, together with a description of the principal risks and uncertainties that they face.
By order of the Board
Matthew HammondManaging Director, Chief Financial OfficerMail.ru Group Limited24 April 2019

SHAREHOLDERS* ECONOMIC INTEREST FINANCIAL
STATEMENTS

Mail.ru Group Limited Consolidated Financial Statements For the year ended December 31, 2018
84Mail.ru Group Annual Report 2018

Mail.Ru Group 2018 Results 2
Contents
Independent Auditor’s Report .......................................................................................................................................................................................86
Consolidated Financial Statements: Consolidated Statement of Financial Position ...........................................................................................................................................................89 Consolidated Statement of Comprehensive Income ................................................................................................................................................90 Consolidated Statement of Cash Flows .......................................................................................................................................................................91 Consolidated Statement of Changes in Equity ...........................................................................................................................................................92 Notes to Consolidated Financial Statements .............................................................................................................................................................94
85Mail.ru Group Annual Report 2018

86

87

88
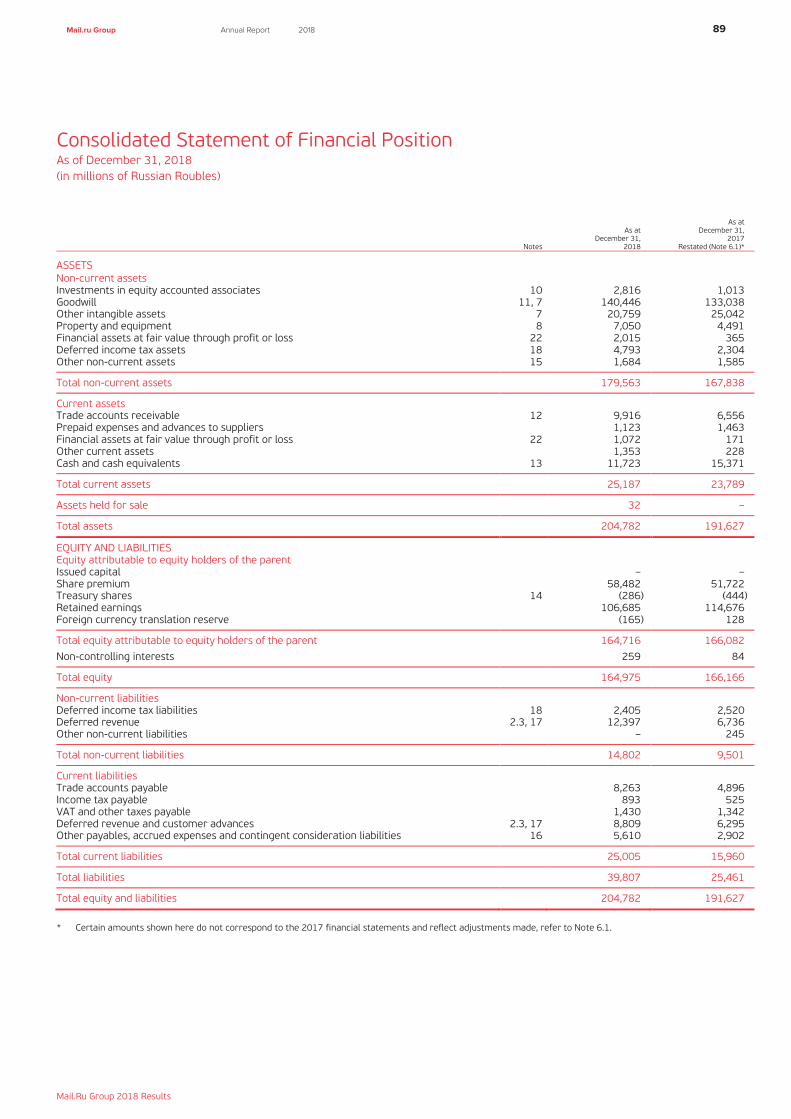
Consolidated Statement of Financial Position As of December 31, 2018 (in millions of Russian Roubles)
Mail.Ru Group 2018 Results 6
Notes
As at December 31,
2018
As at December 31,
2017 Restated (Note 6.1)*
ASSETS Non-current assets Investments in equity accounted associates 10 2,816 1,013 Goodwill 11, 7 140,446 133,038 Other intangible assets 7 20,759 25,042 Property and equipment 8 7,050 4,491 Financial assets at fair value through profit or loss 22 2,015 365 Deferred income tax assets 18 4,793 2,304 Other non-current assets 15 1,684 1,585
Total non-current assets
179,563 167,838
Current assets Trade accounts receivable 12 9,916 6,556 Prepaid expenses and advances to suppliers 1,123 1,463 Financial assets at fair value through profit or loss 22 1,072 171 Other current assets 1,353 228 Cash and cash equivalents 13 11,723 15,371
Total current assets
25,187 23,789
Assets held for sale 32 –
Total assets
204,782 191,627
EQUITY AND LIABILITIES Equity attributable to equity holders of the parent Issued capital – – Share premium 58,482 51,722 Treasury shares 14 (286) (444) Retained earnings 106,685 114,676 Foreign currency translation reserve
(165) 128
Total equity attributable to equity holders of the parent
164,716 166,082
Non-controlling interests
259 84
Total equity
164,975 166,166
Non-current liabilities Deferred income tax liabilities 18 2,405 2,520 Deferred revenue 2.3, 17 12,397 6,736 Other non-current liabilities
– 245
Total non-current liabilities
14,802 9,501
Current liabilities Trade accounts payable 8,263 4,896 Income tax payable 893 525 VAT and other taxes payable 1,430 1,342 Deferred revenue and customer advances 2.3, 17 8,809 6,295 Other payables, accrued expenses and contingent consideration liabilities 16 5,610 2,902
Total current liabilities
25,005 15,960
Total liabilities
39,807 25,461
Total equity and liabilities
204,782 191,627
* Certain amounts shown here do not correspond to the 2017 financial statements and reflect adjustments made, refer to Note 6.1.
89Mail.ru Group Annual Report 2018

Consolidated Statement of Comprehensive Income For the year ended December 31, 2018 (in millions of Russian Roubles)
Mail.Ru Group 2018 Results 7
Notes 2018 2017
Restated (Note 2.3)*
Online advertising 31,970 22,476 MMO games 15,728 12,072 Community IVAS 13,890 13,266 Other revenue
4,517 2,241
Total revenue
66,105 50,055
Other operating gain – 565 Net gain/(loss) on venture capital investments 22 26 (27)
Personnel expenses (22,698) (13,148) Office rent and maintenance (2,528) (2,126) Agent/partner fees (16,404) (9,402) Marketing expenses (15,583) (8,637) Server hosting expenses (1,966) (1,795) Professional services (587) (347) Other operating expenses
(2,815) (2,165)
Total operating expenses
(62,581) (37,620)
EBITDA
3,550 12,973
Depreciation and amortisation (9,665) (8,931) Impairment of intangible assets 7 (1,711) – Share of (loss)/profit of equity accounted associates (497) 15 Finance income 545 511 Finance expenses (17) (15) Other non-operating loss (12) (21) Net loss on derivative financial assets and liabilities at fair value through profit or loss 22 (516) (30) Impairment losses related to equity accounted associates 10 (37) (273) Net gain/(loss) on disposal of shares in subsidiaries 47 (15) Net foreign exchange gain
796 742
(Loss)/profit before income tax expense (7,517) 4,956
Income tax expense 18 (546) (2,675)
Net (loss)/profit
(8,063) 2,281
Attributable to: Equity holders of the parent (7,991) 2,261 Non-controlling interests (72) 20
Other comprehensive loss that may be reclassified to profit or loss in subsequent periods Exchange differences on translation of foreign operations:
Differences arising during the year
(293) (353)
Total other comprehensive loss net of tax effect of 0
(293) (353)
Total comprehensive (loss)/income, net of tax
(8,356) 1,928
Attributable to: Equity holders of the parent (8,284) 1,908 Non-controlling interests (72) 20
(Loss)/Earnings per share, in RUR: Basic and diluted (loss)/earnings per share attributable to ordinary equity holders of the
parent 19 (37) 11 * Certain amounts shown here do not correspond to the consolidated financial statements for the year ended December 31, 2018 and reflect full retrospective
application of IFRS 15, refer to Note 2.3.
90Mail.ru Group Annual Report 2018

Consolidated Statement of Cash Flows For the year ended December 31, 2018 (in millions of Russian Roubles)
Mail.Ru Group 2018 Results 8
Notes 2018 2017
Cash flows from operating activities (Loss)/profit before income tax (7,517) 4,956
Adjustments to reconcile (loss)/profit before income tax to cash flows: Depreciation and amortisation 7,8 9,665 8,931 Impairment losses on financial assets at amortized cost 164 27 Net loss on derivative financial assets and liabilities at fair value through profit or loss 22 516 30 Net (gain)/loss on disposal ofshares in subsidiaries (47) 15 Loss on disposal of property and equipment and intangible assets 15 8 Finance income (545) (511) Finance expenses 17 15 Dividend revenue from venture capital investments (29) (9) Share of loss/(profit) of equity accounted associates 497 (15) Impairment losses related to equity accounted associates 10 37 273 Impairment of intangible assets 7 1,711 – Net foreign exchange gain (796) (742) Share-based payment expense 6,732 2,475 Other non-cash items 30 (3) Net (gain)/loss on venture capital investments 22 (26) 27
Change in operating assets and liabilities: Increase in accounts receivable (2,934) (1,437) Decrease in prepaid expenses and advances to suppliers 604 803 (Increase)/decrease in other assets (314) 7 Increase in accounts payable and accrued expenses 1,592 1,248 (Increase)/decrease in other non-current assets (217) 597 Increase in deferred revenue 7,588 5,415 Increase in financial assets at fair value through profit or loss 22 (3,081) (89) Increase/(decrease) in financial liabilities at fair value through profit or loss 22 1,225 (104)
Operating cash flows before interest, dividends and income taxes
14,887 21,917
Dividends received from venture capital investments 28 8 Interest received 561 521 Interest paid (13) (13) Income tax paid
(2,981) (3,110)
Net cash provided by operating activities
12,482 19,323
Cash flows from investing activities Cash paid for property and equipment (4,492) (2,627) Cash paid for intangible assets (2,156) (1,755) Dividends received from equity accounted associates 10 40 18 Loans issued (83) (56) Cash paid for acquisitions of subsidiaries, net of cash acquired 6 (8,031) (2,769) Proceeds from disposal of subsidiaries, net of cash disposed (20) (43) Cash paid for investments in equity accounted associates 10 (1,960) (640)
Net cash used in investing activities
(16,702) (7,872)
Cash flows from financing activities Loans repaid – (122) Cash paid for treasury shares
– (1,430)
Net cash used in financing activities
– (1,552)
Net increase/(decrease) in cash and cash equivalents (4,220) 9,899 Effect of exchange differences on cash balances 572 (41) Cash and cash equivalents at the beginning of the year 15,371 5,513
Cash and cash equivalents at the end of the year
11,723 15,371
91Mail.ru Group Annual Report 2018

Mail.ru Group Annual Report 2018
Consolidated Statement of Changes in Equity For the year ended December 31, 2017 (in millions of Russian Roubles)
Mail.Ru Group 2018 Results 9
Share capital
Number of shares issued and outstanding Amount Share premium Treasury shares Retained earnings
Foreign currency translation reserve
Total equity attributable to equity holders of the parent
Non-controlling interests Total equity
Balance at January 1, 2017 208,634,437 – 51,758 (1,290) 112,415 470 163,353 64 163,417
Profit for the year – – – – 2,261 – 2,261 20 2,281
Other comprehensive loss: Foreign currency translation – – – – – (353) (353) – (353)
Total other comprehensive loss – – – – – (353) (353) – (353)
Total comprehensive income – – – – 2,261 (353) 1,908 20 1,928
Share-based payment transactions – – 2,238 – – – 2,238 – 2,238 Exercise of RSUs and options over the
shares of the Company 4,648,093 – (2,274) 2,276 – – 2 – 2 Acquisition of treasury shares (Note 14) (857,736) – – (1,430) – – (1,430) – (1,430) Effect of disposal of subsidiary – – – – – 11 11 – 11
Balance at December 31, 2017 212,424,794 – 51,722 (444) 114,676 128 166,082 84 166,166
92

Mail.ru Group Annual Report 2018
Consolidated Statement of Changes in Equity For the year ended December 31, 2018 (in millions of Russian Roubles)
Mail.Ru Group 2018 Results 10
Share capital
Number of shares issued and outstanding Amount Share premium Treasury shares Retained earnings
Foreign currency translation reserve
Total equity attributable to equity holders of the parent
Non-controlling interests Total equity
Balance at January 1, 2018 212,424,794 – 51,722 (444) 114,676 128 166,082 84 166,166
Loss for the year – – – – (7,991) – (7,991) (72) (8,063)
Other comprehensive loss: Foreign currency translation – – – – – (293) (293) – (293)
Total other comprehensive loss – – – – – (293) (293) – (293)
Total comprehensive loss – – – – (7,991) (293) (8,284) (72) (8,356)
Share-based payment transactions – – 6,918 – – – 6,918 – 6,918 Exercise of RSUs and options over the
shares of the Company 3,545,128 – (158) 158 – – – – – Acquisitions of non-controlling interests in
business combinations (Note 6) – – – – – – – 269 269 Effect of disposal of subsidiary – – – – – – – (22) (22)
Balance at December 31, 2018 215,969,922 – 58,482 (286) 106,685 (165) 164,716 259 164,975
93

Notes to Consolidated Financial Statements For the year ended December 31, 2018 (in millions of Russian Roubles)
Mail.Ru Group 2018 Results 11
1 Corporate information and description of business These consolidated financial statements of Mail.ru Group Limited (hereinafter “the Company”) and its subsidiaries (collectively – “the Group”) for the year ended December 31, 2018 were authorised for issue by the directors of the Company on February 28, 2019. The Company was registered on May 4, 2005 in the Territory of the British Virgin Islands (“BVI”), pursuant to the International Business Companies Act (the “Act”), Cap. 291. The principal office of the Company is at 28 Oktovriou, 365, VASHIOTIS SEAFRONT, office 402, Neapoli, 3107 Limassol, Cyprus. The Company consolidates or participates in businesses that operate in the Internet segment, including portals, social networking and communications, online marketplaces, online-to-offline services, massively multiplayer online games (“MMO games”), social and mobile games. The Group has leading positions in Russia and other CIS states where its properties are present. Information on the Company’s main subsidiaries is disclosed in Note 9. 2 Basis of preparation These consolidated financial statements have been prepared on a historical cost basis, except for financial assets and liabilities designated as at fair value through profit or loss and derivative financial instruments that have been measured at fair value. 2.1 Statement of compliance These consolidated financial statements have been prepared in accordance with and comply with International Financial Reporting Standards (“IFRS”). The Group maintains its accounting records and prepares its statutory accounting reports in accordance with domestic accounting legislation and instructions for each of its subsidiaries. These consolidated financial statements are based on the underlying accounting records, appropriately adjusted and reclassified for fair presentation in accordance with the standards and interpretations issued by the International Accounting Standards Board (“IASB”). IFRS adjustments include and affect such major areas as consolidation, revenue recognition, accruals, deferred taxation, fair value adjustments, business combinations, impairment, share-based payments etc. 2.2 Application of new and amended IFRS and IFRIC The accounting policies adopted are consistent with those followed in the preparation of the Group’s annual financial statements for the year ended December 31, 2017, except for the following new and amended IFRS and International Financial Reporting Interpretations Committee (“IFRIC”) interpretations effective as of January 1, 2018: IFRIC Interpretation 22 Foreign Currency Transactions and Advance Considerations The Interpretation clarifies that, in determining the spot exchange rate to use on initial recognition of the related asset, expense or income (or part of it) on the de-recognition of a non-monetary asset or non-monetary liability relating to advance consideration, the date of the transaction is the date on which an entity initially recognizes the non-monetary asset or non-monetary liability arising from the advance consideration. If there are multiple payments or receipts in advance, then the entity must determine a date of the transactions for each payment or receipt of advance consideration. This Interpretation does not have any impact on the Group’s consolidated financial statements. Amendments to IFRS 2 Classification and Measurement of Share-based Payment The IASB issued amendments to IFRS 2 Share-Based Payment that address three main areas: the effects of vesting conditions on the measurement of a cash-settled share-based payment transaction; the classification of a share-based payment transaction with net settlement features for withholding tax obligations; and accounting where a modification to the terms and conditions of a share-based payment transaction changes its classification from cash settled to equity settled. On adoption, entities are required to apply the amendments without restating prior periods, but retrospective application is permitted if elected for all three amendments and other criteria are met. The Group’s accounting policy for cash-settled share share-based payments is consistent with the approach clarified in the amendments. In addition, the Group has no share-based payment transactions with net settlement features for withholding tax obligations and did not make any modifications to the terms and conditions of its share-based payment transactions. Therefore, these amendments do not have any impact on the Group’s consolidated financial statements. Amendments to IAS 28 Investments in Associates and Joint-Ventures – Clarification that measuring investees at fair value through profit and loss is an investment-by-investment choice The amendments clarify that an entity that is a venture capital organisation, or other qualifying entity, may elect, at initial recognition on an investment-by-investment basis, to measure its investments in associates and joint ventures at fair value through profit and loss. If an entity, that is not itself an investment entity, has an interest in an associate or joint venture that is an investment entity, the entity may, when applying the equity method, elect to retain the fair value measurement applied by the investment entity associate or joint venture to the investment entity associate’s or joint venture’s interests in subsidiaries. This election is made separately for each investment entity associate or joint venture, at the later of the date on which: (a) the investment entity associate or joint venture is initially recognised; (b) the associate or joint venture becomes an investment entity; and (c) the investment entity associate or joint venture first becomes a parent. These amendments do not have any impact on the Group’s consolidated financial statements
94Mail.ru Group Annual Report 2018

Notes to Consolidated Financial Statements (continued)
Mail.Ru Group 2018 Results 12
2 Basis of preparation (continued) 2.3 New accounting pronouncements The Group applied IFRS 15 and IFRS 9 for the first time. The nature and effect of the changes as a result of adoption of these new accounting standards are described below. IFRS 9 Financial Instruments
In July 2014, the IASB issued the final version of IFRS 9 Financial Instruments that replaces IAS 39 Financial Instruments: Recognition and Measurement and all previous versions of IFRS 9. IFRS 9 brings together all three aspects of the accounting for financial instruments project: classification and measurement, impairment and hedge accounting. The Group has applied IFRS 9 on the required effective date and has not restated comparative information due to the exemption in IFRS 9. The Group has performed a detailed impact assessment of all three aspects of IFRS 9. The Group has assessed the impact of IFRS 9 to the Group’s consolidated financial statements as follows: (a) Classification and measurement
IFRS 9 contains a new classification and measurement approach for financial assets that is a function of the business model, in which assets are managed and their cash flow characteristics. IFRS 9 includes three principal classification categories for financial assets: those measured at amortised cost, at fair value through other comprehensive income and at fair value through profit or loss. It eliminates the existing IAS 39 categories of held to maturity, loans and receivables and available-for-sale financial assets. There is no significant impact on the Group balance sheet or equity on applying the classification and measurement requirements of IFRS 9. Trade receivables are held to collect contractual cash flows and are expected to give rise to cash flows representing solely payments of principal and interest. The Group analysed the contractual cash flow characteristics of those instruments and concluded that they meet the criteria for amortised cost measurement under IFRS 9. Therefore, reclassification for these instruments is not required. The changes in fair values of financial investments in asscociates, or venture capital investments, are recognised in profit or loss in the period of the change and the Group does not apply the option to present fair value changes in other comprehensive income, and, therefore, the application of IFRS 9 does not have a significant impact. (b) Impairment
IFRS 9 requires the Group to record expected credit losses on all of its debt securities, loans and trade receivables, either on a 12-month or lifetime basis. The Group applies the simplified approach mandated to trade receivables by recording lifetime expected losses. The Group applies the general approach to amortised cost financial assets, other than trade receivables including, but not limited to, cash and cash equivalents. Loss allowances are measured on either of the following bases:
• 12-month basis – these are expected credit losses that result from default events on a financial instrument that are possible within the 12 months after the reporting date; or
• lifetime basis – these are expected credit losses that result from all possible default events over the expected life of a financial instrument. The Group’s cash and cash equivalents have been assigned low credit risk based on the external credit ratings of the respective banks and financial institutions. Therefore, the Group determined that no additional allowances are required at December 31, 2018 in connection with the adoption of the new impairment model under IFRS 9. IFRS 15 Revenue from Contracts with Customers
IFRS 15 was issued in May 2014, and amended in April 2016, and establishes a five-step model to account for revenue arising from contracts with customers. Under IFRS 15, revenue is recognised at an amount that reflects the consideration to which an entity expects to be entitled in exchange for transferring goods or services to a customer. The new revenue standard supersedes all current revenue recognition requirements under IFRS. The Group adopted the new standard on the required effective date using the full retrospective method adjusting each financial statement line item affected for the period immediately preceding the first period for which this Standard is applied. In adopting IFRS 15, the Group has considered the following: a) Principal versus agent considerations
The Group enters into arrangements where services are rendered to end-customers with an involvement of third parties. Under these arrangements, the Group provides mainly display advertising and some other services in social communities which are controlled by third parties but are operated on the Group’s platforms.
95Mail.ru Group Annual Report 2018

Notes to Consolidated Financial Statements (continued)
Mail.Ru Group 2018 Results 13
2 Basis of preparation (continued) 2.3 New accounting pronouncements (continued) Under these arrangements the Group is not considered to have control over these advertising services. At the same time social communities have full discretion in providing access to advertising space in social communities which they control and establish prices for the placing of advertisements. Previously the Group concluded that it is a principal after evaluating the indicators in order to make its principal versus agent determination when from the perspective of the advertisers the Group renders these services, and hence the Group has exposure to the significant risks (including credit risk) and rewards associated with placing advertisements and accounted for these arrangements as a principal. IFRS 15 requires the Group to assess whether it controls a specified good or service before it is transferred to the customer. The Group has determined that it does not control advertising services before these services are transferred to end customers, as the Group does not control the social communities where these advertisements are placed, and hence, is an agent rather than a principal in these contracts. The effect of IFRS 15 adoption on the comparative period ended December 31, 2017 is presented below. The adoption of IFRS 15 did not have any impact on the statement of financial position and retained earnings:
Description As restated IFRS 15 adoption effect As reported prior to the
adoption of IFRS 15
Online advertising 22,476 1293 23,769 Community IVAS 13,266 396 13,662
Total Revenue effect n/a 1,689 n/a
Agent/Partner fees (9,402) (1,689) (11,091)
EBITDA effect n/a – n/a
b) Presentations and disclosures
The presentation and disclosure requirements in IFRS 15 are more detailed than under previous guidance. Detailed disclosure is presented in Note 17. c) Contract balances
Contract balances comprise trade receivables presented as a separate line item in the statement of financial position and contract liabilities.. Contract liabilities comprise deferred revenue (Note 17) and customer advances presented as separate line items in the statement of financial position. 2.4 Standards issued but not yet effective The new and amended standards and interpretations that are issued, but not yet effective, up to the date of issuance of the Group’s financial statements are disclosed below. The Group intends to adopt these new and amended standards and interpretations, if applicable, when they become effective. IFRIC Interpretation 23 Uncertainty over Income Tax Treatments
In June 2017, the IASB issued IFRIC 23 Interpretation entitled Uncertainty over Income Tax Treatments. The IFRIC clarifies that for the purposes of calculating current and deferred tax, companies should use a tax treatment of uncertainties, which will probably be accepted by the tax authorities. IFRIC 23 is effective for annual periods beginning on or after January 1, 2019. The Group does not expect the interpretation to have a material impact on the consolidated financial statements. Definition of a Business – Amendments to IFRS 3
In October 2018, the IASB issued amendments to IFRS 3 Business Combinations. The amendments enhance definition of a business set out by the standard. The amendments are effective for acquisitions to occur on or after January 1, 2020; earlier application is permitted. Possible impact of the amendments on the consolidated financial statements as well as the necessity of early adoption will be assessed in course of accounting support for future significant transactions. The Conceptual Framework for Financial Reporting
In March 2018, the IASB issued a revised version of Conceptual Framework for Financial Reporting. In particular, the revised version introduces new definitions of assets and liabilities, as well as amended definitions of income and expenses. The new version is effective for annual periods beginning on or after January, 2020. The Company is currently assessing the impact of the revised version of Conceptual Framework on the consolidated financial statements. Annual Improvements to IFRSs 2015-2017 Cycle
• IFRS 3 Business Combinations
The amendments clarify that, when an entity obtains control of a business that is a joint operation, it applies the requirements for a business combination achieved in stages, including remeasuring previously held interests in the assets and liabilities of the joint operation at fair value. In doing so, the acquirer remeasures its entire previously held interest in the joint operation.
96Mail.ru Group Annual Report 2018

Notes to Consolidated Financial Statements (continued)
Mail.Ru Group 2018 Results 14
2 Basis of preparation (continued) 2.4 New accounting pronouncements (continued) An entity applies those amendments to business combinations for which the acquisition date is on or after the beginning of the first annual reporting period beginning on or after January 1, 2019, with early application permitted. These amendments will apply on future business combinations of the Group. • IAS 12 Income Taxes
The amendments clarify that the income tax consequences of dividends are linked more directly to past transactions or events that generated distributable profits than to distributions to owners. Therefore, an entity recognises the income tax consequences of dividends in profit or loss, other comprehensive income or equity according to where the entity originally recognised those past transactions or events. An entity applies those amendments for annual reporting periods beginning on or after January 1, 2019, with early application is permitted. When an entity first applies those amendments, it applies them to the income tax consequences of dividends recognised on or after the beginning of the earliest comparative period. Since the Group’s current practice is in line with these amendments, the Group does not expect any effect on its consolidated financial statements. IFRS 16 Leases
IFRS 16 was issued in January 2016 and it replaces IAS 17 Leases, IFRIC 4 Determining whether an Arrangement contains a Lease, SIC-15 Operating Leases-Incentives and SIC-27 Evaluating the Substance of Transactions Involving the Legal Form of a Lease. IFRS 16 sets out the principles for the recognition, measurement, presentation and disclosure of leases and requires lessees to account for all leases under a single on-balance sheet model similar to the accounting for finance leases under IAS 17. The standard includes two recognition exemptions for lessees – leases of ’low-value’ assets (e.g., personal computers) and short-term leases (i.e., leases with a lease term of 12 months or less). At the commencement date of a lease, a lessee will recognise a liability to make lease payments (i.e., the lease liability) and an asset representing the right to use the underlying asset during the lease term (i.e., the right-of-use asset). Lessees will be required to separately recognise the interest expense on the lease liability and the depreciation expense on the right-of-use asset. Lessees will also be required to remeasure the lease liability upon the occurrence of certain events (e.g., a change in the lease term, a change in future lease payments resulting from a change in an index or rate used to determine those payments). The lessee will generally recognise the amount of the remeasurement of the lease liability as an adjustment to the right-of-use asset. IFRS 16 also requires the Group to make more extensive disclosures than under IAS 17. The Group plans to adopt the new standard using a modified retrospective approach and utilizing certain practical expedients provided. In IFRS consolidated financial statements assets and liabilities under IFRS 16 will be recognized as at January 1, 2019. The application of IFRS 16 requires the Group to make judgments that affect the valuation of lease liabilities and right-of-use assets. These include: determining contracts in scope of IFRS 16, determining the lease terms and determining the interest rate used for discounting of future cash flows. The Group identified three main groups of contracts as a subject to IFRS 16 application:
a) Rent of premises (mainly offices, parking and premises for data centers)
b) Rent of racks
c) Rent of physical telecommunication channels IFRS 16 provides several options for applying the standard to simplify and reduce costs for implementation.
a) The Group will apply practical expedients not to separate non-lease components from lease components, and instead will account for each lease component and any associated non-lease components as a single lease component as permitted by IFRS 16.
b) The Group will apply low-value assets lease recognition exemption, which is available on a lease-by-lease basis. The Group will recognise the lease payments associated with those leases as an expense on either a straight-line basis over the lease term or another systematic basis.
c) The Group elected not to apply simplifications for short-term leases and account for them using right-of-use asset model. The Group will present right-of-use asset on the face of Statement of Financial Position. The Group estimates the possible impact that application of IFRS 16 will have on the financial statements in the period of initial application as follows: increase in the amount of lease liabilities in the range of RUB 6-7 bln with corresponding increase in the amount of right-of-use assets as at January 1, 2019.
97Mail.ru Group Annual Report 2018

Notes to Consolidated Financial Statements (continued)
Mail.Ru Group 2018 Results 15
3 Summary of significant accounting policies Set out below are the principal accounting policies used to prepare these consolidated financial statements. 3.1 Principles of consolidation These consolidated financial statements comprise the financial statements of the Company and its subsidiaries as at December 31, 2018 and for the year then ended. Control is achieved when the Group is exposed, or has rights, to variable returns from its involvement with the investee and has the ability to affect those returns through its power over the investee. Specifically, the Group controls an investee if and only if the Group has:
• power over the investee (i.e. existing rights that give it the current ability to direct the relevant activities of the investee);
• exposure, or rights, to variable returns from its involvement with the investee; and
• the ability to use its power over the investee to affect its returns. When the Group has less than a majority of the voting or similar rights of an investee, the Group considers all relevant facts and circumstances in assessing whether it has power over an investee, including:
• the contractual arrangement with the other vote holders of the investee;
• rights arising from other contractual arrangements; and
• the Group’s voting rights and potential voting rights. The Group re-assesses whether or not it controls an investee if facts and circumstances indicate that there are changes to one or more of the three elements of control. Consolidation of a subsidiary begins when the Group obtains control over the subsidiary and ceases when the Group loses control of the subsidiary. Income and expenses of a subsidiary acquired or disposed of during the year are included in the statement of comprehensive income from the date the Group gains control until the date the Group ceases to control the subsidiary. Subsidiaries are fully consolidated from the date of acquisition, being the date on which the Group obtains control, and continue to be consolidated until the date that such control ceases. The financial statements of the subsidiaries are prepared for the same reporting period as the parent company, using consistent accounting policies. All intra-group balances, income and expenses and unrealised gains and losses resulting from intra-group transactions are eliminated. If the Group loses control over a subsidiary, it:
• derecognises the assets (including goodwill) and liabilities of the subsidiary;
• derecognises the carrying amount of any non-controlling interests;
• derecognises the cumulative translation differences recorded in equity;
• recognises the fair value of the consideration received;
• recognises the fair value of any investment retained;
• recognises any surplus or deficit in profit or loss; and
• reclassifies the parent’s share of components previously recognised in other comprehensive income to profit or loss or retained earnings, as appropriate, as would be required if the Group had directly disposed of the related assets or liabilities.
3.2 Business combinations and goodwill Business combinations are accounted for using the acquisition method. The cost of an acquisition is measured as the aggregate of the consideration transferred, measured at acquisition date fair value, and the amount of any non-controlling interest in the acquiree. For each business combination, the acquirer measures the non-controlling interest in the acquiree either at fair value or at the proportionate share of the acquiree’s identifiable net assets. Acquisition costs incurred, such as finder’s fees, legal fees, due diligence fees, and other professional and consulting fees, are expensed and included in operating expenses. The Group measures goodwill as the fair value of the consideration transferred including the recognised amount of any non-controlling interest in the acquiree, less the net recognised amount (generally fair value) of the identifiable assets acquired and liabilities assumed, all measured as of the acquisition date. Consideration transferred includes the fair values of the assets transferred, liabilities incurred by the Group to the previous owners of the acquiree, and equity interests issued by the Group. Consideration transferred also includes the fair value of any contingent consideration and vested share-based payment awards of the acquiree that are replaced in the business combination. If control is achieved in stages, the acquirer’s previously held equity interest in the acquiree is re-measured to fair value as at the acquisition date through profit or loss. A contingent liability of the acquiree is recognised in a business combination only if such a liability represents a present obligation and arises from a past event, and its fair value can be measured reliably.
98Mail.ru Group Annual Report 2018

Notes to Consolidated Financial Statements (continued)
Mail.Ru Group 2018 Results 16
3 Summary of significant accounting policies (continued) 3.2 Business combinations and goodwill (continued) Only components of non-controlling interest constituting a present ownership interest that entitles their holder to a proportionate share of the entity’s net assets in the event of liquidation are measured at either fair value or at the present ownership instruments’ proportionate share of the acquiree’s identifiable net assets. All other components are measured at their acquisition date fair value. The Group accounts for a change in the ownership interest of a subsidiary (without loss of control) as a transaction with owners in their capacity as owners. Therefore, such transactions do not give rise to goodwill, nor do they give rise to a gain or loss and are accounted for as an equity transaction. After initial recognition, goodwill is measured at cost less any accumulated impairment losses. For the purpose of impairment testing, goodwill acquired in a business combination is, from the acquisition date, allocated to each of the Group’s cash generating units that are expected to benefit from the synergies of the combination, irrespective of whether other assets or liabilities of the acquiree are assigned to those units. Where goodwill forms part of a cash-generating unit (CGU) and part of the operation within that unit is disposed of, the goodwill associated with the operation disposed of is included in the carrying amount of the operation when determining the gain or loss on disposal of the operation. Goodwill disposed of in this circumstance is measured based on the relative values of the operation disposed of and the portion of the cash-generating unit retained. If the Group reorganises its reporting structure in a way that changes the composition of one or more cash-generating units to which goodwill has been allocated, the goodwill is reallocated to the units affected. The reallocation is performed using a relative value approach similar to that used in connection with the disposal of an operation within a cash-generating unit, unless some other method better reflects the goodwill associated with the reorganised units. 3.3 Investments in associates Associates are entities in which the Group generally has between 20% and 50% of the voting rights, or is otherwise able to exercise significant influence, but which it does not control or jointly control. The Group participates in the operating management of its equity accounted associates and intends to stay involved in their operations from a long term perspective. Under the equity method, the investments in associates are carried in the statement of financial position at cost plus post acquisition changes in the Group’s share of net assets of the associate. Distributions received from an investee reduce the carrying amount of the investment. Goodwill relating to the associate is included in the carrying amount of the investment and is neither amortised nor individually tested for impairment. The consolidated statement of comprehensive income reflects the Group’s share of the results of operations of associates. Where there has been a change recognised directly in the equity of the associates, the Group recognises its share of any changes in the investment balance and discloses this, when applicable, in the statement of changes in equity. Unrealised gains and losses resulting from transactions between the Group and the associate are eliminated to the extent of the interest in the associate. Dividends received from equity accounted associates are shown in investing activities in the statement of cash flows. The share of profit and other comprehensive income of equity accounted associates is shown on the face of the statement of comprehensive income. This is the profit attributable to equity holders of the associates and therefore is profit after tax of the associates and after non-controlling interests in the subsidiaries of the associates. The Group’s share of movements in reserves is recognised in equity. However, when the Group’s share of accumulated losses in a equity accounted associate equals or exceeds its interest in the associate, the Group does not recognise further losses, unless the Group is obliged to make further payments to, or on behalf of, the associate. The financial statements of equity accounted associates are prepared for the same reporting period as the parent company. Where necessary, adjustments are made to bring the accounting policies in line with those of the Group. After application of the equity method, the Group determines whether it is necessary to recognise an impairment loss on the Group’s investment in its associates. The Group determines at each reporting date whether there is any objective evidence that the investment in the associate is impaired. Determining whether the investment is impaired is based on the guidance of IFRS 9 discussed under 3.12.6. If there is objective evidence that an associate is impaired, the Group calculates the amount of impairment as the difference between the recoverable amount of the associate and its carrying value in accordance with IAS 36 (as discussed under 3.14) and recognises the amount of impairment in earnings under ‘Impairment losses related to equity accounted associates’. If the recoverable amount of the impaired investment subsequently increases, the related impairment is reversed to the extent of such increase. Step acquisitions of significant influence in equity accounted associates previously classified as available-for-sale financial assets are accounted for using a cost-based approach whereby the investment in associate is recognised at the aggregate of (a) the historical cost of the available-for-sale investment and (b) the consideration transferred by the Group upon acquisition of significant influence. Any changes in the fair value of the available-for-sale investment are reversed through other comprehensive income upon acquisition of significant influence. Goodwill is calculated as a difference between (c) the cost of the investment so determined and (d) the Group’s share in the fair value of the investee’s net assets at the date significant influence is attained.
99Mail.ru Group Annual Report 2018
Notes to Consolidated Financial Statements (continued)
Mail.Ru Group 2018 Results 17
3 Summary of significant accounting policies (continued) 3.3 Investments in associates (continued) Upon acquisition of an additional stake in an existing associate where control is not obtained, the fair value of the consideration transferred for the additional stake is allocated to the acquired share of the fair value of associate’s assets and liabilities, and the excess is recognised as goodwill as part of the investment in equity accounted associates. Upon loss of significant influence over a equity accounted associate, the Group measures and recognises any remaining investment at its fair value. Any difference between (a) the carrying amount of the associate upon loss of significant influence and (b) the fair value of the retained investment and proceeds from disposal is recognised in profit or loss. 3.4 Property and equipment 3.4.1 Recognition and measurement Property and equipment are recorded at purchase or construction cost less accumulated depreciation and accumulated impairment. Interest costs on borrowings to finance the construction of property and equipment are capitalised, during the period of time that is required to complete and prepare the asset for its intended use. Expenditures for continuing repairs and maintenance are charged to earnings as incurred. Cost includes expenditure that is directly attributable to the acquisition of the asset. The cost of self-constructed assets includes the cost of materials and direct labour, any other costs directly attributable to bringing the asset to a working condition for its intended use, and the costs of dismantling and removing the items and restoring the site on which they are located. Purchased software that is integral to the functionality of the related equipment is capitalised as part of that equipment. When parts of an item of property and equipment have different useful lives, they are accounted for as separate items (major components) of property and equipment. Gains and losses on disposal of an item of property and equipment are recognised net under ‘Other non-operating income/(expense)’ in the statement of comprehensive income. The cost of replacing part of an item of property and equipment is recognised in the carrying amount of the item if it is probable that the future economic benefits embodied within the part will flow to the Group and its cost can be measured reliably. The carrying amount of the replaced part is derecognised. 3.4.2 Depreciation and useful life Depreciation is calculated on property and equipment on a straight-line basis from the time the assets are available for use, over their estimated useful lives as follows: Estimated useful life (in years)
Servers and computers 2-5 Furniture 7 Office IT equipment 2-3 Leasehold improvements Lesser of useful life or life of lease The assets’ residual values, useful lives and depreciation methods are reviewed, and adjusted as appropriate, at each financial year-end. The Group classifies advances paid to equipment suppliers as assets under construction in property and equipment in the consolidated statement of financial position. 3.5 Intangible assets other than goodwill Intangible assets acquired separately are measured on initial recognition at cost. The cost of intangible assets acquired in a business combination is their fair value as at the date of acquisition. Following initial recognition, intangible assets are carried at cost less any accumulated amortisation and assessed for impairment whenever there is an indication that the intangible asset may be impaired. 3.5.1 Software development costs Expenditure on research activities, undertaken with the prospect of gaining new scientific or technical knowledge and understanding, is recognised in the statement of comprehensive income when incurred. Development activities involve a plan or design for the production of new or substantially improved products and processes. Development expenditure is capitalised only if development costs can be measured reliably, the product or process is technically and commercially feasible, future economic benefits are probable, and the Group intends to and has sufficient resources to complete development and to use or sell the asset. The expenditure capitalised includes the cost of materials, direct labour and overhead costs that are directly attributable to preparing the asset for its intended use. Other development expenditure is recognised in profit or loss as incurred. Research and development costs recognised as an expense in the statement of comprehensive income during 2018 amounted to RUR 258 (2017: RUR 393).
100Mail.ru Group Annual Report 2018

Notes to Consolidated Financial Statements (continued)
Mail.Ru Group 2018 Results 18
3 Summary of significant accounting policies (continued) 3.5 Intangible assets other than goodwill (continued) Subsequent expenditure is capitalised only when it increases the future economic benefits embodied in the specific asset to which it relates. All other expenditure, including expenditure on internally generated goodwill and brands, is recognised in profit or loss as incurred. 3.5.2 Useful life and amortisation of intangible assets The Group assesses whether the useful life of an intangible asset is finite or indefinite and, if finite, the length of, or number of production or similar units constituting, that useful life. An intangible asset is regarded by the entity as having an indefinite useful life when, based on an analysis of all of the relevant factors, there is no foreseeable limit to the period over which the asset is expected to generate net cash inflows for the entity. The Group did not have any intangible assets with an indefinite useful life in the years ended December 31, 2018 and 2017. Intangible assets with finite lives are amortised over the useful economic lives and assessed for impairment whenever there is an indication that the intangible asset may be impaired. Amortisation periods and methods for intangible assets with finite useful lives are reviewed at least at each financial year-end. Changes in the expected useful life or the expected pattern of consumption of future economic benefits embodied in the asset are accounted for by changing the amortisation period or method, as appropriate, and treated as changes in accounting estimates. The estimated useful lives of the Group’s intangible assets are as follows: Estimated useful life (in years)
Patents and trademarks 7-20 Capitalised software development costs 3 Domain names 10 Games 3-9 Customer base 3-15 Licenses 3-5 Purchased software 1-4 3.6 Cash and cash equivalents Cash and cash equivalents comprise cash at banks and on hand, short-term deposits with an original maturity of three months or less and short-term, highly liquid investments that are readily convertible to known amounts of cash and which are subject to an insignificant risk of changes in value. All these items are included as a component of cash and cash equivalents for the purpose of the statement of financial position and statement of cash flows. 3.7 Employee benefits Wages and salaries paid to employees are recognised as expenses in the current period or are capitalised as part of software development costs. The Group also accrues expenses for future vacation payments. Under provisions of Russian legislation, social contributions are made through social insurance payments calculated by the Group by the application of a 30% rate to the portion of the annual gross remuneration of each employee not exceeding RUR 1,021 thousand and a rate of 15% to the portion exceeding this threshold. 3.8 Provisions Provisions are recognised when the Group has a present legal or constructive obligation as a result of past events, it is probable that an outflow of resources will be required to settle the obligation, and a reliable estimate of the amount can be made. Where the Group expects a provision to be reimbursed, for example under an insurance contract, the reimbursement is recognised as a separate asset but only when the reimbursement is virtually certain. If the effect of discounting is material, provisions are determined by discounting the expected value of future cash flows at a pre-tax rate that reflects current market assessments of the time value of money and, where appropriate, the risks specific to the liability. Where discounting is used, the increase in the provision due to the passage of time is recognised as an interest expense. 3.9 Revenue recognition Under IFRS 15, revenue is recognised at an amount that reflects the consideration to which an entity expects to be entitled in exchange for transferring goods or services to a customer. Revenues from services are recognised in the period when services are rendered.
101Mail.ru Group Annual Report 2018

Notes to Consolidated Financial Statements (continued)
Mail.Ru Group 2018 Results 19
3 Summary of significant accounting policies (continued) 3.9 Revenue recognition (continued) 3.9.1 Online advertising 3.9.1.1 Display advertising Promo posts in social networks, video and banner advertising space for display advertising is sold on a dynamic basis (i.e., a function of time that an advertisement lasts) or a static basis (i.e., according to the number of page views on an advertisement). The Group has standard rates for online advertisements that depend on several factors, including the specific web page on which the banner appears, the length of the contract, the season, and the format, size and position of the advertisement. Display advertising revenue is recognised as the services are provided (i.e., as per page view for dynamic banners and over the contractual term for static banners). For display advertising sold through some third party advertising agencies, revenue generally is recognised net of any portion attributable to the third parties. For arrangements related to display advertising where the Group does not control advertising services before these services are transferred to end customers, and hence, the Group is an agent rather than a principal in these contracts. 3.9.1.2 Context advertising The Group earns revenues for search context advertising through partnerships with third parties. Once a user carries out a search on certain of the Group’s websites, search results and advertisement links are displayed on the webpage based on relevancy to the search topic and other known user parameters. When clicked on by the user, the advertisement links lead to sites owned by the third parties’ advertising customers, for which the third party receives a fee, a portion of which it shares with the Group. Context advertising revenue is recognised as the services are provided (i.e., upon “click-through”, which is when a user clicks on an advertiser’s listing) on a net basis. This type of context advertising revenues is based on reports provided by third parties. Context advertising also includes revenue from the Group’s myTarget self-serve advertising technology (“target advertising”). Target advertisements are priced on either pay-per-click or pay-per-view basis. Revenue from pay-per-click advertisements is recognised upon click-through, while revenue from pay-per-view advertisements is recognised as the advertisements are viewed. Context advertising also includes revenue related to the placement of target advertising, display advertising and advertising through integration in applications, advertising thought offers on the Group’s websites and in applications, advertising via networks comprising advertising banners placement on third party websites and advertising on the Group's site communities pages. The revenue from advertising in applications, on the web pages of communities and via networks is recognised on a gross basis with costs and commissions paid to third party owners and administrators of websites, applications, platforms and communities recognised in “Agent/partner fees”. 3.9.2 Internet value-added services (“IVAS”) Revenue from IVAS is derived from a variety of Internet-based services, including communication products and online games.
3.9.2.1 Revenue from MMO games The Group operates its games mainly under the free-to-play game model. The Group derives its online game revenue from in-game virtual items representing additional functionality and features for the game players’ characters purchased by game players to play the Group’s MMO games and casual games. The amounts of cash or receivables from payment systems for cash from the users, net of short messaging service operators, are not recognised as revenues and are credited to deferred revenue. They are then converted by the players into in-game points. In-game points are used to purchase in-game items. Under the item-based revenue model, revenues are recognised over the life of the in-game virtual items that game players purchase or as the in-game virtual items are consumed. Deferred revenue is reduced as revenues are recognised. The estimated life span of in-game items is determined based on historical player usage patterns and playing behaviour. The Group enters into licensing arrangements with overseas licensees to operate the Group’s games in other countries and regions. These licensing agreements provide two separate elements, each having commercial substance: the initial non-refundable fees and the usage-based royalty fees. The initial non-refundable payment represents the license of the game and is recognised as license revenue immediately once the games are launched into commercial use by the licensees. Ongoing usage-based royalties determined based on the amount of money charged to the players’ accounts or services payable by players in a given country or region to the licensees are recognised when they are earned, provided that the collection is probable. 3.9.2.2 Community IVAS The Group derives Community IVAS revenues through certain communication products, where users pay a fee for the paid content and online services, mainly through social networking web sites and through the commission from third party developers of the various applications placed on social networking web sites, including games, based on the respective applications’ revenue. The fees for such services are collected from customers using various payment channels, including bank cards, online payment systems and mobile operators and from the applications developers. The mobile network operators collect fees for such services from their customers, usually through mobile short message services (“SMS”), and pass such fees to the Group. Revenues from third party applications and developers on the Group’s platforms are recognised net of commission to mobile operators and any portion attributable to the developer of the application, at the time when customer payment is due. Revenues from services including games developed by the Group and operated on third party platforms are reported gross as the services are provided net of commission to mobile operators. If the amount of revenue is measured based on third party data, such amounts of revenue are recorded based on the best available data at the date of issuance of the financial statements.
102Mail.ru Group Annual Report 2018

Notes to Consolidated Financial Statements (continued)
Mail.Ru Group 2018 Results 20
3 Summary of significant accounting policies (continued) 3.9 Revenue recognition (continued) 3.9.3 Other revenue 3.9.3.1 Food delivery revenue Food delivery revenue consists substantially of commission from restaurants for courier services rendered by the Group. Commission is charged for each order delivered to the final customers of restaurants who pay upon delivery of food. Revenue from delivery services is recognized when the customer’s order is completed. 3.9.3.2 Other revenues Other revenues primarily consist of classifieds revenue, e-learning, non-advertising b2b big data services,database software implementation and support services, listing fees and dividends from venture investments. 3.10 Income taxes The Company as a Cypriot tax resident is not subject to tax on capital gains and withholding taxes. However, in some jurisdictions where the Company’s subsidiaries and associates are incorporated (particularly in Russia), investment income is subject to withholding tax deducted at the source of the income. The Group presents the withholding tax separately from the gross dividend income in the statement of comprehensive income and the statement of cash flows. The Group is also subject to taxation in Russia, the Netherlands and some other jurisdictions its subsidiaries operate in (see also Note 18). Current income tax
Current income tax assets and liabilities for the current and prior periods are measured at the amount expected to be recovered from or paid to the taxation authorities. The tax rates and tax laws used to compute the amount are those that are enacted or substantively enacted by the reporting date. Current income tax relating to items recognised directly in other comprehensive income is recognised in other comprehensive income and not in profit or loss. Deferred income tax
Deferred tax is recognised in respect of temporary differences between the carrying amounts of assets and liabilities for financial reporting purposes and the amounts used for taxation purposes. Deferred tax is not recognised for the following temporary differences: the initial recognition of assets or liabilities in a transaction that is not a business combination and that affects neither accounting nor taxable profit or loss, and differences relating to investments in subsidiaries and jointly controlled entities to the extent that it is probable that they will not reverse in the foreseeable future. In addition, deferred tax is not recognised for taxable temporary differences arising on the initial recognition of goodwill. Deferred tax is measured at the tax rates that are expected to be applied to temporary differences when they reverse, based on the laws that have been enacted or substantively enacted by the reporting date. Deferred tax assets and liabilities are offset if there is a legally enforceable right to offset current tax liabilities and assets, and they relate to income taxes levied by the same tax authority on the same taxable entity, or on different tax entities, but they intend to settle current tax liabilities and assets on a net basis or their tax assets and liabilities will be realised simultaneously. A deferred tax asset is recognised for unused tax losses, tax credits and deductible temporary differences, to the extent that it is probable that future taxable profits will be available against which they can be utilised. Deferred tax assets are reviewed at each reporting date and are reduced to the extent that it is no longer probable that the related tax benefit will be realised. 3.11 Share-based payment transactions Employees (including senior executives) of the Group and its associates (each of which a “share-based payment recipient”), may receive remuneration in the form of share-based payment transactions, whereby share-based payment recipients render services as consideration for equity instruments (“equity-settled transactions”) or a cash equivalent thereof (“cash-settled share-based payments”). Where the terms of an equity-settled award are modified, the minimum expense recognised is the expense as if the terms had not been modified. An additional expense is recognised for any modification, which increases the total fair value of the share-based payment arrangement, or is otherwise beneficial to the share-based payment recipient as measured at the date of modification. If the Group has a choice to settle share-based payments in cash or in equity, the entire transaction is treated either as cash-settled or as equity-settled, depending on whether or not the Group has a present obligation to settle in cash. 3.11.1 Equity-settled transactions The cost of equity-settled transactions with share-based payment recipients for awards granted is measured by reference to the fair value of the awards at the date on which they are granted. The fair value is determined using an appropriate pricing model (Black-Scholes-Merton, binomial, Monte-Carlo or other).
103Mail.ru Group Annual Report 2018

Notes to Consolidated Financial Statements (continued)
Mail.Ru Group 2018 Results 21
3 Summary of significant accounting policies (continued) 3.11 Share-based payment transactions (continued) The cost of equity-settled transactions is recognised, together with a corresponding increase in equity, over the period in which the performance and/or service conditions are fulfilled, ending on the date on which the relevant share based payment recipients become fully entitled to the award (“the vesting date”). The cumulative expense recognised for equity-settled transactions at each reporting date until the vesting date reflects the extent to which the vesting period has expired and the Group's best estimate of the number of equity instruments that will ultimately vest. The expense or credit for a period recognised in profit or loss represents the movement in cumulative expense recognised as at the beginning and end of that period. No expense is recognised for awards that do not ultimately vest based on estimated forfeiture rates or as actual forfeitures occur for groups of employee where we cannot make reliable estimates. Where the terms of an equity-settled award are modified, the minimum expense recognised is the expense as if the terms had not been modified. An additional expense is recognised for any modification, which increases the total fair value of the share-based payment arrangement, or is otherwise beneficial to the share-based payment recipient as measured at the date of modification. Where an equity-settled award is cancelled, it is treated as if it had vested on the date of cancellation, and any expense not yet recognised for the award is recognised immediately. This includes any award where non-vesting conditions within the control of either the entity or the counterparty are not met. However, if a new award is substituted for the cancelled award, and designated as a replacement award on the date that it is granted, the cancelled and new awards are treated as if they were a modification of the original award, as described in the preceding paragraph. The dilutive effect, if any, of outstanding options is reflected as additional share dilution in the computation of diluted earnings per share (Note 19). 3.11.2 Cash-settled transactions The cost of cash-settled transactions is measured initially at fair value at the grant date using a binomial model, further details of which are provided in Note 24. This fair value is expensed over the period until the vesting date with recognition of a corresponding liability. The liability is re-measured to fair value at each reporting date up to, and including the settlement date, with changes in fair value recognised in ‘Personnel expense’. 3.11.3 Accounting for the change in form of settlement of share-based payments As a result of modification of share-based payment awards from equity-settled to cash-settled the Group recognises a share-based payment expense which comprises as a minimum the following elements:
• the grant date fair value of the original equity-settled award; plus
• any incremental fair value arising from the modification of that award; plus
• any remeasurement of the liability between its fair value at modification date and the amount finally settled. At the date of modification a liability is recognised based on the fair value of the cash-settled award as at that date and the extent to which the vesting period has expired, with a corresponding increase in equity. The total fair value of the cash-settled award is remeasured through profit or loss on an ongoing basis between the date of modification and the date of settlement. 3.12 Financial instruments 3.12.1 Initial recognition and measurement Financial assets within the scope of IFRS 9 are classified as financial assets at fair value through profit or loss, financial assets through other comprehensive income or financial assets at amortised cost, as appropriate. Financial liabilities within the scope of IFRS 9 are classified as financial liabilities at fair value through profit or loss and financial liabilities at amortised cost as appropriate. The Group determines the classification of its financial assets and liabilities at initial recognition. All financial assets are recognised initially at fair value plus, in the case of investments not at fair value through profit or loss, directly attributable transaction costs. At initial recognition, the Group measures trade receivables at their transaction price (as defined in IFRS 15) if the trade receivables do not contain a significant financing component in accordance with IFRS 15. Financial liabilities are recognised initially at fair value and, in the case of loans and borrowings, directly attributable transaction costs. In order for a financial asset to be classified and measured at amortised cost, it needs to give rise to cash flows that are ‘solely payments of principal and interest (SPPI)’ on the principal amount outstanding. This assessment is referred to as the SPPI test and is performed at an instrument level. The Group’s business model for managing financial assets refers to how it manages its financial assets in order to generate cash flows. The business model determines whether cash flows will result from collecting contractual cash flows, selling the financial assets, or both. The Group’s financial assets include cash and cash equivalents, short-term time deposits, trade and other receivables, financial investments in venture capital investees (as defined under 3.17), and derivative financial assets, mainly over equity instruments of the Group’s investees. The Group's financial liabilities include trade and other payables, loans and borrowings, and derivative financial liabilities, mainly over equity instruments of the Group’s associates and subsidiaries. None of the derivative financial instruments held by the Group were designated as effective hedging instruments.
104Mail.ru Group Annual Report 2018

Notes to Consolidated Financial Statements (continued)
Mail.Ru Group 2018 Results 22
3 Summary of significant accounting policies (continued) 3.12 Financial instruments (continued) 3.12.2 Subsequent measurement The subsequent measurement of financial instruments depends on their classification. The Group classifies its financial assets and liabilities into the categories below in accordance with IFRS 9, as follows: 3.12.2.1 Financial assets and liabilities at fair value through profit or loss Financial assets and liabilities at fair value through profit and loss are carried in the statement of financial position at fair value. The changes in their fair value are recognised in the statement of comprehensive income as follows:
• The changes in the fair value of financial investments in associates and those derivative financial assets and liabilities where the underlying asset is represented by equity instruments of a financial investee, are recorded under ‘Net gain/(loss) on venture capital investments and associated derivative financial assets and liabilities’ and are included in the Group’s operating income; and
• The changes in the fair value of derivative financial assets where the underlying asset is represented by equity instruments of a subsidiary, as well as other derivative financial assets, are recorded under ‘Net gain/(loss) on financial assets and liabilities at fair value through profit or loss over the equity of subsidiaries and other agreements’.
3.12.2.2 Financial assets and liabilities at amortised cost This category is the most relevant to the Group. The Group measures financial assets at amortised cost if both of the following conditions are met:
• The financial asset is held within a business model with the objective to hold financial assets in order to collect contractual cash flows, and
• The contractual terms of the financial asset give rise on specified dates to cash flows that are solely payments of principal and interest on the principal amount outstanding.
Financial assets at amortised cost are subsequently measured using the effective interest (EIR) method and are subject to impairment. Gains and losses are recognised in profit or loss when the asset is derecognised, modified or impaired. The Group’s financial assets at amortised cost includes trade receivables, and loan to an associate and loan to a director included under other non-current financial assets. After initial recognition, interest bearing loans and borrowings and other financial liabilities are subsequently measured at amortised cost using the EIR method. Gains and losses are recognised in the statement of comprehensive income when the liabilities are derecognised as well as through the amortisation process. Amortised cost is calculated by taking into account any discount or premium on acquisition and fees or costs that are an integral part of the EIR. The EIR amortisation is included in ‘Finance expenses in the statement of comprehensive income. 3.12.2.3 Contingent consideration Contingent consideration recognised by the Group in a business combination to which IFRS 3 applies is subsequently measured at fair value with changes recognised in profit or loss under ‘Net gain/(loss) on derivative financial assets and liabilities at fair value through profit or loss’. Contingent consideration includes the liabilities shown in the statement of financial position under ‘Other payables, accrued expenses and contingent consideration liabilities’. 3.12.3 Derecognition A financial asset (or, where applicable a part of a financial asset or part of a group of similar financial assets) is de-recognised where:
• The rights to receive cash flows from the asset have expired; or
• The Group has transferred its rights to receive cash flows from the asset or has assumed an obligation to pay the received cash flows in full without material delay to a third party under a ‘pass-through’ arrangement; and
• Either (a) the Group has transferred substantially all the risks and rewards of the asset, or (b) the Group has neither transferred nor retained substantially all the risks and rewards of the asset, but has transferred control of the asset.
The Group de-recognises a financial liability when the obligation under the liability is discharged, cancelled or expires. 3.12.4 Offsetting of financial instruments Financial assets and financial liabilities are offset and the net amount reported in the consolidated statement of financial position if, and only if, there is a currently enforceable legal right to offset the recognised amounts and there is an intention to settle on a net basis, or to realise the assets and settle the liabilities simultaneously.
105Mail.ru Group Annual Report 2018

Notes to Consolidated Financial Statements (continued)
Mail.Ru Group 2018 Results 23
3 Summary of significant accounting policies (continued) 3.12 Financial instruments (continued)
3.12.5 Fair value of financial instruments The fair value of financial instruments that are actively traded in organised financial markets is determined by reference to quoted market bid prices at the close of business on the reporting date. For financial instruments where there is no active market, fair value is determined using valuation techniques. Such techniques may include: using recent arm's length market transactions; reference to the current fair value of another instrument that is substantially the same; discounted cash flow analysis or other valuation models. An analysis of fair values of financial instruments and further details as to how they are measured are provided in Note 22.
3.12.6 Impairment of financial assets The Group recognises an allowance for expected credit losses (“ECLs”) for all debt instruments not held at fair value through profit or loss. ECLs are based on the difference between the contractual cash flows due in accordance with the contract and all the cash flows that the Group expects to receive, discounted at an approximation of the original effective interest rate. The expected cash flows will include cash flows from the sale of collateral held or other credit enhancements that are integral to the contractual terms. For trade receivables the Group applies a simplified approach in calculating ECLs. The Group has established a provision matrix that is based on its historical credit loss experience, adjusted for forward-looking factors specific to the debtors and the economic environment.
3.12.6.1 Financial assets carried at amortised cost For financial assets carried at amortised cost (loans and receivables), evidence of impairment may include indications that the debtor or a group of debtors is experiencing significant financial difficulty, default or delinquency in interest or principal payments, the probability that they will enter bankruptcy or other financial reorganisation and where observable data indicate that there is a measurable decrease in the estimated future cash flows, such as changes in arrears or economic conditions that correlate with defaults. If there is objective evidence that an impairment loss has been incurred, the amount of the loss is measured as the difference between the asset’s carrying amount and the present value of estimated future cash flows (excluding future expected credit losses that have not yet been incurred) discounted using the asset’s original EIR. The carrying amount of the asset is reduced through the use of an allowance account and the amount of the loss is recognised in profit or loss as a ‘Bad debt expense’ in ‘Other operating expenses’. The allowance is estimated based on a combination of specific accounts and general ageing analysis. Trade accounts receivable are recorded at the invoiced amount and are non-interest bearing. Credit is only granted to customers after a review of credit history. 3.13 Foreign currency translation The consolidated financial statements are presented in RUR, which is the Group's presentation currency, and all values are rounded to the nearest million (RUR ’000000) except per share information and unless otherwise indicated. Each entity in the Group determines its own functional currency and items included in the financial statements of each entity are measured using that functional currency. The functional currency of the Group’s Russian subsidiaries and associates as well as the Company itself is RUR. Transactions in foreign currencies are initially recorded in the functional currency at the rate ruling at the date of transaction. Monetary assets and liabilities denominated in foreign currencies are retranslated at the measurement currency rate of exchange ruling at the reporting date. All resulting differences are taken to the consolidated statement of comprehensive income and included in the determination of net profit as ‘Net foreign exchange (losses)/gains’. Non-monetary items that are measured in terms of historical cost in a foreign currency are translated using the exchange rate as at the date of initial transaction. As at the reporting date, the assets and liabilities of the Company and its subsidiaries with functional currencies other than the RUR are translated into the presentation currency of the Group (RUR) at the rate of exchange ruling at the reporting date and their operations are translated at exchange rates prevailing at the date of the transactions. The exchange differences arising on the translation are recognised in other comprehensive income. 3.14 Impairment of non-financial assets and investments in equity accounted associates The Group assesses at each reporting date whether there is an indication that an asset may be impaired. If any indication exists, or when annual impairment testing for an asset is required, the Group estimates the asset’s recoverable amount. An asset’s recoverable amount is the higher of an asset’s or cash-generating unit’s (“CGU”) fair value less costs to sell and its value in use and is determined for an individual asset, unless the asset does not generate cash inflows that are largely independent of those from other assets or groups of assets. Where the carrying amount of an asset or CGU exceeds its recoverable amount, the asset is considered impaired and is written down to its recoverable amount. In assessing value in use, the estimated future cash flows are discounted to their present value using a pre-tax discount rate that reflects current market assessments of the time value of money and the risks specific to the asset. In determining fair value less costs to sell, an appropriate valuation model is used. These calculations are corroborated by valuation multiples, quoted share prices for publicly traded subsidiaries or other available fair value indicators. Impairment losses of continuing operations are recognised in earnings in those expense categories consistent with the function of the impaired asset.
106Mail.ru Group Annual Report 2018

Notes to Consolidated Financial Statements (continued)
Mail.Ru Group 2018 Results 24
3 Summary of significant accounting policies (continued) 3.14 Impairment of non-financial assets and investments in equity accounted associates (continued) For assets excluding goodwill, an assessment is made at each reporting date as to whether there is any indication that previously recognised impairment losses may no longer exist or may have decreased. If such indication exists, the Group estimates the asset’s or cash-generating unit’s recoverable amount. A previously recognised impairment loss is reversed only if there has been a change in the assumptions used to determine the asset’s recoverable amount since the last impairment loss was recognised. The reversal is limited so that the carrying amount of the asset does not exceed its recoverable amount, nor exceed the carrying amount that would have been determined, net of depreciation or amortisation, had no impairment loss been recognised for the asset in prior years. Such reversal is recognised in earnings. Goodwill is tested for impairment annually and when circumstances indicate that the carrying value may be impaired. Impairment is determined for goodwill by assessing the recoverable amount of each CGU (or group of CGUs) to which the goodwill relates. Where the recoverable amount of the CGU is less than its carrying amount an impairment loss is recognised. Impairment losses relating to goodwill cannot be reversed in future periods. 3.15 Earnings per share The Group presents basic and diluted earnings per share (“EPS”) data for its ordinary and Class A shares. Basic EPS is calculated by dividing the profit or loss attributable to shareholders of the Company by the weighted average number of shares outstanding during the period, adjusted for own shares held. Diluted EPS is determined by adjusting the profit or loss attributable to shareholders and the weighted average number of shares outstanding, adjusted for own shares held, for the effects of all dilutive potential ordinary shares, which may comprise share options granted to employees of the Group. 3.16 Segment reporting An operating segment is a component of the Group that engages in business activities from which it may earn revenues and incur expenses, including revenues and expenses that relate to transactions with any of the Group’s other components. An operating segment’s operating results are reviewed regularly by the Group’s chief operating decision maker (“CODM”) to make decisions about resources to be allocated to the segment and assess its performance, and for which discrete financial information is available. Segment results that are reported to the CODM include items directly attributable to a segment as well as those that can be allocated on a reasonable basis. 3.17 Financial investments in venture capital investees Financial investments in venture capital investees, are the Group’s investments in start-up Internet ventures and smaller Internet companies in Russia, Ukraine and Israel with ownership ranging from 1.5% to 50% and which gives the Group significant influence in some of these investments. They form the Group’s venture capital portfolio and are monitored and managed exclusively on the basis of their fair values. The Group’s involvement in the operating management of the investees is limited, and the possibility of the Group maintaining a specific financial investment in its investment portfolio in the long run is remote. Financial investments in such associates are carried in the statement of financial position at fair value even though the Group may exert significant influence over those companies. This treatment is permitted by IAS 28 Investments in Associates and Joint Ventures, which allows investments held by venture capital organisations to be excluded from its scope where those investments are designated, upon initial recognition, as at fair value through profit or loss and accounted for in accordance with IFRS 9, with changes in fair value recognised in profit or loss in the period of the change. Accounting policies of the Group with respect to financial investments in associates are discussed in more detail under 3.12 above as part of the Group’s accounting policies with respect to financial assets. 4 Significant accounting judgments, estimates and assumptions The preparation of consolidated financial statements in conformity with IFRS requires management to make estimates and assumptions that affect the reported amounts of assets and liabilities, disclosures of contingent assets and liabilities at the reporting dates and the reported amounts of revenues and expenses during the reporting periods. However, uncertainty about these assumptions and estimates could result in outcomes that require a material adjustment to the carrying amount of the asset or liability affected in future periods. 4.1 Judgments In the process of applying the Group's accounting policies, management has made the following judgments which have the most significant effect on the amounts recognised in the consolidated financial statements: 4.1.1 Consolidation and accounting for associates The Company directly or indirectly owned up to 50% in certain of its investments. Based on its voting rights and restrictions in the respective governing documents, the Group made judgments about whether it has control or significant influence over these investments. Subsequently, these entities are either accounted for as subsidiaries (consolidated) or associates (accounted for under the equity method or as financial assets through profit or loss).
107Mail.ru Group Annual Report 2018

Notes to Consolidated Financial Statements (continued)
Mail.Ru Group 2018 Results 25
4 Significant accounting judgments, estimates and assumptions (continued) 4.1 Judgments (continued) Under the equity method, the investment in an associate or a joint venture is initially recognised at cost. The carrying amount of the investment is adjusted to recognise changes in the Group’s share of net assets of the associate or joint venture since the acquisition date. Goodwill relating to the associate or joint venture is included in the carrying amount of the investment and is not tested for impairment separately. The statement of profit or loss reflects the Group’s share of the results of operations of the associate or joint venture. Any change in OCI of those investees is presented as part of the Group’s OCI. In addition, when there has been a change recognised directly in the equity of the associate or joint venture, the Group recognises its share of any changes, when applicable, in the statement of changes in equity. Unrealised gains and losses resulting from transactions between the Group and the associate or joint venture are eliminated to the extent of the interest in the associate or joint venture. The aggregate of the Group’s share of profit or loss of an associate and a joint venture is shown on the face of the statement of profit or loss outside operating profit and represents profit or loss after tax and noncontrolling interests in the subsidiaries of the associate or joint venture. The financial statements of the associate or joint venture are prepared for the same reporting period as the Group. When necessary, adjustments are made to bring the accounting policies in line with those of the Group. After application of the equity method, the Group determines whether it is necessary to recognise an impairment loss on its investment in its associate or joint venture. At each reporting date, the Group determines whether there is objective evidence that the investment in the associate or joint venture is impaired. If there is such evidence, the Group calculates the amount of impairment as the difference between the recoverable amount of the associate or joint venture and its carrying value, and then recognises the loss within ‘Share of profit of an associate and a joint venture’ in the statement of profit or loss. Upon loss of significant influence over the associate or joint control over the joint venture, the Group measures and recognises any retained investment at its fair value. Any difference between the carrying amount of the associate or joint venture upon loss of significant influence or joint control and the fair value of the retained investment and proceeds from disposal is recognised in profit or loss. 4.1.2 Consolidation of a structured entity In November 2010, the Company established, as settlor, an employee benefit trust (the “Trust”) under a Trust Deed dated November 11, 2010 (“Trust Deed”), the trustee of which is Mail.ru Employee Benefit Trustees Limited (the “Trustee”). The purpose of the Trust consists in holding trust funds for present and former employees and consultants and related persons. The Trustee manages employee stock options under the 2010 Option Plan (as defined in Note 24). Starting from October 2011, the Trustee was also instructed by the Company to acquire GDRs representing shares of the Company on the stock market and transfer those GDRs to employees in settlement of the 2010 Option Plan options as the options are exercised by the employees. The Group does not hold any equity interest in the Trust; however, under the Trust Deed, the Group has the power to appoint and remove the Trustee at its sole discretion. The operations of the Trust are restricted per the Trust Deed to the activities described above and are solely used by the Group. Based on these facts and circumstances, management concluded that the Group controls the Trustee and, therefore, consolidates the Trustee in its financial statements. 4.1.3 Accounting treatment of share-based payments where the Group has a choice to settle in cash or equity The Group has wide discretion over the manner of settlement of options issued and determines the accounting treatment of the options based on whether the Group has a present obligation to settle in cash. Specifically, any option holder granted an aggregate of 20,000 or more options was only allowed to exercise the respective portion options in the form of GDRs, while exercises by the optionees granted a smaller cumulative number of options can continue to be in GDRs or cash at the Group’s discretion. The terms of the option plan and past exercise history make it reasonable to expect cash settlement of most of the smaller option exercises, even though the Group continues to have discretion over the way of option exercise settlement. Larger than cumulative 20,000 options per person continue to be accounted for as equity awards. 4.2 Estimates and assumptions Significant estimates and assumptions reflected in the Group’s financial statements include, but are not limited to the following:
• revenue recognition;
• fair value of financial instruments;
• useful lives of intangible assets;
• software development costs;
• impairment of goodwill and other intangible assets;
• fair value of assets and liabilities in business combinations; and
• recoverability of deferred tax assets. Actual results could materially differ from those estimates. The key assumptions concerning the future events and other key sources of estimation uncertainty at the reporting date that have a significant risk of a material adjustment to the carrying amounts of assets and liabilities within the next financial year are discussed below.
108Mail.ru Group Annual Report 2018

Notes to Consolidated Financial Statements (continued)
Mail.Ru Group 2018 Results 26
4 Significant accounting judgments, estimates and assumptions (continued)
4.2 Estimates and assumptions (continued)
4.2.1 Revenue recognition – in-game items life span Deferred revenue is recognised as revenue over the estimated life span of the in-game items purchased or as the in-game items purchased with the game points are consumed. The estimated life span of in-game items is determined based on historical player usage patterns and playing behaviour. Future usage patterns may differ from the historical usage patterns on which the Group’s revenue recognition policy is based. The Group monitors the operational statistics and usage patterns of its online games and modifies the expected life span when materially different. Another significant judgements that significantly affect the determination of the amount and timing of revenue from contracts with customers in accordance with IFRS 15 include (i) the timing of satisfaction of performance obligations and (ii) the transaction price and the amounts allocated to performance obligations.
4.2.2 Fair value of financial instruments Where the fair value of financial assets and financial liabilities recorded in the statement of financial position cannot be derived from active markets, they are determined using valuation techniques including the discounted cash flows model. The inputs to these models are taken from observable markets where possible, but where this is not feasible, estimates and assumptions have to be made, and a degree of judgment has to be applied in establishing fair values. The judgments, estimates and assumptions include considerations of inputs such as liquidity risk, credit risk and volatility. Changes in assumptions about these factors could affect the reported fair value of financial instruments. The expected volatility in the pricing models used to measure the fair value of the derivative financial assets and liabilities is determined by reference to peer companies’ historical volatility, as the issuers of the underlying equity instruments are not public. When determining risk-free rates to be used in the pricing models, regard is given to US Treasury bonds or Russian government bonds with maturities equal to the expected terms of the respective derivative financial instruments. Detailed information on the fair values of the Group’s financial instruments is available in Note 22.
4.2.3 Useful life of intangible assets The Group estimates remaining useful lives of its intangible assets at least once a year at the reporting date. If the estimation differs from the previous estimations, the changes are accounted for in accordance with IAS 8 Accounting Policies, Changes in Accounting Estimates and Errors. These estimates may have a significant impact on the carrying value of intangible assets and amortisation, charged to earnings. The carrying value of intangible assets is disclosed in Note 7.
4.2.4 Software development costs Software development costs are capitalised in accordance with the accounting policy described in Note 3.5.1. Initial capitalisation of costs is based on management's judgment that technological and economical feasibility is confirmed, usually when a product development project has reached a defined milestone according to an established project management model. In determining the amounts to be capitalised management makes assumptions regarding the expected future cash generation of the assets, discount rates to be applied and the expected period of benefits.
4.2.5 Impairment of goodwill and other intangible assets Impairment exists when the carrying value of an asset or cash generating unit exceeds its recoverable amount, which is the higher of its fair value less costs of disposal and its value in use. The fair value less costs of disposal calculation is based on available data from binding sales transactions, conducted at arm’s length, for similar assets or observable market prices less incremental costs for disposing of the asset. The value in use calculation is based on a discounted cash flow (“DCF”) model. The cash flows are derived from management forecast. The recoverable amount is sensitive to the discount rate used for the DCF model as well as the growth rate used for extrapolation purposes. The key assumptions used to determine the recoverable amount for the different CGUs, including a sensitivity analysis, are disclosed and further explained in Notes 7 and 11.
4.2.6 Fair value of assets and liabilities in business combinations At the acquisition date the Group recognises separately the identifiable assets, liabilities and contingent liabilities acquired or assumed in a business combination at their fair values, which involves estimates. Such estimates are based on valuation methods that require considerable judgment in forecasting future cash flows and developing other assumptions.
4.2.7 Share-based payments Management estimates the fair value of equity-settled stock options at the date of grant and the fair value of cash-settled options at each reporting date using the Black-Scholes-Merton, binominal, Monte-Carlo or other option pricing models, as applicable. The option pricing models were originally developed for use in estimating the fair value of traded options, which have different characteristics than the Group’s stock options granted by the Company. The models are also sensitive to changes in the subjective assumptions, which can materially affect the fair value estimate. These subjective assumptions include expected volatility, dividend yield, risk-free interest and forfeiture rates.
4.2.8 Deferred taxes on undistributed earnings Deferred tax is recognised based on estimated dividends distributions of Company’s subsidiaries taking into account limitation of cash and cash equivalents available at the reporting date.
109Mail.ru Group Annual Report 2018

Notes to Consolidated Financial Statements (continued)
Mail.Ru Group 2018 Results 27
4 Significant accounting judgments, estimates and assumptions (continued)
4.2 Estimates and assumptions (continued) 4.2.9 Changes in estimates In Q4 2018, the Group changed its estimates with respect to useful live of certain MMO games used in calculation of deferred revenue. The changes resulted from reassessment by management of the games’ remaining useful lives based on relevant recent operational statistics. The changes in estimates were recorded prospectively starting from October 1, 2018 and resulted in a decrease in revenue and an increase in deferred revenue estimated at RUR 877. 5 Operating segments In reviewing the operational performance of the Group and allocating resources, the Chief Executive Officer of the Group, who is the Group’s Chief Operating Decision Maker (CODM), reviews selected items of each segment's income statement, assuming 100% ownership in all of the Group’s key operating subsidiaries, based on management reporting. Management reporting is different from IFRS, because it does not include certain IFRS adjustments which are not analysed by the CODM in assessing the core operating performance of the business. Such adjustments affect such major areas as revenue recognition, deferred tax on unremitted earnings of subsidiaries, share-based payments, disposal or impairment of investments , business combinations, fair value adjustments, amortisation and impairment thereof, net foreign exchange gains and losses, share in financial results of associates, as well as irregular non-recurring items that occur from time to time and are evaluated for adjustment as and when they occur. The tax effect of these adjustments is also excluded from management reporting. The financial information of the key subsidiaries acquired during the reporting period or after the reporting period but prior to the date of these consolidated financial statements is included into the segment disclosure starting from the beginning of the earliest comparative period included in the financial statements. The financial information of subsidiaries disposed of and assets classified as held for sale prior to the date of these consolidated financial statements is excluded from the segment presentation starting from the beginning of the earliest period presented. Accordingly, segment reporting for the year ended December 31, 2018 and the respective comparative segment financial information has been retrospectively adjusted, as applicable, to include the financial information of ZakaZaka, ESforce, Am.ru (Note 6), UMA and to exclude Pandao all starting from January 1, 2017. The Group has identified the following reportable segments based on the types of products and services offered:
• Email, Portal and IM;
• VK (Vkontakte);
• Social Networks (excluding VK);
• Online Games; and
• E-commerce, Search and Other Services. The Email, Portal and IM segment includes email, instant messaging and portal (main page and verticals). It earns substantially all revenues from display and context advertising. The VK segment includes the Group’s social network Vkontakte (VK.com) and earns revenues from (i) commission from application developers based on the respective applications’ revenue, (ii) user payments for virtual gifts, stickers and music subscriptions and (iii) online advertising, including display and context advertising. The Social Networks (excluding VK) segment includes the Group’s two other social networks (OK and My World) and earns revenues from (i) user payments for virtual gifts and music subscriptions, (ii) commission from application developers based on the respective applications’ revenue, and (iii) online advertising, including display and context advertising. OK and My World have been aggregated into a single operating segment as they have similar economic characteristics and provide similar services to similar customers in similar markets. The Online Games segment includes online gaming services, including MMO, social and mobile games. It earns substantially all revenues from (i) sale of virtual in-game items to users and (ii) royalties for games licensed to third-party online game operators. The E-Commerce, Search and Other Services reportable segment represents separate operating segments aggregated in one reportable segment for presentation purposes only and primarily consists of search engine services earning substantially all revenues from context advertising, food delivery services earning substantially all revenue from restaurant's commission and our ESforce eSports business earning substantially all revenues from sponsorship and other advertising. This segment also includes the Group’s Youla classifieds business which is currently not earning material revenues, and a variety of other services, which are considered insignificant by the CODM for the purposes of performance review and resource allocation. The Group measures the performance of its operating segments through a measure of earnings before interest, tax, depreciation and amortisation (EBITDA). Segment EBITDA is calculated as the respective segment’s revenue less operating expenses (excluding depreciation and amortisation and impairment of intangible assets), including Group corporate expenses allocated to the respective segment.
110Mail.ru Group Annual Report 2018

Notes to Consolidated Financial Statements (continued)
Mail.Ru Group 2018 Results 28
5 Operating segments (continued) EBITDA is not a measure of financial performance under IFRS. The calculation of EBITDA by the Group may be different from the calculations of similarly labeled measures used by other companies and it should therefore not be used to compare one company against another or as a substitute for analysis of the Group’s operating results as reported under IFRS. EBITDA is not a direct measure of the Group’s liquidity, nor is it an alternative to cash flows from operating activities as a measure of liquidity, and it needs to be considered in the context of the Group’s financial commitments. EBITDA may not be indicative of the Group’s historical operating results, nor is it meant to be predictive of the Group’s potential future results. The Group believes that EBITDA provides useful information to the users of the consolidated financial statements because it is an indicator of the strength and performance of the Group’s ongoing business operations, including the Group’s ability to fund discretionary spending such as capital expenditure, acquisitions and other investments and the Group’s ability to incur and service debt. The information about the breakdown of revenue from external customers by the customers’ country of domicile and non-current assets by country is not available to the management of the Group, and it considers that the cost to develop such information would be excessive. The income statement items for each segment for the year ended December 31, 2018, as presented to the CODM, are presented below:
Email, Portal and IM Social Networks
(ex VK) Online Games VK E-commerce,
Search and other Eliminations Group
Revenue External revenue 5,684 16,456 24,743 18,380 9,997 – 75,260 Intersegment revenue 1 3 3 51 1,030 (1,088) –
Total revenue 5,685 16,459 24,746 18,431 11,027 (1,088) 75,260 Total operating expenses 3,748 6,944 20,481 7,706 15,247 (1,088) 53,038
EBITDA 1,937 9,515 4,265 10,725 (4,220) – 22,222
Net profit
14,099
The income statement items for each segment for the year ended December 31, 2017, as presented to the CODM, are presented below (all numbers include the effect of IFRS 15 adoption – please see Note 3.2 for details):
Email, Portal and IM Social Networks
(ex VK) Online Games VK E-commerce,
Search and other Eliminations Group
Revenue External revenue 5,206 16,147 17,614 12,520 5,302 – 56,789 Intersegment revenue 3 33 – 156 586 (778) –
Total revenue 5,209 16,180 17,614 12,676 5,888 (778) 56,789 Total operating expenses 3,031 5,977 12,878 3,964 12,216 (778) 37,288
EBITDA 2,178 10,203 4,736 8,712 (6,328) – 19,501
Net profit
13,251
A reconciliation of group aggregate segment revenue, as presented to the CODM, to IFRS consolidated revenue of the Group for the years ended December 31, 2018 and 2017 is presented below:
2018 2017
Group aggregate segment revenuee, as presented to the CODM 75,260 56,789 Adjustments to reconcile revenue as presented to the CODM to consolidated revenue under IFRS: Effect of difference in dates of acquisition,loss of control in subsidiaries and assets held for sale (1,104) (1,007) Differences in timing of revenue recognition (8,154) (5,181) Barter revenue 74 10 Dividend revenue from venture capital investments 29 9 Difference in classification of revenue – (565)
Consolidated revenue under IFRS 66,105 50,055
111Mail.ru Group Annual Report 2018
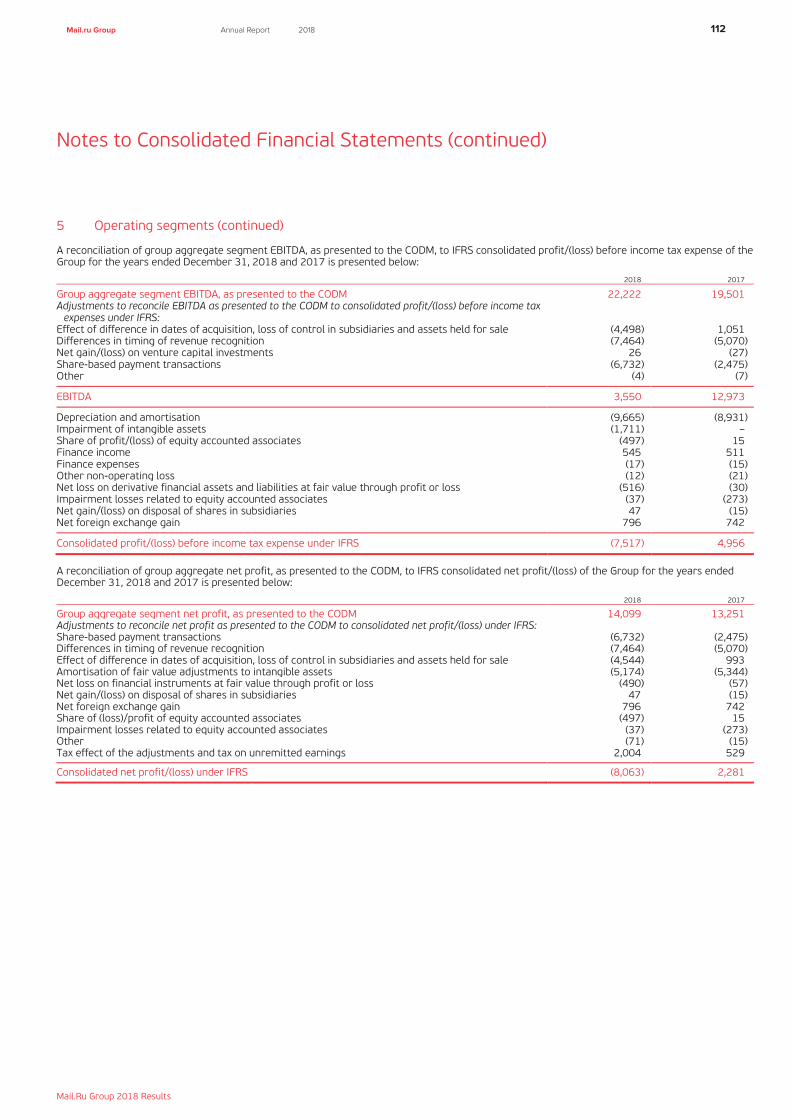
Notes to Consolidated Financial Statements (continued)
Mail.Ru Group 2018 Results 29
5 Operating segments (continued) A reconciliation of group aggregate segment EBITDA, as presented to the CODM, to IFRS consolidated profit/(loss) before income tax expense of the Group for the years ended December 31, 2018 and 2017 is presented below: 2018 2017
Group aggregate segment EBITDA, as presented to the CODM 22,222 19,501 Adjustments to reconcile EBITDA as presented to the CODM to consolidated profit/(loss) before income tax
expenses under IFRS: Effect of difference in dates of acquisition, loss of control in subsidiaries and assets held for sale (4,498) 1,051 Differences in timing of revenue recognition (7,464) (5,070) Net gain/(loss) on venture capital investments 26 (27) Share-based payment transactions (6,732) (2,475) Other (4) (7)
EBITDA 3,550 12,973
Depreciation and amortisation (9,665) (8,931) Impairment of intangible assets (1,711) – Share of profit/(loss) of equity accounted associates (497) 15 Finance income 545 511 Finance expenses (17) (15) Other non-operating loss (12) (21) Net loss on derivative financial assets and liabilities at fair value through profit or loss (516) (30) Impairment losses related to equity accounted associates (37) (273) Net gain/(loss) on disposal of shares in subsidiaries 47 (15) Net foreign exchange gain 796 742
Consolidated profit/(loss) before income tax expense under IFRS (7,517) 4,956
A reconciliation of group aggregate net profit, as presented to the CODM, to IFRS consolidated net profit/(loss) of the Group for the years ended December 31, 2018 and 2017 is presented below: 2018 2017
Group aggregate segment net profit, as presented to the CODM 14,099 13,251 Adjustments to reconcile net profit as presented to the CODM to consolidated net profit/(loss) under IFRS: Share-based payment transactions (6,732) (2,475) Differences in timing of revenue recognition (7,464) (5,070) Effect of difference in dates of acquisition, loss of control in subsidiaries and assets held for sale (4,544) 993 Amortisation of fair value adjustments to intangible assets (5,174) (5,344) Net loss on financial instruments at fair value through profit or loss (490) (57) Net gain/(loss) on disposal of shares in subsidiaries 47 (15) Net foreign exchange gain 796 742 Share of (loss)/profit of equity accounted associates (497) 15 Impairment losses related to equity accounted associates (37) (273) Other (71) (15) Tax effect of the adjustments and tax on unremitted earnings 2,004 529
Consolidated net profit/(loss) under IFRS (8,063) 2,281
112Mail.ru Group Annual Report 2018

Notes to Consolidated Financial Statements (continued)
Mail.Ru Group 2018 Results 30
6 Acquisitions and disposals for 2017 and 2018 6.1 ZakaZaka In May 2017, as a result of a number of transactions, the Group completed the acquisition of 100% of Site-Agregator LLC (“ZakaZaka”), the number two food delivery company in Russia, for a cash consideration of RUR 1,042. The main purpose of the acquisition was further expansion of the Group’s food delivery business. During Q2 2018 the Group finalised purchase price allocation for ZakaZaka acquisition. The fair values of the identifiable assets and liabilities of ZakaZaka at the date of acquisition were as follows: Fair value
Other intangible assets 197 Trade accounts receivable 18 Prepaid expenses and advances to suppliers 13 Other current assets 18 Cash and cash equivalents 24
Total assets 270
Deferred income tax liabilities 35 Trade accounts payable 5 Other payables, provisions and accrued expenses 7
Total liabilities 47
Total net assets 223
Goodwill on the transaction was calculated as the excess of:
(a) the consideration transferred by the Group measured at fair values: [1] cash consideration 1,027 [2] the acquisition date fair value of the Group’s previously held equity interest 120
Consideration transferred by the Group 1,147
Over
(b) financial liabilities at fair value through profit or loss – derivative over the equity of investee 246 (c) the net of the acquisition date amounts of the identifiable assets acquired and the liabilities assumed measured in
accordance with IFRS 3R 223
Goodwill 678
Goodwill is mainly attributable to expected synergies and cost savings with the Group’s food delivery business. Goodwill is not expected to be deductible for income tax purposes. Goodwill is allocated to Delivery Club CGU. Intangible assets mainly include trademark and customer base, and are amortised over the period of 2 to 10 years. The cash flows on acquisition were as follows: Cash paid (included in cash flows from investing activities) 1,042 Cash acquired (included in cash flows from investing activities) (24)
Net cash flow on acquisition 1,018
113Mail.ru Group Annual Report 2018

Notes to Consolidated Financial Statements (continued)
Mail.Ru Group 2018 Results 31
6 Acquisitions and disposals for 2017 and 2018 (continued)
6.1 ZakaZaka (continued) The net assets recognised in the December 31, 2017 financial statements were based on a provisional assessment of their fair value. In 2018, the valuation of the brand name was updated and the acquisition date fair value of other intangible assets was RUR 197, an increase of RUR 127 over the provisional value. The 2017 comparative information was restated to reflect the adjustment to the provisional amounts. As a result, there was an increase in the deferred tax liability of RUR 25. There was also a corresponding reduction in goodwill of RUR 102, resulting in RUR 678 of total goodwill arising on the acquisition. The increased amortisation charge on the other intangible assets from the date of acquisition to December 31, 2017 was not material.
6.2 Am.ru In May 2017 the Group completed the acquisition of exclusive rights for Am.ru, one of the largest Russian auto classifieds websites, from Rambler&Co for cash consideration of RUR 542. The primary purpose of the acquisition of Am.ru was to establish the Group’s presence in the auto classifieds and leverage the Group’s expertise and resources by achieving substantial synergies with Youla, the Group’s general online classifieds product. In accounting for the business combination, the Group has determined the amounts of Am.ru’s net identifiable assets at RUR 392, mainly consisting of software and brand amortisable over 4-10 years and as a result determined the amount of goodwill at RUR 150. Goodwill is mainly attributable to expected synergies with the Group’s classifieds business and is not deductible for income tax purposes.
6.3 Inplat In the third quarter 2017 the Group acquired investments in certain associates for total cash consideration of RUR 640, including acquisition of 17.76% equity stake in Inplat Holding Limited (“Inplat”), an operator of electronic online payment system, for cash consideration of RUR 561. The Group’ s ownership interest in Inplat represents an investment in an associate and accounted for it under the equity method. The Group concluded that it has significant influence over Inplat as the Group has a power to participate in the financial and operating policy decisions through its representation in Inplat’s Board of Directors. The Group finalised purchase price allocation for Inplat acquisition with no effect.
6.4 ESforce In January 2018 the Group acquired a leading eSport group of companies operating under the ESforce brand (together “ESforce”) for a cash consideration of RUR 5,659 and contingent consideration, measured at fair value, of RUR 1,132 based on ongoing financial KPIs in a period of 1 year. Contingent liability was remeasured in December 2018 to RUR 1,948 (Note 16). The primary purpose of the acquisition of ESforce was to enhance the Group’s position on the eSports market. In February 2019 the Group finalised purchase price allocation for ESforce acquisition. The fair values of the identifiable assets and liabilities of ESforce at the date of acquisition were as follows:
Fair value
Property and equipment 648 Other intangible assets 674 Deferred income tax assets 227 Trade accounts receivable 191 Prepaid income tax 12 Prepaid expenses and advances to suppliers 23 Other current assets 167 Other non-current assets 9 Cash and cash equivalents 207
Total assets 2,158
Deferred income tax liabilities 144 Trade accounts payable 235 VAT and other taxes payable 12 Deferred revenue and customer advances 68 Provisions for tax contingencies 128 Other payables and accrued expenses 130
Total liabilities 717
Total net assets 1,441
Goodwill on the transaction was calculated as the excess of: (a) the consideration transferred by the Group measured at fair values:
[1] Cash consideration 5,659 [2] Contingent consideration liability 1,132
Consideration transferred by the Group 6,791
(b) the amount of non-controlling interest in ESForce measured in accordance with IFRS 3 22 over (с) the net of the acquisition date amounts of the identifiable assets acquired and the liabilities assumed measured in
accordance with IFRS 3 1,441
Goodwill 5,372
114Mail.ru Group Annual Report 2018

Notes to Consolidated Financial Statements (continued)
Mail.Ru Group 2018 Results 32
6 Acquisitions and disposals for 2017 and 2018 (continued)
6.4 ESforce (continued) Goodwill is mainly attributable to the potential of ESforce to further enhance its leadership position in the eSports market, as well as the prospects of potential synergies with the Group’s other operations. Goodwill is not expected to be deductible for income tax purposes. Intangible assets mainly include trademark and customer base, and are amortised over the period of 2 to 5 years. The cash flows on acquisition were as follows:
Cash paid (included in cash flows from investing activities) 5,730 Cash acquired (included in cash flows from investing activities) (207)
Net cash flow on acquisition 5,523
6.5 BitGames, 33 Slona and InShopper In April 2018 the Group acquired control in mobile games developer PBL Bitdotgames Publishing Limited (“BitGames”) by increasing its share to 51% (49% in addition to 2% stake as of March 31, 2018). The primary purpose of the acquisition of BitGames was to enhance the Group’s position on mobile games market. Also in April 2018 the Group completed the acquisition of the 100% in LLC “33 Slona” and LLC “Tekhnologii nedvizhimosti” (collectively, “33 Slona”), a digital real estate agency. The primary purpose of the acquisition of 33 Slona was to leverage the Group’s expertise and resources by achieving substantial synergies with Youla, the Group’s general online classifieds product. In June 2018 the Group completed the acquisition of the 100% in Consult Universal Corp (“InShopper”), a cash-back technology provider. The primary purpose of the acquisition of InShopper was to leverage the Group’s expertise and resources by achieving substantial synergies with Group’s payment technologies and solutions. Total cash consideration for the transactions above was RUR 2.5 bln and contingent consideration, measured at fair value, of RUR 93 (based on ongoing financial KPIs in a period of 1 year. Contingent liability was remeasured in December 2018 to RUR 46 (Note 16). In accounting for the business combinations, the Group has provisionally determined the amounts of the acquired companies’ identifiable assets and liabilities at their fair value. The acquisition accounting will be finalised upon completion of the tax planning and valuation of BitGames, 33 Slona and InShopper’s assets and liabilities. The provisional fair values of the identifiable assets and liabilities of BitGames, 33 Slona and InShopper at the date of acquisition were as follows:
Provisional fair value
Other intangible assets 1,140 Loans receivable 5 Deferred income tax assets 59 Prepaid expenses and advances to suppliers 14 Trade accounts receivable 36 Other current assets 36 Cash and cash equivalents 26
Total assets 1,316
Deferred income tax liabilities 143 Trade accounts payable 83 Deferred revenue and customer advances 473 Loans payable 33 VAT and other taxes payable 5 Other payables and accrued expenses 7
Total liabilities 744
Total net assets 572
Goodwill on the transaction was calculated as the excess of: (a) the consideration transferred by the Group measured at fair values:
[1] cash consideration 2,515 [2] financial assets at fair value through profit or loss – derivative over the equity of investee 11 [3] the acquisition date fair value of the Group’s previously held equity interest 114 [4] contingent consideration liability 93
Consideration transferred by the Group 2,733
(b) the amount of non-controlling interest measured in accordance with IFRS 3 247
Over (с) the net of the acquisition date amounts of the identifiable assets acquired and the liabilities assumed measured in
accordance with IFRS 3 572
Goodwill 2,408
115Mail.ru Group Annual Report 2018

Notes to Consolidated Financial Statements (continued)
Mail.Ru Group 2018 Results 33
6 Acquisitions and disposals for 2017 and 2018 (continued) 6.5 BitGames, 33 Slona and InShopper (continued) Goodwill is mainly attributable to development of new games, cost saving and potential synergy with the Group’s classified business, payment solutions and other operations. Goodwill is not expected to be deductible for income tax purposes. Goodwill related to BitGames and 33 Slona acquisition is allocated to Games and Youla CGUs correspondingly. Management is still assessing the allocation of InShopper goodwill among cash generating units. Intangible assets mainly include social and mobile games and are amortised over the period of 2 to 5 years. The cash flows on acquisition were as follows:
Cash paid (included in cash flows from investing activities) 2,534 Cash acquired (included in cash flows from investing activities) (26)
Net cash flow on acquisition 2,508
6.6 Citymobil In April 2018 as a result of a number of transactions the Group acquired a 25.38% stake in taxi aggregator City-Mobil LLC (“Citymobil”) for a total cash consideration of RUR 530 mln, including RUR 120 conversion of loan (Note 15). In November 2018 due to the increase of Citymobil share capital as a result of the new shareholder contribution our stake decreased to 17.65%. The Group concluded that it has significant influence over Citymobil as the Group has the power to participate in the financial and operating policy decisions through its representation on Citymobil’s Board of Directors. The Group’s ownership interest in Citymobil is accounted for under the equity method. The acquisition of investment in Citymobil is accounted for based on provisional values, as the Group has not completed the allocation of purchase price over the fair values of Citymobil’s identifiable assets and liabilities as of the date of these financial statements. 6.7 UMA In May 2018 the Group exercised its call option to purchase 20% of the share capital of the music library rights holder Salerton Investments Limited (“UMA”) for a total cash consideration of RUR 1,363. The Group concluded that it has significant influence over UMA as it is represented on UMA’s board of directors and is entitled to participate in decision making regarding its financial and operating policies. Therefore UMA is accounted for as an associate under the equity method. The acquisition of investment in UMA is accounted for based on provisional values as the Group has not completed the allocation of purchase price over the fair values of UMA’s identifiable assets and liabilities as of the date of these financial statements. On December 27, 2018 the Group signed put and call option agreement for the remaining 80% in UMA.
116Mail.ru Group Annual Report 2018

Notes to Consolidated Financial Statements (continued)
Mail.Ru Group 2018 Results 34
7 Intangible assets
Goodwill Trademark Customer base
Game software and software
development costs Other software,
licenses and other Total
Cost At January 1, 2017 132,309 14,554 22,013 11,943 4,757 185,576 Additions – 3 – 1,016 299 1,318 Disposals – – – – (8) (8) Additions due to acquisition of subsidiaries 729 287 50 – 210 1,276 Translation adjustment – – – 340 34 374
At December 31, 2017 133,038 14,844 22,063 13,299 5,292 188,536
Additions – 13 – 1,407 950 2,370 Disposals – – – (93) (1) (94) Additions due to acquisition of subsidiaries 7,780 265 253 1,041 255 9,594 Disposal due to disposal of subsidiaries (372) (18) (17) – (54) (461) Translation adjustment – 1 – 739 86 826
At December 31, 2018 140,446 15,105 22,299 16,393 6,528 200,771
Accumulated amortisation and impairment At January 1, 2017 – (5,552) (8,873) (6,902) (2,046) (23,373) Charge for the year – (1,512) (2,973) (1,256) (1,197) (6,938) Translation adjustment – – – (124) (21) (145)
At December 31, 2017 – (7,064) (11,846) (8,282) (3,264) (30,456)
Charge for the year – (1,476) (3,022) (945) (1,524) (6,967) Disposals – – – 3 (1) 2 Disposal due to disposal of subsidiaries – – – – 33 33 Impairment – – – (1,711) – (1,711) Translation adjustment – – – (442) (25) (467)
At December 31, 2018 – (8,540) (14,868) (11,377) (4,781) (39,566)
Net book value At January 1, 2017 132,309 9,002 13,140 5,041 2,711 162,203
At December 31, 2017 133,038 7,780 10,217 5,017 2,028 158,080
At December 31, 2018 140,446 6,565 7,431 5,016 1,747 161,205
Game software and development costs consist of internally and externally developed and acquired software for online games in use and in process of development. Because of a significant downward revision of the forecasted cash inflows of the game Armored Warfare in Q2 2018, the Group fully impaired the game, recording an impairment charge of RUR 1,698. Games represent separable CGUs and the analysis of impairment was performed at the level of each game, where either impairment was previously recognised or current operating performance was below the original forecasts. The analysis included the comparison of the value in use determined based on discounted future cash flows to the carrying amount. The value in use calculation uses cash flow projections from financial budgets approved by senior management covering a period limited to the useful life of the respective game, ranging from 6 to 8 years. Determining value in use requires the exercise of significant judgment, including judgment about appropriate discount rates, remaining useful life, the amount and timing of expected future cash flows. The cash flows employed in the DCF analysis are based on the Group’s most recent budget and, for years beyond the budget, the Group’s estimates, which are based on assumed growth rates. The discount rates used in the DCF analysis are intended to reflect the risks inherent in the future cash flows of the respective cash generating units. The pre-tax discount rates used in the DCF models as of December 31, 2018 was 20.6% (2017: 19.1%). The calculation of value in use is most sensitive to the following assumptions:
• Russian online entertainment market growth rates;
• The Group's market share;
• Games operating performance and net profit margins;
• Discount rates.
117Mail.ru Group Annual Report 2018

Notes to Consolidated Financial Statements (continued)
Mail.Ru Group 2018 Results 35
8 Property and equipment
Servers and computers
Leasehold improvements
Furniture, office equipment
and motor vehicles Assets under construction
Other property and equipment Total
Cost At January 1, 2017 7,878 514 227 538 749 9,906 Additions – – – 2,654 – 2,654 Transfers 2,439 1 16 (2,520) 64 – Disposals (174) – (3) – (11) (188) Additions due to acquisition of subsidiaries – – – – – – Disposal due to disposal of subsidiaries – – (1) – – (1) Translation adjustment 81 1 24 (90) (4) 12
At December 31, 2017 10,224 516 263 582 798 12,383
Additions – – – 4,657 (1) 4,656 Transfers 3,228 135 76 (3,747) 308 – Disposals (364) – (6) (6) (376) Assets held for sale (32) (32) Additions due to acquisition of subsidiaries 32 434 68 41 73 648 Disposal due to disposal of subsidiaries (1) – (1) – – (2) Translation adjustment 59 – 2 – 2 63
At December 31, 2018 13,146 1,085 402 1,533 1,174 17,340
Accumulated depreciation and impairment At January 1, 2017 (5,350) (214) (138) – (364) (6,066) Charge for the year (1,785) (60) (27) – (121) (1,993) Disposals 174 – 3 – 11 188 Disposal due to disposal of subsidiaries – – 1 – – 1 Translation adjustment (19) – (3) – – (22)
At December 31, 2017 (6,980) (274) (164) – (474) (7,892)
Charge for the year (2,278) (253) (38) – (129) (2,698) Disposals 358 – 2 – – 360 Disposal due to disposal of subsidiaries – – – – – – Translation adjustment (51) (1) (7) – (1) (60)
At December 31, 2018 (8,951) (528) (207) – (604) (10,290)
Net book value At January 1, 2017 2,528 300 89 538 385 3,840
At December 31, 2017 3,244 242 99 582 324 4,491
At December 31, 2018 4,195 557 195 1,533 570 7,050
118Mail.ru Group Annual Report 2018

Notes to Consolidated Financial Statements (continued)
Mail.Ru Group 2018 Results 36
9 Consolidated subsidiaries These consolidated financial statements include the assets, liabilities and financial results of the Company and its subsidiaries, whose main activity is providing Russian-language Internet services. The significant subsidiaries as at December 31, 2018 and 2017 are listed below:
Ownership,%* Subsidiary Main activity December 31, 2018 December 31, 2017
Mail Coöperatief UA (Netherlands) Holding entity 100.0% 100.0% MRGroup Investments Limited (Cyprus) Holding entity 100.0% 100.0% Mail.Ru, LLC (Russia)
Online portal services, development and support of online games, social network 100.0% 100.0%
NBSCI Money.Mail.Ru, LLC (Russia) Internet payment system 100.0% 100.0% Mail.Ru Development LLC Reserch and development of online products 100.0% 100.0% MGL MY.COM (CYPRUS) LIMITED (renamed from
Benstar limited) Support of online games 100.0% 100.0% Mail.Ru Group LLC (renamed from Internet
company Mail.Ru LLC) Holding company 100.0% 100.0% Data Centre M100 LLC (Russia) Hosting services 100.0% 100.0% My.com B.V. (Netherlands) Support of online games and portal services 100.0% 100.0% Mail.ru Internet Holdings B.V. (Netherlands) Holding company 100.0% 100.0% Mail.ru Aggregates B.V. (Netherlands) Holding company 100.0% 100.0% Mail.ru Holdings B.V. (Netherlands) Holding company 100.0% 100.0% V kontakte LLC (Russia) Social network 100.0% 100.0% Pixonic LLC (Russia) Reserch and development of online products 100.0% 100.0% Pixonic Games Limited (Cyprus) Online games operation 100.0% 100.0% Delivery Club LLC (Russia) Food delivery 100.0% 100.0% * The ownership percentages above represent the Company’s effective indirect ownership in each subsidiary. There are no differences between economic and voting
rigths which the Group holds in subsidiaries. 10 Investments in equity accounted associates The Group has investments in associates operating popular Internet websites and providing various services over the Internet. Investments in equity accounted associates at December 31, 2018 and 2017 comprised the following:
Associate Main activity
Voting shares Carrying value December 31,
2018 December 31,
2017 December 31,
2018 December 31,
2017
Haslop Company Limited (Cyprus) and Russian subsidiaries (collectively, "Mamba")
Provides content for www.love.mail.ru, a vertical of the www.mail.ru portal operated by a subsidiary of Mail.Ru Internet NV
31.19% 31.19% 393 308
Inplat Holdings Limited (Cyprus) Operation of electronic online payment systems 17.76% 17.76% 573 561
Salerton Investment Limited (Cyprus) (“UMA”) The company holds music library rights 20% n/a 1,730 n/a
ООО Сити-мобил/ City-mobil LLC (РФ/ Russia) Taxi aggregator company 17.65% n/a – –
Other Development and operation of online and mobile games n/a n/a 120 144
Total 2,816 1,013
The above entities have the same reporting date as the Company. None of the entities were listed on a public exchange as of December 31, 2018. The tables below illustrate the summarized financial information of the Group’s significant equity accounted investments in: a) Salerton Investment Limited (“UMA”)
Provisional values as of
December 31, 2018
Current assets 1,577 Non-current assets 81 Current liabilities (510)
Equity 1,148
Group's share in equity – 20% (2017: n/a) 230 Goodwill 1,428
Group's carrying amount of the investment 1,658
119Mail.ru Group Annual Report 2018

Notes to Consolidated Financial Statements (continued)
Mail.Ru Group 2018 Results 37
10 Investments in equity accounted associates (continued) a) Salerton Investment Limited (“UMA”) (continued) May-December 2018
Revenue from contracts with customers 1,984 Cost of sales (1,562) Administrative expenses (61) Finance and other income/expenses 37
Profit before tax 398
Income tax expense (37)
Profit for the year 361
Group's share of profit for the year 72
Carrying amount as of December 31 1,730
b) Inplat Holdings Limited December 31, 2018 December 31, 2017
Current assets 237 294 Non-current assets 72 76 Current liabilities (84) (220)
Equity 225 150
Group's share in equity – 17.76% (2017: 17.76%) 40 26 Goodwill 511 511
Group's carrying amount of the investment 551 537
2018 2017
Revenue from contracts with customers 1,050 1,953 Cost of sales (843) (1,696) Administrative expenses (54) (65) Finance and other costs (8) (23)
Profit before tax 145 169
Income tax expense (19) (35)
Profit for the year 126 134
Group's share of profit for the year 22 24
Carrying amount as of December 31 573 561
c) City-Mobil
Provisional values as of
April-December 31, 2018
Current assets 1,028 Non-current assets 24 Current liabilities (1,528)
Equity (476)
Group's share in equity – 17.65% (2017: n/a) (84) Goodwill 784
Group's carrying amount of the investment 700 April-december 2018
Revenue from contracts with customers 967 Cost of sales (4,280) Administrative expenses (26)
Loss before tax (3,339)
Income tax expense –
Loss for the year (3,339)
Group's share of loss for the year (772)
Carrying amount as of December 31 –
120Mail.ru Group Annual Report 2018

Notes to Consolidated Financial Statements (continued)
Mail.Ru Group 2018 Results 38
10 Investments in equity accounted associates (continued) c) City-Mobil (continued) In 2018 the Group received dividends from Mamba in the amount of RUR 40 (2017: 18). In 2018 the Group recorded impairment of RUR 36 with respect to investments in an online games developer. In 2017 the Group recorded impairment of RUR 273 with respect to investments in Mamba. Movement in investments in equity accounted associates for the years ended December 31, 2018 and 2017 is presented below:
2018 2017
Investments in equity accounted associates at January 1 1,013 649 Acquisition of shares in equity accounted associates 2,377 640 Impairment of investments in equity accounted associates (37) (273) Share in net (losses)/profits of equity accounted associates (497) 15 Dividends from equity accounted associates (40) (18)
Investments in equity accounted associates at December 31 2,816 1,013
11 Impairment testing of goodwill The table below shows movements in goodwill per groups of CGUs, corresponding to the Group`s operating segments for each of the years ended December 31, 2018 and 2017:
Email, Portal
and IM Social
Networks Online Games Search
E-commerce and Other Vkontakte Pixonic DeliveryClub ESForce Total
Cost at January 1, 2017 8,192 18,474 1,952 2,496 312 93,691 1,592 5,600 – 132,309
Additions – – – – 150 – – 579 – 729
Cost at December 31, 2017 8,192 18,474 1,952 2,496 462 93,691 1,592 6,179 – 133,038
Disposal – – – – – – – (372) (372) Additions – – 210 – 2,198 – – – 5,372 7,780
Cost at December 31, 2018 8,192 18,474 2,162 2,496 2,660 93,691 1,592 6,179 5,000 140,446
The recoverable amount of goodwill has been determined based on value in use calculations as of December 31, 2018 and 2017. Value in use At December 31, 2018, value in use was determined using cash flow projections from financial budgets and forecasts approved by senior management covering a seven to nine-year periods. The nine-year period was taken as the basis because the Group expects that the growth rates of the Russian Internet market will exceed the terminal growth rates in the four-year period following the first five years of forecast. The Group used the cash flow projections based on financial forecasts over a period longer than five years as it is confident that these projections are reliable and accurate. The major assumptions used in the DCF models at December 31, 2017 are presented below:
Email, Portal
and IM Social
Networks Online Games Search Vkontakte Pixonic DeliveryClub
Terminal growth rate 5.00% 5.00% 5.00% 2.00% 5.00% n/a 4.11% Pre-tax discount rate 16.6% 19.5% 17.2% 17.5% 17.3% 24.3% 19.4% The major assumptions used in the DCF models at December 31, 2018 are presented below:
Email, Portal and IM
Social Networks
Online Games Search
E-commerce and Other Vkontakte Pixonic DeliveryClub ESForce
Terminal growth rate 5.0% 5.0% 5.0% 5.0% 5.0% 5.0% 5.0% 4.0% 5.0% Pre-tax discount rate 17.1% 17.2% 17.5% 17.0% 14.5% 16.9% 16.1% 15.4% 22.3% Determining value in use requires the exercise of significant judgment, including judgment about appropriate discount rates, terminal growth rates, the amount and timing of expected future cash flows. The cash flows employed in the DCF analysis are based on the Group’s most recent budget and, for years beyond the budget, the Group’s estimates, which are based on assumed growth rates. The discount rates used in the DCF analysis are intended to reflect the risks inherent in the future cash flows of the respective cash generating units. The calculation of value in use is most sensitive to the following assumptions:
• Revenue Compound annual growth rates (“CAGR”);
• EBITDA margins;
• Growth rates used to extrapolate cash flows beyond the budget period including terminal growth rate in last year of projections; and
• Discount rates. Reasonably possible changes in any key assumptions would not result in impairment of goodwill of any other CGU. No impairment of goodwill was recognised in 2018 and 2017.
121Mail.ru Group Annual Report 2018

Notes to Consolidated Financial Statements (continued)
Mail.Ru Group 2018 Results 39
12 Trade accounts receivable As of December 31, 2018 and 2017 trade receivables comprised the following: December 31, 2018 December 31, 2017
Trade accounts receivable, gross 10,273 6,856 Allowance for expected credit losses (357) (300)
Total trade receivables, net 9,916 6,556
The accounts receivable increased primarily due to growth of online advertising and MMO games revenue. The movements in the allowance for expected credit losses of trade receivables were as follows:
Balance as of January 1, 2017 (398)
Charge for the year (27) Accounts receivable written off 125
Balance as of December 31, 2017 (300)
Charge for the year (84) Accounts receivable written off 27
Balance as of December 31, 2018 (357)
An impairment analysis is performed at each reporting date using a provision matrix to measure expected credit losses. The provision rates are based on days past due for groupings of various customer segments with similar loss patterns and the likelihood of default over a given time horizon. The calculation reflects the probability-weighted outcome, the time value of money and reasonable and supportable information that is available at the reporting date about past events, current conditions and forecasts of future economic conditions. Set out below is the information about the credit risk exposure on the Group’s trade and other receivables as of December 31, 2018 using a provision matrix: Trade accounts receivable
Days past due <90 days 90-180 180-360 >360 Total
As of December 31, 2018
Expected credit loss rate 1.56% 12% 21% 75% Estimated total gross carrying amount at
default 9,550 404 146 173 10,273 Expected credit loss (149) (49) (30) (129) (357) Trade receivables not impaired as of December 31, 2018 and 2017 are presented below:
Total
Ageing of receivables (days)
<90 90-180
As of December 31, 2018 Trade accounts receivable 9,916 9,401 515
As of December 31, 2017 Trade accounts receivable 6,556 6,542 14 The accounts receivable balances as of December 31, 2018 and 2017 mainly represented amounts due from online electronic payment systems and advertising customers. The trade receivables are non-interest bearing and are generally settled in RUR on a 40-90 days basis. There is no requirement for collateral to receive credit. Management considers that the carrying amount of the receivable balances approximated their fair value as of December 31, 2018 and 2017.
122Mail.ru Group Annual Report 2018

Notes to Consolidated Financial Statements (continued)
Mail.Ru Group 2018 Results 40
13 Cash and cash equivalents and short-term deposits As of December 31, 2018 and 2017 cash and cash equivalents consisted of the following: Currency December 31, 2018 December 31, 2017
Current accounts and cash on hand: USD 1,468 371 RUR 1,436 929 EUR 977 1,203 Other 3 50
Total current accounts and cash on hand
3,884 2,553
Deposit accounts with an original maturity of three months or less: USD 834 1,273 RUR 7,005 11,545
Total deposit accounts with an original maturity of three months or less
7,839 12,818
Total cash and cash equivalents and short-term deposits
11,723 15,371
14 Share capital 14.1 Charter capital and share issues The charter capital of the Company consisted of 208,582,082 ordinary shares and 11,500,100 Class A shares with USD 0.000005 par value each as of December 31, 2018, while the number of authorised shares of the Company as of the same date consisted of 10,000,000,000 ordinary shares and 10,000,000,000 Class A shares. GDRs representing 157,371 shares of the Company were held in treasury by the Group as of December 31, 2018. The charter capital of the Company consisted of 208,582,082 ordinary shares and 11,500,100 Class A shares with USD 0.000005 par value each as of December 31, 2017, while the number of authorised shares of the Company as of the same date consisted of 10,000,000,000 ordinary shares and 10,000,000,000 Class A shares. GDRs representing 258,999 shares of the Company were held in treasury by the Group as of December 31, 2017. As of December 31, 2018 and 2017 all issued shares were fully paid. Rights attached to the share classes as of December 31, 2018 and 2017 The Class A shares and the ordinary shares rank pari passu in all respects, but constitute separate classes of shares, i.e. each and every ordinary share and Class A share has the following rights:
(i) the right to an equal share in any dividend or other distribution paid by the Company to the holders of the shares, pari passu with all other Class A shares and ordinary shares; and, for the avoidance of doubt, any dividend or other distribution may only be declared and paid by the Company to the holders of the Class A shares and the ordinary shares together, and not to the holders of one of those classes of shares only;
(ii) the right to an equal share in the distribution of the surplus assets of the Company pari passu with all other ordinary shares and Class A shares upon the winding up of the Company.
Each Class A share has the right to twenty five votes and each ordinary share has the right to one vote at a meeting of members of the Company or on any resolution of members of the Company. For additional details on the options over the shares of the Company outstanding as of December 31, 2018 and 2017, refer to Note 24. 14.2 GDR buying programme Starting 2011, the Trustee commenced a GDR buying programme in order to cover a part of the employee and director options. Under the GDR buying programme, the Trustee acquires GDRs representing shares of the Company and will subsequently transfer the GDRs to the respective option holders upon the exercise of the options. The Trustee intends to hold the GDRs to be used over the next four years. During 2018 the Trustee has not acquired any GDRs (2017: 857,736) on the market (2017 aggregate consideration: RUR 1,430). The Group accounts for GDRs repurchased as treasury shares. In December 2018 additional extension of RSU 2017 Plan for 2 000 000 units and acquisition of required volume of GDR on the market were approved.
123Mail.ru Group Annual Report 2018

Notes to Consolidated Financial Statements (continued)
Mail.Ru Group 2018 Results 41
15 Other assets The table below represents other non-current assets: December 31, 2018 December 31, 2017
Advance under office lease contract 398 316 Advances for royalties 1,176 1,022 Other non-current assets 110 247
Total other non-current assets 1,684 1,585 16 Other payables and accrued expenses Other payables and accrued expenses consist of: December 31, 2018 December 31, 2017
Payables to personnel 2,140 1,724 Accrued vacations 1,046 774 Accrued professional consulting expenses 41 35 Payables under lease contract 49 121 Contingent consideration liability (Note 6, Note 22) 1,997 – Other current payables and provisions 337 248
Total other payables and accrued expenses 5,610 2,902
17 Revenue The presentation and disclosure requirements in IFRS 15 are more detailed than under previous standard. As required for consolidated financial statements disaggregation of revenue from contracts with customers for the year ended December 31, 2018, based on the Group’s segment reporting (Note 5) is presented below:
Email, Portal
and IM Social Networks
(ex VK) Online Games VK E-commerce,
Search and other Eliminations Group
Revenue External revenue 5,684 16,456 24,743 18,380 9,997 – 75,260 Intersegment revenue 1 3 3 51 1,030 (1,088) –
Total revenue 5,685 16,459 24,746 18,431 11,027 (1,088) 75,260
Services transferred at a point in time 5,554 11,275 1,392 16,318 8,492 (1,088) 41,943
Services transferred over time 131 5,184 23,354 2,113 2,535 – 33,317 Disaggregation of revenue from contracts with customers for the year ended December 31, 2017 for, based on the Group’s segment reporting (Note 5) is presented below:
Email, Portal
and IM Social Networks
(ex VK) Online Games VK E-commerce,
Search and other Eliminations Group
Revenue External revenue 5,206 16,147 17,614 12,520 5,302 – 56,789 Intersegment revenue 3 33 – 156 586 (778) –
Total revenue 5,209 16,180 17,614 12,676 5,888 (778) 56,789
Services transferred at a point in time 5,091 9,890 165 11,749 5,550 (778) 31,667
Services transferred over time 118 6,290 17,449 927 338 – 25,122
Deferred revenue During 2018 the Group recognized revenue under “MMO Games revenue” in amount RUR 2,196 (2017: 1,200) that was included in “Deferred revenue” balance at the beginning of the periods. As of December 31, 2018 the balance of deferred revenue increased in amount of RUR 6,483 (2017: 4,711) mostly due to ingame items life-time. Also “Deferred revenue” balance at October 1, 2018 increased as a result of management reassessment of the games’ remaining useful lives in amount of RUR 877 (2017: 640), see Note 4.2.9. Additionally “Deferred revenue” balance as for December 31, 2018 was affected by business combination in amount RUR 472 (2017: nil), also see Note 6.5. In Q3 2017 the Group made changes to certain estimates used in the calculation of deferred revenue from the Social Network Odnoklassniki. The changes in estimates were recorded prospectively starting from July 1, 2017 and resulted in a decrease in “Deferred revenue” balance in amount RUR 888.
124Mail.ru Group Annual Report 2018

Notes to Consolidated Financial Statements (continued)
Mail.Ru Group 2018 Results 42
18 Income tax The business activity of the Group and its associates is subject to taxation in multiple jurisdictions, including: The Russian Federation The Group’s subsidiaries and associates incorporated in the Russian Federation are subject to corporate income tax at the standard rate of 20% applied to their taxable income. Withholding tax of 15% is applied to any dividends paid out of Russia, reduced to as low as 5% for some countries (including Cyprus), with which Russia has double-tax treaties. Cyprus The Company and the Group’s subsidiaries and associates incorporated or tax residents in Cyprus are subject to a 12.5% corporate income tax applied to their worldwide income. Capital gains derived from sale of securities are tax exempt (except for capital gains realised in connection with sale of shares in companies deriving their value or the greater part of their value from immovable property located in Cyprus). Dividend income is also tax exempt. British Virgin Islands The Company and its subsidiaries and associates incorporated in the British Virgin Islands are exempt from all taxes under the respective laws, unless they become tax residents in other jurisdictions. United States of America The Group’s subsidiaries incorporated in the USA are subject to federal corporate income tax at standard rates of up to 35% applied to their taxable income. The Netherlands The Group’s subsidiaries incorporated in the Netherlands are subject to corporate income tax at a standard rate of 25% applied to their taxable income. Dividend income and capital gains received by the Dutch subsidiaries are exempt from the corporate income (participation exemption). The major components of income tax expense in the consolidated statement of comprehensive income are as follows:
2018 2017
Current income tax expense 3,067 3,017 Deferred income tax benefit (2,521) (342)
Total income tax expense 546 2,675
The reconciliation between tax expense and the product of accounting profit multiplied by domestic rates applicable to individual Group entities for the years ended December 31, 2018 and 2017 is as follows:
2018 2017
(Loss)/profit before income tax expense (7,517) 4,956 Tax at domestic rates applicable to individual group entities 1,103 (925) Non-deductible expenses (1,723) (335) Non-taxable foreign exchange and other gains 559 – Effect of changes in tax rates – (820) Write-down of deferred tax assets 2 (543) Adjustments in respect of current income tax of previous year 135 (24) Tax accruals and penalties (42) – Unrecognised deferred tax assets (618) – Other 38 (28)
Total income tax expense/(benefit) (546) (2,675)
The majority of our taxable profits as well as income tax expenses in 2018 and 2017 are generated in Russia. Pre-tax gains and losses in other jurisdictions in 2018 mostly relate to share based payment expenses, fair value revaluation, foreign exchange gains and losses, and other similar items which are generally non-taxable (non-deductible) in those jurisdictions. These items affect pre-tax profit, but do not have an influence on income tax expense, which has an effect on the blended tax rate.
125Mail.ru Group Annual Report 2018
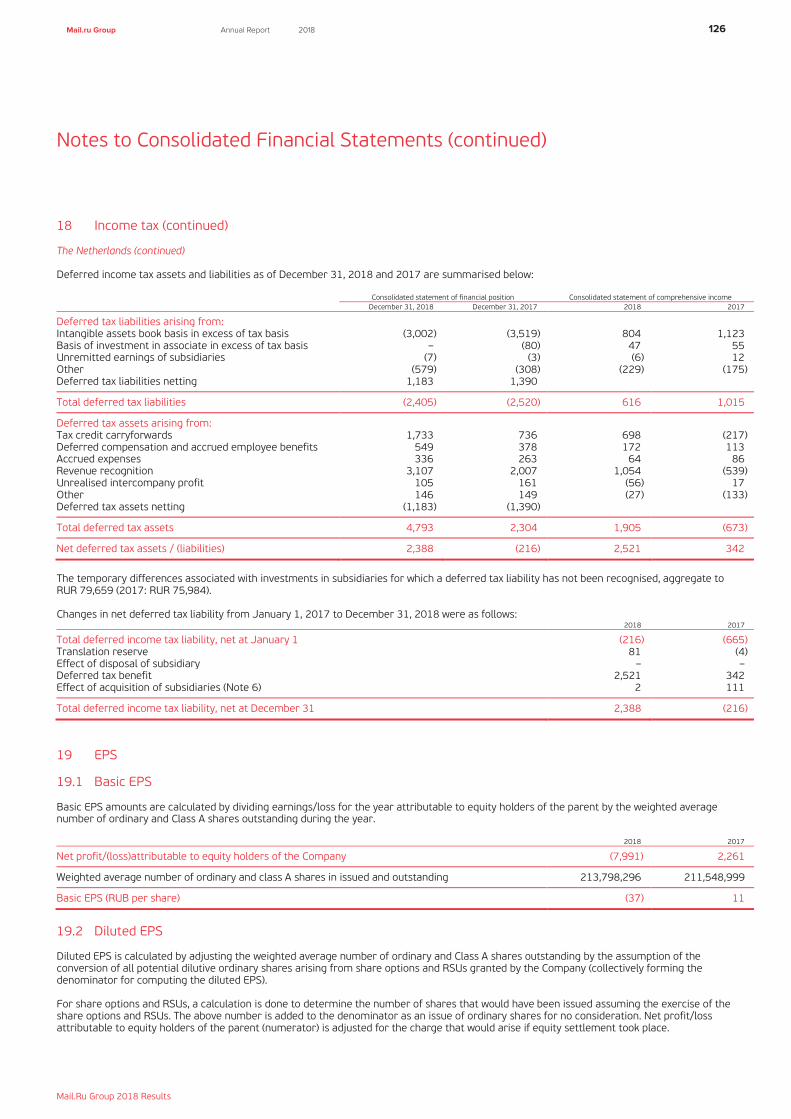
Notes to Consolidated Financial Statements (continued)
Mail.Ru Group 2018 Results 43
18 Income tax (continued) The Netherlands (continued) Deferred income tax assets and liabilities as of December 31, 2018 and 2017 are summarised below:
Consolidated statement of financial position Consolidated statement of comprehensive income December 31, 2018 December 31, 2017 2018 2017
Deferred tax liabilities arising from: Intangible assets book basis in excess of tax basis (3,002) (3,519) 804 1,123 Basis of investment in associate in excess of tax basis – (80) 47 55 Unremitted earnings of subsidiaries (7) (3) (6) 12 Other (579) (308) (229) (175) Deferred tax liabilities netting 1,183 1,390
Total deferred tax liabilities (2,405) (2,520) 616 1,015
Deferred tax assets arising from: Tax credit carryforwards 1,733 736 698 (217) Deferred compensation and accrued employee benefits 549 378 172 113 Accrued expenses 336 263 64 86 Revenue recognition 3,107 2,007 1,054 (539) Unrealised intercompany profit 105 161 (56) 17 Other 146 149 (27) (133) Deferred tax assets netting (1,183) (1,390)
Total deferred tax assets 4,793 2,304 1,905 (673)
Net deferred tax assets / (liabilities) 2,388 (216) 2,521 342
The temporary differences associated with investments in subsidiaries for which a deferred tax liability has not been recognised, aggregate to RUR 79,659 (2017: RUR 75,984). Changes in net deferred tax liability from January 1, 2017 to December 31, 2018 were as follows:
2018 2017
Total deferred income tax liability, net at January 1 (216) (665) Translation reserve 81 (4) Effect of disposal of subsidiary – – Deferred tax benefit 2,521 342 Effect of acquisition of subsidiaries (Note 6) 2 111
Total deferred income tax liability, net at December 31 2,388 (216)
19 EPS 19.1 Basic EPS Basic EPS amounts are calculated by dividing earnings/loss for the year attributable to equity holders of the parent by the weighted average number of ordinary and Class A shares outstanding during the year.
2018 2017
Net profit/(loss)attributable to equity holders of the Company (7,991) 2,261
Weighted average number of ordinary and class A shares in issued and outstanding 213,798,296 211,548,999
Basic EPS (RUB per share) (37) 11
19.2 Diluted EPS Diluted EPS is calculated by adjusting the weighted average number of ordinary and Class A shares outstanding by the assumption of the conversion of all potential dilutive ordinary shares arising from share options and RSUs granted by the Company (collectively forming the denominator for computing the diluted EPS). For share options and RSUs, a calculation is done to determine the number of shares that would have been issued assuming the exercise of the share options and RSUs. The above number is added to the denominator as an issue of ordinary shares for no consideration. Net profit/loss attributable to equity holders of the parent (numerator) is adjusted for the charge that would arise if equity settlement took place.
126Mail.ru Group Annual Report 2018

Notes to Consolidated Financial Statements (continued)
Mail.Ru Group 2018 Results 44
19 EPS (continued) 19.2 Diluted EPS (continued) The calculation of diluted EPS is summarised in the table below: 2018 2017
Net profit attributable to equity holders of the Company (7,991) 2,261 Adjustment for the gains from cash setlled option (82) –
Adjusted net profit attributable to equity holders of the Company (8,073) 2,261
Weighted average number of ordinary and class A shares in issued and outstanding 213,798,296 211,548,999 Effect of equity-settled share based payments of the Company 2,844,785 3,379,979
Total diluted weighted average number of shares 216,643,081 214,928,978
Diluted EPS (RUB per share) n/a 11
20 Commitments, contingencies and operating risks 20.1 Operating environment of the Group Most of the Group’s operations are in Russia. Russia continues economic reforms and development of its legal, tax and regulatory frameworks as required by a market economy. The future stability of the Russian economy is largely dependent upon these reforms and developments and the effectiveness of economic, financial and monetary measures undertaken by the government. The Russian economy has been negatively impacted by sanctions imposed on Russia by a number of countries. The Rouble interest rates remained high. The combination of the above resulted in reduced access to capital, a higher cost of capital and uncertainty regarding economic growth, which could negatively affect the Group’s future financial position, results of operations and business prospects. Management believes it is taking appropriate measures to support the sustainability of the Group’s business in the current circumstances. 20.2 Taxation Russian tax, currency and customs legislation is subject to varying interpretations, and changes, which can occur frequently. Management's interpretation of such legislation as applied to the transactions and activity of the Group may be challenged by the relevant regional and federal authorities. Recent events within the Russian Federation suggest that the tax authorities are taking a more assertive position in their interpretation of the legislation and assessments and as a result, it is possible that transactions and activities that have not been challenged in the past may be challenged. As such, significant additional taxes, penalties and interest may be assessed. Fiscal periods remain open to review by the authorities in respect of taxes for three calendar years preceding the year of review. Under certain circumstances reviews may cover longer periods. The Group’s management believes that its interpretation of the relevant legislation is appropriate and is in accordance with the current industry practice and that the Group’s tax, currency and customs positions will be sustained. However, the interpretations of the relevant authorities could differ and the effect of additional taxes, fines and penalties on these consolidated financial statements, if the authorities were successful in enforcing their different interpretations, could be significant. 20.3 Legal proceedings The Group has been and continues to be the subject of legal proceedings and adjudications from time to time, none of which has had, individually or in the aggregate, a material adverse impact on the Group. Management believes that the resolution of all current and potential legal matters will not have a material adverse impact on the Group’s financial position or operating results. 20.4 Competition The development by domestic and large international internet companies of Russian language versions of the services competing with the services the Group provides could decrease Group’s user base and make it less attractive to advertisers. Increased competition could also result in a reduction in the number of users who buy the Group’s Community IVAS which, in turn, would result in lower revenue and net income. Similarly, the Group may be required to spend additional resources to promote or improve its services in order to compete effectively, which could require additional capital or adversely affect the Group’s profitability. 20.5 Private information To become registered on a website operated by the Group, users have to input their personal data, which is then protected by the Group from access by third parties. Should such data become available to third parties as a result of hackers’ attacks, the Group may become a party to litigation from its users. Management believes it takes all necessary steps to reduce the related risk to an acceptable level.
127Mail.ru Group Annual Report 2018

Notes to Consolidated Financial Statements (continued)
Mail.Ru Group 2018 Results 45
20 Commitments, contingencies and operating risks (continued) 20.6 Intellectual property rights The Group may be subject to infringement claims from third parties in the future resulting from the technology and intellectual property used in the provision and marketing of its services. If the Group is found liable for infringement, it may be required to pay significant damages, and if it is unable to license or develop non-infringing technology on a timely basis, it may be unable to continue offering the affected services without risk of liability. Similarly, third parties may obtain and use the Group’s intellectual property without authorisation. The validity, application, enforceability and scope of protection of intellectual property rights for many Internet-related activities are uncertain and still evolving, which may make it more difficult for the Group to protect its intellectual property and could have a material effect on its business, results of operations and financial condition. The Group has been subject to such proceedings. Although none of them was individually significant, similar potential claims may subject the Group to significant losses in the future, which currently cannot be reliably estimated. 20.7 Development A failure to innovate, to provide popular products and services or to react quickly to changes in the market could affect the popularity of the Group’s sites and, in turn, could affect the Group`s revenue. An inability to develop competitive products and services which are compatible with new mobile devices could result in a failure to capture a significant share of an increasingly important market. 20.8 Regulation The Internet and its associated technologies are subject to government regulation. Substantial part of Group’s business is subject to Russian laws. New laws and regulations, or new interpretations of existing laws and regulations, could require the Group to invest in restructuring certain services or could lead to a reduction in their take-up by users, with a resulting effect on revenue and profitability. Non-compliance with the applicable regulations could lead to penalties or blocking of non-compliant services. In January 2017 law regulating online news aggregation services came into force. The law regulates activities of providers of news aggregation services, requiring registering with a governmental authority if daily audience of aggregation services is more than one million users and imposing on news aggregation services obligations similar to those of registered mass media. At the same time, news aggregation services are exempted from liability if they utilize mass media’s news materials. Further, in 2017 new laws have been adopted in Russia. Law on online online-cinemas has entered into force on June 1, 2017, the law does not affect Group’s properties and does not regulate videos in social networks. Law on identification of messengers’ users has been adopted and will come into force from January 1, 2018, the Group plans to comply with the law without additional material costs. Law on “mirrors” of blocked websites entered into force on October 1, 2017 setting forth a simplifies procedures for blocking restricted websites. Law on anonymizers entered into force on 01 November 2017, but does not affect Group’s properties or services. Starting October 1, 2017 search engines in Russia are obligated to filter pirate websites (included in the black list) in search results, and starting November 1, 2017 search engines are obligated to filter all restricted websites (included in the black list) in search results. The Group is also subject to other various specific Russian laws, such as so called Anti-Piracy Law, Anti-extremism Law, Black List Law, Law regulating aggregators of goods and services, etc. The Group complies with the existing and new laws in all material respects 20.9 Personnel As competition in Russia’s internet industry increases, the Group’s business and operations could be adversely affected by difficulties in hiring, motivating and retaining highly-skilled people. Competition for senior managers is high. One or more could join a competitor, or set-up a competing company, with the result that operations and profitability could be affected by a loss of strategic direction, users, know-how and additional staff. 20.10 Infrastructure and capacity If the infrastructure in Russia were not able to support increased demand, the Group’s services could be interrupted or the Group’s systems damaged. A limited availability of third-party providers of network and server capacity could limit the Group’s ability to offer certain services or to expand. Network or power failures could result in the loss of data and in a reduction in the number of users, which could have a material effect on the Group’s business, results of operations and financial condition. 20.11 Operating lease commitments – the Group as a lessee The table below summarises minimum lease payments under non-cancellable operating lease contracts where the Group is a lessee:
2018 2017
Minimum lease payments Minimum lease payments
Due in less than 1 year 1,780 1,399 Due between 2 to 5 years 469 469 Due in more than 5 years – –
Total 2,249 1,868
128Mail.ru Group Annual Report 2018

Notes to Consolidated Financial Statements (continued)
Mail.Ru Group 2018 Results 46
20 Commitments, contingencies and operating risks (continued) 20.11 Operating lease commitments – the Group as a lessee (continued) The Group mainly leases office premises. In 2018 operating lease expense in the consolidated statement of comprehensive income amounted to RUR 2,149 (2017 – RUR 1,861). The minimum lease payments denominated in currency other than RUR are calculated based on exchange rate of Central Bank of Russia as of December 31, 2018 or according to each respective agreement. 21 Balances and transactions with related parties The following table provides the total amount of transactions, which have been entered into with related parties for the relevant financial year, excluding Directors and key management of the Group (see Notes 21.2 and 21.3). All related party transactions were made in accordance with contractual terms and conditions agreed between the parties. Other entities represents other than equity accounted associates (Note 3.17).
Sales to related parties Purchases from related parties
Amounts owed by related parties
Amounts owed to related parties
2018 Equity accounted associates 1,156 574 305 136 Shareholders and other entities 1,124 22 833 7
2017 Equity accouned associates 119 – 75 3 Shareholders and other entities 243 27 31 2 All related party transactions were made in accordance with contractual terms and conditions agreed between the parties. In January 2018, the Group acquired the ESforce business from Anton Cherepennikov and from Highland Falls Investment. Vladimir Streshinskiy abstained from voting as an interested director. An independent committee of the board was formed to oversee the acquisition process and to advise non-interested directors. The committee received third party assessments from independent advisors. The transaction was approved by all non-interested and independent directors. For details please refer to Note 5.2. 21.1 The ultimate controlling party Starting October 18, 2018, no single shareholder of JSC MF Technologies is entitled solely to nominate 5 directors to the Company’s Board of Directors at its discretion. As such, starting from that date, the Group does not have an ultimate controlling party. 21.2 Directors of the Company Total cash remuneration of the members of the Board of Directors (each a “Director” and collectively, “Directors”) of the Company amounted to RUR 144 for the year ended December 31, 2018 (2017: RUR 130). In 2018 no RSUs or options over the shares of the Company were granted to Directors (2017: 20,000 RSUs). During the year ended December 31, 2018, Directors did not forfeit any RSUs or options (2017: nil) and exercised 2,500 options (2017: 3,986,032). Additionally in Q1 2017 1,100,000 RSUs held by Directors of the Company were accelerated . The corresponding share-based payment expense was a negative RUR 49 for the year ended December 31, 2018 (2017: RUR 728). 21.3 Key management of the Group Total cash remuneration of the key management of the Group (excluding Directors) amounted to RUR 563 for the year ended December 31, 2018 (2017: 517). In addition to the cash remuneration for the year ended December 31, 2018, key executive employees of the Group were granted 200,000 RSUs out of 2017 RSU Plan (2017: 3,335,000). During the year ended December 31, 2018, key management of the Group (excluding Directors) did not forfeit any options (2017: nil) and exercised 3,082,500 RSU`s and options over shares of the Company (2017: 1,465,865). Additionally in Q4 2018 3,535,000 RSUs held by key management of the Company were accelerated. The corresponding share-based payment expense amounted to RUR 3,405 for year ended December 31, 2018 (2017: 998).
129Mail.ru Group Annual Report 2018

Notes to Consolidated Financial Statements (continued)
Mail.Ru Group 2018 Results 47
22 Financial instruments The carrying amounts of the Group's financial instruments approximated their fair values as of December 31, 2018 and December 31, 2017 and are presented by category of financial instruments in the table below: Category* December 31, 2018 December 31, 2017
Financial assets through profit and loss Non-current
Financial investments in venture capital investees FAFVPL 256 264 Derivative financial assets over the equity of investee FAFVPL 92 101 Convertible loans FAFVPL 1,167 – Financial derivative under lease contract FAFVPL 500 –
Current Derivative financial assets over the equity of investee FAFVPL 2 21 Convertible loans FAFVPL 1,070 – Financial derivatives under lease and hosting contracts FAFVPL – 150
Financial assets at amortised cost Trade accounts receivable FAAC 9,916 6,556 Loans and interest receivable FAAC 114 77 Cash and cash equivalents FAAC 11,723 15,371
Total financial assets
24,840 22,540
Financial liabilities through profit and loss Current
Contingent liability (Note 6, Note 16) FLFVPL 1,997 –
Financial liabilities at amortised cost Current
Trade accounts payable, other payables and accrued expenses FLAC 11,876 7,798 Non-current
Other payables FLAC – 245
Total financial liabilities
13,873 8,043
* Financial instruments used by the Group are included in one of the following categories:
– FAFVPL – financial assets at fair value through profit or loss;
– FLFVPL – financial liabilities at fair value through profit or loss;
– FAAC – financial assets at amortised cost; or
– FLAC – financial liabilities at amortised cost. None of the Group’s financial investees are public companies and none of the Group’s financial instruments are traded in active markets. Accordingly, fair values of the Group’s financial assets and liabilities at fair value through profit or loss are determined using valuation techniques, including discounted cash flow models, comparison to similar instruments for which observable market prices exist, option pricing models and other relevant valuation models. Such valuation techniques require management to make certain assumptions about model inputs, including credit risk and volatility. Fair value of cash and cash equivalents, short-term time deposits, short-term accounts receivable, other current assets, trade accounts payable approximate their carrying amounts largely due to the short-term maturities of these instruments. 22.1 Financial assets classified as loans and receivables Detailed information on short-term receivables, cash and cash equivalents and short-term time deposits is available in Notes 12 and 13. 22.2 Fair value hierarchy The Group uses the following hierarchy for determining and disclosing the fair value of financial instruments by valuation technique:
• Level 1: quoted prices (unadjusted) in active markets for identical assets or liabilities
• Level 2: inputs other than quoted prices included within Level 1 that are observable for the asset or liability, either directly (i.e., as prices) or indirectly (i.e., derived from prices)
• Level 3: inputs for the asset or liability that are not based on observable market data (unobservable inputs).
130Mail.ru Group Annual Report 2018

Notes to Consolidated Financial Statements (continued)
Mail.Ru Group 2018 Results 48
22 Financial instruments (continued) 22.2 Fair value hierarchy (continued) As at December 31, 2018 and 2017 the Group held the following financial instruments measured at fair value:
December 31, 2018 Level 1 Level 2 Level 3
Financial assets measured at fair value Financial assets at fair value through profit or loss:
Financial investments in venture capital investees 256 – – 256 Convertible loans 2,237 2,237 Financial derivative under lease contract 500 – – 500 Derivative financial assets over the equity of investee 94 – – 94
Total financial assets at fair value through profit or loss 3,087 – – 3,087
Total financial assets measured at fair value 3,087 – – 3,087
Financial liabilities measured at fair value Contingent consideration liability (Note 16) 1,997 – – 1,997
Total financial liabilities measured at fair value 1,997 – – 1,997
December 31, 2017 Level 1 Level 2 Level 3
Financial assets measured at fair value Financial assets at fair value through profit or loss:
Financial investments in associates 264 – – 264 Financial derivatives under lease and hosting contracts 150 – – 150 Derivative financial assets over the equity of investee 122 – – 122
Total financial assets at fair value through profit or loss 536 – – 536
The balance of Level 3 measurements as of January 1, 2017 is reconciled to the balance of those measurements as of December 31, 2018 as follows:
Balance as of
January 1, 2017
Gains/(losses) recognized in profit
and loss Purchases Acqusition of control
in investees Balance as of
December 31, 2017
Financial assets measured at fair value Financial assets at fair value through profit or loss:
Financial investments in venture capital investees 322 (27) 89 (120) 264 Derivative financial assets over the equity of investee 22 100 – – 122 Financial derivatives under lease and hosting contracts 164 (14) – – 150
Total financial assets at fair value through profit or loss 508 59 89 (120) 536
Financial liabilities at fair value through profit or loss – derivative over the equity of investee (234) (56) 44 246 –
Financial liabilities at fair value through profit or loss – derivative over other agreements – (60) 60 – –
Total financial liabilities measured at fair value (234) (116) 104 246 –
Balance as of
January 1, 2018
Gains/(losses) recognized in
profit and loss
Foreign exchange
gains/(losses) Purchases
Acqusition of control in investees
Acquisition of significant
influence in investee
Balance as of December 31,
2018
Financial assets measured at fair value Financial assets at fair value through profit or loss:
Financial investments in venture capital investees 264 26 5 72 (111) – 256 Derivative financial assets over the equity of investee 122 275 – 3 (11) (295) 94 Convertible loans – (626) – 3,006 – (143) 2,237 Financial derivatives under lease and hosting contracts 150 350 – – – – 500
Total financial assets at fair value through profit or loss 536 25 5 3,081 (122) (438) 3,087
Financial liability measured at fair value Financial liabilities at fair value through profit or loss –
contingent consideration liability – (515) (257) (1,225) – – (1,997)
Total financial liabilities measured at fair value – (515) (257) (1,225) – – (1,997)
131Mail.ru Group Annual Report 2018

Notes to Consolidated Financial Statements (continued)
Mail.Ru Group 2018 Results 49
23 Financial risk management objectives and policies 23.1 Introduction The Group’s principal financial liabilities mainly comprise a contingent consideration liability and trade accounts payable. The main purposes of these financial liabilities are to finance the Group’s operations and, in the case of the contingent consideration, a business acquisition. The Group has short-term receivables, short-term time deposits, cash and cash equivalents and other current financial assets that arise directly from the Group’s operations. The Group also has a venture capital investment portfolio consisting of equity investments in Internet start-ups and smaller Internet companies and derivative contracts over the equity of the Group’s venture capital investees. The Group also has a venture capital investment portfolio consisting of equity investments in Internet start-ups and smaller Internet companies and derivative contracts over the equity of the Group’s venture capital investees. The Group’s senior management is responsible for identifying and controlling risks. These activities are supervised by the Board of Directors, the Group’s governing body that is ultimately responsible for the Group’s overall approach to risk management. The Board of Directors is developing risk management policies covering the following major aspects: identification and analysis of the risks the Group faces, setting appropriate risk limits and controls, and monitoring risks and adherence to limits. Risk management procedures and systems are contemplated to be reviewed regularly to reflect changes in market conditions and the Group’s activities. The Group, through its training and management standards and procedures, aims to develop a disciplined and constructive control environment in which all employees understand their roles and responsibilities. The Group’s Audit Committee has been established to oversee, inter alia, how management monitors compliance with the Group’s risk management practices and procedures when these are approved by the Board of Directors. 23.2 Liquidity and financial resources The Group monitors its risk of a shortage of funds using a liquidity planning tool. The Group’s objective is to maintain a balance between continuity of funding and flexibility through the use of operating cash flows and bank overdrafts. Other financial liabilities of the Group are mostly represented by trade payables with maturity less than one year. 23.3 Credit risk Credit risk is the risk that a counterparty will not meet its obligations under a financial instrument or customer contract, leading to a financial loss. Financial assets, which potentially subject the Company and its subsidiaries and associates to credit risk, consist principally of cash and cash equivalents, short-term time deposits, short-term receivables and convertible loans. The total of these account balances represents the Group’s maximum exposure to credit risk. The Group places its cash and cash equivalents with highly rated financial institutions, which are considered at the time of deposit to have minimal risk of default. The Group does not require collateral or other security to support the financial instruments subject to credit risk. Accounts receivable from the two largest customers collectively represented 12% of total trade accounts receivable of the Group as of December 31, 2018 and 21% as of December 31, 2017. No customer accounted for more than 10% of revenue in 2018 or 2017. The Group provides credit payment terms to its customers in accordance with market practices and based on thorough review of the customer’s profile and creditworthiness. Although collection of receivables could be influenced by economic factors, management believes that there is no significant risk of loss beyond the allowance already recorded. 23.4 Capital management policy For the purpose of the Group’s capital management, capital includes issued capital, share premium and all other equity reserves attributable to the equity holders of the parent. The primary objective of the Group’s capital management is to maximise the shareholder value. The Group manages its capital structure and makes adjustments in light of changes in economic conditions. 23.5 Market risk Market risk is the risk that the fair value of future cash flows of a financial instrument will fluctuate because of changes in market prices. The market risks the Group is exposed to comprise two types of risk: currency risk (Note 23.6) and equity risk. The Group’s financial instruments affected by market risk include payables, cash and cash equivalents, short-term time deposits, financial investments in associates and derivative financial instruments. The Group’s equity risk arises from uncertainties about future values of the investment into unlisted securities.
132Mail.ru Group Annual Report 2018
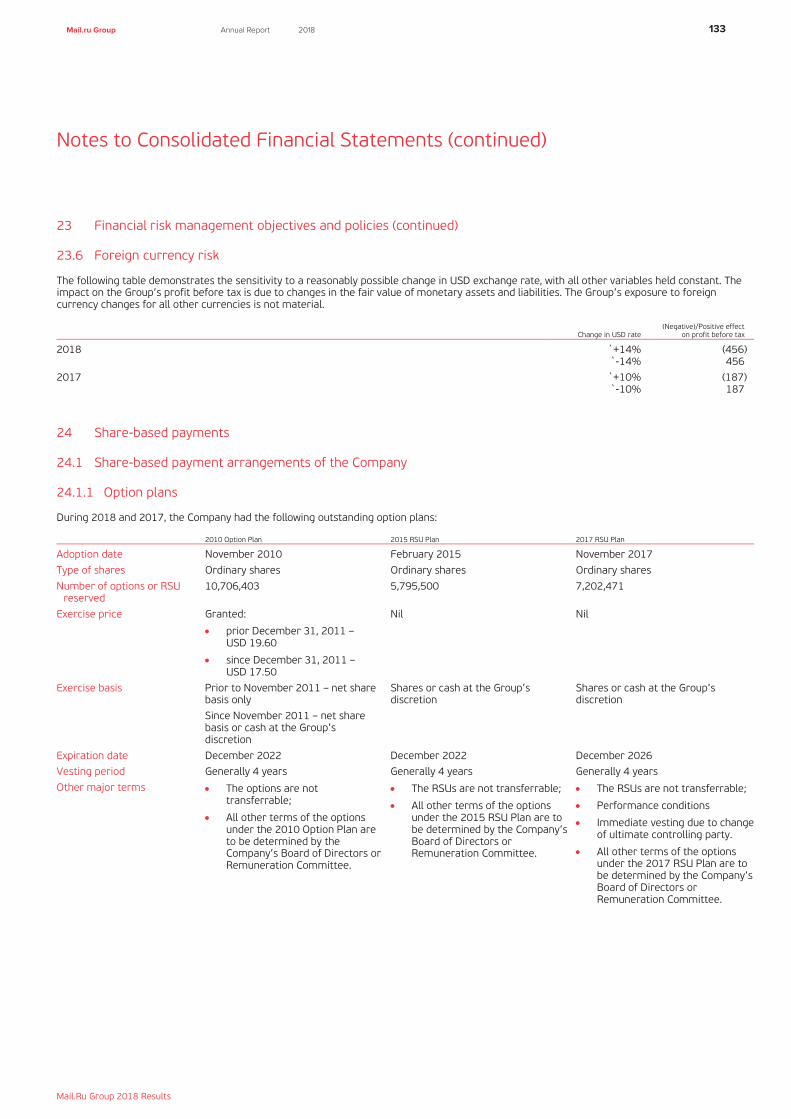
Notes to Consolidated Financial Statements (continued)
Mail.Ru Group 2018 Results 50
23 Financial risk management objectives and policies (continued) 23.6 Foreign currency risk The following table demonstrates the sensitivity to a reasonably possible change in USD exchange rate, with all other variables held constant. The impact on the Group’s profit before tax is due to changes in the fair value of monetary assets and liabilities. The Group’s exposure to foreign currency changes for all other currencies is not material.
Change in USD rate (Negative)/Positive effect
on profit before tax
2018 `+14% (456) `-14% 456
2017 `+10% (187) `-10% 187 24 Share-based payments 24.1 Share-based payment arrangements of the Company 24.1.1 Option plans During 2018 and 2017, the Company had the following outstanding option plans:
2010 Option Plan 2015 RSU Plan 2017 RSU Plan
Adoption date November 2010 February 2015 November 2017
Type of shares Ordinary shares Ordinary shares Ordinary shares
Number of options or RSU reserved
10,706,403 5,795,500 7,202,471
Exercise price Granted:
• prior December 31, 2011 – USD 19.60
• since December 31, 2011 – USD 17.50
Nil Nil
Exercise basis Prior to November 2011 – net share basis only
Shares or cash at the Group’s discretion
Shares or cash at the Group’s discretion
Since November 2011 – net share basis or cash at the Group’s discretion
Expiration date December 2022 December 2022 December 2026
Vesting period Generally 4 years Generally 4 years Generally 4 years
Other major terms • The options are not transferrable;
• All other terms of the options under the 2010 Option Plan are to be determined by the Company’s Board of Directors or Remuneration Committee.
• The RSUs are not transferrable;
• All other terms of the options under the 2015 RSU Plan are to be determined by the Company’s Board of Directors or Remuneration Committee.
• The RSUs are not transferrable;
• Performance conditions
• Immediate vesting due to change of ultimate controlling party.
• All other terms of the options under the 2017 RSU Plan are to be determined by the Company’s Board of Directors or Remuneration Committee.
133Mail.ru Group Annual Report 2018

Notes to Consolidated Financial Statements (continued)
Mail.Ru Group 2018 Results 51
24 Share-based payments (continued) 24.1 Share-based payment arrangements of the Company (continued) 24.1.2 Changes in outstanding options The table below summarises the the number and weighted average exercise prices (WAEP) of and movements in share options and RSUs in 2018 and 2017:
Number of options/RSU WAEP
Outstanding as of December 31, 2016 10,563,127 10.08
Exercisable as of December 31, 2016 7,730,377 13.6 Available for grant as of December 31, 2016 6,384,864 2.12 Granted during the year 4,029,000 0.56 Exercised during the year 7,349,363 10.81 Cancelled during the year 0 n/a Forfeited during the year 38,000 5.93
Outstanding as of December 31, 2017 7,204,764 4.04
Exercisable as of December 31, 2017 2,464,597 11.01 Available for grant as of December 31, 2017 2,393,864 4.79 Granted during the year 1,352,293 5.05 Exercised during the year 3,796,842 1.68 Cancelled during the year 0 n/a Forfeited during the year 110,200 6.75
Outstanding as of December 31, 2018 4,650,015 6.18
Exercisable as of December 31, 2018 3,586,139 5.94 Available for grant as of December 31, 2018 1,151,771 4.68 The weighted-average share price was USD 27.59 for options and RSUs exercised in 2018 and USD 27.30 for options and RSUs exercised in 2017. The range of exercise prices for options and RSUs outstanding as of December 31, 2018 and 2017 is presented in the table below:
Exercise price December 31, 2018 December 31, 2017
– 3,101,093 5,660,800 17.5 782,167 590,500 19.6 766,755 953,464
24.1.3 Valuations of share-based payments The valuations of all equity-settled options and RSUs granted during 2017 and 2018 are summarised in the table below:
Option plan/Grant date Number of options Share price Fair value, total Fair value per option
(USD) (million RUR) (RUR)
2010 Option Plan/ 2017 130,000 26.35 114 875 2015 RSU Plan / 2017 464,000 21.24-33.00 684 1,474 2017 RSU Plan / 2017 3,435,000 29.30 5,907 1,720 2010 Option Plan/ 2018 390,000 21.54-27.96 353 905 2017 RSU Plan / 2018 962,293 22.38-35.54 1,676 1,742 The valuations of all cash-settled options as of December 31, 2018 are summarised in the table below:
Number of options Dividend yield Volatility,
Risk-free interest rate, Expected term, Share price Fair value, total Fair value per option
Valuation method % % % years (USD) (million RUR) (RUR)
447,730 0% 41% 2.54% N/A 23,46 296 661 Binomial The forfeiture rate used for expenses calculation in 2018 is 0.1-17.0%. It is based on historical data and current expectations and is not necessarily indicative of forfeiture patterns that may occur. The expected volatility reflects the assumption that the historical volatility over a period similar to the life of the options/RSUs is indicative of future trends, which may not necessarily be the actual outcome. 24.2 Share-based payment expense The Group recognised RUR 6,732 in share-based payment expenses in the year ended December 31, 2018 (2017: RUR 2,475), including RUR 6,918 (2017: 2,238) related to equity-settled share-based payments and negative change related to cash-settled portion of RUR 186 (2017: negative 237). The expense was included under “Personnel expenses” in the consolidated statement of comprehensive income. According to the terms of 2017 RSU Plan the change of control results in immediate acceleration of related RSUs. The total expense related to such acceleration recongnized in Q4 2018 is RUR 3.7 bln (3,166,250 RSUs).
134Mail.ru Group Annual Report 2018

Notes to Consolidated Financial Statements (continued)
Mail.Ru Group 2018 Results 52
25 Events after the reporting period In February 2019 the Group received Federal Antimonopoly Service of Russia approval and as a result met all criteria to demonstrate control over the UMA.
135Mail.ru Group Annual Report 2018
136Mail.ru Group Annual Report 2018
Cautionary statements
Forward-looking statements The Mail.ru Group Limited Annual Report and Accounts for 2018 contain certain “for-ward-looking statements” which include all statements other than those of historical facts that relate to the Group’s plans, financial position, objectives, goals, strategies, future operations and performance, together with the assumptions underlying such matters. Mail.ru Group Lim-ited generally uses words such as “estimates”, “expects”, “believes”, “intends”, “plans”, “may”, “will”, “should” and other similar expressions to identify forward-looking statements. Mail.ru Group Limited has based these forward-looking statements on the current views of its man-agement with regard to future events and performance. These views reflect management’s best judgment, but involve uncertainties and are subject to certain known and unknown risks together with other important factors outside the Group’s control, the occurrence of which could cause actual results to differ materially from those expressed in Mail.ru Group Limited forward-looking statements.
Competitive position Statements referring to the Group’s competitive position reflect the Group’s beliefs and, in some cases, rely on a range of sources, including investment analysts’ reports, independent market studies and the Group’s internal estimates of market share based on publicly avail-able information regarding the financial results and performance of various market partici-pants.
Rounding Certain figures included in this document have been subject to rounding adjustments. Ac-cordingly, figures shown for the same category presented in different tables may vary slightly and figures shown as totals in certain tables may not be an arithmetic aggregation of the figures that precede them.
Terminology In this document, a reference to the "Company" means Mail.ru Group Limited, which together with its subsidiaries is referred to as “we”, the “Group” or “Mail.ru Group”. Any reference to a position of Boris Dobrodeev as Chief Executive Officer (CEO) means reference to his position as Chief Executive Officer (CEO), Russia. Any reference to a position of Vladimir Nikolsky as Chief Operating Officer (COO) means reference to his position as Chief Operating Officer (COO), Russia. Any reference to a position of Dmitry Sergeev as Deputy Chief Executive Officer means reference to his position as Deputy Chief Executive Officer, Russia.