
Montage Technology Group Limited - Stifel
192
5,350,000 shares Montage Technology Group Limited Ordinary shares This is an offering of ordinary shares of Montage Technology Group Limited. We are offering 1,000,000 ordinary shares. The selling shareholders are offering 4,350,000 ordinary shares. We will not receive any of the proceeds in connection with the shares to be sold by the selling shareholders from this offering. We will bear all of the offering expenses other than the underwriting discount of the shares to be sold by the selling shareholders. Our ordinary shares are listed on the NASDAQ Global Market under the symbol “MONT”. On January 30, 2014, the last reported sale price of our ordinary shares on the NASDAQ Global Market was $21.70 per ordinary share. Investing in our ordinary shares involves a high degree of risk. See “Risk factors” beginning on page 11. Neither the Securities and Exchange Commission nor any state securities commission has approved or disapproved of these securities or passed upon the adequacy or accuracy of this prospectus. Any representation to the contrary is a criminal offense. Per Share Total Public offering price $21.00 $112,350,000 Underwriting discounts and commissions (1) $ 1.05 $ 5,617,500 Proceeds, before expenses, to us $19.95 $ 19,950,000 Proceeds, before expenses, to the selling shareholders $19.95 $ 86,782,500 (1) See “Underwriting” for additional information regarding compensation. The selling shareholders have granted the underwriters an option for a period of 30 days to purchase up to 802,500 additional ordinary shares. An affiliate of an existing shareholder, UMC Capital Corporation, has agreed to purchase 50,000 shares in this offering at the public offering price. The underwriters will receive the same discount and commissions from the ordinary shares purchased by the affiliate of UMC Capital Corporation as they will from any other ordinary shares sold to the public in this offering. The underwriters expect to deliver the shares to purchasers on February 5, 2014. Deutsche Bank Securities Barclays Stifel Wells Fargo Securities Needham & Company Chardan Capital Markets Roth Capital Partners Prospectus dated January 30, 2014.
-
Upload
khangminh22 -
Category
Documents
-
view
2 -
download
0
Transcript of Montage Technology Group Limited - Stifel

5,350,000 shares
Montage Technology Group LimitedOrdinary shares
This is an offering of ordinary shares of Montage Technology Group Limited. We are offering 1,000,000ordinary shares. The selling shareholders are offering 4,350,000 ordinary shares. We will not receive any of theproceeds in connection with the shares to be sold by the selling shareholders from this offering. We will bear all ofthe offering expenses other than the underwriting discount of the shares to be sold by the selling shareholders.
Our ordinary shares are listed on the NASDAQ Global Market under the symbol “MONT”. On January 30,2014, the last reported sale price of our ordinary shares on the NASDAQ Global Market was $21.70 per ordinaryshare.
Investing in our ordinary shares involves a high degree of risk. See “Risk factors”beginning on page 11.
Neither the Securities and Exchange Commission nor any state securities commission has approved ordisapproved of these securities or passed upon the adequacy or accuracy of this prospectus. Anyrepresentation to the contrary is a criminal offense.
Per Share Total
Public offering price $21.00 $112,350,000Underwriting discounts and commissions(1) $ 1.05 $ 5,617,500Proceeds, before expenses, to us $19.95 $ 19,950,000Proceeds, before expenses, to the selling shareholders $19.95 $ 86,782,500
(1) See “Underwriting” for additional information regarding compensation.
The selling shareholders have granted the underwriters an option for a period of 30 days to purchase up to802,500 additional ordinary shares.
An affiliate of an existing shareholder, UMC Capital Corporation, has agreed to purchase 50,000 shares in thisoffering at the public offering price. The underwriters will receive the same discount and commissions from theordinary shares purchased by the affiliate of UMC Capital Corporation as they will from any other ordinary sharessold to the public in this offering.
The underwriters expect to deliver the shares to purchasers on February 5, 2014.
Deutsche Bank Securities BarclaysStifel
Wells Fargo Securities Needham & CompanyChardan Capital Markets Roth Capital Partners
Prospectus dated January 30, 2014.
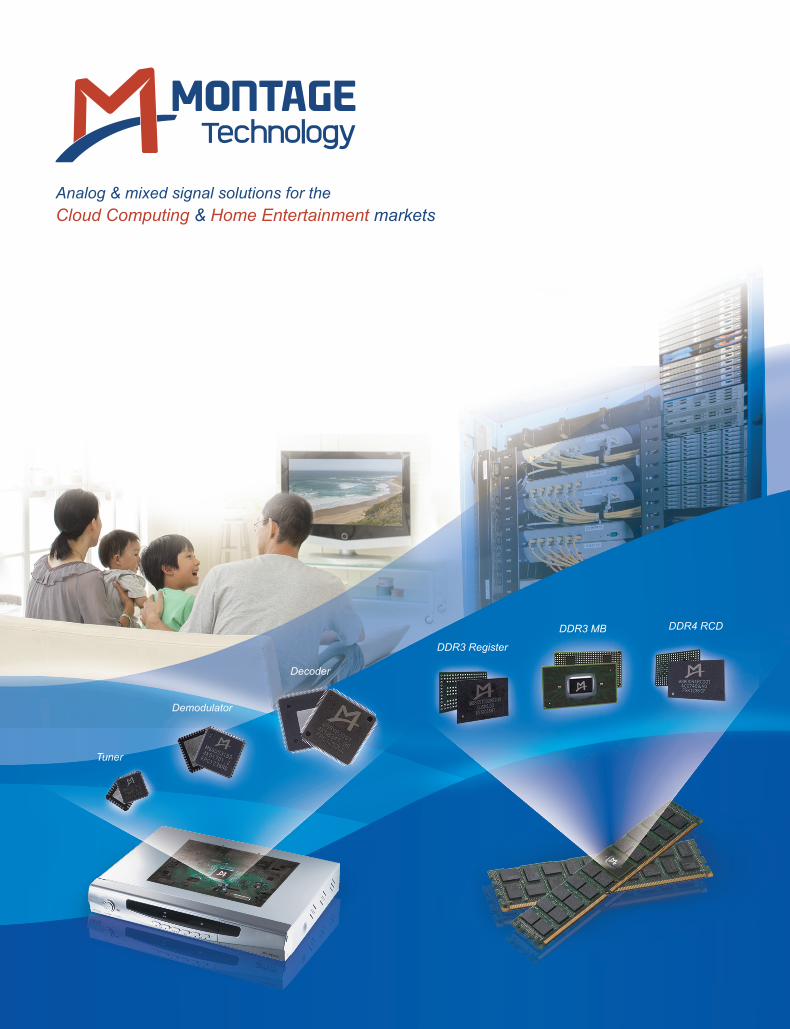

TABLE OF CONTENTS
Page
Prospectus Summary . . . . . . . . . . . . . . . . . . . . . . . . . . . . . . . . . . . . . . . . . . . . . . . . . . . . . . . . . . . . . . . . . . . . . . 1Risk Factors . . . . . . . . . . . . . . . . . . . . . . . . . . . . . . . . . . . . . . . . . . . . . . . . . . . . . . . . . . . . . . . . . . . . . . . . . . . . . 11Special Note Regarding Forward-Looking Statements . . . . . . . . . . . . . . . . . . . . . . . . . . . . . . . . . . . . . . . . . . . 36Market and Industry Data . . . . . . . . . . . . . . . . . . . . . . . . . . . . . . . . . . . . . . . . . . . . . . . . . . . . . . . . . . . . . . . . . 37Use of Proceeds . . . . . . . . . . . . . . . . . . . . . . . . . . . . . . . . . . . . . . . . . . . . . . . . . . . . . . . . . . . . . . . . . . . . . . . . . 38Dividend Policy . . . . . . . . . . . . . . . . . . . . . . . . . . . . . . . . . . . . . . . . . . . . . . . . . . . . . . . . . . . . . . . . . . . . . . . . . . 39Market Price of Ordinary Shares . . . . . . . . . . . . . . . . . . . . . . . . . . . . . . . . . . . . . . . . . . . . . . . . . . . . . . . . . . . . 40Capitalization . . . . . . . . . . . . . . . . . . . . . . . . . . . . . . . . . . . . . . . . . . . . . . . . . . . . . . . . . . . . . . . . . . . . . . . . . . . 41Selected Consolidated Financial Data . . . . . . . . . . . . . . . . . . . . . . . . . . . . . . . . . . . . . . . . . . . . . . . . . . . . . . . . . 42Management’s Discussion and Analysis of Financial Condition and Results of Operations . . . . . . . . . . . . . . . 44Business . . . . . . . . . . . . . . . . . . . . . . . . . . . . . . . . . . . . . . . . . . . . . . . . . . . . . . . . . . . . . . . . . . . . . . . . . . . . . . . 76Management . . . . . . . . . . . . . . . . . . . . . . . . . . . . . . . . . . . . . . . . . . . . . . . . . . . . . . . . . . . . . . . . . . . . . . . . . . . . 94Executive Compensation . . . . . . . . . . . . . . . . . . . . . . . . . . . . . . . . . . . . . . . . . . . . . . . . . . . . . . . . . . . . . . . . . . 102Related Party Transactions . . . . . . . . . . . . . . . . . . . . . . . . . . . . . . . . . . . . . . . . . . . . . . . . . . . . . . . . . . . . . . . . . 107Principal and Selling Shareholders . . . . . . . . . . . . . . . . . . . . . . . . . . . . . . . . . . . . . . . . . . . . . . . . . . . . . . . . . . 108Description of Share Capital . . . . . . . . . . . . . . . . . . . . . . . . . . . . . . . . . . . . . . . . . . . . . . . . . . . . . . . . . . . . . . . 112Shares Eligible for Future Sale . . . . . . . . . . . . . . . . . . . . . . . . . . . . . . . . . . . . . . . . . . . . . . . . . . . . . . . . . . . . . 120Taxation . . . . . . . . . . . . . . . . . . . . . . . . . . . . . . . . . . . . . . . . . . . . . . . . . . . . . . . . . . . . . . . . . . . . . . . . . . . . . . . 122Underwriters . . . . . . . . . . . . . . . . . . . . . . . . . . . . . . . . . . . . . . . . . . . . . . . . . . . . . . . . . . . . . . . . . . . . . . . . . . . . 128Enforceability of Civil Liabilities . . . . . . . . . . . . . . . . . . . . . . . . . . . . . . . . . . . . . . . . . . . . . . . . . . . . . . . . . . . 134Legal Matters . . . . . . . . . . . . . . . . . . . . . . . . . . . . . . . . . . . . . . . . . . . . . . . . . . . . . . . . . . . . . . . . . . . . . . . . . . . 136Experts . . . . . . . . . . . . . . . . . . . . . . . . . . . . . . . . . . . . . . . . . . . . . . . . . . . . . . . . . . . . . . . . . . . . . . . . . . . . . . . . 136Where You Can Find More Information . . . . . . . . . . . . . . . . . . . . . . . . . . . . . . . . . . . . . . . . . . . . . . . . . . . . . . . 137Index to Consolidated Financial Statements . . . . . . . . . . . . . . . . . . . . . . . . . . . . . . . . . . . . . . . . . . . . . . . . . . . . F-1
Neither we, nor the selling shareholders nor the underwriters have authorized anyone to provide anyinformation or to make any representations other than those contained or incorporated by reference in thisprospectus or in any free writing prospectuses we have prepared. We take no responsibility for, and can provide noassurance as to the reliability of, any other information that others may give you. This prospectus is an offer to sellonly the shares offered hereby, but only under circumstances and in jurisdictions where it is lawful to do so. Theinformation contained or incorporated by reference in this prospectus is current only as of its date.
For investors outside the United States: Neither we, nor the selling shareholders, nor the underwriters havedone anything that would permit our public offering or possession or distribution of this prospectus in anyjurisdiction where action for that purpose is required, other than in the United States. Persons outside the UnitedStates who come into possession of this prospectus must inform themselves about, and observe any restrictionsrelating to, the offering of our ordinary shares and the distribution of this prospectus outside of the United States.

Conventions That Apply to This Prospectus
In this prospectus,
• “CPU” refers to central processing unit;
• “DDR” refers to DDR DRAM, or double data rate dynamic random-access memory, a class of memoryintegrated circuits used in servers;
• “DDR2” refers to the second generation of DDR;
• “DDR3” refers to the third generation of DDR;
• “DDR4” refers to the fourth generation of DDR;
• “DIMM” refers to dual in-line memory module;
• “HDTV” refers to high-definition television;
• “HKD” refers to the legal currency of the Hong Kong Special Administrative Region of the People’sRepublic of China;
• “JEDEC” refers to Joint Electron Devices Engineering Council, an independent semiconductorengineering trade organization to develop standards for semiconductor devices;
• “LRDIMM” refers to load-reduced dual in-line memory module;
• “MPEG” refers to Moving Picture Experts Group;
• “preferred shares” refers to our Series A preferred shares, Series A-2 preferred shares, Series Bpreferred shares, Series B-1 preferred shares and Series B-2 preferred shares, each having par value ofUS$0.0125 per share;
• “RDIMM” refers to registered dual in-line memory module;
• “RF” refers to radio frequency;
• “RMB” or “Renminbi” refers to the legal currency of China;
• “SDTV” refers to standard-definition television;
• “shares” or “ordinary shares” refers to our ordinary shares, par value of US$0.0125 per share;
• “SoC” refers to system-on-chip, an integrated circuit that generally contains digital, analog, mixed-signal and radio-frequency functions on a single chip substrate; and
• “we,” “us,” “our company” and “our” refer to Montage Technology Group Limited and its subsidiaries,as the context requires.

PROSPECTUS SUMMARY
This summary highlights information contained elsewhere in this prospectus. This summary does notcontain all of the information you should consider before investing in our ordinary shares. You should read thisentire prospectus carefully, especially the “Risk Factors” section of this prospectus and our consolidatedfinancial statements and related notes appearing at the end of this prospectus, before making an investmentdecision. Some of the statements in this prospectus constitute forward-looking statements. See “Special NoteRegarding Forward-Looking Statements” for more information.
Our Company
We are a global fabless provider of analog and mixed-signal semiconductor solutions currently addressingthe home entertainment and cloud computing markets. Our expertise in analog and radio frequency solutions,digital signal processors and high speed interfaces serves as the foundation for our technology platform. Thesetechnical capabilities enable us to design high performance, low power semiconductors. In the homeentertainment market, our technology platform enables us to design highly integrated solutions with customizedsoftware and support for set-top boxes. Our solutions are designed to optimize signal processing performanceunder the challenging operating conditions typically found in emerging market environments, where oftenbroadcast signals received by the set-top box may be weak, distorted or off-specification. Our solutions contain anumber of different technologies that allow for enhanced signal processing, resulting in improved overall videoquality under the typically limited existing broadband network infrastructure in emerging markets. In the cloudcomputing market, we offer high performance, low power memory interface solutions that enable memory-intensive server applications. Our technology platform approach allows us to provide integrated solutions thatmeet the expanding needs of our customers through our continuous innovation, cost- and power-efficient designand rapid product development. Since our inception in 2004 through December 31, 2013, we have sold over300 million integrated circuits, which have been shipped to over 160 end customers worldwide.
While analog and mixed-signal technology is applicable to a broad array of end markets, we have beenhighly selective in identifying our initial target end markets. We focus on markets which we believe havecompelling long-term growth prospects and are also characterized by complex product design, long life cyclesand stringent qualification requirements. We believe that these market characteristics coupled with oursignificant investment in our technology platform have created high barriers to entry for set-top box solutions inemerging markets. Initially, we developed commercial solutions for the home entertainment market to addressthe rapidly growing demand for television in China, Southeast Asia and other emerging markets. According toiSuppli Corporation, or iSuppli, in 2012, 154 million set-top boxes were sold by Chinese manufacturers. Webelieve that set-top boxes sold by Chinese manufacturers primarily target China and other emerging markets. Thenumber of set-top boxes sold by Chinese manufacturers is expected to grow to over 243 million units in 2016according to iSuppli. This would represent a compound annual growth rate of 12% from 2012 to 2016. A key toour success in addressing the characteristics of the home entertainment market in emerging markets is our abilityto provide integrated solutions with customized software and support, which we develop through closecollaboration with our end customers. Our collaborative approach allows us to develop extensive localizedknowledge of a large, fragmented market with diverse technical and service requirements, deepening ourcustomer relationships and yielding design wins across multiple product generations. Our end customers in thehome entertainment market include nine of the ten largest set-top box manufacturers in China as measured byunits sold in 2012.
More recently, we released our memory interface solutions to pursue opportunities arising from the rapidgrowth in the cloud computing market. Our close collaboration with key industry participants, including CPUmanufacturers, memory module manufacturers and server original equipment manufacturers, or OEMs, hasenabled us to successfully develop high performance, low power memory interface solutions for cloud computing
1
environments. We sell our memory interface solutions to memory module manufacturers, which incorporate ourmemory interfaces into dual in-line memory modules, or DIMMs, which are devices used to add memorycapacity to a CPU. The most advanced cloud computing data servers operating today currently use DDR3memory technology and load-reduced DIMMs, or LRDIMMs, which require memory interfaces that buffer datasignals in addition to command and address signals. Memory interface vendors like us are unable to sell theirsolutions to memory module manufacturers without those solutions first being validated by manufacturers ofCPUs. We are currently one of two LRDIMM memory buffer suppliers validated by Intel Corporation for DDR3technology, the most prevalent industry standard for memory integrated circuits used in servers. Our customersin the cloud computing market include the world’s four largest DRAM manufacturers and the world’s largestthird-party DRAM module supplier as measured by 2012 revenues.
We offer ten solutions for use in the home entertainment market and two memory interface solutions for usein the cloud computing market. In 2012 and the nine months ended September 30, 2013, 94% and 91%,respectively, of our revenue was generated from sales of set-top box solutions targeting the home entertainmentmarket in emerging markets, while the remaining 6% and 9%, respectively, of our revenue was generated fromsales of memory interface solutions targeting the cloud computing market. Our solutions are built upon ourfoundation of 44 issued patents and an additional 48 pending patent applications as of December 31, 2013. As ofDecember 31, 2013, we had 300 engineers in our research and development organization, of which 151 holdpost-graduate engineering degrees. Our revenue has grown from $29.1 million in 2010 to $78.2 million in 2012,representing a compound annual growth rate of 64%, and from $54.5 million in the nine months endedSeptember 30, 2012 to $75.4 million in the nine months ended September 30, 2013, representing an annualgrowth rate of 38%. We had a net loss of $8.5 million in 2010 and net income of $5.0 million in 2011, $18.3million in 2012 and $16.8 million in the nine months ended September 30, 2013.
Our Target Markets
Our solutions primarily serve two large target markets, (i) the home entertainment market, in particular set-top boxes for emerging markets; and (ii) the cloud computing market, in particular memory interface solutionsfor data center servers.
Home Entertainment Market
In emerging markets, such as China, India, the Middle East, Latin and South America, Africa and SoutheastAsia, television content is broadcast and accessed through satellite transmissions, cable network connections orterrestrial over-the-air transmissions. Viewers often access content from these three signal transmission systemsusing set-top boxes that are connected to televisions within the home. According to iSuppli, in 2012, 154 millionset-top boxes were sold by Chinese manufacturers, primarily targeting emerging markets. Of the 154 millionunits sold, 66% were exported outside of China. The total number of set-top boxes sold by Chinesemanufacturers is expected to grow to over 243 million units in 2016 according to iSuppli, with 58% of thoseunits expected to be exported. This would represent a compound annual growth rate of 12% from 2012 to 2016.In addition, in some emerging markets, such as China, the broadcasting signal of television content istransitioning from analog to digital due to government- sponsored programs requiring the replacement oraddition of television access equipment. For example, China has a goal of shutting down analog TV signals by2015 and transitioning to digital TV in most regions. With improvements in content quality and increasingdisposable income, we believe that viewers in China and other emerging markets are expected to increasinglypurchase set-top boxes that can receive and display high-definition video content. While currently the satelliteset-top box market is the largest market for China-manufactured set-top boxes in terms of total number of set-topboxes sold, the cable set-top box market is expected to represent an increasing proportion of China-manufacturedset-top boxes from 2012 to 2016, according to iSuppli.
2
In order to optimize for superior and robust system performance and deliver cost-efficient solutions to set-top box manufacturers, semiconductor providers are integrating multiple functions into a single silicon package.These integrated solutions also require customized embedded software and field application support to ensureproper functionality and system level performance. The demands for cost-effective yet high-performancesolutions are particularly strong in emerging markets. According to iSuppli, the market for semiconductorsaddressing set-top boxes manufactured in China totaled $995 million in 2012 and is expected to grow to $1,316million in 2016, with sales of integrated semiconductor solutions outpacing the growth of the overall marketfrom 2012 to 2016. This would represent a compound annual growth rate of 7% from 2012 to 2016.
Cloud Computing Market
Global data center IP traffic is expected to increase from 1.8 zettabytes, or 1.8 billion terabytes, in 2011 to6.6 zettabytes in 2016, according to the Cisco Global Cloud Index published by Cisco System, Inc., or Cisco.This would represent a compound annual growth rate of 30% from 2011 to 2016. The proliferation of mobiledevices, cloud-based software applications and streaming video pose significant challenges for network datacenters. In addition, the rate at which data is being consumed is growing much faster than the rate of mobiledevice growth. The limited memory and processing speed of mobile devices has led to a majority of contentviewed on mobile devices being accessed using cloud computing technology.
To meet the rising demands being placed on networks, data center operators have increased the number ofservers within their facilities. In cloud computing environments where a significant number of memory-intensiveapplications are simultaneously being run on a server, the processing performance of CPUs is limited by theamount of memory available to the CPU. Additional memory capacity is required to ensure servers perform atoptimal levels, which is critical for on-demand applications like cloud computing and virtualization. As a result,memory capacity is added to a server through the use of dual in-line memory modules, or DIMMs, which housedynamic random access memory, or DRAM. Memory performance is enhanced through the use of interfacedevices called memory buffers that efficiently facilitate the rapid flow of data between the CPU and memory. Asthe number of cores in the CPU increases, the number of DIMMs required to achieve higher performance alsoincreases. The need for greater amounts of DRAM to support high performance computing is expected to drivethe development of higher capacity DIMMs, where a greater amount of gigabit storage is placed on a singleDIMM. The memory content within the overall server market is expected to grow to $3,129 million in 2016,according to Gartner Inc., or Gartner. This would represent a compound annual growth rate of 22% from 2012 to2016. In addition, memory is expected to become a larger percentage of the server semiconductor totaladdressable market, increasing from 13.8% in 2012 to 21.2% in 2016, according to Gartner. Based on ourknowledge gained through qualification processes with CPU and memory module manufacturers, we believehigher capacity DIMMs with memory densities equal to or above 32 gigabits will require the use of LRDIMMtechnology to ensure the highest server performance. Furthermore, we expect that new server platforms will needto expand the capacity for the number of DIMMs to address the increasing amount of data being transmitted overpublic and private networks. The number of machines using LRDIMM is expected to grow from 2.3 million in2014 to 3.1 million in 2016, while the average number of LRDIMMs used on a single machine is expected togrow from 4.8 in 2014 to 18.3 in 2016, according to Jon Peddie Research. The increase in number of machinesusing LRDIMMs and average number of LRDIMMs per machine is expected to drive rapid growth in thepotential available market for LRDIMM chipsets, which Jon Peddie Research estimates will increase from up to$312 million in 2014 to as much as $1,958 million in 2016. This would represent a compound annual growth rateof 151% from 2014 to 2016. In terms of unit volume, Jon Peddie Research estimates the potential availablemarket for LRDIMM chipsets will increase from up to 18.4 million units in 2014 to as much as 93.2 million unitsin 2016. This would represent a compound annual growth rate of 125% from 2014 to 2016.
The rise of computing power in a server also drives a significant increase in the energy costs required tooperate the server. Therefore, data center operators are increasingly focused on the power efficiency of each
3

component within a server system and ascribe significant value to low power solutions that can drive energysavings without compromising performance. Moreover, CPU manufacturers create technology platforms thatserver OEMs use as the basis for their server design. A CPU manufacturer sets the specifications for many of thekey components to be used in each generation of its server platforms. In the case of memory interface solutionsfor DIMMs, CPU manufacturers impose strict guidelines and generally qualify only a few vendors to providememory interface solutions for their server platforms. With each new server platform released by CPUmanufacturers, providers of memory interface solutions must be validated for use on the new platform. As such,the increased technical requirements for memory interface solutions not only create higher degrees of complexityand greater requirements for performance, signal integrity and low power on the newer generation memorybuffers, but also limit the number of participants in the market for memory interface solutions.
Key Requirements of Our Target Markets
Within the home entertainment market, set-top box manufacturers in emerging markets have the followingcritical needs which must be addressed when identifying semiconductor solutions for their products:
• integration;
• high level of field support;
• exceptional performance and signal processing in challenging environments;
• embedded software and comprehensive system-level solutions;
• cost effectiveness; and
• ease of manufacture.
Within the cloud computing market, server OEMs have the following critical needs which must beaddressed when identifying memory interface solutions for their products:
• high performance and low power;
• signal integrity; and
• built-in self-test capability.
To successfully compete in the home entertainment and cloud computing markets, semiconductor providersmust possess strong design capabilities in both analog and mixed-signal technologies as well as system leveldesign expertise. In addition, design solutions must effectively meet the foregoing requirements and offer anattractive value proposition for set-top box manufacturers, memory module manufacturers and server OEMsalike.
Our Solutions
We design, develop and market a range of analog and mixed-signal semiconductor solutions for set-topboxes targeting emerging markets as well as memory interface solutions for the cloud computing markets. Oursolutions comprise one or more analog and mixed-signal semiconductors combined with field application andother support services.
We market a range of high performance and multi-standard compliant HDTV and SDTV semiconductorsolutions for set-top boxes, including tuners, demodulators and decoders as well as integrated solutions withcustomized software and support. We provide an integrated solution by combining our RF and analog hardwaredesign with customized software. Our integrated solutions can combine tuner, demodulator and decodingtechnology in a single semiconductor solution. We believe our set-top box solutions deliver high performance
4

because we offer strong signal processing capabilities which address the challenges that are commonly found inemerging markets, where the limited and often substandard broadcast network infrastructure requires more robustsignal processing and performance capabilities than required in developed markets. We support our solutions withour extensive team of field application engineers who are geographically close to our customers and workextensively to deepen our customer relationships. We offer set-top box solutions for satellite, cable and terrestrialbroadcasts, with a particular strength in satellite and cable set-top boxes aimed at emerging markets.
By combining our expertise in high performance, low power mixed-signal semiconductor designtechnologies and other support services, we have designed and developed advanced memory interface solutionsthat provide high performance and low power consumption for use in data center servers for the cloud computingmarket. We design our memory interface solutions in close collaboration with our memory module manufacturerend customers as well as server OEMs and CPU manufacturers to meet required design specifications. Webelieve our memory interface solutions are high performance, because they can achieve better signal integritythan the competitors in our market, which allow our solutions to efficiently operate at higher speeds therebyincreasing memory capacity and improving server performance. Additionally, our built-in self-test capabilitieshelp our memory module manufacturer customers and server OEMs to rapidly validate memory performance.
Competitive Strengths
We believe the following strengths differentiate us from our competitors and are key drivers of our success:
• High performance, low power analog and mixed-signal technology platform. Our technologyplatform is built upon our foundation of high performance, low power expertise and consists of aversatile and comprehensive set of hardware and software building blocks that serve both our homeentertainment and cloud computing markets. For example, in the cloud computing market, we arecurrently one of two LRDIMM memory buffer suppliers validated by Intel Corporation for DDR3technology, the most prevalent industry standard for memory integrated circuits used in servers.
• Deep technology expertise. Our research and development team of 300 professionals, of which 151have advanced degrees, has extensive digital signal processing, radio frequency and analog and mixed-signal design experience and includes engineers who have participated in the development of keyindustry standards such as JEDEC and MPEG. Our core system-level expertise and understanding ofsystem requirements enables us to optimize our product roadmap and identify attractive opportunities.
• High levels of integration. We believe our integrated solutions result in superior performance andlower material and manufacturing costs for our customers, enhancing our attractive value proposition.Our integrated solutions have significant advantages over competing discrete products such asimproving signal integrity, reducing size and ultimately driving superior system performance. Webelieve that the enhanced performance and cost-effectiveness created by the high level of integration inour solutions allows us to deliver increased value to our end customers, which increases customerloyalty and positions us to benefit from demand for future product upgrades from end customers.
• Close collaboration and relationships with customers and industry participants. Our extensive customerinteraction, in particular through support provided by our field application engineers, combined with ourdeep understanding of our customers’ needs, fosters customer loyalty and increases visibility of evolvingcustomer requirements and market opportunities within our business. Our close proximity to ourcustomers, which are primarily located in Asia, also provides us with a better understanding of localsystem requirements and allows us to achieve faster time to market with our solutions.
• Broad customer base and attractive market opportunities in home entertainment. We have sold oursolutions principally through distributors to over 150 set-top box manufacturers worldwide. Our keycustomers include nine of the ten largest set-top box manufacturers in China, who manufactureproducts optimized for end users in emerging markets.
5

• Well positioned to capitalize on opportunities in cloud computing. We believe we offer the highestperformance and lowest-power memory interface solutions for memory-intensive cloud computingapplications. We are currently one of two LRDIMM suppliers validated by Intel Corporation for DDR3technology, the most prevalent industry standard for memory integrated circuits used in servers, andhave sold our memory interface solutions to the world’s four largest DRAM manufacturers and theworld’s largest third-party DRAM module supplier as measured by 2012 revenues.
Growth Strategy
We believe we can continue to grow our revenue by executing on the following strategies:
• Invest to maintain technology leadership position across product lines. We intend to continue ourfocus on retaining and attracting high quality engineering staff and investing in our intellectual propertyportfolio to further extend our leading high performance, low power technologies in our markets.
• Strengthen our relationships with customers and industry participants. We intend to continue tobuild upon and strengthen our collaborative relationships to increase our customers’ dependence on usand drive greater demand for our solutions, as well as to continue participating in the development ofkey industry standards to better align our future roadmap.
• Expand product offering and market share in home entertainment for emerging markets. We willcontinue to leverage our engineering expertise to grow our market share in the globally fragmentedhome entertainment market. We also intend to continue to introduce solutions with higher levels ofproduct functionality and integration, as we seek to increase our average selling price per set-top boxby providing more integrated solutions.
• Continue to position ourselves for growth in the cloud computing market. We intend to furtherpenetrate our existing customer base and collaborate with new memory module partners to increase ourrevenue. We also intend to further develop our partnership with leading CPU manufacturers and remainaligned with their server and next generation technology roadmaps.
Risk Factors
We are subject to a number of risks, including risks that may prevent us from achieving our businessobjectives or may adversely affect our business, financial condition, results of operations, cash flows andprospects. You should carefully consider these risks, including all of the risks discussed in the section entitled“Risk Factors,” beginning on page 11 of this prospectus, before investing in our ordinary shares. Risks relating toour business relate to, among other things:
• Our ability to sustain our recent revenue growth rates;
• Our ability to sustain or increase our profitability in the future;
• Our ability to develop and maintain relationships with key industry and technology leaders to enhanceour solution offerings and market position;
• Changes to industry standards and technical requirements relevant to our solutions and markets;
• The rapidly evolving and intensely competitive nature of our markets;
• Our ability to continuously develop new and enhanced solutions to meet changing market conditions;
• Our reliance on third parties to manufacture, package, assemble and test the semiconductor productscomprising our solutions;
• Our lengthy sales cycles, which could result in uncertainty and delays in generating revenue;
6

• Our ability to adequately protect our intellectual property rights; and
• Government policies that could have a material adverse effect on our results of operations.
Corporate Information
We are a Cayman Islands company and conduct our business primarily through our wholly owned operatingsubsidiaries in China, Hong Kong and the United States. Our principal executive office is located at Room A1601,Technology Building, 900 Yi Shan Road, Xuhui District, Shanghai 200233, China and our telephone number is +86(21) 6128-5678. Our website address is www.montage-tech.com. We do not incorporate the information containedon, or accessible through, our website into this prospectus, and you should not consider it part of this prospectus.
“Montage Technology” and our logo are our trademarks. All other trademarks and trade names appearing inthis prospectus are the property of their respective owners. We do not intend our use or display of other parties’trademarks, trade names or service marks to imply, and such use or display should not be construed to imply, arelationship with, or endorsement or sponsorship of us by, these other parties.
Preliminary Fourth Quarter of 2013 Financial Results
We expect revenue for the fourth quarter to be between $35.0 to $35.5 million, reflecting higher sales of ourmemory interface solutions due to growing demand for our products as well as continued growth of our set-topbox products in China and the emerging markets. We expect our set-top box revenue to increase by more than 10percent from the third quarter and our memory interface revenue to increase by more than 80 percent from thethird quarter. We expect gross margin for the fourth quarter of 2013 to be between 62 and 63 percent. We expectoperating expenses for the fourth quarter to be between $13.0 and $13.5 million, an increase from the thirdquarter primarily reflecting an increase in research and development expenses related to new products beginningthe fabrication process. We expect net income for the fourth quarter to be between $8.5 and $9.0 millionreflecting the expected increase in revenues and higher gross margins, partially offset by the expected increase inoperating expenses. Net income is expected to reflect pre-tax share-based compensation expenses ofapproximately $1.2 million and the amortization of acquired assets related to an assembled work force in Taiwanof approximately $0.3 million.
The preliminary financial results for the fourth quarter of 2013 are our sole responsibility. The preliminaryfinancial results provided above have not been subject to the completion of our normal annual closing and auditprocess, and final adjustments and other developments may arise between now and the time the financial resultsfor this period are finalized. As a result, our actual financial results for the three months ended December 31,2013 may differ materially from these preliminary financial results. Our independent registered publicaccounting firm has not audited, reviewed, compiled or performed any procedures with respect to theaccompanying preliminary financial results, and does not express an opinion or any other form of assurance withrespect thereto.
7

THE OFFERING
Ordinary shares offered by us 1,000,000 shares
Ordinary shares offered by the sellingshareholders 4,350,000 shares
Ordinary shares outstanding immediatelyafter this offering 27,498,043 shares
Option to purchase additional sharesoffered by the selling shareholders
The selling shareholders have granted to the underwriters an option,exercisable within 30 days from the date of this prospectus, topurchase up to an aggregate of 802,500 additional ordinary shares atthe public offering price, less underwriting discounts andcommissions, if any.
Use of proceeds We intend to use the net proceeds from this offering for generalcorporate purposes, including working capital and capitalexpenditures. We will not receive any of the proceeds from the saleof shares by the selling shareholders in this offering. See “Use ofProceeds.”
Risk factors Investing in our ordinary shares involves a high degree of risk. Youshould carefully read the information set forth under “Risk Factors”beginning on page 11 of this prospectus, together with all of theother information set forth or incorporated by reference in thisprospectus, before deciding to invest in our ordinary shares.
NASDAQ GlobalMarket Symbol
“MONT”
The number of ordinary shares that will be outstanding immediately after this offering:
• is based upon 26,498,043 ordinary shares outstanding as of December 31, 2013;
• excludes 3,786,726 ordinary shares issuable upon the exercise of options granted under our 2006 ShareIncentive Plan and 2013 Performance Incentive Plan outstanding as of December 31, 2013.
8

SUMMARY CONSOLIDATED FINANCIAL DATA
The following table sets forth our summary consolidated financial data for the periods and as of the datesindicated. Our summary consolidated financial data for each of the years ended December 31, 2010, 2011 and2012 have been derived from our audited consolidated financial statements, which are included elsewhere in thisprospectus. Our summary consolidated financial data for the nine months ended September 30, 2012 and 2013and summary consolidated balance sheet data as of September 30, 2013 have been derived from our unauditedconsolidated financial statements, which are included elsewhere in this prospectus. Our unaudited consolidatedfinancial statements have been prepared on the same basis as our audited consolidated financial statements and,in the opinion of management, reflect all adjustments, which consist only of normal recurring adjustments,necessary for the fair statement of those unaudited consolidated financial statements.
The historical results presented below are not necessarily indicative of the results to be expected for anyfuture period. The following summaries of our consolidated financial data for the periods presented should beread in conjunction with “Risk Factors,” “Capitalization,” “Management’s Discussion and Analysis of FinancialCondition and Results of Operations” and our consolidated financial statements and related notes, which areincluded elsewhere in this prospectus.
Year Ended December 31,Nine Months Ended
September 30,
2010 2011 2012 2012 2013
(data) (unaudited)
Summary Statement of Operations Data:Revenue . . . . . . . . . . . . . . . . . . . . . . . . . . . . . $ 29,078 $ 50,338 $ 78,245 $ 54,538 $ 75,448Cost of revenue(1) . . . . . . . . . . . . . . . . . . . . . . (21,248) (22,840) (31,736) (21,374) (27,496)
Gross profit . . . . . . . . . . . . . . . . . . . . . . . . . . 7,830 27,498 46,509 33,164 47,952
Operating expense:Research and development(1) . . . . . . . . . (11,078) (13,651) (17,568) (12,304) (19,096)Sales, general and administrative(1) . . . . (5,046) (5,895) (9,792) (5,614) (10,681)
Total operating expense . . . . . . . . . . . . . . . . (16,124) (19,546) (27,360) (17,918) (29,777)
Income (loss) from operations . . . . . . . . . . . (8,294) 7,952 19,149 15,246 18,175Interest income (expense), net . . . . . . . . . . . . (44) (36) 207 75 504Fair value change in warrant liability . . . . . . (37) — — — —Other income (expense), net . . . . . . . . . . . . . (114) (307) 153 253 (157)
Income (loss) before income taxes . . . . . . . . (8,489) 7,609 19,509 15,574 18,522Provision for income tax . . . . . . . . . . . . . . . . (54) (2,637) (1,228) (980) (1,709)
Net income (loss) . . . . . . . . . . . . . . . . . . . . . $ (8,543) $ 4,972 $ 18,281 $ 14,594 $ 16,813
Net income (loss) attributable to ordinaryshareholders—Basic . . . . . . . . . . . . . . . . . $ (11,056) $ 77 $ 3,114 $ 2,514 $ 3,139
Net income (loss) per share:Basic . . . . . . . . . . . . . . . . . . . . . . . . . . . $ (2.66) $ 0.02 $ 0.72 $ 0.58 $ 0.68
Diluted . . . . . . . . . . . . . . . . . . . . . . . . . . $ (2.66) $ 0.02 $ 0.66 $ 0.53 $ 0.62
Weighted-average shares used in computingnet income (loss) per share:
Basic . . . . . . . . . . . . . . . . . . . . . . . . . . . 4,157,498 4,260,192 4,319,243 4,303,135 4,618,302
Diluted . . . . . . . . . . . . . . . . . . . . . . . . . . 4,157,498 5,924,390 6,366,682 6,295,066 6,557,368
9

(1) Includes share-based compensation as follows:
Year Ended December 31,Nine Months Ended
September 30,
2010 2011 2012 2012 2013
(in thousands) (unaudited)
Cost of revenue . . . . . . . . . . . . . . . . . . . . . . $ 31 $ 13 $ 19 $ 15 $ 62Research and development . . . . . . . . . . . . . 358 356 497 347 1,124Sales, general and administrative . . . . . . . . 389 262 473 320 1,276
Total share-based compensation . . . . . $778 $631 $989 $682 $2,462
The following summary consolidated balance sheet data table shows a summary of our balance sheet data asof September 30, 2013:
• on an actual basis;
• on a pro forma basis, giving effect to the October 1, 2013 conversion of all outstanding convertiblepreferred shares into 16,163,598 ordinary shares, and the issuance and sale of 5,325,000 ordinaryshares and the receipt of net proceeds of $46.9 million in our initial public offering on October 1, 2013;and
• on a pro forma as adjusted basis to reflect, in addition, the sale by us of 1,000,000 ordinary shares inthe offering at the offering price of $21.00 per share, after deducting underwriting discounts andcommissions and estimated offering expenses payable by us (including expenses payable by us for theoffering and sale by the selling shareholders).
As of September 30, 2013
Actual Pro FormaPro Formaas Adjusted
(unaudited) (unaudited)(in thousands)
Summary Balance Sheet Data:Cash and cash equivalents . . . . . . . . . . . . . . . . . . . . . . . . $41,181 $ 88,115 $107,389Working capital . . . . . . . . . . . . . . . . . . . . . . . . . . . . . . . . 50,514 97,448 116,722Total assets . . . . . . . . . . . . . . . . . . . . . . . . . . . . . . . . . . . . 77,850 124,784 144,058Total liabilities . . . . . . . . . . . . . . . . . . . . . . . . . . . . . . . . . 24,575 24,575 24,575Convertible preferred shares . . . . . . . . . . . . . . . . . . . . . . . 54,400 — —Total shareholders’ equity(deficit) . . . . . . . . . . . . . . . . . . (1,125) 100,209 119,483
10

RISK FACTORS
An investment in our ordinary shares involves significant risks. You should carefully consider all of theinformation in this prospectus, including the risk factors described below, before making an investment in ourordinary shares. The following risk factors describe conditions, circumstances or uncertainties that create orenhance risks to our business, financial condition and results of operations or otherwise to the value of yourinvestment in our ordinary shares. Any of these risks could result in a decline in the market price of our ordinaryshares, in which case you could lose all or part of your investment.
Risk Factors Related to Our Business and Our Industry
We may be unable to sustain our recent revenue growth rates.
We experienced significant growth in revenue and profits in 2011 and 2012. Our revenue increased from$29.1 million in 2010 to $78.2 million in 2012, while our net income (loss) improved from a net loss of $8.5million in 2010 to net income of $5.0 million in 2011 and to $18.3 million in 2012. In the three and nine monthsended September 30, 2013, and year ended December 31, 2012, we recorded $30.1 million, $75.4 million, and$78.2 million in revenue, respectively, and $8.0 million, $16.8 million, and $18.3 million in net income,respectively, which increased from $54.5 million to $75.4 million in revenue and $14.6 million to $16.8 millionin net income in the nine months ended September 30, 2013 as compared to the same period in 2012. We maynot achieve similar rates of growth in future periods. You should not rely on our results of operations for anyprior quarterly or annual periods as an indication of our future performance. Our future revenue growth rate willdepend in particular on the success of our memory interface solutions. In the three and nine months endedSeptember 30, 2013 and year ended December 31, 2012, our memory interface solutions generated $2.8 million,$7.1 million and $4.6 million in revenue, respectively, and we may not be successful in growing our revenuefrom our memory interface solutions. If our revenue growth slows significantly or decreases, the market price ofour ordinary shares may decline.
We have a history of losses, have only recently become profitable and may not sustain or increase profitabilityin the future which may cause the market price of our ordinary shares to decline.
We first became profitable on an annual basis in 2011. We incurred significant net losses prior to that year.As of September 30, 2013, we had an accumulated deficit of $7.6 million. We currently expect to increase ourexpense levels to support our business growth. Therefore, to sustain or increase profitability, we will need togrow our revenue. If our expenditures do not result in increased revenue growth or there is a significant time lagbetween these expenses and our revenue growth, we may experience net losses in the future. Because many ofour expenses are fixed in the short term, or are incurred in advance of anticipated sales, we may not be able todecrease our expenses in a timely manner to offset any shortfall of revenue. Any incurrence of net losses in thefuture could cause the market price of our ordinary shares to decline.
We rely on our relationships with industry and technology leaders to enhance our solution offerings andmarket position, and our inability to continue to develop or maintain such relationships in the future wouldharm our ability to remain competitive.
We develop our semiconductor solutions for applications in systems that are driven by industry andtechnology leaders, in particular for our memory interface solutions. In the cloud computing market, CPUmanufacturers create technology platforms that memory module manufacturers and server OEMs use as the basisfor their products and solutions. A CPU manufacturer sets the specifications for many of the key components tobe used on each generation of its server platforms. In the case of our memory interface solutions, CPUmanufacturers impose strict guidelines and generally qualify only a few vendors to provide memory interfacesolutions for their server platforms. With each new server platform released by CPU manufacturers, providers ofmemory interface solutions must be validated for use on the new platform. In addition, we must work closely
11

with memory module manufacturers to ensure our memory interface solutions become qualified for use withtheir memory modules. As a result, maintaining close relationships with leading CPU manufacturers and memorymodule manufacturers is crucial to the long-term success of our memory interface solutions business. If ourrelationships with key industry participants were to deteriorate or if our solutions were not qualified by CPUmanufacturers, our market position and sales could be materially adversely affected.
Changes to industry standards and technical requirements relevant to our solutions and markets couldadversely affect our business, results of operations and prospects.
Our solutions comprise only a part of larger electronic systems. All solutions incorporated into thesesystems must comply with various industry standards and technical requirements created by regulatory bodies orindustry participants in order to operate efficiently together. Industry standards and technical requirements in ourmarkets are evolving and may change significantly over time. For our set-top box solutions, the industrystandards are typically set by government regulators and vary by country. Such standards can sometimes changeor additional standards may be added with limited advance notice. For memory interface solutions, the industrystandards are developed by JEDEC, an industry trade organization. In addition, large industry-leadingsemiconductor and electronics companies play a significant role in developing standards and technicalrequirements for the product ecosystems within which our memory interface solutions can be used. Our endcustomers also may design certain specifications and other technical requirements specific to their products andsolutions. These technical requirements may change as the end customer introduces new or enhanced productsand solutions.
Our ability to compete in the future will depend on our ability to identify and ensure compliance withevolving industry standards and technical requirements. The emergence of new industry standards and technicalrequirements could render our solutions incompatible with solutions developed by other suppliers or make itdifficult for our solutions to meet the requirements of certain of our end customers in both the homeentertainment and cloud computing markets. As a result, we could be required to invest significant time andeffort and to incur significant expense to redesign our solutions to ensure compliance with relevant standards andrequirements. If our solutions are not in compliance with prevailing industry standards and technicalrequirements for a significant period of time, we could miss opportunities to achieve crucial design wins, ourrevenue may decline and we may incur significant expenses to redesign our solutions to meet the relevantstandards, which could adversely affect our business, results of operations and prospects.
Our business would be adversely affected by the departure of existing members of our senior managementteam and other key personnel.
Our success depends, in large part, on the continued contributions of our senior management team, inparticular, the services of Dr. Howard C. Yang, our Chairman of the Board and Chief Executive Officer, andStephen Tai, our President and director, as well as other senior management. The loss of any member of oursenior management team or key personnel could harm our ability to implement our business strategy and respondto the rapidly changing market conditions in which we operate.
Our results of operations can fluctuate from period to period, which could cause our share price to fluctuate.
Our results of operations have fluctuated in the past and may fluctuate from period to period in the futuredue to a variety of factors, many of which are beyond our control. Factors relating to our business that maycontribute to these fluctuations include the following factors, as well as other factors described elsewhere in thisprospectus:
• the receipt, reduction, delay or cancellation of orders by customers;
• the gain or loss of significant customers;
12

• the timing and success of our launch of new solutions and launches of new solutions by ourcompetitors;
• market acceptance of our solutions and our customers’ products;
• the timing and extent of research and development costs, and in particular tape-out costs;
• fluctuations in sales by and inventory levels of module manufacturers who incorporate oursemiconductor solutions in their products, such as memory modules;
• cyclical and seasonal fluctuations in our markets;
• the timing of receiving government subsidies;
• fluctuations in our manufacturing yields;
• significant warranty claims, including those not covered by our contract manufacturer;
• changes in our revenue mix; and
• loss of key personnel or the inability to attract qualified engineers.
The semiconductor industry has been highly cyclical in the past and our markets may experience significantcyclical fluctuations in demand as a result of changing economic conditions, budgeting and buying patterns ofcustomers and others factors. As a result of the various potential factors affecting demand for our products andour results of operations in any given period, the results of any prior quarterly or annual periods should not berelied upon as indicative of our future revenue or operating performance. Fluctuations in our revenue andoperating results could cause our share price to decline.
The markets for our semiconductor solutions are evolving, and changing market conditions, such as theintroduction of new technologies or changes in customer preferences, may negatively affect demand for oursolutions. If we fail to properly anticipate or respond to changing market conditions, our business prospectsand results of operations will suffer.
Our solutions are used in the technologically advanced and rapidly evolving home entertainment and cloudcomputing markets. The technologies used in these markets are constantly being improved and new technologiesthat compete with existing technologies may be developed. Furthermore, the home entertainment market, and inparticular the market for our set-top box solutions, is highly fragmented and subject to changes in viewerpreferences, customer requirements and technical standards. In the cloud computing market, and in particular themarket for our memory interface solutions, technology advancements are continuously underway, such as theadvancements in memory technology from DDR2 to DDR3 and DDR4. Industry analysts have different opinionson how fast and how large these markets will grow. New technologies may be introduced that make the currenttechnologies that our solutions utilize less competitive or obsolete. Due to the evolving nature of our markets, ourfuture success depends on our ability to accurately anticipate and respond to changes in technologies, consumerpreferences and other market conditions. Any decrease in demand for our set-top box and memory interfacesolutions, or set-top box and memory interface solutions in general, due to the emergence of competingtechnologies, changes in customer preferences and requirements or other factors, could adversely affect ourbusiness, results of operations and prospects.
We must continuously develop new and enhanced solutions, and if we are unable to successfully market ournew and enhanced solutions that we have incurred significant expenses developing, our results of operationsand financial condition will be materially adversely affected.
In order to compete effectively in our markets, we must continually design, develop and introduce new andimproved solutions with improved features in a cost-effective manner in response to changing technologies andmarket demand. This requires us to devote substantial financial and other resources to research and development.
13

In the home entertainment market, in response to market trends, we have focused on providing more integratedand customized solutions and are enhancing our offerings of HDTV solutions. In the memory interface market,we are developing next-generation DDR4 memory interface solutions, which we expect to be one of the driversof our revenue growth in the future. However, we may not be successful developing and marketing these newand enhanced solutions. In particular in the memory interface market, we have generated limited revenue fromsales of our memory interface solutions through the nine months ended September 30, 2013. While we expectrevenue from our memory interface solutions to grow, we may not be able to increase our market share in thisglobally competitive market. Moreover, achieving and maintaining Intel validation for our advanced memorybuffers, in particular our LRDIMM memory buffer for DDR4, is extremely important to our future marketposition and the prospects of our memory interface solutions business as the server OEMs who adopt Intel’sserver platforms will only purchase components of their servers from Intel validated vendors. There is noassurance we will achieve or maintain such validations. If we are unable to successfully develop and market ournew and enhanced solutions that we have incurred significant expenses developing, our results of operations andfinancial condition will be materially and adversely affected.
Average selling prices of our solutions have historically decreased over time and will likely continue to do so,which could negatively affect our revenue and margins.
Historically, the semiconductor solutions that we sell have experienced declining average selling prices overtheir life cycle. The rate at which the average selling price declines may be affected by a number of factors,including relative supply and demand, the level of competition, production costs and technological changes. As aresult of the general trend of decreasing average selling prices of our semiconductor solutions following theirlaunch, our ability to grow or maintain our margins depends on our ability to introduce new or enhancedsolutions with higher average selling prices and to reduce our per-unit cost of sales and operating costs. However,our new or enhanced solutions may not be as successful or enjoy as high margins as we expect. If we are unableto offset any reductions in the average selling prices by introducing new solutions with higher average sellingprices or reducing our costs, our revenue and margins will be negatively affected and may decrease.
We face intense competition and expect competition to increase in the future. If we fail to compete effectively,our revenue growth and results of operations will be materially adversely affected.
The markets in which we operate are highly competitive. We compete with numerous domestic andinternational semiconductor companies, many of which have greater financial and other resources with which topursue technology development, product design, manufacturing, marketing and sales and distribution of theirproducts. Currently, our competitors range from large, international companies offering a wide range ofsemiconductor solutions to smaller companies specializing in set-top box or memory interface solutions. Ourprimary competitors in the set-top box market include semiconductor companies that sell to emerging marketssuch as HiSilicon Technologies Co., Ltd., ALi Corporation, RDA Microelectronics, Inc., Airoha TechnologyCorporation and STMicroelectronics NV, as well as smaller semiconductor design companies based in China.Our competitors in the memory interface market include Inphi Corporation, Integrated Device Technology, Inc.and Texas Instruments Inc. We expect that as the markets for our solutions grow, new entrants will enter thesemarkets and existing competitors may make significant investments to compete more effectively against us. Asthe emerging markets to which we sell our set-top box solutions become developed markets, leadingsemiconductor companies focusing on developed markets may increasingly enter our target markets.
Our ability to compete successfully depends on factors both within and outside of our control, including:
• the functionality and performance of our solutions and those of our competitors;
• our relationship with our end customers and other industry participants;
• prices of our solutions and prices of our competitors’ products;
• our reputation and ability to provide satisfactory customer support;
14

• our research and development capabilities to provide innovative solutions;
• our ability to retain high-level talent, including our management team and engineers; and
• the actions of our competitors, including merger and acquisition activity, launches of new products andother actions that could change the competitive landscape.
Intense competition could result in pricing pressure, reduced revenue and profitability and loss of marketshare, any of which could materially and adversely affect our business, results of operations and prospects. In theevent of a market downturn, competition in the markets in which we operate may intensify as our customersreduce their purchase orders. During market downturns, our competitors that are significantly larger and havegreater financial, technical, marketing, distribution, customer support and other resources or more establishedmarket recognition than us may be better positioned to accept lower prices and withstand adverse economic ormarket conditions.
We rely on third parties to manufacture, package, assemble and test the semiconductor products comprisingour solutions, which exposes us to a number of risks, including reduced control over manufacturing anddelivery timing and potential exposure to price fluctuations, which could result in a loss of revenue or reducedprofitability.
As a fabless semiconductor company, we outsource the manufacturing, packaging, assembly and certaintesting of our semiconductor solutions to third-party foundries and assembly and testing service providers. Wegenerally use a single foundry for the production of each semiconductor product comprising our set-top box andmemory interface solutions. In 2012 and the nine months ended September 30, 2013, we outsourced themanufacturing to three different foundries, Semiconductor Manufacturing International Corporation in China,Fujitsu Semiconductor Limited in Japan and United Microelectronics Corporation in Taiwan. Our assembly andtesting contractors in 2012 and the nine months ended September 30, 2013 were Siliconware Precision IndustriesCo., Ltd. in Taiwan and Suzhou, China and STATS ChipPAC Ltd. in Singapore and Korea.
Relying on third-party manufacturing, assembly and testing presents a number of risks, including but notlimited to:
• capacity shortages during periods of high demand;
• reduced control over delivery schedules, inventories and quality;
• the unavailability of, or potential delays in obtaining access to, key process technologies;
• the inability to achieve required production or test capacity and acceptable yields on a timely basis;
• misappropriation of our intellectual property;
• limited warranties on wafers or products supplied to us; and
• potential increases in prices.
We currently do not have long-term supply contracts with any of our third-party contract manufacturers, andwe typically negotiate pricing on a per-purchase order basis. Therefore, they are not obligated to perform servicesor supply product to us for any specific period, in any specific quantities, or at any specific price, except as maybe provided in a particular purchase order. During periods of high demand and tight inventories, our third-partyfoundries and assembly and testing contractors may allocate capacity to the production of other companies’products while reducing deliveries to us, or significantly raise their prices. In particular, they may allocatecapacity to other customers that are larger and better financed than us or that have long-term agreements,decreasing the capacity available to us. Shortages of capacity available to us may be caused by the actions oftheir other large customers that may be difficult to predict, such as major product launches. If we need anotherfoundry or assembly and test contractor because of increased demand, or if we are unable to obtain timely and
15

adequate deliveries from our providers, we might not be able to cost effectively and quickly retain other vendorsto satisfy our requirements. In the event that we need to shift the production of a solution to a different contractmanufacturer, it may take approximately nine to 12 months to allow a smooth transition from our current foundryor assembly services provider to the new provider. Such a transition might require a qualification process by ourend customers.
We purchase from our manufacturing contractors based on our estimates of end customers’ demand, and ifour estimates are incorrect our results of operations could be materially adversely impacted.
Our sales are made on the basis of purchase orders rather than long-term purchase contracts. We placeorders with our third party foundries and service providers for manufacturing, assembling and testing oursemiconductor products according to our estimates of customer demand several months prior to the anticipateddelivery date to our distributor or end customer. This process requires us to make multiple demand forecastassumptions with respect to our end customers’ demands in advance of actual purchase orders. We mightmisestimate demand due to unforeseen changes in market conditions, incomplete or inaccurate customer andmarket information or other factors within and outside of our control. If we overestimate customer demand, wemay purchase products from our third-party contractors that we may not be able to sell and may over-budgetcompany operations, which could result in decreases in our prices or write-downs of unsold inventory.
Conversely, if we underestimate customer demand or if sufficient manufacturing capacity were unavailable,we would lose out on sales opportunities and could lose market share or damage our customer relationships.
Our costs may increase substantially if our third-party manufacturing contractors do not achieve satisfactoryproduct yields or quality.
The wafer fabrication process is an extremely complicated process where small changes in design,specifications or materials can result in material decreases in product yields or even the suspension of production.From time to time, the third-party wafer foundries that we contract to manufacture the semiconductor productscomprising our solutions may experience manufacturing defects and reduced manufacturing yields related toerrors or problems in their manufacturing processes or the interrelationship of their processes with our designs. Insome cases, our third-party wafer foundries may not be able to detect these defects early in the fabricationprocess or determine the cause of such defects in a timely manner.
Generally, in pricing our solutions, we assume that manufacturing yields will continue to improve, even asthe complexity of our solutions increases. Once our solutions are initially qualified with our third-party waferfoundries, minimum acceptable yields are established. We are responsible for the costs of the wafers if the actualyield is above the minimum. If actual yields are below the minimum we are not required to purchase the wafers.Typically, minimum acceptable yields for our new solutions are generally lower at first and gradually improve aswe achieve full production. Unacceptably low product yields or other product manufacturing problems couldsubstantially increase the overall production time and costs and adversely impact our operating results on sales ofour solutions. Product yield losses will increase our costs and reduce our gross margin. In addition tosignificantly harming our operating results and cash flow, poor yields may delay shipment of our solutions andharm our relationships with existing and potential customers.
Our sales cycle can be lengthy, which could result in uncertainty and delays in generating revenue.
As we sell highly integrated solutions with customized software and support, our sales cycle for our set-topbox solutions from initial engagement to volume production may take a prolonged period of time, typicallyseveral months to one year. For our memory interface solutions, our sales cycle can include working with ourcustomers and other industry participants for up to two years or more on product development before we achievedesign wins. Any delays in these lengthy sales cycles increase the risk that a customer will decide to cancel,curtail, reduce or delay its product plans or adopt a competing design or solution from one of our competitors,
16

causing us to lose anticipated revenue. In addition, any delay or cancellation of an end customer’s plans couldmaterially and adversely affect our financial results, as we may have incurred significant expense withoutgenerating any revenue. Finally, our end customers’ failure to successfully market and sell their products couldreduce demand for our solutions and materially and adversely affect our business, results of operations andprospects. If we were unable to generate revenue after incurring substantial expenses during our sales efforts, ourresults of operations would suffer.
If we fail to achieve initial design wins for our solutions, we may lose the opportunity for sales to customersfor a significant period of time and be unable to recoup our investments in our solutions.
We expend considerable resources in order to achieve design wins for our solutions, especially our newsolutions and solution enhancements. Once a customer designs a semiconductor solution into its product, it islikely to continue to use the same semiconductor solution or enhanced versions of that solution from the samesupplier across a number of similar and successor products for a lengthy period of time due to the significantcosts associated with qualifying a new supplier and potentially redesigning the product to incorporate a differentsemiconductor solution. If we fail to achieve an initial design win in a customer’s qualification process, we maylose the opportunity for significant sales to that customer for a number of its products and for a lengthy period oftime. This may cause us to be unable to recoup our investments in our solutions, which would harm our business.
Our customers require our solutions and our third-party contractors to undergo a lengthy and expensivequalification process. If we are unsuccessful or delayed in qualifying any of our solutions with a customer,our business and operating results would suffer.
Prior to selecting and purchasing our solutions, our end customers typically require that our solutionsundergo extensive qualification processes, which involve testing of our solutions in the customers’ systems, aswell as testing for reliability. This qualification process may continue for several months for our set-top boxsolutions. Our memory interface solutions must obtain qualification with our memory module manufacturercustomers as well as CPU manufacturers. The qualification process for our memory interface solutions can takemultiple years. However, obtaining the requisite qualifications for a solution does not assure any sales of thesolution. Even after successful qualification and sales of a solution to an end customer, a subsequent revision inour third party contractors’ manufacturing process or our selection of a new contract manufacturer may require anew qualification process, which may result in delays and in our holding excess or obsolete inventory. After oursolutions are qualified and selected, it can take several months or more before the customer commences volumeproduction of systems that incorporate our solutions. Despite these uncertainties, we devote substantial resources,including design, engineering, sales, marketing and management efforts, to qualifying our solutions withcustomers in anticipation of sales. If we are unsuccessful or delayed in qualifying any of our solutions with acustomer, sales of those solutions to the customer may be precluded or delayed, which may impede our growthand cause our business to suffer.
We have generated a substantial majority of our revenue from sales through three independent distributors,which subjects us to a number of risks.
We have sold a substantial majority of our set-top box solutions to end customers through three independentdistributors, LQW Technology Company Limited, Qinuo International Co., Ltd. and China Electronic ApplianceShenzhen Co., Ltd. Sales through these three distributors accounted for 71%, 8% and 7%, respectively, of ourtotal revenue in the nine months ended September 30, 2013, and 50%, 18% and 9%, respectively, of our totalrevenue in the year ended December 31, 2012. As of September 30, 2013, we had $10.4 million of accountsreceivable, $8.2 million or 79% of which was due from LQW Technology Company Limited. We typicallycollect the accounts receivable from each distributor within one month following billing. We typically enter intodistribution agreements with our distributors, with each distributor covering a defined customer base and/orgeographic area. In addition, our distribution agreements are typically negotiated and entered into on an annualbasis and prohibit the distributor from selling products or solutions competing with ours. If any of our
17

distributors were to default on its obligations and fail to pay our invoices or ship our products in a timely fashion,we may be unable to collect our accounts receivable, recover our inventory, or complete sales to the customerswho had placed orders through that distributor, and we may find it difficult to replace that distributor. In addition,our operating results and financial condition could be significantly disrupted by the loss of one or more of thesedistributors, or various factors outside of our control such as order cancellations or delays in shipment by one ormore of these distributors or the failure of any of these distributors to successfully sell our solutions.
The complexity of our solutions could result in undetected defects and we may be subject to warranty andproduct liability claims, which could result in a decrease in customers and revenue, unexpected expenses andloss of market share.
Our solutions are incorporated into larger electronic equipment sold by our end customers. A solutionusually goes through an intense qualification and testing period performed by our customers before being used inproduction. We primarily outsource our solution testing to third parties and also perform some testing in ourlaboratories in Shanghai, Suzhou and Taiwan. We inspect and test parts, or have them inspected and tested inorder to screen out parts that may be weak or potentially suffer a defect incurred through the manufacturingprocess. From time to time, we are may be subject to warranty or product liability claims that may require us tomake significant expenditures to defend these claims or pay damage awards.
Generally, our agreements seek to limit our liability to the replacement of the part or to the revenue receivedfor the solution, but these limitations on liability may not be effective or sufficient in scope in all cases. Inaddition, we do not maintain any product liability insurance. If an end customer’s equipment fails in use, the endcustomer may incur significant monetary damages including an equipment recall or associated replacementexpenses, as well as lost revenue. The end customer may claim that a defect in our solution caused the equipmentfailure and assert a claim against us to recover monetary damages. The process of identifying a defective orpotentially defective solution in systems that have been widely distributed may be lengthy and require significantresources, and we may incur significant replacement costs and contract damage claims from our end customersas well as harm to our reputation. Defects in our solutions could harm our relationships with our customers anddamage our reputation. Customers may be reluctant to buy our solutions, which could harm our ability to retainexisting customers and attract new customers and our financial results. In addition, the cost of defending theseclaims and satisfying any arbitration award or judicial judgment with respect to these claims could harm ourbusiness prospects and financial condition.
We may not be able to adequately protect our intellectual property rights.
Our success depends in part upon our ability to protect our intellectual property. To accomplish this, we relyon a combination of intellectual property rights, including patents, copyrights, trademarks and trade secrets in theUnited States, China and other jurisdictions. Effective protection of our intellectual property rights may beunavailable, limited or not applied for in some countries. Some of our solutions and technologies are not coveredby any patent or patent application, as we do not believe patent protection of these solutions and technologies iscritical to our business strategy at this time. A failure to timely seek patent protection on solutions ortechnologies generally precludes us from seeking future patent protection on these solutions or technologies. Wecannot guarantee that:
• any of our present or future patents or patent claims will not lapse or be invalidated, circumvented,challenged or abandoned;
• our intellectual property rights will provide competitive advantages to us;
• our ability to assert our intellectual property rights against potential competitors or to settle current orfuture disputes will not be limited by our agreements with third parties;
• any of our pending or future patent applications will be issued or have the coverage originally sought;
18

• our intellectual property rights will be enforced in jurisdictions where competition may be intense orwhere legal protection may be weak;
• any of the trademarks, copyrights, trade secrets or other intellectual property rights that we presentlyemploy in our business will not lapse or be invalidated, circumvented, challenged or abandoned; or
• we will not lose the ability to assert our intellectual property rights against or to license our technologyto others and collect royalties or other payments.
In addition, our competitors or others may design around our protected patents or technologies. In additionto registered patents, we also rely on contractual protections with our customers, suppliers, distributors,employees and consultants, and we implement security measures designed to protect our trade secrets. However,we cannot assure you that these contractual protections and security measures will not be breached, that we willhave adequate remedies for any such breach or that our suppliers, employees or consultants will not assert rightsto intellectual property arising out of such contracts.
Monitoring unauthorized use of our intellectual property is difficult and costly. In addition, intellectualproperty rights and confidentiality protection in China is generally considered less effective than in the UnitedStates or other developed countries. Unauthorized use of our intellectual property may have occurred or may occurin the future. Although we have taken steps to minimize the risk of this occurring, any such failure to identifyunauthorized use and otherwise adequately protect our intellectual property would adversely affect our business.
Moreover, if we are required to commence litigation, whether as a plaintiff or defendant, not only would thisbe time-consuming, but we would also be forced to incur significant costs and divert our attention and efforts ofour employees, which could, in turn, result in lower revenue and higher expenses. If we pursue litigation to assertour intellectual property rights, an adverse decision in any of these legal actions could limit our ability to assertour intellectual property rights, limit the value of our technology or otherwise negatively impact our business,financial condition and results of operations.
We may face claims of intellectual property infringement, which could be time-consuming, costly to defend orsettle, result in the loss of significant rights, harm our relationships with our customers and distributors, orotherwise materially adversely affect our business, financial condition and results of operations.
The semiconductor industry is characterized by companies that hold patents and other intellectual propertyrights and that vigorously pursue, protect and enforce intellectual property rights. From time to time, third partiesmay assert against us and our customers and distributors patent and other intellectual property rights totechnologies that are important to our business.
Claims that our solutions, processes or technology infringe third-party intellectual property rights, regardlessof their merit or resolution, could be costly to defend or settle and could divert the efforts and attention of ourmanagement and technical personnel. Infringement claims also could harm our relationships with our customersor distributors and might deter future customers from doing business with us. If any pending or futureproceedings result in an adverse outcome, we could be required to:
• cease the manufacture, use or sale of the infringing solutions, processes or technology;
• pay substantial damages for infringement;
• expend significant resources to develop non-infringing solutions, processes or technology, which maynot be successful;
• license technology from the third-party claiming infringement, which license may not be available oncommercially reasonable terms, or at all;
• cross-license our technology to a competitor to resolve an infringement claim, which could weaken ourability to compete with that competitor; or
19
• pay substantial damages to our customers or end users to discontinue their use of or to replaceinfringing technology sold to them with non-infringing technology, if available.
Any of the foregoing results could have a material adverse effect on our business, financial condition andresults of operations.
If we are unable to attract, train and retain qualified design and technical personnel, we may not be able toexecute our business strategy effectively.
Our future success depends on our ability to attract and retain qualified design and technical personnel. As thesource of our technological and solution innovations, our design and technical personnel represent a significant asset.Historically, we have not encountered any difficulty in hiring qualified engineers. We do not know whether we will beable to retain all of these personnel as we continue to pursue our business strategy. The loss of the services of one ormore of our key employees, especially our key design and technical personnel, or our inability to attract and retainqualified design and technical personnel, could harm our business, financial condition and results of operations.
Competition for personnel in the semiconductor technology field is intense, and the availability of suitable andqualified candidates is limited. We compete to attract and retain qualified research and development personnel withother semiconductor companies, universities and research institutions. Competition for these individuals couldcause us to offer higher compensation and other benefits to attract and retain them, which could materially andadversely affect our financial condition and results of operations. We previously awarded share options andrestricted shares to our employees, some of which has not yet vested. Such retention awards may cease to beeffective to retain our current employees once the share options or restricted shares vest. We may need to increaseour total compensation costs to attract and retain experienced personnel required to achieve our business objectivesand failure to do so could severely disrupt our operations and growth. If we lose the services of any key seniormanagement member or employee, we may not be able to locate suitable or qualified replacements, and may incuradditional expenses to recruit and train new personnel, which could severely impact our business and prospects.
We may not be able to effectively manage our growth, and we may need to incur significant expenditures toaddress the additional operational and control requirements of our growth, either of which could harm ourbusiness and operating results.
As we continue to expand our business, we expect to grow our headcount and overall size of our operationssignificantly. To effectively manage our growth, we must continue to expand our operational, engineering andfinancial systems, procedures and controls and to improve our accounting and other internal managementsystems. This may require substantial managerial and financial resources, and our efforts in this regard may notbe successful. Our current systems, procedures and controls may not be adequate to support our futureoperations. If we fail to adequately manage our growth, or to improve our operational, financial and managementinformation systems, or fail to effectively motivate or manage our new and future employees, the quality of ourproducts and the management of our operations could suffer, which could adversely affect our operating results.In addition, we intend to implement a new enterprise resource planning system for many aspects of our business.This implementation is a technically intensive process, requiring testing, modifications and project coordination.We may experience disruptions in our business operations related to this implementation effort.
Potential future acquisitions could be difficult to integrate, divert attention of key personnel, disrupt ourbusiness, dilute shareholder value and impair our operating results.
We have completed and may continue to pursue acquisitions in the future that we believe may complementour business, semiconductor solutions or technologies. For example, we acquired a team of 29 engineers, certainintellectual property and equipment from Hengfa Electronics Co., Ltd. in August 2012. Any acquisition involvesa number of risks, many of which could harm our business, including:
• difficulties in integrating the operations, technologies, products, existing contracts, accounting andpersonnel of the target company;
20

• realizing the anticipated benefits of any acquisition;
• difficulties in transitioning and supporting customers, if any, of the target company;
• diversion of financial and management resources from existing operations;
• the price we pay or other resources that we devote may exceed the value we realize, or the value wecould have realized if we had allocated the purchase price or other resources to another opportunity;
• potential loss of key employees, customers and strategic alliances from either our current business orthe target company’s business;
• assumption of unanticipated problems or latent liabilities, such as problems with the quality of thetarget company’s products;
• inability to generate sufficient revenue to offset acquisition costs;
• dilutive effect on our shares as a result of any equity-based acquisitions;
• inability to successfully complete transactions with a suitable acquisition candidate; and
• in the event of international acquisitions, risks associated with accounting and business practices thatare different from applicable U.S. practices and requirements.
Acquisitions also frequently result in the recording of goodwill and other intangible assets that are subject topotential impairments, which could harm our financial results. As a result, if we fail to properly evaluateacquisitions or investments, we may not achieve the anticipated benefits of any such acquisitions, and we mayincur costs in excess of what we anticipate. The failure to successfully evaluate and execute acquisitions orinvestments or otherwise adequately address these risks could materially harm our business and financial results.
Our business, financial condition and results of operations could be adversely affected by political andeconomic conditions in the countries in which we conduct business and our solutions are sold.
Our business and operating results may be adversely impacted by political and economic conditions invarious countries and markets in which we operate or in which our solutions are sold. Uncertainty about currentglobal economic conditions may cause businesses to continue to postpone spending in response to tighter credit,unemployment or negative financial news. This in turn could have a material negative effect on the demand forour semiconductor solutions or the products into which our solutions are incorporated. The demand for our set-top box solutions is driven by consumer demand for television, which is often viewed as a discretionary item inthe emerging markets that we compete. A downturn in general economic conditions in the emerging markets thatwe target could result in a decline in demand for our set-top box solutions. In addition, our memory interfacesolutions are typically sold into data centers when these data centers are upgrading capital equipment such asservers. A downturn in general economic conditions can lead to delays in decisions to upgrade data centerequipment or a reduction in the scope of upgrades, which could reduce demand for our memory interfacesolutions.
Multiple factors relating to our international operations and to particular countries in which we operatecould negatively impact our business, financial condition and results of operations. These factors include:
• changes in political, regulatory, legal or economic conditions;
• restrictive governmental actions, such as restrictions on the transfer or repatriation of funds and foreigninvestments and trade protection measures, including export duties and quotas and customs duties andtariffs;
• disruptions of capital and trading markets;
• changes in import or export requirements;
21
• transportation delays;
• civil disturbances or political instability;
• geopolitical turmoil, including terrorism, war or political or military coups;
• public health emergencies;
• differing employment practices and labor standards;
• limitations on our ability under local laws to protect our intellectual property;
• local business and cultural factors that differ from our customary standards and practices;
• nationalization and expropriation;
• changes in tax laws;
• currency fluctuations relating to our international operating activities; and
• difficulty in obtaining distribution and support.
We conduct our operations primarily in China, our products are manufactured in Asia, and our solutions aresold primarily in Asia. Political and economic conditions in these markets may be less stable or predictable thanin the United States. Any conflict or uncertainty in Asia, and China in particular, including due to naturaldisasters, public health concerns, political unrest or safety concerns, could harm our business, financial conditionand results of operations.
The facilities of our third-party contractors and distributors are located in regions that are subject toearthquakes and other natural disasters.
The facilities of our third-party foundries and contract manufacturers are subject to risk of catastrophic lossdue to fire, flood or other natural or man-made disasters. A number of those foundries and service providers arelocated in areas with above average seismic activity and also subject to typhoons and other Pacific storms.Several foundries that manufacture our wafers are located in Taiwan and Japan, and all of the third-party serviceproviders who assemble and test our solutions are located in Asia. The risk of an earthquake in the Pacific Rimregion is significant due to the proximity of major earthquake fault lines. Both Japan and Taiwan have had majorearthquakes within the last 15 years that significantly disrupted their economies. Any catastrophic loss to any ofthese facilities would likely disrupt our operations, delay production, shipments and revenue and result insignificant expenses to repair or replace the facility.
Our sales in the set-top box market experience seasonality, which is likely to cause our revenue to fluctuate.
Revenue for our set-top box solutions experiences seasonality. We typically realize a large portion of oursales of set-top-box solutions during the fourth quarter prior to the Lunar New Year holiday. We typicallyexperience our slowest quarter in the first quarter of each year. Accordingly, our results of operations may varysignificantly from quarter to quarter and our yearly results of operations may be disproportionately affected byour results during the fourth quarter.
We are subject to risks related to exchange rate fluctuations.
Our revenue is primarily denominated in U.S. dollars, while a significant portion of our assets and expensesare denominated in Renminbi. As a result, our results of operations and financial condition are subject to risksassociated with exchange rate fluctuations, in particular in relation to the exchange rates between the Renminbiand the U.S. dollar. Moreover, appreciation or depreciation in the value of the Renminbi, the functional currencyfor our operating subsidiaries in China, relative to the U.S. dollar would affect our financial results as reported inU.S. dollars without giving effect to any underlying change in our business or results of operations. Depreciation
22
of the Renminbi against the U.S. dollar would have a negative effect on the U.S. dollar amount available to us ifwe decide to convert our Renminbi into U.S. dollars for the purpose of making payments for dividends on ourordinary shares or for other business purposes.
The value of the Renminbi against the U.S. dollar is affected by, among other things, changes in China’spolitical and economic conditions and China’s foreign exchange policies. The People’s Bank of China regularlyintervenes in the foreign exchange market to limit fluctuations in Renminbi exchange rates and achieve policygoals. For example, from mid-2008 to mid-2010 the Renminbi traded within a narrow range against the U.S.dollar at approximately RMB6.83 per U.S. dollar. In June 2010, the People’s Bank of China announced theremoval of the de facto peg. Following this announcement, the Renminbi has appreciated modestly. It is difficultto predict when and how Renminbi-U.S. dollar exchange rate may change going forward.
Risk Factors Related to Regulations Applicable to Us
Our business has benefited from certain preferential tax treatment and government subsidies. Discontinuationor revocation of the preferential tax treatment and government subsidies available to us could decrease ournet income and materially and adversely affect our financial condition and results of operations.
Under the PRC Enterprise Income Tax Law, or the PRC EIT Law, and its implementation rules, botheffective on January 1, 2008, the PRC has a uniform enterprise income tax rate of 25% for all enterprisesincorporated in China. The PRC EIT Law and its implementation rules also permit qualified high and newtechnology enterprises, or HNTEs, to enjoy a reduced 15% enterprise income tax rate. Our principal operatingsubsidiary in China, Montage Technology (Shanghai) Co., Ltd., or Montage Shanghai, had obtained thequalification certificate of HNTE status in October 2011 with a valid period of three years. Therefore it is eligibleto enjoy a preferential tax rate of 15% as long as it maintains its qualification as an HNTE. Separately, pursuantto the Notice on Several Preferential Enterprise Income Tax Policies jointly issued by the Ministry of Finance, orthe MOF, and the State Administration of Taxation, or the SAT, on February 22, 2008, and the Notice onEnterprise Income Tax Policies to Further Stimulate the Development of Software and Integrate CircuitIndustries jointly issued by the MOF and the SAT on April 20, 2012, qualified integrated circuit designenterprises are entitled to a two-year income tax exemption followed by a three-year 50% enterprise income taxrate reduction commencing from the first profit-making year. Montage Shanghai was recognized as an integratedcircuit design enterprise in January 2007 and has passed the annual inspections from 2007 through 2012.Therefore Montage Shanghai is eligible to enjoy the tax holiday from its first profit-making year as well.However, since this tax holiday for qualified integrated circuit design enterprises and the reduced 15% enterpriseincome tax rate for HNTEs are mutually exclusive, Montage Shanghai elected to enjoy the tax holiday from itsfirst profit-making year, which was 2010. Accordingly, it is exempted from enterprise income tax for 2010 and2011 and subject to enterprise income tax at a rate of 12.5% for 2012, 2013 and 2014 as long as it maintains itsqualification as a qualified integrated circuit design enterprise. Similarly, Suzhou Montage MicroelectronicTechnology Co., Ltd. was recognized as an integrated circuit design enterprise in December 2012 and will enjoythis tax holiday when it starts to make profit after certain procedures are completed in competent tax authorities.Furthermore, according to various tax notices regarding replacing business tax with value-added tax intransportation and some modern service sectors jointly issued by the MOF and the SAT from November 2011 toDecember 2013, Montage Shanghai and Suzhou Montage Microelectronic Technology Co., Ltd. are currentlyexempted from value-added tax for their income generated from technical development.
In addition, Montage Shanghai has received subsidies from PRC local government authorities. Theaggregate amounts of the subsidies we received were $1.1 million, $0.5 million and $0.8 million in 2010, 2011,and 2012, and $0.3 million, and $0, in the three months ended September 30, 2013 and 2012, respectively and$1.2 million and $0.1 million in the nine months ended September 30, 2013 and 2012.
Preferential tax treatments and government subsidies are subject to review and may be adjusted or revokedat any time in the future. For example, on December 3, 2013 the MOF, SAT, the Ministry of Industry andInformation Technology and the National Development and Reform Commission jointly promulgated the
23
Administrative Measures on Recognition of Integrated Circuit Design Enterprises, effective from January 1,2014, which provides that, upon expiry of preferential tax treatment period, integrated circuit design enterpriserecognized before January 1, 2011, like Montage Shanghai, shall re-apply for such recognition in accordancewith the aforesaid measures and the newly recognized integrated circuit design enterprise may not enjoypreferential tax treatment of two-year income tax exemption followed by a three-year 50% enterprise income taxrate reduction again. The discontinuation of any preferential tax treatments or government subsidies available tous will cause our effective tax rate to increase, which will decrease our net income and materially and adverselyaffect our financial condition and results of operations. In addition, the timing of receiving government subsidiescan be difficult to predict and may be subject to change, which could lead to unexpected fluctuations in ourresults of operations.
We may be classified as a “resident enterprise” for PRC enterprise income tax purposes under the PRC EITLaw. Such classification could result in unfavorable tax consequences to us and our non-PRC shareholders.
Under the PRC EIT Law, an enterprise established outside the PRC with “de facto management bodies”within the PRC should be considered a PRC “resident enterprise” and is generally subject to a uniform 25%enterprise income tax rate on its worldwide income. Under the implementing rules to the PRC EIT Law, a “defacto management body” is defined as a body that has material and overall management and control over themanufacturing and business operations, personnel and human resources, finances and properties of an enterprise.In addition, a circular issued by the SAT on April 22, 2009, or Circular 82 sets out the standards and proceduresfor recognizing the location of the “de facto management bodies” of an enterprise registered outside of the PRCand controlled by any PRC enterprise or enterprise group. Circular 82 specifies that certain PRC-controlledoffshore enterprises will be classified as PRC resident enterprises if the following are located or resident in thePRC: senior management personnel and departments that are responsible for daily production, operation andmanagement; financial and personnel decision making bodies; key properties, accounting books, the companyseal, and minutes of board meetings and shareholders’ meetings; and half or more of the senior management ordirectors having voting rights. On July 27, 2011, the SAT issued Administrative Measures of Enterprise IncomeTax of Chinese-controlled Offshore Incorporated Resident Enterprises (Trial), or Bulletin 45, which becameeffective on September 1, 2011, to provide further guidance on the implementation of Circular 82. Bulletin 45clarifies certain issues related to determining PRC resident enterprise status of PRC controlled enterprises, post-determination administration and which competent tax authorities are responsible for determining offshoreincorporated PRC resident enterprise status. Bulletin 45 specifies that when provided with a copy of a Chinesetax resident determination certificate issued by the competent tax authorities from an offshore incorporated PRCresident enterprise, the payer should not withhold 10% income tax when paying Chinese-sourced dividends,interest and royalties to the offshore incorporated PRC resident enterprise.
Currently, a substantial majority of the members of our management team are located in China. However,Circular 82 applies only to offshore enterprises controlled by PRC enterprises or PRC corporate groups, not thosecontrolled by PRC or foreign individuals or foreign enterprises like us. In the absence of detailed implementingregulations or other guidance determining that offshore companies controlled by PRC or foreign individuals orforeign enterprises like us are PRC resident enterprises, we do not currently consider our company or any of ouroverseas subsidiaries to be a PRC resident enterprise.
However, the SAT may take the view that the determining criteria set forth in Circular 82 reflects a generalposition on how the “de facto management body” test should be applied in determining the tax resident status ofall offshore enterprises. Additional implementing regulations or guidance may also be issued determining thatour Cayman Islands holding company or other non-PRC entity is a “resident enterprise” for PRC enterpriseincome tax purposes. If the PRC tax authorities determine that our company or any of our non-PRC subsidiariesis a PRC resident enterprise for PRC enterprise income tax purposes, a number of unfavorable PRC taxconsequences could follow. First, our company or our subsidiaries outside of China will be subject to the uniformenterprise income tax rate of 25% as to our global income as well as tax reporting obligations. Second, althoughdividends paid by one PRC tax resident to another PRC tax resident should qualify as “tax-exempt income”
24

under the PRC EIT Law, there is no assurance that we would enjoy such tax exempt treatment on dividends paidto us from Montage Shanghai. As a result, such dividend may continue to be subject to a 10% withholding tax.Finally, a 10% withholding tax will be imposed on dividends we pay to our non-PRC enterprise shareholders andgains derived by our non-PRC shareholders from transferring our ordinary shares. Similar results would follow ifMontage Technology Holdings Company Limited or Montage Technology Hong Kong Limited is considered aPRC “resident enterprise.” In addition to the uncertainty in how the new “resident enterprise” classification couldapply, it is also possible that the rules may change in the future, possibly with retroactive effect.
We may not be able to obtain certain treaty benefits on dividends paid by our PRC subsidiary, MontageShanghai, to us through our Hong Kong Subsidiary.
Under the PRC EIT Law, dividends generated from retained earnings after January 1, 2008 from a PRCcompany to a foreign parent company are subject to a withholding tax rate of 10% unless the foreign parent’sjurisdiction of incorporation has a tax treaty with China that provides for a preferential withholding arrangement.Pursuant to the Arrangement between Mainland China and the Hong Kong Special Administrative Region for theAvoidance of Double Taxation and Prevention of Fiscal Evasion with respect to Taxes on Income, or the HongKong Tax Treaty, which became effective on December 8, 2006, as amended, a company incorporated in HongKong, such as Montage Technology Hong Kong Limited, will be subject to withholding income tax at a rate of5% on dividends it receives from its PRC subsidiary if it holds a 25% or more interest in that particular PRCsubsidiary, or 10% if it holds less than a 25% interest in that subsidiary. On October 27, 2009, the SATpromulgated a tax notice or Circular 601, which provides that tax treaty benefits will be denied to “conduit” orshell companies without business substance, and a beneficial ownership analysis will be used based on a“substance-over-the-form” principle to determine whether or not to grant tax treaty benefits. On June 29, 2012,the SAT further issued the Announcement of the State Administration of Taxation regarding Recognition of“Beneficial Owner” under Tax Treaties, or Announcement 30, which provides that a comprehensive analysisshould be made when determining the beneficial owner status based on various factors that are supported byvarious types of documents including the articles of association, financial statements, records of cashmovements, board meeting minutes, board resolutions, staffing and materials, relevant expenditures, functionsand risk assumption as well as relevant contracts, patent and copyright certificates and other information. As aresult, although one of our PRC subsidiaries, Montage Shanghai, is currently wholly owned by our Hong Kongsubsidiary Montage Technology Hong Kong Limited, we cannot assure you that we would be entitled to the taxtreaty benefits and enjoy the favorable 5% rate applicable under the Hong Kong Tax Treaty on dividends payableby Montage Shanghai. If Montage Technology Hong Kong Limited cannot be recognized as the beneficial ownerunder the Hong Kong Tax Treaty of the dividends to be paid by our PRC subsidiaries to us, such dividends willbe subject to a normal withholding tax of 10% as provided by the PRC EIT Law.
We may be required by the PRC tax authorities to pay withholding tax on capital gains arising out of ourrestructuring in November 2010 and to pay fines or penalties for the failure to pay such withholding tax.
The Notice on Various Issues Concerning Enterprise Income Tax Treatment of Enterprise RestructuringTransactions, or Circular 59, which was jointly issued by the MOF and the SAT on April 30, 2009 and becameeffective retroactively on January 1, 2008, as well as subsequent rules issued by the SAT, provide for scrutiny byPRC tax authorities over the transfer of equity interests in a PRC resident enterprise by a non-resident enterprise.In November 2010, Montage Technology Group Limited transferred its 100% equity interest in MontageShanghai to Montage Technology Hong Kong Limited at a price equal to the registered capital of MontageShanghai without recognizing any gains. As a result of the par value consideration paid in this transaction, thePRC tax authorities may adjust the purchase price for PRC tax purposes, leading to a recognition of capital gainsby Montage Technology Group Limited, unless the restructuring can be certified by the PRC tax authorities as atax-free reorganization under Circular 59. We submitted the agreement relating to the November 2010transaction to the PRC tax authorities as part of the process to register the shareholding change with the PRC taxauthorities. Such registration was completed in 2010 and we have not received any further inquiry from the PRCtax authorities regarding the transaction. However, we have not sought, and do not plan to seek, certification of
25

the transaction as a tax-free reorganization under Circular 59. As a result, there remains the possibility the PRCtax authorities will challenge the purchase price and subject the transaction to a pricing adjustment. The PRC taxauthorities have dedicated teams that review tax filings to identify avoidance of tax liabilities. These reviews donot necessarily take place according to a regular schedule and may happen at any time. During the course of thereviews of our filings PRC tax authorities can and may raise questions regarding the November 2010 transaction,in which case we may be subject to further tax investigation and a special tax adjustment if they conclude that theprice of the transaction was not determined based on arm’s-length principles. In such case, we may be required topay PRC withholding tax on the capital gains at a tax rate of 10% and fines or penalties for the failure to pay suchwithholding tax.
Restrictions on currency exchange and cross-border capital flows into and outside of China may limit ourability to receive and use our revenue and the proceeds from this offering effectively.
Because a significant portion of our assets are held in China in Renminbi, any restrictions on currencyexchange may limit our ability to convert our revenue generated in foreign currency into Renminbi to fund anybusiness activities we may have in China or to make dividend payments in U.S. dollars. Renminbi is generallyconvertible for “current account transactions,” which include among other things dividend payments andpayments for the import of goods and services. Although the Renminbi has been generally convertible for currentaccount transactions since 1996, we cannot assure you that the relevant PRC government authorities will notlimit or eliminate our ability to purchase and retain foreign currencies for current account transactions in thefuture. Conversion of Renminbi into foreign currency, and of foreign currencies into Renminbi, for paymentsrelating to “capital account transactions,” which principally include capital injection and loans, remain subject tosignificant foreign exchange controls and restrictions. As a result, we may be unable to utilize our Renminbiassets for making any investments or other capital account transactions outside of China.
Current PRC regulations permit our subsidiaries in China to pay dividends only out of their accumulatedprofits, if any, determined in accordance with PRC accounting standards and regulations. In addition, oursubsidiaries in China are required to set aside at least 10% of their respective accumulated profits each year, ifany, to fund certain reserve funds until such reserves have reached at least 50% of their respective registeredcapital. These reserves are not distributable as cash dividends. Further, if our subsidiaries in China incur debt ontheir own behalf in the future, the instruments governing the debt may restrict their ability to pay dividends ormake other payments to us.
Any capital contributions or loans that our non-PRC subsidiaries make to our PRC subsidiaries, includingfrom the proceeds of this offering, are subject to PRC regulations and approval requirements. Capitalcontributions and loans to our PRC subsidiaries must be approved by or registered with relevant PRC regulatorybodies. Although we currently do not intend to use any of the proceeds from this offering to fund our operationsor capital expenditures in China or otherwise transfer our proceeds from this offering into China, we cannotassure you that we will be able to complete the necessary registration or obtain the necessary approval on atimely basis, if at all, if we make capital contributions or loans to our PRC subsidiaries in the future. If we fail tocomplete the necessary registration or obtain the necessary approval, our ability to make loans or capitalcontributions to our PRC subsidiaries may be negatively affected, which could adversely affect our PRCsubsidiaries’ liquidity and their ability to fund their working capital and expansion projects and meet theirobligations and commitments.
Furthermore, under the Circular on the Relevant Operating Issues Concerning the Improvement of theAdministration of the Payment and Settlement of Foreign Currency Capital of Foreign-invested Enterprises, orCircular 142, promulgated by the PRC State Administration of Foreign Exchange, or SAFE, in August 2008,Renminbi converted from foreign exchange capital contributions can only be used for activities within theapproved business scope of such foreign-invested enterprise and cannot be used for domestic equity investmentunless otherwise approved by SAFE or its local branch. As a result, our PRC subsidiary, Montage Shanghai,(which is a foreign-invested enterprise) may not be able to use the proceeds of this offering or other capital
26

contributed by us for equity investment including the proceeds from our initial public offering or acquisitions inChina or for other purposes outside of its approved scope of business, which may adversely affect our ability toexpand our business in China. Violations of Circular 142 or related regulations could result in severe penalties,such as heavy fines.
The approval of the China Securities Regulatory Commission, or the CSRC, may be required in connection withthis offering; any requirement to obtain prior CSRC approval could delay this offering and failure to obtain thisapproval, if required, could have a material adverse effect on our business, operating results and reputation aswell as the trading price of our ordinary shares, and could also create uncertainties for this offering.
On August 8, 2006, six PRC regulatory agencies, namely the PRC Ministry of Commerce, the State AssetsSupervision and Administration Commission, or SASAC, the State Administration for Taxation, the StateAdministration for Industry and Commerce, the CSRC, and SAFE, jointly adopted the Regulations on Mergersand Acquisitions of Domestic Enterprises by Foreign Investors, or the M&A Rule, which became effective onSeptember 8, 2006 and was amended on June 22, 2009. This M&A Rule purports, among other things, to requireoffshore special purpose vehicles, or SPVs, formed for overseas listing purposes through acquisitions of PRCdomestic companies and directly or indirectly controlled by PRC companies or individuals, to obtain theapproval of the CSRC prior to publicly listing their securities on an overseas stock exchange. On September 21,2006, the CSRC published a notice on its official website specifying documents and materials required to besubmitted to it by SPVs seeking CSRC approval of their overseas listings. While the implementation of the M&ARule remains unclear, we believe, based on the advice of our PRC counsel, Commerce & Finance Law Offices,that CSRC approval will not be applicable to us in the context of this offering because we established our PRCsubsidiaries by means of direct investment to newly established entities rather than by merger or acquisition ofPRC domestic companies or assets. However, as it is uncertain how the M&A Rule will be interpreted orimplemented, we cannot assure you that the relevant PRC government agency, including the CSRC, or PRCcourts would reach the same conclusion as our PRC counsel. If the CSRC or other PRC regulatory agenciessubsequently determine that we need to obtain the CSRC’s approval for this offering, we may face sanctions bythe CSRC or other PRC regulatory agencies. In such event, these regulatory agencies may impose fines andpenalties on our operations in the PRC, limit our operating privileges in the PRC, delay or restrict the repatriationof the proceeds from this offering into the PRC, or take other actions that could have a material adverse effect onour business, financial condition, results of operations, reputation and prospects, as well as the trading price ofour ordinary shares. The CSRC or other PRC regulatory agencies may also take actions requiring us, or making itadvisable for us, to halt this offering before settlement and delivery of the ordinary shares offered by thisprospectus.
The M&A Rules establish complex procedures for some acquisitions of Chinese companies by foreigninvestors, which could make it more difficult for us to pursue growth through acquisitions in China.
The M&A Rules establish procedures and requirements that could make some acquisitions of Chinesecompanies by foreign investors more time-consuming and complex, including requirements in some instancesthat the MOFCOM be notified in advance of any change-of-control transaction in which a foreign investor takescontrol of a Chinese domestic enterprise. We may expand our business in part by acquiring complementarybusinesses. Complying with the requirements of the M&A Rules to complete such transactions could be time-consuming, and any required approval processes, including obtaining approval from the MOFCOM, may delayor inhibit our ability to complete such transactions, which could affect our ability to expand our business ormaintain our market share.
We could be subject to penalties under PRC law if our PRC shareholders do not comply with PRC regulationsrelating to offshore investment activities by PRC residents.
SAFE promulgated in October 2005 the Notice on Issues Relating to the Administration of ForeignExchange in Fund-raising and Round-trip Investment Activities of Domestic Residents Conducted via OffshoreSpecial Purpose Companies, or Circular 75, which requires PRC residents to register with local branches of
27

SAFE if they use assets or equity interests in PRC entities as capital contributions to establish offshorecompanies, or if they inject assets or equity interests of their PRC entities into offshore companies to raise capitaloverseas (defined in Circular 75 as “round trip investment”). In addition, any PRC resident who makes, or haspreviously made, direct or indirect investments in such an offshore company (defined in Circular 75 as an“offshore special purpose company”) is required to further update that registration for such things as increases ordecreases in the offshore special purpose company’s share capital, transfers or swaps of its shares, mergers, long-term equity or debt investments, and the creation of any security interest. Moreover, the PRC subsidiaries of thatoffshore special purpose company are required to coordinate and supervise the filing of SAFE registrations bythe offshore special purpose company’s shareholders who are PRC residents, and do so in a timely manner.However, pursuant to the Operating Rules for Foreign Exchange Issues with Regard to Direct Investment underCapital Account, or the Operating Rules, an appendix to the Notice on Further Improving and Adjusting ForeignExchange Administration Policies on Direct Investment promulgated by SAFE on November 19, 2012, if a PRCresident individual makes direct investments into China through an overseas enterprise that is not an offshorespecial purpose company as defined in Circular 75, the PRC resident is not required to carry out registrationprocedures for offshore special purpose companies.
Although we believe the registration for offshore special purpose companies under Circular 75 does notapply to our beneficial owners who are PRC resident individuals because it was a direct investment into Chinathrough an overseas enterprise that is not an offshore special purpose company as defined in Circular 75, theseindividuals are generally required under the general PRC foreign exchange regulations, such as AdministrativeMeasures for Personal Foreign Exchange and its Implementing Rules promulgated by SAFE in 2006 and 2007respectively, to conduct registration with the competent SAFE authority for any offshore direct investmentincluding by subscribing for shares in our offshore holding companies. Due to a lack of detailed implementationrules of such registration requirements and uncertainty in implementation and interpretation of the above generalSAFE regulations, our beneficial owners who are PRC resident individuals have not yet conducted foreignexchange registration for offshore direct investment. In addition, the Operating Rules require that, in the case ofdirect investment into China through an overseas enterprise that is not an offshore special purpose company asdefined in Circular 75, the PRC foreign-invested subsidiaries of such overseas enterprise should completeprocedures with SAFE or its local branch to be marked as non-round trip investment by individuals. Due to thelack of detailed implementation rules with respect to such procedures, we have not submitted such request to thelocal SAFE authority yet. If SAFE takes a view that our beneficial owners who are PRC residents or our PRCsubsidiaries have not complied with SAFE rules, we could be subject to legal sanctions, such as being prohibitedfrom making distributions of profits or proceeds from any reduction in capital, share transfer or liquidation to ouroffshore entities or injecting additional capital into our PRC subsidiaries.
All employee participants in our option plan who are PRC citizens may be required to register with SAFE. Wemay also face regulatory uncertainties that could restrict our ability to adopt additional option plans for ourdirectors and employees under PRC law.
PRC regulations require that individuals in China (including PRC citizens and foreign individuals who havelived in China over one year) who intend to participate in the share incentive plan of an overseas listed companyshall appoint a qualified PRC domestic agent or a PRC subsidiary of such overseas listed company (defined as a“PRC agency”) to conduct foreign exchange registration, opening of accounts and transfer and exchange offunds, and an overseas agency shall be appointed to conduct any exercise of options, buying and selling ofrelevant shares or equities and transfer of relevant funds. After such individuals’ foreign exchange incomereceived from participation in the share incentive plan is remitted to PRC, relevant banks shall distribute theabove funds from the account opened and managed by the PRC agency to such individuals’ foreign exchangeaccounts. We and our PRC employees who have been granted share options or restricted shares are subject tothese regulations. Our 2006 Share Incentive Plan has been registered with Shanghai branch of SAFE.
Failure to comply with such registration requirements may subject us and the participants of share incentiveplan who are in the PRC to fines and legal sanctions, prevent us from further granting or exercising of options byour employees in China, or limit our ability to contribute additional capital into our PRC subsidiaries, limiting
28

our PRC subsidiaries’ ability to distribute dividends to us, which could adversely affect our business operations.In addition, several of our employees in China have exercised their share options or received restricted sharesunder our 2006 Share Incentive Plan prior to our becoming a publicly listed company. Since there is not yet aclear regulation on how and whether individuals in China can exercise their share options or hold restrictedshares granted by overseas private companies, although we obtained SAFE registration for the 2006 ShareIncentive Plan on December 3, 2013, we cannot assure you that our other share incentive plans will be approvedby SAFE.
The enforcement of the PRC Labor Contract Law and other labor-related regulations in the PRC mayadversely affect our business and our results of operations.
The PRC Labor Contract Law, which became effective on January 1, 2008, and its implementing rulesimpose requirements concerning contracts entered into between a PRC employer and its employees and establishtime limits for probationary periods and for how long an employee can be placed in a fixed-term labor contract.Because the Labor Contract Law and its implementing rules have not been in effect very long and because thereis lack of clarity with respect to their implementation and potential penalties and fines, there may be a risk thatcertain of our employment policies and practices could be determined by relevant PRC authorities as being inviolation the Labor Contract Law or its implementing rules, which could result in penalties, fines or othersanctions. If we are subject to large penalties or fees related to the Labor Contract Law or its implementing rules,our business, financial condition and results of operations may be materially and adversely affected.Furthermore, the PRC Labor Contract Law and subsequently passed rules and regulations have tended to providegreater rights to employees and impose more onerous requirements on employers in China. As a result ofregulations designed to enhance labor protection, our labor costs in China may increase in the future.
We are subject to additional regulatory compliance requirements, including Section 404 of the Sarbanes-Oxley Act of 2002, as a result of becoming a public company.
We will incur significant legal, accounting and financial compliances costs and other expenses that we didnot incur as a private company. As a public company, we are required to prepare and distribute periodic andcurrent reports, and comply with federal securities law requirements, SEC rules and regulations, including theDodd-Frank Wall Street Reform and Consumer Protection Act of 2010, or the Dodd-Frank Act, and the SarbanesOxley Act of 2002, or the Sarbanes Oxley Act. The individuals who constitute our management team havelimited experience managing a publicly traded company, and limited experience complying with the increasinglycomplex and changing laws pertaining to public companies. Our management team and other personnel will needto devote a substantial amount of time to new compliance initiatives and we may not successfully or efficientlymanage our transition into a public company. We expect rules and regulations such as the Sarbanes-Oxley Act, toincrease our legal and finance compliance costs and to make some activities more time-consuming and costly.We will need to hire a number of additional employees with public accounting and disclosure experience in orderto meet our ongoing obligations as a public company. For example, Section 404 of the Sarbanes-Oxley Actrequires that our management report on the effectiveness of our internal control over financial reporting in ourAnnual Report on Form 10-K for the fiscal year ending December 31, 2014. Moreover, when we are no longer anemerging growth company under the federal securities laws, our independent registered public accounting firmwill be required to issue an attestation report on the effectiveness of our internal control over financial reporting.Section 404 compliance may divert internal resources and will take a significant amount of time and effort tocomplete. We may not be able to successfully complete the procedures and certification and attestationrequirements of Section 404 by the time we will be required to do so. If we fail to do so, or if in the future ourChief Executive Officer, Chief Financial Officer or independent registered public accounting firm determinesthat our internal control over financial reporting is not effective as defined under Section 404, this could result inmaterial misstatements of our financial statements and we could be subject to sanctions or investigations by theNASDAQ Global Market, the Securities and Exchange Commission, or the SEC, or other regulatory authorities.Furthermore, investor perceptions of our company may suffer, and this could cause a decline in the market priceof our shares. Irrespective of compliance with Section 404, any failure of our internal controls could have a
29

material adverse effect on our stated results of operations and harm our reputation. If we are unable to implementthese changes effectively or efficiently, it could harm our operations, financial reporting or financial results andcould result in an adverse opinion on internal controls from our independent auditors.
New regulations related to “conflict minerals” may force us to incur additional expenses, may make oursupply chain more complex and may result in damage to our reputation with customers.
Pursuant to the Dodd-Frank Act, the SEC has adopted new requirements for companies that use certainminerals and metals, known as conflict minerals, in their products, whether or not these products aremanufactured by third parties. These requirements will require companies to diligence, disclose and reportwhether or not such minerals originate from the Democratic Republic of Congo and adjoining countries. Theimplementation of these new requirements could adversely affect the sourcing, availability and pricing ofminerals used in the manufacture of our products, and affect our costs and relationships with customers andsuppliers as we must obtain additional information from them to ensure our compliance with the disclosurerequirement. In addition, we will incur additional costs to comply with the disclosure requirements, includingcosts related to determining the source of any of the relevant minerals and metals used in our products. Since oursupply chain is complex, we may not be able to sufficiently verify the origins for these minerals and metals usedin our products through the due diligence procedures that we implement, which may harm our reputation. In suchevent, we may also face difficulties in satisfying customers who require that all of the components of ourproducts are certified as conflict mineral free.
We are an “emerging growth company” and may elect to comply with reduced public company reportingrequirements applicable to emerging growth companies, which could make our ordinary shares less attractiveto investors.
We are an “emerging growth company” as defined in the Jumpstart Our Business Startups Act enacted inApril 2012, and, for as long as we continue to be an “emerging growth company” we may choose to takeadvantage of exemptions from various reporting requirements applicable to other public companies but not to“emerging growth companies” including, but not limited to, not being required to comply with the auditorattestation requirements of Section 404 of the Sarbanes-Oxley Act, reduced disclosure obligations regardingexecutive compensation in our periodic reports and proxy statements, and exemptions from the requirements ofholding a nonbinding advisory vote on executive compensation and shareholder approval of any goldenparachute payments not previously approved. We could be an “emerging growth company” for up to five years,although, if the market value of our ordinary shares that is held by non-affiliates exceeds $700 million as of thelast business day of the second quarter of any fiscal year during that five-year period, we would cease to be an“emerging growth company” as of the following December 31. We cannot predict if investors will find ourordinary shares less attractive if we choose to rely on these exemptions. If some investors find our ordinaryshares less attractive as a result of any choices to reduce future disclosure, there may be a less active tradingmarket for our ordinary shares and our share price may be more volatile.
Under the Jumpstart Our Business Startups Act, “emerging growth companies” can delay adopting new orrevised accounting standards until such time as those standards apply to private companies. However, we haveirrevocably elected not to avail ourselves of this exemption from new or revised accounting standards and,therefore, we will be subject to the same new or revised accounting standards as other public companies that arenot “emerging growth companies.”
Our auditor, like other independent registered public accounting firms operating in China, is not permitted tobe subject to inspection by Public Company Accounting Oversight Board, and as such, investors may bedeprived of the benefits of such inspection.
Our independent registered public accounting firm that issues the audit reports included in this prospectusfiled with the SEC, as an auditor of companies that are traded publicly in the United States and a firm registered
30
with the Public Company Accounting Oversight Board (United States), or the PCAOB, is required by the laws ofthe United States to undergo regular inspections by the PCAOB to assess its compliance with the laws of theUnited States and professional standards. Because our auditor is located in China, a jurisdiction where thePCAOB is currently unable to conduct inspections without the approval of the PRC authorities, our auditor, likeother independent registered public accounting firms operating in China, is currently not inspected by thePCAOB. On May 24, 2013, the PCAOB announced that it had entered into a memorandum of understanding onenforcement cooperation with the CSRC, and the MOF that establishes a cooperative framework between theparties for the production and exchange of audit documents relevant to investigations in the United States andChina. However, direct PCAOB inspections of independent registered accounting firms in China are still notpermitted by Chinese authorities.
Inspections of other firms that the PCAOB has conducted outside of China have identified deficiencies inthose firms’ audit procedures and quality control procedures, which may be addressed as part of the inspectionprocess to improve future audit quality. The inability of the PCAOB to conduct inspections of independentregistered public accounting firms operating in China makes it more difficult to evaluate the effectiveness of ourauditor’s audit procedures or quality control procedures. As a result, investors may be deprived of the benefits ofPCAOB inspections.
An initial decision in proceedings instituted by the SEC against five PRC-based accounting firms, includingour independent registered public accounting firm, could result in our financial statements being determinedto not be in compliance with the requirements of the Securities Exchange Act of 1934.
In December 2012, the SEC instituted administrative proceedings against five PRC-based accounting firms,including our independent registered public accounting firm, alleging that these firms had violated U.S. securitieslaws and the SEC’s rules and regulations thereunder by failing to provide to the SEC the firms’ work papersrelated to their audits of certain PRC-based companies that are publicly traded in the United States and are thesubject of certain ongoing SEC investigations. We were not and are not the subject of any of the SECinvestigations nor are we involved in the proceedings brought by the SEC against the accounting firms. OnJanuary 22, 2014, the Administrative Law Judge (the “ALJ”) presiding over the matter reached an initialdecision. The ALJ concluded that each of the accounting firms, including our independent registered accountingfirm, violated the SEC’s rules of practice by failing to produce audit work papers directly to the SEC. It furtherdetermined that each of the firms should be censured and barred from practicing before the SEC for a period ofsix months. This initial decision, however, has no binding legal effect until it is reviewed and endorsed by the fullSEC, although that endorsement could then be subject to appeal by the accounting firms. While we cannotpredict the outcome of the SEC’s review or that of any subsequent appeal process, if the initial decision wasupheld, the accounting firms, including our independent registered public accounting firm, would be temporarilydenied the ability to practice before the SEC. If during this temporary period, there was a need for ourindependent registered public accounting firm to issue or reissue an audit report on our financial statements underthe Securities Act of 1933, as amended or the Securities Exchange Act of 1934, as amended and we are unable totimely find another registered public accounting firm which can audit and issue a report on our financialstatements, our financial statements likely would be determined to not be in compliance with the auditrequirements for financial statements of public companies with reporting obligations under the Securities Act orthe Exchange Act. Such a determination could ultimately lead to the delisting of our ordinary shares from theNASDAQ Global Market or deregistration from the SEC, or both, which would substantially reduce oreffectively terminate the trading of our ordinary shares in the United States, which could adversely affect theliquidity and value of our ordinary shares.
Risk Factors Related to This Offering and Ownership of Our Ordinary Shares
If securities or industry analysts do not publish research or reports about our business, or if they change theirrecommendations regarding our shares adversely, our share price and trading volume could decline.
The trading market for our ordinary shares is influenced by the research and reports that industry orsecurities analysts publish about us or our business. If one or more of the analysts who cover us downgrade our
31

shares, our share price would likely decline. If one or more of these analysts cease coverage of our company orfail to regularly publish reports on us, we could lose visibility in the financial markets, which in turn could causeour share price or trading volume to decline.
Substantial future sales of our ordinary shares in the public market could cause our share price to fall.
Additional sales of our ordinary shares in the public market after this offering, or the perception that thesesales could occur, could cause the market price of our ordinary shares to decline. Upon the completion of thisoffering, we will have approximately 27,498,043 ordinary shares outstanding. All shares sold in our initial publicoffering are and all shares sold in this offering will be freely transferable without restriction or additionalregistration under the Securities Act of 1933, or the Securities Act, except for any shares held by our affiliates asdefined in Rule 144 under the Securities Act. The remaining shares outstanding after this offering will be eligiblefor sale at various times beginning upon the expiration of lock-up agreements for our initial public offering asdescribed below.
Our directors, executive officers and substantially all of our shareholders prior to our initial public offeringhave agreed with limited exceptions that they will not sell any of our shares owned by them without the priorwritten consent of Deutsche Bank Securities Inc. and Barclays Capital Inc., on behalf of the underwriters, for aperiod of 180 days from September 25, 2013, which is the date of the prospectus for our initial public offering.At any time and without public notice, Deutsche Bank Securities Inc. and Barclays Capital Inc. may in their solediscretion release some or all of the securities from these lock-up agreements prior to the expiration of the lock-up period. For example, the underwriters waived application of the lock-up agreement for all of the shares beingsold in this offering by the selling shareholders. As resale restrictions end, the market price of our ordinary sharescould decline if the holders of those shares sell them or are perceived by the market as intending to sell them. Inaddition, after this offering and assuming no exercise of the underwriters’ option to purchase additional shares,the holders of approximately 13,124,272 of our ordinary shares will continue to be entitled to contractual rightsto cause us to register the sale of those shares under the Securities Act. All of these shares are subject to the lock-up period from our initial public offering, which expires March 24, 2014. Registration of these shares under theSecurities Act would result in these shares becoming freely tradable without restriction under the Securities Actimmediately upon the effectiveness of the registration statement. Substantial sales following exercise ofoutstanding or future share options or the vesting of restricted share awards following vesting could alsoadversely affect the market price of our shares.
You may face difficulties in protecting your interests as a shareholder, as Cayman Islands law providessubstantially less protection when compared to the laws of the United States.
Our corporate affairs are governed by our amended and restated memorandum and articles of associationand by the Companies Law (Revised) and common law of the Cayman Islands. The rights of shareholders to takelegal action against our directors and us, actions by minority shareholders and the fiduciary responsibilities of ourdirectors to us under Cayman Islands law are to a large extent governed by the common law of the CaymanIslands. The common law of the Cayman Islands is derived in part from comparatively limited judicial precedentin the Cayman Islands as well as from English common law, which has persuasive, but not binding, authority ona court in the Cayman Islands. The rights of our shareholders and the fiduciary responsibilities of our directorsunder Cayman Islands law are not as clearly established as they would be under statutes or judicial precedents inthe United States. In particular, the Cayman Islands have a less developed body of securities laws as compared tothe United States, and provide significantly less protection to investors. In addition, Cayman Islands companiesmay not have standing to initiate a shareholder derivative action before the United States federal courts.
As a result of all of the above, our shareholders may have more difficulty in protecting their intereststhrough actions against us or our officers, directors or major shareholders than would shareholders of acorporation incorporated in a jurisdiction in the United States.
32

Certain judgments obtained against us by our shareholders may not be enforceable.
We are a Cayman Islands company and substantially all of our assets are located outside of the UnitedStates. A significant portion of our assets and operations are conducted in the China and substantially all of ourrevenue has been generated outside the United States, particularly through sales in Hong Kong. In addition, someof our current directors and officers are nationals and residents of countries other than the United States and mayhave a substantial portion or all of their assets outside of the United States. Substantially all of the assets of thesepersons are located outside the United States. As a result, it may be difficult or impossible for you to bring anaction against us or against these individuals in the United States in the event that you believe that your rightshave been infringed under the United States federal securities laws or otherwise. Even if you are successful inbringing an action of this kind, the laws of the Cayman Islands and of China may render you unable to enforce ajudgment against our assets or the assets of our directors and officers. There is no statutory recognition in theCayman Islands of judgments obtained in the United States, although the courts of the Cayman Islands willgenerally recognize and enforce a non-penal judgment of a foreign court of competent jurisdiction without retrialon the merits. Moreover, the PRC does not have treaties with the United States or many other countries providingfor the reciprocal recognition and enforcement of judgment of courts. For more information regarding therelevant laws of the Cayman Islands and China, see “Enforceability of Civil Liabilities” section in thisprospectus.
We have no specific business plan for the net proceeds from this offering. Our management will thereforehave significant flexibility in using the net proceeds of this offering, and you will not have the opportunity, aspart of your investment decision, to assess whether the proceeds are being used appropriately.
We intend to use the net proceeds from this offering for general corporate purposes, including workingcapital for our operating subsidiaries outside China, as well as funding our research and development activitiesand making payments to our suppliers overseas. We may also use a portion of the net proceeds to acquire orinvest in businesses, products and technologies that we believe will complement our business. However,depending on future developments and circumstances, we may use some of the proceeds for other purposes. Wedo not have more specific plans for the net proceeds from this offering. Therefore, our management will havesignificant flexibility in applying the net proceeds we receive from this offering. The net proceeds could beapplied in ways that do not improve our operating results. The actual amounts and timing of these expenditureswill vary significantly depending on a number of factors, including the amount of cash used in or generated byour operations and the market response to the introduction of any new product offerings.
Our articles of association contain anti-takeover provisions that could adversely affect the rights of ourshareholders.
Our amended and restated articles of association contain provisions to limit the ability of others to acquirecontrol of our company or cause us to engage in change-of-control transactions, including, among other things:
• provisions that authorize our board of directors, without action by our shareholders, to issue additionalordinary shares and preferred shares with preferential rights determined by the board;
• provisions that permit only a majority of our board or the chairman of the board to call shareholdermeetings and therefore do not permit shareholders to call shareholder meetings;
• provisions that impose advance notice requirements, minimum shareholding periods and ownershipthresholds, and other requirements and limitations on the ability of shareholders to propose matters forconsideration at shareholder meetings; and
• a staggered board whereby our directors are divided into three classes, with each class subject toretirement and re-election once every three years on a rotating basis, while any director thatsimultaneously serves as our chief executive officer is not subject to retirement or re-election.
33

These provisions could have the effect of depriving our shareholders of an opportunity to sell their shares ata premium over prevailing market prices by discouraging third parties from seeking to obtain control of ourcompany in a tender offer or similar transaction. With our staggered board, at least two annual shareholdermeetings are generally required in order to effect a change in a majority of our directors. Our staggered board candiscourage proxy contests for the election of our directors and purchases of substantial blocks of our shares bymaking it more difficult for a potential acquirer to gain control of our board in a relatively short period of time.
We are a foreign private issuer within the meaning of the rules under the Securities Exchange Act of 1934, asamended, and as such we are exempt from certain provisions applicable to United States domestic publiccompanies.
We are a foreign private issuer within the meaning of the rules under the Securities Exchange Act of 1934,as amended, or the Exchange Act. As such, we are exempt from certain provisions applicable to United Statesdomestic public companies. For example:
• we are not required to provide as many Exchange Act reports, or as frequently, as a domestic publiccompany;
• we are not required to provide the same level of disclosure on certain issues, such as executivecompensation and selected quarterly results of operations;
• for interim reporting, we are permitted to comply solely with our home country requirements, whichare less rigorous than the rules that apply to domestic public companies;
• we are not required to comply with the sections of the Exchange Act regulating the solicitation ofproxies, consents or authorizations in respect of a security registered under the Exchange Act; and
• we are not required to comply with Section 16 of the Exchange Act requiring insiders to file publicreports of their share ownership and trading activities and establishing insider liability for profitsrealized from any “short-swing” trading transaction.
We currently intend to file annual reports on Form 10-K, quarterly reports on Form 10-Q and current reportson Form 8-K similar to U.S. domestic reporting companies and disclose the information required to be disclosedin those reports. However, we may elect in the future to file annual reports on Form 20-F and reports onForm 6-K as a foreign private issuer. If we elected to file reports as a foreign private issuer, our shareholders maynot have access to certain information they may deem important.
We do not currently intend to pay dividends on our ordinary shares and, consequently, your ability to achievea return on your investment will depend on appreciation in the price of our ordinary shares.
We have never declared or paid any cash dividends on our ordinary shares and do not currently intend to doso for the foreseeable future. We currently intend to invest our future earnings, if any, to fund our growth.Therefore, you are not likely to receive any dividends on your ordinary shares for the foreseeable future and thesuccess of an investment in our ordinary shares will depend upon any future appreciation in their value. There isno guarantee that our ordinary shares will appreciate in value or even maintain the price at which ourshareholders have purchased their shares.
We may be classified as a passive foreign investment company, or PFIC, which could result in adverse UnitedStates federal income tax consequence to U.S. holders of ordinary shares.
Depending upon the value of our ordinary shares and the nature and composition of our income and assetsover time, we could be classified as a passive foreign investment company, or PFIC, for U.S. federal income taxpurposes for any taxable year. Based on assumptions as to our projections of the value of our outstandingordinary shares and our expected use of the proceeds from our initial public offering and this offering and of the
34

other cash that we will hold and generate in the ordinary course of our business, we do not expect to be a PFICfor the taxable year 2013, 2014 or in the foreseeable future. However, there can be no assurance that we will notbe a PFIC for the taxable year 2013, 2014 or any future taxable year as PFIC status is tested each taxable yearand depends on the composition of our income and the value of our assets in such taxable year. Our PFIC statusfor the taxable year 2013 or 2014 will not be determinable until our financial statements for the applicabletaxable year have been finalized.
We will be classified as a PFIC for any taxable year if either (i) at least 75% of our gross income for thetaxable year is passive income or (ii) at least 50% of the value of our assets (based on a quarterly value of theassets during the taxable year) is attributable to assets that produce or are held for the production of passiveincome. In determining the average percentage value of our gross assets, the aggregate value of our assets willgenerally be deemed to be equal to our market capitalization (determined by the sum of the aggregate value ofour outstanding equity) plus our liabilities. Therefore, a drop in the market price of our ordinary shares wouldcause a reduction in the value of our non-passive assets for purposes of the asset test. Accordingly, we wouldlikely become a PFIC if our market capitalization were to decrease significantly while we hold substantial cash.As we have not designated specific uses for all of the net proceeds we received from our initial public offeringand will receive from this offering, we may retain a significant portion of those net proceeds in the form of short-term investments or bank deposits for a prolonged period, which could affect our PFIC status in future years. Forfurther details on our intended use of the net proceeds we receive from this offering, see “Use of Proceeds.”
If we are classified as a PFIC in any taxable year in which you hold our ordinary shares, and you are a U.S.taxpayer, you would generally be subject to additional taxes and interest charges on certain “excess” distributionswe make and on any gain recognized on the disposition or deemed disposition of your ordinary shares in a lateryear, even if we are not a PFIC in the year of disposition or distribution. Moreover, if we are classified as a PFICin any taxable year in which you hold our ordinary shares, certain non-corporate U.S. shareholders would not beable to benefit from any preferential tax rate with respect to any dividend distribution received from us in thatyear or in the following year. Finally, you would also be subject to special U.S. tax reporting requirements. Formore information on the U.S. tax consequences to you that would result from our classification as a PFIC, see“Taxation—United States Federal Income Taxation—Passive Foreign Investment Company.”
35

SPECIAL NOTE REGARDING FORWARD-LOOKING STATEMENTS
This prospectus contains forward-looking statements. The statements are found, among other places, in thesections entitled “Prospectus Summary,” “Risk Factors,” “Use of Proceeds,” “Management’s Discussion andAnalysis of Financial Condition and Results of Operations,” “Industry,” “Business,” “Regulation” and“Management.” In some cases, these forward-looking statements can be identified by words and phrases such as“may,” “should,” “intend,” “predict,” “potential,” “continue,” “will,” “expect,” “anticipate,” “estimate,” “plan,”“believe,” “is/are likely to” or the negative form of these words and phrases or other comparable expressions. Theforward-looking statements included in this prospectus relate to, among other things:
• our goals and strategies;
• our expected results of operations for the fourth quarter of 2013;
• our future business development;
• the expected growth of, and trends in, our business and the markets in which we operate;
• our expectations regarding competition as more semiconductor companies enter our markets and asexisting competitors improve or expand their product offerings;
• our plans for future products and solutions, such as DDR4 memory interface solutions, andenhancements of existing products;
• future trends and challenges and our expectations regarding our results of operations and financialcondition;
• our expectations regarding our expenses and revenue, including our expectations that our research anddevelopment, sales and marketing and general and administrative expenses may increase in absolutedollars; and
• relevant government policies and regulations relating to our industry and business.
These forward-looking statements are based on our current expectations, assumptions, estimates andprojections about us and our industry and involve various risks and uncertainties. Although we believe that ourexpectations expressed in these forward-looking statements are reasonable, we cannot assure you that ourexpectations will turn out to be correct. Our actual results could be materially different from our expectations.Important risks and factors that could cause our actual results to be materially different from our expectations aregenerally set forth in the “Risk Factors,” “Management’s Discussion and Analysis of Financial Condition andResults of Operations,” “Business” and elsewhere in this prospectus.
This prospectus also contains third-party data relating to the markets in which we operate that includesprojections based on a number of assumptions. We have not independently verified such data. Our markets maynot grow at the rates projected by market data, or at all. The failure of our markets to grow at the projected ratesmay have a material adverse effect on our business and the market price of our ordinary shares. Furthermore, ifany one or more of the assumptions underlying the market data turns out to be incorrect, actual results may differfrom the projections based on these assumptions. You should not place undue reliance on these forward-lookingstatements. In addition, the relatively new and rapidly changing nature of these markets subjects any projectionsor estimates relating to the growth prospects or future condition of these markets to significant uncertainties.
The forward-looking statements made in this prospectus relate only to events or information as of the dateon which the statements are made in this prospectus. We undertake no obligation to update or revise any forward-looking statements, whether as a result of new information, future events or otherwise, after the date of thisprospectus.
36

MARKET AND INDUSTRY DATA
This prospectus contains information and industry data from China Digital STB Market Forecast and DetailAnalysis of Chipset Market Share, an industry report commissioned by us and prepared by iSuppli Corporation, athird-party market research firm, in March 2013. All references to data from iSuppli in this prospectus are to dataderived from these commissioned reports. In addition, this prospectus contains information and industry datafrom LR-DIMM: Market Forecast, an industry report commissioned by us and prepared by Jon Peddie Research,a third-party market research firm, in July 2013. This prospectus also contains statistical data and estimates,including those relating to market size, future performance and growth rates of the markets in which weparticipate, that we obtained from industry publications and reports generated by Cisco Systems, Inc., Gartner,Inc. and International Data Corporation. Although we have assessed the third-party information and found it tobe reasonable and believe the publications are reliable, we have not independently verified their data.
All references to data from Gartner in this prospectus are to data derived from “Forecast: ElectronicEquipment Production and Semiconductor Consumption by Application, Worldwide, 2010-2016, 4Q12 Update”,or the Gartner Report, published by Gartner on December 21, 2012. The Gartner Report represents data, researchopinion or viewpoints published, as part of a syndicated subscription service, by Gartner, and are notrepresentations of fact. The Gartner Report speaks as of its original publication date and not as of the date of thisprospectus, and the opinions expressed in the Gartner Report are subject to change without notice.
37

USE OF PROCEEDS
We estimate that we will receive net proceeds from this offering of approximately $19.3 million, afterdeducting underwriting discounts and commissions and estimated offering expenses payable by us (includingexpenses payable by us for the offering and sale by the selling shareholders). We will not receive any proceedsfrom the sale of ordinary shares by the selling shareholders, although we will bear the costs, other than theunderwriting discounts and commissions, associated with the sale of these shares.
The primary purposes of this offering are to obtain additional equity capital and provide additional liquidityto existing shareholders with registration rights. We expect to use the net proceeds from this offering, togetherwith available funds, for general corporate purposes, including working capital for our operating subsidiariesoutside China and making payments to our suppliers overseas, capital expenditures relating to the expansion ofour operations, and funding possible future acquisitions. We have not determined any particular capitalexpenditures for which we will use the net proceeds, and the timing and size of our particular capital expenditureneeds may change rapidly in response to perceived market opportunities, technological changes and actions byour competitors. We do not currently have any agreements or understandings for material acquisitions for whichwe intend to allocate a portion of the net proceeds. Therefore, our management is currently unable to allocate anyspecific portions of the net proceeds for particular uses. We currently do not intend to use any proceeds from theoffering to fund our operations or capital expenditures in China or otherwise transfer the proceeds into China.
Pending our use of the net proceeds we receive from this offering, we intend to invest our net proceeds inshort-term investment grade debt securities or to deposit the proceeds into interest-bearing bank accounts.
In utilizing the proceeds of this offering, we, as an offshore holding company, are permitted under PRC lawsand regulations to provide funding to our PRC subsidiaries only through loans or capital contributions and to ourconsolidated affiliated entities only through loans, in each case subject to satisfaction of applicable governmentregistration and approval requirements. We cannot assure you that we will be able to obtain these governmentregistrations or approvals on a timely basis, if at all. Currently, the working capital requirements of our PRCsubsidiaries are primarily funded by their operating income generated from providing services to our non-PRCoperating entities, including research and development and marketing services. We expect our PRC operatingsubsidiaries to continue to fund their working capital requirements in this manner for the foreseeable future.
Our plans for the proceeds of this offering are subject to change due to unforeseen events and opportunities,and the amounts and timing of our actual expenditures depend on several factors, including our expansion plansand the amount of cash generated or used by our operations. Other than as described above, we cannot specifywith certainty the particular uses for the net proceeds to be received upon the completion of this offering.Accordingly, our management will have broad discretion in the application of the net proceeds we receive fromour public offering, and investors will be relying on the judgment of our management regarding the applicationof the net proceeds.
38

DIVIDEND POLICY
We have never declared or paid any dividends in the past and we do not have any plan to declare or pay anydividends in the near future. We currently intend to retain most, if not all, of our available funds and any futureearnings to operate and expand our business.
39

MARKET PRICE OF ORDINARY SHARES
Our ordinary shares commenced trading on the NASDAQ Global Market under the symbol “MONT” onSeptember 26, 2013. The following table sets forth, for the periods indicated, the high and low reported salesprices of our ordinary shares as reported on the NASDAQ Global Market:
High Low
2013Third quarter (from September 26, 2013) . . . . . . . . . . . . . . . . . . . . . . . . . . . . . . . . . $16.40 $10.00Fourth quarter . . . . . . . . . . . . . . . . . . . . . . . . . . . . . . . . . . . . . . . . . . . . . . . . . . . . . . $19.69 $12.802014
First quarter (through January 30, 2014) . . . . . . . . . . . . . . . . . . . . . . . . . . . . . . . . . . $26.70 $16.51
As of January 24, 2014, there were approximately 460 holders of record of our ordinary shares. The actualnumber of shareholders is greater than this number of record holders and includes shareholders who arebeneficial owners but whose shares are held in street name by brokers and other nominees. This number ofholders of record also does not include shareholders whose shares may be held in trust by other entities. The lastreported sale price of our ordinary shares on the NASDAQ Global Market on January 30, 2014 was $21.70 pershare.
40

CAPITALIZATION
The following table describes our capitalization as of September 30, 2013:
• on an actual basis;
• on a pro forma basis, giving effect to the October 1, 2013 conversion of all outstanding convertiblepreferred shares into 16,163,598 ordinary shares issuance and the sale by us of 5,325,000 ordinaryshares in our initial public offering with net proceeds of $46.9 million on October 1, 2013; and
• on a pro forma as adjusted basis to reflect, in addition, the issuance and sale by us of 1,000,000ordinary shares in this offering at an offering price of $21.00 per share, after deducting underwritingdiscounts and commissions and estimated offering expenses payable by us (including expenses payableby us for the offering and sale by the selling shareholders).
The information below is illustrative only and our cash, cash equivalents and capitalization following theclosing of this offering will be adjusted based on the actual public offering price and other terms of this offeringdetermined at pricing. You should read the following table together with our consolidated financial statementsand the related notes appearing elsewhere in this prospectus and the sections of this prospectus titled“Management’s Discussion and Analysis of Financial Condition and Results of Operations” and “SelectedConsolidated Financial and Operating Data.”
As of September 30, 2013
Actual Pro FormaPro Forma as
Adjusted
(unaudited) (unaudited)(in thousands, except per share data)
Convertible preferred shares, par value $0.0125 per share: 17,604,639 sharesauthorized, 15,944,528 shares issued and outstanding, actual; no shares authorized,issued and outstanding, pro forma (unaudited) and pro forma as adjusted(unaudited) . . . . . . . . . . . . . . . . . . . . . . . . . . . . . . . . . . . . . . . . . . . . . . . . . . . . . . . . . $54,400 $ — $ —
Shareholders’ equity:Ordinary shares, par value $0.0125 per share: 26,804,639 shares authorized,
4,660,025 shares issued and outstanding, actual; 44,409,278 sharesauthorized, 26,148,623 shares issued and outstanding, pro forma (unaudited);27,148,623 shares issued and outstanding pro forma as adjusted(unaudited) . . . . . . . . . . . . . . . . . . . . . . . . . . . . . . . . . . . . . . . . . . . . . . . . . . . . . 58 327 340
Additional paid-in capital . . . . . . . . . . . . . . . . . . . . . . . . . . . . . . . . . . . . . . . . . . . . 3,515 104,580 124,395Accumulated comprehensive income . . . . . . . . . . . . . . . . . . . . . . . . . . . . . . . . . . . 2,148 2,148 2,148Statutory reserve . . . . . . . . . . . . . . . . . . . . . . . . . . . . . . . . . . . . . . . . . . . . . . . . . . . 740 740 740Accumulated deficit . . . . . . . . . . . . . . . . . . . . . . . . . . . . . . . . . . . . . . . . . . . . . . . . (7,586) (7,586) (8,140)
Total shareholders’ equity (deficit) . . . . . . . . . . . . . . . . . . . . . . . . . . . . . . . . (1,125) 100,209 119,483
Total capitalization . . . . . . . . . . . . . . . . . . . . . . . . . . . . . . . . . . . . . . . . . $53,275 $100,209 $119,483
41

SELECTED CONSOLIDATED FINANCIAL DATA
The following table sets forth our selected consolidated financial data for the periods and as of the datesindicated. Our selected consolidated financial data for each of the years ended December 31, 2010, 2011 and2012 and selected consolidated balance sheet data as of December 31, 2011 and 2012 have been derived from ouraudited consolidated financial statements, which are included elsewhere in this prospectus. Our selectedconsolidated financial data for the nine months ended September 30, 2012 and 2013 and selected consolidatedbalance sheet data as of September 30, 2013 have been derived from our unaudited consolidated financialstatements, which are included elsewhere in this prospectus. Our unaudited consolidated financial statementshave been prepared on the same basis as our audited consolidated financial statements and, in the opinion ofmanagement, reflect all adjustments, which consist only of normal recurring adjustments, necessary for the fairstatement of those unaudited consolidated financial statements.
The historical results presented below are not necessarily indicative of the results to be expected for anyfuture period. The following summaries of our consolidated financial data for the periods presented should beread in conjunction with “Risk Factors,” “Selected Consolidated Financial and Operating Data,” “Capitalization,”“Management’s Discussion and Analysis of Financial Condition and Results of Operations” and our consolidatedfinancial statements and the related notes, which are included elsewhere in this prospectus.
Year Ended December 31,Nine Months Ended
September 30,
2010 2011 2012 2012 2013
(in thousands, except share and per share data) (unaudited)
Selected Statement of Operations Data:Revenue . . . . . . . . . . . . . . . . . . . . . . . . . . . . . . $ 29,078 $ 50,338 $ 78,245 $ 54,538 $ 75,448Cost of revenue(1) . . . . . . . . . . . . . . . . . . . . . . . (21,248) (22,840) (31,736) (21,374) (27,496)
Gross profit . . . . . . . . . . . . . . . . . . . . . . . . . . . 7,830 27,498 46,509 33,164 47,952
Operating expense:Research and development(1) . . . . . . . . . . (11,078) (13,651) (17,568) (12,304) (19,096)Sales, general and administrative(1) . . . . . (5,046) (5,895) (9,792) (5,614) (10,681)
Total operating expense . . . . . . . . . . . . . . . . . . (16,124) (19,546) (27,360) (17,918) (29,777)
Income (loss) from operations . . . . . . . . . . . . . (8,294) 7,952 19,149 15,246 18,175Interest income (expense), net . . . . . . . . . . . . . (44) (36) 207 75 504Fair value change in warrant liability . . . . . . . (37) — — — —Other income (expense), net . . . . . . . . . . . . . . (114) (307) 153 253 (157)
Income (loss) before income taxes . . . . . . . . . (8,489) 7,609 19,509 15,574 18,522Provision for income tax . . . . . . . . . . . . . . . . . (54) (2,637) (1,228) (980) (1,709)
Net income (loss) . . . . . . . . . . . . . . . . . . . . . . . $ (8,543) $ 4,972 $ 18,281 $ 14,594 $ 16,813
Net income (loss) attributable to ordinaryshareholders—Basic . . . . . . . . . . . . . . . . . . . $ (11,056) $ 77 $ 3,114 $ 2,514 $ 3,139
Net income (loss) per share:Basic . . . . . . . . . . . . . . . . . . . . . . . . . . . . . $ (2.66) $ 0.02 $ 0.72 $ 0.58 $ 0.68
Diluted . . . . . . . . . . . . . . . . . . . . . . . . . . . $ (2.66) $ 0.02 $ 0.66 $ 0.53 $ 0.62
Weighted-average shares used in computingnet income (loss) per share:
Basic . . . . . . . . . . . . . . . . . . . . . . . . . . . . . 4,157,498 4,260,192 4,319,243 4,303,135 4,618,302
Diluted . . . . . . . . . . . . . . . . . . . . . . . . . . . 4,157,498 5,924,390 6,366,682 6,295,066 6,557,368
42

(1) Includes share-based compensation as follows:
Year Ended December 31,Nine Months Ended
September 30,
2010 2011 2012 2012 2013
(in thousands) (unaudited)
Cost of revenue . . . . . . . . . . . . . . . . . . . . . . . . $ 31 $ 13 $ 19 $ 15 $ 62Research and development . . . . . . . . . . . . . . . 358 356 497 347 1,124Sales, general and administrative . . . . . . . . . . 389 262 473 320 1,276
Total share-based compensation . . . . . . . $778 $631 $989 $682 $2,462
As of December 31, As of September 30,
2011 2012 2013
(in thousands) (unaudited)
Selected Balance Sheet Data:Cash and cash equivalents . . . . . . . . . . . . . . . . . . . . . . . . . . . . . . . . . $ 23,343 $ 21,580 $41,181Working capital . . . . . . . . . . . . . . . . . . . . . . . . . . . . . . . . . . . . . . . . . 16,268 33,496 50,514Total assets . . . . . . . . . . . . . . . . . . . . . . . . . . . . . . . . . . . . . . . . . . . . 39,866 53,802 77,850Total liabilities . . . . . . . . . . . . . . . . . . . . . . . . . . . . . . . . . . . . . . . . . 25,620 20,208 24,575Convertible preferred shares . . . . . . . . . . . . . . . . . . . . . . . . . . . . . . . 54,322 54,377 54,400Total shareholders’ deficit . . . . . . . . . . . . . . . . . . . . . . . . . . . . . . . . . (40,076) (20,783) (1,125)
43

MANAGEMENT’S DISCUSSION AND ANALYSIS OF FINANCIAL CONDITIONAND RESULTS OF OPERATIONS
The following discussion and analysis of our financial condition and results of operations should be read inconjunction with the consolidated financial statements and related notes included elsewhere in this prospectus.This discussion contains forward-looking statements that involve risks and uncertainties such as statements ofour plans, objectives, expectations and intentions. Our actual results could differ materially from those discussedbelow. Factors that could cause or contribute to such differences include, but are not limited to, those identifiedbelow and those discussed in the section titled “Risk Factors” included elsewhere in this prospectus.
Overview
We are a global fabless provider of analog and mixed-signal semiconductor solutions currently addressingthe home entertainment and cloud computing markets. In the home entertainment market, we offer a range of set-top box solutions including tuners, demodulators and decoders as well as integrated solutions with customizedsoftware and support. In the cloud computing market, we offer high performance, low power memory interfacesolutions that enable memory intensive server applications.
Since our inception, we have been focused on developing a technology platform consisting of proprietaryhardware building blocks and customized software to enable the design of high performance, low power analogand mixed-signal semiconductor solutions. We have developed expertise in analog and radio frequency solutions,digital signal processors and high speed interfaces, which serve as the foundation for our technology platform.While analog and mixed-signal technology is applicable to a broad array of end markets, in order to best leverageour technology platform, we have been highly selective in identifying our initial target end markets. We havefocused on target markets which we believe have compelling long-term growth prospects and are alsocharacterized by complex product design, long life cycles and stringent qualification requirements. We believethat our extensive customer interaction, combined with our deep understanding of our customers’ needs, fosterscustomer loyalty and increases visibility of evolving customer requirements and market opportunities.
Initially, we focused on the home entertainment market by designing solutions for set-top boxes used inemerging markets. We believed this end market allowed us to best leverage our technology platform and takeadvantage of our presence in China, where almost all of our engineering development takes place and we haveextensive field application engineers to help serve our target end customers. We began addressing this market bydeveloping stand-alone tuners, demodulators and decoders and introduced our first set-top box solution in 2005.In 2010, we began selling integrated set-top box solutions, which combine a demodulator, decoder andsometimes tuner into a single semiconductor solution and have higher average selling prices and gross marginsthan our stand-alone tuner, demodulator and decoder solutions. We currently offer ten set-top box solutions foruse in the home entertainment market, including multi-standard compliant HDTV and SDTV semiconductorsolutions. We believe our ability to provide integrated solutions with customized software and support, which wedevelop through close collaboration with our end customers, has been a key to our success in addressing thecharacteristics of the home entertainment market in emerging markets. Our collaborative approach, which webelieve significantly benefits from our close proximity to our end customers, allows us to develop extensivelocalized knowledge of a large, fragmented market with diverse technical and service requirements.
We have also focused our development efforts on designing memory interface solutions targeting the cloudcomputing market by leveraging our expertise in high performance, low power mixed-signal semiconductordesign technologies and proximity to key industry participants in Asia. Memory interface solutions must meetstringent high performance and low power requirements and must have the ability to process high frequencysignals. Our technology platform enables us to address these requirements. We currently offer two memoryinterface solutions for use in the cloud computing market, consisting of register buffers for use in RDIMMs andmemory buffers for use in LRDIMMs. Achieving and maintaining Intel validation for our LRDIMM memorybuffers is extremely important to our market position and the prospects of our memory interface solutions
44

business, as the server OEMs who adopt Intel’s server platforms will only purchase components of their serversfrom Intel validated vendors. Both of these solutions are compatible with DDR3 DRAM technology, the mostprevalent industry standard. Sales of LRDIMM memory buffers for DDR3 accounted for 27.9% and 32.3% ofour revenue from memory interface solutions, and 1.7% and 3.0% of our total revenue, in 2012 and the ninemonths ended September 30, 2013, respectively.
We have sold our set-top box solutions primarily through distributors to over 150 end customers worldwide.Our end customers include nine of the ten largest set-top box manufacturers in China who sell solutionsoptimized for viewers in emerging markets. We sell substantially all of our memory interface solutions directlyto memory module manufacturers. We have sold our memory interface solutions to the world’s four largestDRAM manufacturers and the world’s largest third-party DRAM module supplier as measured by 2012revenues.
We operate a fabless business model and use third-party foundries and assembly and test manufacturingcontractors to manufacture, assemble and test our semiconductor products. This outsourced manufacturingapproach allows us to focus our resources on the design, development and marketing of our solutions and reducesoverhead and our exposure to semiconductor industry cyclicality risks.
Since inception, we have invested significant resources in our research and development activities. Ourengineering design teams are located in the United States, in Shanghai, Suzhou and Hangzhou in China and inTaipei and Hsinchu in Taiwan. We believe our future success depends on our ability to continuously enhance oursolutions and technology platform to meet the rapidly changing needs and requirements of our end customers. Asa result, we intend to continue to invest in our research and development efforts.
Our revenue has grown from $29.1 million in 2010 to $78.2 million in 2012, representing a compoundannual growth rate of 64%, and from $54.5 million in the nine months ended September 30, 2012 to $75.4million in the nine months ended September 30, 2013, representing an annual growth rate of 38%. In 2012, wegenerated 94% of our revenue from sales of set-top box solutions and 6% from sales of memory interfacesolutions. In the nine months ended September 30, 2013, 91% of our revenue was generated from set-top boxsolutions and 9% was generated from memory interface solutions. Our net income (loss) was $(8.5) million in2010, $5.0 million in 2011, $18.3 million in 2012 and $16.8 million for the nine months ended September 30,2013.
Significant Factors Affecting Our Operating Results
Market Demand. Demand for our solutions, and semiconductors in general, may fluctuate depending onvarious factors, including macroeconomic conditions and changing or evolving technologies, viewer preferences,customer requirements and technical standards. In emerging markets, the satellite set-top box market is currentlylarger than the cable and terrestrial set-top box markets in terms of total number of units sold by Chinesemanufacturers, while the cable set-top box market is expected to expand rapidly in coming years. In the cloudcomputing market, next generation server platforms will require LRDIMM technologies to increase memorycapacity within servers. Due to the evolving nature of our markets, our results of operations depend on our abilityto accurately anticipate and respond to changes in technologies, viewer preferences and other market conditions.
Introduction of New Solutions. Our ability to grow our revenue has depended, and will continue to depend,on our ability to develop new semiconductor solutions and to successfully market those solutions to new andexisting customers. We have expanded our set-top box solutions to include a wide range of multi-standardcompliant HDTV and SDTV solutions, and we are continuing to expand our portfolio to capture additionalsegments of the market. For example, we launched an HDTV decoder solution in early 2013 and are growing ourcable set-top box solutions business. In the cloud computing market, we are working closely with key industryparticipants, including JEDEC, leading CPU and memory module manufacturers and server OEMs to develop thefirst generation of DDR4-compliant memory interface solutions, including a registering clock driver and a data
45
buffer. In July 2013, we introduced our DDR4 registering clock driver and data buffer for DDR4 RDIMMs andLRDIMMs, which we believe is the industry’s first JEDEC 0.92 specifications compliant DDR4 registeringclock driver and data buffer. Our success depends in large part on our ability to leverage our establishedcustomer base, which includes most of the leading set-top box manufacturers in China, to quickly increaserevenue from our new solutions offerings.
Revenue Mix among Our Solutions. Our revenue and gross margin in any given period can be significantlyaffected by the relative proportion of revenue from our different solutions. For example, our integrated set-top boxsolutions generally have higher average selling prices and higher gross margins than our stand-alone tuner,demodulator and decoder solutions. In addition, newly launched solutions which incorporate more complexconfigurations generally have higher margins, subject to market-specific supply and demand. However, we expectthat as our existing solutions and target markets mature, the average unit selling price may decline over time.
Life Cycles of Our Solutions. Our semiconductor solutions are subject to life cycles and experiencegradually declining average selling prices. In general, set-top boxes targeting the emerging markets have lifecycles lasting a number of years, depending on technological or other changes affecting the market, with averageselling prices declining moderately during the life cycle. For memory interface solutions, our solutions aredesigned to support a specific CPU or server platform developed by CPU manufacturers and depend on the lifecycle of the platform we are supporting of the CPU manufacturer. The life cycle of a CPU or server platformtypically ranges from 24 to 36 months.
Attach Rate. In the cloud computing industry, the attach rate for a specific component within the server isexpressed in terms of the percentage of servers sold with that particular component. As an example, thepercentage of servers sold with LRDIMMs would be expressed as the attach rate of LRDIMMs to total servers.As one of only two LRDIMM memory buffer suppliers currently validated by Intel Corporation for DDR3memory buffers, the attach rate for LRDIMMs can have a significant effect on our addressable market andrevenue.
Seasonality. Our quarterly revenue and operating results have fluctuated in the past and may continue tofluctuate significantly depending upon numerous factors. In particular, we typically have lower sales during thefirst quarter of each year, with the fourth quarter typically having the highest quarterly revenue. This fluctuationis driven primarily by the effect of Chinese Lunar New Year, which occurs in the first quarter, on the purchasingpatterns of our distributors and end customers. Our relatively stronger performance in the fourth quarter has beenlargely due to increased demand from our end customers in anticipation of increased demand for set-top boxesduring the Chinese Lunar New Year holiday season.
Research and Development Expenses/Tape-out Costs. The semiconductor industry requires substantialinvestment in research and development in order to develop and bring to market new and enhanced technologiesand products. All of our solutions have originated from our research and development efforts, which provided uswith a significant competitive advantage. While we are committed to investing in new solution development inorder to remain competitive in our target markets, sufficient resources to maintain the level of investment inresearch and development activities is crucial to our competitiveness and results of operations. In the event thatwe are unable to put in sufficient resources in research and development activities, which may or may notbecome commercially successful, our results of operations may be adversely affected. Our research anddevelopment expense may be significantly affected by tape-out costs, which include product engineering maskcosts and prototype integrated circuit packaging and test costs. The timing of tape-out costs may be difficult toaccurately predict and may lead to fluctuations in our quarterly or annual research and development expense andnet income.
Preliminary Fourth Quarter of 2013 Earnings Results. We expect revenue for the fourth quarter to bebetween $35.0 to $35.5 million, reflecting higher sales of our memory interface solutions due to growing demandfor our products as well as continued growth of our set-top box products in China and the emerging markets. Weexpect our set-top box revenue to increase by more than 10 percent from the third quarter and our memory interface
46
revenue to increase by more than 80 percent from the third quarter. We expect gross margin for the fourth quarter of2013 to be between 62 and 63 percent. We expect operating expenses for the fourth quarter to be between $13.0 and$13.5 million, an increase from the third quarter primarily reflecting an increase in research and developmentexpenses related to new products beginning the fabrication process. We expect net income for the fourth quarter tobe between $8.5 and $9.0 million reflecting the expected increase in revenues and higher gross margins, partiallyoffset by the expected increase in operating expenses. Net income is expected to reflect pre-tax share-basedcompensation expenses of approximately $1.2 million and the amortization of acquired assets related to anassembled work force in Taiwan of approximately $0.3 million. The preliminary financial results for the fourthquarter of 2013 are our sole responsibility. The preliminary financial results provided above have not been subjectto the completion of our normal annual closing and audit process, and final adjustments and other developmentsmay arise between now and the time the financial results for this period are finalized. As a result, our actualfinancial results for the three months ended December 31, 2013 may differ materially from these preliminaryfinancial results. Our independent registered public accounting firm has not audited, reviewed, compiled orperformed any procedures with respect to the accompanying preliminary financial results, and does not express anopinion or any other form of assurance with respect thereto.
Description of Certain Statement of Operations Items
The following describes the line items set forth in our consolidated statements of operations.
Revenue
We generate revenue from sales of our set-top box and memory interface solutions to set-top box andmemory module manufacturers, either directly or through our distributors. Substantially all of our set-top boxend customers purchase products indirectly from us through distributors, while we sell substantially all of ourmemory interface solutions directly to our end customers.
In 2012 and for the three months and nine months ended September 30, 2013, we generated 94%, 91% and91% of our revenue from sales of set-top box solutions, respectively, and 6%, 9% and 9% from sales of memoryinterface solutions, respectively. We expect sales of set-top box solutions to continue to account for thesubstantial majority of our revenue; however, we expect revenue from sales of memory interface solutions as apercentage of our total revenue to grow in the next several years. We have generated the significant majority ofour revenue from sales to end customers located in Asia. Although our end customers are primarilymanufacturers located in Asia, our semiconductor solutions are incorporated into finished products sold globally.
Cost of Revenue and Gross Margin
Cost of revenue primarily includes the cost of finished silicon wafers processed by third-party foundries;costs associated with our outsourced packaging, assembly and testing; shipping costs; and costs of personnel,logistics and quality assurance. Cost of revenue also includes indirect costs, such as warranty, inventoryvaluation reserves and other overhead costs.
Gross profit is revenue less cost of revenue. Gross margin is gross profit expressed as a percentage ofrevenue. We expect that our gross margin may fluctuate from period to period, primarily as a result of changes inaverage selling price, revenue mix among our solutions, and manufacturing costs. In addition, we may reserveagainst the value at which we carry our inventory based upon the solution’s life cycle and conditions in themarkets in which we sell. Any declines in average selling prices may be paired with improvements in our cost ofrevenue, which may offset some of the gross margin reduction that could result from lower selling prices.
Operating Expenses
Our operating expenses consist of research and development expense and sales, general and administrativeexpense.
Research and Development. Research and development expense primarily includes personnel-relatedexpenses, including salaries, bonuses, share-based compensation and employee benefits. Research and
47

development expense also includes the costs of developing new products as well as supporting existing products,including tape out costs, computer-aided design software license costs, intellectual property license costs,reference design development costs, development testing and evaluation costs and depreciation expense.Research and development activities include the design of new products, refinement of existing products anddesign of test methodologies to ensure compliance with required specifications. All research and developmentcosts are expensed as incurred. We expect our research and development expense to increase as we continue toexpand our available solutions.
Sales, General and Administrative. Sales, general and administrative expense primarily includes personnel-related expenses, including salaries, bonuses, share-based compensation and employee benefits. Sales, generaland administrative expense also includes field application engineering support, commissions to independent salesrepresentatives, travel costs, professional and consulting fees, legal fees, trade shows, depreciation expense andoccupancy costs. We expect our sales, general and administrative expense to increase as we expand ourorganization to better support our customers and our anticipated growth. Additionally, these expenses willincrease as we continue to establish the necessary infrastructure to operate effectively as a public company.
Interest Income (Expense), Net
Interest income consists of interest earned on our cash, cash equivalents and short-term investment balances.Interest expense primarily consists of interest on our borrowings.
Other Income (Expense), Net
Other income (expense), net generally consists of income (expense) generated from minor non-operatingtransactions.
Fair Value Change in Warrant Liability
Fair value change in warrant liability relates to the change in fair value of our Series B-2 preferred sharewarrants issued to certain of our investors in October 2009. The change in fair value was remeasured at June 30,2010, when the warrants were exercised in full. We determined the fair value of the warrants with the assistanceof an independent third-party valuation specialist. The change in fair value was recorded as a non-cash charge inour consolidated statements of operations and comprehensive income (loss) in 2010.
Provision (Benefit) for Income Tax
We are an exempted company registered in the Cayman Islands and conduct business in several countriesincluding China, Hong Kong, Taiwan and the United States. We are subject to taxation in each of thesejurisdictions in which we conduct business. As a result, our worldwide income is subject to the tax rates in whichour income is generated and as such our effective tax rate may fluctuate based on the geographic distribution ofour earned income or losses and the applicable tax laws in which those earnings or losses were generated. Weestablished a Macao Offshore Trading Company that became operational on June 1, 2013.
Under the current law of the Cayman Islands, we are not subject to income or capital gains tax. In addition,dividend payments made by us are not subject to withholding tax in the Cayman Islands. As an offshore tradingcompany, our Macao subsidiary is not subject to income tax. Our Hong Kong and Taiwan operating subsidiariesare subject to income tax rates at 16.5% and 17%, respectively. Our U.S. subsidiary is subject to U.S. federalincome tax at graduated tax rates from 15% to 35% and the income allocated and apportioned to the state ofCalifornia is subject to California income tax at 8.8%.
The generally applicable corporate income tax rate in China, or an enterprise income tax rate, is 25%. Ourprincipal PRC operating subsidiary enjoys certain preferential tax rates due to its qualification as a qualified
48

integrated circuit design enterprise and a high and new technology enterprises, or HNTE. As a qualifiedintegrated circuit design enterprise, our principal PRC operating subsidiary is entitled to a two-year enterpriseincome tax exemption followed by a three-year 50% enterprise income tax rate reduction commencing from thefirst profit-making year, which was 2010. As a result, our principal PRC operating subsidiary was exempt fromPRC enterprise income tax in 2010 and 2011 and enjoys a preferential enterprise income tax rate of 12.5% from2012 through 2014. PRC preferential tax treatments are subject to review and may be adjusted or revoked at anytime in the future. The discontinuation of any preferential tax treatments available to us will cause our effectivetax rate to increase, which will decrease our net income and materially and adversely affect our financialcondition and results of operations. See “Risk Factors—Risk Factors Related to Regulations Applicable to Us—Our business has benefited from certain preferential tax treatment and government incentives. Discontinuation orrevocation of the preferential tax treatments and government incentives available to us could decrease our netincome and materially and adversely affect our financial condition and results of operations.”
Results of Operations
The following table sets forth our consolidated statement of operations data (in thousands) for the periodsindicated.
Year Ended December 31, Nine Months Ended Sept. 30,
2010 2011 2012 2012 2013
(in thousands, except share and per sharedata) (unaudited)
Statement of Operations Data:Revenue . . . . . . . . . . . . . . . . . . . . . . . . . . . $ 29,078 $ 50,338 $ 78,245 $ 54,538 $ 75,448Cost of revenue(1) . . . . . . . . . . . . . . . . . . . . (21,248) (22,840) (31,736) (21,374) (27,496)
Gross profit . . . . . . . . . . . . . . . . . . . . . . . . 7,830 27,498 46,509 33,164 47,952
Operating expense:Research and development(1) . . . . . . . (11,078) (13,651) (17,568) (12,304) (19,096)Sales, general and administrative(1) . . (5,046) (5,895) (9,792) (5,614) (10,681)
Total operating expense . . . . . . . . . . . . . . (16,124) (19,546) (27,360) (17,918) (29,777)
Income (loss) from operations . . . . . . . . . (8,294) 7,952 19,149 15,246 18,175Interest income (expense), net . . . . . . . . . . (44) (36) 207 75 504Fair value change in warrant liability . . . . (37) — — — —Other income (expense), net . . . . . . . . . . . (114) (307) 153 253 (157)
Income (loss) before income taxes . . . . . . (8,489) 7,609 19,509 15,574 18,522Provision for income tax . . . . . . . . . . . . . . (54) (2,637) (1,228) (980) (1,709)
Net income (loss) . . . . . . . . . . . . . . . . . . . $ (8,543) $ 4,972 $ 18,281 $ 14,594 $ 16,813
Net income (loss) attributable to ordinaryshareholders—Basic . . . . . . . . . . . . . . . $ (11,056) $ 77 $ 3,114 $ 2,514 $ 3,139
Net income (loss) per share:Basic . . . . . . . . . . . . . . . . . . . . . . . . . $ (2.66) $ 0.02 $ 0.72 $ 0.58 $ 0.68
Diluted . . . . . . . . . . . . . . . . . . . . . . . . $ (2.66) $ 0.02 $ 0.66 $ 0.53 $ 0.62
Weighted-average shares used incomputing net income (loss) per share:
Basic . . . . . . . . . . . . . . . . . . . . . . . . . 4,157,498 4,260,192 4,319,243 4,303,135 4,618,302
Diluted . . . . . . . . . . . . . . . . . . . . . . . . 4,157,498 5,924,390 6,366,682 6,295,066 6,557,368
49

(1) Includes share-based compensation as follows:
Year Ended December 31,Nine Months Ended
September 30,
2010 2011 2012 2012 2013
(in thousands) (unaudited)
Cost of revenue . . . . . . . . . . . . . . . . . . . . $ 31 $ 13 $ 19 $ 15 $ 62Research and development . . . . . . . . . . . 358 356 497 347 1,124Sales, general and administrative . . . . . . 389 262 473 320 1,276
Total share-based compensation . . . $778 $631 $989 $682 $2,462
Comparison of the three months and nine months ended September 30, 2013 and 2012
Revenue
Three Months EndedSeptember 30, %
Change2013 2012
(in thousands)
Revenue . . . . . . . . . . . . . . . . . . . . . . . . . . . . . . . . . . . . . . . . $30,056 $20,601 46%
Nine Months EndedSeptember 30, %
Change2013 2012
(in thousands)
Revenue . . . . . . . . . . . . . . . . . . . . . . . . . . . . . . . . . . . . . . . . $75,448 $54,538 38%
Revenue increased by $9.5 million, or 46% and $20.9 million, or 38%, for the three and nine months endedSeptember 30, 2013, from the same periods in 2012, respectively. The increase in revenue was primarily due to anincrease in revenue from sales of our set-top box solutions, which increased from $18.6 million to $27.3 million andfrom $50.6 million to $68.4 million for the three and nine months ended September 30, 2013, respectively. Totalnumber of units shipped for our set-top box solutions increased by 42.0% and 22.1% for the three months and ninemonths ended September 30, 2013 from the same periods in 2012, respectively, due to increased demand reflectinggreater market acceptance of our integrated set-top box solutions which increasingly became the primary source ofour set-top box revenue. A substantial portion of the increase in revenue was attributable to the continued increasein shipments of our integrated set-top box solutions, which have higher average selling prices than our stand-alonesolutions. Our revenue from memory interface solutions increased by $0.8 million, or 44%, and increased by $3.2million, or 81% in the three and nine months ended September 30, 2013 from the same periods in 2012,respectively, due to increased number of units shipped, which increased by 72% and 90%, respectively, as well ashigher average selling prices, primarily as a result of sales of our LRDIMM solutions, which have significantlyhigher average selling prices than our other memory interface solutions.
Cost of Revenue and Gross Profit
Three Months EndedSeptember 30, %
Change2013 2012
(in thousands)
Cost of revenue . . . . . . . . . . . . . . . . . . . . . . . . . . . . . . . . . . . $10,907 $ 7,683 42%% of revenue . . . . . . . . . . . . . . . . . . . . . . . . . . . . . . . . . . . . . 36% 37%Gross profit . . . . . . . . . . . . . . . . . . . . . . . . . . . . . . . . . . . . . . $19,149 $12,918 48%Gross margin . . . . . . . . . . . . . . . . . . . . . . . . . . . . . . . . . . . . . 64% 63%
50

Nine Months EndedSeptember 30, %
Change2013 2012
(in thousands)
Cost of revenue . . . . . . . . . . . . . . . . . . . . . . . . . . . . . . . . . . . $27,496 $21,374 29%% of revenue . . . . . . . . . . . . . . . . . . . . . . . . . . . . . . . . . . . . . 36% 39%Gross profit . . . . . . . . . . . . . . . . . . . . . . . . . . . . . . . . . . . . . . $47,952 $33,164 45%Gross margin . . . . . . . . . . . . . . . . . . . . . . . . . . . . . . . . . . . . . 64% 61%
Cost of revenue increased by $3.2 million, or 42%, and increased by $6.1 million, or 29%, in the three andnine months ended September 30, 2013 from the same periods in 2012, respectively. The increase in cost ofrevenue was primarily due to the increase in the number of units shipped in the three and nine months endedSeptember 30, 2013 compared to the same periods in 2012. Gross margin increased from 63% to 64% in thethree months ended September 30, 2013 compared to the same period in 2012 primarily due to improvedeconomies of scale resulting from the increase in shipment volume as well as increased sales of our higher grossmargin integrated set-top box and LRDIMM solutions. Gross margin increased from 61% to 64% in the ninemonths ended September 30, 2013 compared to the same period in 2012 primarily due to an increase in sales ofour integrated solutions due to their relatively higher average selling prices and gross margins compared to ourstand-alone tuner, demodulator and decoder solutions.
Operating Expenses
Three MonthsEnded
September 30, %Change2013 2012
(in thousands)
Research and development . . . . . . . . . . . . . . . . . . . . . . . . . . . . $6,623 $3,835 73%% of revenue . . . . . . . . . . . . . . . . . . . . . . . . . . . . . . . . . . . . . . . 22% 19%Sales, general and administrative . . . . . . . . . . . . . . . . . . . . . . . $3,880 $2,382 63%% of revenue . . . . . . . . . . . . . . . . . . . . . . . . . . . . . . . . . . . . . . . 13% 12%
Nine Months EndedSeptember 30, %
Change2013 2012
(in thousands)
Research and development . . . . . . . . . . . . . . . . . . . . . . . . . . $19,096 $12,304 55%% of revenue . . . . . . . . . . . . . . . . . . . . . . . . . . . . . . . . . . . . . 25% 23%Sales, general and administrative . . . . . . . . . . . . . . . . . . . . . $10,681 $ 5,614 90%% of revenue . . . . . . . . . . . . . . . . . . . . . . . . . . . . . . . . . . . . . 15% 10%
Research and development expenses increased by $2.8 million, or 73%, and $6.8 million, or 55%, for thethree and nine months ended September 30, 2013, from the same periods in 2012, respectively, primarily as aresult of an increase in personnel-related expenses of $1.4 million and $4.7 million, an increase in share-basedcompensation expense of $0.4 million and $0.8 million attributable to new share option and restricted shareawards grants, an increase of $0.8 million and $0.9 million in product development expenses, and partially offsetby a decrease of $0.8 million in external consulting services in compared to the same period in 2012. Theprimary reason for the increase in personnel-related expenses was the increase in headcount as we ended thisperiod with 376 research and development employees, an increase of 39 employees compared to the sameperiods in 2012.
Sales, general and administrative expenses increased by $1.5 million, or 63%, and $5.1 million, or 90%, forthe three and nine months ended September 30, 2013, from the same periods in 2012, respectively, primarily as aresult of an increase in personnel-related expenses of $0.3 million and $1.3 million, the overall increase in
51

expenses also included an increase of $0.4 million and $1.2 million for professional service fees mainly includingfees for accounting and legal services, an increase of $0.1 million and $0.7 million for amortization of intangibleassets and an increase of $0.4 million and $1.0 million in share-based compensation expense attributable to newgrants of share options and restricted share awards, an increase of $54,000 and $0.3 million in commission fee,and an increase of $0.1 million and $0.2 million in rental expenses. The primary reason for the increase inpersonnel-related expenses was the increase in headcount as we ended this period with 83 sales, general andadministrative employees, an increase of 12 employees compared to the same periods in 2012.
Interest Income, Net and Other Income (Expense), Net
Three Months EndedSeptember 30,
2012 2013 % Change
( in thousands)
Interest Income, net . . . . . . . . . . . . . . . . . . . . . . . . . . $202 $71 185%% of revenue . . . . . . . . . . . . . . . . . . . . . . . . . . . . . . . . 0% 0%Other income (expense), net . . . . . . . . . . . . . . . . . . . . $ (70) $20 (450)%% of revenue . . . . . . . . . . . . . . . . . . . . . . . . . . . . . . . . 0% 0%
Nine Months EndedSeptember 30,
2012 2013%
Change
( in thousands)
Interest Income, net . . . . . . . . . . . . . . . . . . . . . . . . . . . . . . $ 504 $ 75 572%% of revenue . . . . . . . . . . . . . . . . . . . . . . . . . . . . . . . . . . . 1% 0%Other income (expense), net . . . . . . . . . . . . . . . . . . . . . . . $(157) $253 (162)%% of revenue . . . . . . . . . . . . . . . . . . . . . . . . . . . . . . . . . . . 0% 1%
Interest income, net increased $0.1 million, or 185%, and $0.4 million, or 572%, for the three and ninemonths ended September 30, 2013, from the same periods in 2012, respectively, primarily due to increasedinterest income from higher cash and short-term investment balances. Additionally, interest expense decreased inthe three and nine months ended September 30, 2013 from the same periods in 2012 as we repaid $1.6 million ofbank borrowings in January and February 2013.
Other income (expense), net was an expense of $70,000 in the three months ended September 30, 2013 ascompared to an income of $20,000 in the same period of 2012. The other expense we recorded in the threemonths ended September 30, 2013 primarily reflected a foreign exchange loss of $110,000 partially offset by agovernment subsidy of $40,000. The other income we recorded in the three months ended September 30, 2012was primarily foreign exchange gain during the period.
Other income (expense), net was an expense of $0.2 million for the nine months ended September 30, 2013as compared to an income of $0.3 million in the same period of 2012. The other expense, net we recorded in thenine months ended September 30, 2013 primarily reflected a foreign exchange loss of $0.3 million partiallyoffset by a non-project related government subsidy of $0.1 million. The other income we recorded in the ninemonths ended September 30, 2012 was primarily from a non-project related government subsidy received duringthe period by $0.2 million and $0.1 million foreign exchange gain during the period. For the non-project relatedgovernment subsidies with no further conditions to be met, we record the amounts as other income; for theproject related government subsidies with certain operating conditions, we record the amounts are recorded asadvances payable when received and will record as a deduction of related expenses and cost of acquired assetswhen the conditions are met.
52

Provision for Income Taxes
Three Months Ended September 30, % Change
2013 2012
(in thousands)
Provision for income tax . . . . . . . . . . . . . . . . . $ 737 $ 427 73%% of revenue . . . . . . . . . . . . . . . . . . . . . . . . . . 2.45% 2.07%
Nine Months Ended September 30, % Change
2013 2012
(in thousands)
Provision for income tax . . . . . . . . . . . . . . . . . . $1,709 $ 980 74%% of revenue . . . . . . . . . . . . . . . . . . . . . . . . . . . 2.27% 1.80%
We recorded an income tax provision of $0.7 million and $1.7 million in the three and nine months endedSeptember 30, 2013, respectively.
Our effective tax rate for the three and nine months ended September 30, 2013 was 8.4% and 9.2%,respectively. The effective tax rate for the three and nine months ended September 30, 2012 was 6.3% and 6.3%,respectively. The difference between the effective tax rates and the statutory rate resulted primarily due to theforeign tax rate being different from the statutory rate.
Comparison of the Years Ended December 31, 2010, 2011 and 2012
Revenue
Year Ended December 31, % Change
2010 2011 2012 2011 2012
(in thousands, except percentage data)
Revenue . . . . . . . . . . . . . . . . . . . . . . . . . . . . . . . . . . . . . . . . . . . . . $29,078 $50,338 $78,245 73% 55%
Revenue in 2012 increased by $27.9 million, or 55%, from 2011 primarily due to an increase in revenuefrom sales of our set-top box solutions, which increased from $49.0 million to $73.6 million, primarily as a resultof a 50% increase in the number of units shipped for our set-top box solutions driven by increased demandreflecting greater market acceptance of our integrated set-top box solutions which increasingly became theprimary source of our set-top box revenue. A substantial portion of this increase was attributable to the continuedincrease in shipments of our integrated set-top box solutions. Our memory interface solutions revenue alsoincreased significantly in 2012, increasing from $1.3 million in 2011 to $4.6 million in 2012 due to an increase of169% in the number of units shipped, as well as higher average selling prices, primarily as a result of sales of ourLRDIMM solutions, which have significantly higher average selling prices than our other memory interfacesolutions. We began generating meaningful revenue from LRDIMM sales in 2012.
Revenue in 2011 increased by $21.2 million, or 73%, from 2010 primarily due to the increase in revenue ofour set-top box solutions, which increased from $27.9 million to $49.0 million. Total number of units shipped forour set-top box solutions increased by 19% in 2011 reflecting greater market acceptance of our integrated set-topbox solutions which became the primary source of our set-top box revenue. The increase in our set-top boxsolutions revenue was attributable primarily to increased shipments of our integrated solutions, which accountedfor a significantly higher proportion of our revenue from set-top box solutions in 2011 compared to 2010.
53

Cost of Revenue and Gross ProfitYear Ended December 31, % Change
2010 2011 2012 2011 2012
(in thousands, except percentage data)
Cost of revenue . . . . . . . . . . . . . . . . . . . . . . . . . . . . . . . . . . . . . . . $21,248 $22,840 $31,736 8% 39%% of revenue . . . . . . . . . . . . . . . . . . . . . . . . . . . . . . . . . . . . . . . . . 73% 45% 41%Gross profit . . . . . . . . . . . . . . . . . . . . . . . . . . . . . . . . . . . . . . . . . . $ 7,830 $27,498 $46,509 251% 69%Gross margin . . . . . . . . . . . . . . . . . . . . . . . . . . . . . . . . . . . . . . . . . 27% 55% 59%
Cost of revenue increased by $8.9 million, or 39%, from 2011 to 2012. The increase in cost of revenue wasprimarily due to increased shipments, in particular for integrated solutions for set-top box applications. Grossmargin increased from 55% to 59% during the same period due primarily to improved economies of scaleresulting from the increase in shipment volume.
Cost of revenue increased by $1.6 million, or 8%, from 2010 to 2011, primarily due to increased shipments,in particular for integrated solutions for set-top boxes. Gross margin increased from 27% to 55% during the sameperiod as a result of an increase in sales of our integrated solutions due to their relatively higher average sellingprices and gross margins compared to our stand-alone tuner, demodulator and decoder solutions. We also had a$1.6 million write-down of obsolete inventory primarily related to our memory interface solutions that supportedservers utilizing DDR2 memory in 2010.
Our gross profit benefited $30,000, $0.6 million and $0.3 million from sales of product that was previouslywritten down to net realizable value for 2010, 2011 and 2012, respectively.
Operating Expenses
Year Ended December 31, % Change
2010 2011 2012 2011 2012
(in thousands, except percentage data)
Research and development . . . . . . . . . . . . . . . . . . . . . . . . . . . . . . . . . $11,078 $13,651 $17,568 23% 29%% of revenue . . . . . . . . . . . . . . . . . . . . . . . . . . . . . . . . . . . . . . . . . . . . 38% 27% 22%Sales, general and administrative . . . . . . . . . . . . . . . . . . . . . . . . . . . . $ 5,046 $ 5,895 $ 9,792 17% 66%% of revenue . . . . . . . . . . . . . . . . . . . . . . . . . . . . . . . . . . . . . . . . . . . . 17% 12% 13%
Research and development expense for 2012 increased by $3.9 million, or 29%, from 2011 primarily as aresult of an increase in headcount to support the number of product development projects in process during theyear. The increase in personnel-related expenses of $4.8 million was the largest component of the change and adirect result of the increase of 85 employees in our research and development organization as we ended the yearwith 270 research and development employees. The increase was partially offset by proceeds received forgovernment funding of research and development projects that passed the government review process during theyear, which reduced research and development expenses by $1.0 million.
Research and development expense for 2011 increased by $2.6 million, or 23%, from 2010. The increase inpersonnel-related expenses of $1.9 million was the largest component of the change and a direct result of theincrease of 69 employees in our research and development organization as we ended the year with 185 researchand development employees.
Sales, general and administrative expense for 2012 increased by $3.9 million, or 66%, from 2011, primarilyas a result of an increase in personnel-related expenses of $2.0 million, which primarily resulted from an increaseof 24 sales, general and administrative employees during 2012 as we ended the year with 126 sales, general andadministrative employees. In addition, the increase in sales, general and administrative expenses was partiallydue to a $1.1 million increase in consulting and professional fees.
54

Sales, general and administrative expense for 2011 increased by $0.8 million, or 17%, from 2010 due to anincrease in personnel-related expenses of $0.8 million, which primarily resulted from an increase of 16 sales,general and administrative employees as we ended the year with 102 sales, general and administrativeemployees.
Interest Income (Expense), Net, Fair Value Change in Warrant Liability and Other Income (Expense), Net
Year Ended December 31,
2010 2011 2012
(in thousands)
Interest income (expense), net . . . . . . . . . . . . . . . . . . . . . . . . . . . $ (44) $ (36) $207Fair value change in warrant liability . . . . . . . . . . . . . . . . . . . . . . $ (37) — —Other income (expense), net . . . . . . . . . . . . . . . . . . . . . . . . . . . . . $(114) $(307) $153
Interest income (expense), net increased to $207,000 in 2012 from $(36,000) in 2011 primarily due toearnings on higher cash and short term investment balances.
Fair value change in warrant liability of $37,000 in 2010 was the result of the revaluation of warrants issuedto our Series B-2 preferred shareholders in 2009 that were exercised in 2010. The expense reflected the increasein the value of the warrant from the time they were issued to the time they were exercised by shareholders.
We had other income, net in 2012 of $0.2 million compared with other expense, net of $0.3 million in 2011.Our other expense, net increased from $0.1 million in 2010 to $0.3 million in 2011.
Provision (Benefit) for Income Tax
Our provision for income tax was $1.2 million in 2012 compared to $2.6 million in 2011. Our effectiveincome tax rate decreased to 6.3% in 2012 from 34.7% of 2011. In 2011, we recorded a one-time income taxprovision of $2.8 million for research and development expenses that were non-deductible for tax purposes. Wehad provision for income tax of $54,000 in 2010.
55

Selected Quarterly Results of Operations
The following table presents our unaudited quarterly results of operations for the six quarters endedSeptember 30, 2013. This unaudited quarterly information has been prepared on the same basis as our auditedconsolidated financial statements and includes all adjustments, consisting of only normal recurring adjustments,necessary for the fair statement of the information for the quarters presented. You should read this table togetherwith our audited consolidated financial statements and the related notes thereto included elsewhere in thisprospectus. Our quarterly results of operations will vary in the future. The results of operations for any quarterare not necessarily indicative of any future results.
Three Months Ended
Jun. 30,2012
Sept. 30,2012
Dec. 31,2012
Mar. 31,2012
Jun. 30,2013
Sept. 30,2013
(unaudited) (in thousands)
Statement of Operations Data:Revenue . . . . . . . . . . . . . . . . . . . . . . . . . . . . . . . . . $19,233 $20,601 $23,707 $20,084 $25,308 $30,056Cost of revenue . . . . . . . . . . . . . . . . . . . . . . . . . . . 7,137 7,683 10,362 7,769 8,820 10,907
Gross profit . . . . . . . . . . . . . . . . . . . . . . . . . . . . . . 12,096 12,918 13,345 12,315 16,488 19,149
Operating expense:Research and development . . . . . . . . . . . . . . 4,231 3,835 5,264 5,700 6,773 6,623Sales, general and administrative . . . . . . . . . 1,805 2,382 4,178 3,100 3,701 3,880
Total operating expense . . . . . . . . . . . . . . . . . . . . 6,036 6,217 9,442 8,800 10,474 10,503
Income from operations . . . . . . . . . . . . . . . . . . . . 6,060 6,701 3,903 3,515 6,014 8,646Interest income (expense), net . . . . . . . . . . . . . . . . 17 71 132 129 173 202Fair value change in warrant liability . . . . . . . . . . — — — — — —Other income (expense), net . . . . . . . . . . . . . . . . . 215 20 100 16 (103) (70)
Income before income taxes . . . . . . . . . . . . . . . . . 6,292 6,792 3,935 3,660 6,084 8,778Provision for income tax . . . . . . . . . . . . . . . . . . . . (400) (427) (248) (371) (601) (737)
Net income . . . . . . . . . . . . . . . . . . . . . . . . . . . . . . $ 5,892 $ 6,365 $ 3,687 $ 3,289 $ 5,483 $ 8,041
56

The following table presents the unaudited quarterly results of operations as a percentage of revenue:
Three Months Ended
Jun. 30,2012
Sept. 30,2012
Dec. 31,2012
Mar. 31,2012
Jun. 30,2013
Sept. 30,2013
(unaudited)
Statement of Operations Data: . . . . . . . . . . . . . . . . . . . . .Revenue . . . . . . . . . . . . . . . . . . . . . . . . . . . . . . . . . . . . . . 100% 100% 100% 100% 100% 100%Cost of revenue . . . . . . . . . . . . . . . . . . . . . . . . . . . . . . . . 37 37 44 39 35 36
Gross profit . . . . . . . . . . . . . . . . . . . . . . . . . . . . . . . . . . . 63 63 56 61 65 64
Operating expense: . . . . . . . . . . . . . . . . . . . . . . . . . . . . . .Research and development . . . . . . . . . . . . . . . . . . . . 22 19 22 28 27 22Sales, general and administrative . . . . . . . . . . . . . . . 9 12 18 15 15 13
Total operating expense . . . . . . . . . . . . . . . . . . . . . . . . . . 31 30 40 43 42 35
Income from operations . . . . . . . . . . . . . . . . . . . . . . . . . . 32 33 16 18 23 29Interest income (expense), net . . . . . . . . . . . . . . . . . . . . . 0 0 1 0 1 0Fair value change in warrant liability . . . . . . . . . . . . . . . 0 0 0 0 0 0Other income (expense), net . . . . . . . . . . . . . . . . . . . . . . 1 0 0 0 0 0
Income before income taxes . . . . . . . . . . . . . . . . . . . . . . 33 33 17 18 24 29Provision for income tax . . . . . . . . . . . . . . . . . . . . . . . . . (2) (2) (1) (2) (2) (2)
Net income . . . . . . . . . . . . . . . . . . . . . . . . . . . . . . . . . . . . 31% 31% 16% 16% 22% 27%
We typically experience seasonal fluctuations in our quarterly revenue, with the first fiscal quarter normallybeing the lowest revenue quarter and the fourth quarter being the highest revenue quarter. This seasonality isprimarily the result of increased sales into the set-top box market in the fourth quarter of each year as our endcustomers build inventory in preparation for the holiday shopping season. In contrast, we normally experiencelower sales in the first quarter of each year as our end customers generally manufacture fewer set-top boxes as aresult of the Chinese New Year holiday, which falls in January or February of each year.
Our cost of revenue and gross margin generally varies with our revenue mix among our solutions. Typically,solutions incorporated into more complex configurations, such as our integrated set-top box solutions generallyhave higher sales prices and enjoy higher profit margins as compared to stand-alone solutions. Similarly, ourcurrent LRDIMM memory buffers have a higher sales price and higher profit margin compared to our RDIMMregister buffers. We expect that our gross margin may continue to vary from quarter to quarter primarily based onthe mix of solutions that we sell in each of our target markets. Additionally, our gross margin can be affected bythe timing of new product introductions and the effect of the valuation of our inventories.
Research and development expense generally increased on a quarter-on-quarter basis primarily due to an increasein engineering headcount and the costs associated with new product development. We expect our headcount to increasein order to support our growing new product development activities. Our research and development expense may besignificantly affected by tape-out costs in support of these development activities as the timing of tape-out costs may bedifficult to accurately predict and may lead to fluctuations in our quarterly or annual research and development expenseand net income. The relatively lower research and development expense in the quarter ended September 30, 2012 wasprimarily due to proceeds received for government funding of research and development projects that passed thegovernment review process, which reduced research and development expenses by $1.0 million during that quarter.
Sales, general and administrative expense generally increased on a quarter-on-quarter basis primarily due toincreases in headcount to support the growth in our business, business development efforts to support ourgrowing sales and marketing efforts and other professional services to support our legal and accountingrequirements. Sales, general and administrative expense as a percentage of revenue will fluctuate from quarter toquarter primarily based on the timing of these expenses.
57

We incurred relatively high operating expenses, resulting in lower income from operations, in the quarterended December 31, 2012 primarily due to relatively higher professional fees for accounting, tax and legalservices relating to our initial public offering in the three months ended December 31, 2012 that were not eligiblefor capitalization. We typically do not expect operating expenses as a percentage of revenue to be materiallyhigher in the fourth quarter than in other quarters.
Liquidity and Capital Resources
Our principal sources of liquidity are our cash and cash equivalents, short-term investments, and cashgenerated from operations. As of September 30, 2013, we had $41.2 million of cash, cash equivalents and $6.4million of short-term investments. On October 1, 2013, we received an additional $49.5 million of net proceedsafter deducting underwriting discounts and commissions from our initial public offering. Prior to 2011, wefinanced our operations primarily by net proceeds of approximately $43.1 million from the sales of preferredshares. We believe our current cash, cash equivalents and net cash from operating activities will be sufficient tosatisfy our liquidity requirements for the next 12 months. However, management may in the future elect tofinance operations by further utilizing bank loans, credit facilities or selling equity securities.
The ability of our PRC subsidiaries to make dividend and other payments to us may be restricted byapplicable PRC foreign exchange laws and other PRC laws and regulations. Current PRC regulations permit oursubsidiaries in China to pay dividends only out of their accumulated profits, if any, determined in accordancewith PRC accounting standards and regulations. In addition, our subsidiaries in China are required to set aside atleast 10% of their respective accumulated profits each year, if any, to fund certain reserve funds until suchreserves have reached at least 50% of their respective registered capital. These reserves are not distributable ascash dividends. Further, loans or investments outside of China by PRC companies are subject to restrictions andapproval requirements. Therefore, it may be difficult for us to transfer funds from our PRC subsidiaries to usquickly. We do not expect the restrictions on transferring funds out of China will have a material effect on ourliquidity because we believe our cash, cash equivalents and other assets located outside of China are sufficient tomeet our expected needs and our revenues are primarily generated outside of China in U.S. dollars. We generatethe substantial majority of our revenue, and incur our working capital requirements relating to purchases ofinventory from third-party foundries, through our non-PRC operating entities. The working capital requirementsof our PRC operating subsidiaries, which include research and development and sales, general and administrativeexpenses, are primarily funded by their operating income generated from providing services to our non-PRCoperating entities.
Below is a summary of our cash flows provided by (used in) operating activities, investing activities andfinancing activities for the periods indicated:
Year Ended December 31,Nine Months Ended
September 30,
2010 2011 2012 2012 2013
(in thousands) (unaudited)
Net cash provided by (used in) operatingactivities . . . . . . . . . . . . . . . . . . . . . . . . . . . $ (937) $11,187 $ 9,404 $ 6,069 $23,102
Net cash used in investing activities . . . . . . . (824) (807) (10,503) (5,703) (1,381)Net cash provided by (used in) financing
activities . . . . . . . . . . . . . . . . . . . . . . . . . . . 2,415 (636) (553) (466) (1,937)Effect of exchange rates on cash and cash
equivalents . . . . . . . . . . . . . . . . . . . . . . . . . 131 281 (111) (44) (183)
Net increase (decrease) in cash and cashequivalents . . . . . . . . . . . . . . . . . . . . . . . . . $ 785 $10,025 $ (1,763) $ (144) $19,601
58

Net Cash Provided by (Used in) Operating Activities
Our primary uses of cash in operating activities are to fund operating expenses and purchases of inventory.Cash used to fund operating expenses excludes the impact of non-cash items such as depreciation and share-based compensation and is impacted by the timing of when we pay these expenses as reflected in the change inour outstanding accounts payable and accrued expenses.
Our primary sources of cash provided by operating activities are cash receipts on accounts receivable fromour shipment of products to distributors and direct customers. Aside from an increase in amounts billed to ourcustomers, net cash collections of accounts receivable are impacted by the efficiency of our cash collectionsprocess, which can vary from period to period depending on the payment cycles of our major distributorcustomers. Our accounts receivable, net at year end as a percentage of our revenue during the year were 5%, 12%and 10% in 2010, 2011 and 2012, respectively.
Net cash provided by operating activities in the nine months ended September 30, 2013 primarily reflectedour net income of $16.8 million, depreciation and amortization of $1.9 million and share-based compensation of$2.5 million offset by net cash used to fund working capital in operating activities primarily reflecting a decreasein accounts payable of $2.5 million, an increase in deferred margin and accrued expenses of $0.3 million and$0.1 million, respectively, and an increase in inventory of $1.0 million.
Net cash provided by operating activities in the nine months ended September 30, 2012 primarily reflectedour net income of $14.6 million and a decrease in deferred margin, accounts payable and accrued expenses of$4.1 million, $2.7 million and $2.3 million, respectively, and a decrease in inventory of $0.4 million. Net cashprovided by operating activities was also impacted by depreciation and amortization of $0.6 million, share-basedcompensation of $0.7 million, and an increase of tax payable of $0.9 million.
Net cash provided by operating activities in 2012 primarily reflected our net income of $18.3 million, share-based compensation of $1.0 million, depreciation of $1.2 million, inventory write-downs of $0.5 million, andincreases in accrued expenses and taxes payable of $0.9 million and $1.1 million, respectively, partially offset byan increase in accounts receivable and inventory of $2.0 million and $4.7 million, respectively, and reductions inaccounts payable and deferred margin of $3.1 million and $3.9 million, respectively. Our accounts receivable andinventory grew as a result of our increased sales activity.
Net cash provided by operating activities in 2011 primarily reflected our net income of $5.0 million, share-based compensation of $0.6 million, depreciation of $0.6 million, inventory write-downs of $0.5 million, and anincrease in accounts payable, deferred margin, tax payable and accrued expenses of $4.1 million, $4.3 million,$3.3 million and $2.4 million, respectively, offset by increases in accounts receivable and inventory of $4.4million and $5.1 million, respectively. Our accounts receivable and inventory grew as a result of our increasedsales activity.
Net cash used in operating activities in 2010 of $0.9 million primarily reflected our net loss of $8.5 million,and decrease in deferred margin of $1.2 million, offset by non-cash charge of share-based compensation,depreciation and inventory write-downs of $0.8 million, $0.8 million and $1.6 million, respectively, decreases inaccounts receivable of $3.6 million and increase in accrued expenses of $1.6 million. We wrote-down $1.6million of obsolete inventory primarily related to our memory interface solutions that supported servers utilizingDDR2 memory in 2010.
Net Cash Used in Investing Activities
Our capital expenditures have primarily consisted of purchases of property, equipment and software. In thenine months ended September 30, 2013, our capital expenditures did not significantly affect our liquidityposition. We expect our capital expenditures to increase as we grow our business. We currently expect to finance
59

our capital expenditures primarily or exclusively through net cash from operating activities and the net proceedsfrom our initial public offering and this offering, but we may in the future finance our capital expenditurerequirements through issuances of debt or equity securities or bank borrowings.
Net cash used in investing activities in the nine months ended September 30, 2013 primarily related to $33.2million of purchases of short-term investments, $1.2 million for purchases of property, equipment and softwareand $0.5 million for purchase of intangible assets, partially offset by $33.5 million of proceeds from maturities ofshort-term investments. Net cash used in investing activities in the nine months ended September 30, 2012primarily related to $6.4 million of purchases of short-term investments and $1.5 million for purchases ofproperty, equipment and software, and $1.0 million for purchase of intangible assets, partially offset by $3.1million of proceeds from maturities of short-term investment.
Net cash used in investing activities in 2012 primarily related to $11.2 million of purchases of short-terminvestments and $2.1 million for purchases of property, equipment and software, partially offset by $4.8 millionof proceeds from maturities of short-term investments. Our net cash used in investing activities in 2010 and 2011primarily related to purchases of property, equipment and software of $0.7 million in 2010 and $0.6 million in2011.
Net Cash Provided by (Used in) Financing Activities
Net cash used in financing activities in the nine months ended September 30, 2013 consisted primarily of$1.6 million for the repayment of bank borrowings, partially offset by $0.4 million expenses in connection withour initial public offering.
Net cash used in financing activities in the nine months ended September 30, 2012 consisted primarily of$2.1 million for the repayment of bank borrowings, partially offset by $1.6 million of bank borrowing.
Net cash used in financing activities in 2012 consisted primarily of $2.1 million for the repayment of bankborrowings, partially offset by $1.6 million in proceeds from new bank borrowings. Net cash used in financingactivities in 2011 consisted primarily of $3.8 million for the repayment of bank borrowings, partially offset byproceeds from bank borrowings of $3.1 million. Net cash provided by financing activities in 2010 consistedprimarily of $3.8 million in new bank borrowings and $1.5 million of net proceeds from the exercise of warrantsto purchase our Series B-2 shares, partially offset by $3.0 million for the repayment of loans.
Contractual Obligations
The following table summarizes our outstanding contractual obligations as of December 31, 2012:
Payments Due by Period
TotalLess Than
1 Year1-3
Years3-5
Years
(in thousands)
Operating lease obligations . . . . . . . . . . . . . . . . . . . . . . . . . . . . $1,775 $ 992 $783 $—Purchase obligations . . . . . . . . . . . . . . . . . . . . . . . . . . . . . . . . . 1,086 1,086 — —
Total contractual obligations . . . . . . . . . . . . . . . . . . . . . . . . . . . $2,861 $2,078 $783 $—
During 2012, we entered into a 32 month non-cancelable operating lease agreement for additional officespace in our Shanghai facility. The lease commenced in April 2012 with an option to extend the lease for anadditional three years. Future minimum annual payments under the operating lease for the years 2013 and 2014are $0.6 million and $0.6 million, respectively.
60

The following table summarizes our outstanding contractual obligations as of September 30, 2013(unaudited):
Payment Due by Period
TotalLess than9 Months
1-3Years
3-5Years
(in thousands)
Operating lease obligations . . . . . . . . . . . . . . . . . . . . . . . . . . . $2,461 $ 315 $1,877 $269Purchase obligations . . . . . . . . . . . . . . . . . . . . . . . . . . . . . . . . . 1,670 1,670 — —
Total contractual obligations . . . . . . . . . . . . . . . . . . . . . . . . . . $4,131 $1,985 $1,877 $269
Off-Balance Sheet Arrangements
As of September 30, 2013, we did not have any relationships with unconsolidated organizations or financialpartnerships, such as structured finance or special purpose entities that would have been established for thepurpose of facilitating off-balance sheet arrangements or other contractually narrow or limited purposes.
Quantitative and Qualitative Disclosures About Market Risk
Interest Rate Sensitivity
We had cash, cash equivalents and short-term investments of $47.6 million as of September 30, 2013, whichwas held for working capital purposes. Our cash and cash equivalents and short-term investments consist of cash,time deposits, and money market funds. Our investment policy and strategy are focused on preservation ofcapital, supporting our liquidity requirements, and compliance with the Investment Company Act of 1940. We donot enter into investments for trading or speculative purposes. We do not believe that we have any materialexposure to changes in the fair value of these investments as a result of changes in interest rates due to theirshort-term nature. Declines in interest rates, however, will reduce future investment income. Changes in interestrates affect the interest earned on our cash and cash equivalents and short-term investments. We do not believethat an increase or decrease of 100 basis points in interest rates would have a material impact on our financialposition or results of operations. Any realized gains or losses resulting from such interest rate changes wouldonly occur if we sold the investments prior to maturity.
Foreign Currency Risk
The functional currency of Montage Technology Group Limited and our non-PRC subsidiaries is the U.S.dollar. The functional currency of our subsidiaries in the PRC is the Renminbi. Monetary assets and liabilities incurrency denomination other than the functional currency are translated into the functional currency at the rate ofexchange in effect at the balance sheet date. Transactions in currencies other than the functional currency duringthe reporting period are converted into the functional currency at the applicable exchange rate on the daytransaction occurred. Accordingly, the effects of exchange rate fluctuations on the net assets of each of our groupentities are accounted for as translation gains or losses in accumulated other comprehensive income withinshareholders’ equity. In addition, our revenue is primarily denominated in U.S. dollars and since a significantportion of our assets and expenses are in the PRC, they are in the denominated in Renminbi. As a result, ourresults of operations and financial condition are subject to risks associated with exchange rate fluctuations, inparticular in relation to the exchange rates between the Renminbi and the U.S. dollar. We do not believe that achange of 10% in such foreign currency exchange rates would have a material impact on our financial position orresults of operations.
Critical Accounting Policies and Estimates
Our consolidated financial statements and the related notes included elsewhere in this prospectus areprepared in accordance with accounting principles generally accepted in the United States. The preparation of
61
these consolidated financial statements requires us to make estimates and assumptions that affect the reportedamounts of assets, liabilities, revenue, costs and expenses, and any related disclosures. We base our estimates onhistorical experience and on various other assumptions that we believe to be reasonable under the circumstances.Changes in accounting estimates are reasonably likely to occur from period to period. Accordingly, actual resultscould differ significantly from the estimates made by our management. We evaluate our estimates andassumptions on an ongoing basis. To the extent that there are material differences between these estimates andour actual results, our future financial statement presentation, financial condition, results of operations and cashflows will be affected.
We believe that the following accounting policies involve a greater degree of judgment and complexity thanour other accounting policies. Accordingly, these are the policies we believe are the most critical tounderstanding and evaluating our consolidated financial condition and results of operations.
Revenue Recognition
Our revenue is generated from the sale of our semiconductor solutions sold into the home entertainment andcloud computing markets. In the home entertainment market, we sell set-top box solutions which consist ofhighly integrated semiconductors and embedded software. We do not deliver software as a separate product inconnection with the sale of our solutions nor is any software upgrade offered after the sale of our solutions.
We recognize revenue only when all of the following criteria are met: (i) persuasive evidence of anarrangement exists, (ii) delivery has occurred, (iii) the price to the customer is fixed or determinable, and(iv) collection of the resulting receivable is reasonably assured.
We evaluate each of these criteria as follows:
Evidence of an arrangement – We generally use a customer’s purchase order to establish the existence ofan arrangement.
Delivery – We consider delivery to occur when title has been transferred to the customer.
Fixed or determinable fee – We assess whether fees are fixed or determinable at the time of sale. We onlyconsider the fee to be fixed or determinable if the fee is not subject to adjustment.
Collection is deemed probable – We deem collection probable if we expect that the customer will be ableto pay amounts under arrangement as payments become due.
We sell our set-top box solutions primarily through third-party independent distributors under agreementsallowing for pricing credits and/or rights of return and to a lesser extent, directly to set-top box manufacturers.We sell our memory interface products directly to memory module manufacturers. For direct sales to endcustomers, we recognize revenue at the time of shipment to our end customers when all of the above criteria aremet. For sales through distributors, we defer the recognition of revenue and related product costs until the saleand delivery by the distributor to the end customer occurs because we cannot reliably estimate returns or priceadjustments due to rapid changes in technology, consumer preferences and prices. Upon shipment to thedistributor, we record an accounts receivable based on the amount we are entitled to bill the distributor accordingto the contractual arrangement between the distributor and us. This amount is recorded, net of the costs ofproducts delivered, as deferred margin, net on our consolidated balance sheet. We do not accept product returnsfrom customers except for returns to satisfy warranty claims of products previously delivered.
Deferred Margin, Net
We defer revenue recognition on sales to distributors until our products are sold by our distributors to endcustomers, which is when the selling price to the distributor is fixed or determinable. Deferred margin, net is
62

calculated as: 1) deferred revenue that is recorded based on the amount of the sale price that we are entitled tobill the distributor at the time of shipment to the distributor based on terms of the distribution agreement, less 2)deferred cost of revenue, representing the costs of products shipped to the distributor.
Under our contract with LQW Technology Company Limited, or LQW, which has been a distributor for ourproducts since October 2011 and was our largest distributor in 2012 and the nine months ended September 30,2013, we are entitled to bill only a portion of the total sale price at the time of shipment (deferred revenue), withthe remainder billed upon sale by LQW to the end customer. Upon sale by LQW to the end customer, we bill theremaining sale price to LQW and recognize this amount as revenue directly (rather than initially as deferredrevenue) as the sale price is fixed and determinable and all criteria for revenue recognition is met.
For our other distributors, we are typically entitled to bill the entire sale price at the time of shipment to thedistributors, which is recorded as deferred revenue upon shipment and recognized as revenue when sales from thedistributors to the end customers occur.
The distributors resell our products to end customers at a range of individually negotiated prices based on avariety of factors, including the identity of the end customer and its historical relationship with us, the type ofproduct sold and sales quantity. With reference to these factors, according to the terms of our distributionagreement with the distributor, we adjust the original sale price to the distributor based on the actual resale pricefrom the distributor to end customer. Primarily because of the uncertainty related to the final price, we deferrecognition of revenue and cost of sales to distributors until the products are sold by the distributors to endcustomers. The amount of gross margin we recognize in future periods may be more than or less than theoriginally recorded deferred margin, net as a result of any price adjustment. We record price adjustments againstdeferred margin, net at the time of the distributor’s sale to the end customer.
For the years ended December 31, 2010, 2011 and 2012 and nine months ended September 30, 2012 and2013, the total net price adjustments were a downward adjustment of $1.4 million, or 4.9% of total revenue, anupward adjustment of $0.3 million, or 0.7% of total revenue, and a downward adjustment of $0.3 million, or0.3% of total revenue, a downward adjustment of $0.2 million, or 0.4% of total revenue and a downwardadjustment of $0.5 million, or 0.6% of total revenue, respectively. The decreasing trend in total price adjustmentsfrom 2010 to 2011 and 2012 was primarily due to increased sales of solutions that had relatively stable pricingand an increasing proportion of sales to LQW for which the majority of the sale price was billed at the time LQWcompleted its sales to the end customer. For the portion of sales to LQW that we bill at the time LQW completesthe sale to the end customer, we record the billed amount directly to revenue, and therefore no price adjustment isnecessary.
Deferred cost of revenue, a component of deferred margin, net, is stated at the lower of cost or market value.We evaluate whether our deferred cost of revenue has been impaired based on expected net cash flows to bereceived for the deferred items. There was no impairment for deferred cost of revenue for the years endedDecember 31, 2010, 2011 and 2012 and the nine months ended September 30, 2012 and 2013. Please see thediscussion contained in Note 8, Deferred Margin, Net, to our consolidated financial statements for the year endedDecember 31, 2012 included elsewhere in this prospectus for further details.
Allowance for Doubtful Accounts
We perform ongoing credit evaluations of our distributors and end customers to whom we sell directly andadjust credit limits based on creditworthiness of each, as determined by our review of current credit information.We continuously monitor collections and payments from our distributors and end customers to whom we selldirectly and maintain an allowance for doubtful accounts based upon our historical experience, our anticipationof uncollectible accounts receivable and any specific customer collection issues that we have identified. Whileour credit losses have historically been insignificant, we may experience higher credit loss rates in the future thanwe have in the past. Our accounts receivable are concentrated in relatively few distributors, with two of our
63

distributors in the aggregate accounting for 81% of our total accounts receivable, net as of September 30, 2013.Therefore, a significant change in the liquidity or financial position of any one significant distributor or endcustomer could make collection of our accounts receivable more difficult, require us to increase our allowancefor doubtful accounts and negatively affect our working capital.
Inventory Valuation
We continually assess the salability of our inventory based on assumptions about demand and marketconditions. Forecasted demand is determined based on historical sales and expected future sales. We value ourinventory at the lower of cost or its current estimated market value. We reduce our inventory to the estimatedlower of cost or market value on a part-by-part basis to account for its obsolescence or lack of marketability.Reductions are calculated as the difference between the cost of inventory and the estimated market value basedupon assumptions about future demand and market conditions. If actual market conditions are less favorable thanthose projected by management, additional inventory write-downs may be required that may adversely affect ouroperating results. If actual market conditions are more favorable, we may have higher gross profits whenproducts are sold.
Intangible assets
Our intangible assets include acquired assembled workforce and licenses and are amortized on a straight-line basis over their estimated useful lives, which range from 18 to 36 months.
On August 23, 2012, Montage Technology Hong Kong Limited, one of our wholly owned subsidiaries, enteredinto agreements with a third party to acquire research and development workforce, intellectual property, or IP, andcomputers and office equipment for total cash consideration of $2.0 million. The acquisition was completed inSeptember 2012. We determined that the acquisition of research and development workforce, IP and computers andoffice equipment should be accounted for as an asset acquisition as the group of assets that we acquired did not meetthe definition of a business as pursuant to ASC 805. We allocated the total consideration to the acquired researchand development workforce, IP (which was obsolete) and computers and office equipment with the amount of$1.9 million, $0 million, and $0.1 million, respectively. The research and development workforce is recorded asassembled workforce and amortized on a straight line basis over 18 months as we expected the acquired workforceprovides economic benefit to us during this period based on our prior experience in the area of developing ourresearch and development workforce and conducting research and development activities.
For long-lived assets including amortizable intangible assets, we evaluate for impairment whenever eventsor changes (triggering events) indicate that the carrying amount of an asset may no longer be recoverable. Weassess the recoverability of the long-lived assets by comparing the carrying value of the long-lived assets to theestimated undiscounted future cash flows expected to receive from use of the assets and their eventualdisposition. Such assets are considered to be impaired if the sum of the expected undiscounted cash flows is lessthan the carrying amount of the assets. The impairment to be recognized is measured by the amount by which thecarrying amount of the assets exceeds the fair value of the assets. There were no impairments for long-livedassets and intangible assets for the years ended December 31, 2010, 2011 and 2012.
Income Taxes
We account for income taxes using the asset and liability approach. We record deferred tax assets andliabilities for the tax consequences attributable to the differences between the carrying amounts of existing assetsand liabilities in our financial statements and their respective tax basis, and operating loss carry-forwards. Wemeasure deferred tax assets and liabilities using tax rates expected to apply to taxable income in the years inwhich the temporary differences are expected to be recovered or settled. The deferred tax assets would berecovered when the benefits are realized. In the event we were to determine that it is more likely than not that itwould be able to realize its deferred tax assets in the future in excess of its net recorded amount, an adjustment tothe valuation allowance for the deferred tax asset would be made.
64

We are subject to income taxes in China, Hong Kong, Taiwan and the United States, and are subject toroutine corporate income tax audits in these jurisdictions. We believe that our tax return positions are fullysupported, but tax authorities may challenge certain positions, which may not be fully sustained. However, ourincome tax expense includes amounts intended to satisfy income tax assessments that result from thesechallenges. Determining the income tax expense for these potential assessments and recording the related assetsand liabilities requires management judgment and estimates. We believe that our provision for uncertain taxpositions, including related interest and penalties, is adequate based on information currently available to us. Theamount ultimately paid upon resolution of audits could be materially different from the amounts previouslyincluded in income tax expense and therefore could have a material impact on our tax provision, net income andcash flows. Our overall provision requirement could change due to the issuance of new regulations or new caselaw, negotiations with tax authorities, resolution with respect to individual audit issues, or the entire audit, or theexpiration of statutes of limitations.
Share-Based Compensation
Our 2006 Share Incentive Plan, or the 2006 Plan, was adopted in June 2006. The 2006 Plan provides for theissuance of incentive share options (ISOs), nonstatutory share options (NSOs) and restricted share awards(RSAs). NSOs may be granted to employee, directors and consultants, while ISOs may be granted only toemployees and RSAs may be granted to employees, directors or non-employees. Share options granted vest overa maximum period of four years and expire ten years from the date of the grant. Share options generally vest overfour years, one-quarter on the first anniversary of the date of the grant and monthly thereafter for the remainingthree years. RSAs have various vesting periods determined by the plan administrator, and generally vest overfour years, with 25% on each of the anniversary of the vesting commence date. As of September 30, 2013 andDecember 31, 2012, the number of ordinary shares authorized for equity award issuance under the 2006 Plan was6,566,544, and 6,566,544 shares, respectively. The authority to grant additional shares under the 2006 Planterminated upon our initial public offering.
Our board of directors approved and adopted a 2013 Performance Incentive Plan, or the 2013 Plan, inconnection with our initial public offering. Our shareholders have approved the 2013 Plan, which becameeffective upon the completion of our initial public offering. As of the date of this prospectus, a total of 2,600,000ordinary shares is authorized for issuance with respect to awards granted under the 2013 Plan. The share limitwill automatically increase on the first trading day in January of each year by an amount equal to the lesser of(1) 4% of the total number of outstanding shares of our ordinary shares on the last trading day in December in theprior year, (2) 1,000,000 shares, or such lesser number as determined by our board of directors.
Awards under the 2013 Plan may be in the form of incentive or nonqualified share options, shareappreciation rights, share bonuses, restricted share and other forms of awards including cash awards. Awardsunder the plan generally will not be transferable other than by will or the laws of descent and distribution, exceptthat the plan administrator may authorize certain transfers.
Nonqualified and incentive share options may not be granted at prices below the fair market value of theordinary shares on the date of grant. Incentive share options must have an exercise price that is at least equal tothe fair market value of our ordinary shares, or 110% of fair market value of our ordinary shares or incentiveshare option grants to any 10% owner of our ordinary shares, on the date of grant. These and other awards mayalso be issued solely or in part for services. Awards are generally paid in cash or shares of our ordinary shares.The plan administrator may provide for the deferred payment of awards and may determine the terms applicableto deferrals.
The 2013 Plan will terminate on the tenth anniversary of the date our board adopts it. However, the planadministrator will retain its authority until all outstanding awards are exercised or terminated. The maximumterm of options, share appreciation rights and other rights to acquire ordinary shares under the plan is ten yearsafter the initial date of the award.
65

Employees, officers, directors and consultants that provide services to us or one of our subsidiaries may beselected to receive awards under the 2013 Plan and the compensation committee of our board of directors will bethe administrator under the 2013 Plan.
We account for share options issued to non-employees in accordance with authoritative guidance for equitybased payments to non-employees. Share options issued to non-employees are accounted for at their estimatedfair value determined using the Black-Scholes option-pricing model. The fair value of options granted to non-employees is re-measured as they vest, and the resulting increase in value, if any, is recognized as expense duringthe period the related services are rendered.
For purposes of determining our share-based compensation expense, we used the Black-Scholes optionpricing model to calculate the fair value of share options on the grant date for share options granted to employeesand as of each balance sheet date until the date when services are rendered for share options granted to non-employees. This model requires inputs such as the expected term of the option, expected volatility, the risk-freeinterest rate, dividend yield and fair value of the underlying share at grant date. These inputs are subjective andgenerally require significant judgment. For each of the three years ended December 31, 2010, 2011 and 2012 andthe nine months ended September 30, 2013, we estimated the fair value of share options using the Black-Scholesoption pricing model with the following range of assumptions:
Year Ended December 31Nine Months Ended
September 30
2010 2011 2012 2013
(unaudited)
Risk-free interest rate . . . 2.37-4.53% 1.42-4.52% 1.10-3.13% 1.11-3.53%Dividend yield . . . . . . . . — — — —Expected term (years) . . 6 to 10 6 to 10 6 to 10 6 to 10Expected volatility . . . . . 50.21-63.99% 49.29-57.46% 39.97-52.66% 39.69-49.75%
Risk-Free Interest Rate. We derived the risk-free interest rate assumption from the yield-to-maturity of theUSD dominated China International Government bond with the maturity period that can cover the expected termof the share options.
Dividend Yield. Expected dividend yields are assumed to be 0% for all grant dates, as our dividend policy isto retain earning for reinvestment purpose and we do not intend to distribute dividend in the foreseeable future.
Expected Term. The expected term represents the period that our share-based awards are expected to beoutstanding. The expected term was estimated based on the date of the grant, expiration date and vesting periodas stated in the share option grant. The expected term for directors, officers and employees was six years fromeach measurement date. The expected term for external consultants was ten years from the grant date.
Expected Volatility. We estimated volatility based upon the average share price volatility of comparablelisted companies over a period comparable to the expected term of the options. We believe the average shareprice volatility of the selected comparable companies is a reasonable benchmark in estimating the expectedvolatility of our ordinary shares. When making the selections of our industry peer companies to be used in thevolatility calculation, we also considered their stage of development, size and financial leverage.
In addition to determining the fair value of share options granted to employees, we also estimate theforfeiture rate to calculate the amount of compensation expense recognized for each reporting period. We utilizedour historical forfeiture rates to estimate our future forfeiture rate, which is 5.6%. We will continue to evaluatethe appropriateness of estimating the forfeiture rate based on actual forfeiture experience, analysis of employeeturnover behavior and other factors. Estimated forfeiture rates also affect the amount of aggregate compensationcosts recognized for each reporting period. Quarterly changes in the estimated forfeiture rate can have asignificant effect on share-based compensation expense as the cumulative effect of adjusting the rate for all
66
shares compensation expense amortization is recognized in the period the forfeiture estimate is changed. If arevised forfeiture rate is higher than the previously estimated forfeiture rate, an adjustment is made that willresult in a decrease to the share-based compensation expense recognized in the consolidated financial statements.If a revised forfeiture rate is lower than the previously estimated forfeiture rate, an adjustment is made that willresult in an increase to the share-based compensation expense recognized in the consolidated financialstatements. The effect of forfeiture adjustments during 2010, 2011, 2012 and the nine months endedSeptember 30, 2013 was insignificant. We will continue to use judgment in evaluating the expected term,volatility and forfeiture rate related to our share-based compensation on a prospective basis and incorporatingthese factors in the option pricing model.
If in the future, we determine that other methods are more reasonable, or other methods for calculating theseassumptions are prescribed by authoritative guidance, the fair value calculated for our share options could changesignificantly. Higher volatility and longer expected lives result in an increase to share-based compensationexpense determined at the date of grant. Share-based compensation expense affects our cost of revenue, researchand development expense and our sales, general and administrative expense.
In order to determine the fair value of share options using the Black Scholes model, we are required todetermine the fair value of our ordinary shares. The following table summarizes, by grant date, the number ofshare options granted since March 19, 2012 through September 30, 2013 and the associated per share exerciseprice for each of these grants and the fair value of the ordinary shares used to calculate our share-basedcompensation:
Grant Date
Number ofOptionsGranted
Exercise Price($)
Fair Value ofUnderlying
Ordinary Sharesas of the Grant
Date($)
March 19, 2012 . . . . . . . . . . . . . . . . . . . . . . . . . . . . . . . . 34,800 2.20 7.83March 19, 2012 . . . . . . . . . . . . . . . . . . . . . . . . . . . . . . . . 47,200 9.43 7.83June 15, 2012 . . . . . . . . . . . . . . . . . . . . . . . . . . . . . . . . . 21,200 9.43 9.20September 17, 2012 . . . . . . . . . . . . . . . . . . . . . . . . . . . . 340,720 9.43 12.20December 13, 2012 . . . . . . . . . . . . . . . . . . . . . . . . . . . . . 96,000 9.43 15.28February 25, 2013 . . . . . . . . . . . . . . . . . . . . . . . . . . . . . . 120,800 16.03 17.20April 23, 2013 . . . . . . . . . . . . . . . . . . . . . . . . . . . . . . . . . 1,179,960 17.85 17.98August 13, 2013 . . . . . . . . . . . . . . . . . . . . . . . . . . . . . . . 30,000 17.85 17.98
Our board of directors estimated fair value of our ordinary shares on the grant date for purposes ofdetermining the exercise price, but the fair value of our ordinary shares was subsequently revisited by our boardof directors for financial reporting purposes and reassessed on a retrospective basis.
In addition to the above share option grants during the periods above, on April 23 and August 13, 2013, ourcompensation committee approved the grant of restricted shares, primarily to our employees, covering a total of317,120 ordinary shares and 13,500 shares respectively. The estimated fair value on the grant dates was $17.98per ordinary share and the share-based compensation expense related to these awards is calculated based on theestimated fair value of our ordinary shares on the date of grant, multiplied by the number of restricted sharesgranted.
Historically, prior to our initial public offering, given the absence of an active market for our ordinaryshares, our board of directors determined the exercise prices of share options granted by referencing to objectiveand subjective factors affecting value of our ordinary shares. The factors considered by our board of directorsincluded the following:
• retrospective valuations performed by independent third-party valuation specialist;
67

• the prices of our convertible preferred shares sold to outside investors in arm’s-length transactions;
• the rights, preferences and privileges of our convertible preferred shares relative to those of ourordinary shares;
• our operating and financial performance and revenue outlook;
• the introduction of new products;
• the hiring of key personnel;
• the status of product development and qualifications;
• the fact that option grants involve illiquid securities in a private company;
• the public trading prices of the ordinary shares of companies whose business is comparable to ours;
• the general economic outlook;
• the risks inherent in the development of our products and expansion of our target markets; and
• the likelihood of achieving a liquidity event, such as an initial public offering or sale of our company,given prevailing market conditions.
In determining our share-based compensation expense using the Black Scholes model, we engaged anindependent third-party valuation specialist to assist us with the valuation of ordinary shares on a retrospectivebasis. However, our management and board of directors have assumed full responsibility for the estimates. We haveperformed valuations of our ordinary shares in a manner consistent with the methods outlined in the AmericanInstitute of Certified Public Accountants Practice Aid, Valuation of Privately-Held-Company Equity SecuritiesIssued as Compensation. These valuations were prepared in a consistent manner and involved a two-step process.First, we established our enterprise value using the income approach and the market approach. The incomeapproach, which relies on a discounted cash flow analysis, measures the value of a company as the present value ofits future economic benefits by applying an appropriate risk-adjusted discount rate to expected cash flows, based onforecasts of revenue and costs. The market approach, which relies on analysis of comparable public companies andcomparable acquisitions, measures the value of a company through comparison to comparable companies andtransactions. Consideration is given to the financial condition and operating performance of the company beingvalued relative to those of publicly traded companies operating in the same or similar lines of business. Whenchoosing the comparable companies to be used for the market approach, we focused on companies in thesemiconductor industry. Some of the specific criteria we used to select comparable companies within our industryincluded the business description, business size, projected growth, financial condition and historical operatingresults. For each valuation report, we prepared a financial forecast to be used in the computation of the enterprisevalue for both the market approach and the income approach. The financial forecasts took into account our pastexperience and future expectations. The risks associated with achieving these forecasts were assessed in selectingthe appropriate discount rate. As discussed below, there is inherent uncertainty in these estimates. We applied adiscount for lack of marketability to reflect the increased risk arising from the inability of holders to readily sell theshares and then allocated the resulting equity value among the securities that comprise our capital structure usingthe Option-Pricing Method. The aggregate value of the ordinary shares derived from the Option-Pricing Methodwas then divided by the number of ordinary shares outstanding to arrive at the per share common value.
In each valuation, we considered the market approach based on an analysis of comparable public companies.In forming our opinion, we relied upon the income approach to prepare the equity value analysis of the company,due to factors such as lack of a long business history compared with the comparable public companies,differential of business scopes, significant sales increase beginning in 2011, as well as short reporting periods ofnet profit. Since the fair value of our ordinary shares has been ultimately determined by our discounted cash flowanalyses, our valuations have been heavily dependent on our estimates of revenue, costs and related cash flows.These estimates are highly subjective and subject to frequent change based on both new operating data as well asvarious macroeconomic conditions that impact our business. Each of our valuations was prepared using data thatwas consistent with our then-current operating plans that we were using to manage our business.
68

Discussion of Significant Factors in Fair Value Determinations Prior to Our Initial Public Offering
The fair values of the underlying ordinary shares were determined with the assistance of an independentthird-party valuation specialist. To estimate the fair value of the ordinary shares, we first determined ourenterprise value by means of a discounted cash flow analysis using the retrospective approach. The cash flowderived by company management considered the nature of our business, our future business plan, specificbusiness and financial risks, the stage of development of our operations, and economic and competitive elementsaffecting our business, industry and market. We also used other general assumptions, including following: nomajor changes in the existing political, legal, fiscal and economic conditions in China; no major changes in thecurrent taxation laws in the jurisdictions in which we operate; our ability to retain competent management, keypersonnel and technical staff to support our ongoing operating; and no significant deviations in industry trendsand market conditions from our current economic forecasts. The cash flow is discounted using the weightedaverage cost of capital of 20% as of December 31, 2010 and 18% as of June 30, 2012, which were benchmarkedwith discount rates of comparable listed companies. In addition, a lack of marketability discount of 20% and 15%were applied to arrive at the estimated enterprise value as of December 31, 2010 and June 30, 2012. The lack ofmarketability discount takes into consideration the plans for the status of our proposed initial public offering.
The following discusses the significant factors and probabilities of various outcomes considered by ourboard of directors in determining the estimated fair value of our ordinary shares at each of the grant datesspecified below. Our board of directors estimated the fair value of our ordinary shares, however, the fair value ofthe underlying ordinary shares was subsequently revisited by our board of directors for financial reportingpurposes and reassessed on a retrospective basis.
March 19, 2012
On March 19, 2012, our board of directors granted share options with an exercise price equal to the fairvalue of the ordinary shares as of June 30, 2012, as determined by an independent valuation specialist. The shareoptions granted on this date included options to purchase 34,800 ordinary shares which were committed toexisting employees but which had not been submitted to our board of directors for approval. These priorcommitments were made to employees with an exercise price of $2.20 per share prior to the receipt of anindependent valuation. With respect to these awards, our board of directors determined to honor our priorexercise price commitment to the employees. With respect to other grants approved on March 19, 2012, ourboard of directors considered an independent valuation as of June 30, 2012 reflecting a fair value of $9.43 pershare and determined to establish the exercise price for these options at $9.43 per share.
The significant assumptions used in the June 30, 2012 independent valuation report included a discountedweighted average cost of capital of 18% which was benchmarked with discount rates of comparable listedcompanies. In addition, a lack of marketability discount of 15% was applied to arrive at the estimated enterprisevalue. The lack of marketability discount took into consideration the current status of our plan for a proposedinitial public offering. The expected outcomes were heavily weighted based on the probability of a publicoffering, with a probability of an initial public offering set at 55%. Similarly, the second most probable outcomeapplied was a change in control of the company, with a probability set at 30%.
June 15, 2012
On June 15, 2012, our board of directors granted share options with an exercise price equal to the fair valueof the ordinary shares as of June 30, 2012, as determined by an independent valuation specialist. Subsequent tomaking the grants, the board of directors considered an independent valuation as of June 30, 2012 reflecting afair value of $9.43 per share and determined to establish the exercise price for these options at $9.43 per share.
The significant assumptions used in the June 30, 2012 independent valuation report included a discountedweighted average cost of capital of 18% which was benchmarked with discount rates of comparable listed
69

companies. In addition, a lack of marketability discount of 15% was applied to arrive at the estimated enterprisevalue. The lack of marketability discount took into consideration the current status of our plans for a proposedinitial public offering. The expected outcomes were heavily weighted based on the probability of a publicoffering, with a probability of an initial public offering set at 55%. Similarly, the second most probable outcomeapplied was a change in control of the company, with a probability set at 30%.
September 17, 2012
On September 17, 2012, our board of directors granted share options with an exercise price of $9.43 pershare. In estimating the fair value of our ordinary shares to set the exercise price of such options, our board ofdirectors considered a number of factors, including an improving revenue forecast, particularly for memorybuffer products and our continued strong set-top box revenues. Although our business prospect improved, thechanges were deemed not material and as a result our board of directors considered the most recent independentvaluation report of June 30, 2012 that reflected a fair value of our ordinary shares of $9.43 per share and theexercise price for these options remained at $9.43 per share.
The significant assumptions used in the June 30, 2012 independent valuation report included a discountedweighted average cost of capital of 18% which was benchmarked with discount rates of comparable listedcompanies. In addition, a lack of marketability discount of 15% was applied to arrive at the estimated enterprisevalue. The lack of marketability discount took into consideration the current status of our plans for a proposedinitial public offering. The expected outcomes were heavily weighted based on the probability of a publicoffering, with a probability of an initial public offering set at 55%. Similarly, the second most probable outcomeapplied was a change of control of the company, with a probability set at 30%.
December 13, 2012
On December 13, 2012, our board of directors granted share options with an exercise price of $9.43 pershare. In estimating the fair value of our ordinary shares to set the exercise price of such options, our board ofdirectors considered a number of factors, including initial revenue from our LRDIMM memory interfaceproducts and our continued strong set-top box solutions revenue growth. However, our board of directors notedthe high degree of volatility in the U.S. public markets, citing in particular that the NASDAQ Global Marketdeclined 6% since our prior quarterly board meeting. As a result, the board of directors estimated that the fairvalue of our ordinary shares continued to be $9.43 per share based on an independent valuation as of June 30,2012 and the exercise price for the options approved at this meeting be at $9.43 per share.
The significant assumptions used in the June 30, 2012 independent valuation report included a discountedweighted average cost of capital of 18% which was benchmarked with discount rates of comparable listedcompanies. In addition, a lack of marketability discount of 15% was applied to arrive at the estimated enterprisevalue. The lack of marketability discount took into consideration the current status of our plans for a proposedinitial public offering. The expected outcomes were heavily weighted based on the probability of a publicoffering, with a probability of an initial public offering set at 55%. Similarly, the second most probable outcomeapplied was a change in control of the company, with a probability set at 30%.
In January 2013, our board of directors requested our independent third party valuation specialists to perform afull set of retrospective valuations of our ordinary shares at various dates since our inception. In February 2013, ourvaluation specialist delivered to our board of directors valuation reports which valued our ordinary shares as ofDecember 31, 2010, September 30, 2011, June 30, 2012 and December 31, 2012. Our valuation specialist valuedour ordinary shares at each of these dates at $2.35, $5.20, $9.43 and $15.90, respectively. The significantassumptions used in the December 31, 2012 independent valuation report which was delivered by our valuationspecialist in February 2013 included an increase in forecasted revenue for our memory interface solutions as webegan initial shipment of our LRDIMM solutions. The valuation also included a discounted weighted average costof capital of 18%, which was benchmarked with discount rates of comparable listed companies. In addition, a lack
70

of marketability discount of 11% was applied to arrive at the estimated enterprise value. The lack of marketabilitydiscount took into consideration the current status of our plans for a proposed initial public offering. The expectedoutcomes were heavily weighted based on the probability of a public offering, with the probability of an initialpublic offering set at 60%. Similarly, the second most probable outcome applied was a change in control of thecompany, with the probability set at 30%. As a result, for the ordinary shares underlying the options, we haveattributed a fair value for each grant date. This fair value input at each option grant date was determined by thelinear relationship with reference to the fair values of the ordinary shares as of the closest key valuation dates. Webelieve the linear relationship between key dates to derive the fair value of ordinary shares input for share optionpricing is reasonable during these periods. We determined that share-based compensation expense that we wouldrecord should be calculated with the revised estimated fair value of our ordinary shares at each grant date for all theshare option grants.
February 25, 2013
On February 25, 2013, our compensation committee granted share options with an exercise price of $16.03per share. In estimating the fair value of our ordinary shares to set the exercise price of such options, ourcompensation committee considered a number of factors, including increasing revenue from our LRDIMMmemory interface products and our continued strong set-top box revenue growth. In addition, our board ofdirectors was increasingly looking into the possibility of an initial public offering for the company. Ourcompensation committee estimated that the fair value of our ordinary shares was $6.41 per share based on anindependent valuation as of December 31, 2012. As a result, the exercise price for the options approved at thismeeting was at $16.03 per share.
The significant assumptions used in the December 31, 2012 independent valuation report included adiscounted weighted average cost of capital of 18% which was benchmarked with discount rates of comparablelisted companies. In addition, a lack of marketability discount of 11% was applied to arrive at the estimatedenterprise value. The lack of marketability discount took into consideration the then current status of our plansfor a proposed initial public offering. The expected outcomes were heavily weighted based on the probability of apublic offering, with a probability of an initial public offering set at 60%. Similarly, the second most probableoutcome applied was a change in control of the company, with a probability set at 30%.
April 23, 2013
On April 23, 2013, our compensation committee granted share options with an exercise price of $17.85 pershare based on a preliminary report from our independent valuation specialist that determined the fair value ofour ordinary shares as of March 31, 2013 to be $17.85. In estimating the fair value of our ordinary shares to setthe exercise price of such options, our compensation committee considered a number of factors, includingincreasing revenue from our LRDIMM memory interface products and our continued strong set-top box revenuegrowth. In addition, our board of directors was increasingly looking into the possibility of an initial publicoffering for the company. We subsequently estimated that the fair value of our ordinary shares was $17.98 pershare based on the final result of the independent valuation as of March 31, 2013.
On April 23, 2013, we also granted 317,120 restricted shares, under our 2006 Share Incentive Plan. Theestimated fair value on the grant date of the restricted shares was $17.98 per ordinary share. We calculated theshare-based compensation expense for these restricted shares by multiplying the estimated fair value of ourordinary shares on the date of grant by the number of restricted shares, less the forfeitures. The share-basedcompensation expense is recorded on a straight-line basis over the requisite service period of the restrictedshares.
The significant assumptions used in the March 31, 2013 independent valuation report included a discountedweighted average cost of capital of 18% which was benchmarked with discount rates of comparable listedcompanies. In addition, a lack of marketability discount of 6% was applied to arrive at the estimated enterprise
71

value. The lack of marketability discount took into consideration the then current status of our plans for aproposed initial public offering. The expected outcomes were heavily weighted based on the probability of apublic offering, with a probability of an initial public offering set at 60%. Similarly, the second most probableoutcome applied was a change in control of the company, with a probability set at 30%.
August 13, 2013
On August 13, 2013, our compensation committee granted share options with an exercise price of $17.85per share based on the preliminary report from our independent valuation specialist that determined the fair valueof our ordinary shares as of March 31, 2013 to be $17.85. In estimating the fair value of our ordinary shares to setthe exercise price of such options, our compensation committee considered a number of factors, includingincreasing revenue from our LRDIMM memory interface products and our continued strong set-top box revenuegrowth. In addition, our board of directors was increasingly looking into the possibility of an initial publicoffering for the company. We subsequently estimated that the fair value of our ordinary shares was $17.98 pershare based on the final result of the independent valuation as of March 31, 2013. The significant assumptionsused in the March 31, 2013 independent valuation report included a discounted weighted average cost of capitalof 18% which was benchmarked with discount rates of comparable listed companies. In addition, a lack ofmarketability discount of 6% was applied to arrive at the estimated enterprise value. The lack of marketabilitydiscount took into consideration the then current status of our plans for a proposed initial public offering. Theexpected outcomes were heavily weighted based on the probability of a public offering, with a probability of aninitial public offering set at 60%. Similarly, the second most probable outcome applied was a change in controlof the company, with a probability set at 30%.
On August 13, 2013, we also granted 13,500 restricted shares under our 2006 Share Incentive Plan. Theestimated fair value on the grant date of the restricted shares was $17.98 per ordinary share. We calculated theshare-based compensation expense for these restricted shares by multiplying the estimated fair value of ourordinary shares on the date of grant by the number of restricted shares, less the forfeitures. The share-basedcompensation expense is recorded on a straight-line basis over the requisite service period of the restrictedshares.
Share Options and Restricted Share Awards Granted Subsequent to our Initial Public Offering
For share options and restricted share awards granted subsequent to our initial public offering, our board ofdirectors determined the fair value based on the closing price of our ordinary shares as reported on the NasdaqGlobal Market on the date of grant.
As a result of our fair value calculations of the granted share options and restricted share awards and theallocation of value to the vesting periods using the straight-line vesting attribution method, we recognizedemployee share-based compensation in the statements of operations as follows:
Year Ended December 31,
Nine MonthsEnded
September 30,
2010 2011 2012 2013
(in thousands) (unaudited)
Cost of revenue . . . . . . . . . . . . . . . . . . . . . . . . . . . . $ 31 $ 13 $ 19 $ 62Research and development . . . . . . . . . . . . . . . . . . . 358 356 497 1,124Sales, general and administrative . . . . . . . . . . . . . . 389 262 473 1,276
Total share-based compensation . . . . . . . . . . . . . . . $778 $631 $989 $2,462
As of September 30, 2013, there was $17.8 million of unrecognized compensation costs, net of forfeituresrelated to share options and restricted share awards granted under our 2006 Share Incentive Plan. The unrecognized
72

compensation cost for share options and restricted share awards is expected to be recognized over a weightedaverage period of 3.69 years and 3.97 years, respectively. In future periods, we expect our share-basedcompensation expense to increase as a result of our unrecognized share-based compensation to be recognized asthese awards vest and as we issue additional share-based awards to attract and retain employees.
Recent Accounting Pronouncements
In December 2011, the FASB issued ASU 2011-11, “Disclosures about Offsetting Assets and Liabilities.”This update requires an entity to disclose both gross and net information about instruments and transactionseligible for offset in the statements of financial position as well as instruments and transactions executed under amaster netting or similar arrangement and was issued to enable users of financial statements to understand theeffects or potential effects of those arrangements on their financial position. This update is required to be appliedretrospectively and is effective for fiscal years, and interim periods within those years, beginning on or afterJanuary 1, 2013. In January 2013, the FASB issued ASU 2013-01, “Balance Sheet (Topic 210): Clarifying theScope of Disclosures about Offsetting Assets and Liabilities.” The amendments clarify that the scope of ASU2011-11 applies to derivatives accounted for in accordance with ASC 815, Derivatives and Hedging, includingbifurcated embedded derivatives, repurchase agreements and reverse repurchase agreements, and securitiesborrowing and securities lending transactions that are either offset in accordance with ASC 210-20-45 or ASC815-10-45 or subject to an enforceable master netting arrangement or similar agreement. The effective date is thesame as the effective date of ASU 2011-11. The adoption of this update did not have a material impact on ourconsolidated financial statements.
In July 2012, the FASB issued ASU 2012-02, “Intangibles—Goodwill and Other: Testing Indefinite LivedIntangible Assets for Impairment.” The update applies to all entities, both public and nonpublic, that haveindefinite-lived intangible assets, other than goodwill, reported in their financial statements. Per the Update, anentity has the option first to assess qualitative factors to determine whether the existence of events andcircumstances indicates that it is more likely than not that the indefinite-lived intangible asset is impaired. If,after assessing the totality of events and circumstances, an entity concludes that it is not more likely than not thatthe indefinite-lived intangible asset is impaired, then the entity is not required to take further action. Theamendments are effective for annual and interim impairment tests performed for fiscal years beginning afterSeptember 15, 2012. Early adoption is permitted, including for annual and interim impairment tests performed asof a date before July 27, 2012, if financial statements for the most recent annual or interim period have not yetbeen issued. The adoption of this update did not have a material impact on our consolidated financial statements.
In February 2013, the FASB issued ASU 2013-02, “Comprehensive Income: Reporting of AmountsReclassified Out of Accumulated Other Comprehensive Income.” This update does not change the currentrequirements for reporting net income or other comprehensive income in financial statements. However, thisupdate requires an entity to provide information about the amounts reclassified out of accumulated othercomprehensive income by component. In addition, an entity is required to present, either on the face of thestatement where net income is presented or in the notes, significant amounts reclassified out of accumulatedother comprehensive income by the respective line items of net income but only if the amount reclassified isrequired under U.S. GAAP to be reclassified to net income in its entirety in the same reporting period. For otheramounts that are not required under U.S. GAAP to be reclassified in their entirety to net income, an entity isrequired to cross-reference to other disclosures required under U.S. GAAP that provide additional detail aboutthose amounts. This update is effective prospectively for reporting periods beginning after December 15, 2012for public entities. The adoption of this update did not have a material impact on our consolidated financialstatements.
In March 2013, the FASB issued ASU 2013-05, “Parent’s Accounting for the Cumulative TranslationAdjustment upon Derecognition of Certain Subsidiaries or Groups of Assets within a Foreign Entity or of anInvestment in a Foreign Entity”. This update provides that when a reporting entity (parent) ceases to have acontrolling financial interest in a subsidiary or group of assets that is a nonprofit activity or a business (other than
73

a sale of in substance real estate or conveyance of oil and gas mineral rights) within a foreign entity, the parent isrequired to apply the guidance in Subtopic 830-30 to release any related cumulative translation adjustment intonet income. Accordingly, the cumulative translation adjustment should be released into net income only if thesale or transfer results in the complete or substantially complete liquidation of the foreign entity in which thesubsidiary or group of assets had resided. For an equity method investment that is a foreign entity, a pro rataportion of the cumulative translation adjustment should be released into net income upon a partial sale of such anequity method investment. However, this treatment does not apply to an equity method investment that is not aforeign entity. In those instances, the cumulative translation adjustment is released into net income only if thepartial sale represents a complete or substantially complete liquidation of the foreign entity that contains theequity method investment. Additionally, the amendments in this update clarify that the sale of an investment in aforeign entity includes both (1) events that result in the loss of a controlling financial interest in a foreign entity(that is, irrespective of any retained investment) and (2) events that result in an acquirer obtaining control of anacquiree in which it held an equity interest immediately before the acquisition date (sometimes also referred to asa step acquisition). Accordingly, the cumulative translation adjustment should be released into net income uponthe occurrence of those events. This update is effective prospectively for fiscal years (and interim reportingperiods within those years) beginning after December 15, 2013.
On April 22, 2013, the FASB issued Accounting Standards Update No. 2013-07, Presentation of FinancialStatements (Topic 205): Liquidation Basis of Accounting. This guidance addresses when and how an entityshould apply the liquidation basis of accounting. The amendments in this Update are being issued to clarify whenan entity should apply the liquidation basis of accounting. In addition, the guidance provides principles for therecognition and measurement of assets and liabilities and requirements for financial statements prepared usingthe liquidation basis of accounting. The amendments apply to all entities that issue financial statements that arepresented in conformity with U.S. GAAP except investment companies that are regulated under the InvestmentCompany Act of 1940 (the 1940 Act). The amendments are effective for entities that determine liquidation isimminent during annual reporting periods beginning after December 15, 2013, and interim reporting periodstherein. Entities should apply the requirements prospectively from the day that liquidation becomes imminent.Early adoption is permitted. The adoption of this update is not expected to have a material impact on ourconsolidated financial statements.
On July 18, 2013, the FASB issued ASU No. 2013-11, Presentation of an Unrecognized Tax Benefit Whena Net Operating Loss Carryforward, a Similar Tax Loss, or a Tax Credit Carryforward Exists (Income Taxes—Topic 740). This Update applies to all entities that have unrecognized tax benefits when a net operating losscarryforward, a similar tax loss, or a tax credit carryforward exists at the reporting date. An unrecognized taxbenefit, or a portion of an unrecognized tax benefit, should be presented in the financial statements as a reductionto a deferred tax asset for a net operating loss carryforward, a similar tax loss, or a tax credit carryforward, exceptas follows. To the extent a net operating loss carryforward, a similar tax loss, or a tax credit carryforward is notavailable at the reporting date under the tax law of the applicable jurisdiction to settle any additional incometaxes that would result from the disallowance of a tax position or the tax law of the applicable jurisdiction doesnot require the entity to use, and the entity does not intend to use, the deferred tax asset for such purpose, theunrecognized tax benefit should be presented in the financial statements as a liability and should not be combinedwith deferred tax assets. The assessment of whether a deferred tax asset is available is based on the unrecognizedtax benefit and deferred tax asset that exist at the reporting date and should be made presuming disallowance ofthe tax position at the reporting date. For example, an entity should not evaluate whether the deferred tax assetexpires before the statute of limitations on the tax position or whether the deferred tax asset may be used prior tothe unrecognized tax benefit being settled. The amendments in this update do not require new recurringdisclosures. The amendments in this update are effective for fiscal years, and interim periods within those years,beginning after December 15, 2013. Early adoption is permitted. The amendments should be appliedprospectively to all unrecognized tax benefits that exist at the effective date. Retrospective application ispermitted. We are currently evaluating the impact on our financial statements of adopting this update.
74

Under the Jumpstart Our Business Startups Act, or the JOBS Act, “emerging growth companies” can delayadopting new or revised accounting standards until such time as those standards apply to private companies. Wehave elected not to take advantage of this exemption from new or revised accounting standards and, therefore, wewill be subject to the same new or revised accounting standards as other public companies that are not “emerginggrowth companies.”
75

BUSINESS
Overview
We are a global fabless provider of analog and mixed-signal semiconductor solutions currently addressingthe home entertainment and cloud computing markets. Our expertise in analog and radio frequency solutions,digital signal processors and high speed interfaces serves as the foundation for our technology platform. Thesetechnical capabilities enable us to design high performance, low power semiconductors. In the homeentertainment market, our technology platform enables us to design highly integrated solutions with customizedsoftware and support for set-top boxes. Our solutions are designed to optimize signal processing performanceunder the challenging operating conditions typically found in emerging market environments, where oftenbroadcast signals coming into the set-top box may be weak, distorted or off-specification. Our solutions contain anumber of different technologies that allow for enhanced signal processing that improves overall video qualityunder the typically limited existing broadband network infrastructure in emerging markets. In the cloudcomputing market, we offer high performance, low power memory interface solutions that enable memory-intensive server applications. Our technology platform approach allows us to provide integrated solutions thatmeet the expanding needs of our customers through our continuous innovation, cost- and power-efficient designand rapid product development. Since our inception in 2004 through December 31, 2013, we have sold over300 million integrated circuits which have been shipped to over 160 end customers worldwide.
While analog and mixed-signal technology is applicable to a broad array of end markets, we have beenhighly selective in identifying our initial target end markets. We focus on markets which we believe havecompelling long-term growth prospects and are also characterized by complex product design, long life cyclesand stringent qualification requirements. We believe that these market characteristics coupled with oursignificant investment in our technology platform have created high barriers to entry for our set-top box solutionsin emerging markets. Initially, we developed commercial solutions for the home entertainment market to addressthe rapidly growing demand for television in China, Southeast Asia and other emerging markets. According toiSuppli, in 2012, 154 million set-top boxes were sold by Chinese manufacturers, primarily targeting emergingmarkets. According to iSuppli, the total number of set-top boxes sold by Chinese manufacturers is expected togrow to over 243 million. This would represent a compound annual growth rate of 12% from 2012 to 2016. Akey to our success in addressing the characteristics of the home entertainment market in emerging markets is ourability to provide integrated solutions with customized software and support, which we develop through closecollaboration with our end customers. Our collaborative approach allows us to develop extensive localizedknowledge of a large, fragmented market with diverse technical and service requirements, deepening ourcustomer relationships and yielding design wins across multiple product generations. Our end customers in thehome entertainment market include nine of the ten largest set-top box manufacturers in China as measured byunits sold in 2012.
More recently, we released our memory interface solutions to pursue opportunities arising from the rapidgrowth in the cloud computing market. Our close collaboration with key industry participants, including CPUmanufacturers, memory module manufacturers and server OEMs, has enabled us to successfully develop highperformance, low power memory interface solutions for cloud computing environments. We sell our memoryinterface solutions to memory module manufacturers, which incorporate our memory interfaces into dual in-linememory modules, or DIMMs, which are devices used to add memory capacity to a CPU. The most advancedcloud computing data servers operating today currently use DDR3 memory technology and load-reducedDIMMs, or LRDIMMs, which require memory interfaces that buffer data signals in addition to command andaddress signals. Memory interface vendors like us are unable to sell their solutions to memory modulemanufacturers without those solutions first being validated by manufacturers of CPUs. We are currently one oftwo LRDIMM memory buffer suppliers validated by Intel Corporation for DDR3 technology, the most prevalentindustry standard for memory integrated circuits used in servers. Sales of LRDIMM memory buffers for DDR3accounted for 27.9% and 32.3% of our revenue from memory interface solutions, and 1.7% and 3.0% of our totalrevenue, in 2012 and the nine months ended September 30, 2013, respectively. We expect revenue from our
76

LRDIMM memory buffers to increase as a percentage of our total revenue beginning in 2013, driven largely bygrowth in cloud computing. Achieving and maintaining Intel validation for our LRDIMM memory buffers isextremely important to our market position and the prospects of our memory interface solutions business, as theserver OEMs who adopt Intel’s server platforms will only purchase components of their servers from Intelvalidated vendors. Our customers in the cloud computing market include the world’s four largest DRAMmanufacturers and the world’s largest third-party DRAM module supplier as measured by 2012 revenues.
We offer ten solutions for use in the home entertainment market and two memory interface solutions for usein the cloud computing market. In 2012 and the nine months ended September 30, 2013, 94% and 91%,respectively, of our revenue was generated from sales of set-top box solutions targeting the home entertainmentmarket in emerging markets, while the remaining 6% and 9%, respectively, of our revenue was generated fromsales of memory interface solutions targeting the cloud computing market. Our solutions are built upon ourfoundation of 44 issued patents and an additional 48 pending patent applications. As of December 31, 2013, wehad 300 engineers in our research and development organization, of which 151 hold post-graduate engineeringdegrees. We sell our solutions principally through distributors to over 160 end customers worldwide. Ourrevenue has grown from $29.1 million in 2010 to $78.2 million in 2012, representing a compound annual growthrate of 64%, and from $54.5 million in the nine months ended September 30, 2012 to $75.4 million in the ninemonths ended September 30, 2013, representing a compound annual growth rate of 38%. We had a net loss of$8.5 million in 2010 and net income of $5.0 million in 2011, $18.3 million in 2012 and $16.8 million in the ninemonths ended September 30, 2013.
Our Target Markets
Our solutions primarily serve large target markets: (i) home entertainment, in particular set-top boxes foremerging markets; and (ii) the cloud computing market, in particular memory interface solutions for data centerservers.
Home Entertainment Market
In emerging markets, such as China, India, the Middle East, Latin America, Africa and Southeast Asia,television content is broadcast and accessed through satellite transmissions, cable network connections orterrestrial over-the-air transmissions. Viewers often access content from these three signal transmission systemsusing set-top boxes that are connected to televisions within the home. According to iSuppli, in 2012, 154 millionset-top boxes were sold by Chinese manufacturers. We believe that set-top boxes sold by Chinese manufacturersprimarily target China and other emerging markets. Of the 154 million units sold, 66% were exported outside ofChina. The number of set-top boxes sold by Chinese manufactures is expected to grow to over 243 million unitsin 2016 according to iSuppli, with 58% of these units expected to be exported. This would represent a compoundannual growth rate of 12% from 2012 to 2016.
A number of factors determine whether a viewer accesses television broadcasts through a satellite, cable orterrestrial connection including location, existence of wired cable infrastructure and desire for premium content.Within emerging markets, satellite television circumvents expensive capital deployment of wired infrastructure,which makes satellite broadcast a particularly attractive signal transmission solution in rural areas. As a result,the satellite set-top box market is the largest market in terms of total number of units sold by Chinesemanufacturers, with over 83 million units sold, representing 54% of the total number of units sold by Chinesemanufacturers in 2012, according to iSuppli. In addition, the market for high-definition satellite set-top boxesproduced by Chinese manufacturers is expected to grow from 17.3 million units in 2012 to 36.2 million units in2016, according to iSuppli. This would represent a compound annual growth rate of 20% from 2012 to 2016.Cable television is often accessed in these markets through local or regional providers who utilize multiplestandards that differ by region, resulting in a highly fragmented market. Given the proliferation of cableoperators, iSuppli estimates that the market for cable set-top boxes produced by Chinese manufacturers isexpected to grow 87% from 2012 to 2016, which is faster than the terrestrial and satellite set-top box markets.
77

The market for high-definition cable set-top boxes produced by Chinese manufacturers is expected to grow from7.0 million units in 2012 to 24.3 million units in 2016 according to iSuppli. This would represent a compoundannual growth rate of 37% from 2012 to 2016. Terrestrial broadcast is also a highly fragmented market withviewers having free access to limited, non-premium content. Across the satellite, cable and terrestrial set-top boxmarkets, individual operators typically have their own specialized system requirements that require customizedset-top box solutions.
Overall, television content access rates in emerging markets are lower than those in developed markets.However, a number of powerful trends are driving the rapid growth in television viewership. Increasingdisposable household income enables viewers who previously could not afford television access to purchase set-top boxes and access standard programming and premium content. In some emerging markets, such as China, thebroadcasting signal of television content is transitioning from analog to digital due to government sponsoredprograms requiring the replacement or addition of television access equipment. For example, China has a goal ofshutting down analog TV signals by 2015 and transitioning to digital TV in most regions. Similar to the U.S.market, analog broadcast in emerging markets is expected to transition completely to digital broadcast to enablemore channels and provide high-definition service, driving demand for digital signal receivers. As content qualityimproves and continues to shift from standard definition to high definition video, viewers in emerging marketsare expected to increasingly purchase set-top boxes that can receive and display high definition video content.High-definition set-top boxes represented only 28% of the total set-top box shipment in 2012, and iSuppliestimates the number of high definition set-top boxes sold to grow by 106% from 2012 to 2016. These trends,which are already prevalent in more advanced television markets, are currently taking hold in emerging marketsand are driving an increasing demand for set-top box solutions.
A number of key components within a set-top box drive performance, including the tuner, demodulator anddecoder. In order to optimize for superior and robust system performance and deliver cost-efficient solutions toset-top box manufacturers, semiconductor providers are integrating these functions into a single silicon package.The integration process requires significant analog and mixed-signal engineering expertise and deep system levelknowledge to ensure maximum functionality while at the same time delivering value to the manufacturer. Giventhe unique system requirements that individual network operators demand, a high level of collaboration isrequired between set-top box manufacturers and semiconductor providers. These integrated solutions also requirecustomized embedded software and field application support to ensure proper functionality and system levelperformance.
The key factor for home entertainment in emerging markets is delivering low cost entertainment to viewers.Set-top box solutions typically found in advanced television markets provide features that are not required byviewers in emerging markets and therefore are priced too high for emerging markets. Cost-effective yet high-performance solutions that can address the demanding operating conditions typically found in emerging marketenvironments are required. According to iSuppli, the market for semiconductors addressing set-top boxesmanufactured in China totaled $995 million in 2012, 74% of which was SoC solutions, and is expected to growto $1,316 million in 2016, of which 77% is expected to be SoC solutions with sales of integrated semiconductorsolutions outpacing the growth of the overall market from 2012 to 2016. This would represent a compoundannual growth rate of 7% from 2012 to 2016.
78

Cloud Computing Market
Global data center IP traffic will increase from 1.8 zettabytes in 2011 to 6.6 zettabytes in 2016, according toCisco. This would represent a compound annual growth rate of 30% from 2011 to 2016. The proliferation ofmobile devices, cloud-based software applications and streaming video pose significant challenges for networkdata centers. In addition, the rate at which data is consumed is growing much faster than the rate of mobile devicegrowth. The number of mobile devices will increase by three times from 2010 to 2015, and the amount of databeing consumed will increase six times during that same period, according to International Data Corporation, orIDC. The limited memory and processing speed of mobile devices has led to a majority of content viewed onmobile devices being accessed using cloud computing technology.
Global Data Center IP Traffic Growth
20110%
100%
1.8
2.6
3.3
4.1
5.2
6.6
200%
300%
400%
500%
700%
600%
2012 2013 2014 2015 2016
Zetabytes, CAGR 2011-2016: 30%
Source: Cisco Global Cloud Index
To meet the rising demands being placed on networks, data center operators have had to increase thenumber of servers within their facilities. It has been estimated that for every 120 tablets sold, an additional servermust be added to handle the traffic generated. To address the expanding demands on servers, next generationserver platforms utilize a higher number of CPUs while at the same time the computing performance of the CPUsthemselves is also increasing. Higher computing performance for CPUs has generally been accomplished byincreasing the number of cores within the CPU. The maximum number of cores per CPU has increased from onecore in 2004 to 16 cores for the latest CPU platform developed by Intel Corporation. We believe that as cloud-based applications increase, additional cores will be added to CPUs to address the need for greater computingperformance.
In cloud computing environments where a significant number of memory-intensive applications aresimultaneously run on a server, the processing performance of CPUs is limited by the amount of memoryavailable to each CPU. Additional memory capacity is required to ensure servers perform at optimal levels,which is critical for on- demand applications like cloud computing and virtualization. Memory capacity is addedto a server through the use of dual in-line memory modules, or DIMMs, which house dynamic random accessmemory, or DRAM. Memory performance is enhanced through the use of interface devices called memorybuffers that efficiently facilitate the rapid flow of data between the CPUs and memory. As the number of cores inthe CPU increases, the number of DIMMs required to achieve higher performance also increases. According to
79

IDC, the amount of DRAM per entry level server will increase from 45 gigabits per server in 2013 to 90 gigabitsper server in 2017. The need for greater amounts of DRAM to support high performance computing is expectedto drive the development of higher capacity DIMMs, where a greater amount of gigabit storage is placed on asingle DIMM. According to Gartner, the memory content within the overall server market is expected to grow to$3,129 million in 2016. This would represent a compound annual growth rate of 22% from 2012 to 2016.
The rise of computing power in a server also drives a significant increase in the energy costs required tooperate the server. Therefore, data center operators are increasingly focused on the power efficiency of eachcomponent within a server system and ascribe significant value to low power solutions that can drive energysavings without compromising performance.
CPU manufacturers create technology platforms that server OEMs use as the basis for their server design. ACPU manufacturer sets the specifications for many of the key components to be used in each generation of itsserver platforms. In the case of memory interface solutions for DIMMs, CPU manufacturers impose strictguidelines and generally qualify only a few vendors to provide memory interface solutions for their serverplatforms. With each new server platform released by CPU manufacturers, providers of memory interfacesolutions must be validated for use on the new platform. Validation only occurs after expending a considerableamount of development resources and successfully completing a rigorous validation process. Because a smallnumber of CPU manufacturers account for a significant amount of the CPUs used in cloud computingenvironments, this validation has a significant impact on memory interface vendors attempting to address thismarket. Once validation is received, memory interface vendors must then attempt to sell their solution to memorymodule manufacturers by competing against the limited number of companies who have also obtained validationby the leading CPU manufacturers.
The technical requirements for memory interfaces have also increased as historically memory performancewas enhanced by the use of register buffers which only buffered the command and address signals between theCPUs and DIMMs. However, increasing CPU performance and memory capacity now requires data signals to bebuffered in addition to command and address signals. DIMMs that include memory interface semiconductors thatbuffer the address, command and data signals are called load-reduced dual in-line memory modules, orLRDIMMs, which support higher data processing capacity on a single load and reduce electrical loading of theDRAM chips onto the memory bus. These memory buffers create higher degrees of complexity and greaterrequirements for performance, signal integrity and low power, and they command significantly higher averageselling prices than register buffers used in RDIMMs. Based on our knowledge gained through qualificationprocesses with CPU and memory module manufacturers, we believe higher capacity DIMMs with memorydensities equal to or above 32 gigabits will require the use of LRDIMM technology to ensure the highest serverperformance. Furthermore, new server platforms will need to expand the capacity for the number of DIMMs toaddress the increasing amount of data being transmitted over public and private networks. The number ofmachines using LRDIMM is expected to grow from 2.3 million in 2014 to 3.1 million in 2016, while the averagenumber of LRDIMMs used on a single machine is expected to grow from 4.8 in 2014 to 18.3 in 2016, accordingto Jon Peddie Research. The increase in number of machines using LRDIMMs and average number ofLRDIMMs per machine is expected to drive rapid growth in the estimated potential available market ofLRDIMM chipsets, which Jon Peddie Research estimates will increase from up to $312 million in 2014 to asmuch as $1,958 million in 2016, according to Jon Peddie Research. This would represent a compound annualgrowth rate of 151% from 2014 to 2016. However, industry forecasts and actual industry results are necessarilysubject to a high degree of uncertainty and risk, vary among industry participants, and may be lower thansuggested by these forecasts, particularly in a relatively new and evolving market such as the LRDIMM market.In terms of unit volume, Jon Peddie Research estimates the potential available market for LRDIMM chipsets willincrease from up to 18.4 million units in 2014 to as much as 93.2 million units in 2016. This would represent acompound annual growth rate of 125% from 2014 to 2016.
80

Key Requirements for Our Target Markets
Within the home entertainment market, set-top box manufacturers in emerging markets have the followingcritical needs which must be addressed when identifying semiconductor solutions for their products:
• Integration – The ability to combine the functionality of multiple semiconductors onto a singleintegrated circuit to increase signal integrity and performance, while shrinking component size andlowering overall costs.
• High level of field support – Given the fragmented market of network operators and the disparatenature of system requirements, set-top box manufactures require high levels of field support to ensurehigh performance across multiple networks.
• Exceptional performance and signal processing in challenging environments – Often in emergingmarkets, limitations in existing broadcast network infrastructure pose challenges, requiring the signalprocessing and performance capabilities for semiconductor solutions to be more robust than indeveloped markets.
• Embedded software and comprehensive system-level solutions – Customized embedded software cansignificantly improve performance and provide the set-top box manufacturer with a complete solution.
• Cost effective – In emerging markets, set-top boxes must be reasonably priced to ensure significantviewer acceptance, requiring solutions incorporated into set-top boxes to be cost effective.
• Ease of manufacture – By providing comprehensive semiconductor solutions, set-top boxmanufacturers can simplify their manufacturing processes.
Within the cloud computing market, server OEMs have the following critical needs which must beaddressed when identifying memory interface solutions for their products:
• High performance and low power – Solutions must optimize processing speed and accuracy whileminimizing energy requirements.
• Signal integrity – The ability to process high frequency signals ensuring an efficient link between theCPU and memory which ultimately drives superior performance.
• Built-in self-test – The ability for memory interface solutions to give customers the capability toefficiently validate their products.
To successfully compete in the home entertainment and cloud computing markets, semiconductor providersmust possess strong design capabilities in both analog and mixed-signal technologies as well as system leveldesign expertise. In addition design solutions must effectively meet the foregoing requirements and offer anattractive value proposition for both set-top box manufacturers and server OEMs alike.
Our Competitive Strengths
We believe our key competitive strengths include the following:
High performance low power analog and mixed-signal technology platform. Our technology platform is builtupon our foundation of high performance, low power expertise and is comprised of a versatile andcomprehensive set of hardware and software building blocks that serve both our home entertainment and cloudcomputing markets. For example in the cloud computing market, we are currently one of two LRDIMM memorybuffer suppliers validated by Intel Corporation for DDR3 technology, the most prevalent industry standard formemory integrated circuits used in servers. We believe our memory interface solutions consume significantlyless power than the only other Intel Corporation- validated DDR3 LRDIMM offering based on ourcommunications with our memory module manufacturer customers. We also believe our unique and proprietarylow power designs allow us to compete effectively against competitors who may utilize smaller semiconductor
81

process geometries that result in higher engineering and manufacturing costs and longer production cycles. Ourlow power designs are especially critical for certain applications such as data centers where the cost of energyoften exceeds the cost of the server over the lifetime of the server.
Deep technology expertise. Our research and development team of 300 professionals, of which 151 haveadvanced degrees, has extensive digital signal processing, radio frequency and analog and mixed-signal designexperience and includes engineers who have participated in the development of key industry standards such asJEDEC and MPEG. Our world-class management team, which oversees our entire team of engineers, has strongtechnical backgrounds and prior experience at leading US-based semiconductor companies. We have internallydeveloped our technology platform and our intellectual property portfolio consists of 92 issued and pendingpatents as of December 31, 2013. Our core system-level expertise and understanding of system requirementsenables us to optimize our product roadmap and identify attractive opportunities. We supplement our researchand development engineers with 55 application and field application engineers, who collaborate with ourcustomers to provide comprehensive solutions, including embedded software, that reinforce barriers to entry. Ourapplication expertise allows us to partner with industry leading OEMs to develop solutions for a broad range ofhome entertainment and cloud computing technologies.
High levels of integration. We believe our integrated solutions result in superior performance and lower materialcosts for our customers, enhancing our attractive value proposition. Our integrated solutions have significantadvantages over competing discrete products such as improving signal integrity, reducing size and ultimatelydriving superior system performance. Our technology optimizes signal paths from entry to exit, resulting inhighly efficient and robust performance. We believe our integrated, comprehensive and customized solutionshelp optimize performance and simplify manufacturing for our customers by reducing the number of discretecomponents within their systems and may lower overall system costs. For example, we believe we are currentlythe only Asia-based semiconductor provider to make an integrated tuner, demodulator and decoder into a singlechip in the satellite set-top box solutions market in which we compete. We believe that the enhancedperformance and cost-effectiveness created by the high level of integration in our solutions allows us to deliveradditional value to our end customers, which increases customer loyalty and positions us to benefit from demandfor future product upgrades from end customers. We believe this product cycle helps position us to sustain ourprofitability, which enables us to continue our investment in research and development activities in an effort tomaintain our competitive advantage.
Close collaboration and relationships with customers and industry participants. We primarily collaborate withour customers and industry participants through high levels of support from our field application engineers. Ourextensive customer interaction, combined with our deep understanding of our customers’ needs, fosters customerloyalty and increases visibility of evolving customer requirements and market opportunities within our business.Our close proximity to our customers, which are primarily located in Asia, also provides us with a betterunderstanding of local system requirements and allows us to achieve faster time to market with our solutions. Webelieve this close collaboration on a local level and deep knowledge of local market requirements is particularlyimportant due to the fragmentation and diverse technical and service requirements in the home entertainmentmarket in emerging markets, which not only create barriers to entry for competitors without significant resourceslocated in Asia, but also help to enhance customer loyalty. Our close collaboration with key industry participants,including server OEMs such as Dell Inc., Hewlett-Packard Company and International Business MachinesCorporation, has enabled us to successfully develop high performance memory interface solutions for cloudcomputing environments, proven by the fact that we are currently one of two LRDIMM memory buffer suppliersvalidated by Intel Corporation for DDR3 technology.
Broad customer base and attractive market opportunities in home entertainment. We sell our solutionsprincipally through distributors to over 150 set-top box customers worldwide. Our versatile home entertainmentsolutions allow us to address the satellite, cable and terrestrial television in emerging markets. Our end customersinclude nine of the ten largest set-top box manufacturers in China as measured by units sold in 2012, whomanufacture products optimized for end users in emerging markets. We believe the increase in TV viewership
82
penetration, individual disposable income in emerging markets and demand for greater home entertainmentoptions will continue to expand our addressable market. We believe our solutions with customized software andsupport are critical to our set-top box end customers and create a high degree of customer loyalty. We were aleading provider of semiconductors used in set-top boxes manufactured in China in terms of units sold in 2012,and we had the highest growth rate from 2009 to 2012 among digital set-top box solution providers with 10% orgreater market share in China in 2012, according to iSuppli.
Well positioned to capitalize on opportunities in cloud computing. We believe we offer the highest performanceand lowest power memory interface solutions for memory-intensive cloud computing applications. We arecurrently one of two LRDIMM memory buffer suppliers validated by Intel Corporation for DDR3 technology,the most prevalent industry standard for memory integrated circuits used in servers. We closely follow currentand next generation server and DRAM technology roadmaps to ensure our memory interface solutions promptlymeet their qualification windows. We believe we are the only integrated circuit supplier to produce Intel-validated solutions for every generation of memory buffers beginning with DDR2 advanced memory buffers. Wehave sold our memory interface solutions to Samsung Electronics, SK Hynix Semiconductor, Inc., ElpidaMemory, Inc. and Micron Technology, Inc., the world’s four largest memory module manufacturers as measuredby revenue generated in 2012, and to Kingston Technology, the world’s largest third-party DRAM modulesupplier as measured by revenue generated in 2012.
Our Growth Strategies
Our goal is to be the market leader in analog and mixed-signal semiconductor solutions for our targetmarkets. Key elements of our growth strategies include:
Invest to maintain technology leadership position across product lines. We intend to continue our focus onretaining and attracting high quality engineering staff and investing in our intellectual property portfolio tofurther extend our leading high performance, low power technologies in our markets. We believe our newproduct development initiatives will improve our overall average selling price and introduce increasingly diverserevenue streams. In our home entertainment market, the average selling price of our set-top box solutions hasincreased as we have integrated more functionality in our solutions. Additionally, we believe our average sellingprice will increase further as high definition grows in popularity in emerging markets and more complexfunctionality is added to our solutions. Similarly, in the cloud computing market, the average selling price for ourmemory interface solutions for LRDIMMs is significantly higher than our historical average selling prices formemory interface solutions for DIMMs. To supplement our existing engineering resources, we intend toopportunistically acquire engineering talent by adding new or complementary technologies, such as ourrecruitment of the research and development team from Hangzhou Motorola Technologies Limited in June 2011.
Strengthen our relationships with customers and industry participants. We believe our close relationships withour customers and industry participants provide us with strong visibility into their design cycles, allowing us tooptimize our engineering resources. We intend to continue to build upon and strengthen our collaborativerelationships to increase our customers’ dependence on us and drive greater demand for our solutions. We intendto continue educating set-top box manufacturers, memory module manufacturers and server OEMs on thebenefits of our high performance low power solutions to achieve future design wins. We also intend to continueparticipating in the development of key industry standards to better align our future roadmap.
Expand product offering and market share in emerging home entertainment markets. We will continue toleverage our engineering expertise to increase our market share in the globally fragmented home entertainmentmarket. For example, we intend to continue to increase our presence in emerging markets where advances intelevision-related standards and infrastructure are driving increased demand for our solutions. We intend tocontinue to introduce solutions with higher levels of product functionality and integration, similar to ourcomplete solution that combines a tuner, demodulator and decoder, as we seek to significantly increase our totalaverage selling price per set-top box. To date, substantially all of our revenue is derived from solutions servicing
83

the standard definition market. However, as broadcasting technologies and requirements continue to evolve, webelieve our business will experience growth within the digital TV market from solutions including demodulatorsfor second generation digital video broadcasting standards for satellite, terrestrial and cable, such as DVB-S2,DVB-T2, DVB-C2, as well as TV tuners. Furthermore, we believe the China Terrestrial Television Broadcaststandard, which will be required compliance for all TVs sold in China beginning in 2015, will help drive growthfor our solutions. Within the set-top box market, we believe significant opportunities exist to sell more completesolutions compliant with the DVB-T2 standard.
Continue to position ourselves for growth in the cloud computing market. We believe the growth in cloudcomputing and the resulting strain on existing server infrastructure will continue to drive the need for enhancedmemory interface solutions. We intend to provide validated solutions for future generations of memory buffersincluding DDR4. We believe our memory interface solutions will be able to efficiently address the increase inchannels, memory capacity and higher throughput speeds required by DDR4. We intend to further penetrate ourexisting customer base and collaborate with new memory module partners to increase our revenue. We alsointend to further develop our relationship with leading CPU manufacturers and remain aligned with their currentand next generation server and DRAM technology roadmaps.
Our Technology Platform
Our technology platform leverages our high performance and low power design expertise, proprietaryhardware building blocks and customized software to design analog and mixed-signal solutions for the set-topbox solutions for emerging markets and memory interface solutions for the cloud computing markets.Additionally, we provide a high level of field application support to ensure high performance of our solutions. Inthe home entertainment market, our technology platform enables us to design highly integrated solutions for set-top boxes used in the emerging markets. In the cloud computing market, our technology platform has enabled usto produce memory interface solutions that improve server performance while minimizing energy costs.
The foundation of our technology platform is our analog and mixed-signal design capabilities, which areused to optimize our solutions for high performance and low power. This expertise is combined with a number ofinternally developed building blocks that are used in the development of our high performance, low powersemiconductor solutions. The use of internally developed building blocks provides us with an advantage overcompetitors who are required to license third party solutions, which increases their costs. Furthermore, the use ofinternally developed building blocks allows us to maximize the integration of multiple functionalities into our
84

solutions and rapidly and cost-efficiently develop new semiconductor solutions by utilizing our building blocktechnologies across a range of offerings and multiple product generations. For example, if a particular solutiondesign requires a function that may be costly to develop, we can draw from our set of technology building blocksto cost-effectively address this required functionality. We believe this design flexibility provided by ourtechnology platform is a significant competitive advantage in the set-top box market as it allows us to moreeffectively satisfy diverse local market requirements. Our proprietary building blocks include analog and radiofrequency front end solutions, digital signal processors, SoC technologies, high-speed interfaces and memorybuffers. Additionally we develop customized software to increase the functionality of our solutions within ourcustomers’ products. Finally, to ensure optimal performance and build customer loyalty, we provide extensivefield application support to our customers.
Digital Filter
Digital Signal Processing Blocks Memory Buffer Blocks Analog and RF Blocks
SoC BlocksHigh-Speed Interface Blocks
Forward EqualizerSERDESTemperature SensorSignal IntegrityHigh-Speed Digital Design
ADCDACLNA
LDO RegulatorDC-DC SwitchingRegulatorDDR1, DDR2Physical interface
RF MixerRF Filter AGC Analog Filter PLLDLLCrystal Oscillator
DDR2/3/4 PHYDDR2/3/4 ControllerDDR2/3/4 Calibration
Carrier RecoveryCDR
DFE
Error Detection and CorrectionLDPC DecoderViterbi DecoderBit-Interleaved Coded ModulationChannel Estimation
DRAM Sony/Philips DigitalInterface Format
Transport StreamDe-multiplexer
ConvertorCPUStandby Processor2D/3D Graphics EngineJPEG AcceleratorAdvanced CADMA ControllerDDR Memory ControllerFlash Controller
Multi-Format VideoDecoderVideo De-InterlacerVideo Scalar/EnhancerVideo/OSD AlphaBlenderHD/SD TV EncoderAudio Sampling Rate
Integrated InterchipSoundInter-Integrated CircuitUARTIRDA Controller
EthernetUSBSDIOHDMI
Major Building Blocks for Montage Products
Our Solutions
We design, develop and market a range of analog and mixed-signal semiconductor solutions for set-topboxes targeting emerging markets as well as memory interface solutions for the cloud computing markets. Oursolutions comprise one or more analog and mixed-signal semiconductors combined with field application andother support services. In 2012, sales of our set-top box and memory interface solutions accounted for 94% and6%, respectively, of our total revenue. We expect sales of memory interface solutions to grow as a percentage ofour total revenue in 2013 and beyond.
Set-Top Box Solutions
We market a range of high performance and multi-standard compliant HDTV and SDTV semiconductorsolutions for set-top boxes, including tuners, demodulators and decoders as well as integrated solutions withcustomized software and support. We provide an integrated solution by combining our RF and analog hardwaredesign and customized software. Our integrated solutions can combine tuner, demodulator and decodingtechnology in a single semiconductor solution. We support our solutions with our extensive team of fieldapplication engineers who are geographically close to our customers and work extensively to deepen ourcustomer relationships. We believe our set-top box solutions deliver high performance because we offer strong
85

signal processing capabilities to address the challenges that are commonly found in emerging markets, where thelimited and oftentimes substandard broadcast network infrastructure requires more robust signal processing andperformance capabilities than in developed markets. We offer set-top box solutions for satellite, cable andterrestrial broadcasts, with a particular strength in satellite and cable set-top boxes aimed at emerging markets.While solutions for the satellite set-top box market have contributed, and we expect will continue to contribute, amajority of our set-top box solutions revenue, we expect solutions for the cable set-top box market to contributeto our revenue growth over the next several years.
Our tuner and demodulator solutions are compatible with both SDTV and HDTV signals. Currently, weprimarily market our decoder solutions for SDTV. We also launched an HDTV decoder solution in early 2013. In2010, we launched what we believe was the first integrated DVB-S tuner/demodulator/decoder solution in thehome entertainment market in which we compete. To date, substantially all of our set-top box solution revenuehas been generated from the SDTV market. We expect to launch at least three new set-top box solutions by theend of 2014, including an integrated satellite HDTV set-top box solution, an integrated cable HDTV set-top boxsolution and an SDTV set-top box solution supporting DVB-T2 broadcast standards.
We currently offer 11 set-top box solutions, supporting the following broadcast standards:
Memory Interface Solutions
By combining our expertise in high performance, low power mixed-signal semiconductor designtechnologies, we have designed and developed advanced memory interface solutions that provide ultra-lowpower consumption and high performance, including high speed processing as well as signal integrity, for use indata center servers. We design our memory interface solutions in close collaboration with our memory modulemanufacturer end customers as well as server OEMs and CPU manufacturers to meet required designspecifications. We believe our memory interface solutions are high performance, because they can achieve bettersignal integrity than our competitors in our market, which allow our solutions to efficiently operate at higherspeeds thereby increasing memory capacity and improving server performance. Additionally, our built-in self-test capabilities help memory module manufacturers and server OEMs to rapidly validate memory performance.
Our current memory interface solutions include register buffers for DDR3 RDIMMs and memory buffersfor DDR3 LRDIMMs. All our memory interface solutions for DDR3 are JEDEC standard-compliant, and havepassed component- and system-level validation by Intel Corporation and other industry-leading companies.Based on our internal testing, we believe our current generation of LRDIMM solutions consume up to 30% lesspower than our primary competitor. We are working closely with JEDEC and other key industry participants,
86

including leading CPU and memory module manufacturers, to develop the first generation of DDR4-compliantmemory interface solutions, including a registering clock driver and a data buffer. In July 2013, we introducedour DDR4 registering clock driver and data buffer for DDR4 RDIMMs and LRDIMMs, which we believe is theindustry’s first JEDEC 0.92 specification-compliant DDR4 registering clock driver and data buffer.
Our memory interface solutions that are currently in volume production include:
Standards/Applications Speed Intel/OEM Validation
Register Buffer 1600 Mbps and 2133 Mbps ✓Memory Buffer -Generation 2 1600 Mbps and 1866 Mbps ✓
Our memory interface solutions that are sampling include:
Standards/Applications Speed Intel/OEM Validation
Register 2400 Mbps In processData Buffer 2400 Mbps In process
Sales and Distribution
In line with general market practice, we typically sell our set-top box solutions to our end customers throughdistributors. Once our end customers assemble various components into set-top boxes, the set-top boxes are thensold to set-top box retailers or cable network operators. Our set-top box solutions have been incorporated in set-top boxes sold globally to retail outlets and cable network operators in China, Southeast Asia, India, the MiddleEast, Africa and other emerging market geographies. The diagram below shows how our set-top box solutionsare sold to our customers and reach network operators and retailers:
DistributorSTB
Manufacturer
NetworkOperator/Retailer
While our set-top box solutions are typically sold through distributors, we collaborate with our customersand industry participants through high levels of support from our field application engineers.
Sales through our distributors accounted for 82% of our total revenue in 2012. Sales through our threelargest distributors, LQW Technology Company Limited, Qinuo International Co., Ltd. and China ElectronicAppliance Shenzhen Co., Ltd., accounted for 50%, 18% and 9%, respectively, of our total revenue in 2012. Wetypically enter into distribution agreements with our distributors, with each distributor covering a definedcustomer base and/or geographic area. In addition, our distribution agreements are typically negotiated andentered into on an annual basis and prohibit the distributor from selling products or solutions competing withours. Our distributors primarily handle the logistics and payment in connection with our sales for us, but wemaintain direct relationships, both pre- and post-sale with the end customers.
We typically sell our memory interface solutions directly to memory module manufacturers.
End Customers
We sell our set-top box solutions, directly and through distributors, to end customers who are manufacturersof set-top boxes or televisions in China and internationally and to cable network operators in China. Our set-topbox solutions have been shipped to more than 150 end customers, including nine of the ten largest set-top box
87

manufacturers in China as measured by units sold in 2012. In 2012, only one of our set-top box end customers,Shenzhen Changhong Digital Technology Limited, accounted for more than 10% of our total revenue for theyear, and our five largest end customers accounted for in aggregate 41% of our total revenue for the year.
We sell our memory interface solutions to leading memory module manufacturers globally. We have soldour memory interface solutions to Samsung Electronics, SK Hynix Semiconductor, Inc., Elpida Memory Inc.,and Micron Technology, Inc., the world’s four largest memory module manufacturers as measured by revenuegenerated in 2012, and to Kingston Technology, the world’s largest third-party DRAM module supplier asmeasured by revenue generated in 2012.
Sales to end customers in Asian countries accounted for 96%, 97% and 94% of our total revenue in 2010,2011 and 2012, respectively. Although our end customers are primarily manufacturers located in Asia, ourintegrated circuits are incorporated into finished products sold globally.
Marketing and Customer Support
We work directly with our end customers to provide them with application-specific product information fortheir system design, engineering and procurement groups. Our technical marketing, sales and field applicationengineers actively engage potential customers during their design processes to introduce them to our productcapabilities and target applications. We design solutions in an effort to meet the increasingly complex andspecific design requirements of our end customers.
We work with our set-top box end customers to design integrated solutions, including both hardware andsoftware applications, to maximize the performance and efficiency of their set-top boxes. When we provideintegrated, customized solutions, we typically undertake a multi-month sales and development process with theend customer’s system designers and management. Volume production can begin from several months to up toone year after an end customer confirms its decision to use our solutions, depending on the complexity of the endcustomer’s product and other factors. Once one of our solutions is incorporated into an end customer’s design, itis likely to be used for the life cycle of the customer’s product. We believe this to be the case because a redesignwould generally be time-consuming and expensive. We support our solutions with our extensive team of fieldapplication engineers who are geographically close to our end customers and work extensively to deepen ourrelationships with them. Moreover, our extensive customer interaction, combined with our deep understanding ofour end customers’ needs, fosters customer loyalty and increases visibility within our business.
In the cloud computing market, our sales and marketing team maintains relationships with technologyleaders, which enables us to anticipate and solve next generation challenges facing our customers. We alsoparticipate actively in setting industry standards with organizations such as JEDEC to have representation in thedefinition of future market trends, thereby helping us to maintain our leadership position in the memory interfacemarket.
Research and Development
We believe that our future success depends on our ability to introduce enhancements to our existingproducts and to develop new products as well as continue to develop and enhance our technology platform tomeet the rapidly changing needs and requirements of our end customers. For our set-top box solution offerings,we are currently focused on enhancing our existing integrated solutions to serve HDTV applications. For ourmemory interface solution offerings, we are currently focused on DDR4 memory interface solutions. We havedevoted substantial resources to our research and development activities, and have assembled a team of highlyqualified semiconductor and embedded software design engineers who have strong design expertise in highperformance and low power analog and mixed-signal semiconductors and related hardware and softwareapplication design.
88

Our engineering design teams are located in the United States, in Shanghai, Suzhou and Hangzhou in Chinaand in Taipei and Hsinchu in Taiwan. As of December 31, 2013, we had 300 employees in our research anddevelopment department, representing approximately 64% of our total employees. More than half of ourengineers hold advanced degrees. These engineers and designers are involved in advancing our coretechnologies, as well as applying these core technologies to our product development activities across a numberof areas including consumer electronics, multi-media, telecommunications transport systems, enterprisenetworking equipment, data centers and enterprise servers, storage platforms and test and measurement systems.In 2010, 2011, 2012 and the nine months ended September 30, 2013, our research and development expenseswere $11.1 million, $13.7 million, $17.6 million and $19.1 million, respectively.
All of our currently offered solutions and substantially all of the building blocks comprising our technologyplatform have been designed in-house with core technology based on our internally developed intellectualproperty. While we use commercially available simulation tools to predict overall system performance based onthe functionality, architecture and design of our semiconductors, we do not license any material intellectualproperty from third parties. After our semiconductors are manufactured, we perform system measurements andrefine our design to improve the semiconductors’ performance and predictive ability. As a result, our designmethodology has improved over time and we have been able to very accurately predict overall systemperformance prior to fabricating a part.
Our research and development team works closely with our sales and marketing and manufacturing teams todevelop new and commercially attractive products. We have completed our development and have begun customerqualification for a high-definition decoder. We commenced volume production of this set-top box solution in 2013. Weare also currently in the advanced stages of development of our DDR4 register and memory buffers. We are workingwith key industry participants, including JEDEC, to develop these DDR4 memory interface solutions, and we currentlyexpect to begin volume production of this product by the end of 2014.
Manufacturing
We operate a fabless business model and use third-party foundries and assembly and test manufacturingcontractors to manufacture, assemble and test our semiconductor products. For quality control purposes, we alsoinspect and test the final products manufactured by the third party suppliers in our laboratories by way ofsampling before the products are delivered to our distributors or customers. This outsourced manufacturingapproach allows us to focus our resources on the design, development and marketing of our solutions and reducesoverhead and our exposure to cyclicality risks. In addition, we believe outsourcing manufacturing and assemblyactivities provides us the flexibility needed to respond to new market opportunities, simplifies our operations andsignificantly reduces our capital requirements.
We subject our third-party manufacturing contractors to qualification requirements in order to meet the highquality and reliability standards required of our products. We carefully qualify each of our partners and processesbefore applying the technology to our products. Our engineers work closely with our foundries and othercontractors to increase yield, lower manufacturing costs and improve product quality.
Wafer Fabrication. We currently maintain active relationships with a number of world-class semiconductorfoundries. We choose the semiconductor process and foundry that we believe provides the best combination ofperformance and cost-effectiveness attributes for any particular product. For each of our products, we typicallyutilize a single foundry for semiconductor wafer production. Nonetheless, to ensure adequate wafer supply, wealso take into account technologies of other foundries during our design process to ensure that the production ofour products can be transferred to other backup foundries if needed. Our principal foundries are SemiconductorManufacturing International Corporation in China, Fujitsu Semiconductor Limited in Japan and UnitedMicroelectronics Corporation in Taiwan.
89

Packaging, Assembly and Testing. Upon the completion of processing at the foundry, the finished wafers areshipped to our third-party assemblers for packaging, assembly and testing. Currently, our principal packaging,assembly and testing contractors are STATS ChipPAC Ltd. in Singapore and Korea and Siliconware PrecisionIndustries Co., Ltd. in Taiwan and Suzhou, China. The products are then shipped to us, where we also performtesting in our Shanghai, Suzhou and Hangzhou facilities by way of sampling before delivery to our endcustomers.
We are committed to maintaining the highest level of quality in our products. Our objective is that ourproducts meet all of our customer requirements, are delivered on-time and function reliably throughout theiruseful lives. As of the date of this prospectus, we have lowered our defective parts per million, or DPPM, tobelow 100. In addition, we have achieved an on-time delivery rate of more than 98.5%. As part of our totalquality assurance program, our quality management system has been certified to ISO 9001:2008 standards in2006. Our manufacturing partners are also ISO 9001 certified.
Competition
The markets in which we operate are highly competitive. We compete with numerous semiconductorcompanies, some of which have greater financial and other resources with which to pursue technologydevelopment, product design, manufacturing, marketing, sales and distribution of their products. Currently, ourcompetitors range from large, international companies offering a wide range of semiconductor solutions tosmaller companies specializing in set-top box or memory interface solutions. Our primary competitors in the set-top box market include semiconductor companies that sell to emerging markets such as HiSilicon TechnologiesCo., Ltd., ALi Corporation, RDA Microelectronics, Inc., Airoha Technology Corporation andSTMicroelectronics NV, as well as smaller semiconductor design companies based in China. We believe that weprovide a more comprehensive suite of set-top box solutions for emerging markets than any of our Asia-basedcompetitors. Our market share for set-top box chipset solutions in China in terms of units sold was 7% in 2009and 14% in 2012, according to iSuppli. Our competitors in the memory interface market include InphiCorporation, Integrated Device Technology, Inc. and Texas Instruments Inc.
Our ability to compete successfully depends on elements both within and outside of our control, includingindustry and general economic trends. Intense competition could result in price pressure, reduced profitabilityand loss of market share, any of which could materially and adversely affect our business, revenue and operatingresults. Moreover, our markets are characterized by evolving technologies, industry standards and customerpreferences.
We compete or plan to compete in different target markets to various degrees on the basis of a number ofprincipal competitive factors, including but not limited to:
• our ability to offer integrated, high performance and low power semiconductor solutions thatdifferentiate us from our competitors;
• our success in identifying and developing new and emerging technologies, solutions and markets;
• the performance and cost-effectiveness of our solutions;
• our ability to provide innovative and high-quality functionality and features, including integratedsolutions, and superior service;
• our ability to recruit high-level talent, including engineers and chip designers;
• our ability to maintain and grow our relationship with key industry players; and
• our ability to protect our intellectual property.
90
Specifically, in the home entertainment market we compete primarily on the basis of our customization andfield application support capabilities, level of integration of our solutions, performance and price. In the cloudcomputing market, we primarily compete on the basis of high performance, power efficiency and our trackrecord of achieving validation for our memory solutions with leading CPU manufacturers. We believe wecompete favorably with respect to these factors.
Backlog
Historically, our sales are on a purchase order basis rather than long-term purchase commitments. As wetypically ship our semiconductors within two weeks of receiving a purchase order, we have not experiencedmaterial backlog orders.
Intellectual Property
We rely on a combination of intellectual property rights, including patents, trade secrets, copyrights andtrademarks, and contractual protections, to protect our core technology and intellectual property. As ofDecember 31, 2013, among other jurisdictions, we had 23 and 21 issued patents in the United States and China,respectively, and 16, 30 and two patent applications pending in the United States, China and Taiwan, respectively.Among these 92 issued and pending patents, 46 of them relate to technology and design features of our set-top boxsolutions, 40 of them relate to technology and design features of our memory interface solutions and six are relatedto Wi-Fi technology. There is no assurance that our patent applications will result in the issuance of any patents.
We generally control access to and use of our confidential information through the use of internal andexternal controls, including contractual protections with employees, contractors and customers. We rely in parton the PRC, United States and international copyright laws to protect our design work. All employees andconsultants are required to execute confidentiality agreements in connection with their employment andconsulting relationships with us. We also require them to agree to disclose and assign to us all inventionsconceived or made in connection with the employment or consulting relationship.
Legal Proceedings
We have not been, and are not currently a party to, nor are we aware of, any legal proceedings, investigationor claim which, in the opinion of our management, is likely to materially and adversely affect our business,financial condition or results of operations. We may become subject to legal proceedings, investigations andclaims incidental to the conduct of our business from time to time.
Employees
As of December 31, 2013, we had 468 employees, the significant majority of which are based in China orTaiwan. Among the 468 employees, 300 were in research and development, 95 were in sales and marketing, 28 werein operations and 45 were in general and administrative. Montage Technology (Shanghai) Co., Ltd. maintains a laborunion and entered into a collective bargaining agreement with its employees in June 5, 2012 pursuant to PRC law. Weconsider relations with our employees to be good and have never experienced a work stoppage.
Facilities
We currently lease our principal executive offices in Shanghai under four lease agreements totaling 55,311square feet of office space in which the lease agreements expire on March 31, 2016 and December 31, 2014,respectively. We also lease 24,035 square feet and 8,467 square feet in Suzhou and Hangzhou, respectively, forour operations in China. The current leases are expected to expire in May 2014 and May 2016, respectively. OurU.S. subsidiary currently leases 2,237 square feet of office space in San Jose, California under a lease thatexpires on September 30, 2013. In addition, our U.S. subsidiary leases 4,654 square feet of office space with a
91

lease term from September 1, 2013 to November 30, 2018. Our Taiwan subsidiary currently leases office spaceof 11,302 and 4,258 square feet of office space in Taipei and Hsinchu, Taiwan, respectively. The current leasesare set to expire on October 31, 2013 and November 30, 2015, respectively. Our Hong Kong subsidiary currentlyleases 1,175 square feet of office space in Kowloon, Hong Kong under a lease that expires on May 6, 2014. OurMacao subsidiary currently leases 2,594 square feet of office space in Macao under a lease that expires onApril 23, 2015. We believe that our current facilities are sufficient to meet our needs for the foreseeable future. Inaddition, we expect to renew our existing lease agreements shortly before their respective expiration dates and donot foresee any obstacles in the renewal of relevant agreements.
Corporate History and Structure
We established Montage Technology Group Limited in the British Virgin Islands in March 2004 as theoffshore holding company of our business operations. In April 2006, Montage Technology Group Limited wasregistered in the Cayman Islands by way of continuation.
In May 2004, we established Montage Technology (Shanghai) Co., Ltd., or Montage Shanghai, as our wholly-owned PRC subsidiary to conduct our business in the PRC. With the expansion of our business, we subsequentlyestablished additional subsidiaries in the Cayman Islands, California, Hong Kong China and Taiwan.
In October 2010, we established Montage Technology Hong Kong Limited to hold the equity interests ofour PRC operating subsidiaries. In May 2013, we acquired 100% of the equity interest of Sonoma MacaoCommercial Offshore Limited, or Sonoma Macao, a company incorporated in the Macao Special AdministrativeRegion of the People’s Republic of China without any active operations, from Triple Win Holdings Inc. for totalcash consideration of HKD1.0 million. The purpose of this acquisition was to become eligible for preferential taxpolicies offered by the Macao government. We have changed Sonoma Macao’s name to Montage TechnologyMacao Commercial Offshore Limited, or Montage Macao. As a result, Montage Macao will become ourprincipal operating entity outside China going forward.
The following diagram illustrates our corporate structure and the place of incorporation of each named entity:
100%
100% 100%
100%
Montage TechnologyGroup Limited
(Cayman)
Montage TechnologyHoldings Company Limited
(Cayman)
100%
Montage Semiconductor HongKong Company Limited(1)
(Hong Kong)
Montage Technology, Inc.(USA)
Montage SemiconductorHoldings Company Limited(1)
(Cayman)
Montage Technology (Taiwan) Co., Ltd.
(Taiwan)
Montage TechnologyCompany Limited
(Hong Kong)
100%
100%
Montage Technology HongKong Limited(Hong Kong)
Montage Technology (Shanghai) Co., Ltd.
(PRC)
Suzhou MontageMicroelectronic Technology
Co., Ltd. (PRC)
100%
100%
100%
Montage Technology MacaoCommercial Offshore Limited
(Macao)
(1) These subsidiaries are in the process of deregistration as part of our reorganization, which is expected to becompleted in the first half of 2014.
92

Our business in China is not subject to any restrictions on foreign investment under the PRC Catalog forGuidance of Foreign Investment Industries or other applicable regulations. Our principal business within China,the design of integrated circuits, is categorized as an encouraged industry under the PRC Catalog for Guidance ofForeign Investment Industries.
93

MANAGEMENT
Executive Officers, Directors and Significant Employees
Below is a list of our executive officers, directors and significant employees as of December 31, 2013, theirrespective ages and positions and a brief account of the business experience of each of them.
Name Age Position
Executive Officers and Directors:Howard C. Yang . . . . . . . . . . . . . . . . . . 56 Chairman of the Board and Chief Executive OfficerStephen Tai . . . . . . . . . . . . . . . . . . . . . . 42 Director and PresidentMark Voll . . . . . . . . . . . . . . . . . . . . . . . 59 Chief Financial OfficerLeechung Yiu . . . . . . . . . . . . . . . . . . . . 58 Chief Technology Officer, Senior Vice PresidentBill Franciscovich . . . . . . . . . . . . . . . . . 53 Vice President, Worldwide SalesJack Gu . . . . . . . . . . . . . . . . . . . . . . . . . 56 Vice President, China SalesKenneth Chew . . . . . . . . . . . . . . . . . . . . 54 Vice President, OperationsYung Kuei (YK) Yu(2)(3) . . . . . . . . . . . . 48 DirectorCathy Yen(2)(3) . . . . . . . . . . . . . . . . . . . . 48 DirectorJung-Kung (Jackie) Yang(1)(2) . . . . . . . . 47 DirectorEdward Way(1) . . . . . . . . . . . . . . . . . . . 68 DirectorCharles G. Sodini(1)(3) . . . . . . . . . . . . . . 61 Director
Significant Employees:Cheng Tie Chen . . . . . . . . . . . . . . . . . . 58 Vice President, Engineering (SoC Products)Shawn Si . . . . . . . . . . . . . . . . . . . . . . . . 47 Vice President, Engineering (STB Front-end Products)Zhongyuan Chang . . . . . . . . . . . . . . . . . 54 Vice President, Engineering (Memory Interface Products)SeungJin (SJ) Seo . . . . . . . . . . . . . . . . . 49 Vice President, Engineering (Validation and Applications)Phoebe Su . . . . . . . . . . . . . . . . . . . . . . . 41 Vice President, Finance and Administration
(1) Member of Audit Committee(2) Member of Compensation Committee(3) Member of Nominating and Corporate Governance Committee
Dr. Howard C. Yang is one of our founders and has served as our Chairman of the board of directors and ChiefExecutive Officer since our inception. Prior to co-founding us, he was Vice President at Integrated DeviceTechnology Inc., a semiconductor design company, from 2001 to 2004. In 1997, Dr. Yang co-founded NewaveSemiconductor Corp., an integrated circuit design company located in China. In 2001, Newave merged intoIntegrated Device Technology Inc., which was ranked China’s top ten mergers of the year by China Merger andAcquisitions Yearbook (2002). Prior to Newave, Dr. Yang held various positions at Shanghai Belling in Shanghai aswell as National Semiconductor Corp., Chips and Technology Inc. and Pericom Semiconductor Corp. in SiliconValley. He has been an IEEE Fellow since January 2010 and was selected into the National “Thousand TalentsProgram,” a program organized by the Central Coordination Committee on the Recruitment of Talents in China torecruit top overseas scientists and back to China. He has received several awards for his work, including IEEE CASIndustrial Pioneer Award and Magnolia Gold Award from the mayor of Shanghai for his pioneering contributions inChina’s integrated circuit design industry. Dr. Yang holds both master’s and Ph.D. degrees in Electrical Engineeringfrom Oregon State University. We believe that Dr. Yang should serve as a member of our board of directors due tothe perspective and experience he brings as one of our founders, Chairman, and CEO, and his many years ofexperience in the semiconductor industry. Dr. Yang was designated to serve as a member of our board of directorsby our ordinary shareholders.
Stephen Tai is one of our founders and has served as a member of our board of directors and our Presidentsince our inception. Mr. Tai has over 18 years of experience in semiconductor architecture, design andengineering management. Prior to co-founding us, Mr. Tai was the Director of Engineering Research andDevelopment and a founding core team member at Marvell Technology Group Ltd., a semiconductor company,from 1995 to 2003. Prior to Marvell, he was a senior design engineer at Sigmax Technology, a CD-ROMcontroller semiconductor company, from 1994 to 1995. Mr. Tai holds a master’s degree in Electrical Engineering
94

from Stanford University and a bachelor’s degree in Electrical and Computer Engineering from The JohnsHopkins University. We believe that Mr. Tai should serve as a member of our board of directors due to theperspective and experience he brings as one of our founders and his years of experience in the semiconductorindustry. Mr. Tai was designated to serve as a member of our board of directors by our ordinary shareholders.
Mark Voll has served as our Chief Financial Officer since June 2012. Mr. Voll has more than 25 years ofexperience in finance and accounting and served as Chief Financial Officer in a number of public and privatehigh technology companies. Prior to joining us, Mr. Voll served as Chief Financial Officer of Invensense, Inc., aprovider of MEMS devices for consumer electronics products, from June 2010 to January 2011. Prior toInvensense, Mr. Voll was Chief Financial Officer of Techwell, Inc., an analog semiconductor company, fromNovember 2005 to June 2010. Prior to that, he served as Chief Financial Officer for Monolithic SystemTechnology, Inc., an intellectual property semiconductor company, from June 2002 to November 2005. Mr. Vollholds a bachelor’s degree in Business Administration from Providence College.
Dr. Leechung Yiu joined us in October 2008 as Senior Vice President and Chief Technical Officer. Dr. Yiuhas over 25 years of product development experience in the integrated circuit design industry in a broad range ofareas including storage, communication and multimedia applications. Before joining us, Dr. Yiu served as VicePresident of Engineering at Trident Microsystems, Inc., a digital TV chipset manufacturer, from 2007 to 2008.Dr. Yiu also served as VP of Engineering at Shanghai Huahong International, an integrated device manufacturer,from 2005 to 2007, Sunext Technology Company Limited, a supplier of semiconductor products for Optical DiscDrive applications, from 2003 to 2005 and Marvell Semiconductor, Inc., a fabless semiconductor company, from1999 to 2003. In 1997, Dr. Yiu co-founded Newave Semiconductor Corp., an integrated circuit design companyin China, and served as its Vice President of Engineering from 1997 to 1999. Dr. Yiu received both Ph.D. andmaster’s degrees in Electrical Engineering from University of California at Berkeley, and a bachelor’s degree inElectrical Engineering from National Taiwan University.
Bill Franciscovich joined us in January 2007 as a Vice President, Worldwide Sales. Mr. Franciscovich hasover 30 years of experience in semiconductor sales, marketing and manufacturing. Prior to joining us,Mr. Franciscovich served as Vice President of Worldwide Sales at Power-One Inc., a provider of powerconversion and power management solutions, from 2004 to 2006. At Integrated Device Technology, Inc., or IDT,a semiconductor design company Mr. Franciscovich held various executive sales, product-line management andmarketing positions from 1986 to 2003. Prior to IDT, Mr. Franciscovich held sales positions with ZeusElectronics (now a division of Arrow Electronics, Inc.) , an electronic components supplier, from 1984 to 1986and Motorola Semiconductor, a semiconductor company, from 1982 to 1984. Mr. Franciscovich holds abachelor’s in Materials Science Engineering from Cornell University.
Jack Gu joined us in February 2006 as Vice President, China Sales. Mr. Gu has over 25 years of experiencein sales, manufacturing and engineering management in the electronics industry. Prior to joining us, he was amember of the board of directors and Vice President at CEC-View Company Limited in Beijing, a video displaycompany, from 2005 to 2006. Prior to CEC-View, he was the Vice President of Marketing & Sales at ShanghaiBelling Co., Ltd, an integrated circuit IDM company, from 1998 to 2005. Mr. Gu holds a master’s degree inManagement Science and Engineering from Shanghai Jiaotong University.
Kenneth Chew joined us in March 2005 as a Vice President, Operations. Mr. Chew has over 20 years ofexperience in semiconductor manufacturing and engineering project management. Prior to joining us, he was theDirector of Operations and founding team member at Marvell Asia Pte Ltd, a semiconductor company andsubsidiary of Marvell Technology Group Ltd., in Singapore, from 1997 to 2005. Prior to Marvell, he held variousengineering manufacturing and project management positions at Adaptec Singapore, a semiconductor company,from 1996 to 1997, and at Silicon Systems Singapore, a semiconductor company, from 1990 to 1996. Mr. Chewholds a master’s degree in Electrical Engineering from Nanyang Technological University of Singapore and abachelor’s degree in Electronics and Computer Engineering from University of Iowa, USA.
95
Yung Kuei (YK) Yu has served as a member of our Board of Directors since April 2013. Mr. Yu is a VicePresident at TLC Capital Corporation, the venture capital arm of semiconductor foundry United MicroelectronicsCorporation, and has been with TLC Capital since December 2005. Prior to joining TLC Capital, Mr. Yu was anAssociate Vice President of the Direct Investment Department at China Development Industrial Bank, from 1998to 2005. Prior to working at China Development Industrial Bank, Mr. Yu was an Analyst with Asia PacificInvestment Co. from 1995 to 1998. Mr. Yu holds a master’s degree in mechanical engineering from NationalChiao Tung University and a bachelor’s degree in mechanical engineering from National Cheng KungUniversity. Mr. Yu has served as a director of Alliance Optotek Ltd., a LED lighting solution company, since2006, and BCom Electronic Inc., an in-car entertainment company, since 2007. Mr. Yu was a director ofSercomm Ltd., a broadband and wireless networking equipment company, from 2007 to 2008 and a director ofWaltop Ltd., a pen-input solutions company, from 2006 to 2011. We believe that Mr. Yu should serve as amember of our Board of Directors due to his many years of experience as a private equity investor with particularexperience in high and new technology companies and his engineering background.
Cathy Yen has served as a member of our board of directors since June 2006. Ms. Yen has served as aPartner of AsiaVest Partners, TCW/YFY Ltd., a venture capital firm, since 2000. Prior to joining AsiaVest,Ms. Yen was with Fortune Capital, as Senior Manager from 1999 to 2000, Crimson Ventures/China Trust Bank,as Vice President, from 1997 to 1999 and Global Financial Services, as Vice President, from 1990 to 1997.Ms. Yen has served as a director of Anyka Technologies Corporation, a fabless integrated circuit designcompany, since 2005, Sundia MediTech Group, Ltd., a pharmaceutical and biotech research and developmentoutsourcing company, since 2007 and Dynamic Advertising Channels Holding Ltd., an outdoor mediacommunications agency, since 2011. Ms. Yen was previously a director of Chipmore Technology CorporationLimited from 2003 to 2007. Ms. Yen holds master’s degree in Business Administration and a bachelor’s degreein Economics from National Taiwan University. We believe that Ms. Yen should serve as a member of our boardof directors due to her accounting and private equity investing experience. Ms. Yen was designated to serve as amember of our board of directors by our Series B-1 and Series B-2 preferred shareholders.
Jung-Kung (Jackie) Yang has served as a member of our board of directors since September 2007. In April2007, Mr. Yang co-founded TransLink Capital, a venture capital firm, and currently serves as a ManagingDirector. Before starting TransLink, Mr. Yang was Senior Vice President at UMC Capital, the venture capitalarm of semiconductor foundry United Microelectronics Corporation, from 2002 to 2007. Mr. Yang has served asa director of Parade Technologies LTD, a fabless semiconductor company, since December 2005, SiFotonicsTechnologies Co., Ltd., a fabless photonic integrated circuit company, since November 2009, WinkingEntertainment LTD., an online game development and outsourcing company, since July 2011, GlobalCommunication Semiconductors, LLC, a semiconductor wafer foundry, since March 2012, Adwo, a mobile adplatform in China, since June 2012, and Memoright Corporation, a provider of solid state drive solutions andsupport, since November 2012. Mr. Yang also previously served as a director for SandForce, a fablesssemiconductor company, from October 2009 to December 2011 and Aicent, Inc., a mobile data service providerfrom August 2002 to December 2013. Mr. Yang received his master’s degree in Business Administration fromUniversity of Missouri, Columbia and a bachelor’s degree in Mechanical Engineering from National TsinghuaUniversity, Taiwan. We believe that Mr. Yang should serve as a member of our board of directors due to hismany years of experience as a private equity investor and his engineering background. Mr. Yang was designatedto serve as a member of our board of directors by our Series B-1 and Series B-2 preferred shareholders.
Edward Way has served as a member of our board of directors since August 2012. Prior to joining us,Mr. Way served as Chief Executive Officer Emeritus from June 2006 to May 2007 and Managing Partner andChief Executive Officer of Deloitte & Touche (Taiwan), a registered public accounting firm, from June 2003 toMay 2006. Mr. Way is a certified public accountant and holds a master’s degree in Business Administration fromthe University of Georgia and a bachelor’s degree in accounting from Soochow University, Taiwan. We believethat Mr. Way should serve as a member of our board of directors due to his many years of accounting experience.Mr. Way was designated to serve as a member of our board of directors by our preferred shareholders.
96

Dr. Charles Sodini has served as member of our board of directors since February 2013. Since 1983,Dr. Sodini has been a member of the faculty at the Massachusetts Institute of Technology, where he is currentlythe LeBel Professor of Electrical Engineering. From 1974 to 1982, Dr. Sodini was a Member of the TechnicalStaff at Hewlett-Packard. Dr. Sodini was also a co-founder of SMaL Camera Technologies, a leader in imagingtechnology for consumer digital still cameras and machine vision cameras for automotive applications.Dr. Sodini received a master’s degree and a Ph.D. in electrical engineering from the University of California,Berkeley and a bachelor’s degree in electrical engineering from Purdue University. We believe that Dr. Sodinishould serve as a member of our board of directors due to his many years of industry and academic experience.Dr. Sodini was designated to serve as a member of our board of directors by our preferred shareholders.
Dr. Cheng Tie Chen joined us in March 2011 as a Vice President, Engineering (SoC Products). Dr. Chen hasmore than 25 years of industrial research and development experience in digital integrated circuit developmentand video applications. Prior to joining us, Dr. Chen was a Vice President of Engineering at TridentMicrosystems, Inc., a DTV chips manufacturer, from July 2006 to February 2011, responsible for digital TVintegrated circuit development. Prior to Trident, Dr. Chen was a Vice President of Engineering at MagnumSemiconductor Inc., a provider of silicon, modules, software and IP for the professional broadcast infrastructuremarket, from 2005 to 2006 and Cirrus Logic, Inc., an analog and mixed-signal integrated circuit supplier, from2001 to 2005. In 1996, Dr. Chen joined Stream Machine Company (which was acquired by Cirrus Logic), asupplier of MPEG-2 video recording technology, as Technology Founder and VP of Engineering. Dr. Chen alsoheld various research and engineering positions at Eastman Kodak Research Laboratories, an industrial researchorganization, from 1984 to 1987 and Bell Communications Research, from 1987 to 1996. Dr. Chen received hismaster’s and Ph.D. degrees in Electrical Engineering from University of Pennsylvania, and bachelor’s degree inElectrical Engineering from National Taiwan University.
Shawn Si is one of our founders and has served as a Vice President of Engineering STB Front-end Productssince 2010, having previously served as Engineering Director since our inception. He has over 19 years ofexperience in developing high-performance analog, RF and mixed-signal semiconductor products. Prior tojoining us, Mr. Si served as senior Member of the Technical Staff at Bigbear Networks, Inc. (acquired byFairchild Semiconductor International, Inc.), a provider of transceivers and electronic dispersion compensationsolutions for high speed networks, from 2001 to 2004, and a senior Member of Technical Staff of DatapathSystems Inc. (acquired by LSI Logic), a communications chip company, from 1994 to 2000. Mr. Si received hismaster’s degree in Electrical Engineering from University of Hawaii and a bachelor’s degree in ElectricalEngineering from Zhejiang University, China.
Dr. Zhongyuan Chang joined us in June 2013 as a Vice President of Engineering (Memory InterfaceProducts). Dr. Chang has over 23 years of experience in analog and mixed-signal product development andengineering management. Prior to joining us, he served as CTO at Shanghai Belling Co. Ltd., from 2010 to 2013.Prior to working at Belling, Dr. Chang served as Vice President at Integrated Device Technology Inc. andGeneral Manager of IDT-Shanghai. Before returning to China, he was a Senior Engineer at Alcatel Inc. inBelgium. Dr. Chang served as an Information Technology Policy Committee member of the Data ConverterSubcommittee of IEEE International Solid-State Circuits Conference (ISSCC), from 2004 to 2009. He was aninvited speaker at ISSCC in 2004. In addition, Dr. Chang has published over 20 technical articles in IEEEJournals and international conferences, including three papers at ISSCC. He is the first author of the monograph“Low Noise Wideband Amplifiers in Bipolar and CMOS Technology” (Kluwer Academic, 1990). Dr. Changholds both master’s and Ph.D. degrees in Microelectronic Engineering from Catholic University of Louvain inBelgium.
SeungJin (SJ) Seo joined us in February 2012 as a Vice President, Engineering (Validation andApplications). Mr. Seo has more than 22 years of experience in memory module development. Prior to joiningus, Mr. Seo served as a Principal Engineer at Samsung Electronics Co., Ltd., a multinational electronicscompany, from 1989 to 2011, managing a memory module development team with responsibility for all aspectsof memory module development. Mr. Seo has extensive experience with key server OEMs, and during his career
97

has been involved in the development of JEDEC standards, module PCB design, verification and systemvalidation testing. Mr. Seo received his bachelor degree in Electronic Engineering from the Inha University,Incheon, Korea.
Phoebe Su joined us in October 2007 as a Vice President, Finance and Administration. She has more than15 years of experience in finance and accounting. Before joining us, she was Finance Controller of Dow CorningChina, a provider of silicon products and services, from 2003 to 2007. Prior to that, she had worked atPricewaterhouseCoopers Zhong Tian CPAs Limited Company, a registered public accounting firm, as an AuditManager from 1995 to 2003. She holds a bachelor’s degree in Management Information System from FudanUniversity.
Election of Officers
Our executive officers are elected by, and serve at the discretion of, our board of directors. There are nofamily relationships among any of our directors, executive officers or significant employees.
Board Composition and Terms
Our business and affairs are managed under the direction of our board of directors. We have a board ofseven directors. The number of directors may be changed by resolution of our board of directors. Our directors,other than any director serving as chief executive officer, are divided into class A, class B and class C directors.The class A directors are Jung-Kung (Jackie) Yang and Cathy Yen, the class B directors are Yung Kuei (YK) Yuand Edward Way, and the class C directors are Charles G. Sodini and Stephen Tai. Class A, class B and class Cdirectors each serve three-year terms and stand for election every year at our annual general meeting ofshareholders on a rotating basis, beginning with our class A directors at the first annual general meeting of ourshareholders following the completion of our initial public offering. If any director simultaneously serves as ourchief executive officer, as Dr. Howard C. Yang currently does, he will not, for so long as he is chief executiveofficer, be designated a class A, class B or class C director or be subject to retirement or re-election.
Director Independence
Our board of directors has determined that none of our non-employee directors has a relationship that wouldinterfere with the exercise of independent judgment in carrying out the responsibilities of a director and that eachof these directors is “independent” as that term is defined under the rules of the NASDAQ.
Board Committees
Our board of directors has established an audit committee, a compensation committee and a nominating andcorporate governance committee. The composition and responsibilities of each committee are described below.Members will serve on these committees until their resignation or until otherwise determined by our board ofdirectors. In the future, our board of directors may establish other committees, as it deems appropriate, to assistwith its responsibilities.
Audit Committee
Our audit committee consists of Edward Way, Jung-Kung (Jackie) Yang and Charles G. Sodini. EdwardWay is the chairperson of our audit committee. Our board of directors has affirmatively determined that eachmember of our audit committee meet the definition of an independent director under applicable SEC andNASDAQ listing rules. In addition, our board of directors has determined that Edward Way qualifies as an “auditcommittee financial expert,” as such term is defined in the rules and regulations of the SEC.
98
Our audit committee is responsible for, among other things:
• appointing the independent auditor;
• pre-approving all auditing and non-auditing services permitted to be performed by the independentauditor;
• setting clear hiring policies for employees and former employees of the independent auditor;
• reviewing with the independent auditor any audit problems or difficulties and management’s responses;
• reviewing and approving all related party transactions, as defined under applicable U.S. securities lawsand regulations;
• reviewing and discussing the annual audited financial statements with management and theindependent auditor;
• reviewing and discussing with management and the independent auditor major issues regardingaccounting principles and financial statement presentations;
• reviewing reports prepared by management relating to significant financial reporting issues andjudgments;
• resolving any differences in financial reporting between management and the independent auditor;
• discussing earnings press releases with management, as well as financial information and earningsguidance provided to analysts and rating agencies;
• reviewing with management and the independent auditor the effect of regulatory and accountinginitiatives, as well as off-balance sheet structures, on our financial statements;
• discussing policies with respect to risk assessment and risk management;
• timely reviewing reports from management regarding all critical accounting policies and practices to beused by our company, all alternative treatments of financial information within U.S. GAAP that havebeen discussed with management and all other material written communications between theindependent auditor and management;
• establishing procedures for the receipt, retention and treatment of complaints received from ouremployees regarding accounting, internal accounting controls or auditing matters, and the confidential,anonymous submission by our employees of concerns regarding questionable accounting or auditingmatters;
• establishing, maintaining and overseeing our code of conduct and ethics; and
• annually reviewing and reassessing the adequacy of our audit committee charter.
Compensation Committee
Our compensation committee consists of Jung-Kung (Jackie) Yang, Cathy Yen and Yung Kuei (YK) Yu.Jung-Kung (Jackie) Yang is the chairperson of our compensation committee. Our board of directors hasaffirmatively determined that each member of our compensation committee meets the definition of anindependent director under NASDAQ listing rules.
The compensation committee is responsible for, among other things:
• reviewing and approving corporate goals and objectives relevant to the compensation of our chiefexecutive officer, evaluating our chief executive officer’s performance in light of those goals andobjectives, reporting the results of such evaluation to the board of directors and determining our chiefexecutive officer’s compensation level based on this evaluation;
99

• reviewing and making recommendations to the board with respect to the compensation level of ourother executive officers;
• hiring or termination of any executive officer;
• overseeing and approving all welfare, benefit, pension or other plans related to compensation of currentor former employees, including equity-based compensation plans; and
• evaluating and making recommendations to the board with respect to compensation of non-executivedirectors.
Nominating and Corporate Governance Committee
Our nominating and corporate governance committee consists of Yung Kuei (YK) Yu, Cathy Yen andCharles G. Sodini. Yung Kuei (YK) Yu is the chairperson of our nominating and corporate governancecommittee. Our board of directors has affirmatively determined that each member of our nominating andcorporate governance committee meets the definition of an independent director under the NASDAQ listingrules.
The nominating and corporate governance committee is responsible for, among other things:
• seeking and evaluating qualified individuals to become new directors as needed;
• making recommendations to the board regarding assignment of board members to various boardcommittees;
• developing, reviewing and confirming compliance with our corporate governance policies; and
• overseeing self-evaluations by our board.
Compensation Committee Interlocks and Insider Participation
None of the members of our compensation committee is an officer or employee of our company, nor havethey ever been an officer or employee of our company. None of the executive officers of our company has servedon the compensation committee, or any other committee serving an equivalent function, of any entity that hasone or more executive officers serving as members of our board of directors or our compensation committee.
Code of Conduct and Ethics
Our code of conduct and ethics applies to all of our employees, officers and directors, including thoseofficers responsible for financial reporting. Our code of conduct and ethics addresses, among other things,competition and fair dealing, conflicts of interest, financial matters and external reporting, company funds andassets, confidentiality and corporate opportunity requirements and the process for reporting violations of the codeof conduct and ethics, employee misconduct, conflicts of interest or other violations. Our code of conduct andethics is available on our website at www.montage-tech.com.
Role of the Board in Risk Oversight
One of the key functions of our board of directors is informed oversight of our risk management process.The board of directors does not have a standing risk management committee, but rather administers this oversightfunction directly through the board of directors as a whole, as well as through its standing committees thataddress risks inherent in their respective areas of oversight. In particular, our board of directors is responsible formonitoring and assessing strategic risk exposure. Our audit committee has the responsibility to consider anddiscuss our major financial risk exposures and the steps our management has taken to monitor and control theseexposures, including guidelines and policies to govern the process by which risk assessment and management is
100
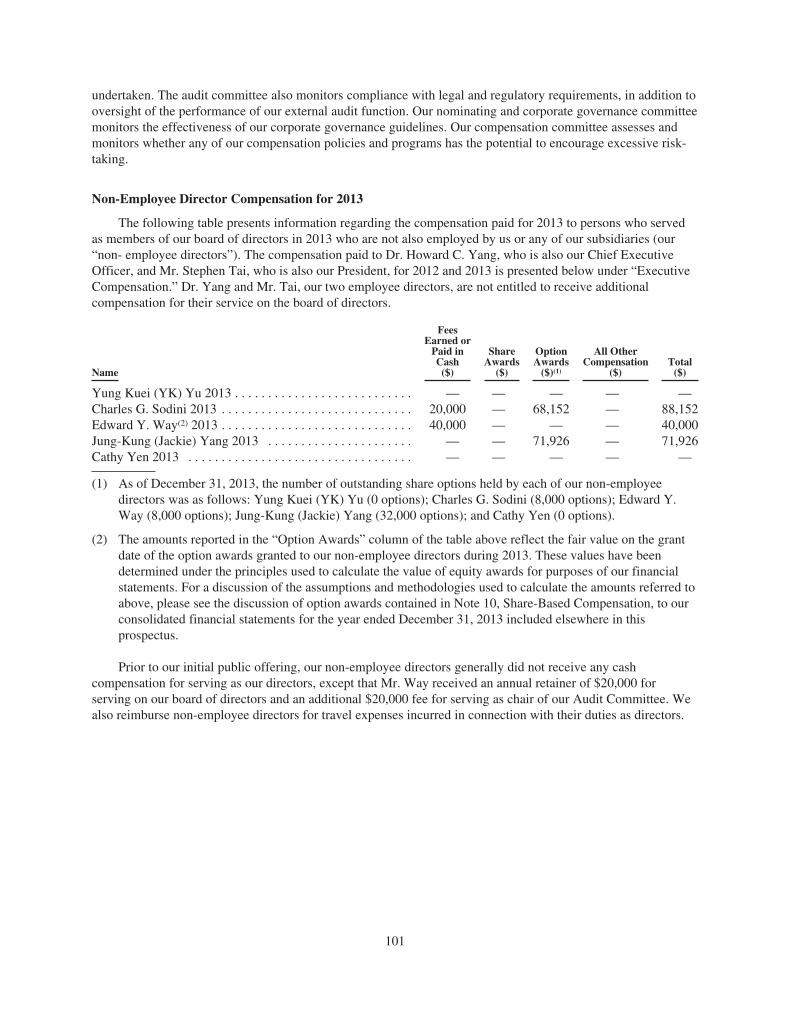
undertaken. The audit committee also monitors compliance with legal and regulatory requirements, in addition tooversight of the performance of our external audit function. Our nominating and corporate governance committeemonitors the effectiveness of our corporate governance guidelines. Our compensation committee assesses andmonitors whether any of our compensation policies and programs has the potential to encourage excessive risk-taking.
Non-Employee Director Compensation for 2013
The following table presents information regarding the compensation paid for 2013 to persons who servedas members of our board of directors in 2013 who are not also employed by us or any of our subsidiaries (our“non- employee directors”). The compensation paid to Dr. Howard C. Yang, who is also our Chief ExecutiveOfficer, and Mr. Stephen Tai, who is also our President, for 2012 and 2013 is presented below under “ExecutiveCompensation.” Dr. Yang and Mr. Tai, our two employee directors, are not entitled to receive additionalcompensation for their service on the board of directors.
Name
FeesEarned or
Paid inCash
($)
ShareAwards
($)
OptionAwards
($)(1)
All OtherCompensation
($)Total
($)
Yung Kuei (YK) Yu 2013 . . . . . . . . . . . . . . . . . . . . . . . . . . . — — — — —Charles G. Sodini 2013 . . . . . . . . . . . . . . . . . . . . . . . . . . . . . 20,000 — 68,152 — 88,152Edward Y. Way(2) 2013 . . . . . . . . . . . . . . . . . . . . . . . . . . . . . 40,000 — — — 40,000Jung-Kung (Jackie) Yang 2013 . . . . . . . . . . . . . . . . . . . . . . — — 71,926 — 71,926Cathy Yen 2013 . . . . . . . . . . . . . . . . . . . . . . . . . . . . . . . . . . — — — — —
(1) As of December 31, 2013, the number of outstanding share options held by each of our non-employeedirectors was as follows: Yung Kuei (YK) Yu (0 options); Charles G. Sodini (8,000 options); Edward Y.Way (8,000 options); Jung-Kung (Jackie) Yang (32,000 options); and Cathy Yen (0 options).
(2) The amounts reported in the “Option Awards” column of the table above reflect the fair value on the grantdate of the option awards granted to our non-employee directors during 2013. These values have beendetermined under the principles used to calculate the value of equity awards for purposes of our financialstatements. For a discussion of the assumptions and methodologies used to calculate the amounts referred toabove, please see the discussion of option awards contained in Note 10, Share-Based Compensation, to ourconsolidated financial statements for the year ended December 31, 2013 included elsewhere in thisprospectus.
Prior to our initial public offering, our non-employee directors generally did not receive any cashcompensation for serving as our directors, except that Mr. Way received an annual retainer of $20,000 forserving on our board of directors and an additional $20,000 fee for serving as chair of our Audit Committee. Wealso reimburse non-employee directors for travel expenses incurred in connection with their duties as directors.
101

EXECUTIVE COMPENSATION
This section describes the material elements of compensation awarded to, earned by or paid to theindividuals who served as our executive officers during 2013. These individuals are listed in the “SummaryCompensation Table” below and are referred to as the named executive officers in this prospectus.
We have provided our executives with an annual base salary and an annual cash bonus opportunity, and wehave granted our executives share options to provide an additional incentive to grow our Company and furtherlink the interests of our executives with those of our shareholders. Our board of directors and compensationcommittee of the board reviews our executive officers’ overall compensation packages on an annual basis ormore frequently as it deems warranted.
Summary Compensation Table for 2012 and 2013
The following table provides a summary of compensation paid for the years ended December 31, 2012 and2013 to our named executive officers:
Name and Principal Position Year
BaseSalary($)(1)
Bonus($)
RestrictedShare
Awards($)
ShareOptionAwards
($)(2)
Non-EquityIncentive PlanCompensation
($)
AllOther
Compensation($)(1)(3)
Total($)
Howard C. Yang . . . . . . . . . . 2013 165,739 11,711 — 3,333,782 — 45,637 3,556,868Chief Executive Officer 2012 110,061 9,597 — — — 29,032 148,690
Stephen Tai . . . . . . . . . . . . . . 2013 166,720 11,711 — 3,333,782 — 43,245 3,555,457President 2012 110,061 9,597 — — — 29,032 148,690
Mark Voll(4) . . . . . . . . . . . . . 2013 249,996 — — — — 41,133 291,129Chief Financial Officer 2012 134,596 — — 1,078,240 — 14,678 1,227,517
(1) The amounts reported in these columns for Dr. Howard C. Yang and Mr. Tai have been converted based onan exchange rate of 6.0969 Renminbi for one U.S. dollar.
(2) The amounts reported in the “Option Awards” column of the table above for 2012 and 2013 reflect the fairvalue on the grant date of the option awards granted to our named executive officers during these years.These values have been determined under the principles used to calculate the value of equity awards forpurposes of our financial statements. For a discussion of the assumptions and methodologies used tocalculate the amounts referred to above, see the discussion of option awards contained in Note 10, Share-Based Compensation, to our consolidated financial statements for the year ended December 31, 2012 andour unaudited consolidated financial statements for the nine months ended September 30, 2013, includedelsewhere in this prospectus.
(3) This amount reflects a housing allowance provided by us to each executive.(4) Mr. Voll joined our Company as Chief Financial Officer in June 2012.
Employment Agreements
We have entered into an employment agreement with each of our named executive officers. The agreementwith Dr. Yang is dated May 1, 2012 and provides for Dr. Yang to receive an annual base salary of $114,600. Theagreement with Mr. Tai is dated May 1, 2012 and provides for him to receive an annual base salary of $114,600.The agreement with Mr. Voll is dated June 8, 2012 and provides for him to receive an annual base salary of$250,000. He is also eligible for an annual performance bonus of up to 50% of his base salary and was granted in2012 options to purchase 160,000 of our ordinary shares. We have also agreed to provide Mr. Voll reasonablehousing when he works in Shanghai. Each agreement has a term of three years and may be terminated by eitherparty upon one month written notice.
102

In addition, Montage Shanghai, our principal PRC operating subsidiary, has entered into employmentagreements with Dr. Yang and Mr. Tai pursuant to PRC labor law. Dr. Yang’s agreement was entered into inJanuary 2013 and has a fixed term through April 30, 2022. Mr. Tai’s agreement was entered into in December2012 and has a fixed term through December 19, 2017. Each of Dr. Yang’s and Mr. Tai’s agreement provides fora monthly base salary of RMB23,800. In addition, each of Dr. Yang and Mr. Tai is eligible to receive quarterlyand annual bonuses each year. The agreements provide for each of Dr. Yang and Mr. Tai to receive socialinsurance, welfare and severance benefits, in each case as provided by applicable law. According to the PRCLabor Contract Law and its implementing regulations, we may terminate Dr. Yang’s or Mr. Tai’s employmentagreement under certain specified circumstances. In certain cases, the terminated employee is entitled to receivea severance payment equal to the employee’s average monthly salary for the 12-month period prior to thetermination date (up to a maximum of three times the local average monthly salary). If we sought to terminate theemployment agreement in any circumstance other than those specified under the PRC Labor Contract Law andits implementing regulations, including termination without cause, the employee could force us to perform underthe agreement or pay the employee damages in the amount of two months’ salary per year of service up to thedate of termination, but if we pay such damages we are not required to pay other severance or the remainder ofthe amount owed under the employment agreement.
Outstanding Equity Awards at December 31, 2013
The following table presents information regarding the outstanding equity awards held by each of ournamed executive officers as of December 31, 2013, including the vesting dates for the portions of these awardsthat had not vested as of that date.
NameAwardDate
Number ofSecurities
UnderlyingUnexercised
OptionsExercisable
Number ofSecurities
UnderlyingUnexercised
OptionsUnexercisable
OptionExercisePrice($)
OptionExpiration Date
Howard C. Yang . . . . . . . . . . . . . . . . . . . . . . . . 4/23/2013 400,000(1) — 17.85 4/22/2023Stephen Tai . . . . . . . . . . . . . . . . . . . . . . . . . . . . 4/23/2013 400,000(1) — 17.85 4/22/2023Mark Voll . . . . . . . . . . . . . . . . . . . . . . . . . . . . . . 9/17/2012 160,000(2) — 9.43 9/16/2022
(1) These options vested as to 25% of the shares covered by the option on October 1, 2013 and as to theremaining 75% of such shares in monthly installments over the three-year period thereafter. The optionincludes an “early exercise” feature, meaning that it may be exercised prior to the vesting date and anyshares received on such exercise will continue to be subject to a right of repurchase which shall lapse inaccordance with the original vesting schedule.
(2) These options vested as to 25% of the shares covered by the option on June 18, 2013 and as to the remaining75% of such shares in monthly installments over the three-year period thereafter. The option includes an“early exercise” feature, meaning that it may be exercised prior to the vesting date and any shares receivedon such exercise will continue to be subject to a right of repurchase which shall lapse in accordance with theoriginal vesting schedule.
Equity Incentive Plans
2006 Share Incentive Plan
On June 13, 2006, our board of directors adopted our 2006 Share Incentive Plan, or 2006 Plan. Our authorityto grant additional awards under the 2006 Plan terminated upon our initial public offering. See the discussioncontained in Note 10, Share-Based Compensation, to our consolidated financial statements for the year endedDecember 31, 2012 and our unaudited consolidated financial statement for the nine months ended September 30,2013, included elsewhere in this prospectus.
103

The purpose of the 2006 Plan was to promote the success of our company and the interests of ourshareholders by providing a means through which we may grant equity-based incentives to attract, motivate,retain and reward certain officers, employees, directors and other eligible persons and to further link the interestsof award recipients with those of our shareholders generally.
The 2006 Plan is divided into two separate equity programs:
• The option grant program under which eligible persons may be granted options; and
• The share award program under which eligible persons may be awarded restricted or unrestrictedordinary shares.
Eligibility. Only officers, or employees of our company and any of our affiliates, members of the board,directors of our affiliates, or any individual consultants or advisors rendering bona fide services to us or one ofour affiliates were eligible for grants under our 2006 plan, provided, however, that incentive share options, withinthe meaning of Section 422 of the Internal Revenue Code, may be granted only to employees.
Administration. The administrator, which means our board or one or more committees appointed by theboard or another committee (within its delegated authority), is entitled to administer our 2006 Plan. Theadministrator has complete discretion to make all decisions implementing the 2006 Plan, including the power to(a) determine who will receive the awards, (b) approve the forms of award agreements, (c) construe and interpretthe terms of the 2006 Plan and the awards thereunder, (d) cancel, modify or terminate any or all outstandingawards, and (e) determine the fair market value for purpose of our 2006 Plan and awards.
Share Options. In no case will the exercise price of the option be less than the greater of (a) the par value ofthe ordinary shares; (b) in the case of Incentive Share Option grants, 100% of the fair market value of theordinary shares on the date of grant; or (c) in the case of Incentive Share Option grants, 110% of the fair marketvalue of the ordinary shares on the date of grant, in the case that any holder of more than 10% of the votingpower of all classes of our outstanding shares as of the grant date.
Each option shall expire not more than ten years after its date of grant. Each option is evidenced by anaward agreement in the form approved by the administrator. The administrator may require that the recipient ofan option and the spouse of any married recipient promptly execute and return to our company his or her awardagreement evidencing the option. Any exercisable option will be deemed to be exercised when we receive writtennotice of such exercise, together with the any required payment made in accordance with the 2006 Plan.
When an employee ceases to provide continuous services to us (or any parent, subsidiary, or affiliate), he orshe may exercise his or her option for the period of time stated in the 2006 Plan, to the extent his or her option isvested and exercisable on the date of termination. An option, to the extent not vested and exercisable on the dateof termination, shall terminate on the date of termination. An option may never be exercised later than theexpiration of its term.
Restricted Share. A restricted share means ordinary shares awarded under our 2006 Plan, subject to paymentof such consideration and such conditions on vesting (which may include, among others, the passage of time,specified performance objectives or other factors) and such transfer and other restrictions as are established in orpursuant to this 2006 Plan and the related award agreement, to the extent such remain unvested and restrictedunder the terms of the applicable award agreement.
Transferability. All awards are non-transferable and will not be subject in any manner to sale, transfer,anticipation, alienation, assignment, pledge, encumbrance or charge. No one is entitled to exercise the award,unless he or she is the recipient of the award. The amounts payable or shares issuable pursuant to an award willbe delivered only to the recipient of such award. However, the exercise and transfer restrictions shall not apply to(a) transfers to our company, (b) transfers by gift or domestic relations order to one or more “family members”
104

(as that term is defined in SEC Rule 701 promulgated under the Securities Act) of the recipient of such award,(c) the designation of a beneficiary to receive benefits if the recipient of such award dies or, if the recipient ofsuch award has died, transfers to or exercises by the recipient of such award Beneficiary, or, in the absence of avalidly designated beneficiary, transfers by will or the laws of descent and distribution; or (d) if the recipient ofsuch award has suffered a disability, permitted transfers or exercises on behalf of the recipient of such award byhis or her duly authorized legal representative.
Payment. The administrator may permit any of the following methods of payments for the exercise ofoptions:
• cash, check payable to the order of our company or electronic funds transfer;
• notice and third party payment in such manner as may be authorized by the administrator;
• the delivery of previously owned ordinary shares;
• by a reduction in the number of ordinary shares otherwise deliverable pursuant to the award;
• subject to such procedures as the administrator may adopt, pursuant to a “cashless exercise;” or ifauthorized by the administrator or specified in the applicable award agreement, by a promissory noteaccording to the 2006 Plan.
2013 Performance Incentive Plan
Our board of directors adopted the 2013 Performance Incentive Plan, or the 2013 Plan, to provide a meansthrough the grant of awards to attract, motivate, retain and reward selected employees and other eligible persons.Our shareholders have approved the 2013 Plan, which became effective upon the completion of our initial publicoffering. Employees, officers, directors and consultants that provide services to us or one of our subsidiaries maybe selected to receive awards under the 2013 Plan. As noted above, our authority to grant any more awards underthe 2006 Plan has terminated.
The compensation committee of our board of directors will be the administrator under the 2013 Plan. Theadministrator of the plan has broad authority to:
• select participants and determine the types of awards that they are to receive;
• determine the number of shares that are to be subject to awards and the terms and conditions of awards,including the price (if any) to be paid for the shares or the award and establish the vesting conditions (ifapplicable) of such shares or awards;
• cancel, modify or waive our rights with respect to, or modify, discontinue, suspend or terminate any orall outstanding awards, subject to any required consents;
• construe and interpret the terms of the 2013 Plan and any agreements relating to the Plan;
• accelerate or extend the vesting or exercisability or extend the term of any or all outstanding awardssubject to any required consent;
• subject to the other provisions of the 2013 Plan, make certain adjustments to an outstanding award andauthorize the termination, conversion, substitution or succession of an award; and
• allow the purchase price of an award or shares of our ordinary shares to be paid in the form of cash,check or electronic funds transfer, by the delivery of previously-owned shares of our ordinary shares orby a reduction of the number of shares deliverable pursuant to the award, by services rendered by therecipient of the award, by notice and third party payment or cashless exercise on such terms as theadministrator may authorize or any other form permitted by law.
105

As of the date of this prospectus, a total of 2,600,000 ordinary shares are authorized for issuance withrespect to awards granted under the 2013 Plan. The share limit will automatically increase on the first trading dayin January of each year by an amount equal to the lesser of (1) 4% of the total number of outstanding shares ofour ordinary shares on the last trading day in December in the prior year, (2) 1,000,000 shares, or (3) such lessernumber as determined by our board of directors. Any shares subject to awards that are not paid, delivered orexercised before they expire or are canceled or terminated, fail to vest, as well as shares used to pay the purchaseor exercise price of awards or related tax withholding obligations, will become available for other award grantsunder the 2013 Plan. As of the date of this prospectus, no awards have been granted under the 2013 Plan, and thefull number of shares authorized under the 2013 Plan is available for award purposes.
Awards under the 2013 Plan may be in the form of incentive or nonqualified share options, shareappreciation rights, share bonuses, restricted share and other forms of awards including cash awards. Awardsunder the plan generally will not be transferable other than by will or the laws of descent and distribution, exceptthat the plan administrator may authorize certain transfers.
Nonqualified and incentive share options may not be granted at prices below the fair market value of theordinary shares on the date of grant. Incentive share options must have an exercise price that is at least equal tothe fair market value of our ordinary shares, or 110% of fair market value of our ordinary shares or incentiveshare option grants to any 10% owner of our ordinary shares, on the date of grant. These and other awards mayalso be issued solely or in part for services. Awards are generally paid in cash or shares of our ordinary shares.The plan administrator may provide for the deferred payment of awards and may determine the terms applicableto deferrals.
As is customary in incentive plans of this nature, the number and type of shares available under the 2013Plan and any outstanding awards, as well as the exercise or purchase prices of awards, will be subject toadjustment in the event of certain reorganizations, mergers, combinations, recapitalizations, share splits, sharedividends or other similar events that change the number or kind of shares outstanding, and extraordinarydividends or distributions of property to the shareholders.
Generally, and subject to limited exceptions set forth in the 2013 Plan, if we dissolve or undergo certaincorporate transactions such as a merger, business combination or other reorganization, or a sale of all orsubstantially all of its assets, the plan administrator will generally provide for the substitution, assumption,exchange or other continuation or settlement (in cash, securities or property) of the outstanding awards grantedunder the plan, or, if the plan administrator does not so provide, the outstanding awards will generally becomefully vested and, in the case of options, exercisable, and will terminate or be terminated in such circumstances.The plan administrator also has the discretion to establish other change in control provisions with respect toawards granted under the 2013 Plan. For example, the administrator could provide for the acceleration of vestingor payment of an award in connection with a corporate event that is not described above and provide that anysuch acceleration shall be automatic upon the occurrence of any such event.
Our board of directors may amend or terminate the 2013 Plan at any time, but no such action will affect anyoutstanding award in any manner materially adverse to a participant without the consent of the participant. Planamendments will be submitted to shareholders for their approval as required by applicable law or any applicablelisting agency. The 2013 Plan is not exclusive – our board of directors and compensation committee may grantshare and performance incentives or other compensation, in shares or cash, under other plans or authority.
The 2013 Plan will terminate on the tenth anniversary from the date it was adopted by the board. However,the plan administrator will retain its authority until all outstanding awards are exercised or terminated. Themaximum term of options, share appreciation rights and other rights to acquire ordinary shares under the plan isten years after the initial date of the award.
106

RELATED PARTY TRANSACTIONS
In addition to the executive officer and director compensation arrangements discussed in the section titled“Executive Compensation,” we describe below the transactions since January 1, 2010, to which we have been aparticipant, in which the amount involved in the transaction exceeds or will exceed $120,000 and in which any of ourdirectors, executive officers or holders of more than 5% of our share capital, or any immediate family member of, orperson sharing the household with, any of these individuals, had or will have a direct or indirect material interest.
Investor Rights Agreement
In connection with our private placement of Series B-2 preferred shares in October 2009, we and ourshareholders entered into an investor rights agreement, or IRA. The following parties to the IRA are our relatedparties: Howard C. Yang, Stephen Tai, Jung-Kung (Jackie) Yang, Xunren Yang, Shuzhuang Liang, Kuai LapTai, Iong Wa Chao and Absolute Pioneer Co., Ltd., being our directors, immediate family members of ourdirectors or entities controlled by our director; Shawn Si, Kenneth Chew, Jack Gu, Phoebe Su, Liang Wu, ShungHo Shaw, Alan Tzi-Hong Yiu and Pannyun Yiu, being our officers or immediate family members of our officers;and AsiaVest Opportunities Fund IV and Intel Capital (Cayman) Corporation, being our principal shareholders.Pursuant to the IRA, we have granted certain registration rights to holders of our registrable securities asdescribed in “Description of Share Capital—Registration Rights.”
Participation in Initial Public Offering
Four of our executive officers, Howard C. Yang, Stephen Tai, Mark Voll and Zhongyuan Chang, and anaffiliate of an existing shareholder, UMC Capital Corporation, purchased an aggregate of 835,000 ordinaryshares offered in our October 1, 2013 initial public offering at the initial public offering price.
Indemnification Arrangements with Executive Officers and Directors
We have entered into indemnification agreements with all of our executive officers and directors. Eachindemnification agreement provides that we will indemnify the director or executive officer, as the case may be,to the fullest extent permitted by law for claims arising in his or her capacity as our director or executive officer,as the case may be, provided that he or she acted in good faith and in a manner that he or she reasonably believedto be in, or not opposed to, our best interests and, with respect to any criminal proceeding, had no reasonablecause to believe that his or her conduct was unlawful. In the event that we do not assume the defense of a claimagainst a director or such officer, we will be required to advance his or her expenses in connection with his or herdefense, provided that he or she undertakes to repay all amounts advanced if it is ultimately determined that he orshe is not entitled to be indemnified by us.
Review, Approval or Ratification of Related Party Transactions
Our audit committee is responsible for reviewing and approving all related party transactions that arerequired to be disclosed under the applicable rules of the SEC and NASDAQ, when appropriate, and authorizingor ratifying all such transactions in accordance with written policies and procedures established by our board ofdirectors from time to time. The audit committee may approve or ratify related party transaction only if itdetermines in good faith that under all the circumstances, the transaction is fair to us.
No member of our audit committee may participate in the review, approval, authorization or ratification of atransaction with respect to which he or she is a related party, except that such member can be counted forpurposes of a quorum and shall provide such information with respect to the transaction as may be reasonablyrequested by other members of the committee.
All of the transactions described under “Related Party Transactions” were entered into prior to the adoptionof a written policy and therefore were not reviewed or approved by our audit committee.
107

PRINCIPAL AND SELLING SHAREHOLDERS
The following table sets forth information as of December 31, 2013 regarding the beneficial ownership ofour ordinary shares by:
• each person or group who we know to beneficially own more than 5% of our ordinary shares;
• each of our directors;
• each of our named executive officers;
• all of our executive officers and directors as a group; and
• each of the selling shareholders.
Beneficial ownership is determined in accordance with SEC rules. These rules generally provide that a personis the beneficial owner of securities if such person has or shares the power to vote or to dispose of the shares or hasthe right to acquire such powers within 60 days, such as through the exercise of options. Percentage of beneficialownership for each person or group is calculated by dividing (i) the number of ordinary shares beneficially ownedby such person or group by (ii) the total number of ordinary shares outstanding plus the number of ordinary sharessuch person or group has the right to acquire within 60 days after December 31, 2013. The total number of ordinaryshares outstanding prior to the offering is 26,498,043. For the purposes of the table below, we have assumed thetotal number of ordinary shares outstanding after completion of this offering will be 27,498,043.
An affiliate of an existing shareholder, UMC Capital Corporation, has agreed to purchase 50,000 shares inthis offering at the public offering price. The underwriters will receive the same discount and commissions fromthe ordinary shares purchased by the affiliate of UMC Capital Corporation as they will from any other ordinaryshares sold to the public in this offering.
Unless otherwise indicated, the persons or entities identified in this table have sole voting and investmentpower with respect to all shares shown as beneficially owned by them, subject to applicable community propertylaws. Unless otherwise indicated, the address for each person named in the table below is c/o Montage TechnologyGroup Limited, Room A1601, Technology Building, 900 Yi Shan Road, Xuhui District, Shanghai 200233, China.
Shares BeneficiallyOwned Prior to the
Offering
Number ofShares
Being OfferedShares Beneficially Owned
After the Offering
No Exercise Full Exercise
Name and Address of beneficial Owner SharesPercentage
(%)No
ExerciseFull
Exercise SharesPercentage
(%) SharesPercentage
(%)
Executive Officers and Directors:Howard C. Yang(1) . . . . . . . . . . . . . . . . . . . . . 1,513,319 5.6 — — 1,513,319 5.4 1,513,319 5.4Stephen Tai(2) . . . . . . . . . . . . . . . . . . . . . . . . . 1,005,319 3.7 — — 1,005,319 3.6 1,005,319 3.6Yung Kuei (YK) Yu . . . . . . . . . . . . . . . . . . . . — — — — — — — —Cathy Yen . . . . . . . . . . . . . . . . . . . . . . . . . . . 49,234 * — — 49,234 * 49,234 *Jung-Kung (Jackie) Yang(3) . . . . . . . . . . . . . . 71,766 * — — 71,766 * 71,766 *Edward Way(4) . . . . . . . . . . . . . . . . . . . . . . . . 8,000 * — — 8,000 * 8,000 *Charles G. Sodini(5) . . . . . . . . . . . . . . . . . . . . 8,000 * — — 8,000 * 8,000 *Mark Voll(6) . . . . . . . . . . . . . . . . . . . . . . . . . . 185,000 * — — 185,000 * 185,000 *Leechung Yiu(7) . . . . . . . . . . . . . . . . . . . . . . . 277,280 1.0 — — 277,280 1.0 277,280 1.0Bill Franciscovich(8) . . . . . . . . . . . . . . . . . . . . 156,000 * — — 156,000 * 156,000 *Jack Gu(9) . . . . . . . . . . . . . . . . . . . . . . . . . . . . 103,417 * — — 103,417 * 103,417 *Kenneth Chew(10) . . . . . . . . . . . . . . . . . . . . . . 176,275 * — — 176,275 * 176,275 *Cheng-Tie Chen(11) . . . . . . . . . . . . . . . . . . . . . 96,000 * — — 96,000 * 96,000 *Shawn Si(12) . . . . . . . . . . . . . . . . . . . . . . . . . . 401,864 1.5 — — 401,864 1.5 401,864 1.5
108

Shares BeneficiallyOwned Prior to the
OfferingNumber of Shares
Being OfferedShares Beneficially Owned After the
Offering
No Exercise Full Exercise
Name and Address of beneficial Owner SharesPercentage
(%)No
ExerciseFull
Exercise SharesPercentage
(%) SharesPercentage
(%)
SeungJin (SJ) Seo(13) . . . . . . . . . . . . . . . . . . 40,000 * — 40,000 * 40,000 *Zhongyuan Chang(14) . . . . . . . . . . . . . . . . . 110,000 * — 110,000 * 110,000 *Phoebe Su(15) . . . . . . . . . . . . . . . . . . . . . . . . 51,385 * — 51,385 * 51,385 *All directors and executive officers as a
group(16) . . . . . . . . . . . . . . . . . . . . . . . . . . 4,252,858 15.1 — 4,252,858 14.5 4,252,858 14.5
5% stockholders:AsiaVest Opportunities Fund IV(17) . . . . . . 2,437,470 9.2 1,841,556 2,336,203 595,914 2.2 101,267 0.4Intel Capital (Cayman) Corporation and its
affiliates(18) . . . . . . . . . . . . . . . . . . . . . . . 1,695,666 6.4 1,096,202 1,390,645 599,464 2.2 549,764 2.0Mr. Kuai Lap Tai and Ms. Iong Wa
Chao(19) . . . . . . . . . . . . . . . . . . . . . . . . . . 1,312,000 5.0 400,000 400,000 912,000 3.3 912,000 3.3
Other Selling Stockholders:Mr. Xunren Yang and Ms. Shuzhuang
Liang(20) . . . . . . . . . . . . . . . . . . . . . . . . . . 804,000 3.0 400,000 400,000 404,000 1.5 404,000 1.5Translink Capital Partners I, L.P.(21) . . . . . . 461,572 1.7 92,315 92,315 369,257 * 369,257 *Venglobal Capital Fund II, L.P.(22) . . . . . . . 400,000 1.5 200,000 200,000 200,000 * 200,000 *Wu, Liang(23) . . . . . . . . . . . . . . . . . . . . . . . . 400,000 1.5 160,000 160,000 240,000 * 240,000 *SCP AIV I, Ltd.(24) . . . . . . . . . . . . . . . . . . . 134,000 * 67,000 67,000 67,000 * 67,000 *Christine S. Chang(25) . . . . . . . . . . . . . . . . . 42,691 * 18,000 18,000 24,691 * 24,691 *SF Vest, LLC(26) . . . . . . . . . . . . . . . . . . . . . 40,236 * 30,399 38,564 9,837 * 1,672 *Caroline T. Cheng(27) . . . . . . . . . . . . . . . . . 40,000 * 25,000 25,000 15,000 * 15,000 *Riverwood Capital LLC(28) . . . . . . . . . . . . . 20,743 * 15,672 19,881 5,071 * 862 *Shuchen Tina Wang(29) . . . . . . . . . . . . . . . . 5,104 * 3,856 4,892 1,248 * 212 *
* Beneficially owns less than 1% of our outstanding ordinary shares.(1) Includes 400,000 ordinary shares that may be acquired through exercise of share options, all of which are subject
to our company’s right of repurchase, which right lapses as the options vest according to their vesting schedule;and excludes 804,000 ordinary shares held jointly by Mr. Yang’s parents, who do not live in the same householdas Mr. Yang. Mr. Yang disclaims beneficial ownership of the ordinary shares held by his parents.
(2) Includes 400,000 ordinary shares that may be acquired through exercise of share options, all of which aresubject to our company’s right of repurchase, which right lapses as the options vest according to their vestingschedule; and excludes 1,312,000 ordinary shares held jointly by Mr. Tai’s parents, who do not live in thesame household as Mr. Tai. Mr. Tai disclaims beneficial ownership of the ordinary shares held by his parents.
(3) Includes 32,000 ordinary shares that may be acquired through exercise of share options, 8,000 of which aresubject to our company’s right of repurchase, which right lapses as the options vest according to theirvesting schedule.
(4) Includes 8,000 ordinary shares that may be acquired through exercise of share options, 5,167 of which aresubject to our company’s right of repurchase, which right lapses as the options vest according to theirvesting schedule.
(5) Includes 8,000 ordinary shares that may be acquired through exercise of share options, 6,000 of which aresubject to our company’s right of repurchase, which right lapses as the options vest according to theirvesting schedule.
(6) Includes 160,000 ordinary shares that may be acquired through exercise of share options, 93,333 of whichare subject to our company’s right of repurchase, which right lapses as the options vest according to theirvesting schedule.
(7) Includes 277,280 ordinary shares that may be acquired through exercise of share options, 8,000 of which aresubject to our company’s right of repurchase, which right lapses as the options vest according to theirvesting schedule.
109

(8) Includes 8,000 ordinary shares that may be acquired through exercise of share options, all of which aresubject to our company’s right of repurchase, which right lapses as the options vest according to theirvesting schedule.
(9) Includes 59,417 ordinary shares that may be acquired through exercise of share options.(10) Includes 12,333 ordinary shares that may be acquired through exercise of share options, 10,166 of which are
subject to our company’s right of repurchase, which right lapses as the options vest according to theirvesting schedule.
(11) Includes 96,000 ordinary shares that may be acquired through exercise of share options, 31,833 of which aresubject to our company’s right of repurchase, which right lapses as the options vest according to theirvesting schedule.
(12) Includes 128,000 ordinary shares that may be acquired through exercise of share options, 8,000 of which aresubject to our company’s right of repurchase, which right lapses as the options vest according to theirvesting schedule.
(13) Includes 40,000 ordinary shares that may be acquired through exercise of share options, 20,833 of which aresubject to our company’s right of repurchase, which right lapses as the options vest according to theirvesting schedule.
(14) Includes 80,000 ordinary shares that may be acquired through exercise of share options, all of which aresubject to our company’s rights of repurchase, which right lapses as the options vest according to theirvesting schedule.
(15) Includes 40,667 ordinary shares that may be acquired through exercise of share options.(16) Includes 1,749,696 ordinary shares that may be acquired through share options, 1,079,333 of which are
subject to our company’s right of repurchase, which right lapses as the options vest according to theirvesting schedule.
(17) AsiaVest Opportunities Fund IV is a Cayman Islands limited liability company. The manager of AsiaVestOpportunities Fund IV is AsiaVest Partners, TCW/YFY Ltd., a Cayman Island company. The investmentcommittee of AsiaVest Partners TCW/YFY Ltd., which consists of T. J. Huang, Henry Shaw, HarveyChang, Marc Stern and Clifford Mak, exercises the voting and dispositive power over our shares owned byAsiaVest Opportunities Fund IV. AsiaVest Partners TCW/YFY Ltd. is a joint venture between AsiaVestInvestment Ltd., a British Virgin Islands company and TCW (TSOP), Ltd., a Cayman Island company. Theaddress of AsiaVest Opportunities Fund IV is Ugland House, P.O. Box 309, George Town, Grand Cayman,Cayman Islands.
(18) Includes 1,450,924 ordinary shares held directly by Intel Capital (Cayman) Corporation, an exemptedcompany incorporated in the Cayman Islands wholly owned by Intel Corporation, and 244,742 ordinaryshares held directly by Intel Capital Corporation, a Delaware corporation wholly owned by IntelCorporation. The shares of Intel Corporation are listed on NASDAQ. The registered office of Intel Capital(Cayman) Corporation is Caledonian Trust (Cayman) Limited, Caledonian House, 69 Dr. Roy’s Dr., POBox 1043, George Town, Grand Cayman, Cayman Islands.
(19) Mr. Tai and Ms. Chao are Mr. Stephen Tai’s parents and do not live in the same household as Mr. StephenTai. Mr. Stephen Tai disclaims beneficial ownership of the ordinary shares held by Mr. Tai and Ms. Chao.The address of Mr Tai Kuai Lap and Ms. Chao Iong Wa is Room 2404, Tower 9, Century Metropolis, 168Hong Qiao Road, Shanghai, China.
(20) Mr. Xunren Yang and Ms. Shuzhuang Liang are Mr. Howard C. Yang’s parents and do not live in the samehousehold as Mr. Howard C. Yang. Mr. Howard C. Yang disclaims beneficial ownership of the ordinaryshares held by Mr. Yang and Ms. Liang. The address of Mr. Xunren Yang and Ms. Shuzhuang Liang is1720 Hong Qiao Road, Building 9, Suite 10F, Shanghai, China.
(21) Translink Capital Partners I, L.P., incorporated in the Cayman Islands as a limited partnership, is controlledby Translink Management I, LLC as its General Partner. The investment committee of TranslinkManagement I, LLC, consisting of Jackie Yang, Jay Eum and Toshiya Otani, exercises the voting anddispositive power over our shares owned by Translink Capital Partners I, L.P. The address of TranslinkCapital Partners I, L.P. is 228 Hamilton Ave. Suite 210, Palo Alto, California, 94301.
110

(22) Venglobal Capital Fund II, L.P. incorporated in California, the United States as a limited partnership, iscontrolled by VenGlobal Capital Partners II, L.L.C., a California limited liability company. The managingmembers of VenGlobal Capital Partners II, L.L.C., consisting of Gary Y. Cheng and Phil Mak, exercise thevoting and dispositive power over our shares owned by Venglobal Capital Fund II, L.P. The address ofVenglobal Capital Fund II, L.P. is 2053 Grant Road PMB 378, Los Altos, California, 94024.
(23) Mr. Liang Wu’s address is Room 401, 4 Dan Yuan, Cha Qiu Nong, Shiwukui Alley, Hangzhou, China.(24) SCP AIV I, Ltd., incorporated in the British Virgin Islands as a BVI Business Company, is controlled by
Sagamore China Partners II, L.P., a Cayman Islands exempted limited partnership. Sagamore ChinaPartners II, L.P. is controlled by Sagamore China General Partner II, L.P., a Cayman Islands exemptedlimited partnership. Sagamore China General Partner II, L.P. is controlled by Sagamore China GP IILimited, a Cayman Islands exempted limited partnership. The board of directors of Sagamore China GP IILimited consisting of Rodrigo Yang, exercises the voting and dispositive power over our shares owned bySCP AIV I, Ltd. The address of SCP AIV I, Ltd. is 100 Painters Mill Road, Suite 700, Owings Mills,Maryland, 21117.
(25) Includes 6,859 ordinary shares held directly by Christine S. Chang and 35,832 ordinary shares held by theChristine and Dick Chang Trust dated March 16, 2004. Christine S. Chang, as trustees of the Christine andDick Chang Trust dated March 16, 2004, holds voting and dispositive power over our shares held by thetrust. The address of Ms. Chang is 1150 Bay Laurel Drive, Menlo Park, California, 94025.
(26) SFVest, LLC is a limited liability company in Commonwealth of Virginia. The manager of SFVest, LLCMichael Marks, exercises voting and dispositive power over ours shares owned by SFVest, LLC. Theaddress of SFVest, LLC is 9030 Stony Point Parkway Suite 400 Richmond, Virginia.
(27) Caroline T. Cheng’s address is 126601 Arroyo De Arguello, Saratoga, California, 95070.(28) Riverwood Capital LLC is a Delaware limited liability company. The investment committee of Riverwood
Capital LLC, which consists of Micheal Marks, Thomas Smach, Christopher Varelas, Nicholas Brathwaitz,Jeffery Parks and Francisco Alvarez, exercises voting and dispositive power over our shares owned byRiverwood Capital LLC. The address of Riverwood Capital LLC is 70 Willow Road, Menlo Park,California, the United States.
(29) Ms. Shuchen Tina Wang’s address is 10118 Randy Lane Cupertino, California, 95014.
111

DESCRIPTION OF SHARE CAPITAL
We were incorporated as an international business company with limited liability under InternationalBusiness Companies Act, 1984 of the British Virgin Islands on March 29, 2004 and continued to, and registeredin the Cayman Islands as an exempted company on April 24, 2006. Our affairs are currently governed by ouramended and restated memorandum and articles of association and the Companies Law, Cap 22 (Law 3 of 1961,as consolidated and revised) of the Cayman Islands, which we refer to as the Companies Law below.
Our authorized share capital consists of 200,000,000 ordinary shares, $0.0125 par value per share. As ofDecember 31, 2013, there were 26,498,043 ordinary shares issued and outstanding.
A Cayman Islands exempted company is a company that conducts its business outside the Cayman Islandsand is accordingly exempted from certain requirements or enjoy certain accommodations of the CaymanCompanies law. As a result, we are not required to file an annual report of our shareholders with the Registrar ofCompanies or make our register of shareholders open to inspection. We also may obtain an undertaking againstthe imposition of any future taxation.
The following are summaries of material provisions of our amended and restated memorandum and articlesof association and the Companies Law insofar as they relate to the material terms of our ordinary shares. Ouramended and restated memorandum and articles of association have been filed as exhibits to the registrationstatement of which this prospectus is a part.
Ordinary Shares
The following discussion primarily concerns our ordinary shares and the rights of holders of ordinaryshares.
All of our outstanding ordinary shares are fully paid and non-assessable and issued in registered form. Ourshareholders who are non-residents of the Cayman Islands may freely hold and vote their ordinary shares.
Meetings
Shareholders’ meetings may be convened by a majority of our board of directors or chairman and may notbe called by any other person. Advance notice of at least ten calendar days is required for the convening of ourannual general meeting and any other general meeting of our shareholders. A quorum required for a meeting ofshareholders consists of at least two shareholders present or by proxy, representing not less than one-third innominal value of the total issued voting shares in our company.
Notwithstanding that a meeting is called by shorter notice than that mentioned above, but, subject to theCompanies Law, it will be deemed to have been duly called, if it is so agreed in the case of a meeting called as anannual general meeting by all of our shareholders entitled to attend and vote at the meeting; and in the case ofany other meeting, by a majority in number of the shareholders holding not less than 95% in nominal value of theissued shares giving that right.
No business other than the appointment of a chairman may be transacted at any general meeting unless aquorum is present at the commencement of business. However, the absence of a quorum will not preclude theappointment of a chairman. If present, the chairman of our board of directors shall be the chairman presiding atany shareholders’ meetings.
A corporation being a shareholder shall be deemed for the purpose of our amended and restated articles ofassociation to be present in person if represented by its duly authorized representative being the person appointedby resolution of the directors or other governing body of such corporation to act as its representative at the
112

relevant general meeting or at any relevant general meeting of any class of our shareholders. Such dulyauthorized representative shall be entitled to exercise the same powers on behalf of the corporation that herepresents as that corporation could exercise if it were our individual shareholder.
The quorum for a separate general meeting of the holders of a separate class of shares is described in “—Variation of Rights” below.
No business may be transacted at any general meeting, other than business that is either (i) specified in thenotice of meeting (or any supplement thereto) given by or at the direction of the board of directors (or any dulyauthorized committee thereof), (ii) otherwise properly brought before an annual general meeting by or at thedirection of the board (or any duly authorized committee thereof) or (iii) otherwise properly brought before anannual general meeting by any shareholder of our company who (1) is a shareholder of record on both (x) thedate of the giving of the notice by such shareholder provided for in the amended and restated articles ofassociation and (y) the record date for the determination of shareholders entitled to vote at such annual generalmeeting and (2) complies with the notice procedures set forth in our amended and restated articles of association.
Our amended and restated articles of association do not allow our shareholders to approve matters to bedetermined at shareholders’ meetings by way of written resolutions without a meeting.
Voting Rights
In respect of all matters requiring a shareholders’ vote, each ordinary share is entitled to one vote. At anygeneral meeting, a resolution is to be decided on a show of hands unless voting by way of a poll is demanded by(i) the chairman of the meeting, (ii) at least three members present in person or, in the case of a member being acorporation, by its duly authorized representative or by proxy for the time being entitled to vote at the meeting(iii) any member or members present in person or, in the case of a member being a corporation, by its dulyauthorized representative or by proxy and representing not less than one-tenth of the total voting rights of all themembers having the right to vote at the meeting, (iv) a member or members present in person or, in the case ofmember being a corporation, by its duly authorized representative or by proxy and holding shares in ourcompany conferring a right to vote at the meeting being shares on which an aggregate sum has been paid equal tonot less than one-tenth of the total sum paid up on all the shares conferring that right, or (v) if required by therules of the NASDAQ, by any director or directors who, individually or collectively, hold proxies in respect ofshares representing 5% or more of the total voting rights at such meeting.
No shareholder shall be entitled to vote or be reckoned in a quorum, in respect of any share, unless suchshareholder is duly registered as our shareholder and all calls or installments due by such shareholder to us havebeen paid.
If a clearing house (or its nominee(s)) or a central depositary entity, being a corporation, is our shareholder,it may authorize such person or persons as it thinks fit to act as its representative(s) at any meeting or at anymeeting of any class of shareholders provided that, if more than one person is so authorized, the authorizationshall specify the number and class of shares in respect of which each such person is so authorized. A personauthorized pursuant to this provision is entitled to exercise the same powers on behalf of the clearing house orcentral depositary entity (or its nominee(s)) as if such person was the registered holder of our shares held by thatclearing house or central depositary entity (or its nominee(s)) including the right to vote individually on a showof hands.
While there is nothing under the laws of the Cayman Islands which specifically prohibits or restricts thecreation of cumulative voting rights for the election of directors of our company, it is not a concept that isaccepted as an ordinary practice in the Cayman Islands, and our company has made no provisions in ouramended and restated articles of association to allow cumulative voting for such elections.
113

Calls on Shares and Forfeiture of Shares
Subject to our amended and restated memorandum and articles of association and to the terms of allotment,our directors may from time to time make such calls upon the members in respect of any amounts unpaid on theshares held by them. The shares that have been called upon and remain unpaid on the specified time are subjectto forfeiture.
Protection of Minority Shareholders
The Cayman Islands courts ordinarily would be expected to follow English case law precedents whichpermit a minority shareholder to commence a representative action against or derivative actions in the name ofthe company to challenge (a) an act which is ultra vires the company or illegal, (b) an act which constitutes afraud against the minority and regarding which the wrongdoers are themselves in control of the company, and(c) an irregularity in the passing of a resolution which requires a qualified (or special) majority.
In the case of a company (not being a bank) having its share capital divided into shares, the Grand Court ofthe Cayman Islands may, on the application of members holding not less than one fifth of the shares of thecompany in issue, appoint an inspector to examine the affairs of the company and to report thereon in suchmanner as the Grand Court of the Cayman Islands shall direct.
Any of our shareholders may petition the Grand Court of the Cayman Islands which may make a winding uporder if the Grand Court of the Cayman Islands is of the opinion that it is just and equitable that we should bewound up or, as an alternative to a winding up order, (a) an order regulating the conduct of our affairs in thefuture, (b) an order requiring us to refrain from doing or continuing an act complained of by the shareholderpetitioner or to do an act which the shareholder petitioner has complained we have omitted to do, (c) an orderauthorizing civil proceedings to be brought in our name and on our behalf by the shareholder petitioner on suchterms as the Grand Court of the Cayman Islands may direct, or (d) an order providing for the purchase of theshares of any of our shareholders by other shareholders or us and, in the case of a purchase by us, a reduction ofour capital accordingly.
Generally, claims against us must be based on the general laws of contract or tort applicable in the CaymanIslands or individual rights as shareholders as established by our amended and restated articles of association.
Pre-Emption Rights
There are no pre-emption rights applicable to the issue of new shares under either Cayman Islands law orour amended and restated memorandum and articles of association.
Liquidation Rights
Subject to any future shares which are issued with specific rights, (a) if we are wound up and the assetsavailable for distribution among our shareholders are more than sufficient to repay the whole of the capital paidup at the commencement of the winding up, the excess shall be distributed pari passu among those shareholdersin proportion to the amount paid up at the commencement of the winding up on the shares held by them,respectively, and (b) if we are wound up and the assets available for distribution among the shareholders as suchare insufficient to repay the whole of the paid-up capital, those assets shall be distributed so that, as nearly asmay be, the losses shall be borne by the shareholders in proportion to the capital paid up at the commencement ofthe winding up on the shares held by them, respectively.
If we are wound up (whether the liquidation is voluntary or by the court), the liquidator may with thesanction of our special resolution and any other sanction required by the Companies Law, divide among ourshareholders in specie or kind the whole or any part of our assets (whether or not they shall consist of property of
114

the same kind) and may, for such purpose, set such value as the liquidator deems fair upon any property to bedivided and may determine how such division shall be carried out as between the shareholders or differentclasses of shareholders. The liquidator may also vest the whole or any part of these assets in trustees upon suchtrusts for the benefit of the shareholders as the liquidator shall think fit, but so that no shareholder will becompelled to accept any assets, shares or other securities upon which there is a liability.
Variation of Rights
Alterations to our amended and restated memorandum and articles of association may only be made byspecial resolution, meaning a majority of not less than two-thirds of votes cast at a shareholders’ meeting.
If at any time, our share capital is divided into different classes of shares, all or any of the special rightsattached to any class of shares may, subject to the provisions of the Companies Law, be varied with the sanctionof a special resolution passed at a general meeting of the holders of the shares of that class. Consequently, therights of any class of shares cannot be detrimentally altered without a majority of two-thirds of the vote of all ofthe shares in that class. The provisions of our amended and restated articles of association relating to generalmeetings shall apply similarly to every such separate general meeting, but so that the quorum for the purposes ofany such separate general meeting or at the adjourned meeting shall be a person or persons together holding (orrepresented by proxy) on the date of the relevant meeting not less than one-third in nominal value of the issuedshares of that class, that every holder of shares of the class shall be entitled on a poll to one vote for every suchshare held by such holder and that any holder of shares of that class present in person or by proxy may demand apoll.
The rights conferred upon the holders of the shares of any class issued with preferred or other rights shallnot, unless otherwise expressly provided by the terms of issue of the shares of that class, be deemed to be variedby the creation or issue of further shares ranking pari passu with such existing class of shares.
Alteration of Capital
We may from time to time by ordinary resolution in accordance with the Companies Law alter theconditions of our amended and restated memorandum of association to:
• increase our capital by such sum, to be divided into shares of such amounts, as the resolution shallprescribe;
• consolidate and divide all or any of our share capital into shares of larger amounts than our existingshares;
• cancel any shares which at the date of the passing of the resolution have not been taken or agreed to betaken by any person, and diminish the amount of its share capital by the amount of the shares socancelled subject to the provisions of the Companies Law;
• sub-divide our shares or any of them into shares of smaller amount than is fixed by our amended andrestated memorandum of association, subject nevertheless to the Companies Law, so that the resolutionwhereby any share is sub-divided may determine that, as between the holders of the shares resultingfrom such subdivision, one or more of the shares may have any such preferred or other rights, or mayhave such deferred rights or be subject to any such restrictions as compared with the others, as we havepower to attach to unissued or new shares; and
• divide shares into several classes and without prejudice to any special rights previously conferred onthe holders of existing shares, attach to the shares respectively any preferential, deferred, qualified orspecial rights, privileges, conditions or such restrictions that in the absence of any such determinationin a general meeting may be determined by our directors.
115

We may, by special resolution, subject to any confirmation or consent required by the Companies Law,reduce our share capital or any capital redemption reserve in any manner authorized by law.
Transfer of Shares
Subject to any applicable restrictions set forth in our amended and restated articles of association, including,for example, the board of directors’ discretion to refuse to register a transfer of any share (not being a fully paidup share) to a person of whom it does not approve, or any share issued under share incentive plans for employeesupon which a restriction on transfer imposed thereby still subsists, or a transfer of any share to more than fourjoint holders, any of our shareholders may transfer all or any of his or her shares by an instrument of transfer inthe usual or common form or in a form prescribed by the NASDAQ or in another form that our directors mayapprove.
Our directors may decline to register any transfer of any share which is not paid up or on which we have alien. Our directors may also decline to register any transfer of any share unless:
• the instrument of transfer is lodged with us and is accompanied by the certificate for the shares towhich it relates and such other evidence as our directors may reasonably require to show the right ofthe transferor to make the transfer;
• the instrument of transfer is in respect of only one class of share;
• the instrument of transfer is properly stamped (in circumstances where stamping is required); and
• fee of such maximum sum as the NASDAQ may determine to be payable or such lesser sum as ourdirectors may from time to time require is paid to us in respect thereof.
If our directors refuse to register a transfer, they shall, within three months after the date on which theinstrument of transfer was lodged, send to each of the transferor and the transferee notice of such refusal.
The registration of transfers may, after compliance with any notice requirement of the NASDAQ, besuspended and the register closed at such times and for such periods as our directors may from time to timedetermine; provided, however, that the registration of transfers shall not be suspended nor the register closed formore than 30 days in any year as our directors may determine.
Register of Members
In accordance with Section 48 of the Companies Law, the register of members is prima facie evidence of theregistered holder or member of shares of a company. Therefore, a person becomes a registered holder or memberof shares of the company only upon entry being made in the register of members. Entries of any change in theshares and member information, including allotment, transfer, consolidation, subdivision or cancellation, need tobe made in the register as and when completed or notified. The register of members of our Company is notrequired to be maintained in the Cayman Islands and our directors will maintain one register of members, at theoffice of Computershare Trust Company NA, 250 Royall St., Canton MA 02021.
Share Repurchases
We are empowered under our memorandum of association to purchase our shares subject to the CompaniesLaw and our amended articles of association. Our amended articles of association provide that this power isexercisable by our board of directors in such manner, upon such terms and subject to such conditions as it in itsabsolute discretion thinks fit subject to the Companies Law and, where applicable, the rules of the NASDAQ andthe applicable regulatory authority.
116
Under the Companies Law, a redemption or purchase may be made out of profits, or the proceeds of a newissue of shares made for the purpose of the redemption or purchase, or out of capital provided that the requisitesolvency requirements under the Companies Law are met. No redemption or purchase may take place unless theshares are fully paid, or if as a result of the redemption or purchase, there would no longer be any other memberof the company holding shares. Shares redeemed may be held in treasury or may be cancelled and are availablefor reissue.
Dividends
Subject to the Companies Law, our company in a general meeting or our directors may declare dividends inany currency to be paid to our shareholders but no dividend shall be declared in excess of the amountrecommended by our board of directors. Dividends may be declared and paid out of our profits, realized orunrealized, or from any reserve set aside from profits which our directors determine is no longer needed. Ourboard of directors may also declare and pay dividends out of the share premium account or any other fund oraccount that can be authorized for this purpose in accordance with the Companies Law.
Except in so far as the rights attaching to, or the terms of issue of, any share otherwise provides, (a) alldividends shall be declared and paid according to the amounts paid up on the shares in respect of which thedividend is paid, but no amount paid up on a share in advance of calls shall be treated for this purpose as paid upon that share and (b) all dividends shall be apportioned and paid pro rata according to the amounts paid up on theshares during any portion or portions of the period in respect of which the dividend is paid.
Our directors may also pay interim dividends, whenever our financial position, in the opinion of ourdirectors, justifies such payment.
Our directors may deduct from any dividend or bonus payable to any shareholder all sums of money (if any)presently payable by such shareholder to us on account of calls or otherwise.
No dividend or other money payable by us on or in respect of any share shall bear interest against us.
In respect of any dividend proposed to be paid or declared on our share capital, our directors may resolveand direct that (a) such dividend be satisfied wholly or in part in the form of an allotment of shares credited asfully paid up, provided that our shareholders entitled thereto will be entitled to elect to receive such dividend (orpart thereof if our directors so determine) in cash in lieu of such allotment or (b) the shareholders entitled to suchdividend will be entitled to elect to receive an allotment of shares credited as fully paid up in lieu of the whole orsuch part of the dividend as our directors may think fit. Our shareholders may, upon the recommendation of ourdirectors, by ordinary resolution resolve in respect of any particular dividend that, notwithstanding the foregoing,a dividend may be satisfied wholly in the form of an allotment of shares credited as fully paid up without offeringany right to shareholders to elect to receive such dividend in cash in lieu of such allotment.
Any dividend interest or other sum payable in cash to the holder of shares may be paid by check or warrantsent by mail addressed to the holder at his registered address, or addressed to such person and at such addressesas the holder may direct. Every check or warrant shall, unless the holder or joint holders otherwise direct, bemade payable to the order of the holder or, in the case of joint holders, to the order of the holder whose namestands first on the register in respect of such shares, and shall be sent at his or their risk and payment of the checkor warrant by the bank on which it is drawn shall constitute a good discharge to us.
All dividends unclaimed for one year after having been declared may be invested or otherwise made use ofby our board of directors for the benefit of our company until claimed. Any dividend unclaimed after a period ofsix years from the date of declaration of such dividend shall be forfeited and revert to us.
117

Whenever our directors have resolved that a dividend be paid or declared, our directors may further resolvethat such dividend be satisfied wholly or in part by the distribution of specific assets of any kind, and inparticular of paid up shares, debentures or warrants to subscribe for our securities or securities of any othercompany. Where any difficulty arises with regard to such distribution, our directors may settle it as they thinkexpedient. In particular, our directors may issue fractional certificates, ignore fractions altogether or round thesame up or down, fix the value for distribution purposes of any such specific assets, determine that cashpayments shall be made to any of our shareholders upon the footing of the value so fixed in order to adjust therights of the parties, vest any such specific assets in trustees as may seem expedient to our directors, and appointany person to sign any requisite instruments of transfer and other documents on behalf of the persons entitled tothe dividend, which appointment shall be effective and binding on our shareholders.
Untraceable Shareholders
We are entitled to sell any shares of a shareholder who is untraceable, provided that:
• all checks or warrants in respect of dividends of such shares, not being less than three in number, forany sums payable in cash to the holder of such shares have remained un-cashed for a period of 12 yearsprior to the publication of the advertisement and during the three months referred to in the third bulletpoint below;
• we have not during that time received any indication of the whereabouts or existence of the shareholderor person entitled to such shares by death, bankruptcy or operation of law; and
• we, if so required by the rules of the NASDAQ, have caused an advertisement to be published innewspapers in accordance with such applicable rules giving notice of our intention to sell these shares,and a period of three months (or such shorter period as permitted under the applicable rules) haselapsed since such advertisement.
The net proceeds of any such sale shall belong to us, and when we receive these net proceeds we shallbecome indebted to the former shareholder for an amount equal to such net proceeds.
Inspection of Books and Records
Holders of our ordinary shares will have no general right under Cayman Islands law to inspect or obtaincopies of our list of shareholders or our corporate records. However, we will provide our shareholders withannual audited financial statements. See “Where You Can Find More Information.”
Registration Rights
Upon completion of this offering and assuming no exercise of the underwriters’ option to purchaseadditional shares, holders of approximately 13,124,272 of our outstanding ordinary shares initially issued uponconversion of preferred shares upon our initial public offering will continue to be entitled to registration rights,assuming the underwriters do not exercise their option to purchase additional shares. These shares are referred toas registrable securities.
Demand Registration Rights
At any time after the date that is six months after September 25, 2013, the holders of 33% or more of ourthen outstanding registrable securities may require us, upon written request, to file a registration under theSecurities Act with an anticipated aggregate price to the public of at least $10 million. We will be obligated touse our best efforts to register the sale of all registrable securities that holders of registrable securities request inwriting to be registered within 20 days of the mailing of a notice by us to all holders of such registration. We areobliged to effect no more than two such demand registrations which are declared or ordered effective. We havethe right to defer filing the registration statement for a period of no more than 90 days if our board of directors in
118

good faith determines that filing of such registration will be seriously detrimental to us and our shareholders, butwe cannot utilize this right more than once in any 12-month period. Additionally, we are not required to effectthe filing of a registration statement during the period beginning 60 days prior to our good faith estimate of thedate of the filing of, and ending on a date 180 days following the effective date of, a registration initiated by us.
Form S-3 Registration Rights
Holders of registrable securities may also require us to effect a registration on Form S-3 and any relatedqualification or compliance, as applicable, for a public offering of all or a part of their registrable securitiesunless a Form S-3 is not available for such offering or the aggregate price to the public of the shares offered isless than $1.0 million. We have the right to defer such filing for a period of no more than 90 days if our board ofdirectors in good faith determines that filing of such registration will be materially detrimental to us and ourshareholders, but we cannot utilize this right more than once during any 12-month period. Additionally, we arenot required to effect the filing of a registration statement during the period ending on a date 180 days followingthe effective date of a registration initiated by us.
Piggyback Registration Rights
Holders of registrable securities also have “piggyback” registration rights, pursuant to which they mayrequire us to register all or any part of the registrable securities then held by such holders when we file anyregistration statement for purposes of effecting a public offering of our securities. The underwriters of anyunderwritten offering will have the right to limit the number of shares with registration rights to be included inthe registration statement, subject to certain conditions.
Expenses of Registration
We are required to pay all expenses incurred by us in complying with any demand, Form S-3 or piggybackregistration. In addition, we are required to pay for counsel to the Company and one counsel to the selling holdersand all the selling shareholders of registrable securities in the registration. We are not required to pay anyunderwriting discounts and selling commissions applicable to the sale of registered securities nor are we requiredto pay for any expenses of any demand registration if the request is subsequently withdrawn at the request of amajority of the holders of the registrable securities to be registered, subject to limited exceptions.
We will have no obligations to effect any demand, S-3 or piggyback registration with respect to anyregistrable securities after five years following the consummation of this offering.
119

SHARES ELIGIBLE FOR FUTURE SALE
Future sales of substantial amounts of our ordinary shares in the public market following this offering orperception that such future sales may occur could adversely affect the prevailing market price of our ordinaryshares from time to time and could impair our ability to raise equity capital in the future.
Upon completion of this offering, we will have approximately 27,498,043 outstanding ordinary shares. Allof the ordinary shares sold in this offering will be freely transferable without restriction or further registrationunder the Securities Act, except for any ordinary shares purchased by our “affiliates” as that term is defined inRule 144 under the Securities Act. Rule 144 defines an affiliate of a company as a person that, directly orindirectly, through one or more intermediaries, controls or is controlled by, or is under common control with, ourcompany. Restricted securities may be sold on the NASDAQ Global Market only if they are sold pursuant to aneffective registration statement under the Securities Act or an exemption from the registration requirement of theSecurities Act such as those provided for in Rules 144 and 701 promulgated under the Securities Act, which rulesare summarized below. Restricted ordinary shares may also be sold outside of the United States in accordancewith Regulation S under the Securities Act. This prospectus may not be used in connection with any resale of ourordinary shares acquired in this offering by our affiliates.
Rule 144
In general, under Rule 144 as currently in effect, a person who has owned our restricted securities for atleast six months is entitled to sell the restricted securities without registration under the Securities Act, subject tocertain restrictions. Persons who are our affiliates (as that term is defined in Rule 144) may sell within any three-month period a number of restricted securities that does not exceed the greater of the following:
• 1% of the number of our ordinary shares then outstanding, which will equal approximately sharesimmediately after this offering; and
• the average weekly trading volume of our ordinary shares on the NASDAQ Global Market during thefour calendar weeks preceding the date on which notice of the sale is filed with the SEC.
Such sales are also subject to manner-of-sale provisions, notice requirements and the availability of currentpublic information about us. Persons who are not our affiliates and have owned our restricted securities for morethan six months but not more than one year may sell the restricted securities without registration under theSecurities Act subject to the availability of current public information about us. Persons who are not our affiliatesand have beneficially owned our restricted securities for more than one year may freely sell the restrictedsecurities without registration under the Securities Act.
Share Options
Rule 701
In general, under Rule 701 of the Securities Act as currently in effect, each of our employees, consultants oradvisors who purchases our ordinary shares from us in connection with a compensatory option plan or otherwritten agreement relating to compensation is eligible to resell such ordinary shares 90 days after we became areporting company under the Exchange Act in reliance on Rule 144, but without compliance with some of therestrictions, including the holding period contained in Rule 144.
Form S-8
We have filed a registration statement on Form S-8 under the Securities Act covering all ordinary shareswhich are either subject to outstanding options granted prior to our initial public offering or that may be issuedpursuant to equity awards which may be granted following our initial public offering under our 2006 ShareIncentive Plan or our 2013 Performance Incentive Plan. Shares registered on Form S-8 generally may be sold in
120

the open market, except to the extent that the shares are (i) held by affiliates has defined in Rule 144, who are,however, eligible to resell such ordinary shares in reliance on Rule 144 but without compliance with the holdingperiod restriction contracted in Rule 144, or (ii) subject to vesting restrictions or lock-up or other contractualrestrictions.
Registration Rights
Certain holders of our outstanding shares are entitled to request that we register their ordinary shares underthe Securities Act, following the expiration of the lockup agreements described below. For a further descriptionof these registration rights, see “Description of Share Capital—Registration Rights.”
Lock-Up Agreements
In connection with our initial public offering, we, our executive officers and directors and all of our existingshareholders that were shareholders prior to our initial public offering agree, with exceptions, not to sell ortransfer any ordinary shares or securities convertible into, exchangeable or exercisable for ordinary shares for180 days after the date of our initial public offering without first obtaining the written consent of Deutsche BankSecurities Inc. and Barclays Capital Inc. Specifically, we and these other individuals have agreed not to directlyor indirectly:
• offer, pledge, sell, contract to sell, sell any option or contract to purchase, purchase any option orcontract to sell, grant any option, right or warrant to purchase, lend or otherwise transfer or dispose of,directly or indirectly, any ordinary shares or any securities convertible into or exercisable orexchangeable for ordinary shares; or
• enter into any hedge or other arrangement that transfers to another, in whole or in part, any of theeconomic consequences of ownership of our ordinary shares;
whether any transaction described above is to be settled by delivery of ordinary shares or such othersecurities, in cash or otherwise.
121

TAXATION
The following is a summary of the material Cayman Islands, PRC and United States federal income taxconsequences of an investment in our ordinary shares. The summary is not intended to be, nor should it beconstrued as, legal or tax advice to any particular prospective purchaser. The summary is based on laws andrelevant interpretations thereof in effect as of the date of this prospectus, all of which are subject to change ordifferent interpretations, possibly with retroactive effect. The discussion does not deal with all possible taxconsequences relating to an investment in our ordinary shares, such as U.S. state or local tax laws, or tax laws ofjurisdictions other than the Cayman Islands, the PRC and the United States. To the extent that the discussionrelates to matters of Cayman Islands tax law, it represents the opinion of Conyers, Dill & Pearman (Cayman)Limited, special Cayman Islands counsel to us. To the extent that the discussion relates to matters of PRC taxlaw, it represents the opinion of Commerce & Finance Law Offices. To the extent the discussion relates tomatters of current U.S. federal income tax law, and subject to the qualifications herein, it represents the opinionof O’Melveny & Myers LLP, our special U.S. counsel. You should consult your own tax advisors with respect tothe consequences of acquisition, ownership and disposition of our ordinary shares.
Cayman Islands Taxation
The Cayman Islands currently levies no taxes on individuals or corporations based upon profits, income,gains or appreciation and there is no taxation in the nature of inheritance tax or estate duty or withholding taxapplicable to us or to any holder of our ordinary shares. There are no other taxes likely to be material to us leviedby the Government of the Cayman Islands except for stamp duties, which may be applicable on instrumentsexecuted in, or after execution brought within the jurisdiction of the Cayman Islands. No stamp duty is payable inthe Cayman Islands on transfers of shares of Cayman Islands companies, except those which hold interests inland in the Cayman Islands. The Cayman Islands is not party to any double tax treaties. There are no exchangecontrol regulations or currency restrictions in the Cayman Islands.
Pursuant to Section 6 of the Tax Concessions Law (2011 Revision) of the Cayman Islands, we haveobtained an undertaking from the Governor-in-Cabinet:
• that no law which is enacted in the Cayman Islands imposing any tax to be levied on profits or incomeor gains or appreciation shall apply to us or our operations; and
• that the aforesaid tax or any tax in the nature of estate duty or inheritance tax shall not be payable onour shares, debentures or other obligations.
The undertaking for us is for a period of twenty years from April 23, 2013.
People’s Republic of China Taxation
On March 16, 2007, the National People’s Congress, the PRC legislature, enacted the Enterprise IncomeTax Law, or the PRC EIT Law, which became effective on January 1, 2008, and on December 6, 2007, the StateCouncil promulgated the Implementation Rules to the Enterprise Income Tax Law, or the Implementation Rules,which also became effective on January 1, 2008. Under the PRC EIT Law and the Implementation Rules, unlessotherwise specified, foreign invested enterprises and domestic companies are subject to a uniform income taxrate of 25%. In addition, the dividends payable to foreign investors are subject to PRC withholding tax at the rateof 10% unless the foreign investor’s jurisdiction of incorporation has a tax treaty with the PRC that provides for areduced withholding tax rate. According to the Hong Kong Tax Treaty, a company incorporated in Hong Kong,will be subject to withholding income tax at a rate of 5% on dividends it receives from its PRC subsidiary if itholds a 25% or more interest in that particular PRC subsidiary. However, the SAT promulgated Circular 601 andAnnouncement 30, which provide that tax treaty benefits will be denied to “conduit” or shell companies withoutbusiness substance, and a beneficial ownership analysis will be used based on a “substance-over-the-form”principle to determine whether or not to grant tax treaty benefits. Therefore, it is unclear at this stage whether the
122

reduced rate of 5% under the Hong Kong Tax Treaty could apply to dividends from Montage Shanghai paid to usthrough our Hong Kong subsidiary. See “Risk Factors — Risk Factors Related to Regulations Applicable to Us-We may not be able to obtain certain treaty benefits on dividends paid by Montage Shanghai to us through ourHong Kong Subsidiary.”
The PRC EIT Law created a new “resident enterprise” classification which if applied could treat ourCayman Islands holding company or any of our other overseas holding companies in a manner similar to aChinese enterprise for enterprise income tax purposes. If the PRC tax authorities determine that our CaymanIslands holding company or any of our other overseas holding companies is a “resident enterprise” for PRCenterprise income tax purposes, a number of unfavorable PRC tax consequences could follow. One example isthe possibility of a 10% withholding tax being imposed on dividends we pay to our non-PRC enterpriseshareholders and with respect to gains derived by our non-PRC enterprise shareholders from transferring ourshares. See “Risk Factors — Risk Factors Related to Regulations Applicable to Us—Under the PRC enterpriseincome tax law, we may be classified as a PRC “resident enterprise,” which could result in unfavorable taxconsequences to us and our shareholders and have a material adverse effect on our results of operations and thevalue of your investment.”
United States Federal Income Taxation
This discussion describes the material U.S. federal income tax consequences of the purchase, ownership anddisposition of our ordinary shares. This discussion does not address any aspect of U.S. federal gift or estate tax,or the state, local or non-U.S. tax consequences or the Medicare tax of an investment in our ordinary shares. Thisdiscussion applies only to U.S. Holders (as defined below) who beneficially own our ordinary shares as capitalassets for U.S. federal income tax purposes. This discussion does not apply to you if you are a member of a classof holders subject to special rules, such as:
• dealers in securities or currencies;
• traders in securities that elect to use a mark-to-market method of accounting for securities holdings;
• banks or certain financial institutions;
• insurance companies;
• tax-exempt organizations;
• partnerships or other entities treated as partnerships or other pass-through entities for U.S. federalincome tax purposes or persons holding ordinary shares through any such entities;
• regulated investments companies or real estate investment trusts;
• persons that hold ordinary shares as part of a hedge, straddle, constructive sale, conversion transactionor other integrated investment;
• persons whose functional currency for tax purposes is not the U.S. dollar;
• persons liable for alternative minimum tax; or
• persons who actually or constructively own 10% or more of the total combined voting power of allclasses of our shares entitled to vote.
This discussion is based on the U.S. Internal Revenue Code of 1986, as amended, which we refer to in thisdiscussion as the Code, its legislative history, existing and proposed regulations promulgated thereunder,published rulings and court decisions, all as of the date hereof. These laws are subject to change, possibly on aretroactive basis.
123

Prospective purchasers are urged to consult their own tax advisor concerning the particular U.S. federalincome tax consequences to them of the purchase, ownership and disposition of our ordinary shares, as wellas the consequences to them arising under the laws of any other taxing jurisdiction.
For purposes of the U.S. federal income tax discussion below, you are a “U.S. Holder” if you beneficiallyown our ordinary shares and are:
• an individual citizen or resident of the United States for U.S. federal income tax purposes;
• a corporation, or other entity taxable as a corporation, that was created or organized in or under thelaws of the United States or any state thereof or the District of Columbia;
• an estate the income of which is subject to U.S. federal income tax regardless of its source; or
• a trust if (a) a court within the United States is able to exercise primary supervision over itsadministration and one or more U.S. persons have the authority to control all substantial decisions ofthe trust, or (b) the trust has a valid election in effect to be treated as a U.S. person.
For U.S. federal income tax purposes, income earned through a non-U.S. or U.S. partnership or other flow-through entity is attributed to its owners. Accordingly, if a partnership or other flow-through entity holdsordinary shares, the tax treatment of the holder will generally depend on the status of the partner or other ownerand the activities of the partnership or other flow-through entity.
Dividends on Ordinary Shares
Subject to the “Passive Foreign Investment Company” discussion below, the gross amount of any distributionsyou receive on your ordinary shares (including any withheld taxes) will generally be includible in your grossincome on the day you actually or constructively receive such income as dividend income if the distributions aremade from our current or accumulated earnings and profits, calculated according to U.S. federal income taxprinciples. We do not intend to determine our earnings and profits on the basis of U.S. federal income tax principles.Accordingly, distributions paid on our ordinary shares, if any, will generally be treated as dividend distributions forU.S. federal income tax purposes. With respect to non-corporate U.S. Holders, certain dividends received from aqualified foreign corporation may be subject to a reduced capital gains rate rather than the marginal tax ratesgenerally applicable to ordinary income. A non-U.S. corporation is treated as a qualified foreign corporation withrespect to dividends from that corporation on shares that are readily tradable on an established securities market inthe United States. U.S. Treasury Department guidance indicates that our ordinary shares, which are listed on theNASDAQ Global Market, will be readily tradable on an established securities market in the United States. Therecan be no assurance that our ordinary shares will be considered readily tradable on an established securities marketin later years. Non-corporate U.S. Holders that do not meet a minimum holding period requirement (more than 60days of ownership, without protection from the risk of loss, during the 121-day period beginning 60 days before theex-dividend date) will not be eligible for the reduced rates of taxation regardless of our status as a qualified foreigncorporation. You should consult your own tax advisor as to the rate of tax that will apply to you with respect todividend distributions, if any, you receive from us.
Dividends received on our ordinary shares will not be eligible for the dividends received deduction allowedfor corporations. Dividends generally will constitute foreign source passive income for purposes of the U.S.foreign tax credit rules. You should consult your own advisor as to your ability, and the various limitations onyour ability, to claim foreign tax credits in connection with the receipt of dividends.
Sales and Other Dispositions of Ordinary Shares
Subject to the “Passive Foreign Investment Company” discussion below, when you sell or otherwise disposeof our ordinary shares, you will generally recognize capital gain or loss in an amount equal to the differencebetween the amount realized on the sale or other disposition and your adjusted tax basis in the ordinary shares.
124

Your adjusted tax basis will generally equal the amount you paid for the ordinary shares. Any gain or loss yourecognize will be long-term capital gain or loss if your holding period in our ordinary shares is more than oneyear at the time of disposition. If you are a non-corporate U.S. Holder, including an individual, any such long-term capital gain will be taxed at preferential rates. The deductibility of a capital loss may be subject to variouslimitations. Any gain or loss recognized by you will generally be treated as U.S. source gain or loss. You shouldconsult your own tax advisor as to your ability, and the various limitations on your ability, to claim foreign taxcredits in connection with a disposition of ordinary shares.
Passive Foreign Investment Company
If we are a passive foreign investment company or “PFIC” in any taxable year in which you hold ourordinary shares, as a U.S. Holder, you would generally be subject to adverse U.S. tax consequences, in the formof increased tax liabilities and special U.S. tax reporting requirements.
In general, we will be classified as a PFIC in any taxable year if either: (a) the average quarterly value of ourgross assets that produce passive income or are held for the production of passive income is at least 50% of theaverage quarterly value of our total gross assets (the “asset test”) or (b) 75% or more of our gross income for thetaxable year is passive income (such as certain dividends, interest or royalties). For this purpose, we will betreated as owning our proportionate share of the assets and earning our proportionate share of the income of anyother corporation in which we own, directly or indirectly, at least 25% (by value) of the share. For purposes ofthe asset test: (a) any cash and cash invested in short-term, interest bearing, debt instruments, or bank depositsthat are readily convertible into cash will generally count as producing passive income or held for the productionof passive income, and (b) the total value of our assets is calculated based on our market capitalization.
We do not expect to be a PFIC for the taxable year 2013, 2014 or in the foreseeable future. Our expectationregarding our status as a PFIC is based on assumptions as to our projections of the value of our outstandingshares during the year and our use of the proceeds from our initial public offering and this offering of ourordinary shares and of other cash that we will hold and generate in the ordinary course of our business throughouttaxable year 2014. Despite our expectation, there can be no assurance that we were not a PFIC in 2013 and willnot be a PFIC in 2014 or any future taxable year as PFIC status is tested each taxable year and will depend on thecomposition of our assets and income in such taxable year. In particular, in determining the average percentagevalue of our gross assets, the aggregate value of our assets will generally be deemed to be equal to our marketcapitalization (the sum of the aggregate value of our outstanding equity) plus our liabilities. Therefore, a drop inthe market price of our ordinary shares and associated decrease in the value of our goodwill would cause areduction in the value of our non-passive assets for purposes of the asset test. Accordingly, we would likelybecome a PFIC if our market capitalization were to decrease significantly while we hold substantial cash andcash equivalents. As we have not designated specific uses for all of the net proceeds we receive from our initialpublic offering or this offering, we may retain a significant portion of those net proceeds in the form of short-term investments or bank deposits for a prolonged period, which could affect our PFIC status in future years. Forfurther details on our intended use of the net proceeds we receive from this offering, see “Use of Proceeds.” Wecould also be a PFIC for any taxable year if the gross income that we and our subsidiaries earn from investing theportion of the cash raised in our initial public offering and this offering that exceeds the immediate capital needsof our business is substantial in comparison with the gross income from our business operations. Our special U.S.counsel expresses no opinion with respect to our expectations contained in this paragraph.
If we were a PFIC for any taxable year during which you held our ordinary shares, certain adverse U.S.federal income tax rules would apply. You would generally be subject to additional taxes and interest charges oncertain “excess distributions” we make and on any gain realized on the disposition or deemed disposition of yourordinary shares, regardless of whether we continue to be a PFIC in the year in which you receive an “excessdistribution” or dispose of or are deemed to dispose of your ordinary shares. Distributions in respect of yourordinary shares during a taxable year would generally constitute “excess distributions” if, in the aggregate, theyexceed 125% of the average amount of distributions with respect to your ordinary shares over the three precedingtaxable years or, if shorter, the portion of your holding period before such taxable year.
125

To compute the tax on “excess distributions” or any gain, (a) the “excess distribution” or the gain would beallocated ratably to each day in your holding period for the ordinary shares, (b) the amount allocated to thecurrent year and any tax year prior to the first taxable year in which we were a PFIC would be taxed as ordinaryincome in the current year, (c) the amount allocated to other taxable years would be taxable at the highestapplicable marginal rate in effect for that year, and (d) an interest charge at the rate for underpayment of taxes forany period described under (c) above would be imposed on the resulting tax liability on any portion of the“excess distribution” or gain that is allocated to such period. In addition, no distribution that you receive from uswould qualify for taxation at the preferential rate discussed in the “—Dividends on Ordinary Shares” sectionabove if we were a PFIC in the taxable year in which such distribution is made or in the preceding taxable year.
Under certain attribution rules, if we are a PFIC, you will be deemed to own your proportionate share (byvalue) of lower-tier PFICs, and will be subject to U.S. federal income tax on (i) a distribution on the shares of alower-tier PFIC and (ii) a disposition of shares of a lower-tier PFIC, both as if you directly held the shares ofsuch lower-tier PFIC.
If we were a PFIC in any year, you would generally be able to avoid the “excess distribution” rulesdescribed above by making a timely so-called “mark-to-market” election with respect to your ordinary sharesprovided our ordinary shares are “marketable.” Our ordinary shares will be “marketable” as long as they remainregularly traded on a national securities exchange, such as the NASDAQ Global Market. If you made thiselection in a timely fashion, you would generally recognize as ordinary income or ordinary loss the differencebetween the fair market value of your ordinary shares on the first day of any taxable year and your adjusted taxbasis in the ordinary shares. Any ordinary income resulting from this election would generally be taxed atordinary income rates and would not be eligible for the reduced rate of taxation discussed in the “—Dividends onOrdinary Shares” section above. Any ordinary losses would be deductible, but only to the extent of the netamount of previously included income as a result of the mark-to-market election, if any. Your basis in theordinary shares would be adjusted to reflect any such income or loss. You should consult your own tax adviserregarding potential advantages and disadvantages to you of making a “mark-to-market” election with respect toyour ordinary shares. The mark-to-market election will not be available for any lower tier PFIC that is deemedowned pursuant to the attribution rules discussed above. If you make a mark-to-market election it will beeffective for the taxable year for which the election is made and all subsequent taxable years unless the ordinaryshares are no longer “marketable” or the Internal Revenue Service (“IRS”) consents to the revocation. We do notintend to provide you with the information you would need to make or maintain a “Qualified Electing Fund”election and you will, therefore, not be able to make or maintain such an election with respect to your ordinaryshares.
If you own our ordinary shares during any taxable year that we are a PFIC, you are required to file an annualreport containing such information as the United States Treasury Department may require and may be required tofile an annual IRS Form 8621. Each U.S. Holder is advised to consult with its tax advisor concerning the U.S.federal income tax consequences of purchasing, holding and disposing ordinary shares if we are or becomeclassified as a PFIC.
U.S. information reporting and backup withholding rules
In general, dividend payments with respect to the ordinary shares and the proceeds received on the sale or otherdisposition of ordinary shares may be subject to information reporting to the IRS and to backup withholding.Backup withholding will not apply, however, if you (a) come within certain exempt categories and, when required,can demonstrate that fact or (b) provide a taxpayer identification number, certify as to no loss of exemption frombackup withholding and otherwise comply with the applicable backup withholding rules. To establish your status asan exempt person, you will generally be required to provide certification on IRS Form W-9. Any amounts withheldfrom payments to you under the backup withholding rules that exceed your U.S. federal income tax liability will beallowed as a refund or a credit against your U.S. federal income tax liability, provided that you timely furnish therequired information to the IRS. Certain U.S. Holders who hold “specific foreign financial assets,” including shares
126

of a non-U.S. corporation that are not held in an account maintained by a U.S. “financial institution,” the aggregatevalue of which exceeds $50,000 during the tax year, may be required to attach to their tax returns for the yearcertain specified information. A U.S. Holder who fails to timely furnish the required information may be subject toa penalty. Each U.S. Holder is advised to consult with its tax advisor regarding the application of the U.S.information reporting rules to their particular circumstances.
PROSPECTIVE PURCHASERS OF OUR ORDINARY SHARES SHOULD CONSULT WITH THEIROWN TAX ADVISOR REGARDING THE APPLICATION OF THE U.S. FEDERAL INCOME TAX LAWSTO THEIR PARTICULAR SITUATIONS AS WELL AS ANY TAX CONSEQUENCES RESULTING FROMPURCHASING, HOLDING OR DISPOSING OF OUR ORDINARY SHARES, INCLUDING THEAPPLICABILITY AND EFFECT OF THE TAX LAWS OF ANY STATE, LOCAL OR NON-USJURISDICTION AND INCLUDING ESTATE, GIFT AND INHERITANCE LAWS.
127

UNDERWRITERS
Subject to the terms and conditions of the underwriting agreement, the underwriters named below, throughtheir representatives Deutsche Bank Securities Inc. and Barclays Capital Inc., have severally agreed to purchasefrom us and the selling shareholders the following respective number of ordinary shares at a public offering priceless the estimated underwriting discounts and commissions set forth on the front cover page of this prospectus:
Underwriters Number of Shares
Deutsche Bank Securities Inc. . . . . . . . . . . . . . . . . . . . . . . . . . . . . . . . . . . . . . . . . . . . 1,872,500Barclays Capital Inc. . . . . . . . . . . . . . . . . . . . . . . . . . . . . . . . . . . . . . . . . . . . . . . . . . . 1,765,500Stifel, Nicolaus & Company, Incorporated . . . . . . . . . . . . . . . . . . . . . . . . . . . . . . . . . 695,500Wells Fargo Securities, LLC . . . . . . . . . . . . . . . . . . . . . . . . . . . . . . . . . . . . . . . . . . . . 374,500Needham & Company, LLC . . . . . . . . . . . . . . . . . . . . . . . . . . . . . . . . . . . . . . . . . . . . 321,000Chardan Capital Markets, LLC . . . . . . . . . . . . . . . . . . . . . . . . . . . . . . . . . . . . . . . . . . 160,500Roth Capital Partners, LLC . . . . . . . . . . . . . . . . . . . . . . . . . . . . . . . . . . . . . . . . . . . . . 160,500
Total . . . . . . . . . . . . . . . . . . . . . . . . . . . . . . . . . . . . . . . . . . . . . . . . . . . . . . . . . . . 5,350,000
The underwriting agreement provides that the obligations of the several underwriters to purchase theordinary shares offered hereby are subject to certain conditions precedent and that the underwriters will purchaseall of the ordinary shares offered by this prospectus, other than those covered by the underwriters’ option topurchase additional shares described below, if any of these shares are purchased.
We have been advised by the representatives of the underwriters that the underwriters propose to initiallyoffer the ordinary shares to the public at the public offering price set forth on the front cover page of thisprospectus and to dealers at a price that represents a concession not in excess of $0.63 per share under the publicoffering price. After the public offering, representatives of the underwriters may change the offering price andother selling terms.
The selling shareholders have granted to the underwriters an option, exercisable not later than 30 days afterthe date of this prospectus, to purchase up to 802,500 additional ordinary shares at the initial public offering priceless the estimated underwriting discounts and commissions set forth on the cover page of this prospectus. Theunderwriters may exercise this option only to cover over-allotments made in connection with the sale of theordinary shares offered by this prospectus. To the extent that the underwriters exercise this option, each of theunderwriters will become obligated, subject to conditions, to purchase approximately the same percentage ofthese additional ordinary shares as the number of ordinary shares to be purchased by it in the above table bears tothe total number of ordinary shares offered by this prospectus. The selling shareholders will be obligated,pursuant to the option, to sell these additional ordinary shares to the underwriters to the extent the option isexercised. If any additional ordinary shares are purchased, the underwriters will offer the additional shares on thesame terms as those on which the shares are being offered.
128

The underwriting discounts and commissions per share are equal to the public offering price per ordinaryshare less the amount paid by the underwriters to us per ordinary share. The underwriting discounts andcommissions are 5.0% of the public offering price. We and the selling shareholders have agreed to pay theunderwriters the following discounts and commissions, assuming either no exercise or full exercise by theunderwriters of the underwriters’ option to purchase additional shares:
Total Fees
Fee pershare
WithoutExercise of
Over-Allotment Option
With FullExercise of
Over-Allotment Option
Discounts and commissions paid by us . . . . . . . . . . . . . $1.05 $1,050,000 $1,050,000
Discounts and commissions paid by the sellingshareholders . . . . . . . . . . . . . . . . . . . . . . . . . . . . . . . . $1.05 $4,567,500 $5,410,125
An affiliate of an existing shareholder, UMC Capital Corporation, has agreed to purchase 50,000 shares inthis offering at the public offering price. The underwriters will receive the same discount and commissions fromthe ordinary shares purchased by the affiliate of UMC Capital Corporation as they will from any other ordinaryshares sold to the public in this offering.
In addition, we estimate that our share of the total expenses of this offering, excluding underwritingdiscounts and commissions, will be $675,885, including a reimbursement to the underwriters for an amount of upto $35,208 for filing fees and expenses (including legal fees and disbursements) incident to securing any requiredreview by the Financial Inquiry Regulatory Authority, Inc. of the terms of sale of ordinary shares in this offering.
We and the selling shareholders have agreed to indemnify the underwriters against some specified types ofliabilities, including liabilities under the Securities Act, and to contribute to payments the underwriters may berequired to make in respect of any of these liabilities.
In connection with our initial public offering, each of our officers and directors, and substantially all of ourshareholders, have agreed not to offer, sell, contract to sell or otherwise dispose of, or enter into any transactionthat is designed to, or could be expected to, result in the disposition of any our ordinary shares or other securitiesconvertible into or exchangeable or exercisable for ordinary shares or derivatives of our ordinary shares ownedby these persons prior to this offering or ordinary shares issuable upon exercise of options or warrants held bythese persons for a period of 180 days after the effective date for our initial public offering without the priorwritten consent of Deutsche Bank Securities Inc. and Barclays Capital Inc. In certain instances, this consent maybe given at any time without public notice. Transfers or dispositions can be made during the lock-up period in thecase of gifts or for estate planning purposes where the donee signs a lock-up agreement. We entered into asimilar agreement with the representatives of the underwriters. For purposes of this offering, Deutsche BankSecurities Inc. and Barclays Capital Inc. have waived, solely with respect to the shares being sold in this offering,the restrictions under these lock-up agreements applicable to the selling shareholders. Except for the waiverprovided by Deutsche Bank Securities Inc. and Barclays Capital Inc. to sell the shares offered in this offering,there are no agreements between the representatives and any of our shareholders or affiliates releasing them fromthese lock-up agreements prior to the expiration of the 180-day period.
The representatives of the underwriters have advised us that the underwriters do not intend to confirm salesto any account over which they exercise discretionary authority. In connection with the offering, the underwritersmay purchase and sell our ordinary shares in the open market. These transactions may include short sales,purchases to cover positions created by short sales and stabilizing transactions.
129

Short sales involve the sale by the underwriters of a greater number of shares than they are required topurchase in the offering. Covered short sales are sales made in an amount not greater than the underwriters’option to purchase additional ordinary shares from us in the offering. The underwriters may close out anycovered short position by either exercising their option to purchase additional shares or purchasing shares in theopen market. In determining the source of shares to close out the covered short position, the underwriters willconsider, among other things, the price of shares available for purchase in the open market as compared to theprice at which they may purchase shares through their option to purchase additional shares.
Naked short sales are any sales in excess of the underwriters’ option to purchase additional shares. Theunderwriters must close out any naked short position by purchasing shares in the open market. A naked shortposition is more likely to be created if underwriters are concerned that there may be downward pressure on theprice of the shares in the open market prior to the completion of the offering.
Stabilizing transactions consist of various bids for or purchases of our ordinary shares made by theunderwriters in the open market prior to the completion of the offering.
The underwriters may impose a penalty bid. This occurs when a particular underwriter repays to the otherunderwriters a portion of the underwriting discount received by it because the representatives of the underwritershave repurchased shares sold by or for the account of that underwriter in stabilizing or short coveringtransactions.
Purchases to cover a short position and stabilizing transactions may have the effect of preventing or slowinga decline in the market price of our ordinary shares. Additionally, these purchases, along with the imposition ofthe penalty bid, may stabilize, maintain or otherwise affect the market price of our ordinary shares. As a result,the price of our ordinary shares may be higher than the price that might otherwise exist in the open market. Thesetransactions may be effected on the NASDAQ, in the over-the-counter market or otherwise.
Certain of the underwriters and their affiliates have provided in the past to us and our affiliates, and mayprovide from time to time in the future, certain commercial banking, financial advisory, investment banking andother services for us and such affiliates in the ordinary course of their business, for which they have received andmay continue to receive customary fees and commissions. In addition, from time to time, certain of theunderwriters and their affiliates may effect transactions for their own account or the account of customers, andhold, on behalf of themselves or their customers, long or short positions in our debt or equity securities or loans,and may do so in the future.
A prospectus in electronic format is being made available on Internet web sites maintained by one or moreof the lead underwriters of this offering and may be made available on web sites maintained by otherunderwriters. Other than the prospectus in electronic format, the information on any underwriter’s website andany information contained in any other web site maintained by an underwriter is not part of the prospectus or theregistration statement of which the prospectus forms a part.
Other than in the United States, no action has been taken by us or the underwriters that would permit apublic offering of the securities offered by this prospectus in any jurisdiction where action for that purpose isrequired. The securities offered by this prospectus may not be offered or sold, directly or indirectly, nor may thisprospectus or any other offering material or advertisements in connection with the offer and sale of any suchsecurities be distributed or published in any jurisdiction, except under circumstances that will result incompliance with the applicable rules and regulations of that jurisdiction. Persons into whose possession thisprospectus comes are advised to inform themselves about and to observe any restrictions relating to the offeringand the distribution of this prospectus. This prospectus does not constitute an offer to sell or a solicitation of anoffer to buy any securities offered by this prospectus in any jurisdiction in which such an offer or a solicitation isunlawful.
130

Notice to Prospective Investors in European Economic Area
In relation to each Member State of the European Economic Area which has implemented the ProspectusDirective (each, a “Relevant Member State”) an offer to the public of any shares which are the subject of theoffering contemplated by this prospectus (the “Shares”) may not be made in that Relevant Member State exceptthat an offer to the public in that Relevant Member State of any Shares may be made at any time under thefollowing exemptions under the Prospectus Directive, if they have been implemented in that Relevant MemberState:
(a) to any legal entity which is a qualified investor as defined under the Prospectus Directive;
(b) by the Managers to fewer than 100, or, if the Relevant Member State has implemented the relevantprovisions of the 2010 PD Amending Directive, 150, natural or legal persons (other than qualifiedinvestors as defined in the Prospectus Directive) subject to obtaining the prior consent of LeadManager for any such offer; or
(c) in any other circumstances falling within Article 3(2) of the Prospectus Directive,
provided that no such offer of Shares shall result in a requirement for the Issuer or any Manager to publish aprospectus pursuant to Article 3 of the Prospectus Directive or supplement a prospectus pursuant to Article 16 ofthe Prospectus Directive.
For the purposes of this provision, the expression an “offer to the public” in relation to any Shares in anyRelevant Member State means the communication in any form and by any means of sufficient information on theterms of the offer and any Shares to be offered so as to enable an investor to decide to purchase any Shares, asthe same may be varied in that Member State by any measure implementing the Prospectus Directive in thatMember State. The expression “Prospectus Directive” means Directive 2003/71/EC (and amendments thereto,including the 2010 PD Amending Directive, to the extent implemented in the Relevant Member State), andincludes any relevant implementing measure in each Relevant Member State and the expression “2010 PDAmending Directive” means Directive 2010/73/EU.
The EEA selling restriction is in addition to any other selling restrictions set out in this prospectus.
Notice to Prospective Investors in Australia
This offering memorandum is not a formal disclosure document and has not been, nor will be, lodged withthe Australian Securities and Investments Commission. It does not purport to contain all information that aninvestor or their professional advisers would expect to find in a prospectus or other disclosure document (asdefined in the Corporations Act 2001 (Australia)) for the purposes of Part 6D.2 of the Corporations Act 2001(Australia) or in a product disclosure statement for the purposes of Part 7.9 of the Corporations Act 2001(Australia), in either case, in relation to the securities.
The securities are not being offered in Australia to “retail clients” as defined in sections 761G and 761GA ofthe Corporations Act 2001 (Australia). This offering is being made in Australia solely to “wholesale clients” forthe purposes of section 761G of the Corporations Act 2001 (Australia) and, as such, no prospectus, productdisclosure statement or other disclosure document in relation to the securities has been, or will be, prepared.
This offering memorandum does not constitute an offer in Australia other than to persons who do notrequire disclosure under Part 6D.2 of the Corporations Act 2001 (Australia) and who are wholesale clients for thepurposes of section 761G of the Corporations Act 2001 (Australia). By submitting an application for oursecurities, you represent and warrant to us that you are a person who does not require disclosure under Part 6D.2and who is a wholesale client for the purposes of section 761G of the Corporations Act 2001 (Australia). If anyrecipient of this offering memorandum is not a wholesale client, no offer of, or invitation to apply for, oursecurities shall be deemed to be made to such recipient and no applications for our securities will be accepted
131

from such recipient. Any offer to a recipient in Australia, and any agreement arising from acceptance of suchoffer, is personal and may only be accepted by the recipient. In addition, by applying for our securities youundertake to us that, for a period of 12 months from the date of issue of the securities, you will not transfer anyinterest in the securities to any person in Australia other than to a person who does not require disclosure underPart 6D.2 and who is a wholesale client.
Notice to Prospective Investors in Canada
The shares may be sold only to purchasers purchasing as principal that are both “accredited investors” asdefined in National Instrument 45-106 Prospectus and Registration Exemptions and “permitted clients” asdefined in National Instrument 31-103 Registration Requirements, Exemptions and Ongoing RegistrantObligations. Any resale of the shares must be made in accordance with an exemption from the prospectusrequirements and in compliance with the registration requirements of applicable securities laws.
Notice to Prospective Investors in Hong Kong
The contents of this prospectus have not been reviewed by any regulatory authority in Hong Kong. You areadvised to exercise caution in relation to the offer. If you are in any doubt about any of the contents of thisprospectus, you should obtain independent professional advice. Please note that (i) our securities may not beoffered or sold in Hong Kong, by means of this prospectus or any document other than to “professionalinvestors” within the meaning of Part I of Schedule 1 of the Securities and Futures Ordinance (Cap.571, Laws ofHong Kong) (SFO) and any rules made thereunder, or in other circumstances which do not result in the documentbeing a “prospectus” within the meaning of the Companies Ordinance (Cap.32, Laws of Hong Kong) (CO) orwhich do not constitute an offer or invitation to the public for the purpose of the CO or the SFO, and (ii) noadvertisement, invitation or document relating to our securities may be issued or may be in the possession of anyperson for the purpose of issue (in each case whether in Hong Kong or elsewhere) which is directed at, or thecontents of which are likely to be accessed or read by, the public in Hong Kong (except if permitted to do sounder the securities laws of Hong Kong) other than with respect to the securities which are or are intended to bedisposed of only to persons outside Hong Kong or only to “professional investors” within the meaning of theSFO and any rules made thereunder.
Notice to Prospective Investors in Japan
Our securities have not been and will not be registered under the Financial Instruments and Exchange Lawof Japan (the Financial Instruments and Exchange Law) and our securities will not be offered or sold, directly orindirectly, in Japan, or to, or for the benefit of, any resident of Japan (which term as used herein means anyperson resident in Japan, including any corporation or other entity organized under the laws of Japan), or toothers for re-offering or resale, directly or indirectly, in Japan, or to a resident of Japan, except pursuant to anexemption from the registration requirements of, and otherwise in compliance with, the Financial Instrumentsand Exchange Law and any other applicable laws, regulations and ministerial guidelines of Japan.
Notice to Prospective Investors in Singapore
This document has not been registered as a prospectus with the Monetary Authority of Singapore.Accordingly, this document and any other document or material in connection with the offer or sale, or invitationfor subscription or purchase, of our securities may not be circulated or distributed, nor may our securities beoffered or sold, or be made the subject of an invitation for subscription or purchase, whether directly orindirectly, to persons in Singapore other than (i) to an institutional investor under Section 274 of the Securitiesand Futures Act, Chapter 289 of Singapore (the “SFA”), (ii) to a relevant person pursuant to Section 275(1), orany person pursuant to Section 275(1A), and in accordance with the conditions specified in Section 275, of theSFA, or (iii) otherwise pursuant to, and in accordance with the conditions of, any other applicable provision ofthe SFA.
132

Where our securities are subscribed or purchased under Section 275 by a relevant person which is:
(a) a corporation (which is not an accredited investor (as defined in Section 4A of the SFA)) the solebusiness of which is to hold investments and the entire share capital of which is owned by one or moreindividuals, each of whom is an accredited investor; or
(b) a trust (where the trustee is not an accredited investor) whose sole purpose is to hold investments andeach beneficiary of the trust is an individual who is an accredited investor, securities (as defined inSection 239(1) of the SFA) of that corporation or the beneficiaries’ rights and interest (howsoeverdescribed) in that trust shall not be transferred within six months after that corporation or that trust hasacquired our securities pursuant to an offer made under Section 275 except:
(1) to an institutional investor or to a relevant person defined in Section 275(2) of the SFA, or to anyperson arising from an offer referred to in Section 275(1A) or Section 276(4)(i)(B) of the SFA;
(2) where no consideration is or will be given for the transfer;
(3) where the transfer is by operation of law; or
(4) as specified in Section 276(7) of the SFA.
Notice to Prospective Investors in Switzerland
The Prospectus does not constitute an issue prospectus pursuant to Article 652a or Article 1156 of the SwissCode of Obligations (“CO”) and the shares will not be listed on the SIX Swiss Exchange. Therefore, theProspectus may not comply with the disclosure standards of the CO and/or the listing rules (including anyprospectus schemes) of the SIX Swiss Exchange. Accordingly, the shares may not be offered to the public in orfrom Switzerland, but only to a selected and limited circle of investors, which do not subscribe to the shares witha view to distribution.
Notice to Prospective Investors in the United Kingdom
This prospectus is only being distributed to and is only directed at: (1) persons who are outside the UnitedKingdom; (2) investment professionals falling within Article 19(5) of the Financial Services and Markets Act2000 (Financial Promotion) Order 2005 (the “Order”); or (3) high net worth companies, and other persons towhom it may lawfully be communicated, falling within Article 49(2)(a) to (d) of the Order (all such personsfalling within (1)-(3) together being referred to as “relevant persons”). The shares are only available to, and anyinvitation, offer or agreement to subscribe, purchase or otherwise acquire such shares will be engaged in onlywith, relevant persons. Any person who is not a relevant person should not act or rely on this prospectus or any ofits contents.
133

ENFORCEABILITY OF CIVIL LIABILITIES
Our ultimate holding company, Montage Technology Group Limited, is registered under the laws of theCayman Islands as an exempted company with limited liability. Montage Technology Group Limited isregistered in the Cayman Islands because of certain benefits associated with being a Cayman Islands company,such as political and economic stability, an effective judicial system, a favorable tax system, the absence offoreign exchange control or currency restrictions and the availability of professional and support services.However, the Cayman Islands has a less developed body of securities laws as compared to the United States andprovides protections for investors to a significantly lesser extent. In addition, Cayman Islands companies may nothave standing to sue before the federal courts of the United States.
A significant portion of our assets and operations are located outside the United States. In addition, some ofour directors and officers are nationals or residents of jurisdictions other than the United States and a substantialportion of their assets may be located outside the United States. As a result, it may be difficult for investors toeffect service of process within the United States upon us or these persons, or to enforce against us or themjudgments obtained in U.S. courts, including judgments predicated upon the civil liability provisions of thesecurities laws of the United States or any state in the United States.
Conyers Dill & Pearman (Cayman) Limited, our counsel as to Cayman Islands law, and Commerce &Finance Law Offices, our counsel as to PRC law, have advised us that there is uncertainty as to whether thecourts of the Cayman Islands or China would, respectively, (i) recognize or enforce judgments of U.S. courtsobtained against us or our directors or officers predicated upon the civil liability provisions of the securities lawsof the United States or any state in the United States, or (ii) entertain original actions brought in the CaymanIslands or China against us or our directors or officers predicated upon the civil liability provisions of thesecurities laws of the United States or any state in the United States.
Conyers Dill & Pearman (Cayman) Limited has informed us that the uncertainty with regard to CaymanIslands law relates to whether a judgment obtained from the U.S. courts under civil liability provisions of thesecurities law will be determined by the courts of the Cayman Islands as penal or punitive in nature. The courtsof the Cayman Islands may not recognize or enforce such judgments against a Cayman company, and becausesuch a determination has not yet been made by a court of the Cayman Islands, it is uncertain whether such civilliability judgments from U.S. courts would be enforceable in the Cayman Islands. Conyers Dill & Pearman(Cayman) Limited has further advised us that a final and conclusive judgment in the federal or state courts of theUnited States under which a sum of money is payable, other than a sum payable in respect of taxes, fines,penalties or similar charges, may be subject to enforcement proceedings as a debt in the courts of the CaymanIslands under the common law doctrine of obligation, provided that (a) such federal or state courts of the UnitedStates had proper jurisdiction over the parties subject to such judgment; (b) such federal or state courts of theUnited States did not contravene the rules of natural justice of the Cayman Islands; (c) such judgment was notobtained by fraud; (d) the enforcement of the judgment would not be contrary to the public policy of the CaymanIslands; (e) no new admissible evidence relevant to the action is submitted prior to the rendering of the judgmentby the courts of the Cayman Islands; and (f) there is due compliance with the correct procedures under the lawsof the Cayman Islands.
Commerce & Finance Law Offices has further advised us that the recognition and enforcement of foreignjudgments are provided for under PRC Civil Procedure Law. Under the PRC Civil Procedure Law, courts inChina may recognize and enforce foreign judgments pursuant to treaties between China and the country wherethe judgment is rendered or based on reciprocity arrangements for the recognition and enforcement of foreignjudgments between jurisdictions. China does not have any treaties or other arrangements that provide forreciprocal recognition and enforcement of foreign judgments with the United States or the Cayman Islands. As aresult, it is generally difficult to recognize and enforce in China a judgment rendered by a court in either of thesetwo jurisdictions.
134

Any judgment of United States courts will not be directly enforced in Hong Kong as there are currently notreaties or other arrangements providing for reciprocal enforcement of foreign judgments between Hong Kongand the United States. However, subject to certain conditions, including that the judgment is for a liquidatedamount in a civil matter and not in respect of taxes, fines, penalties or similar charges, the judgment is final andconclusive and has not been stayed or satisfied in full, the proceedings in which the judgment was obtained werenot contrary to natural justice, and the enforcement of the judgment is not contrary to public policy of HongKong, Hong Kong courts may, upon application by the judgment creditor to enforce the judgment obtained froma United States court, enforce such judgment as a debt due under the rules of common law enforcement.
135

LEGAL MATTERS
Certain matters of United States Federal and New York State law will be passed upon for us byO’Melveny & Myers LLP. Pillsbury Winthrop Shaw Pittman LLP, Palo Alto, California is acting as counsel tothe underwriters in connection with certain legal matters related to the ordinary shares being offered by thisprospectus. The validity of the ordinary shares offered in this offering will be passed upon for us by ConyersDill & Pearman (Cayman) Limited. Legal matters as to PRC law will be passed upon for us by Commerce &Finance Law Offices, and will be passed upon for the underwriters by Fangda Partners.
EXPERTS
The consolidated financial statements of Montage Technology Group Limited as of December 31, 2011 and2012 and for each of the three years in the period ended December 31, 2012 included in this prospectus havebeen so included in reliance on the report of PricewaterhouseCoopers Zhong Tian LLP (previously known asPricewaterhouseCoopers Zhong Tian CPAs Limited Company), an independent registered public accountingfirm, given on the authority of said firm as experts in auditing and accounting.
At the discretion of the government of the People’s Republic of China in accordance with the Scheme forthe Localization Restructuring of Chinese-Foreign Cooperative Accounting Firms, PricewaterhouseCoopersZhong Tian CPAs Limited Company has converted to a new partnership and changed its name toPricewaterhouseCoopers Zhong Tian LLP, effective from July 1, 2013.
The office of PricewaterhouseCoopers Zhong Tian LLP is located at 11th Floor, PricewaterhouseCoopersCenter, 202 Hu Bin Road, Shanghai 200021, People’s Republic of China.
136

WHERE YOU CAN FIND MORE INFORMATION
We are a foreign private issuer within the meaning of the rules under the Securities Act, but have elected tofile a registration statement on Form S-1 with respect to the ordinary shares to be sold in this offering. Thisprospectus, which constitutes part of the registration statement, does not include all of the information containedin the registration statement and the exhibits and schedules thereto. You should refer to the registration statementand its exhibits and schedules for additional information. Whenever we make reference in this prospectus to anyof our contracts, agreements or other documents, the references are not necessarily complete and you should referto the exhibits attached to the registration statement for copies of the actual contract, agreement or otherdocument.
You can read our SEC filings, including the registration statement and the exhibits and schedules thereto, atthe SEC’s website at www.sec.gov. You may also read and copy any document we file with the SEC at its publicreference facilities at 100 F Street, N.E., Washington, DC 20549. You may also obtain copies of the documentsat prescribed rates by writing to the Public Reference Section of the SEC at 100 F Street, N.E., Washington, DC20549. Please call the SEC at 1-800-SEC-0330 for further information on the operation of the public referencefacilities.
Because we are subject to the informational reporting requirements of the Exchange Act, and have elected tofile on forms applicable to domestic companies, we file annual reports on Form 10-K, quarterly reports on Form10-Q, and current reports on Form 8-K, and other information on forms applicable to domestic companies withthe SEC. You are able to inspect and copy these reports and other information at the public reference facilitiesmaintained by the SEC at the address noted above. You are also able to inspect them without charge at the SEC’swebsite.
137

[THIS PAGE INTENTIONALLY LEFT BLANK]

Montage Technology Group Limited
Index to Consolidated Financial Statements
Page
Report of Independent Registered Public Accounting Firm . . . . . . . . . . . . . . . . . . . . . . . . . . . . . . . . . . . . . . F-2Consolidated Balance Sheets as of December 31, 2011 and 2012 and September 30, 2013 (unaudited) . . . . F-3Consolidated Statements of Operations and Comprehensive Income (Loss) for the years ended December 31,
2010, 2011 and 2012, and the nine months ended September 30, 2012 (unaudited) and 2013(unaudited). . . . . . . . . . . . . . . . . . . . . . . . . . . . . . . . . . . . . . . . . . . . . . . . . . . . . . . . . . . . . . . . . . . . . . . . . . . F-4
Consolidated Statements of Changes in Convertible Preferred Shares and Shareholders’ Deficit for theyears ended December 31, 2010, 2011 and 2012, and the nine months ended September 30, 2013(unaudited) . . . . . . . . . . . . . . . . . . . . . . . . . . . . . . . . . . . . . . . . . . . . . . . . . . . . . . . . . . . . . . . . . . . . . . . . . . F-5
Consolidated Statements of Cash Flows for the years ended December 31, 2010, 2011 and 2012, and thenine months ended September 30, 2012 (unaudited) and 2013 (unaudited) . . . . . . . . . . . . . . . . . . . . . . . . F-7
Notes to Consolidated Financial Statements . . . . . . . . . . . . . . . . . . . . . . . . . . . . . . . . . . . . . . . . . . . . . . . . . . F-8
F-1

Report of Independent Registered Public Accounting Firm
To the board of directors and shareholders of Montage Technology Group Limited:
In our opinion, the accompanying consolidated balance sheets and related consolidated statements of operationsand comprehensive income (loss), changes in convertible preferred shares and shareholders’ deficit and cashflows present fairly, in all material respects, the financial position of Montage Technology Group Limited and itssubsidiaries (the “Company”) at December 31, 2012 and 2011, and the results of their operations and their cashflows for each of the three years in the period ended December 31, 2012 in conformity with accounting principlesgenerally accepted in the United States of America. These financial statements are the responsibility of theCompany’s management. Our responsibility is to express an opinion on these financial statements based on ouraudits. We conducted our audits of these statements in accordance with the standards of the Public CompanyAccounting Oversight Board (United States). Those standards require that we plan and perform the audit toobtain reasonable assurance about whether the financial statements are free of material misstatement. An auditincludes examining, on a test basis, evidence supporting the amounts and disclosures in the financial statements,assessing the accounting principles used and significant estimates made by management, and evaluating theoverall financial statement presentation. We believe that our audits provide a reasonable basis for our opinion.
/s/ PricewaterhouseCoopers Zhong Tian LLPShanghai, the People’s Republic of ChinaAugust 9, 2013, except for Note 16 as to which the date is September 11, 2013
F-2

Montage Technology Group Limited
Consolidated Balance Sheets(Dollars in thousands, except share and per share data)
December 31, September 30,
2011 2012 2013
2013pro forma(Note 18)
(unaudited) (unaudited)AssetsCurrent assets:
Cash and cash equivalents . . . . . . . . . . . . . . . . . . . . . . . . . . . . . . . . . . . . . . . . . . . . . . . $ 23,343 $ 21,580 $41,181 $41,181Short-term investments . . . . . . . . . . . . . . . . . . . . . . . . . . . . . . . . . . . . . . . . . . . . . . . . . — 6,472 6,443 6,443Accounts receivable, net . . . . . . . . . . . . . . . . . . . . . . . . . . . . . . . . . . . . . . . . . . . . . . . . 5,924 7,903 10,413 10,413Inventories . . . . . . . . . . . . . . . . . . . . . . . . . . . . . . . . . . . . . . . . . . . . . . . . . . . . . . . . . . . 6,981 11,116 9,830 9,830Prepaid expenses and other current assets . . . . . . . . . . . . . . . . . . . . . . . . . . . . . . . . . . . 1,798 2,000 2,591 2,591Current deferred tax assets . . . . . . . . . . . . . . . . . . . . . . . . . . . . . . . . . . . . . . . . . . . . . . 420 338 343 343
Total current assets . . . . . . . . . . . . . . . . . . . . . . . . . . . . . . . . . . . . . . . . . . . . . . . . . . . . 38,466 49,409 70,801 70,801
Property and equipment, net . . . . . . . . . . . . . . . . . . . . . . . . . . . . . . . . . . . . . . . . . . . . . 1,015 2,284 2,459 2,459Acquired intangible asset, net . . . . . . . . . . . . . . . . . . . . . . . . . . . . . . . . . . . . . . . . . . . . 94 1,496 1,020 1,020Deferred tax assets . . . . . . . . . . . . . . . . . . . . . . . . . . . . . . . . . . . . . . . . . . . . . . . . . . . . 291 330 330 330Deferred offering costs . . . . . . . . . . . . . . . . . . . . . . . . . . . . . . . . . . . . . . . . . . . . . . . . . — 283 3,240 3,240
Total assets . . . . . . . . . . . . . . . . . . . . . . . . . . . . . . . . . . . . . . . . . . . . . . . . . . . . . . . . . . $ 39,866 $ 53,802 $77,850 $77,850
Liabilities, Convertible Preferred Shares and Shareholders’ Equity (Deficit)Current liabilities:
Accounts payable . . . . . . . . . . . . . . . . . . . . . . . . . . . . . . . . . . . . . . . . . . . . . . . . . . . . . $ 6,855 $ 3,719 $ 5,345 $ 5,345Short-term loans . . . . . . . . . . . . . . . . . . . . . . . . . . . . . . . . . . . . . . . . . . . . . . . . . . . . . . 2,063 1,591 — —Accrued liabilities . . . . . . . . . . . . . . . . . . . . . . . . . . . . . . . . . . . . . . . . . . . . . . . . . . . . . 8,091 9,108 11,941 11,941Deferred margin, net . . . . . . . . . . . . . . . . . . . . . . . . . . . . . . . . . . . . . . . . . . . . . . . . . . . 5,147 1,200 1,545 1,545Income tax payable . . . . . . . . . . . . . . . . . . . . . . . . . . . . . . . . . . . . . . . . . . . . . . . . . . . . 42 261 1,422 1,422Current deferred tax liabilities . . . . . . . . . . . . . . . . . . . . . . . . . . . . . . . . . . . . . . . . . . . . — 34 34 34
Total current liabilities . . . . . . . . . . . . . . . . . . . . . . . . . . . . . . . . . . . . . . . . . . . . . 22,198 15,913 20,287 20,287
Long-term tax liabilities . . . . . . . . . . . . . . . . . . . . . . . . . . . . . . . . . . . . . . . . . . . . . . . . . . . . 3,422 4,295 4,288 4,288
Total liabilities . . . . . . . . . . . . . . . . . . . . . . . . . . . . . . . . . . . . . . . . . . . . . . . . . . . . $ 25,620 $ 20,208 $24,575 $24,575
Commitments and contingencies (Note 14)Convertible Preferred Share:
Series A convertible preferred shares, $0.0125 par value; 4,800,000 sharesauthorized; 4,800,000 issued and outstanding as of December 31, 2011 and 2012and September 30, 2013 (unaudited), respectively; none outstanding on a pro-forma basis as of September 30, 2013 (unaudited), (Liquidation value: $6,000 asof December 31, 2011 and 2012 and September 30, 2013 (unaudited),respectively) . . . . . . . . . . . . . . . . . . . . . . . . . . . . . . . . . . . . . . . . . . . . . . . . . . . . . . . $ 6,000 $ 6,000 $ 6,000 $ —
Series B convertible preferred shares, $0.0125 par value; 4,681,416 sharesauthorized; 4,255,843 issued and outstanding as of December 31, 2011 and 2012and September 30, 2013 (unaudited), respectively; none outstanding on a pro-forma basis as of September 30, 2013 (unaudited), (Liquidation value: $13,092 asof December 31, 2011 and 2012 and September 30, 2013 (unaudited),respectively) . . . . . . . . . . . . . . . . . . . . . . . . . . . . . . . . . . . . . . . . . . . . . . . . . . . . . . . 17,020 17,020 17,020 —
Series B-1 convertible preferred shares, $0.0125 par value; 4,551,709 sharesauthorized; 4,049,276 issued and outstanding as of December 31, 2011 and 2012and September 30, 2013 (unaudited), respectively; none outstanding on a pro-forma basis as of September 30, 2013 (unaudited), (Liquidation value: $16,191 asof December 31, 2011 and 2012 and September 30, 2013 (unaudited),respectively) . . . . . . . . . . . . . . . . . . . . . . . . . . . . . . . . . . . . . . . . . . . . . . . . . . . . . . . 21,048 21,048 21,048 —
Series B-2 convertible preferred shares, $0.0125 par value; 3,571,514 sharesauthorized; 2,839,409 issued and outstanding as of December 31, 2011 and 2012and September 30, 2013 (unaudited), respectively; none outstanding on a pro-forma basis as of September 30, 2013 (unaudited), (Liquidation value: $7,947 asof December 31, 2011 and 2012 and September 30, 2013 (unaudited),respectively) . . . . . . . . . . . . . . . . . . . . . . . . . . . . . . . . . . . . . . . . . . . . . . . . . . . . . . . 10,254 10,309 10,332 —
Shareholders’ equity (deficit):Ordinary Shares, $0.0125 par value; 26,804,639 shares authorized; 4,293,639,
4,403,859 and 4,660,025 issued and outstanding at December 31, 2011 and 2012and September 30, 2013 (unaudited), respectively . . . . . . . . . . . . . . . . . . . . . . . . . . 54 55 58 260
Additional paid-in capital . . . . . . . . . . . . . . . . . . . . . . . . . . . . . . . . . . . . . . . . . . . . . . . — 1,010 3,515 57,713Accumulated comprehensive income . . . . . . . . . . . . . . . . . . . . . . . . . . . . . . . . . . . . . . 1,810 1,811 2,148 2,148Statutory reserve . . . . . . . . . . . . . . . . . . . . . . . . . . . . . . . . . . . . . . . . . . . . . . . . . . . . . . 610 740 740 740Accumulated deficit . . . . . . . . . . . . . . . . . . . . . . . . . . . . . . . . . . . . . . . . . . . . . . . . . . . (42,550) (24,399) (7,586) (7,586)
Total shareholders’ equity (deficit) . . . . . . . . . . . . . . . . . . . . . . . . . . . . . . . . . . . . (40,076) (20,783) (1,125) 53,275
Total liabilities, convertible preferred share and shareholders’ equity (deficit) . . . . . . . . . . $ 39,866 $ 53,802 $77,850 $77,850
The accompanying notes are an integral part of these consolidated financial statements.
F-3
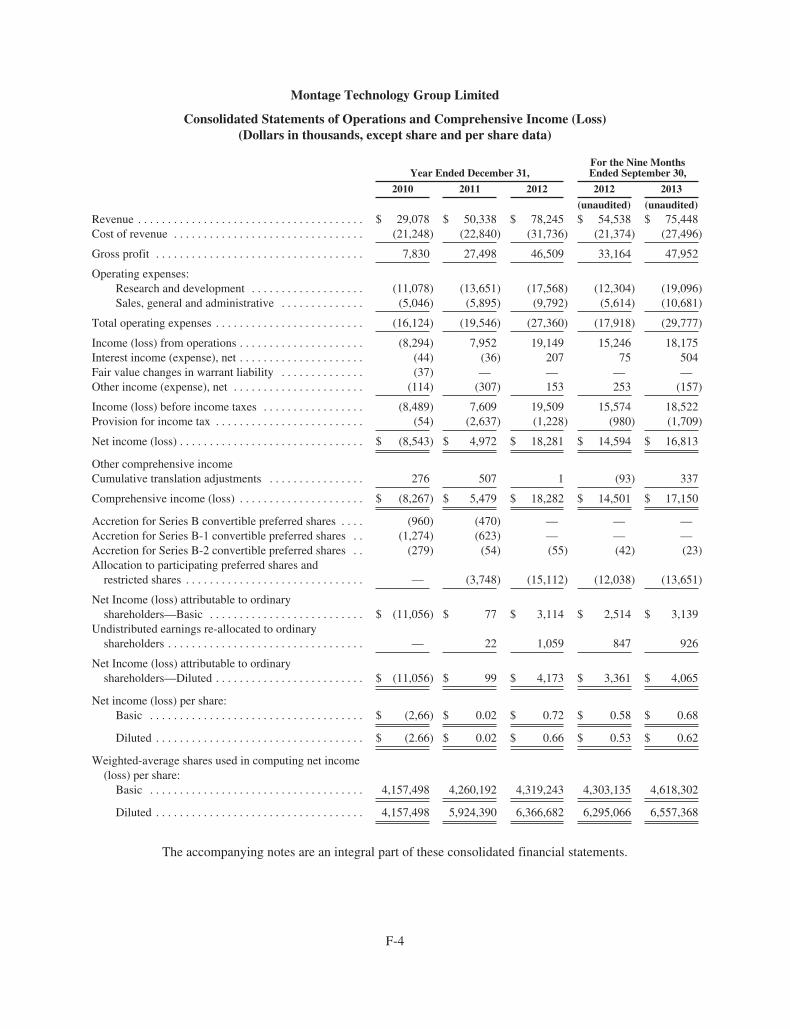
Montage Technology Group Limited
Consolidated Statements of Operations and Comprehensive Income (Loss)(Dollars in thousands, except share and per share data)
Year Ended December 31,For the Nine MonthsEnded September 30,
2010 2011 2012 2012 2013
(unaudited) (unaudited)Revenue . . . . . . . . . . . . . . . . . . . . . . . . . . . . . . . . . . . . . . $ 29,078 $ 50,338 $ 78,245 $ 54,538 $ 75,448Cost of revenue . . . . . . . . . . . . . . . . . . . . . . . . . . . . . . . . (21,248) (22,840) (31,736) (21,374) (27,496)
Gross profit . . . . . . . . . . . . . . . . . . . . . . . . . . . . . . . . . . . 7,830 27,498 46,509 33,164 47,952
Operating expenses:Research and development . . . . . . . . . . . . . . . . . . . (11,078) (13,651) (17,568) (12,304) (19,096)Sales, general and administrative . . . . . . . . . . . . . . (5,046) (5,895) (9,792) (5,614) (10,681)
Total operating expenses . . . . . . . . . . . . . . . . . . . . . . . . . (16,124) (19,546) (27,360) (17,918) (29,777)
Income (loss) from operations . . . . . . . . . . . . . . . . . . . . . (8,294) 7,952 19,149 15,246 18,175Interest income (expense), net . . . . . . . . . . . . . . . . . . . . . (44) (36) 207 75 504Fair value changes in warrant liability . . . . . . . . . . . . . . (37) — — — —Other income (expense), net . . . . . . . . . . . . . . . . . . . . . . (114) (307) 153 253 (157)
Income (loss) before income taxes . . . . . . . . . . . . . . . . . (8,489) 7,609 19,509 15,574 18,522Provision for income tax . . . . . . . . . . . . . . . . . . . . . . . . . (54) (2,637) (1,228) (980) (1,709)
Net income (loss) . . . . . . . . . . . . . . . . . . . . . . . . . . . . . . . $ (8,543) $ 4,972 $ 18,281 $ 14,594 $ 16,813
Other comprehensive incomeCumulative translation adjustments . . . . . . . . . . . . . . . . 276 507 1 (93) 337
Comprehensive income (loss) . . . . . . . . . . . . . . . . . . . . . $ (8,267) $ 5,479 $ 18,282 $ 14,501 $ 17,150
Accretion for Series B convertible preferred shares . . . . (960) (470) — — —Accretion for Series B-1 convertible preferred shares . . (1,274) (623) — — —Accretion for Series B-2 convertible preferred shares . . (279) (54) (55) (42) (23)Allocation to participating preferred shares and
restricted shares . . . . . . . . . . . . . . . . . . . . . . . . . . . . . . — (3,748) (15,112) (12,038) (13,651)
Net Income (loss) attributable to ordinaryshareholders—Basic . . . . . . . . . . . . . . . . . . . . . . . . . . $ (11,056) $ 77 $ 3,114 $ 2,514 $ 3,139
Undistributed earnings re-allocated to ordinaryshareholders . . . . . . . . . . . . . . . . . . . . . . . . . . . . . . . . . — 22 1,059 847 926
Net Income (loss) attributable to ordinaryshareholders—Diluted . . . . . . . . . . . . . . . . . . . . . . . . . $ (11,056) $ 99 $ 4,173 $ 3,361 $ 4,065
Net income (loss) per share:Basic . . . . . . . . . . . . . . . . . . . . . . . . . . . . . . . . . . . . $ (2,66) $ 0.02 $ 0.72 $ 0.58 $ 0.68
Diluted . . . . . . . . . . . . . . . . . . . . . . . . . . . . . . . . . . . $ (2.66) $ 0.02 $ 0.66 $ 0.53 $ 0.62
Weighted-average shares used in computing net income(loss) per share:
Basic . . . . . . . . . . . . . . . . . . . . . . . . . . . . . . . . . . . . 4,157,498 4,260,192 4,319,243 4,303,135 4,618,302
Diluted . . . . . . . . . . . . . . . . . . . . . . . . . . . . . . . . . . . 4,157,498 5,924,390 6,366,682 6,295,066 6,557,368
The accompanying notes are an integral part of these consolidated financial statements.
F-4
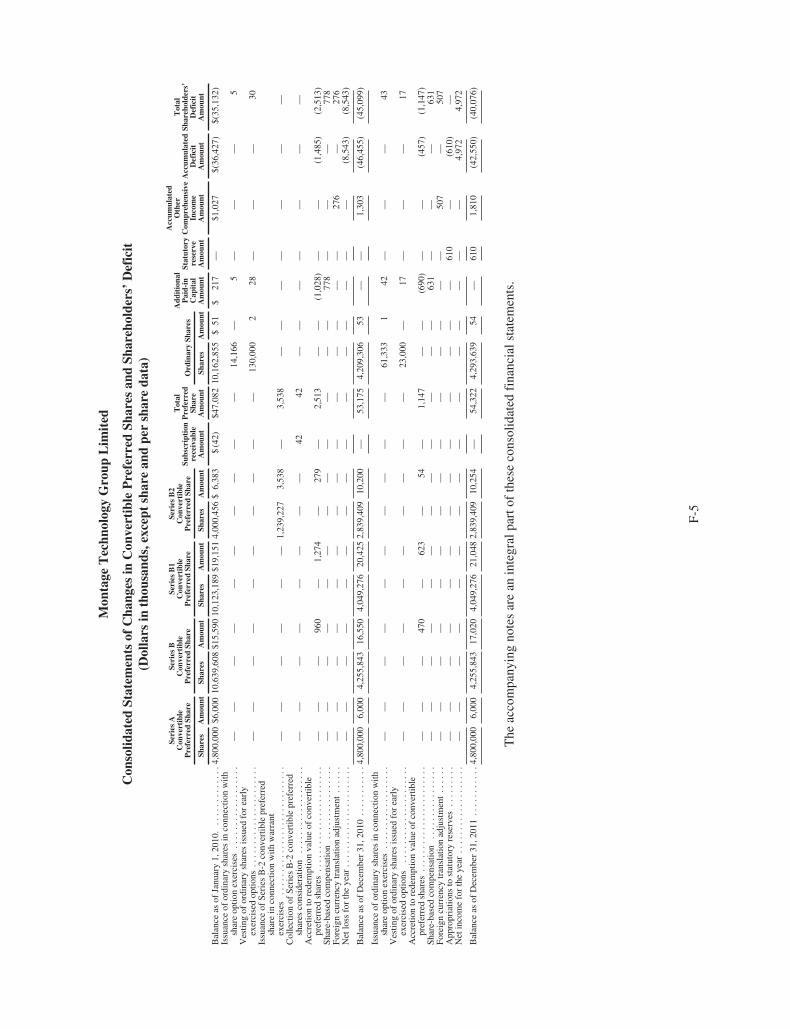
Mon
tage
Tec
hnol
ogy
Gro
upL
imit
ed
Con
solid
ated
Stat
emen
tsof
Cha
nges
inC
onve
rtib
leP
refe
rred
Shar
esan
dSh
areh
olde
rs’
Def
icit
(Dol
lars
inth
ousa
nds,
exce
ptsh
are
and
per
shar
eda
ta)
Seri
esA
Con
vert
ible
Pre
ferr
edSh
are
Seri
esB
Con
vert
ible
Pre
ferr
edSh
are
Seri
esB
1C
onve
rtib
leP
refe
rred
Shar
e
Seri
esB
2C
onve
rtib
leP
refe
rred
Shar
eSu
bscr
ipti
onre
ceiv
able
Am
ount
Tot
alP
refe
rred
Shar
eA
mou
nt
Ord
inar
ySh
ares
Add
itio
nal
Pai
d-in
Cap
ital
Am
ount
Stat
utor
yre
serv
eA
mou
nt
Acc
umul
ated
Oth
erC
ompr
ehen
sive
Inco
me
Am
ount
Acc
umul
ated
Def
icit
Am
ount
Tot
alSh
areh
olde
rs’
Def
icit
Am
ount
Shar
esA
mou
ntSh
ares
Am
ount
Shar
esA
mou
ntSh
ares
Am
ount
Shar
esA
mou
nt
Bal
ance
asof
Janu
ary
1,20
10.
....
....
....
.4,8
00,0
00$6
,000
10,6
39,6
08$1
5,59
010
,123
,189
$19,
151
4,00
0,45
6$
6,38
3$
(42)
$47,
082
10,1
62,8
55$
51$
217
—$1
,027
$(36
,427
)$(
35,1
32)
Issu
ance
ofor
dina
rysh
ares
inco
nnec
tion
with
shar
eop
tion
exer
cise
s..
....
....
....
....
——
——
——
——
——
14,1
66—
5—
——
5V
estin
gof
ordi
nary
shar
esis
sued
for
earl
yex
erci
sed
optio
ns..
....
....
....
....
....
——
——
——
——
——
130,
000
228
——
—30
Issu
ance
ofSe
ries
B-2
conv
ertib
lepr
efer
red
shar
ein
conn
ectio
nw
ithw
arra
ntex
erci
ses
....
....
....
....
....
....
....
——
——
——
1,23
9,22
73,
538
—3,
538
——
——
——
—C
olle
ctio
nof
Seri
esB
-2co
nver
tible
pref
erre
dsh
ares
cons
ider
atio
n..
....
....
....
....
.—
——
——
——
—42
42—
——
——
——
Acc
retio
nto
rede
mpt
ion
valu
eof
conv
ertib
lepr
efer
red
shar
es..
....
....
....
....
....
.—
——
960
—1,
274
—27
9—
2,51
3—
—(1
,028
)—
—(1
,485
)(2
,513
)Sh
are-
base
dco
mpe
nsat
ion
....
....
....
....
——
——
——
——
——
——
778
——
—77
8Fo
reig
ncu
rren
cytr
ansl
atio
nad
just
men
t..
....
——
——
——
——
——
——
——
276
—27
6N
etlo
ssfo
rth
eye
ar..
....
....
....
....
....
——
——
——
——
——
——
——
—(8
,543
)(8
,543
)
Bal
ance
asof
Dec
embe
r31
,201
0..
....
....
.4,8
00,0
006,
000
4,25
5,84
316
,550
4,04
9,27
620
,425
2,83
9,40
910
,200
—53
,175
4,20
9,30
653
——
1,30
3(4
6,45
5)(4
5,09
9)
Issu
ance
ofor
dina
rysh
ares
inco
nnec
tion
with
shar
eop
tion
exer
cise
s..
....
....
....
....
——
——
——
——
——
61,3
331
42—
——
43V
estin
gof
ordi
nary
shar
esis
sued
for
earl
yex
erci
sed
optio
ns..
....
....
....
....
...
——
——
——
——
——
23,0
00—
17—
——
17A
ccre
tion
tore
dem
ptio
nva
lue
ofco
nver
tible
pref
erre
dsh
ares
....
....
....
....
....
...
——
—47
0—
623
—54
—1,
147
——
(690
)—
—(4
57)
(1,1
47)
Shar
e-ba
sed
com
pens
atio
n..
....
....
....
..—
——
——
——
——
——
—63
1—
——
631
Fore
ign
curr
ency
tran
slat
ion
adju
stm
ent
....
..—
——
——
——
——
——
——
—50
7—
507
App
ropr
iatio
nsto
stat
utor
yre
serv
es..
....
...
——
——
——
——
——
——
—61
0—
(610
)—
Net
inco
me
for
the
year
....
....
....
....
...
——
——
——
——
——
——
——
—4,
972
4,97
2
Bal
ance
asof
Dec
embe
r31
,201
1..
....
....
.4,8
00,0
006,
000
4,25
5,84
317
,020
4,04
9,27
621
,048
2,83
9,40
910
,254
—54
,322
4,29
3,63
954
—61
01,
810
(42,
550)
(40,
076)
The
acco
mpa
nyin
gno
tes
are
anin
tegr
alpa
rtof
thes
eco
nsol
idat
edfi
nanc
ials
tate
men
ts.
F-5

Seri
esA
Con
vert
ible
Pre
ferr
edSh
are
Seri
esB
Con
vert
ible
Pre
ferr
edSh
are
Seri
esB
1C
onve
rtib
leP
refe
rred
Shar
e
Seri
esB
2C
onve
rtib
leP
refe
rred
Shar
eSu
b-sc
ript
ion
rece
ivab
leA
mou
nt
Tot
alP
refe
rred
Shar
eA
mou
nt
Ord
inar
ySh
ares
Add
itio
nal
Pai
d-in
Cap
ital
Am
ount
Stat
utor
yre
serv
eA
mou
nt
Acc
umu-
late
dO
ther
Com
pre-
hens
ive
Inco
me
Am
ount
Acc
umu-
late
dD
efic
itA
mou
nt
Tot
alSh
are-
hold
ers’
Def
icit
Am
ount
Shar
esA
mou
ntSh
ares
Am
ount
Shar
esA
mou
ntSh
ares
Am
ount
Shar
esA
mou
nt
Issu
ance
ofor
dina
rysh
ares
inco
nnec
tion
with
shar
eop
tion
exer
cise
s..
....
....
....
....
....
....
....
....
....
....
..—
——
——
——
——
—10
6,22
01
67—
——
68
Ves
ting
ofor
dina
rysh
ares
issu
edfo
rea
rly
exer
cise
dop
tions
....
.—
——
——
——
——
—4,
000
—9
——
—9
Acc
retio
nto
rede
mpt
ion
valu
eof
conv
ertib
lepr
efer
red
shar
es..
..—
——
——
——
55—
55—
—(5
5)—
——
(55)
Shar
e-ba
sed
com
pens
atio
n..
....
....
....
....
....
....
....
..—
——
——
——
——
——
—98
9—
——
989
Fore
ign
curr
ency
tran
slat
ion
adju
stm
ent
....
....
....
....
....
.—
——
——
——
——
——
——
—1
—1
App
ropr
iatio
nsto
stat
utor
ygre
serv
es..
....
....
....
....
....
.—
——
——
——
——
——
——
130
—(1
30)
—
Net
inco
me
for
the
year
....
....
....
....
....
....
....
....
..—
——
——
——
——
——
——
——
18,2
8118
,281
Bal
ance
asof
Dec
embe
r31
,201
2..
....
....
....
....
....
....
4,80
0,00
0$6
,000
4,25
5,84
3$1
7,02
04,
049,
276
$21,
048
2,83
9,40
9$1
0,30
9$—
$54,
377
4,40
3,85
9$
55$1
,010
$740
$1,8
11$(
24,3
99)$
(20,
783)
Issu
ance
ofor
dina
rysh
ares
inco
nnec
tion
with
shar
eop
tion
exer
cise
s(U
naud
ited)
....
....
....
....
....
....
....
....
..—
——
——
——
——
251,
166
361
——
—64
Ves
ting
ofor
dina
rysh
ares
issu
edfo
rea
rly
exer
cise
dop
tions
(Una
udite
d)..
....
....
....
....
....
....
....
....
....
....
——
——
——
——
——
5,00
0—
5—
——
5
Acc
retio
nto
rede
mpt
ion
valu
eof
conv
ertib
lepr
efer
red
shar
es(U
naud
ited)
....
....
....
....
....
....
....
....
....
....
..—
——
——
——
23—
23—
—(2
3)—
——
(23)
Shar
e-ba
sed
com
pens
atio
n(U
naud
ited)
....
....
....
....
....
..—
——
——
——
——
—2,
462
——
—2,
462
Fore
ign
curr
ency
tran
slat
ion
adju
stm
ent(
Una
udite
d)..
....
....
.—
——
——
——
——
——
—33
7—
337
Net
inco
me
for
the
peri
od(U
naud
ited)
....
....
....
....
....
..—
——
——
——
——
——
——
16,8
1316
,813
Bal
ance
asof
Sept
embe
r30
,201
3(U
naud
ited)
....
....
....
....
4,80
0,00
0$6
,000
4,25
5,84
3$1
7,02
04,
049,
276
$21,
048
2,83
9,40
9$1
0,33
2—
$54,
400
4,66
0,02
5$
58$3
,515
$740
$2,1
48$
(7,5
86)$
(1,1
25)
The
acco
mpa
nyin
gno
tes
are
anin
tegr
alpa
rtof
thes
eco
nsol
idat
edfi
nanc
ials
tate
men
ts.
F-6
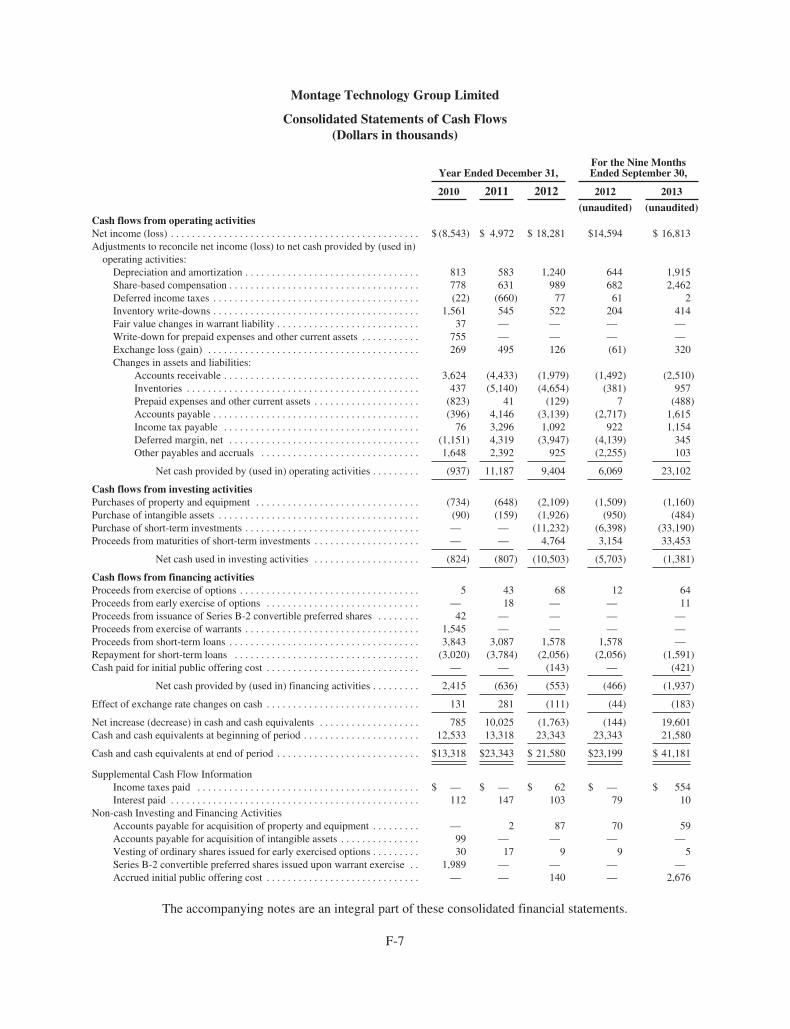
Montage Technology Group Limited
Consolidated Statements of Cash Flows(Dollars in thousands)
Year Ended December 31,For the Nine MonthsEnded September 30,
2010 2011 2012 2012 2013
(unaudited) (unaudited)Cash flows from operating activitiesNet income (loss) . . . . . . . . . . . . . . . . . . . . . . . . . . . . . . . . . . . . . . . . . . . . . . . $ (8,543) $ 4,972 $ 18,281 $14,594 $ 16,813Adjustments to reconcile net income (loss) to net cash provided by (used in)
operating activities:Depreciation and amortization . . . . . . . . . . . . . . . . . . . . . . . . . . . . . . . . . 813 583 1,240 644 1,915Share-based compensation . . . . . . . . . . . . . . . . . . . . . . . . . . . . . . . . . . . . 778 631 989 682 2,462Deferred income taxes . . . . . . . . . . . . . . . . . . . . . . . . . . . . . . . . . . . . . . . (22) (660) 77 61 2Inventory write-downs . . . . . . . . . . . . . . . . . . . . . . . . . . . . . . . . . . . . . . . 1,561 545 522 204 414Fair value changes in warrant liability . . . . . . . . . . . . . . . . . . . . . . . . . . . 37 — — — —Write-down for prepaid expenses and other current assets . . . . . . . . . . . 755 — — — —Exchange loss (gain) . . . . . . . . . . . . . . . . . . . . . . . . . . . . . . . . . . . . . . . . 269 495 126 (61) 320Changes in assets and liabilities:
Accounts receivable . . . . . . . . . . . . . . . . . . . . . . . . . . . . . . . . . . . . . 3,624 (4,433) (1,979) (1,492) (2,510)Inventories . . . . . . . . . . . . . . . . . . . . . . . . . . . . . . . . . . . . . . . . . . . . 437 (5,140) (4,654) (381) 957Prepaid expenses and other current assets . . . . . . . . . . . . . . . . . . . . (823) 41 (129) 7 (488)Accounts payable . . . . . . . . . . . . . . . . . . . . . . . . . . . . . . . . . . . . . . . (396) 4,146 (3,139) (2,717) 1,615Income tax payable . . . . . . . . . . . . . . . . . . . . . . . . . . . . . . . . . . . . . 76 3,296 1,092 922 1,154Deferred margin, net . . . . . . . . . . . . . . . . . . . . . . . . . . . . . . . . . . . . (1,151) 4,319 (3,947) (4,139) 345Other payables and accruals . . . . . . . . . . . . . . . . . . . . . . . . . . . . . . 1,648 2,392 925 (2,255) 103
Net cash provided by (used in) operating activities . . . . . . . . . (937) 11,187 9,404 6,069 23,102
Cash flows from investing activitiesPurchases of property and equipment . . . . . . . . . . . . . . . . . . . . . . . . . . . . . . . (734) (648) (2,109) (1,509) (1,160)Purchase of intangible assets . . . . . . . . . . . . . . . . . . . . . . . . . . . . . . . . . . . . . . (90) (159) (1,926) (950) (484)Purchase of short-term investments . . . . . . . . . . . . . . . . . . . . . . . . . . . . . . . . . — — (11,232) (6,398) (33,190)Proceeds from maturities of short-term investments . . . . . . . . . . . . . . . . . . . . — — 4,764 3,154 33,453
Net cash used in investing activities . . . . . . . . . . . . . . . . . . . . (824) (807) (10,503) (5,703) (1,381)
Cash flows from financing activitiesProceeds from exercise of options . . . . . . . . . . . . . . . . . . . . . . . . . . . . . . . . . . 5 43 68 12 64Proceeds from early exercise of options . . . . . . . . . . . . . . . . . . . . . . . . . . . . . — 18 — — 11Proceeds from issuance of Series B-2 convertible preferred shares . . . . . . . . 42 — — — —Proceeds from exercise of warrants . . . . . . . . . . . . . . . . . . . . . . . . . . . . . . . . . 1,545 — — — —Proceeds from short-term loans . . . . . . . . . . . . . . . . . . . . . . . . . . . . . . . . . . . . 3,843 3,087 1,578 1,578 —Repayment for short-term loans . . . . . . . . . . . . . . . . . . . . . . . . . . . . . . . . . . . (3,020) (3,784) (2,056) (2,056) (1,591)Cash paid for initial public offering cost . . . . . . . . . . . . . . . . . . . . . . . . . . . . . — — (143) — (421)
Net cash provided by (used in) financing activities . . . . . . . . . 2,415 (636) (553) (466) (1,937)
Effect of exchange rate changes on cash . . . . . . . . . . . . . . . . . . . . . . . . . . . . . 131 281 (111) (44) (183)
Net increase (decrease) in cash and cash equivalents . . . . . . . . . . . . . . . . . . . 785 10,025 (1,763) (144) 19,601Cash and cash equivalents at beginning of period . . . . . . . . . . . . . . . . . . . . . . 12,533 13,318 23,343 23,343 21,580
Cash and cash equivalents at end of period . . . . . . . . . . . . . . . . . . . . . . . . . . . $13,318 $23,343 $ 21,580 $23,199 $ 41,181
Supplemental Cash Flow InformationIncome taxes paid . . . . . . . . . . . . . . . . . . . . . . . . . . . . . . . . . . . . . . . . . . $ — $ — $ 62 $ — $ 554Interest paid . . . . . . . . . . . . . . . . . . . . . . . . . . . . . . . . . . . . . . . . . . . . . . . 112 147 103 79 10
Non-cash Investing and Financing ActivitiesAccounts payable for acquisition of property and equipment . . . . . . . . . — 2 87 70 59Accounts payable for acquisition of intangible assets . . . . . . . . . . . . . . . 99 — — — —Vesting of ordinary shares issued for early exercised options . . . . . . . . . 30 17 9 9 5Series B-2 convertible preferred shares issued upon warrant exercise . . 1,989 — — — —Accrued initial public offering cost . . . . . . . . . . . . . . . . . . . . . . . . . . . . . — — 140 — 2,676
The accompanying notes are an integral part of these consolidated financial statements.
F-7

Montage Technology Group Limited
Notes to Consolidated Financial Statements(Dollars in thousands except share and per share data)
1. Organization and Summary of Significant Accounting Policies
Montage Technology Group Limited (the “Company”) was incorporated as an international businesscompany with limited liability under International Business Companies Act, 1984 of the British Virgin Islands onMarch 29, 2004 and continued to, and registered in the Cayman Islands as an exempted company on April 24,2006. The Company conducts business in several territories including China, Hong Kong, Taiwan and the UnitedStates through its wholly owned subsidiaries. As of December 31, 2011 and 2012 and September 30, 2013, theCompany had 306, 418 and 459 employees, respectively, the significant majority of which are based in China.
The Company is a global fabless provider of analog and mixed signal semiconductor solutions currentlyaddressing the home entertainment and cloud computing markets. The foundation of its technology platform isthe Company’s ability to design high performance, low power semiconductors by using its proprietary buildingblocks which include radio frequency and analog front end solutions, digital signal processors and high speedinterfaces. In the home entertainment market, the Company’s technology platform enables it to design highlyintegrated solutions with customized software for set-top boxes. The Company’s solutions optimize signalprocessing performance under demanding operating conditions typically found in emerging marketenvironments. In the cloud computing market, the Company offers high performance, low power memoryinterface solutions that enable memory intensive server applications.
a. Basis of Presentation
The consolidated financial statements include the accounts of the Company and all of its subsidiaries. Allintercompany transactions have been eliminated upon consolidation. The consolidated financial statements havebeen prepared in conformity with generally accepted accounting principles in the United States (“U.S. GAAP”).The Company’s fiscal year end is December 31.
The unaudited consolidated financial statements and related footnotes have been prepared on the same basisas the audited consolidated financial statements and, in the opinion of the Company’s management, reflect alladjustments, which consist only of normal recurring adjustments, necessary for the fair statement of thoseconsolidated financial statements and related footnotes for interim periods.
All share-related disclosures, including par value, share price, number of ordinary shares, preferred shares,share options, restricted shares, and warrants, exercise prices of share options, restricted shares, and warrants andrelated fair value per share, and net income (loss) per share calculations, have been recast to reflect the 2.5-for-1reverse share split (See Note 16) for all periods presented.
b. Initial Public Offering
On October 1, 2013, the Company completed an initial public offering (the “Offering”) of 8,165,000 sharesof ordinary shares at a price of $10.00 per share, including 5,325,000 additional ordinary shares issued by theCompany and 2,840,000 shares sold by existing shareholders. Accordingly, the Company received net proceedsof $46.9 million from the issuance of the ordinary shares in the offering after deducting underwriting discountsand commissions of $3.7 million and excluding other offering expenses of approximately $2.6 million.
Upon completion of the initial public offering on October 1, 2013, the Series A, B, B1 and B2 ConvertiblePreferred Shares automatically converted into 16,163,598 ordinary shares and the related carrying amounts werereclassified as additional paid-in capital. As these transactions occurred after September 30, 2013, they are notreflected in the unaudited consolidated financial statements as of and for the nine months period endedSeptember 30, 2013. See Note 18 for discussion of the unaudited pro forma information.
F-8

Montage Technology Group Limited
Notes to Consolidated Financial Statements—(Continued)(Dollars in thousands except share and per share data)
c. Use of Estimates
The preparation of financial statements in conformity with U.S. GAAP requires management to makeestimates and assumptions that affect the reported amount of assets and liabilities and disclosures of contingentassets and liabilities at the date of the financial statements, and the reported amounts of net revenue and expensesduring the reporting period. Actual results could differ from those estimates. Significant accounting estimatesreflected in the Company’s consolidated financial statements mainly include share-based compensation,allowance for doubtful accounts, inventory write-down, allowance for deferred tax assets, provision for uncertaintax positions, and estimated useful lives of equipment and intangible assets.
d. Cash and Cash Equivalents
The Company considers all cash on demand and time deposits with original maturities of less than threemonths to be cash and cash equivalents.
e. Short-term Investments
Highly liquid investments with original maturities of greater than three months and less than one year areclassified as short-term investments. For investments in financial instruments with variable interest rates indexedto the performance of underlying assets, the Company elected the fair value method at the date of initialrecognition and remeasured these investments subsequently at fair value. Changes in the fair value are reflectedas interest income in the consolidated statements of operations and comprehensive income (loss).
The Company has revised the consolidated statements of cash flows for the year ended December 31, 2012to present investment income of $141 as an operating cash inflow versus as an investing item. The impact of thisrevision is not material to the Company’s previously reported operating or investing cash flows, and had noimpact on total cash flows.
f. Fair Market Value of Financial Instruments
Fair value reflects the price that would be received from selling an asset or paid to transfer a liability in anorderly transaction between market participants at the measurement date. When determining the fair valuemeasurements for assets and liabilities required or permitted to be recorded at fair value, the Company considersthe principal or most advantageous market in which it would transact and considers assumptions that marketparticipants would use when pricing the assets or liabilities.
The Company applies a fair value hierarchy that requires an entity to maximize the use of observable inputsand minimize the use of unobservable inputs when measuring fair value. A financial instrument’s categorizationwithin the fair value hierarchy is based upon the lowest level of input that is significant to the fair valuemeasurement. This guidance specifies a hierarchy of valuation techniques, which is based on whether the inputsinto the valuation technique are observable or unobservable. The hierarchy is as follows:
Level 1—Valuation techniques in which all significant inputs are unadjusted quoted prices from activemarkets for assets or liabilities that are identical to the assets or liabilities being measured.
Level 2—Valuation techniques in which significant inputs include quoted prices from active markets forassets or liabilities that are similar to the assets or liabilities being measured and/or quoted prices for assets orliabilities that are identical or similar to the assets or liabilities being measured from markets that are not active.
F-9

Montage Technology Group Limited
Notes to Consolidated Financial Statements—(Continued)(Dollars in thousands except share and per share data)
Also, model-derived valuations in which all significant inputs and significant value drivers are observable inactive markets are Level 2 valuation techniques.
Level 3—Valuation techniques in which one or more significant inputs or significant value drivers areunobservable. Unobservable inputs are valuation technique inputs that reflect the Company’s own assumptionsabout the assumptions that market participants would use in pricing an asset or liability.
The fair value guidance describes three main approaches to measure the fair value of assets and liabilities:(1) market approach, (2) income approach and (3) cost approach. The market approach uses prices and otherrelevant information generated from market transactions involving identical or comparable assets or liabilities.
The income approach uses valuation techniques to convert future amounts to a single present value amount.The measurement is based on the value indicated by current market expectations about those future amounts. Thecost approach is based on the amount that would currently be required to replace an asset.
When available, the Company uses quoted market prices to determine the fair value of an asset or liability.If quoted market prices are not available, the Company will measure fair value using valuation techniques thatuse, when possible, current market-based or independently sourced market parameters, such as interest rates andcurrency rates.
The carrying amount reflected in the balance sheet for cash and cash equivalents, accounts receivable,prepaid and other current assets, accounts payable, accrued expenses and other current liabilities, approximatetheir fair value due to the short-term nature of these financial instruments. The fair market value of outstandingwarrants that were exercised to purchase convertible preferred shares in June 2010 was classified as Level 3financial instruments.
There were no financial assets and liabilities classified as Level 3 financial instruments as of December 31,2011 and 2012 and September 30, 2013 (unaudited).
The following table sets forth the financial instruments, measured at fair value by level within the fair valuehierarchy as of December 31, 2011:
Items
As ofDecember 31,
2011
Fair value measurements at reporting date using
Quoted Pricesin Active Markets
for Identical Assets(Level 1)
SignificantOther
ObservableInputs
(Level 2)
SignificantUnobservable
Inputs(Level 3)
Cash . . . . . . . . . . . . . . . . . . . . . . . . . $16,438 $16,438 $ — $ —Time deposits with the maturity term
below 3 months . . . . . . . . . . . . . . . 6,905 6,905 — —
$23,343 $23,343 $ — $ —
F-10

Montage Technology Group Limited
Notes to Consolidated Financial Statements—(Continued)(Dollars in thousands except share and per share data)
The following table sets forth the financial instruments, measured at fair value by level within the fair valuehierarchy as of December 31, 2012:
Items
As ofDecember 31,
2012
Fair value measurements at reporting date using
Quoted Pricesin Active Markets
for Identical Assets(Level 1)
SignificantOther
ObservableInputs
(Level 2)
SignificantUnobservable
Inputs(Level 3)
Cash . . . . . . . . . . . . . . . . . . . . . . . . . $12,175 $12,175 $ — $ —Time deposits with the maturity term
below 3 months . . . . . . . . . . . . . . . 9,405 9,405 — —Short-term investments . . . . . . . . . . . 6,472 — 6,472 —
$28,052 $21,580 $6,472 $ —
The following table sets forth the financial instruments, measured at fair value by level within the fair valuehierarchy as of September 30, 2013 (unaudited):
As ofSeptember 30,
2013
Fair value measure at reporting date using
Quoted Pricesin Active Markets
for Identical Assets(Level 1)
Significant OtherObservable Inputs
(Level 2)
SignificantUnobservable
Inputs(Level 3)
Cash . . . . . . . . . . . . . . . . . . . . . $27,414 $27,414 $ — $ —Bank investment products
readily convertible withinthe maturity term below 3months . . . . . . . . . . . . . . . . . 9,759 — 9,759 —
Time deposits with thematurity term below 3months . . . . . . . . . . . . . . . . . 4,008 4,008 — —
Time deposits with thematurity term greater than 3months but less than 1year . . . . . . . . . . . . . . . . . . . 50 50 — —
Short-term investments . . . . . . 6,393 — 6,393 —
Total . . . . . . . . . . . . . . . . . . . . . $47,624 $31,472 $16,152 $ —
As of December 31, 2012, and September 30, 2013, the investments measured at fair value by level 2 areissued by banks with variable interest rates indexed to performance of underlying assets, from 4.60% to 4.80%and from 3.20% (unaudited) to 4.60% (unaudited), respectively. Since these investments’ maturity dates arewithin one year, they are classified as short-term investments. To estimate the fair value of the short-terminvestments, the Company refers to the quoted rate of return provided by the bank at the end of each period usingthe discounted cash flow method. The Company classifies the valuation techniques that use these inputs asLevel 2 of fair value measurements.
For the years ended December 31, 2010, 2011 and 2012 and the nine months ended September 30, 2012 and2013, the Company recorded in the consolidated statements of operations and comprehensive income (loss) achange in the fair value of short-term investments in the amount of $0, $0, $141, $63 (unaudited) and$344 (unaudited), respectively.
F-11
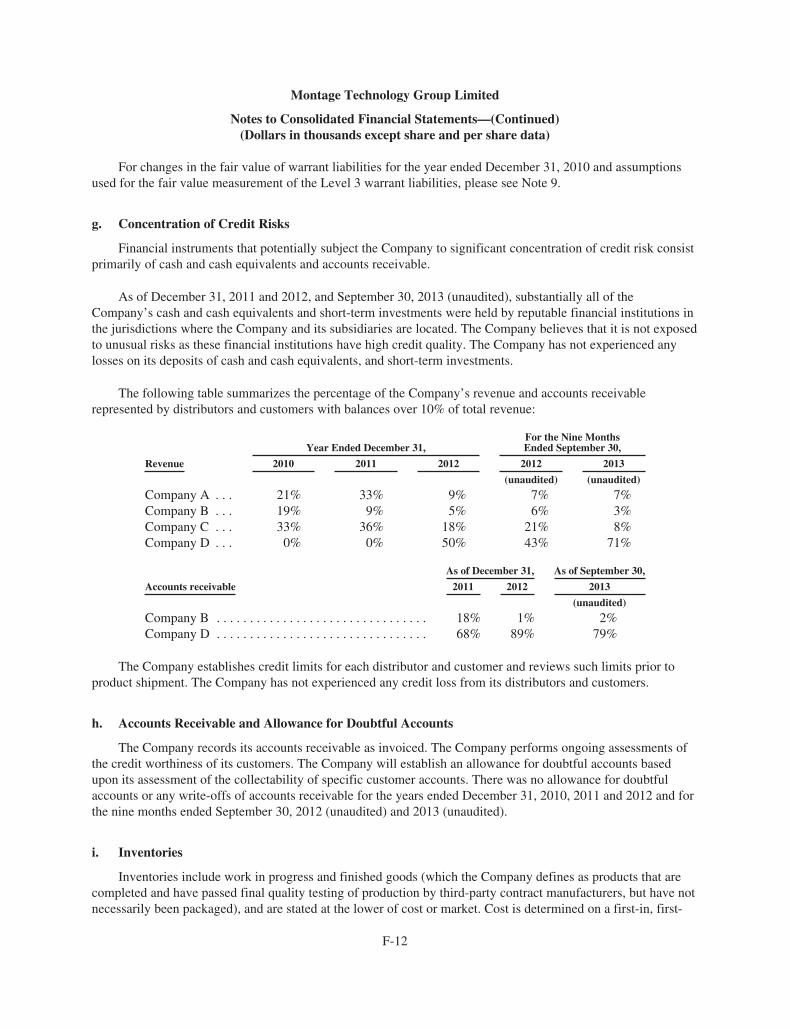
Montage Technology Group Limited
Notes to Consolidated Financial Statements—(Continued)(Dollars in thousands except share and per share data)
For changes in the fair value of warrant liabilities for the year ended December 31, 2010 and assumptionsused for the fair value measurement of the Level 3 warrant liabilities, please see Note 9.
g. Concentration of Credit Risks
Financial instruments that potentially subject the Company to significant concentration of credit risk consistprimarily of cash and cash equivalents and accounts receivable.
As of December 31, 2011 and 2012, and September 30, 2013 (unaudited), substantially all of theCompany’s cash and cash equivalents and short-term investments were held by reputable financial institutions inthe jurisdictions where the Company and its subsidiaries are located. The Company believes that it is not exposedto unusual risks as these financial institutions have high credit quality. The Company has not experienced anylosses on its deposits of cash and cash equivalents, and short-term investments.
The following table summarizes the percentage of the Company’s revenue and accounts receivablerepresented by distributors and customers with balances over 10% of total revenue:
Year Ended December 31,For the Nine MonthsEnded September 30,
Revenue 2010 2011 2012 2012 2013
(unaudited) (unaudited)
Company A . . . 21% 33% 9% 7% 7%Company B . . . 19% 9% 5% 6% 3%Company C . . . 33% 36% 18% 21% 8%Company D . . . 0% 0% 50% 43% 71%
As of December 31, As of September 30,
Accounts receivable 2011 2012 2013
(unaudited)
Company B . . . . . . . . . . . . . . . . . . . . . . . . . . . . . . . . 18% 1% 2%Company D . . . . . . . . . . . . . . . . . . . . . . . . . . . . . . . . 68% 89% 79%
The Company establishes credit limits for each distributor and customer and reviews such limits prior toproduct shipment. The Company has not experienced any credit loss from its distributors and customers.
h. Accounts Receivable and Allowance for Doubtful Accounts
The Company records its accounts receivable as invoiced. The Company performs ongoing assessments ofthe credit worthiness of its customers. The Company will establish an allowance for doubtful accounts basedupon its assessment of the collectability of specific customer accounts. There was no allowance for doubtfulaccounts or any write-offs of accounts receivable for the years ended December 31, 2010, 2011 and 2012 and forthe nine months ended September 30, 2012 (unaudited) and 2013 (unaudited).
i. Inventories
Inventories include work in progress and finished goods (which the Company defines as products that arecompleted and have passed final quality testing of production by third-party contract manufacturers, but have notnecessarily been packaged), and are stated at the lower of cost or market. Cost is determined on a first-in, first-
F-12

Montage Technology Group Limited
Notes to Consolidated Financial Statements—(Continued)(Dollars in thousands except share and per share data)
out basis. Inventory reserves are established based on estimated obsolescence or marketability of the specifiedinventory. The reserve that is established is equal to the difference between the cost of the inventory and theestimated realized value based upon management assumptions. These assumptions include estimates of futuredemand and market conditions in which the product is sold. Once the inventory is written down, a new cost basisis established and it is not reversed.
j. Property and Equipment
Property and equipment are stated at cost less accumulated depreciation and amortization. Depreciation andamortization is provided on property and equipment over the estimated useful lives ranging from three to fiveyears on a straight-line basis. Leasehold improvements are amortized on a straight-line basis over the shorter oftheir estimated useful lives or lease terms. Repairs and maintenance are charged to expense as incurred. Usefullives by asset category are as follows:
Asset Category Years
Office equipment . . . . . . . . . . . . . . . . . . . . . . . . . . . . . . 3-7 yearsLeasehold improvements . . . . . . . . . . . . . . . . . . . . . . . . Shorter of lease term or estimated useful lifeEquipment . . . . . . . . . . . . . . . . . . . . . . . . . . . . . . . . . . . 3-5 yearsFurniture and fixtures . . . . . . . . . . . . . . . . . . . . . . . . . . . 3-7 years
k. Intangible assets
Intangible assets include acquired assembled workforce and licenses and are amortized on a straight-linebasis over their estimated useful lives, which range from 18 to 36 months.
l. Impairment of long-lived assets and intangible assets
For long-lived assets including amortizable intangible assets, the Company evaluates for impairmentwhenever events or changes (triggering events) indicate that the carrying amount of an asset may no longer berecoverable. The Company assesses the recoverability of the long-lived assets by comparing the carrying value ofthe long-lived assets to the estimated undiscounted future cash flows expected to be received from use of theassets and their eventual disposition. Such assets are considered to be impaired if the sum of the expectedundiscounted cash flows is less than the carrying amount of the assets. The impairment to be recognized ismeasured by the amount by which the carrying amount of the assets exceeds the fair value of the assets. Therewere no impairments for long-lived assets and intangible assets for the years ended December 31, 2010, 2011 and2012 and the nine months ended September 30, 2012 (unaudited) and 2013 (unaudited).
m. Revenue Recognition
The Company’s revenue is generated from the sale of its semiconductor solutions sold into the homeentertainment and cloud computing markets. In the home entertainment market, the Company sells set-top boxsolutions which consist of highly integrated semiconductors and embedded software. The Company does notdeliver software as a separate product in connection with the sale of the Company’s solutions nor is any softwareupgrade offered after the sale of the Company’s solutions.
The Company recognizes revenue only when all of the following criteria are met: (i) persuasive evidence ofan arrangement exists, (ii) delivery has occurred, (iii) the price to the customer is fixed or determinable, and (iv)collection of the resulting receivable is reasonably assured.
F-13

Montage Technology Group Limited
Notes to Consolidated Financial Statements—(Continued)(Dollars in thousands except share and per share data)
The Company sells substantially all of its set-top solutions through third-party independent distributorsunder agreements allowing for pricing credits and/or rights of return. It sells substantially all of its memoryinterface products to memory module manufacturers. For direct sales to end customers, the Company recognizesrevenue at the time of shipment to its end customers when all of the above criteria are met. For sales throughdistributors, the Company defers the recognition of revenue and related product costs until the sale and deliveryby the distributor to the end customer occurs because returns or price adjustments cannot be reliably estimateddue to rapid changes in technology, consumer preferences and prices. Upon shipment to the distributor, theCompany records an accounts receivable from the distributors based on the amount it is entitled to bill thedistributors according to contractual arrangements. This amount less related costs of products delivered isrecorded as deferred margin, net on the consolidated balance sheet (See Note 1.o below). If the distributors’margin to the end customer is greater/lower than the distributor’s margin agreed in the contractual agreement, thedistributor will receive a debit/credit for the difference.
The Company does not accept product returns from customers except for returns to satisfy warranty claims(See Note 1.p below).
n. Cost of Revenue
Cost of revenue includes cost of materials, such as wafers processed by third-party foundries, costassociated with packaging and assembly, test and shipping, cost of personnel, including share-basedcompensation, logistics and quality assurance, warranty cost, and write down of inventories.
o. Deferred Margin, Net
The Company defers revenue recognition on sales to distributors until its products are sold by thedistributors to end customers, which is when the selling price to the distributor is fixed or determinable. Deferredmargin, net is calculated as: 1) deferred revenue that is recorded based on the amount of the sale price that theCompany is entitled to bill the distributor at the time of shipment to the distributor based on terms of thedistribution agreement, less 2) deferred cost of revenue, representing the costs of products shipped to thedistributor.
Under the Company’s contract with LQW Technology Company Limited (“LQW”), which has been adistributor for the Company’s products since October 2011 and was the Company’s largest distributor in 2012and the nine months ended September 30, 2013, the Company is entitled to bill only a portion of the total saleprice at the time of shipment (deferred revenue), with the remainder billed upon sale by LQW to the endcustomer. Upon sale by LQW to the end customer, the Company bills the remaining sale price to LQW andrecognizes this amount as revenue directly (rather than initially as deferred revenue) and also recognizes thepreviously deferred amount as revenue, as the sale price is fixed and determinable and all criteria for revenuerecognition have been met.
For the Company’s other distributors, the Company is typically entitled to bill the entire sale price at thetime of shipment, which is recorded as deferred revenue upon shipment and recognized as revenue when salesfrom the distributors to end customers occur.
The distributors resell the Company’s products to end customers at a range of individually negotiated pricesbased on a variety of factors, including the identity of the end customer and its historical relationship with theCompany, the type of product sold and sales quantity. With reference to these factors, according to the terms of
F-14

Montage Technology Group Limited
Notes to Consolidated Financial Statements—(Continued)(Dollars in thousands except share and per share data)
the Company’s distribution agreement with the distributor, the Company adjusts the original sale price to thedistributor based on the actual resale price from the distributor to end customer. Primarily because of theuncertainty related to the final price, the Company defers recognition of revenue and cost of sales to distributorsuntil the products are sold by the distributors to end customers. The amount of gross margin the Companyrecognizes in future periods may be more than or less than the originally recorded deferred margin, net as a resultof any price adjustment. The Company records price adjustments against deferred margin, net at the time of thedistributor’s sale to the end customer.
For the years ended December 31, 2010, 2011 and 2012 and the nine months ended September 30, 2012 and2013, the total net price adjustments were a downward adjustment of $1,424, or 4.9% of total revenue, an upwardadjustment of $341, or 0.7% of total revenue, and a downward adjustment of $256, or 0.3% of total revenue, adownward adjustment of $195 (unaudited), or 0.4% of total revenue and a downward adjustment of $453(unaudited), or 0.6% of total revenue, respectively. The decreasing trend in total price adjustments was primarilydue to increased sales of solutions that had relatively stable pricing and an increasing proportion of sales to LQWfor which the majority of the sale price was billed at the time LQW completed its sales to the end customer. Forthe portion of sales to LQW that the Company bills at the time LQW completes the sale to the end customer, theCompany records the billed amount directly to revenue. Therefore, no price adjustment is necessary.
Deferred cost of revenue, a component of deferred margin, net, is stated at the lower of cost or market value.The Company evaluates whether its deferred cost of revenue has been impaired based on expected net cash flowsto be received for the deferred items. There was no impairment for deferred cost of revenue for the years endedDecember 31, 2010, 2011 and 2012 and the nine months ended September 30, 2012 (unaudited) and 2013(unaudited).
p. Warranty
The Company provides a one-year product warranty. The Company establishes a reserve for the estimatedcost of the product warranty at the time revenue is recognized. The reserves established are regularly monitoredbased upon historical experiences and any actual claims are charged against the reserve. Warranty reserves arerecorded as a cost of net revenue. The warranty cost incurred during the years ended December 31, 2010, 2011and 2012 and the nine months ended September 30, 2012 and 2013 were $211, $75, $255, $37 (unaudited) and$128 (unaudited), respectively.
q. Research and Development Expense
Research and development costs are expensed when incurred and consist primarily of personnel-relatedexpenses, including salaries, bonuses, share-based compensation and employee benefits. Research anddevelopment expense also includes new product engineering mask costs, prototype integrated circuit packagingand test costs, computer-aided design software license costs, intellectual property license costs, reference designdevelopment costs, development testing and evaluation costs and depreciation expense.
r. Government Funded Research and Development Projects
The Company participates in research and development projects which are funded by the People’s Republic ofChina (“PRC”) government under agreed upon written agreements. Under these government funded projects, theCompany records the government funds as accrued liabilities when received and such funds are subsequentlyrecognized as a reduction to expenses in the period when the Company has reasonable assurance that it hascomplied with the conditions attached to the agreement. This is typically after the Company passes a review
F-15
Montage Technology Group Limited
Notes to Consolidated Financial Statements—(Continued)(Dollars in thousands except share and per share data)
process. If an agreement does not carry any conditions, the Company records the amount as a reduction of researchand development expense in the period the cash is received. For government funds specifically approved for thepurchase of depreciable assets, the related funds received are recorded as a reduction to the carrying value of therelated assets. For the years ended December 31, 2010, 2011 and 2012 and the nine months ended September 30,2012 and 2013, the Company recorded $0, $0, $1,025, $1,025 (unaudited) and $396 (unaudited) governmentfunding as a deduction to expense, respectively. For the years ended December 31, 2010, 2011 and 2012 and thenine months ended September 30, 2012 (unaudited) and 2013 (unaudited), the Company has not incurred orrecorded any reduction to the carrying value of the related assets. As of December 31, 2011 and 2012 andSeptember 30, 2013, the Company has recorded an accrued liability for cash funding received from the PRCgovernment of $3,273, $3,055, and $3,893 (unaudited), respectively, because the government had not commencedits review of the research and development projects qualified for funding at the end of the respective periods.
s. Operating Leases
The Company records rent expense on a straight-line basis over the lease term. Any difference between rentexpensed and rent paid is recorded as deferred rent.
t. Share-Based Compensation
The Company has adopted a share incentive plan under which options to purchase ordinary shares (“ShareOptions”) and Restricted Share Awards (“RSA”) have been granted to employees, consultants and directors.Under the plan, the Company is authorized to issue equity awards equal to 6,566,544 ordinary shares as ofDecember 31, 2012 and September 30, 2013 (unaudited), respectively. Share Options granted expire ten yearsfrom the date of grant and generally vest over four years, with 25% on the first anniversary of the date of grantand monthly thereafter over the remaining vesting period. RSAs have various vesting periods determined by theplan administrator, and generally vest over four years, with 25% on each anniversary of the vesting commencedate.
The Company recognizes a compensation expense for Share Options and RSAs granted to employees basedon their estimated fair value on the grant date on a straight-line basis over the requisite service period, which isthe period during which the employee is required to provide services in exchange for the award. The Companyuses the Black-Scholes option pricing model to determine the fair value of the Share Options granted and RSA’sfair value is determined based on the fair value of the Company’s ordinary shares on grant date.
The fair value of options granted to non-employees is determined using the Black-Scholes option pricingmodel. The fair value of unvested options and restricted shares granted to non-employees is re-measured at eachreporting period until the options and restricted shares are fully vested.
u. Sales, General and Administrative Expense
Sales, general and administrative expense primarily includes personnel-related expenses, including salaries,bonuses, share-based compensation and employee benefits. Sales, general and administrative expense alsoincludes field application engineering support, commissions to independent sales representatives, travel costs,professional and consulting fees, legal fees, trade shows, depreciation expense and occupancy costs.
v. Income Taxes
The Company accounts for income taxes using the asset and liability approach. Deferred tax assets andliabilities are recorded for the tax consequences attributable to the differences between the carrying amounts of
F-16

Montage Technology Group Limited
Notes to Consolidated Financial Statements—(Continued)(Dollars in thousands except share and per share data)
existing assets and liabilities in the financial statements and their respective tax basis, and operating loss carry-forwards. Deferred tax assets and liabilities are measured using tax rates enacted and expected to apply to taxableincome in the years in which the temporary differences are expected to be recovered or settled.
Deferred tax assets are reduced by a valuation allowance if, based on available evidence, it is consideredthat it is more likely than not that some portion of or all of the deferred tax assets will not be realized. In makingsuch determination, the Company considers factors including future reversals of existing taxable temporarydifferences, future profitability and tax planning strategies. If events were to occur in the future that would allowthe Company to realize more of its deferred tax assets than the presently recorded net amount, an adjustmentwould be made to the deferred tax assets that would increase income for the period when those events occurred.If events were to occur in the future that would require the Company to realize less of its deferred tax assets thanthe presently recorded net amount, an adjustment would be made to the valuation allowance against deferred taxassets that would decrease income for the period when those events occurred. Significant management judgmentis required in determining income tax expense and deferred tax assets and liabilities.
The Company applies the authoritative guidance for the accounting for uncertainty in income taxes. Theguidance requires that the tax effect of a position be recognized only if it is “more likely than not” to be sustainedbased solely on the technical merits of tax laws and regulations as of the reporting date. The Company assessesits tax position and benefits by evaluating numerous factors which may require periodic adjustment. TheCompany’s financial statements reflect only those tax positions that are more likely than not to be sustainedunder examination.
w. Comprehensive Income (Loss)
Comprehensive income (loss) is defined as the change in equity during a period from transactions and otherevents and circumstances from non-owner sources. Other comprehensive income (loss) includes certain changesin equity that are excluded from net income (loss), such as the differences for translation of subsidiaries’financial statements where the United States dollar (“USD”) is not their functional currency.
x. Net Income (Loss) Per Share
The Company follows the authoritative guide that establishes a two class method for calculating net income(loss) per share. Under the two class method, net income is allocated between ordinary shares and otherparticipating securities based on their participating rights. The guidance requires earnings available to ordinaryshareholders, after deducting preferred shares dividends, be allocated between ordinary and preferred shareholdersbased on each shareholders’ respective rights to dividends, whether or not declared. Basic net income (loss) iscalculated by dividing net income (loss) allocable to ordinary shareholders by the weighted average number ofordinary shares outstanding for the period. Diluted net income (loss) per share is calculated under the as-if-converted method unless the conversion of the preferred shares is anti-dilutive to basic net income per share.Diluted net income (loss) per share is calculated by dividing the net income (loss) allocable to ordinary shareholdersby the weighted average number of ordinary shares outstanding, adjusted for the effects of potentially dilutiveordinary shares, which are comprised of share options, restricted shares and convertible preferred shares. Theguidance does not require the presentation of basic and diluted net income (loss) per share for securities other thanordinary shares, therefore net income (loss) per share pertain only to the Company’s ordinary shares.
y. Foreign Currency Translation
The functional currency of the Company and its subsidiaries incorporated in the U.S. and Cayman Islands isthe USD. The functional currency of the Company’s three subsidiaries incorporated in Hong Kong is USD as
F-17

Montage Technology Group Limited
Notes to Consolidated Financial Statements—(Continued)(Dollars in thousands except share and per share data)
i) two of them, Montage Semiconductor Hong Kong Company Limited and Montage Technology Hong KongCompany Limited, are holding companies with limited cash flows and their cash, paid-in capital and long-terminvestment are denominated in USD and ii) Montage Technology Company Limited (“MT Company”)historically was responsible for a majority of sales and purchases with external third parties and other groupcompanies. MT Company enters into sale and purchase contracts in USD and settles related receivables andpayables in USD. In addition, inter- company charges between MT Company and the Company or itssubsidiaries are also denominated and settled in USD. The Company concluded that the primary economicenvironment in which MT Company operates is in USD. The functional currency of the Company’s subsidiariesincorporated in the PRC, which are mainly for research and development activities of the Company, is theRenminbi (“RMB”) as a majority of their purchases and research and development expenses are denominatedand settled in RMB. The functional currency of the Company’s subsidiary incorporated in Taiwan is Taiwandollars. After the Company’s subsidiary incorporated in Macao was established in June 2013, substantially all ofthe business transaction under MT Company described above is being conducted by the subsidiary in Macao. TheCompany determined that the functional currency for the subsidiary in Macao is USD as the primary economicenvironment in which it operates is in USD.
Monetary assets and liabilities in currency denomination other the functional currency are translated into thefunctional currency at the rate of exchange in effect at the balance sheet date. Transactions in currencies otherthan the functional currency during the reporting period are converted into the functional currency at theapplicable exchange rate on the day the transaction occurred. Gains and losses resulting from the translation areincluded in other income (expense), net. For the years ended December 31, 2010, 2011 and 2012 and the ninemonths ended September 30, 2012 and 2013, foreign exchange loss (gain) was $269, $495, $126, $(61)(unaudited) and $320 (unaudited), respectively.
The Company has chosen the USD as the reporting currency. For the subsidiaries whose functional currencyis not the USD, their assets and liabilities are translated at the exchange rates at the balance sheet date, equityaccounts are translated at historical exchange rates, and revenues, and expenses, gains, and losses are translatedusing the average exchange rate for the reporting period. Foreign currency translation adjustments are accountedfor as accumulated comprehensive income, which is a component of shareholders’ deficit.
z. Appropriations to Statutory Reserves
In accordance with the relevant PRC regulations, the Company’s subsidiaries in the PRC are required toallocate at least 10% of their after-tax profit, after the recovery of accumulated deficit reported under PRCaccounting standards, to the general reserve until the general reserve has reached 50% of the registered capital ofeach subsidiary in PRC. These reserves can only be used for specific purposes and are not transferable to theCompany in the form of loans, advances, or cash dividends. For the years ended December 31, 2010, 2011 and2012 and for the nine months ended September 30, 2012 and 2013, the appropriations to statutory reserves forprofit making subsidiaries in PRC were $0, $610, $130, $0 (unaudited) and $0 (unaudited), respectively.
aa. Employee Benefit Plan
The Company’s subsidiaries incorporated in the PRC participate in a government-mandated multi-employerdefined contribution plan pursuant to which certain retirement, medical and other welfare benefits are provided toemployees. Chinese labor regulations require the Company’s subsidiaries in PRC to pay to the local labor bureaua monthly contribution at a stated contribution rate based on the monthly compensation of qualified employees.The relevant local labor bureau is responsible for meeting all retirement benefit obligations. The Company’s
F-18
Montage Technology Group Limited
Notes to Consolidated Financial Statements—(Continued)(Dollars in thousands except share and per share data)
subsidiaries in the PRC have no further commitments beyond their monthly contributions. For the years endedDecember 31, 2010, 2011 and 2012 and the nine months ended September 30, 2012 and 2013, the Company’ssubsidiaries in the PRC contributed a total of $1,111, $1,558, $2,339, $1,692 (unaudited) and $2,327 (unaudited),respectively, to these funds.
The Company’s subsidiaries in Hong Kong and Taiwan contribute to pension funds administrated byindependent third parties and have no further payment obligations once the contributions have been paid. Thecontributions to the schemes are based on a fixed percentage of the employees’ relevant income per month andare expensed as incurred. The Company has no legal or constructive obligation to pay further contributions if thefunds do not hold sufficient assets to pay all employees the benefits relating to employee service in the currentand prior periods. For the years ended December 31, 2010, 2011 and 2012 and the nine months endedSeptember 30, 2012 and 2013, the Company’s subsidiaries in Hong Kong and Taiwan contributed a total of $0,$0, $10, $0 (unaudited) and $88 (unaudited), respectively, to these funds.
The Company’s subsidiary in the United States does not participate in any pension or similar employeesaving plans.
bb. Recent Accounting Pronouncements
In December 2011, the FASB issued ASU 2011-11, “Disclosures about Offsetting Assets and Liabilities.”This update requires an entity to disclose both gross and net information about instruments and transactionseligible for offset in the statements of financial position as well as instruments and transactions executed under amaster netting or similar arrangement and was issued to enable users of financial statements to understand theeffects or potential effects of those arrangements on their financial position. This update is required to be appliedretrospectively and is effective for fiscal years, and interim periods within those years, beginning on or afterJanuary 1, 2013. The adoption of this update did not have a material impact on the Company’s consolidatedfinancial statements.
In July 2012, the FASB issued ASU 2012-02, “Intangibles — Goodwill and Other: Testing Indefinite LivedIntangible Assets for Impairment.” The update applies to all entities, both public and nonpublic, that haveindefinite-lived intangible assets, other than goodwill, reported in their financial statements. Per the update, anentity has the option first to assess qualitative factors to determine whether the existence of events andcircumstances indicates that it is more likely than not that the indefinite-lived intangible asset is impaired. If,after assessing the totality of events and circumstances, an entity concludes that it is not more likely than not thatthe indefinite-lived intangible asset is impaired, then the entity is not required to take further action.The amendments are effective for annual and interim impairment tests performed for fiscal years beginning afterSeptember 15, 2012. Early adoption is permitted, including for annual and interim impairment tests performed asof a date before July 27, 2012, if financial statements for the most recent annual or interim period have not yetbeen issued. The adoption of this update did not have a material impact on the Company’s consolidated financialstatements.
In February 2013, the FASB issued ASU 2013-02, “Comprehensive Income: Reporting of AmountsReclassified Out of Accumulated Other Comprehensive Income.” This update does not change the currentrequirements for reporting net income or other comprehensive income in financial statements. However, thisupdate requires an entity to provide information about the amounts reclassified out of accumulated othercomprehensive income by component. In addition, an entity is required to present, either on the face of thestatement where net income is presented or in the notes, significant amounts reclassified out of accumulatedother comprehensive income by the respective line items of net income but only if the amount reclassified is
F-19

Montage Technology Group Limited
Notes to Consolidated Financial Statements—(Continued)(Dollars in thousands except share and per share data)
required under U.S. GAAP to be reclassified to net income in its entirety in the same reporting period. For otheramounts that are not required under U.S. GAAP to be reclassified in their entirety to net income, an entity isrequired to cross-reference to other disclosures required under U.S. GAAP that provide additional detail aboutthose amounts. This update is effective prospectively for reporting periods beginning after December 15, 2012for public entities. The adoption of this update did not have a material impact on the Company’s consolidatedfinancial statements.
In March 2013, the FASB issued ASU 2013-05, “Parent’s Accounting for the Cumulative TranslationAdjustment upon Derecognition of Certain Subsidiaries or Groups of Assets within a Foreign Entity or of anInvestment in a Foreign Entity”. This update provides that when a reporting entity (parent) ceases to have acontrolling financial interest in a subsidiary or group of assets that is a nonprofit activity or a business (other thana sale of in substance real estate or conveyance of oil and gas mineral rights) within a foreign entity, the parent isrequired to apply the guidance in Subtopic 830-30 to release any related cumulative translation adjustment intonet income. Accordingly, the cumulative translation adjustment should be released into net income only if thesale or transfer results in the complete or substantially complete liquidation of the foreign entity in which thesubsidiary or group of assets had resided. For an equity method investment that is a foreign entity, a pro rataportion of the cumulative translation adjustment should be released into net income upon a partial sale of such anequity method investment. However, this treatment does not apply to an equity method investment that is not aforeign entity. In those instances, the cumulative translation adjustment is released into net income only if thepartial sale represents a complete or substantially complete liquidation of the foreign entity that contains theequity method investment. Additionally, the amendments in this update clarify that the sale of an investment in aforeign entity includes both (1) events that result in the loss of a controlling financial interest in a foreign entity(that is, irrespective of any retained investment) and (2) events that result in an acquirer obtaining control of anacquiree in which it held an equity interest immediately before the acquisition date (sometimes also referred to asa step acquisition). Accordingly, the cumulative translation adjustment should be released into net income uponthe occurrence of those events. This update is effective prospectively for fiscal years (and interim reportingperiods within those years) beginning after December 15, 2013. The Company is currently evaluating the impacton its financial statements of adopting this update.
On April 22, 2013, the FASB issued Accounting Standards Update No. 2013-07, Presentation of FinancialStatements (Topic 205): Liquidation Basis of Accounting. This guidance addresses when and how an entityshould apply the liquidation basis of accounting. The amendments in this Update are being issued to clarify whenan entity should apply the liquidation basis of accounting. In addition, the guidance provides principles for therecognition and measurement of assets and liabilities and requirements for financial statements prepared usingthe liquidation basis of accounting. The amendments apply to all entities that issue financial statements that arepresented in conformity with U.S. GAAP except investment companies that are regulated under the InvestmentCompany Act of 1940 (the 1940 Act). The amendments are effective for entities that determine liquidation isimminent during annual reporting periods beginning after December 15, 2013, and interim reporting periodstherein. Entities should apply the requirements prospectively from the day that liquidation becomes imminent.Early adoption is permitted. The adoption of this update is not expected to have a material impact on theCompany’s consolidated financial statements.
On July 18, 2013, the FASB issued ASU No. 2013-11, Presentation of an Unrecognized Tax Benefit Whena Net Operating Loss Carryforward, a Similar Tax Loss, or a Tax Credit Carryforward Exists (Income Taxes -Topic 740). This Update applies to all entities that have unrecognized tax benefits when a net operating losscarryforward, a similar tax loss, or a tax credit carryforward exists at the reporting date. An unrecognized taxbenefit, or a portion of an unrecognized tax benefit, should be presented in the financial statements as a reductionto a deferred tax asset for a net operating loss carryforward, a similar tax loss, or a tax credit carryforward, except
F-20
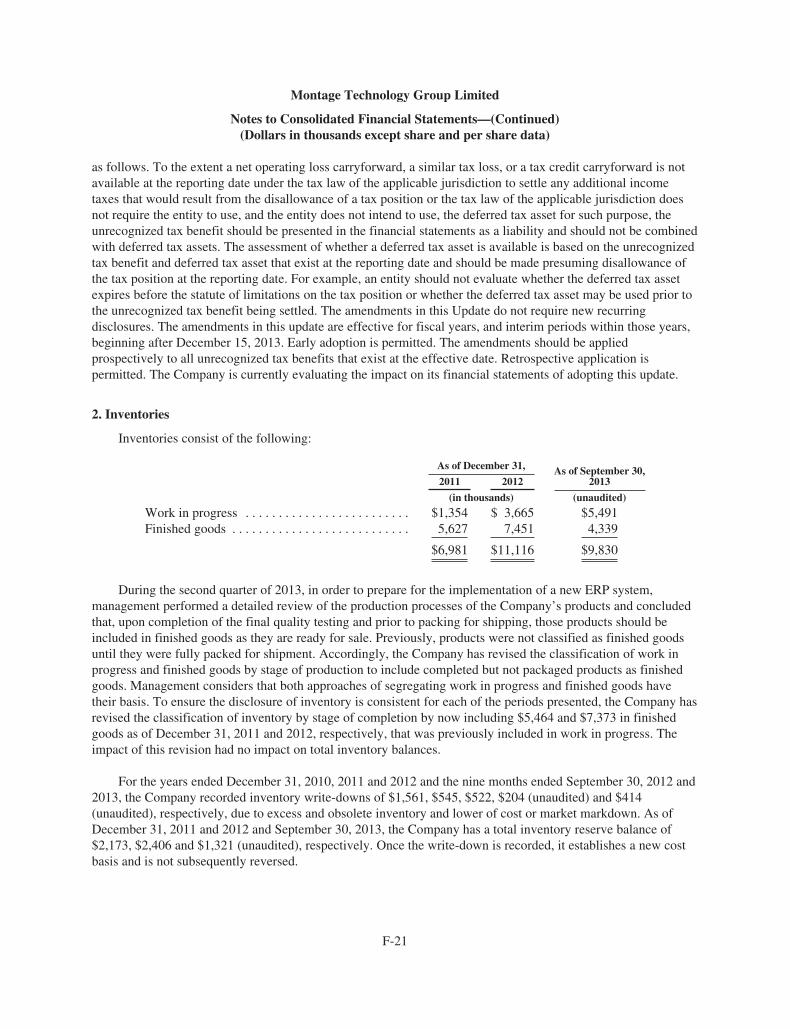
Montage Technology Group Limited
Notes to Consolidated Financial Statements—(Continued)(Dollars in thousands except share and per share data)
as follows. To the extent a net operating loss carryforward, a similar tax loss, or a tax credit carryforward is notavailable at the reporting date under the tax law of the applicable jurisdiction to settle any additional incometaxes that would result from the disallowance of a tax position or the tax law of the applicable jurisdiction doesnot require the entity to use, and the entity does not intend to use, the deferred tax asset for such purpose, theunrecognized tax benefit should be presented in the financial statements as a liability and should not be combinedwith deferred tax assets. The assessment of whether a deferred tax asset is available is based on the unrecognizedtax benefit and deferred tax asset that exist at the reporting date and should be made presuming disallowance ofthe tax position at the reporting date. For example, an entity should not evaluate whether the deferred tax assetexpires before the statute of limitations on the tax position or whether the deferred tax asset may be used prior tothe unrecognized tax benefit being settled. The amendments in this Update do not require new recurringdisclosures. The amendments in this update are effective for fiscal years, and interim periods within those years,beginning after December 15, 2013. Early adoption is permitted. The amendments should be appliedprospectively to all unrecognized tax benefits that exist at the effective date. Retrospective application ispermitted. The Company is currently evaluating the impact on its financial statements of adopting this update.
2. Inventories
Inventories consist of the following:
As of December 31, As of September 30,20132011 2012
(in thousands) (unaudited)
Work in progress . . . . . . . . . . . . . . . . . . . . . . . . . $1,354 $ 3,665 $5,491Finished goods . . . . . . . . . . . . . . . . . . . . . . . . . . . 5,627 7,451 4,339
$6,981 $11,116 $9,830
During the second quarter of 2013, in order to prepare for the implementation of a new ERP system,management performed a detailed review of the production processes of the Company’s products and concludedthat, upon completion of the final quality testing and prior to packing for shipping, those products should beincluded in finished goods as they are ready for sale. Previously, products were not classified as finished goodsuntil they were fully packed for shipment. Accordingly, the Company has revised the classification of work inprogress and finished goods by stage of production to include completed but not packaged products as finishedgoods. Management considers that both approaches of segregating work in progress and finished goods havetheir basis. To ensure the disclosure of inventory is consistent for each of the periods presented, the Company hasrevised the classification of inventory by stage of completion by now including $5,464 and $7,373 in finishedgoods as of December 31, 2011 and 2012, respectively, that was previously included in work in progress. Theimpact of this revision had no impact on total inventory balances.
For the years ended December 31, 2010, 2011 and 2012 and the nine months ended September 30, 2012 and2013, the Company recorded inventory write-downs of $1,561, $545, $522, $204 (unaudited) and $414(unaudited), respectively, due to excess and obsolete inventory and lower of cost or market markdown. As ofDecember 31, 2011 and 2012 and September 30, 2013, the Company has a total inventory reserve balance of$2,173, $2,406 and $1,321 (unaudited), respectively. Once the write-down is recorded, it establishes a new costbasis and is not subsequently reversed.
F-21

Montage Technology Group Limited
Notes to Consolidated Financial Statements—(Continued)(Dollars in thousands except share and per share data)
3. Prepaid Expenses and Other Current Assets
Prepaid expenses and other current assets consist of the following:
As of December 31, As of September 30,20132011 2012
(unaudited)
Value-added tax recoverable . . . . . . . . . . . . . . . . $ 543 $ 486 $ 603Prepaid license fees . . . . . . . . . . . . . . . . . . . . . . . 150 294 141Prepayment for material purchase . . . . . . . . . . . . 481 170 173Rental deposits . . . . . . . . . . . . . . . . . . . . . . . . . . . 316 321 400Value-added tax refundable on export sales . . . . 56 306 489Other prepaid expenses and other current
assets . . . . . . . . . . . . . . . . . . . . . . . . . . . . . . . . . 252 423 785
$1,798 $2,000 $2,591
4. Property and Equipment, Net
Property and equipment, net consist of the following:
As of December 31, As of September 30,20132011 2012
(in thousands) (unaudited)
Office and other equipment . . . . . . . . . . . . . . . . . $ 2,103 $ 3,193 $ 3,862Furniture and fixtures . . . . . . . . . . . . . . . . . . . . . . 389 475 663Leasehold improvements . . . . . . . . . . . . . . . . . . . 512 1,354 1,665
3,004 5,022 6,190Less: accumulated depreciation and
amortization . . . . . . . . . . . . . . . . . . . . . . . . . . . (1,989) (2,738) (3,731)
$ 1,015 $ 2,284 $ 2,459
For the years ended December 31, 2010, 2011 and 2012 and the nine months ended September 30, 2012 and2013, depreciation expense was $313, $405, $742, $482 (unaudited) and $929 (unaudited), respectively.
5. Acquired Intangible Assets, Net
Acquired intangible assets, net consist of the following:
As of December 31, As of September 30,20132011 2012
(in thousands) (unaudited)
Assembled workforce(1) . . . . . . . . . . . . . . . . . . . $— $1,900 $ 1,900Technology Licenses . . . . . . . . . . . . . . . . . . . . . . 150 150 116Software . . . . . . . . . . . . . . . . . . . . . . . . . . . . . . . . — — 265Montage Macao license(2) . . . . . . . . . . . . . . . . . . — — 129Less: accumulated amortization . . . . . . . . . . . . . . (56) (554) (1,390)
$ 94 $1,496 $ 1,020
F-22

Montage Technology Group Limited
Notes to Consolidated Financial Statements—(Continued)(Dollars in thousands except share and per share data)
For the years ended December 31, 2010, 2011 and 2012 and the nine months ended September 30, 2012 and2013, amortization expense was $500, $178, $498, $162 (unaudited) and $986 (unaudited), respectively.
As of December 31, 2012, the Company expects to record estimated amortization expenses of $1,285, $211,$0, $0 and $0 for the years ending December 31, 2013, 2014, 2015, 2016 and 2017, respectively.
As of September 30, 2013, the Company expects to record estimated amortization expenses of $324(unaudited), $240 (unaudited), $24 (unaudited), $23 (unaudited) and $23 (unaudited) for the three months endedDecember 31, 2013 and the years ended December 31, 2014, 2015, 2016 and 2017, respectively.
(1) Assembled workforce
On August 23, 2012, Montage Technology Hong Kong Limited, a wholly owned subsidiary of theCompany, entered into agreements with a third party to acquire a research and development workforce,intellectual property (“IP”) and computers and office equipment for total cash consideration of $2,016. Theacquisition was completed in September 2012. The Company determined that the acquisition of research anddevelopment workforce, IP and computers and office equipment should be accounted for an asset acquisition asthe group of assets acquired by the Company did not meet the definition of a business as pursuant to ASC 805.The Company allocated the total consideration to the acquired research and development workforce, IP (whichwas obsolete) and computers and office equipment with the amount of $1,900, $0 and $116, respectively, on theacquisition date. The research and development workforce is recorded as assembled workforce and amortized ona straight line basis over 18 months as the Company expected the acquired workforce to provide economicbenefit to the Company during this period based on the Company’s prior experience in developing research anddevelopment workforce and conducting research and development activities.
(2) Montage Macao license (unaudited)
The Company entered into a memorandum of understanding to acquire Sonoma Commercial Offshore, Ltd,a Macao Offshore Company, which was subsequently renamed Montage Technology Commercial OffshoreLimited (“Montage Macao”), to be the principal entity in the Company’s international corporate structure. Theacquisition of Montage Macao was completed in May 2013 when Montage Macao completed its registration withthe Macao government and the Company took control over Montage Macao. Montage Macao did not have anyassets or liabilities other than a qualification license as a commercial offshore entity in Macao. The Companydetermined that the acquisition of Montage Macao shall be accounted for as an asset acquisition of itscommercial offshore license qualification in Macao as it did not meet the definition of a business as pursuant toASC 805-20-20 and ASC 805-10-55-4 through 805-10-55-9. The useful life of the commercial offshore licensequalification in Macao is indefinite as long as the Company maintains its offshore business in Macao. Therefore,the acquisition cost of $129 for the commercial offshore license is not amortized and shall be tested forimpairment annually or more frequently if events or changes in circumstances indicate that the commercialoffshore license might be impaired pursuant to ASC 350-30-35-18 through 35-20.
6. Short-Term Loans
There were no short-term bank loans outstanding as of September 30, 2013 (unaudited). The short-termbank loans outstanding as of December 31, 2011 and 2012 carried a weighted average interest rate of 6.35%, and5.88%, per annum, respectively. The borrowings were repayable in one year of their respective draw-down date.Proceeds from short-term bank borrowings were for working capital purposes. None of the short-term bank loansbear financial covenants or restrictions.
F-23

Montage Technology Group Limited
Notes to Consolidated Financial Statements—(Continued)(Dollars in thousands except share and per share data)
Short-term bank loans as of December 31, 2011 and 2012 were all denominated in RMB.
The Company repaid the outstanding short-term bank loans of $795.5 and $795.5 upon maturity in Januaryand February 2013, respectively.
7. Accrued Liabilities
Accrued liabilities consist of the following:
As of December 31, As of September 30,20132011 2012
(in thousands) (unaudited)
Government funding for research anddevelopment projects(1) . . . . . . . . . . . . . . . . . . $3,273 $3,055 $ 3,893
Accrued employee compensation and otheremployee expenses . . . . . . . . . . . . . . . . . . . . . . 2,196 4,505 3,504
Accrued research and development expenses . . . 1,317 28 —Accrued royalty on licensed technology . . . . . . . 466 — —Advances from customers . . . . . . . . . . . . . . . . . . 141 230 267Accrued warranty . . . . . . . . . . . . . . . . . . . . . . . . . 111 149 187Accrued professional service fee . . . . . . . . . . . . . 33 497 3,484Proceeds received for early exercised options . . . 9 — 8Other accrued liabilities . . . . . . . . . . . . . . . . . . . . 545 644 598
$8,091 $9,108 $11,941
(1) For the nine months ended September 30, 2012 and 2013, the Company recorded $1,025 (unaudited) and$396 (unaudited) government funding as a deduction to expense, respectively. The Company has notrecorded any reduction to the carrying value of depreciable assets. As of December 31, 2012 andSeptember 30, 2013, the Company has recorded an accrued liability for cash funding received from the PRCgovernment of $3,055, and $3,893 (unaudited), respectively, because the government had not commencedits review of the research and development projects qualified for funding at the end of the respectiveperiods.
8. Deferred Margin, Net
Deferred margin, net consists of the following:
As of December 31, As of September 30,20132011 2012
(in thousands) (unaudited)
Deferred revenue . . . . . . . . . . . . . . . . . . . . . . . . $12,685 $ 15,878 $ 20,146Deferred cost of revenue . . . . . . . . . . . . . . . . . . (7,538) (14,678) (18,601)
$ 5,147 $ 1,200 $ 1,545
F-24

Montage Technology Group Limited
Notes to Consolidated Financial Statements—(Continued)(Dollars in thousands except share and per share data)
The deferred revenue and deferred cost of revenue on sales to distributor activities for the years ended 2010,2011 and 2012 and the nine months ended September 30, 2012 and 2013 were as follows:
For the Years Ended December 31,Nine Months Ended
September 30,
2010 2011 2012 2012 2013
(in thousands) (unaudited) (unaudited)
Balance at the beginning of the period . . . . . . . . . . . . . $ 1,979 $ 828 $ 5,147 $ 5,147 $ 1,200Revenue deferred upon shipment to
distributors . . . . . . . . . . . . . . . . . . . . . . . . . . . . 23,739 53,085 40,456 27,734 33,847Cost of sales deferred upon shipments to
distributors . . . . . . . . . . . . . . . . . . . . . . . . . . . . (14,933) (23,426) (31,655) (18,509) (26,952)Revenue recognized upon resale from
distributors to end customers . . . . . . . . . . . . . . (23,780) (43,747) (37,007) (26,295) (29,126)Cost of sales recognized upon resale from
distributors to end customers . . . . . . . . . . . . . . 15,247 18,066 24,515 13,126 23,029Price adjustments to distributors . . . . . . . . . . . . . (1,424) 341 (256) (195) (453)
Balance at the end of period . . . . . . . . . . . . . . . . . . . . . $ 828 $ 5,147 $ 1,200 $ 1,008 $ 1,545
The following table shows reconciliation from revenue recognized upon resale from distributors to endcustomers as included in the above table to revenue recorded in the consolidated statements of operations andcomprehensive income (loss) for the years ended December 31, 2010, 2011 and 2012 and the nine months endedSeptember 30, 2012 and 2013:
For the Years EndedDecember 31,
Nine Months EndedSeptember 30,
2010 2011 2012 2012 2013
(in thousands) (unaudited) (unaudited)
Revenue recognized upon resale from distributors to endcustomers (through deferred revenue) . . . . . . . . . . . . . $23,780 $43,747 $37,007 $26,295 $29,126
Revenue recognized upon resale from LQW to endcustomers (recorded directly in revenue)(1) . . . . . . . . — — 29,007 17,998 38,115
Revenue recognized for the Company’s sales directly toend customers . . . . . . . . . . . . . . . . . . . . . . . . . . . . . . . . 5,298 6,591 12,231 10,245 8,207
Total . . . . . . . . . . . . . . . . . . . . . . . . . . . . . . . . . . . . . . . . . $29,078 $50,338 $78,245 $54,538 $75,448
(1) LQW has been a distributor for the Company’s products since October 2011 and no revenue was recognizedthrough sales by LQW for the year ended December 31, 2011. As discussed in note 1n, the Company isentitled to bill only a portion of the total sale price at the time of shipment (deferred revenue), with theremainder billed upon sale by LQW to the end customer. The portion of the total sale price that theCompany is not entitled to bill at the time of shipment to LQW is recorded directly in revenue upon sale byLQW to the end customers.
F-25

Montage Technology Group Limited
Notes to Consolidated Financial Statements—(Continued)(Dollars in thousands except share and per share data)
9. Convertible Preferred Shares
Convertible preferred shares consist of the following as of December 31, 2012:
ConvertiblePreferred Shares Issuance date
ParValuePer
Share
SubscriptionPrice
Per Share
Shares Carryingamount
LiquidationValueAuthorized Outstanding
Series A . . . . . . . . . . . April 23, 2004 andAugust 31, 2004 $0.0125 $1.2500 4,800,000 4,800,000 $ 6,000 $ 6,000
Series B . . . . . . . . . . . June 19, 2006 0.0125 3.2263 4,681,416(1) 3,325,843 13,949 10,730Series B issued upon
exercise ofwarrant . . . . . . . . . December 20, 2007 0.0125 2.5400 930,000 3,071 2,362
Series B-1 . . . . . . . . . May 18, 2007 0.0125 3.9985 4,551,709 4,049,276 21,048 16,191Series B-2 . . . . . . . . . October 8, 2009
October 22, 2009June 30, 2010 0.0125 2.7990(2) 3,571,514 2,839,409 10,309 7,947
17,604,639 15,944,528 $54,377 $43,230
Convertible preferred shares consist of the following as of September 30, 2013 (unaudited):
ConvertiblePreferred Shares Issuance date
ParValuePer
Share
SubscriptionPrice Per
Share
Shares Carryingamount
LiquidationValueAuthorized Outstanding
Series A . . . . . . . . . . . April 23, 2004 andAugust 31, 2004 $0.0125 $1.2500 4,800,000 4,800,000 $ 6,000 $ 6,000
Series B . . . . . . . . . . . June 19, 2006 0.0125 3.2263 4,681,416(1) 3,325,843 13,949 10,730Series B issued upon
exercise ofwarrant . . . . . . . . . December 20, 2007 0.0125 2.5400 930,000 3,071 2,362
Series B-1 . . . . . . . . . May 18, 2007 0.0125 3.9985 4,551,709 4,049,276 21,048 16,191Series B-2 . . . . . . . . . October 8, 2009
October 22, 2009June 30, 2010 0.0125 2.7990(2) 3,571,514 2,839,409 10,332 7,947
17,604,639 15,944,528 $54,400 $43,230
(1) Authorized shares for Series B convertible preferred shares issued on June 19, 2006 also included sharesauthorized for Series B convertible preferred shares issued upon exercise of warrant on December 20, 2007.
(2) Pursuant to the Company’s Amended and Restated Memorandum and Articles dated September 2009, thesubscription price for Series B-2 convertible preferred shares represents the weighted average price of theshares issued in October 2009 and June 2010, respectively.
F-26

Montage Technology Group Limited
Notes to Consolidated Financial Statements—(Continued)(Dollars in thousands except share and per share data)
The Company’s Board of Directors is authorized to determine the rights of each offering of convertiblepreferred shares including, among other terms, dividend rights, voting rights, conversion rights, redemptionprices and liquidation preferences, if any, subject to the limitations of applicable laws, regulations and its charter.The following summarizes the terms of each series of convertible preferred shares:
Conversion Rights
Each share of Series A, Series B, Series B-1 and Series B-2 is convertible, at the holder’s option, into suchnumber of fully paid and nonassessable ordinary shares as is determined by dividing the applicable originalissuance price by the conversion price which is the same as the original issue price.
In the event of the issuance of additional ordinary shares, subject to certain exclusions, at a price per shareless than the conversion price for any series of convertible preferred shares in effect on the date of such issuance,the conversion price for that series will be adjusted based on a weighted average anti-dilution formula. Theconversion price is also subject to adjustment based on certain other anti-dilution provisions. Each convertiblepreferred share will automatically convert into ordinary shares at its then effective conversion rate immediatelyupon the closing of an initial public offering pursuant to an effective registration statement under the SecuritiesAct of 1933, as amended, covering the offer and sale of ordinary shares with gross proceeds to the Company ofnot less than $50 million at a price per share of at least $5.00 (“Qualified IPO”). The Company is required toreserve and keep available, out of its authorized but unissued ordinary shares, 16,163,598 shares for theconversion of convertible preferred shares.
In connection with the issuance of Series B-2 upon the exercise in full of all the Series B-2 warrants, theweighted average price for Series B-2 originally issued in October 2009 and Series B-2 issued upon exercise ofwarrant in June 2010 was $2.7990 per share, which was less than the original conversion price of Series B issuedon June 19, 2006 and Series B-1, the conversion price for Series B issued on June 19, 2006 and Series B-1 wasadjusted to $3.1715 and $3.8450 per share, respectively, on August 18, 2010. After such adjustment, each SeriesB issued on June 19, 2006 and Series B-1 share is convertible into approximately 1.0173 and 1.040 ordinaryshares, respectively.
Dividends
The holders of each series of convertible preferred shares are entitled to receive noncumulative dividendsper annum when and if declared by the Board of Directors. The Series A, Series B, Series B-1 and Series B-2convertible preferred shares are entitled to dividends at 8% of the original issuance price per share. After theforegoing dividend payments, if any, have been made in full in a given calendar year, any dividends declared bythe Board out of funds legally available shall be shared ratably among the holders of ordinary shares; provided,however, that any non-cash dividends shall be shared ratably among the holders of ordinary and preferred shareson an as-if-converted basis. No dividends have been declared or paid to date.
Liquidation
In the event of any liquidation, dissolution or winding up of the Company, whether voluntarily orinvoluntary, including a consolidation, merger or acquisition or sale of assets where the beneficial owners of theCompany’s ordinary shares and convertible preferred shares own less than a majority of the resulting votingpower of the surviving entity, the holders of Series A, Series B, Series B-1 and Series B-2 convertible preferredshares are entitled to receive an amount equal to 100% of the subscription price per share, based on the number
F-27

Montage Technology Group Limited
Notes to Consolidated Financial Statements—(Continued)(Dollars in thousands except share and per share data)
of preferred shares plus any declared but unpaid dividends prior to the distribution to the ordinary shares. Theremaining assets, if any, shall be distributed among the holders of ordinary shares on a pro rata basis based on thenumber of shares they hold.
Voting Rights
The holders of each preferred share are entitled to the number of votes equal to the number of ordinaryshares into which such preferred shares are converted.
Redemption Rights
The holders of the Company’s Series B and B-1 preferred shares hold redemption rights such that at anytime after June 19, 2011, if at least two-thirds of the holders of Series B and B-1 convertible preferred shares,voting together, elect to redeem their shares, the Company shall redeem all Series B and B-1 convertiblepreferred shares. The holders of the Company’s Series B-2 convertible preferred shares hold redemption rightssuch that at any time after June 1, 2013, if at least two-thirds of the holders of Series B-2 elect to redeem theirshares, the Company shall redeem all Series B-2 convertible preferred shares. The redemption price available toSeries B, B-1 and B-2 shall be 130% of subscription price per share, plus all declared and unpaid dividends.
According to the shareholders’ resolution dated August 13, 2013, the first possible redemption dates of theCompany’s Series B, B-1 and B-2 preferred shares were amended to January 1, 2014, respectively.
There was no consideration given to the holders of the Series B, B-1 and B2 preferred shares for themodification of the first possible redemption dates. Based on the assessment the Company performed, themodification for the first possible redemption dates did not involve the transfer of wealth between ordinaryshares, Series A and Series B, B-1 and B-2 preferred shares as the modification was viewed as a pre-conditionagreed by the holders of ordinary and preferred shares for the Company’s initial public offering.
The aggregate amount of redemption for all issued redeemable preferred shares each year for the five yearsfollowing December 31, 2012 is $48,400.
Accretion
In accordance with authoritative guidance and consistent with the accounting for Series B, B-1 and B-2convertible preferred shares, the carrying value of the Series B, B-1 and B-2 convertible preferred shares is adjustedfor accretion to the redemption price over the period from the date of issuance to the first possible redemption date(June 19, 2011 for Series B and B-1 and June 1, 2013 for Series B-2) using the effective interest rate method. Priorto the shareholders’ approval for the modification of the first possible redemption dates of the Company’s Series B,B-1 and B-2 to January 1, 2014 on August 13, 2013, the carrying value of the Series B, B-1 and B-2 convertiblepreferred shares had already been fully accreted to the redemption. The modification of the first possible redemptiondate has no impact on the accretion to Series B, B-1 and B-2’s redemption value.
F-28
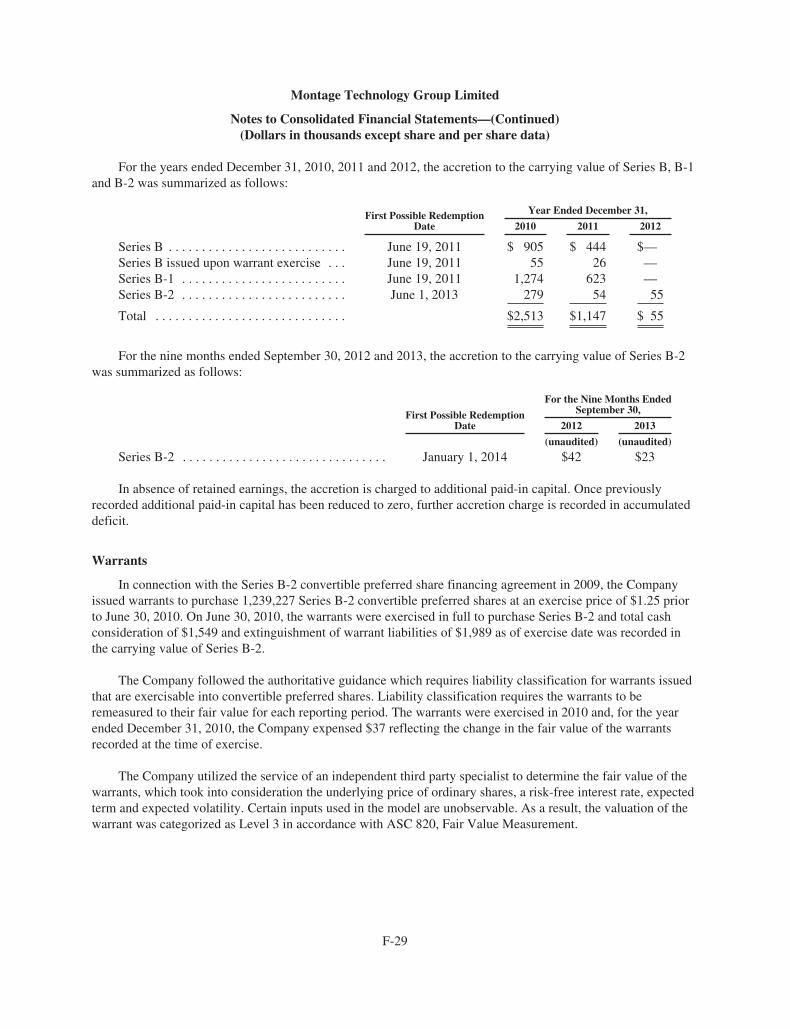
Montage Technology Group Limited
Notes to Consolidated Financial Statements—(Continued)(Dollars in thousands except share and per share data)
For the years ended December 31, 2010, 2011 and 2012, the accretion to the carrying value of Series B, B-1and B-2 was summarized as follows:
First Possible RedemptionDate
Year Ended December 31,
2010 2011 2012
Series B . . . . . . . . . . . . . . . . . . . . . . . . . . . June 19, 2011 $ 905 $ 444 $—Series B issued upon warrant exercise . . . June 19, 2011 55 26 —Series B-1 . . . . . . . . . . . . . . . . . . . . . . . . . June 19, 2011 1,274 623 —Series B-2 . . . . . . . . . . . . . . . . . . . . . . . . . June 1, 2013 279 54 55
Total . . . . . . . . . . . . . . . . . . . . . . . . . . . . . $2,513 $1,147 $ 55
For the nine months ended September 30, 2012 and 2013, the accretion to the carrying value of Series B-2was summarized as follows:
First Possible RedemptionDate
For the Nine Months EndedSeptember 30,
2012 2013
(unaudited) (unaudited)
Series B-2 . . . . . . . . . . . . . . . . . . . . . . . . . . . . . . . January 1, 2014 $42 $23
In absence of retained earnings, the accretion is charged to additional paid-in capital. Once previouslyrecorded additional paid-in capital has been reduced to zero, further accretion charge is recorded in accumulateddeficit.
Warrants
In connection with the Series B-2 convertible preferred share financing agreement in 2009, the Companyissued warrants to purchase 1,239,227 Series B-2 convertible preferred shares at an exercise price of $1.25 priorto June 30, 2010. On June 30, 2010, the warrants were exercised in full to purchase Series B-2 and total cashconsideration of $1,549 and extinguishment of warrant liabilities of $1,989 as of exercise date was recorded inthe carrying value of Series B-2.
The Company followed the authoritative guidance which requires liability classification for warrants issuedthat are exercisable into convertible preferred shares. Liability classification requires the warrants to beremeasured to their fair value for each reporting period. The warrants were exercised in 2010 and, for the yearended December 31, 2010, the Company expensed $37 reflecting the change in the fair value of the warrantsrecorded at the time of exercise.
The Company utilized the service of an independent third party specialist to determine the fair value of thewarrants, which took into consideration the underlying price of ordinary shares, a risk-free interest rate, expectedterm and expected volatility. Certain inputs used in the model are unobservable. As a result, the valuation of thewarrant was categorized as Level 3 in accordance with ASC 820, Fair Value Measurement.
F-29

Montage Technology Group Limited
Notes to Consolidated Financial Statements—(Continued)(Dollars in thousands except share and per share data)
In determining the fair value of the warrants, the Company applied the Black-Scholes pricing model withthe following assumptions used:
January 1, 2010
Expected volatility (%)(1) . . . . . . . . . . . . . . . . . . . . . . . . . 43.55%Expected dividend yield (%)(2) . . . . . . . . . . . . . . . . . . . . 0%Expected term (years)(3) . . . . . . . . . . . . . . . . . . . . . . . . . . 0.5Risk-free interest rate (per annum) (%)(4) . . . . . . . . . . . . 1.162%
(1) The expected volatility was estimated based on the historical volatility of comparable companies in theperiod equal to average time to expiration.
(2) The expected dividends are considered to be zero because the Company has no history or expectation ofpaying dividends on its ordinary shares.
(3) The expected term was determined based on the period between the valuation date and the expiration date asthe warrants are transferable.
(4) The risk-free interest rates are based on the yield of government securities with similar time duration as theexpected term.
For the year ended December 31, 2010, the changes in the fair value of warrant liabilities were summarizedas follows:
Amount
Balance as of January 1, 2010 . . . . . . . . . . . . . . . . . . . . . . . . . . . . . . . . . . . . . . . . . . $ 1,952Changes in the fair value prior to warrant exercise on June 30, 2010 . . . . . . . . . . . 37Transferred warrant liabilities to carrying value of Series B-2 preferred shares . . . (1,989)
Balance as of December 31, 2010 . . . . . . . . . . . . . . . . . . . . . . . . . . . . . . . . . . . . . . . $ —
10.Share-Based Compensation
The Company’s 2006 Share Incentive Plan, or the 2006 Plan, was adopted in June 2006. The 2006 Planprovides for the issuance of incentive share options (ISOs), nonstatutory share options (NSOs) and restrictedshare awards (RSAs). NSOs may be granted to employee, directors and consultants, while ISOs may be grantedonly to employees and RSAs may be granted to employees, directors or non-employees. Share options grantedvest over a maximum period of four years and expire ten years from the date of the grant. Share options generallyvest over four years, one-quarter on the first anniversary of the date of the grant and monthly thereafter for theremaining three years. RSAs have various vesting periods determined by the plan administrator, and generallyvest over four years, with 25% on each of the anniversary of the vesting commence date. As of December 31,2011 and 2012, and September 30, 2013, the number of ordinary shares authorized for equity award issuanceunder the 2006 Plan was 4,656,000, 6,566,544 and 6,566,544 (unaudited) shares, respectively.
The Company’s board of directors has approved and adopted a 2013 Performance Incentive Plan, or the2013 Plan, in connection with the initial public offering. The Company’s shareholders have approved the 2013Plan, which has become effective upon the completion of the initial public offering. A total of 1,600,000 ordinaryshares were originally authorized for issuance with respect to awards granted under the 2013 Plan. The sharelimit will automatically increase on the first trading day in January of each year (commencing with January2014) by an amount equal to the lesser of (1) 4% of the total number of outstanding ordinary shares on the lasttrading day in December in the prior year, (2) 1,000,000 shares, or such lesser number as determined by ourboard of directors.
F-30
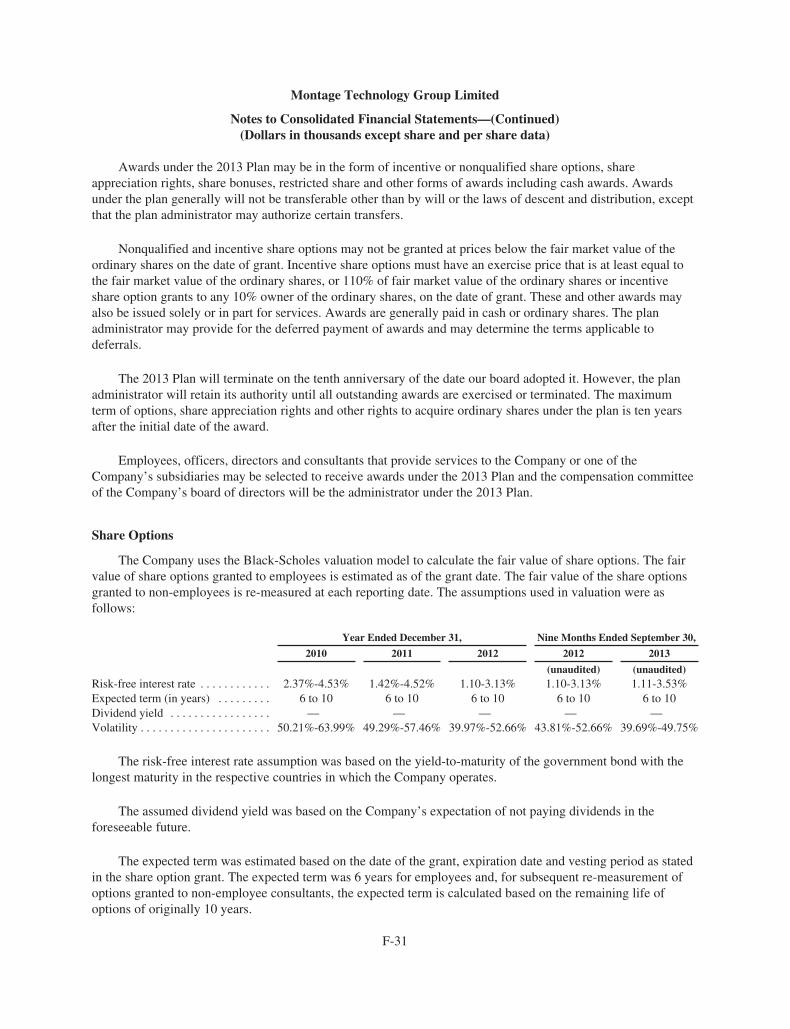
Montage Technology Group Limited
Notes to Consolidated Financial Statements—(Continued)(Dollars in thousands except share and per share data)
Awards under the 2013 Plan may be in the form of incentive or nonqualified share options, shareappreciation rights, share bonuses, restricted share and other forms of awards including cash awards. Awardsunder the plan generally will not be transferable other than by will or the laws of descent and distribution, exceptthat the plan administrator may authorize certain transfers.
Nonqualified and incentive share options may not be granted at prices below the fair market value of theordinary shares on the date of grant. Incentive share options must have an exercise price that is at least equal tothe fair market value of the ordinary shares, or 110% of fair market value of the ordinary shares or incentiveshare option grants to any 10% owner of the ordinary shares, on the date of grant. These and other awards mayalso be issued solely or in part for services. Awards are generally paid in cash or ordinary shares. The planadministrator may provide for the deferred payment of awards and may determine the terms applicable todeferrals.
The 2013 Plan will terminate on the tenth anniversary of the date our board adopted it. However, the planadministrator will retain its authority until all outstanding awards are exercised or terminated. The maximumterm of options, share appreciation rights and other rights to acquire ordinary shares under the plan is ten yearsafter the initial date of the award.
Employees, officers, directors and consultants that provide services to the Company or one of theCompany’s subsidiaries may be selected to receive awards under the 2013 Plan and the compensation committeeof the Company’s board of directors will be the administrator under the 2013 Plan.
Share Options
The Company uses the Black-Scholes valuation model to calculate the fair value of share options. The fairvalue of share options granted to employees is estimated as of the grant date. The fair value of the share optionsgranted to non-employees is re-measured at each reporting date. The assumptions used in valuation were asfollows:
Year Ended December 31, Nine Months Ended September 30,
2010 2011 2012 2012 2013
(unaudited) (unaudited)Risk-free interest rate . . . . . . . . . . . . 2.37%-4.53% 1.42%-4.52% 1.10-3.13% 1.10-3.13% 1.11-3.53%Expected term (in years) . . . . . . . . . 6 to 10 6 to 10 6 to 10 6 to 10 6 to 10Dividend yield . . . . . . . . . . . . . . . . . — — — — —Volatility . . . . . . . . . . . . . . . . . . . . . . 50.21%-63.99% 49.29%-57.46% 39.97%-52.66% 43.81%-52.66% 39.69%-49.75%
The risk-free interest rate assumption was based on the yield-to-maturity of the government bond with thelongest maturity in the respective countries in which the Company operates.
The assumed dividend yield was based on the Company’s expectation of not paying dividends in theforeseeable future.
The expected term was estimated based on the date of the grant, expiration date and vesting period as statedin the share option grant. The expected term was 6 years for employees and, for subsequent re-measurement ofoptions granted to non-employee consultants, the expected term is calculated based on the remaining life ofoptions of originally 10 years.
F-31

Montage Technology Group Limited
Notes to Consolidated Financial Statements—(Continued)(Dollars in thousands except share and per share data)
Due to the Company’s limited historical data, the estimated volatility incorporated the historical volatility ofcomparable companies whose share prices are publicly available.
In connection with the grant of share options to all participants, the Company recorded share-basedcompensation of $778, $631, $989, $682 (unaudited) and $1,958 (unaudited) for the years ended December 31,2010, 2011 and 2012 and the nine months ended September 30, 2012 and 2013, respectively.
From inception to September 30, 2013, the Company issued share options to certain employees and non-employees under the 2006 Plan with exercise prices below the fair value of the Company’s ordinary shares at thedate of grant. The Company estimated the fair value of its ordinary shares based upon several factors, includingprogress and milestones attained in its business. In accordance with the requirements of ASC 718, the Companyhas recorded share-based compensation expense based on the fair value of share options at the date of grant orremeasurement date on a straight line basis over requisite service period.
Early Exercise of Employee Share Options
Certain share options granted under the 2006 Plan provide option holders the right to elect to exerciseunvested options in exchange for restricted ordinary shares. Unvested shares, which amounted to 4,000, 0 and7,500 (unaudited) shares as of December 31, 2011 and 2012 and September 30, 2013 respectively, are subject toa repurchase right held by the Company at the lower of (a) the fair market value of the restricted ordinary sharesat the time of the termination, or (b) the original purchase price of the restricted ordinary shares, upontermination of the holder’s status as an employee or consultant. For exercises of employee options, this rightusually lapses 25% on the first anniversary of the vesting start date and in 36 equal monthly amounts thereafter.These repurchase terms are considered to be a forfeiture provision and do not result in variable accounting. Inaccordance with authoritative guidance, the cash received from option holders for the exercise of unvestedoptions is treated as a refundable deposit shown as a liability in the Company’s consolidated financial statements.As of December 31, 2011 and 2012 and September 30, 2013, cash received for early exercise of options totaled$9, $0, and $8 (unaudited), respectively.
Total fair value for share options vested during the years ended December 31, 2010, 2011 and 2012 and thenine months ended September 30, 2012 and 2013 was $762, $561, $860, $646 (unaudited) and $1,100(unaudited), respectively.
The total compensation cost related to all unvested share option grants not yet recognized as ofDecember 31, 2012 and September 30, 2013 was $4,100 and $13,091 (unaudited), respectively and the weighted-average period over which these grants are expected to vest is 3.33 years and 3.69 (unaudited) years,respectively.
F-32
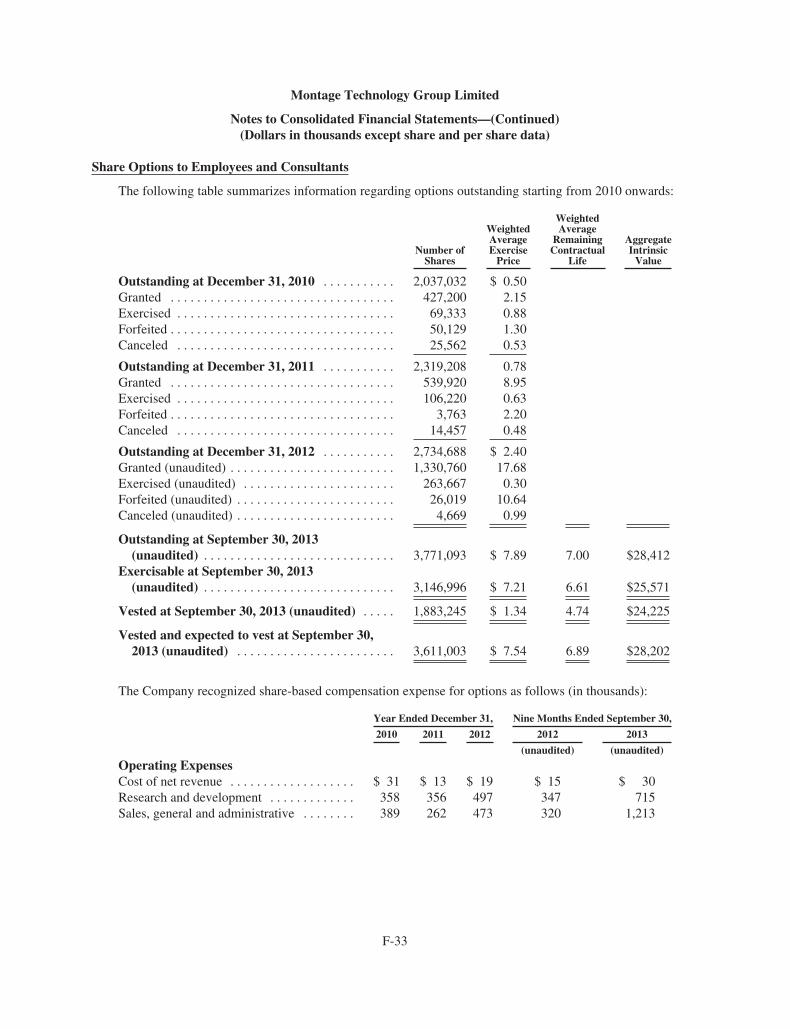
Montage Technology Group Limited
Notes to Consolidated Financial Statements—(Continued)(Dollars in thousands except share and per share data)
Share Options to Employees and Consultants
The following table summarizes information regarding options outstanding starting from 2010 onwards:
Number ofShares
WeightedAverageExercise
Price
WeightedAverage
RemainingContractual
Life
AggregateIntrinsic
Value
Outstanding at December 31, 2010 . . . . . . . . . . . 2,037,032 $ 0.50Granted . . . . . . . . . . . . . . . . . . . . . . . . . . . . . . . . . . 427,200 2.15Exercised . . . . . . . . . . . . . . . . . . . . . . . . . . . . . . . . . 69,333 0.88Forfeited . . . . . . . . . . . . . . . . . . . . . . . . . . . . . . . . . . 50,129 1.30Canceled . . . . . . . . . . . . . . . . . . . . . . . . . . . . . . . . . 25,562 0.53
Outstanding at December 31, 2011 . . . . . . . . . . . 2,319,208 0.78Granted . . . . . . . . . . . . . . . . . . . . . . . . . . . . . . . . . . 539,920 8.95Exercised . . . . . . . . . . . . . . . . . . . . . . . . . . . . . . . . . 106,220 0.63Forfeited . . . . . . . . . . . . . . . . . . . . . . . . . . . . . . . . . . 3,763 2.20Canceled . . . . . . . . . . . . . . . . . . . . . . . . . . . . . . . . . 14,457 0.48
Outstanding at December 31, 2012 . . . . . . . . . . . 2,734,688 $ 2.40Granted (unaudited) . . . . . . . . . . . . . . . . . . . . . . . . . 1,330,760 17.68Exercised (unaudited) . . . . . . . . . . . . . . . . . . . . . . . 263,667 0.30Forfeited (unaudited) . . . . . . . . . . . . . . . . . . . . . . . . 26,019 10.64Canceled (unaudited) . . . . . . . . . . . . . . . . . . . . . . . . 4,669 0.99
Outstanding at September 30, 2013(unaudited) . . . . . . . . . . . . . . . . . . . . . . . . . . . . . 3,771,093 $ 7.89 7.00 $28,412
Exercisable at September 30, 2013(unaudited) . . . . . . . . . . . . . . . . . . . . . . . . . . . . . 3,146,996 $ 7.21 6.61 $25,571
Vested at September 30, 2013 (unaudited) . . . . . 1,883,245 $ 1.34 4.74 $24,225
Vested and expected to vest at September 30,2013 (unaudited) . . . . . . . . . . . . . . . . . . . . . . . . 3,611,003 $ 7.54 6.89 $28,202
The Company recognized share-based compensation expense for options as follows (in thousands):
Year Ended December 31, Nine Months Ended September 30,
2010 2011 2012 2012 2013
(unaudited) (unaudited)
Operating ExpensesCost of net revenue . . . . . . . . . . . . . . . . . . . $ 31 $ 13 $ 19 $ 15 $ 30Research and development . . . . . . . . . . . . . 358 356 497 347 715Sales, general and administrative . . . . . . . . 389 262 473 320 1,213
F-33

Montage Technology Group Limited
Notes to Consolidated Financial Statements—(Continued)(Dollars in thousands except share and per share data)
The following table summarizes information about share options outstanding as of December 31, 2012:
Share Options OutstandingShare Options
Exercisable
Range of Exercise PricesShares
Outstanding
WeightedAverage
RemainingContractual
Term(in years)
WeightedAverageExercise
PriceShares
Exercisable
WeightedAverageExercise
Price
$ 0.13-$0.25 . . . . . . . . . . . . . . . . . . . 1,008,800 3.48 $0.13 1,008,800 $0.13$ 0.40-$1.03 . . . . . . . . . . . . . . . . . . . 802,980 6.07 0.98 752,897 0.98$ 2.20-$9.43 . . . . . . . . . . . . . . . . . . . 922,907 9.19 6.18 475,583 6.18
2,734,687 6.16 $2.40 2,237,280 $1.70
The following table summarizes information about share options outstanding as of September 30, 2013(unaudited):
Share Options OutstandingShare Options
Exercisable
Range of Exercise PricesShares
Outstanding
WeightedAverage
RemainingContractual
Term(in years)
WeightedAverageExercise
PriceShares
Exercisable
WeightedAverageExercise
Price
Unaudited
$0.13-$0.25 . . . . . . . . . . . . . . . . . . . . 789,600 2.75 $ 0.13 789,600 $ 0.13$0.40-$1.03 . . . . . . . . . . . . . . . . . . . . 758,480 5.24 0.96 735,166 0.96$2.20-$9.43 . . . . . . . . . . . . . . . . . . . . 897,253 8.44 6.11 581,830 6.08$16.03-$17.85 . . . . . . . . . . . . . . . . . . 1,325,760 9.56 17.68 1,040,400 17.64
3,771,093 7.00 $ 7.89 3,146,996 $ 7.21
Restricted Share Awards
On April 23, 2013 and August 13, 2013, the Company granted 317,120 and 13,500 restricted shares with non-forfeitable dividend rights under the 2006 Plan and these restricted shares are entitled to cash dividends with respectto the Restricted Shares subject to the award even though such shares are not vested. Therefore, pursuant to ASC260-10-45-61A, these restricted shares are participating securities and related unvested restricted shares are includedin the computation of basic net income per share under the two-class method.
F-34

Montage Technology Group Limited
Notes to Consolidated Financial Statements—(Continued)(Dollars in thousands except share and per share data)
The following table summarizes the details related to RSAs, granted and outstanding under the 2006 Planfor the nine months ended September 30, 2013:
Numberof Shares
Weighted-AverageGrant Date FairValue Per Share
Outstanding at December 31, 2012 . . . . . . . . . . . . — $ —Granted . . . . . . . . . . . . . . . . . . . . . . . . . . . . . . . . . . . 330,620 17.98Vested . . . . . . . . . . . . . . . . . . . . . . . . . . . . . . . . . . . . — —Forfeited . . . . . . . . . . . . . . . . . . . . . . . . . . . . . . . . . . 8,200 17.98
Outstanding at September 30, 2013(unaudited) . . . . . . . . . . . . . . . . . . . . . . . . . . . . . 322,420(*) $17.98
(*) The restricted shares are not included in the outstanding ordinary shares due to their restrictions.
The estimated fair value on the grant date of RSAs was $17.98 per share and the share-based compensationexpense related to these awards is calculated based on the estimated fair value of the Company’s ordinary shareson the date of grant, multiplied by the number of RSAs granted. The share-based compensation expense, less theforfeitures, is recorded on a straight-line basis over the requisite service period of the RSAs. As of September 30,2013, there was $4,698 (unaudited) of unrecognized compensation costs, net of forfeitures related to RSAsgranted under the 2006 Plan. The unrecognized compensation cost is expected to be recognized over a weightedaverage period of 3.97 (unaudited) years.
In connection with the grant of the RSAs to all participants, the Company recorded share-basedcompensation of $504 (unaudited) for the nine months ended September 30, 2013.
The Company recognized share-based compensation expense for RSAs as follows (in thousands):
Year Ended December 31, Nine Months Ended September 30,
2010 2011 2012 2012 2013
(Unaudited) (Unaudited)
Operating ExpensesCost of net revenue . . . . . . . . . . . . . . . . . . . $— $— $— $— $ 32Research and development . . . . . . . . . . . . . — — — — 409Sales, general and administrative . . . . . . . . — — — — 63
11. Income Taxes
The Company is incorporated as an international business company with limited liability under InternationalBusiness Companies Act, 1984 of the British Virgin Islands on March 29, 2004 and continued to, and registeredin the Cayman Islands as an exempted company on April 24, 2006. The Company conducts business in severalterritories including China, Hong Kong, Taiwan, Macao and the United States. The Company is subject totaxation in each of these territories in which it conducts business. As a result, the Company’s worldwide incomewill be subject to the tax rates in which its income is generated and as such its effective tax rate may fluctuatebased on the geographic distribution of its earned income or losses and the applicable tax laws in which thoseearnings or losses were generated.
F-35

Montage Technology Group Limited
Notes to Consolidated Financial Statements—(Continued)(Dollars in thousands except share and per share data)
Cayman Islands
The Company is not subject to income or capital gains tax.
United States
The Company’s subsidiary incorporated in the U.S. is subject to U.S. federal income taxes at graduated taxrates from 15% to 35% and the income allocated and apportioned to California is subject to California incometax at 8.8%.
Hong Kong
The Company’s subsidiaries incorporated in Hong Kong are subject to income tax rates at 16.5% on theirassessable profits.
Macao
As an offshore trading company, the Company’s subsidiary in Macao is not subject to income tax.
Taiwan
The Company’s subsidiary incorporated in Taiwan is subject to income tax rates at 17% on their assessableprofits.
PRC
The generally applicable corporate income tax rate in China (referred to herein as an enterprise income taxrate) is 25%. The Company’s principal PRC operating subsidiary enjoys certain preferential tax rates due to itsqualification as a qualified integrated circuit design enterprise and a high and new technology enterprise, orHNTE. As a qualified integrated circuit design enterprise, the Company’s principal PRC operating subsidiary isentitled to a two-year enterprise income tax exemption followed by a three-year 50% enterprise income tax ratereduction commencing from the first profit-making year, which was 2010. As a result, the Company’s principalPRC operating subsidiary was exempt from PRC enterprise income tax in 2010 and 2011 and enjoys apreferential 12.5% enterprise income tax from 2012 through 2014. PRC preferential tax treatments are subject toreview and may be adjusted or revoked at any time in the future.
Pursuant to the PRC Corporate Income Tax Law, net operating losses can be carried forward 5 years tooffset future taxable income.
Income (loss) before income taxes consists of the following:
Year Ended December 31,
2010 2011 2012
(in thousands)
China operations . . . . . . . . . . . . . . . . . . . . . . . . . . . . . . . . . . $ 319 $5,952 $ 2,241Non-China operations . . . . . . . . . . . . . . . . . . . . . . . . . . . . . . (8,808) 1,657 17,268
Income (loss) before income taxes . . . . . . . . . . . . . . . . . . . . $(8,489) $7,609 $19,509
F-36

Montage Technology Group Limited
Notes to Consolidated Financial Statements—(Continued)(Dollars in thousands except share and per share data)
Management’s intention is to indefinitely reinvest any undistributed earnings from its subsidiaries in China,Hong Kong, Taiwan, Macao and the United States. Accordingly, no provision for withholding taxes has beenprovided nor is it practical to determine the amount of this liability. Upon distribution of those earnings in theform of dividends or otherwise, the Company will be subject to potential withholding taxes in the above-mentioned jurisdictions.
The Company’s worldwide operating income is subject to varying rates and its consolidated effective taxrate is dependent upon the countries in which earnings or loss were realized and the tax laws in effect in eachcountry. The Company is incorporated in the Cayman Islands with foreign subsidiaries in China, Hong Kong,Taiwan, Macao and the United States. Under the current laws of the Cayman Islands, the Company is not subjectto tax on income or capital gains. The laws of the Cayman Islands also provide for the distribution of dividendswithout any related withholding tax imposed.
Income tax provision consists of the following:
Year Ended December 31,
2010 2011 2012
(in thousands)
Current:China operations . . . . . . . . . . . . . . . . . . . . . . . . . . . . . . . . . . . . . $— $ 178 $ 263Non-China operations . . . . . . . . . . . . . . . . . . . . . . . . . . . . . . . . . 76 3,119 888
$ 76 $3,297 $1,151
Deferred:China operations . . . . . . . . . . . . . . . . . . . . . . . . . . . . . . . . . . . . . $ (22) $ (208) $ (159)Non-China operations . . . . . . . . . . . . . . . . . . . . . . . . . . . . . . . . . — (452) 236
$ (22) $ (660) $ 77
Provision for income taxes . . . . . . . . . . . . . . . . . . . . . . . . . . . . . $ 54 $2,637 $1,228
Income tax provision differed from the amounts computed by applying the statutory income tax rate of 25%for the PRC subsidiaries to pre-tax income (loss) as a result of the following:
Year Ended December 31,
2010 2011 2012
(in thousands)
Income tax at statutory rate . . . . . . . . . . . . . . . . . . . . . . . . . $(2,122) $ 1,902 $ 4,877Foreign tax rate differential . . . . . . . . . . . . . . . . . . . . . . . . . 1,619 (670) (4,144)Tax holiday benefit . . . . . . . . . . . . . . . . . . . . . . . . . . . . . . . . (374) (1,746) (161)Change in valuation allowance . . . . . . . . . . . . . . . . . . . . . . (63) (447) (75)Provision for uncertain tax position . . . . . . . . . . . . . . . . . . . 814 3,646 760Others . . . . . . . . . . . . . . . . . . . . . . . . . . . . . . . . . . . . . . . . . . 180 (48) (29)
Provision for income taxes . . . . . . . . . . . . . . . . . . . . . . . . . . $ 54 $ 2,637 $ 1,228
The Company recorded an income tax provision of $1,709 (unaudited) and $980 (unaudited) for the ninemonths ended September 30, 2013 and 2012, respectively.
F-37
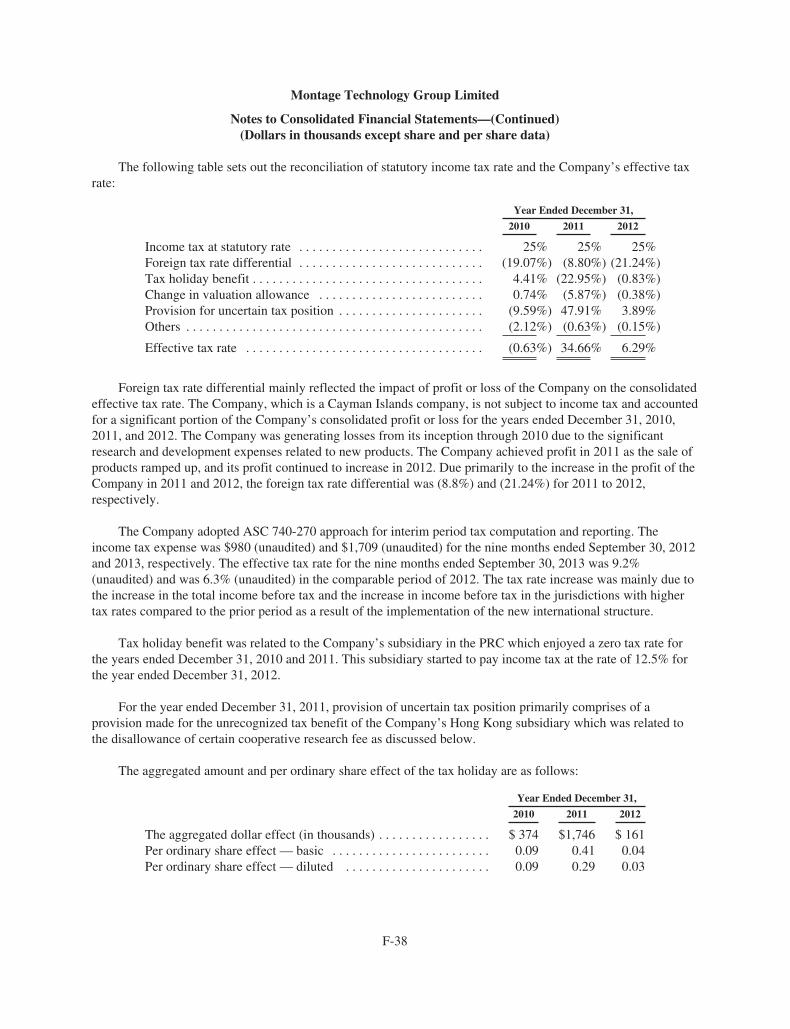
Montage Technology Group Limited
Notes to Consolidated Financial Statements—(Continued)(Dollars in thousands except share and per share data)
The following table sets out the reconciliation of statutory income tax rate and the Company’s effective taxrate:
Year Ended December 31,
2010 2011 2012
Income tax at statutory rate . . . . . . . . . . . . . . . . . . . . . . . . . . . . 25% 25% 25%Foreign tax rate differential . . . . . . . . . . . . . . . . . . . . . . . . . . . . (19.07%) (8.80%) (21.24%)Tax holiday benefit . . . . . . . . . . . . . . . . . . . . . . . . . . . . . . . . . . . 4.41% (22.95%) (0.83%)Change in valuation allowance . . . . . . . . . . . . . . . . . . . . . . . . . 0.74% (5.87%) (0.38%)Provision for uncertain tax position . . . . . . . . . . . . . . . . . . . . . . (9.59%) 47.91% 3.89%Others . . . . . . . . . . . . . . . . . . . . . . . . . . . . . . . . . . . . . . . . . . . . . (2.12%) (0.63%) (0.15%)
Effective tax rate . . . . . . . . . . . . . . . . . . . . . . . . . . . . . . . . . . . . (0.63%) 34.66% 6.29%
Foreign tax rate differential mainly reflected the impact of profit or loss of the Company on the consolidatedeffective tax rate. The Company, which is a Cayman Islands company, is not subject to income tax and accountedfor a significant portion of the Company’s consolidated profit or loss for the years ended December 31, 2010,2011, and 2012. The Company was generating losses from its inception through 2010 due to the significantresearch and development expenses related to new products. The Company achieved profit in 2011 as the sale ofproducts ramped up, and its profit continued to increase in 2012. Due primarily to the increase in the profit of theCompany in 2011 and 2012, the foreign tax rate differential was (8.8%) and (21.24%) for 2011 to 2012,respectively.
The Company adopted ASC 740-270 approach for interim period tax computation and reporting. Theincome tax expense was $980 (unaudited) and $1,709 (unaudited) for the nine months ended September 30, 2012and 2013, respectively. The effective tax rate for the nine months ended September 30, 2013 was 9.2%(unaudited) and was 6.3% (unaudited) in the comparable period of 2012. The tax rate increase was mainly due tothe increase in the total income before tax and the increase in income before tax in the jurisdictions with highertax rates compared to the prior period as a result of the implementation of the new international structure.
Tax holiday benefit was related to the Company’s subsidiary in the PRC which enjoyed a zero tax rate forthe years ended December 31, 2010 and 2011. This subsidiary started to pay income tax at the rate of 12.5% forthe year ended December 31, 2012.
For the year ended December 31, 2011, provision of uncertain tax position primarily comprises of aprovision made for the unrecognized tax benefit of the Company’s Hong Kong subsidiary which was related tothe disallowance of certain cooperative research fee as discussed below.
The aggregated amount and per ordinary share effect of the tax holiday are as follows:
Year Ended December 31,
2010 2011 2012
The aggregated dollar effect (in thousands) . . . . . . . . . . . . . . . . . $ 374 $1,746 $ 161Per ordinary share effect — basic . . . . . . . . . . . . . . . . . . . . . . . . 0.09 0.41 0.04Per ordinary share effect — diluted . . . . . . . . . . . . . . . . . . . . . . 0.09 0.29 0.03
F-38
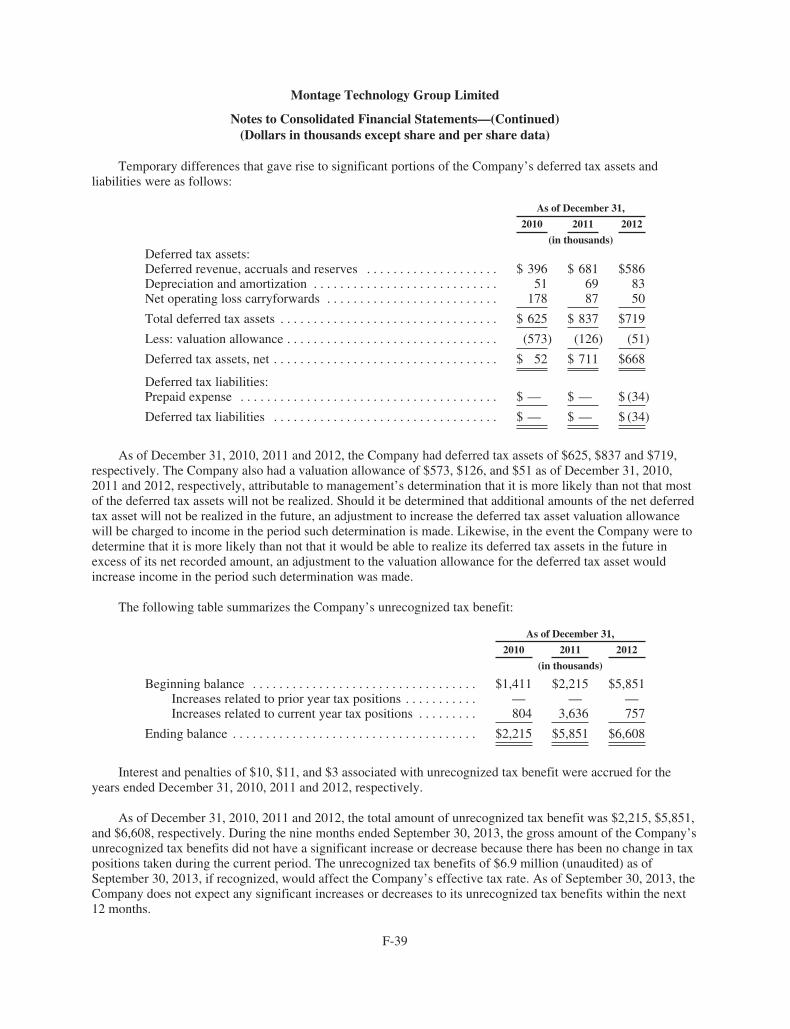
Montage Technology Group Limited
Notes to Consolidated Financial Statements—(Continued)(Dollars in thousands except share and per share data)
Temporary differences that gave rise to significant portions of the Company’s deferred tax assets andliabilities were as follows:
As of December 31,
2010 2011 2012
(in thousands)Deferred tax assets:Deferred revenue, accruals and reserves . . . . . . . . . . . . . . . . . . . . $ 396 $ 681 $586Depreciation and amortization . . . . . . . . . . . . . . . . . . . . . . . . . . . . 51 69 83Net operating loss carryforwards . . . . . . . . . . . . . . . . . . . . . . . . . . 178 87 50
Total deferred tax assets . . . . . . . . . . . . . . . . . . . . . . . . . . . . . . . . . $ 625 $ 837 $719
Less: valuation allowance . . . . . . . . . . . . . . . . . . . . . . . . . . . . . . . . (573) (126) (51)
Deferred tax assets, net . . . . . . . . . . . . . . . . . . . . . . . . . . . . . . . . . . $ 52 $ 711 $668
Deferred tax liabilities:Prepaid expense . . . . . . . . . . . . . . . . . . . . . . . . . . . . . . . . . . . . . . . $ — $ — $ (34)
Deferred tax liabilities . . . . . . . . . . . . . . . . . . . . . . . . . . . . . . . . . . $ — $ — $ (34)
As of December 31, 2010, 2011 and 2012, the Company had deferred tax assets of $625, $837 and $719,respectively. The Company also had a valuation allowance of $573, $126, and $51 as of December 31, 2010,2011 and 2012, respectively, attributable to management’s determination that it is more likely than not that mostof the deferred tax assets will not be realized. Should it be determined that additional amounts of the net deferredtax asset will not be realized in the future, an adjustment to increase the deferred tax asset valuation allowancewill be charged to income in the period such determination is made. Likewise, in the event the Company were todetermine that it is more likely than not that it would be able to realize its deferred tax assets in the future inexcess of its net recorded amount, an adjustment to the valuation allowance for the deferred tax asset wouldincrease income in the period such determination was made.
The following table summarizes the Company’s unrecognized tax benefit:
As of December 31,
2010 2011 2012
(in thousands)
Beginning balance . . . . . . . . . . . . . . . . . . . . . . . . . . . . . . . . . . $1,411 $2,215 $5,851Increases related to prior year tax positions . . . . . . . . . . . — — —Increases related to current year tax positions . . . . . . . . . 804 3,636 757
Ending balance . . . . . . . . . . . . . . . . . . . . . . . . . . . . . . . . . . . . . $2,215 $5,851 $6,608
Interest and penalties of $10, $11, and $3 associated with unrecognized tax benefit were accrued for theyears ended December 31, 2010, 2011 and 2012, respectively.
As of December 31, 2010, 2011 and 2012, the total amount of unrecognized tax benefit was $2,215, $5,851,and $6,608, respectively. During the nine months ended September 30, 2013, the gross amount of the Company’sunrecognized tax benefits did not have a significant increase or decrease because there has been no change in taxpositions taken during the current period. The unrecognized tax benefits of $6.9 million (unaudited) as ofSeptember 30, 2013, if recognized, would affect the Company’s effective tax rate. As of September 30, 2013, theCompany does not expect any significant increases or decreases to its unrecognized tax benefits within the next12 months.
F-39

Montage Technology Group Limited
Notes to Consolidated Financial Statements—(Continued)(Dollars in thousands except share and per share data)
The major unrecognized tax benefit for 2011 was related to the potential disallowance of cooperativeresearch fee of $17,140 recorded in the Company’s Hong Kong subsidiary’s books. The cooperative research feewas charged by the Company for the expense incurred for the reimbursement of the research and developmentservices performed by its China subsidiaries.
According to the Hong Kong tax regulations, capital expenditure is generally non-deductible unlessotherwise specified. Certain R&D expenditure is deductible provided that certain criteria are satisfied. Based onthe current view of the Hong Kong tax authority, it may challenge that the cooperative research fee is capital innature, and that it also does not satisfy the specific criteria set out in the tax regulations. Although managementdoes not agree with the tax authority’s view, it believes that it is more likely than not that the Hong Kong taxauthority will disallow such expense upon tax audit.
For the nine months ended September 30, 2013, the Company incurred additional R&D expenditure asdiscussed above and recorded the unrecognized tax benefit accordingly.
12. Net Income (Loss) Per Share
The following shows the computation of basic and diluted net income (loss) per ordinary share:
Year Ended December 31,Nine Months ended
September 30,
2010 2011 2012 2012 2013
(unaudited) (unaudited)
NumeratorNet income (loss) . . . . . . . . . . . . . . . . . . . . . $ (8,543) $ 4,972 $ 18,281 $ 14,594 $ 16,813Less: Accretion to preferred shares . . . . . . . . (2,513) (1,147) (55) (42) (23)Less: Allocation of net income to
participating preferred shares andrestricted shares . . . . . . . . . . . . . . . . . . . . . — (3,748) (15,112) (12,038) (13,651)
Numerator for basic calculation . . . . . . . . . . (11,056) 77 3,114 2,514 3,139Undistributed earnings re-allocated to
ordinary shareholders . . . . . . . . . . . . . . . . — 22 1,059 847 926
Numerator for diluted calculation . . . . . . . . . $ (11,056) $ 99 $ 4,173 $ 3,361 $ 4,065
DenominatorDenominator for basic calculation,
weighted-average number of shares ofordinary share outstanding . . . . . . . . . . . . 4,157,498 4,260,192 4,319,243 4,303,135 4,618,302
Dilutive effect of share option . . . . . . . . . . . . — 1,664,198 2,047,439 1,991,931 1,926,644Dilutive effect of restricted shares and
awards . . . . . . . . . . . . . . . . . . . . . . . . . . . . — — — — 12,422
Denominator for diluted calculation . . . . . . . 4,157,498 5,924,390 6,366,682 6,295,066 6,557,368
Net income (loss) per shareBasic . . . . . . . . . . . . . . . . . . . . . . . . . . . $ (2.66) $ 0.02 $ 0.72 $ 0.58 $ 0.68
Diluted . . . . . . . . . . . . . . . . . . . . . . . . . . $ (2.66) $ 0.02 $ 0.66 $ 0.53 $ 0.62
F-40

Montage Technology Group Limited
Notes to Consolidated Financial Statements—(Continued)(Dollars in thousands except share and per share data)
The Company’s preferred shares were participating securities and as such were included in the calculationof basic net income per share under the two-class method pursuant to ASC 260-10-45-60A and 60-B. Accordingto the contractual terms of the preferred shares, the preferred shares do not have a contractual obligation to sharein the losses of the Company as described in ASC 260-10-45-67. Therefore, no loss was allocated to thepreferred shares in the computation of basic loss per share for the years ended December 31, 2010.
In addition, the Company granted 317,120 and 13,500 restricted shares in April 2013 and August 2013 withnon-forfeitable dividend rights and the holders of these restricted shares are entitled to cash dividends withrespect to the restricted shares subject to the award even though such shares are not vested (Note 10). Therefore,pursuant to ASC 260-10-45-61A, these restricted shares are participating securities and related unvestedrestricted shares are included in the computation of basic net income per share under the two-class method.
For the years ended December 31, 2011 and 2012 and the nine months ended September 30, 2012 and 2013,under two-class method for the calculation of net income (loss) per share, the noncumulative dividends of 8% ofthe original issuance price for each series of preferred share were $3,459, $3,459, $2,594 (unaudited) and $2,594(unaudited), respectively, whereas the remaining undistributed earnings attributable to preferred shares on as-if-converted basis and unvested restricted shares were $289, $11,653, $9,444 (unaudited) and $11,057 (unaudited),respectively.
For the diluted net income per share calculation, the net income allocated to participating preferred sharesand unvested restricted shares was decreased by $22, $1,059, $847 (unaudited) and $926 (unaudited),respectively for the years ended December, 31, 2011 and 2012 and the nine months ended September 30, 2012and 2013, due to the inclusion of incremental shares for share options and restricted shares which have a dilutiveimpact on the basic net income per share. As a result, undistributed earnings re-allocated to ordinary shares were$22, $1,059, $847 (unaudited) and $926 (unaudited) respectively, for the years ended December 31, 2011 and2012 and the nine months ended September 30, 2012 and 2013.
The following table sets forth potential shares of ordinary shares that are not included in the calculation ofdiluted net income (loss) per share because including them would be anti-dilutive as of the end of each periodpresented:
Year Ended December 31,Nine Months Ended
September 30,
2010 2011 2012 2012 2013
(unaudited) (unaudited)
Convertible preferred shares . . . . . . . . . . . . . 15,411,033 16,163,598 16,163,598 16,163,598 16,163,598Equity awards outstanding . . . . . . . . . . . . . . 1,967,598 — — — —Warrants to purchase convertible preferred
share . . . . . . . . . . . . . . . . . . . . . . . . . . . . . 614,521 — — — —
17,993,152 16,163,598 16,163,598 16,163,598 16,163,598
F-41

Montage Technology Group Limited
Notes to Consolidated Financial Statements—(Continued)(Dollars in thousands except share and per share data)
The following table sets forth potential shares of ordinary shares that are not included in the calculation ofdiluted net income (loss) per share for the corresponding periods because the number of shares calculated basedon the assumed proceeds from exercise of the equity awards and the weighted average fair value of theCompany’s ordinary shares is higher than the number of shares assumed to be issued under the awards:
Year Ended December 31,Nine Months Ended
September 30,
2010 2011 2012 2012 2013
(unaudited) (unaudited)
Equity awards outstanding . . . . . . . . . . . . . . . . . . . . . . . . . . 86,650 93,624 154,906 417,120 1,726,480
13. Segment and Geographic Information
The Company operates in one segment related to the design, development and sale of high performance, lowpower semiconductors for the home entertainment and cloud computing markets. The Company’s chief operatingdecision maker is its chief executive officer, who reviews the Company’s operating results on an aggregate basisfor the purpose of evaluating financial performance and allocating resources.
The following table sets forth the Company’s revenue by geographic region:
Year Ended December 31,For the Nine MonthsEnded September 30,
2010 2011 2012 2012 2013
(in thousands) (unaudited) (unaudited)
Hong Kong . . . . . . . . . . . . . . . $27,382 $48,911 $72,570 $50,002 $68,404Asia Pacific . . . . . . . . . . . . . . 581 44 1,325 1,236 2,782United States . . . . . . . . . . . . . 977 1,115 3,160 2,644 2,655Europe . . . . . . . . . . . . . . . . . . 138 268 1,190 656 1,607
$29,078 $50,338 $78,245 $54,538 $75,448
As of December 31, 2012 and September 30, 2013 (unaudited), substantially all of the Company’s long-lived tangible assets were located in the Asia Pacific region.
The following table sets forth the Company’s revenue generated from sales of semiconductors solutions forthe home entertainment and cloud computing markets:
Year Ended December 31,For the Nine MonthsEnded September 30,
2010 2011 2012 2012 2013
(in thousands) (unaudited) (unaudited)
Home entertainment . . . . . . . . $27,991 $48,995 $73,611 $50,614 $68,371Cloud computing market . . . . 1,087 1,343 4,634 3,924 7,077
$29,078 $50,338 $78,245 $54,538 $75,448
F-42

Montage Technology Group Limited
Notes to Consolidated Financial Statements—(Continued)(Dollars in thousands except share and per share data)
14. Commitments and Contingencies
Future minimum lease payment under noncancelable operating leases and purchase commitments havinginitial terms in excess of one year as of December 31, 2012 are as follows:
Payment Due by Period
TotalLess than
1 Year1 - 3
Years3 - 5
Years
(in thousands)
Operating lease obligations . . . . . . . . . . . . . . . . . . . . . $1,775 $ 992 $783 $—Purchase obligations . . . . . . . . . . . . . . . . . . . . . . . . . . 1,086 1,086 — —
Total contractual obligations . . . . . . . . . . . . . . . . . . . . $2,861 $2,078 $783 $—
Future minimum lease payment under noncancelable operating leases and purchase commitment havinginitial terms in excess of one year as of September 30, 2013 (unaudited) are as follows:
Payment Due by Period
TotalLess than
1 Year1 - 3
Years3 - 5
Years
(in thousands)
Operating lease obligations . . . . . . . . . . . . . . . . . . . $2,461 $ 315 $1,877 $269Purchase obligations . . . . . . . . . . . . . . . . . . . . . . . . . 1,670 1,670 — —
Total contractual obligations . . . . . . . . . . . . . . . . . . $4,131 $1,985 $1,877 $269
As of December 31, 2012 and September 30, 2013, there was no unsettled or unasserted claims or litigationagainst the Company. Rental expenses for the years ended December 31, 2010, 2011 and 2012 and the ninemonths ended September 30, 2012 and 2013 were $373, $489, $887, $517 (unaudited) and $917 (unaudited),respectively.
15. Off-Balance Sheet Arrangements
As of December 31, 2010, 2011, 2012, and September 30, 2013, the Company did not have any transactions,obligations or relationships that could be considered off-balance sheet arrangements.
16. 2.5-for-1 Reverse Share Split
On September 6, 2013, the Company’s shareholders approved and effected a reverse share split such thatevery 2.5 issued and unissued ordinary and preferred shares of par value US$0.005 were consolidated into oneshare with a par value of US$0.0125 each. All share-related disclosures, including par value, share price, numberof ordinary shares, preferred shares, share options, restricted shares, and warrants, exercise price of share options,restricted shares, and warrants and related fair value per share, and net income (loss) per share calculations, havebeen recast to reflect the 2.5-for-1 reverse share split for all periods presented.
17. Subsequent Events
Updates subsequent to August 9, 2013 (Unaudited)
According to the shareholders’ resolution dated August 13, 2013, the redemption availability dates of theCompany’s Series B, B-1 and B-2 preferred shares were amended to January 1, 2014, respectively.
F-43

Montage Technology Group Limited
Notes to Consolidated Financial Statements—(Continued)(Dollars in thousands except share and per share data)
In conjunction with the preparation of these financial statements, an evaluation of subsequent events wasperformed through September 11, 2013 (unaudited), which is the date the financial statements were issued.
Subsequent events for the unaudited consolidated financial statement as of September 30, 2013(Unaudited)
On September 25, 2013, the Company registration statement on Form S-1 (File No. 333-190761) wasdeclared effective by the SEC for the initial public offering of 8,165,000 shares of ordinary shares. The offeringwas completed on October 1, 2013 (Note 1b).
Upon completion of the initial public offering of the Company on October 1, 2013, the Series A, B, B-1 andB-2 Convertible Preferred Shares automatically converted into 16,163,598 ordinary shares.
18. Pro Forma Balance Sheet and Net Income per Share for Conversion of Preferred Shares (Unaudited)
The Series A, B, B-1 and B-2 convertible preferred shares automatically converted into ordinary sharesbased on the then effective conversion ratio immediately upon the closing of the Company’s initial publicoffering on October 1, 2013. As the offering was consummated after the September 30, 2013 date of thesefinancial statements, the pro forma balance sheet as of September 30, 2013 assumes the initial public offeringhad occurred and presents an as adjusted financial position as if the conversion of the Series A, B, B-1 and B-2convertible preferred shares into ordinary shares had occurred on September 30, 2013 at the then conversion ratioof 1 for 1 (Series A, Series B issued on December 20, 2007 and Series B-2), 1 for 1.0173 (Series B issued onJune 19, 2006) and 1 for 1.040 (Series B-1). Accordingly, the carrying value of the convertible preferred shares,in the amount of $54,400 was reclassified from Convertible Preferred Shares to ordinary shares and additionalpaid-in capital for such pro forma presentation.
The unaudited pro forma income per share for the year ended December 31, 2012 and the nine monthsended September 30, 2013 after giving effect to the conversion of the Series A, B, B-1 and B-2 Preferred Sharesinto ordinary shares as if the closing occurred at the beginning of each period presented was as follows:
For the Years EndedDecember 31, 2012
For the Nine MonthsEnded September 30, 2013
(unaudited) (unaudited)
Numerator:Actual net income attributable to ordinary
shareholders . . . . . . . . . . . . . . . . . . . . . . . . . . . . . . . . $ 3,114 $ 3,139Pro forma effect of preferred shares . . . . . . . . . . . . . . . . 15,167 13,674
Pro forma net income attributable to ordinaryshareholders—Basic and diluted . . . . . . . . . . . . . . . . 18,281 16,813
Denominator:Actual weighted average number of ordinary shares
outstandingBasic . . . . . . . . . . . . . . . . . . . . . . . . . . . . . . . . . . . . 4,319,243 4,618,302Diluted . . . . . . . . . . . . . . . . . . . . . . . . . . . . . . . . . . 6,366,682 6,557,368
Pro forma effect of preferred shares . . . . . . . . . . . . . . . . 16,163,598 16,163,598
F-44

Montage Technology Group Limited
Notes to Consolidated Financial Statements—(Continued)(Dollars in thousands except share and per share data)
For the Years EndedDecember 31, 2012
For the Nine MonthsEnded September 30, 2013
(unaudited) (unaudited)
Denominator for pro forma basic and dilutedcalculation
Basic . . . . . . . . . . . . . . . . . . . . . . . . . . . . . . . . . . . . $20,482,841 $20,781,900
Diluted . . . . . . . . . . . . . . . . . . . . . . . . . . . . . . . . . . 22,530,280 22,720,966
Pro forma basic and diluted net income per shareattributable to ordinary shareholders . . . . . . . . . .
Basic . . . . . . . . . . . . . . . . . . . . . . . . . . . . . . . . . . . . $ 0.89 $ 0.81
Diluted . . . . . . . . . . . . . . . . . . . . . . . . . . . . . . . . . . $ 0.81 $ 0.74
Certain equity awards are not included in the calculation of pro forma diluted net income per share becauseof their anti-dilutive effect.
19. Restricted Net Assets
Regulations in the PRC currently permit payment of dividends of a PRC company only out of accumulatedprofits as determined in accordance with accounting standards and regulations in China. Under PRC law, theCompany’s subsidiaries incorporated in China are required to set aside at least 10% of their after-tax profit basedon PRC accounting standards each year to their general reserves until the cumulative amount reaches 50% oftheir paid-in capital. These reserves are not distributable as cash dividends, or as loans or advances.
As a result of these and other restrictions under PRC laws and regulations, the PRC subsidiaries arerestricted in their ability to transfer a portion of their net assets to the Company either in the form of dividends,loans or advances, which restricted portion amounted to approximately $10,749 and $10,749 (unaudited) of theCompany’s total consolidated net assets as of December 31, 2012 and September 30, 2013. Even though theCompany currently does not require any such dividends, loans or advances from the PRC subsidiaries forworking capital and other funding purposes, the Company may in the future require additional cash resourcesfrom our PRC subsidiaries due to changes in business conditions, to fund future acquisitions and developments,or merely declare and pay dividends to or distributions to the Company’s shareholders.
For the years ended December 31, 2010, 2011 and 2012 and the nine months ended September 30, 2012(unaudited) and 2013 (unaudited), no dividends were declared by any of the Company’s subsidiaries.
20. Additional Information — Condensed Financial Statements of the Company
The Company is required to include the condensed financial statements of the parent company inaccordance with Regulation S-X, Rule 5-04 promulgated by the United States Securities and ExchangeCommission. The separate condensed financial statements of the Company as presented below have beenprepared in accordance with Securities and Exchange Commission Regulation S-X Rule 5-04 and Rule 12-04 andpresent the Company’s investments in its subsidiaries under the equity method of accounting. Such investmentsare presented on the separate condensed balance sheets of the Company as “Investments in subsidiaries.”Subsidiaries’ income or losses are included as the Company’s “Share of income from subsidiaries” on thestatement of income and comprehensive income (loss).
F-45
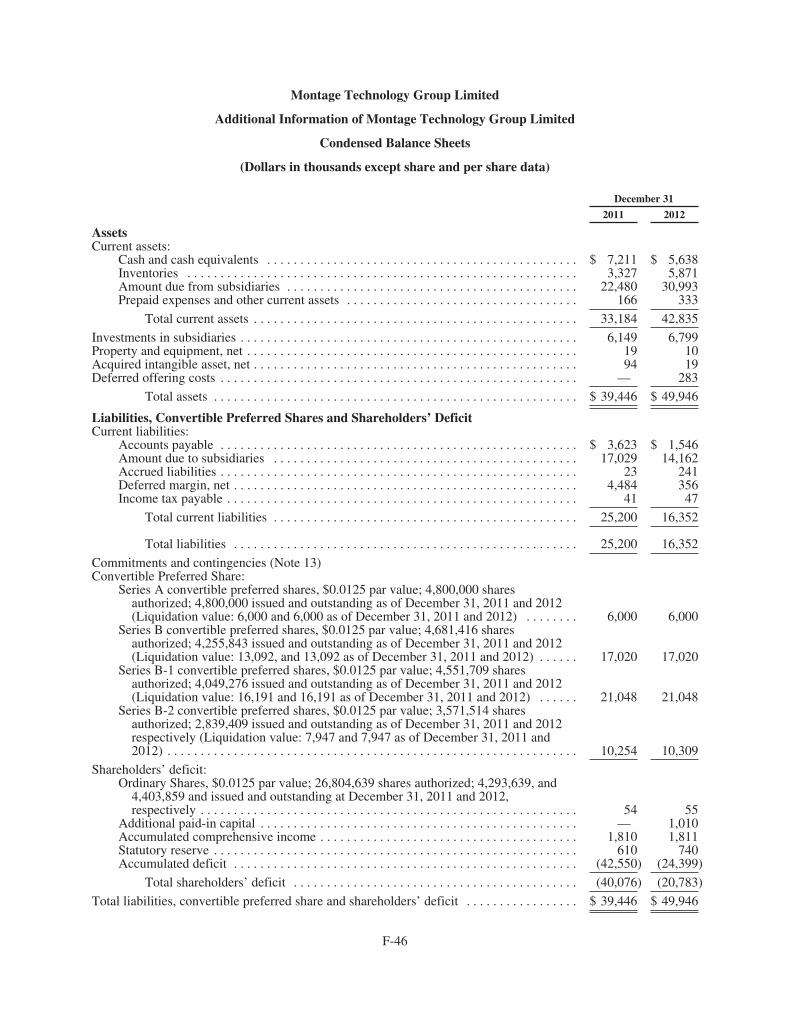
Montage Technology Group Limited
Additional Information of Montage Technology Group Limited
Condensed Balance Sheets
(Dollars in thousands except share and per share data)
December 31
2011 2012
AssetsCurrent assets:
Cash and cash equivalents . . . . . . . . . . . . . . . . . . . . . . . . . . . . . . . . . . . . . . . . . . . . . . . $ 7,211 $ 5,638Inventories . . . . . . . . . . . . . . . . . . . . . . . . . . . . . . . . . . . . . . . . . . . . . . . . . . . . . . . . . . . 3,327 5,871Amount due from subsidiaries . . . . . . . . . . . . . . . . . . . . . . . . . . . . . . . . . . . . . . . . . . . . 22,480 30,993Prepaid expenses and other current assets . . . . . . . . . . . . . . . . . . . . . . . . . . . . . . . . . . . 166 333
Total current assets . . . . . . . . . . . . . . . . . . . . . . . . . . . . . . . . . . . . . . . . . . . . . . . . . 33,184 42,835
Investments in subsidiaries . . . . . . . . . . . . . . . . . . . . . . . . . . . . . . . . . . . . . . . . . . . . . . . . . . . 6,149 6,799Property and equipment, net . . . . . . . . . . . . . . . . . . . . . . . . . . . . . . . . . . . . . . . . . . . . . . . . . . 19 10Acquired intangible asset, net . . . . . . . . . . . . . . . . . . . . . . . . . . . . . . . . . . . . . . . . . . . . . . . . . 94 19Deferred offering costs . . . . . . . . . . . . . . . . . . . . . . . . . . . . . . . . . . . . . . . . . . . . . . . . . . . . . . — 283
Total assets . . . . . . . . . . . . . . . . . . . . . . . . . . . . . . . . . . . . . . . . . . . . . . . . . . . . . . . $ 39,446 $ 49,946
Liabilities, Convertible Preferred Shares and Shareholders’ DeficitCurrent liabilities:
Accounts payable . . . . . . . . . . . . . . . . . . . . . . . . . . . . . . . . . . . . . . . . . . . . . . . . . . . . . . $ 3,623 $ 1,546Amount due to subsidiaries . . . . . . . . . . . . . . . . . . . . . . . . . . . . . . . . . . . . . . . . . . . . . . 17,029 14,162Accrued liabilities . . . . . . . . . . . . . . . . . . . . . . . . . . . . . . . . . . . . . . . . . . . . . . . . . . . . . . 23 241Deferred margin, net . . . . . . . . . . . . . . . . . . . . . . . . . . . . . . . . . . . . . . . . . . . . . . . . . . . . 4,484 356Income tax payable . . . . . . . . . . . . . . . . . . . . . . . . . . . . . . . . . . . . . . . . . . . . . . . . . . . . . 41 47
Total current liabilities . . . . . . . . . . . . . . . . . . . . . . . . . . . . . . . . . . . . . . . . . . . . . . 25,200 16,352
Total liabilities . . . . . . . . . . . . . . . . . . . . . . . . . . . . . . . . . . . . . . . . . . . . . . . . . . . . 25,200 16,352
Commitments and contingencies (Note 13)Convertible Preferred Share:
Series A convertible preferred shares, $0.0125 par value; 4,800,000 sharesauthorized; 4,800,000 issued and outstanding as of December 31, 2011 and 2012(Liquidation value: 6,000 and 6,000 as of December 31, 2011 and 2012) . . . . . . . . 6,000 6,000
Series B convertible preferred shares, $0.0125 par value; 4,681,416 sharesauthorized; 4,255,843 issued and outstanding as of December 31, 2011 and 2012(Liquidation value: 13,092, and 13,092 as of December 31, 2011 and 2012) . . . . . . 17,020 17,020
Series B-1 convertible preferred shares, $0.0125 par value; 4,551,709 sharesauthorized; 4,049,276 issued and outstanding as of December 31, 2011 and 2012(Liquidation value: 16,191 and 16,191 as of December 31, 2011 and 2012) . . . . . . 21,048 21,048
Series B-2 convertible preferred shares, $0.0125 par value; 3,571,514 sharesauthorized; 2,839,409 issued and outstanding as of December 31, 2011 and 2012respectively (Liquidation value: 7,947 and 7,947 as of December 31, 2011 and2012) . . . . . . . . . . . . . . . . . . . . . . . . . . . . . . . . . . . . . . . . . . . . . . . . . . . . . . . . . . . . . . 10,254 10,309
Shareholders’ deficit:Ordinary Shares, $0.0125 par value; 26,804,639 shares authorized; 4,293,639, and
4,403,859 and issued and outstanding at December 31, 2011 and 2012,respectively . . . . . . . . . . . . . . . . . . . . . . . . . . . . . . . . . . . . . . . . . . . . . . . . . . . . . . . . . 54 55
Additional paid-in capital . . . . . . . . . . . . . . . . . . . . . . . . . . . . . . . . . . . . . . . . . . . . . . . . — 1,010Accumulated comprehensive income . . . . . . . . . . . . . . . . . . . . . . . . . . . . . . . . . . . . . . . 1,810 1,811Statutory reserve . . . . . . . . . . . . . . . . . . . . . . . . . . . . . . . . . . . . . . . . . . . . . . . . . . . . . . . 610 740Accumulated deficit . . . . . . . . . . . . . . . . . . . . . . . . . . . . . . . . . . . . . . . . . . . . . . . . . . . . (42,550) (24,399)
Total shareholders’ deficit . . . . . . . . . . . . . . . . . . . . . . . . . . . . . . . . . . . . . . . . . . . (40,076) (20,783)
Total liabilities, convertible preferred share and shareholders’ deficit . . . . . . . . . . . . . . . . . $ 39,446 $ 49,946
F-46
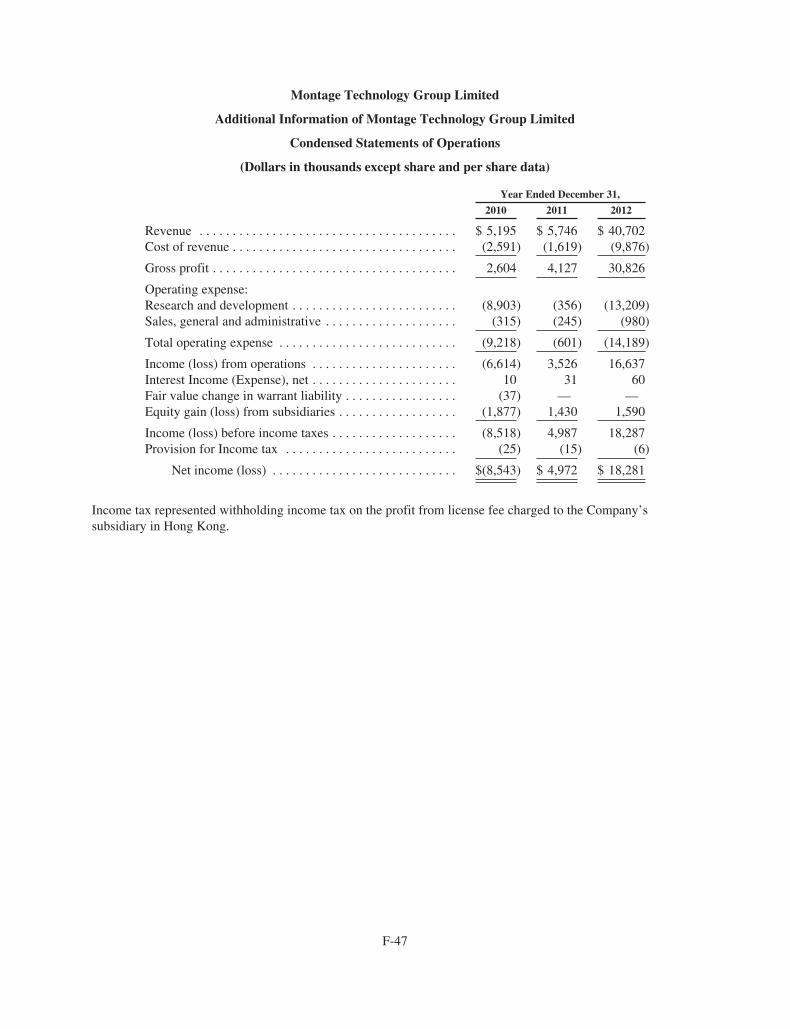
Montage Technology Group Limited
Additional Information of Montage Technology Group Limited
Condensed Statements of Operations
(Dollars in thousands except share and per share data)
Year Ended December 31,
2010 2011 2012
Revenue . . . . . . . . . . . . . . . . . . . . . . . . . . . . . . . . . . . . . . . $ 5,195 $ 5,746 $ 40,702Cost of revenue . . . . . . . . . . . . . . . . . . . . . . . . . . . . . . . . . . (2,591) (1,619) (9,876)
Gross profit . . . . . . . . . . . . . . . . . . . . . . . . . . . . . . . . . . . . . 2,604 4,127 30,826
Operating expense:Research and development . . . . . . . . . . . . . . . . . . . . . . . . . (8,903) (356) (13,209)Sales, general and administrative . . . . . . . . . . . . . . . . . . . . (315) (245) (980)
Total operating expense . . . . . . . . . . . . . . . . . . . . . . . . . . . (9,218) (601) (14,189)
Income (loss) from operations . . . . . . . . . . . . . . . . . . . . . . (6,614) 3,526 16,637Interest Income (Expense), net . . . . . . . . . . . . . . . . . . . . . . 10 31 60Fair value change in warrant liability . . . . . . . . . . . . . . . . . (37) — —Equity gain (loss) from subsidiaries . . . . . . . . . . . . . . . . . . (1,877) 1,430 1,590
Income (loss) before income taxes . . . . . . . . . . . . . . . . . . . (8,518) 4,987 18,287Provision for Income tax . . . . . . . . . . . . . . . . . . . . . . . . . . (25) (15) (6)
Net income (loss) . . . . . . . . . . . . . . . . . . . . . . . . . . . . $(8,543) $ 4,972 $ 18,281
Income tax represented withholding income tax on the profit from license fee charged to the Company’ssubsidiary in Hong Kong.
F-47

Montage Technology Group Limited
Additional Information of Montage Technology Group Limited
Condensed Statements of Cash Flows
(Dollars in thousands except share and per share data)
Year Ended December 31,
2010 2011 2012
Cash flows from operating activitiesNet income (loss) . . . . . . . . . . . . . . . . . . . . . . . . . . . . . . . . . . . . . . . . . . . . . . . . . . . $(8,543) $ 4,972 $18,281Adjustments to reconcile net income (loss) to net cash provided by (used in)
operating activities:Depreciation and amortization . . . . . . . . . . . . . . . . . . . . . . . . . . . . . . . . . . . . 515 185 84Share-based compensation . . . . . . . . . . . . . . . . . . . . . . . . . . . . . . . . . . . . . . . 623 577 928Equity in profit of subsidiaries . . . . . . . . . . . . . . . . . . . . . . . . . . . . . . . . . . . . 1,876 (1,431) (1,589)Fair value changes in warrant liability . . . . . . . . . . . . . . . . . . . . . . . . . . . . . . 37 — —
Changes in assets and liabilities:Inventories . . . . . . . . . . . . . . . . . . . . . . . . . . . . . . . . . . . . . . . . . . . . . . . . 4,336 (3,327) (2,544)Prepaid expenses and other assets . . . . . . . . . . . . . . . . . . . . . . . . . . . . . . 472 54 (281)Amount due from subsidiaries . . . . . . . . . . . . . . . . . . . . . . . . . . . . . . . . . (415) (14,742) (8,513)Accounts payable . . . . . . . . . . . . . . . . . . . . . . . . . . . . . . . . . . . . . . . . . . . (2,805) 3,623 (2,077)Amount due to subsidiaries . . . . . . . . . . . . . . . . . . . . . . . . . . . . . . . . . . . 3,819 5,945 (2,867)Tax payable . . . . . . . . . . . . . . . . . . . . . . . . . . . . . . . . . . . . . . . . . . . . . . . 25 16 6Deferred margin, net . . . . . . . . . . . . . . . . . . . . . . . . . . . . . . . . . . . . . . . . — 4,484 (4,128)Other payables and accruals . . . . . . . . . . . . . . . . . . . . . . . . . . . . . . . . . . (222) (52) 228
Net cash provided by (used in) operating activities . . . . . . . . . . . . (282) 304 (2,472)
Cash flows from investing activitiesPurchases of property and equipment . . . . . . . . . . . . . . . . . . . . . . . . . . . . . . . . . . . (16) (9) —Proceeds from disposal of a subsidiary . . . . . . . . . . . . . . . . . . . . . . . . . . . . . . . . . . — — 1,000Purchase of intangible assets . . . . . . . . . . . . . . . . . . . . . . . . . . . . . . . . . . . . . . . . . . (90) (159) —Prepayment for acquisition . . . . . . . . . . . . . . . . . . . . . . . . . . . . . . . . . . . . . . . . . . . — — (26)
Net cash provided by (used in) investing activities . . . . . . . . . . . . . (106) (168) 974
Cash flows from financing activitiesProceeds from exercise of options . . . . . . . . . . . . . . . . . . . . . . . . . . . . . . . . . . . . . . 5 43 68Proceeds from early exercise of options . . . . . . . . . . . . . . . . . . . . . . . . . . . . . . . . . — 18 —Proceeds from issuance of Series B-2 convertible preferred shares . . . . . . . . . . . . 42 — —Proceeds from exercise of warrant . . . . . . . . . . . . . . . . . . . . . . . . . . . . . . . . . . . . . 1,545 — —Cash paid for initial public offering cost . . . . . . . . . . . . . . . . . . . . . . . . . . . . . . . . . — — (143)
Net cash provided by (used in) financing activities . . . . . . . . . . . . 1,592 61 (75)
Effect of exchange rate changes on cash . . . . . . . . . . . . . . . . . . . . . . . . . . . . . . . . . — — —
Net increase (decrease) in cash and cash equivalents . . . . . . . . . . . . . . . . . . . . . . . 1,204 197 (1,573)Cash and cash equivalents at beginning of period . . . . . . . . . . . . . . . . . . . . . . . . . . 5,810 7,014 7,211
Cash and cash equivalents at end of period . . . . . . . . . . . . . . . . . . . . . . . . . . . . . . . $ 7,014 $ 7,211 $ 5,638
As of December 31, 2011 and 2012, there were no material contingencies, significant provisions for long-term obligations, or guarantees of the Company, except for those which have been separately disclosed in theconsolidated financial statements, if any.
F-48

5,350,000 shares
Montage Technology Group LimitedOrdinary shares
Deutsche Bank Securities BarclaysStifel
Wells Fargo Securities Needham & CompanyChardan Capital Markets Roth Capital Partners