
DragonWave Inc. - Stifel
143
16SEP200917322012 No securities regulatory authority has expressed an opinion about these securities and it is an offence to claim otherwise. This short form prospectus constitutes a public offering of these securities only in those jurisdictions where they may be lawfully offered for sale and therein only by persons authorized to sell such securities in those jurisdictions. Information contained herein is subject to completion or amendment. DragonWave Inc. has filed a registration statement on Form F-10 with the U.S. Securities and Exchange Commission, under the United States Securities Act of 1933, as amended, with respect to the sale of these securities. These securities may not be sold nor may offers to buy be accepted prior to the time the registration statement becomes effective. This short form prospectus shall not constitute an offer to sell or the solicitation of an offer to buy, nor shall there be any sale of these securities in any U.S. state in which such offer, solicitation or sale would be unlawful prior to registration or qualification under the securities laws of any such U.S. state. Information has been incorporated by reference in this short form prospectus from documents filed with securities commissions or similar authorities in Canada. Copies of the documents incorporated herein by reference may be obtained on request without charge from the Secretary of DragonWave Inc. at 411 Legget Drive, Suite 600, Ottawa, Ontario, Canada, K2K 3C9, telephone: (613) 599-9991; facsimile: (613) 599-4225 and are also available electronically at www.sedar.com. This offering of securities is made by a Canadian issuer that is permitted, under a multi-jurisdictional disclosure system (‘‘MJDS’’) adopted by the United States and Canada, to prepare this short form prospectus in accordance with Canadian disclosure requirements. Purchasers of the Offered Shares (as defined below) should be aware that such requirements are different from those of the United States. Consolidated financial statements contained and incorporated herein have been prepared in accordance with Canadian generally accepted accounting principles, and may be subject to Canadian auditor and independence standards, and thus may not be comparable to financial statements of United States companies. Information regarding the impact upon our consolidated financial statements of significant differences between Canadian and United States generally accepted accounting principles is contained in (a) note 20 (entitled ‘‘Reconciliation with United States Generally Accepted Accounting Principles’’) presented in the consolidated financial statements comprising DragonWave Inc.’s (i) amended audited consolidated financial statements for the fiscal years ended February 28, 2009 and February 29, 2008 (together with the auditors’ report thereon dated April 17, 2009 except as to note 20 which is as of August 25, 2009) and (ii) amended unaudited consolidated financial statements for the three month period ended May 31, 2009 which are contained elsewhere and are incorporated by reference in this short form prospectus and (b) note 13 (entitled ‘‘Reconciliation with United States Generally Accepted Accounting Principles’’) presented in the unaudited consolidated financial statements for the three and six months ended August 31, 2009 which are incorporated by reference in this short form prospectus. Prospective investors should be aware that the acquisition of the securities described herein may have tax consequences in both the United States and Canada. This short form prospectus or any applicable prospectus supplement may not describe these tax consequences fully for investors who are resident in, or citizens of either Canada or the United States. You should consult your tax advisor about the potential tax consequences that may be applicable in your particular circumstances. SUPPLEMENTED SHORT FORM PREP PROSPECTUS New Issue and Secondary Offering October 14, 2009 DragonWave Inc. U.S.$10.00 12,972,300 Common Shares This offering (the ‘‘Offering’’) is the initial public offering of the common shares (the ‘‘Common Shares’’) of DragonWave Inc. (‘‘DragonWave’’, ‘‘we’’, ‘‘us’’, ‘‘our’’ or the ‘‘Company’’) in the United States and includes a new issue of Common Shares in Canada. The Offering consists of a treasury offering of 7,454,050 Common Shares (the ‘‘Treasury Shares’’) by us and a secondary offering by Enterprise Partners V, L.P., Enterprise Partners VI, L.P., Wesley Clover Corporation, Venture Coaches Fund L.P. and certain members of our management (collectively, the ‘‘Selling Shareholders’’) of an aggregate of 5,518,250 Common Shares (the ‘‘Secondary Shares’’, and together with the Treasury Shares, the ‘‘Offered Shares’’). See ‘‘Selling Shareholders’’. The Offering is being made concurrently in Canada under the terms of this short form prospectus and in the United States under the terms of a registration statement on Form F-10 filed with the United States Securities and Exchange Commission (the ‘‘SEC’’). Our outstanding Common Shares are listed and posted for trading on the Toronto Stock Exchange (the ‘‘TSX’’) under the symbol ‘‘DWI’’. The TSX has conditionally approved the listing of the Treasury Shares on the TSX.NASDAQ has conditionally approved the listing of the Treasury Shares and our outstanding Common Shares (including the Secondary Shares) on the NASDAQ Global Market under the trading symbol ‘‘DRWI’’. Listing will be subject to our fulfillment of all of the listing requirements of the TSX and NASDAQ, respectively on or before December 23, 2009. On October 14, 2009, the last trading day prior to the filing of this short form prospectus, the closing price of our Common Shares on the TSX was U.S.$10.30 or C$10.60 based on the prevailing U.S.-Canadian dollar exchange rate of U.S.$1.00 = C$1.0292 on October 14, 2009. (continued on next page)
-
Upload
khangminh22 -
Category
Documents
-
view
0 -
download
0
Transcript of DragonWave Inc. - Stifel

16SEP200917322012
No securities regulatory authority has expressed an opinion about these securities and it is an offence to claim otherwise. This short form prospectusconstitutes a public offering of these securities only in those jurisdictions where they may be lawfully offered for sale and therein only by persons authorizedto sell such securities in those jurisdictions.
Information contained herein is subject to completion or amendment. DragonWave Inc. has filed a registration statement on Form F-10 with theU.S. Securities and Exchange Commission, under the United States Securities Act of 1933, as amended, with respect to the sale of these securities. Thesesecurities may not be sold nor may offers to buy be accepted prior to the time the registration statement becomes effective. This short form prospectus shallnot constitute an offer to sell or the solicitation of an offer to buy, nor shall there be any sale of these securities in any U.S. state in which such offer,solicitation or sale would be unlawful prior to registration or qualification under the securities laws of any such U.S. state.
Information has been incorporated by reference in this short form prospectus from documents filed with securities commissions or similar authorities inCanada. Copies of the documents incorporated herein by reference may be obtained on request without charge from the Secretary of DragonWave Inc. at411 Legget Drive, Suite 600, Ottawa, Ontario, Canada, K2K 3C9, telephone: (613) 599-9991; facsimile: (613) 599-4225 and are also availableelectronically at www.sedar.com.
This offering of securities is made by a Canadian issuer that is permitted, under a multi-jurisdictional disclosure system (‘‘MJDS’’) adopted by theUnited States and Canada, to prepare this short form prospectus in accordance with Canadian disclosure requirements. Purchasers of the OfferedShares (as defined below) should be aware that such requirements are different from those of the United States. Consolidated financial statementscontained and incorporated herein have been prepared in accordance with Canadian generally accepted accounting principles, and may be subject toCanadian auditor and independence standards, and thus may not be comparable to financial statements of United States companies. Informationregarding the impact upon our consolidated financial statements of significant differences between Canadian and United States generally acceptedaccounting principles is contained in (a) note 20 (entitled ‘‘Reconciliation with United States Generally Accepted Accounting Principles’’) presentedin the consolidated financial statements comprising DragonWave Inc.’s (i) amended audited consolidated financial statements for the fiscal yearsended February 28, 2009 and February 29, 2008 (together with the auditors’ report thereon dated April 17, 2009 except as to note 20 which is as ofAugust 25, 2009) and (ii) amended unaudited consolidated financial statements for the three month period ended May 31, 2009 which are containedelsewhere and are incorporated by reference in this short form prospectus and (b) note 13 (entitled ‘‘Reconciliation with United States GenerallyAccepted Accounting Principles’’) presented in the unaudited consolidated financial statements for the three and six months ended August 31, 2009which are incorporated by reference in this short form prospectus.
Prospective investors should be aware that the acquisition of the securities described herein may have tax consequences in both the United States andCanada. This short form prospectus or any applicable prospectus supplement may not describe these tax consequences fully for investors who areresident in, or citizens of either Canada or the United States. You should consult your tax advisor about the potential tax consequences that may beapplicable in your particular circumstances.
SUPPLEMENTED SHORT FORM PREP PROSPECTUSNew Issue and Secondary Offering October 14, 2009
DragonWave Inc.U.S.$10.00
12,972,300 Common Shares
This offering (the ‘‘Offering’’) is the initial public offering of the common shares (the ‘‘Common Shares’’) of DragonWave Inc. (‘‘DragonWave’’,‘‘we’’, ‘‘us’’, ‘‘our’’ or the ‘‘Company’’) in the United States and includes a new issue of Common Shares in Canada. The Offering consists of atreasury offering of 7,454,050 Common Shares (the ‘‘Treasury Shares’’) by us and a secondary offering by Enterprise Partners V, L.P., EnterprisePartners VI, L.P., Wesley Clover Corporation, Venture Coaches Fund L.P. and certain members of our management (collectively, the ‘‘SellingShareholders’’) of an aggregate of 5,518,250 Common Shares (the ‘‘Secondary Shares’’, and together with the Treasury Shares, the ‘‘OfferedShares’’). See ‘‘Selling Shareholders’’. The Offering is being made concurrently in Canada under the terms of this short form prospectus and in theUnited States under the terms of a registration statement on Form F-10 filed with the United States Securities and Exchange Commission(the ‘‘SEC’’). Our outstanding Common Shares are listed and posted for trading on the Toronto Stock Exchange (the ‘‘TSX’’) under the symbol‘‘DWI’’. The TSX has conditionally approved the listing of the Treasury Shares on the TSX. NASDAQ has conditionally approved the listing of theTreasury Shares and our outstanding Common Shares (including the Secondary Shares) on the NASDAQ Global Market under the trading symbol‘‘DRWI’’. Listing will be subject to our fulfillment of all of the listing requirements of the TSX and NASDAQ, respectively on or before December 23,2009. On October 14, 2009, the last trading day prior to the filing of this short form prospectus, the closing price of our Common Shares on the TSXwas U.S.$10.30 or C$10.60 based on the prevailing U.S.-Canadian dollar exchange rate of U.S.$1.00 = C$1.0292 on October 14, 2009.
(continued on next page)

(continued from cover)
The Offered Shares are being offered in Canada by Canaccord Capital Corporation, CIBC World Markets Inc., GMP Securities L.P., RBC DominionSecurities Inc., Dundee Securities Corporation and TD Securities Inc. (the ‘‘Canadian Underwriters’’) and in the United States by CanaccordAdams Inc., Piper Jaffray & Co., Pacific Crest Securities LLC, CIBC World Markets Corp., GMP Securities L.P., Dundee Securities Inc. andTD Securities (USA) LLC (together with the Canadian Underwriters, the ‘‘Underwriters’’). See ‘‘Plan of Distribution’’.
Price: U.S.$10.00 per Common SharePrice to Net Proceeds to Net Proceeds to thePublic(1) Underwriters’ Fees(2) Us(3)(4)(5) Selling Shareholders
Per Common Share . . . . . . . . . . . . . . . . . U.S.$10.00 U.S.$0.575 U.S.$9.425 U.S.$9.425Total . . . . . . . . . . . . . . . . . . . . . . . . . . U.S.$129,723,000 U.S.$7,459,073 U.S.$70,254,421 U.S.$52,009,506(1) The public Offering price for the Offered Shares offered in the U.S. of U.S.$10.00 per Common Share is payable in U.S. dollars and the public Offering price of
the Offered Shares offered in Canada of C$10.29 per Common Share is payable in Canadian dollars, except as may otherwise be agreed by the Underwriters. TheU.S. dollar amount is the approximate equivalent of such Canadian dollar amount based on the prevailing U.S.-Canadian dollar exchange rate of U.S.$1.00 =C$1.0292 on October 14, 2009.
(2) The Underwriters will receive a fee of U.S.$0.575 (C$0.592) per Offered Share (5.75% of the price of the Offered Shares), that will be paid in the currency inwhich we and the Selling Shareholders receive payment for the Offered Shares. See ‘‘Plan of Distribution’’.
(3) Before deducting expenses of the Offering estimated to be U.S.$1,700,350 (C$1,750,000). The expenses of the Offering will be paid solely by us, and the SellingShareholders will not pay any portion of such expenses, as provided in the Underwriting Agreement (as defined herein). We have agreed to pay all of the expensesof the Offering since the sale of the Secondary Shares has not added materially to the expenses of the Offering. See ‘‘Plan of Distribution’’.
(4) If the Over-Allotment Option (as defined below) is exercised in full, the total number of Offered Shares under the Offering will be 14,918,145, the total ‘‘Price toPublic’’ will be U.S.$149,181,450, the total ‘‘Underwriters’ Fees’’ will be U.S.$8,577,933, the total ‘‘Net Proceeds to Us’’ will be U.S.$88,594,010 (or C$153,537,548,C$8,828,409 and C$91,180,955 respectively). The total Net Proceeds to the Selling Shareholders will be unaffected by the exercise of the Over-Allotment Option.
(5) It is anticipated that the Private Investor Warrants (as defined herein) held by Enterprise Partners V. L.P. and Enterprise Partners VI, L.P. will be exercised on theClosing Date pursuant to the cashless exercise feature contained in such Private Investor Warrants. If the exercise of the Private Investor Warrants pursuant to thecashless exercise feature results in the issue of less than 114,366 Common Shares, the number of Treasury Shares offered will be increased by the differencebetween 114,366 and the total number of Common Shares issued pursuant to the exercise of the Private Investor Warrants held by Enterprise Partners V. L.P. andEnterprise Partners VI, L.P. In any event, the total number of Offered Shares will be no greater than 12,972,300. If the number of Treasury Shares is increasedpursuant to the cashless exercise of the Private Investor Warrants, ‘‘Net Proceeds to Us’’ will increase and ‘‘Net Proceeds to the Selling Shareholders’’will decrease.
There are certain risks associated with an investment in the Offered Shares which prospective purchasers should carefully review andconsider. See ‘‘Risk Factors’’ beginning on page 11 of this short form prospectus.We have granted to the Underwriters an option (the ‘‘Over-Allotment Option’’) allowing the Underwriters to purchase that number of Common Sharesrepresenting up to 15% of the Offered Shares sold pursuant to the Offering at the Offering price, for a period of 30 days following the Closing Date(as defined below), to cover over-allotments, if any, and for market stabilization purposes. See ‘‘Plan of Distribution’’. This short form prospectusqualifies both the grant of the Over-Allotment Option and the issuance of Common Shares if the Over-Allotment Option is exercised. A purchaserwho acquires Common Shares forming part of the Underwriters’ over-allocation position acquires those securities under this short form prospectus,regardless of whether the over-allocation position is ultimately filled through the exercise of the Over-Allotment Option or through secondary marketpurchases. See ‘‘Plan of Distribution’’.
Underwriters’ Position Maximum size Exercise period Exercise price
Over-Allotment Option . . . . . . . 1,945,845 Common Shares 30 days following the U.S.$10.00 per Common ShareClosing Date (C$10.29 per Common Share)
Unless otherwise indicated, all information in this short form prospectus is presented without giving effect to the exercise of the Over-AllotmentOption.
The Underwriters, as principals, conditionally offer the Offered Shares, subject to prior sale, if, as and when issued by us and if, as and when sold bythe Selling Shareholders in accordance with the conditions contained in the Underwriting Agreement referred to under ‘‘Plan of Distribution’’ andsubject to the approval of certain legal matters on our behalf by our Canadian counsel Fraser Milner Casgrain LLP and our U.S. counsel DLAPiper LLP (US) and on behalf of the Underwriters by the Underwriters’ Canadian counsel Stikeman Elliott LLP and U.S. counsel Paul, Weiss, Rifkind,Wharton & Garrison LLP.
Subject to applicable laws, the Underwriters may, in connection with the Offering, effect transactions that stabilize or maintain the market price of theCommon Shares at levels other than those which might otherwise prevail on the open market. Such transactions, if commenced, may be discontinuedat any time. The Underwriters may offer the Offered Shares at lower prices than stated above. See ‘‘Plan of Distribution’’.Subscriptions for the Offered Shares will be received subject to rejection or allotment, in whole or in part, and the right is reserved to close thesubscription books at any time without notice. We expect to arrange for an instant deposit of the Offered Shares to or for the account of theUnderwriters with The Depositary Trust Company on the date of closing, which is expected to take place on or about October 20, 2009 (the ‘‘ClosingDate’’). In any event, the Offered Shares are to be taken up by the Underwriters, if at all, on or before a date not later than 42 days after the date of thereceipt of this final short form base PREP prospectus.
Two of the Selling Shareholders, Enterprise Partners V, L.P. and Enterprise Partners VI, L.P., are incorporated, continued or otherwiseorganized under the laws of a foreign jurisdiction. Mr. McCormack, a Selling Shareholder, is a U.S. citizen and resides in the U.S. Althoughsuch Selling Shareholders have appointed Fraser Milner Casgrain LLP, 99 Bank Street, Suite 1420, Ottawa, Ontario, K1P 1H4 as theiragent for service of process in all of the provinces of Canada, except Quebec, it may not be possible for investors to enforce judgmentsobtained in Canada against such Selling Shareholders.The enforcement by investors of civil liabilities under United States federal securities laws may be affected adversely by the fact thatDragonWave is incorporated under the laws of Canada, that a majority of our officers and directors and experts are residents of Canada,that some or all of the Underwriters or experts named in the registration statement to which this short form prospectus relates are residentsof a foreign country and that a substantial portion of our assets and said persons are located outside of the United States.NEITHER THE SEC NOR ANY STATE OR CANADIAN SECURITIES COMMISSIONS OR SIMILAR REGULATORY AUTHORITYHAS APPROVED OR DISAPPROVED THE OFFERED SHARES OR PASSED UPON THE ACCURACY OR ADEQUACY OF THISSHORT FORM PROSPECTUS. ANY REPRESENTATION TO THE CONTRARY IS A CRIMINAL OFFENCE.Our head and registered office is 411 Legget Drive, Suite 600, Ottawa, Ontario, Canada, K2K 3C9.
In this short form prospectus, unless otherwise specified or the context otherwise requires, all dollar amounts are expressed in Canadian dollars. Allreferences to ‘‘dollars’’, ‘‘C$’’ or ‘‘$’’ are to Canadian dollars and all references to ‘‘U.S.$’’ are to United States dollars. See ‘‘Currency Presentationand Exchange Rate Information’’.

Fixed MobileConvergence
Smartphones
Real-TimeInternet
Municipalities, Schoolsand Hospitals
Mobile Broadband
3G/4G Cellular
Private/EnterpriseNetworks
BroadbandWireless Access
LTE/WiMAX
IP Video

Fixed MobileConvergence
Smartphones
Real-TimeInternet
Municipalities, Schoolsand Hospitals
Mobile Broadband
3G/4G Cellular
Private/EnterpriseNetworks
BroadbandWireless Access
LTE/WiMAX
IP Video

TABLE OF CONTENTS
Page Page
GENERAL MATTERS . . . . . . . . . . . . . . . . iv DOCUMENTS INCORPORATED BYREFERENCE . . . . . . . . . . . . . . . . . . . . . 94GLOSSARY OF TECHNICAL TERMS . . . . v
AUDITORS, TRANSFER AGENT ANDCAUTION REGARDING FORWARD-REGISTRAR . . . . . . . . . . . . . . . . . . . . . 95LOOKING STATEMENTS . . . . . . . . . . . 1
CURRENCY PRESENTATION AND RECONCILIATION TO U.S. GAAP . . . . . . 95EXCHANGE RATE INFORMATION . . . 2
CERTAIN CANADIAN FEDERALPROSPECTUS SUMMARY . . . . . . . . . . . . 3 INCOME TAX CONSIDERATIONS FOR
NON-RESIDENTS OF CANADA . . . . . . 96OUR BUSINESS . . . . . . . . . . . . . . . . . . . . 3
THE OFFERING . . . . . . . . . . . . . . . . . . . . 7 CERTAIN UNITED STATES FEDERALINCOME TAX CONSIDERATIONS FORSUMMARY CONSOLIDATEDU.S. HOLDERS . . . . . . . . . . . . . . . . . . . 97FINANCIAL INFORMATION . . . . . . . . . 9
NASDAQ QUORUM REQUIREMENT . . . 101RISK FACTORS . . . . . . . . . . . . . . . . . . . . . 11
OUR BUSINESS . . . . . . . . . . . . . . . . . . . . 26 WHERE YOU CAN FIND MOREINFORMATION . . . . . . . . . . . . . . . . . . . 102DIRECTORS AND MANAGEMENT . . . . . 48
INTERESTS OF MANAGEMENT AND ENFORCEABILITY OF CIVILOTHERS IN CERTAIN LIABILITIES . . . . . . . . . . . . . . . . . . . . . 102TRANSACTIONS . . . . . . . . . . . . . . . . . . 54
LEGAL MATTERS . . . . . . . . . . . . . . . . . . 103DESCRIPTION OF SECURITIES BEING
EXPERTS . . . . . . . . . . . . . . . . . . . . . . . . . 103DISTRIBUTED . . . . . . . . . . . . . . . . . . . 55
CONSOLIDATED CAPITALIZATION . . . . 56 ELIGIBILITY FOR INVESTMENT . . . . . . 104USE OF PROCEEDS . . . . . . . . . . . . . . . . . 57 PURCHASERS’ STATUTORY RIGHTS . . . 104DIVIDEND POLICY . . . . . . . . . . . . . . . . . 57
PURCHASERS’ CONTRACTUAL RIGHTSELECTED CONSOLIDATED OF ACTION . . . . . . . . . . . . . . . . . . . . . . 104
FINANCIAL INFORMATION . . . . . . . . . 58AUDITORS’ CONSENT . . . . . . . . . . . . . . . 105MANAGEMENT’S DISCUSSION AND
ANALYSIS OF FINANCIAL AMENDED AUDITED CONSOLIDATEDCONDITION AND RESULTS OF FINANCIAL STATEMENTS FOR THEOPERATIONS . . . . . . . . . . . . . . . . . . . . 60 YEARS ENDED FEBRUARY 28, 2009
AND FEBRUARY 29, 2008 ANDOPTIONS AND WARRANTS TOAMENDED CONSOLIDATEDPURCHASE SECURITIES . . . . . . . . . . . 84FINANCIAL STATEMENTS FOR THE
PRIOR SALES . . . . . . . . . . . . . . . . . . . . . . 86 THREE MONTH PERIOD ENDEDMAY 31, 2009 . . . . . . . . . . . . . . . . . . . . . F-1TRADING PRICE AND VOLUME . . . . . . 87
PRINCIPAL SHAREHOLDERS . . . . . . . . . 87 CERTIFICATE OF THE COMPANY . . . . . C-1SELLING SHAREHOLDERS . . . . . . . . . . . 89 CERTIFICATE OF THEPLAN OF DISTRIBUTION . . . . . . . . . . . . 91 UNDERWRITERS . . . . . . . . . . . . . . . . . C-2
iii

GENERAL MATTERS
Documents incorporated by reference in this short form prospectus include market share information andindustry data and forecasts obtained from independent industry publications and surveys. References in suchdocuments to research reports, surveys or articles should not be construed as depicting the complete findings ofthe entire referenced report, survey or article. The information in any such report, survey or article is notincorporated by reference in this short form prospectus. Although we believe these sources are reliable, we havenot independently verified any of the data nor ascertained the underlying economic assumptions relied upon insuch reports, surveys or articles. Some data is also based on our estimates, which are derived from our review ofour internal surveys, as well as independent sources. We cannot and do not provide any assurance as to theaccuracy or completeness of such information. Market forecasts, in particular, are likely to be inaccurate,especially over long periods of time.
Investors should rely only on the information contained in or incorporated by reference in this short formprospectus. Neither we, nor the Selling Shareholders, nor the Underwriters have authorized any other person toprovide investors with different information.
Readers should not assume that the information contained in this short form prospectus is accurate as ofany date other than the date on the front of this short form prospectus, unless otherwise noted herein or asrequired by law. It should be assumed that the information appearing in this short form prospectus and thedocuments incorporated by reference herein is accurate only as of their respective dates. Our business, financialcondition, results of operations or prospects may have changed since those dates.
Certain terms and phrases used in this short form prospectus are defined in the ‘‘Glossary of TechnicalTerms’’.
Unless indicated otherwise, all information in this short form prospectus is presented without giving effectto the exercise of the Over-Allotment Option.
Information contained on our website, www.dragonwaveinc.com, is not part of this short form prospectusand is not incorporated herein by reference and may not be relied upon by prospective purchasers for thepurpose of determining whether to invest in the Offered Shares offered under this short form prospectus.
iv

GLOSSARY OF TECHNICAL TERMS
‘‘2G’’: refers to the second generation family of standards for mobile wireless communications, based on GSM orCDMA technologies.
‘‘3G+’’: refers to the third generation family of standards for wireless communication for mobile voice and datacommunications established by the International Telecommunications Union (‘‘ITU’’) as well as fourthgeneration (4G) standards still being defined. 3G+ includes such advanced all-IP wireless networkingtechnologies as HSPA, WiMAX and LTE. The 3G+ family of standards enable concurrent use of voice andother data services such as enhanced multimedia (Internet, email, video and other data) at broadbandtransmission speed, and roaming capability. 3G+ networks enable network operators to offer users a widerrange of more advanced services while achieving greater network capacity through improved spectral efficiency.
‘‘ATPC’’: is an acronym for ‘‘automatic transmit power control’’, a technique used to reduce the level of radiosignal interference between communications systems. The ATPC reduces transmitter power during clearweather when the path attenuation is low and increases transmitter power during rain, when the pathattenuation increases.
‘‘backhaul’’: refers to the means by which information (or data) is carried from a radio access network wirelessbase station or other collection point to a core network node, from which it can be transported over the highcapacity fiber optic network.
‘‘broadband’’: refers to a telecommunication technology in which a wide band of frequencies is available totransmit information. Where a wide band of frequencies is available, information can be multiplexed and sent onmany different frequencies or channels within the band concurrently. This allows more information to betransmitted in a given amount of time.
‘‘CCTV’’: is an acronym for ‘‘closed circuit television’’, the use of video cameras to transmit a signal to a specificplace, on a limited set of monitors. More generally, CCTV refers to the use of video for surveillanceapplications.
‘‘CDMA’’: is an acronym for ‘‘code division multiple access’’, a channel access method utilized by various radiocommunications technologies.
‘‘DEMS’’: is an acronym for ‘‘digital electronic messaging services’’, a wireless service providing local broadbanddata transmission.
‘‘DS3’’: is an acronym for ‘‘digital signal 3’’, a high-speed TDM circuit for data connectivity equivalent inbandwidth to 28 T1 lines (45 Mbps).
‘‘DSL’’: is an acronym for ‘‘digital subscriber line’’, a technology for bringing high-bandwidth Internetconnectivity to homes and small businesses over ordinary copper telephone lines.
‘‘E1’’: refers to a 2.0 Mbps point-to-point dedicated digital circuit typically provided by the telephone companies.This is a standard interface used mostly outside the United States.
‘‘EDGE’’: refers to Enhanced Data rates for GSM Evolution, a digital mobile communications technology thatallows increased data transmission rates and improved data transmission reliability. EDGE is generally classifiedas a ‘2.75G’ mobile wireless technology.
‘‘Ethernet’’: refers to a common method of networking computers in a local area network (or LAN) and isspecified in an IEEE standard, IEEE 802.3.
‘‘EV-DO’’: refers to Evolution-Data Optimized, a 3G+ wireless radio broadband data standard based upon theCDMA access scheme that enables faster speeds than are available in early CDMA networks or other 2Gservices, such as GPRS or EDGE. EV-DO was designed as an evolution of the CDMA2000 standard that wouldsupport high data rates and could be deployed alongside a wireless carrier’s voice services. ‘‘1xEV-DO Rev A’’and ‘‘EV-DO Rev B’’ refer to different revisions of this CDMA-based technology.
‘‘FOMA’’: is an acronym for ‘‘freedom of mobile multimedia access’’, the brand name of a CDMA-based 3G+telecommunications service offered by the Japanese telecommunications service provider NTT DoCoMo.FOMA is an implementation of UMTS and was one of the world’s first 3G+ services to commence operation.
v

‘‘FPGA’’: is an acronym for ‘‘field-programmable gate array’’, a semiconductor device that can be configured bythe customer or designer after manufacturing. FPGAs are programmed to specify how the chip will work.FPGAs can be used to implement any logical function that an application-specific integrated circuit (or ASIC)could perform, but the ability to update the functionality after shipping offers advantages for many applications.
‘‘Gbps’’: is an acronym for ‘‘billions of bits per second’’ or ‘‘gigabits per second’’, a measure of bandwidth(the total information flow over a given time) on a telecommunications medium.
‘‘GHz’’: is an abbreviation of ‘‘gigahertz’’, frequencies in the billions of cycles per second range. In radiocommunications, GHz is used to define the size of radio bands in the electromagnetic spectrum.
‘‘Gigabit Ethernet’’ or ‘‘GigE’’: refers to a transmission technology based on the Ethernet protocol used in LANswhich provides a data rate of 1 billion bits per second (one gigabit).
‘‘GPRS’’: is an acronym for ‘‘general packet radio service’’, a packet-oriented mobile data service available tousers of the 2G cellular communication systems GSM, as well as in certain 3G+ technologies and networkstandards.
‘‘GSM’’: is an acronym for ‘‘global system for mobile communications’’, a cellular network technology and themost common standard for mobile phones globally.
‘‘HSDPA’’: is an acronym for ‘‘high speed download packet access’’, a 3G+ mobile telephony communicationsprotocol in the HSPA family, which allows networks based on UMTS to increase data capacity and increasetransfer rates.
‘‘HSPA’’ is an acronym for ‘‘high speed packet access’’, a family of high-speed 3G+ digital data services providedby cellular carriers worldwide based on GSM technology. HSPA service works with HSPA handsets as well aslaptops and other portable devices with HSPA modems. The two established standards of HSPA are HSDPAand HSUPA.
‘‘HSUPA’’: is an acronym for ‘‘high speed upload packet access’’, a 3G+ mobile telephony protocol in the HSPAfamily that improves the performance of uplink dedicated transport channels to increase uplink data capacityand increase transfer rates.
‘‘IEEE’’: is an acronym for ‘‘Institute of Electrical and Electronics Engineers’’, a U.S.-based organization ofengineers, scientists and students involved in electrical, electronics, and related fields. IEEE also functions as apublishing house and standards making body.
‘‘IF’’: is an acronym for ‘‘intermediate frequency’’, a frequency between the base band and RF frequency that isused in communications between a modem and a radio.
‘‘IP’’ or ‘‘Internet Protocol’’: refers to a standardized method of transporting information across the Internet inpackets of digital data.
‘‘ISM’’: is an acronym for ‘‘industrial, scientific and medical’’, a part of the radio spectrum that can be used forspecific applications such as point-to-point communications without a license in most countries.
‘‘LMDS’’: is an acronym for ‘‘local multipoint distribution systems’’, a system for broadband fixed microwavewireless transmission direct from a local antenna to homes and businesses within line-of-sight.
‘‘LTE’’ is an acronym for ‘‘long term evolution’’, an advanced 3G+ all-IP technology for both GSM and CDMAcellular service providers for which initial deployments are expected in the 2010 time frame. Approved in 2008,LTE is expected to enable typical download speeds of approximately 6 Mbps, a considerably higher bandwidththan HSPA (evolved from GSM) and EV-DO (evolved from CDMA) technologies.
‘‘Mbps’’: is an acronym for ‘‘millions of bits per second’’ or ‘‘megabits per second’’, a measure of bandwidth(the total information flow over a given time) on a telecommunications medium.
‘‘MHz’’: is an abbreviation of ‘‘megahertz’’, frequencies in the millions of cycles per second range. In radiocommunications, MHz is used to define the size of radio bands in the electromagnetic spectrum.
‘‘ms’’: is an abbreviation of ‘‘millisecond’’.
vi

‘‘multiplexer’’: refers to a device that can send several signals over a single line. The signals are then separatedby a similar device at the other end of the link.
‘‘native Ethernet’’: refers to systems that are designed to transport Ethernet directly rather than adapting Ethernetto existing SONET/SDH or PDH transport systems.
‘‘PDA’’: is an acronym for ‘‘personal digital assistant’’, a lightweight handheld consumer electronic device thatperforms basic computing tasks such as diary and personal database management.
‘‘PDH’’: is an acronym for ‘‘plesiochronous digital hierarchy’’, the data rates and formats used intelecommunications equipment and described in International Telecommunications Standard G 920. Commondata rates include 1.5 Mbps (or T1) and 2.0 Mbps (or E1).
‘‘points of presence’’: refers to a site that houses a service provider’s telecommunication equipment such as aswitching system or a facility node.
‘‘pseudowire technology’’: refers to technology that allows a communications service provider or network operatorto package any network service, legacy or emerging, and send it into the network in a format that both preservesthe service’s original features and delivers the values of end-to-end OAM&P (operations, administration,maintenance and provisioning), statistical multiplexing, and unified management.
‘‘RF’’: is an acronym for ‘‘radio frequency’’, the range of electromagnetic frequencies above the audio range andbelow visible light. All broadcast transmissions, from AM radio to satellites, fall into this range, which is between30 kilohertz and 300 GHz.
‘‘SDH’’: is an acronym for ‘‘synchronous digital hierarchy’’, the data rates and formats used intelecommunications equipment and described in International Telecommunications Union standard G.823.Common data rates include 155 Mbps (or STM1) and 622 Mbps (or STM4).
‘‘SNMP’’: is an acronym for ‘‘simple network management protocol’’, a protocol for exchanging managementinformation and commands across a network between a management computer and a managed device.
‘‘SONET’’: is an acronym for ‘‘synchronous optical network’’, the data rates and formats used intelecommunications equipment and described in American National Standards Institute standardGR-253-CORE. Common data rates include 155 Mbps (or OC3) and 622 Mbps (or OC12).
‘‘T1’’: refers to a 1.544 Mbps point-to-point dedicated digital circuit provided by telephone companies.
‘‘Tbps’’: is an acronym for ‘‘tera bits per second’’, a measure of bandwidth (the total information flow over agiven time) on a telecommunications medium.
‘‘TDM’’: is an acronym for ‘‘time division multiplexing’’, a scheme in which numerous signals are combined fortransmission on a single communications line or channel.
‘‘topology’’: refers to the physical or logical connectivity of a network.
‘‘UMTS’’: is an acronym for ‘‘universal mobile telecommunications system’’, a 3G+ mobile telecommunicationstechnology and standard specified by the 3rd Generation Partnership Project (or 3GPP) and the ITU-IMT-2000.
‘‘VLAN’’: is an acronym for ‘‘virtual local area network’’, a group of hosts with a common set of requirementsthat communicate as if they were attached to the broadcast domain, regardless of their physical location. AVLAN has the same attributes as a physical local area network, but allows for end stations to be groupedtogether even if they are not located on the same network switch. In a VLAN, network reconfiguration can beperformed through software instead of physically relocating devices.
‘‘VoIP’’: is an acronym for ‘‘voice over internet protocol’’, a category of hardware and software that enables theuse of the Internet as the transmission medium for telephone calls.
‘‘WiFi’’: is an acronym for ‘‘wireless fidelity’’, a set of product compatibility standards for wireless local areanetworks (or WLANs) based on the IEEE 802.11 standard. WiFi operates in unlicensed frequency bands.
‘‘WiMAX’’: is an acronym for ‘‘worldwide interoperability for microwave access’’, a set of product compatibilitystandards for wireless metropolitan-area networks based on the IEEE 802.16 standard.
vii
The following is a summary of the principal features of this Offering and should be read together with the moredetailed information and financial data contained elsewhere in this short form prospectus, including the documentsincorporated by reference in this short form prospectus. Prospective purchasers should carefully consider, among otherthings, the matters discussed in ‘‘Risk Factors’’ beginning on page 11 of this short form prospectus.
CAUTION REGARDING FORWARD-LOOKING STATEMENTS
This short form prospectus contains or incorporates by reference certain information that may constitute‘‘forward-looking information’’ and ‘‘forward-looking statements’’ within the meaning of applicable Canadianand United States securities laws. All forward looking information and forward-looking statements arenecessarily based on a number of estimates and assumptions that are inherently subject to significant business,economic and competitive uncertainties and contingencies. All statements other than statements which arereporting results as well as statements of historical fact set forth or incorporated herein by reference, areforward-looking statements that may involve a number of known and unknown risks, uncertainties and otherfactors; many of which are beyond our ability to control or predict. Forward-looking statements include, withoutlimitation, statements regarding strategic plans, future production, sales and revenue estimates, cost estimatesand anticipated financial results, capital expenditures and objectives. These statements relate to analysis andother information that are based on forecasts of future results, estimates of amounts not yet determinable andassumptions of management. Known and unknown factors could cause actual results to differ materially fromthose projected in the forward-looking statements.
Forward-looking statements, which involve assumptions and describe our future plans, strategies andexpectations, are generally identifiable by use of the words ‘‘may’’, ‘‘will’’, ‘‘should’’, ‘‘continue’’, ‘‘expect’’,‘‘anticipate’’, ‘‘estimate’’, ‘‘believe’’, ‘‘intend’’, ‘‘plan’’ or ‘‘project’’ or the negative of these words or othervariations on these words or comparable terminology. There can be no assurance that such statements will proveto be accurate and actual results and future events could differ materially from those anticipated in suchstatements. The following are some of the important factors that could cause actual results or outcomes to differmaterially from those discussed in the forward-looking statements:
• our dependence on the development and growth of the market for high-capacity wireless communicationsservices;
• our reliance on a small number of customers for a large percentage of revenue;
• intense competition from several competitors;
• competition from indirect competitors;
• our dependence on our ability to develop new products and enhance existing products;
• our history of losses;
• our ability to successfully manage growth;
• quarterly revenue and operating results which are difficult to predict and can fluctuate substantially;
• the impact of the general economic downturn on our customers;
• disruption resulting from economic and geopolitical uncertainty;
• currency fluctuations;
• our exposure to credit risk for accounts receivable;
• pressure on our pricing models;
• the allocation of radio spectrum and regulatory approvals for our products;
• the ability of our customers to secure a license for applicable radio spectrum;
• changes in government regulation or industry standards that may limit the potential market forour products;
1

• our dependence on establishing and maintaining relationships with channel partners;
• our reliance on outsourced manufacturing;
• our reliance on suppliers of components;
• our ability to protect our own intellectual property and potential harm to our business if we infringe theintellectual property rights of others;
• risks associated with software licensed by us;
• a lengthy and variable sales cycle;
• our dependence on ability to recruit and retain management and other qualified personnel;
• our exposure to risks resulting from our international sales and operations, including the requirement tocomply with export control and economic sanctions laws;
• our ability to successfully effect acquisitions of products or businesses; and
• product defects, product liability claims, or health and safety risks relating to wireless products.
Although we have attempted to identify important factors that could cause our actual results to differmaterially from expectations, intentions, estimates or forecasts, there may be other factors that could cause ourresults to differ from what we currently anticipate, estimate or intend. Recent unprecedented events in globalfinancial and credit markets have resulted in high market price volatility and contraction in credit markets.These on-going events could impact forward-looking statements contained in this short form prospectus and inthe documents incorporated herein by reference in an unpredictable and possibly detrimental manner. In lightof these risks, uncertainties and assumptions, the forward-looking events described in this short form prospectusand the documents incorporated by reference might not occur or might not occur when stated.
Forward-looking statements made in a document incorporated by reference in this short form prospectusare made as at the date of the original document and have not been updated by us except as expressly providedfor in this short form prospectus. Except as required under applicable securities legislation, we undertake noobligation to publicly update or revise forward-looking statements, whether as a result of new information,future events or otherwise.
CURRENCY PRESENTATION AND EXCHANGE RATE INFORMATION
In this short form prospectus, unless otherwise specified or the context otherwise requires, all dollaramounts are expressed in Canadian dollars. All references to ‘‘dollars’’, ‘‘C$’’ or ‘‘$’’ are to Canadian dollars andall references to ‘‘U.S.$’’ are to United States dollars. For the amounts referenced under ‘‘Use of Proceeds’’ and‘‘Plan of Distribution’’, the rate of exchange was U.S.$1.00=C$1.0292 or C$1.00=U.S.$0.9716, each based onthe Bank of Canada’s noon exchange rate for October 14, 2009.
The following table sets out (1) the high and low rate of exchange for one Canadian dollar in U.S. dollarsduring the indicated periods, (2) the average of the rate of exchange on the last business day of each monthduring those periods, and (3) the exchange rate in effect as at the end of each of those periods, each based onthe noon rate published by the Bank of Canada.
High Low Average End of Period
Three Month Periods ended August 31,2009 . . . . . . . . . . . . . . . . . . . . . . . . . . . . . . . . . . . . . . . . . . . . . 0.9358 0.8580 0.8981 0.91182008 . . . . . . . . . . . . . . . . . . . . . . . . . . . . . . . . . . . . . . . . . . . . . 0.9987 0.9365 0.9738 0.9411
Three Month Periods ended May 31,2009 . . . . . . . . . . . . . . . . . . . . . . . . . . . . . . . . . . . . . . . . . . . . . 0.9123 0.7692 0.8246 0.91232008 . . . . . . . . . . . . . . . . . . . . . . . . . . . . . . . . . . . . . . . . . . . . . 1.0161 0.9729 0.9949 1.0058
Fiscal Years EndedFebruary 28, 2009 . . . . . . . . . . . . . . . . . . . . . . . . . . . . . . . . . . . 1.0161 0.7711 0.9133 0.7870February 29, 2008 . . . . . . . . . . . . . . . . . . . . . . . . . . . . . . . . . . . 1.0905 0.8467 0.9588 1.0206
2

PROSPECTUS SUMMARY
OUR BUSINESS
Overview
We are a leading provider of high-capacity Ethernet microwave equipment used in emerging IP networks.We design, develop, market and sell proprietary, carrier-grade microwave networking equipment, or links, thatwirelessly transmit broadband voice, video and other data between two points. Our Ethernet microwave links,which are based on a native Ethernet platform, function as a wireless extension to an existing fiber optic coretelecommunications network. Our products principally perform the backhaul function in a communicationservice provider’s network, connecting high traffic points of aggregation such as high-capacity wireless basestations (3G+ wireless networks, including HSPA, WiMAX and LTE-based systems) and large ‘out of territory’enterprises to nodes on the fiber optic core network.
We target principally the global wireless communications service provider market and, in particular, serviceproviders offering high-capacity wireless communication services, including 3G+ wireless service providers. Atthe end of our most recent fiscal year, we had shipped approximately 9,500 product units and our customer baseincluded more than 250 customers worldwide in 56 countries. Our customers include Clearwire Corporation(‘‘Clearwire’’), which has launched the world’s most advanced mobile WiMAX deployment, as well as GlobaliveWireless Management Corp. (‘‘Globalive’’), which has selected our products for deployment in Globalive’sNorth American 3G+ (HSPA) cellular network in support of its wireless services offered in the Canadianmarket under the brand name WIND. Based on our review of published United States Federal CommunicationsCommission (‘‘FCC’’) data, in 2008 we had the largest U.S. market share, at 32%, in combined 6, 11, 18 and23 GHz links, and in 2008 we increased our market share in the U.S. market for 18 and 23 GHz bands to 46%.
Our revenue for the three months ended May 31, 2009 was $16.0 million, representing an increase of 49%or $5.2 million compared to the same period in the previous fiscal year. Revenue growth was driven by theacceleration of network deployment by Clearwire, as well as by overall increased sales activity. In the fiscal yearended February 28, 2009, our revenue was $43.3 million, representing an increase of 7.3% or $2.9 millioncompared to the previous fiscal year.
Industry Background
There are two key trends driving the increased demand for our products: increased demand for backhaulcapacity and IP convergence. Demand for backhaul capacity is predicted to experience strong growth. Accordingto a 2009 research report prepared by ABI Research titled ‘‘Mobile Backhaul — Global Market Analysis andForecast (CAPEX and Lease Revenue Opportunities for Carrier Ethernet, Microwave, MPLS-TE, PBB-TE,TDM and Cable Backhaul Solutions)’’ (the ‘‘ABI Report’’), global demand for backhaul capacity is expected togrow by almost five times from 2008 to 2014 (from 13.51 Tbps in 2008 to 66.49 Tbps in 2014), representing acompound annual growth rate of 30%. We believe the following factors are key drivers of demand for increasedbackhaul capacity:
• Increasing Functionality of Mobile Devices and Capacity at the Edge of Wireless Networks. Accesstechnologies currently being deployed or planned, including WiMAX, HSPA and LTE, in concert with theavailability of sophisticated mobile devices, including smartphones, data cards and netbooks, significantlyincrease bandwidth demand per user within mobile networks.
• Shift in Demand from Voice to Multimedia Content and Services in Mature Markets. Service providers inareas with mature subscriber bases are attempting to increase average revenue per user, or ARPU, byoffering data services such as e-mail, web browsing, music and video downloading and other Internetrelated services, as well as mobile video services.
• Increasing Demand for Wireless Coverage in Emerging Markets. As early broadband and wireless marketshave matured, growth of broadband and wireless subscribers is shifting to emerging markets indeveloping countries and rural areas. In rural areas of the United States, some deployments are expected
3

to receive government funding or other support through the U.S.$7.2 billion rural broadband stimuluspackage.
• Increase in Global Wireless Communications Subscribers. According to the ABI Report, the number ofcellular subscribers globally is expected to increase from more than 4 billion at the end of 2008 toapproximately 5.9 billion by the end of 2014.
• Global Investment in Wireless Access Network Spectrum. There have been numerous auctions around theworld of radio spectrum that is used in wireless access networks. The purchasers of this spectrum requirebackhaul solutions such as ours.
With the dramatic increase in mobile data, service providers are increasingly looking to integrate allcommunications traffic, including voice, video and other data traffic, onto a single, unified IP-based network.IP convergence enables service providers to carry more volume and types of data on a single network, improvingefficiency, lowering network costs and giving service providers the ability to offer more advanced services.Advanced wireless networks such as certain 3G+ networks will utilize IP-based platforms and are expected toutilize the superior backhaul efficiencies of carrier-grade Ethernet equipment that supports scalability,high-availability, legacy TDM traffic support and service management.
Our Solutions
We believe our Ethernet microwave links are an attractive alternative to other backhaul solutions such asleased lines and fiber optic cable deployments. The key characteristics of our solutions are as follows:
• Ethernet Microwave. Our products are based on a native Ethernet design which delivers high efficiency,low latency and full support for Ethernet data transport features. The advantages of Ethernet are lowerprice points when compared to SONET or SDH alternatives, more efficient transport due to the ability toperform statistical multiplexing, traffic priority management and fine bandwidth control.
• High-Capacity and Scalable. Our products feature Gigabit Ethernet transport with link speeds up to4 Gbps. The capacity of our Ethernet microwave links can be remotely controlled using our Flex softwareto match network demands without the need for site visits to upgrade hardware.
• High Availability. Our products deliver 99.999% availability using Ethernet networking through acombination of equipment reliability and network level redundancy, including support for ring / mesharchitectures. Our proprietary rapid link shutdown feature provides SONET-like failover speeds withlow-cost Ethernet switching.
• Cost Competitive. Our proprietary surface mount designs and manufacturing processes enable us to offera cost competitive product compared with those that rely on conventional microwave manufacturingtechniques. We deliver scalable bandwidth managed in 10 Mbps increments, providing our customerswith an attractive ‘pay as you grow’ approach.
• Support for Legacy Networking Standards. Our Service Delivery Unit, or SDU, supports pseudowire, atechnology that emulates the essential attributes of legacy TDM services over an IP switched network.Our SDU allows our customers to continue offering revenue-generating legacy services, while making asmooth transition to more efficient IP-based networks.
• Network Management and Planning. Our products use industry standard simple network managementprotocol, or SNMP, rather than costly, proprietary network management systems. This significantlyreduces the cost to service providers of integrating our product into their networks. We also offerdeployment planning services to assist our customers in the design of their networks and the deploymentof our products.
Clearwire Relationship
Clearwire is an alternative mobile network operator using pre-WiMAX and WiMAX 802.16 E-2005technology to deliver mobile, fixed and nomadic Internet services to its subscribers in the United States and
4

Europe in the 2.5 GHz and 3.5 GHz frequency bands, respectively. In 2008, Clearwire Corporation was formedthrough the combination of Clearwire LLC and certain Sprint WiMAX network and 2.5 GHz assets andoperations. These wireless assets were combined with investments from Intel Capital Corp., Google Inc.,Comcast Corp., Time Warner Cable Inc. and Bright House Networks LLC. Clearwire has since announced plansto launch WiMAX networks in more than 80 markets, with the objective of expanding coverage to 120 millionsubscriber points of presence by the end of 2010. Clearwire has also announced that as of March, 2009, it hadmarkets covering 75 million people under development and construction, with some of these markets launchinglater in 2009 and others in 2010. Clearwire also stated in March, 2009 that it was working on the long lead timelow-cost site acquisition zoning and permitting work for the markets covering the remaining 45 million peopleover the course of 2009, and most recently announced (in August, 2009) that it has more than 20,000 cell sitesunder development. Clearwire has deployed wireless networks in multiple markets across North America usingour Ethernet microwave links, and we are currently the primary supplier of licensed microwave equipmentto Clearwire.
Our Growth Strategy
Our objective is to strengthen our position as a global leader in high-capacity Ethernet microwavecommunication equipment that enables the transition by wireless service providers to high-capacity all-IPnetworks. In order to accomplish this goal, we aim to leverage our technological leadership, broaden our marketpenetration, and demonstrate competitiveness for deployment with key customers in multiple radio accessnetwork types such as WiMAX, HSPA and LTE. The specific elements of our growth strategy are as follows:
• Continue Product Development Investment. We believe that our growth to date has been, in large part,due to our product development focus on high-capacity Ethernet microwave equipment. We intend tocontinue to develop products to address market requirements in various applications and geographicmarkets around the world.
• Expand Geographical Reach. We intend to build on our leading U.S. market share and our currentinternational market penetration to expand our geographical reach. This multi-faceted strategy includesincreasing global direct sales activities, expanding our distributor, value added reseller (‘‘VAR’’) andoriginal equipment manufacturer (‘‘OEM’’) arrangements around the globe and investing in training andtools for our international distribution partners.
• Capitalize on Broadband Stimulus Funding. The U.S. government has recently announced substantialfunding of new rural broadband initiatives under the American Recovery and Reinvestment Act of 2009totaling U.S.$7.2 billion in grants and loans. We believe that broadband stimulus funding of rural projectsrepresents a significant opportunity for us to develop new and expanded markets for our backhaultransport solutions.
• Continue to Focus on Operational Excellence and Deliver Effective Customer Service and Support. We intendto continue to focus on improving product quality, reducing delivery time, reducing costs, streamliningmanufacturing processes and optimizing inventories. This focus on operational excellence has allowed usto significantly reduce our manufacturing costs and shorten our delivery time.
• Review Selective Strategic Acquisitions. We intend to selectively review opportunities to acquire companiesor technologies that complement our existing product portfolio and market reach.
Recent Developments
On September 14, 2009, we introduced Horizon Quantum, our newest product designed to providesignificantly increased bandwidth capacity of up to 4 Gbps per link in a half-rack-unit device incorporating abandwidth accelerator feature that enables superior spectral efficiency by up to a factor of 2.5 times as comparedto conventional systems. Shipments of Horizon Quantum are scheduled to commence by the end of 2009.
5

Corporate Information
We were incorporated on February 24, 2000 by a Certificate and Articles of Incorporation issued under theCanada Business Corporations Act. Our head and registered office is 411 Legget Drive, Suite 600, Ottawa,Ontario, Canada, K2K 3C9.
Unless otherwise noted or the context otherwise indicates, the terms ‘‘DragonWave’’, ‘‘we’’, ‘‘us’’, ‘‘our’’ andthe ‘‘Company’’ refer to DragonWave Inc. and its wholly-owned subsidiaries DragonWave Corp. and4472314 Canada Inc.
This short form prospectus contains company names, logos, trade names, trademarks and service marks ofDragonWave and other organizations, all of which are the property of their respective owners.
6

THE OFFERING
Common Shares offered by 7,454,050 Common Sharesus:
Common Shares offered by 5,518,250 Common Sharesthe Selling Shareholders:
Offering price: U.S.$10.00 (C$10.29) per Common Share
Size of Offering: U.S.$129,723,000 (C$133,484,967)
Common Shares Outstanding 36,209,978 Common Shares. This represents immediate dilution of 21% forAssuming Completion of the existing holders of Common Shares. The number of Common Shares and theOffering: dilution calculation assume the exercise of the Private Investor Warrants (as
defined herein) held by Enterprise Partners V, L.P. and EnterprisePartners VI, L.P. but assume no exercise of the Underwriters’Over-Allotment Option or any other options or warrants described in‘‘Options and Warrants to Purchase Securities’’. See ‘‘ConsolidatedCapitalization’’.
Offering Type: Offering in the U.S. under the MJDS and in each of the provinces of Canada,except the province of Quebec.
Use of Proceeds: We expect to use the net proceeds of the sale of the Treasury Shares asfollows:
(i) as to approximately U.S.$27,421,629 (C$28,222,340) (40% ofthe net proceeds), to strengthen our balance sheet inpreparation for new mobile broadband network deploymentsand to better position us to be selected as an equipment vendorfor large network service providers;
(ii) as to approximately U.S.$20,566,221 (C$21,166,755) (30% ofthe net proceeds), to fund working capital requirementsassociated with accelerating sales and production of ourproducts;
(iii) as to approximately U.S.$13,710,814 (C$14,111,170) (20% ofthe net proceeds), to continue to fund our efforts to increasesales penetration in regions outside North America, includingincreasing global direct sales activity, expanding ourdistribution, VAR and OEM network, and providing trainingand support to strengthen the systems engineering and supportorganizations of our VARs and OEMs. We also plan to investin human resources and supporting infrastructure to supportthis effort; and
(iv) as to the balance, to provide an available source of funding forpotential future acquisition opportunities.
Over-Allotment Option: We have granted the Underwriters an option to purchase up to an additional1,945,845 Common Shares (equal to 15% of the Offered Shares) at theOffering price, exercisable during the period ending 30 days after the closingof this Offering to cover over-allotments, if any, and for market stabilizationpurposes. See ‘‘Plan of Distribution’’.
Dividend Policy: We have never paid dividends and do not anticipate paying dividends in theforeseeable future. See ‘‘Dividend Policy’’.
7
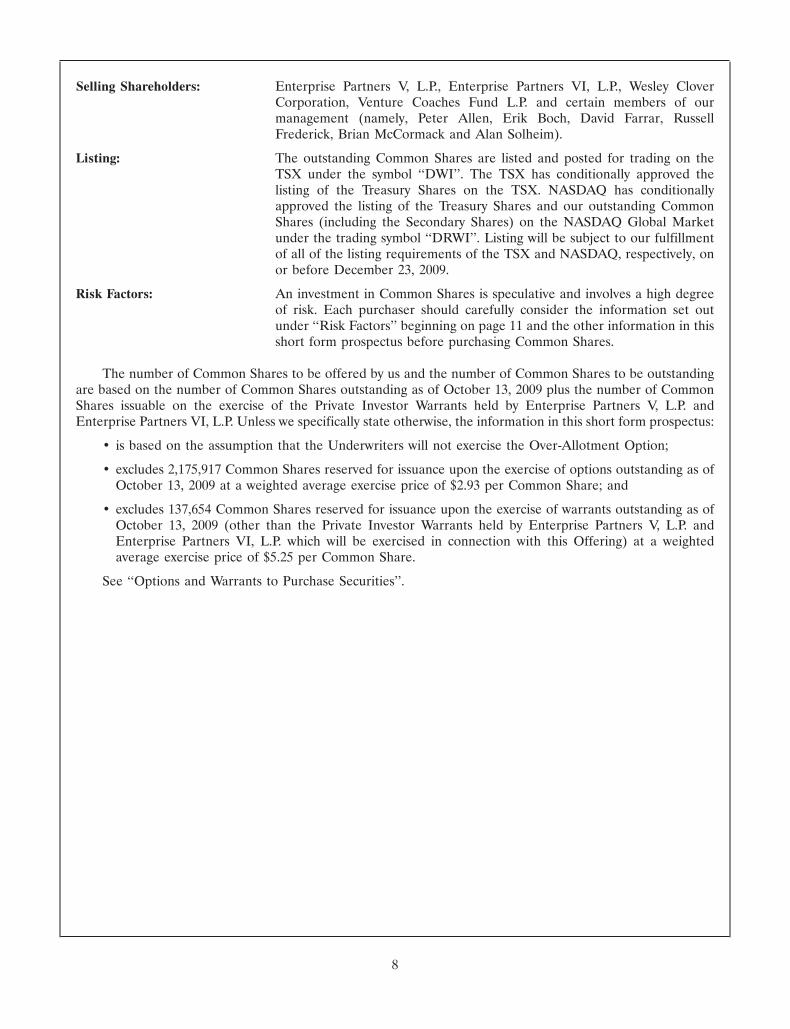
Selling Shareholders: Enterprise Partners V, L.P., Enterprise Partners VI, L.P., Wesley CloverCorporation, Venture Coaches Fund L.P. and certain members of ourmanagement (namely, Peter Allen, Erik Boch, David Farrar, RussellFrederick, Brian McCormack and Alan Solheim).
Listing: The outstanding Common Shares are listed and posted for trading on theTSX under the symbol ‘‘DWI’’. The TSX has conditionally approved thelisting of the Treasury Shares on the TSX. NASDAQ has conditionallyapproved the listing of the Treasury Shares and our outstanding CommonShares (including the Secondary Shares) on the NASDAQ Global Marketunder the trading symbol ‘‘DRWI’’. Listing will be subject to our fulfillmentof all of the listing requirements of the TSX and NASDAQ, respectively, onor before December 23, 2009.
Risk Factors: An investment in Common Shares is speculative and involves a high degreeof risk. Each purchaser should carefully consider the information set outunder ‘‘Risk Factors’’ beginning on page 11 and the other information in thisshort form prospectus before purchasing Common Shares.
The number of Common Shares to be offered by us and the number of Common Shares to be outstandingare based on the number of Common Shares outstanding as of October 13, 2009 plus the number of CommonShares issuable on the exercise of the Private Investor Warrants held by Enterprise Partners V, L.P. andEnterprise Partners VI, L.P. Unless we specifically state otherwise, the information in this short form prospectus:
• is based on the assumption that the Underwriters will not exercise the Over-Allotment Option;
• excludes 2,175,917 Common Shares reserved for issuance upon the exercise of options outstanding as ofOctober 13, 2009 at a weighted average exercise price of $2.93 per Common Share; and
• excludes 137,654 Common Shares reserved for issuance upon the exercise of warrants outstanding as ofOctober 13, 2009 (other than the Private Investor Warrants held by Enterprise Partners V, L.P. andEnterprise Partners VI, L.P. which will be exercised in connection with this Offering) at a weightedaverage exercise price of $5.25 per Common Share.
See ‘‘Options and Warrants to Purchase Securities’’.
8
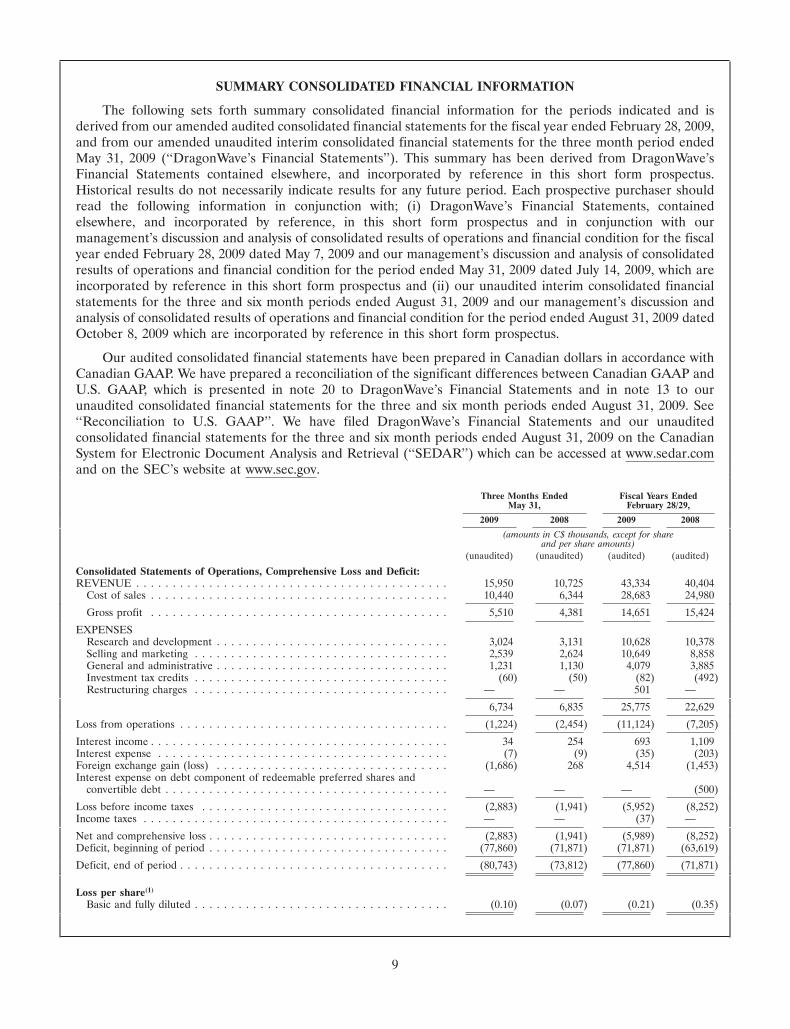
SUMMARY CONSOLIDATED FINANCIAL INFORMATION
The following sets forth summary consolidated financial information for the periods indicated and isderived from our amended audited consolidated financial statements for the fiscal year ended February 28, 2009,and from our amended unaudited interim consolidated financial statements for the three month period endedMay 31, 2009 (‘‘DragonWave’s Financial Statements’’). This summary has been derived from DragonWave’sFinancial Statements contained elsewhere, and incorporated by reference in this short form prospectus.Historical results do not necessarily indicate results for any future period. Each prospective purchaser shouldread the following information in conjunction with; (i) DragonWave’s Financial Statements, containedelsewhere, and incorporated by reference, in this short form prospectus and in conjunction with ourmanagement’s discussion and analysis of consolidated results of operations and financial condition for the fiscalyear ended February 28, 2009 dated May 7, 2009 and our management’s discussion and analysis of consolidatedresults of operations and financial condition for the period ended May 31, 2009 dated July 14, 2009, which areincorporated by reference in this short form prospectus and (ii) our unaudited interim consolidated financialstatements for the three and six month periods ended August 31, 2009 and our management’s discussion andanalysis of consolidated results of operations and financial condition for the period ended August 31, 2009 datedOctober 8, 2009 which are incorporated by reference in this short form prospectus.
Our audited consolidated financial statements have been prepared in Canadian dollars in accordance withCanadian GAAP. We have prepared a reconciliation of the significant differences between Canadian GAAP andU.S. GAAP, which is presented in note 20 to DragonWave’s Financial Statements and in note 13 to ourunaudited consolidated financial statements for the three and six month periods ended August 31, 2009. See‘‘Reconciliation to U.S. GAAP’’. We have filed DragonWave’s Financial Statements and our unauditedconsolidated financial statements for the three and six month periods ended August 31, 2009 on the CanadianSystem for Electronic Document Analysis and Retrieval (‘‘SEDAR’’) which can be accessed at www.sedar.comand on the SEC’s website at www.sec.gov.
Three Months Ended Fiscal Years EndedMay 31, February 28/29,
2009 2008 2009 2008
(amounts in C$ thousands, except for shareand per share amounts)
(unaudited) (unaudited) (audited) (audited)
Consolidated Statements of Operations, Comprehensive Loss and Deficit:REVENUE . . . . . . . . . . . . . . . . . . . . . . . . . . . . . . . . . . . . . . . . . . . 15,950 10,725 43,334 40,404
Cost of sales . . . . . . . . . . . . . . . . . . . . . . . . . . . . . . . . . . . . . . . . . 10,440 6,344 28,683 24,980
Gross profit . . . . . . . . . . . . . . . . . . . . . . . . . . . . . . . . . . . . . . . . . 5,510 4,381 14,651 15,424
EXPENSESResearch and development . . . . . . . . . . . . . . . . . . . . . . . . . . . . . . . . 3,024 3,131 10,628 10,378Selling and marketing . . . . . . . . . . . . . . . . . . . . . . . . . . . . . . . . . . . 2,539 2,624 10,649 8,858General and administrative . . . . . . . . . . . . . . . . . . . . . . . . . . . . . . . . 1,231 1,130 4,079 3,885Investment tax credits . . . . . . . . . . . . . . . . . . . . . . . . . . . . . . . . . . . (60) (50) (82) (492)Restructuring charges . . . . . . . . . . . . . . . . . . . . . . . . . . . . . . . . . . . — — 501 —
6,734 6,835 25,775 22,629
Loss from operations . . . . . . . . . . . . . . . . . . . . . . . . . . . . . . . . . . . . . (1,224) (2,454) (11,124) (7,205)
Interest income . . . . . . . . . . . . . . . . . . . . . . . . . . . . . . . . . . . . . . . . . 34 254 693 1,109Interest expense . . . . . . . . . . . . . . . . . . . . . . . . . . . . . . . . . . . . . . . . (7) (9) (35) (203)Foreign exchange gain (loss) . . . . . . . . . . . . . . . . . . . . . . . . . . . . . . . . (1,686) 268 4,514 (1,453)Interest expense on debt component of redeemable preferred shares and
convertible debt . . . . . . . . . . . . . . . . . . . . . . . . . . . . . . . . . . . . . . . — — — (500)
Loss before income taxes . . . . . . . . . . . . . . . . . . . . . . . . . . . . . . . . . . (2,883) (1,941) (5,952) (8,252)Income taxes . . . . . . . . . . . . . . . . . . . . . . . . . . . . . . . . . . . . . . . . . . — — (37) —
Net and comprehensive loss . . . . . . . . . . . . . . . . . . . . . . . . . . . . . . . . . (2,883) (1,941) (5,989) (8,252)Deficit, beginning of period . . . . . . . . . . . . . . . . . . . . . . . . . . . . . . . . . (77,860) (71,871) (71,871) (63,619)
Deficit, end of period . . . . . . . . . . . . . . . . . . . . . . . . . . . . . . . . . . . . . (80,743) (73,812) (77,860) (71,871)
Loss per share(1)
Basic and fully diluted . . . . . . . . . . . . . . . . . . . . . . . . . . . . . . . . . . . (0.10) (0.07) (0.21) (0.35)
9

Three Months Ended Fiscal Years EndedMay 31, February 28/29,
2009 2008 2009 2008
(amounts in C$ thousands, except for shareand per share amounts)
(unaudited) (unaudited) (audited) (audited)
Basic and diluted(2) weighted average number of shares outstanding . . . . . . 28,569,238 28,480,522 28,537,202 23,448,504
(1) Basic loss per share is calculated by dividing net loss by the weighted average number of Common Shares outstanding during theperiod. For all periods presented, the net loss available to shareholders equates to the net loss. The diluted loss per share does notdiffer from the basic loss per share as outstanding dilutive instruments are anti-dilutive.
(2) Excludes the effect of all options and warrants that are anti-dilutive for all periods presented.
Fiscal Years EndedThree Months EndedMay 31, 2009 February 28, 2009 February 29, 2008
C$ (thousands)(unaudited) (audited) (audited)
Consolidated Balance Sheet Data:Cash and cash equivalents . . . . . . . . . . . . . . . . . . . . . 21,975 8,504 1,551Short-term investments . . . . . . . . . . . . . . . . . . . . . . . — 14,994 31,908Total assets . . . . . . . . . . . . . . . . . . . . . . . . . . . . . . . . 49,818 51,828 59,815Total debt (line of credit) . . . . . . . . . . . . . . . . . . . . . . 586 641 550Total liabilities . . . . . . . . . . . . . . . . . . . . . . . . . . . . . . 9,153 8,533 11,318Total liabilities and shareholders’ equity . . . . . . . . . . . 49,818 51,828 59,815
10

RISK FACTORS
An investment in the Offered Shares involves a number of risks. In addition to the other informationcontained in this short form prospectus, prospective purchasers should give careful consideration to thefollowing risk factors. Any of the matters highlighted in these risk factors could have a material adverse effect onour business, results of operations and financial condition, causing an investor to lose all, or part of, its, his orher investment.
The risks and uncertainties described below are not the only ones we face. Additional risks anduncertainties that we are not aware of or focused on, or that we currently deem to be immaterial, may alsoimpair our business operations and cause the trading price of the Offered Shares to decline.
Risks Related to Our Business and Industry
Our growth is dependent on the development and growth of the market for high-capacity wireless communicationsservices.
The market for high-capacity wireless communications services is still emerging and the market demand,price sensitivity and preferred business model to deliver these services remain highly uncertain. Our growth isdependent on, among other things, the size and pace at which the market for high-capacity wirelesscommunications services develops. If this market does not gain widespread acceptance and declines, remainsconstant or grows more slowly than anticipated, we may not be able to grow or sustain our growth, and ouroverall revenues and operating results will be materially and adversely affected.
In particular, our products are optimized for service providers that wish to deploy networks based onemerging 3G+ technologies such as HSPA, WiMAX and LTE. There can be no assurance that there will besufficient end-user demand for services offered using these emerging network technologies. Other competingtechnologies may be developed that have advantages over these emerging technologies, and service providers ofother networks based on these competing technologies may be able to deploy their networks at a lower cost,which may allow these service providers to compete more effectively.
Service providers that do choose to deploy emerging technologies for high-capacity wirelesscommunications services are also dependent on suppliers other than us in order to build and operate theirnetworks. If these third party suppliers are not successful in developing the network components, subscriberequipment and other equipment required by our customers in a timely and cost-efficient manner, networkdeployments by our customers and demand for our products will be materially and adversely affected.
We rely on a small number of customers for a large percentage of our revenue.
We have been dependent, and expect that in at least the next twelve months we will continue to bedependent, on a key customer, Clearwire. Clearwire represented approximately 77% of our sales for the threemonths ended August 31, 2009 (three months ended August 31, 2008 — 8%) 52% of our sales for the threemonths ended May 31, 2009 (three months ended May 31, 2008 — 39%), 19% of our sales for the fiscal yearended February 28, 2009, and 27% of our sales for the fiscal year ended February 29, 2008. We supply productsto our customers, including Clearwire, on a purchase order basis and, accordingly, customers are under noongoing obligation to buy our products. Our relationships with our customers are generally not exclusive. To theextent that certain of our customers regard us as a critical supplier of equipment, such customers may choose todevelop alternative sources of supply, such as our competitors, in order to mitigate actual or perceived risk totheir own supply chains. If one or more of our customers discontinues its relationship with us for any reason, orreduces or postpones current or expected purchases of our products or services, our business, results ofoperations and financial condition could be materially adversely affected.
We face intense competition from several competitors and if we do not compete effectively with these competitors, ourrevenue may not grow and could decline.
We have experienced, and expect to continue to experience, intense competition from a number ofcompanies. We compete principally with Harris Stratex Networks, Inc. and Ceragon Networks Ltd. Our existingand/or new competitors may announce new products, services or enhancements that better meet the needs of
11

customers or changing industry standards or deeply discount the price of their products. Further, newcompetitors or alliances among competitors could emerge. Increased competition may cause price reductions,reduced gross margins and loss of market share, any of which could have a material adverse effect on ourbusiness, financial condition and results of operations. Our competitors may also establish or strengthenco-operative relationships with sales channel partners or other parties with whom we have strategicrelationships, thereby limiting our ability to promote our products.
Many of our competitors and potential competitors have significantly greater financial, technical, marketingand/or service resources than us and/or have greater geographical reach to existing and prospective customers.Many of these companies also have a larger installed base of products, longer operating histories or greatername recognition than we do. Some of our competitors have the ability to offer vendor financing to theircustomers which we do not currently have nor expect to have in the foreseeable future. Customers for ourproducts are particularly concerned that their suppliers will continue to operate and provide upgrades andmaintenance for their products over a long-term period. Our relatively small size and short operating historymay be considered negatively by current and prospective customers. In addition, our competitors may be able torespond more quickly than us to changes in end-user requirements and devote greater resources to theenhancement, promotion and sale of their products.
We face competition from indirect competitors.
In addition to direct competitors, we face competition from broadband technologies that compete withwireless transmission. Our products compete to a certain extent with other high-speed communicationssolutions, including fiber optic lines, DSL, free space optics, low and medium capacity point-to-point radios andother wireless technologies. Some of these technologies utilize existing installed infrastructure and haveachieved significantly greater market acceptance and penetration than high-capacity broadband wirelesstechnologies. Our wireless products and many other wireless products require a direct line of sight betweenantennas, potentially limiting deployment options and the ability to deploy products in a cost-effective manner.In addition, customers may wish to use transmission frequencies for which we do not offer products and,therefore, such customers may turn to our competitors to fulfill their requirements. We expect to face increasingcompetitive pressures from both current and future technologies in the broadband backhaul market. In light ofthese factors, the market for broadband wireless solutions may fail to develop or may develop more slowly thanexpected. Any of these outcomes could have a material adverse effect on our business, results of operations andfinancial condition.
Our success depends on our ability to develop new products and enhance existing products.
The markets for our products are characterized by rapidly changing technology, evolving industry standardsand increasingly sophisticated customer requirements. The introduction of products embodying new technologyand the emergence of new industry standards can render our existing products obsolete and unmarketable andcan exert price pressures on existing products. Our success depends on our ability to anticipate and react quicklyto changes in technology or in industry standards and to successfully develop and introduce new, enhanced andcompetitive products on a timely basis. In particular, the continued acceptance and future success of our productofferings will depend on the capacity of those products to handle growing volumes of traffic, their reliability andsecurity, and their cost-effectiveness compared to competitive product offerings. We cannot give assurance thatwe will successfully develop new products or enhance and improve our existing products, that new products andenhanced and improved existing products will achieve market acceptance or that the introduction of newproducts or enhanced existing products by others will not render our products obsolete. Our inability to developproducts that are competitive in technology and price and that meet customer needs could have a materialadverse effect on our business, financial condition and results of operations. Accelerated product introductionsand short product life cycles require high levels of expenditure for research and development that couldadversely affect our operating results. Further, any new products that we develop could require longdevelopment and testing periods and may not be introduced in a timely manner or may not achieve the broadmarket acceptance necessary to generate significant revenue.
As we develop new products, our older products will reach the end of their lives. As we discontinue the saleof these older products, we must manage the liquidation of inventory, supplier commitments and customer
12

expectations. Part of our inventory may be written off, which would increase our cost of sales. In addition, wemay be exposed to inventory-related losses on inventories purchased by our contract manufacturers. If we areunable to properly manage the discontinuation of older products and secure customer acceptance of newproducts, our business, financial condition and results of operations could be materially and adversely affected.
We have a history of losses and cannot provide assurance that we will sustain profitability. If we fail to do so, ourshare price may decline.
We reported net losses of $10.724 million for our 2007 fiscal year, $8.252 million for our 2008 fiscal year,$5.989 million for our 2009 fiscal year and $2.883 million for the three months ended May 31, 2009. We expectour expenses will grow to support our revenue growth. We cannot provide assurance that we will be able tosustain profitability on a quarterly or annual basis. Our business strategies may not be successful. Our results ofoperations will be harmed if our revenue does not increase at a rate equal to or greater than increases in ourexpenses or if our revenue is insufficient for us to attain profitability. If we are not able to sustain profitability,our share price may decline and we may require additional financing, which may not be available.
Failure to manage our growth successfully may adversely impact our operating results.
The growth of our operations places a strain on managerial, financial and human resources. Our ability tomanage future growth will depend in large part upon a number of factors, including our ability to rapidly:
• build a network of channel partners to create an expanding presence in the evolving marketplace for ourproducts and services;
• build a sales team to keep customers and channel partners informed regarding the technical features,issues and key selling points of our products and services;
• attract and retain qualified technical personnel in order to continue to develop reliable and flexibleproducts and provide services that respond to evolving customer needs;
• develop support capacity for customers as sales increase, so that we can provide post-sales supportwithout diverting resources from product development efforts; and
• expand our internal management and financial controls significantly, so that we can maintain control overour operations and provide support to other functional areas as our number of personnel andsize increases.
Our inability to achieve any of these objectives could harm our business, financial condition and resultsof operations.
Our quarterly revenue and operating results can be difficult to predict and can fluctuate substantially.
Our revenue is difficult to forecast, is likely to fluctuate significantly and may not be indicative of our futureperformance from quarter to quarter. In addition, our operating results may not follow any past trends. Thefactors affecting our revenue and results, many of which are outside of our control, include:
• competitive conditions in our industry, including strategic initiatives by us or our competitors, newproducts or services, product or service announcements and changes in pricing policy by us or ourcompetitors;
• market acceptance of our products and services;
• our ability to maintain existing relationships and to create new relationships with channel partners;
• varying size, timing and contractual terms of orders for our products, which may delay the recognitionof revenue;
• the project based nature of deployments of our products;
• the discretionary nature of purchase and budget cycles of our customers and changes in their budgets for,and timing of, equipment purchases;
13

• strategic decisions by us or our competitors, such as acquisitions, divestitures, spin-offs, joint ventures,strategic investments or changes in business strategy;
• general weakening of the economy resulting in a decrease in the overall demand for telecommunicationsproducts and services or otherwise affecting the capital investment levels of service providers;
• timing of product development and new product initiatives; and
• the length and variability of the sales cycles for our products.
Because our quarterly revenue is dependent upon a relatively small number of transactions, even minorvariations in the rate and timing of conversion of our sales prospects into revenue could cause us to plan orbudget inaccurately, and those variations could adversely affect our financial results. Delays, reductions in theamount or cancellations of customers’ purchases would adversely affect our business, results of operations andfinancial condition.
A general global economic downturn may negatively affect our customers and their ability to purchase our products.A downturn may decrease our revenues and increase our costs and may increase credit risk with our customers andimpact our ability to collect accounts receivable and recognize revenue.
Disruptions in the financial markets have had and may continue to have an adverse effect on the U.S. andworld economy, which could negatively impact business spending patterns. Current tightening of credit infinancial markets could adversely affect the ability of our customers and suppliers to obtain financing forsignificant purchases and operations and could result in a decrease in or cancellation of orders for our products.
The current financial market conditions and the extent of the accompanying economic downturn mayexacerbate some of the other risks that affect our business, results of operations and financial condition. Atighter credit market for consumer, business, and service provider spending may have several adverse effects,including reduced demand for our products, increased price competition or deferment of purchases and ordersby our customers. Additional effects may include increased demand for customer finance, difficulties incollection of accounts receivable and increased risk of counterparty failures.
We may be negatively affected by economic and geopolitical uncertainty.
The market for our products depends on economic and geopolitical conditions affecting the broadermarket. Economic conditions globally are beyond our control. In addition, acts of terrorism and the outbreak ofhostilities and armed conflicts between countries can create geopolitical uncertainties that may affect the globaleconomy. Downturns in the economy or geopolitical uncertainties may cause our customers to delay or cancelprojects, reduce their overall capital or operating budgets or reduce or cancel orders for our products, whichcould have a material adverse effect on our business, results of operations and financial condition.
We may be adversely affected by currency fluctuations.
A substantial portion of our revenue is earned in U.S. dollars, but a substantial portion of our operatingexpenses are incurred in Canadian dollars. Fluctuations in the exchange rate between the U.S. dollar and othercurrencies, such as the Canadian dollar, may have a material adverse effect on our business, financial conditionand operating results. We do not currently engage in transactional hedging schemes but we do attempt to hedgeor mitigate the risk of currency fluctuations by actively monitoring and managing our foreign currency holdingsrelative to our foreign currency expenses.
We may be adversely affected by credit risk.
We are exposed to credit risk for accounts receivable in the event that counterparties do not meet theirobligations. We attempt to mitigate our credit risk to the extent possible by performing credit reviews. Botheconomic and geopolitical uncertainty can influence the ultimate collectability of these receivable amounts.Failure to collect outstanding receivables could have a material adverse effect on our business, results ofoperations and financial condition.
14

If we are required to change our pricing models to compete successfully, our margins and operating results may beadversely affected.
The intensely competitive market in which we conduct our business may require us to reduce our prices. Ifour competitors offer deep discounts on certain products or services in an effort to recapture or gain marketshare or to sell other products and services, we may be required to lower our prices or offer other favorableterms to compete successfully. Any such changes would reduce our margins and could adversely affect ouroperating results.
If sufficient radio spectrum is not allocated for use by our products, or we fail to obtain regulatory approval for ourproducts, our ability to market our products may be restricted.
Radio communications are subject to regulation in North America, Europe and other jurisdictions in whichwe sell our products. Generally, our products must conform to a variety of national and international standardsand requirements established to avoid interference among users of radio frequencies and to permit theinterconnections of telecommunications equipment. In addition, our products are affected by the allocation andlicensing (by auction or other means) of radio spectrum by governmental authorities. Such governmentalauthorities may not allocate or license sufficient radio spectrum for use by prospective customers of ourproducts. Historically, in many developed countries, the lack of availability of commercial radio spectrum or thefailure by governments to license that spectrum has inhibited the growth of wireless telecommunicationsnetworks.
In order to sell our products in any given jurisdiction, we must obtain regulatory approval for our products.Each jurisdiction in which we market our products has its own rules relating to such approval. Products thatsupport emerging wireless telecommunications services can be marketed in a jurisdiction only if permitted bysuitable radio spectrum allocations and regulations, and the process of establishing new regulations is complexand lengthy.
Any failure by regulatory authorities to allocate suitable and sufficient radio spectrum to potentialcustomers in a timely manner could negatively impact demand for our products and may result in the delay orloss of potential orders for our products. In addition, any failure by us to obtain or maintain the properregulatory approvals for our products could have a material adverse effect on our business, financial conditionand results of operations.
If our current or prospective customers are unable to secure a license for applicable radio spectrum, the customermay not be permitted to deploy a wireless network using our products.
Our products operate primarily on government-licensed radio frequencies. Users of our products musteither have a spectrum license to operate and provide communications services in the applicable frequency ormust acquire the right to do so from another license holder. Obtaining such licenses is a lengthy process and issubject to significant uncertainties regarding timing and availability. There can be no assurance as to when anygovernment may license radio spectrum or as to whether our customers will be successful in securing,maintaining or renewing any necessary spectrum licenses.
In addition, if a license holder of such radio spectrum files for liquidation, dissolution or bankruptcy,substantial time could pass before its licenses are transferred, cancelled, reissued or made available by theapplicable government licensing authority. Until the licenses are transferred, cancelled, reissued or otherwisemade available, other operators may be precluded from operating in such licensed spectrum, which coulddecrease demand for our products. In addition, if the authorities choose to revoke licenses for certain radiofrequencies, demand for our products may decrease as well.
Changes in government regulation, or industry standards, may limit the potential markets for our products. We mayneed to modify our products, which may increase our product costs and adversely affect our ability to becomeprofitable.
Radio frequencies are subject to extensive regulation both nationally and internationally. The emergence orevolution of regulations and industry standards for wireless products, through official standards committees or
15

widespread use by operators, could require us to modify our systems. This may be expensive andtime-consuming. Each country has different regulations and procedures for the approval of wirelesscommunications equipment and the uses of radio spectrum in association with that equipment. If new industrystandards emerge that we do not anticipate, our products could be rendered obsolete.
Our ability to sell products and services is dependent upon our establishing and maintaining relationships withchannel partners.
We are dependent upon our ability to establish and develop new relationships and to build on existingrelationships with channel partners, which we rely on to sell our current and future products and services. Wecannot provide assurance that we will be successful in maintaining or advancing our relationships with channelpartners. In addition, we cannot provide assurance that our channel partners will act in a manner that willpromote the success of our products and services. Failure by channel partners to promote and support ourproducts and services could adversely affect our business, results of operations and financial condition.
Some channel partners also sell products and services of our competitors. If some of our competitors offertheir products and services to our channel partners on more favorable terms or have more products or servicesavailable to meet their needs, there may be pressure on us to reduce the price of our products or services orincrease the commissions payable to channel partners, failing which our channel partners may stop carrying ourproducts or services or de-emphasize the sale of our products and services in favor of the products and servicesof our competitors.
We rely primarily upon two outsourced manufacturers and we are exposed to the risk that these manufacturers willnot be able to satisfy our manufacturing needs on a timely basis.
We do not have any internal manufacturing capabilities and we rely upon a small number of outsourcedmanufacturers to manufacture our products. Substantially all of our products are currently manufactured byBreconRidge Corporation (‘‘BreconRidge’’) and Plexus Corp. (‘‘Plexus’’). See ‘‘Our Business — Manufacturingand Supply Chain Management’’. Our ability to ship products to our customers could be delayed or interruptedas a result of a variety of factors relating to our outsourced manufacturers, including:
• our outsourced manufacturers not being required to manufacture our products on a long-term basis inany specific quantity or at any specific price;
• early termination of, or failure to renew, contractual arrangements;
• our failure to effectively manage our outsourced manufacturer relationships;
• our outsourced manufacturers experiencing delays, disruptions or quality control problems in theirmanufacturing operations;
• lead-times for required materials and components varying significantly and being dependent on factorssuch as the specific supplier, contract terms and the demand for each component at a given time;
• underestimating our requirements, resulting in our outsourced manufacturers having inadequatematerials and components required to produce our products, or overestimating our requirements,resulting in charges assessed by the outsourced manufacturers or liabilities for excess inventory, each ofwhich could negatively affect our gross margins; and
• the possible absence of adequate capacity and reduced control over component availability, qualityassurances, delivery schedules, manufacturing yields and costs.
Although we believe that BreconRidge and Plexus have sufficient economic incentive to perform ourmanufacturing, the resources devoted to these activities by BreconRidge and Plexus are not within our control,and there can be no assurance that manufacturing problems will not occur in the future. Insufficient supply or aninterruption or stoppage of supply from BreconRidge and Plexus or our inability to obtain additionalmanufacturers when and if needed, could have a material adverse effect on our business, results of operationsand financial condition.
16
If any of our outsourced manufacturers are unable or unwilling to continue manufacturing our products inrequired volumes and quality levels, we will have to identify, qualify, select and implement acceptable alternativemanufacturers, which would likely be time consuming and costly. In addition, an alternate source may not beavailable to us or may not be in a position to satisfy our production requirements at commercially reasonableprices and quality. Therefore, any significant interruption in manufacturing would result in us being unable todeliver the affected products to meet our customer orders, which could have a material adverse effect on ourbusiness, results of operations and financial condition.
We rely on our suppliers to supply components for our products and we are exposed to the risk that these supplierswill not be able to supply components on a timely basis, or at all.
The manufacturers of our products depend on obtaining adequate supplies of components on a timely basis.We source several key components used in the manufacture of our products from a limited number of suppliers,and in some instances, a single source supplier.
In addition, these components are often acquired through purchase orders and we may have no long-termcommitments regarding supply or pricing from our suppliers. Lead-times for various components may lengthen,which may make certain components scarce. As component demand increases and lead-times become longer,our suppliers may increase component costs. We also depend on anticipated product orders to determine ourmaterials requirements. Lead-times for limited-source materials and components can be as long as six months,vary significantly and depend on factors such as the specific supplier, contract terms and demand for acomponent at a given time. From time to time, shortages in allocations of components have resulted in delays infilling orders. Currently, the global recession has caused some component suppliers to reduce inventories andproduction. Shortages and delays in obtaining components in the future could impede our ability to meetcustomer orders. Any of these sole source or limited source suppliers could stop producing the components,cease operations entirely, or be acquired by, or enter into exclusive arrangements with, our competitors. As aresult, these sole source and limited source suppliers may stop selling their components to our outsourcedmanufacturers at commercially reasonable prices, or at all. Any such interruption, delay or inability to obtainthese components from alternate sources at acceptable prices and within a reasonable amount of time wouldadversely affect our ability to meet scheduled product deliveries to our customers and reduce margins realized.
Alternative sources of components are not always available or available at acceptable prices. In addition, werely on, but have limited control over, the quality, reliability and availability of the components supplied to it. Ifwe cannot manufacture our products due to a lack of components, or are unable to redesign our products withother components in a timely manner, our business, results of operations and financial condition could beadversely affected.
If our intellectual property is not adequately protected, we may lose our competitive advantage.
Our success depends in part on our ability to protect our rights in our intellectual property. We rely onvarious intellectual property protections, including patents, copyright, trade-mark and trade secret laws andcontractual provisions, to preserve our intellectual property rights. Our present protective measures may not beadequate or enforceable to prevent misappropriation of our technology or to prevent a third party fromdeveloping the same or similar technology. Despite our precautions, it may be possible for third parties to obtainand use our intellectual property without our authorization. Policing unauthorized use of intellectual property isdifficult, and some foreign laws do not protect proprietary rights to the same extent as the laws of Canada or theUnited States.
To protect our intellectual property, we may become involved in litigation, which could result in substantialexpenses, divert management’s attention, cause significant delays, materially disrupt the conduct of our businessor adversely affect our revenue, financial condition and results of operations.
Our business may be harmed if we infringe on the intellectual property rights of others.
Our commercial success depends, in part, upon us not infringing intellectual property rights owned byothers. A number of our competitors and other third parties have been issued patents and may have filed patentapplications or may obtain additional patents and proprietary rights for technologies similar to those used by us
17
in our products. Some of these patents may grant very broad protection to the owners of the patents. We cannotdetermine with certainty whether any existing third party patents or the issuance of any third party patents wouldrequire us to alter our technology, obtain licenses or cease certain activities. We may become subject to claims bythird parties that our technology infringes their intellectual property rights due to the growth of products in ourtarget markets, the overlap in functionality of these products and the prevalence of products. Aggressive patentlitigation is not uncommon in our industry and can be disruptive. We may become subject to these claims eitherdirectly or through indemnities against these claims that we routinely provide to our customers and channelpartners. In some of our agreements we do not have a limit on our liability for such claims and therefore asuccessful claim could result in significant liability to us.
In addition, we have received, and may receive in the future, claims from third parties assertinginfringement and other related claims. Litigation may be necessary to determine the scope, enforceability andvalidity of such third party proprietary rights or to establish our proprietary rights. Some of our competitorshave, or are affiliated with companies having, substantially greater resources than us and these competitors maybe able to sustain the costs of complex intellectual property litigation to a greater degree and for a longer periodof time than us. Regardless of their merit, any such claims could:
• be time consuming to evaluate and defend;
• result in costly litigation;
• cause product shipment delays or stoppages;
• divert the attention and focus of our management and technical personnel away from our business;
• subject us to significant damages, noting that in the United States plaintiffs may be entitled to trebledamages if intellectual property infringement is found to be wilful;
• subject us to significant other liabilities, including liability to indemnify end-customers pursuant tostandard contractual indemnities entered into by us in favor of those customers;
• require us to enter into costly royalty or licensing agreements; and
• require us to modify, rename or stop using the infringing technology.
We may be prohibited from developing or commercializing certain technologies and products unless weobtain a license from a third party. There can be no assurance that we will be able to obtain any such license oncommercially favorable terms, or at all. If we do not obtain such a license, our business, results of operations andfinancial condition could be materially adversely affected and we could be required to cease related businessoperations in some markets and to restructure our business to focus on operations in other markets.
Moreover, license agreements with third parties may not include all intellectual property rights that may beissued to or owned by the licensors, and future disputes with these parties are possible. Current or futurenegotiations with third parties to establish license or cross license arrangements, or to renew existing licenses,may not be successful and we may not be able to obtain or renew a license on satisfactory terms or at all. If wecannot obtain required licenses, or if existing licenses are not renewed, litigation could result.
If we lose our rights to use software we currently license from third parties, we could be forced to seek alternativetechnology, which could increase our operating expenses and could adversely affect our ability to compete.
We license certain software used in our products from third parties, generally on a non-exclusive basis. Thetermination of any of these licenses, or the failure of the licensors to adequately maintain or update theirsoftware, could delay our ability to ship our products while we seek to implement alternative technology offeredby other sources and could require significant unplanned investments on our part if we are forced to developalternative technology internally. In addition, alternative technology may not be available to us on commerciallyreasonable terms from other sources. In the future, it may be necessary or desirable to obtain other third partytechnology licences relating to one or more of our products or relating to current or future technologies toenhance our product offerings. There is a risk that we will not be able to obtain licensing rights to the neededtechnology on commercially reasonable terms, or at all.
18

We have a lengthy and variable sales cycle.
It is difficult for us to forecast the timing of revenue from sales of our products because our customerstypically invest substantial time, money and other resources researching their needs and available competitivealternatives before deciding to purchase our products and services. Typically, the larger the potential sale, themore time, money and other resources will be invested by customers. As a result, it may take many months afterour first contact with an end-customer before a sale can actually be completed. In addition, we rely on ourchannel partners to sell our products to customers and, therefore, our sales efforts are vulnerable to delays atboth the channel partner and the end-customer level.
During these long sales cycles, events may occur that affect the size or timing of the order or even cause itto be cancelled, including:
• purchasing decisions may be postponed, or large purchases reduced, during periods of economicuncertainty;
• we or our competitors may announce or introduce new products or services;
• our competitors may offer lower prices; or
• budget and purchasing priorities of customers may change.
If these events were to occur, sales of our products or services may be cancelled or delayed, which wouldreduce our revenue.
Our ability to recruit and retain management and other qualified personnel is crucial to our ability to develop,market, sell and support our products and services.
We depend on the services of our key technical, sales, marketing and management personnel. The loss ofany of these key persons could have a material adverse effect on our business, results of operations and financialcondition. Our success is also highly dependent on our continuing ability to identify, hire, train, motivate andretain highly qualified technical, sales, marketing and management personnel. Competition for such personnelcan be intense, and we cannot provide assurance that we will be able to attract or retain highly qualifiedtechnical, sales, marketing and management personnel in the future. Stock options comprise a significantcomponent of our compensation of key employees, and if our share price declines, it may be difficult to recruitand retain such individuals. In addition, the number of stock options available for grant under our Stock OptionPlan (as defined herein) is limited (see ‘‘Options and Warrants to Purchase Securities — Equity CompensationPlans’’) and even though the number of stock options available for grant will increase as a result of this Offering,the size of our option pool may limit our ability to use equity incentives as a means to recruit and retain keyemployees. Our inability to attract and retain the necessary technical, sales, marketing and managementpersonnel may adversely affect our future growth and profitability. It may be necessary for us to increase thelevel of compensation paid to existing or new employees to a degree that our operating expenses could bematerially increased. We do not currently maintain corporate life insurance policies on key employees.
Our international sales and operations subject us to additional risks that can adversely affect our operating results.
Our business model is to sell our products across the world in jurisdictions where service providers arebuilding new communications networks or expanding existing networks, and our sales and operations are,therefore, global in nature. Our current and future international operations subject us to a variety of risks,including:
• difficulty managing and staffing foreign offices and the increased travel, infrastructure and legalcompliance costs associated with multiple international locations;
• difficulties in enforcing contracts, collecting accounts receivable and longer payment cycles, especially inemerging markets;
• the need to localize our products and licensing programs for international customers;
• tariffs and trade barriers and other regulatory or contractual limitations on our ability to sell or developour products in certain foreign markets;
19

• increased exposure to foreign currency exchange rate risk; and
• reduced protection for intellectual property rights in some countries.
Because our products are sold and marketed in different countries, the products must function in and meetthe requirements of many different environments and be compatible with various systems and products. If ourproducts fail to meet these requirements, this could negatively impact on sales and have a material adverse effecton our business, results of operation and financial condition.
We are subject to government regulations concerning the sale and export of our products and our failure or inabilityto comply with these regulations could materially restrict our operations and subject us to penalties.
As discussed above, our sales and operations are global in nature and we must comply with applicableexport control and economic sanctions laws. Canadian export control and economic sanctions laws govern anyinformation, products or materials that we ship from Canada or otherwise provide to non-Canadian persons. OnMay 27, 2009 and August 14, 2009, we filed a ‘non-compliance report’ with Canada’s Export and ImportControls Bureau (‘‘EICB’’) relating to our inadvertent non-compliance with the requirement to obtain an exportpermit covering certain of our products and a number of export sales and electronic transfers of these productssince October 2004. While there can be no assurance that the Government of Canada will not exercise itsdiscretion to impose penalties or impose conditions with respect to the issuance of new export permits in respectof the past acts of non-compliance, since the time we first reported past non-compliance on May 27, 2009, theEICB has issued new export permits to us with standard conditions and has invited us to apply for an exceptionalbroad-based permit to cover our future exports. We understand that the EICB accepts applications for broad-based permits as a policy matter only from exporters in whom the EICB has confidence in terms of compliance.Nevertheless, and regardless of its past practice, if the EICB elects to decline the issuance of further exportpermits to us or otherwise conditions such permits further based on its final pending assessment of ournon-compliance reports, our ability to continue to export our products could be restricted which could materiallydisrupt the conduct of our business or adversely affect our revenue, financial condition and results of operations.
Finally, although we are a Canadian company, certain of our business transactions are also governed byU.S. export control requirements, including the export of items containing more than de minimis amounts ofU.S. controlled content. While we are not aware of any instances of non-compliance with U.S. licensingrequirements for hardware or technology exports made during the past five years, an internal review has raisedquestions concerning certain past internet-based transfers of software (some of which apparently containedsmall amounts of low-level encryption for networking), and we have filed a voluntary disclosure with theU.S. Department of Commerce so it can determine whether any past electronic transfers resulted innon-compliance. While there can be no assurance that the U.S. Department of Commerce will not exercise itsdiscretion to impose penalties in the event we are found to have been non-compliant, we have no reason tobelieve, based on a review of past enforcement actions by the U.S. Department of Commerce, that any likelyenforcement outcome would present a material risk to our ongoing business operations. We remain committedto compliance with all applicable export controls and sanctions laws, both in Canada and in the United States.
We may be unable to identify and complete acquisitions. Acquisitions could divert management’s attention andfinancial resources, may negatively affect our operating results and could cause significant dilution to ourshareholders.
In the future, we may engage in selective acquisitions of products or businesses that we believe arecomplementary to our products or business. There is a risk that we will not be able to identify suitableacquisition candidates available for sale at reasonable prices, complete any acquisition, or successfully integrateany acquired product or business into our operations. We are likely to face competition for acquisitioncandidates from other parties including those that have substantially greater available resources. Acquisitionsmay involve a number of other risks, including:
• diversion of management’s attention;
• disruption to our ongoing business;
• failure to retain key acquired personnel;
20

• difficulties in integrating acquired operations, technologies, products or personnel;
• unanticipated expenses, events or circumstances;
• assumption of disclosed and undisclosed liabilities;
• inappropriate valuation of the acquired in-process research and development, or the entire acquiredbusiness; and
• difficulties in maintaining customer relations.
If we do not successfully address these risks or any other problems encountered in connection with anacquisition, the acquisition could have a material adverse effect on our business, results of operations andfinancial condition. Problems with an acquired business could have a material adverse effect on our performanceor our business as a whole. In addition, if we proceed with an acquisition, our available cash may be used tocomplete the transaction, diminishing our liquidity and capital resources, or shares may be issued which couldcause significant dilution to our existing shareholders.
Defects in our products could result in significant costs to us and could impair our ability to sell our products.
Our products are complex and, accordingly, they may contain defects or errors, particularly when firstintroduced or as new versions are released. We may not discover such defects or errors until after a product hasbeen released and used by our end-customers. Defects and errors in our products could materially and adverselyaffect our reputation, result in significant costs to us, delay planned release dates and impair our ability to sellour products in the future. The costs we incur correcting any product defects or errors may be substantial andcould adversely affect our operating margins. While we plan to continually test our products for defects anderrors and work with customers through our post-sales support services to identify and correct defects anderrors, defects or errors in our products may be found in the future.
If a successful product liability claim were made against us, our business could be seriously harmed.
Our agreements with our customers typically, although not always, contain provisions designed to limit ourexposure to potential product liability claims. Despite this, it is possible that these limitation of liabilityprovisions may not be effective as a result of existing or future laws or unfavorable judicial decisions. We havenot experienced a material product liability claim to date; however, the sale and support of our products mayentail the risk of those claims, which are likely to be substantial in light of the use of our products in criticalapplications. A successful product liability claim could result in significant monetary liability to us and couldseriously harm our business.
There may be health and safety risks relating to wireless products.
In recent years, there has been publicity regarding the potentially negative direct and indirect health andsafety effects of electromagnetic emissions from cellular telephones and other wireless equipment sources,including allegations that these emissions may cause cancer. Our wireless communications products emitelectromagnetic radiation. Health and safety issues related to our products may arise that could lead to litigationor other actions against us or to additional regulation of our products. We may be required to modify ourtechnology and may not be able to do so. We may also be required to pay damages that may reduce ourprofitability and adversely affect our financial condition. Even if these concerns prove to be baseless, theresulting negative publicity could affect our ability to market our products and, in turn, could harm our businessand results of operations.
Risks relating to the Offering and our Share Capital
The trading price of our Common Shares has been, and may continue to be, subject to large fluctuations.
Our outstanding Common Shares are listed on the TSX and the TSX has conditionally approved the listingof the Treasury Shares on the TSX. The Treasury Shares and our outstanding Common Shares (including theSecondary Shares) have been conditionally aproved for listing on the NASDAQ Global Market. Listing will besubject to our fulfillment of the requirements of the TSX and NASDAQ, respectively, on or before
21

December 23, 2009. The trading price of our Common Shares has been, and may continue to be, subject to largefluctuations and, therefore, the value of any of the Offered Shares may also fluctuate significantly, which mayresult in losses to investors. The trading price of our Common Shares may increase or decrease in response to anumber of events and factors, including:
• low trading volumes;
• actual or anticipated fluctuations in our results of operations;
• changes in estimates of our future results of operations by us or securities analysts;
• announcement of technological innovations or new products or services by us or our competitors;
• changes affecting the communications industry; and
• other events and factors, including the risk factors identified or incorporated by reference in this shortform prospectus.
Listing our Common Shares and the Offered Shares on the NASDAQ Global Market in addition to theTSX may increase share price volatility on the TSX and also result in volatility of the trading price on NASDAQbecause trading will be split between the two markets, resulting in less liquidity on both exchanges. In addition,different liquidity levels, volume of trading, currencies and market conditions on the two exchanges may result indifferent prevailing trading prices.
Securities class action litigation often has been brought against companies following periods of volatility inthe market price of their securities. We may in the future be the target of similar litigation. Securities litigationcould result in substantial costs and damages and divert management’s attention and resources, which couldadversely affect our business. Any adverse determination in litigation against us could also subject us tosignificant liabilities.
Our Common Shares have no prior trading history in the United States, and an active market may not develop.
Our Common Shares are currently listed on the TSX but are not listed on any United States stock exchangeor quoted on any United States quotation system. Accordingly, prior to the Offering, there has been no publicmarket in the United States for our Common Shares. The initial United States public Offering price for theOffered Shares may bear no relationship to the price at which the Common Shares will trade on the completionof the Offering. The price of the Common Shares may be lower than the Offering price. In addition, because theliquidity and trading patterns of securities listed on the TSX may be substantially different from those ofsecurities quoted on NASDAQ, historical trading prices may not be indicative of the prices at which ourCommon Shares will trade in the future on NASDAQ.
Although our outstanding Common Shares and the Offered Shares have been conditionally approved forlisting on the NASDAQ Global Market, an active trading market for our Common Shares may never develop orbe sustained in the United States following the Offering. On January 5, 2009, we cancelled the admission of ourCommon Shares to trading on the Alternative Investment Market operated by the London Stock ExchangeGroup plc (‘‘AIM’’), in part because low trading volumes did not justify continued admission. If an active marketfor our Common Shares does not develop, it may be difficult for United States residents to sell the OfferedShares they purchase in the Offering without depressing the market price for the shares, or at all.
As a foreign private issuer, we are subject to different U.S. securities laws and rules than a domestic U.S. issuer,which may limit the information publicly available to our shareholders.
DragonWave is a ‘‘foreign private issuer’’ under applicable U.S. federal securities laws and, therefore, weare not required to comply with all the periodic disclosure and current reporting requirements of theUnited States Securities and Exchange Act of 1934, as amended (the ‘‘Exchange Act’’) and related rules andregulations. As a result, we do not file the same reports that a U.S. domestic issuer would file with the SEC,although we will be required to file or furnish to the SEC the continuous disclosure documents that we arerequired to file in Canada under Canadian securities laws. In addition, our officers, directors, and principalshareholders are exempt from the reporting and ‘‘short swing’’ profit recovery provisions of Section 16 of theExchange Act. Therefore, our shareholders may not know on as timely a basis when our officers, directors and
22
principal shareholders purchase or sell their Common Shares, as the reporting deadlines under thecorresponding Canadian insider reporting requirements are longer. In addition, as a foreign private issuer weare exempt from the proxy rules under the Exchange Act.
We may lose our foreign private issuer status in the future, which could result in significant additional costs andexpenses to us.
We may in the future lose our foreign private issuer status if a majority of our Common Shares are held inthe U.S. and we fail to meet the additional requirements necessary to avoid loss of foreign private issuer status.The regulatory and compliance costs to us under U.S. securities laws as a U.S. domestic issuer may besignificantly more than the costs incurred as a Canadian foreign private issuer eligible to use the MJDS. If weare not a foreign private issuer, we would not be eligible to use the MJDS or other foreign issuer forms andwould be required to file periodic and current reports and registration statements on U.S. domestic issuer formswith the SEC, which are more detailed and extensive than the forms available to a foreign private issuer. We mayalso be required to prepare our financial statements in accordance with U.S. GAAP. In addition, we may lose theability to rely upon exemptions from NASDAQ corporate governance requirements that are available to foreignprivate issuers. Further, if we engage in capital raising activities after losing foreign private issuer status, there isa higher likelihood that investors may require us to file resale registration statements with the SEC as acondition to any such financing.
The financial reporting obligations of being a public company in the U.S. will be expensive and time consuming,and will place significant additional demands on our management.
Prior to the consummation of the Offering, we have not been subject to public company reportingobligations in the U.S. The additional obligations of being a public company in the U.S. will require significantadditional expenditures and place additional demands on our management. In particular, Section 404 of theSarbanes-Oxley Act of 2002 and the SEC rules and regulations implementing Section 404 require an annualevaluation of our internal controls over financial reporting to be attested to by an independent auditing firm.Under current rules, we will be subject to these requirements beginning with the fiscal year ending February 28,2011. This process will increase our legal and financial compliance costs, and could make some activities moredifficult, time-consuming or costly. If an independent auditing firm is unable to provide us with an attestationand an unqualified report as to the effectiveness of our internal controls, investors could lose confidence in thereliability of our financial statements, which could result in a decrease in the value of our Common Shares.
An investor may be unable to bring actions or enforce judgments against us and certain of our directorsand officers.
DragonWave is incorporated under the laws of Canada, and our principal executive offices are located inCanada. A majority of our directors and officers, and our independent public accounting firm, reside principallyoutside of the United States and all or a substantial portion of our assets and the assets of these persons arelocated outside the United States. Consequently, it may not be possible for an investor to effect service ofprocess within the United States on us or those persons. Furthermore, it may not be possible for an investor toenforce judgments obtained in United States courts based upon the civil liability provisions of United Statesfederal securities laws or other laws of the United States against us or those persons.
We do not currently intend to pay any cash dividends on our Common Shares in the foreseeable future and,therefore, purchasers of Offered Shares may not be able to receive a return on their Offered Shares unless they sellthem at an amount greater than the Offering price.
We have never declared or paid any dividends on our Common Shares. We currently intend to retain anyfuture earnings to fund the development and growth of our business and do not anticipate paying any cashdividends in the foreseeable future. Any future determination to pay dividends will be at the discretion of ourboard of directors and will depend upon many factors, including our results of operations, capital requirementsand other factors as the board of directors deems relevant.
23

Our actual financial results may vary from our publicly disclosed forecasts.
Our actual financial results may vary from our publicly disclosed forecasts and these variations could bematerial and adverse. We periodically provide guidance on future financial results. Our forecasts reflectnumerous assumptions concerning our expected performance, as well as other factors that are beyond ourcontrol and which may not turn out to be correct. Although we believe that the assumptions underlying ourguidance and other forward-looking statements were and are reasonable when we make such statements, actualresults could be materially different. Our financial results are subject to numerous risks and uncertainties,including those identified throughout these risk factors and elsewhere in this short form prospectus and thedocuments incorporated by reference. See ‘‘Caution Regarding Forward-Looking Statements’’. If our actualresults vary from our announced guidance, the price of our Common Shares may decline, and such a declinecould be substantial. Except as required under applicable securities legislation, we do not undertake to updateany guidance or other forward-looking information we may provide, whether as a result of new information,future events or otherwise.
We believe that we are not currently a PFIC for U.S. federal income tax purposes, but this factual determination ismade annually and could change in the future.
We believe that we are not currently a ‘‘passive foreign investment company’’ (a ‘‘PFIC’’) for U.S. federalincome tax purposes. However, if we were a PFIC, or if we were to become a PFIC in future taxable years, thiscould result in material adverse U.S. federal income tax consequences for any investor who is a U.S. holder(as defined below under the heading ‘‘Certain United States Federal Income Tax Considerations forU.S. Holders’’) of Offered Shares, including having gains realized on the sale of the Offered Shares treated asordinary income rather than as capital gains, and having potentially punitive interest charges apply to those gainsas well as to certain other distributions made by us. Further, in the event we were to be or become a PFIC,certain non-corporate U.S. holders would not be eligible for the preferential tax rates on dividends paid byqualified foreign corporations, as discussed below under the heading ‘‘Certain United States Federal Income TaxConsiderations for U.S. Holders’’. For a more detailed discussion of the consequences of DragonWave beingclassified as a PFIC, including discussion of certain elections which, if available, could mitigate some of theadverse consequences described above, see below under the heading ‘‘Certain United States Federal Income TaxConsiderations for U.S. Holders — PFIC Rules’’.
U.S. purchasers are urged to consult their tax advisors with respect to the U.S. federal, state, local andnon-U.S. tax consequences of the acquisition, ownership, and disposition of the Offered Shares as may beapplicable to their particular circumstances.
The acquisition of, investment in and disposition of the Offered Shares has tax consequences.
A summary of material Canadian and United States tax considerations for certain types of purchasers of theOffered Shares is described under the heading ‘‘Certain Canadian Federal Income Tax Considerations forNon-Residents of Canada’’ and ‘‘Certain U.S. Federal Income Tax Considerations for U.S. Holders’’.Prospective investors also should be aware that the acquisition, holding and/or disposition of the Offered Sharesmay have additional tax consequences both in the United States and Canada that are not described herein.
Purchasers should consult their own tax advisors with respect to the tax consequences of the acquisition,ownership, and disposition of the Offered Shares as may be applicable to their particular circumstances.
Future sales of Common Shares by our existing shareholders could cause our share price to fall.
If our shareholders sell substantial amounts of our Common Shares in the public market, the market priceof the Common Shares could fall. The perception among investors that these sales will occur could also producethis effect. After this Offering, we will have 36,209,978 Common Shares outstanding (assuming the exercise ofthe Private Investor Warrants held by Enterprise Partners V, L.P. and Enterprise Partners VI, L.P.). All of theTreasury Shares we will issue in the Offering and all of our outstanding Common Shares will, subject toapplicable securities legislation, generally be immediately available for resale in the public markets with theexception of 2,019,959 Common Shares, or approximately 5.6% of our outstanding Common Shares after theOffering, which are currently restricted as a result of lock-up agreements but will be able to be sold after the
24
close of trading of the Common Shares on January 25, 2010. See ‘‘Plan of Distribution — Lock-UpAgreements’’.
We may require additional capital in the future and we cannot give any assurance that such capital will beavailable at all or available on terms acceptable to us and, if it is available, additional capital raised by us maydilute each shareholder’s ownership of our Common Shares.
We may need to raise additional funds through public or private debt or equity financings in order to:
• fund ongoing operations;
• take advantage of opportunities, including more rapid expansion of our business or the acquisition ofcomplementary products, technologies or businesses;
• develop new products; or
• respond to competitive pressures.
Any additional capital raised through the sale of equity will dilute each shareholder’s percentage ownershipof our Common Shares. Capital raised through debt financing would require us to make periodic interestpayments and may impose restrictive covenants on the conduct of our business. Furthermore, additionalfinancings may not be available on terms favourable to us, or at all. Our failure to obtain additional fundingcould prevent us from making expenditures that may be required to grow our business or maintainour operations.
Each purchaser will suffer immediate and substantial dilution due to this Offering.
The Offering price will significantly exceed the net tangible book value per share of our Common Shares.Accordingly, a purchaser of Offered Shares in this Offering will incur immediate and substantial dilution of his,her or its investment. If the outstanding options and warrants to purchase Common Shares are exercised,additional dilution will occur. In addition, the total number of options available for grant under our StockOption Plan will increase as a result of this Offering and if new stock options are granted and such stock optionsare exercised, additional dilution will occur. See ‘‘Options and Warrants to Purchase Securities’’.
Our management will have broad discretion over the use of the net proceeds from the sale of the Treasury Shares. Ifwe do not use the proceeds effectively to develop and grow our business, an investment in the Offered Sharescould suffer.
Our management has broad discretion in how it uses the net proceeds received by us from this Offering,and there can be no assurance that such proceeds will be used efficiently or effectively. We may spend theseproceeds in ways that do not increase our operating results or market value, which would adversely affect ourbusiness, results of operations and financial condition. While we currently anticipate that we will use the netproceeds of this Offering received by us as described under ‘‘Use of Proceeds’’, we may re-allocate the netproceeds as we determine necessary. Pending their use, we may invest the net proceeds from the Offering in amanner that does not produce income or that loses value.
Further, if we do not restrict our investment of a sufficient portion of the net proceeds from the sale of theTreasury Shares, pending their use, to investments that are not ‘‘investment securities’’ within the meaning of theUnited States Investment Company Act of 1940, we may inadvertently become subject to regulation as aninvestment company under that Act. If we do become subject to regulation as an investment company underUnited States Investment Company Act of 1940, the consequences to us would be material and adverse.
Certain Canadian laws could delay or deter a change of control.
The Investment Canada Act (Canada) subjects an acquisition of control of DragonWave by a non-Canadianto government review if the value of our assets as calculated pursuant to the legislation exceeds a thresholdamount. A reviewable acquisition may not proceed unless the relevant Minister is satisfied that the investment islikely to be a net benefit to Canada. This could prevent or delay a change of control and may eliminate or limitstrategic opportunities for shareholders to sell their Common Shares.
25

OUR BUSINESS
Overview
Founded in 2000, we are a leading provider of high-capacity Ethernet microwave equipment used inemerging IP networks. We design, develop, market and sell proprietary, carrier-grade microwave networkingequipment, or links, that wirelessly transmit broadband voice, video and other data between two points. OurEthernet microwave links, which are based on a native Ethernet platform, function as a wireless extension to anexisting fiber optic core telecommunications network. Our products principally perform the backhaul function ina communication service provider’s network, which is to connect high traffic points of aggregation such ashigh-capacity wireless base stations (3G+ wireless networks, including HSPA, WiMAX and LTE-based systems)and large ‘out of territory’ enterprises to nodes on the fiber optic core network. Additional applications for ourproducts include point-to-point transport applications in private networks, including municipal and enterpriseapplications. In our target markets, network traffic is shifting from legacy TDM (voice) traffic to IP-based trafficto improve network efficiency and enable IP-based services.
Our line of Ethernet microwave links is marketed under the Horizon trade name. Our Horizon product lineis carrier-grade and operates primarily in licensed spectrum bands to minimize interference. We also offer ourService Delivery Unit (SDU) solution product line of TDM-to-Ethernet multiplexer products based onpseudowire technology, which enables our native Ethernet links to support the network traffic generated byemerging converged services based on IP such as data access, VoIP, and video streaming, as well as legacyTDM services.
We believe that our Ethernet microwave links are an attractive alternative to other backhaul solutions suchas leased lines and fiber optic cable deployments. One of our principal technological advantages over our directcompetitors is that our products operate on a native Ethernet platform, and as such our equipment is designedto transport Ethernet directly rather than adapting Ethernet to TDM transport systems. As a result, ourproducts feature high efficiency, low latency and full support for critical Ethernet data transport features, suchas VLAN queuing and prioritization, flow control and jumbo packet support. In addition, our product designpermits automated assembly and testing which allows reduced lead time for product delivery. Our othercompetitive advantages include a patent-protected rapid link shutdown feature that enables the creation ofcarrier-grade networks featuring low-cost Ethernet networking.
We target principally the global wireless communications service provider market and, in particular, serviceproviders offering high-capacity wireless communication services, including 3G+ wireless service providers.These service providers offer high-speed digital communication services over wireless access networks, someemploying IP-based wireless network access. The markets addressed by these wireless service providers arecharacterized by significant growth in number of subscribers, coverage area, and bandwidth requirements persubscriber, as well as the need to reduce transmission costs. Each of these factors places increased pressure onbackhaul capacity, making backhaul the bottleneck in many wireless communications networks. The leased linealternative is not capable of being easily or readily scaled to meet the growing demand for backhaul capacity dueto infrastructure constraints. Against this backdrop, we believe that in many circumstances our Ethernetmicrowave backhaul solutions offer the most rapidly deployable and scalable alternative to deliver requiredcapacity in a manner that optimizes overall network performance and costs for service providers. We also targetother markets, including wireless extension of fixed-line networks to directly connect high-bandwidthend-customers to the core network, and private networks of large multi-site organizations such as Fortune500 enterprises, municipalities and government organizations.
We commenced commercial deployment of our products in 2002. At the end of our most recent fiscal year,we had shipped approximately 9,500 product units and our customer base included more than 250 customersworldwide in 56 countries. We shipped to 142 customers in our most recent fiscal year, of which 44% were inEurope, the Middle East and Africa, 47% were in North America, and 9% were in the rest of the world. Ourcustomers include Clearwire, which has launched the world’s most advanced mobile WiMAX deployment, aswell as Globalive, which has selected our products for deployment in Globalive’s North American 3G+ (HSPA)cellular network. Globalive has announced that it will market its wireless services in the Canadian market underthe brand name WIND.
26

We intend to build on our advanced technology and customer-focused platform to become the leadingprovider of Ethernet microwave links to the communications service provider, enterprise andmunicipal/government markets. See ‘‘Our Growth Strategy’’ and ‘‘Our Products’’ below.
Industry Overview
The global transmission of voice, video and other data among end-users relies on a communicationsnetwork infrastructure of fiber optic lines, which today forms the core of the global telecommunicationsnetwork. These fixed, high-traffic, high-speed lines connect nodes throughout the world and facilitate thetransmission of information between such nodes. To deliver voice, video and other data from the core of thenetwork to end-users, and from end-users to the core, such information is first transmitted from a node on thecore of the network to base stations and other aggregation points on the edge of the network, and reciprocallyfrom end-users to collection points on the edge of the network back to the core. This transmission ofinformation, or link, between a node on the core of the network and a base station or other collection point onthe edge of the network is referred to as the backhaul function. Information can be transmitted in the backhaulportion of the network by leased telecom lines, fiber optic cable, wireless link, or any combination of these andother less common technologies.
We believe that a bottleneck for transmission of voice, video and other data is now occurring on thebackhaul portion of mobile communications networks. The ABI Report estimates that global demand forbackhaul capacity will grow by almost five times from 2008 to 2014 (from 13.51 Tbps in 2008 to 66.49 Tbps in2014), representing a compound annual growth rate of 30%. We estimate that backhaul transport currentlyrepresents between 20% and 45% of a mobile wireless service provider’s operating expenses when using leasedservices, or up to 40% of the capital cost of building a new mobile wireless network. We also believe thatbackhaul bandwidth requirements in the core network rings are increasing from approximately 8 Mbps tosupport GSM or CDMA services to in excess of 1 Gbps to support WiMAX or LTE services. As wirelessnetworks increasingly shift from transmission of voice to transmission of more bandwidth-intensive dataapplications, including video, we believe that network traffic, and associated service provider costs, haveincreased and will continue to increase more rapidly than subscriber revenue. This makes controlling backhauland other costs relating to increased network traffic through the deployment of innovative technologies a crucialelement of the business case for wireless service providers and providers of network technologies. In this context,the ABI Report forecasts that microwave radio-based wireless networks will emerge by 2013 as the largestbackhaul capacity solution worldwide as compared to copper telecom lines (including TDM and Ethernet) andfiber optic networks. More specifically, Infonetics Research forecasts that Ethernet microwave will experiencethe highest growth rate as a backhaul technology and will represent in excess of 40% of all installed mobilebackhaul connections by 2013.
27

21SEP200919141613
Bandwidth Capacity for Backhaul Networks by Type
0
10
20
30
40
50
60
70
2008 2009 2010 2011 2012 2013 2014
Ban
dwid
th (
Tbp
s)
Copper Telecom Lines Fiber Optic Networks Wireless Links Other
Source: ABI Report
Principal Backhaul Solutions
The backhaul function within a telecommunications network can be addressed in a number of ways. Theprincipal backhaul technologies currently utilized are copper telecom lines, fiber optic cable, and wireless links.Many backhaul networks are comprised of a combination of these and other less common solutions. We believethat communications service providers and network operators generally have three principal objectives indeploying a backhaul network: meeting carrier-grade requirements, rapid deployment of service, and minimizationof overall data transport costs. In the current environment of rapidly growing demand for wireless communicationsservices generally, and more particularly for high-capacity 3G+ wireless services, these objectives are criticallyinfluenced by the scalability (ability to increase capacity in response to increased network traffic) of the backhaulsolution. The following is a summary of the chief advantages and disadvantages associated with the most commonsolutions to backhaul capacity constraints available to communications service providers.
Leased Telecom Lines:
Currently, many service providers address their backhaul requirements by leasing T1/E1 or DS3-basedcircuits, based on existing copper lines, from an incumbent local telecommunications exchange provider. This isknown as a ‘leased line’ solution, the benefits of which include low capital expenditure requirements and fastservice deployment (assuming the copper line infrastructure is in place), and economic efficiency for thedeployment of backhaul for 2G wireless services. The expense of leasing backhaul transmission lines, andconstraints in available network capacity for lease, are increasingly considered prohibitive for aggregated trafficlevels as subscriber numbers increase to critical levels and communications service providers deploy higher-bandwidth 3G+ wireless services. Moreover, often the only source of leased lines is a direct competitor.
New Build of Fiber Optic Cable:
A second solution for communications service providers to address their increasing backhaul requirementsis to construct their own system of fiber optic cables. New build of fibre optic infrastructure is highly reliable andcan provide a service provider with very high bandwidth capacity. However, building fiber optic infrastructure isa complex, expensive and multi-stage undertaking, involving planning and routing, obtaining local planning
28

23SEP200916475666
permits (which can be particularly difficult in urban locations), constructing subterranean ducts and channelsrequired for the cables (with resulting vehicular traffic disruption), and finally, installing and connecting thesystem. The construction of a new fiber optic network can therefore be costly and require a significant period oftime to deploy compared to other solutions, particularly if the cable must span long distances and/or approachhistorically or environmentally sensitive areas. The cost of building a fiber optic backhaul network typicallyincreases in direct proportion to the distance covered by the network, which means that fiber optic backhaullinks are generally most cost competitive with wireless links over short distances.
Wireless Links:
The third principal backhaul solution for communications service providers to address their increasingbackhaul requirements is the deployment of wireless links, to support either hub-and-spoke or ring/meshnetwork architectures. Wireless backhaul links are comprised of a variety of technology types using a range oflicensed and unlicensed radio spectrum.
Within the wireless links backhaul solutions category, there is an emerging technology referred to asEthernet microwave. Ethernet refers to a common packet-based method of networking computers in a local areanetwork increasingly being adapted to and utilized in a carrier network environment. Microwave refers tohigh-frequency radio waves used for point-to-point and omni directional communication of voice, data and videosignals. Microwave frequencies require direct ‘line of sight’ to operate, are typically licensed fromcommunications regulatory bodies, and are well suited for backhaul applications. Emerging Ethernet microwavetechnologies, such as our solutions, enable the rapid deployment of high-capacity, carrier-grade Ethernetbackhaul networks that cost-effectively meet the backhaul scaling requirements of communications serviceproviders supporting critical subscriber levels and/or deploying higher-bandwidth 3G+ wireless services.
According to a report dated May 2009 prepared by Infonetics Research titled ‘‘Mobile Backhaul Equipmentand Services Biannual Worldwide and Regional Market Size and Forecasts’’ (the ‘‘Infonetics Report’’), theprimary technology trend of the mobile backhaul market is the transition from TDM to IP/Ethernet and thatEthernet microwave is leading the new mobile backhaul connections by technology and will continue to leadthrough 2013 at which time Ethernet microwave will be the dominant mobile backhaul technology with a shareof installed connections in excess of 40%.
Other PDH/SDH microwave Ethernet microwave SONET/SDH Ethernet copper and fiber ATM over PDH PDH
Technology MixNumber of New Connections
CY11
19%27%
35%
0%
10%
20%
30%
40%
50%
60%
70%
80%
90%
100%
7% 12%
42%
-
1,400,000
1,200,000
1,000,000
800,000
600,000
400,000
200,000
CY08 CY09 CY10 CY11 CY12 CY13 CY08 CY09 CY10 CY11 CY12 CY13
Num
ber
of N
ew C
onne
ctio
ns
Pro
port
ion
of W
orld
wid
e In
stal
led
Con
nect
ions
Source: Infonetics Report
29

Due to the fact that the cost of a wireless link does not increase in proportion with the distance covered bythe link (up to the effective distance limit of the link), we believe that wireless links are cost competitive withnew builds of fiber optic cable beyond a certain fixed network distance. Currently, we believe that our Ethernetmicrowave links are typically cost competitive with new builds of fiber optic cable beyond a distance ofapproximately 200 meters in an urban environment (assuming a cost of $328 per linear meter), 600 meters in asuburban environment (assuming a cost of $98 per linear meter), and 1,600 meters in a rural environment(assuming a cost of $33 per linear meter). According to the ABI Report, wireless links will emerge by 2013 as thelargest backhaul capacity solution worldwide by network type over competing copper, fiber optic and othertechnologies.
Our Markets
As noted above, we target customers principally in the global communications service provider market,including broadband service providers and wireless service providers. In the broadband service provider market,our products are used to connect to the core of the network in both mature, developed markets as an extensionor alternative to existing broadband infrastructure, and in emerging markets that possess limited broadbandinfrastructure as an alternative to deployment of wire-line infrastructure. In the wireless service provider market,our products are used by service providers that provide emerging high-capacity services to end-users. We alsotarget enterprise and municipal/government customers that own or operate private networks requiringpoint-to-point applications. Our principal markets are described below.
Communications Service Provider Markets
Broadband Service Provider Market
Broadband is a high-speed digital communications medium that uses high-bandwidth channels for sendingand receiving large amounts of voice, video and other data. Traditionally, broadband services have beendelivered to end-users via cable, DSL or T1/E1 (TDM) networks, which transmit communications much fasterthan analog networks used for earlier data and voice communications.
Communications service providers provide broadband connectivity to business customers both ‘in territory’where they own the infrastructure connecting their points of presence and end-users, and ‘out of territory’,where they must lease or build this access infrastructure. The leased lines model is generally not optimal forthese service providers, due to high lease costs and the fact that, in many cases, lines must be leased from directcompetitors. As a result, these service providers have an economic and strategic imperative to find acost-effective alternative to leased lines. We believe that Ethernet microwave transport technologies, such asthose we provide, can furnish this alternative.
Wireless Service Provider Market
Wireless communications services is the provision of voice, video and other data communications services tousers of wireless devices for network connectivity for fixed and/or mobile applications. Within this market, wefocus on service providers offering emerging high-capacity services based upon 3G+ access technologies, such asHSPA, WiMAX and LTE.
In wireless networks, mobile wireless handsets and other subscriber devices connect to a network of wirelessbase stations, which are in turn interconnected by backhaul network solutions to the fiber optic core network.Cellular and other mobile networking technologies have evolved to provide higher bandwidth and IP networkingcapabilities. The ABI Report forecasts that in markets where subscriber growth is most rapid, service providerswill focus on building new networks to provide basic voice services, and in markets where the subscriber base ismature, service providers will focus on expanding the capacity of existing networks to roll out advanced data andvideo services which require higher network bandwidth per subscriber. Both scenarios create increased demandfor backhaul capacity.
3G+ wireless technologies comprise a range of technologies that enable the provision of high-speedwireless access services for subscriber devices such as handsets and personal computers. 3G+ wirelesstechnologies include technologies evolved from traditional cellular technologies or from all-IP broadband
30

wireless access technologies such as WiMAX. As such, 3G+ mobile technologies encompass a range of differentwireless network access standards that provide increased subscriber bandwidth either in legacy TDM networksor utilizing emerging wireless IP networks. 3G+ mobile technologies enable users to utilize voice services as wellas high bandwidth applications such as downloading music and other content such as maps and video,exchanging email, multimedia messaging, and a broad array of Internet applications.
Examples of emerging high-capacity all-IP radio access network technologies currently being deployed orplanned for deployment include WiMAX and LTE:
• WiMAX: Developed from inception as an all-IP networking technology, WiMAX is a standards-basedtechnology enabling the delivery of last-mile broadband wireless access as a complement to wire-linebroadband solutions such as cable and DSL. The IEEE 802.16d-2004 standard provides fixed broadbandwireless capacity and the IEEE 802.16e-2005 WiMAX standard provides fixed broadband wirelesscapacity as well as mobility capabilities. The pre-WiMAX development cycle spanned 2005 to 2007.WiMAX deployments were first launched in the U.S. in 2008 and today large scale WiMAX deploymentsare underway.
• Long Term Evolution (LTE): LTE is an advanced 3G+ technology for both GSM and CDMA cellularservice providers. Approved in 2008, LTE is defined by the 3G Partnership Project in the 3GPP Release8 specification. With typical download speeds of approximately 6 Mbps, LTE is considerably higherbandwidth than HSPA (evolved from GSM) and EV-DO (evolved from CDMA). LTE is an IPnetworking technology and we envision that GSM and CDMA service providers will eventually migrate toLTE to provide an interoperable IP-based cellular system worldwide. We expect LTE networkdeployments to commence in the U.S. in 2010. For example, on May 28, 2009, AT&T Inc. (‘‘AT&T’’)announced plans to begin LTE trials in 2010 with LTE network deployment beginning in 2011, and in astatement on the same day, Verizon Communications Inc. (‘‘Verizon’’) indicated that it plans to offercommercial LTE service in 25 to 30 markets in 2010 with the ultimate goal of covering virtually all of itspoints of presence with a LTE network by the end of 2013.
Enterprise and Government/Municipal Markets
We also target large organizations, such as enterprises and government/municipal bodies, with diverselocations that require high bandwidth communications networks. This market includes the education vertical(distance learning and Internet access for schools), the health vertical (remote imaging and campus networks)and municipalities that deploy networks for city-wide public Internet access and/or government and emergencyservices. In this market, we target our products at organizations that build their own communications networksrather than lease services from service providers. We believe that as bandwidth demand continues to grow, theseorganizations will increasingly consider the implementation of private networks to reduce service lease costs.Examples of our end-customers that have deployed private networks include The City of Barrie (Ontario,Canada), South Wales Fire Department (U.K.), The Palm Springs School District (California, United States),South Georgia Regional Information Technical Authority (Georgia, United States), Nexus Systems (Louisiana,United States), City of Joliet (Illinois, United States), City of Plano (Texas, United States), City of HoffmanEstates (Illinois, United States), City of Melrose Park (Illinois, United States), Crane Naval Base (Indiana,United States), Ventura County (California, United States), and the Dubai Police (Dubai, U.A.E.).
Key Trends Driving Increased Demand for Our Products
There are two key trends driving the increased demand for our products: increased demand for backhaulcapacity and IP convergence.
Increased Demand for Backhaul Capacity
Demand for backhaul capacity is predicted to experience strong growth. The ABI Report estimates thatglobal demand for backhaul capacity will grow by almost five times from 2008 to 2014 (from 13.51 Tbps in 2008to 66.49 Tbps in 2014), a compound annual growth rate of 30% for the forecast period.
We believe that the following are the key drivers of demand for increased backhaul capacity.
31

Increasing Functionality of Mobile Devices and Capacity at the Edge of Wireless Networks
Mobile devices are rapidly evolving to meet the requirements and expectations of consumers. Current andnext-generation cellular phones perform ‘smartphone’ functions, drawing design elements from PDAs such aslarger screens and alternative forms of input. The mobile device market has also evolved beyond handsets, withmobile communication capacity now being embedded in appliances such as laptop personal computers,MP3 players, gaming consoles, tablet PCs, data cards, netbooks, GPS units, motor vehicles, cameras andhousehold appliances. Wireless access technologies currently being deployed, in concert with the availability ofthese sophisticated mobile devices, significantly increase bandwidth demand per user within mobile networks ascompared to traditional 2G services such as GSM and CDMA cellular voice services. The increase in typicaldata transfer rates for wireless access technologies between GSM to LTE and WiMAX is over 400 times(downstream). As available bandwidth per subscriber grows in the device and access network, we expectincreased capacity will be required in the backhaul network. The chart below illustrates the bandwidth persubscriber (expressed as theoretical and typical peak data transfer limits) for certain wireless accesstechnologies:
Theoretical Peak Data Transfer Limits on Selected Mobile Technologies
Mobile Technologies Rate Theoretical Typical
(downstream/upstream)2.0G
GSM . . . . . . . . . . . . . . . . . . . . . . . . . . . . . . . . . . . . . . . . . . . . . (Kbps) 115 14
2.5GGPRS . . . . . . . . . . . . . . . . . . . . . . . . . . . . . . . . . . . . . . . . . . . . (Kbps) 171 33
2.75GEDGE . . . . . . . . . . . . . . . . . . . . . . . . . . . . . . . . . . . . . . . . . . . . (Kbps) 384 118
3.0GFOMA . . . . . . . . . . . . . . . . . . . . . . . . . . . . . . . . . . . . . . . . . . . . (Kbps) 2,000 3841xEV-DO Rev A . . . . . . . . . . . . . . . . . . . . . . . . . . . . . . . . . . . . (Kbps) 3,100 800EV-DO Rev B (15 service providers) . . . . . . . . . . . . . . . . . . . . . . (Kbps) 73,000/27,000UMTS . . . . . . . . . . . . . . . . . . . . . . . . . . . . . . . . . . . . . . . . . . . . (Kbps) 2,048 384
3.5GHSDPA . . . . . . . . . . . . . . . . . . . . . . . . . . . . . . . . . . . . . . . . . . . (Kbps) 14,400 2,000
3.75GHSUPA . . . . . . . . . . . . . . . . . . . . . . . . . . . . . . . . . . . . . . . . . . . (Kbps) 5,760 1,400WiMAX (10 MHz channel) . . . . . . . . . . . . . . . . . . . . . . . . . . . . . (Kbps) 46,000/4,000 6,000/2,000LTE (20 MHz channel; 4x4 MIMO) . . . . . . . . . . . . . . . . . . . . . . (Kbps) 326,000/86,000 6,000/2,000
Source: ABI Report
Future wireless communications standards and technologies are expected to further drive bandwidth persubscriber, associated capacity requirements in the backhaul portion of the network, and interoperabilityrequirements. The 4G interoperability and component standards for the next generation of broadband mobilecapabilities are currently being defined by such industry organizations as the International TelecommunicationsUnion. Certain objectives of the 4G wireless communication standard have been established to include highnetwork capacity (more simultaneous users per cell); a nominal data rate of 100 Mbps while the client physicallymoves at high speeds relative to the base station and 1 Gbps while client and station are in relatively fixedpositions; interoperability with legacy wireless standards; and an all-IP, packet switched network.
Shift in Demand from Voice to Multimedia Content and Services in Mature Markets
The ABI Report suggests that service providers in areas with a mature subscriber base will attempt toincrease average revenue per user (ARPU) by offering data services such as e-mail, web browsing, music andvideo downloading and other Internet-related services, as well as mobile video services. As compared to voice
32

services, these in-demand applications are bandwidth-intensive, placing pressure on the backhaul capacity of thecommunications networks of such service providers.
Increasing Demand for Wireless Coverage in Emerging Markets
As early broadband and wireless markets have matured, growth of broadband and wireless subscribers isshifting to emerging markets in developing countries and rural areas. These emerging markets are oftencharacterized by limited telecommunications infrastructure and by broad geographic coverage area, and as suchare inherently suited for wireless as opposed to wire-line backhaul networks. In rural areas of the United States,some deployments are expected to receive government funding or other support through the U.S.$7.2 billionrural broadband stimulus package: see ‘‘Our Customers — Other Target Customer Markets’’. The ABI Reportforecasts that an additional 6 million cellular base stations will be deployed worldwide between 2008 and 2014.
Increase in Global Wireless Communications Subscribers
The number of global wireless subscribers and minutes of use per subscriber are expected to continue toincrease. According to the ABI Report, there were more than 4 billion cellular subscribers globally by the end of2008, with this number expected to grow to approximately 5.9 billion by the end of 2014.
Global Investment in Wireless Access Network Spectrum
There have been numerous auctions around the world of radio spectrum that is used in wireless accessnetworks. The purchasers of this spectrum require backhaul solutions such as those represented by our products.Recent examples of such spectrum auctions include:
• the U.S.$13.8 billion auction of advanced wireless spectrum (‘‘AWS’’) in the United States by the FCC in2006 (in which T-Mobile USA, Inc. represented the largest single bidder winning 120 licenses forapproximately U.S.$4.2 billion);
• the U.S.$19 billion 700 MHz wireless spectrum auction held by the FCC in 2008 (in which Verizon andAT&T bid U.S.$9.4 billion and U.S.$6.6 billion, respectively);
• the $4.3 billion auction of AWS spectrum by Industry Canada in 2008 (in which Globalive, which hasannounced that it will market its wireless services in the Canadian market under the brand name WIND,won 30 licenses for approximately $442 million);
• the A125 million auction of spectrum in the 3.5GHz frequency band by the French telecommunicationsregulator ARCEP in 2006;
• the purchase by Clearwire of 2.5 GHz wireless broadband spectrum from AT&T that the FCC requiredAT&T to sell as a condition of its 2006 merger with Bell South;
• the purchase by five companies of licenses in the 3.5 GHz frequency band in Germany in an auctionraising a total of A56 million in December, 2006;
• the 2007 coordinated auction of spectrum in the 1785-1805 MHz frequency band held by Ofcom and theCommission for Communications Regulation in Ireland;
• the A136 million Italian auction of spectrum in the 3.5 GHz band concluded in February, 2008;
• the U.S.$42 million auction of spectrum in the 2.6 GHz band frequency held by the Norwegian Post andTelecommunications Authority in 2006;
• the U.S.$348 million auction of spectrum in the 2.6 GHz frequency band held by PTS, Sweden’stelecommunications regulatory authority in 2008; and
• the 2.3 and 2.5 GHz auction held by the New Zealand Radio Spectrum Management group, concluded inDecember, 2007.
In addition, upcoming auctions that have been publicly announced include the spectrum auction planned inIndia for 2009 and the spectrum auctions planned in the U.K. and Germany for 2010.
33

Businesses that acquire rights to licensed spectrum are frequently expected or required to build out theirtelecommunications networks within a fixed period of time in order to exploit and develop the spectrum. Thesebusinesses represent potential customers for backhaul equipment, such as our products.
IP Convergence
IP convergence is generally defined as the integration of all communications traffic types, including voice,video and other data traffic, onto a unified IP-based network. Convergence enables service providers to carrymore volume and types of data on a single network, improving efficiency, lowering network costs and givingservice providers the ability to offer more advanced services such as VoIP, video over Internet and dataconnectivity. According to the Infonetics Report, the primary technology trend in the mobile backhaul market isthe transition from TDM to IP/Ethernet. The Infonetics Report indicates that mobile operators are upgradingtheir backhaul from legacy TDM to packet IP/Ethernet which delivers more bandwidth per connection at amuch lower cost per bit, and will increasingly use IP/Ethernet backhaul as a single converged network to carryvoice, data and video traffic for all 2G and 3G+ services. Advanced wireless networks such as certain 3G+networks will utilize IP-based platforms and will require the superior backhaul efficiencies of carrier-gradeEthernet equipment that supports scalability, high-availability, legacy TDM support and services management.We believe that IP convergence will increase demand for backhaul technologies that can support IP networktraffic while meeting the needs of service providers to continue to support legacy TDM services. Our Ethernetmicrowave solutions address both of these critical market requirements.
Our Solutions
Our Ethernet microwave links function as a networked, IP-based extension to an existing fiber optic corecommunications network. Our products operate in the licensed 6 to 38 GHz range, using native Ethernetnetworking to deliver network topologies including point-to-point, ring, and mesh architectures, with~50 millisecond failover times and software-controlled capacity. We also offer a line of pseudowire equipmentto carry legacy TDM traffic across IP networks. Our product offering is complemented by our service andsupport program.
Our solutions consist of links, each comprised of two radios, two modems, and two antennas, together withembedded software:
• Radio — The radio controls transmission power, and converts IF to RF for transmission and RF to IF forreceiving. The radio is an outdoor, weather-hardened unit, which can be attached directly to the antenna.The radio determines the frequency of the transmitted signal and, for this reason, we supply differentradios for different transmission bands.
• Modem — The modem performs aggregation, network management, monitoring, signal processing andswitching for mesh configurations, and controls user throughput and Ethernet functions. The GigabitEthernet interface to the network is provided by the modem. The modem is available in indoor version(Horizon Duo, Horizon Quantum) and in a version integrated into the outdoor unit with the radio(Horizon Compact). The modem also provides a 10/100baseT Ethernet interface for out-of-bandmanagement, is available with an electrical or optical Gigabit Ethernet interface, and can be deployed inredundant configurations.
• Antenna — The antenna transmits and receives microwave radio signals and can be mounted on a tower,pole, rooftop or inside a custom enclosure. Our antenna portfolio includes an ultra-compact version forinstallation in existing antenna panels.
34

15SEP200923542918Each set of links includes embedded software and FPGA firmware that is licensed for use from us to
the customer.
Aspects of our radio and modem manufacturing and assembly process, and the software and FPGAfirmware included in our product offering, are proprietary to us. We have filed patent applications that protect anumber of important aspects of the design, assembly and testing of our products. See ‘‘Our Business —Protection of Intellectual Property’’. Our products also include commercially-available electronic componentssourced from third party suppliers, including FPGAs, monolithic microwave integrated circuits and microprocessors. The antennas used in our Ethernet microwave links are manufactured by third party suppliers.
Our Ethernet microwave links can transmit over distances in excess of 80 kilometres and require line ofsight. The achievable distance depends upon frequency band, antenna size, rain region, throughput capacity, anddesired availability. Each link can be controlled by our network management system or by a service provider’snetwork management system through industry standard protocols.
Our products are available in localized variations for the North American, European and certain otherglobal markets.
Key Characteristics
The key characteristics of our solutions are as follows:
High-Performance
Ethernet Microwave:
Our products use a native Ethernet platform which delivers high efficiency, low latency and full support forEthernet data transport features. Ethernet is a broadly used standard for packet-based transport networks. Theadvantages of Ethernet are lower price points when compared to SONET or SDH alternatives, more efficienttransport due to the ability to perform statistical multiplexing, traffic priority management, and fine bandwidthcontrol. Native Ethernet refers to systems that are designed to transport Ethernet directly rather than adaptingEthernet to existing SONET/SDH or PDH transport systems. The adaptation of Ethernet to such systems
35
increases latency (delay) and decreases efficiency, as an extra layer of mapping is required to perform thetransport function.
High-capacity:
Our products feature Gigabit Ethernet transport with link speeds up to 4.0 Gbps. Our products providesufficient capacity for aggregation and backhaul of traffic from 3G+ wireless base stations without requiringexpensive and time consuming fiber optic backhaul installations.
Low Latency:
Latency, or delay, in a network gives rise to significant inefficiencies, including loss of connectivity.Managing latency throughout the network is essential for proper operation of networked applications,particularly mobile voice and data. Our Horizon products deliver near-zero latency (100 microseconds per link)which enables applications such as 3G+ wireless backhaul.
Output Power:
Our Horizon products are available in a standard power configuration as well as a high-power option. Thehigh-power option enables increased range of approximately 30% with constant antenna size. The total networkcost is optimized by deploying high-power units only on the longer links that require them, and standard units onshorter links.
Carrier-grade
Interference Free:
Our products operate in the licensed spectrum bands between 6 and 38 GHz, in area licensed bands such as24 DEMS and 28 GHz LMDS and in the license-exempt 24 GHz ISM band. All of these frequency optionsprovide low-cost spectrum that can be licensed or used by service providers on a per-link basis, and is readilyavailable in most markets with minimal wait-time. Deploying our solution in the license-exempt 24 GHz ISMband provides service providers with an opportunity for rapid service deployment without spectrumco-ordination and licensing. Equally important, there is low risk of interference in this band due to the limitedrange of equipment that regulators permit to operate in this band compared to other lower frequency license-exempt bands. We believe that we are one of the few vendors providing Ethernet microwave equipment for thisfrequency band.
Scalable:
The capacity of our Ethernet microwave links can be remotely controlled using our Flex software to matchnetwork demands without the need for site visits to upgrade hardware. In addition, our products have featuresthat improve the flexibility and scalability of our product offering, such as automatic modulation shifting andDual Pole Radio Mount (or DPRM). Modulation shifting allows the system to operate at its highest possiblethroughput under good weather conditions and to downshift to a more robust modulation with lower throughputduring heavy rain storms. DPRM enables the link capacity of our standard product to be doubled by adding asecond radio pair in parallel with the original pair.
High Network Availability:
One of the key characteristics of products designated as carrier-grade is high network availability, typicallydefined as 99.999% up-time. This level of availability is achieved principally through a combination ofequipment reliability and network level redundancy. Wireless backhaul network architectures that provide thisredundancy include single link hot standby (also known as 1+1), ring and/or mesh topologies. Our Horizonproducts deliver such high-availability networks using Ethernet networking rather than conventional SONET orSDH equipment. Our proprietary rapid link shutdown feature provides SONET-like failover speeds withlow-cost Ethernet switching.
36

Cost Competitive
Designed for Manufacturability:
Our proprietary surface mount product designs and manufacturing processes permit automated assemblyand testing of our products. These automated processes enable us to sell a cost competitive product compared toproducts that rely on conventional microwave manufacturing techniques.
Flex Pricing:
Our products deliver scalable bandwidth managed in 10 Mbps increments through software license keys.This ‘pay as you grow’ approach enables service providers to pay for only the bandwidth required. This pricingmodel not only optimizes initial cost, but significantly reduces the cost of network maintenance by avoiding theneed for the customer to physically visit each site to upgrade hardware or deploy new equipment to increasecapacity. Using Flex software, the service provider simply issues commands from the network operations centerto manage network capacity.
Ring/Mesh:
The ring/mesh architecture designed into our products provides higher availability at lower cost thancomparable systems, which only support 1+1 architectures, by supporting path diversity as well as equipmentredundancy. The ring/mesh architecture also reduces network costs by reducing the amount of protectionbandwidth required and by using spectrum more efficiently. Unlike SONET or SDH rings, Ethernet ring/meshnetworks can be organically expanded to meet service and capacity requirements, allowing efficient networkimplementation.
Network Optimization:
We have used our network planning expertise to develop products that allow not only individual linkoptimization, but network-wide traffic and topology optimization to better manage network lifecycle costs.Ring/mesh networking, Flex pricing, adaptive modulation and Ethernet statistical multiplexing offer new toolsfor our customers to reduce overall network costs. These features result in significant total cost of ownershipsavings for service providers.
Higher Level of Integration:
The conventional industry link design locates the base band electronics in an Indoor Unit (or IDU) and theRF electronics in an Outdoor Unit (or ODU). Our Horizon Compact product is distinguished in the market forEthernet microwave equipment in that it integrates the baseband and microwave electronics into a single unitthat can be mounted up-mast on the antenna or indoors in an equipment rack. The higher level of integration ofthe Horizon Compact provides a lower cost solution by reducing or eliminating redundant housings,components, circuitry, rack space, and cabling; enabling more efficient installations; and providing a higher levelof system reliability.
Support of Legacy Networking Standards
Pseudowire is a mechanism that emulates the essential attributes of legacy TDM services over an IPswitched network. Pseudowire enables IP convergence for service providers that have IP core networks and areextending these packet technologies to the edge of those networks. Using pseudowire, service providers are ableto continue to transport revenue-generating legacy services to existing customers, lower the cost of such legacyservices by taking advantage of their new high-speed scalable Ethernet microwave infrastructure, and extendinto markets for new services to secure new sources of revenue. This strategy reduces the costs to serviceproviders of adapting to new IP services. Our pseudowire Service Delivery Unit (or SDU) solution providesenhanced TDM transport for applications such as cellular backhaul, leased line replacement and enterpriseconnectivity.
37

Advanced Network Management
Our products are designed to be flexible, meet carrier-grade management requirements, and use industrystandard simple network management protocol (or SNMP) rather than costly, proprietary network managementsystems. This significantly reduces the cost to service providers of integrating our product into their networks.Our products allow network management traffic to be accessed using a local craft terminal, carried over aseparate datacom network or in-band directly over a separate 802.1q VLAN. Our network management solutionenables service providers to measure not only conventional Ethernet statistics but also parameters such as RFperformance and link utilization to proactively manage a complete wireless network.
Remote software download is a feature of Horizon products that allows networks operators to avoiddecommissioning during upgrades. As a result, customer traffic is not affected during a download orsystem upgrade.
Wireless IP Network Planning
We offer deployment planning to help ensure optimum performance. Our competencies in this area includeline of sight assessment and verification, determining mounting requirements, assistance in securing spectrumlicenses, and budgeting for link and network availability.
Our Competitive Strengths
Our solutions allow service providers to rapidly and cost-effectively address their backhaul requirements.We believe that we are positioned to capitalize on anticipated growth trends in our target markets based on thefollowing competitive advantages:
Ethernet Microwave Transport Leadership
We are a technology leader in the development of Ethernet microwave data transport solutions that meetthe requirements of carrier-grade IP and legacy TDM network markets. We continue to develop and integrateadditional functionality into our products. With a research and development team comprised of 68 industryprofessionals each with an average of more than 18 years of experience in the telecommunications sector, webelieve that we will be able to continue to develop our products to remain a leader in our market.
Strong Customer Base
We have demonstrated both customer traction and the ability to capture top-tier customers, includingClearwire, the most advanced mobile WiMAX deployment globally, and Globalive, a North American servicesprovider deploying a 3G+ (HSPA) all-IP wireless network (which has announced that it will market its wirelessservices in the Canadian market under the brand name WIND). Deployment of our products by first-movercustomers in each of our key target markets enhances our brand and raises our profile among service providersand other prospective customers. Based on our review of published FCC data, in 2008 we had the largestU.S. market share (at 32%) in combined 6, 11, 18 and 23 GHz links and in 2008 we increased our market sharein the U.S. market for 18 and 23 GHz bands to 46%. We have focused our product offering on these bands sincethey are optimal for high bandwidth backhaul applications, are generally licensed on a long-term basis to serviceproviders, and have been allocated by the ITU to the fixed service as a primary allocation. The FCC data alsoindicates that we continue to hold the largest market share in the U.S. market for the 24 GHz unlicensed band.We also work closely with our customers to design and implement their networks. Our strong customerinvolvement gives us valuable insight into the precise requirements of our target customers.
Scalability/Flexibility
Our proprietary product design and manufacturing processes allows the radio to be assembled by ouroutsourced manufacturers on a surface mount assembly line, rather than requiring hand-assembled modules.Our products are also tested using an automated process. This automated assembly and test capability results inlower equipment costs, better economies of scale and capacity scalability, and faster manufacturing turns. For us,this results in reduced order lead times and lower required inventory levels. As we achieve increased order
38

volumes for our products, we expect our manufacturing design to continue to reduce our production costs andimprove our product margins.
Networkability
Our Ethernet microwave products include features such as low latency, flexible Quality of Service (or QOS)policing, software-controlled capacity and layer-2 transparency that enable point-to-point transmission as well asring/mesh architectures. We have also adopted Ethernet operations and maintenance standards for enhancedfault isolation and simplified operation. These features and the resulting network architectures that they enableachieve performance and economic benefits specifically when our Ethernet microwave products are deployedend-to-end in a network rather than being deployed with Ethernet microwave products from another vendor.We believe that these performance and economic benefits incline our customers to deploy our Ethernetmicrowave products end-to-end across their microwave networks.
Effective Sales & Distribution
We have an established strategy to reach customers globally in our target markets through our direct andindirect sales and distribution organization. Our direct sales organization focuses on our principal markets inNorth America and Europe. To complement our direct sales force, our experienced distributor, reseller andOEM network allows us to expand our global reach without investing in local sales offices in every territory. Thisspeeds deployment of our sales efforts and reduces costs. In the fiscal year ended February 28, 2009, we secured55 new customers. See ‘‘Our Sales and Distribution Strategy’’ below.
Responsive Service and Support
Carrier-class service providers require suppliers to provide responsive support and service to help ensurehigh network availability. We meet this requirement by providing a comprehensive pre-sale and post-salecustomer support and service program, staffed by our team of experienced support engineers.
Our Customers
We are focused on customers in two principal target markets — communications service providers and largeenterprises/government/municipal entities. A sample of our customers in these target markets, as well as inemerging markets, are detailed below.
Communications Service Providers
• Clearwire: Clearwire is an alternative mobile network operator using pre-WiMAX and WiMAX802.16 E-2005 technology to deliver mobile, fixed and nomadic Internet services to its subscribers in theUnited States and Europe in the 2.5 GHz and 3.5 GHz frequency bands, respectively. In 2008, ClearwireCorporation was formed through the combination of Clearwire LLC and certain Sprint WiMAX networkand 2.5 GHz assets and operations. These wireless assets were combined with investments from IntelCapital Corp., Google Inc., Comcast Corp., Time Warner Cable Inc., and Bright House Networks LLC.Clearwire has since announced plans to launch WiMAX networks in more than 80 markets, with theobjective of expanding coverage to 120 million subscriber points of presence by the end of 2010.Clearwire has also announced that as of March, 2009, it had markets covering 75 million people underdevelopment and construction, with some of these markets launching later in 2009 and others in 2010.Clearwire also stated in March, 2009 that it was working on the long lead time low-cost site acquisitionzoning and permitting work for the markets covering the remaining 45 million people over the course of2009, and most recently announced (in August, 2009) that it has more than 20,000 cell sites underdevelopment. According to the ABI Report, Clearwire will deploy thousands of base stations over thenext two years and uses Ethernet over microwave for 90% of its backhaul network. Clearwire hasdeployed wireless networks in multiple markets across North America using our Ethernet microwavelinks, and we are currently the primary supplier of licensed microwave equipment to Clearwire.
On August 11, 2009, Clearwire Communications LLC, an operating subsidiary of Clearwire, announcedthat it had recently completed its network supplier selections and that DragonWave is part of a selected
39

vendor mix that also includes Huawei Technologies Corporation, Samsung Electronics Co., Ltd., CiscoSystems, Inc. and Ciena Corporation.
• Globalive: Globalive won 30 licenses for approximately $442 million in the 2008 AWS spectrum auctionheld by Industry Canada and today is one of the ‘new entrants’ in the Canadian wireless communicationsservices sector. Globalive has announced that it plans to provide voice, text and data services toCanadians on a next-generation all-IP wireless network based on HSPA technology and that its wirelessservices will be marketed in the Canadian market under the brand name WIND. We have been selectedas a supplier of Ethernet microwave backhaul equipment for this planned HSPA network deployment.
• wi-tribe Pakistan Limited (‘‘wi-tribe’’): wi-tribe was formed in 2007 to provide broadband wireless accessin emerging markets across the Middle East, Asia, and Africa. wi-tribe has deployed its network using ourHorizon Compact Ethernet microwave backhaul equipment.
• LINKEM S.P.A. (‘‘LINKEM’’): LINKEM provides both nationwide WiFi hotspot services and wirelessDSL services in Italy. At the beginning of 2008, LINKEM acquired 13 regional WiMAX licenses toprovide mobile broadband coverage to points of presence covering 80% of the Italian population.LINKEM has deployed our Horizon Compact Ethernet microwave backhaul equipment for backhaul inits new WiMAX network.
• Pakistan Mobile Communications Limited (‘‘Mobilink’’): Mobilink is an Orascom TelecomHolding S.A.E. company and is Pakistan’s leading cellular service provider. We supply Mobilink’sEthernet microwave backhaul equipment for deployment in Mobilink’s nationwide WiMAX networkin Pakistan.
• Altitude Telecom (‘‘Altitude’’): Altitude is a leading provider of broadband access services in Francebased on WiMAX. Altitude’s first deployments took place in 2004. Our Ethernet microwave backhaulequipment has been selected by Altitude for four regional deployments in the Departement de la HauteGaronne, Departement des Deux Sevres, Departement du Jura and Departement des PyreneesAtlantiques.
• Barrett Xplore Inc. (‘‘Barrett Xplore’’): Barrett Xplore is one of Canada’s largest and fastest growingwireless broadband service providers serving rural and non-urban homes and businesses. Barrett Xplorehas completed in excess of 200 wireless broadband deployments in Canada, reaching 300 ruralcommunities and covering 350,000 homes and businesses. Barrett Xplore is using our Ethernetmicrowave backhaul equipment for its deployment of a broadband wireless network in rural towns andcommunities across Canada.
• Bell West Inc. (‘‘Bell Canada’’): In 2004, Bell Canada built the Alberta Supernet, a regional network inthe province of Alberta in Canada that is designed to support government and enterprise customers. Thisnetwork provides direct wireless access to schools and enterprises, delivering high bandwidth access tocommunities throughout Alberta. Bell Canada deployed our Ethernet microwave backhaul equipmentlinks to provide direct end-customer access for this project.
• Cedarcom S.A.I. (‘‘Cedarcom’’): Cedarcom is the leading telecommunications provider in Lebanon.Cedarcom holds a wireless data networking license under decree number 10172, allowing the deploymentand operation of a country-wide broadband wireless access data network. We are a supplier of HorizonCompact Ethernet microwave backhaul equipment to Cedarcom and are playing a key role in extendingcoverage to major cities in four of Lebanon’s administrative regions (or governorates): Mount Lebanon(Mont-Liban), North (Liban-Nord), South (Liban-Sud), and Bekaa.
Other direct customers include Navigata Communications Ltd., Orascom Telecom Holding S.A.E.,Connecteo Group (a subsidiary of Monaco Telecom Ltd.), Monaco Telecom Ltd., Siege Prosystel, Total Telecom(a subsidiary of Terrapinn Holdings Ltd.), Etihad Etisalat Company (otherwise known as Bayanat Al-Oula),M3 Wireless Ltd., Telecard Limited, ECAS Telecommunications & Systems Ltd., Towerstream Corporation,Brightstar Corp., BOB LLC (BOB Business Only Broadband) and Televersa GmbH.
Our revenue from direct sales to wireless service providers was $27.5 million in the fiscal year endedFebruary 28, 2009 (with 47% of such revenue originating from the United States, 44% from Europe, the MiddleEast and Africa (‘‘EMEA’’)), 9% from Canada and nil% from the rest of the world) and $21.8 million in the
40
fiscal year ended February 29, 2008 (with 61% of such revenue originating from the United States, 31% fromEMEA, 7% from Canada and 1% from the rest of the world). We also sell our products to wireless serviceproviders through our indirect sales channel. See ‘‘Our Sales and Distribution Strategy — Indirect Sales ChannelStrategy’’.
Enterprise and Government/Municipal
This customer segment includes large, multi-site enterprises and organizations that build their own privatecommunications networks rather than purchasing services from service providers. Examples of our customerswithin this segment include:
• South Georgia Regional Information Technology Authority (‘‘SGRITA’’): SGRITA provides high-speedInternet service to area industry, government offices, schools, public safety professionals and otherinterests. SGRITA has deployed our Horizon Compact Ethernet microwave backhaul equipment in astate-of-the-art broadband network throughout Baker, Calhoun, Early, Miller and Mitchell counties inSouth Georgia.
• Dubai Police Department: The City of Dubai has deployed CCTV cameras throughout the city forsecurity and surveillance purposes. The video feeds from these cameras are carried by our Ethernetmicrowave links to create a 800 square kilometre private, secure wireless network that connects to acentral monitoring location.
Other Target Customer Markets
We also target other markets of prospective customers that choose broadband wireless networks as datatransport solutions. We have been, or are currently, in trials with customers such as broadband service providers(rural service coverage extension), satellite content providers (content distribution and uplink channel forbi-directional services), cable companies (extension of hybrid fiber/coax plant) and defence services (hardenedcommunications and remote telemetry). We believe that as the demand for broadband services continues toincrease, the market for Ethernet microwave backhaul equipment will expand beyond service providers andgenerate significant future opportunities for our products.
The U.S. government has announced substantial funding of new rural broadband initiatives under theAmerican Recovery and Reinvestment Act of 2009 (the ‘‘Recovery Act’’). The Recovery Act appropriatesU.S.$4.7 billion to the National Telecommunications and Information Administration, U.S. Department ofCommerce (‘‘NTIA’’) to establish the Broadband Technologies Opportunities Program (‘‘BTOP’’), throughwhich NTIA will provide grants for broadband initiatives throughout the United States, including projects inunserved and underserved areas, expansion of public computer center capacity and programs to encouragesustainable adoption of broadband service. The Recovery Act also appropriates U.S.$2.5 billion in budgetauthority to the Rural Utilities Service, U.S. Department of Agriculture (‘‘RUS’’) to establish the BroadbandInitiatives Program (‘‘BIP’’), through which RUS will provide grants, loans, and loan/grant combinations forbroadband initiatives throughout the United States, again including projects in unserved and underserved ruralareas. The U.S. government has announced that NTIA and RUS received applications for nearly U.S.$28 billionin funding under the BTOP and BIP programs during the first of an expected three rounds of grant applications.Of this amount, approximately U.S.$4.0 billion is expected to be awarded in the first round of funding in late2009, for deployments over 2010 and 2011. The remainder of federal funding, U.S.$3.2 billion, will be awardedduring subsequent application rounds. We believe that Recovery Act funding of rural broadband projectsrepresents a significant opportunity for DragonWave to develop new and expanded markets for our backhaultransport solutions.
Our Business Model
We generate almost all of our revenues from the sale of Ethernet microwave transport systems, whichincludes our Horizon family of Ethernet microwave products. We also offer a range of support and serviceprograms as well as extended product warranties to our customers. Services — including training, installationand basic consulting, such as network design and engineering design — contribute to our success with ourcustomers but comprised less than 3.5% of our revenues in the three-month period ended May 31, 2009 and the
41

fiscal year ended February 28, 2009. As more customers deploy our products, we expect that revenues from ouradvanced replacement and warranty renewals to increase and that the sale of software for capacity upgrades willemerge as a future potential revenue source. From time to time, we also enter into customer design engineeringcontracts. Our revenue for the three-month period ended May 31, 2009 and the fiscal year ended February 28,2009 from such contracts was $0.3 million and $0.9 million, respectively.Our Growth Strategy
Our objective is to strengthen our position as a global leader in high-capacity Ethernet microwaveequipment that enables the transition by wireless service providers to high-capacity all-IP networks. In order toaccomplish this goal, we aim to leverage our technological leadership, broaden our market penetration, anddemonstrate competitiveness for deployment in multiple broadband radio access network types such as WiMAX,HSPA and LTE. The specific elements of our growth strategy are:Continue Product Development Investment
We believe that our growth to date has been, in large part, due to our product development focus onhigh-capacity Ethernet microwave equipment. We believe that our technological leadership in this area is theresult of our continued investment in research and development and our commitment to providingtechnologically advanced and cost-effective solutions to our customers. We intend to continue to develop ourproducts to address market requirements in various applications and geographic markets around the world. Ourproduct development priorities include the following:
• continuing to focus on the rapidly evolving high-capacity Ethernet microwave backhaul market;• expanding the capacity of our products;• continuing product cost reduction;• developing product enhancements to reduce the operating costs of our customers, including
enhancements in rackspace and spectral efficiencies as well as network and networking capabilities;• expanding the frequency range in which our products operate in order to better address new geographic
markets; and• expanding the variety of interfaces offered with our products to increase the number of applications that
our products can address.Expand Geographical Reach
We expect that the U.S. component of this Offering, which constitutes our initial public offering in the U.S.,will improve awareness of DragonWave in the U.S. where many of the initial deployments in the 4G wave ofnetwork infrastructure build-out will occur, and will increase investor participation in the Company bybroadening our group of potential investors. We also believe that this Offering will better position DragonWaveto be selected as an equipment vendor for large network service providers. We intend to build upon our leadingU.S. market share and our current international market penetration to expand our geographical reach. Thismulti-faceted strategy includes the following:
• increasing investment in global direct sales activity, including sales activity in continental Europe(particularly Russia and Greece), the Middle East, Pakistan, the Caribbean and Latin America, Indiaand China;
• expanding the number and scope of our distributor, VAR and OEM arrangements around the globe tocomplement our direct sales efforts; and
• continuing investment in training and tools for the engineering and support organizations of our VARsand OEMs, to improve the overall efficiency and effectiveness of these arrangements.
Capitalize on Broadband Stimulus FundingThe U.S. government has recently announced substantial funding of new rural broadband initiatives under
the American Recovery and Reinvestment Act of 2009 totaling U.S.$7.2 billion in grants and loans. We believethat broadband stimulus funding of rural projects represents a significant opportunity for us to develop new andexpanded markets for our backhaul transport solutions.Continue to Focus on Operational Excellence and Deliver Effective Customer Service and Support
We intend to continue to focus on improving product quality, reducing delivery time, reducing costs,streamlining manufacturing processes and optimizing inventories. This focus on operational excellence hasallowed us to significantly reduce our manufacturing costs and shorten our delivery time. Our focus onoperational excellence has enabled us to rapidly expand the number of systems shipped to meet the growingdemands in the marketplace.
We intend to continue to deliver our customer service and support capabilities to help our customersoptimize their network deployments and ensure high network performance and availability by providing acomprehensive pre-sale and post-sale customer support and service program.
42

Review Selective Strategic Acquisitions
We intend to selectively review opportunities to acquire companies or technologies that complement ourexisting product portfolio and market reach.
Our Products
We have commercialized two principal product lines of Ethernet microwave links, Horizon and AirPair. Wecommenced commercial production of our Horizon product line in 2007. Our Horizon product line wasdesigned as a next-generation product to follow our AirPair product line, which was introduced in 2002.
Horizon Product Family
Our Horizon product family is a Ethernet microwave portfolio and consists of Horizon Compact andHorizon Duo. Key features across our Horizon product line include adaptive modulation, ring/mesh support,advanced prioritization, jumbo frames, flow control, ATPC and layer 2 transparency.
Horizon Compact
Our Horizon Compact is designed to lower capital and operating costs for service providers by integratingand enhancing the functionality of traditional wireless indoor and outdoor units into a single, compact,high-performance, high-availability Gigabit Ethernet all-outdoor microwave transmission system. HorizonCompact offers scalability to 400 Mbps per channel, or 800 Mbps full duplex capacity using a single antenna withcross polarization. The design of the Horizon Compact reduces the installation and operational burden forservice providers by not requiring support of indoor backhaul equipment or space in indoor base-station cabinetsand using standard cabling with power over Ethernet. These zero-footprint characteristics of the HorizonCompact product complement 3G+ radio-access network solutions. Horizon Compact operates in the 6 to38 GHz licensed radio frequency, ensuring interference-free performance for Ethernet microwave applications,and provides scalable, low-latency native Gigabit Ethernet connectivity.
We believe that Horizon Compact will enable service providers to offer carrier-Ethernet services usinglicensed spectrum on a basis that provides direct cost competition to systems using unlicensed spectrum, whilealso providing scalability comparable to fiber optic solutions.
Horizon Duo
Our Horizon Duo product is a wireless indoor and outdoor split mount, high-availability Ethernetmicrowave transmission system that provides scalable, low-latency native Gigabit Ethernet connectivity. HorizonDuo is a high capacity Ethernet microwave system that offers 1600 Mbps full duplex capacity while loweringcapital and operational costs for service providers. The high capacity of the Horizon Duo is optimized for coretransport ring-and-mesh applications. Horizon Duo operates in the 11 to 38 GHz licensed radio frequency,ensuring interference-free performance for wireless carrier Ethernet applications.
We believe that Horizon Duo enables service providers to achieve the network scalability that is requiredfor emerging 4G networks. Horizon Duo’s rapid link shutdown capability allows it to be deployed in ring/mesharchitectures with 50-100 ms switching.
Horizon Quantum
We recently launched our Horizon Quantum product. We have designed Horizon Quantum to providesignificantly increased bandwidth capacity of up to 4 Gbps per link. Horizon Quantum is a native Ethernetimplementation supporting sub-0.1-ms latencies and is optimized for the rollout of LTE services. HorizonQuantum is a half-rack-unit device incorporating a Bandwidth Accelerator feature that enables superior spectralefficiency by up to a factor of 2.5 times as compared to conventional systems. The combination of these featuresresults in a five times improvement in rack density per unit of available bandwidth capacity. Horizon Quantumalso integrates key nodal intelligence that enables network operations to be streamlined and simplified to yieldsignificant cost efficiencies. For example, Horizon Quantum incorporates integrated switching capabilityenabling aggregation and switching to optimize ring-and-mesh network deployments by requiring reduced
43

network equipment to be deployed, powered and maintained. Horizon Quantum also incorporates our standarduser-scalable bandwidth enabling simple and remote scaling, without truck rolls, providing our customers withkey operational-cost benefits.
AirPair
We commenced commercial production of our previous generation product line, AirPair, in 2002. Initially, a100 Mbps version of the product was introduced in 18 and 23 GHz frequency bands. AirPair’s frequencycoverage was expanded to include frequencies from 11 through 38 GHz. In 2005, we introduced a new version ofthe AirPair product line, AirPair Release 4, which can scale up to 250 Mbps per carrier or up to 500 Mbps perlink. This version currently accounts for the majority of AirPair product sales. While we continue to produce andsupport our AirPair product line, this line has been largely superseded by our Horizon product family.
Service Delivery Unit (SDU)
Our SDU product range incorporates pseudowire products that enable cost-effective converged packettransport and TDM transport and eliminates intermediate cabling and complexity. Our SDU productfunctionality includes 6XGigE ports, Ethernet switching, remote network management, prioritization,point-to-point pseudowire or hub-and-spoke functionality and includes our SDU-16 and SDU-155 products.
Product Flexibility
Our products are configurable, allowing the end-customer to configure throughput, channel widths and anumber of other parameters. Our products can be updated remotely from a network operations center to addfeatures and functionality to products deployed in the field. The packet processing and modem function on bothour Horizon Compact and Horizon Duo products are implemented through firmware in FPGA, enabling us tocustomize these functions, provide value-added features and upgrade field-deployed units without requiringhardware changes.
Support and Service
Our product offering is complemented by customer support and service and extended product warranties.Our customer support program includes project management, link installation, RF planning, network design andline of sight assessments for large scale projects; assistance in securing licensed spectrum; full training andcertification for network operators; access to our technical assistance center (including both telephone andon-site support); and our 24-hour customer support website. Our support team of 11 full-time support engineersis comprised of specialized wireless professionals that work closely with our customers to ensure that customerrequirements are met both during and after initial deployment of our products.
Our Sales and Distribution Strategy
We distribute our products and services through a combination of direct and indirect sales channels. Thisstrategy permits us to broaden our customer coverage, while at the same time retaining contact with ourcustomer base and managing costs. Our sales cycles can be lengthy and often include network studies and trialsof our equipment in laboratory and field environments. Because our products are utilized in large networkdeployments, our sales are project-based and accordingly are highly variable from quarter to quarter. Our directcustomers are typically service providers that operate networks in large geographical areas. The sales cycle tothis class of customer typically involves a trial (or trials), and requires nine to twelve months from first contactbefore orders are received. Once the order stage is reached, a supply agreement is usually established andmultiple orders are processed under one master supply agreement. While North America is our primarygeographic market, our sales team targets service providers across the world and our products have beendeployed in numerous countries across Europe (in France, Spain, Germany, Italy, Romania and the CzechRepublic) and the Middle East (in Pakistan, the United Arab Emirates, Saudi Arabia, Kuwait and Lebanon). Inour most recent fiscal year, 69% of our sales originated from North America, 26% from EMEA, 4% fromAsia-Pacific and 1% from Latin America.
44
Direct Sales Strategy
Our direct sales and business development team of 26 employees primarily focuses on Tier 1 serviceproviders. The team is organized across three geographic regions: North America, EMEA and Asia-Pacific.Direct sales employees are currently based in the United States, Canada, the United Kingdom, France and theUnited Arab Emirates. We expect to place additional direct sales personnel in Singapore in the third quarter ofthe current fiscal year. Our sales and business development team is comprised of dedicated salespeople assignedto specific customer accounts. Our sales personnel have extensive knowledge of network infrastructure. Inaddition to closely monitoring our target markets for potential network deployments and new customeropportunities, our sales team builds on our existing relationships with our customers’ network planningorganizations, including participating in business case development and technical analysis of projects. Thischannel represented 77% and 62% of revenue for the three months ended May 31, 2009 and the fiscal yearended February 28, 2009, respectively (fiscal year ended February 29, 2008 — 55%).
Indirect Sales Channel Strategy
Our indirect sales channel consists primarily of distributors and regional VARs, and is involved in bothchannel-initiated sales (sales initiated and serviced by third parties) and channel-fulfilled sales (sales initiated byour direct sales team and serviced by third party resellers). Our principal North American distributors areTESSCO Technologies Inc., Talley Inc., Alliance Communications Corporation and HuttonCommunications Inc. These distributors have been selected based on geographic coverage and access to marketverticals. Within North America, our VARs are identified by these distributors. We have agreements with severalregional VARs in North America. Outside of North America, we select our VARs directly. We qualify our VARsbased on experience deploying microwave equipment, contacts in our target customer segments, and financialstability. We provide ongoing training to our VARs, and our VARs work with our dedicated account managers,participate in co-operative marketing programs and receive market development funds and support materials forcustomer sales. Our personnel assist our VARs with initial installations of our products to provide qualityassurance to end-customers.
We also work with OEMs, including system integrators and network equipment vendors, to assist them inproviding complete network solutions for their end-customers.
The majority of our indirect revenues in North America are accounted for by three distributors. In EMEAand Asia-Pacific, we have agreements with regional VARs in the United Kingdom, Ireland, Spain, France,Germany, Belgium, the Netherlands, Sweden, Norway, Hungary, the Czech Republic, Israel, Saudi Arabia,United Arab Emirates, Kuwait, South Africa, Australia, Pakistan and Singapore. This channel represented 18%and 34% of revenue for the three months ended May 31, 2009 and the fiscal year ended February 28, 2009,respectively (fiscal year ended February 29, 2008 — 37%).
Competition
We face competition in our target markets from two types of microwave equipment suppliers: PDHequipment suppliers and Ethernet equipment suppliers. Microwave equipment has historically been used toaddress the backhaul requirements of 2G cellular applications and, today, the market is dominated by PDHproducts. The leading suppliers of PDH microwave equipment are NEC Corp., Alcatel-Lucent,Telefonaktiebolaget LM Ericsson and Nokia Siemens Networks. While we compete with suppliers of PDHbackhaul products of T1s and E1s used in 2G networks, our native Ethernet-based products are optimized forthe transport of packet-based networks and feature significantly higher capacity, and a manufacturing processthat delivers this high capacity at a lower price, than PDH equipment. A second category of equipment suppliersfor backhaul applications are, like us, focused on Ethernet-based products in IP networks. These suppliers areour main competitors and include Ceragon Networks Ltd. of Israel and Harris Stratex Networks, Inc. of theUnited States. We encounter these competitors in network builds focused on IP traffic. We believe that ourbandwidth capability/flexibility, and all-outdoor solution, performance and simplicity differentiate our solutionfrom products offered by our competitors.
Our assessment of our competitive position, as described above, is based, among other factors, on ourknowledge of the telecommunications equipment industry and communications with our customers.
45

Manufacturing and Supply Chain Management
We outsource most of our manufacturing and certain of our supply chain management and distributionfunctions. Outsourcing these functions allows us to focus on designing, developing, selling and supporting ourproducts. In addition, we are able to leverage the economies of scale and expertise of specialized outsourcedmanufacturers, reduce manufacturing and supply chain risk and reduce distribution costs.
We have two principal outsourced manufacturers, BreconRidge and Plexus:
• BreconRidge is an electronics manufacturing services company specializing in the communications,industrial and consumer market sectors. BreconRidge is ISO 9001 certified and has manufacturingfacilities in Canada, the United States and China. Our products are manufactured at BreconRidge’sfacility in Ottawa, Ontario, Canada. Terence Matthews, one of our directors, has a significant equityinterest in BreconRidge. See ‘‘Interests of Management and Others in Certain Transactions’’. We believethat our manufacturing agreement with BreconRidge reflects fair market terms and payment provisions.
• Plexus is an electronics manufacturing services company with manufacturing facilities in the United States andMalaysia. Plexus provides product design, supply chain and materials management, manufacturing, test,fulfillment and aftermarket solutions to branded product companies in the wire-line/networking, wirelessinfrastructure, medical, industrial/commercial and defense/security/aerospace market sectors.
We have allocated manufacturing of our products (including components) among key suppliers to reducethe risks associated with using a single supply source and to ensure competitive pricing and levels of service.Using multiple suppliers also enables us to respond more rapidly to increases in demand for our products.
Research and Development Activities
Our ability to develop technologically superior and/or most cost-effective solutions relative to ourcompetitors can only be achieved through our continued research and development (‘‘R&D’’) efforts.
Our R&D activities take place at our headquarters in Ottawa, Ontario, Canada. We currently haveapproximately 82 personnel in our engineering group, representing approximately 45% of our total personnel(including contractors). The majority of our engineering staff hold technical degrees in engineering. A largenumber of our senior engineering personnel have worked together for several years and have been responsiblefor the development of our products. Our R&D team works closely with our growing customer base, andincorporates feedback from our direct and indirect sales teams into our product development plans to improveour products and address emerging market requirements.
Our R&D expenses have historically been, and will continue to be, a significant portion of our overall coststructure as we will continue to invest in new product features and new platforms to better serve the current andfuture needs of our customers. We invested 25% and 26% of our revenues in R&D during fiscal year 2009 andfiscal year 2008, respectively.
Protection of Intellectual Property
In accordance with industry practice, we protect our proprietary rights through a combination of patent,copyright, trade-mark and trade secret laws and contractual provisions.
Patent law offers some protection for our current and future products and may protect certain elements ofour manufacturing processes. Our patent strategy is focused on protecting novel elements of the followingaspects of our product and manufacturing design:
• core design features (including certain circuits and algorithms required for advanced, low-costpoint-to-point radio implementations);
• implementation technologies (consisting of the proprietary aspects of our manufacturing design thatpermit low-cost automated assembly and testing);
46

• certain key Ethernet microwave networking technologies for high-speed, high-performance metroEthernet networking applications (including bandwidth scaling feature (marketed as ‘‘Flex’’), mesh rapidlink shutdown feature, mesh node packaging/integration); and
• other key features of our products (including Flex functionality, RF-loopback, mesh nodes and tri-modemesh panel features).
Our active patent portfolio consists of 8 issued U.S. patents, 12 pending U.S. applications, 2 pendingCanadian applications and 4 pending European applications.
The executable code for our software and firmware, the embedded software and firmware in our hardwareproducts and our manufacturing designs are protected under trade secret law and as unpublished, copyrightedworks. Software is only provided to our customers in binary format. We recognize, however, that effectivecopyright protection may not be available in some countries in which we distribute products. We license the useof our product to our customers and resellers. These licenses contain standard provisions prohibiting theunauthorized reproduction, disclosure, reverse engineering or transfer of our product. In addition, we aredesigning products changes that will enable the implementation of encrypted embedded firmware which willfurther enhance our ability to protect our critical intellectual property.
Our general practice is to enter into confidentiality and non-disclosure agreements with our employees,consultants, manufacturers, suppliers, customers, channel partners and others to attempt to limit access to anddistribution of our proprietary information. In addition, our practice is to enter into agreements with ouremployees that include an assignment to us of all intellectual property developed in the course of theiremployment.
We have registered trade-marks DRAGONWAVE, AIRPAIR and HORIZON in Canada andDRAGONWAVE and HORIZON in the U.S. We have a pending trade-mark application in the U.S. forAIRPAIR, although this application is currently being opposed by a third party.
Except for intellectual property which we have taken measures to protect as described above, there are nopatents or other intellectual property rights, licenses or proprietary rights, or processes protected by tradesecrets that we rely on or that are material to our business or revenues.
Operations and Facilities
Our headquarters are located at leased premises in Ottawa, Ontario, Canada, pursuant to a lease enteredinto by us with Kanata Research Park Corporation (‘‘KRPC’’), a corporation controlled by Terence Matthews,one of our directors. See ‘‘Interests of Management and Others in Certain Transactions’’. Our R&D, servicesand support, and general and administrative groups operate from our headquarters. These premises consist ofapproximately 26,306 square feet of rentable space with a lease term that expires on November 30, 2011.Aggregate annual lease payments (base rent and all other rent and charges) are approximately $596,000. Thelease for these premises is renewable at our option for a further term of five years, provided we deliver writtennotice to KRPC of our intention to exercise our option not less than six months prior to the expiry of the leaseterm. We also lease a warehouse facility at 362 Terry Fox Drive, Ottawa, Ontario from KRPC, pursuant to alease dated August 30, 2006, as most recently amended on October 23, 2008. The term of this lease has beenamended and expires on October 31, 2011. These premises consist of approximately 10,863 square feet ofrentable space. Aggregate annual lease payments (base rent and all other rent and charges) are approximately$224,000. Additional warehouse space (4,050 square feet) located at 349 Terry Fox Drive, Ottawa, Ontario hasbeen leased from KRPC pursuant to a six month lease commencing February 1, 2008 and on a month-to-monthbasis after the expiry of the initial six month term. Total rent payments for the year are estimated at $40,500. Wehave also subleased additional space at 362 Terry Fox Drive, Ottawa, Ontario. The premises consist ofapproximately 3,146 square feet of rentable space. Aggregate annual lease payments are approximately $15,730.The term of the lease commences on September 1, 2009 and ends on November 29, 2010. We also leaseoffice space in England under a lease that expires in 2013. See ‘‘Management’s Discussion and Analysis ofFinancial Condition and Results of Operations — Three Month Period Ended May 31, 2009 — Off-BalanceSheet Arrangements’’.
47

Employees and Contractors
As of August 31, 2009, we had 182 full-time and temporary employees and contractors. A breakdown of ouremployees and contractors by main category of activity and geographic location is as follows:
Category of Activity August 31, 2009 Geographic Location
General and administrative: . . . . . . . . . . . . . . . . . . 16 CanadaOperations: . . . . . . . . . . . . . . . . . . . . . . . . . . . . . 45 CanadaResearch and development: . . . . . . . . . . . . . . . . . . 82 CanadaSales and marketing/customer support: . . . . . . . . . . 39 Canada, U.S., Europe, the Middle East
Total: . . . . . . . . . . . . . . . . . . . . . . . . . . . . . . . . . . 182
Legal Proceedings
It is common in our industry to receive notices alleging patent infringement arising in the normal course ofbusiness. We have set up internal procedures to deal with such notices, which include assessing the merits ofeach notice and seeking, where appropriate, a business resolution. Where a business resolution cannot bereached, litigation may be necessary. The ultimate outcome of any litigation is uncertain and, regardless ofoutcome, litigation can have an adverse impact on our business because of defense costs, negative publicity,diversion of management resources and other factors. Our failure to obtain any necessary license or other rightson commercially reasonable terms, or otherwise, or litigation arising out of intellectual property claims couldmaterially adversely affect our business. As of the date of this short form prospectus, we are not party to anylitigation that we believe is material to our business.
DIRECTORS AND MANAGEMENT
The following table sets out, for each of our directors and executive officers, the person’s full name,municipality of residence, position with DragonWave, principal occupation and, if a director, the date on whichthe person became a director. Directors are elected at our annual shareholders meetings for a term that expiresat the time of our next annual shareholders meeting, unless the director’s office becomes vacant earlier byresignation, death, removal or other cause.
Name and Municipalityof Residence Age Offices with DragonWave Principal Occupation Director Since
JEAN-PAUL COSSART(1)(2) . . . 62 Director Associate Director, Infoteria of June 9, 2009Versailles, France France
CARL EIBL(2)(3) . . . . . . . . . . . 49 Director Managing Director, Enterprise November 15, 2005La Jolla, California, U.S.A. Partners Venture Capital
CLAUDE HAW(1)(2)(3) . . . . . . . 53 Director President and CEO of the November 10, 2003Ottawa, Ontario, Canada Ottawa Centre for Research and
Innovation
TERENCE MATTHEWS . . . . . 66 Director Chairman, Wesley Clover March 30, 2000Ottawa, Ontario, Canada International Corporation
GERRY SPENCER(1)(3) . . . . . . 60 Director and Retired February 3, 2006Kingswood, Surrey, U.K. Chair of the Board of Directors
PETER ALLEN . . . . . . . . . . . 53 President, Chief Executive Chief Executive Officer, March 4, 2004Ottawa, Ontario, Canada Officer and Director DragonWave Inc.
ERIK BOCH . . . . . . . . . . . . 48 Vice President, R&D and Chief Chief Technology Officer, N/AOttawa, Ontario, Canada Technology Officer DragonWave Inc.
DAVID FARRAR . . . . . . . . . 52 Vice President, Operations Vice President, Operations, N/AOttawa, Ontario, Canada DragonWave Inc.
RUSSELL FREDERICK . . . . . 50 Chief Financial Officer, Vice Chief Financial Officer, March 23, 2007Ottawa, Ontario, Canada President, Secretary and Director DragonWave Inc.
48

Name and Municipalityof Residence Age Offices with DragonWave Principal Occupation Director Since
BRIAN MCCORMACK . . . . . 66 Vice President, Sales Vice President, Sales, N/AAtlanta, Georgia, U.S.A. DragonWave Inc.
ALAN SOLHEIM . . . . . . . . . 50 Vice President, Product Vice President, Product N/AOttawa, Ontario, Canada Management Management, DragonWave Inc.
(1) Audit Committee members are Claude Haw (Chair), Jean-Paul Cossart and Gerry Spencer.
(2) Compensation Committee members are Carl Eibl (Chair), Jean-Paul Cossart and Claude Haw.
(3) Nominating and Governance Committee members are Gerry Spencer (Chair), Carl Eibl and Claude Haw.
As a group, our directors and executive officers beneficially own or control or direct, directly or indirectly, atotal of 2,759,955 Common Shares, representing approximately 9.64% of the total outstanding Common Sharesas at October 13, 2009.
Officers and Senior Management
Peter Allen, President & Chief Executive Officer. Prior to joining DragonWave in 2004, Peter Allen wasPresident and CEO of Innovance Inc. (‘‘Innovance’’), a private reconfigurable optical networking company.Prior to 2000, Peter was the Vice President of Business Development for the Optical Networks Division ofNortel Networks Limited (‘‘Nortel’’), holding leadership responsibility for Nortel’s optical components businessas well as business development responsibility for system activities. At Nortel, Peter led a 5,000-employee globaloperation spanning R&D, manufacturing and sales and marketing. Peter has also held managerial positions atFord Motor and Rothmans International plc, and has lived and worked in North America, Europe and Africa.
Erik Boch, Founder, Vice President, R&D and Chief Technology Officer. Prior to co-founding DragonWave inFebruary 2000, Erik Boch held senior engineering or technical management positions at a number ofcommunications and aerospace companies, namely Litton Systems Canada Ltd., ComDev International Ltd.,Lockheed Martin Corporation and Newbridge Networks Corporation (since acquired by Alcatel Canada, Inc.).While at Newbridge Networks Corporation (‘‘Newbridge’’), Erik was Assistant Vice President of the WirelessSystems Group. Erik has been involved in various aspects of microwave and millimetre wave subsystem andsystem design for more than 22 years. Erik led the R&D team at Newbridge that introduced the first ATM-basedfixed wireless access system in our industry. Erik has been published extensively in major networkingpublications, including Telephony, Microwave Journal, Wireless Review, Internet Telephony and America’sNetwork. Erik holds several approved RF design patents and numerous patents pending. Erik holds a bachelorand a masters degree in electrical engineering from Carleton University, Ottawa, Ontario, Canada and is aregistered professional engineer.
David Farrar, Founder & Vice President, Operations. Prior to co-founding DragonWave in February 2000,David Farrar was employed by Newbridge, where he held senior management positions in product management,R&D, operations, and information technology. Prior to joining Newbridge, Dave was Director of Engineering atSynapse Corporation, a private data communications design company, and an Engineering Manager at MitelNetworks Corporation. Dave holds a bachelor of science in electrical engineering from the University ofWaterloo in Waterloo, Ontario, Canada.
Russell Frederick, Vice President, Chief Financial Officer and Secretary. Prior to joining DragonWave in2004, Russell Frederick was the Chief Operating Officer and Chief Financial Officer of Wavesat Wireless Inc.(‘‘Wavesat’’) (2000 to 2003). Prior to Wavesat, Russell was the Chief Financial Officer of PRIOR DataSciences Ltd. (1994 to 2000) where he played a key role in the management buy-out and subsequent sale of thecompany. Prior thereto, Russell was employed with Digital Equipment Ltd. of Canada in various financial roles.Russell holds a master of business administration degree in finance, as well as a bachelor of science degree fromMcMaster University in Hamilton, Ontario, Canada.
Brian McCormack, Vice President, Sales. Prior to joining DragonWave in 2003, Brian McCormack heldsenior sales and marketing positions at SS8 Networks, Inc. (2002 to 2003), Teem Photonics Corporation (2001 to2002), TelOptica Inc. (2001) and Avici Systems Inc. (‘‘Avici’’) (now Soapstone Networks Inc.) (1999 to 2001). At
49

Avici, a recognized leader in the carrier-class switch/router market, Brian was Senior Vice President ofWorldwide Sales. Prior to 1999, Brian held senior sales and marketing positions at Nortel Networks Inc., CiscoSystems, Inc. and DSC/Alcatel (now Alcatel USA Inc.). Brian holds a bachelor of arts degree from St. AnselmCollege in Manchester, New Hampshire, United States.
Dr. Alan Solheim, Vice President, Product Management. Prior to joining DragonWave in 2005, AlanSolheim was Chief Technology Officer at Innovance (2000-2004), a private reconfigurable optical networkingcompany. Prior to Innovance, Alan was a Vice President at Nortel Networks Inc., responsible for market strategyin the metro transport group. Alan has extensive experience in the telecommunications industry, notablyworking on six generations of fiber optic transmission systems, and was the system design authority for Nortel’sOC-192 program. Alan holds over 50 patents and is the principal or co-author of numerous papers published inrespected industry journals. Alan holds a doctoral degree in electrical engineering from the University ofWaterloo in Waterloo, Ontario, Canada and a bachelor degree in engineering from the University ofSaskatchewan in Saskatoon, Saskatchewan, Canada.
Directors
Jean-Paul Cossart, Director. Jean-Paul Cossart is an Associate Director of Infoteria of France, a companythat provides technological coaching. He has held this position since 2004. Prior to this Mr. Cossart was VicePresident Strategy and Marketing of Cofratel since 2002, a company that provides PBX and LAN integration forthe enterprise market and was a subsidiary of France Telecom. Mr. Cossart also held several positions atAlcatel-CIT (Paris, France). Mr. Cossart’s experience has spanned service provider, corporate and consumermarkets; telephony, data/internet and broadcast services; and international development, global sales andmarketing. He is also a member of the executive committee of the French chapter of the Institute of Directors,United Kingdom. Mr. Cossart has been an executive advisor to DragonWave since 2007 and has been grantedoptions to purchase 10,000 Common Shares as his only compensation for these services. Mr. Cossart is also onthe board of directors of Mitel Networks Corporation. Mr. Cossart holds an electronic engineering degree fromEcole Superieure d’Electricite in Paris.
Carl Eibl, Director. Carl Eibl has been a Managing Director with Enterprise Partners Venture Capital since2003. Prior to joining Enterprise Partners, Mr. Eibl was the CEO of several technology and life sciencecompanies in San Diego, including Maxwell Technologies, Inc. (NASDAQ: MXWL) (1999-2003). Before joiningMaxwell Technologies, Inc., Mr. Eibl served as President of Stratagene Corporation (NASDAQ: STGN).Mr. Eibl also served as CEO and President for Mycogen Corporation, a publicly held agricultural biotechnologycompany, which was sold to The Dow Chemical Company in 1998 for U.S.$1.1 billion. Mr. Eibl holds a J.D.degree from the Boston University School of Law in Boston, Massachusetts, United States and a bachelor of artsdegree from Cornell University in Ithaca, New York, United States.
Claude Haw, Director. Claude Haw is President, Chief Executive Officer and a board member of theOttawa Centre for Research and Innovation, Ottawa’s leading economic development organization. He is alsothe founder and managing partner of Venture Coaches Fund L.P. (‘‘Venture Coaches’’), an Ottawa-basedventure capital firm providing venture capital for technology companies. From 2003 to early 2007, Mr. Haw wasalso a general partner at Skypoint Capital Corporation, an Ottawa-based venture capital firm. Prior to VentureCoaches, Mr. Haw held a number of executive positions at Newbridge, including Vice President of CorporateBusiness Development. In this role, he managed strategic investment programs in more than 20 companies.Mr. Haw has also held senior management positions at Mitel Networks Corporation and Leigh Instruments Ltd.Mr. Haw holds a bachelor of electrical engineering degree from Lakehead University in Ontario, Canada andhas completed the Canadian Securities Course.
Terence Matthews, Director. Terence Matthews is Chairman of Wesley Clover International Corporation,March Networks Corporation (‘‘March Networks’’) and Mitel Networks Corporation (‘‘Mitel’’). Prior to MarchNetworks and Mitel, Mr. Matthews founded Newbridge in 1986 where he served as CEO and Chairman until itsacquisition by Alcatel of France (now Alcatel-Lucent) in May 2000. At Newbridge, Mr. Matthews built thecompany into a leader in the worldwide data networking industry. Mr. Matthews also co-founded MitelCorporation in 1972. A Fellow of the Institution of Electrical Engineers and the University of Wales,Mr. Matthews received an honorary doctor of technology degree from the University of Glamorgan, Wales and
50

an honorary doctor of engineering degree from Carleton University, Ottawa, Ontario, Canada. In May 1994, hewas appointed an Officer of the Order of the British Empire.
Gerry Spencer, Director (Chair). Gerry Spencer retired as Senior Vice President of BritishTelecommunications plc (‘‘BT’’) in late 2000 after a career of nearly 30 years in finance, product management,marketing, sales and business development. During his final 6 years with BT, he served on the board of BTGlobal Services, with particular responsibility for International Wholesale and Marketing. Since retiring,Mr. Spencer has assumed consulting and advisory roles in international wholesale strategy and profitability (bothswitched minutes and IP streams), local networking, network equipment supply and business customerequipment and applications. Currently, Mr. Spencer is a member of the Chairman’s advisory board at WesleyClover International Corporation. Mr. Spencer is a graduate of Cambridge University in the United Kingdom.
For more information on director compensation see ‘‘Compensation of Directors’’ in our managementproxy circular dated May 14, 2009 in connection with the annual and special meeting of shareholders held onJune 9, 2009 (our ‘‘Management Circular’’), which is incorporated by reference in this short form prospectus.
Board Committees
Our board of directors has established an Audit Committee, a Compensation Committee and a Nominatingand Governance Committee to assist the directors in efficiently carrying out their responsibilities.
Audit Committee
The mandate, role, responsibilities and procedures of the Audit Committee are set forth in our AuditCommittee Charter. The Audit Committee is responsible for, among other things, reviewing our financialreporting procedures, internal controls and the performance of our external auditors. The Audit Committee isalso responsible for reviewing quarterly financial statements, annual financial statements and related pressreleases prior to their approval by the full board of directors and certain other documents required by regulatoryauthorities. The Audit Committee Charter addresses in detail the relationship between the Audit Committeeand our external auditors and management, and contemplates direct communication channels between theAudit Committee and our external auditors. The Audit Committee is empowered to retain persons havingspecial competence as necessary to assist it in fulfilling its responsibilities. The Audit Committee is currentlycomprised of three directors: Claude Haw (Chair), Gerry Spencer and Jean-Paul Cossart. All members of theAudit Committee have accounting or related financial expertise. Each of the members of the Audit Committeeis ‘‘independent’’ within the meaning of Rule 10A-3 under the Exchange Act, the NASDAQ marketplace rulesand Canadian securities laws. Please refer to our annual information form dated May 7, 2009 for the fiscal yearended February 28, 2009, which is incorporated by reference in this short form prospectus, for the complete textof the Audit Committee Charter and additional information with respect to the Audit Committee.
Compensation Committee
The mandate of the Compensation Committee includes making recommendations to our board of directorson executive compensation, including the compensation of the President and Chief Executive Officer. Theresponsibilities of the Compensation Committee also include oversight of our equity compensation plans andmanagement succession strategy. The Compensation Committee is currently composed of three directors: CarlEibl (Chair), Jean-Paul Cossart and Claude Haw. Each of the members of the Compensation Committee is‘‘independent’’ within the meaning of the NASDAQ marketplace rules and Canadian securities laws.
Nominating and Governance Committee
The mandate of the Nominating and Governance Committee is to assist our directors in carrying out theiroversight responsibility, ensuring that our strategic direction is reviewed annually, and ensuring that our board ofdirectors and each of the board committees carry out its respective functions in accordance with an appropriateprocess. The Nominating and Governance Committee is also responsible for: assessing the effectiveness of ourboard of directors as a whole, as well the effectiveness of each board committee, and the contribution of eachindividual director; governance issues; identifying, recruiting, nominating, endorsing, recommending theappointment of, and orienting, new directors; and the ongoing training and education of our directors. The
51
Nominating and Governance Committee also reviews our Insider Trading Policy, Disclosure Policy and Code ofBusiness Conduct and Ethics and is responsible for recommending changes and any action required to deal withany breach of any such policy or code. Our full board of directors is also directly involved in corporategovernance matters upon the recommendation of the Nominating and Governance Committee and whereotherwise appropriate. The Nominating and Governance Committee is currently composed of three directors:Gerry Spencer (Chair), Carl Eibl and Claude Haw. Each of the members of the Nominating and GovernanceCommittee is ‘‘independent’’ within the meaning of the NASDAQ marketplace rules and Canadiansecurities laws.
Cease Trade Orders and Bankruptcies
Peter Allen, one of our directors and our Chief Executive Officer, was a director and the President ofInnovance, a private, venture capital funded, reconfigurable optical networking company. On December 23,2003, Innovance filed a Notice of Intent to make a proposal pursuant to Part III of the Bankruptcy andInsolvency Act (Canada) (the ‘‘BIA’’). Pricewaterhouse Coopers LLP consented to act as proposal trustee. OnJuly 12, 2004, a majority of the creditors of Innovance voted to accept the proposal, and the proposal receivedcourt approval on September 16, 2004. The proposal trustee reported in the applicable court materials that therewas no conduct of Innovance that was subject to censure, and no irregular facts to report in accordance withSection 173 of the BIA.
Terence Matthews, one of our directors, routinely invests in and acts as a director on the boards ofbusinesses that are at an early stage of development and that, as a result, involve substantial risks. Mr. Matthewswas a director of Ironbridge Networks Corporation, which went into receivership in January 2001 and West EndSystems Corporation, which went into receivership in February 1999.
Carl Eibl, one of our directors, was a director of TwinStar Systems, Inc. (‘‘TwinStar’’), a private start-upcompany that developed tools for semiconductor fabrication facilities. TwinStar ceased operations in May 2005and all of the assets of TwinStar were sold and a settlement with its creditors was completed by the end ofAugust 2005.
Gerry Spencer, the Chair of our board of directors, was the non-executive Chairman of an AIM-listedcompany, AT Communications Group plc (‘‘ATC’’), beginning in mid 2005. On April 15, 2009, Mr. Spencerannounced his intention to step down from the board of ATC, with his resignation to be made effective at ATC’sannual general meeting, which was held on May 28, 2009. In fact, he stood down at a meeting of the board ofdirectors on April 27, 2009, which was announced by ATC on April 30, 2009. On June 1, 2009, ATC announced asignificant delay of revenue from a major customer. On June 24, 2009, ATC announced that it had receivednotice of a possible claim under the warranties in a sale and purchase agreement relating to the disposal of awholly-owned subsidiary of ATC in March, 2009. In connection with the delay of revenue and the possible claim,ATC announced that it had requested, and received, a suspension, with immediate effect, of the trading of itsshares on AIM, pending clarification of ATC’s financial position. On August 3, 2009, ATC announced theappointment of Grant Thornton UK LLP as administrators of ATC. On August 4, 2009, Daisy Group plc, anAIM-listed company, announced that its wholly-owned subsidiary had entered into agreements to acquire all ofthe trading assets of ATC. On August 23, 2009, The Sunday Times (U.K. edition) reported that the LondonStock Exchange has launched an investigation into ATC following disclosures of accounting discrepancies.
None of our directors, officers or principal shareholders have been subject to a corporate cease trade orsimilar order.
Executive Compensation
Executive Compensation for the Fiscal Year Ended February 28, 2009
Detailed information concerning the compensation of our executive officers and directors for the fiscal yearended February 28, 2009 is contained in pages 12 to 32 of our Management Circular, which is incorporated byreference in this short form prospectus. For ease of reference, we have set out below the two key tables relatingto the compensation for the fiscal year ended February 28, 2009 for our Chief Executive Officer (Peter Allen),Chief Financial Officer (Russell Frederick), and our three other most highly compensated executive officers
52

during the fiscal year (collectively, the ‘‘Named Executive Officers’’). These tables have been extracted from ourManagement Circular.
Summary Compensation Table
The following table sets forth compensation information for the fiscal year ended February 28, 2009 for ourNamed Executive Officers.
Non-equityOption-based incentive plan All other Total
Salary awards compensation compensation compensationName and principal position ($) ($)(1) ($) ($) ($)
Peter Allen $200,000 $49,000 Nil Nil $249,000President and Chief ExecutiveOfficer
Russell Frederick $185,000 $31,500 Nil Nil $216,500Chief Financial Officer, VicePresident and Secretary
Erik Boch $185,000 $31,500 Nil Nil $216,500Vice President, R&D and ChiefTechnology Officer
Brian McCormack U.S.$200,000 U.S.$8,573(2) U.S.$310,340(3) Nil U.S.$518,913Vice President, Sales
Alan Solheim $185,000 $31,500 Nil Nil $216,500Vice President, Product LineManagement
(1) Option based award values are calculated at their fair market value established using the Black-Scholes methodology, which we havechosen as the method to value options as it is the most widely recognized methodology and is accepted by Canadian GenerallyAccepted Accounting Standards. The Black-Scholes model considers various factors including historical share prices, price volatilityand interest rates.
(2) Foreign exchange rate used to convert Canadian dollar to US dollars is 1.2248 (the Bank of Canada C$ to US$ closing rate onJanuary 13, 2009, being the date of the option grant).
(3) Mr. McCormack earned U.S.$310,340 in sales commission in fiscal year 2009.
Incentive plan awards — value vested or earned during the fiscal year ended February 28, 2009
The following table sets forth the value vested or earned by the Named Executive Officers under our equityand non-equity incentive plans for the fiscal year ended February 28, 2009.
Non-equity incentive planOption-based awards — compensation — Value
Value vested during the fiscal Share-based awards — Value earned during the fiscal yearName of Executive year ended February 28, 2009 vested during the fiscal year ended February 28, 2009Officer ($)(1) ($) ($)
Peter Allen $45,426 $85,709 Nil
Russell Frederick $13,530 $59,203 Nil
Erik Boch $19,330 $44,532 Nil
Brian McCormack $11,600 $24,116 U.S.$310,340(2)
Alan Solheim $15,460 $134,263 Nil
(1) Represents the aggregate dollar value that would have been realized if the options under the option-based award had been exercisedon the vesting date.
(2) Mr. McCormack earned U.S.$310,340 in sales commission in fiscal year 2009.
53
Recent Executive Compensation Developments
On June 9, 2009, in compliance with the rules of the TSX, our shareholders approved the exchange ofoptions originally granted to certain senior officers (the ‘‘Option Exchange’’), all as described in ourManagement Circular. Set forth below is the Outstanding Option-Based Awards and Share-Based Awards tableupdated to reflect this Option Exchange.
Outstanding Option-Based Awards and Share-Based Awards as at August 31, 2009
The following table sets forth all unexercised options outstanding as of August 31, 2009 for each NamedExecutive Officer, giving effect to the Option Exchange.
Option-Based Awards
Aggregatevalue of Share-Based AwardsNumber of unexercised
Common in-the-money Number of Market value of share-Shares Option options as at Common based awards that have
underlying exercise August 31, Shares that not vested as atName of unexercised price Option 2009 have not August 31, 2009Executive Officer options (#) ($)(1) expiration date ($)(2) vested (#) ($)(1)
Peter Allen 70,000 $1.34 January 13, 2014 $1,463,050 Nil Nil80,000 $4.45 October 5, 2013(1)
235,000 $2.46 June 22, 2011
Russell Frederick 45,000 $1.34 January 13, 2014 $602,450 Nil Nil45,000 $4.45 October 5, 2013(1)
70,000 $2.46 June 22, 2011
Erik Boch 45,000 $1.34 January 13, 2014 $732,850 Nil Nil50,000 $4.45 October 5, 2013(1)
100,000 $2.46 June 22, 2011
Brian McCormack 15,000 $1.34 January 13, 2014 $357,950 Nil Nil20,000 $4.45 October 5, 2013(1)
60,000 $2.46 June 22, 2010
Alan Solheim 45,000 $1.34 January 13, 2014 $652,650 Nil Nil50,000 $4.45 October 5, 2013(1)
80,000 $2.46 June 22, 2011
(1) Following the approval of the Option Exchange by shareholders on June 9, 2009, the options with an exercise price of $6.57 wereexchanged for options with an exercise price of $4.45. As the same time, the vesting schedule and the expiry date of the new optionswere extended by a period of one year.
(2) The closing market price of the Common Shares on the TSX on August 31, 2009 was $6.47.
Insurance
We maintain liability insurance for our directors and officers. The directors’ and officers’ insurance iscontained in a policy issued on June 1, 2009. The annual premium for the policy is $221,000. No portion of thepremium is directly paid by any of our directors or officers. The policy carries a limit of $40,000,000 and has adeductible of $25,000 for each claim.
INTERESTS OF MANAGEMENT AND OTHERS IN CERTAIN TRANSACTIONS
Private Investor Convertible Debentures and Warrants
Between October 12, 2005 and November 7, 2006, we borrowed funds from a group of our shareholderscomprised of Enterprise Partners V, L.P. and Enterprise Partners VI, L.P. (together ‘‘Enterprise’’), Wesley CloverInternational Corporation, Venture Coaches, The Business, Engineering, Science & Technology DiscoveriesFund Inc., VentureLink Brighter Future Fund Equity Inc. and William Sinclair. Three of these lenders hadnominees on our board of directors, namely, Carl Eibl of Enterprise, Terence Matthews of Wesley CloverInternational Corporation (a corporation controlled by Terence Matthews) and Claude Haw of Venture
54

Coaches. As of April 19, 2007, we owed the lenders a total of $13,378,472, consisting of $12.5 million in principaland $878,472 in accrued interest. On the closing of our initial public offering on April 19, 2007, all principal andinterest owed to these lenders was converted into an aggregate of 3,763,283 Common Shares (representing a10% discount to the price per Common Share of the initial public offering). As an inducement to extend theabove referenced credit to us, each lender was also granted a warrant to purchase that number of CommonShares equal to X/Y, where is X is equal to 6% of the principal amount advanced by the lender and Y is equal to$3.95, at an exercise price of $3.55 per share. The warrants expire on April 19, 2010. See ‘‘Options and Warrantsto Purchase Securities — Warrants Issued in Relation to Convertible Debt Financings’’.
Kanata Research Park Corporation
Our principal office located at 411 Legget Drive, Ottawa, Ontario is leased by us from KRPC pursuant to alease dated February 14, 2000, as most recently amended on October 25, 2006. The term of this lease expires onNovember 30, 2011. We currently lease approximately 26,306 square feet of rentable space. Aggregate leasepayments (base rent and all other rent and charges) are approximately $596,000 per annum. We also lease awarehouse facility at 362 Terry Fox Drive, Ottawa, Ontario from KRPC pursuant to a lease dated August 30,2006, as most recently amended on October 23, 2008. The term of this lease has been amended and expires onOctober 31, 2011. These premises consist of approximately 10,683 square feet of rentable space. Aggregateannual lease payments (base rent and all other rent and charges) are approximately $224,000. Additionalwarehouse space (4,050 square feet) located at 349 Terry Fox Drive, Ottawa, Ontario has been leased fromKRPC pursuant to a six month lease commencing February 1, 2008 and on a month-to-month basis after expiryof the initial six month term. Total rent payments for the year are estimated at $40,500. We believe that the termsof our leases reflect fair market terms and payment provisions at the times that the leases were negotiated.KRPC is a corporation wholly-owned by Terence Matthews, one of our directors.
BreconRidge Corporation
On November 4, 2005, we entered into a supply agreement with BreconRidge (the ‘‘Supply Agreement’’).Pursuant to the Supply Agreement, BreconRidge has agreed to provide us with production and pre-productionproducts and related services which may included prototype development and manufacturing, pre-productionand production product manufacturing for materials by way of purchase orders and forecasts from us. In thefiscal year 2009, we purchased manufacturing and other services in the approximate amount of $14.1 millionfrom BreconRidge. We negotiated the terms of the Supply Agreement on an arm’s-length basis and we believethat the terms reflect market terms and payment provisions. We have no minimum purchase commitmentspursuant to the Supply Agreement. Upon our request, BreconRidge provides us with price quotations forpre-production and production products and services. If such quotation is acceptable to us, we then issuepurchase orders to BreconRidge based on the pricing set forth in the quotation. The Supply Agreement providesthat, so long as we have established approved credit terms with BreconRidge, purchase orders submitted by usare paid within 30 days from the date of invoice. The term of the Supply Agreement is continuous untiltermination. Either we or BreconRidge may terminate the Supply Agreement on 30 days notice. TerenceMatthews, one of our directors, owns a significant equity interest in BreconRidge.
Wesley Clover Corporation
We also purchase services from Wesley Clover Corporation, a company controlled by Terence Matthews,one of our directors. Total net service purchases in the fiscal year ending February 28, 2009 was $204,504 ascompared to $100,000 in the 2008 fiscal year. These purchases have been recorded in sales & marketingexpenses in DragonWave’s Financial Statements for the fiscal year ended February 28, 2009.
DESCRIPTION OF SECURITIES BEING DISTRIBUTED
Each of the Common Shares entitles its holder to notice of, and to one vote at, all meetings of ourshareholders. Each of the Common Shares carries an entitlement to receive dividends if, as and when declaredby our board of directors. In the event of the liquidation, dissolution or winding-up of DragonWave, our netassets available for distribution to our shareholders will be distributed rateably among the holders of theCommon Shares.
55

Authorized and Issued Share Capital
Our authorized share capital consists of an unlimited number of Common Shares of which28,641,562 Common Shares are issued and outstanding on the date of this short form prospectus.
Shareholder Rights Plan
On June 9, 2009, our shareholders approved, ratified and confirmed our Shareholder Rights PlanAgreement dated January 29, 2009 (the ‘‘Rights Plan’’). The objective of the Rights Plan is to enable our boardof directors to better control the timing and process of unsolicited take-over bids. The Rights Plan was notadopted in response to or in anticipation of any pending or threatened take-over bid. It is not intended to andwill not prevent a take-over of DragonWave. Specifically, the Rights Plan is designed to encourage an offeroreither to make a ‘‘Permitted Bid’’ (as defined therein), without approval of our board of directors, or tonegotiate the terms of the offer with our board of directors. Failure to pursue either course of action creates thepotential for substantial dilution of the offeror’s position.
A summary of the Rights Plan is included in our Management Circular, which is incorporated by referencein this short form prospectus, and a copy of the Rights Plan has been filed with the Canadian securitiesregulatory authorities on SEDAR at www.sedar.com. See ‘‘Management’s Discussion and Analysis of FinancialCondition and Results of Operations — Fiscal Year Ended February 28, 2009 — Overview’’.
CONSOLIDATED CAPITALIZATION
The following table sets out our consolidated capitalization as at August 31, 2009 and after giving effect tothe Offering, in each case excluding the exercise of the Over-Allotment Option and the exercise of the optionsand warrants described under the heading ‘‘Options and Warrants to Purchase Securities’’. There has been nomaterial change in our share and loan capital on a consolidated basis since August 31, 2009.
This table should be read in conjunction with ‘‘Summary Consolidated Financial Information’’,‘‘Management’s Discussion and Analysis of Financial Condition and Results of Operations’’ and ‘‘Options andWarrants to Purchase Securities’’, DragonWave’s Financial Statements which are contained elsewhere, and areincorporated by reference, in this short form prospectus and our unaudited interim financial statements for thethree and six month periods ended August 31, 2009 which are incorporated by reference in this short formprospectus.
As at August 31, 2009 Pro Forma after giving(Before this Offering) effect to this Offering(2)
(amounts in C$ thousands,except for share amounts)
(unaudited)
Total debt (line of credit) . . . . . . . . . . . . . . . . . . . . . . . . . . . . . . 587 587Total current liabilities . . . . . . . . . . . . . . . . . . . . . . . . . . . . . . . . 22,523 22,523Shareholder’s equity . . . . . . . . . . . . . . . . . . . . . . . . . . . . . . . . . . 47,293 118,232
Total issued and outstanding Common Shares . . . . . . . . . . . . . . 28,633,995 36,209,978Contributed surplus . . . . . . . . . . . . . . . . . . . . . . . . . . . . . . . . . 1,744 1,478Deficit . . . . . . . . . . . . . . . . . . . . . . . . . . . . . . . . . . . . . . . . . . (74,452) (74,452)
Total capitalization(1) . . . . . . . . . . . . . . . . . . . . . . . . . . . . . . . . . . 185,267 383,826
(1) Based on the closing price of $6.47 for the Common Shares on August 31, 2009.
(2) After deducting the portion of the fee payable to the Underwriters and the estimated expenses of the Offering payable by us.
56

USE OF PROCEEDS
We expect to receive net proceeds from the sale of the Treasury Shares of approximately U.S.$68,554,071,after deducting our portion of the fee payable to the Underwriters and estimated offering expenses ofU.S.$1,700,350. We will not receive any of the net proceeds to the Selling Shareholders from the sale of theSecondary Shares.
We expect to use the net proceeds from the sale of the Treasury Shares as follows:
(i) as to approximately U.S.$27,421,629 (C$28,222,340) (40% of the net proceeds), to strengthen ourbalance sheet in preparation for new mobile broadband network deployments and to better position usto be selected as an equipment vendor for large network service providers;
(ii) as to approximately U.S.$20,566,221 (C$21,166,755) (30% of the net proceeds), to fund working capitalrequirements associated with accelerating sales and production of our products;
(iii) as to approximately U.S.$13,710,814 (C$14,111,170) (20% of the net proceeds), to continue to fund ourefforts to increase sales penetration in regions outside North America, including increasing globaldirect sales activity, expanding our distribution, VAR and OEM network, and providing training andsupport to strengthen the systems engineering and support organizations of our VARs and OEMs. Wealso plan to invest in human resources and supporting infrastructure to support this effort; and
(iv) as to the balance, to provide an available source of funding for potential future acquisitionopportunities.
Although we evaluate potential acquisition and investment opportunities from time to time, we have nopresent agreements or commitments with respect to any particular transaction.
While we currently anticipate that we will use the net proceeds from the sale of the Treasury Sharesreceived as set forth above, we may re-allocate these proceeds from time to time having consideration to ourstrategy relative to the market and other conditions in effect at the time, including those referred to under‘‘Risk Factors’’.
Pending the use of proceeds outlined above, we intend to invest the net proceeds from the sale of theTreasury Shares in investment grade, short-term, interest bearing securities. Our Chief Financial Officer isresponsible for following our investment policy.
DIVIDEND POLICY
We have never declared or paid any dividends on our Common Shares. We currently intend to retain anyfuture earnings to fund the development and growth of our business and do not anticipate paying any cashdividends in the foreseeable future. Any future determination by us to pay dividends will be at the discretion ofour board of directors and will depend upon many factors, including our results of operations, capitalrequirements and other factors as our board of directors deems relevant. There are no restrictions in our articlespreventing us from declaring dividends or paying dividends to our shareholders.
57

SELECTED CONSOLIDATED FINANCIAL INFORMATION
The following sets forth summary consolidated financial information for the periods indicated and isderived from DragonWave’s Financial Statements, which are contained elsewhere, and are incorporated byreference, in this short form prospectus. Historical results do not necessarily indicate results for any futureperiod. Each prospective purchaser should read the following information in conjunction with our consolidatedfinancial statements and the related notes and with our management’s discussion and analysis of consolidatedresults of operations and financial condition for the fiscal year ended February 28, 2009 dated May 7, 2009, ourmanagement’s discussion and analysis of consolidated results of operations and financial condition for theperiod ended May 31, 2009 dated July 14, 2009, and our management’s discussion and analysis of consolidatedresults of operations and financial condition for the period ended August 31, 2009 dated October 8, 2009 whichare incorporated by reference in this short form prospectus. See ‘‘Management’s Discussion and Analysis ofFinancial Condition and Results of Operations’’ and ‘‘Reconciliation to U.S. GAAP’’.
Three Months Ended Fiscal Years EndedMay 31, February 28/29,
2009 2008 2009 2008
(amounts in C$ thousands, except for share and per shareamounts)
(unaudited) (unaudited) (audited) (audited)
Consolidated Statements of Operations, ComprehensiveLoss and Deficit:
REVENUE . . . . . . . . . . . . . . . . . . . . . . . . . . . . . . . . 15,950 10,725 43,334 40,404Cost of sales . . . . . . . . . . . . . . . . . . . . . . . . . . . . . . 10,440 6,344 28,683 24,980
Gross profit . . . . . . . . . . . . . . . . . . . . . . . . . . . . . . . 5,510 4,381 14,651 15,424
EXPENSESResearch and development . . . . . . . . . . . . . . . . . . . . 3,024 3,131 10,628 10,378Selling and marketing . . . . . . . . . . . . . . . . . . . . . . . . 2,539 2,624 10,649 8,858General and administrative . . . . . . . . . . . . . . . . . . . . 1,231 1,130 4,079 3,885Investment tax credits . . . . . . . . . . . . . . . . . . . . . . . (60) (50) (82) (492)Restructuring charges . . . . . . . . . . . . . . . . . . . . . . . . — — 501 —
6,734 6,835 25,775 22,629
Loss from operations . . . . . . . . . . . . . . . . . . . . . . . . . . (1,224) (2,454) (11,124) (7,205)
Interest income . . . . . . . . . . . . . . . . . . . . . . . . . . . . . . 34 254 693 1,109Interest expense . . . . . . . . . . . . . . . . . . . . . . . . . . . . . (7) (9) (35) (203)Foreign exchange gain (loss) . . . . . . . . . . . . . . . . . . . . (1,686) 268 4,514 (1,453)Interest expense on debt component of redeemable
preferred shares and convertible debt . . . . . . . . . . . . — — — (500)
Loss before income taxes . . . . . . . . . . . . . . . . . . . . . . . (2,883) (1,941) (5,952) (8,252)Income taxes . . . . . . . . . . . . . . . . . . . . . . . . . . . . . . . . — — (37) —
Net and comprehensive loss . . . . . . . . . . . . . . . . . . . . . (2,883) (1,941) (5,989) (8,252)Deficit, beginning of period . . . . . . . . . . . . . . . . . . . . . (77,860) (71,871) (71,871) (63,619)
Deficit, end of period . . . . . . . . . . . . . . . . . . . . . . . . . (80,743) (73,812) (77,860) (71,871)
Loss per share(1)
Basic and fully diluted . . . . . . . . . . . . . . . . . . . . . . . (0.10) (0.07) (0.21) (0.35)
Basic and diluted(2) weighted average number ofshares outstanding . . . . . . . . . . . . . . . . . . . . . . . . 28,569,238 28,480,522 28,537,202 23,448,504
(1) Basic loss per share is calculated by dividing net loss by the weighted average number of Common Shares outstanding during theperiod. For all periods presented, the net loss available to shareholders equates to the net loss. The diluted loss per share does notdiffer from the basic loss per share as outstanding dilutive instruments are anti-dilutive.
(2) Excludes the effect of all options and warrants that are anti-dilutive for all periods presented.
58
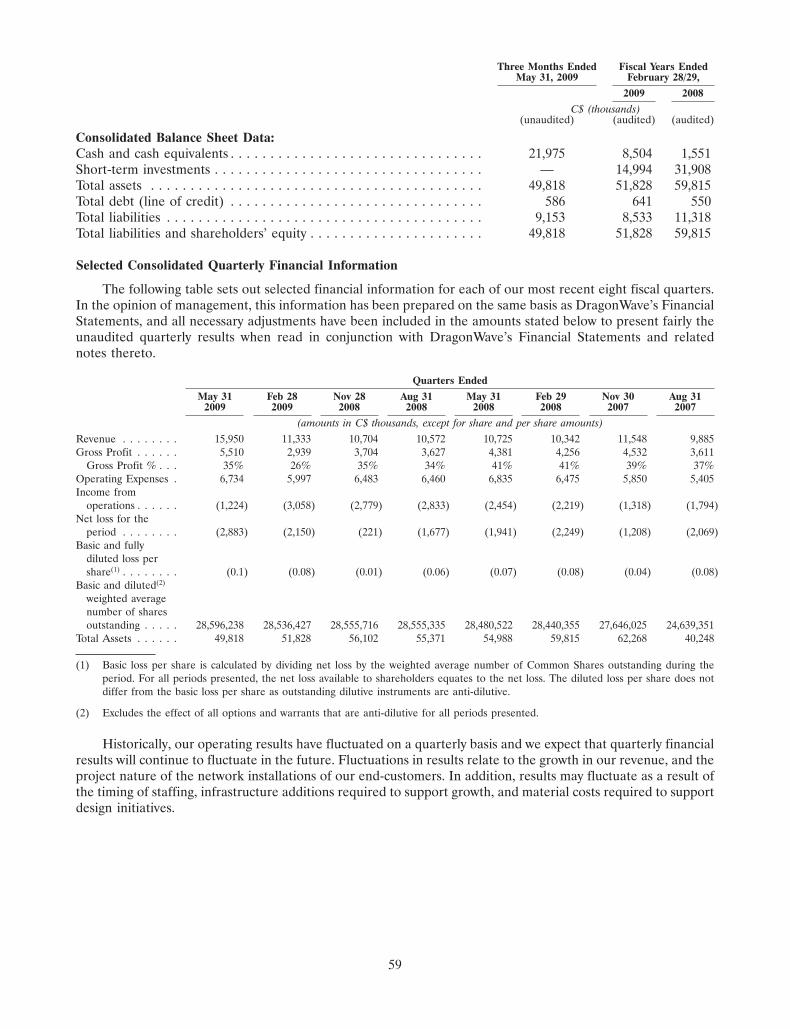
Three Months Ended Fiscal Years EndedMay 31, 2009 February 28/29,
2009 2008
C$ (thousands)(unaudited) (audited) (audited)
Consolidated Balance Sheet Data:Cash and cash equivalents . . . . . . . . . . . . . . . . . . . . . . . . . . . . . . . . 21,975 8,504 1,551Short-term investments . . . . . . . . . . . . . . . . . . . . . . . . . . . . . . . . . . — 14,994 31,908Total assets . . . . . . . . . . . . . . . . . . . . . . . . . . . . . . . . . . . . . . . . . . 49,818 51,828 59,815Total debt (line of credit) . . . . . . . . . . . . . . . . . . . . . . . . . . . . . . . . 586 641 550Total liabilities . . . . . . . . . . . . . . . . . . . . . . . . . . . . . . . . . . . . . . . . 9,153 8,533 11,318Total liabilities and shareholders’ equity . . . . . . . . . . . . . . . . . . . . . . 49,818 51,828 59,815
Selected Consolidated Quarterly Financial Information
The following table sets out selected financial information for each of our most recent eight fiscal quarters.In the opinion of management, this information has been prepared on the same basis as DragonWave’s FinancialStatements, and all necessary adjustments have been included in the amounts stated below to present fairly theunaudited quarterly results when read in conjunction with DragonWave’s Financial Statements and relatednotes thereto.
Quarters Ended
May 31 Feb 28 Nov 28 Aug 31 May 31 Feb 29 Nov 30 Aug 312009 2009 2008 2008 2008 2008 2007 2007
(amounts in C$ thousands, except for share and per share amounts)
Revenue . . . . . . . . 15,950 11,333 10,704 10,572 10,725 10,342 11,548 9,885Gross Profit . . . . . . 5,510 2,939 3,704 3,627 4,381 4,256 4,532 3,611
Gross Profit % . . . 35% 26% 35% 34% 41% 41% 39% 37%Operating Expenses . 6,734 5,997 6,483 6,460 6,835 6,475 5,850 5,405Income from
operations . . . . . . (1,224) (3,058) (2,779) (2,833) (2,454) (2,219) (1,318) (1,794)Net loss for the
period . . . . . . . . (2,883) (2,150) (221) (1,677) (1,941) (2,249) (1,208) (2,069)Basic and fully
diluted loss pershare(1) . . . . . . . . (0.1) (0.08) (0.01) (0.06) (0.07) (0.08) (0.04) (0.08)
Basic and diluted(2)
weighted averagenumber of sharesoutstanding . . . . . 28,596,238 28,536,427 28,555,716 28,555,335 28,480,522 28,440,355 27,646,025 24,639,351
Total Assets . . . . . . 49,818 51,828 56,102 55,371 54,988 59,815 62,268 40,248
(1) Basic loss per share is calculated by dividing net loss by the weighted average number of Common Shares outstanding during theperiod. For all periods presented, the net loss available to shareholders equates to the net loss. The diluted loss per share does notdiffer from the basic loss per share as outstanding dilutive instruments are anti-dilutive.
(2) Excludes the effect of all options and warrants that are anti-dilutive for all periods presented.
Historically, our operating results have fluctuated on a quarterly basis and we expect that quarterly financialresults will continue to fluctuate in the future. Fluctuations in results relate to the growth in our revenue, and theproject nature of the network installations of our end-customers. In addition, results may fluctuate as a result ofthe timing of staffing, infrastructure additions required to support growth, and material costs required to supportdesign initiatives.
59

MANAGEMENT’S DISCUSSION AND ANALYSISOF FINANCIAL CONDITION AND RESULTS OF OPERATIONS
Each prospective investor should read the following in conjunction with the ‘‘Summary Consolidated FinancialInformation’’ section of this short form prospectus, DragonWave’s Financial Statements which are containedelsewhere, and are incorporated by reference, in this short form prospectus and our unaudited interim consolidatedfinancial statements for the three and six month periods ended August 31, 2009 and our management’s discussionand analysis of results of operation for the period ended August 31, 2009 dated October 8, 2009 which areincorporated by reference in this short form prospectus. Our consolidated financial statements have been prepared inaccordance with Canadian GAAP. A reconciliation of the significant differences between Canadian GAAP andU.S. GAAP is presented in note 20 to DragonWave’s Financial Statements. The forward-looking statements in thisdiscussion regarding our industry, our expectations regarding our future performance, liquidity and capital resourcesand other non-historical statements in this discussion include numerous risks and uncertainties, as described in the‘‘Risk Factors’’ and ‘‘Caution Regarding Forward-Looking Statements’’ sections of this short form prospectus. Ouractual results may differ materially from those contained in any forward-looking statements. Each prospective investorshould read this discussion completely and with the understanding that our actual future results may be materiallydifferent from what we expect.
This Management’s Discussion and Analysis of Financial Condition and Results of Operations presentsinformation contained in our publicly disclosed documents and, in particular, information contained in ourmanagement’s discussion and analysis of consolidated results of operations and financial condition for the threemonths ended May 31, 2009 dated July 14, 2009, and our management’s discussion and analysis of consolidatedresults of operations and financial conditions for the year ended February 28, 2009 dated May 7, 2009, which areincorporated by reference in this short form prospectus.
Three Month Period Ended May 31, 2009
See ‘‘Selected Consolidated Financial Information’’ for summary consolidated financial information for thethree month period ended May 31, 2009.
Overview
We are a foremost industry innovator that designs, develops and manufactures carrier-grade microwaveequipment offering high-capacity broadband wireless systems for network operators and service providersworldwide. We deliver native Ethernet wireless point-to-point backhaul networks for the transport of voice,video and data.
On May 1, 2009, we made an announcement relating to the significant increase in order activity attributedto an existing customer in North America. Further, we released a business update on May 7, 2009 thatarticulated our expectation that our 2010 fiscal year would be a ‘‘break out’’ year for us as a result of the growthin sales we expect during the fiscal year. The three month period ended May 31, 2009 was shaped by this surge,with a record quarterly revenue of $16.0 million representing growth of 49% year over year. Underpinning thisincrease was a significant effort by our operations team to successfully adjust our output levels by working withour suppliers to respond to changing demand. Margin remained at 34.5%, consistent with the quarterly marginrealized in the fourth quarter of our 2009 fiscal year. We continue to execute our cost reduction strategies whichwill enable us to track back toward higher margins as the fiscal year progresses. Our loss from operationsnarrowed to $1.2 million, down from $2.5 million as compared to the first fiscal quarter of fiscal year 2008. Ournet loss increased from $1.9 million to $2.9 million year over year as a result of a foreign exchange expense of$1.7 million which resulted primarily from the translation of our cash and accounts receivable balances.
Our growth strategy continues to have a dual focus of satisfying the growing demands from our existingcustomers, coupled with our drive to acquire new service provider customers and distributors around the world.In the three months ended May 31, 2009, we shipped product to 11 new customers, increasing our customer baseto more than 260 customers in 57 countries. In our continued bid to offer comprehensive solutions to ourcustomer base, we announced that we had qualified for the Cisco Technology Developer Program whichconnects Cisco Systems Inc. with third-party developers of hardware and software to deliver tested interoperable
60

15SEP200923441493
solutions to joint customers. We also announced that our cost effective Horizon Compact solution was selectedfor Connecteo’s network throughout Western Africa.
We continue to focus on improving our margins by reducing the cost of our products. Our strategy toachieve this objective includes increased outsourcing from low-cost manufacturing locations in Asia. Further, wewill migrate certain time intensive manufacturing functions to contract manufacturers better able to scale outputfor high volumes. In addition to the cost benefits we anticipate from changing our sources of supply, and thelocation of manufacturing, we anticipate that high volume orders will enable us to achieve price discounts formany of our raw materials.
Revenue and Expenses
We distribute our products and services through a combination of direct and indirect sales channels. In theservice provider market, our direct sales efforts target customers worldwide implementing or planning networks,and include marketing to prospective customers where spectrum is being sold in anticipation of a network build.The sales cycle to this class of customer typically involves a trial (or trials), and generally requires nine to twelvemonths from first contact before we receive orders. Once the order stage is reached, we usually establish asupply agreement and process multiple orders under one master supply arrangement. We address the remainderof the market through a network of distributors, VARs and OEMs, leveraging the market specific expertise ofthese channel partners.
We evaluate revenue performance over three main geographic regions. These regions are North America,EMEA and the rest of the world (‘‘ROW’’). The following chart sets out the portion of new customers andexisting customers we shipped to in the first quarter of fiscal year 2010.
Number of Customers Shipped to in the Quarter EndedMay 31, 2009
15
8
30
2
21
0
5
10
15
20
25
30
35
EMEA North America ROW
New Customers
Existing Customers
The chart above demonstrates our continued push to expand our international reach. In order to achieveour globalization objective, we continue to hire new sales and customer support representatives, and invest incertifications and product variants that enable our products to be marketable across a spectrum of regions.
Our manufacturing strategy continues to center on the utilization of outsourced manufacturing to meet theincreasing demand for our products worldwide. As such, a large component of our cost of sales is the cost ofproduct purchased from outsourced manufacturers. In addition to the cost of product payable to outsourcedmanufacturers, we incur expenses associated with final configuration, testing, logistics and warranty activities.Final test and assembly is carried out on our premises. We primarily use the services of two outsourcedmanufacturers. One of those manufacturers is BreconRidge. BreconRidge is related to us because one of ourdirectors, Terence Matthews, holds a significant equity position in both DragonWave and BreconRidge. Webelieve that the commercial terms of our arrangement with BreconRidge reflect fair market terms and paymentprovisions.
Our R&D costs relate mainly to the compensation of our engineering group and the material consumptionassociated with prototyping activities.
61

Our selling and marketing expenses include the remuneration of sales staff, travel and trade show activities,and customer support services.
Our general and administrative expenses relate to the remuneration of related personnel, and professionalfees associated with tax, accounting and legal advice, and insurance costs.
Our occupancy and information systems costs are related to our leasing costs and communications networksand are accumulated and allocated, based on headcount, to all functional areas in our business. Our facilities areleased from a related party that is controlled by Terence Matthews, one of our directors and a shareholder ofDragonWave. We believe the terms of the lease reflect fair market terms and payment provisions.
As a consequence of being a publicly traded company the federal portion of investment tax credits earnedby us are no longer refundable but are still available to us to reduce future cash taxes payable. There remains arefundable provincial investment tax credit available to us.
We conduct the majority of our business transactions in two currencies, U.S. dollars and Canadian dollars.Most of our sales and cost of sales are denominated in U.S. dollars. Since our headquarters are located inCanada, the majority of our operating expenses (including salaries and operating costs but excluding cost ofsales) are denominated in Canadian dollars. The majority of the proceeds from our initial public offering inApril 2007 and follow-on offering in September 2007 were received by us in Canadian dollars. This supply ofCanadian currency significantly reduces the requirement for us to purchase Canadian dollars to pay Canadianbased expenses for the foreseeable future. The expense or gain in our consolidated statements of operations isdriven largely by the requirement to translate U.S.-based cash deposits and accounts receivable into Canadiandollars.
Comparison of the three months ended May 31, 2009 and May 31, 2008
Revenue
Three Months Ended
May 31, 2009 May 31, 2008
C$ (in thousands) C$ (in thousands)(unaudited)
15,950 10,725
Our revenue increased by 49% or $5.2 million for the three months ended May 31, 2009 compared with thesame period in the previous fiscal year.
Changes to Revenue: Three months ended May 31, 2009 vs Three months ended May 31, 2008
C$ (in thousands)(unaudited)
Existing customers: regional carriers and internet service providers, primarily in NorthAmerica . . . . . . . . . . . . . . . . . . . . . . . . . . . . . . . . . . . . . . . . . . . . . . . . . . . . . . . . . . . . 4,400
Existing customers: distributors and VARS globally . . . . . . . . . . . . . . . . . . . . . . . . . . . . . . 900New customers (Middle East, Europe, Turkey) . . . . . . . . . . . . . . . . . . . . . . . . . . . . . . . . . 200External engineering services contracts . . . . . . . . . . . . . . . . . . . . . . . . . . . . . . . . . . . . . . . (300)
5,200
62

The table below shows the first quarter regional revenue breakdown. The impact of the growth in demandfrom an existing carrier in North America is evident in the 59% increase in North America. The 25% growth inEMEA was driven by regional carrier demand primarily in Pakistan.
Three Months Ended
May 31, 2009 May 31, 2008
C$ (in thousands) C$ (in thousands)(unaudited)
North America . . . . . . . . . . . . . . . . . . . . . . . . . . . . . . . . 12,852 80% 8,059 75%Europe, Middle East & Africa . . . . . . . . . . . . . . . . . . . . . 3,027 19% 2,416 23%Rest of World . . . . . . . . . . . . . . . . . . . . . . . . . . . . . . . . . 71 1% 250 2%
15,950 100% 10,725 100%
Gross Margin
Three Months Ended
May 31, 2009 May 31, 2008
C$ (in thousands) C$ (in thousands)(unaudited)
5,510 4,38134.5% 40.8%
In the three months ended May 31, 2009, our gross margin remains at a level consistent with both the thirdand fourth fiscal quarter of our 2009 fiscal year (third quarter of fiscal 2009; 34.6% and fourth quarter of fiscal2009; 34.7% — before the AirPair provision). The factors which continue to have an impact on our gross margincenter on pricing pressures and product mix factors which we experienced through this period. Relative to thethree months ended May 31 2008, these factors combined to reduce margin by approximately 6%. We are in theprocess of securing a supply of raw materials which will assist us in reducing our material costs, in part as a resultof the higher volumes being ordered, and in part because of a change in the sources of supply. In addition,through our 2010 fiscal year, we will be migrating labour intensive final test and assembly processes to thecontract manufacturers, which is expected to help reduce our variable overhead and labour costs.
Research and Development
Three Months Ended
May 31, 2009 May 31, 2008
C$ (in thousands) C$ (in thousands)(unaudited)
3,024 3,131
R&D expenses decreased by $0.1 million in the three months ended May 31, 2009 when compared with thesame period in the previous fiscal year. The restructuring actions which were announced on the first day of thefourth quarter of our 2009 fiscal year had the effect of reducing our number of R&D resources. As a result,lower compensation related charges, and costs associated with external contractors were primary contributors tothe lower spending. (Positive variance: $0.2 million). In addition, lower project spending on software whencompared to the three months ended May 31, 2008 was also partly responsible for the improvement. (Positivevariance: $0.2 million). Offsetting these savings were the decreased recoveries generated from external contractbillings in comparison to the three months ended May 31, 2008. When revenue is recognized on these contractsthe associated costs are removed from R&D and recognized in cost of goods sold. (Negative variance:$0.3 million).
63

Sales & Marketing
Three Months Ended
May 31, 2009 May 31, 2008
C$ (in thousands) C$ (in thousands)(unaudited)
2,539 2,624
Our sales and marketing expenses decreased slightly in the three months ended May 31, 2009 relative to thesame period in the previous fiscal year.
Higher variable compensation costs which contributed to increased spending quarter over quarter($0.2 million) were offset by travel related reductions and sales promotion activity decreases. Travel and othersales spending decisions have been closely monitored and alternatives to travel, for example, have beenencouraged as part of the ongoing efforts to control spending.
General & Administrative
Three Months Ended
May 31, 2009 May 31, 2008
C$ (in thousands) C$ (in thousands)(unaudited)
1,231 1,130
General and administrative expenses increased by $0.1 million for the three months ended May 31, 2009when compared to the same period in the previous fiscal year.
The $0.1 million increase in spending can be attributed to higher compensation costs quarter over quarter.Two factors contributed to this growth: an increase in the resources required to administer the ‘‘new product’’introduction process as well as supply chain management functions in addition to variable compensationspending.
Investment Tax Credits
Three Months Ended
May 31, 2009 May 31, 2008
C$ (in thousands) C$ (in thousands)(unaudited)
(60) (50)
In the three months ended May 31, 2009 we continued to accrue an amount related to the refundableportion of the investment tax credits available in the province of Ontario. There has been no significant changein the value in the three months ended May 31, 2009 over the amount accrued in the same period in the previousfiscal year.
Interest Income (Expense), Net
Three Months Ended
May 31, 2009 May 31, 2008
C$ (in thousands) C$ (in thousands)(unaudited)
Interest income . . . . . . . . . . . . . . . . . . . . . . . . . . . . . . . . . . . . . . . . . . . . 34 254Interest expense . . . . . . . . . . . . . . . . . . . . . . . . . . . . . . . . . . . . . . . . . . . (7) (9)
26 245
64
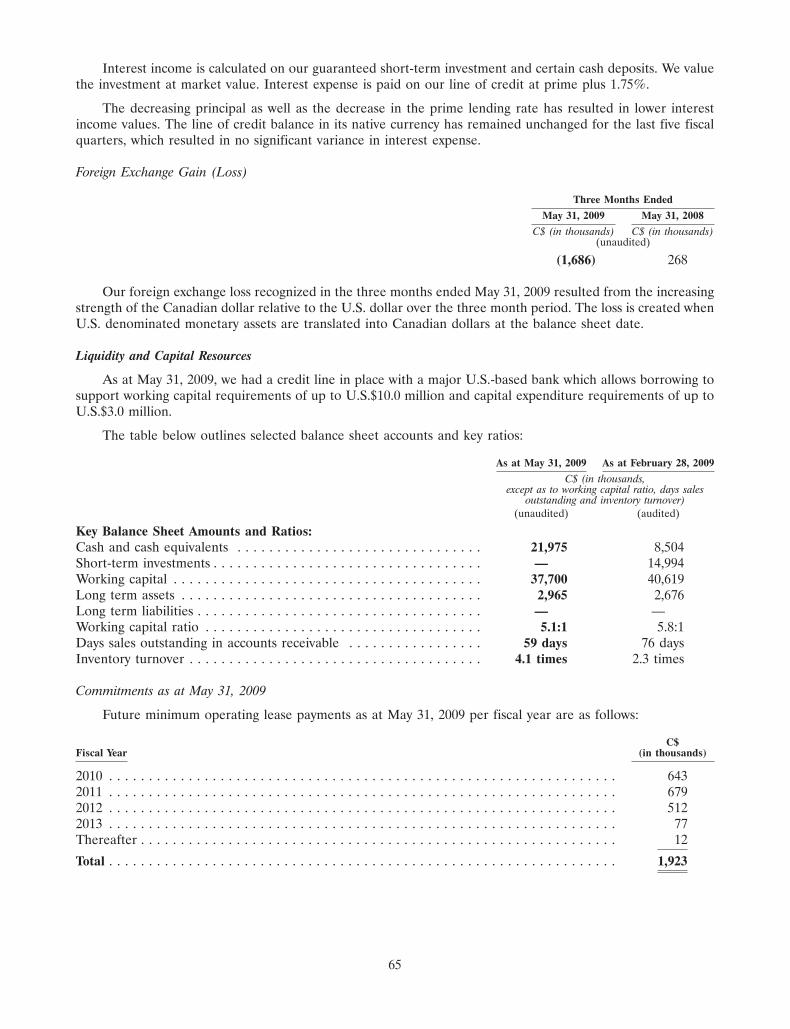
Interest income is calculated on our guaranteed short-term investment and certain cash deposits. We valuethe investment at market value. Interest expense is paid on our line of credit at prime plus 1.75%.
The decreasing principal as well as the decrease in the prime lending rate has resulted in lower interestincome values. The line of credit balance in its native currency has remained unchanged for the last five fiscalquarters, which resulted in no significant variance in interest expense.
Foreign Exchange Gain (Loss)
Three Months Ended
May 31, 2009 May 31, 2008
C$ (in thousands) C$ (in thousands)(unaudited)
(1,686) 268
Our foreign exchange loss recognized in the three months ended May 31, 2009 resulted from the increasingstrength of the Canadian dollar relative to the U.S. dollar over the three month period. The loss is created whenU.S. denominated monetary assets are translated into Canadian dollars at the balance sheet date.
Liquidity and Capital Resources
As at May 31, 2009, we had a credit line in place with a major U.S.-based bank which allows borrowing tosupport working capital requirements of up to U.S.$10.0 million and capital expenditure requirements of up toU.S.$3.0 million.
The table below outlines selected balance sheet accounts and key ratios:
As at May 31, 2009 As at February 28, 2009
C$ (in thousands,except as to working capital ratio, days sales
outstanding and inventory turnover)(unaudited) (audited)
Key Balance Sheet Amounts and Ratios:Cash and cash equivalents . . . . . . . . . . . . . . . . . . . . . . . . . . . . . . . 21,975 8,504Short-term investments . . . . . . . . . . . . . . . . . . . . . . . . . . . . . . . . . . — 14,994Working capital . . . . . . . . . . . . . . . . . . . . . . . . . . . . . . . . . . . . . . . 37,700 40,619Long term assets . . . . . . . . . . . . . . . . . . . . . . . . . . . . . . . . . . . . . . 2,965 2,676Long term liabilities . . . . . . . . . . . . . . . . . . . . . . . . . . . . . . . . . . . . — —Working capital ratio . . . . . . . . . . . . . . . . . . . . . . . . . . . . . . . . . . . 5.1:1 5.8:1Days sales outstanding in accounts receivable . . . . . . . . . . . . . . . . . 59 days 76 daysInventory turnover . . . . . . . . . . . . . . . . . . . . . . . . . . . . . . . . . . . . . 4.1 times 2.3 times
Commitments as at May 31, 2009
Future minimum operating lease payments as at May 31, 2009 per fiscal year are as follows:
C$Fiscal Year (in thousands)
2010 . . . . . . . . . . . . . . . . . . . . . . . . . . . . . . . . . . . . . . . . . . . . . . . . . . . . . . . . . . . . . . . . 6432011 . . . . . . . . . . . . . . . . . . . . . . . . . . . . . . . . . . . . . . . . . . . . . . . . . . . . . . . . . . . . . . . . 6792012 . . . . . . . . . . . . . . . . . . . . . . . . . . . . . . . . . . . . . . . . . . . . . . . . . . . . . . . . . . . . . . . . 5122013 . . . . . . . . . . . . . . . . . . . . . . . . . . . . . . . . . . . . . . . . . . . . . . . . . . . . . . . . . . . . . . . . 77Thereafter . . . . . . . . . . . . . . . . . . . . . . . . . . . . . . . . . . . . . . . . . . . . . . . . . . . . . . . . . . . . 12
Total . . . . . . . . . . . . . . . . . . . . . . . . . . . . . . . . . . . . . . . . . . . . . . . . . . . . . . . . . . . . . . . . 1,923
65

In addition to the above, on December 1, 2008, we issued a letter of credit to support a guarantee with aEuropean bank. The guarantee expires on April 30, 2010 and has an amount of up to 860,000 Euros. We areselling equipment to an integrator who will resell the equipment to a service provider. We will be required tofulfill our obligations under the guarantee in the event that the service provider defaults on its obligations to thebank. We have recourse against the integrator in the event that the guarantee is exercised.
Cash and Cash Equivalents and Short-term Investments
As at May 31, 2009, we had $22.0 million in cash and cash equivalents and short-term investments,representing a $1.5 million decrease from the $23.5 million in cash and cash equivalents and short-terminvestments we had at February 28, 2009. The cash outflow in the three months ended May 31, 2009 was due to anumber of factors. The net loss of ($2.3) million (adjusted for non-cash items) was the largest usage of cash,followed by the acquisition of property and equipment ($0.6 million). Offsetting these cash draws were changesin the non-cash working capital items ($1.4 million), driven by the reduction in our inventory levels.
Working Capital
February 28, 2009 toMay 31, 2009
C$ (in thousands)(unaudited)
Changes in working capitalCash and cash equivalents and short-term investments . . . . . . . . . . . . . . . . . . . . . . . . . . (1,523)Accounts receivable . . . . . . . . . . . . . . . . . . . . . . . . . . . . . . . . . . . . . . . . . . . . . . . . . . . 735Other receivables . . . . . . . . . . . . . . . . . . . . . . . . . . . . . . . . . . . . . . . . . . . . . . . . . . . . . (80)Inventory . . . . . . . . . . . . . . . . . . . . . . . . . . . . . . . . . . . . . . . . . . . . . . . . . . . . . . . . . . . (1,705)Prepaid expenses . . . . . . . . . . . . . . . . . . . . . . . . . . . . . . . . . . . . . . . . . . . . . . . . . . . . . 274Line of credit . . . . . . . . . . . . . . . . . . . . . . . . . . . . . . . . . . . . . . . . . . . . . . . . . . . . . . . . 55Accounts payable and accrued liabilities . . . . . . . . . . . . . . . . . . . . . . . . . . . . . . . . . . . . . (1,004)Deferred revenue . . . . . . . . . . . . . . . . . . . . . . . . . . . . . . . . . . . . . . . . . . . . . . . . . . . . . 329
Net change in working capital . . . . . . . . . . . . . . . . . . . . . . . . . . . . . . . . . . . . . . . . . . . . (2,919)
We calculate working capital as the difference between our current assets and current liabilities. Ourworking capital balance decreased by $2.9 million between February 28, 2009 and May 31, 2009. The decrease inour cash and cash equivalents and short-term investments had a significant impact, as did the decrease in ourinventory balances. Growth in the accounts receivable balance was offset by the growth in accounts payable andaccrued liabilities amounts.
We evaluate days sales outstanding (‘‘DSO’’) by determining the number of days of sales in the endingaccounts receivable balance with reference to the most recent monthly sales, rather than average yearly orquarterly values. The DSO in accounts receivable as at May 31, 2009 was 59 days. This calculation was 17 dayslower than the DSO of 76 days at February 28, 2009. The favourable DSO performance relates to strongcollection efforts and timely receipt of carrier payments. Inventory turnover for May 31, 2009 was 4.1 times forthe period then ended, an improvement to that experienced at February 28, 2009. Turnover is calculated withreference to the most recent monthly standard cost of goods sold and is based on the period ending inventorybalance of production related inventory (net of labour and overhead allocations). We will be continuing topursue a variety of actions with the objective of reducing inventory levels and improving turnover going forward.
66

Cash Inflows and Outflows
Three Months Ended
May 31, August 31, November 30, February 28, May 31,2008 2008 2008 2009 2009
C$ (in thousands)(unaudited)
Beginning Cash and Cash Equivalents (includingShort-term investments) . . . . . . . . . . . . . . . . . . . . 33,459 31,002 27,697 25,220 23,498
Net loss . . . . . . . . . . . . . . . . . . . . . . . . . . . . . . . . . (1,941) (1,677) (221) (2,150) (2,883)Non cash items . . . . . . . . . . . . . . . . . . . . . . . . . . . . 391 408 446 451 545Changes in working capital . . . . . . . . . . . . . . . . . . . (740) (1,711) (2,625) 79 1,451Investing activities . . . . . . . . . . . . . . . . . . . . . . . . . . (323) (347) (136) (117) (592)Financing activities . . . . . . . . . . . . . . . . . . . . . . . . . 156 22 59 15 (44)Ending cash . . . . . . . . . . . . . . . . . . . . . . . . . . . . . . 31,002 27,697 25,220 23,498 21,975Total cash used . . . . . . . . . . . . . . . . . . . . . . . . . . . . (2,457) (3,305) (2,477) (1,722) (1,523)
As at May 31, 2009, our cash utilization has continued to decline over the past four quarters.
Cash Used in Operating Activities
Our net loss, excluding non cash items, was $2.3 million in the three months ended May 31, 2009. Our usageof cash was offset by the changes in working capital. Our inventory levels decreased between February 28, 2009and May 31, 2009 and new inventory purchased within the quarter was still in accounts payable and accruedliabilities.
Purchase of Capital Asset
In the three months ended May 31, 2009 we invested in capital equipment to support engineering programsas well as the capacity requirements associated with the increase in sales demand. In the fiscal quarter spendingon capital equipment used $0.6 million in cash resources.
Liquidity and Capital Resource Requirements
Based on our recent performance, current revenue expectations, and the funds raised through the financingactivities during our 2009 fiscal year, as at May 31, 2009 we believe cash resources will be available to satisfy ourworking capital needs at least until May 31, 2010.
Off-Balance Sheet Arrangements
As discussed above under ‘‘Our Business — Operations and Facilities’’, we lease space for our headquartersin Ottawa, Ontario, Canada. Our R&D, services and support, and general and administrative groups operatefrom our headquarters. We also lease warehouse space in Ottawa, Ontario, Canada. The building lease and thewarehouse lease expire in November, 2011. We lease additional warehouse space on a month by month basis.Our rental costs including operating expenses total $71,650 per month. In April, 2008 we signed a leaseagreement in England. The lease expires in April, 2013 and rental costs including operating costs total $6,349per month. See ‘‘Operations and Facilities’’.
We use an outsourced manufacturing model whereby most of the component acquisition and assembly ofour products is executed by third parties. Generally, we provide the supplier with a purchase order 90 days inadvance of expected delivery. We are responsible for the financial impact of any changes to the productrequirements within this period.
Transactions with Related Parties
We lease premises from a real estate company controlled by one of our directors, Terence Matthews.During the three months ended May 31, 2009 and the year ended February 28, 2009, we paid $0.2 million and
67

$0.8 million respectively (three months ended May 31, 2008 — $0.2 million; year ended February 29, 2008 —$0.8 million), relating to the rent and operating costs associated with this real estate. We have allocated theseamounts among our various expense accounts.
We also purchased products and services from two companies controlled or significantly influenced byMr. Matthews (BreconRidge and Wesley Clover Corporation). Total net product and services purchased for thethree months ended May 31, 2009 and the year ended February 28, 2009 were $2.3 million and $14.3 millionrespectively (three months ended May 31, 2008 — $3.6 million; year ended February 29, 2008 — $14.9 million),and the value owing for net purchases at May 31, 2009 was $0.4 million (fiscal year ended February 28, 2009 —$1.4 million; year ended February 29, 2008 — $1.0 million) and is included in accounts payable and accruedliabilities. The majority of the purchases have been recorded in inventory and ultimately in cost of sales.
Interest expense paid to a related party for a convertible debenture for the three months ended May 31,2009 and the year ended February 28, 2009 was $nil and $nil respectively (fiscal year ended February 29, 2008 —$0.1 million).
All transactions are in the normal course of business and have been recorded at the exchange amount.
Description of Credit Facilities
Bank Line of Credit
As at May 31, 2009, we had drawn $0.6 million (fiscal year ended February 28, 2009 — $0.6 million), on anoperating credit facility with a limit of U.S.$10.0 million (fiscal year ended February 28, 2009 — $5 million).Interest is calculated at the bank’s prime rate of interest plus 1.75% (fiscal year ended February 28, 2009 — 1%)and resulted in a weighted average effective rate of 3.92% (three months ended May 31, 2008 — 6.22%; yearended February 28, 2009 — 5.44%). The draw on the line of credit is denominated in both Canadian andU.S. currencies. An additional U.S.$1.5 million has been reserved against the operating line of credit to secureletters of credit to support performance guarantees. We have provided a general security agreement on all of ourassets, including accounts receivable. We were in compliance with the financial covenants included in the lendingagreement as at May 31, 2009.
We also hold a capital expenditure facility with a limit of U.S.$3 million (fiscal year endedFebruary 28, 2009 — $nil).
Controls and Procedures
In compliance with the Canadian Securities Administrators’ National Instrument 52-109 — Certification ofDisclosure in Issuers’ Annual and Interim Filings, we have filed certificates signed by our Chief Executive Officer(‘‘CEO’’) and Chief Financial Officer (‘‘CFO’’) that, among other things, report on the design and effectivenessof disclosure controls and procedures and the design and effectiveness of internal controls over financialreporting. These reports were filed for the three months ended May 31, 2009 and the twelve months endedFebruary 28, 2009.
Critical Accounting Policies and Estimates
Inventory
We value inventory at the lower of cost and market. We calculate the cost of raw materials on a standardcost basis, which approximates average cost. Market is determined as net realizable value for finished goods, rawmaterials and work in progress. Indirect manufacturing costs and direct labour expenses are allocatedsystematically to the total production inventory.
Revenue recognition
We derive revenue from the sale of our broadband wireless backhaul equipment which includes embeddedsoftware and a license to use said software and extended product warranties. We consider software to beincidental to the product. Services range from installation and training to basic consulting. We recognize revenuewhen persuasive evidence of an arrangement exists, delivery has occurred and there are no significant remaining
68

vendor obligations, collection of receivables is reasonably assured and the fee is fixed and determinable. Wherefinal acceptance of the product is specified by the customer, revenue is deferred until acceptance criteria havebeen met. Additionally, our business agreements may contain multiple elements. Accordingly, we are required todetermine the appropriate accounting, including whether the deliverables specified in a multiple elementarrangement should be treated as separate units of accounting for revenue recognition purposes, the fair valueof these separate units of accounting and when to recognize revenue for each element. For arrangementsinvolving multiple elements, we allocate revenue to each component of the arrangement using the residual valuemethod, based on vendor-specific objective evidence of the fair value of the undelivered elements. Theseelements may include one or more of the following: advanced replacement, extended warranties, training, andinstallation. We allocate the arrangement fee, in a multiple-element transaction, to the undelivered elementsbased on the total fair value of those undelivered elements, as indicated by vendor-specific objective evidence.This portion of the arrangement fee is deferred. The difference between the total arrangement fee and theamount deferred for the undelivered elements is recognized as revenue related to the delivered elements. Insome instances, a group of contracts or agreements with the same customer may be so closely related that theyare, in effect, part of a single multiple element arrangement and, therefore, we would allocate the correspondingrevenue among the various components, as described above.
We generate revenue through direct sales and sales to distributors. Revenue on stocking orders sold todistributors is not recognized until the end-user is identified.
We evaluate arrangements that include services such as training and installation to determine whether thoseservices are essential to the functionality of other elements of the arrangement. When services are consideredessential, revenue allocable to the other elements is deferred until the services have been performed. Whenservices are not considered essential, the revenue allocable to the services is recognized as the servicesare performed.
We recognize revenue associated with extended warranty and advanced replacement rateably over the lifeof the contract.
We recognize revenue from engineering services or development agreements according to the specific termsand acceptance criteria as services are rendered.
We accrue estimated potential product liability as warranty costs when revenue on the sale of equipment isrecognized. We calculate warranty costs on a percentage of revenue per month based on current actual warrantycosts and return experience.
We record shipping and handling costs borne by us in costs of sales. Shipping and handling costs charged tocustomers are recorded as revenue, if billed at the time of shipment. Costs charged to customers after deliveryare recorded in cost of sales.
Research and development
Our research costs are expensed as incurred. Our development costs other than property and equipmentare expensed as incurred unless they meet generally accepted accounting criteria for deferral and amortization.Development costs incurred prior to establishment of technological feasibility do not meet these criteria, and areexpensed as incurred. Government assistance and investment tax credits relating to ongoing R&D costs arerecorded as a recovery of the related R&D expenses, where such assistance is reasonably assured.
Foreign currency translation
Our U.S. subsidiary, DragonWave Corp., is considered financially and operationally integrated and istranslated into Canadian dollars using the temporal method of translation: monetary assets and liabilities aretranslated at the period end exchange rate, non-monetary assets are translated at the historical exchange rate,and revenue and expense items are translated at the average exchange rate. Gains or losses resulting from thetranslation adjustments are included in our income.
69

Income taxes
We follow the liability method in accounting for income taxes. Under this method, current income taxes arerecognized based on an estimate of the current year. Future tax assets and liabilities are recorded for the effectsof temporary differences between the tax basis of an asset or liability and its reported amount in the financialstatements. The future benefit of losses available to be carried forward, and likely to be realized are measuredusing the substantively enacted tax rate in effect at the time in which the losses will be utilized. A valuationallowance is recorded when it is more likely than not that the benefit of the future income tax asset will notbe realized.
Future Accounting Changes
In 2006, Canada’s Accounting Standards Board ratified a strategic plan that will result in Canadian GAAP,as used by public companies, being evolved and converged with International Financial Reporting Standards(‘‘IFRS’’) over a transitional period to be complete by 2011 (Q1 FY2012). We will be required to report usingthe converged standards effective for interim and annual financial statements relating to fiscal years beginningon or after January 1, 2011. Canadian GAAP will be converged with IFRS through a combination of twomethods: as current joint-convergence projects of the United States’ Financial Accounting Standards Board andthe International Accounting Standards Board are agreed upon, they will be adopted by Canada’s AccountingStandards Board and may be introduced in Canada before the complete changeover to IFRS; and standards notsubject to a joint-convergence project will be exposed in an omnibus manner for introduction at the time of thecomplete changeover to IFRS. The International Accounting Standards Board currently has projects underwaythat should result in new pronouncements that continue to evolve IFRS.
Transition to IFRS
We will be required to report consolidated year end financial statements under IFRS for the first time onFebruary 28, 2012. We are aware of the magnitude of the effort involved to succeed in such a transition and havebegun the process to prepare for this eventuality.
We will start on the conversion plan in the first half of our 2010 fiscal year with the help of an externaladvisor. The project consists of three phases to be completed in order to change over to IFRS: diagnostic,development and implementation.
The first phase includes the identification of significant differences between the current Canadian GAAPstandards and IFRS that are relevant to us and a review of the alternatives available upon adoption. We willperform a diagnostic review and establish the most significant differences applicable to us. Canadian GAAP andIFRS differ in the following areas: revenue recognition, property and equipment, leases, provisions, reportingcurrency, presentation and additional disclosure requirements under IFRS. Additional differences might beidentified in the future as changes to IFRS standards are released.
The second phase includes identification, evaluation and selection of accounting policies necessary for us tochange over to IFRS as well as potential first-time adoption exemptions. During this phase, we will assess theimpact of the transition on the data system and internal control over financial reporting, the further trainingrequired for the financial team and the impact on business activities such as foreign currency, capitalrequirements, banking agreements or compensation arrangements. We will begin this phase in the third andfourth fiscal quarters of our 2010 fiscal year.
The implementation phase will integrate all the solutions into our financial system and processes that arenecessary for us to convert to IFRS.
Fiscal Year Ended February 28, 2009
See ‘‘Selected Consolidated Financial Information’’ for summary consolidated financial information for thefiscal year ended February 28, 2009.
70

Overview
We entered our 2009 fiscal year with a strategy to continue our thrust to grow revenue, expandinternationally, penetrate new customers, and improve margin. The fiscal 2009 year end results show that weattained revenue growth of 7% over our previous fiscal year. Two main factors constrained our revenue fromgrowing faster during our 2009 fiscal year. The first was the announcement of a business combination of two ofour service provider customers in North America (Clearwire and Sprint Nextel Corp.) that resulted in purchasesfrom both customers being curtailed as regulatory approval was pursued and the combination was completed.The combination of these two broadband businesses was completed successfully at the end of November, 2008and the transaction included an injection of U.S.$3.2 billion. The second factor constraining our growth was theeffect of the macroeconomic instability the world was experiencing which had the impact of changing somecustomer buying patterns to conserve cash. On the international expansion front, our revenue from outsideNorth America increased by 6% year over year. The dampening effect of the financial market situation was mostnoticeable in Europe, with the Middle East market reflecting less of an impact. Our new customer acquisitionwas strong with 55 new customers during our 2009 fiscal year bringing our customer base to more than250 customers worldwide, in 56 countries. Our value proposition for our Horizon product family with its carrier-class performance, low power consumption, and indoor and outdoor configurations was an importantdeterminant of our new customer wins. Our gross margin was 34% in our 2009 fiscal year versus 38% in our 2008fiscal year. Half of this decline in our gross margin is a result of an excess inventory charge of $1.0 million beingtaken in the fourth quarter of our 2009 fiscal year. This provision recognizes material that has become excessbased on the rapid success of our Horizon product platform. The other half of the decline was a combination ofproduct mix shifting to an average of lower capacity products, some one-time costs associated with a new serviceprovider win, and higher freight costs. Overall, we have remained healthy and are now well positioned to addressopportunities in our 2010 fiscal year.
Several important customer announcements during our 2009 fiscal year highlighted the scale andgeographic distribution of the new wins. In the Latin American region, M3 Wireless Ltd. of Bermuda announcedits intention to use our equipment for backhaul in its network and we were pleased to have Brightstar Corp. signon as a new distributor in the Caribbean. In Europe, Altitude Infrastructure Exploitation, a subsidiary ofAltitude, selected our products to provide high-capacity Ethernet backhaul as part of its rollout of WiMAXbroadband services across France. A win in Italy was also announced where LINKEM, one of that country’slargest broadband service providers, selected our Horizon Compact for its new WiMAX network. Pakistan hasbecome one of our most active markets, and our recently announced win with wi-tribe Pakistan Limited, aWiMAX service provider in the country, has further strengthened our presence there.
One of the most significant shifts in our product mix in our 2009 fiscal year was the swing toward ourHorizon product family. By the fourth quarter of our 2009 fiscal year, greater than 80% of all orders receivedwere for either Horizon Compact or Horizon Duo, and we expect this trend to continue. We are very pleasedwith the market’s adoption of our Horizon line of products and believe that we will continue to gain traction inthe backhaul market. The low projected demand for our AirPair products, however, has necessitated anexamination of our existing inventory levels for AirPair specific components. The total value of the inventoryprovision recorded in the fourth quarter of our 2009 fiscal year for excess AirPair inventory is $1.0 million. Asignificant portion of this provision relates to two critical components we secured as part of a last time buyagreement in 2005 ($0.9 million).
Within the context of limited revenue growth and visibility in our 2009 fiscal year, our focus was on costcontrol. Although we consciously expended certain costs to achieve new large customer wins, where possible wetook aggressive steps to find new sources of supply, and re-think shipping methods. In an environment of intensepricing pressure, higher fuel surcharges, and increased overhead and labour costs associated with the early stageproduction of our Horizon products, we were able to limit margin erosion to 2% before the excess inventoryprovision.
Overall gross margin before the excess inventory margin was 36.1% (fiscal year 2009 gross margin afterAirPair provision: 33.8%; fiscal year 2008 gross margin: 38.2%).
The aggressive cost reduction measures designed to proactively reduce our cost structure were extended toinclude the elimination of approximately twenty positions from our workforce in the third quarter of our 2009
71
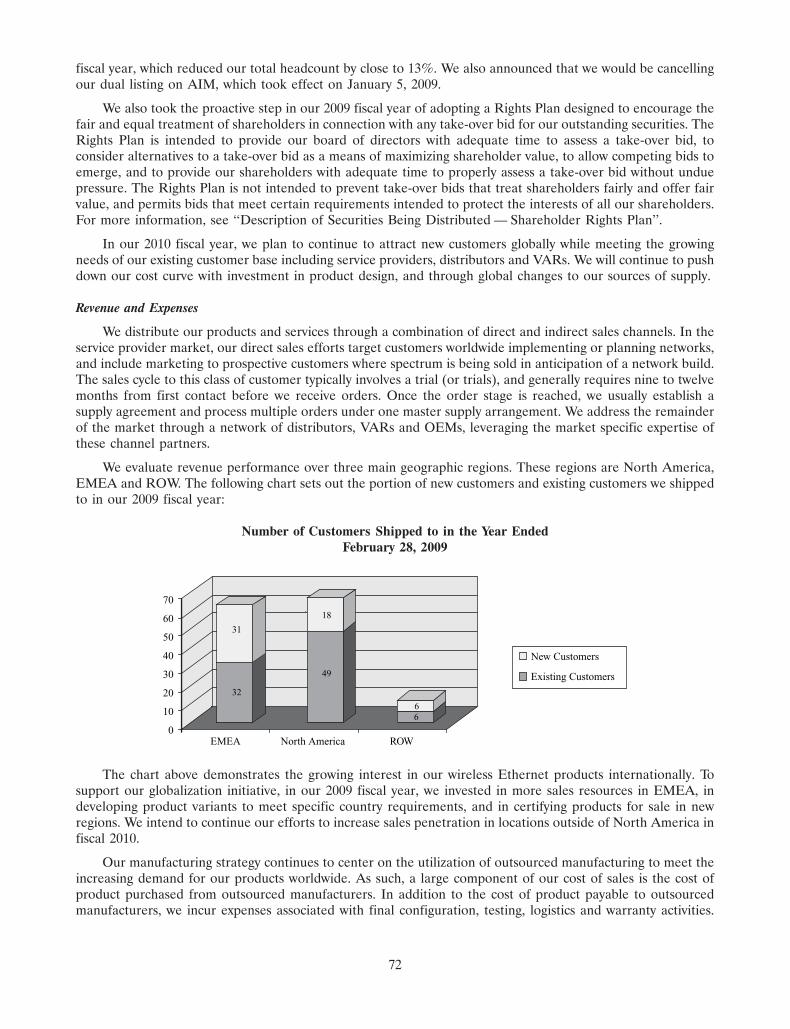
15SEP200923441643
fiscal year, which reduced our total headcount by close to 13%. We also announced that we would be cancellingour dual listing on AIM, which took effect on January 5, 2009.
We also took the proactive step in our 2009 fiscal year of adopting a Rights Plan designed to encourage thefair and equal treatment of shareholders in connection with any take-over bid for our outstanding securities. TheRights Plan is intended to provide our board of directors with adequate time to assess a take-over bid, toconsider alternatives to a take-over bid as a means of maximizing shareholder value, to allow competing bids toemerge, and to provide our shareholders with adequate time to properly assess a take-over bid without unduepressure. The Rights Plan is not intended to prevent take-over bids that treat shareholders fairly and offer fairvalue, and permits bids that meet certain requirements intended to protect the interests of all our shareholders.For more information, see ‘‘Description of Securities Being Distributed — Shareholder Rights Plan’’.
In our 2010 fiscal year, we plan to continue to attract new customers globally while meeting the growingneeds of our existing customer base including service providers, distributors and VARs. We will continue to pushdown our cost curve with investment in product design, and through global changes to our sources of supply.
Revenue and Expenses
We distribute our products and services through a combination of direct and indirect sales channels. In theservice provider market, our direct sales efforts target customers worldwide implementing or planning networks,and include marketing to prospective customers where spectrum is being sold in anticipation of a network build.The sales cycle to this class of customer typically involves a trial (or trials), and generally requires nine to twelvemonths from first contact before we receive orders. Once the order stage is reached, we usually establish asupply agreement and process multiple orders under one master supply arrangement. We address the remainderof the market through a network of distributors, VARs and OEMs, leveraging the market specific expertise ofthese channel partners.
We evaluate revenue performance over three main geographic regions. These regions are North America,EMEA and ROW. The following chart sets out the portion of new customers and existing customers we shippedto in our 2009 fiscal year:
Number of Customers Shipped to in the Year EndedFebruary 28, 2009
0
10
20
30
40
50
60
70
EMEA North America ROW
New Customers
Existing Customers
32
31
49
18
66
The chart above demonstrates the growing interest in our wireless Ethernet products internationally. Tosupport our globalization initiative, in our 2009 fiscal year, we invested in more sales resources in EMEA, indeveloping product variants to meet specific country requirements, and in certifying products for sale in newregions. We intend to continue our efforts to increase sales penetration in locations outside of North America infiscal 2010.
Our manufacturing strategy continues to center on the utilization of outsourced manufacturing to meet theincreasing demand for our products worldwide. As such, a large component of our cost of sales is the cost ofproduct purchased from outsourced manufacturers. In addition to the cost of product payable to outsourcedmanufacturers, we incur expenses associated with final configuration, testing, logistics and warranty activities.
72

Final test and assembly is carried out on our premises. We primarily use the services of two outsourcedmanufacturers. One of those manufacturers is BreconRidge. BreconRidge is related to us because one of ourdirectors, Terence Matthews, holds a significant equity position in both DragonWave and BreconRidge. Webelieve that the commercial terms of our arrangement with BreconRidge reflect fair market terms and paymentprovisions.
Our R&D costs relate mainly to the compensation of our engineering group and the material consumptionassociated with prototyping activities.
Our selling and marketing expenses include the remuneration of sales staff, travel and trade show activities,and customer support services.
Our general and administrative expenses relate to the remuneration of related personnel, and professionalfees associated with tax, accounting and legal advice, and insurance costs.
Our occupancy and information systems costs are related to our leasing costs and communications networksand are accumulated and allocated, based on headcount, to all functional areas in our business. Our facilities areleased from a related party that is controlled by Terence Matthews, one of our directors and also one of ourshareholders. We believe the terms of the lease reflect fair market terms and payment provisions.
For the period from March 1, 2007 until our initial public offering on April 19, 2007, DragonWave wasclassified as a Canadian controlled private corporation (‘‘CCPC’’). By virtue of being a CCPC, we claimed andreceived a partial cash refund relating to qualified R&D expenditures from the Canadian federal and provincialgovernments. The cash refundable amount was estimated by management each year and is reflected in ourfinancial statements as a reduction to our expenses. As a consequence of our ceasing to be a CCPC, the federalportion of investment tax credit we earn will no longer be refundable but will still be available to us at a reducedrate to reduce our future cash taxes payable. There is still a refundable provisional investment tax creditavailable to us.
We conduct the majority of our business transactions in two currencies, U.S. dollars and Canadian dollars.Most of our sales and cost of sales are denominated in U.S. dollars. Since our headquarters are located inCanada, the majority of our operating expenses (including salaries and operating costs but excluding cost ofsales) are denominated in Canadian dollars. The majority of the proceeds from our initial public offering inApril, 2007 and follow-on offering in September, 2007 were received by us in Canadian dollars. This supply ofCanadian currency significantly reduces the requirement for us to purchase Canadian dollars to pay Canadianbased expenses for the foreseeable future. The requirement to sell U.S. currency and purchase Canadian dollarsin the past exposed us to fluctuations in the Canadian and U.S. dollar exchange rates.
Comparison of the years ended February 28, 2009 and February 29, 2008
Year Ended
February 28, 2009 February 29, 2008
C$ (in thousands) C$ (in thousands)
43,334 40,404
Revenue increased by 7.3% or $2.9 million for the year ended February 28, 2009 compared with the yearended February 29, 2008.
73

Changes to Revenue; Fiscal Year Ended February 28, 2009 vs. Fiscal Year Ended February 29, 2008
C$ (in millions)
New customers: EMEA (primarily a regional carrier in Pakistan; VAR in Italy) . . . . . . . . . . . 3.5New customers: China and ROW . . . . . . . . . . . . . . . . . . . . . . . . . . . . . . . . . . . . . . . . . . . . 1.9New customers: North America (primarily from new VARs) . . . . . . . . . . . . . . . . . . . . . . . . . 1.2Existing customers: EMEA (Primarily the timing of completion of projects in
Germany/Spain) . . . . . . . . . . . . . . . . . . . . . . . . . . . . . . . . . . . . . . . . . . . . . . . . . . . . . . . (3.6)Existing customers: North America & ROW . . . . . . . . . . . . . . . . . . . . . . . . . . . . . . . . . . . . (0.1)
2.9
The table below, shows the fourth quarter and total year breakdown by region, and reveals the impact byregion of the factors described above.
Year Ended
February 28, 2009 February 29, 2008
C$ (in thousands) C$ (in thousands)
North America . . . . . . . . . . . . . . . . . . . . . . . . . . . . . . . . . . . . . . . . . . . . 29,641 69% 28,065 70%Europe, Middle East & Africa . . . . . . . . . . . . . . . . . . . . . . . . . . . . . . . . 11,334 26% 11,382 28%Rest of World . . . . . . . . . . . . . . . . . . . . . . . . . . . . . . . . . . . . . . . . . . . . 2,359 5% 957 2%
43,334 100% 40,404 100%
Gross Profit
Year Ended
February 28, 2009 February 29, 2008
C$ (in thousands) C$ (in thousands)
Gross Margin before Airpair inventory provision . . . . . . . . . . . . . . . . . . . 15,647 15,42436.1% 38.2%
Less: Airpair inventory provision . . . . . . . . . . . . . . . . . . . . . . . . . . . . . . . 996 0
Gross profit . . . . . . . . . . . . . . . . . . . . . . . . . . . . . . . . . . . . . . . . . . . . . . 14,651 15,42433.8% 38.2%
Our examination of the 2.1% margin percentage change when comparing our 2009 fiscal year to our 2008fiscal year reveals the impact of a number of pressures on our business. Once again, labour and overhead costsassociated with the final test and assembly for our Horizon product line are higher than our more matureAirPair product line and these higher costs had a 1% impact on our gross margin. Our shift to suppliers locatedin China and our utilization of a contract manufacturer in the United States resulted in higher freight costs andthis reduced margin by approximately 1% in the fiscal year as well. We continue to take significant steps toreduce the material costs of our products through design modifications and changes to our sources of supply. Weare employing strategies to minimize the impact of transportation costs and overhead and we expect the labourcosts associated with the early phases of producing Horizon Compact and Horizon Duo to decline withexperience and the migration of a greater portion of the process to contract manufacturers. The AirPairinventory provision had a 2.3% impact on margin for the fiscal year.
Research and Development
Year Ended
February 28, 2009 February 29, 2008
C$ (in thousands) C$ (in thousands)
10,628 10,378
74
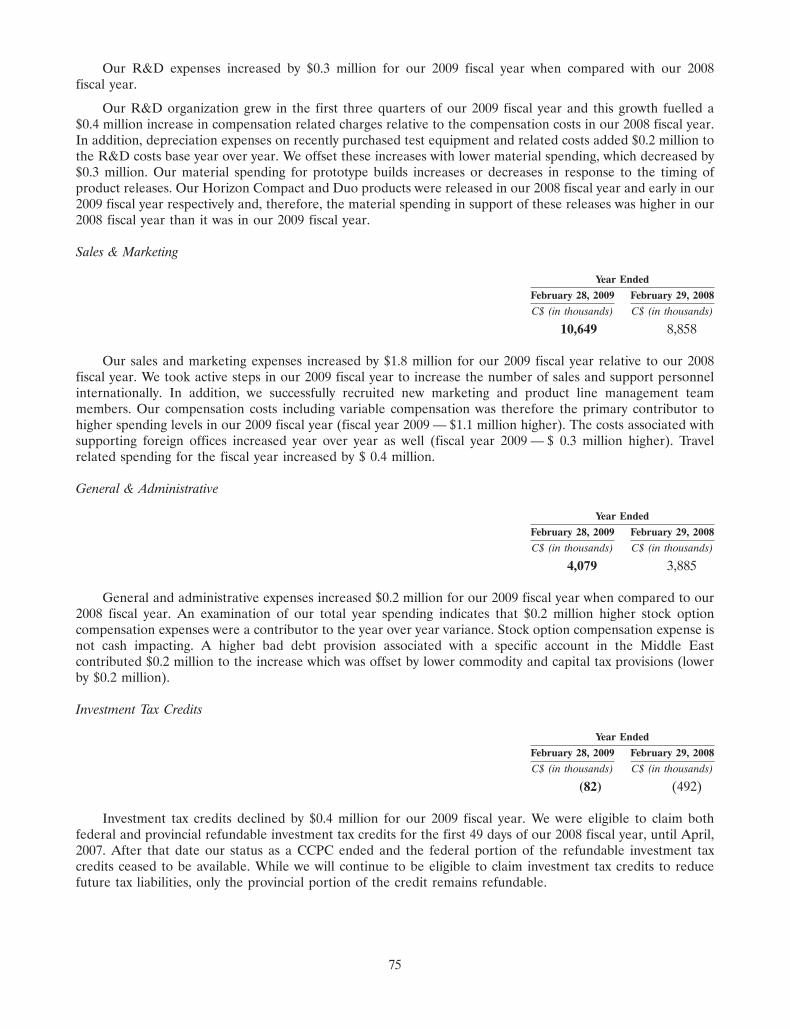
Our R&D expenses increased by $0.3 million for our 2009 fiscal year when compared with our 2008fiscal year.
Our R&D organization grew in the first three quarters of our 2009 fiscal year and this growth fuelled a$0.4 million increase in compensation related charges relative to the compensation costs in our 2008 fiscal year.In addition, depreciation expenses on recently purchased test equipment and related costs added $0.2 million tothe R&D costs base year over year. We offset these increases with lower material spending, which decreased by$0.3 million. Our material spending for prototype builds increases or decreases in response to the timing ofproduct releases. Our Horizon Compact and Duo products were released in our 2008 fiscal year and early in our2009 fiscal year respectively and, therefore, the material spending in support of these releases was higher in our2008 fiscal year than it was in our 2009 fiscal year.
Sales & Marketing
Year Ended
February 28, 2009 February 29, 2008
C$ (in thousands) C$ (in thousands)
10,649 8,858
Our sales and marketing expenses increased by $1.8 million for our 2009 fiscal year relative to our 2008fiscal year. We took active steps in our 2009 fiscal year to increase the number of sales and support personnelinternationally. In addition, we successfully recruited new marketing and product line management teammembers. Our compensation costs including variable compensation was therefore the primary contributor tohigher spending levels in our 2009 fiscal year (fiscal year 2009 — $1.1 million higher). The costs associated withsupporting foreign offices increased year over year as well (fiscal year 2009 — $ 0.3 million higher). Travelrelated spending for the fiscal year increased by $ 0.4 million.
General & Administrative
Year Ended
February 28, 2009 February 29, 2008
C$ (in thousands) C$ (in thousands)
4,079 3,885
General and administrative expenses increased $0.2 million for our 2009 fiscal year when compared to our2008 fiscal year. An examination of our total year spending indicates that $0.2 million higher stock optioncompensation expenses were a contributor to the year over year variance. Stock option compensation expense isnot cash impacting. A higher bad debt provision associated with a specific account in the Middle Eastcontributed $0.2 million to the increase which was offset by lower commodity and capital tax provisions (lowerby $0.2 million).
Investment Tax Credits
Year Ended
February 28, 2009 February 29, 2008
C$ (in thousands) C$ (in thousands)
(82) (492)
Investment tax credits declined by $0.4 million for our 2009 fiscal year. We were eligible to claim bothfederal and provincial refundable investment tax credits for the first 49 days of our 2008 fiscal year, until April,2007. After that date our status as a CCPC ended and the federal portion of the refundable investment taxcredits ceased to be available. While we will continue to be eligible to claim investment tax credits to reducefuture tax liabilities, only the provincial portion of the credit remains refundable.
75
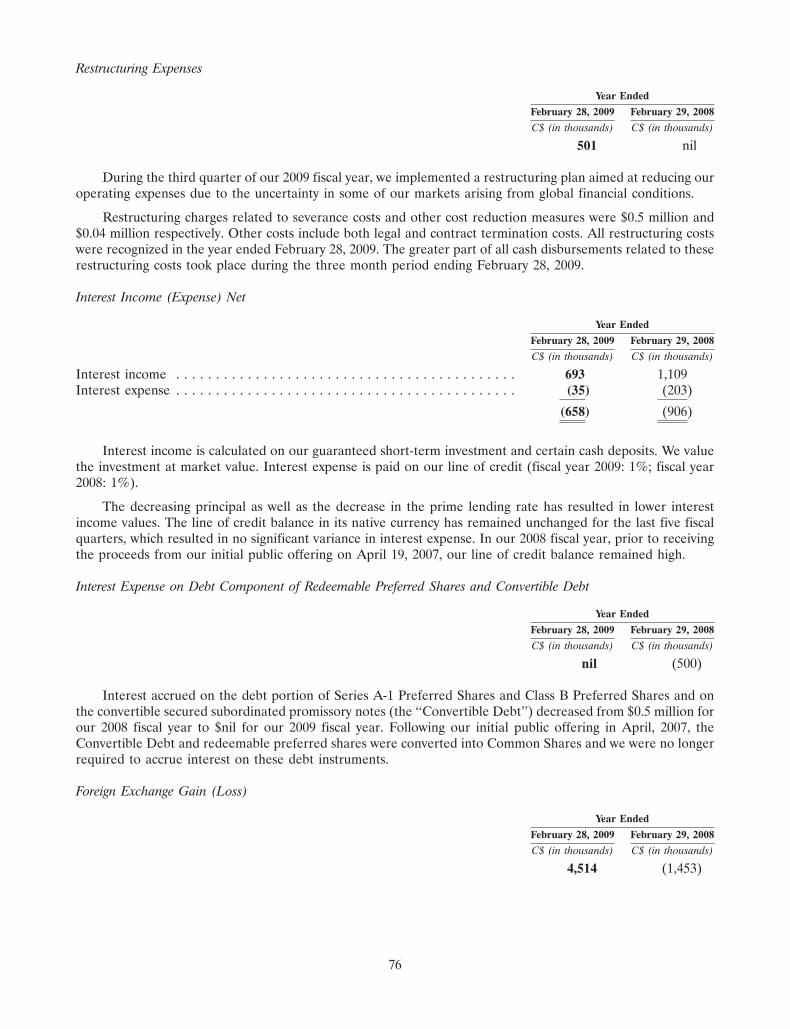
Restructuring Expenses
Year Ended
February 28, 2009 February 29, 2008
C$ (in thousands) C$ (in thousands)
501 nil
During the third quarter of our 2009 fiscal year, we implemented a restructuring plan aimed at reducing ouroperating expenses due to the uncertainty in some of our markets arising from global financial conditions.
Restructuring charges related to severance costs and other cost reduction measures were $0.5 million and$0.04 million respectively. Other costs include both legal and contract termination costs. All restructuring costswere recognized in the year ended February 28, 2009. The greater part of all cash disbursements related to theserestructuring costs took place during the three month period ending February 28, 2009.
Interest Income (Expense) Net
Year Ended
February 28, 2009 February 29, 2008
C$ (in thousands) C$ (in thousands)
Interest income . . . . . . . . . . . . . . . . . . . . . . . . . . . . . . . . . . . . . . . . . . . 693 1,109Interest expense . . . . . . . . . . . . . . . . . . . . . . . . . . . . . . . . . . . . . . . . . . . (35) (203)
(658) (906)
Interest income is calculated on our guaranteed short-term investment and certain cash deposits. We valuethe investment at market value. Interest expense is paid on our line of credit (fiscal year 2009: 1%; fiscal year2008: 1%).
The decreasing principal as well as the decrease in the prime lending rate has resulted in lower interestincome values. The line of credit balance in its native currency has remained unchanged for the last five fiscalquarters, which resulted in no significant variance in interest expense. In our 2008 fiscal year, prior to receivingthe proceeds from our initial public offering on April 19, 2007, our line of credit balance remained high.
Interest Expense on Debt Component of Redeemable Preferred Shares and Convertible Debt
Year Ended
February 28, 2009 February 29, 2008
C$ (in thousands) C$ (in thousands)
nil (500)
Interest accrued on the debt portion of Series A-1 Preferred Shares and Class B Preferred Shares and onthe convertible secured subordinated promissory notes (the ‘‘Convertible Debt’’) decreased from $0.5 million forour 2008 fiscal year to $nil for our 2009 fiscal year. Following our initial public offering in April, 2007, theConvertible Debt and redeemable preferred shares were converted into Common Shares and we were no longerrequired to accrue interest on these debt instruments.
Foreign Exchange Gain (Loss)
Year Ended
February 28, 2009 February 29, 2008
C$ (in thousands) C$ (in thousands)
4,514 (1,453)
76
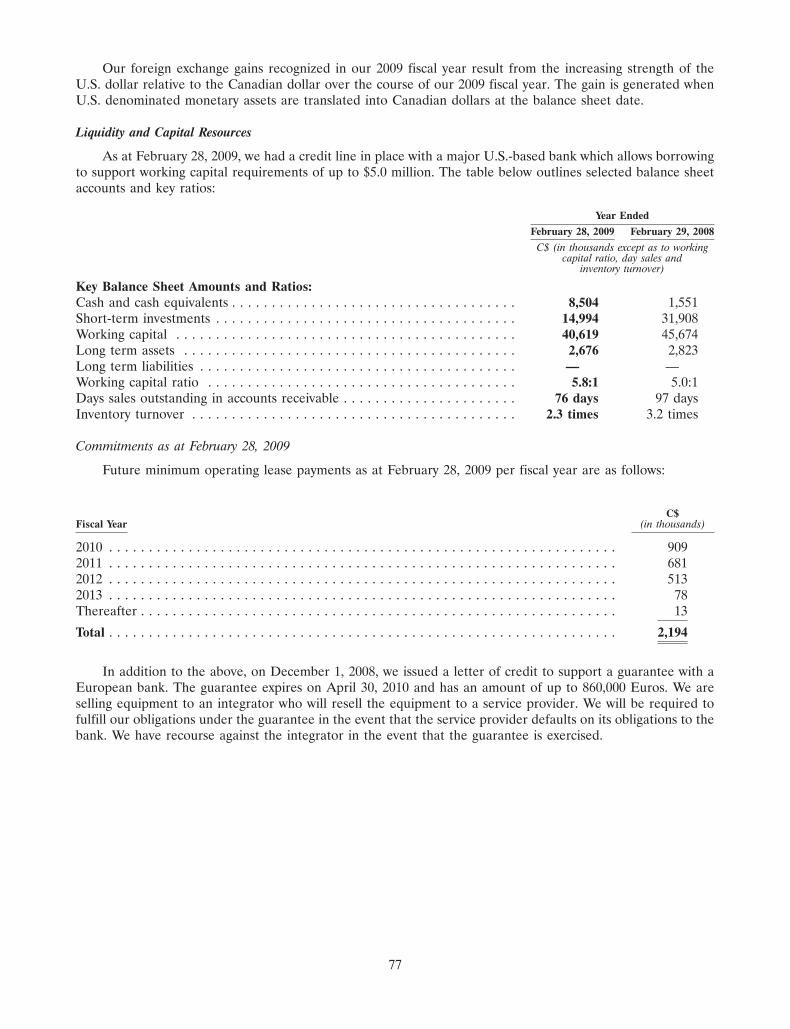
Our foreign exchange gains recognized in our 2009 fiscal year result from the increasing strength of theU.S. dollar relative to the Canadian dollar over the course of our 2009 fiscal year. The gain is generated whenU.S. denominated monetary assets are translated into Canadian dollars at the balance sheet date.
Liquidity and Capital Resources
As at February 28, 2009, we had a credit line in place with a major U.S.-based bank which allows borrowingto support working capital requirements of up to $5.0 million. The table below outlines selected balance sheetaccounts and key ratios:
Year Ended
February 28, 2009 February 29, 2008
C$ (in thousands except as to workingcapital ratio, day sales and
inventory turnover)
Key Balance Sheet Amounts and Ratios:Cash and cash equivalents . . . . . . . . . . . . . . . . . . . . . . . . . . . . . . . . . . . . 8,504 1,551Short-term investments . . . . . . . . . . . . . . . . . . . . . . . . . . . . . . . . . . . . . . 14,994 31,908Working capital . . . . . . . . . . . . . . . . . . . . . . . . . . . . . . . . . . . . . . . . . . . 40,619 45,674Long term assets . . . . . . . . . . . . . . . . . . . . . . . . . . . . . . . . . . . . . . . . . . 2,676 2,823Long term liabilities . . . . . . . . . . . . . . . . . . . . . . . . . . . . . . . . . . . . . . . . — —Working capital ratio . . . . . . . . . . . . . . . . . . . . . . . . . . . . . . . . . . . . . . . 5.8:1 5.0:1Days sales outstanding in accounts receivable . . . . . . . . . . . . . . . . . . . . . . 76 days 97 daysInventory turnover . . . . . . . . . . . . . . . . . . . . . . . . . . . . . . . . . . . . . . . . . 2.3 times 3.2 times
Commitments as at February 28, 2009
Future minimum operating lease payments as at February 28, 2009 per fiscal year are as follows:
C$Fiscal Year (in thousands)
2010 . . . . . . . . . . . . . . . . . . . . . . . . . . . . . . . . . . . . . . . . . . . . . . . . . . . . . . . . . . . . . . . . 9092011 . . . . . . . . . . . . . . . . . . . . . . . . . . . . . . . . . . . . . . . . . . . . . . . . . . . . . . . . . . . . . . . . 6812012 . . . . . . . . . . . . . . . . . . . . . . . . . . . . . . . . . . . . . . . . . . . . . . . . . . . . . . . . . . . . . . . . 5132013 . . . . . . . . . . . . . . . . . . . . . . . . . . . . . . . . . . . . . . . . . . . . . . . . . . . . . . . . . . . . . . . . 78Thereafter . . . . . . . . . . . . . . . . . . . . . . . . . . . . . . . . . . . . . . . . . . . . . . . . . . . . . . . . . . . . 13
Total . . . . . . . . . . . . . . . . . . . . . . . . . . . . . . . . . . . . . . . . . . . . . . . . . . . . . . . . . . . . . . . . 2,194
In addition to the above, on December 1, 2008, we issued a letter of credit to support a guarantee with aEuropean bank. The guarantee expires on April 30, 2010 and has an amount of up to 860,000 Euros. We areselling equipment to an integrator who will resell the equipment to a service provider. We will be required tofulfill our obligations under the guarantee in the event that the service provider defaults on its obligations to thebank. We have recourse against the integrator in the event that the guarantee is exercised.
77

Cash, Cash Equivalents and Short-term Investments
As at February 28, 2009, we had $23.5 million in cash and cash equivalents plus short-term investmentsrepresenting a $10.0 million decrease from February 29, 2008. The cash was used in our 2009 fiscal year in anumber of ways. First, the net loss of $4.3 million ($6.0 million when adjusted for items in our statements ofoperations which do not affect cash including $1.1 million in depreciation and $0.6 million in stock basedcompensation) had a significant impact. While the $5.0 million growth in non-cash working capital was also animportant driver, the most significant element in the non-cash working capital increase was the growth ininventory. We continued to invest in critical capital assets in our 2009 fiscal year and this further utilized$0.9 million in cash resources. Offsetting these factors were a number of small financing activities in our 2009fiscal year including most prominently the exercise of warrants. Together these activities provided $0.3 million tothe cash available to us.
Working Capital
February 29, 2008 toFebruary 28, 2009
C$ (in millions)
Changes in working capitalCash and cash equivalents and short-term investments . . . . . . . . . . . . . . . . . . . . . . . . . . (10.0)Accounts receivable . . . . . . . . . . . . . . . . . . . . . . . . . . . . . . . . . . . . . . . . . . . . . . . . . . . (0.9)Other receivables . . . . . . . . . . . . . . . . . . . . . . . . . . . . . . . . . . . . . . . . . . . . . . . . . . . . . (0.4)Inventory . . . . . . . . . . . . . . . . . . . . . . . . . . . . . . . . . . . . . . . . . . . . . . . . . . . . . . . . . . . 3.7Prepaid expenses . . . . . . . . . . . . . . . . . . . . . . . . . . . . . . . . . . . . . . . . . . . . . . . . . . . . . (0.3)Line of credit . . . . . . . . . . . . . . . . . . . . . . . . . . . . . . . . . . . . . . . . . . . . . . . . . . . . . . . . (0.1)Accounts payable and accrued liabilities . . . . . . . . . . . . . . . . . . . . . . . . . . . . . . . . . . . . . 3.4Deferred revenue . . . . . . . . . . . . . . . . . . . . . . . . . . . . . . . . . . . . . . . . . . . . . . . . . . . . . (0.5)
Net change in working capital . . . . . . . . . . . . . . . . . . . . . . . . . . . . . . . . . . . . . . . . . . . . (5.1)
We calculate working capital as the difference between our current assets and current liabilities. Ourworking capital balance decreased by $5.1 million between February 29, 2008 and February 28, 2009. Thedecrease in cash and cash equivalents combined with short-term investments had the most significant impact.Decreases in the outstanding accounts receivable balance as well as other receivables was offset by the growth ininventory and the decrease in accounts payable and accrued liabilities amounts.
We evaluate DSO by determining the number of days of sales in the ending accounts receivable balancewith reference to the most recent monthly sales, rather than average yearly or quarterly values. The DSO inaccounts receivable, as at February 28, 2009 was 76 days. This calculation was 21 days lower than the DSO of97 days at February 29, 2008. A significant number of customers worldwide are demanding longer paymentterms, which is a reflection of the global economic environment at present. This appetite for extended terms islikely to continue to push our days sales outstanding figure higher.
Inventory turnover for February 28, 2009 was 2.3 times for the period then ended, a turnover level similar tothat experienced at November 30, 2008. Turnover is calculated with reference to the most recent monthlystandard cost of goods sold and is based on the period ending inventory balance of production related inventory(net of labour and overhead allocations). We will be continuing to pursue a variety of strategic directions withtheir outsourced manufacturers with the objective of reducing inventory levels and improving turnovergoing forward.
78

Cash Inflows and Outflows
Year Ended
February 28, 2009 February 29, 2008
C$ (in thousands) C$ (in thousands)
Cash Inflows (Outflows) by Activity:Operating activities . . . . . . . . . . . . . . . . . . . . . . . . . . . . . . . . . . . . . . . . . (10,356) (10,272)Investing activities . . . . . . . . . . . . . . . . . . . . . . . . . . . . . . . . . . . . . . . . . 16,150 (34,182)Financing activities . . . . . . . . . . . . . . . . . . . . . . . . . . . . . . . . . . . . . . . . . 252 45,150Effect of foreign exchange on bank accounts . . . . . . . . . . . . . . . . . . . . . . 907 (479)Net cash inflows . . . . . . . . . . . . . . . . . . . . . . . . . . . . . . . . . . . . . . . . . . . 6,953 217
Cash Used in Operating Activities
Our net loss accounted for the majority of the usage ($6.0 million), while the increase in non-cash workingcapital ($5.0 million) accounted for the majority of the remaining difference.
Investing Activities
Capital asset purchases for our 2009 fiscal year were $0.9 million compared to $2.8 million for the sameperiod in our previous fiscal year. In our 2008 fiscal year the significant capital spending level related primarilyto the acquisition of test equipment and R&D lab equipment required to meet the changing capabilityrequirements of the new product lines including Horizon Compact and Horizon Duo. This spending declined inour 2009 fiscal year as most of the capability related equipment was already purchased. Spending also occurredto a lesser extent in the desktop and IT infrastructure area to meet the needs of our growing labour force. Thematurity of the short-term investment of $17.1 million accounted for the majority of the funds provided byinvesting activities.
Financing Activities
We experience a limited level of financing activity during or 2009 fiscal year. We received proceeds of$0.2 million due to the issuance of 114,980 Common Shares as a result of our bank exercising three separatewarrants. Financing activities in our 2008 fiscal year included the $49.0 million proceeds from our initial publicoffering and a follow-up offering.
Liquidity and Capital Resource Requirements
Based on our recent performance, current revenue expectations, and the funds raised through the financingactivities during our 2009 fiscal year as outlined above, and as at February 28, 2009, we believe cash resourceswill be available to satisfy our working capital needs for at least until February 28, 2010. See also ‘‘ManagementDiscussion and Analysis — Three Months Ended May 31, 2009 — Liquidity and Capital Resource — Liquidityand Capital Resource Requirements’’.
Off Balance Sheet Arrangements
As discussed above under ‘‘Our Business — Operations and Facilities’’, we lease space for our headquartersin Ottawa, Ontario, Canada. Our R&D, services and support, and general and administrative groups operatefrom our headquarters. We also lease warehouse space in Ottawa, Ontario, Canada. The building lease expiresin November, 2011, while the warehouse lease expires in October, 2009. We lease additional warehouse space ona month by month basis. As at February 28, 2009, our rental costs including operating expenses totalled $63,000per month. In April, 2008 we signed a lease agreement in England. The lease expires in April, 2013 and rentalcosts including operating costs total $6,349 per month. See ‘‘Our Business — Operations and Facilities’’.
We use an outsourced manufacturing model whereby most of the component acquisition and assembly ofour products are executed by third parties. Generally, we provide the supplier with a purchase order 90 days inadvance of expected delivery. We are responsible for the financial impact of any changes to the productrequirements within this period.
79

Transactions with Related Parties
We lease premises from a real estate company controlled by one of our directors, Terence Matthews.During the year ended February 28, 2009, we paid $0.8 million (fiscal year ended February 29, 2008 —$0.8 million), relating to the rent and operating costs associated with this real estate. These amounts have beenallocated amongst various expense accounts.
We also purchased products and services from two companies controlled or significantly influenced byMr. Matthews (BreconRidge and Wesley Clover Corporation). Total net product and services purchased for theyear ended February 28, 2009 was $14.3 million (fiscal year ended February 29, 2008 — $14.9 million), and thevalue owing for net purchases at February 28, 2009 was $1.4 million (fiscal year ended February 29, 2008 —$1.0 million) and is included in accounts payable and accrued liabilities. The majority of the purchases have beenrecorded in inventory and ultimately in cost of sales.
Interest expense paid to a related party for a convertible debenture issued by us for the fiscal year endedFebruary 28, 2009 was $nil (fiscal year ended February 29, 2008 — $0.1 million).
All transactions are in the normal course of business and have been recorded at the exchange amount.
Description of Credit Facilities
Bank Line of Credit
As at February 28, 2009, we had drawn $0.6 million (fiscal year ended February 29, 2008 — $0.6 million), onan operating credit facility with a limit of $5.0 million (fiscal year ended February 29, 2008 — $5.0 million).Interest is calculated at the bank’s prime rate of interest plus 1.0% and resulted in a weighted average effectiverate of 5.44% (fiscal year ended February 29, 2008 — 8%). The draw on the line of credit is denominated in bothCanadian and U.S. currencies. We have provided a general security agreement on all of our assets, includingaccounts receivable. We were in compliance with the financial covenants included in the lending agreement as atFebruary 28, 2009.
Controls and Procedures
In compliance with the Canadian Securities Administrators’ National Instrument 52-109, we have filedcertificates signed by our CEO and our CFO that, among other things, report on the design and effectiveness ofdisclosure controls and procedures and the design and effectiveness of internal controls over financial reporting.These reports were filed for the twelve months ended February 28, 2009.
Disclosure controls and procedures
Our CEO and our CFO have designed disclosure controls and procedures, or have caused them to bedesigned under their supervision, in order to provide reasonable assurance that within the time periods specifiedin securities legislation:
• material information relating to us has been made known to them; and
• information required to be disclosed in our filings is recorded, processed, summarized and reported.
An evaluation was carried out, under the supervision of our CEO and CFO, of the effectiveness of ourdisclosure controls and procedures. Based on this evaluation, our CEO and CFO concluded that our disclosurecontrols and procedures are effective.
Internal controls over financial reporting
Our CEO and CFO have also designed internal controls over financial reporting as defined under Canadianlaw, or have caused them to be designed under their supervision, in order to provide reasonable assuranceregarding the reliability of our financial reporting and the preparation of our financial statements for externalpurposes in accordance with Canadian GAAP.
80

An evaluation was carried out, under the supervision of our CEO and CFO, of the design and effectivenessof our internal controls over financial reporting. Based on this evaluation, our CEO and CFO concluded thatour internal controls over financial reporting are effective.
Changes in internal controls over financial reporting
No changes were made to our internal controls over financial reporting that occurred during our fiscal year2009 that have materially affected, or are reasonably likely to materially affect, our internal controls overfinancial reporting.
Critical Accounting Policies and Estimates
Inventory
We value inventory at the lower of cost and market. We calculate the cost of raw materials on a standardcost basis, which approximates average cost. Market is determined as net realizable value for finished goods, rawmaterials and work in progress. Indirect manufacturing costs and direct labour expenses are allocatedsystematically to the total production inventory.
Revenue recognition
We derive revenue from the sale of our broadband wireless backhaul equipment which includes embeddedsoftware and a license to use said software and extended product warranties. We consider software to beincidental to the product. Services range from installation and training to basic consulting. We recognize revenuewhen persuasive evidence of an arrangement exists, delivery has occurred and there are no significant remainingvendor obligations, collection of receivables is reasonably assured and the fee is fixed and determinable. Wherefinal acceptance of the product is specified by the customer, revenue is deferred until acceptance criteria havebeen met. Additionally, our business agreements may contain multiple elements. Accordingly, we are required todetermine the appropriate accounting, including whether the deliverables specified in a multiple elementarrangement should be treated as separate units of accounting for revenue recognition purposes, the fair valueof these separate units of accounting and when to recognize revenue for each element. For arrangementsinvolving multiple elements, we allocate revenue to each component of the arrangement using the residual valuemethod, based on vendor-specific objective evidence of the fair value of the undelivered elements. Theseelements may include one or more of the following: advanced replacement, extended warranties, training, andinstallation. We allocate the arrangement fee, in a multiple-element transaction, to the undelivered elementsbased on the total fair value of those undelivered elements, as indicated by vendor-specific objective evidence.This portion of the arrangement fee is deferred. The difference between the total arrangement fee and theamount deferred for the undelivered elements is recognized as revenue related to the delivered elements. Insome instances, a group of contracts or agreements with the same customer may be so closely related that theyare, in effect, part of a single multiple element arrangement and, therefore, we would allocate the correspondingrevenue among the various components, as described above.
We generate revenue through direct sales and sales to distributors. Revenue on stocking orders sold todistributors is not recognized until the end-user is identified.
We evaluate arrangements that include services such as training and installation to determine whether thoseservices are essential to the functionality of other elements of the arrangement. When services are consideredessential, revenue allocable to the other elements is deferred until the services have been performed. Whenservices are not considered essential, the revenue allocable to the services is recognized as the servicesare performed.
We recognize revenue associated with extended warranty and advanced replacement rateably over the lifeof the contract.
We recognize revenue from engineering services or development agreements according to the specific termsand acceptance criteria as services are rendered.
81

We accrue estimated potential product liability as warranty costs when revenue on the sale of equipment isrecognized. We calculate warranty costs on a percentage of revenue per month based on current actual warrantycosts and return experience.
We record shipping and handling costs borne by us in costs of sales. Shipping and handling costs charged tocustomers are recorded as revenue, if billed at the time of shipment. Costs charged to customers after deliveryare recorded in cost of sales.
Research and development
Our research costs are expensed as incurred. Our development costs other than property and equipmentare expensed as incurred unless they meet generally accepted accounting criteria for deferral and amortization.Development costs incurred prior to establishment of technological feasibility do not meet these criteria, and areexpensed as incurred. Government assistance and investment tax credits relating to ongoing R&D costs arerecorded as a recovery of the related R&D expenses, and where such assistance is reasonably assured.
Foreign currency translation
Our U.S. subsidiary, DragonWave Corp., is considered financially and operationally integrated and istranslated into Canadian dollars using the temporal method of translation: monetary assets and liabilities aretranslated at the period end exchange rate, non-monetary assets are translated at the historical exchange rate,and revenue and expense items are translated at the average exchange rate. Gains or losses resulting from thetranslation adjustments are included in our income.
Income taxes
We follow the liability method in accounting for income taxes. Under this method, current income taxes arerecognized based on an estimate of the current year. Future tax assets and liabilities are recorded for the effectsof temporary differences between the tax basis of an asset or liability and its reported amount in the financialstatements. The future benefit of losses available to be carried forward, and likely to be realized are measuredusing the substantively enacted tax rate in effect at the time in which the losses will be utilized. A valuationallowance is recorded when it is more likely than not that the benefit of the future income tax asset will notbe realized.
Loss per share
Basic loss per share is calculated by dividing net loss available to shareholders by the weighted averagenumber of Common Shares outstanding during the period. For all periods presented, the net loss available toshareholders equates to the net loss. The diluted loss per share does not differ from the basic loss per share asoutstanding dilutive instruments are anti-dilutive.
As of February 28, 2009, diluted net loss per share is equal to the basic net loss per share since the effect ofexercising 2,075,918 stock options (fiscal year ended February 29, 2008 — 1,604,350) would be anti-dilutive forall periods.
Equity Compensation Plans
We have a Stock Option Plan which is described in note 9 to the DragonWave Financial Statements. Weaccount for stock options granted to employees using the fair value method, in accordance with therecommendations in CICA Handbook section 3870, Stock-based Compensation and Other Stock-basedPayments. In accordance with the fair value method, we recognize estimated compensation expense related tostock options over the vesting period of the options granted, with the related credit being charged to contributedsurplus.
We launched an employee share purchase plan on October 20, 2008. The plan includes provisions to allowemployees to purchase Common Shares. We will match the contribution at a rate of 25%. Proceeds fromemployees and cost of matching shares are recorded in equity at the time the shares are issued. The shares
82

contributed by us will vest 12 months after issuance with a corresponding compensation expense recognizedinto income.
For further information, see ‘‘Options and Warrants to Purchase Securities — Equity Compensation Plans’’.
Changes in Accounting Policies
The CICA has issued the following new Handbook Sections which affect the current period:
a) Handbook Section 3862, ‘‘Financial Instruments — Disclosures,’’ applies to fiscal years beginning on orafter October 1, 2007. This Section modifies the disclosure standards for financial instruments thatwere included in Section 3861 ‘‘Financial Instruments — Disclosure and Presentation’’. The newstandard requires entities to provide disclosure on a) the significance of financial instruments for theentity’s financial position and performance and b) the nature and extent of risks arising from financialinstruments to which the entity is exposed during the period and at the balance sheet date, and how theentity manages those risks. We have provided the required disclosure in note 11 to DragonWave’sFinancial Statements.
b) Handbook Section 3863, ‘‘Financial Instruments — Presentation,’’ applies to fiscal years beginning onor after October 1, 2007. This section carries forward the same presentation standards for financialinstruments that were included in Section 3861 ‘‘Financial Instruments — Disclosure andPresentation’’.
c) Handbook Section 3031, ‘‘Inventories’’, was issued in March 2007 and replaces Section 3030‘‘Inventories’’ effective for fiscal years beginning on or after January 1, 2008. The new sectionprescribes measurement of inventories at the lower of cost and net realizable value. It providesguidance on the determination of cost, prohibiting the use of the last in, first out method (or LIFO),and requires the reversal of previous write-downs when there is a subsequent increase in the value ofinventories. The changes noted above have been incorporated in our 2009 fiscal year financialstatements and analysis.
d) Section 1535, ‘‘Capital Disclosures’’, establishes standards for disclosing information about an entity’scapital and how it is managed. It describes the disclosure of the entity’s objectives, policies andprocesses for managing capital, the qualitative data about what the entity regards as capital, whetherthe entity has complied with any capital disclosure requirements, and, if it has not complied, theconsequences of such non-compliance.
We are in compliance with the new Handbook Sections mentioned above as of February 28, 2009.
Future Accounting Changes
In 2006, Canada’s Accounting Standards Board ratified a strategic plan that will result in Canadian GAAP,as used by public companies, being evolved and converged with IFRS over a transitional period to be completeby 2011 (by May 31, 2011). We will be required to report using the converged standards effective for interim andannual financial statements relating to fiscal years beginning on or after January 1, 2011. Canadian GAAP willbe converged with IFRS through a combination of two methods: as current joint-convergence projects of theUnited States’ Financial Accounting Standards Board and the International Accounting Standards Board areagreed upon, they will be adopted by Canada’s Accounting Standards Board and may be introduced in Canadabefore the complete changeover to IFRS; and standards not subject to a joint-convergence project will beexposed in an omnibus manner for introduction at the time of the complete changeover to IFRS. TheInternational Accounting Standards Board currently has projects underway that should result in newpronouncements that continue to evolve IFRS.
Transition to IFRS
We will be required to report consolidated year end financial statements under IFRS for the first time onFebruary 28, 2012. We are aware of the magnitude of the effort involved to succeed in such a transition and havebegun the process to prepare for this eventuality.
83

We will start on the conversion plan in the first half of our 2010 fiscal year with the help of an externaladvisor. The project consists of three phases to be completed in order to change over to IFRS: diagnostic,development and implementation.
The first phase includes the identification of significant differences between the current Canadian GAAPstandards and IFRS that are relevant to us and a review of the alternatives available upon adoption. We willperform a diagnostic review and establish the most significant differences for us. Canadian GAAP and IFRSdiffer in the following areas: revenue recognition, property and equipment, leases, provisions, reportingcurrency, presentation and additional disclosure requirements under IFRS. Additional differences might beidentified in the future as changes to IFRS standards are released.
The second phase includes identification, evaluation and selection of accounting policies necessary for us tochange over to IFRS as well as potential first-time adoption exemptions. During this phase, we will assess theimpact of the transition on the data system and internal control over financial reporting, the further trainingrequired for the financial team and the impact on business activities such as foreign currency, capitalrequirements, banking agreements or compensation arrangements. We will begin this phase in the third andfourth quarters of the fiscal year ending February 28, 2010.
The implementation phase will integrate all the solutions into our financial system and processes that arenecessary for us to convert to IFRS.
OPTIONS AND WARRANTS TO PURCHASE SECURITIES
The following is a summary description of all of our outstanding options and warrants to purchase ourCommon Shares.
Equity Compensation Plans
We currently have two equity compensation plans for the benefit of our directors, officers, consultants andemployees: our Fourth Amended and Restated Key Employee Stock Option/Stock Issuance Plan (the ‘‘StockOption Plan’’) and our Employee Share Purchase Plan (‘‘ESPP’’), both of which are described in detail in ourManagement Circular, which is incorporated by reference in this short form prospectus.
The maximum number of Common Shares issued or issuable under the Stock Option Plan is a fixedpercentage of 15% of the Common Shares outstanding from time to time. As of October 13, 2009,4,296,234 Common Shares are reserved for issue under the Stock Option Plan of which 245,097 Common Sharesremain available for new grants of options. If this Offering is completed, 1,135,262 additional Common Shareswill be available for new grants of options under the Stock Option Plan before the Over-Allotment Option isexercised. If the Over-Allotment Option is fully exercised, an additional 296,377 Common Shares will beavailable for new grants of options under the Stock Option Plan. In May and June of 2009, certain changes weremade to outstanding options granted under the Stock Option Plan to create a more effective incentive to retainand motivate our executives and employees. On May 14, 2009, ‘underwater’ options to purchase an aggregate of371,150 Common Shares held by our non-executive employees and consultants were exchanged for newly-granted options with a lower exercise price of $3.38 per share. On June 9, 2009, ‘underwater’ options to purchasean aggregate of 290,000 Common Shares held by our executive employees were exchanged for newly-grantedoptions with a lower exercise price of $4.45 per share. New options received on the exchange are exercisable forthe same number of Common Shares and otherwise have the same terms and conditions as the exchangedoptions, except that the vesting schedule and expiry date of the new options is extended for a period of one year.On May 7, 2009, the expiry dates of options to purchase an aggregate of 205,600 Common Shares held bynon-executive employees was extended for a period of one year. On June 9, 2009, the expiry dates of options topurchase an aggregate of 565,000 Common Shares held by our executives employees was extended for a periodof one year. The option exchange and expiry date extension for our executive employees were effected pursuantto amendments to the Stock Option Plan that were approved by our shareholders at a shareholders meeting heldon June 9, 2009. For more information, please see our Management Circular, which is incorporated by referencein this short form prospectus.
84

As at October 13, 2009, the maximum number of Common Shares that may be issued under the ESPPis 488,732.
Warrant Held by QK Investments Inc.
QK Investments Inc. holds a warrant (the ‘‘QK Warrant’’) that entitles the holder to purchase that numberof Common Shares equal to the quotient of U.S.$315,000/$15.00 (using a conversion rate based on the nominalnoon exchange rate for Canadian dollars as reported by the Bank of Canada two business days prior to theexercise date of the QK Warrant), multiplied by 1.647932. Assuming an exchange rate of $1.00 to U.S.$0.9118(being the nominal noon exchange rate for Canadian dollars as reported by the Bank of Canada on August 31,2009), the QK Warrant would be exercisable for 37,954 Common Shares. The exercise price per share of the QKWarrant is equal to the quotient of U.S.$315,000 divided by the number of Common Shares for which the QKWarrant is exercisable (the ‘‘QK Exercise Price’’). Assuming an exchange rate of $1.00 to U.S.$0.9118, theexercise price per share would be $9.10. The QK Warrant will expire on April 19, 2012. The QK Warrant carriesa cashless exercise privilege pursuant to which the holder can convert the QK Warrant for that number ofCommon Shares determined by dividing (a) the number of Common Shares covered by the QK Warrant that arebeing exercised multiplied by, the fair market value of one Common Share minus the QK Exercise Price by(b) the fair market value of one Common Share. For the purposes of this cashless exercise right, the fair marketvalue will be the average closing price of the Common Shares for the five days prior to the cashless exercise ofthe QK Warrant.
Warrant Held by GATX Venture Finance Canada Inc.
GATX Venture Finance Canada Inc. holds a warrant (the ‘‘GATX Warrant’’) that entitles the holder topurchase that number of Common Shares equal to the quotient of U.S.$35,000/$15.00 (using a conversion ratebased on the nominal noon exchange rate for Canadian dollars as reported by the Bank of Canada two businessdays prior to the exercise date of the GATX Warrant), multiplied by 1.647932. Assuming an exchange rate of$1.00 to U.S.$0.9118 (being the nominal noon exchange rate for Canadian dollars as reported by the Bank ofCanada on August 31, 2009), the GATX Warrant would be exercisable for 4,217 Common Shares. The exerciseprice of the GATX Warrant is equal to the quotient of U.S.$35,000 divided by the number of Common Sharesfor which the GATX Warrant is exercisable (the ‘‘GATX Exercise Price’’). Assuming an exchange rate of $1.00to U.S.$0.9118, the exercise price per share would be $9.10. The GATX Warrant will expire on April 19, 2012.The GATX Warrant carries a cashless exercise privilege pursuant to which the holder can exercise the GATXWarrant for that number of Common Shares determined by dividing (a) the number of Common Shares coveredby the GATX Warrant that are being exercised multiplied by, the fair market value of one Common Share minusthe GATX Exercise Price by (b) the fair market value of one Common Share. For the purposes of this cashlessexercise right, the fair market value will be the average closing price of the Common Shares for the five daysprior to the cashless exercise of the GATX Warrant.
Warrants Issued in Relation to Convertible Debt Financings
Between October 12, 2005 and November 7, 2006, we borrowed funds from a group of our shareholderspursuant to a convertible debt instrument. See ‘‘Interests of Management and Others in Certain Transactions —Private Investor Convertible Debentures and Warrants’’. All of the convertible debt was converted into CommonShares in connection with our initial public offering on April 19, 2007. As part of this convertible debt financing,we also issued warrants to each of the lenders (the ‘‘Private Investor Warrants’’), which are currently exercisablefor up to 178,287 Common Shares in the aggregate, at a purchase price of $3.555 (the ‘‘Conversion Price’’). It isanticipated that the Private Investor Warrants held by Enterprise Partners V, L.P. and Enterprise Partner VI, L.P.will be exercised on the Closing Date pursuant to the cashless exercise feature contained in such Private InvestorWarrants. The Private Investor Warrants will expire on April 19, 2010. The Private Investor Warrants carry acashless exercise privilege to which any holder can exercise its warrant for that number of Common Sharesdetermined by dividing (a) the aggregate fair market value of the Common Shares in respect of which thewarrant is being exercised minus the product of the Conversion Price and the number of Common Shares inrespect of which the warrant is being exercised by (b) the fair market value of one Common Share. For thepurposes of this cashless exercise right, the fair market value will be the average closing price of the Common
85

Shares for the five days prior to the cashless exercise of the Private Investor Warrant. See also ‘‘PrincipalShareholders’’ and ‘‘Selling Shareholders’’ below.
Warrants Issued to Sprint/Nextel
Sprint/United Management Co., a wholly-owned subsidiary of Sprint Nextel Corp., holds a warrant topurchase up to 126,250 Common Shares (the ‘‘Sprint Warrant’’). The Sprint Warrant is subject to vestingconditions and is currently only vested as to 31,562 Common Shares. The Sprint Warrant expires on May 30,2017 and is exercisable at a price of $3.555 per share.
PRIOR SALES
During the 12 month period before the date of this short form prospectus, we have issued Common Sharesand securities convertible into Common Shares as follows:
Date Price per Security ($) Number of Securities
Common SharesIssued pursuant to the exercise of options:October 1, 2008 . . . . . . . . . . . . . . . . . . . . . . . . . . . . . . . . . . . . . . . 2.46 450May 15, 2009 . . . . . . . . . . . . . . . . . . . . . . . . . . . . . . . . . . . . . . . . . 0.10 53,600July 22, 2009 . . . . . . . . . . . . . . . . . . . . . . . . . . . . . . . . . . . . . . . . . 2.46 350July 23, 2009 . . . . . . . . . . . . . . . . . . . . . . . . . . . . . . . . . . . . . . . . . 2.46 1,450August 13, 2009 . . . . . . . . . . . . . . . . . . . . . . . . . . . . . . . . . . . . . . . 3.38 5,379August 13, 2009 . . . . . . . . . . . . . . . . . . . . . . . . . . . . . . . . . . . . . . . 2.46 3,850August 21, 2009 . . . . . . . . . . . . . . . . . . . . . . . . . . . . . . . . . . . . . . . 3.38 92August 21, 2009 . . . . . . . . . . . . . . . . . . . . . . . . . . . . . . . . . . . . . . . 2.46 1,525Issued pursuant to the ESPP:November 30, 2008 . . . . . . . . . . . . . . . . . . . . . . . . . . . . . . . . . . . . . 1.27 2,299December 31, 2008 . . . . . . . . . . . . . . . . . . . . . . . . . . . . . . . . . . . . . 0.99 2,886January 31, 2009 . . . . . . . . . . . . . . . . . . . . . . . . . . . . . . . . . . . . . . . 1.27 852February 28, 2009 . . . . . . . . . . . . . . . . . . . . . . . . . . . . . . . . . . . . . . 1.52 844March 31, 2009 . . . . . . . . . . . . . . . . . . . . . . . . . . . . . . . . . . . . . . . 1.90 676April 30, 2009 . . . . . . . . . . . . . . . . . . . . . . . . . . . . . . . . . . . . . . . . 2.54 508May 31, 2009 . . . . . . . . . . . . . . . . . . . . . . . . . . . . . . . . . . . . . . . . . 3.96 699June 31, 2009 . . . . . . . . . . . . . . . . . . . . . . . . . . . . . . . . . . . . . . . . . 4.36 688July 31, 2009 . . . . . . . . . . . . . . . . . . . . . . . . . . . . . . . . . . . . . . . . . 6.53 477August 31, 2009 . . . . . . . . . . . . . . . . . . . . . . . . . . . . . . . . . . . . . . . 6.53 814September 30, 2009 . . . . . . . . . . . . . . . . . . . . . . . . . . . . . . . . . . . . 8.23 673Issued pursuant to the exercise of warrants:July 24, 2009 . . . . . . . . . . . . . . . . . . . . . . . . . . . . . . . . . . . . . . . . . 3.56 4,905Options(1)
September 29, 2008 . . . . . . . . . . . . . . . . . . . . . . . . . . . . . . . . . . . . 1.70 500October 6, 2008 . . . . . . . . . . . . . . . . . . . . . . . . . . . . . . . . . . . . . . . 2.14 1,000October 14, 2009 . . . . . . . . . . . . . . . . . . . . . . . . . . . . . . . . . . . . . . 1.70 1,000October 15, 2008 . . . . . . . . . . . . . . . . . . . . . . . . . . . . . . . . . . . . . . 1.61 32,500January 9, 2009 . . . . . . . . . . . . . . . . . . . . . . . . . . . . . . . . . . . . . . . 1.34 148,500January 13, 2009 . . . . . . . . . . . . . . . . . . . . . . . . . . . . . . . . . . . . . . . 1.34 260,000April 17, 2009 . . . . . . . . . . . . . . . . . . . . . . . . . . . . . . . . . . . . . . . . 1.94 8,500May 4, 2009 . . . . . . . . . . . . . . . . . . . . . . . . . . . . . . . . . . . . . . . . . . 2.73 1,000May 14, 2009 . . . . . . . . . . . . . . . . . . . . . . . . . . . . . . . . . . . . . . . . . 3.38 42,837July 16, 2009 . . . . . . . . . . . . . . . . . . . . . . . . . . . . . . . . . . . . . . . . . 5.51 34,600July 21, 2009 . . . . . . . . . . . . . . . . . . . . . . . . . . . . . . . . . . . . . . . . . 5.83 14,279August 5, 2009 . . . . . . . . . . . . . . . . . . . . . . . . . . . . . . . . . . . . . . . . 6.44 53,500October 8, 2009 . . . . . . . . . . . . . . . . . . . . . . . . . . . . . . . . . . . . . . . 10.22 40,700
(1) In addition to the new grants, on May 14, 2009, ‘underwater’ options to purchase an aggregate of 371,150 Common Shares held by ournon-executive employees and consultants were exchanged for newly-granted options with a lower exercise price of $3.38 per share andon June 9, 2009, ‘underwater’ options to purchase an aggregate of 290,000 Common Shares held by our executive employees wereexchanged for newly-granted options with a lower exercise price of $4.45 per share. See ‘‘Options and Warrants to PurchaseSecurities — Equity Compensation Plans.’’
86
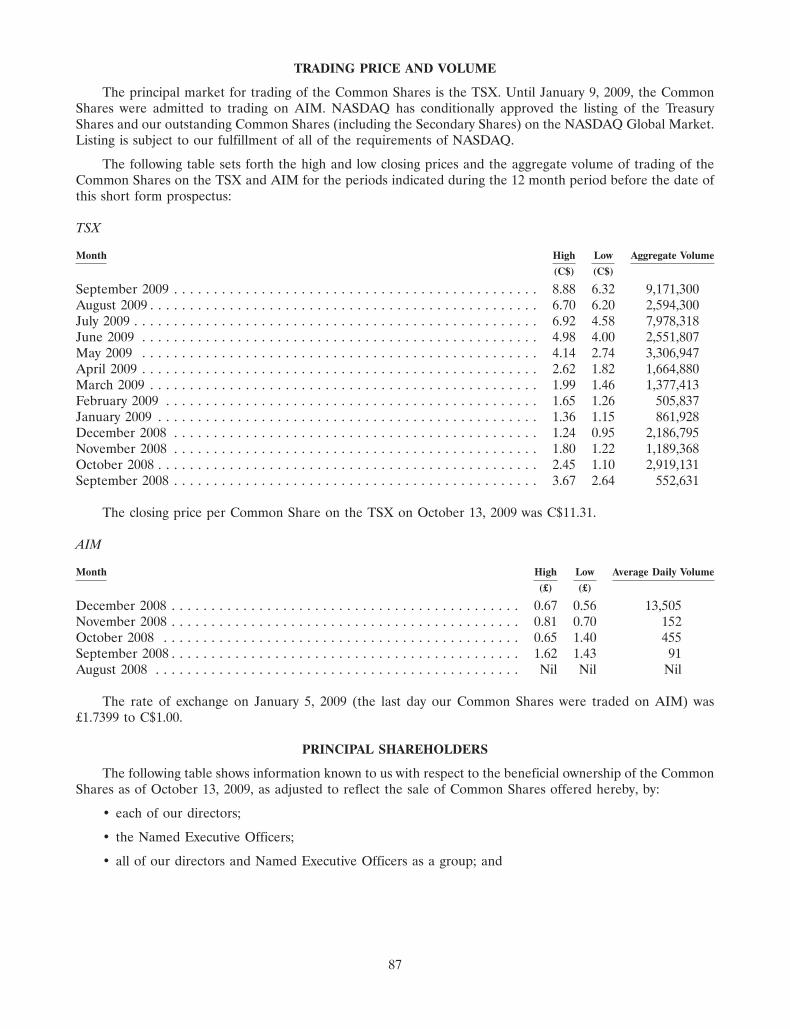
TRADING PRICE AND VOLUME
The principal market for trading of the Common Shares is the TSX. Until January 9, 2009, the CommonShares were admitted to trading on AIM. NASDAQ has conditionally approved the listing of the TreasuryShares and our outstanding Common Shares (including the Secondary Shares) on the NASDAQ Global Market.Listing is subject to our fulfillment of all of the requirements of NASDAQ.
The following table sets forth the high and low closing prices and the aggregate volume of trading of theCommon Shares on the TSX and AIM for the periods indicated during the 12 month period before the date ofthis short form prospectus:
TSX
Month High Low Aggregate Volume
(C$) (C$)
September 2009 . . . . . . . . . . . . . . . . . . . . . . . . . . . . . . . . . . . . . . . . . . . . . . 8.88 6.32 9,171,300August 2009 . . . . . . . . . . . . . . . . . . . . . . . . . . . . . . . . . . . . . . . . . . . . . . . . . 6.70 6.20 2,594,300July 2009 . . . . . . . . . . . . . . . . . . . . . . . . . . . . . . . . . . . . . . . . . . . . . . . . . . . 6.92 4.58 7,978,318June 2009 . . . . . . . . . . . . . . . . . . . . . . . . . . . . . . . . . . . . . . . . . . . . . . . . . . 4.98 4.00 2,551,807May 2009 . . . . . . . . . . . . . . . . . . . . . . . . . . . . . . . . . . . . . . . . . . . . . . . . . . 4.14 2.74 3,306,947April 2009 . . . . . . . . . . . . . . . . . . . . . . . . . . . . . . . . . . . . . . . . . . . . . . . . . . 2.62 1.82 1,664,880March 2009 . . . . . . . . . . . . . . . . . . . . . . . . . . . . . . . . . . . . . . . . . . . . . . . . . 1.99 1.46 1,377,413February 2009 . . . . . . . . . . . . . . . . . . . . . . . . . . . . . . . . . . . . . . . . . . . . . . . 1.65 1.26 505,837January 2009 . . . . . . . . . . . . . . . . . . . . . . . . . . . . . . . . . . . . . . . . . . . . . . . . 1.36 1.15 861,928December 2008 . . . . . . . . . . . . . . . . . . . . . . . . . . . . . . . . . . . . . . . . . . . . . . 1.24 0.95 2,186,795November 2008 . . . . . . . . . . . . . . . . . . . . . . . . . . . . . . . . . . . . . . . . . . . . . . 1.80 1.22 1,189,368October 2008 . . . . . . . . . . . . . . . . . . . . . . . . . . . . . . . . . . . . . . . . . . . . . . . . 2.45 1.10 2,919,131September 2008 . . . . . . . . . . . . . . . . . . . . . . . . . . . . . . . . . . . . . . . . . . . . . . 3.67 2.64 552,631
The closing price per Common Share on the TSX on October 13, 2009 was C$11.31.
AIM
Month High Low Average Daily Volume
(£) (£)
December 2008 . . . . . . . . . . . . . . . . . . . . . . . . . . . . . . . . . . . . . . . . . . . . 0.67 0.56 13,505November 2008 . . . . . . . . . . . . . . . . . . . . . . . . . . . . . . . . . . . . . . . . . . . . 0.81 0.70 152October 2008 . . . . . . . . . . . . . . . . . . . . . . . . . . . . . . . . . . . . . . . . . . . . . 0.65 1.40 455September 2008 . . . . . . . . . . . . . . . . . . . . . . . . . . . . . . . . . . . . . . . . . . . . 1.62 1.43 91August 2008 . . . . . . . . . . . . . . . . . . . . . . . . . . . . . . . . . . . . . . . . . . . . . . Nil Nil Nil
The rate of exchange on January 5, 2009 (the last day our Common Shares were traded on AIM) was£1.7399 to C$1.00.
PRINCIPAL SHAREHOLDERS
The following table shows information known to us with respect to the beneficial ownership of the CommonShares as of October 13, 2009, as adjusted to reflect the sale of Common Shares offered hereby, by:
• each of our directors;
• the Named Executive Officers;
• all of our directors and Named Executive Officers as a group; and
87

• each person who beneficially owns, or controls or directs, directly or indirectly, more than 10% of theCommon Shares.
Number of Percentage of Number of Percentage ofCommon Shares Common Shares Common Shares Common Shares
beneficially owned beneficially owned beneficially owned beneficially ownedName before the Offering before the Offering(1) after the Offering after the Offering(1)
Directors and Named Executive OfficersJean-Paul Cossart . . . . . . . . . . . . . . Nil(2) n/a Nil n/aCarl Eibl(3) . . . . . . . . . . . . . . . . . . . Nil(4) n/a Nil n/aClaude Haw(5) . . . . . . . . . . . . . . . . . Nil(6) n/a Nil n/aTerence Matthews . . . . . . . . . . . . . . 1,118,242(7) 3.90% 868,242 2.40%Gerry Spencer . . . . . . . . . . . . . . . . Nil n/a Nil n/aPeter Allen . . . . . . . . . . . . . . . . . . 541,107(8) 1.89% 441,107 1.22%Erik Boch . . . . . . . . . . . . . . . . . . . 276,037(9) 0.96% 151,037 0.42%Russell Frederick . . . . . . . . . . . . . . 158,141(10) 0.55% 95,141 0.26%Brian McCormack . . . . . . . . . . . . . . 129,000(11) 0.45% 29,000 0.08%Alan Solheim . . . . . . . . . . . . . . . . . 161,997(12) 0.57% 101,997 0.28%
All directors and Named ExecutiveOfficers as a group (10 persons) . . . . 2,384,524 8.33% 1,686,524 4.66%
10% ShareholdersEnterprise Partners V, L.P. and
Enterprise Partners VI, L.P.(13) . . . . 4,413,884 15.41% Nil(14) n/a
(1) The percentage of Common Shares held prior to the Offering is based on 28,641,562 Common Shares outstanding on October 13,2009, and the percentage of Common Shares held after the Offering is based on 36,209,978 Common Shares outstanding immediatelyfollowing the Offering which assumes the exercise of the Private Investor Warrants held by Enterprise Partners V, L.P. and EnterprisePartners VI, L.P. For purposes of the fully-diluted calculations, the total number of Common Shares outstanding is 31,069,499 withrespect to calculations prior to the Offering and is 38,523,549 with respect to calculations after the Offering.
(2) Mr. Cossart holds options to purchase up to 24,279 Common Shares, which are currently exercisable as to 5,828 Common Shares. On afully-diluted basis, Mr. Cossart holds 24,279 Common Shares (assuming full vesting of the options held by Mr. Cossart) (0.08%) beforethe Offering and will hold 24,279 Common Shares (0.06%) after the Offering.
(3) Enterprise Partners V, L.P. and Enterprise Partners VI, L.P. are controlled by Enterprise Partners Venture Capital, of which Mr. Eibl isManaging Director. Enterprise Partners V, L.P. owns 2,456,942 Common Shares. Enterprise Partners VI, L.P. owns 1,956,942 CommonShares. Each of Enterprise Partners V, L.P. and Enterprise Partners VI, L.P. hold Private Investor Warrants to purchase up to57,183 Common Shares. See ‘‘Selling Shareholders’’ and ‘‘Options and Warrants to Purchase Securities — Warrants Issued in Relationto Convertible Debt Financings’’. Mr. Eibl and his associates beneficially own less than 5% of the limited partnership units ofEnterprise Partners V, L.P. and Enterprise Partners VI, L.P. Mr. Eibl does not independently exert control or direction over theCommon Shares owned by Enterprise Partners V, L.P. and Enterprise Partners VI, L.P.
(4) Mr. Eibl holds options to purchase up to 28,517 Common Shares which are currently exercisable as to 5,039 Common Shares. On afully-diluted basis, Mr. Eibl holds 28,517 Common Shares (assuming full vesting of the options held by Mr. Eibl) (0.09%) before theOffering and will hold 28,517 Common Shares (0.07%) after the Offering.
(5) Venture Coaches, of which Claude Haw is Managing Partner, owns 659,987 Common Shares and Private Investor Warrants topurchase up to 10,126 Common Shares. Claude Haw and his associates beneficially own less than 5% of the limited partnership unitsof Venture Coaches. Mr. Haw does not exert control or direction over the Common Shares held by Venture Coaches.
(6) Mr. Haw holds options to purchase up to 40,917 Common Shares, which are currently exercisable as to 13,041 Common Shares. On afully-diluted basis, Mr. Haw holds 40,917 Common Shares (assuming full vesting of the options held by Mr. Haw) (0.13%) before theOffering and will hold 40,917 Common Shares (0.11%) after the Offering.
(7) 500,964 Common Shares are registered in the name of Wesley Clover Corporation and 617,278 Common Shares are registered in thename of Wesley Clover International Corporation. Wesley Clover Corporation and Wesley Clover International Corporation are bothcontrolled by Mr. Matthews. Wesley Clover International Corporation also holds Private Investor Warrants to purchase up to21,100 Common Shares. On a fully-diluted basis, Mr. Matthews holds, through Wesley Clover Corporation and Wesley CloverInternational Corporation, 1,139,342 Common Shares (3.67%) before the Offering and will hold 889,342 Common Shares (2.31%)after the Offering.
(8) Mr. Allen holds options to purchase up to 385,000 Common Shares, which are currently exercisable as to 228,907 Common Shares. Ona fully-diluted basis, Mr. Allen holds 926,107 Common Shares (assuming full vesting of the options held by Mr. Allen) (2.98%) beforethe Offering and will hold 826,107 Common Shares (2.14%) after the Offering.
88

(9) Mr. Boch holds options to purchase up to 195,000 Common Shares, which are currently exercisable as to 104,985 Common Shares. Ona fully-diluted basis, Mr. Boch holds 471,037 Common Shares (assuming full vesting of the options held by Mr. Boch) (1.52%) beforethe Offering and will hold 346,037 Common Shares (0.90%) after the Offering.
(10) Mr. Frederick holds options to purchase up to 160,000 Common Shares, which are currently exercisable as to 78,236 Common Shares.On a fully-diluted basis, Mr. Frederick holds 318,141 Common Shares (assuming full vesting of the options held by Mr. Frederick)(1.02%) before the Offering and will hold 255,141 Common Shares (0.66%) after the Offering.
(11) Mr. McCormack holds options to purchase up to 95,000 Common Shares, which are currently exercisable as to 65,750 CommonShares. On a fully-diluted basis, Mr. McCormack holds 224,000 Common Shares (assuming full vesting of the options held byMr. McCormack) (0.72%) before the Offering and will hold 124,000 Common Shares (0.32%) after the Offering.
(12) Mr. Solheim holds options to purchase up to 175,000 Common Shares, which are currently exercisable as to 88,726 Common Shares.On a fully-diluted basis, Mr. Solheim holds 336,997 Common Shares (assuming full vesting of the options held by Mr. Solheim)(1.08%) before the Offering and will hold 276,997 Common Shares (0.72%) after the Offering.
(13) Enterprise Partners V, L.P. and Enterprise Partners VI, L.P. are controlled by Enterprise Partners Venture Capital, of which Mr. Eibl isManaging Director. Enterprise Partners V, L.P. owns 2,456,942 Common Shares. Enterprise Partners VI, L.P. owns 1,956,942 CommonShares. Each of Enterprise Partners V, L.P. and Enterprise Partners VI, L.P. hold a Private Investor Warrant to purchase up to57,183 Common Shares. On a fully-diluted basis, Enterprise Partners V, L.P. and Enterprise Partners VI, L.P. hold 4,528,250 CommonShares (14.6%) before the Offering and will hold no Common Shares after the Offering. See ‘‘Selling Shareholders’’ and ‘‘Options andWarrants to Purchase Securities — Warrants Issued in Relation to Convertible Debt Financings’’. Mr. Eibl and his associatesbeneficially own less than 5% of the limited partnership units of Enterprise Partners V, L.P. and Enterprise Partners VI, L.P. Mr. Eibldoes not independently exert control or direction over the Common Shares owned by Enterprise Partners V, L.P. and EnterprisePartners VI, L.P.
(14) Assumes the sale of 57,183 Common Shares issuable upon the exercise of the Private Investor Warrants held by Enterprise Partnersand 57,183 Common Shares issuable upon the exercise of the Private Investor Warrants held by Enterprise Partners VI, L.P.
SELLING SHAREHOLDERS
The following table sets forth certain information regarding the Selling Shareholders as at October 13, 2009.All Offered Shares held by the Selling Shareholders are owned by such holders beneficially and of record.
Number of Common Number of Common Number of Common Percentage of CommonShares owned, controlled Shares of the Selling Shares owned, controlled Shares owned, controlledor directed by the Selling Shareholder being or directed by the Selling or directed by the Selling
Name of Selling Shareholder before the distributed pursuant to Shareholder after the ShareholderShareholder Offering the Offering Offering after the Offering(12)
Enterprise PartnersV, L.P.(1) . . . . . . . . . 2,456,942 2,514,125(10) Nil n/a
Enterprise PartnersVI, L.P.(1) . . . . . . . . 1,956,942 2,014,125(11) Nil n/a
Wesley CloverCorporation(2) . . . . . 1,118,242 250,000 868,242 2.40%
Venture CoachesFund L.P.(3) . . . . . . . 659,987 250,000 409,987 1.13%
Peter Allen(4) . . . . . . . 541,107 100,000 441,107 1.22%Erik Boch(5) . . . . . . . . 276,037 125,000 151,037 0.42%David Farrar(6) . . . . . . 375,431 42,000 333,431 0.92%Russell Frederick(7) . . . 158,141 63,000 95,141 0.26%Brian McCormack(8) . . 129,000 100,000 29,000 0.08%Alan Solheim(9) . . . . . 161,997 60,000 101,997 0.28%
Note: For purposes of the fully-diluted calculations in the footnotes below, the total number of Common Shares outstanding is31,069,499 with respect to calculations prior to the Offering and is 38,523,549 with respect to calculations after the Offering.
(1) Enterprise Partners V, L.P. and Enterprise Partners VI, L.P. are under common management by Enterprise Partners Venture Capital.Carl Eibl, one of our directors, is Managing Director of Enterprise Partners Venture Capital. Enterprise Partners V, L.P. also holdsPrivate Investor Warrants to purchase up to 57,183 Common Shares, and Enterprise Partners VI, L.P. holds Private Investor Warrantsto purchase up to 57,183 Common Shares. See ‘‘Options and Warrants to Purchase Securities — Warrants Issued in Relation toConvertible Debt Financings’’. On a fully-diluted basis, Enterprise Partners V, L.P. holds 2,514,125 Common Shares (8.09%) before theOffering and will hold no Common Shares after the Offering. On a fully-diluted basis, Enterprise Partners VI, L.P. holds2,014,125 Common Shares (6.48%) before the Offering and will hold no Common Shares after the Offering.
89

(2) The numbers in the table above reflect the aggregate number of Common Shares held by Wesley Clover Corporation and WesleyClover International Corporation. Wesley Clover Corporation is selling 250,000 of its Common Shares and Wesley CloverInternational Corporation is not selling any of its Common Shares. Terence Matthews, one of our directors, controls Wesley CloverInternational Corporation and Wesley Clover Corporation. Wesley Clover International Corporation also holds Private InvestorWarrants to purchase up to 21,100 Common Shares. See ‘‘Options and Warrants to Purchase Securities — Warrants Issued in Relationto Convertible Debt Financings’’. On a fully-diluted basis, Wesley Clover International Corporation and Wesley Clover Corporationhold 1,139,342 Common Shares (3.67%) before the Offering and will hold 889,342 Common Shares (2.31%) after the Offering.
(3) Claude Haw, one of our directors, is Managing Partner of Venture Coaches. Venture Coaches also holds Private Investor Warrants topurchase up to 10,126 Common Shares. See ‘‘Options and Warrants to Purchase Securities — Warrants Issued in Relation toConvertible Debt Financings’’. On a fully-diluted basis, Venture Coaches holds 670,113 Common Shares (2.16%) before the Offeringand will hold 420,113 Common Shares (1.09%) after the Offering.
(4) Mr. Allen holds options to purchase up to 385,000 Common Shares, which are currently exercisable as to 228,907 Common Shares. Ona fully-diluted basis, Mr. Allen holds 926,107 Common Shares (assuming full vesting of the options held by Mr. Allen) (2.98%) beforethe Offering and will hold 826,107 Common Shares (2.14%) after the Offering.
(5) Mr. Boch holds options to purchase up to 195,000 Common Shares, which are currently exercisable as to 104,985 Common Shares. Ona fully-diluted basis, Mr. Boch holds 471,037 Common Shares (assuming full vesting of the options held by Mr. Boch) (1.52%) beforethe Offering and will hold 346,037 Common Shares (0.93%) after the Offering.
(6) Mr. Farrar holds options to purchase up to 165,000, which are currently exercisable as to 86,352 Common Shares. On a fully-dilutedbasis, Mr. Farrar holds 540,431 Common Shares (assuming full vesting of the options held by Mr. Farrar) (1.74%) before the Offeringand will hold 498,431 Common Shares (1.30%) after the Offering.
(7) Mr. Frederick holds options to purchase up to 160,000 Common Shares, which are currently exercisable as to 78,236 Common Shares.On a fully-diluted basis, Mr. Frederick holds 318,141 Common Shares (assuming full vesting of the options held by Mr. Frederick)(1.02%) before the Offering and will hold 255,141 Common Shares (0.66%) after the Offering.
(8) Mr. McCormack holds options to purchase up to 95,000 Common Shares, which are currently exercisable as to 65,750 CommonShares. On a fully-diluted basis, Mr. McCormack holds 224,000 Common Shares (assuming full vesting of the options held byMr. McCormack) (0.72%) before the Offering and will hold 124,000 Common Shares (0.32%) after the Offering.
(9) Mr. Solheim holds options to purchase up to 175,000 Common Shares, which are currently exercisable as to 88,726 Common Shares.On a fully-diluted basis, Mr. Solheim holds 336,997 Common Shares (assuming full vesting of the options held by Mr. Solheim)(1.09%) before the Offering and will hold 276,997 Common Shares (0.72%) after the Offering.
(10) Includes 57,183 Common Shares issuable upon the exercise of the Private Investor Warrants held by Enterprise Partners V, L.P. It isanticipated that the Private Investor Warrants held by Enterprise Partners V. L.P. and Enterprise Partners VI, L.P. will be exercised onthe Closing Date pursuant to the cashless exercise feature contained in the Private Investor Warrants. If the exercise of the PrivateInvestor Warrants pursuant to the cashless exercise feature results in the issue of less than 57,183 Common Shares, the number ofTreasury Shares offered will be increased by the difference between 114,366 and the total number of Common Shares issued pursuantto the exercise of the Private Investor Warrants held by Enterprise Partners V. L.P. and Enterprise Partners VI, L.P., and the ‘‘Numberof Common Shares of the Selling Shareholder being distributed pursuant to the Offering’’ will decrease. In any event, the total numberof Offered Shares will be no greater than 12,972,300. If the number of Treasury Shares is increased pursuant to the cashless exercise ofthe Private Investor Warrants, ‘‘Net Proceeds to Us’’ will increase and ‘‘Net Proceeds to the Selling Shareholders’’ will decrease.
(11) Includes 57,183 Common Shares issuable upon the exercise of the Private Investor Warrants held by Enterprise Partners VI, L.P. It isanticipated that the Private Investor Warrants held by Enterprise Partners V. L.P. and Enterprise Partners VI, L.P. will be exercised onthe Closing Date pursuant to the cashless exercise feature contained in the Private Investor Warrants. If the exercise of the PrivateInvestor Warrants pursuant to the cashless exercise feature results in the issue of less than 57,183 Common Shares, the number ofTreasury Shares offered will be increased by the difference between 114,366 and the total number of Common Shares issued pursuantto the exercise of the Private Investor Warrants held by Enterprise Partners V. L.P. and Enterprise Partners VI, L.P., and the ‘‘Numberof Common Shares of the Selling Shareholder being distributed pursuant to the Offering’’ will decrease. In any event, the total numberof Offered Shares will be no greater than 12,972,300. If the number of Treasury Shares is increased pursuant to the cashless exercise ofthe Private Investor Warrants, ‘‘Net Proceeds to Us’’ will increase and ‘‘Net Proceeds to the Selling Shareholders’’ will decrease.
(12) The percentage of Common Shares held after the Offering is based on 36,209,978 Common Shares outstanding immediately followingthe Offering, without giving effect to the exercise of the Over-Allotment Option but assuming the exercise of the Private InvestorWarrants held by Enterprise Partners V, L.P. and Enterprise Partners VI, L.P.
Enterprise Partners V, L.P. and Enterprise Partners VI, L.P., both of which are Selling Shareholders, areincorporated, continued or otherwise organized under the laws of a foreign jurisdiction. Mr. McCormack, aSelling Shareholder, is a U.S. citizen and resides in the U.S. Although Enterprise Partners V, L.P., EnterpriseVI, L.P. and Mr. McCormack have appointed Fraser Milner Casgrain LLP, 99 Bank Street, Suite 1420, Ottawa,Ontario, K1P 1H4 as their agent for service of process in each of the provinces of Canada, except Quebec, it maynot be possible for investors to collect from Enterprise Partners V, L.P., Enterprise Partners VI, L.P. orMr. McCormack judgments obtained in Canadian courts predicated on the civil liability provisions of securitieslegislation.
90

PLAN OF DISTRIBUTION
Pursuant to the terms and subject to the conditions contained in an underwriting agreement datedOctober 14, 2009 (the ‘‘Underwriting Agreement’’), between us, the Selling Shareholders and the Underwriters,for whom Canaccord Capital Corporation and Piper Jaffray & Co. are acting as representatives and jointbook-runners of the Offering (collectively, the ‘‘Lead Underwriters’’), we have agreed to sell and theUnderwriters have severally agreed to purchase 7,454,050 Treasury Shares at the Offering price, and the SellingShareholders have agreed to transfer and sell and the Underwriters have severally agreed to purchase5,518,250 Secondary Shares at the Offering price, on or about the Closing Date. We will not be entitled to any ofthe proceeds from the sale of the Secondary Shares.
The Offering price of the Offered Shares has been determined by negotiation between us, the SellingShareholders and the Underwriters. The public Offering price for the Offered Shares for investors in theUnited States will be payable in U.S. dollars and the public Offering price of the Offered Shares for investors inCanada will be payable in Canadian dollars, except as may otherwise be agreed by the Underwriters. Payment ofthe Offering price for the Offered Shares will be made to us and each of the Selling Shareholders, respectively,as the case may be, by wire transfer against delivery of certificates for the Offered Shares to the LeadUnderwriters on behalf of the Underwriters through the facilities of The Depository Trust Company for therespective accounts of the Underwriters.
The Underwriters, as principals, conditionally offer the Offered Shares, subject to prior sale, if, as and whenissued by us and if, as and when sold by the Selling Shareholders in accordance with the conditions contained inthe Underwriting Agreement. The obligations of the Underwriters under the Underwriting Agreement may beterminated upon the occurrence of certain stated events, and the closing of the Offering is conditional upon,among other things, the Financial Industry Regulatory Authority not raising any objections to the fairness andreasonableness of the underwriting terms and arrangements. The Underwriters are, however, obligated to takeup and pay for all of the Offered Shares offered by this short form prospectus if any of the Offered Shares arepurchased under the Underwriting Agreement. However, the Underwriters are not required to take or pay forthe Common Shares covered by the Over-Allotment Option, as described below.
The Offered Shares are being offered concurrently to the public in all of the provinces of Canada, exceptfor the province of Quebec, and in the United States pursuant to the MJDS implemented by the securitiesregulatory authorities in the United States and Canada. The Offered Shares will be offered in the United Statesand Canada through the Underwriters either directly or through their respective United States or Canadianbroker-dealer affiliates or agents, as applicable. No securities will be offered or sold in any jurisdiction except byor through brokers or dealers duly registered under the applicable securities laws of that jurisdiction, or incircumstances where an exemption from such registered dealer requirements is available. Subject to applicablelaw and the terms of the Underwriting Agreement, the Underwriters may offer the Offered Shares outside of theUnited States and Canada.
Listing
Our outstanding Common Shares are listed and posted for trading on the TSX under the trading symbol‘‘DWI’’. The TSX has conditionally approved the listing of the Treasury Shares on the TSX. NASDAQ hasconditionally approved the listing of the Treasury Shares and our outstanding Common Shares (including theSecondary Shares) on the NASDAQ Global Market under the trading symbol ‘‘DRWI’’. Listing will be subject tous fulfilling all of the listing requirements of the TSX and NASDAQ, respectively on or beforeDecember 23, 2009.
Commission and Expenses
In consideration for their services in connection with this Offering, we and the Selling Shareholders haveagreed to pay the Underwriters a fee of U.S.$0.575 (C$0.592) per Offered Share (5.75% of the price of theOffered Shares), that will be paid in the currency in which we and the Selling Shareholders receive payment forthe Offered Shares. The Underwriters’ fee is paid by us and the Selling Shareholders on a pro rata basis based onthe number of Offered Shares sold by each pursuant to the Offering. Pursuant to the terms of the UnderwritingAgreement, the expenses of the Offering will be paid solely by us, and the Selling Shareholders will not pay any
91

portion of such expenses. We have agreed to pay all of the expenses of the Offering since the sale of theSecondary Shares has not added materially to the expenses of the Offering. We estimate that our total expensesof the Offering payable by us, excluding Underwriters’ fees, will be approximately U.S.$1,700,350(or C$1,750,000). We will pay all these expenses from the proceeds of the Offering.
The Underwriters propose to offer the Offered Shares initially at the public Offering price set forth on thecover page of this short form prospectus, and to certain dealers, at the public Offering price less a sellingconcession not in excess of U.S.$0.29 (or C$0.30) per share. The Underwriters may allow, and certain dealersmay re-allow, a discount from the concession not in excess of U.S.$0.10 (or C$0.1029) per share to certainbrokers and dealers. If all of the Offered Shares have not been sold after the Underwriters have made areasonable effort to sell all of the Offered Shares at the public Offering price specified herein, the Underwritersmay from time to time decrease the Offering price, and further change the Offering price to an amount notgreater than the price set out on the face page of this prospectus, and the compensation realized by theUnderwriters will be decreased by the amount that the aggregate price paid by the purchasers for the OfferedShares is less than the gross proceeds paid by the Underwriters to us and the Selling Shareholders. Subscriptionswill be received subject to rejection or allotment in whole or in part and the right is reserved to close thesubscription book at any time without notice.
We have agreed to reimburse the reasonable filing fees, attorney’s fees and other disbursements incurred bythe Underwriters, as well as, reasonable costs and expenses of the Underwriters relating to the presentations ormeetings undertaken with the marketing of the offering and sale of the Offered Shares, up to a maximumamount of C$350,000 (exclusive of taxes and disbursements).
Indemnification
We have agreed to indemnify the Underwriters against certain liabilities, including liabilities under theUnited States Securities Act of 1933, as amended (the ‘‘U.S. Securities Act’’), and applicable Canadian securitieslegislation, and to contribute payments that the Underwriters may be required to make in respect thereof.
Option to Purchase Additional Common Shares
In order to cover over-allotments, if any, we have granted to the Underwriters an Over-Allotment Option topurchase an aggregate of up to 1,945,845 additional Common Shares which is equal to 15% of the aggregatenumber of Offered Shares sold pursuant to the Offering. The Underwriters may exercise the Over-AllotmentOption in whole or in part on or before 5:00 p.m. (Ottawa time) on the 30th day following the closing of thisOffering to cover over-allotments, if any, and for market stabilization purposes. To the extent that theOver-Allotment Option is exercised, the additional Common Shares will be purchased by the Underwriters atthe public Offering price set forth on the cover page of this short form prospectus and the Underwriters will beentitled to a fee of U.S.$0.575 (C$0.592) per share (5.75% of the price of the share) in respect of each CommonShare purchased, which fee will be payable by us. If the Underwriters exercise the Over-Allotment Option, eachUnderwriter will be obligated, subject to some conditions, to severally purchase a number of additional CommonShares proportionate to that Underwriter’s initial purchase commitment as set forth in the UnderwritingAgreement. This short form prospectus also qualifies for distribution the Over-Allotment Option and anyCommon Shares that are sold pursuant to the Over-Allotment Option. If the Over-Allotment Option isexercised in full, the total number of Offered Shares under the Offering will be 14,918,145, the total price to thepublic will be U.S.$149,181,450, the total Underwriters’ fees will be U.S.$8,577,933, the total net proceeds to uswill be U.S.$88,594,010 (or C$153,537,548, C$8,828,409 and C$91,180,955 respectively). The total net proceedsto the Selling Shareholders will be unaffected by the exercise of the Over-Allotment Option.
Lock-Up Agreements
Pursuant to the Underwriting Agreement, DragonWave and each of our directors and officers, EnterprisePartners V, L.P., Enterprise Partners VI, L.P., Wesley Clover Corporation and Wesley Clover International
92

Corporation, have agreed, subject to certain specified exceptions, including, among other things, this Offering,not to, without the consent of the Lead Underwriters:
• issue, offer, sell (including, without limitation, any short sale), contract or agree to sell, hypothecate,pledge, grant any option to purchase or otherwise dispose of or agree to dispose of or transfer, directly orindirectly, or establish or increase a ‘‘put equivalent position’’ or liquidate or decrease a ‘‘call equivalentposition’’ within the meaning of Section 16 of the Exchange Act, with respect to, any Common Shares, orany securities convertible into or exchangeable or exercisable for, or warrants or other rights to purchase,the foregoing; or
• file or cause to become effective a registration statement under the U.S. Securities Act, or to file aprospectus in Canada, relating to the offer and sale of any Common Shares or securities convertible intoor exercisable or exchangeable for Common Shares or other rights to purchase Common Shares or anyother of our securities that are substantially similar to Common Shares, or any securities convertible intoor exchangeable or exercisable for, or any warrants or other rights to purchase, the foregoing; or
• enter into any swap or other arrangement that transfers to another, in whole or in part, any of theeconomic consequences of ownership of Common Shares or any other of our securities that aresubstantially similar to Common Shares, or any securities convertible into or exchangeable or exercisablefor, or any warrants or other rights to purchase, the foregoing, whether any such transaction is to besettled by delivery of Common Shares or such other securities, in cash or otherwise; or
• publicly announce an intention to do any of the foregoing for a period of 90 days following theClosing Date.
This restriction terminates after the close of trading of the Common Shares on January 25, 2010.
The Lead Underwriters, may, in their sole discretion and at any time or from time to time before thetermination of the restricted period, without notice, waive compliance with or release all or any portion of thesecurities subject to the lock-up agreements.
Electronic Distribution
A prospectus in electronic format may be made available on websites or through other online servicesmaintained by one or more of the Underwriters or by their affiliates. Other than the prospectus in electronicformat, the information on any Underwriter’s website and any information contained in any other websitemaintained by an Underwriter is not part of the prospectus or the registration statement of which this prospectusforms a part, has not been approved and/or endorsed by us or any of the Underwriters in their capacity asunderwriters and should not be relied upon by investors.
Price Stabilization, Short Positions and Penalty Bids
Pursuant to the policy statements and/or rules of certain Canadian provincial securities commissions, theUnderwriters may not, throughout the period of distribution under this short form prospectus, bid for orpurchase Common Shares. The foregoing restriction is subject to certain exceptions, as long as the bid orpurchase is not engaged in for the purpose of creating actual or apparent active trading in, or raising the price ofsuch securities. These exceptions include: (i) a bid or purchase of Common Shares permitted under theUniversal Market Integrity Rules for Canadian Marketplaces administered by the Investment IndustryRegulatory Organization of Canada relating to market stabilization and passive market-making activities, and(ii) a bid or purchase made for, or on behalf of, a customer where the order was not solicited during the periodof distribution, provided that the bid or purchase was not engaged in for the purpose of creating actual orapparent active trading in, or raising the price of such securities. Subject to the foregoing and applicable laws,the Underwriters may, in connection with the Offering, over-allot or effect transactions which intend to stabilize,maintain or support the market price of the Common Shares at levels other than those which otherwise mightprevail on the open market. Such transactions, if commenced, may be discontinued at any time.
93

In addition, the rules of the SEC may limit the ability of the Underwriters to bid for or purchase CommonShares before the distribution of the Offered Shares is completed. However, the Underwriters may engage in thefollowing activities in accordance with these rules:
• stabilizing transactions that permit bids to purchase Common Shares so long as the stabilizing bids do notexceed a specified maximum;
• over-allotment transactions that involve sales by the Underwriters of Common Shares in excess of thenumber of Offered Shares the Underwriters are obligated to purchase, which creates a syndicate shortposition. The Underwriters may close out any short position by purchasing Common Shares in the openmarket; and
• penalty bids that permit the representatives to reclaim a selling concession from a syndicate memberwhen the Offered Shares originally sold by the syndicate member are purchased in a stabilizing orsyndicate covering transaction to cover syndicate short positions.
These stabilizing transactions, syndicate covering transactions and penalty bids may have the effect ofpreventing or mitigating a decline in the market price of the Common Shares, and may cause the price of theCommon Shares to be higher than would otherwise exist in the open market absent such stabilizing activities. Asa result, the price of the Common Shares may be higher than the price that might otherwise exist in the openmarket. These transactions may be effected on the TSX, NASDAQ, in the over-the-counter market or otherwiseand, if commenced, may be discontinued at any time.
Neither we, nor any of the Underwriters makes any representation or prediction as to the direction ormagnitude of any effect that the transactions described above may have on the price of our Common Shares.
DOCUMENTS INCORPORATED BY REFERENCE
Information has been incorporated by reference in this short form prospectus from documents filed with thesecurities commissions or similar regulatory authorities in Canada (collectively, the ‘‘Commissions’’). Copies ofthe documents incorporated by reference may be obtained on request without charge from our Secretary at411 Legget Drive, Suite 600, Ottawa, Ontario, Canada, K2K 3C9, telephone: (613) 599-9991; facsimile:(613) 599-4225, or by accessing our disclosure documents available through the internet on SEDAR which canbe accessed at www.sedar.com and on the SEC’s website at www.sec.gov.
We file annual and quarterly financial information, material change reports and other information with theCommissions. The Commissions allow us to ‘‘incorporate by reference’’ the information it files with them, whichmeans that we can disclose important information to you by referring you to those documents. Information thatis incorporated by reference is an important part of this short form prospectus. The following documents filedwith the Commissions are specifically incorporated by reference into and form an integral part of this short formprospectus:
(i) our annual information form dated May 7, 2009 for the fiscal year ended February 28, 2009;
(ii) our management’s discussion and analysis of consolidated results of operations and financial conditiondated May 7, 2009 for the fiscal year ended February 28, 2009;
(iii) our management’s discussion and analysis of consolidated results of operations and financial conditiondated July 14, 2009 for the three month period ended May 31, 2009;
(iv) our Management Circular;
(v) our news release dated June 9, 2009 announcing the ratification of our shareholder rights plan byshareholders;
94
(vi) DragonWave’s Financial Statements;
(vii) our unaudited interim consolidated financial statements for the three and six months ended August 31,2009; and
(viii) our management’s discussion and analysis of consolidated results of operations and financial conditiondated October 8, 2009 for the three and six months ended August 31, 2009.
Any annual information forms, annual consolidated financial statements and related management’sdiscussion and analysis, consolidated interim financial statements and related management’s discussion andanalysis, any material change reports (except confidential material change reports), business acquisition reports,information circulars, the content of any news release disclosing financial information for a period more recentthan the period for which financial information is deemed incorporated by reference in this short formprospectus and certain other disclosure documents as set forth in section 11.1 of Form 44-101F1 of NationalInstrument 44-101 — Short Form Prospectus Distributions filed by us with the securities commissions or similarregulatory authorities in Canada on or after the date of this short form prospectus and prior to the terminationof the Offering shall be deemed to be incorporated by reference in this short form prospectus. Any report filedby us with the SEC or Report of Foreign Private Issuer on Form 6-K furnished to the SEC pursuant toSection 13(a), 13(c), 14 or 15(d) of the Exchange Act after the date of this short form prospectus until thetermination of the distribution under this short form prospectus shall be deemed to be incorporated by referenceinto the registration statement of which this short form prospectus forms a part of, if and to the extent expresslyprovided in such report. The documents incorporated or deemed to be incorporated by reference herein containmeaningful and material information relating to us and the readers should review all information contained inthis short form prospectus and the documents incorporated or deemed to be incorporated by reference herein.
Any statement contained in a document incorporated or deemed to be incorporated by reference hereinshall be deemed to be modified or superseded for the purposes of this short form prospectus, to the extent that astatement contained herein or in any other subsequently filed document which also is or is deemed to beincorporated by reference in this short form prospectus modifies or supersedes such statement. Any statementso modified or superseded shall not constitute a part of this short form prospectus, except as so modified orsuperseded. The modifying or superseding statement need not state that it has modified or superseded a priorstatement or include any other information set forth in the document that it modifies or supersedes. The makingof such a modifying or superseding statement shall not be deemed an admission for any purposes that themodified or superseded statement, when made, constituted a misrepresentation, an untrue statement of amaterial fact or an omission to state a material fact that is required to be stated or that is necessary to make astatement not misleading in light of the circumstances in which it was made. Without limiting the generality ofthe foregoing, the description of our business appearing in this short form prospectus under the heading ‘‘OurBusiness’’ modifies and supersedes in its entirety the description of our business contained under the heading‘‘Description of the Business’’ on pages 7 through 13 of our annual information form dated May 7, 2009.
AUDITORS, TRANSFER AGENT AND REGISTRAR
Our auditors are Ernst & Young LLP, Ottawa, Ontario. The transfer agent and registrar for the OfferedShares is Computershare Investor Services Inc. at its principal offices located in Toronto, Ontario.
RECONCILIATION TO U.S. GAAP
Our consolidated financial statements were prepared in accordance with Canadian GAAP that differ insome respects from U.S. GAAP. We have reconciled our financial results for significant differences betweenCanadian GAAP and U.S. GAAP in accordance with the instructions of Item 18 of SEC Form 20-F as set out innote 20 in DragonWave’s Financial Statements which are contained elsewhere, and are incorporated byreference, in this short form prospectus.
Financial statement readers should understand that there are certain significant differences betweenCanadian GAAP and U.S. GAAP. In order to facilitate the understanding of the differences that would havearisen had these financial statements been presented in accordance with U.S. GAAP, refer to note 20 inDragonWave’s Financial Statements.
95

CERTAIN CANADIAN FEDERAL INCOME TAX CONSIDERATIONSFOR NON-RESIDENTS OF CANADA
The following summary describes the principal Canadian federal income tax considerations generallyapplicable to a purchaser who acquires, as a beneficial owner, Offered Shares pursuant to this Offering and who,at all relevant times, for the purposes of the application of the Income Tax Act (Canada) (the ‘‘Tax Act’’) and theregulations thereunder, (1) is not, and is not deemed to be, resident in Canada; (2) does not use or hold, and isnot deemed to use or hold, the Offered Shares in a business carried on in Canada; (3) deals at arm’s length withus; (4) is not affiliated with us, the Underwriters or a subsequent purchaser of the Offered Shares; and (5) holdsthe Offered Shares as capital property (a ‘‘Non-Resident Holder’’). Generally, the Offered Shares will be capitalproperty to a Non-Resident Holder provided the Non-Resident Holder does not acquire or hold those OfferedShares in the course of carrying on a business or as part of an adventure or concern in the nature of trade.
Special rules, which are not discussed in this summary, may apply to a Non-Resident Holder that is aninsurer that carries on an insurance business in Canada and elsewhere.
This summary is based on the current provisions of the Tax Act, and counsel’s understanding of the currentadministrative policies and assessing practices of the Canada Revenue Agency (‘‘CRA’’) published in writingprior to the date hereof. This summary takes into account all specific proposals to amend the Tax Act publiclyannounced by or on behalf of the Minister of Finance (Canada) prior to the date hereof (the ‘‘ProposedAmendments’’) and assumes that all Proposed Amendments will be enacted in the form proposed. However, noassurances can be given that the Proposed Amendments will be enacted as proposed, or at all. This summarydoes not otherwise take into account or anticipate any changes in law or administrative policy or assessingpractice whether by legislative, regulatory, administrative or judicial action nor does it take into account taxlegislation or considerations of any province, territory or foreign jurisdiction, which may differ from thosediscussed herein.
This summary is of a general nature only and is not, and is not intended to be, legal or tax advice to anyparticular purchaser. This summary is not exhaustive of all Canadian federal income tax considerations.Accordingly, a purchaser should consult their own tax advisors with respect to their particular circumstances.
Currency Conversion
Generally, for purposes of the Tax Act, all amounts relating to the acquisition, holding or disposition of theOffered Shares must be converted into Canadian dollars based on the exchange rates as determined inaccordance with the Tax Act. The amount of dividends required to be included in the income of, and capitalgains or capital losses realized by, a Non-Resident Holder may be affected by fluctuations in exchange rates.
Dividends
Dividends paid or credited or deemed to be paid or credited to a Non-Resident Holder by us will be subjectto Canadian withholding tax at the rate of 25 per cent of the gross amount of the dividend, subject to anyreduction in the rate of withholding to which the Non-Resident Holder is entitled under any applicable incometax convention between Canada and the country in which the Non-Resident Holder is resident. For example,where the Non-Resident Holder is a U.S. resident entitled to benefits under the Canada-U.S. Income TaxConvention (1980) and is the beneficial owner of the dividends, the applicable rate of Canadian withholding taxis generally reduced to 15 per cent.
Dispositions
A Non-Resident Holder will not be subject to tax under the Tax Act on any capital gain realized on adisposition of an Offered Share, unless the Offered Share is or is deemed to be ‘‘taxable Canadian property’’ tothe Non-Resident Holder for the purposes of the Tax Act and the Non-Resident Holder is not entitled to reliefunder an applicable income tax convention between Canada and the country in which the Non-Resident Holderis resident.
Generally, provided the Common Shares are listed on a ‘‘designated stock exchange’’ as (defined in theTax Act) (which includes the TSX and NASDAQ) at the time of disposition, the Common Shares will not
96
constitute taxable Canadian property of a Non-Resident Holder, unless at any time during the 60-month periodimmediately preceding the disposition, the Non-Resident Holder, persons with whom the Non-Resident Holderdid not deal at arm’s length, or the Non-Resident Holder together with all such persons, owned 25 per cent ormore of our issued Offered Shares or any other class or series of our shares. Notwithstanding the foregoing, incertain circumstances set out in the Tax Act, the Offered Shares would be deemed to be taxable Canadianproperty. Non-Resident Holders whose Offered Shares constitute taxable Canadian property should consult withtheir own tax advisors.
CERTAIN UNITED STATES FEDERAL INCOME TAX CONSIDERATIONS FOR U.S. HOLDERS
This section describes the material United States federal income tax considerations of the acquisition,ownership and disposition of the Offered Shares. This summary addresses only persons or entities that are‘‘U.S. holders’’ (as defined below). This summary is for general information purposes only and does not purportto be a complete analysis or listing of all potential U.S. federal income tax consequences that may apply to aU.S. holder arising from or relating to the acquisition, ownership, and disposition of the Offered Shares. Inaddition, this summary does not take into account the individual facts and circumstances of any particularU.S. holder that may affect the U.S. federal income tax consequences to such U.S. holder. Accordingly, thissummary is not intended to be, and should not be construed as, legal or U.S. federal income tax advice withrespect to any U.S. holder. This summary does not address the U.S. state and local, U.S. federal estate and gift,or foreign tax consequences or the alternative minimum tax provisions of the Code (as defined below). EachU.S. holder should consult its own financial advisor, legal counsel, or accountant regarding the U.S. federalincome, U.S. state and local, and foreign tax consequences arising from and relating to the acquisition,ownership, and disposition of Offered Shares.
This section does not apply to you if you are a member of a class of holders subject to special rules,including, but not limited to:
• U.S. holders that are tax-exempt organizations, qualified retirement plans, individual retirementaccounts, or other tax-deferred accounts;
• U.S. holders that are financial institutions, insurance companies, real estate investment trusts, orregulated investment companies;
• U.S. holders that are dealers in securities or currencies or U.S. holders that are traders in securities thatelect to apply a mark-to-market accounting method;
• U.S. holders that have a ‘‘functional currency’’ other than the U.S. dollar;
• U.S. holders that own Offered Shares as part of a straddle, hedging transaction, conversion transaction,constructive sale, or other arrangement involving more than one position;
• U.S. holders who use Offered Shares as security for a loan;
• U.S. holders that acquired Offered Shares in connection with the exercise of employee stock options orotherwise as compensation for services;
• U.S. holders that hold Offered Shares other than as capital assets within the meaning of Section 1221 ofthe Code;
• U.S. expatriates or former longer-term residents of the U.S.; and
• U.S. holders that own (directly, indirectly, or by attribution) 10% or more of the total combined votingpower of our outstanding shares.
This section is based on the Internal Revenue Code of 1986, as amended (the ‘‘Code’’), its legislativehistory, existing and proposed regulations under the Code, published rulings and court decisions, theConvention Between Canada and the United States of America with Respect to Taxes on Income and onCapital, signed September 26, 1980, as amended (the ‘‘Canada-U.S. Tax Convention’’), all as in effect on thedate of this Offering, and all of which are subject to change, possibly with retroactive effect. This summary does
97

not discuss the potential effects, whether adverse or beneficial, of any proposed legislation that, if enacted, couldbe applied on a retroactive basis.
This summary is not binding upon the Internal Revenue Service (the ‘‘IRS’’) and no rulings have been orwill be sought from the IRS regarding any matters discussed in this summary. In that regard, there can be noassurance that one or more of the tax considerations described in this summary will not be challenged by the IRSor a U.S. court.
If a partnership (or other entity or arrangement treated as a partnership for United States federal incometax purposes) holds the Offered Shares, the United States federal income tax treatment of a partner(or member) will generally depend on the status of the partner and the tax treatment of the partnership(or other entity). A partner in a partnership (or member of such other entity) holding the Offered Shares shouldconsult its tax advisor with regard to the U.S. federal income tax treatment of an investment in theOffered Shares.
You are a U.S. holder if you are a beneficial owner of an Offered Share and you are:
• an individual who is a citizen or resident (including a lawful permanent resident alien holding a greencard) of the United States as determined for U.S. federal income tax purposes;
• a corporation (or other entity treated as a corporation for U.S. federal income tax purposes) created ororganized in or under the laws of the United States or any state thereof or the District of Columbia;
• an estate whose income is subject to U.S. federal income tax regardless of its source; or
• a trust if it (1) is subject to the primary supervision of a federal, state or local court within theUnited States and one or more United States persons are authorized to control all substantial decisionsof the trust or (2) has a valid election in effect under applicable Treasury Regulations to be treated as aU.S. person.
A ‘‘non-U.S. holder’’ is a beneficial owner of an Offered Share that is not a U.S. holder.
The United States federal income tax consequences of the acquisition, ownership and disposition of theOffered Shares can be very complex and, in certain cases, uncertain or potentially unfavourable to a U.S. holder.Accordingly, each prospective investor considering an acquisition of, or who acquires Offered Shares pursuantto this Offering is strongly urged to consult its own tax advisor with respect to the United States federal, state orlocal income and alternative minimum tax, United States federal estate or gift, or foreign tax consequences ofsuch acquisition, ownership and disposition of Offered Shares in light of its own particular facts andcircumstances.
U.S. Holders
Taxation of Distributions
Under the U.S. federal income tax laws, and subject to the passive foreign investment company (‘‘PFIC’’)rules discussed below, if you are a U.S. holder, a distribution of cash, if any, paid on an Offered Share, includinga constructive distribution, generally will be included in your gross income as a dividend (without reduction forany amounts withheld in respect of Canadian federal income tax) to the extent of our current or accumulated‘‘earnings and profits’’ (as computed under United States federal income tax rules).
If you are a non-corporate U.S. holder, dividends paid to you in taxable years beginning before January 1,2011 that constitute qualified dividend income will be taxable to you at a maximum tax rate of 15% provided thatyou hold the Offered Shares for more than 60 days during the 121-day period beginning 60 days before theex-dividend date and meet other holding period requirements. Dividends we pay with respect to the OfferedShares should be qualified dividend income provided that we are not a PFIC in the year the dividend is paid orthe previous taxable year.
You must include any Canadian tax withheld from the dividend payment in this gross amount even thoughyou do not in fact receive the withheld amount. The dividend is taxable to you when you receive the dividend,actually or constructively. The dividend will not be eligible for the dividends-received deduction generally
98

allowed to U.S. corporations in respect of dividends received from other U.S. corporations. The amount of thedividend distribution that you must include in your income as a U.S. holder will be the U.S. dollar value of theCanadian dollar payments made, determined at the spot Canadian dollar/U.S. dollar rate on the date thedividend distribution is includible in your income, regardless of whether the payment is in fact converted intoU.S. dollars. Generally, any gain or loss resulting from currency exchange fluctuations during the period fromthe date you include the dividend payment in income to the date you convert the payment into U.S. dollars willbe treated as ordinary income or loss. The gain or loss generally will be income or loss from sources within theUnited States for foreign tax credit limitation purposes.
To the extent that a distribution paid on the Offered Shares is in excess of our current and accumulated‘‘earnings and profits’’ (as determined for U.S. federal income tax purposes), such distribution generally will betreated as a non-taxable return of capital to the extent of your adjusted tax basis in the Offered Shares, with anyexcess treated as a gain from the sale or exchange of the Shares.
A U.S. holder that pays (whether directly or through withholding) Canadian income tax with respect todistributions by us generally will be entitled, at the election of such U.S. holder, to receive either a deduction ora credit for such Canadian income tax paid. Complex limitations apply to the foreign tax credit, including thegeneral limitation that the credit cannot exceed the proportionate share of a U.S. holder’s U.S. federal incometax liability that such U.S. holder’s ‘‘foreign source’’ taxable income bears to such U.S. holder’s worldwidetaxable income. In applying this limitation, a U.S. holder’s various items of income and deduction must beclassified, under complex rules, as either ‘‘foreign source’’ or ‘‘U.S. source.’’ Special rules apply in determiningthe foreign tax credit limitation with respect to dividends that are subject to the maximum 15% tax rate.
For foreign tax credit purposes, dividends will be income from sources outside the United States and will,depending on your circumstances, be either ‘‘passive category’’ or ‘‘general category’’ income for purposes ofcomputing the foreign tax credit allowable to you. However, the amount of a distribution with respect to theOffered Shares that is treated as a ‘‘dividend’’ may be lower for U.S. federal income tax purposes than it is forCanadian federal income tax purposes, potentially resulting in a reduced foreign tax credit allowance to aU.S. holder. The foreign tax credit rules are complex, and each U.S. holder should consult its own U.S. taxadvisor regarding the foreign tax credit rules.
Taxation of Sale, Exchange or other Taxable Disposition
Subject to the PFIC rules discussed below, if you are a U.S. holder and you sell or otherwise dispose of yourOffered Shares, you will recognize gain or loss for United States federal income tax purposes equal to thedifference between the United States dollar value of the amount that you realize and your tax basis, determinedin United States dollars, in your Offered Shares. Any such gain or loss will be capital gain or loss if the OfferedShares are held by you as capital assets. Any such gain or loss generally will be United States source income orloss for purposes of applying the United States foreign tax credit rules unless the gain is subject to tax in Canadaand is re-sourced as ‘‘foreign source’’ under the Convention and such U.S. holder elects to treat such gain as‘‘foreign source.’’ Capital gain of a non-corporate U.S. holder that is recognized in taxable years beginningbefore January 1, 2011 is generally taxed at a maximum rate of 15% where the U.S. holder has a holding periodgreater than one year. Deductions for capital losses are subject to limitations.
PFIC Rules
If we are considered to be a PFIC, as that term is defined in Section 1297 of the Code, at any time during aU.S. holder’s holding period, the following sections will generally describe the United States federal income taxconsequences to a U.S. holder in relation to the acquisition, ownership and disposition of Offered Shares.
We generally will be regarded as a PFIC for United States federal income tax purposes if, for a taxable year,either (i) 75% or more of our gross income for such taxable year is passive income or (ii) on the basis of aquarterly average, 50% or more of the assets held by us either produce passive income or are held for theproduction of passive income, based on the fair market value of such assets. ‘‘Passive income’’ includes, forexample, dividends, interest, certain rents and royalties, certain gains from the sale of stock and securities, andcertain gains from commodities transactions. If a foreign corporation (such as DragonWave) owns, directly orindirectly, at least 25% by value of the stock of another corporation, the foreign corporation is treated for
99

purposes of the PFIC tests described above as owning its proportionate share of the assets of the othercorporation, and as receiving directly its proportionate share of the other corporation’s income. In addition,under certain attribution rules, if we are a PFIC, U.S. holders will be deemed to own their proportionate shareof the our subsidiaries which are PFICs (such subsidiaries referred to as ‘‘Subsidiary PFICs’’), and will be subjectto U.S. federal income tax on (i) a distribution on the shares of a Subsidiary PFIC and (ii) a disposition of sharesof a Subsidiary PFIC, both as if the holder directly held the shares of such Subsidiary PFIC.
We believe that the Offered Shares should not be treated as interests in a PFIC for U.S. federal income taxpurposes for the taxable year ending December 31, 2009. However, PFIC classification is fundamentally factualin nature, generally cannot be determined until the close of the taxable year in question, and is determinedannually. Consequently, there can be no assurance that we have never been and will not become a PFIC for anytaxable year during which U.S. holders hold Offered Shares.
In any given taxable year for which we are classified as a PFIC, during which a U.S. holder holds OfferedShares, a U.S. holder would be subject to increased tax liability (possibly including a non-deductible interestcharge) upon the sale or other disposition of the Offered Shares or upon the receipt of certain distributionstreated as ‘‘excess distributions,’’ unless such U.S. holder elects to be taxed currently, by making aMark-to-Market or a Qualified Electing Fund (‘‘QEF’’) Election. An excess distribution generally would be anydistribution to a U.S. holder with respect to Offered Shares during a single taxable year that is greater than125% of the average annual distributions received by such U.S. holder with respect to the Offered Shares duringthe three preceding taxable years or, if shorter, during such U.S. holder’s holding period for the Offered Shares.In addition, certain special, generally adverse rules would apply to the Offered Shares if we are a PFIC. Forexample, under certain proposed Treasury regulations, a ‘‘disposition’’ for this purpose may include, undercertain circumstances, transfers at death, gifts, pledges, transfers pursuant to tax-deferred reorganizations andother transactions with respect to which gain ordinarily would not be recognized. In addition, if we are treated asa PFIC, dividends paid by us will not be eligible for taxation at the preferential tax rates described above underthe heading ‘‘Taxation of Distributions’’.
If a U.S. holder owns the Offered Shares during any year in which we are a PFIC, such U.S. holder mustalso file IRS Form 8621 regardless of whether such holder makes a Mark-to-Market or QEF Election.
Under the PFIC rules:
• the gain or excess distribution will be allocated ratably over your holding period for the Offered Shares;
• the amount allocated to the taxable year in which you realized the gain or excess distribution will be taxedas ordinary income;
• the amount allocated to each prior year, with certain exceptions, will be taxed at the highest tax rate ineffect for that year; and
• the interest charge generally applicable to underpayments of tax will be imposed in respect of the taxattributable to each such year. A U.S. holder that is not a corporation must treat such interest asnon-deductible personal interest.
If we were a PFIC, a U.S. holder might be able to make a Mark-to-Market Election with respect to theOffered Shares to mitigate some of these adverse tax consequences. A U.S. holder that holds stock of a PFICgenerally may make a Mark-to-Market Election with respect to its stock if the stock constitutes ‘‘marketablestock’’. Marketable stock is stock that is regularly traded (other than in de minimis quantities) on a U.S. ornon-U.S. exchange or other market that the U.S. Treasury Department determines has trading, listing, financialdisclosure, and other rules adequate to carry out the purposes of the Mark-to-Market Election. The OfferedShares should constitute marketable stock with respect to which a Mark-to-Market Election could be made. Insuch case, a U.S. holder would generally include as ordinary income or loss the difference between the fairmarket value of the Offered Shares at the end of the taxable year and the adjusted tax basis of the OfferedShares (but loss could only be included to the extent of the net amount of previously included income as a resultof the Mark-to-Market Election). If a U.S. holder made the election, the U.S. holder’s tax basis in the OfferedShares would be adjusted to reflect any such income or loss amounts. Any gain recognized on the sale or otherdisposition of Offered Shares would be treated as ordinary income. A U.S. holder should consult their own tax
100

advisors regarding the availability and advisability of making a Mark-to-Market Election with respect to theOffered Shares in their particular circumstances in the event the Company is or becomes a PFIC. AMark-to-Market Election would not be available for any Subsidiary PFIC.
The QEF Election, if available, generally would allow a U.S. holder to avoid the consequences of the PFICrules but would require such holder to include its pro rata share of the Company’s ordinary income and netcapital gain in income currently, whether or not distributed. However, the Company does not intend to provideU.S. holders with such information as may be required to make a QEF Election effective in the event it isa PFIC.
The PFIC rules are complex and in certain cases, uncertain. Each U.S. holder is strongly urged to consult itstax advisor regarding application and operation of the PFIC rules, including the availability and advisability of,and procedure for, making the Mark-to-Market and/or QEF Elections.
Backup Withholding and Information Reporting
Under U.S. federal income tax law and Treasury regulations, certain categories of U.S. holders must fileinformation returns with respect to their investment in, or involvement in, a foreign corporation. Penalties forfailure to file certain of these information returns are substantial. U.S. holders who acquire Offered Sharesthrough the Offering and hold Offered Shares should consult with their own tax advisors regarding therequirements of filing information returns, and if applicable, any Mark-to-Market Election or QEF Election.
If the holder is a non-corporate U.S. holder, then payments to it made within the United States, or by aUnited States payor or United States middleman, of dividends on or proceeds arising from the sale or othertaxable disposition of Offered Shares, and/or proceeds arising from the sale or other taxable disposition ofOffered Shares, generally will be subject to information reporting and backup withholding (currently at the rateof 28%), where such U.S. holder fails to furnish its correct United States taxpayer identification number(generally on IRS Form W-9), and to make certain certifications, or otherwise fails to establish an exemptionfrom backup withholding. Any amounts withheld under the backup withholding rules from a payment to aU.S. holder generally may be refunded (or credited against its United States federal income tax liability, if any)provided the required information is furnished to the IRS in a timely manner. Each U.S. holder should consultits own tax advisor regarding the backup withholding tax.
NASDAQ QUORUM REQUIREMENT
NASDAQ Marketplace Rule 5615(a)(3) permits a foreign private issuer to follow its home country practicein lieu of certain of the requirements of the Rule 5600 Series. A foreign private issuer that follows a homecountry practice in lieu of one or more provisions of the Rule 5600 Series shall disclose in its registrationstatement related to its initial public offering or first U.S. listing on NASDAQ, or on its website, eachrequirement of the Rule 5600 Series that it does not follow and describe the home country practice followed bythe issuer in lieu of those requirements.
We do not follow Rule 5620(c), but instead follow our home country practice. The NASDAQ minimumquorum requirement under Rule 5620(c) for a meeting of shareholders is 33.33% of the outstanding commonshares. In addition, Rule 5620(c) requires that an issuer listed on NASDAQ state its quorum requirement in itsbylaws. On September 23, 2009. as permitted by the Canada Business Corporations Act, our directors approved aby-law amendment to our quorum requirement, to be made effective on the date immediately preceding theclosing of the Offering, to require two persons present in person or by proxy who together hold 25% or more ofour Common Shares. The foregoing is consistent with the laws, customs, and practices in Canada. If the by-lawamendment is not approved by a resolution of the shareholders at our next meeting of shareholders, theamendment will cease to be effective and the quorum requirement will be reduced to two persons present inperson or by proxy who together hold not less than 5% of the Common Shares.
101
WHERE YOU CAN FIND MORE INFORMATION
We have filed with the SEC under the U.S. Securities Act a registration statement on Form F-10 relating tothe Offered Shares and of which this short form prospectus is a part. This prospectus does not contain all of theinformation set forth in such registration statement, as to which reference is made for further information. Uponeffectiveness of such registration statement on Form F-10, we will become subject to the informationalrequirements of the Exchange Act, and in accordance therewith will be required to file reports and otherinformation with the SEC. Under the MJDS adopted by the United States and Canada, we may prepare suchreports and other information in accordance with the disclosure requirements of Canada, which requirementsare different from those of the United States. Prospective investors may read any document we file or furnish tothe SEC, including those documents that are incorporated by reference in this short form prospectus, which arefiled as exhibits to the registration statement on Form F-10, at the SEC’s website at http://www.sec.gov. Investorsmay also read and copy any document we file at the SEC’s Public Reference Room at 100 F Street, N.E.,Washington, D.C. 20549. Please call the SEC at 1-800-SEC-0330 for further information on the operation of thePublic Reference Room.
As a ‘‘foreign private issuer’’ under the Exchange Act, we intend to provide shareholders with proxystatements and annual reports prepared in accordance with applicable Canadian law. Our annual reports will beavailable within 90 days of the end of each fiscal year and will contain our audited consolidated financialstatements. We will also make available quarterly reports containing unaudited summary consolidated financialinformation for each of the first three fiscal quarters. We intend to prepare these financial statements inaccordance with Canadian GAAP (and for the fiscal year ending February 28, 2012 and thereafter to preparethese financial statements in accordance with IFRS) and to include a reconciliation to U.S. GAAP in the notesto the annual consolidated financial statements. We are exempt from provisions of the Exchange Act whichrequire issuers to provide proxy statements in prescribed form to shareholders and officers, directors andshareholders are exempt from U.S. insider reporting requirements and ‘‘short swing’’ profit liability.
We have or will file the following documents with the SEC as part of the registration statement of which thisshort form prospectus forms a part: the documents set out under the heading ‘‘Documents Incorporated byReference’’; consents of auditors and counsel; the powers of attorney from our directors and certain of ourofficers; and the form of underwriting agreement.
ENFORCEABILITY OF CIVIL LIABILITIES
We are a corporation existing under the Canada Business Corporations Act. Many of our directors andofficers are residents of Canada or other non-U.S. jurisdictions, and all or a substantial portion of their assets,and a substantial portion of our assets, are located outside the United States. We have appointed an agent forservice of process in the United States (as set forth below), but it may be difficult for holders of Offered Shareswho reside in the United States to effect service within the United States upon those directors, officers andexperts who are not residents of the United States. It may also be difficult for holders of Offered Shares whoreside in the United States to realize in the United States upon judgments of courts of the United Statespredicated upon our civil liability and the civil liability of our directors, officers and experts under theUnited States federal securities laws.
We filed with the SEC, concurrently with our registration statement on Form F-10 of which this short formprospectus is a part, an appointment of agent for service of process on Form F-X. Under the Form F-X, weappointed Corporation Service Company as our agent for service of process in the United States in connectionwith any investigation or administrative proceeding conducted by the SEC, and any civil suit or action broughtagainst or involving us in a United States court arising out of or related to or concerning the offering of theOffered Shares under this short form prospectus.
102
LEGAL MATTERS
Certain legal matters related to the Offered Shares being offered hereby are being passed upon on ourbehalf by Fraser Milner Casgrain LLP with respect to Canadian legal matters and DLA Piper LLP (US) withrespect to U.S. legal matters, and on behalf of the Underwriters by Stikeman Elliott LLP with respect toCanadian legal matters and Paul, Weiss, Rifkind, Wharton & Garrison LLP with respect to U.S. legal matters.
As of the date hereof, the partners and associates of each of Fraser Milner Casgrain LLP, DLA Piper LLP(US), Stikeman Elliott LLP and Paul, Weiss, Rifkind, Wharton & Garrison LLP, in each case as a group,beneficially own, directly or indirectly, less than 1%, respectively, of our outstanding securities.
EXPERTS
Our amended consolidated financial statements for the fiscal years ended February 28, 2009 andFebruary 29, 2008, which comprise part of DragonWave’s Financial Statements, have been audited byErnst & Young LLP, independent registered chartered accountants, as stated in their report dated April 17, 2009(except as to note 20 which is dated August 25, 2009) which is contained elsewhere, and is incorporated byreference, in this short form prospectus and has been so incorporated in reliance upon the report of such firmgiven upon their authority as experts in accounting and auditing.
103

ELIGIBILITY FOR INVESTMENT
In the opinion of our Canadian counsel Fraser Milner Casgrain LLP and Stikeman Elliott LLP, Canadiancounsel to the Underwriters, provided the Offered Shares are listed on a designated stock exchange (whichcurrently includes the TSX and NASDAQ) on the date of closing of this Offering, the Offered Shares will be, asat that date, qualified investments under the Tax Act and the regulations thereunder for trusts governed byregistered retirement savings plans, registered retirement income funds, registered education savings plans,deferred profit sharing plans, registered disability savings plans and tax-free savings accounts (‘‘TFSA’’).
Notwithstanding the foregoing, a holder of the Offered Shares will be subject to a penalty tax if the OfferedShares held in a TFSA are a ‘‘prohibited investment’’ under the Tax Act. The Offered Shares generally will notbe a ‘‘prohibited investment’’ unless either (i) the holder of the TFSA does not deal at arm’s length withDragonWave, or (ii) the holder has a ‘‘significant interest’’ in DragonWave within the meaning of the Tax Act,which includes, but is not limited to, the ownership of 10% or more of any class of the issued shares ofDragonWave. Holders should consult their own tax advisors as to whether the Offered Shares will be a‘‘prohibited investment’’ in their particular circumstances.
PURCHASERS’ STATUTORY RIGHTS
Securities legislation in certain of the provinces of Canada provides purchasers with the right to withdrawfrom an agreement to purchase securities. This right may be exercised within two business days after receipt ordeemed receipt of a prospectus and any amendment. In several of the provinces, the securities legislation furtherprovides a purchaser with remedies of rescission or, in some jurisdictions, revisions or the price or damages if theprospectus and any amendment contains a misrepresentation or is not delivered to the purchaser, provided thatthe remedies for rescission, revisions of the price or damages are exercised by the purchaser within the time limitprescribed by the securities legislation of the purchaser’s province. Purchasers should refer to any applicableprovisions of the securities legislation of their province for the particulars of these rights or consult with alegal advisor.
PURCHASERS’ CONTRACTUAL RIGHT OF ACTION
We may make available certain materials describing the Offering (the ‘‘Website Materials’’) on the websiteof one or more commercial services such as www.retailroadshow.com and/or www.netroadshow.com under theheading ‘‘Dragonwave Inc.’’ in accordance with U.S. securities law during the period prior to obtaining a finalreceipt for the final short form base PREP prospectus relating to this Offering (the ‘‘Final Prospectus’’) from thesecurities regulatory authorities in each of the provinces of Canada, except the province of Quebec(the ‘‘Canadian Jurisdictions’’). In order to give purchasers in each of the Canadian Jurisdictions the sameunrestricted access to the Website Materials as provided to U.S. purchasers, we have applied for and obtainedexemptive relief from the securities regulatory authorities in each of the Canadian Jurisdictions. Pursuant to theterms of that exemptive relief, we and each of the Canadian Underwriters signing the certificate contained in theFinal Prospectus have agreed that, in the event that the Website Materials contained any untrue statement of amaterial fact or omitted to state a material fact required to be stated or necessary in order to make anystatement therein not misleading in the light of the circumstances in which is was made (a ‘‘misrepresentation’’)a purchaser resident in any of the Canadian Jurisdictions who purchases Common Shares pursuant to the FinalProspectus during the period of distribution shall have, without regard to whether the purchaser relied on themisrepresentation, rights against us and each Canadian Underwriter with respect to such misrepresentations asare equivalent to the rights under section 130 of the Securities Act (Ontario) or the comparable provision of thesecurities legislation of each of the other Canadian Jurisdictions, as if such misrepresentation was contained inthe Final Prospectus.
104

AUDITORS’ CONSENT
We have read the supplemented short form PREP prospectus of DragonWave Inc. (the ‘‘Company’’) datedOctober 14, 2009 qualifying the distribution of Offered Shares of the Company. We have complied withCanadian generally accepted standards for an auditor’s involvement with offering documents.
We consent to the incorporation by reference, and the inclusion, in the above-mentioned short formprospectus of our report to the shareholders of the Company on the consolidated balance sheets of theCompany as at February 28, 2009 and February 29, 2008 and the consolidated statements of operations,comprehensive loss and deficit and consolidated statements of cash flows for each of the years in the two-yearperiod ended February 28, 2009. Our report is dated April 17, 2009 (except as to note 20 which is datedAugust 25, 2009).
Ottawa, Canada Ernst & Young LLPOctober 14, 2009 Chartered Accountants, Licensed Public Accountants
105

AMENDED AUDITED CONSOLIDATED FINANCIAL STATEMENTS FOR THEYEARS ENDED FEBRUARY 28, 2009 AND FEBRUARY 29, 2008
AND AMENDED CONSOLIDATED FINANCIAL STATEMENTS FOR THETHREE MONTH PERIOD ENDED MAY 31, 2009
F-1
AUDITORS’ REPORT
To the Shareholders ofDragonWave Inc.
We have audited the consolidated balance sheets of DragonWave Inc. as at February 28, 2009 andFebruary 29, 2008 and the consolidated statements of operations, comprehensive loss and deficit and cash flowsfor each of the years in the two-year period ended February 28, 2009. These consolidated financial statementsare the responsibility of the Company’s management. Our responsibility is to express an opinion on theseconsolidated financial statements based on our audits.
We conducted our audits in accordance with Canadian generally accepted auditing standards. Thosestandards require that we plan and perform an audit to obtain reasonable assurance whether the financialstatements are free of material misstatement. An audit includes examining, on a test basis, evidence supportingthe amounts and disclosures in the financial statements. An audit also includes assessing the accountingprinciples used and significant estimates made by management, as well as evaluating the overall financialstatement presentation.
In our opinion, these consolidated financial statements present fairly, in all material respects, the financialposition of the Company as at February 28, 2009 and February 29, 2008 and the results of its operations and itscash flows for each of the years in the two-year period ended February 28, 2009 in accordance with Canadiangenerally accepted accounting principles.
Ottawa, Canada, /s/ Ernst & Young LLPApril 17, 2009 (except as to note 20, Chartered Accountantswhich is as of August 25, 2009) Licensed Public Accountants
F-2

DRAGONWAVE INC.
CONSOLIDATED BALANCE SHEETS
(Expressed in Cdn $000’s)
As at As at As atMay 31, February 28, February 29,
Note 2009 2009 2008
$ $ $(non-audited) (audited)
Assets
Current AssetsCash and cash equivalents . . . . . . . . . . . . . . . . . . . . . . . . . . . 21,975 8,504 1,551Short-term investments . . . . . . . . . . . . . . . . . . . . . . . . . . . . . — 14,994 31,908Accounts receivable . . . . . . . . . . . . . . . . . . . . . . . . . . . . . . . . 6 11,258 10,523 11,433Other receivables . . . . . . . . . . . . . . . . . . . . . . . . . . . . . . . . . 3 640 720 1,092Inventory . . . . . . . . . . . . . . . . . . . . . . . . . . . . . . . . . . . . . . . 4 12,533 14,238 10,584Prepaid expenses . . . . . . . . . . . . . . . . . . . . . . . . . . . . . . . . . . 447 173 424
46,853 49,152 56,992
Property and equipment . . . . . . . . . . . . . . . . . . . . . . . . . . . . . 5 2,965 2,676 2,823
2,965 2,676 2,823
Total Assets . . . . . . . . . . . . . . . . . . . . . . . . . . . . . . . . . . . . . 49,818 51,828 59,815
Liabilities
Current LiabilitiesLine of credit . . . . . . . . . . . . . . . . . . . . . . . . . . . . . . . . . . . . 6 586 641 550Accounts payable and accrued liabilities . . . . . . . . . . . . . . . . . 6,681 5,677 9,055Deferred revenue . . . . . . . . . . . . . . . . . . . . . . . . . . . . . . . . . 1,886 2,215 1,713
9,153 8,533 11,318
Commitments . . . . . . . . . . . . . . . . . . . . . . . . . . . . . . . . . . . . 10
Shareholders’ equityCapital stock . . . . . . . . . . . . . . . . . . . . . . . . . . . . . . . . . . . . . 9 119,936 119,925 119,435Contributed surplus . . . . . . . . . . . . . . . . . . . . . . . . . . . . . . . . 9 1,472 1,230 933Deficit . . . . . . . . . . . . . . . . . . . . . . . . . . . . . . . . . . . . . . . . . (80,743) (77,860) (71,871)
40,665 43,295 48,497
Total Liabilities and Shareholders’ Equity . . . . . . . . . . . . . . . 49,818 51,828 59,815
On behalf of the Board:
/s/ GERRY SPENCER /s/ CLAUDE HAW
Director Director
See accompanying notes
F-3
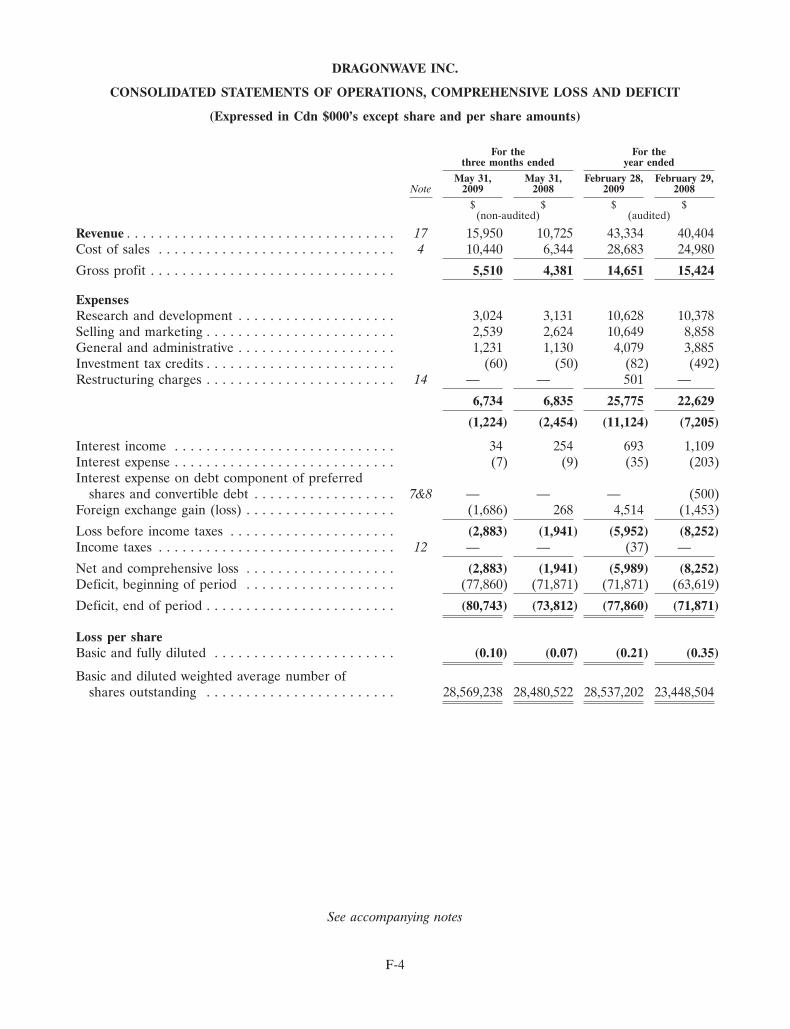
DRAGONWAVE INC.
CONSOLIDATED STATEMENTS OF OPERATIONS, COMPREHENSIVE LOSS AND DEFICIT
(Expressed in Cdn $000’s except share and per share amounts)
For the For thethree months ended year ended
May 31, May 31, February 28, February 29,Note 2009 2008 2009 2008
$ $ $ $(non-audited) (audited)
Revenue . . . . . . . . . . . . . . . . . . . . . . . . . . . . . . . . . . 17 15,950 10,725 43,334 40,404Cost of sales . . . . . . . . . . . . . . . . . . . . . . . . . . . . . . 4 10,440 6,344 28,683 24,980
Gross profit . . . . . . . . . . . . . . . . . . . . . . . . . . . . . . . 5,510 4,381 14,651 15,424
ExpensesResearch and development . . . . . . . . . . . . . . . . . . . . 3,024 3,131 10,628 10,378Selling and marketing . . . . . . . . . . . . . . . . . . . . . . . . 2,539 2,624 10,649 8,858General and administrative . . . . . . . . . . . . . . . . . . . . 1,231 1,130 4,079 3,885Investment tax credits . . . . . . . . . . . . . . . . . . . . . . . . (60) (50) (82) (492)Restructuring charges . . . . . . . . . . . . . . . . . . . . . . . . 14 — — 501 —
6,734 6,835 25,775 22,629
(1,224) (2,454) (11,124) (7,205)
Interest income . . . . . . . . . . . . . . . . . . . . . . . . . . . . 34 254 693 1,109Interest expense . . . . . . . . . . . . . . . . . . . . . . . . . . . . (7) (9) (35) (203)Interest expense on debt component of preferred
shares and convertible debt . . . . . . . . . . . . . . . . . . 7&8 — — — (500)Foreign exchange gain (loss) . . . . . . . . . . . . . . . . . . . (1,686) 268 4,514 (1,453)
Loss before income taxes . . . . . . . . . . . . . . . . . . . . . (2,883) (1,941) (5,952) (8,252)Income taxes . . . . . . . . . . . . . . . . . . . . . . . . . . . . . . 12 — — (37) —
Net and comprehensive loss . . . . . . . . . . . . . . . . . . . (2,883) (1,941) (5,989) (8,252)Deficit, beginning of period . . . . . . . . . . . . . . . . . . . (77,860) (71,871) (71,871) (63,619)
Deficit, end of period . . . . . . . . . . . . . . . . . . . . . . . . (80,743) (73,812) (77,860) (71,871)
Loss per shareBasic and fully diluted . . . . . . . . . . . . . . . . . . . . . . . (0.10) (0.07) (0.21) (0.35)
Basic and diluted weighted average number ofshares outstanding . . . . . . . . . . . . . . . . . . . . . . . . 28,569,238 28,480,522 28,537,202 23,448,504
See accompanying notes
F-4

DRAGONWAVE INC.
CONSOLIDATED STATEMENTS OF CASH FLOWS
(Expressed in Cdn $000’s except share and per share amounts)
For the For thethree months ended year ended
May 31, May 31, February 28, February 29,Note 2009 2008 2009 2008
$ $ $ $(non-audited) (audited)
Cash and cash equivalents provided by (used in)
Operating ActivitiesNet loss . . . . . . . . . . . . . . . . . . . . . . . . . . . . . . . . . . (2,883) (1,941) (5,989) (8,252)Items not affecting cash
Depreciation . . . . . . . . . . . . . . . . . . . . . . . . . . . . 5 303 235 1,070 563Interest on debt component of preferred shares . . . 7 — — — 350Interest on debt component of convertible debt . . . 8 — — — 150Stock-based compensation . . . . . . . . . . . . . . . . . . . 9 242 145 624 327Warrant expense . . . . . . . . . . . . . . . . . . . . . . . . . . 9 — 11 2 64Unrealized foreign exchange (gain) loss . . . . . . . . . 1,032 60 (907) 479Accrued interest on fair value of short-term
investments . . . . . . . . . . . . . . . . . . . . . . . . . . . . 15 — 150 (159) (534)
(1,306) (1,340) (5,359) (6,853)
Changes in non-cash working capital items . . . . . . . . 11 1,451 (740) (4,997) (3,419)
145 (2,080) (10,356) (10,272)
Investing ActivitiesAcquisition of property and equipment . . . . . . . . . 5 (592) (323) (923) (2,808)Maturity (Investment) of short-term investments . . . 14,994 31,758 17,073 (31,374)
14,402 31,435 16,150 (34,182)
Financing ActivitiesChange in line of credit . . . . . . . . . . . . . . . . . . . . 6 (55) 4 91 (3,893)Exercise of warrants . . . . . . . . . . . . . . . . . . . . . . . 9 — 152 150 —Issuance of Common stock net of stock
issuance costs . . . . . . . . . . . . . . . . . . . . . . . . . . 9 11 — 11 49,043
(44) 156 252 45,150Effect of foreign exchange on cash and
cash equivalents . . . . . . . . . . . . . . . . . . . . . . . . . . (1,032) (60) 907 (479)Net increase in cash and cash equivalents . . . . . . . . . 13,471 29,451 6,953 217Cash and cash equivalents — beginning of period . . . . 8,504 1,551 1,551 1,334
Cash and cash equivalents — end of period . . . . . . . . 21,975 31,002 8,504 1,551
Cash paid during the year for:Interest . . . . . . . . . . . . . . . . . . . . . . . . . . . . . . . . 7 9 35 203
See accompanying notes
F-5

DRAGONWAVE INC.
NOTES TO CONSOLIDATED FINANCIAL STATEMENTS
(Expressed in Cdn $000’s except share and per share amounts)
1. NATURE OF BUSINESS AND BASIS OF PRESENTATION
DragonWave Inc. (the ‘‘Company’’), incorporated under the Canada Business Corporations Act in February 2000, is in the business ofdeveloping next-generation broadband wireless backhaul equipment.
All references to shares in these consolidated financial statements have been restated to reflect one-for-ten share consolidation whichwas approved on April 10, 2007.
2. SIGNIFICANT ACCOUNTING POLICIES
The consolidated financial statements have been prepared in accordance with Canadian Generally Accepted Accounting Principles(‘‘GAAP’’) and include the following significant accounting policies as well as a reconciliation of the significant differences withgenerally accepted accounting principles in the United States in note 20.
Use of accounting estimates
The preparation of the consolidated financial statements in conformity with Canadian GAAP requires the Company’s management tomake estimates that affect the reported amounts of assets and liabilities and disclosure of contingent amounts of assets and liabilities asat the date of the consolidated financial statements and the reported amounts of revenues and expenses during the reporting periodspresented. Actual results could differ from the estimates made by management.
The following accounts include estimates by management: allowance for doubtful accounts, other receivables, inventory provisions, andaccrued liabilities.
Cash and cash equivalents
The Company considers all highly liquid investments with an original maturity of three months or less to be cash equivalents.
Short-term investments
The Company has classified its short-term investments as held for trading and are carried at fair value with both realized and unrealizedgains and losses included in the net loss.
Comprehensive loss
Comprehensive loss is composed of the Company’s net loss and other comprehensive loss. The Company does not currently have anyother comprehensive loss.
Consolidation
These consolidated financial statements include the accounts of the Company and its wholly owned subsidiary, DragonWave Corp.,incorporated in the state of Delaware, and 4472314 Canada Inc., incorporated in Canada. All intercompany accounts and transactionshave been eliminated.
Property and equipment
Property and equipment are stated at cost. Amortization is calculated using the straight-line method over the anticipated useful lives ofthe assets as follows:
Research and development equipment . . . . . . . . . . . . . . . . . . . . . . . . . . . . . . . . . . . . . . . . . . . . . . . . . . . . . 5 yearsFurniture and fixtures . . . . . . . . . . . . . . . . . . . . . . . . . . . . . . . . . . . . . . . . . . . . . . . . . . . . . . . . . . . . . . . . 5 yearsAutomobiles . . . . . . . . . . . . . . . . . . . . . . . . . . . . . . . . . . . . . . . . . . . . . . . . . . . . . . . . . . . . . . . . . . . . . . 5 yearsLeasehold improvements . . . . . . . . . . . . . . . . . . . . . . . . . . . . . . . . . . . . . . . . . . . . . . . . . . . . . . . . . . . . . . 5 yearsTest equipment . . . . . . . . . . . . . . . . . . . . . . . . . . . . . . . . . . . . . . . . . . . . . . . . . . . . . . . . . . . . . . . . . . . . 4 yearsCommunication equipment . . . . . . . . . . . . . . . . . . . . . . . . . . . . . . . . . . . . . . . . . . . . . . . . . . . . . . . . . . . . 3 yearsWarehouse and production fixtures . . . . . . . . . . . . . . . . . . . . . . . . . . . . . . . . . . . . . . . . . . . . . . . . . . . . . . . 3 yearsComputer hardware . . . . . . . . . . . . . . . . . . . . . . . . . . . . . . . . . . . . . . . . . . . . . . . . . . . . . . . . . . . . . . . . . 2 yearsComputer software . . . . . . . . . . . . . . . . . . . . . . . . . . . . . . . . . . . . . . . . . . . . . . . . . . . . . . . . . . . . . . . . . 2 years
F-6
DRAGONWAVE INC.
NOTES TO CONSOLIDATED FINANCIAL STATEMENTS (Continued)
(Expressed in Cdn $000’s except share and per share amounts)
2. SIGNIFICANT ACCOUNTING POLICIES (Continued)
Impairment of long-lived assets
Management evaluates the carrying value of its long-lived assets whenever events or changes in circumstances indicate that the carryingvalue may not be recoverable. To the extent the estimated undiscounted future net cash inflows attributable to the asset are less than thecarrying amount, an impairment loss is recognized. The amount of impairment loss to be recorded is the difference between the asset’scarrying value and the net discounted estimated future cash flows.
As at May 31, 2009, there are no indicators of impairment of long-lived assets.
Inventory
Inventory is valued at the lower of cost and market. The cost of inventory is calculated on a standard cost basis, which approximatesaverage cost. Market is determined as net realizable value for finished goods, raw materials and work in progress. Indirectmanufacturing costs and direct labour expenses are allocated systematically to the total production inventory.
Revenue recognition
The Company derives revenue from the sale of broadband wireless backhaul equipment which includes embedded software and alicense to use said software and extended product warranties. Software is considered to be incidental to the product. Services rangefrom installation and training to basic consulting. Revenue is recognized when persuasive evidence of an arrangement exists, deliveryhas occurred and there are no significant remaining vendor obligations, collection of receivables is reasonably assured and the fee isfixed and determinable. Where final acceptance of the product is specified by the customer, revenue is deferred until acceptance criteriahave been met. Additionally, the Company’s business agreements may contain multiple elements. Accordingly, the Company is requiredto determine the appropriate accounting, including whether the deliverables specified in a multiple element arrangement should betreated as separate units of accounting for revenue recognition purposes, the fair value of these separate units of accounting and whento recognize revenue for each element. For arrangements involving multiple elements, the Company allocates revenue to eachcomponent of the arrangement using the residual value method, based on vendor-specific objective evidence of the fair value of theundelivered elements. These elements may include one or more of the following: advanced replacement, extended warranties, training,and installation. The Company allocates the arrangement fee, in a multiple-element transaction, to the undelivered elements based onthe total fair value of those undelivered elements, as indicated by vendor-specific objective evidence. This portion of the arrangementfee is deferred. The difference between the total arrangement fee and the amount deferred for the undelivered elements is recognizedas revenue related to the delivered elements. In some instances, a group of contracts or agreements with the same customer may be soclosely related that they are, in effect, part of a single multiple-element arrangement, and therefore, the Company would allocate thecorresponding revenue among the various components, as described above.
The Company generates revenue through direct sales and sales to distributors. Revenue on stocking orders sold to distributors is notrecognized until the product is sold to an end user.
Arrangements that include services such as training and installation are evaluated to determine whether those services are essential tothe functionality of other elements of the arrangement. When services are considered essential, revenue allocable to the other elementsis deferred until the services have been performed. When services are not considered essential, the revenue allocable to the services isrecognized as the services are performed.
Revenue associated with extended warranty and advanced replacement is recognized rateably over the life of the contracted service.
Revenue from engineering services or development agreements is recognized according to the specific terms and acceptance criteria asservices are rendered.
The Company accrues estimated potential product liability as warranty costs when revenue on the sale of equipment is recognized.Warranty costs are calculated on a percentage of revenue per month based on current actual warranty costs and return experience.
Shipping and handling costs borne by the Company are recorded in cost of sales. Shipping and handling costs charged to customers arerecorded as revenue, if billed at the time of shipment. Costs charged to customers after delivery are recorded in cost of sales.
Research and development
Research costs are expensed as incurred. Development costs other than property and equipment are expensed as incurred unless theymeet generally accepted accounting criteria for deferral and amortization. Development costs incurred prior to establishment oftechnological feasibility do not meet these criteria, and are expensed as incurred. Government assistance and investment tax credits
F-7

DRAGONWAVE INC.
NOTES TO CONSOLIDATED FINANCIAL STATEMENTS (Continued)
(Expressed in Cdn $000’s except share and per share amounts)
2. SIGNIFICANT ACCOUNTING POLICIES (Continued)
relating to ongoing research and development costs are recorded as a recovery of the related research and development expenses, andwhere such assistance is reasonably assured.
Foreign currency translation
The Company’s foreign subsidiary is considered financially and operationally integrated and is translated into Canadian dollars usingthe temporal method of translation: monetary assets and liabilities are translated at the period end exchange rate, non-monetary assetsare translated at the historical exchange rate, and revenue and expense items are translated at the average exchange rate. Gains orlosses resulting from the translation adjustments are included in income.
Income taxes
The Company follows the liability method in accounting for income taxes. Under this method, current income taxes are recognizedbased on an estimate of the current year. Future tax assets and liabilities are recorded for the effects of temporary differences betweenthe tax basis of an asset or liability and its reported amount in the consolidated financial statements. The future benefit of lossesavailable to be carried forward, and likely to be realized are measured using the substantively enacted tax rate in effect at the time inwhich the losses will be utilized. A valuation allowance is recorded when it is more likely than not that the benefit of the future incometax asset will not be realized.
Loss per share
Basic loss per share is calculated by dividing net loss available to Common shareholders by the weighted average number of Commonshares outstanding during the period. For all periods presented, the net loss available to Common shareholders equates to the net loss.
Diluted net loss per share is equal to the basic net loss per share since the effect of exercising 2,070,255 stock options outstanding atMay 31, 2009 (February 28, 2009 — 2,075,918; February 29, 2008 — 1,604,350) would be anti-dilutive for all periods.
Stock option plan
The Company has a stock option plan which is described in note 9. The Company accounts for stock options granted to employees usingthe fair value method, in accordance with the recommendations in the Canadian Institute of Chartered Accountants (‘‘CICA’’)Handbook section 3870, Stock-based Compensation and Other Stock-based Payments. In accordance with the fair value method, theCompany recognizes estimated compensation expense related to stock options over the vesting period of the options granted, with therelated credit being charged to contributed surplus.
The Company launched an employee share purchase plan on October 20, 2008. The plan includes provisions to allow employees topurchase Common shares. The Company will match the employees’ contribution at a rate of 25%. Proceeds from employees and cost ofmatching shares are recorded in share capital and contributed surplus at the time the shares are issued. The shares contributed by theCompany will vest 12 months after issuance with a corresponding compensation expense recognized in income.
CHANGES IN ACCOUNTING POLICIES
The CICA has issued the following new Handbook Sections which affect the year ended February 29, 2008:
a) Handbook Section 3862, ‘‘Financial Instruments — Disclosures,’’ applies to fiscal years beginning on or after October 1, 2007. Thissection modifies the disclosure standards for financial instruments that were included in Section 3861, ‘‘Financial Instruments —Disclosure and Presentation’’. The new standard requires entities to provide disclosure on a) the significance of financialinstruments for the entity’s financial position and performance and b) the nature and extent of risks arising from financialinstruments to which the entity is exposed during the period and at the balance sheet date, and how the entity manages those risks.The Company has provided the required disclosure in note 15.
b) Handbook Section 3863, ‘‘Financial Instruments — Presentation,’’ applies to fiscal years beginning on or after October 1, 2007.This Section carries forward the same presentation standards for financial instruments that were included in Section 3861,‘‘Financial Instruments — Disclosure and Presentation’’. The Company has provided the required disclosure in note 15.
c) Handbook Section 3031, ‘‘Inventories’’, was issued in March 2007 and replaces Section 3030, ‘‘Inventories’’ effective for fiscal yearsbeginning on or after January 1, 2008. The new section prescribes measurement of inventories at the lower of cost and netrealizable value. It provides guidance on the determination of cost, prohibiting the use of the last-in, first-out method (LIFO), and
F-8

DRAGONWAVE INC.
NOTES TO CONSOLIDATED FINANCIAL STATEMENTS (Continued)
(Expressed in Cdn $000’s except share and per share amounts)
2. SIGNIFICANT ACCOUNTING POLICIES (Continued)
requires the reversal of previous write-downs when there is a subsequent increase in the value of inventories. The changes notedabove have been incorporated in the periods presented.
d) Section 1535, ‘‘Capital Disclosures’’, establishes standards for disclosing information about an entity’s capital and how it ismanaged. It describes the disclosure of the entity’s objectives, policies and processes for managing capital, the qualitative dataabout what the entity regards as capital, whether the entity has complied with any capital disclosure requirements, and, if it has notcomplied, the consequences of such non-compliance. The Company has provided this disclosure in note 16.
The Company is in compliance with the new Handbook Sections mentioned above as of February 28, 2009. There was no transitionaladjustment required for the year ended February 29, 2008.
Future Accounting Changes
In 2006, Canada’s Accounting Standards Board ratified a strategic plan that will result in Canadian GAAP, as used by public companies,being evolved and converged with International Financial Reporting Standards (‘‘IFRS’’) over a transitional period to be complete by2011. The Company will be required to report using the converged standards effective for interim and annual financial statementsrelating to fiscal years beginning on or after January 1, 2011. Canadian GAAP will be converged with IFRS through a combination oftwo methods: as current joint-convergence projects of the United States’ Financial Accounting Standards Board and the InternationalAccounting Standards Board are agreed upon, they will be adopted by Canada’s Accounting Standards Board and may be introduced inCanada before the complete changeover to IFRS; and standards not subject to a joint-convergence project will be exposed in anomnibus manner for introduction at the time of the complete changeover to IFRS. The International Accounting Standards Boardcurrently has projects underway that should result in new pronouncements that continue to evolve IFRS.
Discussion of the Company’s progress with respect to the established conversion plan is addressed in the Management’s Discussion andAnalysis of the financial results for the three months ended May 31, 2009.
3. OTHER RECEIVABLES
Other receivables are comprised of the following:
May 31, February 28, February 29,2009 2009 2008
Investment tax credits recoverable . . . . . . . . . . . . . . . . . . . . . . . . . . . . . . . . . . . 247 187 329Goods and Services Tax receivable . . . . . . . . . . . . . . . . . . . . . . . . . . . . . . . . . . . 234 229 628Provincial sales tax receivable . . . . . . . . . . . . . . . . . . . . . . . . . . . . . . . . . . . . . . 1 — 28UK Value Added Tax receivable . . . . . . . . . . . . . . . . . . . . . . . . . . . . . . . . . . . . 18 203 —Miscellaneous receivables . . . . . . . . . . . . . . . . . . . . . . . . . . . . . . . . . . . . . . . . 140 101 107
Total Other Receivables . . . . . . . . . . . . . . . . . . . . . . . . . . . . . . . . . . . . . . . . . 640 720 1,092
4. INVENTORY
Inventory is comprised of the following:
May 31, February 28, February 29,2009 2009 2008
Raw materials . . . . . . . . . . . . . . . . . . . . . . . . . . . . . . . . . . . . . . . . . . . . . . . 5,199 6,368 3,887Work in progress . . . . . . . . . . . . . . . . . . . . . . . . . . . . . . . . . . . . . . . . . . . . . . 878 455 1,343Finished goods . . . . . . . . . . . . . . . . . . . . . . . . . . . . . . . . . . . . . . . . . . . . . . . 3,634 4,822 4,144
Total production inventory . . . . . . . . . . . . . . . . . . . . . . . . . . . . . . . . . . . . . . . 9,711 11,645 9,374Inventory held for customer service/warranty . . . . . . . . . . . . . . . . . . . . . . . . . . . . 2,822 2,593 1,210
Total Inventory . . . . . . . . . . . . . . . . . . . . . . . . . . . . . . . . . . . . . . . . . . . . . . . 12,533 14,238 10,584
Cost of sales for the three and twelve months ended May 31, 2009 and February 28, 2009 was $10,440 and $28,683 respectively (May 31,2008 — $6,344; February 29, 2008 — $24,980), which included $9,929 and $25,689 respectively (three months ended May 31, 2008 —
F-9
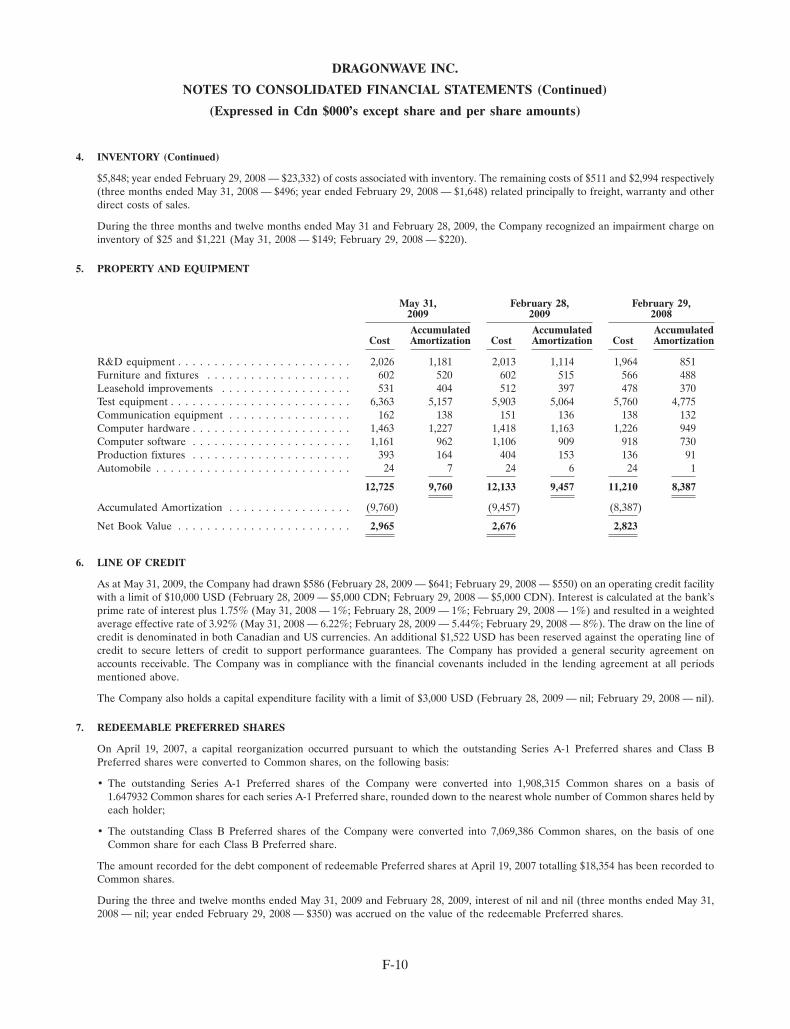
DRAGONWAVE INC.
NOTES TO CONSOLIDATED FINANCIAL STATEMENTS (Continued)
(Expressed in Cdn $000’s except share and per share amounts)
4. INVENTORY (Continued)
$5,848; year ended February 29, 2008 — $23,332) of costs associated with inventory. The remaining costs of $511 and $2,994 respectively(three months ended May 31, 2008 — $496; year ended February 29, 2008 — $1,648) related principally to freight, warranty and otherdirect costs of sales.
During the three months and twelve months ended May 31 and February 28, 2009, the Company recognized an impairment charge oninventory of $25 and $1,221 (May 31, 2008 — $149; February 29, 2008 — $220).
5. PROPERTY AND EQUIPMENT
May 31, February 28, February 29,2009 2009 2008
Accumulated Accumulated AccumulatedCost Amortization Cost Amortization Cost Amortization
R&D equipment . . . . . . . . . . . . . . . . . . . . . . . . 2,026 1,181 2,013 1,114 1,964 851Furniture and fixtures . . . . . . . . . . . . . . . . . . . . 602 520 602 515 566 488Leasehold improvements . . . . . . . . . . . . . . . . . . 531 404 512 397 478 370Test equipment . . . . . . . . . . . . . . . . . . . . . . . . . 6,363 5,157 5,903 5,064 5,760 4,775Communication equipment . . . . . . . . . . . . . . . . . 162 138 151 136 138 132Computer hardware . . . . . . . . . . . . . . . . . . . . . . 1,463 1,227 1,418 1,163 1,226 949Computer software . . . . . . . . . . . . . . . . . . . . . . 1,161 962 1,106 909 918 730Production fixtures . . . . . . . . . . . . . . . . . . . . . . 393 164 404 153 136 91Automobile . . . . . . . . . . . . . . . . . . . . . . . . . . . 24 7 24 6 24 1
12,725 9,760 12,133 9,457 11,210 8,387
Accumulated Amortization . . . . . . . . . . . . . . . . . (9,760) (9,457) (8,387)
Net Book Value . . . . . . . . . . . . . . . . . . . . . . . . 2,965 2,676 2,823
6. LINE OF CREDIT
As at May 31, 2009, the Company had drawn $586 (February 28, 2009 — $641; February 29, 2008 — $550) on an operating credit facilitywith a limit of $10,000 USD (February 28, 2009 — $5,000 CDN; February 29, 2008 — $5,000 CDN). Interest is calculated at the bank’sprime rate of interest plus 1.75% (May 31, 2008 — 1%; February 28, 2009 — 1%; February 29, 2008 — 1%) and resulted in a weightedaverage effective rate of 3.92% (May 31, 2008 — 6.22%; February 28, 2009 — 5.44%; February 29, 2008 — 8%). The draw on the line ofcredit is denominated in both Canadian and US currencies. An additional $1,522 USD has been reserved against the operating line ofcredit to secure letters of credit to support performance guarantees. The Company has provided a general security agreement onaccounts receivable. The Company was in compliance with the financial covenants included in the lending agreement at all periodsmentioned above.
The Company also holds a capital expenditure facility with a limit of $3,000 USD (February 28, 2009 — nil; February 29, 2008 — nil).
7. REDEEMABLE PREFERRED SHARES
On April 19, 2007, a capital reorganization occurred pursuant to which the outstanding Series A-1 Preferred shares and Class BPreferred shares were converted to Common shares, on the following basis:
• The outstanding Series A-1 Preferred shares of the Company were converted into 1,908,315 Common shares on a basis of1.647932 Common shares for each series A-1 Preferred share, rounded down to the nearest whole number of Common shares held byeach holder;
• The outstanding Class B Preferred shares of the Company were converted into 7,069,386 Common shares, on the basis of oneCommon share for each Class B Preferred share.
The amount recorded for the debt component of redeemable Preferred shares at April 19, 2007 totalling $18,354 has been recorded toCommon shares.
During the three and twelve months ended May 31, 2009 and February 28, 2009, interest of nil and nil (three months ended May 31,2008 — nil; year ended February 29, 2008 — $350) was accrued on the value of the redeemable Preferred shares.
F-10

DRAGONWAVE INC.
NOTES TO CONSOLIDATED FINANCIAL STATEMENTS (Continued)
(Expressed in Cdn $000’s except share and per share amounts)
8. CONVERTIBLE DEBT
On April 19, 2007, a capital reorganization occurred pursuant to which the Convertible Debt was converted into 3,763,283 Commonshares at a 10% discount to the price of the Common shares. The amount recorded as Convertible Debt on April 19, 2007 totalled$13,171 and on conversion has been recorded to Common shares.
During the three and twelve months ended May 31, 2009 and February 28, 2009, interest of nil and nil (three months ended May 31,2008 — nil; year ended February 29, 2008 — $150) was accrued on the debt component of the Convertible Debt. Certain lenders arerelated party shareholders, which is further discussed in note 13.
9. CAPITAL STOCK
Share capital consists of the following:
The Company is authorized to issue an unlimited number of voting Common shares. After all preferential dividends are declared;common shareholders are entitled to dividends, if and when declared by the Board of Directors, provided that an equivalent dividendon the outstanding Class A-1 Preferred shares, Class B Preferred shares, and Class B-1 Preferred shares are declared.
On April 19, 2007, the Company completed an initial public offering (‘‘IPO’’). Pursuant to the offering, the Company issued7,595,000 Common shares for gross proceeds of $30,000. On May 23, 2007, the Company closed an over-allotment option of700,000 shares resulting in additional gross proceeds to the Company of $2,765. The net proceeds from both the IPO and theover-allotment, after deducting share issue costs of $5,832, which have been netted against the value of the Common shares, was$26,935. In addition, the Company has converted its Series A-1 Preferred shares (note 7), Class B Preferred shares (note 7), and theConvertible Debt (see note 8) into 1,908,315, 7,069,386, and 3,763,283 Common shares respectively. Upon conversion of the Preferredshares and the Convertible Debt; the amounts previously recorded in contributed surplus of $16,011 and $1,109, respectively, have beenallocated from contributed surplus to the value recorded for Common shares. Additionally, the debt component of the Preferred sharesand the Convertible Debt outstanding at the date of the capital reorganization amounting to $18,354 and $13,171, respectively, havealso been adjusted to the value recorded for the Common shares.
On March 11 and May 22, 2008, the Company issued 36,446 and 78,534 Common shares respectively. These shares were issued as aresult of the Company’s bank exercising three separate warrants for cash consideration of $150.
May 31, February 28, February 29,2009 2009 2008
in shares
Issued and outstanding . . . . . . . . . . . . . . . . . . . . . . . . . . . . . . . . . . . . . . . . 28,614,780 28,559,297 28,440,355
in dollars
Value of Capital StockCommon shares . . . . . . . . . . . . . . . . . . . . . . . . . . . . . . . . . . . . . . . . . . . 119,936 119,925 119,435Contributed surplus . . . . . . . . . . . . . . . . . . . . . . . . . . . . . . . . . . . . . . . . . 1,472 1,230 933
Total Capital Stock . . . . . . . . . . . . . . . . . . . . . . . . . . . . . . . . . . . . . . . . . . . 121,408 121,155 120,368
During the three months ended May 31, 2009 and the year ended February 28, 2009, the Company repurchased nil and 3,221 restrictedCommon shares from departing employees respectively (year ended February 29, 2008 — 5,209 shares).
On January 29, 2009 the Board of Directors of the Company approved the adoption of a shareholder rights plan (the ‘‘Rights Plan’’).The Rights Plan is intended to provide the Company’s Board of Directors with adequate time to assess a take-over bid, to consideralternatives to a take-over bid as a means of maximizing shareholder value, to allow competing bids to emerge, and to provide theCompany’s shareholders with adequate time to properly assess a take-over bid without undue pressure. The Rights Plan is not intendedto prevent take-over bids that treat shareholders fairly and offer fair value, and permits bids that meet certain requirements intended toprotect the interests of all shareholders.
The Rights Plan was approved by the Toronto Stock Exchange and was ratified by the Company’s shareholders on June 9, 2009 at theCompany’s Annual and Special Meeting of the shareholders. The complete Rights Plan is published separately and availableat www.sedar.com.
F-11
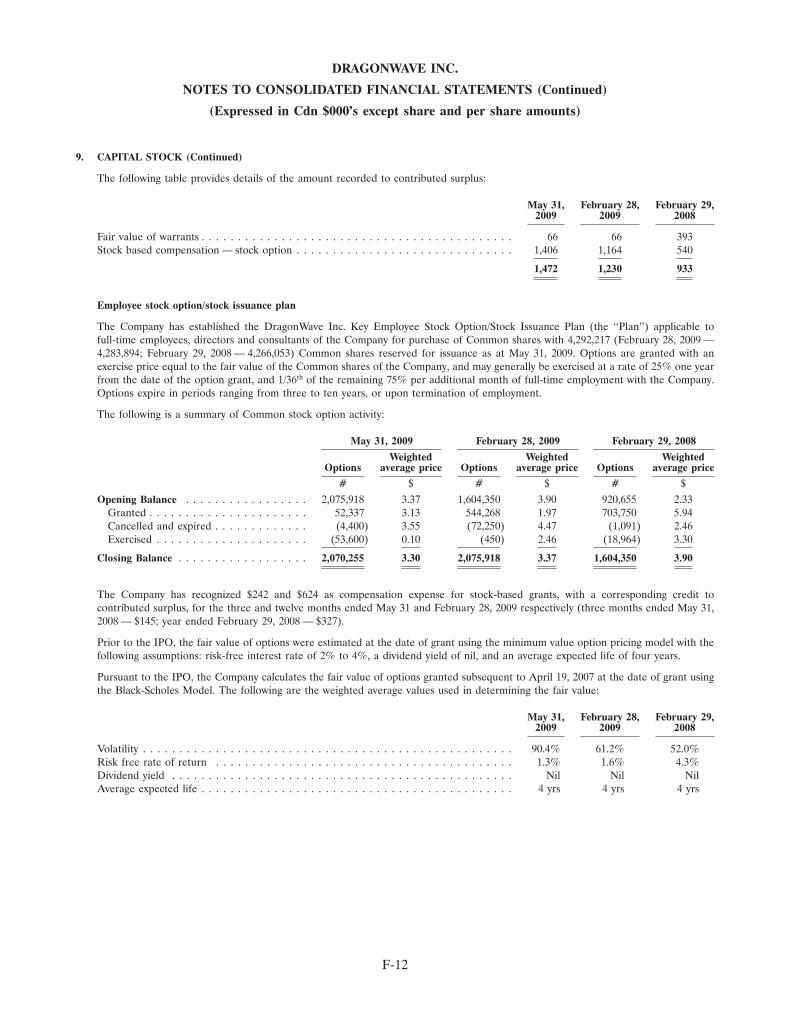
DRAGONWAVE INC.
NOTES TO CONSOLIDATED FINANCIAL STATEMENTS (Continued)
(Expressed in Cdn $000’s except share and per share amounts)
9. CAPITAL STOCK (Continued)
The following table provides details of the amount recorded to contributed surplus:
May 31, February 28, February 29,2009 2009 2008
Fair value of warrants . . . . . . . . . . . . . . . . . . . . . . . . . . . . . . . . . . . . . . . . . . . 66 66 393Stock based compensation — stock option . . . . . . . . . . . . . . . . . . . . . . . . . . . . . . 1,406 1,164 540
1,472 1,230 933
Employee stock option/stock issuance plan
The Company has established the DragonWave Inc. Key Employee Stock Option/Stock Issuance Plan (the ‘‘Plan’’) applicable tofull-time employees, directors and consultants of the Company for purchase of Common shares with 4,292,217 (February 28, 2009 —4,283,894; February 29, 2008 — 4,266,053) Common shares reserved for issuance as at May 31, 2009. Options are granted with anexercise price equal to the fair value of the Common shares of the Company, and may generally be exercised at a rate of 25% one yearfrom the date of the option grant, and 1/36th of the remaining 75% per additional month of full-time employment with the Company.Options expire in periods ranging from three to ten years, or upon termination of employment.
The following is a summary of Common stock option activity:
May 31, 2009 February 28, 2009 February 29, 2008
Weighted Weighted WeightedOptions average price Options average price Options average price
# $ # $ # $Opening Balance . . . . . . . . . . . . . . . . . 2,075,918 3.37 1,604,350 3.90 920,655 2.33
Granted . . . . . . . . . . . . . . . . . . . . . . 52,337 3.13 544,268 1.97 703,750 5.94Cancelled and expired . . . . . . . . . . . . . (4,400) 3.55 (72,250) 4.47 (1,091) 2.46Exercised . . . . . . . . . . . . . . . . . . . . . (53,600) 0.10 (450) 2.46 (18,964) 3.30
Closing Balance . . . . . . . . . . . . . . . . . . 2,070,255 3.30 2,075,918 3.37 1,604,350 3.90
The Company has recognized $242 and $624 as compensation expense for stock-based grants, with a corresponding credit tocontributed surplus, for the three and twelve months ended May 31 and February 28, 2009 respectively (three months ended May 31,2008 — $145; year ended February 29, 2008 — $327).
Prior to the IPO, the fair value of options were estimated at the date of grant using the minimum value option pricing model with thefollowing assumptions: risk-free interest rate of 2% to 4%, a dividend yield of nil, and an average expected life of four years.
Pursuant to the IPO, the Company calculates the fair value of options granted subsequent to April 19, 2007 at the date of grant usingthe Black-Scholes Model. The following are the weighted average values used in determining the fair value:
May 31, February 28, February 29,2009 2009 2008
Volatility . . . . . . . . . . . . . . . . . . . . . . . . . . . . . . . . . . . . . . . . . . . . . . . . . . . 90.4% 61.2% 52.0%Risk free rate of return . . . . . . . . . . . . . . . . . . . . . . . . . . . . . . . . . . . . . . . . . 1.3% 1.6% 4.3%Dividend yield . . . . . . . . . . . . . . . . . . . . . . . . . . . . . . . . . . . . . . . . . . . . . . . Nil Nil NilAverage expected life . . . . . . . . . . . . . . . . . . . . . . . . . . . . . . . . . . . . . . . . . . . 4 yrs 4 yrs 4 yrs
F-12
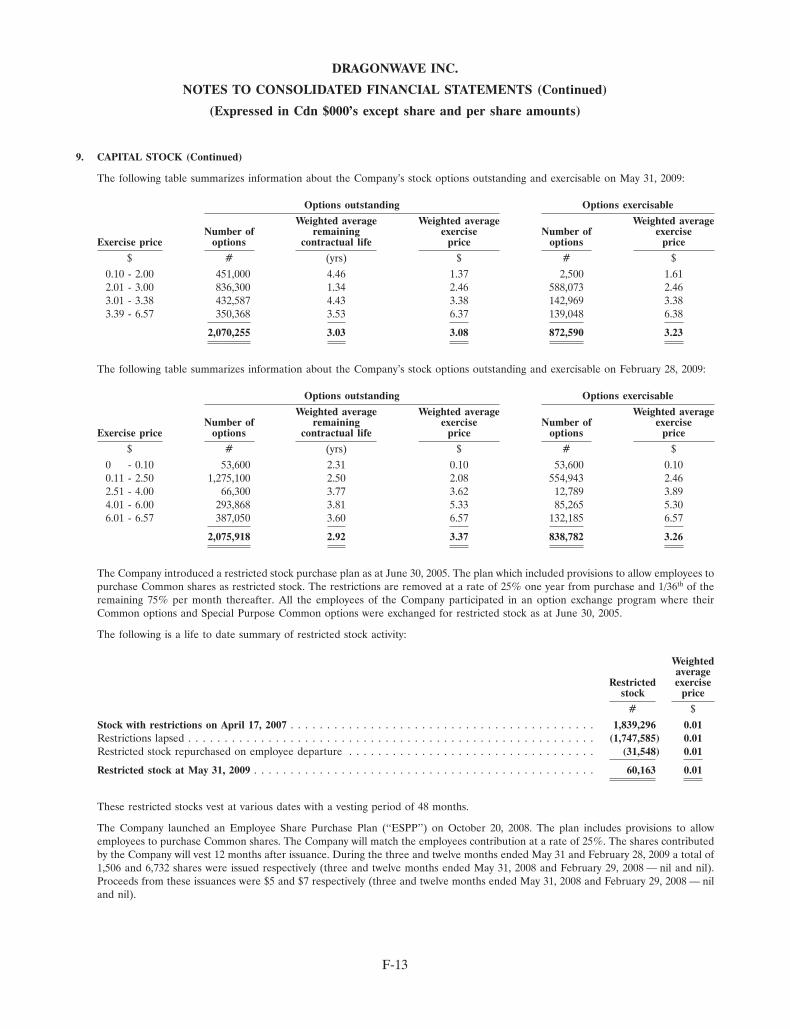
DRAGONWAVE INC.
NOTES TO CONSOLIDATED FINANCIAL STATEMENTS (Continued)
(Expressed in Cdn $000’s except share and per share amounts)
9. CAPITAL STOCK (Continued)
The following table summarizes information about the Company’s stock options outstanding and exercisable on May 31, 2009:
Options outstanding Options exercisable
Weighted average Weighted average Weighted averageNumber of remaining exercise Number of exercise
Exercise price options contractual life price options price
$ # (yrs) $ # $0.10 - 2.00 451,000 4.46 1.37 2,500 1.612.01 - 3.00 836,300 1.34 2.46 588,073 2.463.01 - 3.38 432,587 4.43 3.38 142,969 3.383.39 - 6.57 350,368 3.53 6.37 139,048 6.38
2,070,255 3.03 3.08 872,590 3.23
The following table summarizes information about the Company’s stock options outstanding and exercisable on February 28, 2009:
Options outstanding Options exercisable
Weighted average Weighted average Weighted averageNumber of remaining exercise Number of exercise
Exercise price options contractual life price options price
$ # (yrs) $ # $0 - 0.10 53,600 2.31 0.10 53,600 0.100.11 - 2.50 1,275,100 2.50 2.08 554,943 2.462.51 - 4.00 66,300 3.77 3.62 12,789 3.894.01 - 6.00 293,868 3.81 5.33 85,265 5.306.01 - 6.57 387,050 3.60 6.57 132,185 6.57
2,075,918 2.92 3.37 838,782 3.26
The Company introduced a restricted stock purchase plan as at June 30, 2005. The plan which included provisions to allow employees topurchase Common shares as restricted stock. The restrictions are removed at a rate of 25% one year from purchase and 1/36th of theremaining 75% per month thereafter. All the employees of the Company participated in an option exchange program where theirCommon options and Special Purpose Common options were exchanged for restricted stock as at June 30, 2005.
The following is a life to date summary of restricted stock activity:
Weightedaverage
Restricted exercisestock price
# $Stock with restrictions on April 17, 2007 . . . . . . . . . . . . . . . . . . . . . . . . . . . . . . . . . . . . . . . . . . 1,839,296 0.01Restrictions lapsed . . . . . . . . . . . . . . . . . . . . . . . . . . . . . . . . . . . . . . . . . . . . . . . . . . . . . . . . (1,747,585) 0.01Restricted stock repurchased on employee departure . . . . . . . . . . . . . . . . . . . . . . . . . . . . . . . . . . (31,548) 0.01
Restricted stock at May 31, 2009 . . . . . . . . . . . . . . . . . . . . . . . . . . . . . . . . . . . . . . . . . . . . . . . 60,163 0.01
These restricted stocks vest at various dates with a vesting period of 48 months.
The Company launched an Employee Share Purchase Plan (‘‘ESPP’’) on October 20, 2008. The plan includes provisions to allowemployees to purchase Common shares. The Company will match the employees contribution at a rate of 25%. The shares contributedby the Company will vest 12 months after issuance. During the three and twelve months ended May 31 and February 28, 2009 a total of1,506 and 6,732 shares were issued respectively (three and twelve months ended May 31, 2008 and February 29, 2008 — nil and nil).Proceeds from these issuances were $5 and $7 respectively (three and twelve months ended May 31, 2008 and February 29, 2008 — niland nil).
F-13
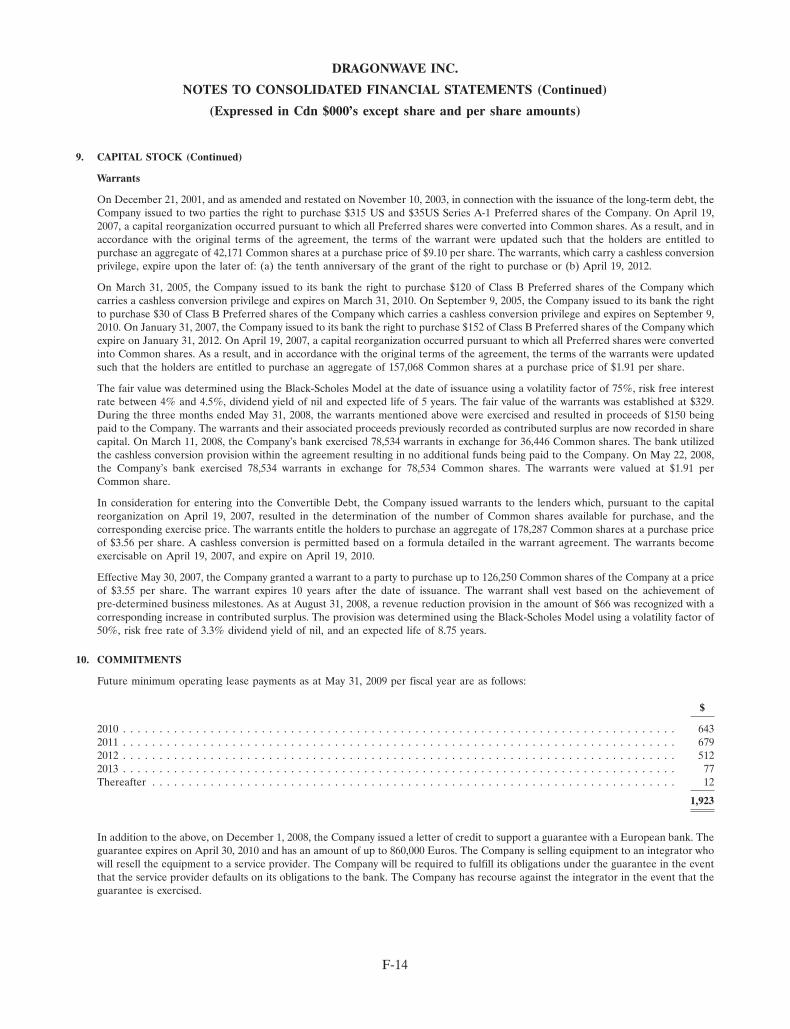
DRAGONWAVE INC.
NOTES TO CONSOLIDATED FINANCIAL STATEMENTS (Continued)
(Expressed in Cdn $000’s except share and per share amounts)
9. CAPITAL STOCK (Continued)
Warrants
On December 21, 2001, and as amended and restated on November 10, 2003, in connection with the issuance of the long-term debt, theCompany issued to two parties the right to purchase $315 US and $35US Series A-1 Preferred shares of the Company. On April 19,2007, a capital reorganization occurred pursuant to which all Preferred shares were converted into Common shares. As a result, and inaccordance with the original terms of the agreement, the terms of the warrant were updated such that the holders are entitled topurchase an aggregate of 42,171 Common shares at a purchase price of $9.10 per share. The warrants, which carry a cashless conversionprivilege, expire upon the later of: (a) the tenth anniversary of the grant of the right to purchase or (b) April 19, 2012.
On March 31, 2005, the Company issued to its bank the right to purchase $120 of Class B Preferred shares of the Company whichcarries a cashless conversion privilege and expires on March 31, 2010. On September 9, 2005, the Company issued to its bank the rightto purchase $30 of Class B Preferred shares of the Company which carries a cashless conversion privilege and expires on September 9,2010. On January 31, 2007, the Company issued to its bank the right to purchase $152 of Class B Preferred shares of the Company whichexpire on January 31, 2012. On April 19, 2007, a capital reorganization occurred pursuant to which all Preferred shares were convertedinto Common shares. As a result, and in accordance with the original terms of the agreement, the terms of the warrants were updatedsuch that the holders are entitled to purchase an aggregate of 157,068 Common shares at a purchase price of $1.91 per share.
The fair value was determined using the Black-Scholes Model at the date of issuance using a volatility factor of 75%, risk free interestrate between 4% and 4.5%, dividend yield of nil and expected life of 5 years. The fair value of the warrants was established at $329.During the three months ended May 31, 2008, the warrants mentioned above were exercised and resulted in proceeds of $150 beingpaid to the Company. The warrants and their associated proceeds previously recorded as contributed surplus are now recorded in sharecapital. On March 11, 2008, the Company’s bank exercised 78,534 warrants in exchange for 36,446 Common shares. The bank utilizedthe cashless conversion provision within the agreement resulting in no additional funds being paid to the Company. On May 22, 2008,the Company’s bank exercised 78,534 warrants in exchange for 78,534 Common shares. The warrants were valued at $1.91 perCommon share.
In consideration for entering into the Convertible Debt, the Company issued warrants to the lenders which, pursuant to the capitalreorganization on April 19, 2007, resulted in the determination of the number of Common shares available for purchase, and thecorresponding exercise price. The warrants entitle the holders to purchase an aggregate of 178,287 Common shares at a purchase priceof $3.56 per share. A cashless conversion is permitted based on a formula detailed in the warrant agreement. The warrants becomeexercisable on April 19, 2007, and expire on April 19, 2010.
Effective May 30, 2007, the Company granted a warrant to a party to purchase up to 126,250 Common shares of the Company at a priceof $3.55 per share. The warrant expires 10 years after the date of issuance. The warrant shall vest based on the achievement ofpre-determined business milestones. As at August 31, 2008, a revenue reduction provision in the amount of $66 was recognized with acorresponding increase in contributed surplus. The provision was determined using the Black-Scholes Model using a volatility factor of50%, risk free rate of 3.3% dividend yield of nil, and an expected life of 8.75 years.
10. COMMITMENTS
Future minimum operating lease payments as at May 31, 2009 per fiscal year are as follows:
$
2010 . . . . . . . . . . . . . . . . . . . . . . . . . . . . . . . . . . . . . . . . . . . . . . . . . . . . . . . . . . . . . . . . . . . . . . . . . . . . 6432011 . . . . . . . . . . . . . . . . . . . . . . . . . . . . . . . . . . . . . . . . . . . . . . . . . . . . . . . . . . . . . . . . . . . . . . . . . . . . 6792012 . . . . . . . . . . . . . . . . . . . . . . . . . . . . . . . . . . . . . . . . . . . . . . . . . . . . . . . . . . . . . . . . . . . . . . . . . . . . 5122013 . . . . . . . . . . . . . . . . . . . . . . . . . . . . . . . . . . . . . . . . . . . . . . . . . . . . . . . . . . . . . . . . . . . . . . . . . . . . 77Thereafter . . . . . . . . . . . . . . . . . . . . . . . . . . . . . . . . . . . . . . . . . . . . . . . . . . . . . . . . . . . . . . . . . . . . . . . . 12
1,923
In addition to the above, on December 1, 2008, the Company issued a letter of credit to support a guarantee with a European bank. Theguarantee expires on April 30, 2010 and has an amount of up to 860,000 Euros. The Company is selling equipment to an integrator whowill resell the equipment to a service provider. The Company will be required to fulfill its obligations under the guarantee in the eventthat the service provider defaults on its obligations to the bank. The Company has recourse against the integrator in the event that theguarantee is exercised.
F-14

DRAGONWAVE INC.
NOTES TO CONSOLIDATED FINANCIAL STATEMENTS (Continued)
(Expressed in Cdn $000’s except share and per share amounts)
11. SUPPLEMENTAL CASH FLOW INFORMATION
May 31, May 31, February 28, February 29,2009 2008 2009 2008
Changes in non-cash working capital balances:Accounts receivable . . . . . . . . . . . . . . . . . . . . . . . . . . . . . . . . . . . (735) 3,891 910 (3,756)Other receivables . . . . . . . . . . . . . . . . . . . . . . . . . . . . . . . . . . . . . 80 323 372 (106)Inventory . . . . . . . . . . . . . . . . . . . . . . . . . . . . . . . . . . . . . . . . . . 1,705 (1,763) (3,654) (3,686)Prepaid expenses . . . . . . . . . . . . . . . . . . . . . . . . . . . . . . . . . . . . . (274) 7 251 (92)Accounts payable and accrued liabilities . . . . . . . . . . . . . . . . . . . . . . 1,004 (2,862) (3,378) 3,137Deferred revenue . . . . . . . . . . . . . . . . . . . . . . . . . . . . . . . . . . . . . (329) (336) 502 1,084
Changes in non-cash working capital balances . . . . . . . . . . . . . . . . . . . . 1,451 (740) (4,997) (3,419)
12. INCOME TAXES
The reported income tax provision differs from the amount computed by applying the Canadian statutory rate to the net loss, for thefollowing reasons:
Year Ended Year EndedFebruary 28, February 29,
2009 2008
$ $Loss before income taxes . . . . . . . . . . . . . . . . . . . . . . . . . . . . . . . . . . . . . . . . . . . . . . . . (5,952) (8,252)Statutory income tax rate . . . . . . . . . . . . . . . . . . . . . . . . . . . . . . . . . . . . . . . . . . . . . . . . 33.42% 35.68%
Expected income tax recovery . . . . . . . . . . . . . . . . . . . . . . . . . . . . . . . . . . . . . . . . . . . . . (1,989) (2,944)Tax effect of expenses only deductible for tax purposes . . . . . . . . . . . . . . . . . . . . . . . . . . . . . (490) —Tax effect of realizing benefit of prior years’ loss carryforwards . . . . . . . . . . . . . . . . . . . . . . . . (275) (69)Tax effect of losses not recognized . . . . . . . . . . . . . . . . . . . . . . . . . . . . . . . . . . . . . . . . . . — 813Foreign tax rate differences . . . . . . . . . . . . . . . . . . . . . . . . . . . . . . . . . . . . . . . . . . . . . . 5 14Foreign branch taxes . . . . . . . . . . . . . . . . . . . . . . . . . . . . . . . . . . . . . . . . . . . . . . . . . . . 37 —Tax effect of expenses not deductible for tax purposes . . . . . . . . . . . . . . . . . . . . . . . . . . . . . 364 (41)Tax effect of temporary differences not recognized . . . . . . . . . . . . . . . . . . . . . . . . . . . . . . . . 2,385 2,227
Income tax expense . . . . . . . . . . . . . . . . . . . . . . . . . . . . . . . . . . . . . . . . . . . . . . . . . . . 37 —
The Company’s future tax assets and liabilities include the following significant components:
February 28, February 29,2009 2008
$ $Scientific Research and Experimental Development expenditures . . . . . . . . . . . . . . . . . . . . . . . 10,120 9,068Income tax loss carryforwards . . . . . . . . . . . . . . . . . . . . . . . . . . . . . . . . . . . . . . . . . . . . . 5,416 10,086Book and tax differences on assets . . . . . . . . . . . . . . . . . . . . . . . . . . . . . . . . . . . . . . . . . . 4,259 718Ontario Harmonization tax credit . . . . . . . . . . . . . . . . . . . . . . . . . . . . . . . . . . . . . . . . . . 1,857 1,019
Total future tax assets . . . . . . . . . . . . . . . . . . . . . . . . . . . . . . . . . . . . . . . . . . . . . . . . . 21,652 20,891
Valuation allowance . . . . . . . . . . . . . . . . . . . . . . . . . . . . . . . . . . . . . . . . . . . . . . . . . . . (21,652) (20,891)
Net future tax assets . . . . . . . . . . . . . . . . . . . . . . . . . . . . . . . . . . . . . . . . . . . . . . . . . . — —
F-15
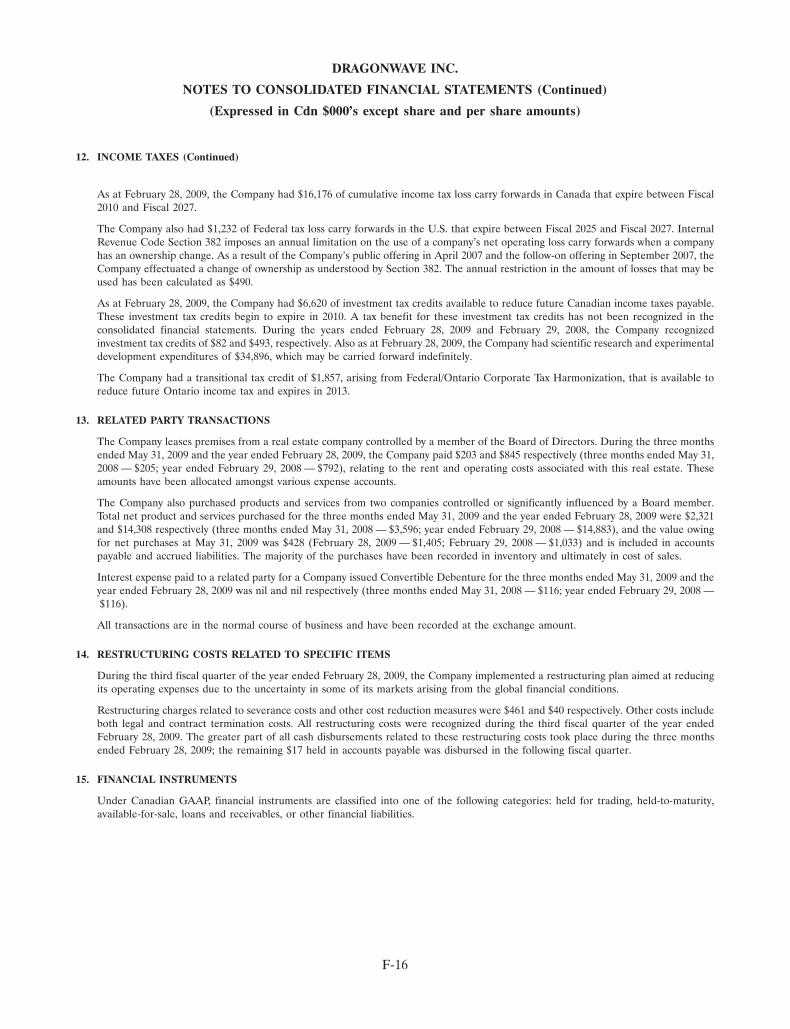
DRAGONWAVE INC.
NOTES TO CONSOLIDATED FINANCIAL STATEMENTS (Continued)
(Expressed in Cdn $000’s except share and per share amounts)
12. INCOME TAXES (Continued)
As at February 28, 2009, the Company had $16,176 of cumulative income tax loss carry forwards in Canada that expire between Fiscal2010 and Fiscal 2027.
The Company also had $1,232 of Federal tax loss carry forwards in the U.S. that expire between Fiscal 2025 and Fiscal 2027. InternalRevenue Code Section 382 imposes an annual limitation on the use of a company’s net operating loss carry forwards when a companyhas an ownership change. As a result of the Company’s public offering in April 2007 and the follow-on offering in September 2007, theCompany effectuated a change of ownership as understood by Section 382. The annual restriction in the amount of losses that may beused has been calculated as $490.
As at February 28, 2009, the Company had $6,620 of investment tax credits available to reduce future Canadian income taxes payable.These investment tax credits begin to expire in 2010. A tax benefit for these investment tax credits has not been recognized in theconsolidated financial statements. During the years ended February 28, 2009 and February 29, 2008, the Company recognizedinvestment tax credits of $82 and $493, respectively. Also as at February 28, 2009, the Company had scientific research and experimentaldevelopment expenditures of $34,896, which may be carried forward indefinitely.
The Company had a transitional tax credit of $1,857, arising from Federal/Ontario Corporate Tax Harmonization, that is available toreduce future Ontario income tax and expires in 2013.
13. RELATED PARTY TRANSACTIONS
The Company leases premises from a real estate company controlled by a member of the Board of Directors. During the three monthsended May 31, 2009 and the year ended February 28, 2009, the Company paid $203 and $845 respectively (three months ended May 31,2008 — $205; year ended February 29, 2008 — $792), relating to the rent and operating costs associated with this real estate. Theseamounts have been allocated amongst various expense accounts.
The Company also purchased products and services from two companies controlled or significantly influenced by a Board member.Total net product and services purchased for the three months ended May 31, 2009 and the year ended February 28, 2009 were $2,321and $14,308 respectively (three months ended May 31, 2008 — $3,596; year ended February 29, 2008 — $14,883), and the value owingfor net purchases at May 31, 2009 was $428 (February 28, 2009 — $1,405; February 29, 2008 — $1,033) and is included in accountspayable and accrued liabilities. The majority of the purchases have been recorded in inventory and ultimately in cost of sales.
Interest expense paid to a related party for a Company issued Convertible Debenture for the three months ended May 31, 2009 and theyear ended February 28, 2009 was nil and nil respectively (three months ended May 31, 2008 — $116; year ended February 29, 2008 —$116).
All transactions are in the normal course of business and have been recorded at the exchange amount.
14. RESTRUCTURING COSTS RELATED TO SPECIFIC ITEMS
During the third fiscal quarter of the year ended February 28, 2009, the Company implemented a restructuring plan aimed at reducingits operating expenses due to the uncertainty in some of its markets arising from the global financial conditions.
Restructuring charges related to severance costs and other cost reduction measures were $461 and $40 respectively. Other costs includeboth legal and contract termination costs. All restructuring costs were recognized during the third fiscal quarter of the year endedFebruary 28, 2009. The greater part of all cash disbursements related to these restructuring costs took place during the three monthsended February 28, 2009; the remaining $17 held in accounts payable was disbursed in the following fiscal quarter.
15. FINANCIAL INSTRUMENTS
Under Canadian GAAP, financial instruments are classified into one of the following categories: held for trading, held-to-maturity,available-for-sale, loans and receivables, or other financial liabilities.
F-16

DRAGONWAVE INC.
NOTES TO CONSOLIDATED FINANCIAL STATEMENTS (Continued)
(Expressed in Cdn $000’s except share and per share amounts)
15. FINANCIAL INSTRUMENTS (Continued)
Fair value
The following table summarizes the carrying values of the Company’s financial instruments:
May 31, February 28, February 29,2009 2009 2008
Held for trading(1) . . . . . . . . . . . . . . . . . . . . . . . . . . . . . . . . . . . . . . . . . . . . . 21,975 23,498 33,459Loans and receivables(2) . . . . . . . . . . . . . . . . . . . . . . . . . . . . . . . . . . . . . . . . . 11,898 11,243 12,525Other financial liabilities(3) . . . . . . . . . . . . . . . . . . . . . . . . . . . . . . . . . . . . . . . . 6,745 5,934 9,176
(1) Includes cash, cash equivalents, and short-term investments
(2) Includes accounts receivable and other receivables
(3) Includes line of credit, accounts payable and accrued liabilities which are financial in nature
Cash and cash equivalents, short-term investments, accounts receivable, other receivables, line of credit, accounts payable and accruedliabilities are short-term financial instruments whose fair value approximates the carrying amount given that they will mature shortly. Asat the balance sheet date, there are no significant differences between the carrying value of these items and their estimated fair values.
Interest rate risk
Cash and cash equivalents and short-term investments with fixed interest rates expose the Company to interest rate risk on thesefinancial instruments. Interest income of $34 and $693 was recognized during the three and twelve months ended May 31, 2009 andFebruary 28, 2009 respectively, on the Company’s cash, cash equivalents and short-term investments (three months ended May 31,2008 — $254; year ended February 29, 2008 — $1,109).
The following table illustrates the effect of a change in interest rates on the Company’s net loss for the periods mentioned below, withall other variables held constant. The change in after-tax loss is due to adjustments in the fair value for fixed rate short-term investmentsclassified as held for trading.
Interest Rates Interest Rates+25 basis points �25 basis points
Effect on the Company’s after-tax incomeas at May 31, 2009 . . . . . . . . . . . . . . . . . . . . . . . . . . . . . . . . . . . . . . . . . . . . . nil nilas at February 28, 2009 . . . . . . . . . . . . . . . . . . . . . . . . . . . . . . . . . . . . . . . . . . (2) 2as at May 31, 2008 . . . . . . . . . . . . . . . . . . . . . . . . . . . . . . . . . . . . . . . . . . . . . (5) 5as at February 29, 2008 . . . . . . . . . . . . . . . . . . . . . . . . . . . . . . . . . . . . . . . . . . (7) 7
The Company pays interest on its line of credit at the bank’s prime rate of interest plus 1.75% (February 28, 2009 — 1%; February 29,2008 — 1%), and has interest rate risk exposure due to changes in the bank’s prime rate.
Credit risk
The Company is exposed to credit risk with respect to accounts receivable in the event that its counterparties do not meet theirobligations. The Company minimizes its credit risk with respect to accounts receivable by performing credit reviews for each of itscustomers. As at May 31, 2009, one customer exceeded 10% of the total receivable balance. This customer represented 45%(February 28, 2009 — two customers represented 44%; February 29, 2008 — one customer represented 26%) of the accounts receivablebalance.
The Company’s allowance for doubtful accounts reflects the Company’s assessment of collectability across its global customer base. TheCompany defines past due based on agreed upon terms with each individual customer. As at May 31, 2009, 28% of trade receivables(net of allowances) are considered at least one day past due (February 28, 2009 — 23%; February 29, 2008 — 49%).
F-17

DRAGONWAVE INC.
NOTES TO CONSOLIDATED FINANCIAL STATEMENTS (Continued)
(Expressed in Cdn $000’s except share and per share amounts)
15. FINANCIAL INSTRUMENTS (Continued)
Foreign exchange risk
The following table summarizes the currency distribution of the Company’s financial instruments in Canadian dollars:
May 31, 2009 February 28, 2009 February 29, 2008
CDN US Other CDN US Other CDN US OtherDollars Dollars Currency Dollars Dollars Currency Dollars Dollars Currency
Cash and cash equivalents . . 65% 30% 5% 69% 26% 5% 96% 3% 1%Accounts receivable . . . . . . . 3% 96% 1% 4% 90% 6% 15% 84% 1%Financial liabilities . . . . . . . 43% 56% 1% 40% 59% 1% 43% 56% 1%
Foreign exchange risk arises because of fluctuations in exchange rates. The Company’s financial results are reported in Canadian dollarswhile it conducts a significant portion of its business activities in foreign currencies, primarily United States dollars. The assets,liabilities, revenue and expenses that are denominated in foreign currencies will be affected by changes in the exchange rate between theCanadian dollar and these foreign currencies. The Company does not currently use derivative financial instruments to mitigate this risk.
If the Canadian dollar had appreciated 1 percent against all foreign currencies at May 31, 2009, with all other variables held constant,the impact of this foreign currency change on the Company’s foreign denominated financial instruments would have resulted in areduction of after-tax net income of $149 for the three months ended May 31, 2009 (three month ended May 31, 2008 — $86; yearended February 28, 2009 — $211; year ended February 29, 2008 — $69). If the Canadian dollar had depreciated 1 percent against allforeign currencies for the three months ended May 31, 2009, with all other variables held constant, the impact of this foreign currencychange on the Company’s foreign denominated financial instruments would have resulted in an additional $149 of after-tax net incomefor the three month period ended May 31, 2009 (three months ended May 31, 2008 — $86; year ended February 28, 2009 — $211; yearended February 29, 2008 — $69).
For the three months ended May 31, 2009, a foreign exchange loss of $1,686 was recognized (three months ended May 31, 2008 — $268gain; year ended February 28, 2009 — $4,514 gain; year ended February 29, 2008 — $1,453 loss).
Liquidity risk
Liquidity risk is the risk that the Company will not be able to meet its financial obligations as they become due. Based on the Company’srecent performance, current revenue expectations and strong current ratio, management believes that liquidity risk is low.
16. CAPITAL MANAGEMENT
The Company defines capital to include shareholders’ equity. The Company manages its capital in order to maintain flexibility andrespond to changes in economic and/or marketplace conditions. In order to increase shareholder value, the Company may adjust itscapital structure by issuing new shares, purchasing shares for cancellation or raising debt. At this time, the Company does not utilizedebt facilities as part of its capital management strategy with the exception of an operating line of credit. For all periods noted, theCompany has not distributed dividends to its shareholders. The Company is not subject to any externally imposed requirements otherthan disclosed in note 6; and there were no changes in the Company’s approach to capital management during the periods noted inthese consolidated financial statements.
17. SEGMENTS AND GEOGRAPHICAL INFORMATION
The Company operates in one reportable segment — broadband wireless backhaul equipment. All significant assets held by theCompany are located in Canada. The following table presents total revenues by geographic location:
May 31, May 31, February 28, February 29,2009 2008 2009 2008
$ % $ % $ % $ %Canada . . . . . . . . . . . . . . . . . . . . . . . . . . . . . . . . . . . . . 966 6 1,820 17 4,690 11 5,678 14North America (excluding Canada) . . . . . . . . . . . . . . . . . . . . 11,886 74 6,239 58 24,951 58 22,387 56Europe, Middle East, and Africa . . . . . . . . . . . . . . . . . . . . . 3,027 19 2,416 23 11,334 26 11,382 28Other . . . . . . . . . . . . . . . . . . . . . . . . . . . . . . . . . . . . . . 71 1 250 2 2,359 5 957 2
15,950 100 10,725 100 43,334 100 40,404 100
F-18
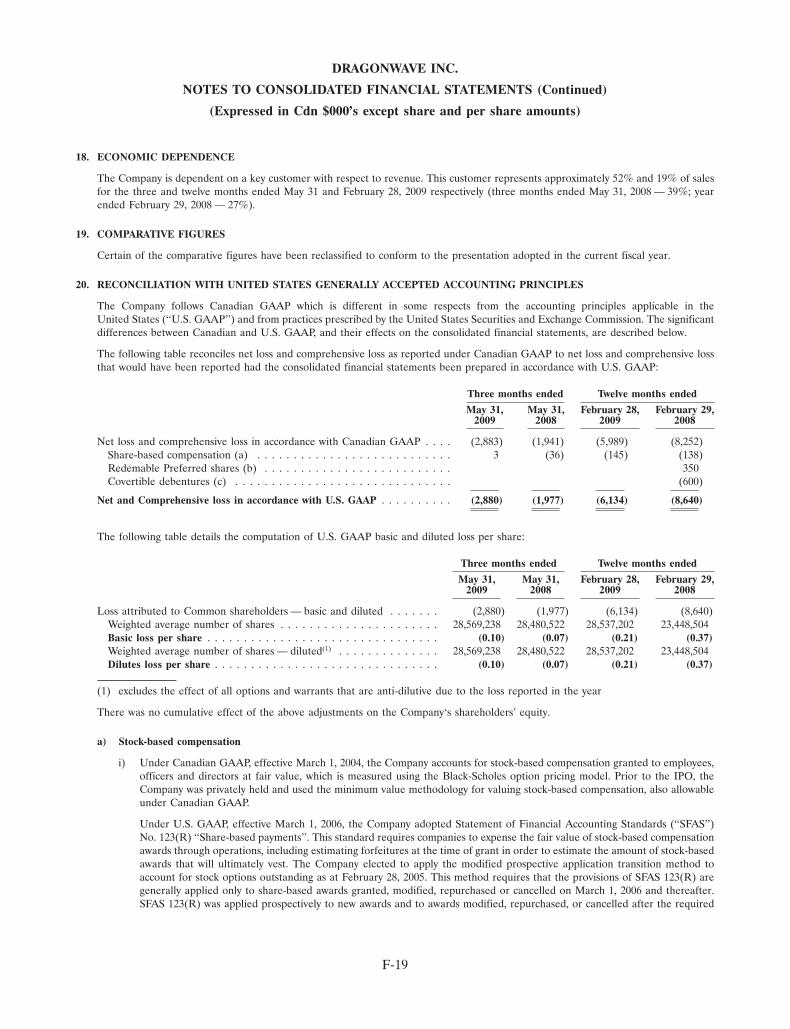
DRAGONWAVE INC.
NOTES TO CONSOLIDATED FINANCIAL STATEMENTS (Continued)
(Expressed in Cdn $000’s except share and per share amounts)
18. ECONOMIC DEPENDENCE
The Company is dependent on a key customer with respect to revenue. This customer represents approximately 52% and 19% of salesfor the three and twelve months ended May 31 and February 28, 2009 respectively (three months ended May 31, 2008 — 39%; yearended February 29, 2008 — 27%).
19. COMPARATIVE FIGURES
Certain of the comparative figures have been reclassified to conform to the presentation adopted in the current fiscal year.
20. RECONCILIATION WITH UNITED STATES GENERALLY ACCEPTED ACCOUNTING PRINCIPLES
The Company follows Canadian GAAP which is different in some respects from the accounting principles applicable in theUnited States (‘‘U.S. GAAP’’) and from practices prescribed by the United States Securities and Exchange Commission. The significantdifferences between Canadian and U.S. GAAP, and their effects on the consolidated financial statements, are described below.
The following table reconciles net loss and comprehensive loss as reported under Canadian GAAP to net loss and comprehensive lossthat would have been reported had the consolidated financial statements been prepared in accordance with U.S. GAAP:
Three months ended Twelve months ended
May 31, May 31, February 28, February 29,2009 2008 2009 2008
Net loss and comprehensive loss in accordance with Canadian GAAP . . . . (2,883) (1,941) (5,989) (8,252)Share-based compensation (a) . . . . . . . . . . . . . . . . . . . . . . . . . . . 3 (36) (145) (138)Redemable Preferred shares (b) . . . . . . . . . . . . . . . . . . . . . . . . . . 350Covertible debentures (c) . . . . . . . . . . . . . . . . . . . . . . . . . . . . . . (600)
Net and Comprehensive loss in accordance with U.S. GAAP . . . . . . . . . . (2,880) (1,977) (6,134) (8,640)
The following table details the computation of U.S. GAAP basic and diluted loss per share:
Three months ended Twelve months ended
May 31, May 31, February 28, February 29,2009 2008 2009 2008
Loss attributed to Common shareholders — basic and diluted . . . . . . . (2,880) (1,977) (6,134) (8,640)Weighted average number of shares . . . . . . . . . . . . . . . . . . . . . . 28,569,238 28,480,522 28,537,202 23,448,504Basic loss per share . . . . . . . . . . . . . . . . . . . . . . . . . . . . . . . . (0.10) (0.07) (0.21) (0.37)Weighted average number of shares — diluted(1) . . . . . . . . . . . . . . 28,569,238 28,480,522 28,537,202 23,448,504Dilutes loss per share . . . . . . . . . . . . . . . . . . . . . . . . . . . . . . . (0.10) (0.07) (0.21) (0.37)
(1) excludes the effect of all options and warrants that are anti-dilutive due to the loss reported in the year
There was no cumulative effect of the above adjustments on the Company‘s shareholders’ equity.
a) Stock-based compensation
i) Under Canadian GAAP, effective March 1, 2004, the Company accounts for stock-based compensation granted to employees,officers and directors at fair value, which is measured using the Black-Scholes option pricing model. Prior to the IPO, theCompany was privately held and used the minimum value methodology for valuing stock-based compensation, also allowableunder Canadian GAAP.
Under U.S. GAAP, effective March 1, 2006, the Company adopted Statement of Financial Accounting Standards (‘‘SFAS’’)No. 123(R) ‘‘Share-based payments’’. This standard requires companies to expense the fair value of stock-based compensationawards through operations, including estimating forfeitures at the time of grant in order to estimate the amount of stock-basedawards that will ultimately vest. The Company elected to apply the modified prospective application transition method toaccount for stock options outstanding as at February 28, 2005. This method requires that the provisions of SFAS 123(R) aregenerally applied only to share-based awards granted, modified, repurchased or cancelled on March 1, 2006 and thereafter.SFAS 123(R) was applied prospectively to new awards and to awards modified, repurchased, or cancelled after the required
F-19

DRAGONWAVE INC.
NOTES TO CONSOLIDATED FINANCIAL STATEMENTS (Continued)
(Expressed in Cdn $000’s except share and per share amounts)
20. RECONCILIATION WITH UNITED STATES GENERALLY ACCEPTED ACCOUNTING PRINCIPLES (Continued)
effective date. The Company had previously applied SFAS 123(R) and recognizes the remaining value of awards granted priorto March 1, 2006 over their remaining service period.
The Company has adopted the straight-line attribution method for determining the compensation cost to be recorded duringeach accounting period. However, awards based on performance conditions are recorded as compensation expense when theperformance conditions are expected to be met.
As a result of adopting SFAS 123(R), which does not permit the use of the minimum value method additional compensationexpense has been recorded under U.S. GAAP for the three-month periods ended May 31, 2009 and May 31, 2008 and for theyears ended February 28, 2009 and February 29, 2008.
During the three-month period ended May 31, 2009, the Company modified certain outstanding stock options by reducing theexercise price of the options and extending their contractual life by one year. Under Canadian GAAP, in calculating the valueof the option immediately prior to the modification, its expected life was limited to the remaining life of the previously grantedoption. Under U.S. GAAP, in accordance with SFAS 123(R), the expected life of the option was re-evaluated immediatelyprior to the modification and was not limited to the remaining expected life of the un-modified option. As a result,compensation cost recorded for the three-month period ended May 31, 2009 related to the modification under U.S. GAAP isless than the amount recorded under Canadian GAAP.
ii) As at May 31, 2009 and February 28, 2009, compensation costs not yet recognized relating to stock option awards outstandingof $2,132 and $2,164 respectively (May 31, 2008 — $2,454 February 29, 2008 — $2,464) net of estimated forfeitures. As atMay 31, 2009, compensation cost will be recognized on a straight line basis over the remaining weighted-average period ofapproximately 2.3 years for the time vesting options and the performance vesting awards will vest as performance conditionsare met. Compensation will be adjusted for subsequent changes in estimated forfeitures.
iii) The total intrinsic value of options exercised during the three-month period ended May 31, 2009 was $177 (three-monthperiod ended May 31, 2008 — nil) and for the year ended February 28, 2009 was nil (February 29, 2008 — $3).
iv) The total intrinsic value of fully vested options at May 31, 2009 was $777 (May 31, 2008 — $1,411) and was ($516) atFebruary 29, 2009 (February 29, 2008 — $1,000).
v) The total fair value of options that vested during the three-month period ended May 31, 2009 was $239 (three month periodended May 31, 2008 — $181) and for the year ended February 28, 2009 was $769 (2008 — $464).
vi) SFAS 123(R) does not permit the use of the minimum value method. The Company derives the volatility over the expectedterm of the awards based on comparable companies’ historical volatilities as this represents the most appropriate basis todetermine actual expected volatility of its own shares in future periods. The expected life of options was determined based onseveral factors including historical life, probable life before exercise, and probability of exercise.
vii) The Company records an expense equal to the fair value of shares granted pursuant to the employee share purchase plan overthe period the shares vest. The total fair value of the shares recognized during the three-month period ended May 31, 2009 was$1 (three-month period ended May 31, 2008 — nil) and for the year ended February 28, 2009 was $1 (2008 — nil). The fairvalue of the unearned ESPP shares as at May 31, 2009 was $2 (May 31, 2008 — nil) and as at February 28, 2009 was$1 (2008 — nil). The number of shares held for release under the plan at May 31, 2009 and February 28, 2009 were 1,076 and1,413 respectively (May 31, 2008 — nil; February 29, 2008 — nil).
b) Redeemable Preferred Shares
Under Canadian GAAP, the fair value of the redemption feature of the redeemable Preferred shares at their date of issuance wasseparated from the Preferred shares and recorded as a liability. As a result, the amount allocated to the Preferred shares was lessthan their redemption amount. The Preferred shares were accreted up to their redemption amount over the term to the date thatthe redeemable Preferred shares first became redeemable. This accretion was charged to interest expense. Under Canadian GAAP,the value of the conversion feature was recorded in shareholders’ equity.
Under U.S. GAAP, the fair value of the conversion feature was not required to be separately recorded. As a result, no interestexpense was required to be recorded under U.S. GAAP. Under U.S. GAAP, the redeemable Preferred shares are classified outsideof permanent shareholders’ equity as they are redeemable at the option of the holder. This results in a U.S. GAAP reconciling itemto reflect the different classification. As the Preferred shares were all redeemed prior to February 28, 2008, there is no classificationdifference for any of the periods presented.
F-20

DRAGONWAVE INC.
NOTES TO CONSOLIDATED FINANCIAL STATEMENTS (Continued)
(Expressed in Cdn $000’s except share and per share amounts)
20. RECONCILIATION WITH UNITED STATES GENERALLY ACCEPTED ACCOUNTING PRINCIPLES (Continued)
c) Convertible Debt
Under Canadian GAAP, the fair value of the liability component of the Convertible Debt at the date of issuance was recorded aslong-term debt. This liability component was being accreted up to the face amount of the Convertible Debt over the term tomaturity until the underlying debt was converted into Preferred shares. This accretion was charged to interest expense using theeffective interest rate method. Under Canadian GAAP the equity components of the Convertible Debt, consisting of theconversion right and warrants, were valued using the residual valuation of the equity component method where the liabilitycomponent is valued first, and the difference between the proceeds of the debt issuance and the fair value of the liability is assignedto the equity components and recorded in shareholders’ equity.
Under U.S. GAAP, the proceeds of debt instruments issued with detachable stock purchase warrants should be allocated based ona relative fair value basis. As a result, the relative fair value of the warrants at their issuance was determined to be $465 and wasallocated to shareholders’ equity with a corresponding discount on the Convertible Debt. Due to the allocation of proceeds towarrants and ability for holders to convert the debt at a price equal to ninety percent (90%) of the then-current share price, aBeneficial Conversion Feature (‘‘BCF’’) exists under U.S. GAAP. In accordance with U.S. GAAP, a further discount on theConvertible Debt and increase to shareholders’ equity of $1,854 was recorded representing the fair value of the BCF upon issuance.The discounts on the Convertible Debt are accreted to interest expense using the effective interest method and any unamortizedbalance is expensed immediately upon conversion of the Convertible Debt.
The discount on Convertible Debt under U.S. GAAP is greater than that under Canadian GAAP, and as a result, additional interestexpense was recorded under U.S. GAAP for the year ended February 29, 2008.
OTHER DISCLOSURES REQUIRED UNDER U.S. GAAP
a) Income Statement
i) During each of the periods presented revenue is comprised of:
Three months ended Twelve months ended
May 31, May 31, February 28, February 29,2009 2008 2009 2008
Product Sales . . . . . . . . . . . . . . . . . . . . . . . . . . . . . . . 14,929 9,289 38,952 37,640Services . . . . . . . . . . . . . . . . . . . . . . . . . . . . . . . . . . . 1,021 1,436 4,382 2,764
Total Revenue . . . . . . . . . . . . . . . . . . . . . . . . . . . . . . . 15,950 10,725 43,334 40,404
ii) Stock based compensation:
Non-cash stock based compensation of $239 was recorded for the three-month period ended May 31, 2009 (three monthperiod ended May 31, 2008 — $181) and $769 for the year ended February 28, 2009 (2008 — $465) and was included inGeneral and administrative, Selling and Marketing, and Research and Development expenses as detailed below.
Three months ended Twelve months ended
May 31, May 31, February 28, February 29,2009 2008 2009 2008
General and Administrative . . . . . . . . . . . . . . . . . . . . . . 93 52 306 153Research and Development . . . . . . . . . . . . . . . . . . . . . . . 60 51 186 153Sales and Marketing . . . . . . . . . . . . . . . . . . . . . . . . . . . 86 78 277 158
239 181 769 464
F-21

DRAGONWAVE INC.
NOTES TO CONSOLIDATED FINANCIAL STATEMENTS (Continued)
(Expressed in Cdn $000’s except share and per share amounts)
20. RECONCILIATION WITH UNITED STATES GENERALLY ACCEPTED ACCOUNTING PRINCIPLES (Continued)
iii) Details of related party transaction amounts included in income statement captions are as follows:
Three months ended Twelve months ended
May 31, May 31, February 28, February 29,2009 2008 2009 2008
Cost of Sales . . . . . . . . . . . . . . . . . . . . . . . . . . . . . . . . 2,321 3,574 14,103 14,782Reaserch and Development . . . . . . . . . . . . . . . . . . . . . . . 98 109 437 423General and administrative . . . . . . . . . . . . . . . . . . . . . . . 76 65 280 260Sales and Marketing . . . . . . . . . . . . . . . . . . . . . . . . . . . 29 53 333 208
Total . . . . . . . . . . . . . . . . . . . . . . . . . . . . . . . . . . . . . 2,524 3,801 15,153 15,673
iv) Bad debt expense:
Included in general and administrative expenses is $11 related to bad debt expense for the three-month period ended May 31,2009 (three-month period ended May 31, 2008 — $47) and $325 related to the year ended February 28, 2009 (year endedFebruary 29, 2008 — $116).
v) Rental expense:
Included in general and administrative expenses is $191 related to premises rental expense for the three-month period endedMay 31, 2009 (three-month period ended May 31, 2008 — $191) and $759 related to the year ended February 28, 2009 (yearended February 29, 2008 — $617).
vi) Depreciation expense:
Included in general and administrative expenses is $92 related to depreciation of capital assets for the three-month periodended May 31, 2009 (three-month period ended May 31, 2008 — $74) and $341 related to the year ended February 28, 2009(year ended February 29, 2008 — $199).
b) Balance Sheet
i) Accounts Payable and Accrued Liabilities:
Details of accounts payable and accrued liabilities are as follows:
Three months Twelve months endedendedMay 31, February 28, February 29,
2009 2009 2008
Accounts payable . . . . . . . . . . . . . . . . . . . . . . . . . . . . . . . . . . . . 3,739 1,764 3,423Accruals . . . . . . . . . . . . . . . . . . . . . . . . . . . . . . . . . . . . . . . . . 2,148 1,991 3,840Payroll related Accruals . . . . . . . . . . . . . . . . . . . . . . . . . . . . . . . . 366 487 759Related party . . . . . . . . . . . . . . . . . . . . . . . . . . . . . . . . . . . . . . 428 1,422 1,033Taxes . . . . . . . . . . . . . . . . . . . . . . . . . . . . . . . . . . . . . . . . . . . — 13 —
Total accounts payables and accrued liabilities . . . . . . . . . . . . . . . . . 6,681 5,677 9,055
ii) Warranty liability:
The Company records a liability for future warranty costs based on management’s best estimate of probable claims within theCompanies product warranties. The accrual is based on the terms of the warranty which vary by customer, product, or serviceand historical experience. The Company regularly evaluate the appropriateness of the remaining accrual.
F-22

DRAGONWAVE INC.
NOTES TO CONSOLIDATED FINANCIAL STATEMENTS (Continued)
(Expressed in Cdn $000’s except share and per share amounts)
20. RECONCILIATION WITH UNITED STATES GENERALLY ACCEPTED ACCOUNTING PRINCIPLES (Continued)
The following table details the changes in the warranty liability:
Three months Twelve months endedendedMay 31, February 28, February 29,
2009 2009 2008
Balance at beginning of period . . . . . . . . . . . . . . . . . . . . . . . . . . . 401 429 286Accruals . . . . . . . . . . . . . . . . . . . . . . . . . . . . . . . . . . . . . . . . . 236 531 669Utilization . . . . . . . . . . . . . . . . . . . . . . . . . . . . . . . . . . . . . . . . (115) (559) (526)
Balance at end of period . . . . . . . . . . . . . . . . . . . . . . . . . . . . . . . 522 401 429
iii) Restructuring charges:
During the year ended February 28, 2009, the Company recorded restructuring charges of $501 related to severance andbenefit costs associated with a workforce reduction of 20 employees, all of whom were notified of their termination during theyear ended February 28, 2009. Of the total expense, $484 was disbursed during the three months ended February 28, 2009 withthe remainder disbursed during the subsequent fiscal quarter.
iv) Short-term investments:
Cost and fair value of investments classified as held for trading, as at February 29, 2008, by contractual maturity wereas follows:
Amortized FairCost Value
Due in one to 3 months . . . . . . . . . . . . . . . . . . . . . . . . . . . . . . . . . . . . . . . . . . . . . . . . 31,878 31,908Due in 3 to 6 months . . . . . . . . . . . . . . . . . . . . . . . . . . . . . . . . . . . . . . . . . . . . . . . . . . — —
Total Investments . . . . . . . . . . . . . . . . . . . . . . . . . . . . . . . . . . . . . . . . . . . . . . . . . . . . 31,878 31,908
v) Allowance for doubtful accounts:
Allowance for doubtful accounts at May 31, 2009 was $281 (February 28, 2009 — $296; February 29, 2008 — $77).
c) Capital Stock
i) Shares outstanding:
Under U.S. GAAP, issued and authorized capital is required to be presented on the face of the balance sheet. The Company isauthorized to issue an unlimited number of voting Common shares. After all preferential dividends are declared, commonshareholders are entitled to dividends, if and when declared by the Board of Directors provided that an equivalent dividend onthe outstanding Class A-1 Preferred shares, and Class B Preferred shares are declared.
The Company had 28,614,780 and 28,559,297 Common shares issued and outstanding as at May 31, 2009 and February 28,2009, respectively (28,555,335 and 28,440,355 as at May 31, 2008 and February 29, 2008, respectively).
d) Income Taxes
i) Adoption of FASB Interpretation 48:
In June 2006, the Financial Accounting Standards Board (‘‘FASB’’) issued Interpretation No. 48 (‘‘FIN 48’’), Accounting forUncertainty in Income Taxes, an interpretation of FAS 109, effective for fiscal years beginning on or after December 15, 2006.FIN 48 provides specific guidance on the recognition, de-recognition and measurement of income tax positions in financialstatements, including the accrual of related interest and penalties recorded in interest expense. An income tax position isrecognized when it is more likely than not that it will be sustained upon examination based on its technical merits, and ismeasured as the largest amount that is greater than 50% likely of being realized upon ultimate settlement. Under Canadian
F-23

DRAGONWAVE INC.
NOTES TO CONSOLIDATED FINANCIAL STATEMENTS (Continued)
(Expressed in Cdn $000’s except share and per share amounts)
20. RECONCILIATION WITH UNITED STATES GENERALLY ACCEPTED ACCOUNTING PRINCIPLES (Continued)
GAAP, the Company recognizes and measures income tax positions based on the best estimate of the amount that is morelikely than not of being realized. The adoption of FIN 48 did not have any impact on the Company’s U.S. GAAP results.
ii) Substantively enacted tax rates:
Under Canadian GAAP, income taxes are measured using substantively enacted tax rates, while under U.S. GAAP,measurement is based upon enacted tax rates. This difference does not result in a difference for any periods presented in theseconsolidated financial statements.
iii) Deferred tax asset:
Under U.S. GAAP, investment tax credits are included in the determination of deferred tax asset whereas under CanadianGAAP, investment tax credits are not considered in the determination of future tax assets. Including the investment tax creditsas a deferred tax asset under U.S. GAAP would have the impact of increasing deferred tax assets with a correspondingincrease in the Company’s valuation allowance of $4,700 as at February 28, 2009 and $3,647 as at February 29, 2008.
iv) Accrued interest expenses:
The Company recognizes interest accrued relating to unrecognized tax liabilities as interest expense.
v) Fiscal period subject to examination:
The Company files income tax returns in Canada, the United States, and the United Kingdom. Generally, the years 2002 to2009 remain subject to examination by tax authorities.
vi) Income (loss) by jurisdiction:
The components of the Company’s income (loss) from continuing operations before income taxes, by taxing jurisdiction, wereas follows:
Three months ended Twelve months ended
May 31, May 31, February 28, February 29,2009 2008 2009 2008
Canada . . . . . . . . . . . . . . . . . . . . . . . . . . . . . . . . . . . (1,638) (2,503) (11,354) (7,393)United States . . . . . . . . . . . . . . . . . . . . . . . . . . . . . . . 412 61 230 188Other . . . . . . . . . . . . . . . . . . . . . . . . . . . . . . . . . . . . 2 (12) — —
(1,224) (2,454) (11,124) (7,205)
vii) Future tax liabilities by jurisdiction:
The Company’s future tax liability for each tax jurisdiction is nil for all periods noted above.
viii) Valuation Allowance:
Under U.S. GAAP, any valuation allowance related to investment tax credits (‘‘ITC’’) must be included in the valuationallowance for deferred tax assets. Accordingly, the Company recorded a valuation allowance of $26,352 as at February 28, 2009(February 29, 2008 — $24,538).
ix) Recognition of deferred tax assets:
In assessing the likelihood of realizing deferred tax assets, management considers whether it is more likely than not that someportion or all of the deferred tax assets will be realized. The ultimate realization of future income tax assets is dependent uponthe generation of future taxable income during the years in which the temporary differences are deductible. Managementconsiders the scheduled reversals of deferred tax liabilities, the character of the deferred income tax assets and available taxplanning strategies in making this assessment.
To the extent that management determines that the realization of future income taxes does not meet the more likely than notrealization criterion, a valuation allowance is recorded against the future income tax assets.
F-24
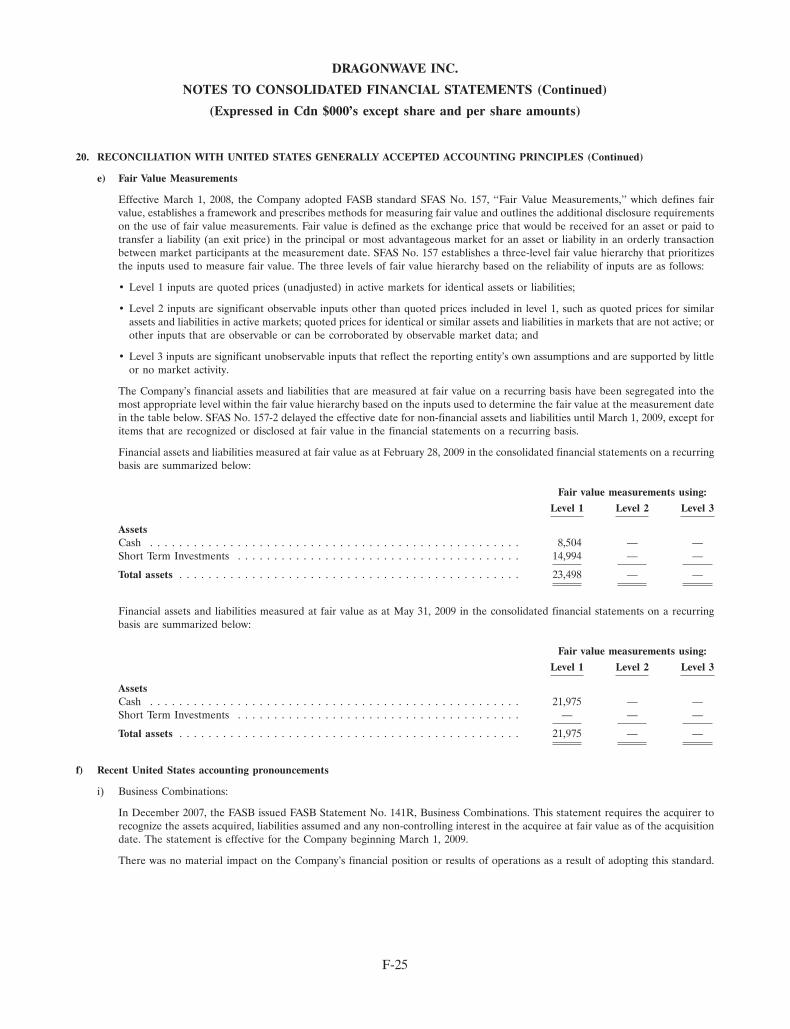
DRAGONWAVE INC.
NOTES TO CONSOLIDATED FINANCIAL STATEMENTS (Continued)
(Expressed in Cdn $000’s except share and per share amounts)
20. RECONCILIATION WITH UNITED STATES GENERALLY ACCEPTED ACCOUNTING PRINCIPLES (Continued)
e) Fair Value Measurements
Effective March 1, 2008, the Company adopted FASB standard SFAS No. 157, ‘‘Fair Value Measurements,’’ which defines fairvalue, establishes a framework and prescribes methods for measuring fair value and outlines the additional disclosure requirementson the use of fair value measurements. Fair value is defined as the exchange price that would be received for an asset or paid totransfer a liability (an exit price) in the principal or most advantageous market for an asset or liability in an orderly transactionbetween market participants at the measurement date. SFAS No. 157 establishes a three-level fair value hierarchy that prioritizesthe inputs used to measure fair value. The three levels of fair value hierarchy based on the reliability of inputs are as follows:
• Level 1 inputs are quoted prices (unadjusted) in active markets for identical assets or liabilities;
• Level 2 inputs are significant observable inputs other than quoted prices included in level 1, such as quoted prices for similarassets and liabilities in active markets; quoted prices for identical or similar assets and liabilities in markets that are not active; orother inputs that are observable or can be corroborated by observable market data; and
• Level 3 inputs are significant unobservable inputs that reflect the reporting entity’s own assumptions and are supported by littleor no market activity.
The Company’s financial assets and liabilities that are measured at fair value on a recurring basis have been segregated into themost appropriate level within the fair value hierarchy based on the inputs used to determine the fair value at the measurement datein the table below. SFAS No. 157-2 delayed the effective date for non-financial assets and liabilities until March 1, 2009, except foritems that are recognized or disclosed at fair value in the financial statements on a recurring basis.
Financial assets and liabilities measured at fair value as at February 28, 2009 in the consolidated financial statements on a recurringbasis are summarized below:
Fair value measurements using:
Level 1 Level 2 Level 3
AssetsCash . . . . . . . . . . . . . . . . . . . . . . . . . . . . . . . . . . . . . . . . . . . . . . . . . . . 8,504 — —Short Term Investments . . . . . . . . . . . . . . . . . . . . . . . . . . . . . . . . . . . . . . . 14,994 — —
Total assets . . . . . . . . . . . . . . . . . . . . . . . . . . . . . . . . . . . . . . . . . . . . . . . 23,498 — —
Financial assets and liabilities measured at fair value as at May 31, 2009 in the consolidated financial statements on a recurringbasis are summarized below:
Fair value measurements using:
Level 1 Level 2 Level 3
AssetsCash . . . . . . . . . . . . . . . . . . . . . . . . . . . . . . . . . . . . . . . . . . . . . . . . . . . 21,975 — —Short Term Investments . . . . . . . . . . . . . . . . . . . . . . . . . . . . . . . . . . . . . . . — — —
Total assets . . . . . . . . . . . . . . . . . . . . . . . . . . . . . . . . . . . . . . . . . . . . . . . 21,975 — —
f) Recent United States accounting pronouncements
i) Business Combinations:
In December 2007, the FASB issued FASB Statement No. 141R, Business Combinations. This statement requires the acquirer torecognize the assets acquired, liabilities assumed and any non-controlling interest in the acquiree at fair value as of the acquisitiondate. The statement is effective for the Company beginning March 1, 2009.
There was no material impact on the Company’s financial position or results of operations as a result of adopting this standard.
F-25

DRAGONWAVE INC.
NOTES TO CONSOLIDATED FINANCIAL STATEMENTS (Continued)
(Expressed in Cdn $000’s except share and per share amounts)
20. RECONCILIATION WITH UNITED STATES GENERALLY ACCEPTED ACCOUNTING PRINCIPLES (Continued)
ii) Non-controlling interests:
In December 2007, the FASB issued FASB Statement No. 160, Non-controlling Interests in Financial Statements. This statementwill require non-controlling interest in a subsidiary to be reported in equity in the consolidated financial statements. The statementis effective for the Company beginning March 1, 2009.
There was no material impact on the Company’s financial position or results of operations as a result of adopting this standard.
iii) Disclosure about Derivative Instruments and Hedging Activities:
In March 2008, the FASB issued FASB Statement No. 161, Disclosures about Derivative Instruments and Hedging Activities. Thisnew statement enhances disclosures regarding an entity’s derivative and hedging activities. This statement is effective for theCompany beginning March 1, 2009.
There was no impact to the Company on adoption of this statement.
iv) Hierarchy of Generally Accepted Accounting Principles:
In May 2008, the FASB issued FASB Statement No. 162, The Hierarchy of Generally Accepted Accounting Principles. Thestatement identifies the sources of accounting principles and the framework for selecting the principles to be used in thepreparation of financial statements in accordance with GAAP in the United States. This statement was effective for the CompanyNovember 15, 2008, which is 60 days after the Securities and Exchange Commission’s approval of Auditing Standard No. 6,Evaluating Consistency of Financial Statements.
There was no impact to the Company on adoption of this statement.
v) Subsequent events:
In May 2009, the FASB issued SFAS No. 165, Subsequent Events, (‘‘SFAS 165’’), which is effective for the Company June 30, 2009.SFAS 165 provides guidance for disclosing events that occur after the balance sheet date, but before financial statements are issuedor available to be issued.
The adoption of SFAS 165 did not have a significant impact on the Company’s consolidated financial statements.
F-26

CERTIFICATE OF THE COMPANY
Date: October 14, 2009
This short form prospectus, together with the documents incorporated by reference, constitutes full, trueand plain disclosure of all material facts relating to the securities offered by this prospectus as required underthe securities legislation of British Columbia, Alberta, Saskatchewan, Manitoba, Ontario, New Brunswick, NovaScotia, Prince Edward Island and Newfoundland and Labrador.
By: (Signed) PETER ALLEN By: (Signed) RUSSELL FREDERICK
Chief Executive Officer Chief Financial Officer
On behalf of the Board of Directors
By: (Signed) GERRY SPENCER By: (Signed) CLAUDE HAW
Director Director
C-1

CERTIFICATE OF THE UNDERWRITERS
Date: October 14, 2009
To the best of our knowledge, information and belief, this short form prospectus, together with thedocuments incorporated by reference, constitutes full, true and plain disclosure of all material facts relating tothe securities offered by this prospectus as required under the securities legislation of British Columbia, Alberta,Saskatchewan, Manitoba, Ontario, New Brunswick, Nova Scotia, Prince Edward Island and Newfoundlandand Labrador.
CANACCORD CAPITAL CORPORATION
By: (Signed) JEAN-YVES BOURGEOIS
CIBC WORLD MARKETS INC. GMP SECURITIES L.P.
By: (Signed) MARWAN KUBURSI By: (Signed) STEVE OTTAWAY
RBC DOMINION SECURITIES INC.
By: (Signed) JAN SORHAUG
DUNDEE SECURITIES CORPORATION TD SECURITIES INC.
By: (Signed) AARON UNGER By: (Signed) SIMON KWONG
C-2

16SEP200917322012
1SEP200614461308Printed In Canada09-23476-4