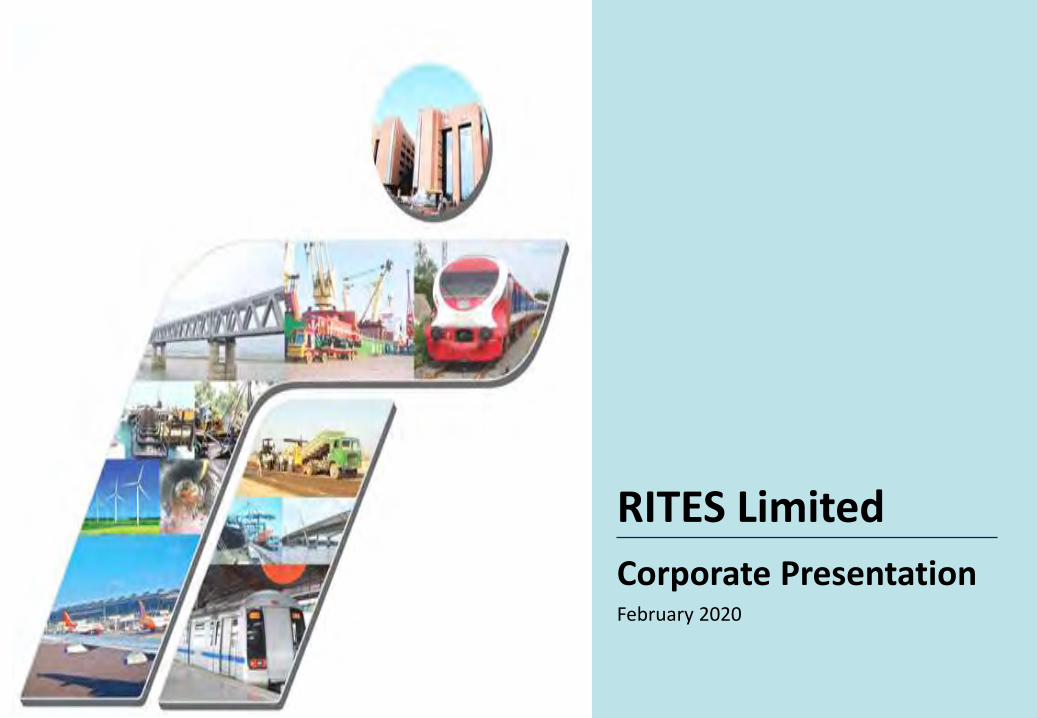
RITES Limited
38
February 2020 Corporate Presentation RITES Limited
-
Upload
khangminh22 -
Category
Documents
-
view
1 -
download
0
Transcript of RITES Limited
February 2020
Corporate Presentation
RITES Limited
Disclaimer
THIS PRESENTATION (“PRESENTATION”) DOES NOT CONSTITUTE OR FORM PART OF ANY OFFER OR INVITATION OR INDUCEMENT TO SELL OR ISSUE, OR ANY SOLICITATION OF ANY OFFER TO PURCHASE OR SUBSCRIBE FOR, ANY SECURITIES OF RITES LIMITED (THE “COMPANY”), NOR SHALL IT OR ANY PART OF IT OR THE FACT OF ITS DISTRIBUTION FORM THE BASIS OF, OR BE RELIED ON IN CONNECTION WITH, ANY CONTRACT OR COMMITMENT THEREFOR.
The material that follows is a Presentation of general background information about the Company’s activities, without regards to specific objectives, suitability, financial situations and needs of any particular person. It is information given in summary form and does not purport to be complete. This Presentation does not constitute a prospectus, offering circular or offering memorandum or an offer, or a solicitation of any offer, to purchase or sell, any shares and should not be considered as a recommendation that any investor should subscribe for or purchase any of the Company’s equity shares. No person is authorized to give any information or to make any representation not contained in or inconsistent with this presentation and if given or made, such information or representation must not be relied upon as having been authorized by any person.
This Presentation includes statements that are, or may be deemed to be, “forward-looking statements”. These forward-looking statements can be identified by the use of forward-looking terminology, including the terms “believes”, “estimates”, “anticipates”, “projects”, “predicts”, “aims”, “foresees”, “plans”, “expects”, “intends”, “may”, “will”, “seeks” or “should” or, in each case, their negative or other variations or comparable terminology, or by discussions of strategy, plans, aims, objectives, goals, future events or intentions. These forward-looking statements include all matters that are not historical facts. They appear in a number of places throughout this Presentation and include statements regarding the Company’s intentions, beliefs or current expectations concerning, amongst other things, its results or operations, financial condition, liquidity, prospects, growth, strategies and the industry in which the Company operates. By their nature, forward-looking statements involve risks and uncertainties because they relate to events and depend on circumstances that may or may not occur in the future. Forward-looking statements are not guarantees of future performance including those relating to general business plans and strategy of the Company, its future outlook and growth prospects, and future developments in its businesses and its competitive and regulatory environment. Neither the Company, nor its Directors, the President of India, acting through the Ministry of Railways, Government of India (“Promoter”), affiliates or other advisors or representatives nor any of its or their parent or subsidiary undertakings or any such person’s officers or employees gives any assurance that the assumptions underlying such forward-looking statements are free from errors nor do any of them accept any responsibility for the future accuracy of the forward-looking statements contained in this Presentation or the actual occurrence of the forecasted developments. Forward-looking statements speak only as of the date of this presentation. As a result, the Company expressly disclaims any obligations or undertaking to release any update or revisions to any forward-looking statements in this presentation as a result of any change in expectations or any change in events, conditions, assumptions or circumstances on which these forward-looking statements are based. In addition, even if the Company’s results of operations, financial condition and liquidity, and the development of the industry in which the Company operates, are consistent with the forward-looking statements contained in this Presentation, those results or developments may not be indicative of results or developments in subsequent periods.
The Company, as such, makes no representation or warranty, express or implied, as to, and does not accept any responsibility or liability with respect to, the fairness, accuracy, completeness or correctness of any information or opinions contained herein. The information contained in this Presentation, unless otherwise specified is only current as of the date of this Presentation. None of the Company, its Directors, Promoters or affiliates, nor any of its or their respective employees, advisors or representatives or any other person accepts any responsibility or liability whatsoever, whether arising in tort, contract or otherwise, for any errors, omission or inaccuracies in such information or opinions or for any loss, cost or damage suffered or incurred however arising, directly or indirectly, from any use of its documents or its contents or otherwise in connection with this document. The Company assumes no responsibility to publicly amend, modify or revise any forward looking statements, on the basis of any subsequent development, information or events, or otherwise. By attending the presentation you acknowledge that you will be solely responsible for your own assessment of the market and the market position of the Company and that you will conduct your own analysis and be solely responsible for forming your own view of the potential future business of the Company. This presentation has been prepared based on the information available in the public domain. The information contained herein is subject to change without notice. Past performance is not indicative of future results.
This presentation is strictly confidential and may not be copied or disseminated, in whole or in part, and in any manner or for any purpose. No person is authorized to give any information or to make any representation not contained in or inconsistent with this presentation and if given or made, such information or representation must not be relied upon as having been authorized by any person. Failure to comply with this restriction may constitute a violation of the applicable securities laws.
This presentation is not intended for distribution or publication in the United States. Neither this document nor any part or copy of it may be distributed, directly or indirectly, in the United States. The distribution of this document in certain jurisdictions may be restricted by law and persons in to whose possession this presentation comes should inform themselves about and observe any such restrictions. By reviewing this presentation, you agree to be bound by the foregoing limitations. You further represent and agree that (i) you are located outside the United States and you are permitted under the laws of your jurisdiction to receive this presentation or (ii) you are located in the United States and are a “qualified institutional buyer” (as defined in Rule 144A under the U.S. Securities Act of 1933, as amended (the “Securities Act”)).
This presentation is not an offer to sell or a solicitation of any offer to buy the securities of the Company in the United States or in any other jurisdiction where such offer or sale would be unlawful. Securities may not be offered, sold, resold, pledged, delivered, distributed or transferred, directly or indirectly, in to or within the United States absent registration under the Securities Act, except pursuant to an exemption from, or in a transaction not subject to, the registration requirements of the Securities Act and in compliance with any applicable securities laws of any state or other jurisdiction of the United States. The Company’s securities have not been and will not be registered under the Securities Act.
This document has not been and will not be reviewed or approved by a regulatory authority in India or by any stock exchange in India. This document and its contents should not be forwarded or delivered or transmitted in any manner to any person other than its intended recipient, and should not be reproduced in any manner whatsoever. The distribution of this presentation in certain jurisdictions may be restricted by law and persons in to whose possession this presentation comes should inform themselves about and observe such restrictions. By reviewing this Presentation, you agree to be bound by the foregoing limitations.
2
Agenda
3
Company Overview
Key Strengths
Appendix
1
2
3

Company Overview
4
1
RITES - Introduction
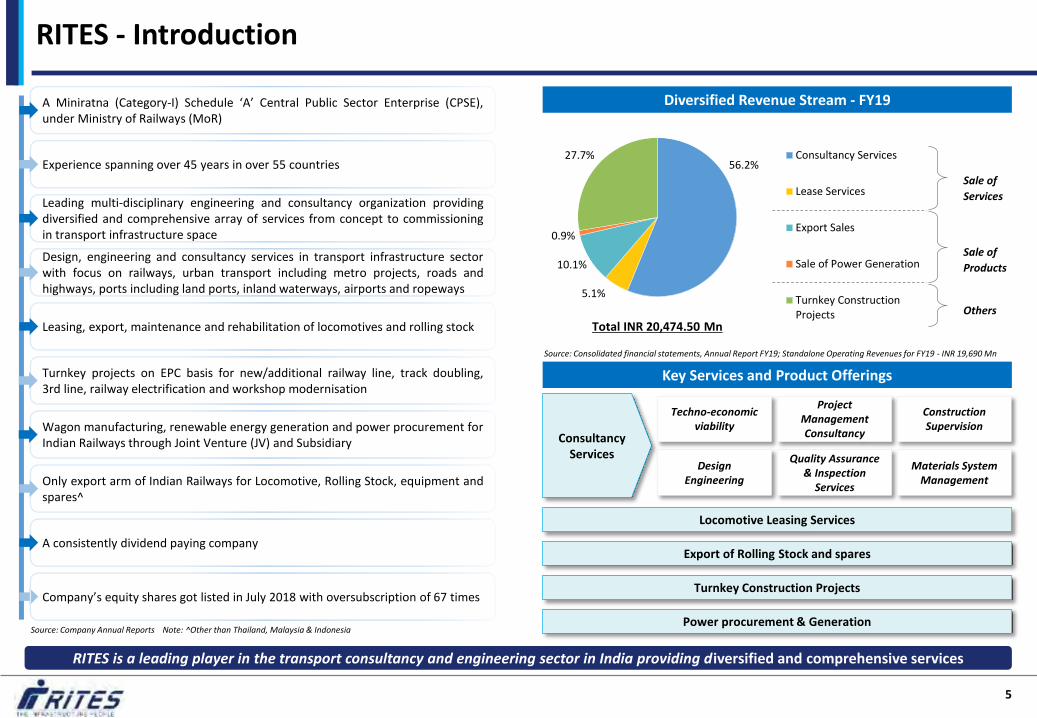
RITES is a leading player in the transport consultancy and engineering sector in India providing diversified and comprehensive services
5
Turnkey Construction Projects
Export of Rolling Stock and spares
Locomotive Leasing Services
Techno-economic viability
Design Engineering
Project Management Consultancy
Quality Assurance & Inspection
Services
Consultancy Services
Diversified Revenue Stream - FY19
Key Services and Product Offerings
Construction Supervision
Power procurement & Generation
Materials System Management
A Miniratna (Category-I) Schedule ‘A’ Central Public Sector Enterprise (CPSE), under Ministry of Railways (MoR)
Experience spanning over 45 years in over 55 countries
Leading multi-disciplinary engineering and consultancy organization providing diversified and comprehensive array of services from concept to commissioning in transport infrastructure space
Design, engineering and consultancy services in transport infrastructure sector with focus on railways, urban transport including metro projects, roads and highways, ports including land ports, inland waterways, airports and ropeways
Leasing, export, maintenance and rehabilitation of locomotives and rolling stock
Turnkey projects on EPC basis for new/additional railway line, track doubling, 3rd line, railway electrification and workshop modernisation
Wagon manufacturing, renewable energy generation and power procurement for Indian Railways through Joint Venture (JV) and Subsidiary
Only export arm of Indian Railways for Locomotive, Rolling Stock, equipment and spares^
A consistently dividend paying company
Source: Company Annual Reports Note: ^Other than Thailand, Malaysia & Indonesia
Source: Consolidated financial statements, Annual Report FY19; Standalone Operating Revenues for FY19 - INR 19,690 Mn
Company’s equity shares got listed in July 2018 with oversubscription of 67 times
56.2%
5.1%
10.1%
0.9%
27.7% Consultancy Services
Lease Services
Export Sales
Sale of Power Generation
Turnkey ConstructionProjects
Sale of
Products
Sale of
Services
Total INR 20,474.50 Mn Others
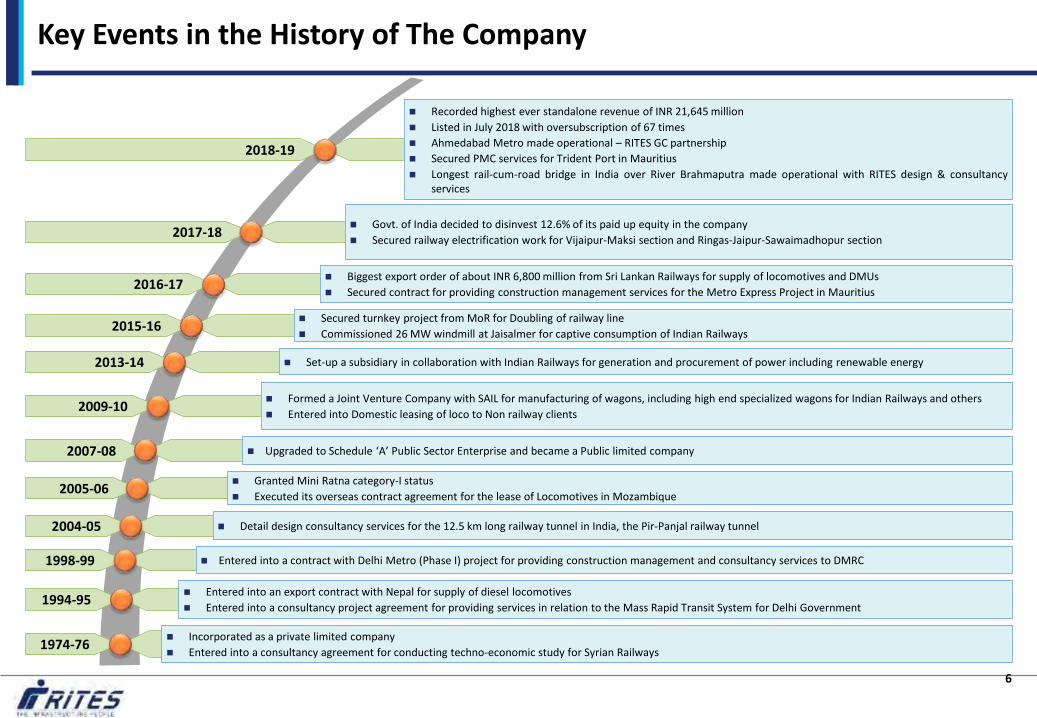
Key Events in the History of The Company
6
1974-76 Incorporated as a private limited company
Entered into a consultancy agreement for conducting techno-economic study for Syrian Railways
Biggest export order of about INR 6,800 million from Sri Lankan Railways for supply of locomotives and DMUs
Secured contract for providing construction management services for the Metro Express Project in Mauritius 2016-17
Set-up a subsidiary in collaboration with Indian Railways for generation and procurement of power including renewable energy 2013-14
Formed a Joint Venture Company with SAIL for manufacturing of wagons, including high end specialized wagons for Indian Railways and others
Entered into Domestic leasing of loco to Non railway clients 2009-10
Upgraded to Schedule ‘A’ Public Sector Enterprise and became a Public limited company 2007-08
Granted Mini Ratna category-I status
Executed its overseas contract agreement for the lease of Locomotives in Mozambique 2005-06
Detail design consultancy services for the 12.5 km long railway tunnel in India, the Pir-Panjal railway tunnel 2004-05
Entered into a contract with Delhi Metro (Phase I) project for providing construction management and consultancy services to DMRC 1998-99
Entered into an export contract with Nepal for supply of diesel locomotives
Entered into a consultancy project agreement for providing services in relation to the Mass Rapid Transit System for Delhi Government 1994-95
2015-16 Secured turnkey project from MoR for Doubling of railway line
Commissioned 26 MW windmill at Jaisalmer for captive consumption of Indian Railways
Govt. of India decided to disinvest 12.6% of its paid up equity in the company
Secured railway electrification work for Vijaipur-Maksi section and Ringas-Jaipur-Sawaimadhopur section 2017-18
Recorded highest ever standalone revenue of INR 21,645 million
Listed in July 2018 with oversubscription of 67 times
Ahmedabad Metro made operational – RITES GC partnership
Secured PMC services for Trident Port in Mauritius
Longest rail-cum-road bridge in India over River Brahmaputra made operational with RITES design & consultancy services
2018-19

7
Railway Energy Management Company Limited (“REMCL”) – Subsidiary
SAIL-RITES Bengal Wagon Industry Private Limited – JV
Incorporated on August 16, 2013 to carry out business relating to:
Creation, planning, promoting, constructing, executing, organizing, arranging and augmenting capacity in all activities relating to energy efficiency and power generation;
Undertaking any kind of projects for power generation in the field of renewable energy resources and sale of power generated
RITES holds 51% shares in REMCL, balance is held by Ministry of Railways
Provides PMC services for Indian Railways for setting up of wind and solar energy projects, power procurement and construction of transmission lines
Commissioned a wind power project of capacity 26 MW in Jaisalmer, Rajasthan and has also concluded power procurement contracts for approximately 1,175MW across various states in India
Provided PMC services for setting up of 10.5 MW wind farm in Tamil Nadu and is working on a pilot project to harness 2 MW Solar power along the tracks of IR
Successfully implemented open access power supply for Railways in 12 entities across the country, covering 65% of energy requirement resulting in annual saving of INR 40,000 million to Indian Railways
Incorporated on December 30, 2010
Involved in the business of
Manufacturing and trading of railway wagons including high end specialized wagons, wagon prototypes, fabricated components/ parts of railway vehicles
Rehabilitation of wagons
SAIL and RITES holds 50% each in this Joint Venture
Achieved milestone of utilizing full capacity of manufacturing 100 wagons per month in the month of January 2019, producing 101 new BOXNHL wagons; cumulatively, produced 696 BOXNHL wagons and rehabilitated 313 BOXNR wagons in fiscal year 2018-19
Key Subsidiary and Joint Venture (JV)
8
2
Key Strengths

9
Comprehensive range of offerings and a diversified sector portfolio in the transport infrastructure space
Large order book with strong and diversified clientele base across sector
Experienced management personnel and technically qualified team
Preferred consultancy organization of the Government of India including the Indian Railways
Strong and consistent financial performance supported by robust internal control and risk management system
Technical expertise and business divisions with specialized domain knowledge
1
2
3
4
5
6
Key Strengths
10
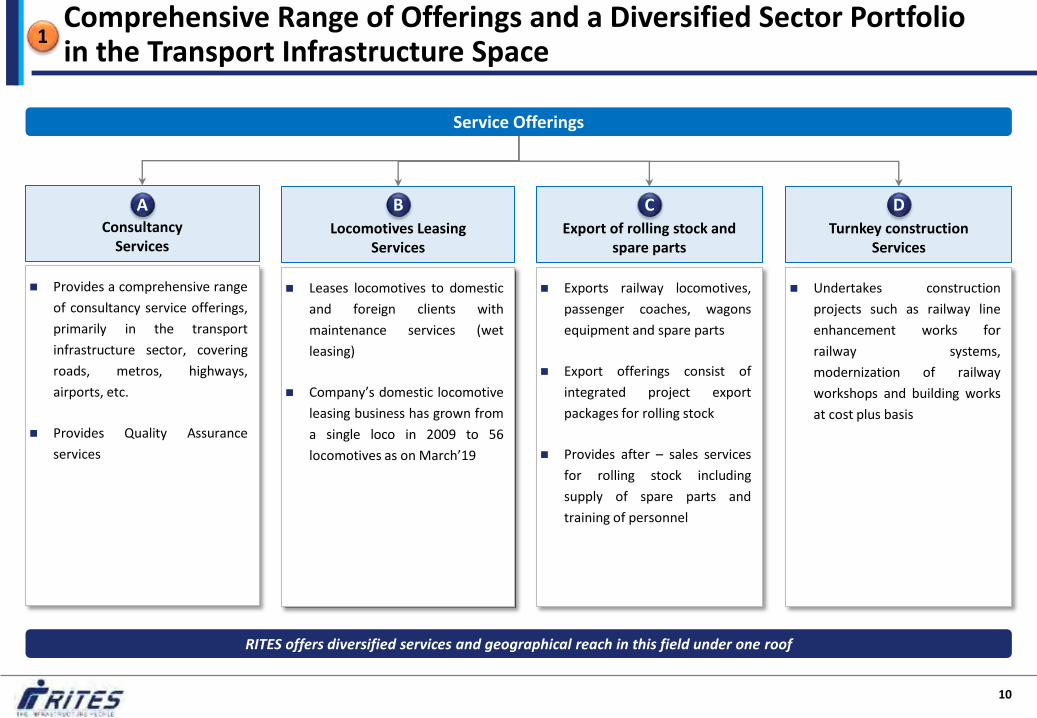
Service Offerings
Locomotives Leasing Services
Turnkey construction Services
Export of rolling stock and spare parts
Leases locomotives to domestic
and foreign clients with
maintenance services (wet
leasing)
Company’s domestic locomotive
leasing business has grown from
a single loco in 2009 to 56
locomotives as on March’19
Exports railway locomotives,
passenger coaches, wagons
equipment and spare parts
Export offerings consist of
integrated project export
packages for rolling stock
Provides after – sales services
for rolling stock including
supply of spare parts and
training of personnel
Undertakes construction
projects such as railway line
enhancement works for
railway systems,
modernization of railway
workshops and building works
at cost plus basis
Consultancy Services
Provides a comprehensive range
of consultancy service offerings,
primarily in the transport
infrastructure sector, covering
roads, metros, highways,
airports, etc.
Provides Quality Assurance
services
A B C D
RITES offers diversified services and geographical reach in this field under one roof
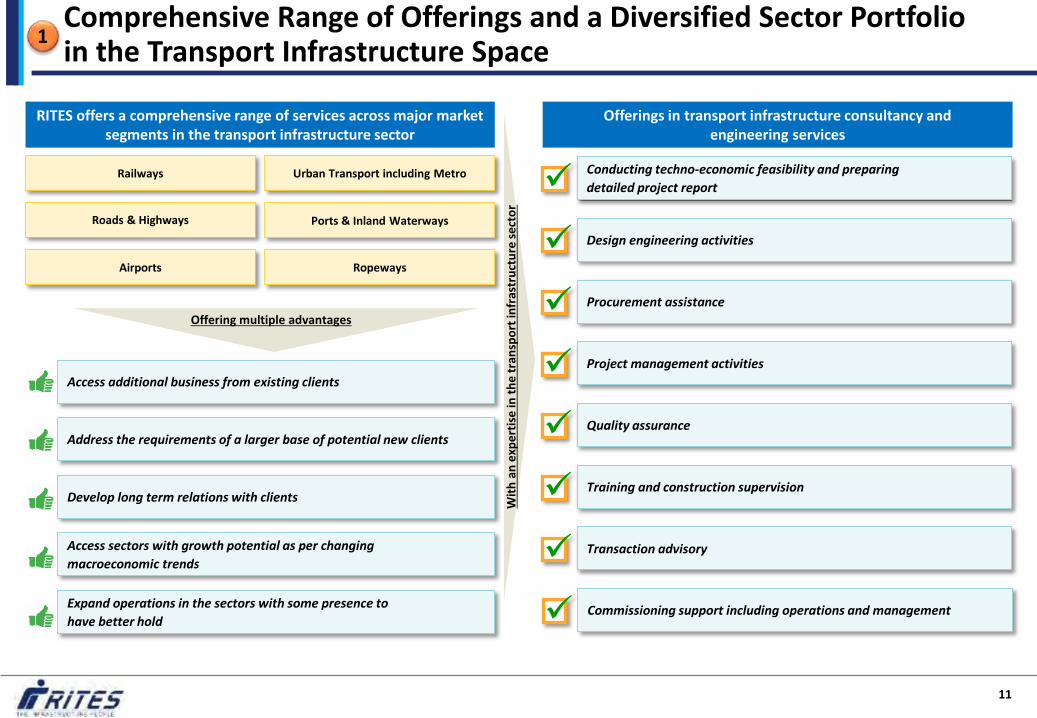
1 Comprehensive Range of Offerings and a Diversified Sector Portfolio in the Transport Infrastructure Space
11
RITES offers a comprehensive range of services across major market segments in the transport infrastructure sector
Urban Transport including Metro Railways
Ports & Inland Waterways Roads & Highways
Airports Ropeways
Offering multiple advantages
Access additional business from existing clients
Address the requirements of a larger base of potential new clients
Develop long term relations with clients
Access sectors with growth potential as per changing
macroeconomic trends
Expand operations in the sectors with some presence to
have better hold Commissioning support including operations and management
Conducting techno-economic feasibility and preparing
detailed project report
Design engineering activities
Procurement assistance
Project management activities
Quality assurance
Training and construction supervision
Transaction advisory
Wit
h a
n e
xpe
rtis
e in
th
e t
ran
spo
rt in
fras
tru
ctu
re s
ect
or
Offerings in transport infrastructure consultancy and engineering services
1 Comprehensive Range of Offerings and a Diversified Sector Portfolio in the Transport Infrastructure Space

12
Strong Order Book* indicating revenue visibility
Order Book Composition (as of December 31, 2019)
Total INR 57,823 Mn
Source: Company Stock Exchange Filings
Order Book Composition – Govt. vs Others (as of December 31, 2019)
2 Large Order Book With Strong and Diversified Clientele Base Across Sectors
Secured more than 250 projects/contracts including
enhanced scope during 9MFY20
Break-Up Of Order Book (INR Mn)
Services (As On) 31-Mar-2019 31-Dec-2019
Consultancy 23,170 25,302
Leasing Services 1,520 1,312
Export Sales 10,860 7,707
Turnkey Projects 25,420 22,642
REMCL - 860
Total 60,970 57,823
37,310
48,180
60,970 57,823
31-Mar-17 31-Mar-18 31-Mar-19 31-Dec-19
Order Book (INR Mn)
Total INR 57,823 Mn
Order book also includes US Dollar denominated projects and conversion to INR of such projects has been done at the time of award of the contract.; REMCL’s power procurement orders are annualised based on the last quarter’s procurement contracts and wind power generation.
44%
2% 13%
39%
2%
Consultancy Leasing Export Turnkey Projects REMCL
77%
23%
Central/State Govts. & PSUs Others
13
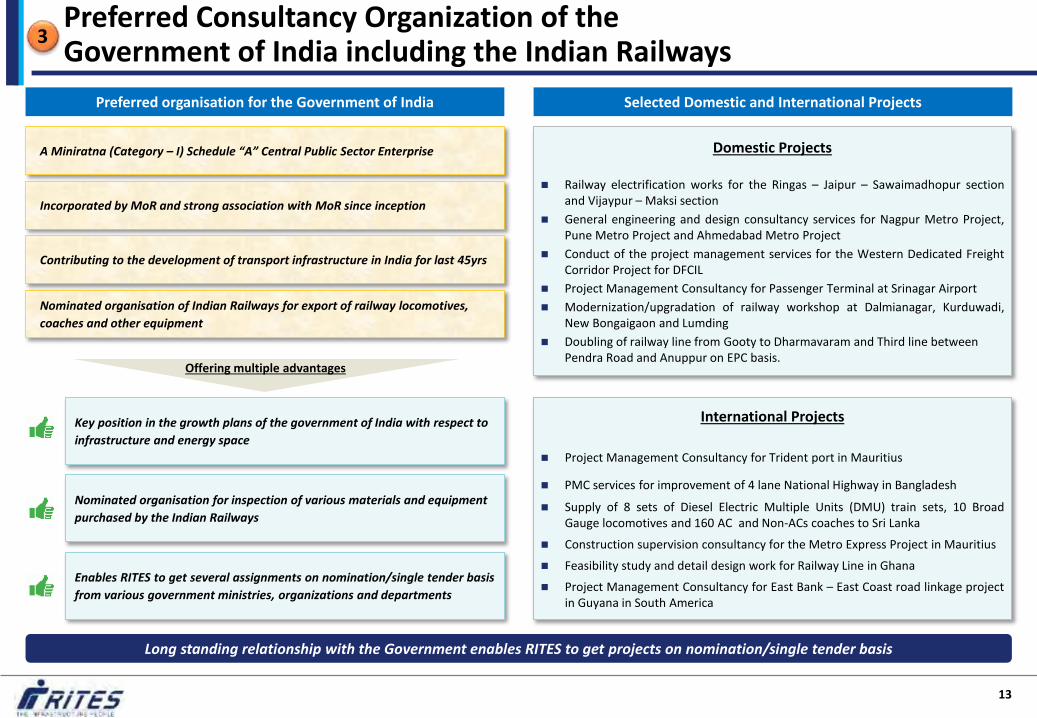
Preferred organisation for the Government of India
Long standing relationship with the Government enables RITES to get projects on nomination/single tender basis
A Miniratna (Category – I) Schedule “A” Central Public Sector Enterprise
Incorporated by MoR and strong association with MoR since inception
Contributing to the development of transport infrastructure in India for last 45yrs
Nominated organisation of Indian Railways for export of railway locomotives,
coaches and other equipment
Key position in the growth plans of the government of India with respect to
infrastructure and energy space
Nominated organisation for inspection of various materials and equipment
purchased by the Indian Railways
Enables RITES to get several assignments on nomination/single tender basis
from various government ministries, organizations and departments
Offering multiple advantages
Domestic Projects
Railway electrification works for the Ringas – Jaipur – Sawaimadhopur section and Vijaypur – Maksi section
General engineering and design consultancy services for Nagpur Metro Project, Pune Metro Project and Ahmedabad Metro Project
Conduct of the project management services for the Western Dedicated Freight Corridor Project for DFCIL
Project Management Consultancy for Passenger Terminal at Srinagar Airport
Modernization/upgradation of railway workshop at Dalmianagar, Kurduwadi, New Bongaigaon and Lumding
Doubling of railway line from Gooty to Dharmavaram and Third line between Pendra Road and Anuppur on EPC basis.
International Projects
Project Management Consultancy for Trident port in Mauritius
PMC services for improvement of 4 lane National Highway in Bangladesh
Supply of 8 sets of Diesel Electric Multiple Units (DMU) train sets, 10 Broad Gauge locomotives and 160 AC and Non-ACs coaches to Sri Lanka
Construction supervision consultancy for the Metro Express Project in Mauritius
Feasibility study and detail design work for Railway Line in Ghana
Project Management Consultancy for East Bank – East Coast road linkage project in Guyana in South America
3 Preferred Consultancy Organization of the Government of India including the Indian Railways
Selected Domestic and International Projects

14
Technical expertise housed in various business division with specialized domain knowledge across market segments
Rail Infrastructure Division
Provides consultancy services in:
Railway transportation and economics,
Electrical engineering, signal and telecommunications
Dedicated freight corridors
Track and survey,
Geo – technology and civil engineering design
Building and Airports Division
Provides consultancy services for construction of
institutional, commercial and residential
buildings and development of greenfield and
brownfield airports, airport terminals, ICDs, ICPs
and PMC services
Highways and Ports Division
Provides consultancy services for roads and highways including
Expressways, National and State Highways, rural roads including
bridges via ducts and tunnels, ports and harbours, water
resources engineering, inland water transport, including
preparation of feasibility studies, detailed project reports, PMC
services, Quality Assurance of such projects including safety
audits etc.
Urban Infrastructure Division
Provides PMC services in urban transport sector including General
Engineering Consultancy services for metro projects
Conducting urban and regional transport studies
Developing transport sector master plans, including traffic engineering
and management surveys
Expotech Division
Provides integrated export packages for railway
locomotives and rolling stock including, rehabilitation,
maintenance and spare part support
Also provides technical consultancy services for
workshop modernization, facility planning for rolling
stock maintenance, training of maintenance personnel
and related technology transfer
Technical Services Division
Provides consultancy services for design and development of rolling stock, procurement and logistics management
Wet leasing of locomotives
Also provides operation and maintenance services of railway sidings for various clients in the power, steel, mining, cement and port sector
Domain knowledge and technical expertise enhancement by participating in consortiums with several consulting partners from countries such as France, Japan, Austria, U.S.A, Germany and Denmark
Quality Assurance Division
Provides third party inspection and vendor assessment services
Clientele includes government ministries, departments,
instrumentalities, local govt. bodies, PSUs, IR and private sector
entities in India and abroad
Also provides laboratory testing services in India
4 Technical Expertise and Business Divisions with Specialized Domain Knowledge and Stringent Quality Controls
Note: PSU – Public Sector Undertakings; IR – Indian Railways, ICD – Inland Container Depot; ICP – Integrated Check Post; PMC – Project Management Consultancy

15
Board of Directors
Mr. Rajeev Mehrotra
Chairman & Managing Director and Chief Executive Officer
35+ years of experience with over 12 years at Board level with RITES
He holds a Bachelor’s Honors degree in Accountancy and Business Statistics from Rajasthan University and is qualified as a Fellow Member of the Institute of Cost
Accountants of India
Mr. Gopal Sureshkumar Varadarajan,
Director - Projects
30+ years of experience and associated with RITES since September 2018
He holds a first class Bachelor’s degree in civil engineering from REC (now National Institute of Technology) Trichy and Master’s in General Management from IIM
Indore
Mr. Anil Vij
Director - Technical
34+ years experience and associated with RITES since 2005
He possesses graduate qualification in three disciplines of engineering – Mechanical, Electrical and Electronics & Communications (Gold Medalist). He has also done
full time MBA at the Management Development Institute, Gurugram specialising in Operations & Finance
5 Experienced Management Personnel and Technically Qualified Team
Mr. B. P. Nayak
Director - Finance
34+ years experience and associated with RITES since November 2019
He is a qualified Cost Accountant. He has also done B.Tech. in Metallurgy from IIT, Kharagpur

1,985
171
1,130
No. of Employees – 3,286 (As of December 31,2019)
Regular Deputation ContractDr. Rajendra N Goyal, Independent Director 43+ years of experience He is an Emeritus Professor at I.I.T Roorkee and holds a doctorate of science degree from Agra University
and a doctorate of philosophy from Roorkee University. He has in the past held positions as faculty member, Head of Department in Chemistry Department and Dean Research at IIT Roorkee.
16
Board of Directors
Dr. Pramod Kumar Anand, Independent Director 31+ years of experience He is a retired IAS officer, holds a doctorate degree in Social Science from University of Rajasthan. He has
held positions as JS, Ministry of Rural Development and as Senior Adviser, Planning Commission
Ms. Geethakumary , Independent Director 21+ years of experience She is a practicing lawyer registered with the Bar Council of Kerala and holds a bachelors’ degree in law
from Mahatma Gandhi University, Kottayam. She has been the government pleader for Kerala State Insurance Department in Motor Accidents Claim Tribunal, Ernakulam.
…Supported by a strong in-house team
5 Experienced Management Personnel and Technically Qualified Team
Mr. Alok Kumar Tewari, Govt. Nominee Director
38+ years experience and associated with RITES since May’19 He is a Mechanical Engineer from Indian Railway Service of Mechanical Engineering (IRSME)
Mr. Satish Sareen, Independent Director 26+ years of experience He is a practising chartered accountant registered with the Institute of Chartered Accountants of India
Mr. Anil Kumar Goel, Independent Director 29+ years of experience He is a practising chartered accountant registered with the Institute of Chartered Accountants of India
…Increasing productivity every year
3.6 4.1
4.7 4.9
6.5
FY15 FY16 FY17 FY18 FY19
(INR Mn) Revenue per employee – Standalone
Mr. Vinay Srivastava, Govt. Nominee Director
26+ years experience and associated with RITES since Dec’19 He is a Mechanical Engineer from Jamalpur with a Masters Degree in Public Administration from Syracuse
University

17
5 …Senior Management with an Average Experience of About 33 Years
15+ yrs of experience. Associated with RITES since Feb’18
He holds a bachelors’ degree in commerce from Maharshi
Dayanand University, Rohtak and bachelors of law degree
from Ch. Charan Singh University, Meerut. He is a fellow of
the Institute of Company Secretaries of India.
36+ years of experience. Associated with RITES since
Oct’83
He holds a Bachelor’s degree in Civil Engineering from
Aligarh Muslim University and a Master’s degree in
Management and Systems from the IIT, Delhi
33+ yrs of experience. Associated with RITES since May’07
He holds a Bachelor’s degree in Mechanical Engineering
from AMIE. He also has a Special Class Railway Apprentice
from Indian Railways Institute of Mechanical and Electrical
Engineering, Jaipur
32+ yrs of experience. Associated with RITES since Oct’11
He holds a Bachelor’s degree in Mechanical Engineering
from IIT Delhi and MBA (Finance) from IGNOU, New Delhi
Mr Ashish Kumar
Srivastava
(Company Secretary)
Mr. Alok Garg
(Executive Director –
Transport Infra)
Mr. Virendra Singh
Executive Director -
Expotech)
Mr. S. C. Singhal
(Executive Director -
Quality Assurance)
30+ yrs of experience; Associated with RITES since Apr’09
He holds a Bachelor’s and Master’s degree in Economics
from Punjab University, Chandigarh and Post-Graduate
Diploma in Public Policy from Indian Institute of Public
Administration, New Delhi
Mr. Ved Prakash
(Executive Director –
Corporate Services)
36+ yrs of experience. Associated with RITES since Feb’88
He holds a Bachelor’s degree in Civil Engineering from IIT,
Roorkee (1981), Master’s degree in Transport Planning
from School of Planning and Architecture, New Delhi
(1983) and MBA Finance from IMT, Ghaziabad (2009)
Mr. Piyush Kansal
(Executive Director –
Urban Infra)
35+ years of experience
He holds a Bachelor’s degree in Civil Engineering and a
Master’s degree in Structures. He also holds a PGDM in
Alternate Dispute Resolution (ADR)
Mr. Rakesh Kapoor
(Executive Director -
Airport)
33+ yrs of experience. Associated with RITES since Nov’86
He holds a bachelors’ degree in commerce (hons) from
Delhi University and a Chartered Accountant. He is a fellow
member of Institute of Chartered Accountant.
Mr Parmod Narang
(Chief Financial
Officer)
35+ yrs of experience. Associated with RITES since Sept’07
He holds a Bachelor’s degree in Civil Engineering from
MNREC Allahabad and Master’s degree in Building Science
& Construction Management from IIT Delhi.
Mr. Sanjay Agrawal Executive Director – Regional Projects)
35+ years of experience. Associated with RITES since Jan’85
He holds a Diploma in Civil Engineering from Board of
Technical Education and AMIE equivalent to Graduation in
Civil Engineering from Institution of Engineers (India). He
also is a Fellow of Institution of Engineers (India)
Mr. Pawan Chowdhry
(Executive Director –P&C)
32+ yrs of experience. Associated with RITES since May’07
He holds AMIE (Mech) from Institution of Engineers (india)
and PGDFM from IGNOU
Mr. D. Mazumdar (Executive Director –Technical Services)
3,122 2,825 3,370 3,566
4,898
3,394
4,893
FY15 FY16 FY17 FY18 FY19 9MFY19 9MFY20
PAT (Rs. Mn)
4,944 4,899 5,546 5,662 7,760
5,355 7,191
FY15 FY16 FY17 FY18 FY19 9MFY19 9MFY20
EBITDA (Rs. Mn)
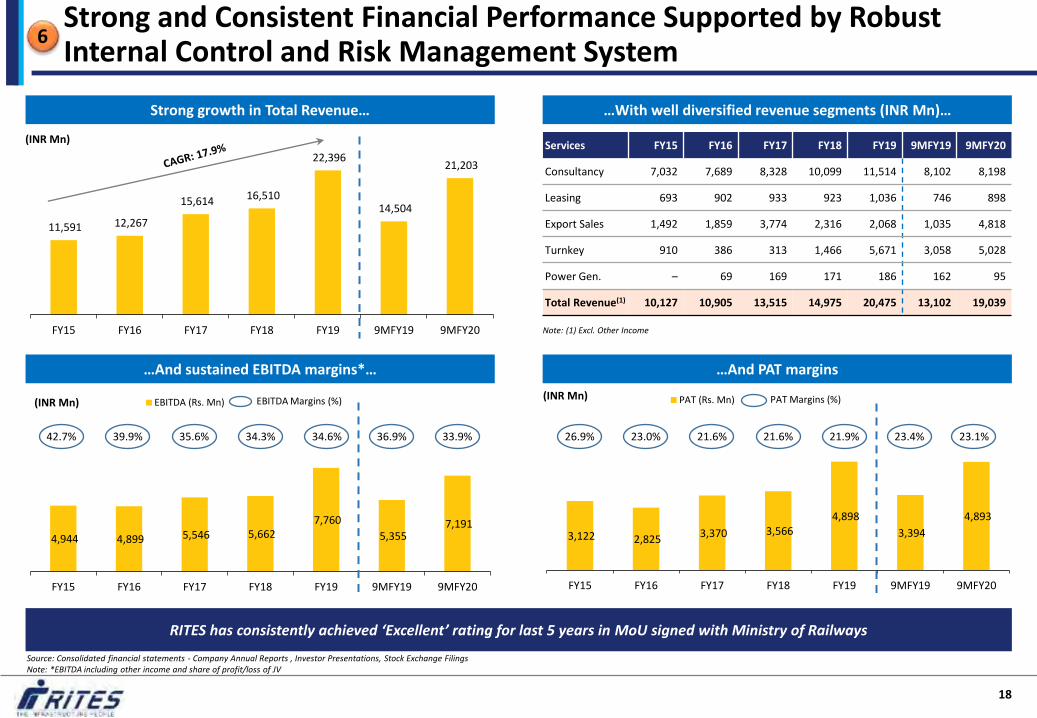
18
Strong growth in Total Revenue…
…And sustained EBITDA margins*…
…With well diversified revenue segments (INR Mn)…
…And PAT margins
RITES has consistently achieved ‘Excellent’ rating for last 5 years in MoU signed with Ministry of Railways
Source: Consolidated financial statements - Company Annual Reports , Investor Presentations, Stock Exchange Filings Note: *EBITDA including other income and share of profit/loss of JV
6 Strong and Consistent Financial Performance Supported by Robust Internal Control and Risk Management System
11,591 12,267
15,614 16,510
22,396
14,504
21,203
FY15 FY16 FY17 FY18 FY19 9MFY19 9MFY20
(INR Mn)
Note: (1) Excl. Other Income
(INR Mn)
Services FY15 FY16 FY17 FY18 FY19 9MFY19 9MFY20
Consultancy 7,032 7,689 8,328 10,099 11,514 8,102 8,198
Leasing 693 902 933 923 1,036 746 898
Export Sales 1,492 1,859 3,774 2,316 2,068 1,035 4,818
Turnkey 910 386 313 1,466 5,671 3,058 5,028
Power Gen. – 69 169 171 186 162 95
Total Revenue(1) 10,127 10,905 13,515 14,975 20,475 13,102 19,039
42.7% 39.9% 35.6% 34.3% 33.9%
EBITDA Margins (%)
26.9% 23.0% 21.6% 21.6% 23.1%
PAT Margins (%)
34.6% 21.9% 36.9% 23.4%
(INR Mn)
19
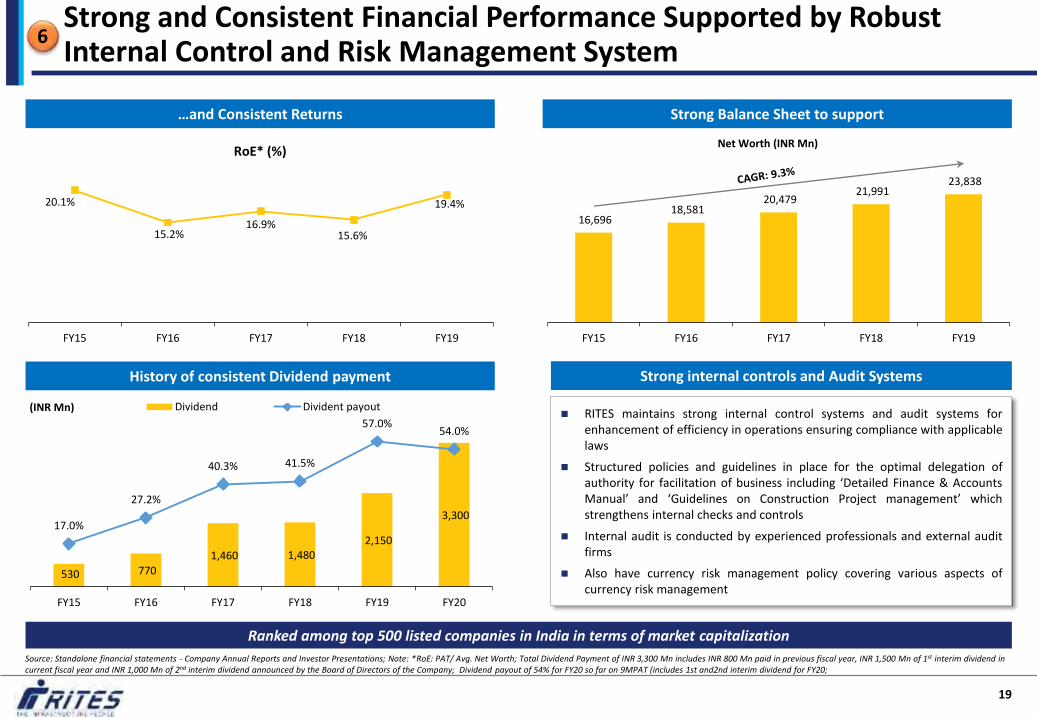
…and Consistent Returns
History of consistent Dividend payment
Strong Balance Sheet to support
20.1%
15.2% 16.9%
15.6%
19.4%
FY15 FY16 FY17 FY18 FY19
RoE* (%)
16,696 18,581
20,479 21,991
23,838
FY15 FY16 FY17 FY18 FY19
Net Worth (INR Mn)
530 770
1,460 1,480 2,150
3,300 17.0%
27.2%
40.3% 41.5%
57.0% 54.0%
FY15 FY16 FY17 FY18 FY19 FY20
Dividend Divident payout(INR Mn) RITES maintains strong internal control systems and audit systems for
enhancement of efficiency in operations ensuring compliance with applicable laws
Structured policies and guidelines in place for the optimal delegation of authority for facilitation of business including ‘Detailed Finance & Accounts Manual’ and ‘Guidelines on Construction Project management’ which strengthens internal checks and controls
Internal audit is conducted by experienced professionals and external audit firms
Also have currency risk management policy covering various aspects of currency risk management
Strong internal controls and Audit Systems
Ranked among top 500 listed companies in India in terms of market capitalization
Source: Standalone financial statements - Company Annual Reports and Investor Presentations; Note: *RoE: PAT/ Avg. Net Worth; Total Dividend Payment of INR 3,300 Mn includes INR 800 Mn paid in previous fiscal year, INR 1,500 Mn of 1st interim dividend in current fiscal year and INR 1,000 Mn of 2nd interim dividend announced by the Board of Directors of the Company; Dividend payout of 54% for FY20 so far on 9MPAT (includes 1st and2nd interim dividend for FY20;
6 Strong and Consistent Financial Performance Supported by Robust Internal Control and Risk Management System
20
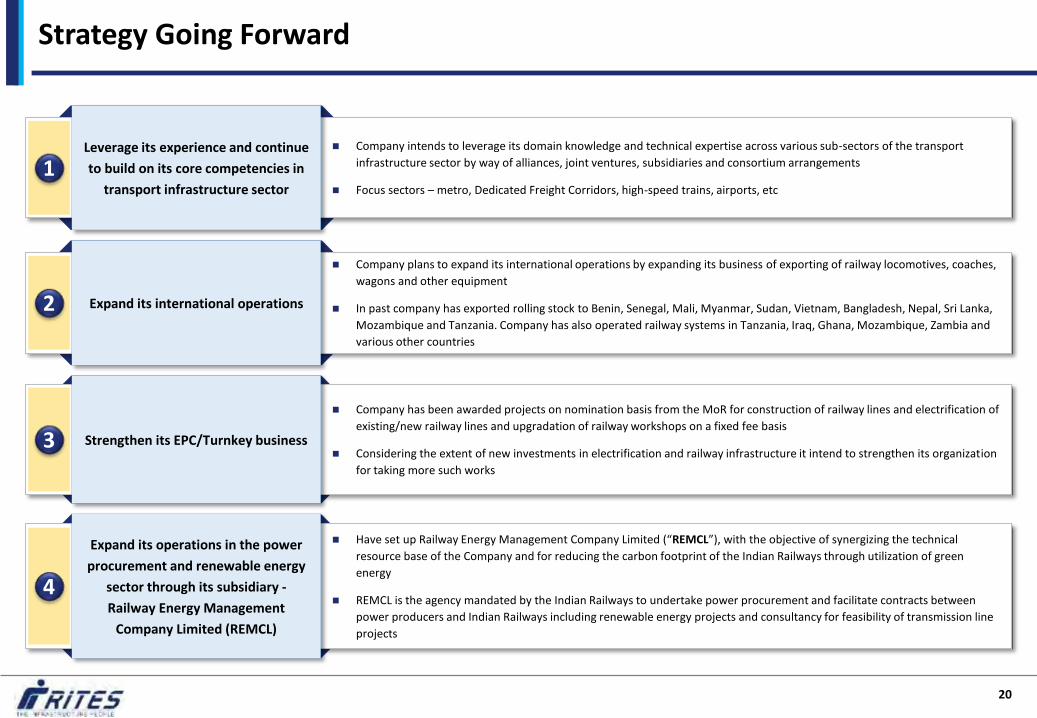
Company intends to leverage its domain knowledge and technical expertise across various sub-sectors of the transport
infrastructure sector by way of alliances, joint ventures, subsidiaries and consortium arrangements
Focus sectors – metro, Dedicated Freight Corridors, high-speed trains, airports, etc
Leverage its experience and continue
to build on its core competencies in
transport infrastructure sector 1
Company plans to expand its international operations by expanding its business of exporting of railway locomotives, coaches,
wagons and other equipment
In past company has exported rolling stock to Benin, Senegal, Mali, Myanmar, Sudan, Vietnam, Bangladesh, Nepal, Sri Lanka,
Mozambique and Tanzania. Company has also operated railway systems in Tanzania, Iraq, Ghana, Mozambique, Zambia and
various other countries
Expand its international operations 2
Company has been awarded projects on nomination basis from the MoR for construction of railway lines and electrification of
existing/new railway lines and upgradation of railway workshops on a fixed fee basis
Considering the extent of new investments in electrification and railway infrastructure it intend to strengthen its organization
for taking more such works
Strengthen its EPC/Turnkey business 3
Have set up Railway Energy Management Company Limited (“REMCL”), with the objective of synergizing the technical
resource base of the Company and for reducing the carbon footprint of the Indian Railways through utilization of green
energy
REMCL is the agency mandated by the Indian Railways to undertake power procurement and facilitate contracts between
power producers and Indian Railways including renewable energy projects and consultancy for feasibility of transmission line
projects
Expand its operations in the power
procurement and renewable energy
sector through its subsidiary -
Railway Energy Management
Company Limited (REMCL)
4
Strategy Going Forward
21
Awards & Recognitions
Key Growth Drivers for Transport Infrastructure Sector
Organisation Structure
Financial Statements
3
Appendix
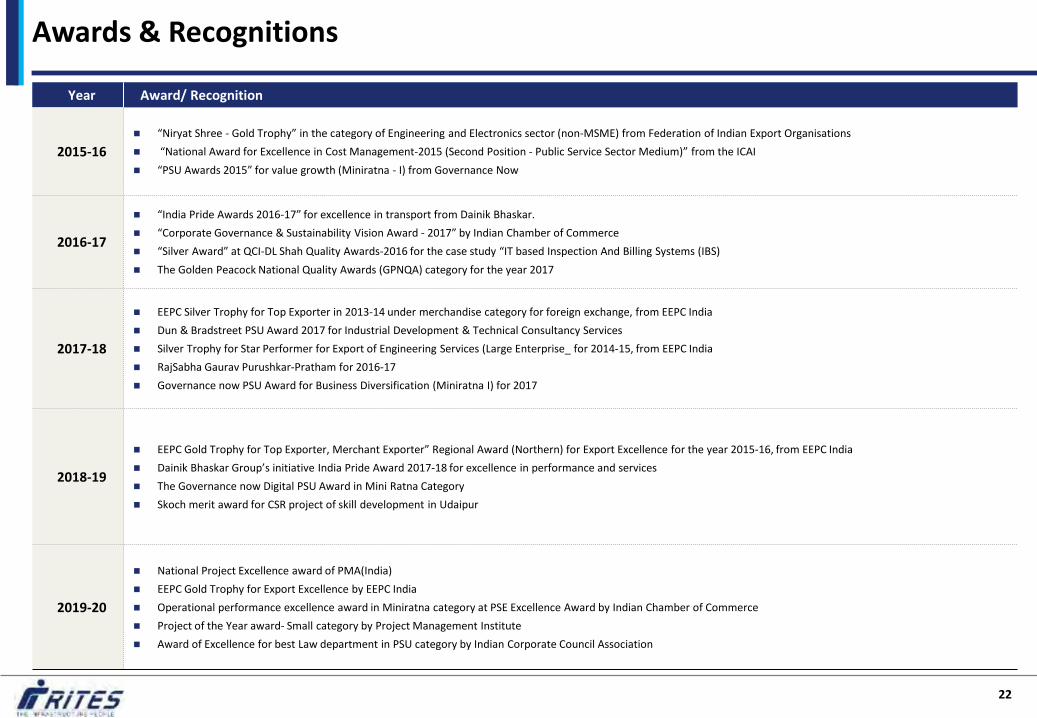
Awards & Recognitions
22
Year Award/ Recognition
2015-16
“Niryat Shree - Gold Trophy” in the category of Engineering and Electronics sector (non-MSME) from Federation of Indian Export Organisations
“National Award for Excellence in Cost Management-2015 (Second Position - Public Service Sector Medium)” from the ICAI
“PSU Awards 2015” for value growth (Miniratna - I) from Governance Now
2016-17
“India Pride Awards 2016-17” for excellence in transport from Dainik Bhaskar.
“Corporate Governance & Sustainability Vision Award - 2017” by Indian Chamber of Commerce
“Silver Award” at QCI-DL Shah Quality Awards-2016 for the case study “IT based Inspection And Billing Systems (IBS)
The Golden Peacock National Quality Awards (GPNQA) category for the year 2017
2017-18
EEPC Silver Trophy for Top Exporter in 2013-14 under merchandise category for foreign exchange, from EEPC India
Dun & Bradstreet PSU Award 2017 for Industrial Development & Technical Consultancy Services
Silver Trophy for Star Performer for Export of Engineering Services (Large Enterprise_ for 2014-15, from EEPC India
RajSabha Gaurav Purushkar-Pratham for 2016-17
Governance now PSU Award for Business Diversification (Miniratna I) for 2017
2018-19
EEPC Gold Trophy for Top Exporter, Merchant Exporter” Regional Award (Northern) for Export Excellence for the year 2015-16, from EEPC India
Dainik Bhaskar Group’s initiative India Pride Award 2017-18 for excellence in performance and services
The Governance now Digital PSU Award in Mini Ratna Category
Skoch merit award for CSR project of skill development in Udaipur
2019-20
National Project Excellence award of PMA(India)
EEPC Gold Trophy for Export Excellence by EEPC India
Operational performance excellence award in Miniratna category at PSE Excellence Award by Indian Chamber of Commerce
Project of the Year award- Small category by Project Management Institute
Award of Excellence for best Law department in PSU category by Indian Corporate Council Association
23
Awards & Recognitions
Key Growth Drivers for Transport Infrastructure Sector
Organisation Structure
Financial Statements
3
Appendix
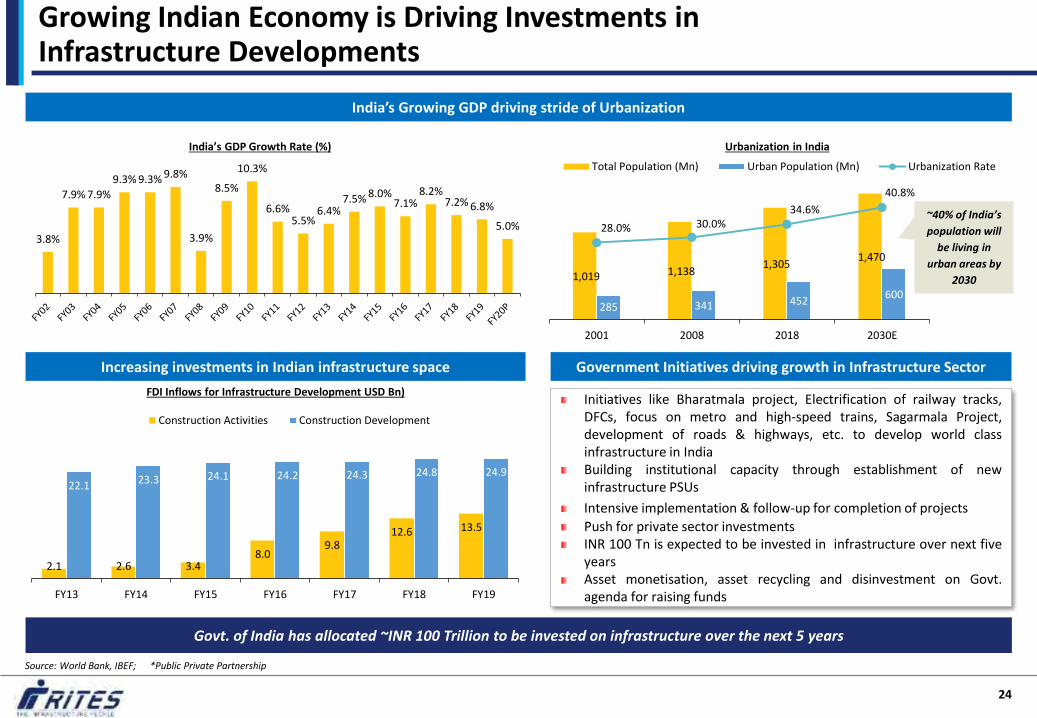
3.8%
7.9% 7.9%
9.3% 9.3% 9.8%
3.9%
8.5%
10.3%
6.6% 5.5%
6.4% 7.5% 8.0%
7.1% 8.2%
7.2% 6.8%
5.0%
24
India’s Growing GDP driving stride of Urbanization
Increasing investments in Indian infrastructure space
Govt. of India has allocated ~INR 100 Trillion to be invested on infrastructure over the next 5 years
India’s GDP Growth Rate (%)
1,019 1,138 1,305
1,470
285 341 452 600
28.0% 30.0% 34.6%
40.8%
2001 2008 2018 2030E
Total Population (Mn) Urban Population (Mn) Urbanization Rate
Urbanization in India
~40% of India’s
population will
be living in
urban areas by
2030
2.1 2.6 3.4 8.0
9.8 12.6 13.5
22.1 23.3 24.1 24.2 24.3 24.8 24.9
FY13 FY14 FY15 FY16 FY17 FY18 FY19
Construction Activities Construction Development
FDI Inflows for Infrastructure Development USD Bn)
Source: World Bank, IBEF; *Public Private Partnership
Growing Indian Economy is Driving Investments in Infrastructure Developments
Government Initiatives driving growth in Infrastructure Sector
Initiatives like Bharatmala project, Electrification of railway tracks, DFCs, focus on metro and high-speed trains, Sagarmala Project, development of roads & highways, etc. to develop world class infrastructure in India Building institutional capacity through establishment of new infrastructure PSUs
Intensive implementation & follow-up for completion of projects
Push for private sector investments INR 100 Tn is expected to be invested in infrastructure over next five years Asset monetisation, asset recycling and disinvestment on Govt. agenda for raising funds

25
India’s infrastructure investments since fiscal 2013 (INR Trillion)
National Infrastructure Pipeline - Sector wise breakup of Capital Expenditure of ~INR 100 Trillion during FY 20-25
Infrastructure Vision 2025 Meeting Aspirations, propelling growth, facilitating ease of living
1.4 1.6 1.7 2 2.3 3.9 3.8
2.4 2.7 3 3.5
4.3
3.8 3.7 1.5
2 2.3
3 2.6
2.5 2.5
5.3 6.3
7
8.5 9.2
10.2 10
FY13 FY14 FY15 FY16 FY17 FY18E FY19E
Center State Private Total
Sector-wise share of infra. investments of INR 80 Trillion made during FY 08 - FY 19
32%
18% 13%
13%
10%
9%
1% 1%
3% Power
Road & Bridges
Urban
Telecommunication
Railways
Irrigation
Airport
Ports
Others
39%
39%
22% Center
State
Private
Energy 24%
Roads 19%
Railways 13%
Ports 1%
Airports 1%
Urban 16%
Others 26%
Energy
Roads
Railways
Ports
Airports
Urban
Others
Share of Centre, states and the private sector in the NIP
Source: https://pib.gov.in
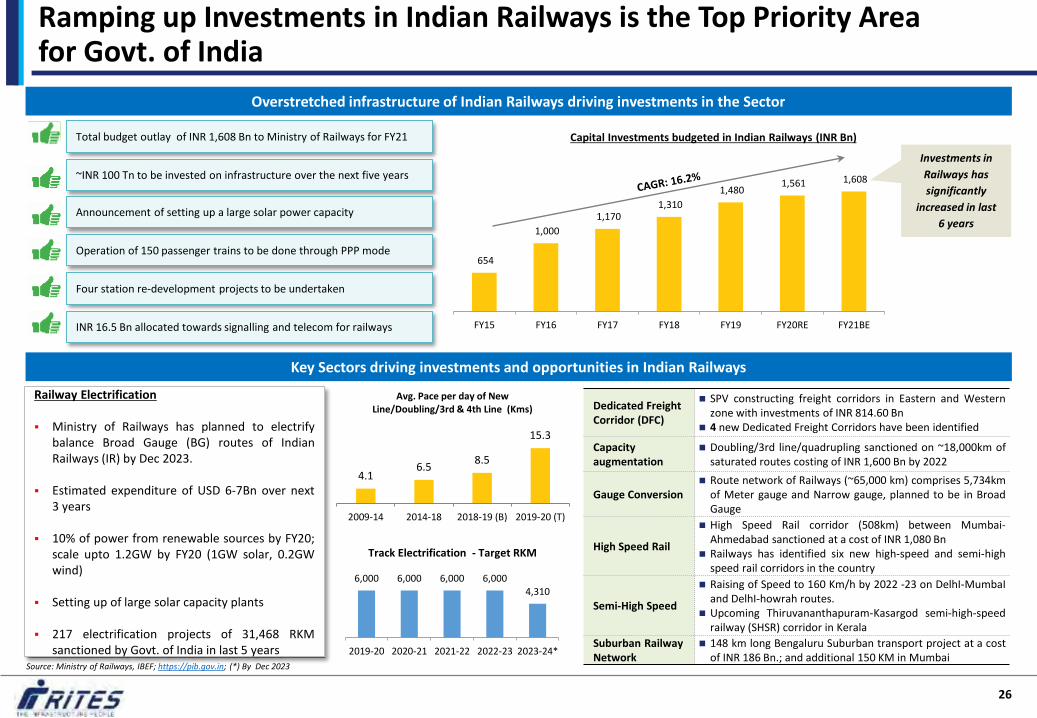
654
1,000
1,170 1,310
1,480 1,561 1,608
FY15 FY16 FY17 FY18 FY19 FY20RE FY21BE
26
Overstretched infrastructure of Indian Railways driving investments in the Sector
Key Sectors driving investments and opportunities in Indian Railways
Investments in
Railways has
significantly
increased in last
6 years
Capital Investments budgeted in Indian Railways (INR Bn)
Dedicated Freight Corridor (DFC)
SPV constructing freight corridors in Eastern and Western zone with investments of INR 814.60 Bn
4 new Dedicated Freight Corridors have been identified
Capacity augmentation
Doubling/3rd line/quadrupling sanctioned on ~18,000km of saturated routes costing of INR 1,600 Bn by 2022
Gauge Conversion Route network of Railways (~65,000 km) comprises 5,734km
of Meter gauge and Narrow gauge, planned to be in Broad Gauge
High Speed Rail
High Speed Rail corridor (508km) between Mumbai-Ahmedabad sanctioned at a cost of INR 1,080 Bn
Railways has identified six new high-speed and semi-high speed rail corridors in the country
Semi-High Speed
Raising of Speed to 160 Km/h by 2022 -23 on DelhI-MumbaI and DelhI-howrah routes.
Upcoming Thiruvananthapuram-Kasargod semi-high-speed railway (SHSR) corridor in Kerala
Suburban Railway Network
148 km long Bengaluru Suburban transport project at a cost of INR 186 Bn.; and additional 150 KM in Mumbai
Source: Ministry of Railways, IBEF; https://pib.gov.in; (*) By Dec 2023
Ramping up Investments in Indian Railways is the Top Priority Area for Govt. of India
Total budget outlay of INR 1,608 Bn to Ministry of Railways for FY21
~INR 100 Tn to be invested on infrastructure over the next five years
Announcement of setting up a large solar power capacity
Operation of 150 passenger trains to be done through PPP mode
Four station re-development projects to be undertaken
INR 16.5 Bn allocated towards signalling and telecom for railways
4.1 6.5
8.5
15.3
2009-14 2014-18 2018-19 (B) 2019-20 (T)
Avg. Pace per day of New Line/Doubling/3rd & 4th Line (Kms)
Railway Electrification
Ministry of Railways has planned to electrify balance Broad Gauge (BG) routes of Indian Railways (IR) by Dec 2023.
Estimated expenditure of USD 6-7Bn over next 3 years
10% of power from renewable sources by FY20; scale upto 1.2GW by FY20 (1GW solar, 0.2GW wind)
Setting up of large solar capacity plants
217 electrification projects of 31,468 RKM sanctioned by Govt. of India in last 5 years
6,000 6,000 6,000 6,000 4,310
2019-20 2020-21 2021-22 2022-23 2023-24*
Track Electrification - Target RKM

27
Sustained economic growth has brought about a remarkable development expansion in infrastructure of the road sector
Road Sector outlook
Overview of Road Infrastructure in India as of FY19 (% of total Kms) – 5.5 Mn kms
Budgetary Outlay for Roads (INR Bn) Actual Physical Progress in Roads (in ‘000 km)
2.8% 2.2%
95.0%
National Highways/Expressways
State Highways
Other District/ RuralRoads
428
580 649
786 830 918
FY16 FY17 FY18 FY19 FY20E FY21E
8.0 10.1
15.9 17.1
5.5 4.4
6.1 8.2
9.8 10.8
55.3% 60.0% 51.6% 57.5%
197.4%
FY15 FY16 FY17 FY18 FY19
Awarded LengthConstructed% of Constructed/Awarded Length
5,676
2,500
6,616
7,626
4,299 3,338
5,396 5,656
FY18 FY19 FY20P FY21P
Awarded (Km) Constructed (Km)
GOI aims to boost public and private investment in roads sector through various schemes such as NHDP, PMGSY, Bharat Mala scheme, etc. along with introducing business-friendly strategies that will balance profitability with effective project execution
NHAI Plans
1,200
2,790
728
3,800 4,396
1,582
NH State Roads Rural Roads
FY12-FY16 FY17-FY21
Investment Plans (INR Bn)
49% of the
proposed
investments for
NH are expected
from the private
sector
Roads and Highway Sector Today Dominates the Government’s Planned Expenditure Amongst Other Key Infrastructure Segments
MoRTH had
declared FY19 as
the
‘Year of
Construction’
which led to
increased focus
on completion of
pending projects
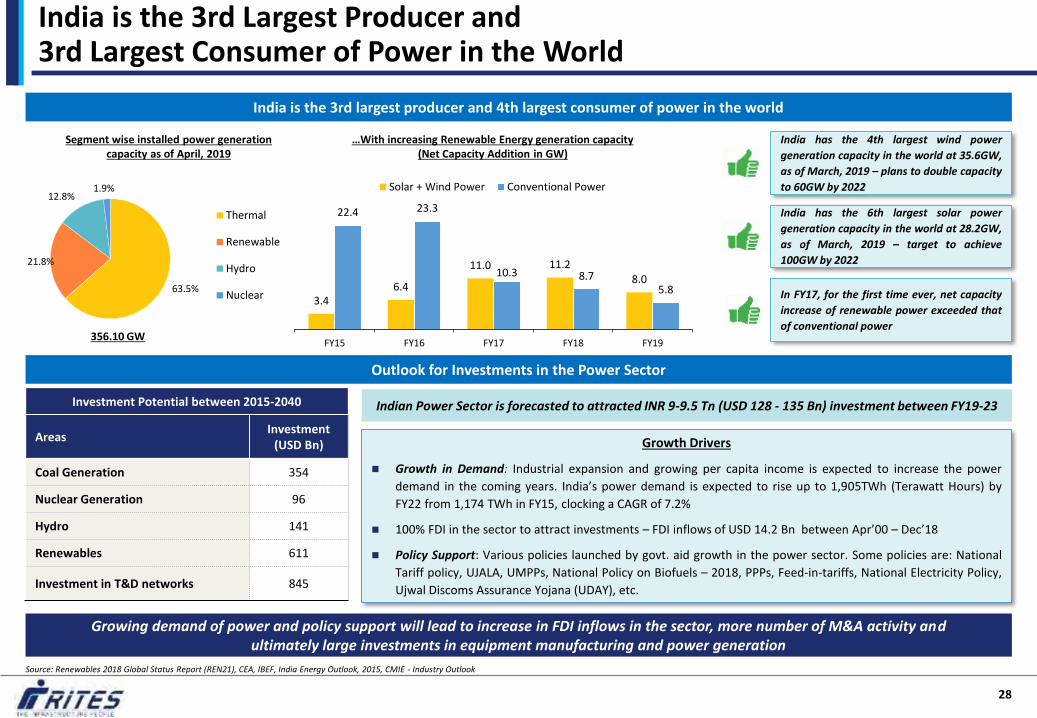
Growth Drivers
Growth in Demand: Industrial expansion and growing per capita income is expected to increase the power
demand in the coming years. India’s power demand is expected to rise up to 1,905TWh (Terawatt Hours) by
FY22 from 1,174 TWh in FY15, clocking a CAGR of 7.2%
100% FDI in the sector to attract investments – FDI inflows of USD 14.2 Bn between Apr’00 – Dec’18
Policy Support: Various policies launched by govt. aid growth in the power sector. Some policies are: National
Tariff policy, UJALA, UMPPs, National Policy on Biofuels – 2018, PPPs, Feed-in-tariffs, National Electricity Policy,
Ujwal Discoms Assurance Yojana (UDAY), etc.
28
India is the 3rd largest producer and 4th largest consumer of power in the world
Outlook for Investments in the Power Sector
Investment Potential between 2015-2040
Areas Investment
(USD Bn)
Coal Generation 354
Nuclear Generation 96
Hydro 141
Renewables 611
Investment in T&D networks 845
Growing demand of power and policy support will lead to increase in FDI inflows in the sector, more number of M&A activity and ultimately large investments in equipment manufacturing and power generation
Source: Renewables 2018 Global Status Report (REN21), CEA, IBEF, India Energy Outlook, 2015, CMIE - Industry Outlook
India has the 4th largest wind power
generation capacity in the world at 35.6GW,
as of March, 2019 – plans to double capacity
to 60GW by 2022
India has the 6th largest solar power
generation capacity in the world at 28.2GW,
as of March, 2019 – target to achieve
100GW by 2022
In FY17, for the first time ever, net capacity
increase of renewable power exceeded that
of conventional power
63.5%
21.8%
12.8% 1.9%
Thermal
Renewable
Hydro
Nuclear
Segment wise installed power generation capacity as of April, 2019
…With increasing Renewable Energy generation capacity (Net Capacity Addition in GW)
356.10 GW
3.4 6.4
11.0 11.2 8.0
22.4 23.3
10.3 8.7 5.8
FY15 FY16 FY17 FY18 FY19
Solar + Wind Power Conventional Power
India is the 3rd Largest Producer and 3rd Largest Consumer of Power in the World
Indian Power Sector is forecasted to attracted INR 9-9.5 Tn (USD 128 - 135 Bn) investment between FY19-23
29
Source: MoUD
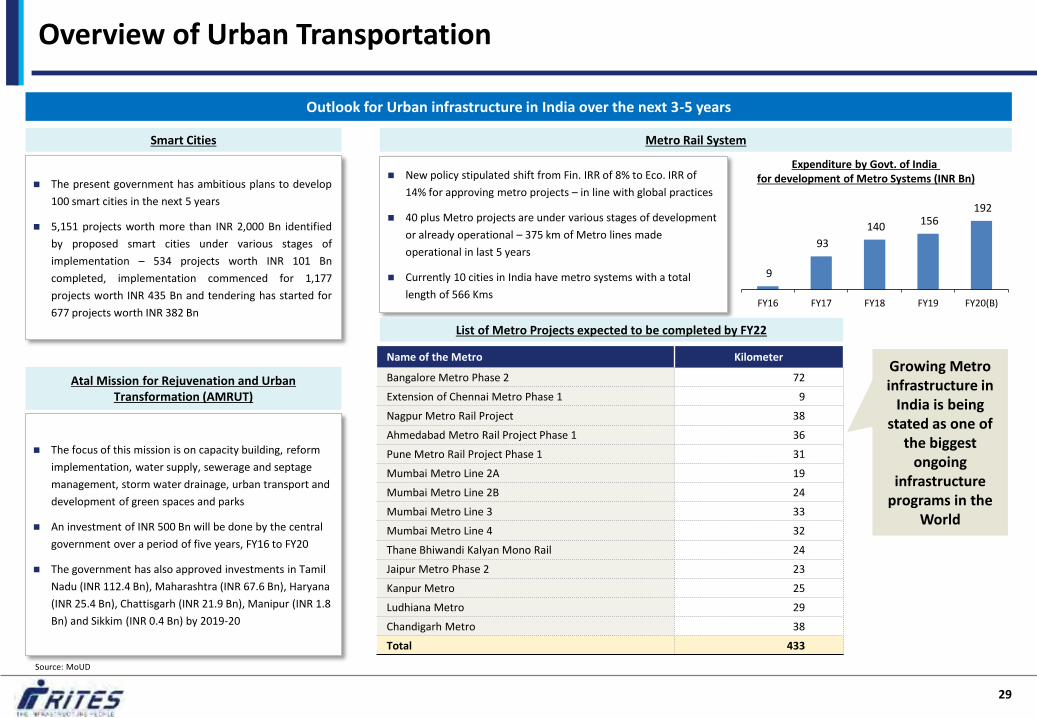
Overview of Urban Transportation
Outlook for Urban infrastructure in India over the next 3-5 years
The present government has ambitious plans to develop
100 smart cities in the next 5 years
5,151 projects worth more than INR 2,000 Bn identified
by proposed smart cities under various stages of
implementation – 534 projects worth INR 101 Bn
completed, implementation commenced for 1,177
projects worth INR 435 Bn and tendering has started for
677 projects worth INR 382 Bn
Smart Cities
The focus of this mission is on capacity building, reform
implementation, water supply, sewerage and septage
management, storm water drainage, urban transport and
development of green spaces and parks
An investment of INR 500 Bn will be done by the central
government over a period of five years, FY16 to FY20
The government has also approved investments in Tamil
Nadu (INR 112.4 Bn), Maharashtra (INR 67.6 Bn), Haryana
(INR 25.4 Bn), Chattisgarh (INR 21.9 Bn), Manipur (INR 1.8
Bn) and Sikkim (INR 0.4 Bn) by 2019-20
Atal Mission for Rejuvenation and Urban Transformation (AMRUT)
New policy stipulated shift from Fin. IRR of 8% to Eco. IRR of
14% for approving metro projects – in line with global practices
40 plus Metro projects are under various stages of development
or already operational – 375 km of Metro lines made
operational in last 5 years
Currently 10 cities in India have metro systems with a total
length of 566 Kms
Metro Rail System
Name of the Metro Kilometer
Bangalore Metro Phase 2 72
Extension of Chennai Metro Phase 1 9
Nagpur Metro Rail Project 38
Ahmedabad Metro Rail Project Phase 1 36
Pune Metro Rail Project Phase 1 31
Mumbai Metro Line 2A 19
Mumbai Metro Line 2B 24
Mumbai Metro Line 3 33
Mumbai Metro Line 4 32
Thane Bhiwandi Kalyan Mono Rail 24
Jaipur Metro Phase 2 23
Kanpur Metro 25
Ludhiana Metro 29
Chandigarh Metro 38
Total 433
List of Metro Projects expected to be completed by FY22
9
93
140 156 192
FY16 FY17 FY18 FY19 FY20(B)
Expenditure by Govt. of India for development of Metro Systems (INR Bn)
Growing Metro infrastructure in
India is being stated as one of
the biggest ongoing
infrastructure programs in the
World

India set to become 3rd largest aviation market by 2020
India’s aviation industry is expected to witness INR 1,000 Bn of investments over the next 5 years
Govt. of India has granted "in principle" approval for setting up of 19 Greenfield airports – 7 of which will be developed on PPP model
Over 30 airport development projects under progress across various regions of Northeast India. AAI plans to develop Guwahati as an inter-regional hub and Agartala, Imphal and Dibrugarh as intra-regional hubs
Additionally, GOI has announced setting up of 100 new airports by 2024
UDAN scheme has been introduced to enhance regional connectivity and 43 cities are expected to be mainstreamed on India’s flight connectivity grid
30
Outlook for Investments in Airport Infrastructure Outlook for Investments in Port Infrastructure
Source: Ministry of Civil Aviation, Airports Authority of India, IBEF
India has 12 major ports. Under the National Perspective Plan for Sagarmala, six
new mega ports will be developed in the country. 189 projects worth USD 22 Bn
envisioned for modernisation of ports In FY 18, major ports in India handled 679.36 million tones (MT) of cargo traffic,
implying a CAGR of 2.73% during FY 08-18. In Q1 FY19 traffic increased 3.91% year
on year to 174.02 million tonnes (MT) Major ports has capacity of 1,452MT at the end of FY18. The Maritime Agenda
2010 – 20 has a 2020 target of 3,130MT of port capacity The Central Government plans to develop 10 coastal regions as part of plans to
revive country’s Sagarmala (string of ports) project In March/May 2018, Ministry of Shipping allowed foreign flagged ships to carry containers for trans-shipment. Revised Model Concession Agreement (MCA) was approved to make port projects more investor friendly
Greenfield Airport Investments (Recently Inaugurated/Proposed)
Sr. No. Location Estimated (INR Bn)
1. Mopa, Goa 31.0 2. Navi Mumbai, Maharashtra 167.0 3. Shirdi, Maharashtra 3.2 4. Sindhudurg, Maharashtra 5.2 5. Bijapur, Karnataka 1.5 6. Gulburga, Karnataka 0.1 7. Hassan, Karnataka 5.9 8. Shimoga, Karnataka 0.4 9. Kannur, Kerala 18.9
10. Durgapur, West Bengal 6.7 11. Dabra, Madhya Pradesh 2.0 12. Pakyoong, Sikkim 5.5 13. Karaikal, Pudhucherry 1.7 14. Kushinagar, Uttar Pradesh 4.5 15. Dholera, Gujarat 17.1 16. Degadarthi Mandal, Andhra Pradesh 2.9 17. Bhogapuram, Andhra Pradesh 22.6 18. Oravakallu, Andhra Pradesh 2.0 19. Jewar, Uttar Pradesh 19.0
Total 317.2
Airports and Ports
Outlook for Investments in Integrated Check Post
Under Phase-I of development of ICPs, Land Post Authority of India has already made
6 ICPs operational and 1 ICP at Dawki is under development
In Phase-II, GoI has approved proposals to develop 13 more integrated check posts at
various border location i.e. 1 at Bhutan border, 5 at Nepal border, 7 at Bangladesh
border – estimated expenditure to be INR 50 Bn
Further GoI is planning to set 19 ICPs along the border of Bangladesh, 7 in West Bengal,
3 in Assam, 3 in Meghalaya and 7 in Tripura

31
Awards & Recognitions
Key Growth Drivers for Transport Infrastructure Sector
Organisation Structure
Financial Statements
3
Appendix

Organization Structure
32
Workshops
Rolling Stock Design
Material Service Management
Railway Equipment Services
Executive Director – Technical Services
Board of Directors
Chairman and Managing Director
Director (Projects) Director (Technical) Director (Finance) Chief Vigilance Officer
Executive Director – Rail Infrastructure
Executive Director – Urban Infrastructure
Executive Director – Expotech
Executive Director – Quality Assurance
Executive Director – Privatisation & Concessioning Vigilance
Executive Director – Corporate Services
Expotech Project Office - Delhi
Project Office - Lucknow
Project Office – Secundarabad
Project Office – Nagpur
Project Office – Kolkata
Project Office – Bhubaneswar
Project Office – Raigarh
Track & Survey
Tunneling and Geotech
Railway Civil Engineering Design
Electrical Engineering
Signal & Telecom Engineering
Transport & Economics
Special Project/DFCC
Executive Director/ Business Development/
North East
Urban Transport
General Consultancy/ Delhi/ Nagpur/ Ahmedabad
Urban Infrastructure/ Mumbai
Project Office - Ahmedabad
Building Projects
Airports
Executive Director – Building & Airports
Executive Director – Highway & Ports
Corporate Quality Assurance
Inspection Office/Northern Region/Delhi
Inspection Office/Western Region/Mumbai
Inspection Office/Southern Region/Chennai
Inspection Office/Eastern Region/Kolkata
Inspection Office/Central Region/Bhilai
Highway Design
Highway Construction. Supervision
Highway Design & Supervision/ Kolkata
Ports & Waterways
Privatisation & Concessioning
Information Technology
Marketing & Corporate Communication
Advertisement Revenue Cell
Corporate Finance
Company Secretary & Legal
Corporate Social Responsibility
Personnel
Administration
Corporate Training
Railway Energy Management Company Ltd.
RITES AFRIKA
Subsidiary Companies
Joint Ventures
SAIL RITES Bengal Wagon Ind. Pvt. Ltd.
BNV Gujarat Rail Private Limited

33
Awards & Recognitions
Key Growth Drivers for Transport Infrastructure Sector
Organisation Structure
Financial Statements
3
Appendix

(INR Mn) 9MFY20 FY19 FY18 FY17 FY16 FY15
Revenue:
Revenue from operations 19,037 20,475 14,975 13,515 10,905 10,127
Other income 2,166 1,922 1,535 2,099 1,362 1,464
Total revenue 21,203 22,396 16,510 15,614 12,267 11,591
Expenditure:
Employee benefit expenses 3,887 4,871 4,588 4,170 3,410 3,245
Travel 369 495 414 395 355 325
Supplies & services 1,316 1,675 1,267 1,222 1,047 843
Cost of export Purchase 3,070 1,267 1,532 2,530 1,396 776
Cost of turnkey construction projects 4,562 5,165 1,308 279 353 835
Transmission and whelling charges 38 51 48 38 22 –
Finance costs 49 75 113 124 47 –
Depreciation & amortisation expenses 341 384 363 383 346 262
Other expenses 823 1,196 1,670 1,314 759 635
Total expenditure 14,454 15,178 11,303 10,453 7,735 6,919
Profit before share of profit/(loss) of joint ventures, exceptional items and tax from continuing operations
6,748 7,218 5,207 5,161 4,532 4,672
Share of profit/(loss) of joint ventures 53 82 (21) (115) (26) 10
Profit before tax 6,801 7,301 5,186 5,046 4,506 4,682
Tax expenses
- Current tax (1,493) (2,591) (1,873) (1,554) (1,490) (1,424)
- Deferred tax (net) (415) 188 253 (121) (187) (136)
Profit after tax from continuing operations 4,893 4,898 3,566 3,371 2,829 3,122
Discontinued operations:
Loss before tax from discontinued operations - - - (1) (4) –
Tax expenses of discontined operations - - - - (0) –
Loss from discontinued operations - - - (1) (4) –
Profit/(loss) for the year 4,893 4,898 3,566 3,370 2,825 3,122
34
Summary Statement Of Profit And Loss (Consolidated)
Source: Annual Reports; All numbers rounded off to nearest decimal

35
(INR Mn) H1FY20 FY19 FY18 FY17 FY16 FY15
Property, plant and equipment 5,133 4,765 4,000 4,035 4,154 2,057
Right of use Assets 217 - - - - -
Capital work in progress 55 23 4 42 70 257
Investment property 8 8 12 13 13 13
Intangible assets 6 6 9 17 31 48
Intangible assets under development 16 16 16 16 16 7
Investment in joint ventures applying equity method 235 212 128 148 306 258
Financial assets 1,606 1,806 2,643 3,744 3,771 5,494
Deferred tax assets (net) 326 719 531 278 275 462
Other non current assets 999 1,248 1,195 1,320 906 1,210
Total Non Current Assets 8,601 8,804 8,538 9,613 9,541 9,807
Inventories 821 1,049 94 504 131 67
Financial assets
Investments - - - 1,930 500 –
Trade receivables 8,719 6,095 4,677 4,652 5,355 3,808
Cash and cash equivalents-owned fund 587 1,690 1,452 2,647 2,620 2,570
Cash and cash equivalents-clients fund 4,286 4,916 5,928 3,334 1,904 1,994
Other bank balances-owned fund 12,231 11,335 12,734 6,300 4,654 4,644
Other bank balances-clients fund 16,817 17,174 15,845 16,591 16,368 11,391
Loans 153 131 65 149 72 122
Other financial assets 2,094 1,733 1,165 1,676 1,735 1,351
Current tax assets (net) 915 509 368 103 387 16
Other current assets 829 878 835 593 825 286
Total Current Assets 47,452 45,511 43,161 38,479 34,548 26,247
Total Assets 56,053 54,315 51,699 48,091 44,089 36,054
Summary Statement Of Assets (Consolidated)
Source: Annual Reports; All numbers rounded off to nearest decimal
36
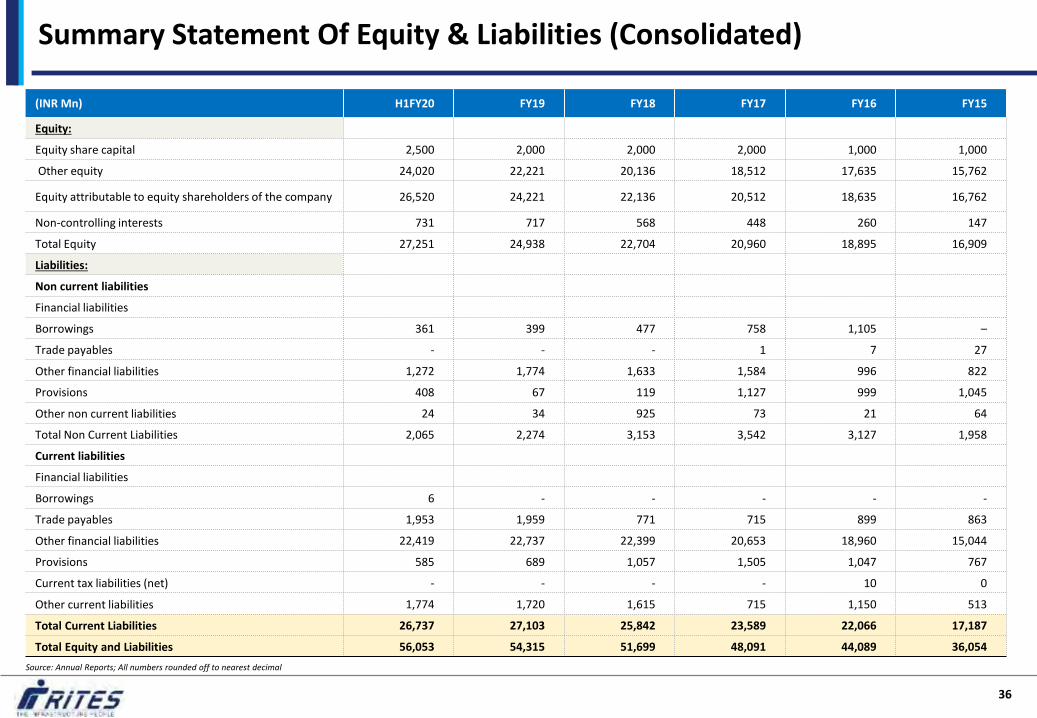
(INR Mn) H1FY20 FY19 FY18 FY17 FY16 FY15
Equity:
Equity share capital 2,500 2,000 2,000 2,000 1,000 1,000
Other equity 24,020 22,221 20,136 18,512 17,635 15,762
Equity attributable to equity shareholders of the company 26,520 24,221 22,136 20,512 18,635 16,762
Non-controlling interests 731 717 568 448 260 147
Total Equity 27,251 24,938 22,704 20,960 18,895 16,909
Liabilities:
Non current liabilities
Financial liabilities
Borrowings 361 399 477 758 1,105 –
Trade payables - - - 1 7 27
Other financial liabilities 1,272 1,774 1,633 1,584 996 822
Provisions 408 67 119 1,127 999 1,045
Other non current liabilities 24 34 925 73 21 64
Total Non Current Liabilities 2,065 2,274 3,153 3,542 3,127 1,958
Current liabilities
Financial liabilities
Borrowings 6 - - - - -
Trade payables 1,953 1,959 771 715 899 863
Other financial liabilities 22,419 22,737 22,399 20,653 18,960 15,044
Provisions 585 689 1,057 1,505 1,047 767
Current tax liabilities (net) - - - - 10 0
Other current liabilities 1,774 1,720 1,615 715 1,150 513
Total Current Liabilities 26,737 27,103 25,842 23,589 22,066 17,187
Total Equity and Liabilities 56,053 54,315 51,699 48,091 44,089 36,054
Summary Statement Of Equity & Liabilities (Consolidated)
Source: Annual Reports; All numbers rounded off to nearest decimal
(INR Mn) H1FY20 FY19 FY18 FY17 FY16 FY15
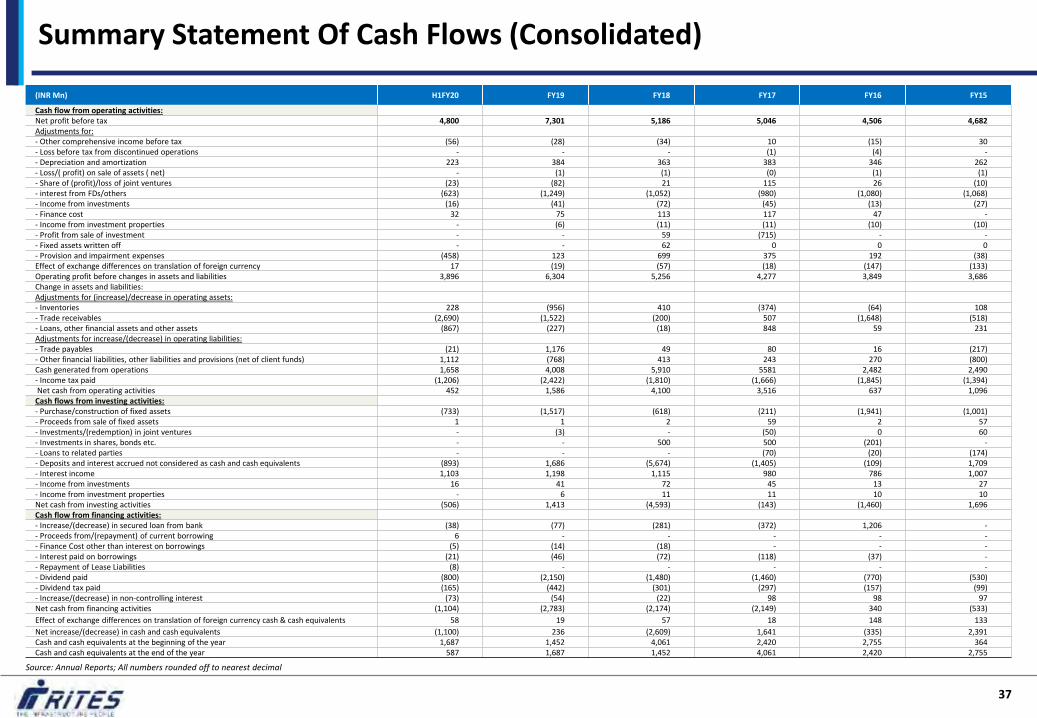
Cash flow from operating activities: Net profit before tax 4,800 7,301 5,186 5,046 4,506 4,682 Adjustments for: - Other comprehensive income before tax (56) (28) (34) 10 (15) 30 - Loss before tax from discontinued operations - - - (1) (4) - - Depreciation and amortization 223 384 363 383 346 262 - Loss/( profit) on sale of assets ( net) - (1) (1) (0) (1) (1) - Share of (profit)/loss of joint ventures (23) (82) 21 115 26 (10) - interest from FDs/others (623) (1,249) (1,052) (980) (1,080) (1,068) - Income from investments (16) (41) (72) (45) (13) (27) - Finance cost 32 75 113 117 47 - - Income from investment properties - (6) (11) (11) (10) (10) - Profit from sale of investment - - 59 (715) - - - Fixed assets written off - - 62 0 0 0 - Provision and impairment expenses (458) 123 699 375 192 (38) Effect of exchange differences on translation of foreign currency 17 (19) (57) (18) (147) (133) Operating profit before changes in assets and liabilities 3,896 6,304 5,256 4,277 3,849 3,686 Change in assets and liabilities: Adjustments for (increase)/decrease in operating assets: - Inventories 228 (956) 410 (374) (64) 108 - Trade receivables (2,690) (1,522) (200) 507 (1,648) (518) - Loans, other financial assets and other assets (867) (227) (18) 848 59 231 Adjustments for increase/(decrease) in operating liabilities: - Trade payables (21) 1,176 49 80 16 (217) - Other financial liabilities, other liabilities and provisions (net of client funds) 1,112 (768) 413 243 270 (800) Cash generated from operations 1,658 4,008 5,910 5581 2,482 2,490 - Income tax paid (1,206) (2,422) (1,810) (1,666) (1,845) (1,394) Net cash from operating activities 452 1,586 4,100 3,516 637 1,096 Cash flows from investing activities: - Purchase/construction of fixed assets (733) (1,517) (618) (211) (1,941) (1,001) - Proceeds from sale of fixed assets 1 1 2 59 2 57 - Investments/(redemption) in joint ventures - (3) - (50) 0 60 - Investments in shares, bonds etc. - - 500 500 (201) - - Loans to related parties - - - (70) (20) (174) - Deposits and interest accrued not considered as cash and cash equivalents (893) 1,686 (5,674) (1,405) (109) 1,709 - Interest income 1,103 1,198 1,115 980 786 1,007 - Income from investments 16 41 72 45 13 27 - Income from investment properties - 6 11 11 10 10 Net cash from investing activities (506) 1,413 (4,593) (143) (1,460) 1,696 Cash flow from financing activities: - Increase/(decrease) in secured loan from bank (38) (77) (281) (372) 1,206 - - Proceeds from/(repayment) of current borrowing 6 - - - - - - Finance Cost other than interest on borrowings (5) (14) (18) - - - - Interest paid on borrowings (21) (46) (72) (118) (37) - - Repayment of Lease Liabilities (8) - - - - - - Dividend paid (800) (2,150) (1,480) (1,460) (770) (530) - Dividend tax paid (165) (442) (301) (297) (157) (99) - Increase/(decrease) in non-controlling interest (73) (54) (22) 98 98 97 Net cash from financing activities (1,104) (2,783) (2,174) (2,149) 340 (533)
Effect of exchange differences on translation of foreign currency cash & cash equivalents 58 19 57 18 148 133
Net increase/(decrease) in cash and cash equivalents (1,100) 236 (2,609) 1,641 (335) 2,391 Cash and cash equivalents at the beginning of the year 1,687 1,452 4,061 2,420 2,755 364 Cash and cash equivalents at the end of the year 587 1,687 1,452 4,061 2,420 2,755
37
Summary Statement Of Cash Flows (Consolidated)
Source: Annual Reports; All numbers rounded off to nearest decimal

38
Thank You