Einbau und Wartung Installation and Maintenance Montage et ...
Upload
independentCategory
view
1download
0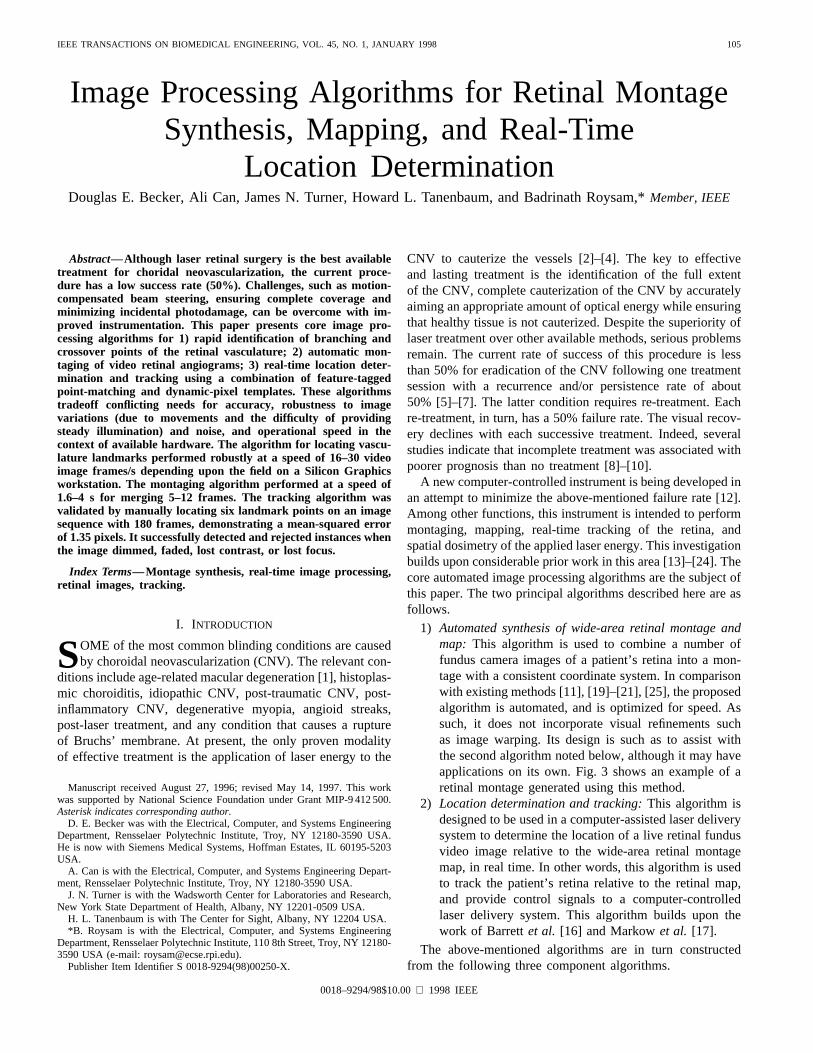
IEEE TRANSACTIONS ON BIOMEDICAL ENGINEERING, VOL. 45, NO. 1, JANUARY 1998 105
Image Processing Algorithms for Retinal MontageSynthesis, Mapping, and Real-Time
Location DeterminationDouglas E. Becker, Ali Can, James N. Turner, Howard L. Tanenbaum, and Badrinath Roysam,*Member, IEEE
Abstract—Although laser retinal surgery is the best availabletreatment for choridal neovascularization, the current proce-dure has a low success rate (50%). Challenges, such as motion-compensated beam steering, ensuring complete coverage andminimizing incidental photodamage, can be overcome with im-proved instrumentation. This paper presents core image pro-cessing algorithms for 1) rapid identification of branching andcrossover points of the retinal vasculature; 2) automatic mon-taging of video retinal angiograms; 3) real-time location deter-mination and tracking using a combination of feature-taggedpoint-matching and dynamic-pixel templates. These algorithmstradeoff conflicting needs for accuracy, robustness to imagevariations (due to movements and the difficulty of providingsteady illumination) and noise, and operational speed in thecontext of available hardware. The algorithm for locating vascu-lature landmarks performed robustly at a speed of 16–30 videoimage frames/s depending upon the field on a Silicon Graphicsworkstation. The montaging algorithm performed at a speed of1.6–4 s for merging 5–12 frames. The tracking algorithm wasvalidated by manually locating six landmark points on an imagesequence with 180 frames, demonstrating a mean-squared errorof 1.35 pixels. It successfully detected and rejected instances whenthe image dimmed, faded, lost contrast, or lost focus.
Index Terms—Montage synthesis, real-time image processing,retinal images, tracking.
I. INTRODUCTION
SOME of the most common blinding conditions are causedby choroidal neovascularization (CNV). The relevant con-
ditions include age-related macular degeneration [1], histoplas-mic choroiditis, idiopathic CNV, post-traumatic CNV, post-inflammatory CNV, degenerative myopia, angioid streaks,post-laser treatment, and any condition that causes a ruptureof Bruchs’ membrane. At present, the only proven modalityof effective treatment is the application of laser energy to the
Manuscript received August 27, 1996; revised May 14, 1997. This workwas supported by National Science Foundation under Grant MIP-9 412 500.Asterisk indicates corresponding author.
D. E. Becker was with the Electrical, Computer, and Systems EngineeringDepartment, Rensselaer Polytechnic Institute, Troy, NY 12180-3590 USA.He is now with Siemens Medical Systems, Hoffman Estates, IL 60195-5203USA.
A. Can is with the Electrical, Computer, and Systems Engineering Depart-ment, Rensselaer Polytechnic Institute, Troy, NY 12180-3590 USA.
J. N. Turner is with the Wadsworth Center for Laboratories and Research,New York State Department of Health, Albany, NY 12201-0509 USA.
H. L. Tanenbaum is with The Center for Sight, Albany, NY 12204 USA.*B. Roysam is with the Electrical, Computer, and Systems Engineering
Department, Rensselaer Polytechnic Institute, 110 8th Street, Troy, NY 12180-3590 USA (e-mail: [email protected]).
Publisher Item Identifier S 0018-9294(98)00250-X.
CNV to cauterize the vessels [2]–[4]. The key to effectiveand lasting treatment is the identification of the full extentof the CNV, complete cauterization of the CNV by accuratelyaiming an appropriate amount of optical energy while ensuringthat healthy tissue is not cauterized. Despite the superiority oflaser treatment over other available methods, serious problemsremain. The current rate of success of this procedure is lessthan 50% for eradication of the CNV following one treatmentsession with a recurrence and/or persistence rate of about50% [5]–[7]. The latter condition requires re-treatment. Eachre-treatment, in turn, has a 50% failure rate. The visual recov-ery declines with each successive treatment. Indeed, severalstudies indicate that incomplete treatment was associated withpoorer prognosis than no treatment [8]–[10].
A new computer-controlled instrument is being developed inan attempt to minimize the above-mentioned failure rate [12].Among other functions, this instrument is intended to performmontaging, mapping, real-time tracking of the retina, andspatial dosimetry of the applied laser energy. This investigationbuilds upon considerable prior work in this area [13]–[24]. Thecore automated image processing algorithms are the subject ofthis paper. The two principal algorithms described here are asfollows.
1) Automated synthesis of wide-area retinal montage andmap: This algorithm is used to combine a number offundus camera images of a patient’s retina into a mon-tage with a consistent coordinate system. In comparisonwith existing methods [11], [19]–[21], [25], the proposedalgorithm is automated, and is optimized for speed. Assuch, it does not incorporate visual refinements suchas image warping. Its design is such as to assist withthe second algorithm noted below, although it may haveapplications on its own. Fig. 3 shows an example of aretinal montage generated using this method.
2) Location determination and tracking:This algorithm isdesigned to be used in a computer-assisted laser deliverysystem to determine the location of a live retinal fundusvideo image relative to the wide-area retinal montagemap, in real time. In other words, this algorithm is usedto track the patient’s retina relative to the retinal map,and provide control signals to a computer-controlledlaser delivery system. This algorithm builds upon thework of Barrettet al. [16] and Markowet al. [17].
The above-mentioned algorithms are in turn constructedfrom the following three component algorithms.
0018–9294/98$10.00 1998 IEEE

106 IEEE TRANSACTIONS ON BIOMEDICAL ENGINEERING, VOL. 45, NO. 1, JANUARY 1998
1) Algorithm for rapid detection and characterization ofvasculature landmarks:To identify a particular area ofa patient’s retina, landmarks that usually correspond tobranching and crossover points in the vasculature aredetected in each retinal image. The algorithm presentedhere differs from the work of Goldbaum [22] in that itis designed to operate very rapidly and with repetitiveconsistency, at the expense of absolute accuracy.
2) Fast algorithm for matching sets of vascular landmarkpoints: These algorithms quickly compute the origi-nal spatial transformation linking two sets of retinallandmarks (extracted from two retinal images). Thisalgorithm is used not only to construct the retinal imagemontage, but also to assist with real-time image tracking.
3) Algorithm for validation and improvement of transfor-mations:This algorithm determines whether to accept orreject a transformation produced by the previous algo-rithm. This is needed since the transformation producedby the landmark matching algorithm may not be accurate(due to poor image quality). In addition, it is used torefine an acceptable transformation.
II. M ETHODS
A. Image Acquisition
The experimental data for evaluating the image processingalgorithms was acquired using a Hitachi KPM-1 low-lightmonochrome charge-coupled device (CCD) video camera at-tached to the eyepiece of the TOPCON TRC-501A funduscamera using red-free illumination. A healthy subject was usedwith eyes dilated. The video camera was interfaced directlyto the video input on a Silicon Graphics Indy Workstationwith a 150-MHz R4400 CPU, 96 Mb of memory and 1 Gb ofsystem disk. This system captured uncompressed video imagesto main memory at a resolution of 640480 pixels at a rate of30 frames/s. This system was used to capture both individualframes as well as real-time video sequences lasting 6 s each.The 6-s sampling duration was dictated by the available mainmemory on the Indy computer, and the desire to avoid anyform of lossy image compression that may degrade imagequality. The subject was asked to move his eye in order todeliberately make it difficult to track. As an artifact of thecollection procedure, the eyepiece crosshairs are visible in allthe frames. The programs that processed these images weredesigned to ignore them, knowing their fixed locations relativeto the image. Each frame in the video sequence represents apartial view of the retina, and the zoom factor (magnification,scale) can vary from frame to frame, due either to selectionof a different magnification setting on the fundus camera ormovement of the camera nearer or farther from the patient’seye (which may be necessary for focusing).
Several aspects of retinal images in general, and live videoretinal images, in particular, make automated processing dif-ficult. First, the images are highly variable. The naturallyhigh variability of fundus images between patients is widelyacknowledged. The variability of live images is especiallyhigh, due to unavoidable movements, and the difficulty ofproviding steady illumination. For instance, the need arises
to process image frames that are dim, out of focus, motionblurred, or corrupted with optical effects such as glare ornonuniform illumination. Examples of such low-quality framesthat must be processed in a consistent manner are availablefrom the World Wide Web (http://www.rpi.edu/˜roysab). It isimportant that such frames do not result in an erroneous actionby the instrument. During standard retinal still photography,skilled technicians quickly re-focus the camera for optimumillumination for each picture. Images are only taken whenthe illumination is optimal. Any images with insufficientillumination or excessive glare are simply discarded. Theimage processing subsystem of the proposed automated retinalsurgical system does not have this luxury. It must be ableto work with suboptimal illumination, and be able to detectwhen image quality is too poor for processing, and reject theseframes. Image processing in the face of high variability ordi-narily requires the application of adaptive image processingalgorithms that require a large number of operations/pixel.However, particularly for the real-time tracking, the timeneeded for such elaborate processing is simply not available.The algorithms described below were designed in the contextof such conflicting needs. They are designed to be simple andquick and yet capable of automatically skipping over invalidimage frames.
The extent of scene motion between retinal image framescan be extremely high due to the speed at which the eyemoves [26]. The saccades involve sudden jumps up to 15degrees. These movements occur at speeds ranging from90 to 180 /s. The mean peak acceleration can range from15 000 –22 000/s/s. Indeed, the interframe motion at theimaging speed of 30 frames/s is high enough to precludeuseful pixel-level interframe correlations, so only feature-based image processing approaches were considered.
B. Algorithms for Rapid Detection andCharacterization of Vasculature Landmarks
A natural and widely-used choice of features are the retinalvasculature landmark points. These points must have thefollowing properties to be useful. They: 1) must be at fixedlocations on the patient’s retina; 2) must be present in sufficientnumbers in all areas of the retina for effective locationdetermination; 3) must be detectable in different images ofthe same area of the retina even when the images differin magnification, focus, and lighting; 4) must be quicklydetectable. Points identifying bifurcations and crossing pointsof the retinal vasculature generally meet these requirements(with exceptions such as those arising in retinal detachment).
One possible method of detecting blood-vessel branchingand crossover points, for example the method of Goldbaumet al. [22], [24], [27], is based on identifying and determiningthe locations of the blood vessels by boundary detection orsegmentation, thinning the vessels to a single pixel width, anddetermining the points where blood vessels meet. This methodis not appropriate for this application due to the fact that thecomputation time is too high for real-time operation.
The method presented here is much more direct in the sensethat it bypasses the steps related to segmentation, thinning and

BECKER et al.: ALGORITHMS FOR RETINAL MONTAGE SYNTHESIS, MAPPING, AND REAL-TIME LOCATION 107
Fig. 1. Illustrating the image processing steps involved in the rapid detection of vasculature landmarks. (a) One red-free video image frame. (b) Resultof minimum filtering showing slight widening of the vasculature. (c) Result of Sobel edge detection. (d) Result of thinning the Sobel edges. (e) Edgedirection dispersion measure shown inverted (the dark regions indicate high-dispersion regions). (f) Result of thresholding the edge direction dispersionimage. The dots indicate detected vasculature landmarks.
skeleton analysis. This method proceeds in two steps (pleaserefer to Fig. 1 for an illustration). First, the boundaries of theretinal vasculature are detected using a standard Sobel edgedetection algorithm [28], after the image has been smoothedand the vasculature thickened using a minimum filter [29]. TheSobel operator also computes edge directions (perpendicularto the image intensity gradient) in the image. The detectededge directions are then normalized so that opposite sides of ablood vessel have edges pointing in the same direction. Finally,the edges detected by the Sobel detector are thinned using asingle-pass algorithm described by Anarimet al. [30]. Thesecond step is to identify points in the image around whichthe edge direction varies significantly. The justification behindthis approach is that for most of the images, the edge directiondoes not vary greatly over small areas of the image becausethe edges correspond to the boundaries of blood vessels witha small curvature. Therefore, where the edge directions dovary significantly, it is likely that this is where a bloodvessel is splitting off into two different directions, or crossinganother vessel. This motivates the following approach. A 99window is considered centered at each edge pixel in the
image. If the number of edge pixels in the window exceedsa threshold, an edge direction dispersion measure (describedbelow) is computed over the window. This edge directiondispersion measure is computed as follows:
(1)
where represents the set of all edge pixels in the window,is the number of edge pixels in the window (the number of
elements in , is the direction vector of each edge pixel,and is an operator computing the Euclidean magnitude.Watson [31] has provided a detailed explanation as to whythis is a reasonable dispersion measure for directional data.Pixels with a locally maximum dispersion value, provided thatthe dispersion exceeds a threshold, are taken to be possiblelandmark points. It has been shown that the expected valueof this dispersion measure is greater for vessel branches andcrossovers than for points along a straight vessel [12]. Thiscan be understood by considering a perfectly straight blood-vessel segment [see Fig. 1(d) and (e)]. For this segment, all

108 IEEE TRANSACTIONS ON BIOMEDICAL ENGINEERING, VOL. 45, NO. 1, JANUARY 1998
(a)
(b)
(c)
(d)
Fig. 2. Showing examples of edge direction histograms. (a) Shows the local 22�22 pixel region around a landmark point (adjusted for contrast) and thecorresponding edge direction histogram (after smoothing). (b)–(d) Show the same information for landmarks from a different retinal image of the sameeye. (b) Is the point identified as having the most similar edge direction histogram based on (4). (c) Was also identified as having a similar histogram. (d)Shows an example of a landmark with a significantly different edge direction histogram.
the edges point in the same direction, so the dispersion in awindow containing the vessel is zero. If the vessel was slightlycurved, the dispersion would be nonzero, but still small. Now,at a branch point or a crossover, the edge directions varygreatly, so the dispersion is large. While the above approachto landmark detection is much faster than traditional methods,it is not nearly as accurate in the sense that the detectedpoints do not always coincide with branching and crossoverpoints. However, for this work, this is not important. It ismore important that the landmarks be consistent and robustlyreproducible across image frames. The above procedure hasthis property since it only depends upon local changes inintensity greater than a threshold (i.e., edges) which are largelyrobust to illumination changes, and relative orientations of theedges in this local neighborhood, which do not change unlessthe retina is detached.
This window size (9 9) for the dispersion calculationwas determined empirically based on a tradeoff between
performance and computation. Clearly, since onlyrelativevalues of the dispersion measure between straight sectionsand branch points are of interest, rather than actual values,the above strategy remains fairly robust to choice of windowsizes. Large window sizes provide a better sampling of thelocal regions, and work better when large blood vessels areinvolved, especially at high scale values. On the other hand,an excessively large window size will encounter the confusingproblem of multiple landmarks within a single window. Inaddition, larger window sizes entail higher computational cost.In any case, the robust point-matching algorithm describedin Section III-C is able to survive a small number of miss-ing and/or incorrectly located landmark points. The chosenwindow size was empirically determined as the smallest sizethat yielded satisfactory detection performance for the video-resolution images, over the scale changes of interest [12].
To enable rapid image matching, a local edge directionhistogram (Fig. 2) is computed at each landmark. Since each

BECKER et al.: ALGORITHMS FOR RETINAL MONTAGE SYNTHESIS, MAPPING, AND REAL-TIME LOCATION 109
vasculature crossing or branch point is unique, edge directionhistograms represent a unique “signature” associated witheach landmark point that can be used to distinguish differentlandmark points in a way that is reasonably independent ofscale differences (because the pattern of edge directions arounda landmark does not change with scale) and slight translationdifferences (because positional information is ignored in thecalculation of the edge direction histogram). Fig. 2 showsexamples of edge direction histograms.
C. Fast Algorithm for Matching Sets ofVascular Landmark Points
This Section describes an efficient procedure for matchingpairs of vasculature landmark point sets that are computedfrom sets of retinal images. Mathematically, the core compu-tation of interest is the matching of feature-tagged point setswith unknown correspondences, in the presence of a smallnumber of noncorresponding points, to produce an optimaltransformation between the two point sets. The nature ofretinal video images restricts the possible transformations toinclude two-dimensional (2-D) translations andscale changes This model holds for the area of the retinathat is of most interest–around the fovea, where the retina iswell approximated by a plane at standard video resolutions.The small errors resulting from this modeling assumption donot affect the subsequent point-matching steps as discussedlater in this Section. The rotational movements are known tobe very small (rarely approaching and never exceeding 5). Aslong as there is no detachment, the retina is known to move“rigidly;” that is, all the points on the retina move together andmaintain the same relative location with respect to one another.On the other hand, the apparent scale of the images cannot beneglected. It can change not only when the magnification isadjusted, but also when the patient moves closer or furtherfrom the camera.
The matching algorithm operates by corresponding pairsof points. First, a number of potential transformations arecalculated by hypothesizing correspondences between pointsin one set and points in the other. Second, the transformationsare evaluated by computing a “score” for each transformationthat measures how well the transformation corresponds to theimage data. Every “plausible” correspondence between a pairof points in the first set and a pair of points in the second setdefines a transformation. A “plausible” correspondence is amatch that induces a transformation with no significant rotationand has a scale within an acceptable range (a typical extremerange is 70–145%). Given a plausible correspondence betweena pair of points in the first set and a pair of points inthe second set the scale factor can be computed bythe following equation:
(2)
The translation can then be computed by
(3)
If there are points in the first set and points in thesecond set, then there are on the order of pair-to-
pair matches. Although relatively few of these matches areplausible, there are still a large number of transformations toevaluate. One way to avoid evaluating this large a number oftransformations is to attempt toquickly reject bad correspon-dences. The method adopted in this system is to compare thelocal edge direction histograms of each landmark. Only thosewith sufficiently similar (in the sense defined as follows) edgedirection histograms are considered for correspondence.
Comparisons between edge direction histograms are madeas follows. First, in order that binning artifacts (i.e., artifactsdue to the assigning of a direction to a discrete histogram bin)do not prevent good matches, a Gaussian smoothing is appliedto each histogram. The similarity between two histogramsis then calculated by a sum-of-squared-difference measureaccording to the following equation:
(4)
where and are the two (smoothed) histograms, andis the number of bins in the histograms. Pairs of landmarksthat produce a small measure (near zero) are considered moresimilar than landmarks giving a larger measure. Empiricalinvestigation has revealed that it is generally sufficient touse only the five most-similar (in the above sense) landmarksfor correspondence. Limiting the number of these evaluationsdramatically decreases the computation time, from to
By restricting potential correspondences to the fivemost-similar (as determined by histogram comparison), itis possible (though unlikely) that we may miss out on acorrect correspondence. In other words, all five potentialcorrespondences may be wrong. But that does not cause aserious problem, since when we generate transformations fromthese (incorrect) correspondences, they will evaluate poorly ina subsequent evaluation step (described below). As long aswe have some correct correspondences from which we cangenerate a correct transformation, it will be selected in thelatter step. It must be further noted that the five pairs of pointsare used to generate several (not one) transformations, eachof which is evaluated.
Further, since many of the computed transformations willbe similar or, ideally, the same, it would be wasteful toevaluate every transformation. This duplication is avoided bymaintaining a list of transformation “clusters” following thework of Stockman and Esteva [32], [33]. Each transformationcluster represents a set of plausible matches that induce similartransformations. The algorithm for generating clusters operatesas follows. For each plausible match, the transformation vector
is computed. The vector is then compared toeach cluster. If the distance (in transformation space) betweenany cluster center and is less than a certain thresholdvalue the transformation is added to the cluster, the countof transformation points in the cluster is incremented byone, and the cluster centroid is re-computed. Otherwise, anew cluster is defined consisting of one transformation atBy assigning transformations to clusters, the computationallyexpensive evaluation of the transformation need not to beperformed for each match. Because a correct transformation

110 IEEE TRANSACTIONS ON BIOMEDICAL ENGINEERING, VOL. 45, NO. 1, JANUARY 1998
should map a large number of landmark points, and hencepairs of points, correctly, it is intuitively reasonable that theoptimal transformation cluster will have a large number oftransformation points associated with it. Therefore, all theclusters do not need to be evaluated. It is only necessary fora certain number of the ones with the most transformationpoints to be evaluated.
To evaluate a transformation (for determining the optimaltransformation), the landmark points of the first set are trans-formed and compared to the landmark points in the secondset. Define a mapping function , as follows:
(5)
where is a landmark point in the first set, is the spatialtransformation, and is the second set of landmark points.This function computes the closest landmark in the second setto the transformed point Next, define the following set ofpoints:
(6)
where is the first set of the landmark points and is themaximum acceptable distance between a transformed point inthe first set and the nearest point in the second set. The setcontains all points in that, when transformed by, are lessthan distance from a point in the second set. Then we candefine an evaluation function as follows:
(7)
This evaluation function returns high values for points in thefirst set that are mapped close to points in the second set.Because the function does not require exact matches betweenpoints, but degrades gracefully, allowing small differences inthe locations of points, the system will allow some error inthe landmark point identification and will also allow slightdistortions of the type incurred by using 2-D rather thanthree-dimensional (3-D) perspective transformations. Practicaloperation of this algorithm requires this type of robustness.
One major time-consuming operation in the evaluation oftransformations can be that determination of the closest pointin one set to a given transformed point in the other set (withina maximum acceptable distance). A naive way of doing thiswould be to compare the transformed point to every point inthe other set to find the minimum distance between them. Amethod to dramatically cut down the amount of computation isto use a “hash table.” For this, define a grid over the locationspace. The space between the grid lines is defined asortwice the maximum acceptable distance between a transformedpoint in the one set and the closest point in the other set. Thegrid divides the entire space into “boxes,” so that every pointin the location space has a box that covers that point. Thehash table consists of a 2-D set of such boxes, each of whichcontains a list of points that are contained within that box.Now, instead of examining every point in the set to determinethe closest point to a transformed point, it is only necessaryto examine the points in the lists associated with the four
neighboring boxes to the transformed point. For a typical red-free retinal video frame, a computation reduction factor of atleast ten was obtained experimentally.
The above improvements to the point-matching algorithmresult in overall speed improvement of approximately 180–200times. The resulting computation times, of the order of 1 sor less on a Silicon Graphics computer, are acceptable formontage synthesis. However, they are still not sufficient forreal-time location determination and tracking.
D. Algorithms for Validation and Improvementof Transformations
Two issues of concern with the transformations provided bythe point-matching algorithms are that: 1) The transformationmay not be close to correct at all (i.e., the point matchinghas failed, or 2) the transformation, while close to the correcttransformation, may be slightly inaccurate. In the first case, itis necessary todetectthis failure, while in the second case it isdesirable tocorrect the inaccuracy by a refinement operation.
To determine the success or failure of the above matchingalgorithm, a sequential similarity detector (SSD) was used[34], [35]. Given a transformed imagethat is to be comparedwith an image , the SSD algorithm computes the measure
(8)
where is a window over which the measure is to becomputed, and are the average intensities of imageandimage , respectively, in this window, and and are theestimated standard deviations within the window. The lowerthe value of , the better the match. Subtracting the mean andnormalizing by the standard deviation of the windows meansthat even images with significantly different illumination canbe matched successfully, an important consideration for thisapplication.
This measure works best when the window contains a regionof interest, such as vasculature branch points [36]. Therefore,for this algorithm, the value is computed for a small windowaround each of several landmark points. The lowest valuereturned by the similarity measure for all the locations testedis considered to be the correct match of the landmark fromthe retinal map to a point in the new image. This processis repeated for a number of landmark points. Experimentsindicate that five is a sufficient number of points. If themeasure exceeds a certain (experimentally determined)threshold for a given window, then the match is determined tobe a failure. Because effects such as glare can cause a failedmatch, a single failed match does not automatically causethe transformation to be rejected. The entire transformation isrejected if less than four of the five points match successfully.
If the transformation is not rejected, the results of the SSDmatches can be used to refine the transformation. Each ofthe successful matches maps a point in the retinal map tothe new image. In general, no one transformation will allowall the points to be mapped exactly. However, the optimaltransformation, in the least-squares sense, can be computed.Suppose that a set of points in image 2 (the new

BECKER et al.: ALGORITHMS FOR RETINAL MONTAGE SYNTHESIS, MAPPING, AND REAL-TIME LOCATION 111
image) map to a set of points in image 1 (theretinal map). The least-squares estimate of the optimal scaleparameter in the new transformation is given by
(9)
where denotes the average of the coordinates,denotes the average of multiplying correspondingcoordi-nates from the two images (i.e. the average of and
represents the average of the square of thecoordinatesof image 2. The correspondingand translation values aregiven by
(10)
The net result of applying these procedures is an improved andvalidated transformation. The detailed derivation of the aboveequations are provided in the Appendix.
E. Algorithm for Wide-Area Montage and Map Synthesis
The wide-area map is first initialized to the first accept-able image frame. Subsequent image frames serve to eitherreinforce or augment the wide-area map. Specifically, thealgorithm computes landmark points for each image frame, anduses the matching algorithm to compute a transformation tothe current wide-area map. If the transformation is sufficientlyreliable, as defined in the previous Section, then the extent ofthe overlap between the stored wide-area map and the newimage frame is determined. The portion of the new framethat is not represented in the current wide-area map is nowinserted into the wide area map. Also, the portion of the wide-area map that overlaps with the new image frame is updatedto reflect the new level of confidence in the landmark points.Specifically, associated with every landmark point in the wide-area map is a count of the number of times it coincided witha landmark in a new frame (coincidence counts), and a countof the number of times a new image reliably overlapped withthe relevant spatial region (observation counts). A “confidencevalue” is computed by dividing the number of coincidencecounts by the number of observation counts. Points with higherconfidence values are considered more reliable. A thresholdcan be set for rejecting landmarks with insufficient confidencevalues. As more overlapping images are added to the map, itis expected that a set of very reliable landmark points will beobtained. Once the wide-area map has been computed, it isstraightforward to transform and merge the actual gray levelimage frames to construct a montage corresponding to thewide-area map.
F. Real-Time Algorithm for LocationDetermination and Tracking
During laser retinal surgery, it is important that the locationof each incoming video frame be determined relative to thewide-area retinal map in real time (in 33 ms/frame or less).Unfortunately, the point-matching algorithm presented above,while fast, could not be computed in the above time frame.Barrett et al. [16] and Markowet al. [17] have described anovel method for tracking the positions of retinal images in
real time for small movements and with a fixed magnification.Their method is based on defining a small set (typically 5–10)of local correlation templates that are sensitive to the positionof blood vessels in either the horizontal or vertical direction.Usually, these templates are defined on locally horizontal orvertical segments of a few prominent vessels in the retinalimages. Each template consists of four pixels: two adjacentpixels, denoted and , straddling one boundary of a retinalblood vessel and two pixels, denotedand , straddling theother boundary. If and are the intensities of the pixelsoutside the hypothesized blood vessel andand are theintensities of the pixels inside the vessel, then the intensitydifference across the vessel boundaries are , and
, respectively. The response of the template is definedas the sum of these differences divided by the average intensityof these four points, as given by the following equation:
(11)
For each incoming video frame, a 2828 pixel region cen-tered about the location of the template in the last frame isdefined. The template is hypothesized to be at every position inthis 28 28 region, and the response computed. The locationwith the maximum response is considered to be the location ofthe template in the new frame. In practice, several horizontaland vertical templates are defined to cover blood vessels atvarious positions on a retinal map. They are maintained atfixed locations relative to one another as possible positions forthe combined template are hypothesized. At each hypothesizedposition for the combined template, the responses of the one-dimensional (1-D) templates are summed to form a totalresponse for the 2-D template. The response of the 2-Dtemplate is maximum when all 1-D templates are aligned overblood vessels. Because these calculations can be performedwell within the time between frames (33 ms), the retina canbe tracked in real-time.
To define the templates for a particular retinal map, eachpossible template location within a region is examined andthe location with the highest response is selected. This processof defining templates can take longer than the time betweenframes. However, this does not prevent the algorithm fromtracking in real time. Barrettet al. [16] describe obtaining aset of templates once before tracking begins.
While very fast, the template-based method has some dis-advantages. There are a number of conditions that can causethis method to fail, and there is no way of detecting orcorrecting these failures within the template approach. It isdesirable to design a method for location determination thatcombines the speed advantages of the template-based methodwith the advantages of a point-matching-based method, suchas flexibility, robustness, and verifiability. The main difficultywith this is that the advantages from the point-matchingmethod come at a cost of significant computation time. It is notobvious how the advantages of point matching can be utilizedwhile still maintaining real-time operation.
The key to solving this dilemma comes from noting that thelarge, sudden saccadic or fixation movements happen muchless frequently when compared to the small and constant

112 IEEE TRANSACTIONS ON BIOMEDICAL ENGINEERING, VOL. 45, NO. 1, JANUARY 1998
Fig. 3. A montage of nine red-free retinal images from the Live Video dataset. These images have been transformed onto a single coordinate system,aligned, and combined into a single montage. This montage does not have theimage warping refinements as in the work of Mahurkaret al. [19]. Its purposeis to provide a coordinate reference frame, as defined by the landmarks forlocation determination (see Fig. 5 for an example).
microsaccades. The other insight needed for the design of thisalgorithm is that real-time location determination performanceis only necessarywhile the surgical laser is active.In otherwords, if sudden large movements of the eye, eye blinks,glare, or scale changes can bedetected within the timebetween image frames, then the laser can automatically bedisabled (shuttered or deflected to a beam dump), allowing aslower point-matching-based algorithm to obtain an accurate,verifiable fix on the current retinal position, allowing thetracking to be re-initiated.
What becomes necessary, therefore, is a way to quicklydetect whether the template-based method has failed. A two-part method has been found to be useful for this purpose. First,the template response is compared to a minimum “confidencethreshold.” If the response of the template is below thisthreshold, this is an indication that the algorithm may begiving an incorrect estimate of the retinal location. Second,if the template-based method indicates a sudden movementbetween frames larger than normally expected, this may be anindication of an incorrect location, or at least that a verifiableestimate of the retinal location should be obtained. In eithercase, the laser is disabled while the point-matching algorithmobtains a new location estimate.
Based on the considerations listed above, the combinedlocation determination algorithm operates as follows. It isassumed that after diagnosis and analysis, the physician has
obtained a wide-area retinal map and has outlined an areaon the map that is designated for treatment. During laserapplication, the instrument obtains a video image frame ofthe patient’s retina. The point-matching algorithm matches theframe with the retinal map. The transformation that resultsfrom this matching operation provides an estimate of thespatial location of the current image frame relative to the wide-area map. Then the algorithm automatically obtains a set of1-D templates for the template-based tracking method. Thetemplate-based method tracks the retina based on the positionfix determined by the point-matching algorithm. If the templateresponse is above the confidence threshold, and the change inthe retinal location between frames is within a preset limit,then the laser is enabled. As long as the confidence testsare passed, the algorithm proceeds by grabbing new retinalimages at video rates and using the template method to obtainnew estimates of the retinal location. Otherwise, the laser isdisabled and a new determination of the retinal location isobtained by matching the current image frame with the retinalmap. A visible tracking (marker) laser spot is detected in eachincoming image frame, and the location of this spot can bedetermined on the retinal map. The tracking laser spot marksthe precise location where the surgical laser will hit when fired.As a result, the computer can determine the area of the retinaon the retinal map that will be cauterized when the surgicallaser is fired. The resulting algorithms provide a unifiedmethod for tracking the retina and controlling the surgicallaser. From a physician’s standpoint, the system remainssimple; whenever tracking is lost, the system automaticallyshuts off the laser, overriding the physician’s request to turnon the laser. A flowchart summarizing the above procedure isshown in Fig. 4.
III. EXPERIMENTAL RESULTS
A. Detection of Retinal Vasculature Landmarks
Fig. 1 illustrates the intermediate steps in the detectionof retinal vasculature landmarks. Fig. 1(a) shows a red-freevideo image of a healthy retina. Fig. 1(b) shows the resultof minimum filtering. This operation smoothes out impulsiveimage noise, and has the effect of widening the vasculature.The latter effect is needed to prevent merging of edgesduring the thinning operation that follows. Fig. 1(c) showsthe effect of Sobel edge detection. An important practicalconsequence of this step is that subsequent computations arehastened by restricting them to the detected edge regions.Fig. 1(d) illustrates the effect of single-pass thinning of theedge detection output. This operation greatly reduces theamount of data that must be processed in the subsequentstep, typically, a factor of eight. Fig. 1(e) shows the effectof computing the direction variance at each thinned-edgepixel. In this image, the darker pixels are close to one,whereas the lighter pixels are close to zero. Thresholding thisimage, followed by local maximum suppression yields a set oflandmark points that are displayed in Fig. 1(f) as white dotssuperimposed on the original image in Fig. 1(a).

BECKER et al.: ALGORITHMS FOR RETINAL MONTAGE SYNTHESIS, MAPPING, AND REAL-TIME LOCATION 113
Fig. 4. Flowchart outlining the algorithm for real-time retinal location determination and laser control. Bold arrows represent actions that must beperformed in real time.
B. Construction of Wide-Area Retinal Map and Montage
A number of wide-area montages consisting of severalretinal images were constructed. The result of montaging ninered-free retinal images is shown in Fig. 3. It took 7.2 s ona 150-MHz Silicon Graphics Indy computer to compute thetransformations for the images in this montage. The algorithmsfor generating the wide-area map and montage were ablesuccessfully to handle differences in position and scale, as wellas differences in illumination and general image quality. Thewide-area maps form the basis of retinal location determinationand tracking.
C. Location Determination and Tracking
During laser surgery, each incoming image frame must belocated with respect to the wide-area retinal map in order todetermine the current location of the laser. Fig. 5 shows anexample of an image that was located on the wide-area retinalmap. The white circular outline on Fig. 5(b) represents thelocation of the outline of the frame shown in Fig. 5(a), asautomatically identified by the algorithm.
The image in Fig. 6 is the first image of a 6-s (180 frame)live red-free video sequence. In capturing this sequence,
the subject was asked to move his eye in order to createa deliberately difficult sequence to track. In actual retinalsurgery, attempts would be made to minimize eye movements.The location determination and tracking algorithms were usedto track this entire sequence off-line. Each image in thesequence was processed as if it were captured live fromthe proposed instrument during surgery. When re-establishinga position fix, the sequence was paused; the next imageprocessed was the next image in the sequence. Some sampleresults of this tracking are shown in Fig. 6. In this figure, anarbitrary point was selected on the first image of the sequence.The tracking algorithm was used to record the position ofthis point on every other image of the sequence based on thecalculated location of that frame on the retinal map. A whitecrosshair is shown in Fig. 6 at this calculated point on sixframes from this sequence. The algorithm required 19 positionfixes in processing this 180-frame 6-s sequence, including theinitial fix. Ten frames were determined by the algorithm tobe unusable for location determination based on the criteriadescribed earlier. In the proposed instrument, the operatinglaser would be disabled while obtaining a position fix or afterdetecting an unusable frame.

114 IEEE TRANSACTIONS ON BIOMEDICAL ENGINEERING, VOL. 45, NO. 1, JANUARY 1998
Fig. 5. An example of location determination. The upper image is the firstframe of a red-free video sequence from the Live Video data set. (b) Is amontage constructed from a sequence of 24 successive image frames. Thewhite outline in (b) represents the outline of (a) as automatically determinedby the location determination algorithm. The superimposed white dots indicatethe detected landmark points.
The accuracy of the above algorithms was verified manually.Each of the 180 images in the Live Video data set was analyzedmanually. For each image, a specific landmark point waslocated manually using a computer mouse in each image of thesequence. Then, the tracking algorithm was used to predict the
location of this selected landmark point for each frame.The spatial distance between the algorithm-predicted point andthe manually identified point was used as an error measure.Fig. 7 shows the average error for all manually identifiedpoints. The average error over all points was computed tobe 1.9 pixels.
By way of comparison, cross validation was performed onthe manually selected points to give a measure of consistency.This cross validation was performed by calculating the least-squares transformation as in (9)–(10) for each frame basedon the manually selected points. The average error betweeneach point as selected manually from the position predictedfrom the least-squares transformation was computed. Fig. 8shows this cross-validation measure. Note the very largeerror of over 12 pixels at frame 158. This is a frame withconsiderable motion blur. There was no way of obtainingreliable landmarks for this image. The large error for this framein the manually selected points is not reflected in the manualversus automatic comparison because the automatic locationdetermination method identified this frame as being unsuitablefor processing. Fig. 8(b) shows the same data without frame
Fig. 6. Six representative red-free image frames from a 6-s video sequencedemonstrating the results of automatic tracking. An arbitrary point wasselected on the first image of the sequence. The tracking algorithm was usedto record the position of this point on every other image of the sequence asa white crosshair.
Fig. 7. Graph showing the average discrepancy between manual and auto-matic location determination computed over all manually mapped points. Thedotted vertical lines indicate times when the template method failed, requiringthe point-matching-based algorithm to be invoked to derive a position fix.
158. The average error (inconsistency) was computed to be1.35 pixels.
A higher accuracy may be achieved at a correspondinglyhigher computational cost. For example, increasing the win-dow size of the SSD computations for transformation valida-tion and improvement can give more accurate results. Fig. 9

BECKER et al.: ALGORITHMS FOR RETINAL MONTAGE SYNTHESIS, MAPPING, AND REAL-TIME LOCATION 115
(a)
(b)
Fig. 8. (a) Cross validation data showing the internal consistency of themanually selected points. The average error over all points was computedbased on a least-squares computation of the transformation for each frame. Alarge error exists for frame 158 due to extreme motion blur in that frame. (b)The same data, excluding frame 158 plotted on an expanded scale.
shows the effect of increasing the window size on averageerror. Error bars for each point show the standard deviationof the error. A horizontal line indicates the inconsistency ofthe human data as discussed in the previous paragraph. Othertradeoffs of speed for accuracy can be made, including increas-ing the window size during landmark detection, increasing therange over which the SSD is performed, and upgrading thetransformation models.
IV. DISCUSSION AND CONCLUSIONS
The algorithms presented here are being used to constructa computer-assisted instrument for laser retinal surgery. Re-cently, Welch [15]–[17] has sketched out a concept for afuture computer-controlled retinal surgery system that includesretinal tracking and automatic laser beam movement, similarto our work. Also known is the largely unpublished andproprietary work of Dr. S. Charles (Charles Retina Institute,Memphis, TN). It is expected that our instrument will reducethe failure rate of laser retinal surgery by enabling accurateand quantitatively monitored delivery of the laser energy to
Fig. 9. Graph showing decreasing error with increasing amounts of compu-tation. The window size of the SSD calculations for transformation validationand improvement is graphed against the average error. Error bars show thestandard deviation for each window size. A horizontal line indicates theinconsistency of the manually selected points as computed by cross-validation.The average computation times corresponding to the vertical bars were (777,851, 875, 1626, and 2322 ms, respectively).
the region of interest with the minimum-possible incidentalretinal damage or untreated area. For example, it will bepossible to shutoff the operating laser when the laser isaimed at an unplanned region, or when the optical dosageto a particular region exceeds a threshold. The problem ofincidental damage is especially important when operating nearcritical regions such as the fovea. The progress of the lasertreatment will be displayed on a heads-up display as it occurs.For instance, currently, the physician is required to alternatelyview and memorize a portion of a monochrome image onwhich the treatment region is mapped, then visually identifythe corresponding region on the patient’s retina (in color)through a slit-lamp microscope using vasculature landmarks,and manually direct the laser using a foot pedal to switchthe laser on and off. This task can only be performed ap-proximately, leading the high treatment failure rate. Ideally,the physician should be able to perform a comprehensiveimaging of the retina, view it on a large computer screen, use apointing device to outline the areas requiring treatment, specifythe optical dosages to each such area, make annotations, andperform a simulated treatment before proceeding with the fulltreatment. The retinal map that is generated above, as wellas the marked treatment areas should be displayed to thephysician in real time to help guide the treatment. Ideally too,previously acquired aligned retinal maps should be accessibleduring the post-operative phase to monitor the progression ofa treatment. In this context, note that the same algorithmscan also be used to perform post-laser follow-up measurementsince the mapping data can be easily stored on the computerand retrieved later. A considerable factor causing misdirectionof the laser is related to eye movements (normal saccadicscanning, those resulting from distractions, as well as theavoidance movements that are reflex responses to irritatinglight or the discomfort induced by the laser, involuntarymovement to fixate the fovea on the laser spot, etc.). The closer

116 IEEE TRANSACTIONS ON BIOMEDICAL ENGINEERING, VOL. 45, NO. 1, JANUARY 1998
the laser aiming beam is brought to the fovea, the harder itis for the patient to resist the desire to direct the fovea to thebeam. In macular degeneration the patient’s vision is oftenso poor that this is not a problem, but the physician must beprepared for it. The physician attempts to override this driveby giving a point-source target to the other fovea. This worksfairly well if the uninvolved eye has better central vision thanthe involved eye, which is often not the case.
The algorithms presented here demonstrated the ability totrack image frames or to determine that the laser must bedisabled within the time required for real-time operation. Alltimings shown here are on a 150-MHz Silicon Graphics Indycomputer. An average of 3.7 ms was required to track ormake the determination required to disable the laser (due toa new position fix being required) using the template method.This is nearly an order of magnitude faster than required forreal-time operation. With a window size of 16 pixels for theSSD computations, it took an average of 875 ms to obtain aposition fix, 51 ms of which was required to define a new set oftemplates, 400 ms was required for detecting landmarks, 353ms was required for validation, and 105 ms was needed for thepoint matching. The time for point matching is remarkably lowconsidering the combinatorial nature of the problem [37], [38],indicating the success of the computation reduction techniquesadopted here. Collectively, these techniques brought down thistiming from about an hour down to 150 ms. These times are tobe interpreted as being representative, and they depend uponthe image, and on parameter selection (see Fig. 9). It is clearfrom these performance numbers that the bulk of the timeneeded to obtain a position fix is used for pixel-intensive tasks.This suggests the use of a parallel pixel-processor, such asthe Texas Instruments TMS320C80 chip for accelerating theseoperations. This device consists of four long instruction wordsignal processors and a standard RISC CPU with floating-pointarithmetic, all integrated on a single die.
A particular capability of the algorithms relates to thehandling of the high variability in the image data, in particularbad frames, in a consistent manner, without the use of com-putationally expensive adaptive image-analysis algorithms. Bycombining the template method with the fast point-matching-based method, a consistent real-time control of the laserdelivery system becomes possible. Of particular importanceis the ability to quickly (in 3.7 ms after frame capture) shutoff the operating laser in the event of a tracking loss, orwhen a poor-quality image is acquired, and the ability toautomatically re-initiate the tracking when acceptable imageframes become available. This greatly improves upon the workof Barrettet al. [16] and Markowet al. [17]. The problem oflocating retinal landmarks is another example that requireda novel solution. The direct approach to this problem [22]involves adaptive image segmentation and matched filteringto detect the retinal vasculature, followed by skeletonizationand branch point detection. Such an approach, again, would becomputationally infeasible for the proposed instrument. Theapproach described in this paper is “less accurate” in thespecific sense that the detected landmarks may not correspondto vasculature branching and crossover points, yet they aresufficient for the specific purpose of location determination and
montaging, while being orders of magnitude faster to compute.An interesting issue that arises is the method to ensure that
an applied laser does indeed impact a point indicated by thealgorithms relative to the montage. In this context, it mustbe noted that the operating laser has an additional collinearvisible-light low-power beam known as the aiming beam. Theimaging system observes the spot created by this beam (theaiming spot) through the same optical system, with the samedistortions. This fact eliminates the need for a reverse mappingmechanism from the retinal map to the 3-D point on the retina.
The accuracy of the location determination algorithm wasdemonstrated to be within 1.9 pixels of the manually acquiredlocation data. It was also shown that the manual data, despiteextreme care and effort, had an inherent error of 1.35 pixelson average. In this context, it is useful to note that the need foraccuracy has less to do with the absolute achieveable precisionimplied by the optics, and much to do with the need to addressthe principal causes of failure in laser retinal surgery—failureto cover the treatment area, and incidental damage resultingfrom applying the laser to nontreatment areas. An importantfeature of the proposed algorithms is the fact that they areamenable to further improvements given increased computingcapability. For instance, the accuracy of the tracking can beimproved by increasing the size of the window used for theSSD, and increasing the number of landmark points usedfor transformation improvement. This should become possiblewith inevitable improvements in microprocessor technology.
We are currently investigating full 3-D modeling of theretinal surface in order to improve the accuracy of the montage,and the location determination implied by it.
APPENDIX
DERIVATION OF (9) AND (10)
Given a set of points in image 2 (the newimage) that map to set of points in image 1 (theretinal map), we can define a squared difference error valueas follows:
(A.1)The minimum of this error measure can be computed by takingpartial derivatives and setting the result equal to zero, givingthe following results:
(A.2)
(A.3)
and
(A.4)
By solving these equations, the parameters of the best transfor-mation in the least-squares sense can be computed in closedform as (9) and (10).

BECKER et al.: ALGORITHMS FOR RETINAL MONTAGE SYNTHESIS, MAPPING, AND REAL-TIME LOCATION 117
ACKNOWLEDGMENT
The authors would like to thank the staff at the Center forSight, Albany, NY, especially photographers G. Howe and M.Fish, for assisting with image acquisition. They would alsolike to thank T. Turner and H. Yau for assisting with manualvalidation of the tracking algorithm.
REFERENCES
[1] R. Murphy, “Age-related macular degeneration,”Ophthalmol.,vol. 93,pp. 969–971, 1986.
[2] Macular Degeneration Study Group. “Recurrent choroidal neovascular-ization after argon laser photocoagulation for neovascular maculopathy,”Arch. Ophthalmol.,vol. 104, pp. 503–512, 1986.
[3] S. L. Trokel, “Lasers in Ophthalmology,”Optics, Photonics News,Oct.1992, pp. 11–13.
[4] M. W. Balles, C. A. Puliafito, D. J. D’ Amico, J. J. Jacobson, andR. Birngruber, “Semiconductor diode laser photocoagulation in retinalvascular disease,”Ophthalmol.,vol. 97, no. 11, pp. 1553–1561, Nov.1990.
[5] N. M. Bressler, S. B. Bressler, and E. S. Gragoudas, “Clinical charac-teristics of choroidal neovascular membranes,”Arch. Ophthalmol.,vol.105, pp. 209–213, 1987.
[6] P. N. Monahan, K. A. Gitter, J. D. Eichler, G. Cohen, and K. Schomaker,“Use of digitized fluorescein angiogram system to evaluate laser treat-ment for subretinal neovascularization: Technique,”Retina—J. Retinal,Vitreous Diseases,vol. 13, no. 3, pp. 187–195, 1993.
[7] P. N. Monahan, K. A. Gitter, J. D. eichler, and G. Cohen, “Evaluationof persistence of subretinal neovascular membranes using digitizedangiographic analysis,”Retina—J. Retinal, Vitreous Diseases,vol. 13,no. 3, pp. 196–201, 1993.
[8] S. Fine, “Observations following laser treatment for choroidal neo-vascularization,”Archives of Ophthalmol.,vol. 106, pp. 1524–1525,1988.
[9] G. Soubrane, G. Coscas, C. Francais, and F. Koenig, “Occult subretinalnew vessels in age-related macular degeneration,”Ophthalmol.,vol. 97,pp. 649–657, 1990.
[10] Macular Photocoagulation Study Group. “Persistent and recurrent neo-vascularization after Krypton laser photocoagulation for neovascularlesions of ocular histoplasmosis,”Arch. Ophthalmol.,vol. 107, pp.344–352, 1989.
[11] Q. Zheng and R. Chellappa, “A computational vision approach to imageregistration,”IEEE Trans. Image Processing,vol. 2, no. 3, July 1993.
[12] D. E. Becker “Algorithms for automatic retinal mapping and real-timelocation determination for an improved retinal laser surgery system,”Ph.D. dissertation, Rensselaer Polytechnic Inst., Troy, New York 12180,Aug. 1995
[13] R. W. Flower and B. F. Hochheimer, “A clinical technique and apparatusfor simultaneous angiography of the separate retinal and choroidalcirculation,” Investigat. Ophthalmol.,vol. 12, no. 4, pp. 248–261, Apr.1973.
[14] T. M. Clark, W. R. Freeman, and M. H. Goldbaum, “Digital overlay offluorescein angiograms and fundus images for treatment of subretinalneovascularization,”Retina—J. Retinal, Vitreous Diseases,vol. 2, no.12, pp. 118–126, 1992.
[15] A. J. Welch, “University of Texas lab studies tissue optics, ablation,automation,”Biomed. Optics: Newslett. Biomed. Optics Soc.,vol. 2, no.2, May 1993.
[16] S. F. Barrett, M. R. Jerath, H. G. Rylander, and A. J. Welch, “Digitaltracking and control of retinal images,”Opt. Eng.,vol. 33, no. 1, pp.150–159, Jan. 1994.
[17] M. S. Markow, H. G. Rylander, and A. J. Welch, “Real-time algorithmfor retinal tracking,” IEEE Trans. Biomed. Eng., vol. 40, no. 12, pp.1269–1281, Dec. 1993.
[18] M. J. Borodkin and J. T. Thompson, “Retinal cartography: An analysisof two-dimensional and three-dimensional mapping of the retina,”Retina—J. Retinal, Vitreous Diseases,vol. 12, no. 3, pp. 273–280, 1992.
[19] A. A. Mahurkar, B. L. Trus, M. A. Vivino, E. M. Kuehl, M. B.Datiles, and M. I. Kaiser-Kupfer, “Retinal fundus photo montages: Anew computer based method,”Investigat. Ophthalmol., Visual Sci.,vol.36, no. 4, Mar. 1995.
[20] P. Dani and S. Chaudhuri, “Automated assembling of images—Imagemontage preparation,”Pattern Recogn.,vol. 28, no. 1, pp. 431–445,Mar. 1995.
[21] D. Milgram, “Adaptive techniques for photomosaicking,”IEEE Trans.Comput.,vol. C-26, no. 11, pp. 1175–1180, Nov. 1977.
[22] M. Goldbaum, N. Katz, S. Chaudhuri, M. Nelson, and P. Kube, “Digitalimage processing for ocular fundus images,”Ophthalmol. Clin. N.Amer.,vol. 3, no. 3, pp. 447–466, Sept. 1990.
[23] R. Jagoe, J. Arnold, C. Blauth, P. L. C. Smith, P. M. Taylor, andR. Wootton, “Measurement of capillary dropout in retinal angiogramsby computerized image analysis,”Pattern Recogn. Lett.,vol. 13, pp.143–151, Feb. 1992.
[24] S. Chaudhuri, S. Chtterjee, N. Katz, M. Nelson, and M. Goldbaum,“Detection of blood vessels in retinal images using two-dimensionalmatched filters,”IEEE Trans. Med. Imag., vol. 8, no. 3, pp. 263–269,Sept. 1989.
[25] A. V. Cideciyan, “Registration of ocular fundus images,”IEEE Eng.Med., Biol., Mag., vol. 14, no. 1, pp. 52–58, Jan./Feb. 1995.
[26] K. E. Rayner, Ed.,Eye Movements and Visual Cognition: Scene Per-ception and Reading,Springer Series in Neuropsychology. New York:Springer-Verlag, 1992.
[27] M. H. Goldbaum, V. Kouznetsova, B. L. Cot´e, W. E. Hart, and M.Nelson, “Automated registration of digital ocular fundus images forcomparison of lesions,” inSPIE: Ophthalmic Technologies III,1993,vol. 1877, pp. 94–99.
[28] L. S. Davis, “A survey of edge detection techniques,”Comput. Graphics,Image Processing,vol. 4, pp. 248–270, 1975.
[29] R. M. Haralick and L. G. Shapiro,Computer and Robot Vision,vol. 1.Reading, MA: Addison-Wesley, 1992.
[30] E. Anarim, H. Aydinoglu, and I. C. Goknar, “Decision based edgedetector,”Signal Processing,vol. 35, pp. 149–156, Jan. 1994.
[31] G. S. Watson,Statistics on Spheres.New York: Wiley, 1983.[32] G. Stockman, S. Kopstein, and S. Benett, “Matching images to models
for registration and object detection via clustering,”IEEE Trans. PatternAnal. Machine Intell.,vol. 3, no. 3, pp. 229–241, 1982.
[33] G. Stockman and J. C. Esteva, “3-D object pose from clustering withmultiple views,” Pattern Recogn. Lett.,vol. 3, pp. 279–286, 1985.
[34] L. G. Brown, “A survey of image registration techniques,”ACMComputing Surveys,vol. 24, no. 4, pp. 325–376, Dec. 1992.
[35] D. I. Barnea and H. F. Silverman, “A class of algorithms for fast digitalimage registration,”IEEE Trans. Comput.,vol. C-21, no. 2, pp. 179–186,Feb. 1972.
[36] E. Peli, R. A. Augliere, and G. T. Timberlake, “Feature-based registra-tion of retinal images,”IEEE Trans. Med. Imag., vol. 6, no. 3, Sept.1987.
[37] B. Ravichandran and A. C. Sanderson, “Model-based matching using ahybrid genetic algorithm,” inProc. 1994 IEEE Int. Conf. Robotics andAutomat.,pp. 2064–2069, 1994.
[38] S. Umeyama, “Least-squares estimation of transformation parametersbetween two point patterns,”IEEE Trans. Pattern Anal. Machine Intell.,vol. 13, no. 4, pp. 376–380, Apr. 1991.
Douglas E. Beckerwas born on December 4, 1970.He received the B.S. degree in 1990, the M.S.degree in 1991, and the Ph.D. degree in 1995, all incomputer and systems engineering from RensselaerPolytechnic Institute, Troy, NY.
He is currently a Principal Software Engineerat Siemens Medical Systems, Nuclear MedicineGroup, Hoffman Estates, IL. His current researchinterests are in medical image analysis, image reg-istration, and high-speed computer architectures.
Ali Can received the B.S. degree in electrical en-gineering from University of Gaziantep, Turkey, in1993, and the M.S. degree in computer and systemsengineering from Rennselaer Polytechnic Institute(RPI), Troy, NY, in 1997. Currently, he is a Ph.D.degree student at RPI.
His research interests include biomedical imageprocessing and real-time applications, motion andstructure estimation (2-D and 3-D) from imagesequences.
Mr. Can is a member of the Microscopy Societyof America.

118 IEEE TRANSACTIONS ON BIOMEDICAL ENGINEERING, VOL. 45, NO. 1, JANUARY 1998
James N. Turner received the B.S. degree inengineering science in 1968 and the Ph.D. degreein biophysics in 1973 from the State University ofNew York at Buffalo.
He did National Institutes of Health (NIH) andNational Science Foundation (NSF) postdoctoralfellowships at the Roswell Park Memorial Institute,Buffalo. Currently, he is Director of the Three-Dimensional Light Microscopy Facility at theWadsworth Center of the New York State De-partment of Health, Albany. He is also Professor of
Biomedical Engineering at Rensselaer Polytechnic Institute and BiomedicalSciences in the School of Public Health of the University at Albany. Hisinterests focus on applications of light imaging methods and quantitativeimage analysis in biology and medicine, with special emphasis on thenervous system.
Dr. Turner is on the Editorial Boards ofMicroscopy and Microanalysisand Microscopy Research Techniques, and he has chaired numerous symposiain the area of 3-D microscopy both light and electron at meetings of theMicroscopy Society of America. He is a member of the Microscopy Societyof America, International Society for Analytical Cytology, AAAS, and theSociety for Neuroscience. He frequently serves on NIH advisory panels.
Howard L. Tanenbaum received the B.Sc. degreeand the M.D., C.M. from McGill University, Mon-treal, P.Q., Canada in 1961.
He is a Fellow of the Royal College of Physi-cians and Surgeons of Canada. He has taught oph-thalmology at various levels at the University ofColorado, Boulder, (1962–1963), Montreal Gen-eral Hospital, Montreal, P.Q., Canada (1968–1969),Jewish General Hospital, Montreal, P.Q., Canada(1968–1984), McGill University (1968–1984), andAlbany Medical College, Albany, NY (1984–1987).
He is currently Director of The Center for Sight in Albany, NY. His researchinterests are in proliferative vitreoretinal diseases, diabetic retinopathy, neo-vascularization, and a variety of laser-related issues.
Dr. Tanenbaum is a member of the Association for Research in Visionand Ophthalmology (ARVO), Canadian Medical Association, The RetinaSociety, American Academy of Ophthalmology, New York Academy ofScience, Quebec Retina Club, Macula Society, Northeast Eye, Ear, and ThroatSociety of New York, New York State Medical Society, New York StateOphthalmological Society, and The American Medical Association. He ison the Editorial Committee of the National Eye Trauma Registry, and isContributing Editor to the journalOphthalmic Practice.
Badrinath Roysam (M’89) received the B.Tech.degree in electronics engineering from the IndianInstitute of Technology, Madras, India, in 1984 andthe M.S. and D.Sc. degrees in electrical engineeringfrom Washington University, St. Louis, MO, in 1987and 1989, respectively.
He has been at Rensselaer Polytechnic Institute,Troy, NY, since 1989. He is currently an AssociateProfessor in the Electrical, Computer, and SystemsEngineering department. He co-founded AutoQuantImaging Systems Inc., Troy, NY. He has also con-
sulted for various major and small corporations on imaging systems andimage processing, and has assisted venture capital companies with detailedanalysis of startup companies. His current research interests are in the areas ofbiomedical image analysis, optical instrumentation, high-speed and real-timecomputing architectures, parallel algorithms, and other compelling medicalapplications.
Dr. Roysam is a member of the Microscopy Society of America (MSA)and the Association for Research in Vision and Ophthalmology (ARVO).
Copyright © 2022 FDOKUMEN