
Automated Image Detection of Retinal Pathology
386
-
Upload
independent -
Category
Documents
-
view
1 -
download
0
Transcript of Automated Image Detection of Retinal Pathology


AutomatedImage Detection
of RETINALPATHOLOGY
7556_FM.indd 1 9/9/09 3:56:01 PM

7556_FM.indd 2 9/9/09 3:56:01 PM

Edited byHERBERT F. JELINEK
MICHAEL J. CREE
AutomatedImage Detection
of RETINALPATHOLOGY
CRC Press is an imprint of theTaylor & Francis Group, an informa business
Boca Raton London New York
7556_FM.indd 3 9/9/09 3:56:01 PM

CRC PressTaylor & Francis Group6000 Broken Sound Parkway NW, Suite 300Boca Raton, FL 33487-2742
© 2010 by Taylor and Francis Group, LLCCRC Press is an imprint of Taylor & Francis Group, an Informa business
No claim to original U.S. Government works
Printed in the United States of America on acid-free paper10 9 8 7 6 5 4 3 2 1
International Standard Book Number: 978-0-8493-7556-9 (Hardback)
This book contains information obtained from authentic and highly regarded sources. Reasonable efforts have been made to publish reliable data and information, but the author and publisher cannot assume responsibility for the validity of all materials or the consequences of their use. The authors and publishers have attempted to trace the copyright holders of all material reproduced in this publication and apologize to copyright holders if permission to publish in this form has not been obtained. If any copyright material has not been acknowledged please write and let us know so we may rectify in any future reprint.
Except as permitted under U.S. Copyright Law, no part of this book may be reprinted, reproduced, trans-mitted, or utilized in any form by any electronic, mechanical, or other means, now known or hereafter invented, including photocopying, microfilming, and recording, or in any information storage or retrieval system, without written permission from the publishers.
For permission to photocopy or use material electronically from this work, please access www.copyright.com (http://www.copyright.com/) or contact the Copyright Clearance Center, Inc. (CCC), 222 Rosewood Drive, Danvers, MA 01923, 978-750-8400. CCC is a not-for-profit organization that provides licenses and registration for a variety of users. For organizations that have been granted a photocopy license by the CCC, a separate system of payment has been arranged.
Trademark Notice: Product or corporate names may be trademarks or registered trademarks, and are used only for identification and explanation without intent to infringe.
Library of Congress Cataloging‑in‑Publication Data
Automated image detection of retinal pathology / editors, Herbert Jelinek, Michael J. Cree.
p. ; cm.Includes bibliographical references and index.ISBN 978-0-8493-7556-9 (hardcover : alk. paper)1. Retina--Diseases--Imaging--Data processing. 2. Image processing--Digital
techniques. 3. Diabetic retinopathy--Imaging--Data processing. I. Jelinek, Herbert. II. Cree, Michael J.
[DNLM: 1. Retinal Diseases--diagnosis. 2. Diagnosis, Computer-Assisted. 3. Diagnostic Imaging--methods. 4. Retina--pathology. WW 270 A939 2010]
RE551.A98 2010617.7’350754--dc22 2009025019
Visit the Taylor & Francis Web site athttp://www.taylorandfrancis.com
and the CRC Press Web site athttp://www.crcpress.com
7556_FM.indd 4 9/9/09 3:56:01 PM

Contents
Preface xiii
Contributors xvii
1 Introduction 1H. F. Jelinek and M. J. Cree1.1 Why Automated Image Detection of Retinal Pathology? . . . . . 1
1.1.1 The general clinical need . . . . . . . . . . . . . . . . . . 21.1.2 Diabetes: A global problem . . . . . . . . . . . . . . . . . 21.1.3 Diabetic retinopathy . . . . . . . . . . . . . . . . . . . . . 21.1.4 Eye-screening for diabetic retinopathy . . . . . . . . . . . 31.1.5 Other retinal pathologies . . . . . . . . . . . . . . . . . . 51.1.6 The retina as an indicator for disease elsewhere . . . . . . 61.1.7 Research needs in automated retinopathy detection . . . . 61.1.8 The engineering opportunity . . . . . . . . . . . . . . . . 7
1.2 Automated Assessment of Retinal Eye Disease . . . . . . . . . . 71.2.1 Automated microaneurysm detection in diabetic retinopathy 81.2.2 Hemorrhages . . . . . . . . . . . . . . . . . . . . . . . . 91.2.3 White lesion segmentation . . . . . . . . . . . . . . . . . 91.2.4 Localization of important markers . . . . . . . . . . . . . 101.2.5 Retinal vessel diameter changes in disease . . . . . . . . . 111.2.6 Retinal blood vessel segmentation . . . . . . . . . . . . . 111.2.7 Mathematical analysis of vessel patterns . . . . . . . . . . 12
1.3 The Contribution of This Book . . . . . . . . . . . . . . . . . . . 13
2 Diabetic Retinopathy and Public Health 27D. Worsley and D. Simmons2.1 Introduction . . . . . . . . . . . . . . . . . . . . . . . . . . . . . 272.2 The Pandemic of Diabetes and Its Complications . . . . . . . . . 282.3 Retinal Structure and Function . . . . . . . . . . . . . . . . . . . 292.4 Definition and Description . . . . . . . . . . . . . . . . . . . . . 352.5 Classification of Diabetic Retinopathy . . . . . . . . . . . . . . . 402.6 Differential Diagnosis of Diabetic Retinopathy . . . . . . . . . . 402.7 Systemic Associations of Diabetic Retinopathy . . . . . . . . . . 42
2.7.1 Duration of diabetes . . . . . . . . . . . . . . . . . . . . . 422.7.2 Type of diabetes . . . . . . . . . . . . . . . . . . . . . . . 422.7.3 Blood glucose control . . . . . . . . . . . . . . . . . . . . 422.7.4 Blood pressure . . . . . . . . . . . . . . . . . . . . . . . 42
v

vi CONTENTS
2.7.5 Serum lipids . . . . . . . . . . . . . . . . . . . . . . . . . 432.7.6 Renal disease . . . . . . . . . . . . . . . . . . . . . . . . 432.7.7 Anemia . . . . . . . . . . . . . . . . . . . . . . . . . . . 432.7.8 Pregnancy . . . . . . . . . . . . . . . . . . . . . . . . . . 432.7.9 Smoking . . . . . . . . . . . . . . . . . . . . . . . . . . . 43
2.8 Pathogenesis . . . . . . . . . . . . . . . . . . . . . . . . . . . . 432.8.1 Hyperglycemia . . . . . . . . . . . . . . . . . . . . . . . 432.8.2 Hematological abnormalities . . . . . . . . . . . . . . . . 442.8.3 Leukostasis and inflammation . . . . . . . . . . . . . . . 442.8.4 Growth factors . . . . . . . . . . . . . . . . . . . . . . . 442.8.5 Neurodegeneration . . . . . . . . . . . . . . . . . . . . . 45
2.9 Treatment . . . . . . . . . . . . . . . . . . . . . . . . . . . . . . 452.9.1 Management of systemic associations . . . . . . . . . . . 452.9.2 Ocular treatments . . . . . . . . . . . . . . . . . . . . . . 452.9.3 Investigational treatments . . . . . . . . . . . . . . . . . . 46
2.10 Screening . . . . . . . . . . . . . . . . . . . . . . . . . . . . . . 482.10.1 Methods of screening . . . . . . . . . . . . . . . . . . . . 482.10.2 Frequency of screening . . . . . . . . . . . . . . . . . . . 542.10.3 Cost effectiveness of screening . . . . . . . . . . . . . . . 542.10.4 Access to care and screening . . . . . . . . . . . . . . . . 54
2.11 Conclusion . . . . . . . . . . . . . . . . . . . . . . . . . . . . . 55
3 Detecting Retinal Pathology Automatically with Special Emphasis onDiabetic Retinopathy 67M. D. Abramoff and M. Niemeijer3.1 Historical Aside . . . . . . . . . . . . . . . . . . . . . . . . . . 673.2 Approaches to Computer (Aided) Diagnosis . . . . . . . . . . . . 683.3 Detection of Diabetic Retinopathy Lesions . . . . . . . . . . . . 703.4 Detection of Lesions and Segmentation of Retinal Anatomy . . . 713.5 Detection and Staging of Diabetic Retinopathy: Pixel to Patient . 713.6 Directions for Research . . . . . . . . . . . . . . . . . . . . . . 72
4 Finding a Role for Computer-Aided Early Diagnosis of DiabeticRetinopathy 79L. B. Backlund4.1 Mass Examinations of Eyes in Diabetes . . . . . . . . . . . . . . 79
4.1.1 Motive for accurate early diagnosis of retinopathy . . . . . 804.1.2 Definition of screening . . . . . . . . . . . . . . . . . . . 814.1.3 Practical importance of the concept of screening . . . . . . 814.1.4 Coverage and timely re-examination . . . . . . . . . . . . 81
4.2 Developing and Defending a Risk Reduction Program . . . . . . 824.2.1 Explaining why retinopathy is suitable for screening . . . . 824.2.2 Understanding reasons for possible criticism . . . . . . . . 834.2.3 Fulfilling criteria for screening tests . . . . . . . . . . . . 834.2.4 Setting quality assurance standards . . . . . . . . . . . . . 84
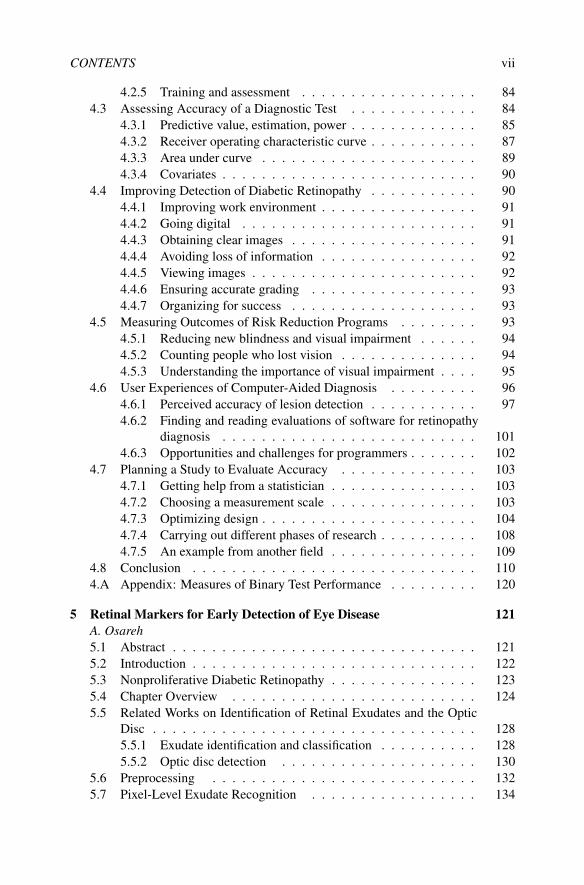
CONTENTS vii
4.2.5 Training and assessment . . . . . . . . . . . . . . . . . . 844.3 Assessing Accuracy of a Diagnostic Test . . . . . . . . . . . . . 84
4.3.1 Predictive value, estimation, power . . . . . . . . . . . . . 854.3.2 Receiver operating characteristic curve . . . . . . . . . . . 874.3.3 Area under curve . . . . . . . . . . . . . . . . . . . . . . 894.3.4 Covariates . . . . . . . . . . . . . . . . . . . . . . . . . . 90
4.4 Improving Detection of Diabetic Retinopathy . . . . . . . . . . . 904.4.1 Improving work environment . . . . . . . . . . . . . . . . 914.4.2 Going digital . . . . . . . . . . . . . . . . . . . . . . . . 914.4.3 Obtaining clear images . . . . . . . . . . . . . . . . . . . 914.4.4 Avoiding loss of information . . . . . . . . . . . . . . . . 924.4.5 Viewing images . . . . . . . . . . . . . . . . . . . . . . . 924.4.6 Ensuring accurate grading . . . . . . . . . . . . . . . . . 934.4.7 Organizing for success . . . . . . . . . . . . . . . . . . . 93
4.5 Measuring Outcomes of Risk Reduction Programs . . . . . . . . 934.5.1 Reducing new blindness and visual impairment . . . . . . 944.5.2 Counting people who lost vision . . . . . . . . . . . . . . 944.5.3 Understanding the importance of visual impairment . . . . 95
4.6 User Experiences of Computer-Aided Diagnosis . . . . . . . . . 964.6.1 Perceived accuracy of lesion detection . . . . . . . . . . . 974.6.2 Finding and reading evaluations of software for retinopathy
diagnosis . . . . . . . . . . . . . . . . . . . . . . . . . . 1014.6.3 Opportunities and challenges for programmers . . . . . . . 102
4.7 Planning a Study to Evaluate Accuracy . . . . . . . . . . . . . . 1034.7.1 Getting help from a statistician . . . . . . . . . . . . . . . 1034.7.2 Choosing a measurement scale . . . . . . . . . . . . . . . 1034.7.3 Optimizing design . . . . . . . . . . . . . . . . . . . . . . 1044.7.4 Carrying out different phases of research . . . . . . . . . . 1084.7.5 An example from another field . . . . . . . . . . . . . . . 109
4.8 Conclusion . . . . . . . . . . . . . . . . . . . . . . . . . . . . . 1104.A Appendix: Measures of Binary Test Performance . . . . . . . . . 120
5 Retinal Markers for Early Detection of Eye Disease 121A. Osareh5.1 Abstract . . . . . . . . . . . . . . . . . . . . . . . . . . . . . . . 1215.2 Introduction . . . . . . . . . . . . . . . . . . . . . . . . . . . . . 1225.3 Nonproliferative Diabetic Retinopathy . . . . . . . . . . . . . . . 1235.4 Chapter Overview . . . . . . . . . . . . . . . . . . . . . . . . . 1245.5 Related Works on Identification of Retinal Exudates and the Optic
Disc . . . . . . . . . . . . . . . . . . . . . . . . . . . . . . . . . 1285.5.1 Exudate identification and classification . . . . . . . . . . 1285.5.2 Optic disc detection . . . . . . . . . . . . . . . . . . . . 130
5.6 Preprocessing . . . . . . . . . . . . . . . . . . . . . . . . . . . 1325.7 Pixel-Level Exudate Recognition . . . . . . . . . . . . . . . . . 134

viii CONTENTS
5.8 Application of Pixel-Level Exudate Recognition on the WholeRetinal Image . . . . . . . . . . . . . . . . . . . . . . . . . . . . 137
5.9 Locating the Optic Disc in Retinal Images . . . . . . . . . . . . . 1395.9.1 Template matching . . . . . . . . . . . . . . . . . . . . . 1415.9.2 Color morphology preprocessing . . . . . . . . . . . . . . 1415.9.3 Accurate localization of the optic disc-based snakes . . . . 1445.9.4 Optic disc localization results . . . . . . . . . . . . . . . 146
5.10 Conclusion . . . . . . . . . . . . . . . . . . . . . . . . . . . . . 148
6 Automated Microaneurysm Detection for Screening 155M. J. Cree6.1 Characteristics of Microaneurysms and Dot-Hemorrhages . . . . 1556.2 History of Automated Microaneurysm Detection . . . . . . . . . 156
6.2.1 Early morphological approaches . . . . . . . . . . . . . . 1566.2.2 The “standard approach” to automated microaneurysm
detection . . . . . . . . . . . . . . . . . . . . . . . . . . . 1576.2.3 Extensions of the standard approach . . . . . . . . . . . . 1596.2.4 Other approaches . . . . . . . . . . . . . . . . . . . . . . 1626.2.5 General red lesion detection . . . . . . . . . . . . . . . . 164
6.3 Microaneurysm Detection in Color Retinal Images . . . . . . . . 1656.4 The Waikato Automated Microaneurysm Detector . . . . . . . . 167
6.4.1 Further comments on the use of color . . . . . . . . . . . 1716.5 Issues for Microaneurysm Detection . . . . . . . . . . . . . . . . 172
6.5.1 Image quality assessment . . . . . . . . . . . . . . . . . . 1726.5.2 Image compression implications . . . . . . . . . . . . . . 1736.5.3 Optic disc detection . . . . . . . . . . . . . . . . . . . . . 1756.5.4 Meaningful comparisons of implementations . . . . . . . 175
6.6 Research Application of Microaneurysm Detection . . . . . . . . 1776.7 Conclusion . . . . . . . . . . . . . . . . . . . . . . . . . . . . . 178
7 Retinal Vascular Changes as Biomarkers of Systemic CardiovascularDiseases 185N. Cheung, T. Y. Wong, and L. Hodgson7.1 Introduction . . . . . . . . . . . . . . . . . . . . . . . . . . . . . 1857.2 Early Description of Retinal Vascular Changes . . . . . . . . . . 1867.3 Retinal Vascular Imaging . . . . . . . . . . . . . . . . . . . . . . 187
7.3.1 Assessment of retinal vascular signs from retinal photographs 1877.3.2 Limitations in current retinal vascular imaging techniques . 187
7.4 Retinal Vascular Changes and Cardiovascular Disease . . . . . . 1897.4.1 Hypertension . . . . . . . . . . . . . . . . . . . . . . . . 1897.4.2 Stroke and cerebrovascular disease . . . . . . . . . . . . 1917.4.3 Coronary heart disease and congestive heart failure . . . . 193
7.5 Retinal Vascular Changes and Metabolic Diseases . . . . . . . . 1947.5.1 Diabetes mellitus . . . . . . . . . . . . . . . . . . . . . . 1967.5.2 The metabolic syndrome . . . . . . . . . . . . . . . . . . 196
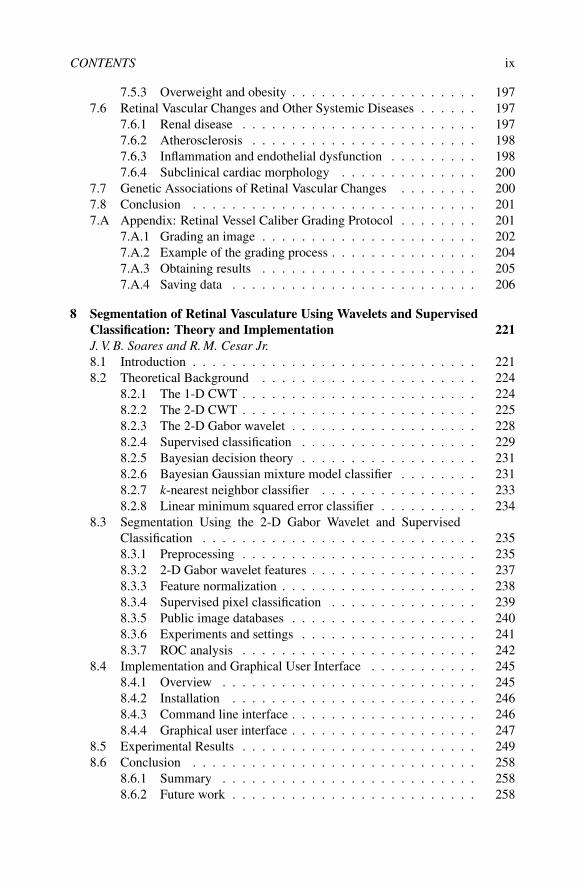
CONTENTS ix
7.5.3 Overweight and obesity . . . . . . . . . . . . . . . . . . . 1977.6 Retinal Vascular Changes and Other Systemic Diseases . . . . . . 197
7.6.1 Renal disease . . . . . . . . . . . . . . . . . . . . . . . . 1977.6.2 Atherosclerosis . . . . . . . . . . . . . . . . . . . . . . . 1987.6.3 Inflammation and endothelial dysfunction . . . . . . . . . 1987.6.4 Subclinical cardiac morphology . . . . . . . . . . . . . . 200
7.7 Genetic Associations of Retinal Vascular Changes . . . . . . . . 2007.8 Conclusion . . . . . . . . . . . . . . . . . . . . . . . . . . . . . 2017.A Appendix: Retinal Vessel Caliber Grading Protocol . . . . . . . . 201
7.A.1 Grading an image . . . . . . . . . . . . . . . . . . . . . . 2027.A.2 Example of the grading process . . . . . . . . . . . . . . . 2047.A.3 Obtaining results . . . . . . . . . . . . . . . . . . . . . . 2057.A.4 Saving data . . . . . . . . . . . . . . . . . . . . . . . . . 206
8 Segmentation of Retinal Vasculature Using Wavelets and SupervisedClassification: Theory and Implementation 221J. V. B. Soares and R. M. Cesar Jr.8.1 Introduction . . . . . . . . . . . . . . . . . . . . . . . . . . . . . 2218.2 Theoretical Background . . . . . . . . . . . . . . . . . . . . . . 224
8.2.1 The 1-D CWT . . . . . . . . . . . . . . . . . . . . . . . . 2248.2.2 The 2-D CWT . . . . . . . . . . . . . . . . . . . . . . . . 2258.2.3 The 2-D Gabor wavelet . . . . . . . . . . . . . . . . . . . 2288.2.4 Supervised classification . . . . . . . . . . . . . . . . . . 2298.2.5 Bayesian decision theory . . . . . . . . . . . . . . . . . . 2318.2.6 Bayesian Gaussian mixture model classifier . . . . . . . . 2318.2.7 k-nearest neighbor classifier . . . . . . . . . . . . . . . . 2338.2.8 Linear minimum squared error classifier . . . . . . . . . . 234
8.3 Segmentation Using the 2-D Gabor Wavelet and SupervisedClassification . . . . . . . . . . . . . . . . . . . . . . . . . . . . 2358.3.1 Preprocessing . . . . . . . . . . . . . . . . . . . . . . . . 2358.3.2 2-D Gabor wavelet features . . . . . . . . . . . . . . . . . 2378.3.3 Feature normalization . . . . . . . . . . . . . . . . . . . . 2388.3.4 Supervised pixel classification . . . . . . . . . . . . . . . 2398.3.5 Public image databases . . . . . . . . . . . . . . . . . . . 2408.3.6 Experiments and settings . . . . . . . . . . . . . . . . . . 2418.3.7 ROC analysis . . . . . . . . . . . . . . . . . . . . . . . . 242
8.4 Implementation and Graphical User Interface . . . . . . . . . . . 2458.4.1 Overview . . . . . . . . . . . . . . . . . . . . . . . . . . 2458.4.2 Installation . . . . . . . . . . . . . . . . . . . . . . . . . 2468.4.3 Command line interface . . . . . . . . . . . . . . . . . . . 2468.4.4 Graphical user interface . . . . . . . . . . . . . . . . . . . 247
8.5 Experimental Results . . . . . . . . . . . . . . . . . . . . . . . . 2498.6 Conclusion . . . . . . . . . . . . . . . . . . . . . . . . . . . . . 258
8.6.1 Summary . . . . . . . . . . . . . . . . . . . . . . . . . . 2588.6.2 Future work . . . . . . . . . . . . . . . . . . . . . . . . . 258

x CONTENTS
9 Determining Retinal Vessel Widths and Detection of Width Changes 269K. H. Fritzsche, C. V. Stewart, and B. Roysam9.1 Identifying Blood Vessels . . . . . . . . . . . . . . . . . . . . . 2709.2 Vessel Models . . . . . . . . . . . . . . . . . . . . . . . . . . . 2709.3 Vessel Extraction Methods . . . . . . . . . . . . . . . . . . . . . 2719.4 Can’s Vessel Extraction Algorithm . . . . . . . . . . . . . . . . . 271
9.4.1 Improving Can’s algorithm . . . . . . . . . . . . . . . . . 2729.4.2 Limitations of the modified Can algorithm . . . . . . . . . 275
9.5 Measuring Vessel Width . . . . . . . . . . . . . . . . . . . . . . 2769.6 Precise Boundary Detection . . . . . . . . . . . . . . . . . . . . 2789.7 Continuous Vessel Models with Spline-Based Ribbons . . . . . . 279
9.7.1 Spline representation of vessels . . . . . . . . . . . . . . . 2799.7.2 B-spline ribbons . . . . . . . . . . . . . . . . . . . . . . . 284
9.8 Estimation of Vessel Boundaries Using Snakes . . . . . . . . . . 2889.8.1 Snakes . . . . . . . . . . . . . . . . . . . . . . . . . . . . 2889.8.2 Ribbon snakes . . . . . . . . . . . . . . . . . . . . . . . . 2899.8.3 B-spline ribbon snake . . . . . . . . . . . . . . . . . . . . 2899.8.4 Cross section-based B-spline snakes . . . . . . . . . . . . 2929.8.5 B-spline ribbon snakes comparison . . . . . . . . . . . . . 293
9.9 Vessel Width Change Detection . . . . . . . . . . . . . . . . . . 2949.9.1 Methodology . . . . . . . . . . . . . . . . . . . . . . . . 2949.9.2 Change detection via hypothesis test . . . . . . . . . . . . 2969.9.3 Summary . . . . . . . . . . . . . . . . . . . . . . . . . . 298
9.10 Conclusion . . . . . . . . . . . . . . . . . . . . . . . . . . . . . 298
10 Geometrical and Topological Analysis of Vascular Branches fromFundus Retinal Images 305N. W. Witt, M. E. Martınez-Perez, K. H. Parker, S. A. McG. Thom, andA. D. Hughes10.1 Introduction . . . . . . . . . . . . . . . . . . . . . . . . . . . . . 30510.2 Geometry of Vessel Segments and Bifurcations . . . . . . . . . . 306
10.2.1 Arterial to venous diameter ratio . . . . . . . . . . . . . . 30610.2.2 Bifurcation geometry . . . . . . . . . . . . . . . . . . . . 30810.2.3 Vessel length to diameter ratios . . . . . . . . . . . . . . . 31110.2.4 Tortuosity . . . . . . . . . . . . . . . . . . . . . . . . . . 312
10.3 Vessel Diameter Measurements from Retinal Images . . . . . . . 31210.3.1 The half-height method . . . . . . . . . . . . . . . . . . . 31310.3.2 Double Gaussian fitting . . . . . . . . . . . . . . . . . . . 31410.3.3 The sliding linear regression filter (SLRF) . . . . . . . . . 314
10.4 Clinical Findings from Retinal Vascular Geometry . . . . . . . . 31510.5 Topology of the Vascular Tree . . . . . . . . . . . . . . . . . . . 318
10.5.1 Strahler branching ratio . . . . . . . . . . . . . . . . . . . 32110.5.2 Path length . . . . . . . . . . . . . . . . . . . . . . . . . 32110.5.3 Number of edges . . . . . . . . . . . . . . . . . . . . . . 32110.5.4 Tree asymmetry index . . . . . . . . . . . . . . . . . . . . 322

CONTENTS xi
10.6 Automated Segmentation and Analysis of Retinal Fundus Images 32310.6.1 Feature extraction . . . . . . . . . . . . . . . . . . . . . . 32410.6.2 Region growing . . . . . . . . . . . . . . . . . . . . . . . 32610.6.3 Analysis of binary images . . . . . . . . . . . . . . . . . 327
10.7 Clinical Findings from Retinal Vascular Topology . . . . . . . . 32810.8 Conclusion . . . . . . . . . . . . . . . . . . . . . . . . . . . . . 329
11 Tele-Diabetic Retinopathy Screening and Image-Based ClinicalDecision Support 339K. Yogesan, F. Reinholz, and I. J. Constable11.1 Introduction . . . . . . . . . . . . . . . . . . . . . . . . . . . . . 33911.2 Telemedicine . . . . . . . . . . . . . . . . . . . . . . . . . . . . 339
11.2.1 Image capture . . . . . . . . . . . . . . . . . . . . . . . . 34011.2.2 Image resolution . . . . . . . . . . . . . . . . . . . . . . 34111.2.3 Image transmission . . . . . . . . . . . . . . . . . . . . . 34211.2.4 Image compression . . . . . . . . . . . . . . . . . . . . . 342
11.3 Telemedicine Screening for Diabetic Retinopathy . . . . . . . . 34411.4 Image-Based Clinical Decision Support Systems . . . . . . . . . 34611.5 Conclusion . . . . . . . . . . . . . . . . . . . . . . . . . . . . . 347
Index 351


Preface
With the start of the 21st century, digital image processing and analysis is coming ofage. Advances in hardware for capturing the minute detail in biological tissues suchas the retina, and the unrelenting improvement in computational power in accordancewith Moore’s law, have provided the basis for mathematicians, computer scientists,and engineers to apply pattern recognition and image analysis in medical and bio-logical applications. A better understanding of disease processes, which incorporatepreclinical markers that identify people at risk combined with medical advances indiagnosis and treatment pave the way for improvement in health care generally andspecifically for people with retinal disease such as that found in diabetes.
Globally the prevalence of diabetes mellitus is on the rise and with it the asso-ciated complications including retinopathy, heart disease, and peripheral vasculardisease. Early detection of features often not directly discernible by clinical inves-tigation has the potential to reduce the global burden of diabetes and cardiovasculardisease. Although there are good public health reasons for screening certain popu-lations or sub-populations, several factors need to be considered as outlined by theWorld Health Organization. These include the following: the disease is an impor-tant health problem, the natural history of the disease needs to be understood, thereshould be a detectable early stage, and treatment at the early stage should be morebeneficial than treatment at later stages of disease. Diabetes and cardiovascular dis-ease meet these criteria.
Diabetic retinopathy (DR) and heart disease are associated with changes in thecharacteristics of the blood vessels either in the retina, heart, or in the peripheralcirculation. The retina is a tissue that is easily accessible and investigated. Signs ofdeveloping or current diabetic retinopathy and heart disease include changes in ves-sel diameter, occurrence of vessel tortuosity, new vessel growth, small enlargementsof retinal capillaries referred to as microaneurysms, small and large hemorrhages andlipid exudates. Changes in either venule or arteriolar diameter have been associatedwith an increased risk of diabetes, hypertension, cardiovascular disease, and stroke.Even small increases in blood sugar levels, being below the accepted concentrationfor the diagnosis of diabetes, can affect the retina and lead to the presence of microa-neurysms. To assess an appropriate number of people in the community, screeningmethods have to be economical, accurate, and easily performed. Therefore, auto-mated assessment of preclinical or clinical signs associated with diabetic retinopathyand cardiovascular disease has been of great interest.
Engineering tools such as digital image processing combined with advanced ma-chine learning allow identification and automated classification of features, lesions,and retinal changes in digital images of the retina. Objective diagnostic criteria fordiabetic retinopathy progression have been available for 30 years, with the Early
xiii

xiv Automated Image Detection of Retinal Pathology
Treatment Diabetic Retinopathy Study providing a robust tool in 1991. Various per-mutations of this classification system have been proposed but essentially the gradingsystem includes: minimal, mild, moderate, and severe nonproliferative retinopathyand proliferative retinopathy, both with or without macular involvement. Each ofthese stages is associated with the presence of particular pathological features. Bycombining different branches of engineering and medicine it has become possible toutilize today’s technology and to contribute to the needs of physicians in providingoptimal health care.
For any computer-based classification system to be successful the images need tobe of adequate quality and resolution. The resolution of digital images can now ex-ceed 10 megapixels and arguably surpasses the 35 mm photographic standard. Therehas been work carried out in image preprocessing that addresses uneven retinal illu-mination, poor focus, or differences in background epithelium hue. The optic discis the main feature in the retinal fundus. Numerous methods in image analysis suchas using the measure of pixel intensity variance of a window size equal to the opticdisc for locating the optic disc to applying the Hough transform and snake-basedalgorithms for identification of the boundary of the optic disk have been proposed.Automated microaneurysm segmentation was first applied to fluorescein-labeled im-ages in the early 1990s and recently extended to nonmydriatic color retinal images.The latter is well suited for large population screening as it is noninvasive and eco-nomical. The literature on retinal vessel segmentation is numerous and varied. Morework is needed, not only to characterize and compare algorithms, but also to improvealgorithms to achieve better reliability in segmenting vessels. Segmentation of thevascular tree allows the determination of length, diameter, and coverage. It is alsorequired to allow identification of lesions associated with diabetic retinopathy pro-gression by removing the vessels as a confounder. Matched filters, local operatorssuch as wavelet transforms, local gradients in the form of the first and second deriva-tives, neural networks that sweep over the whole image, vessel tracking algorithms,and many other approaches have been proposed. Local variation in vessel widthsand vessel branching patterns can then be used to identify venous beading, vesselnicking, and the arteriolar-venous ratio.
Advances in automated image detection of retinal pathology require interactionand dialogue between practitioners from diverse fields. In this spirit, the contributorsto this book include engineers, physicists, computer scientists, and physicians toprovide a nexus between these fields. Each contributor is a recognized expert and hasmade significant contributions to the development of automated analysis of retinalimages. There is much that has been discovered and proved to be effective in researchinstitutes but has failed to make the transition to general clinical practice. Thereforemany problems are yet to be solved.
This book is intended for researchers in the diverse fields of engineering, mathe-matics, and physics, as well as biologists and physicians. It discusses the epidemiol-ogy of disease, screening protocols, algorithm development, image processing, andfeature analysis applied to the retina. Hopefully it inspires readers that automatedanalysis of retinal images is an exciting field, both for the physician and nonphysi-cian alike, and one in which many developments have been made, but much more

Preface xv
needs to be done if the products of our labor are to benefit the health of the commu-nity.
Chapter 1, by Jelinek and Cree, presents the general argument for automated im-age detection of retinal pathology. The field of diabetic retinopathy in terms ofpathologies that affect the retina and those that are possibly identifiable by auto-mated processing is emphasized. Prevalence and incidence of diabetic retinopathyare discussed with respect to the need for automated assessment. The chapter furtheroutlines the use of automated retinal assessment as an indicator for disease elsewheresuch as cardiovascular disease and peripheral vascular disease. A brief overview ofwork to date of automated image assessment of retinal disease is presented and op-portunities for further development are highlighted.
Before embarking on applying image analysis techniques to retinal images, oneneeds to be aware of the clinical context. Chapter 2, by Worsley and Simmons, fo-cuses on the pandemic of diabetes that is spurred by the reduction in physical activityand increases in energy-dense foods leading to an increase in obesity, insulin resis-tance, and Type 2 diabetes. The chapter discusses the importance of diabetic retino-pathy and its contribution to blindness as well as its utility in providing a window onthe natural history of diabetes in the population. The main focus is on how diabeticretinopathy is defined and classified, the disease process, the population distribution,and its prevention and screening for early changes.
Chapter 3, by Abramoff and Niemeijer, addresses optimization of retinal imagedigitization and detection of retinopathy. There are several approaches one can take,that is, decide whether there is disease / no disease or decide on progression. Thechapter focuses on the frequency of occurrence of disease indicators in relation to atypical screening population and how research emphasis needs to focus on makingautomated detection methods more robust for clinical practice.
Chapter 4, by Backlund, concentrates on outlining the reasons why well-designedretinopathy risk-reduction programs need to be implemented on a large scale. Con-siderable efforts are required to address the importance and difficulty of achievingreliable early diagnosis of DR at a reasonable cost and to evaluate computer-aideddiagnosis. Observations of a practitioner who has some experience with computer-aided diagnosis on why systems for automated detection of retinal lesions have madelittle impact to date, are presented.
Chapter 5, by Osareh, is the first to provide an application of the nexus betweenengineering and medicine. The chapter concentrates on detection of the optic discand retinal exudate identification. Color retinal images are classified to exudate andnonexudate classes following some preprocessing steps. The authors investigate Knearest neighbor, Gaussian quadratic, and Gaussian mixture model classifiers. Theoptic disc detection is based on color mathematical morphology and active contours.Implications for screening are discussed.
Cree, in Chapter 6, outlines the differences between microaneurysms and dot hem-orrhages as part of the disease process and how their presentation can be used forautomated detection and classification. Microaneurysms are usually the first signof diabetic retinopathy and a positive correlation between the number of microa-neurysms and disease progression has been reported. A historical background to

xvi Automated Image Detection of Retinal Pathology
automated detection of microaneurysms is followed by an overview of the standardapproach to microaneurysm detection and extensions of this standard approach in-cluding application for population screening of color digital images.
Certain subtle vascular changes in retinal images are believed to predict the risk ofdisease elsewhere in the body. In Chapter 7, Cheung, Wong and Hodgson, developthe case that the arteriolar-venous ratio measured from retinal images is a good pre-dictor of risk of diabetes, cardiovascular disease, and stroke as well as hypertension.
To automate measurement of features, such as the arteriolar-venous ratio, one mustfirst reliably segment the blood vessels of the retina. In Chapter 8, Soares and Cesar,focus on the use of wavelet transforms to segment retinal blood vessels, discussingfirst the theoretical background of 1-D, 2-D continuous wavelet transforms, and the2-D Gabor wavelet as a specific application that is suitable for blood vessel segmen-tation. Pixels are classified as either belonging to the vessel or not using a BayesianGaussian mixture model.
Chapters 9 (by Fritzsche et al.) and 10 (by Witt et al.) set the scene for analysis ofthe blood vessels including vessel diameter and branching angle, which can be indi-cators of pathology. Fritzsche et al. concentrate on how vessels can be detected usingdiverse models such as edge detectors, cross-sectional models, as well as algorithmsthat use intensity measures combined with thresholding, relaxation, morphologicaloperators or affine convex sets to identify ridges and valleys. Following considera-tion of vessel segmentation the measure of vessel width is considered. Two potentialissues arise, one being the orientation in which the width is measured and determina-tion of the points at which to begin and end the measurement. Witt and co-workersconcentrate on feature parameters associated with the geometry of vessel segmentsand bifurcations. One of the first parameters describing vascular geometry was theratio of arterial to venous diameters. The geometry of bifurcating vessels may havea significant impact on hemodynamics of the vessel network and include the bifur-cation angle, junction exponent, and tortuosity. These parameters are then discussedin the context of clinical findings such as hypertension, peripheral vascular disease,and ischemic heart disease.
The last chapter, by Yogesan et al., investigates the use of teleophthalmology inclinical practice. The chapter focuses on issues of image size and quality, healthcare costs, and early detection of diabetic retinopathy; and continues by consideringcombining teleophthalmology with automated assessment.

Contributors
Michael D. AbramoffUniversity of IowaIowa City, Iowa
Lars B. BacklundKarolinska Institutet and Uppsala UniversitetStockholm, Sweden
Roberto M. Cesar Jr.University of Sao PauloSao Paulo, Brazil
Ning CheungCentre for Eye Research AustraliaSpringfield, Australia
Ian J. ConstableThe Lions Eye InstituteNedlands, Australia
Michael J. CreeUniversity of WaikatoHamilton, New Zealand
Kenneth H. FritzscheUnited States Military AcademySpringfield, Virginia
Lauren HodgsonCentre for Eye Research AustraliaSpringfield, Australia
Alun D. HughesImperial CollegeLondon, United Kingdom
Herbert F. JelinekCharles Sturt UniversityAlbury, Australia
M. Elena Martınez-PerezNational Autonomous University of MexicoMexico City, Mexico
Meindert NiemeijerUniversity of IowaIowa City, Iowa
Alireza OsarehShahid Chamran University of AhvazAhvaz, Iran
Kim H. ParkerImperial CollegeLondon, United Kingdom
Fred ReinholzThe Lions Eye InstituteNedlands, Australia
Bardrinath RoysamRensselaer Polytechnic InstituteTroy, New York
David SimmonsWaikato Clinical SchoolHamilton, New Zealand
Joao V. B. SoaresUniversity of Sao PauloSao Paulo, Brazil
Charles V. StewartRensselaer Polytechnic InstituteTroy, New York
Simon A. McG. ThomImperial CollegeLondon, United Kingdom
xvii

xviii Automated Image Detection of Retinal Pathology
Nicholas W. WittImperial CollegeLondon, United Kingdom
Tien Y. WongCentre for Eye Research AustraliaSpringfield, Australia
David WorsleyWaikato Health Ltd.Hamilton, New Zealand
Kanagasingam YogesanThe Lions Eye InstituteNedlands, Australia

1Introduction
Herbert F. Jelinek and Michael J. Cree
CONTENTS
1.1 Why Automated Image Detection of Retinal Pathology? . . . . . . . . . . . . . . . . . . . 11.2 Automated Assessment of Retinal Eye Disease . . . . . . . . . . . . . . . . . . . . . . . . . . . . 71.3 The Contribution of This Book . . . . . . . . . . . . . . . . . . . . . . . . . . . . . . . . . . . . . . . . . . . . 13
References . . . . . . . . . . . . . . . . . . . . . . . . . . . . . . . . . . . . . . . . . . . . . . . . . . . . . . . . . . . . . . . . 13
1.1 Why Automated Image Detection of Retinal Pathology?Indeed, why? What are the driving forces that are leading to the development ofautomated computer detection and quantification of retinal lesions? Why is there amulti-disciplinary approach involving medical specialists, health professionals, med-ical physicists, biomedical engineers, and computer scientists to develop systemscapable of automated detection of retinal pathology?
In this section we examine the reasons why a number of research groups haveembarked on developing methodology and computer software for automated imagedetection of retinal pathology. We shall see (1) that there is a need in clinical prac-tice to find better and cheaper ways of identifying, managing, and treating retinaldisease; (2) that in the research community there is a desire to better understandthe underlying causes and progression of disease that requires the detailed analysisof large cohorts of retinal images; (3) that the recent advances in computer hard-ware and computing power, coupled with increasingly sophisticated image analysisand machine learning techniques, provide opportunities to meet the needs of clinicalpractice and the eye research community; and, finally, that images of the retina areboth a gold mine and a minefield for the application of digital image processing andmachine learning techniques, that can both reward the recent graduate and test toexasperation the most competent and innovative engineer.
We begin with the impetus arising from the medical community for new, cheaper,and more efficient means of detecting and managing retinal disease. The impetusarises from a number of quarters and we consider each in turn.
1

2 Automated Image Detection of Retinal Pathology
1.1.1 The general clinical need
With an increase in the aged population worldwide there is increasing eye disease,therefore there is a relative decrease in ophthalmic services, especially in rural ar-eas and developing countries. The World Health Organization has launched “Vision2020,” a global initiative for the prevention of avoidable visual impairment by theyear 2020 [1]. Eye health encompasses several approaches such as expanding effortsto raise awareness about eye health, early detection of disease, accurate diagnosis,and targeted prevention to improve outcomes. Recent data suggest that there are37 million blind people and 124 million with low vision worldwide, excluding thosewith uncorrected refractive errors. The main causes of global blindness are cataract,glaucoma, corneal scarring, age-related macular degeneration, and diabetic retino-pathy. The global Vision 2020 initiative is having an impact to reduce avoidableblindness particularly from ocular infections, but more needs to be done to addresscataract, glaucoma, and diabetic retinopathy [2]. It is diabetic retinopathy that rep-resents the most pressing problem and it is to this that most work on automateddetection has been directed.
1.1.2 Diabetes: A global problem
Diabetes is a metabolic disorder that leads to complications including cardiovascu-lar, renal, and eye disease. It has been identified as a significant and growing globalpublic health problem with the expected worldwide prevalence of 300 million by theyear 2025 [3–6]. Current prevalence of diabetes in the United States is 6.3% withgreater prevalence in certain ethnic groups and socioeconomic classes [6–8]. TheNew Zealand situation is similar [3]. In Australia approximately one million peo-ple (5%) are affected by diabetes and health care costs associated with treatment ofcomplications amounts to approximately AUS$7 billion dollars [9]. Diabetes is a sig-nificant and costly heath problem in the Western world, and is growing in incidenceat almost epidemic levels. New and innovative ways of identification, diagnosis,treatment and follow-up are needed to manage this growing problem.
1.1.3 Diabetic retinopathy
Increase in blood sugar levels associated with diabetes is the known cause of dia-betic retinopathy (DR), a progressive degenerative disease of the retina that has anasymptomatic stage that can start long before the onset of recognized diabetes.
Diabetic retinopathy is divided into various stages. The earliest signs of DR aremicroaneurysms, small hemorrhages, cotton wool spots, and exudates that resultfrom abnormal permeability and nonperfusion of capillaries. These early signs areknown as nonproliferative diabetic retinopathy (NPDR). There may even be earlierindications of diabetic retinopathy [10–12]. Fluid leaking from the retinal capillariesindicates a further progression of the disease. This may lead to sight threateningdiabetic retinopathy (STDR) if the leakage is located in the area of most acute vision(the macula) [13–15]. Diabetic macular edema is the most common cause of visionloss in diabetes. Proliferative diabetic retinopathy (PDR) develops from occluded

Introduction 3
capillaries that lead to retinal ischemia and formation of new vessels on the surfaceof the retina either near the optic disc or in the retinal periphery.
With an increase in diabetes prevalence, the prevalence and incidence of diabeticretinopathy are also increasing [16]. Early studies suggested that some form of di-abetic eye disease is present in up to 60% of people with type 2 (insulin indepen-dent) diabetes [17]. More recent evidence suggests that 40% to 45% of the diabeticpopulation have some DR with 10% to 14% having STDR [18]. In type 1 (insulindependent) diabetes other investigators reported a baseline prevalence of any retino-pathy, PDR, and STDR of 45.7%, 3.7%, and 16.4% respectively [15]. In type 2diabetes, the baseline prevalence of any retinopathy, PDR, and STDR was 25.3%,0.5%, and 6.0% respectively. Diabetic retinopathy that preceded diagnosis of dia-betes in 20.8% of the Wisconsin diabetes study subjects [19] remains an importantcause of preventable blindness and visual impairment [19–22]. In other words, one-fifth of people with diabetes (in the Wisconsin study) developed DR before diabeteswas diagnosed.
Diabetic retinopathy is characterized by a number of features that are recognizableby the trained observer. The features of DR are described in detail in Chapter 2,but it is worth noting here in advance that certain lesions indicating DR, such asthe number of microaneurysms and dot hemorrhages, have been demonstrated tocorrelate with disease severity and likely progression of the disease, at least for itsearly stages [23; 24]. Such lesions have a reasonably well defined appearance andrepresent useful targets for automated image detection, and the detection of themprovides useful information.
It is also important that DR is a treatable disease throughout disease progressioncommencing from the preclinical stage. If detected early and treated then signifi-cant saving in cost and reduction in the progression of eyesight loss is possible. Thedetection, management, and treatment of DR are huge resource drains on govern-ments and health systems worldwide [22]. As the disease is treatable, detection andmonitoring of the disease via fundus photography is beneficial, and more efficientdetection and monitoring saves costs, it would seem that automated image detectionof diabetic retinopathy is an engineering solution to a growing need.
1.1.4 Eye-screening for diabetic retinopathy
Screening is generally considered effective if a number of criteria are met. Thesecriteria include but are not limited to identification of disease at an early, preferablypreclinical, stage and that the disease in its early or late stage is amenable to treat-ment. Screening for DR and monitoring progression, especially in the early asymp-tomatic stage, has been shown to be effective in the prevention of vision loss andreducing cost associated with disease progression and treatment [25–28]. Estimatesof the rate of annual eye examinations are generally fairly low, from 40% to 65%depending on the country.
Various methods of screening have been shown to be sufficiently sensitive andspecific for the detection of sight-threatening eye disease at justifiable costs [18; 29–31]. There still remains potential for reduction in costs, increased effectiveness and

4 Automated Image Detection of Retinal Pathology
timeliness, and extension of eye-screening to remote areas that are not serviced byophthalmologists. Automated assessment of retinal images may be a key ingredientto achieving these benefits. We further explore these claims in the following.
The U.S. “Healthy People 2010” project aims at increasing the number of peo-ple with diabetes screened annually for diabetic retinopathy from the current 46% to75%. To achieve or improve on this goal, several different screening models for dia-betic eye disease have been proposed for diverse health care professionals from oph-thalmology to rural community screening by health technicians [32]. The AustralianNational Health and Medical Research Council as well as other health departmentsincluding those of the United States and United Kingdom have established guide-lines for screening of diabetic retinopathy [26; 33; 34]. National screening programshave the potential to be not only cost effective but also improve health care outcomesand quality of life for individuals with DR.
In rural and remote areas as well as in developing countries regular assessment fordiabetic eye disease is difficult. Any method that simplifies the process, increasesefficiency, and reduces costs of retinal screening will have significant health bene-fits [35; 36]. In terms of method, retinal photography has shown to be the screeningtest of choice [37]. Retinal photography using 35 mm slides, color photography, orPolaroid films has now been extended to digital photography that has additional ad-vantages such as low technical failure, good sensitivity and specificity, as well asbeing cost effective [38; 39]. The original seven-field criterion for diabetic retinopa-thy classification using photography has also been reduced to two-field and one-fieldretinal image analysis for screening purposes [40; 41].
Several field studies illustrate the utility of retinal vascular imaging. A studyin the Goulburn and La Trobe Valleys in Victoria, Australia, using nonmydriatic(i.e., nondilated pupil) retinal photography reported 60% of participants with no ab-normality, 18% with diabetic retinopathy, 9% with other fundus pathology, 3% re-duced acuity alone, and 10% of photographs were ungradeable and 29% had neverhad a fundus examination [42]. Reducing the number that had never had an eyeexamination is critical in improving community health and quality of life as earlyidentification leads to effective treatment and a reduction in sight threatening dia-betic retinopathy [32; 43]. A community-based screening of diabetic patients inrural Western Australia using retinal photography found that 28% of subjects hadretinopathy [44]. Rates increased by approximately 20% every 10 years (e.g., 42%had retinopathy by 15 years duration). Vision threatening retinopathy was present in13% of patients.
Waikato Regional Mobile Diabetic Retinopathy Photoscreening Programme at-tended over 200 sites between 1993 and 2003 and screened 79% of the expectednumber of patients [45]. The study concluded that mobile retinal photoscreeningis practical in a large rural area, and its implementation has been associated with areduction in presentations with vision-threatening retinopathy within the total com-munity [46]. These data lead to the conclusion that effective screening increasesdetection of early DR and therefore better treatment outcomes [29; 44].
Targeting screening incorporating automated detection of retinal pathology has thepotential to improve identification and follow-up of diabetic retinopathy by increas-

Introduction 5
Table 1.1: List of Pathologies That Affect the Retina and the Possibility ofAutomated Detection Leading to Early Treatment
Retinal Pathology Screening Automated EarlyPossible Detection Treatment
Possible PossibleDiabetic retinopathy Yes YesRefractive error in preschool children Yes YesNewborns for gonococcal eye disease (swab) YesRetinopathy of prematurity Yes YesHydroxychloroquine medication for retinopathy Yes YesGlaucoma Yes YesAge-related macular degeneration Yes YesSystemic atherosclerotic disease/systemic hyper-tension
Yes Yes
ing the availability of this screening method and reducing cost either by combiningit with teleophthalmology [47–50], or for use in rural and remote health by commu-nity health centers and primary care practitioners. Freeing up ophthalmologists, whootherwise read the retinal images of the screening program, allows them to focus onprimary health care. By combining screening programs with health nurses, a largerpopulation can be screened. Furthermore, automated assessment enables immediatefeedback to patients [38; 47; 49; 51–54].
1.1.5 Other retinal pathologies
Other retinal diseases that can also be considered for automated image analysis arelisted in Table 1.1. Here we highlight three.
Age-related macular degeneration (AMD) is the most common cause of legalblindness among industrialized nations in the population aged 50 years and above.It is characterized by the presence of drusen, choroidal neovascularization, and de-tachments of the retinal pigment epithelium and geographic atrophy (GA) of retinalpigment epithelium (RPE). Age-related macular degeneration is now treatable andtherefore worth detecting and monitoring. Choroidal neovascularization and geo-graphic atrophy is amenable to automated computer-based identification algorithms.There are two forms of AMD including dry (also called atrophic, nonneovascular, ornonexudative) and wet (also called exudative). Dry AMD is the more common formof the disease and accounts for 90% of all AMD. The key identifier for dry AMD issmall, round, white-yellow deposits called drusen that build up in the macula. Auto-mated segmentation of drusen can be reliably performed and can be added to effortsin community screening to reduce the progression of disease by early identificationand treatment options now available.
Macular edema and other eye pathology either related or not related to diabetescan also lead to blindness. Four techniques are most often used for identifica-tion and quantification of macular edema including ultrasound, optical coherence

6 Automated Image Detection of Retinal Pathology
tomography, retinal thickness analyzer, and scanning laser ophthalmology. Thesetechniques vary in resolution and sensitivity with the optical techniques providingthe best results. At this stage the cost of the equipment and technology for opticalcoherence tomography and the retinal thickness analyzer is too excessive for use inroutine community screening. However, digital biomicroscopy combined with vi-sual acuity testing is economically viable and can be automated, for instance, bydetection of the grey patches associated with clinical significant macular edema.
The shape and appearance of the optic nerve head region are sensitive to changesassociated with glaucoma and diabetes that may be otherwise asymptomatic. Ini-tial screening for the presence of glaucoma and tracking disease progression arecurrently under intense investigation by characterizing the optic disc. Glaucoma isassociated with an inadequate fluid flow from the drainage canals of the eye. Crys-tallization of the fluid in the cornea and iris region is a consequence of this blockageand also provides an opportunity to automatically compute this accretion. A semi-automated algorithm for quantitative representation of the optic disc and cup con-tours by computing accumulated disparities in the disc and cup regions from stereofundus image pairs has also been developed using advanced digital image analysismethodologies. A 3-D visualization of the disc and cup is achieved assuming camerageometry.
1.1.6 The retina as an indicator for disease elsewhere
Retinal morphology and the associated blood vessel pattern can also provide an indi-cation of the risk of hypertension, cardiovascular, and cerebrovascular disease as wellas diabetes [55–58]. Early identification of people at risk of morbidity and mortalitydue to diverse disease processes allows preventative measures to be commenced withthe greatest efficacy. As such, preclinical signs are not easily recognized and oftenappear as signs or symptoms that are not specific for a particular disease. Using theretina and its blood vessel characteristics can provide a window into several diseaseprocesses. The identification of increased risk of disease progression is based on thechange in the venous or arterial vessel diameter especially in proximity to the opticdisc. This morphological characteristic allows the application of image analysis andautomated classification in risk assessment of cardiovascular and cerebrovasculardisease as well as diabetes [59–61].
1.1.7 Research needs in automated retinopathy detection
The underlying causes and mechanisms of retinopathy, such as diabetic retinopathy,are not fully understood and further research is needed. Getting data to help guidehypothesis and model formation and testing is a mammoth task. Obtaining informa-tion by dismembering eyes and fundus tissues for assays and microscopic studies isusually not an option. Data result therefore mostly from close examination of theprogression of the clinical signs of retinopathy. The acquisition of such data requirescareful and fine grading of retinal images of large cohorts over an extended periodof time. This has historically required time-consuming and mind-numbing manual

Introduction 7
grading of large numbers of retinal images. Consequently, such studies are few innumber and only pursued by a number of centers (Wisconsin most notable) that havehuge financial resources at hand. There is also evidence that preclinical signs, suchas arteriolar and venule caliber changes that are not easily determined with manualgrading, may be important factors. Such features are so subtle that this evidence canonly be gained, in practice, with assisted computer analysis of the retinal images.
There is therefore a need for automated image detection and analysis of retinalpathologies and features to make the grading of large numbers of images practicableand cost-effective [55]. There is also a need for measurement of features that are noteasily observable with the human eye. These are much more demanding tasks thanthat of eye-screening for diabetic retinopathy, as a much finer quantitative analysis ofthe retina is needed. Therefore a greater effort is required to develop computer-basedprograms for detection of the more difficult aspects of retinopathy.
1.1.8 The engineering opportunity
Retinal images are a rich, varied, and fascinating set of interesting images to workwith. Even in healthy images there are a number of key features that for automateddetection require varied and ingenious image processing and pattern recognitiontechniques. With retinal pathology comes an even richer field of patterns and featuresto target. Some are quite distinctive; others bear similarity to one another and proveto be a challenging task for current algorithms to reliably distinguish. Engineers andscientists expert in pattern recognition and image processing will find retinal imagesexciting, challenging, and rewarding to work with. There remain quite a numberof problems in automated retinal analysis that need to be solved before automatedpathology detection systems can be rolled out for general clinical use.
1.2 Automated Assessment of Retinal Eye DiseaseUse of computer-based systems has been shown to be valuable for the diagnosis of vi-sual function loss in people with diverse retinal diseases. One of the most successfulclinical areas is the application of computer-based automated assessment of diabeticretinopathy. Several countries including Scotland are implementing or consideringautomated assessment as part of a national diabetes retinopathy screening program.Detection of microaneurysms, cotton wool spots, soft exudates, and small hemor-rhages indicate nonproliferative retinopathy, whereas ischemic areas in the retina,loss of vessels, and vessel proliferation are indicators for proliferative retinopathyand identifiable by automated assessment protocols based on digital image analysisand expert systems [62–68]. Some of the diseases mentioned in Table 1.1 are nowamenable to automated identification and assessment. In addition, retinal blood ves-sel pattern and characteristics can also provide information on the presence or riskof developing hypertension, cardio- and cerebrovascular disease, and diabetes.

8 Automated Image Detection of Retinal Pathology
In the following we give a summary of some the work on automated retinal analy-sis. Our aim is to give a few examples to give a feel for the breadth and depth of thefield, and to highlight some areas requiring further research. The reader should alsoconsult the literature including useful review papers [48; 69].
1.2.1 Automated microaneurysm detection in diabetic retinopathy
Early attempts at computerized detection of lesions in retinal images date back to the1980s but it is only in the late 1990s that useable and somewhat reliable results beganto be achieved [70]. The first reliable system capable of detecting microaneurysms influorescein angiographic images was reported by the Aberdeen group [71; 72]. Workto transfer this technology to red-free and color retinal images is ongoing and hasbeen discussed by several laboratories. The significance of microaneurysm countsin diabetic retinopathy and their close correlation to the severity of the disease iswell documented [23; 24]. Microaneurysm formation is a dynamic process [73–75]and there are indications that turnover is an early indicator of retinopathy progres-sion [24; 75]. Therefore detecting microaneurysms should form an important compo-nent in an automated diabetic retinopathy screening tool. Hipwell et al. [76] appliedautomated microaneurysm detection in directly digitized images as a screening tool.Despite that fewer microaneurysms are visible in red-free images than in fluoresceinangiography, they achieved 85% sensitivity and 76% specificity for the detection ofpatients with any retinopathy. They suggest that their system could be useful in elim-inating 50% or more of the screening population who have no retinopathy therebyhalving the number of images that trained experts need to examine.
It is because of the established clinical implications of microaneurysm counts,the distinctive appearance of microaneurysms, and the advances in high resolution,sensitive and affordable digital camera technology that quite a few algorithms forautomated microaneurysm detection have been proposed. As these are summarizedin Chapter 6 we restrict ourselves to making some general observations here.
High sensitivities have been achieved in automated detection of microaneurysmsbut the number of false positive reports tends to still exceed that of trained manualobservers. Some automated microaneurysm detection systems are developed withthe express aim of screening for diabetic retinopathy and when used for this pur-pose the sensitivity for detecting microaneurysms can be lowered as only one micro-aneurysm per image needs to be detected to identify images with microaneurysms.The British Diabetic Retinopathy Working Group recommended a minimum sensi-tivity of 80% and minimum specificity of 95% for the screening of diabetic retinopa-thy [77]. Many automated screening projects based on microaneurysm detection (asdescribed above and in Chapter 6) achieve the required sensitivity, but none achievethe required specificity. Achieving high specificity is a major difficulty in developingautomated screening systems. Another important difficulty is when severe lesions arenot accompanied by microaneurysms or distort the image in such a way that detect-ing microaneurysms fails. Reporting only sensitivities and specificities can mask thefailure of the system to report such rare, but very important, cases.

Introduction 9
Also glossed over in the above is the problem of actually establishing the sensitiv-ity and specificity of an automated lesion detection system. Testing methodologiesand test image datasets used in papers on automated microaneurysm detection arealmost as numerous as the total number of algorithms reported! This makes compar-ing systems difficult. This issue is picked up and expanded upon by the authors ofChapters 4 and 6, for example.
Automated microaneurysm detection, of itself, is not sufficient for completely au-tomating eye screening for diabetic retinopathy. An automated eye-screening systemwill also need to be able to detect the quality of the image and the eye field includinglocations of the optic disc and macula (if present), and integrate results from anal-yses of multiple images of the same patient. Work on these aspects of automatedeye screening has only just started to be reported [78]. Furthermore, integration withautomated detection of other lesions will be important. It is to this we now turnattention.
1.2.2 Hemorrhages
Hemorrhages are one of the first signs of diabetic retinopathy and are also prominentin other ocular disease. They take on a range of size, color and texture from thesmall round dot hemorrhages that are related to microaneurysms and indistinguish-able from microaneurysms in color fundus images, through the flame shaped andblotch (cluster) hemorrhages whose names describe their appearance, to the largerboat shaped hemorrhages. It may well be that a multifaceted pattern recognitionapproach is needed to reliably detect hemorrhages of all descriptions.
Automated detection of hemorrhages is not as well described in the literature asautomated microaneurysm detection, except for dot-hemorrhages, which, by default,are detected by automated detection of microaneurysms working on color fundusimages due to the close simularity in appearance with microaneurysms. Reports ofautomated detection of the larger hemorrhages include a “spider-net” approach [79],neural networks [80], segmentation of dark lesions with classification [64], and math-ematical morphology [81; 82].
1.2.3 White lesion segmentation
The so called white lesions consist of exudate, cotton wool spots, and drusen. Theyare characterized by a white to yellow appearance brighter than the surroundingretina and are typically medium sized lesions but that is as far as there similaritygoes. We consider them together because the simplest feature to detect them (highintensity in the green plane) is effective in segmenting these lesions, but insufficientto distinguish them from each other and from other bright features such as the opticdisc, light artifacts and laser photocoagulation scars. Indeed the earliest automatedexudate detectors were based on thresholding of red-free images [83].
To distinguish the white lesions from each another and from other confoundingbright features requires a more sophisticated algorithm. Of some interest is the detec-tion of exudates, without confusion with cotton wool spots and bright light artifacts,

10 Automated Image Detection of Retinal Pathology
to aid in diabetic retinopathy eye screening. Features that can be used are the yel-lowish color of exudates, their sharp edges, their rougher texture, and the clusteringof exudates together and in circles about areas of leakage.
Exudate detection, which has some robustness against confusion with other whitelesions or bright artifacts, has been performed with neural networks [80; 84], fuzzyC-means clustering [85; 86], mathematical morphology [87] coupled with regiongrowing [82; 88], region growing coupled with classification [64], clustering tech-niques coupled with color and vessel analysis [89], and the work reported in Chap-ter 5 herein. High sensitivities near or above 95% are regularly reported for detectingexudates, however specificity is typically lower. Maybe one of the most significantstudies on exudate detection, at least in terms of the large number of images used intesting, is that of Fleming et al. [88]. They achieved 95% sensitivity for a specificityof 85% for detecting images with exudates on a test set of 13 219 images, of which300 contained exudates.
Because of the low incidence of exudates (and other white lesions) in retinal im-ages (only 2.2% for the study mentioned above) it can be difficult to acquire enoughimages containing exudates and other white features to be able to sufficiently testa proposed algorithm. Many reported studies test with fewer than 30 images, andsometimes do not even include images with other white features. The reported sen-sitivities and specificities are therefore likely to be inflated, and give no indicationhow the algorithm performs on rare, but nevertheless important, difficult cases. Sinceautomated microaneurysm detection can be performed with greater than 80% sensi-tivity and good specificity for detecting images with diabetic retinopathy, an includedautomated exudate detector stage must be able to reliably detect the rare and moredifficult to analyze cases to effect an improvement in detecting images with diabeticretinopathy.
Less attention has been given to automated detection of other white lesions. Auto-mated detection of cotton wool spots has usually been performed in association withdetection of exudates [64; 90; 91]. Drusen occur in age-related macular degenera-tion and there has been some interest in automated detection [92–97]. Many of theapproaches are similar to those used for exudate and cotton wool spot detection.
1.2.4 Localization of important markers
It is important to not only detect and quantify lesions but also to know their locationwith respect to one another and to the eye. Retinal images normally cover from 35°to 50° field of view of the retina, and multiple images (typically seven) are requiredto create a substantial picture of the retina. The macula (central point of vision) andthe optic disc (entry point of the nervous and blood system to the retina) provideimportant markers for location. The flow of blood vessels from the optic disc enableone to establish the retinal field and whether it is the right or left eye. The location oflesions, for example the proximity of exudates to the macula, has important clinicalimplications. It is therefore important that automated detection of the optic disc,macula, and field of view be developed.

Introduction 11
In fluorescein angiographic images the macula can often be detected by the ab-sence of flouresence in the foveal avascular zone (a zone at the center of the maculadevoid of retinal vessels). A correlation of the gross background fluoresence witha standardized model often enables accurate localization of the macula [98], thoughabnormal maculae prove problematic to detect. This method is less effective forcolor fundus images. A refinement is to search the expected location of the foveabased on prior detection of the optic disc [99–101].
The optic disc is a very distinctive feature of the eye. It is often the brightest ob-ject, ranging from white to yellow, is circular and of reasonably consistent size frompatient to patient, and the retinal vasculature radiates out from its center. Strategiesfor automated detection of the optic disc include those based on locating the area ofmaximal intensity and image variance [99; 102; 103], detecting the circular edge ofthe optic disc [104], whether by fitting snakes to the edge [105; 106], or Hough trans-form [101] and by using vessel convergence and orientation [107; 108]. Reportedsensitivities for detection of the optic disc range from 85% to 98%. Abnormal opticdiscs present problems for most methods.
1.2.5 Retinal vessel diameter changes in disease
Retinal vessel dilatation is a well known phenomenon in diabetes and significantdilatation and elongation of retinal arterioles, venules, and their macular brancheshave been shown to occur in the development of diabetic macular edema that can belinked to hydrostatic pressure changes [11; 109]. These vessel changes are not lim-ited to diabetic associated changes and as Wong and collaborators reported can beassociated with risk of cardiovascular and cerebrovascular disease as well [55; 110].Retinal microvascular abnormalities, such as generalized and focal arteriolar nar-rowing, arteriovenous nicking and retinopathy, reflect cumulative vascular damagefrom hypertension, ageing, and other processes. Epidemiological studies indicatethat these abnormalities can be observed in 2% to 15% of the nondiabetic generalpopulation and are strongly and consistently associated with elevated blood pres-sure. Generalized arteriolar narrowing and arteriovenous nicking also appear to beirreversible long-term markers of hypertension, related not only to current but pastblood pressure levels as well [60; 111].
1.2.6 Retinal blood vessel segmentation
The literature on computer algorithms to delineate the vessel network in fluoresceinretinal images [99; 112; 113] and color fundus images [62; 114; 115] is extensiveand we can not do justice to the field in an introduction such as this. Approachesto automated vessel detection include matched filtering [116] coupled with thresh-old probing [117], mathematical morphology [118; 119], scale-space analysis withregion growing [120], multi-threshold probing [121], pixel classification [122], andwavelet analysis [62], among many others [123–126]. A fundamentally different ap-proach is vessel tracking in which one starts from an initial seed point on a vessel and

12 Automated Image Detection of Retinal Pathology
makes small steps in the direction of the vessel from determinations of the directionof the vessel in the local region [127–132].
The public availability of the STARE [117] and DRIVE [123] databases of retinalimages, with accompanying manually produced annotations of locations of the ves-sel, has provided a test set of images that has enabled quantitative and fair compar-isons between vessel detection algorithms. Studies have been published comparingvarious vessel detection algorithms with the STARE and DRIVE dataset [122; 133]and any new algorithms should be tested on these datasets.
It should be noted that the reasons for detecting blood vessels are varied, rangingfrom a need to identify vessel locations to aid in reducing false-detections of otherlesions, to detecting the vessel networks to establish their geometrical relationshipsor identifying the field-of-view of the retina, through to accurate delineation of thevessels for quantitative measurement of various vessel parameters (width, branchingratios, and tortuousity) and for identifying vessel features such as venous dilatationand arteriolar narrowing.
1.2.7 Mathematical analysis of vessel patterns
Blood vessels in the optic fundus are a complex network of branches that spreadout from the optic disc to provide nutrients and oxygen to the fundus. In prolifera-tive diabetic retinopathy new blood vessels are formed that emerge from the areaof the optic disc and spread towards the macula or emerge from peripheral ves-sels [134]. Automated procedures are not required to identify the smallest vesselsthat are seen by visual inspection, but new vessel growth and small vessel leak-age that is clinically significant require attention. The most important attributeof the automated vessel identification and classification system is that it providesclinically relevant data [65; 135; 136]. Segmented blood vessels can be ana-lyzed for branching patterns, bifurcation points, diameters and other physical at-tributes associated with disease such as venous beading or tortuosity. Furthermore apool of morphological descriptors that identify several different attributes impor-tant in identifying blood vessels include edge detection and to detect the bloodvessels with different diameters while leaving undesirable artifacts such as noiseout [137].
Branching patterns have been analyzed using mathematical techniques such asfractal and local fractal dimension. These techniques are able to quantify complexbranching patterns including blood vessels [138–142]. Initial studies of the opticfundus that concentrated on the analysis of optic fundus blood vessel patterns usedhand-drawn vessel patterns to obtain the fractal dimension. These studies demon-strated that blood vessels in the optic fundus are fractal and that vessel occlusion andneovascularization could be identified [143–149]. These authors demonstrated thefractal nature of the retinal blood vessel network and that the fractal dimension canbe used to identify pathology.

Introduction 13
1.3 The Contribution of This Book
Computer and camera technology have substantially improved over the last decadeto provide effective, fast and afforable systems for fundus image analysis. Softwaredevelopment in the field has developed to the point that automated image detectionof retinal pathology is coming of age. This chapter has introduced the field, outlinedsome of the successes, and brought attention to some of the remaining problems. Inthe following chapters the reader shall find descriptions of retinal image analysis aspracticed by experts in the field.
Chapter 2 is a brief introduction to diabetes, diabetic retinopathy, and ophthalmicterminology, to give the reader new to the field the necessary medical and ophthalmicknowledge. The authors of Chapters 3 and 4 write primarily as users of automatedimage analysis software, and outline some of the successes and opportunities for au-tomated image detection of retinal pathology and the reasons why automated systemshave failed to be embraced in clinical practice.
The engineering description of automated image detection of retinal pathologybegins in Chapter 5 with the automated detection of exudates and the optic disc, andcontinued in Chapter 6 with the automated detection of microaneurysms. Detectionof blood vessels and quantification of various vessel parameters is an important fieldand it is in Chapter 7 that the clinical impetus is outlined. Segmentation of bloodvessels is the subject of Chapter 8 and the quantification of vessel parameters is thefocus of Chapters 9 and 10. In this day of the Internet and the potential for easy andfast transmission of digital data, it seems appropriate that in Chapter 11 the potentialfor teleophthalmology is explored.
References[1] Thylefors, B., A global initiative for the elimination of avoidable blindness,
American Journal of Ophthalmology, 125(1), 90, 1998.
[2] Foster, A. and Resnikoff, S., The impact of Vision 2020 on global blindness,Eye, 19(10), 1133, 2005.
[3] Joshy, G. and Simmons, D., Epidemiology of diabetes in New Zealand: re-visit to a changing landscape, The New Zealand Medical Journal, 119(1235),2006.
[4] Colagiuri, S., Colagiuri, R., and Ward, J., National Diabetes Strategy andImplementation Plan., Diabetes Australia, Paragon Printers, Canberra, 1998.

14 Automated Image Detection of Retinal Pathology
[5] King, H., Aubert, R.E., and Herman, W.H., Global burden of diabetes, 1995–2025: prevalence, numerical estimates and projections, Diabetes Care, 21,1414, 1998.
[6] Wild, S., Roglic, G., Green, A., et al., Globel prevalence of diabetes: es-timates for the year 2000 and projections for 2030, Diabetes Care, 27(10),2569, 2004.
[7] Centers for Disease Control and Prevention, National diabetes fact sheet: gen-eral information and national estimates on diabetes in the United States, Tech-nical report, U.S. Department of Health and Human Services, Centers for Dis-ease Control and Prevention, 2003.
[8] The Eye Diseases Prevalence Research Group, The prevalence of diabeticretinopathy among adults in the United States, Archives of Ophthalmology,122(4), 552, 2004.
[9] Mathers, C. and Penm, R., Health system costs of cardiovascular diseases anddiabetes in Australia 1993–94, Technical Report HWE 11, Australian Instituteof Health and Welfare, 1999.
[10] Engerman, R., Pathogenesis of diabetic retinopathy, Diabetes, 38, 1203,1989.
[11] Kristinsson, J.K., Gottfredsdottir, M.S., and Stefansson, E., Retinal vessel di-latation and elongation precedes diabetic macular oedema, Br J Ophthalmol,81(4), 274, 1997.
[12] Wong, T.Y., Klein, R., Sharrett, A.R., et al., Retinal arteriolar narrowing andrisk of diabetes mellitus in middle-aged persons, Journal of the AmericanMedical Association, 287(19), 2528, 2002.
[13] Cockburn, D., Diabetic retinopathy: classification, description and optometricmanagement, Clinical and Experimental Optometry, 82(2-3), 59, 1999.
[14] Ciulla, T., Amador, A., and Zinman, B., Diabetic retinopathy and diabeticmacular edema: pathophysiology, screening, and novel therapies, DiabetesCare, 26(9), 2653, 2003.
[15] Younis, N., Broadbent, D., Harding, S., et al., Prevalence of diabetic eye dis-ease in patients entering a systematic primary care-based eye screening pro-gramme, Diabetic Medicine, 19, 1014, 2002.
[16] Williams, R., Airey, M., Baxter, H., et al., Epidemiology of diabetic retinopa-thy and macular oedema: a systematic review, Eye, 18, 963, 2004.
[17] Klein, R., Klein, B.E., Moss, S.E., et al., The Wisconsin Epidemiologic Studyof Diabetic Retinopathy. III. Prevalence and risk of diabetic retinopathy whenage at diagnosis is 30 or more years, Arch Ophthalmol, 102(4), 527, 1984.
[18] Harding, S.P., Broadbent, D.M., Neoh, C., et al., Sensitivity and specificity

Introduction 15
of photography and direct ophthalmology in screening for sight threateningeye disease: the Liverpool Diabetic Eye Study, British Medical Journal, 311,1131, 1995.
[19] Betz-Brown, J., Pedula, K., and Summers, K., Diabetic retinopathy — con-temporary prevalence in a well-controlled population, Diabetes Care, 26(9),2637, 2003.
[20] Icks, A., Trautner, C., Haastert, B., et al., Blindness due to diabetes:population-based age- and sex-specific incidence rates, Diabetic Medicine,14, 571, 1997.
[21] Cunha-Vaz, J., Lowering the risk of visual impairment and blindness, DiabeticMedicine, 15(S4), S47, 1998.
[22] Taylor, H.R., Vu, H.T.V., McCarty, C.A., et al., The need for routine eye exam-inations, Investigative Ophthalmology and Visual Science, 45(8), 2539, 2004.
[23] Kohner, E. and Sleightholm, M., Does microaneurysm count reflect the sever-ity of early diabetic retinopathy? Ophthalmology, 93, 586, 1986.
[24] Klein, R., Meuer, S.M., Moss, S.E., et al., Retinal microaneurysm countsand 10-year progression of diabetic retinopathy, Archives of Ophthalmology,113(11), 1386, 1995.
[25] Mazze, R. and Simonson, G., Staged diabetes management: a systematicevidence-based approach to the prevention and treatment of diabetes and itsco-morbidities, Practical Diabetes International, 18(7), S1, 2001.
[26] National Health and Medical Research Council, Management of diabeticretinopathy clinical practice guidelines, Technical report, Australian Govern-ment Publishing Service, 1997.
[27] Lee, S.J., McCarty, C.A., Taylor, H.R., et al., Costs of mobile screening fordiabetic retinopathy: a practical framework for rural populations, AustralianJournal of Rural Health, 9, 186, 2001.
[28] Facey, K., Cummins, E., Macpherson, K., et al., Organisation of services fordiabetic retinopathy screening, Technical Report 1, Health Technology Boardfor Scotland, 2002.
[29] Lee, S., McCarty, C., Taylor, H.R., et al., Costs of mobile screening for di-abetic retinopathy: a practical framework for rural populations, AustralianJournal of Rural Health, 9, 186, 2001a.
[30] James, M., Turner, D., Broadbent, D., et al., Cost-effectiveness analysis ofscreening for sight threatening diabetic eye disease, British Medical Journal,320, 1627, 2000.
[31] Leese, G., Tesfaye, S., Dengler-Harles, M., et al., Screening for diabetic eyedisease by optometrists using slit lamps, Journal of Royal College of Physi-

16 Automated Image Detection of Retinal Pathology
cians London, 31, 65, 1997.
[32] Hutchinson, A., McIntosh, A., Peters, J., et al., Effectiveness of screening andmontitoring tests for diabetic retinopathy — a systematic review, DiabeticMedicine, 17, 495, 2000.
[33] UK National Screening Committee, Essential elements in developing a dia-betic retinopathy screening programme, Technical report, 2004.
[34] American Diabetic Association, Screening for type 2 diabetes: American Dia-betes Association position statement, Diabetes Care, 26(Suppl 1), S21, 2003.
[35] Lee, V., Kingsley, R., and Lee, E., The diagnosis of diabetic retinopathy. Oph-thalmology versus fundus photography, Ophthalmology, 100., 1504, 1993.
[36] Taylor, H.R. and Keeffe, J.E., World blindness: a 21st century perspective,British Journal of Ophthalmology, 85, 261, 2001.
[37] Bachmann, M.O. and Nelson, S., Impact of diabetic retinopathy screeningon a British district population: case detection and blindess prevention in anevidence-based model, Journal of Epidemiology and Community Health, 52,45, 1998.
[38] Sharp, P.F., Olsen, J., Strachan, F.M., et al., The value of digital imaging indiabetic retinopathy, Technical Report 7(30), Health Technology Assessment,2003.
[39] Phiri, R., Keeffe, J.E., Harper, C.A., et al., Comparative study of the Po-laroid and digital non-mydriatic cameras in the detection of referrable diabeticretinopathy in Australia, Diabetic Medicine, 23(8), 867, 2006.
[40] Bursell, S.E., Caverallerano, J., Caverallerano, A., et al., Joslin Vision Net-work Research Team: Stereo nonmydriatic digital-video color retinal imagingcompared with early treatment diabetic retinopathy study seven standard field35mm stereo color photos for determining level of diabetic retinopathy, Oph-thalmology, 108, 572, 2001.
[41] Olson, J.A., Strachan, F.M., Hipwell, J.H., et al., A comparative evaluation ofdigital imaging, retinal photography and optometrist examination in screeningfor diabetic retinopathy, Diabetic Medicine, 20(7), 528, 2003.
[42] Harper, C.A., Livingston, P.M., Wood, C., et al., Screening for diabetic retino-pathy using a non-mydriatic camera in rural Victoria, Australian and NewZealand Journal of Ophthalmology, 28, 135, 1998.
[43] Sussman, E., Tsiaras, W., and Soper, K., Diagnosis of diabetic eye disease,JAMA, 247, 3231, 1982.
[44] Howsam, G., The Albury-Wodonga syndrome: A tale of two cities, Australianand New Zealand Journal of Opthalmololgy, 23, 135, 1995.
[45] Lawrenson, R., Dunn, P., Worsley, D., et al., Discover diabetes: a community

Introduction 17
based screening programme for diabetic eye disease, The New Zealand Medi-cal Journal, 107, 172, 1994.
[46] Reda, E., Dunn, P., Straker, C., et al., Screening for diabetic retinopathy usingthe mobile retinal camera: the Waikato experience, The New Zealand MedicalJournal, 116(1180), 562, 2003.
[47] Yogesan, K., Constable, I.J., Barry, C.J., et al., Telemedicine screening ofdiabetic retinopathy using a hand-held fundus camera, Telemedicine Journal,6(2), 219, 2000.
[48] Patton, N., Aslam, T.M., MacGillivray, T., et al., Retinal image analysis: con-cepts, applications and potential, Progress in Retinal and Eye Research, 25,99, 2006.
[49] Whited, J.D., Accuracy and reliability of teleophthalmology for diagnosingdiabetic retinopathy and macular edema: A review of the literature, DiabetesTechnology and Therapeutics, 8(1), 102, 2006.
[50] Constable, I.J., Yogesan, K., Eikelboom, R.H., et al., Fred Hollows lecture:Digital screening for eye disease, Clinical and Experimental Ophthalmology,28, 129, 2000.
[51] Lin, D., Blumenkranz, M., Brothers, R., et al., The sensitivity and specificityof single-field nonmydriatic monochromatic digital fundus photography withremote images interpretation for diabetic retinopathy screening: a comparisonwith ophthalmology and standardized mydriatic color photography, AmericanJournal of Ophthalmology, 134, 204, 2002.
[52] Davis, R., Fowler, S., Bellis, K., et al., Telemedicine improves eye examina-tion rates in individuals with diabetes, Diabetes Care, 26(8), 2476, 2003.
[53] Lee, S., Sicari, C., Harper, C., et al., Program for the early detection of dia-betic retinopathy: a two-year follow-up, Clinical and Experimental Ophthal-mology, 29, 12, 2001b.
[54] Madden, A.C., Simmons, D., McCarty, C.A., et al., Eye health in rural Aus-tralia, Clinical and Experimental Ophthalmology, 30(5), 316, 2002.
[55] Wong, T.Y., Shankar, A., Klein, R., et al., Retinal arteriolar narrowing, hy-pertension and subsequent risk of diabetes mellitus, Archives of InternalMedicine, 165(9), 1060, 2005.
[56] Li, H., Hsu, W., Lee, M.L., et al., Automated grading of retinal vessel caliber,IEEE Transactions on Biomedical Engineering, 52(7), 1352, 2005.
[57] Witt, N., Wong, T.Y., Hughes, A.D., et al., Abnormalities of retinal microvas-cular structure and risk of mortality from ischemic heart disease and stroke,Hypertension, 47, 345, 2000.
[58] Forracchia, M., Grisan, E., and Ruggeri, A., Extraction and quantitative

18 Automated Image Detection of Retinal Pathology
description of vessel features in hypertensive retinopathy fundus images, inCAFIA2001, 2001, 6.
[59] Sherry, L.M., Wang, J.J., Rochtchina, E., et al., Reliability of computer-assisted retinal vessel measurement in a population, Clinical & ExperimentalOphthalmology, 30, 179, 2002.
[60] Wang, J.J., Mitchell, P., Sherry, L.M., et al., Generalized retinal arteriolar nar-rowing predicts 5-year cardiovascular and cerebro-vascular mortality: find-ings from the Blue Mountains Eye Study, Investigative Ophthalmology andVisual Science, 43, 2002.
[61] Klein, R., Klein, B.E., Moss, S.E., et al., The relation of retinal vessel caliberto the incidence and progression of diabetic retinopathy: XIX: The WisconsinEpidemiologic Study of Diabetic Retinopathy, Archives of Ophthalmology,122(1), 76, 2004.
[62] Soares, J.V.B., Leandro, J.J.G., Cesar, Jr, R.M., et al., Retinal vessel seg-mentation using the 2-D Gabor wavelet and supervised classification, IEEETransactions on Medical Imaging, 25(9), 1214, 2006.
[63] Lee, S.C., Lee, E.T., Wang, Y., et al., Computer classification of nonprolifera-tive diabetic retinopathy, Archives of Ophthalmology, 123, 759, 2005.
[64] Ege, B.M., Hejlesen, O.K., Larsen, O.V., et al., Screening for diabetic retino-pathy using computer based image analysis and statistical classification, Com-puter Methods and Programs in Biomedicine, 62(3), 165, 2000.
[65] Osareh, A., Mirmehdi, M., Thomas, B., et al., Classification and localisationof diabetic-related eye disease, in 7th European Conference on Computer Vi-sion (ECCV2002), 2002, vol. 2353 of Lecture Notes in Computer Science,502–516.
[66] Goldbaum, M.H., Sample, P.A., Chan, K., et al., Comparing machine learn-ing classifiers for diagnosing glaucoma from standard automated perimetry,Investigative Ophthalmology and Visual Science, 43(1), 162, 2002.
[67] Frame, A.J., Undrill, P.E., Cree, M.J., et al., A comparison of computer basedclassification methods applied to the detection of microaneurysms in oph-thalmic fluorescein angiograms, Computers in Biology and Medicine, 28, 225,1998.
[68] Niemeijer, M., van Ginneken, B., Staal, J., et al., Automatic detection of redlesions in digital color fundus photographs, IEEE Transactions on MedicalImaging, 24(5), 584, 2005.
[69] Teng, T., Lefley, M., and Claremont, D., Progress towards automated diabeticocular screening: a review of image analysis and intelligent systems for dia-betic retinopathy, Medical and Biological Engineering and Computing, 40, 2,2002.

Introduction 19
[70] Baudoin, C.E., Lay, B.J., and Klein, J.C., Automatic detection of microa-neurysms in diabetic fluorescein angiography, Revue d Epidemiologie et deSante Publique, 32(3-4), 254, 1984.
[71] Spencer, T., Olson, J., McHardy, K., et al., Image-processing strategy for thesegmentation and quantification of microaneurysms in fluorescein angiogramsof the ocular fundus, Computers and Biomedical Research, 29, 284, 1996.
[72] Cree, M.J., Olson, J.A., McHardy, K.C., et al., A fully automated comparativemicroaneurysm digital detection system, Eye, 11, 622, 1997.
[73] Kohner, E.M. and Dollery, C.T., The rate of formation and disapearance ofmicroaneurysms in diabetic retinopathy, European Journal of Clinical Inves-tigation, 1(3), 167, 1970.
[74] Hellstedt, T. and Immonen, I., Disappearance and formation rates of microa-neurysms in early diabetic retinopathy, British Journal of Ophthalmology,80(2), 135, 1996.
[75] Goatman, K.A., Cree, M.J., Olson, J.A., et al., Automated measurement ofmicroaneurysm turnover, Investigative Ophthalmology and Visual Science,44, 5335, 2003.
[76] Hipwell, J., Strachan, F., Olson, J., et al., Automated detection of microa-neurysms in digital red-free photographs: a diabetic retinopathy screeningtool, Diabetic Medicine, 17, 588, 2000.
[77] British Diabetic Association, Retinal photography screening for diabetic eyedisease, 1994.
[78] Fleming, A.D., Philip, S., Goatman, K.A., et al., Automated assessment of di-abetic retinal image quality based on clarity and field definition, InvestigativeOphthalmology and Visual Science, 47(1120-1125), 2006.
[79] Lee, S.C., Wang, Y., and Lee, E.T., Computer algorithm for automated detec-tion and quantification of microaneurysms and hemorrhages (HMAs) in colorretinal images, in Medical Imaging 1999: Image Perception and Performance,1999, vol. 3663 of Proceedings of the SPIE, 61–71.
[80] Gardner, G., Keating, D., Williamson, T., et al., Automatic detection of dia-betic retinopathy using an artificial neural network: a screening tool, BritishJournal of Ophthalmology, 80, 940, 1996.
[81] Luo, G., Chutatape, O., Li, H., et al., Abnormality detection in automatedmass screening system of diabetic retinopathy, in 14th IEEE Symposium onComputer-Based Medical Systems 2001, 2001, 332.
[82] Sinthanayothin, C., Boyce, J.F., Williamson, T.H., et al., Automated detectionof diabetic retinopathy on digital fundus images, Diabet Med, 19(2), 105,2002.

20 Automated Image Detection of Retinal Pathology
[83] Phillips, R., Forrester, J., and Sharp, P., Automated detection and quantifica-tion of retinal exudates, Graefes Arch Clin Exp Ophthalmol, 231(2), 90, 1993.
[84] Hunter, A., Lowell, J., Owen, J., et al., Quantification of diabetic retinopathyusing neural networks and sensitivity analysis, Technical Report SCET9901,University of Sunderland, 2000.
[85] Osareh, A., Mirmehdi, M., Thomas, B., et al., Automatic recognition of ex-udative maculopathy using fuzzy C-means clustering and neural networks, inProceedings of the Medical Image Understanding and Analysis Conference,2001, 49–52.
[86] Osareh, A., Mirmehdi, M., Thomas, B., et al., Automated identification ofdiabetic retinal exudates in digital colour images, British Journal of Ophthal-mology, 87, 1220, 2003.
[87] Walter, T., Klein, J.C., Massin, P., et al., A contribution of image processing tothe diagnosis of diabetic retinopathy — detection of exudates in color fundusimages of the human retina, IEEE Transactions on Medical Imaging, 21(10),1236, 2002.
[88] Fleming, A.D., Philip, S., Goatman, K.A., et al., Automated detection of exu-dates for diabetic retinopathy screening, Physics in Medicine and Biology, 52,7385, 2007.
[89] Hsu, W., Pallawala, P.M.D.S., Lee, M.L., et al., The role of domain knowledgein the detection of retinal hard exudates, in 2001 IEEE Computer Society Con-ference on Computer Vision and Pattern Recognition (CVPR’01), 2001, vol. 2,246–251.
[90] Xiaohui, Z. and Chutatape, O., Detection and classification of bright lesionsin color fundus images, in International Conference on Image Processing(ICIP’04), 2004, vol. 1, 139–142.
[91] Lee, S.C., Lee, E.T., Kingsley, R.M., et al., Comparison of diagnosis of earlyretinal lesions of diabetic retinopathy between a computer system and humanexperts, Archives of Ophthalmology, 119(4), 509, 2001.
[92] Barthes, A., Conrath, J., Rasigni, M., et al., Mathematical morphology in com-puterized analysis of angiograms in age-related macular degeneration, Medi-cal Physics, 28(12), 2410, 2001.
[93] ben Sbeh, Z., Cohen, L.D., Mimoun, G., et al., A new approach of geodesicreconstruction for drusen segmentation in eye fundus images, IEEE Transac-tions on Medical Imaging, 20(12), 1321, 2001.
[94] Brandon, L. and Hoover, A., Drusen detection in a retinal image using multi-level analysis, in Medical Image Computing and Computer-Assisted Interven-tion (MICCAI 2003), 2003, vol. 2878 of Lecture Notes in Computer Science,618–625.

Introduction 21
[95] Shin, D.S., Javornik, N.B., and Berger, J.W., Computer-assisted, interactivefundus image processing for macular drusen quantitation, Ophthalmology,106(6), 1119, 1999.
[96] Sivagnanavel, V., Smith, R.T., Lau, G.B., et al., An interinstitutional compar-ative study and validation of computer aided drusen detection, British Journalof Ophthalmology, 89, 554, 2005.
[97] Smith, R.T., Chan, J.K., Nagasaki, T., et al., Automated detection of maculardrusen using geometric background leveling and threshold selection, Archivesof Ophthalmology, 123(2), 200, 2005.
[98] Cree, M.J., Olson, J.A., McHardy, K.C., et al., Automated microaneurysm de-tection, in International Conference on Image Processing, Lausanne, Switzer-land, 1996, vol. 3, 699–702.
[99] Sinthanayothin, C., Boyce, J., Cook, H., et al., Automated localisation of theoptic disc, fovea and retinal blood vessels from digital colour fundus images,British Journal of Ophthalmology, 83(8), 902, 1999.
[100] Li, H.Q. and Chutatape, O., Automated feature extraction in color retinal im-ages by a model based approach, IEEE Transactions on Biomedical Engineer-ing, 51(2), 246, 2004.
[101] Pinz, A., Bernogger, S., Datlinger, P., et al., Mapping the human retina, IEEETransactions on Medical Imaging, 17(4), 606, 1998.
[102] Li, H.Q. and Chutatape, O., Automatic detection and boundary estimationof the optic disk in retinal images using a model-based approach, Journal ofElectronic Imaging, 12(1), 97, 2003.
[103] Lowell, J., Hunter, A., Steel, D., et al., Optic nerve head segmentation, IEEETransactions on Medical Imaging, 23(2), 256, 2004.
[104] Abdel-Ghafara, R.A., Morrisa, Ritchingsb, T.T., et al., Detection and charac-terisation of the optic disk in glaucoma and diabetic retinopathy, 2005.
[105] Chanwimaluang, T. and Fan, G., An efficient algorithm for extraction of ana-tomical structures in retinal images, in 2003 International Conference on Im-age Processing, 2003, vol. 1, 1093–1096.
[106] Osareh, A., Mirmehdi, M., Thomas, B., et al., Colour morphology and snakesfor optic disc localisation, in Proceedings of the Medical Image Underestand-ing and Analysis Conference (MIUA 2002), Portsmouth, UK, 2002, 21–24.
[107] Hoover, A. and Goldbaum, M., Locating the optic nerve in a retinal image us-ing the fuzzy convergence of the blood vessels, IEEE Transactions on MedicalImaging, 22(8), 951, 2003.
[108] Foracchia, M., Grisan, E., and Ruggeri, A., Detection of optic disc in retinalimages by means of a geometrical model of vessel structure, IEEE Transac-

22 Automated Image Detection of Retinal Pathology
tions on Medical Imaging, 23(10), 1189, 2004.
[109] Guan, K., Hudson, C., Wong, T.Y., et al., Retinal hemodynamics in earlydiabetic macular edema, Diabetes, 55(3), 813, 2006.
[110] Wong, T., Shankar, A., Klein, R., et al., Prospective cohort study of retinalvessel diameters and risk of hypertension, British Medical Journal, 329, 79,2004.
[111] Wong, T.Y., Klein, R., Klein, B.E., et al., Retinal microvascular abnormalitiesand their relationship with hypertension, cardiovascular disease, and mortal-ity, Survey of Ophthalmology, 46(1), 59, 2001.
[112] Lin, T.S. and Zheng, Y.B., Experimental study of automated diameter mea-surement of retinal blood vessel, Journal of Information and ComputationalScience, 2(1), 81, 2005.
[113] Leandro, J.J.G., Cesar-Jr, R.M., and Jelinek, H.F., Blood vessels segmenta-tion in retina: preliminary assessment of the mathematical morphology and ofthe wavelet transform techniques, in XIV Brazilian Symposium on ComputerGraphics and Image Processing (SIBGRAPI-01), Florianopolis, Brazil, 2001,84–90.
[114] Cesar, Jr, R.M. and Jelinek, H., Segmentation of retinal fundus vasculaturein nonmydriatic camera images using wavelets, in Angiography and plaqueimaging, J. Suri and S. Laxminarayan, eds., CRC Press, London, 193–224,2003.
[115] Leandro, J.J.G., Soares, J.V.B., Cesar, J., R., et al., Blood vessel segmenta-tion of non-mydriatic images using wavelets and statistical classifiers, in 16thBrazilian Symposium on Computer Graphics and Image Processing (SIB-GRAPI03), Sao Carlos, Brazil, 2003, 262–269.
[116] Chaudhuri, S., Chatterjee, S., Katz, N., et al., Detection of blood vessels inretinal images using two-dimensional matched filters, IEEE Transactions onMedical Imaging, 8(3), 263, 1989.
[117] Hoover, A., Kouznetsova, V., and Goldbaum, M., Locating blood vessels inretinal images by piecewise threshold probing of a matched filter response,IEEE Transactions on Medical Imaging, 19(3), 203, 2000.
[118] Zana, F. and Klein, J.C., A multimodal registration algorithm of eye fundusimages using vessels detection and hough transform, IEEE Transactions onMedical Imaging, 18(5), 419, 1999.
[119] Zana, F. and Klein, J.C., Segmentation of vessel-like patterns using mathe-matical morphology and curvature evaluation, IEEE Transactions on ImageProcessing, 10(7), 1010, 2001.
[120] Martınez-Perez, M.E., Hughes, A.D., Stanton, A.V., et al., Segmentation ofretinal blood vessels based on the second directional derivative and region

Introduction 23
growing, in IEEE International Conference in Image Processing (ICIP’99),Kobe, Japan, 1999, 173–176.
[121] Jiang, X. and Mojon, D., Adaptive local thresholding by verification-basedmultithreshold probing with application to vessel detection in retinal images,IEEE Transactions on Pattern Analysis and Machine Intelligence, 25(1), 131,2003.
[122] Niemeijer, M., Staal, J., van Ginneken, B., et al., Comparative study of retinalvessel segmentation methods on a new publicly available database, Proceed-ings of the SPIE, 5370, 648, 2004.
[123] Staal, J., Abramoff, M., Niemeijer, M., et al., Ridge-based vessel segmenta-tion in color images of the retina, IEEE Transactions on Medical Imaging,23(4), 501, 2004.
[124] Hongqing, Z., Huazhong, S., and Limin, L., Blood vessels segmentation inretina via wavelet transforms using steerable filters, in Proceedings of the 17thIEEE Symposium on Computer-Based Medical Systems (CBMS’04), 2004,316–321.
[125] Mendonca, A. and Campilho, A., Segmentation of retinal blood vessels bycombining the detection of centerlines and morphological reconstruction,IEEE Transactions on Medical Imaging, 25(9), 1200, 2006.
[126] Fritzsche, K., Computer vision algorithms for retinal vessel width change de-tection and quantification, 2005.
[127] Kochner, B., Schuhmann, D., Michaelis, M., et al., Course tracking and con-tour extraction of retinal vessels from color fundus photographs: most effi-cient use of steerable filters for model-based image analysis, Proceedings ofthe SPIE, 3338, 755, 1998.
[128] Tamura, S., Okamoto, Y., and Yanashima, K., Zero-crossing interval correc-tion in tracing eye-fundus blood vessels, Pattern Recognition, 21, 227, 1988.
[129] Tolias, Y.A. and Panas, S.M., A fuzzy vessel tracking algorithm for retinalimages based on fuzzy clustering, IEEE Transactions on Medical Imaging,17(2), 263, 1998.
[130] Gao, X., Bharath, A., Stanton, A., et al., A method of vessel tracking for vesseldiameter measurement on retinal images, in Proceedings of the InternationalConference on Image Processing (ICIP’01), 2001, vol. 2, 881–884.
[131] Kirbas, C. and Quek, F., A review of vessel extraction techniques and algo-rithms, ACM Computing Surveys, 36(2), 81, 2004.
[132] Cree, M.J., Cornforth, D.J., and Jelinek, H.F., Vessel segmentation and track-ing using a two-dimensional model, in Image and Vision Computing NewZealand, Dunedin, New Zealand, 2005, 345–350.
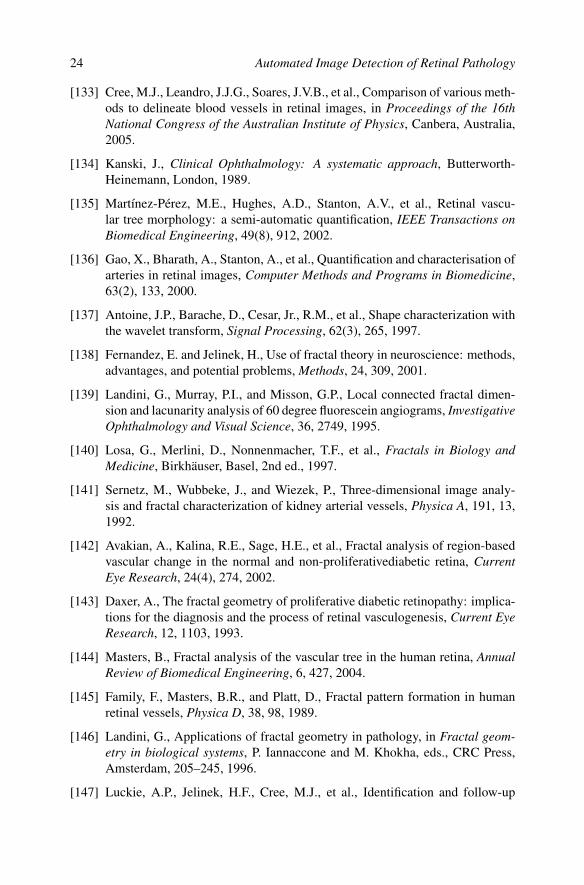
24 Automated Image Detection of Retinal Pathology
[133] Cree, M.J., Leandro, J.J.G., Soares, J.V.B., et al., Comparison of various meth-ods to delineate blood vessels in retinal images, in Proceedings of the 16thNational Congress of the Australian Institute of Physics, Canbera, Australia,2005.
[134] Kanski, J., Clinical Ophthalmology: A systematic approach, Butterworth-Heinemann, London, 1989.
[135] Martınez-Perez, M.E., Hughes, A.D., Stanton, A.V., et al., Retinal vascu-lar tree morphology: a semi-automatic quantification, IEEE Transactions onBiomedical Engineering, 49(8), 912, 2002.
[136] Gao, X., Bharath, A., Stanton, A., et al., Quantification and characterisation ofarteries in retinal images, Computer Methods and Programs in Biomedicine,63(2), 133, 2000.
[137] Antoine, J.P., Barache, D., Cesar, Jr., R.M., et al., Shape characterization withthe wavelet transform, Signal Processing, 62(3), 265, 1997.
[138] Fernandez, E. and Jelinek, H., Use of fractal theory in neuroscience: methods,advantages, and potential problems, Methods, 24, 309, 2001.
[139] Landini, G., Murray, P.I., and Misson, G.P., Local connected fractal dimen-sion and lacunarity analysis of 60 degree fluorescein angiograms, InvestigativeOphthalmology and Visual Science, 36, 2749, 1995.
[140] Losa, G., Merlini, D., Nonnenmacher, T.F., et al., Fractals in Biology andMedicine, Birkhauser, Basel, 2nd ed., 1997.
[141] Sernetz, M., Wubbeke, J., and Wiezek, P., Three-dimensional image analy-sis and fractal characterization of kidney arterial vessels, Physica A, 191, 13,1992.
[142] Avakian, A., Kalina, R.E., Sage, H.E., et al., Fractal analysis of region-basedvascular change in the normal and non-proliferativediabetic retina, CurrentEye Research, 24(4), 274, 2002.
[143] Daxer, A., The fractal geometry of proliferative diabetic retinopathy: implica-tions for the diagnosis and the process of retinal vasculogenesis, Current EyeResearch, 12, 1103, 1993.
[144] Masters, B., Fractal analysis of the vascular tree in the human retina, AnnualReview of Biomedical Engineering, 6, 427, 2004.
[145] Family, F., Masters, B.R., and Platt, D., Fractal pattern formation in humanretinal vessels, Physica D, 38, 98, 1989.
[146] Landini, G., Applications of fractal geometry in pathology, in Fractal geom-etry in biological systems, P. Iannaccone and M. Khokha, eds., CRC Press,Amsterdam, 205–245, 1996.
[147] Luckie, A.P., Jelinek, H.F., Cree, M.J., et al., Identification and follow-up

Introduction 25
of diabetic retinopathy in rural Australia: an automated screening model, inAVRO, Ft. Lauderdale, FL, 2004, 5245/B569.
[148] McQuellin, C., Jelinek, H., and Joss, G., Characterisation of fluorescein an-giograms of retinal fundus using mathematical morphology: a pilot study., in5th International Conference on Ophthalmic Photography, Adelaide, 2002,83.
[149] Stosic, T. and Stosic, B.D., Multifractal analysis of human retinal vessels,IEEE Transactions on Medical Imaging, 25(8), 1101, 2006.


2Diabetic Retinopathy and Public Health
David Worsley and David Simmons
CONTENTS
2.1 Introduction . . . . . . . . . . . . . . . . . . . . . . . . . . . . . . . . . . . . . . . . . . . . . . . . . . . . . . . . . . . . . . . 272.2 The Pandemic of Diabetes and Its Complications . . . . . . . . . . . . . . . . . . . . . . . . . . 282.3 Retinal Structure and Function . . . . . . . . . . . . . . . . . . . . . . . . . . . . . . . . . . . . . . . . . . . . . 292.4 Definition and Description . . . . . . . . . . . . . . . . . . . . . . . . . . . . . . . . . . . . . . . . . . . . . . . . . 352.5 Classification of Diabetic Retinopathy . . . . . . . . . . . . . . . . . . . . . . . . . . . . . . . . . . . . . 402.6 Differential Diagnosis of Diabetic Retinopathy . . . . . . . . . . . . . . . . . . . . . . . . . . . . . 402.7 Systemic Associations of Diabetic Retinopathy . . . . . . . . . . . . . . . . . . . . . . . . . . . . 422.8 Pathogenesis . . . . . . . . . . . . . . . . . . . . . . . . . . . . . . . . . . . . . . . . . . . . . . . . . . . . . . . . . . . . . . 432.9 Treatment . . . . . . . . . . . . . . . . . . . . . . . . . . . . . . . . . . . . . . . . . . . . . . . . . . . . . . . . . . . . . . . . . 452.10 Screening . . . . . . . . . . . . . . . . . . . . . . . . . . . . . . . . . . . . . . . . . . . . . . . . . . . . . . . . . . . . . . . . . 482.11 Conclusion . . . . . . . . . . . . . . . . . . . . . . . . . . . . . . . . . . . . . . . . . . . . . . . . . . . . . . . . . . . . . . . . 55
References . . . . . . . . . . . . . . . . . . . . . . . . . . . . . . . . . . . . . . . . . . . . . . . . . . . . . . . . . . . . . . . . 55
2.1 IntroductionDiabetic retinopathy (DR) is the commonest complication of diabetes and is one ofthe leading causes of blindness [1]. Recent research has given a better understandingof the disease processes and is opening up new avenues for prevention and treatment.Very effective treatments are available and are optimally used when retinopathy is de-tected early, well before the patient is aware of symptoms. For this reason screeningprograms for early detection of retinopathy are an essential part of diabetes care andare in widespread use. Several screening modalities have been used, however, digitalretinal photography is now considered the preferred screening tool. There is poten-tial for automated image analysis to manage the large volume of images generatedfrom screening the ever-increasing number of people with diabetes.
27

28 Automated Image Detection of Retinal Pathology
2.2 The Pandemic of Diabetes and Its ComplicationsDiabetes mellitus is considered one of the major diseases of the 21st century, indeedit has been said that “What AIDS was in the last 20 years of the 20th century, diabetesis going to be in the first 20 years of this century” [2; 3]. Much of this growth isdue to the increasing prevalence of type 2 diabetes, where insulin secretion fromthe beta cells of the pancreas is inadequate for daily demands [4]. Such demanddepends upon a complex balance between various hormones, existing energy stores(e.g. as adipose tissue), physical activity, and resistance to insulin action in muscle,liver, and adipose tissue. Contemporary life in both the developed and developingworld increasingly involves reductions in physical activity and increases in energydense food, with a resulting energy imbalance leading to greater obesity, insulinresistance, and type 2 diabetes. There is now good evidence that the progression fromlesser degrees of glucose intolerance (i.e., impaired fasting glucose and impairedglucose tolerance) to type 2 diabetes can be prevented, or at least delayed, throughlifestyle change providing that substantial support is provided [5–7]. The other majorgroup of patients have type 1 diabetes, where there is destruction of the beta cellsthrough either auto-immune or other mechanisms. Type 1 diabetes is also increasingin prevalence [8]. Other rarer forms of diabetes mellitus exist including MaturityOnset Diabetes of Youth (MODY) and other inherited forms [9].
The epidemic of type 2 diabetes is not only associated with an increasing numberof people with diabetes within a given age group, the mean age at which it is diag-nosed (and presumably commences) is becoming younger [10]. Type 2 diabetes inyouth and children is becoming more prevalent with type 2 diabetes now becomingas common as type 1 diabetes in pediatric diabetes clinics [11]. Of great concern isthe growth in the number of women of child-bearing age with type 2 diabetes whobecome pregnant with poor glucose control with both immediate and long term ter-atogenic effects—the latter increasing the risk of diabetes in the offspring [12; 13].
Diabetes is associated with a range of acute and chronic complications, althoughthe prevalence of these varies by ethnicity, country, and over time [14; 15]. Bothtype 1 and type 2 diabetes are associated with long term macrovascular complicationssuch as ischemic heart disease, stroke, peripheral vascular disease, and heart failure,and microvascular complications such as nephropathy, neuropathy, and retinopathy.Other complications also continue to occur due to glycation such as cataract andcheiroarthropathy or with combined causes such as the diabetic foot.
The biochemical criteria for diabetes were originally defined by their ability topredict microvascular disease, particularly diabetic retinopathy, over time [16]. In-deed, diabetic retinopathy was considered such a specific diabetes-related compli-cation that studies predicted the length of time between development and diagnosisof diabetes by backward linear regression [17]. In the first AusDiab study, however,using linear regression between duration and prevalence of retinopathy, the clinicaldiagnosis of diabetes was thought to have been made at the same time as diabetesdeveloped [18]. AusDiab also showed that retinopathy (defined as the presence of

Diabetic Retinopathy and Public Health 29
at least one definite retinal hemorrhage and/or microaneurysm) was present beforeovert diabetes was detected: 6.7% (5.3% to 8.4%) in impaired fasting glucose andimpaired glucose tolerance with a comparable prevalence in newly diagnosed dia-betes 6.2% (4.0% to 9.2%) and in those without diabetes 5.8% (3.7% to 8.5%) [18].Similar prevalences were found in the Blue Mountains Eye Study [19].
Diabetic retinopathy is a leading cause of visual loss in working-age adults world-wide [20]. Severe vision loss is primarily from diabetic macular edema (DME) andproliferative diabetic retinopathy (PDR). As DME is more common than PDR intype 2 diabetes, and 90% of diabetics are type 2, DME is the leading cause of visualloss in diabetic retinopathy [21].
The prevalence of diabetic retinopathy has recently been thoroughly reviewedby Williams et al. [22]. Tables 2.1a, 2.1b, 2.2a, 2.2b, and 2.2c show the preva-lence and incidence respectively of diabetic retinopathy by retinopathy grade andtype of diabetes (type 1, type 2 diabetes, and mixtures of both) across countries,ethnic groups, and over time. There are clearly major differences in prevalence andincidence between studies depending on when and where they were undertaken anddepending on the methods used for assessing retinopathy. There are likely to be eth-nic differences in diabetic retinopathy as there are in nephropathy, but these remaininconsistent [22].
The most significant predictor of the prevalence of DR is duration of diabetes.In view of the importance of diabetic retinopathy and its contribution to blindness,as well as its utility in providing a window on the natural history of diabetes inindividuals and populations, this chapter will focus on how diabetic retinopathy isdefined and classified, the pathophysiology, the epidemiology, its prevention throughoptimizing metabolic control and associated health care issues, and screening forearly changes.
2.3 Retinal Structure and FunctionThe retina is a transparent layer of vascularized neural tissue lining the inner layerof the back wall of the eye, between the retinal pigment epithelium on the outer andthe vitreous on the inner side. The retina captures photons and converts these to pho-tochemical and electrical energy, integrates the signals, and transmits the resultantsignal to the visual cortex of the brain via the optic nerve, tracts, and radiations.
The retinal architecture is lamellar. Within this there are major cell types perform-ing sensory, nutritional, regulatory, immunomodulatory, and structural functions.The retina is uniquely partitioned from the vascular system by the blood-retinal bar-rier and blood-aqueous barrier. The blood supply is dual; to the inner retina it is bythe retinal circulation lying within the inner retina (the inner blood-retinal barrier)and to the outer retina it is by the choroidal circulation, a thick vascular layer lyingoutside of the retinal pigment epithelium (the outer blood-retinal barrier). The retinalpigment epithelium and the choroid are critical to retinal function.

30 Automated Image Detection of Retinal Pathology
Table 2.1a: Summary of the Range of Global Prevalence Estimates in Type 1,Type 2, and Mixed Cohort Diabetic Patients
Population Grade Type 1 Type 2 Mixed CohortRetinopathy
United States Any DR 0–84% (97.5%415 years DMduration)
7–55% 37–61.1%
PDR 3.8–25% (70%430 years DMduration)
0.9–5%
CSMO 6% 2–4%United Any DR 33.6–36.7% 21–52% 16.5–41%Kingdom PDR 1.1–2.0% 1.1–4% 1.1–8%
CSMO 2.3–6.4% 6.4–6.8%Australian Any DR 42% 13–59.7% 29.1% (10% at 5
years and80% 435 yearsDM duration)
PDR 1.6–7%CSMO 4.3–10%
European Any DR 16.6–76.5% 32.6–61.8% 26.2%PDR 7.3–17% 3.1–15.9% 1.8%CSMO 5.4%
Scandinavian Any DR 10.8–68.3%(90% 420 yearsDM duration)
18.8–65.9% 13.8–75.1%
PDR 2.6–28.4% 4.2–14.5% 1.7–2.4%CSMO 16% 0.6–26.1% 8%Blindness 1.4%
African Any DR 63.9% 26.5–31.4% 28.5%American PDR 18.9% 0.9–1.5% 0.9%
CSMO 8.6% 8.6%Blindness 3.1%
Hispanic Any DR 33.4–45% 48%American PDR 5.6–6.0%
CSMOAmerican Any DR 19.7– 20.9% 19–49.3% 1.7% (total pop.)Indian PDR 5.1–7%
CSMOCSMO, clinically significant macular edema; DM, diabetes mellitus, DR, diabetic retinopathy; PDR,proliferative DR.Adapted from Williams et al., Eye, 18, 963, 2004, Ref. [22]. With permission.

Diabetic Retinopathy and Public Health 31
Table 2.1b: Summary of the Range of Global Prevalence Estimates inType 1, Type 2, and Mixed Cohort Diabetic Patients (continued)
Population Grade Type 1 Type 2 Mixed CohortRetinopathy
NZ European Any DR 37.3%PDR 2.7%CSMO 8.7%
NZ Maori Any DR 40.7%PDR 5.0%CSMO 8.6%
NZ Pacific Any DR 43.8%PDR 6.2%CSMO 13.0%
South Asia Any DR 13.6% 6.7–34.1%PDR 1.9% 0.7–10.3%CSMO 6.4–13.3%Blindness 4.1%
UK South Asians Any DR 11.6%PDRCSMO
Japanese Any DR 31.6–38%PDR 2.8–10%CSMOBlindness 2.9%
Chinese Any DR 19–42% 28–45.2%PDR 0.4–12.7% 2.2%CSMO 2.7%Blindness 0.3%
African Any DR 26–43% 30.5–43% 12.7–42.4%PDR 12.8%CSMO
South American Any DR 54–51.2%PDR 3.4–5.5%CSMO 4.7–8.2%
CSMO, clinically significant macular edema; DM, diabetes mellitus, DR, diabetic retinopathy;PDR, proliferative DR.Adapted from Williams et al., Eye, 18, 963, 2004, Ref. [22]. With permission.NZ data from ref. [23]

32 Automated Image Detection of Retinal Pathology
Tabl
e2.
2a:S
umm
ary
ofth
eR
ange
ofG
loba
lInc
iden
ceE
stim
ates
inTy
pe1,
Type
2,an
dM
ixed
Coh
ortD
iabe
ticPa
tient
s
Popu
latio
nR
etin
opat
hyTy
pe1
Type
2M
ixed
Coh
ort
grad
eU
nite
dSt
ates
No
DR
toD
R33
%>
2yr
s176
.1/1
000P
Y17
.4/1
000P
Y89
.3%
>10
yrs
66.9
%>
10yr
sD
Rto
PDR
37%
>4
yrs
53–6
9%>
10yr
s1.
6/10
00PY
Two-
step
prog
ress
ion
76%
>10
yrs
10–2
4%>
10yr
sC
SMO
20.1
%>
10yr
s13
.9%
>10
yrs
Blin
dnes
s1.
8%>
10yr
s4.
8%>
10yr
s2.
4%>
14yr
sU
nite
dN
oD
Rto
DR
60/1
000P
YK
ingd
om22
%>
6yr
sN
oD
Rto
PDR
7/10
00PY
15.0
/100
0PY
Non
-PD
Rto
PDR
42.1
/100
0PY
Two-
step
prog
ress
ion
29%
>6
yrs
CSM
OB
lindn
ess
64/1
0000
0PY
Aus
tral
ian
No
DR
toD
R8%
pery
ear
DR
toPD
R7%
pery
ear
CSM
O7%
pery
ear
1 Dia
bete
sdu
ratio
n.C
SMO
,cl
inic
ally
sign
ifica
ntm
acul
ared
ema;
DR
,di
abet
icre
tinop
athy
;FP
Gfa
stin
gpl
asm
agl
ucos
e;PD
R,p
rolif
erat
ive
DR
;PY,
pers
on–y
ears
.A
dapt
edfr
omW
illia
ms
etal
.,E
ye,1
8,96
3,20
04,R
ef.[
22].
With
perm
issi
on.

Diabetic Retinopathy and Public Health 33Ta
ble
2.2b
:Su
mm
ary
ofth
eR
ange
ofG
loba
lInc
iden
ceE
stim
ates
inTy
pe1,
Type
2,an
dM
ixed
Coh
ortD
iabe
ticPa
tient
s(c
ontin
ued)
Popu
latio
nR
etin
opat
hyTy
pe1
Type
2M
ixed
coho
rtgr
ade
Eur
opea
nN
oD
Rto
DR
56%
>7
yrs1
47%
>5
yrs
DR
toPD
R9%
>5
yrs
CSM
OB
lindn
ess
60.5
/100
000/
year
forD
Mpo
pula
tion
Scan
dina
vian
No
DR
toD
R85
%>
15yr
s38
%>
4yr
sN
oD
Rto
PDR
13%
>10
yrs
16%
>20
yrs
CSM
O3.
4%>
4yr
sB
lindn
ess
0.23
–1.1
/10
000
yrs
0.6%
>5
yrs
0.5%
>5
yrs
Afr
ican
No
DR
toD
RA
mer
ican
DR
toPD
R2%
>4
yrs
Two-
step
prog
ress
ion
19%
>4
yrs
CSM
OH
ispa
nic
No
DR
toD
R58
.3/1
000P
YA
mer
ican
DR
toPD
RTw
o-st
eppr
ogre
ssio
n24
.1%
>4
yrs
CSM
O1 D
iabe
tes
dura
tion.
CSM
O,c
linic
ally
sign
ifica
ntm
acul
ared
ema;
DR
,dia
betic
retin
opat
hy;F
PGfa
stin
gpl
asm
agl
u-co
se;P
DR
,pro
lifer
ativ
eD
R;P
Y,pe
rson
–yea
rs.
Ada
pted
from
Will
iam
set
al.,
Eye
,18,
963,
2004
,Ref
.[22
].W
ithpe
rmis
sion
.

34 Automated Image Detection of Retinal Pathology
Tabl
e2.
2c:
Sum
mar
yof
the
Ran
geof
Glo
balI
ncid
ence
Est
imat
esin
Type
1,Ty
pe2,
and
Mix
edC
ohor
tDia
betic
Patie
nts
(con
tinue
d)
Popu
latio
nR
etin
opat
hyTy
pe1
Type
2M
ixed
Coh
ort
grad
eA
mer
ican
No
DR
toD
R72
.3%
>12
.8yr
sIn
dian
No
DR
toPD
R12
/100
0PY
CSM
OJa
pane
seN
oD
Rto
DR
70%
at29
year
s39
.8/1
000P
Y,48
.1/1
000P
YFP
G<
125
mg/
dl:3
/100
0PY
DR
toPD
R57
.7/1
000P
YFP
G12
6–13
9m
g/dl
:6.9
/100
0PY
FPG
4140
mg/
dl:1
3.9/
1000
PYC
hine
seN
oD
Rto
DR
19.2
%>
4yr
s,44
.4/1
000
PYD
Rto
PDR
5.8%
>4
yrs
37.5
/100
0PY
CSM
OSo
uth
No
DR
toD
R6.
6/10
0PY
Am
eric
anD
Rto
PDR
CSM
O
CSM
O,c
linic
ally
sign
ifica
ntm
acul
ared
ema;
DR
,dia
betic
retin
opat
hy;F
PGfa
stin
gpl
asm
agl
ucos
e;PD
R,p
rolif
erat
ive
DR
;PY,
pers
on–y
ears
.A
dapt
edfr
omW
illia
ms
etal
.,E
ye,1
8,96
3,20
04,R
ef.[
22].
With
perm
issi
on.
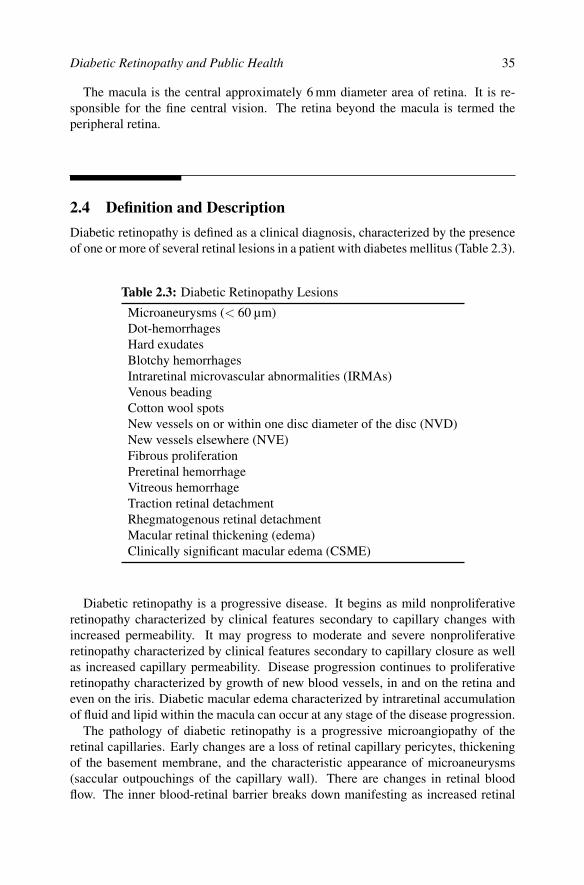
Diabetic Retinopathy and Public Health 35
The macula is the central approximately 6 mm diameter area of retina. It is re-sponsible for the fine central vision. The retina beyond the macula is termed theperipheral retina.
2.4 Definition and DescriptionDiabetic retinopathy is defined as a clinical diagnosis, characterized by the presenceof one or more of several retinal lesions in a patient with diabetes mellitus (Table 2.3).
Table 2.3: Diabetic Retinopathy Lesions
Microaneurysms (< 60 µm)Dot-hemorrhagesHard exudatesBlotchy hemorrhagesIntraretinal microvascular abnormalities (IRMAs)Venous beadingCotton wool spotsNew vessels on or within one disc diameter of the disc (NVD)New vessels elsewhere (NVE)Fibrous proliferationPreretinal hemorrhageVitreous hemorrhageTraction retinal detachmentRhegmatogenous retinal detachmentMacular retinal thickening (edema)Clinically significant macular edema (CSME)
Diabetic retinopathy is a progressive disease. It begins as mild nonproliferativeretinopathy characterized by clinical features secondary to capillary changes withincreased permeability. It may progress to moderate and severe nonproliferativeretinopathy characterized by clinical features secondary to capillary closure as wellas increased capillary permeability. Disease progression continues to proliferativeretinopathy characterized by growth of new blood vessels, in and on the retina andeven on the iris. Diabetic macular edema characterized by intraretinal accumulationof fluid and lipid within the macula can occur at any stage of the disease progression.
The pathology of diabetic retinopathy is a progressive microangiopathy of theretinal capillaries. Early changes are a loss of retinal capillary pericytes, thickeningof the basement membrane, and the characteristic appearance of microaneurysms(saccular outpouchings of the capillary wall). There are changes in retinal bloodflow. The inner blood-retinal barrier breaks down manifesting as increased retinal

36 Automated Image Detection of Retinal Pathology
capillary permeability and intraretinal hemorrhage. Retinal capillaries and arteriolesclose (retinal nonperfusion). Later there is proliferation of blood vessels (termed“new vessels”), first within the retina and then on the retinal surface and onto theposterior surface of the vitreous. Accompanying vessel proliferation is fibrous tissueproliferation on the retinal surface and along the posterior vitreous surface. Contrac-tion of fibrous tissue leads to complications such as vitreous hemorrhage and tractionretinal detachment. In advanced disease new vessels proliferate on the iris.
Microaneurysms are almost always the first clinical sign of diabetic retinopa-thy, and are seen as intraretinal deep red spots 15 to 60 µm in diameter. There isa continuous turnover of microaneurysms; individual microaneurysms may persistfor long time periods before eventually disappearing. Rupture of microaneurysmsand increased capillary permeability give rise to intraretinal hemorrhage. Small pin-point intraretinal (dot) hemorrhages are typical of diabetic retinopathy. They maybe difficult to distinguish clinically from microaneurysms. Distinguishing betweenmicroaneurysms and dot-hemorrhages is of little clinical importance and thereforesmall intraretinal red lesions can be classified together as “hemorrhages and microa-neurysms” (Figure 2.1).
Increased capillary permeability gives rise to intraretinal accumulation of fluid(edema) clinically termed “retinal thickening,” and lipid, seen as yellow-white well-defined intraretinal accumulations termed “hard exudate” (Figure 2.2).
Patches of capillary closure develop and coalesce as areas of nonperfused retina.Capillary closure is not visible clinically without fluorescein angiography. Adjacentto areas of nonperfusion tortuous vessels termed “intraretinal microvascular abnor-malities” (IRMA) may arise. It is not clear whether IRMA are new vessel prolifera-tion or abnormal preexisting vessels. Other features associated with capillary closureinclude large intraretinal hemorrhages (“blotchy hemorrhages”), segmental vein di-latation (“venous beading”) and a halt in axoplasmic flow in the nerve fiber layerseen as fluffy white patches in the innermost retina (“cotton wool spots”) — seeFigure 2.2(b)).
Nonperfused retina releases vascular endothelial growth factors (VEGFs). Theseare a family of peptides produced by a single gene. VEGF isoforms act specificallyon vascular endothelial cells leading to new vessel proliferation and increased ves-sel permeability. VEGF expression, synthesis and release are enhanced by hypoxiafrom areas of nonperfusion [24]. VEGF diffuses throughout the eye and results inthe growth of new vessels on the retinal surface and eventually on the iris. This istermed “proliferative diabetic retinopathy” (PDR) while all retinopathy prior to newvessel formation is “nonproliferative diabetic retinopathy” (NPDR). This is the basisof the classification of diabetic retinopathy discussed later. The presence of severeNPDR (three of the following four in at least two quadrants of the retina: IRMA, cot-ton wool spots, venous beading, extensive retinal hemorrhages, or microaneurysms)is a predictor of the development of PDR; about 50% will develop PDR within 15months [25]. However, these features are not universally found with early new ves-sels. Cotton wool spots are transient; IRMA and retinal hemorrhages may not beseen with more extensive capillary closure.

Diabetic Retinopathy and Public Health 37
FIGURE 2.1Moderate nonproliferative diabetic retinopathy with moderate diabetic macularedema. (See color insert following page 174.)
New vessels are usually first evident within 45 degrees of the optic disc, 15% onor within one disc diameter of the optic disc, termed “new vessels disc” (NVD);40% only outside of this area termed “new vessels elsewhere” (NVE); and 45% hadvessels in both areas [26].
Early NVD are loops or networks of fine vessels on the optic disc. As they growthe vessel complex extends outside the optic disc margin and the vessel caliber in-creases. NVE begin as small loops or networks usually near a retinal vein. As theygrow they form networks that distinctively pass across the underlying retinal veinsand arterioles. The new vessels grow into the scaffold of the posterior vitreous sur-face. New vessels are fragile and highly permeable. Vitreous traction on these fragilenew vessels may lead to preretinal and vitreous hemorrhage (Figure 2.3).
With time fibroglial tissue develops adjacent to the new vessels and within thenew vessel complexes. The combination of fibrous and vascular tissue is termedfibrovascular tissue. As the fibrovascular tissue grows, the proportion of the fibrouscomponent increases. Eventually new vessels may regress. Fibrovascular tissue is

38 Automated Image Detection of Retinal Pathology
(a) (b)
(c) (d)
FIGURE 2.2Nonproliferative diabetic retinopathy (NPDR). (a) Moderate NPDR and severe di-abetic macular edema; hard exudates involve the center of the macula. (b) Moder-ate NPDR; microaneurysms/dot hemorrhages, hard exudate (ring) and cotton woolspots. (c) Severe NPDR; > 20 intraretinal hemorrhages in four quadrants (threeshown here) and IRMA (possibly NVE). Biomicroscopy showed the latter lesion tobe intraretinal, hence it is IRMA. (d) Venous beading. (See color insert.)

Diabetic Retinopathy and Public Health 39
(a) (b)
(c) (d)
FIGURE 2.3Proliferative diabetic retinopathy (PDR). (a) PDR with moderate diabetic macularedema. There are new vessels disc, new vessels elsewhere, IRMA, blotchy hem-orrhages, microaneurysms/dot-hemorrhages, and hard exudates. Hard exudate ap-proach the center of the macula. Pan retinal photocoagulation scars are seen in thetop left and top and bottom far right. (b) New vessels elsewhere. (c) PDR with pre-retinal hemorrhage. Hemorrhage is contained within the space between the retinaand the posterior vitreous face. The hemorrhage obscures the retinal new vessels.(d) Fibrous proliferation with traction macular detachment. PDR has regressed. Re-gressed fibro-vascular tissue along the inferior temporal vascular arcade has con-tracted causing traction macular detachment. Traction lines can be seen extendinginto the central macula. (See color insert.)

40 Automated Image Detection of Retinal Pathology
adherent to both the retina and the posterior vitreous surface. In many eyes thefibrovascular tissue contracts, and via these adhesions exerts traction on the retina.Traction may cause retinal edema, striation, and heterotropia (dragging), and retinaldetachments; either without retinal tear (traction retinal detachment) or with retinaltear (rhegmatogenous retinal detachment).
Diabetic macular edema (DME) is defined as intraretinal accumulation of fluidwithin two disc diameters of the center of the macula. DME may develop at any stageof diabetic retinopathy. Macular abnormalities found in diabetic retinopathy includeDME, capillary nonperfusion, intraretinal hemorrhage, preretinal hemorrhage, mac-ular surface traction from fibrovascular proliferation, preretinal membrane (avascularfibrous tissue proliferation) and partial or full thickness macular hole.
2.5 Classification of Diabetic RetinopathyThe Early Treatment Diabetic Retinopathy Study (ETDRS) classification system [25]is the gold standard used in clinical trials. It is complex and not easy to use in clinicalpractice.
Proposed to replace the ETDRS classification for use in clinical practice are theInternational Clinical Diabetic Retinopathy and Diabetic Macular Edema DiseaseSeverity Scales [27]. These are scientifically based and practical classification sys-tems derived from the ETDRS and the Wisconsin Epidemiological Study of DiabeticRetinopathy study (WESDR) [28; 29]. The major modifications to previous classi-fication systems are based on scientific evidence. IRMA and venous beading areincluded as they are the most predictive for progression to PDR. A separate stage forsevere NPDR is made on the basis of the evidence that early treatment is beneficialfor patients with type 2 diabetes with severe NPDR. A severity scale for DME is anew and important addition. Included are the factors that determine if macular edemais sight threatening; the location and area of retinal thickening and hard exudates.
2.6 Differential Diagnosis of Diabetic RetinopathyA number of retinal vascular diseases share many of the clinical signs seen in diabeticretinopathy; these include central retinal vein occlusion, branch retinal vein occlu-sion, hypertensive retinopathy, ocular ischemic syndrome (hypoperfusion retinopa-thy), the retinopathies of blood dyscrasias such as anemia and leukemia, parafovealtelangiectasis and other retinal telangiectases, sickle cell retinopathy, and radiationretinopathy.
One of the more common of these diseases such as branch retinal vein occlusion orcentral retinal vein occlusion may well be seen concurrently with diabetic retinopa-thy and may be difficult to differentiate. If suspected from the clinical features, ocular

Diabetic Retinopathy and Public Health 41
Table 2.4: International Clinical Diabetic Retinopathy Disease Severity Scale
Disease Severity Level FindingsNo apparent retinopathy No abnormalitiesMild nonproliferative diabeticretinopathy
Microaneurysms only
Moderate nonproliferativediabetic retinopathy
More than just microaneurysms but lessthan severe nonproliferative diabeticretinopathy
Severe nonproliferative diabeticretinopathy
Any of the following:
• > 20 intraretinal hemorrhages ineach of four quadrants
• Venous beading in two or morequadrants
• Intraretinal microvascular abnormal-ities in one or more quadrants
and no signs of proliferative retinopathyProliferative diabeticretinopathy
One or both of the following:
• Neovascularization
• Vitreous/preretinal hemorrhage
Table 2.5: International Clinical Diabetic Macular Edema Disease SeverityScale
Disease Severity Level FindingsDiabetic macular edemaapparently absent
No apparent retinal thickening or hard ex-udates in posterior pole
Diabetic macular edemaapparently present
Some apparent retinal thickening or hardexudates in posterior pole
If diabetic macular edema present then:Mild diabetic macularedema
Some retinal thickening or hard exudatein the posterior retina but distant from thecenter of the macula
Moderate diabetic macularedema
Retinal thickening or hard exudate near butnot involving the center of the macula
Severe diabetic macularedema
Retinal thickening or hard exudate in thecenter of the macula

42 Automated Image Detection of Retinal Pathology
investigations such as fluorescein angiography or optical coherence tomography andsystemic investigations may be needed to distinguish from diabetic retinopathy.
2.7 Systemic Associations of Diabetic RetinopathyCoexistent systemic factors can have a significant bearing on the development andprogression of diabetic retinopathy.
2.7.1 Duration of diabetes
The most significant predictor of the development and progression of diabetic retino-pathy is duration of diabetes. For type 1 diabetes, diabetic retinopathy is rare before5 years duration, 8% for 3 years, 25% for 5 years, 60% for 10 years and 80% for15 years. PDR has 0% prevalence at 3 years and 25% at 15 years [30]. In type 2diabetes prevalence is 23% 11 to 13 years after diagnosis and 60% after 16 years ormore [31].
2.7.2 Type of diabetes
Some data suggest that diabetes type is important in some aspects of treatment ofdiabetic retinopathy. Type 2 diabetes with severe nonproliferative retinopathy maybenefit from pan-retinal photocoagulation according to reanalysis of data from theETDRS [20]. The Diabetic Retinopathy Study found a similar trend.
The Diabetic Vitrectomy Study found early vitrectomy for vitreous hemorrhagebeneficial for type 1 diabetes but not for type 2 [32]. However this study is some 20years old and more modern vitrectomy techniques put this conclusion in question.
2.7.3 Blood glucose control
The Diabetes Control and Complications Trial and the United Kingdom ProspectiveDiabetes Study demonstrate the benefit of intensive glycemic control on delayingthe development and slowing progression of diabetic retinopathy in both type 1 andtype 2 diabetes [33–35].
2.7.4 Blood pressure
High blood pressure can produce a retinopathy characterized by microaneurysms, in-traretinal hemorrhages, cotton wool spots, hard exudates, and optic nerve swelling,which is related to the level of systolic blood pressure. Coexistent hypertension isseen in 25% of type 1 diabetics after 10 years [36] and 38–68% of type 2 diabet-ics [37]. Studies show hypertension to be a risk factor for development and progres-sion of diabetic retinopathy [20; 36; 38].

Diabetic Retinopathy and Public Health 43
2.7.5 Serum lipids
The relationship between serum lipids and diabetic retinopathy is unclear. TheETDRS found an association with faster development of hard exudate [20]. Hard ex-udate is associated with an increased risk of moderate visual loss [20]. The WESDRfound no association between diabetic retinopathy and serum lipids [20].
2.7.6 Renal disease
Renal disease secondary to diabetes predicts diabetic retinopathy [28; 39] and con-versely diabetic retinopathy predicts renal disease [40; 41]. The nature of the inter-relationship is not defined and probably complex. Concurrence could represent theinfluence of common risk factors such as hyperglycemia, duration of diabetes, andsystemic hypertension [28; 42–44]
2.7.7 Anemia
Several studies link anemia with development and progression of diabetic retinopa-thy [20].
2.7.8 Pregnancy
Pregnancy may be associated with a rapid progression of diabetic retinopathy [45;46], but this is generally temporary so that long-term risk is unchanged [47]. Postu-lated reasons include progesterone-induced upregulation of VEGF [48] and alteredhemodynamics [49; 50].
2.7.9 Smoking
Any association between smoking and diabetic retinopathy is unclear [51], howeversmoking is a risk factor for cardiovascular disease, hypertension, and renal diseasein diabetics [52].
2.8 PathogenesisThe exact mechanism by which diabetes causes retinopathy is unknown. There arenumerous pieces of evidence that could explain some aspects of the disease.
2.8.1 Hyperglycemia
In NPDR chronic hyperglycemia induces oxidative stress, mitochondria dysfunction,and ultimately cell death (apoptosis). Hyperglycemia activates enzymes that mayinitiate apoptosis [53]. Retinal capillary cells (pericytes and endothelial cells) and

44 Automated Image Detection of Retinal Pathology
Muller cells are damaged and may undergo apoptosis [54]. Pericyte damage leadsto altered hemodynamics with abnormal autoregulation of retinal blood flow andreduced blood flow velocity [55; 56].
Excess glucose enters the polyol pathway to be converted into sorbitol [57]. Thiscauses disruption of cell osmotic balance leading to retinal capillary pericyte dam-age [58], in turn leading to microaneurysm formation.
Advanced glycation end products (AGEs) are produced from nonenzymatic inter-action of the excess glucose with proteins [59; 60]. AGEs may lead to oxidativestress, microvascular disease with altered hemodynamics and endothelial cell dam-age, stimulation of inflammation and thrombosis [61; 62].
Excess glucose also forms diacylglycerol (DAG). This activates protein kinase C(PKC) [63; 64]. PKC may also be increased after oxidative stress to endothelialcells [65; 66]. PKC, particularly the beta form, is associated with increased retinalcapillary permeability and increased VEGF activity [67; 68].
Reactive oxygen species (ROS) could derive from glucose oxidation, an unregu-lated polyol pathway, and protein glycation. ROS may activate PKC and increaseAGEs and DAG levels [65; 69].
2.8.2 Hematological abnormalities
There are a number of hematological abnormalities seen in diabetes that could leadto reduction of blood flow and have a role in retinal capillary damage and occlu-sion [70]. The abnormalities include increased plasma viscosity [71], decreased rederythrocyte deformability [72], increased erythrocyte and platelet aggregation [73;74], and leukocyte abnormalities (discussed below).
2.8.3 Leukostasis and inflammation
Leukocytes are large, rigid white blood cells that have a normal tendency to adhereto endothelial cells lining blood vessels (leukostasis). They then produce superoxideradicals and proteolytic enzymes [75]. There is increased leukostasis in diabetesand the leukocytes are less deformable and more activated. This causes endothelialcell dysfunction, reduced capillary perfusion, occlusion, altered permeability, andangiogenesis [75].
There is evidence linking a role for inflammation induced by hyperglycemia [76].Findings in DR in common with inflammation include leukostasis, capillary occlu-sion, increased vascular permeability, increased inducible nitric oxide (iNOS), cy-tokines, and nuclear factor kappa B (NF-B) [77].
2.8.4 Growth factors
Vascular endothelial growth factor (VEGF) is a cytokine promoting angiogenesis andis considered the major growth factor in ocular angiogenesis and for neovasculariza-tion in diabetic retinopathy [78]. VEGF not only promotes growth of new vesselsbut maintains the endothelial cells until they have pericyte coverage. VEGF also

Diabetic Retinopathy and Public Health 45
promotes endothelial cell migration, increased permeability, and vasodilatation. Cellstress resulting from reduced oxygen tension is the key stimulus for VEGF release. Indiabetic retinopathy retinal nonperfusion is considered the initiator of excess VEGFrelease [79].
The insulin-like growth factor system comprises IGF-1 and -2 plus at least sixIGF binding proteins. These factors have many functions. Research indicates animportant role of these factors in diabetic retinopathy [76].
2.8.5 Neurodegeneration
The retina is a neural tissue. Diabetic retinopathy may be a neurodegenerative dis-order as well as a vascular disorder. Glucose-induced glutamate elevation may leadto oxidative stress causing neuronal and glial cell toxicity [80]. Retinal ganglion cellapoptosis appears very early in diabetic retinopathy and progresses throughout thedisease course [54]. Retinal glial cell dysfunction leads to endothelial cell dysfunc-tion [80].
2.9 TreatmentThe care of a patient with diabetic retinopathy involves determining the stage ofretinopathy and macular edema, promptly giving any indicated ocular treatments,managing any associated systemic conditions, and arranging appropriately-timedfollow-up examination. The risks of disease progression based on baseline retinopa-thy determine the management recommendations.
2.9.1 Management of systemic associations
Attention to the modifiable systemic associations can delay development and slowthe progression of diabetic retinopathy. Rigorous maintenance of blood glucose atnear to normal levels significantly reduces the development and progression of dia-betic retinopathy in both type 1 diabetes [33] and type 2 diabetes [35]. Tight controlof blood pressure in type 1 and 2 diabetes reduces progression of diabetic retinopa-thy [33; 38; 81; 82]. There is an association between development of hard exudateand higher serum lipid levels. As hard exudate accumulation is associated with visualloss, control of serum lipid may reduce the risk of visual loss [83].
2.9.2 Ocular treatments
2.9.2.1 Laser photocoagulation
Laser photocoagulation of the retina is the mainstay treatment for diabetic retino-pathy. Pan retinal laser where the peripheral retina outside of the macula is coveredwith spaced laser burns is used for PDR. The rationale is that ablation of a significant

46 Automated Image Detection of Retinal Pathology
proportion of retina reduces the load of angiogenic factors (including VEGF) pro-duced by a nonperfused retina. The Diabetic Retinopathy Study demonstrated thatpan-retinal laser significantly reduces severe vision loss (visual acuity < 5/200) ineyes with PDR [82; 84; 85]. Treatment should also be considered for severe NPDR,especially for type 2 diabetes [86]. Early pan retinal laser may also be considered inat-risk situations such as pregnancy or renal failure.
DME is treated with laser to the macula. The mechanisms by which macularlaser may work are not fully understood. Laser may directly close leaking microa-neurysms, alter retinal blood flow, or work via changes in the retinal pigment ep-ithelium [87]. The ETDRS demonstrated a greater than 50% reduction in moderatevisual loss using macular laser for DME with defined at-risk characteristics [88; 89]termed clinically significant diabetic macular edema (CSDME). These are: (1) Reti-nal thickening at or within 500 microns of the macular center. (2) Hard exudate at orwithin 500 microns of the macular center associated with adjacent retinal thickening;and (3) A zone(s) of retinal thickening≥ 1 disc diameter, any part of which is within1 disc diameter of the macular center [88].
Laser technology has advanced since these studies were performed. Indirect laserdeliver systems allow treatment to far peripheral retina and through media opacitysuch as cataract and vitreous hemorrhage. New technologies and techniques aim toreduce the degree of thermal retinal damage as a consequence of treatment. Sub-threshold micropulse laser delivery techniques are being investigated for treatmentof PDR and DME [90; 91].
2.9.2.2 Vitreoretinal surgery
Vitreoretinal microsurgery can be used to remove media opacity and relieve vitreo-retinal traction. It is indicated for advanced diabetic retinopathy with certain com-plications including vitreous hemorrhage, severe new vessel proliferation, tractionmacular detachment, and rhegmatogenous retinal detachment [92; 93]. Our un-derstanding of disease processes and the instrumentation and techniques for vitre-ous surgery have advanced significantly since these studies were published. Morecomplex pathology can now be treated and surgical complications are less frequentand better managed. Consequently, the surgical results have improved dramatically.The indications for surgery have widened to include earlier stages of disease, in-cluding certain subsets of DME [94]. In eyes with DME and vitreous traction,vitrectomy with or without peeling of the internal limiting membrane may reducemacular edema. Submacular hard exudates can be removed using vitrectomy tech-niques [95; 96].
2.9.3 Investigational treatments
2.9.3.1 Corticosteroids
Corticosteroids reduce vasopermeability, stabilize the blood-retinal barrier, down-regulate VEGF, and are anti-inflammatory.

Diabetic Retinopathy and Public Health 47
Triamcinolone acetonide injected into the subtenon’s space adjacent to the eyereduces macular edema and improves visual acuity in eyes with DME [97–99]. In-travitreal triamcinolone has been found to be more effective than subtenon injection.The main problem is the short duration of efficacy, measured in months [100; 101].This necessitates multiple treatments that increase the risk of complications, whichinclude endophthalmitis, cataract, retinal detachment, and glaucoma [99].
Sustained-release corticosteroid intraocular implants Retisert (fluocinolone ace-tonide; Bausch & Lomb; Rochester, New York) and Posurdex (dexamethasone; Al-lergan, Inc.; Irvine, California) are being evaluated for the treatment of DME.
2.9.3.2 Angiogenesis inhibitors
Vascular endothelial growth factor (VEGF) is a potent stimulus for both retinal neo-vascularization and macular edema in diabetic retinopathy [102]. Several moleculesthat block VEGF activity are under investigation for the treatment of diabetic retino-pathy. Pegaptanib (Macugen, Eyetech) is a VEGF aptamer and ranibizumab (lucen-tis, Genentech) and bevacizumab (Avastin, Genetech) are anti-VEGF monoclonalantibodies. These agents lead to regression of retinal and iris neovascularizationand macular edema [103–106]. The apparent effectiveness of these drugs has ledto widespread clinical use for the treatment of DME and PDR without completedclinical trials.
2.9.3.3 Protein kinase C inhibitors
Ruboxistaurin is a specific inhibitor of protein kinase C beta taken as a daily oralmedication. It has shown promising effects in animal models [107] and on human di-abetic retinal blood flow abnormalities [108]. Inconclusive effects have been demon-strated for reducing visual loss from nonproliferative retinopathy [109] and on DME[110]. Further studies are ongoing.
2.9.3.4 Other agents
A number of other agents including angiotensin converting enzyme inhibitors, an-giotensin II receptor blockers, growth hormone inhibitors, cycloxgenase-2 inhibitor,pigment epithelium-derived factor, and interferon-alpha 2a are under investigationfor treatment of diabetic retinopathy.
2.9.3.5 Surgical adjuncts
Investigational surgical adjuncts include hyaluronidase and plasmin. Hyaluronidasebreaks down vitreous structure thereby liquefying the vitreous. Intravitreal injectionof purified ovine hyaluronidase (Vitrase, ISTA Pharmaceuticals) is under study fortreatment of vitreous hemorrhage [111; 112]. Plasmin is a protease that can cleavethe vitreoretinal junction and potentially allow a relatively atraumatic separation ofthe vitreous from the retina [113; 114].

48 Automated Image Detection of Retinal Pathology
2.10 ScreeningScreening is the systematic evaluation of apparently healthy people with a significantrisk of having a specific disease with consequences that can be prevented by medicalintervention. Screening is offered to a defined group within the population. Thosefound to have a positive screening test are referred for further diagnostic evaluation.
Diabetic retinopathy has few if any symptoms until the advanced stages of disease,either the development of macular edema or complications of proliferative retino-pathy. Because treatment is aimed at preventing vision loss rather than restoringlost vision and treatable retinopathy is frequently asymptomatic, it is important toidentify patients at an early stage of retinal disease. Then regular re-examinationis needed to detect progression of retinopathy to a threshold level for initiatingtreatment. The benefits of early detection of retinopathy, regular examination, andtimely treatment in reducing vision loss and costs to society have been shown [115;116].
Diabetic retinopathy satisfies all the criteria for screening: it has (1) significantmorbidity, (2) a high prevalence in the diabetic population, (3) diagnosis by defi-nite and simple criteria, (4) acceptable, readily available, and effective treatment,(5) treatment that is more beneficial if initiated at an earlier time than is usual fordiagnosis (while still asymptomatic), and (6) an acceptable, economic, reliable, andvalid screening test. Validity is measured by the sensitivity (ability of a test to cor-rectly identify disease) and specificity (ability to correctly identify nondisease). Atest with 95% sensitivity will correctly identify 95 of 100 cases of disease. 95%specificity means the test will be negative in 95 of 100 normals. A good screeningtest should have both an acceptably high sensitivity and specificity.
2.10.1 Methods of screening
There are a variety of methods for detection of diabetic retinopathy (Table 2.6). Di-abetic retinopathy screening has employed a number of these methods; direct orindirect ophthalmoscopy, mydriatic or nonmydriatic, color or monochromatic, filmor digital photography.
2.10.1.1 Retinal photography
Retinal photography is a widely utilized method of screening. The United KingdomScreening Committee has put digital retinal photography as the preferred modalityfor newly established screening programs [117].
Seven standard field stereoscopic color photography as defined by the ETDRS isthe gold standard for detecting and classifying diabetic retinopathy [25]. It serves asthe benchmark to which other screening techniques can be compared. Although veryaccurate this is logistically demanding on the scale required for screening [118]. Toemulate the ETDRS either seven 30°, three 60°, or nine overlapping 45° fields can beused [119; 120]. This is difficult to do for a large number of patients in a screening

Diabetic Retinopathy and Public Health 49
Table 2.6: Examination Methods for Diabetic Retinopathy
Direct/indirect ophthalmoscopyContact lens/ noncontact lens biomicroscopyRetinal photography:
mydriatic 7-standard field (gold standard)mydriatic/nonmydriatic film/digital (1 or more fields)
program because of the need for a highly experienced photographer, the long timetaken to accurately obtain the required views, the logistics of handling and storingthe large number of images generated and of the input from highly skilled imagereaders. In addition, the pupil needs to be dilated, which adds to the time taken andthe cost, and introduces compliance issues.
Nonstereoscopic photographic screening is logistically easier than stereoscopicphotography and is a valid simplification for screening. By definition the detec-tion of DME requires identification of retinal thickening, which is not possible withnonstereoscopic photography. Other indicators of the presence of DME can be sub-stituted. Visual acuity is one other easily obtained indication of macular status. Thepresence of microaneurysms, hemorrhages, or hard exudate in the macula is acceptedas a good indicator of DME. Nonstereoscopic photography has comparable sensitiv-ity and specificity with the ETDRS seven standard field images for grading of retino-pathy and achieves a fair to moderate comparison for DME [121; 122]. Despite thepoorer validity for determining DME, nonstereoscopic photography is considered agood screening method [122; 123].
Nonstereoscopic photography permits nonmydriasis (nondilation of the pupil) andthereby a simplification of the screening method. Nonmydriasis has the advantagesof technically easier screening with greater patient compliance but with the disadvan-tages of lower image quality and sensitivity [118]. There is a significant incidence ofungradable images in the elderly due to lens opacity, however, most become gradableafter mydriasis [124].
There has been considerable discussion on the minimum area of image fields re-quired for screening. It is essential to have a field including the macula and a mini-mum field is considered to be 45 degrees horizontal and 40 degrees vertical. A singlefield including the macula may be sufficient [118] although multiple field photogra-phy does give greater coverage and increased sensitivity [122–125]. Nasal retinopa-thy has been shown to be accompanied by referable retinopathy in the macular field,and an argument can be made that this obviates the need for the second nasal field.The advantage of single field screening is the lower technical failure rate; the diffi-culty of multiple field photography is that it is more technically challenging, needs askilled photographer, mydriasis, increased time for taking and reading images, morestorage, and with all these, cost. However, the argument for a single field is notwidely accepted in practice.
In the United Kingdom a Minimum Camera Specification for screening has beenproposed. Nonmydriatic digital cameras are preferred even when mydriasis is rou-tinely undertaken.

50 Automated Image Detection of Retinal Pathology
The recommendations are that [126]:
• Image file formats should not result in the loss of any clinically significantinformation.
• Camera resolution of the original images, as output by the camera, should bea minimum of 20 pixels per degree of retinal image, both horizontally andvertically.
• The field of view, as permanently recorded, should be a minimum of 45° hori-zontally and 40° vertically.
Images must be reviewed by a skilled reader. This is a significant cost of photo-graphic screening [127]. Digital image capture allows for transmission to a readingcenter. This is valid for finding vision threatening retinopathy but not for detection ofDME [123; 128]. Another study found a high validity for reading 45° digital imagessent via the Internet [129]. Internet transmission has created interest in telemedicinefor screening. Telemedicine is an accurate method for remote grading and assessingthe need for referral for treatment [122].
2.10.1.2 Ophthalmoscopy
Ophthalmoscopy is relatively easy to apply as a method of screening. It is quick tomaster and can be performed by nonophthalmologists with no specialized equipment.Ophthalmoscopy performed by an experienced examiner such as an ophthalmologisthas a high sensitivity and has a greater than 85% correlation with photographic grad-ing [130]. However, nonophthalmologists only achieve a sensitivity of 63% for anyretinopathy [131] and about 50% for the detection of PDR [132].
There are limitations to the use of ophthalmoscopy for screening. Although it ispossible to have very high sensitivity and specificity, even ophthalmoscopy by oph-thalmologists is not as sensitive as photography for detecting the earliest signs ofretinopathy and DME [133; 134]. In addition, the resource of experienced ophthal-mologists is limited and expensive.
2.10.1.3 Automated image analysis
Digital photographic retinopathy screening programs generate very large numbers ofretinal images for manual reading. Acquiring, processing, and reading these imagesis labor intensive, time consuming, and expensive.
As diabetic retinopathy is diagnosed and classified solely on analysis of visibleretinal lesions, automated computer image analysis is an attractive option but untilrelatively recently has only been of academic interest. The perceived benefits of au-tomated analysis would be rapid, accurate, quantified, and cost-effective processingof large numbers of images. Additionally, there is the potential for “instant” analysisat the time of image capture so a point-of-service screening program is possible. Thiscould be a mobile system that captures, processes, and analyzes the images to givean accurate diagnosis, all at the time of the patient’s examination. This would then

Diabetic Retinopathy and Public Health 51
allow for the immediate arrangement of any referral for treatment or reschedulingfor future screening.
A valid automated analysis system will need to perform above the 80% sensitiv-ity and 95% specificity set by the World Health Organization for diabetic retino-pathy [135]. In a typical screening program 78% of screenings have no diabeticretinopathy [136], and these could be identified and eliminated from the need formanual image reading by an automated analysis system that detects any diabeticretinopathy [137]. To this end a microaneurysm detector has been shown to be effec-tive [137; 138]. More advanced image analysis would need to identify each of theimportant clinical lesions; microaneurysms/dot hemorrhages, hard exudates, venousbeading, blotchy hemorrhages, and new vessels. This would then make automatedclassification of retinopathy possible. The critical end points would be severe non-proliferative retinopathy, proliferative retinopathy and, at any point, the presenceof macular edema. Distinguishing severe nonproliferative retinopathy requires thedefinition of blotchy hemorrhages, venous beading, IRMA, and their number anddistribution in the four retinal quadrants. For proliferative retinopathy new vesselsmust be defined. Automated detection of DME is more problematic. Ideally this re-quires identification of retinal thickening by stereoscopic examination. Photographicscreening programs would be unlikely to include stereoscopic macular photogra-phy. However, as discussed earlier, for screening purposes the presence of microa-neurysms, intraretinal hemorrhages, or hard exudate in the macula is accepted asan indicator of likely DME. Hard exudate is particularly associated with intraretinaledema/retinal thickening. Additionally, retinal thickening may be associated withgeometric distributions of lesions, rings and clusters of hard exudate, clusters ofmicroaneurysms, or intraretinal hemorrhages. Such geometric features could be de-tected by image analysis as an indicator of likely DME.
Alternatively or additionally to photographic methods for defining DME, opticalcoherence tomography (OCT) could be employed in diabetic retinopathy screeningto detect retinal thickening. OCT is an imaging modality using the measurement oftime delay and intensity of back-scattered light incident upon the retina to providehigh resolution (1–15 µm) cross-sectional images of the retina. The images showthe layered structural anatomy of the retina (see Figure 2.4). OCT allows accuratedetection and quantification of DME and may be more sensitive than biomicroscopyfor detecting mild degrees of macular thickening. Its reproducibility would allowfor detection of any change in retinal thickness with repeat screening. Current OCTtechnology cannot be seen as replacing photographic technology for detection ofother lesions of retinopathy but rather running concurrently for improved detectionof DME.
What image analysis algorithms are needed for automated analysis of diabeticretinopathy? Each eye is analyzed separately. An image must be of sufficient quality,in focus, and have adequate contrast. This would need to be sampled at a numberof localities across the image. One possible approach for determining contrast andfocus would be to locate retinal blood vessels and determine the contrast at the vesseledges. Brightness can be manipulated to create an image of optimal parameters foranalysis of a particular lesion.

52 Automated Image Detection of Retinal Pathology
(a)
(b)
(c)
FIGURE 2.4Optical Coherence Tomography (OCT). (a) Normal macula of a diabetic with noDR. (b) A patient with 6/6 acuity and microaneurysms close to the fovea. OCTshows intraretinal thickening and cystic spaces of intraretinal edema. Edema justinvolves the fovea. (c) The same patient six months later. Visual acuity has fallento 6/12. There is increased intraretinal edema with foveal involvement. (See colorinsert.)

Diabetic Retinopathy and Public Health 53
The minimum image field is an equivalent view to a 45° horizontal and 40° verticalimage centered on the macula that includes the optic disc. More extensive coverage,that is, two or more views, provides more data and may allow for classification ofretinopathy. As the optic disc is a simple landmark for the photographer to find, three45° views with the optic disc placed at the left edge, the center, and the right edgeare a simple set to obtain that cover a wide area of retina and include a view of themacula. An automated system could determine this by identifying the optic disc.It can be recognized by its approximate size, color, and the emergence of the reti-nal vasculature; tracking the vascular tree back to its source is an alternative. Thereare situations where there is difficulty in accurately identifiying the optic disc. Theoptic disc can be locally obscured in diabetic retinopathy either by preretinal hem-orrhage, fibrovascular tissue, or retinal detachment, all advanced states of disease.Large accumulations of hard exudate could appear as an optic disc size white lesion.Uncommonly there could be other abnormalities that superficially resemble the op-tic disc, for example, chorioretinal scars may be white and may be associated withvessels.
Due to imperfections in centering some retinal photographs have a peripheral seg-ment obscured while the remainder is of good quality. Poor quality areas could beenhanced or removed and analysis could also determine if there is then still sufficientarea of quality image. A composite retinal image could be constructed from a set ofretinal images taken widely around the retina by mapping the retinal vascular tree.
To classify retinopathy there must be an analysis of each of the four quadrants cen-tered on the optic disc (quandants are centered on the optic disc rather than on centerof the macula). To distinguish early from moderate and severe NPDR, specific le-sions (intraretinal hemorrhages, venous beading, and IRMAs) must be identified andcounted in each quadrant. The presence (or absence) of new vessels must be deter-mined to identify PDR (or by their absence NPDR). Normal retinal vessels follow aparticular set of parameters. They are a continuously connected tree-like structure,arising from the optic disc, have small curvatures, the vessel caliber changes grad-ually, and the intensity profile across a vessel is approximated by a Gaussian curve.Arterioles do not cross arterioles and veins do not cross veins. New vessels do notfollow these “rules” and in particular may cross a normal vessel or themselves.
To detect DME the macula needs to be accurately identified. The macula may beidentified by several strategies; for a right eye image it lies to the left of the opticdisc and to the right on a left eye image, the macula is surrounded by a wreath ofvasculature with branches pointing toward but not reaching the avascular center, thecenter has a concentration of pigment, and in a healthy eye has an optical reflex, thefoveal reflex. Of these the first feature is universal, the second usually true (thereare exceptions, the vascular pattern can be unreliable in a few normal eyes, and insome disease states, for example, heterotopia macula (dragged macula)), the last twofeatures may be obscured in macular disease including diabetic retinopathy itself.With the macula identified the presence, number of, and proximity to the center ofthe various diabetic retinopathy lesions can be determined. This process for readingretinal images is summarized in Table 2.7.

54 Automated Image Detection of Retinal Pathology
Table 2.7: Steps in Reading a Retinal Image
1. Identify eye as right or left.
2. Identify quality view of macula as minimum image.
3. Identify lesions of retinopathy:
microaneurysms, hemorrhages, hard exudate, (cottonwool spot,) venous beading, new vessels, fibrosis, vitre-ous hemorrhage.
4. Lesions’ proximity to macula center as indicator for DME.
5. Grading by identification and quantification of lesions infour quadrants.
2.10.2 Frequency of screening
The optimal frequency for diabetic retinopathy screening is unknown. Without em-pirical data to show otherwise, annual screening is recommended [139]. Less fre-quent re-screening may be needed for those with no apparent retinopathy or mildNPDR with no apparent DME. For these patients, the annual incidence of progres-sion to either PDR or DME is low and therefore a longer interval between examina-tions may be appropriate [140]. Based on cost effectiveness there is a clear argumentfor only screening those with no retinopathy every two or three years. Effective-ness is virtually unchanged for very significant screening cost savings. The need forannual screening for some type 2 diabetics has been questioned [141].
2.10.3 Cost effectiveness of screening
The cost and benefits of screening will vary depending on the perspective taken. Anaccepted measure of utility is the Cost per Sight Year Saved. This shows diabeticretinopathy screening to be highly effective [142; 143].
2.10.4 Access to care and screening
The size of the diabetes epidemic, socioeconomic, cultural and geographic issues,lack of patient education, limited funding with scarce health resources, incompletecommunication between health care providers with broken continuity of care andincomplete patient registers all contribute to many patients missing out on adequateeye care. With effective treatment readily available, there is unnecessary loss ofvision and blindness.
Access to health care is also likely to be a determinant of duration of diabetes be-fore diagnosis, metabolic control after diagnosis, retinal screening penetration andaccess to early treatment. At least in Australia, there appears to be no major dif-ference in prevalence of retinopathy between rural and urban areas although otherrural-urban differences in eye disease exist [144].

Diabetic Retinopathy and Public Health 55
As a complex, largely asymptomatic, chronic disease, there are many reasons foraccess to health care to be patchy. Barriers to diabetes care can be placed in fivedomains: psychological (i.e., behavioral), psychosocial (i.e., the way the individualand those around interact with each other such as family), internal physical (i.e.,physical conditions that prevent self care), external physical (i.e., barriers relating tothe health system in its widest context) and educational [145].
2.11 ConclusionDigital photographic screening of the diabetic population is an essential health caremeasure for detection of early diabetic retinopathy. Automated retinal image analy-sis promises to provide consistently accurate and detailed screening information, aneffective solution to managing the huge volume of images generated by screeningthe large and ever increasing diabetic population and “instant” image analysis at thetime of screening.
References[1] Fong, D.S., Aiello, L.P., and Gardner, Retinopathy in diabetes, Diabetes Care,
27(suppl 1), S84, 2004.
[2] Zimmet, P., Alberti, K.G., and Shaw, J., Global and societal implications ofthe diabetes epidemic, Nature, 414, 782, 2001.
[3] New Zealand Herald, World faces diabetes catastrophe, experts say, NewZealand Herald, August 26, 2003.
[4] Stumvoll, M., Goldstein, B.J., and van Haeften, T.W., Type 2 diabetes: Prin-ciples of pathogensis and therapy, Lancet, 365, 1333, 2005.
[5] Knowler, W.C., Barrett-Connor, E., Fowler, S.E., et al., Reduction in the in-cidence of type 2 diabetes with lifestyle intervention or metformin, N Engl JMed., 346, 393, 2002.
[6] Tuomilehto, J., Lindstrom, J., Eriksson, J.G., et al., Prevention of type 2 dia-betes mellitus by changes in lifestyle among subjects with impaired glucosetolerance, N Engl J Med., 344, 1343, 2001.
[7] Ramachandran, A., Snehalatha, C., Mary, S., et al., The Indian DiabetesPrevention Programme shows that lifestyle modification and metformin pre-vent type 2 diabetes in Asian Indian subjects with impaired glucose tolerance(IDPP-1), Diabetologia, 49, 289, 2006.

56 Automated Image Detection of Retinal Pathology
[8] Daneman, D., Type 1 diabetes, Lancet, 367, 847, 2006.
[9] Permutt, M.A., Wasson, J., and N., C., Genetic epidemiology of diabetes, JClin Invest, 115, 1431, 2005.
[10] Fagot-Campagna, A., Pettitt, D.J., Engelgau, M.M., et al., Type 2 diabetesamong North American children and adolescents: An epidemiologic reviewand a public health perspective, J. Pediatr., 136, 664, 2000.
[11] Rosenbloom, A., Joe, J.R., Young, R.S., et al., Emerging epidemic of type 2diabetes in youth, Diabetes Care, 22, 345, 1999.
[12] McElduff, A., Ross, G.P., Lagstrom, J.A., et al., Pregestational diabetes andpregnancy: An Australian experience, Diabetes Care, 28, 1260, 2005.
[13] Pettitt, D.J., Bennett, P.H., Knowler, W.C., et al., Gestational diabetes mel-litus and impaired glucose tolerance during pregnancy: Long terms effectson obesity and glucose tolerance in the offspring, Diabetes, 34(supp 2), 119,1985.
[14] Amos, A.F., McCarty, D.J., and Zimmet, P., The rising global burden of dia-betes and its complications: Estimates and projections to the year 2010, DiabMed, 14(supp 5), S1, 1997.
[15] International Diabetes Federation, ed., Diabetes Atlas, International DiabetesFederation, 2nd ed., 2003.
[16] Dorf, A. and et al., Retinopathy in Pima Indians: Relationship to glucoselevel, duration of diabetes and age at examination in a population with a highprevalence of diabetes, Diabetes, 25, 554, 1976.
[17] Harris, M., Klein, R., Welborn, T., et al., Onset of NIDDM occurs at least 4–7years before clinical diagnosis, Diabetes Care, 15, 815, 1992.
[18] Tapp, R.J., Shaw, J.E., Harper, C.A., et al., The prevalence of and factorsassociated with diabetic retinopathy in the Australian population, DiabetesCare, 26, 1731, 2003.
[19] Yu, T., Mitchell, P., Berry, G., et al., Retinopathy in older persons withoutdiabetes and its relationship to hypertension, Arch Ophthalmol, 116, 83, 1998.
[20] Aiello, L.P., Cahill, M.T., and Wong, J.S., Systemic considerations in the man-agement of diabetic retinopathy, Am J Ophthalmol, 132, 760, 2001.
[21] Klein, R., Klein, B.E., Moss, S.E., et al., The Wisconsin Epidemiologic Studyof Diabetic Retinopathy. IV. Diabetic macular edema, Ophthalmology, 91,1464, 1985.
[22] Williams, R., Airey, M., Baxter, H., et al., Epidemiology of diabetic retinopa-thy and macular oedema: A systematic review, Eye, 18, 963, 2004.
[23] Simmons, D., Clover, G., and Hope, C., Ethnic differences in diabetic

Diabetic Retinopathy and Public Health 57
retinopathy, Diabet Med, 24, 1093, 2007.
[24] Frank, R.N., Diabetic retinopathy, N Engl J Med, 350, 48, 2004.
[25] Early Treatment Diabetic Retinopathy Study Research Group, Grading dia-betic retinopathy from stereoscopic color fundus photographs–an extensionof the modified Airlie House classification. ETDRS report number 10., Oph-thalmology, 98, 786, 1991.
[26] Klein, R., Barriers to prevention of vision loss caused by diabetic retinopathy,Arch Ophthalmol, 115, 1073, 1997.
[27] American Academy of Ophthalmology, Diabetic retinopathy disease sever-ity scale 2002, 2002, http://www.aao.org/education/library/recommendations/international dr.cfm.
[28] Klein, R., Klein, B.E., Moss, S.E., et al., The Wisconsin Epidemiologic Studyof Diabetic Retinopathy: XVII. The 14-year incidence and progression ofdiabetic retinopathy and associated risk factors in type 1 diabetes, Ophthal-mology, 105, 1801, 1998.
[29] Klein, R., Klein, B.E., and Moss, S.E., How many steps of progression ofdiabetic retinopathy are meaningful? The Wisconsin Epidemiologic Study ofDiabetic Retinopathy, Arch Ophthalmol, 119, 547, 2001.
[30] Klein, R., Klein, B.E., Moss, S.E., et al., The Wisconsin Epidemiologic Studyof Diabetic Retinopathy. III. Prevalence and risk of diabetic retinopathy whenage at diagnosis is 30 or more years, Arch Ophthalmol, 102, 527, 1984.
[31] Yanko, L., Goldbourt, U., Michaelson, I.C., et al., Prevalence and 15-yearincidence of retinopathy and associated characteristics in middle-aged and el-derly diabetic men, Br J Ophthalmol, 67, 759, 1984.
[32] Diabetic Retinopathy Vitrectomy Study, Early vitrectomy for severe vitreoushemorrhage in diabetic retinopathy. Four-year results of a randomized trial:Diabetic Retinopathy Vitrectomy Study Report 5, Arch Ophthalmol, 108, 958,1990.
[33] The Diabetes Control and Complications Trial Research Group, The effect ofintensive treatment of diabetes on the development and progression of long-term complications in insulin-dependent diabetes mellitus, N Engl J Med, 329,977, 1993.
[34] Diabetes Control and Complications Trial Research Group, Progression ofretinopathy with intensive versus conventional treatment in the Diabetes Con-trol and Complications Trial, Ophthalmology, 102, 647, 1995.
[35] UK Prospective Diabetes Study (UKPDS) Group, Intensive blood-glucosecontrol with sulphonylureas or insulin compared with conventional treat-ment and risk of complications in patients with type 2 diabetes (UKPDS 33),Lancet, 352, 837, 1998.

58 Automated Image Detection of Retinal Pathology
[36] Klein, R., Klein, B.E., Lee, K.E., et al., The incidence of hypertension ininsulin-dependent diabetes, Arch Intern Med, 156, 622, 1996.
[37] Klein, R., Klein, B.E., Moss, S.E., et al., Blood pressure and hypertension indiabetes, Am J Epidemiol, 122, 75, 1985.
[38] UK Prospective Diabetes Study (UKPDS) Group, Tight blood pressure con-trol and risk of macrovascular and microvascular complications in type 2 dia-betes: UKPDS 38, BMJ, 317, 703, 1998.
[39] Park, J.Y., Kim, H.K., Chung, Y.E., et al., Incidence and determinants ofmicroalbuminuria in Koreans with type 2 diabetes, Diabetes Care, 21, 530,1998.
[40] Hasslacher, C., Bostedt-Kiesel, A., Kempe, H.P., et al., Effect of metabolicfactors and blood pressure on kidney function in proteinuric type 2 (non-insulin-dependent) diabetic patients, Diabetologia, 36, 1051, 1993.
[41] Klein, R., Moss, S.E., and Klein, B.E., Is gross proteinuria a risk factor for theincidence of proliferative diabetic retinopathy? Ophthalmology, 100, 1140,1993.
[42] Klein, R., Klein, B.E., Moss, S.E., et al., The 10-year incidence of renal in-sufficiency in people with type 1 diabetes, Diabetes Care, 22, 743, 1999.
[43] Lloyd, G., The importance of accuracy in blood pressure recording, Br J ClinPract, 49, 284, 1996.
[44] UK Prospective Diabetes Study Group (UKPDS), X. Urinary albumin excre-tion over 3 years in diet-treated type 2, (non-insulin-dependent) diabetic pa-tients, and association with hypertension, hyperglycaemia and hypertriglyc-eridaemia, Diabetologia, 36, 1021, 1993.
[45] Moloney, J.B. and Drury, M.I., The effect of pregnancy on the natural courseof diabetic retinopathy, Am J Ophthalmol, 93, 745, 1982.
[46] Klein, B.E., Moss, S.E., and Klein, R., Effect of pregnancy on progression ofdiabetic retinopathy, Diabetes Care, 13, 34, 1990.
[47] Diabetes Control and Complications Trial (DCCT) Research Group, Effect ofpregnancy on microvascular complications in the Diabetes Control and Com-plications Trial, Diabetes Care, 23, 1084, 2000.
[48] Sone, H., Okuda, Y., Kawakami, Y., et al., Progesterone induces vascular en-dothelial growth factor on retinal pigment epithelial cells in culture, Life Sci,59, 21, 1996.
[49] Chen, H.C., Newsom, R.S., Patel, V., et al., Retinal blood flow changes dur-ing pregnancy in women with diabetes, Invest Ophthalmol Vis Sci, 35, 3199,1994.
[50] Schocket, L.S., Grunwald, J.E., Tsang, A.F., et al., The effect of pregnancy on

Diabetic Retinopathy and Public Health 59
retinal hemodynamics in diabetic versus nondiabetic mothers, Am J Ophthal-mol, 128, 477, 1999.
[51] Muhlhauser, I., Cigarette smoking and diabetes: An update, Diabet Med, 11,336, 1994.
[52] Sawicki, P.T., Muhlhauser, I., Bender, R., et al., Effects of smoking on bloodpressure and proteinuria in patients with diabetic nephropathy, J Intern Med,239, 345, 1996.
[53] Mohr, S.E. and Boswell, R.E., Genetic analysis of Drosophila melanogasterpolytene chromosome region 44D–45F: Loci required for viability and fertil-ity, Genetics, 160, 1503, 2002.
[54] Barber, A.J., Lieth, E., Khin, S.A., et al., Neural apoptosis in the retina duringexperimental and human diabetes. Early onset and effect of insulin, J ClinInvest, 102, 783, 1998.
[55] Ciulla, T.A., Harris, A., Latkany, P., et al., Ocular perfusion abnormalities indiabetes, Acta Ophthalmol Scand, 80, 468, 2002.
[56] Otani, T., Kishi, S., and Maruyama, Y., Patterns of diabetic macular edemawith optical coherence tomography, Am J Ophthalmol, 127, 688, 1999.
[57] Gabbay, K.H., Hyperglycemia, polyol metabolism, and complications of dia-betes mellitus, Annu Rev Med, 26, 521, 1975.
[58] Sato, S., Secchi, E.F., Lizak, M.J., et al., Polyol formation and NADPH-dependent reductases in dog retinal capillary pericytes and endothelial cells,Invest Ophthalmol Vis Sci, 40, 697, 1999.
[59] Brownlee, M., Vlassara, H., and Cerami, A., Nonenzymatic glycosylation andthe pathogenesis of diabetic complications, Ann Intern Med, 101, 527, 1984.
[60] Friedman, E.A., Advanced glycosylated end products and hyperglycemia inthe pathogenesis of diabetic complications, Diabetes Care, 22 Suppl 2, B65,1999.
[61] Schmidt, A.M., Yan, S.D., Wautier, J.L., et al., Activation of receptor for ad-vanced glycation end products: A mechanism for chronic vascular dysfunc-tion in diabetic vasculopathy and atherosclerosis, Circ Res, 84, 489, 1999.
[62] Singh, R., Barden, A., Mori, T., et al., Advanced glycation end-products: Areview, Diabetologia, 44, 129, 2001.
[63] Inoguchi, T., Battan, R., Handler, E., et al., Preferential elevation of proteinkinase C isoform beta II and diacylglycerol levels in the aorta and heart ofdiabetic rats: Differential reversibility to glycemic control by islet cell trans-plantation, Proc Natl Acad Sci USA, 89, 11059, 1992.
[64] Xia, P., Inoguchi, T., Kern, T.S., et al., Characterization of the mechanism forthe chronic activation of diacylglycerol-protein kinase C pathway in diabetes

60 Automated Image Detection of Retinal Pathology
and hypergalactosemia, Diabetes, 43, 1122, 1994.
[65] Nishikawa, T., Edelstein, D., and Brownlee, M., The missing link: A singleunifying mechanism for diabetic complications, Kidney Int Suppl, 77, S26,2001.
[66] Taher, M.M., Garcia, J.G., and Natarajan, V., Hydroperoxide-induced dia-cylglycerol formation and protein kinase C activation in vascular endothelialcells, Arch Biochem Biophys, 303, 260, 1993.
[67] Nagpala, P.G., Malik, A.B., Vuong, P.T., et al., Protein kinase C beta 1 overex-pression augments phorbol ester-induced increase in endothelial permeability,J Cell Physiol, 166, 249, 1996.
[68] Xia, P., Aiello, L.P., Ishii, H., et al., Characterization of vascular endothelialgrowth factor’s effect on the activation of protein kinase C, its isoforms, andendothelial cell growth, J Clin Invest, 98, 2018, 1997.
[69] Giugliano, D., Ceriello, A., and Paolisso, G., Oxidative stress and diabeticvascular complications, Diabetes Care, 19, 257, 1996.
[70] Sakata, K., Funatsu, H., Harino, S., et al., Relationship between macular mi-crocirculation and progression of diabetic macular edema, Ophthalmology,113, 1385, 2006.
[71] McMillan, D.E., Plasma protein changes, blood viscosity, and diabetic mi-croangiopathy, Diabetes, 25, 858, 1976.
[72] McMillan, D.E., Utterback, N.G., and La Puma, J., Reduced erythrocyte de-formability in diabetes, Diabetes, 27, 895, 1978.
[73] Schmid-Schonbein, H. and Volger, E., Red-cell aggregation and red-cell de-formability in diabetes, Diabetes, 25, 897, 1976.
[74] Sagel, J., Colwell, J.A., Crook, L., et al., Increased platelet aggregation inearly diabetus mellitus, Ann Intern Med, 82, 733, 1975.
[75] Miyamoto, K. and Ogura, Y., Pathogenetic potential of leukocytes in diabeticretinopathy, Semin Ophthalmol, 14, 233, 2000.
[76] Grant, M.B., Afzal, A., Spoerri, P., et al., The role of growth factors in thepathogenesis of diabetic retinopathy, Expert Opin Investig Drugs, 13, 1275,2004.
[77] Joussen, A.M., Poulaki, V., Qin, W., et al., Retinal vascular endothelial growthfactor induces intercellular adhesion molecule-1 and endothelial nitric oxidesynthase expression and initiates early diabetic retinal leukocyte adhesion invivo, Am J Pathol, 160, 501, 2002.
[78] Miller, J.W., Adamis, A.P., and Aiello, L.P., Vascular endothelial growth fac-tor in ocular neovascularization and proliferative diabetic retinopathy, Dia-betes Metab Rev, 13, 37, 1997.

Diabetic Retinopathy and Public Health 61
[79] Aiello, L.P., Avery, R.L., Arrigg, P.G., et al., Vascular endothelial growth fac-tor in ocular fluid of patients with diabetic retinopathy and other retinal disor-ders, N Engl J Med, 331, 1480, 1994.
[80] Cunha-Vaz, J., Faria de Abreu, J.R., and Campos, A.J., Early breakdown ofthe blood-retinal barrier in diabetes, Br J Ophthalmol, 59, 649, 1975.
[81] Diabetes Control and Complications Trial (DCCT), Early worsening of dia-betic retinopathy in the Diabetes Control and Complications Trial, Arch Oph-thalmol, 116, 874, 1998.
[82] Diabetic Retinopathy Study Research Group, Preliminary report on effects ofphotocoagulation therapy, Am J Ophthalmol, 81, 383, 1976.
[83] Sjolie, A.K. and Moller, F., Medical management of diabetic retinopathy, Di-abet Med, 21, 666, 2004.
[84] Diabetic Retinopathy Study Research Group, Photocoagulation treatment ofproliferative diabetic retinopathy. Clinical application of Diabetic RetinopathyStudy (DRS) findings, DRS report number 8, Ophthalmol, 88, 583, 1981.
[85] Diabetic Retinopathy Study Research Group, Four risk factors for severe vi-sual loss in diabetic retinopathy. the third report from the Diabetic RetinopathyStudy, Arch Ophthalmol, 97, 654, 1979.
[86] Aiello, L.M., Perspectives on diabetic retinopathy, Am J Ophthalmol, 136,122, 2003.
[87] Fong, D.S., Strauber, S.F., Aiello, L.P., et al., Comparison of the modifiedearly treatment diabetic retinopathy study and mild macular grid laser pho-tocoagulation strategies for diabetic macular edema, Arch Ophthalmol, 125,469, 2007.
[88] Early Treatment Diabetic Retinopathy Study (ETDRS) Research Group , Pho-tocoagulation for diabetic macular edema. Early Treatment Diabetic Retino-pathy Study Report Number 1, Arch Ophthalmol, 103, 1796, 1985.
[89] Early Treatment Diabetic Retinopathy Study (ETDRS) Research Group, Earlyphotocoagulation for diabetic retinopathy. ETDRS Report Number 9, Oph-thalmol, 98(5 Suppl), 766, 1991.
[90] Luttrull, J.K., Musch, D.C., and Spink, C.A., Subthreshold diode micropulsepanretinal photocoagulation for proliferative diabetic retinopathy, Eye, 22,607, 2008.
[91] Luttrull, J.K., Musch, D.C., and Mainster, M.A., Subthreshold diode mi-cropulse photocoagulation for the treatment of clinically significant diabeticmacular oedema, Br J Ophthalmol, 89, 74, 2004.
[92] The Diabetic Retinopathy Vitrectomy Study Research Group, Early vitrec-tomy for severe vitreous hemorrhage in diabetic retinopathy. Two-year results

62 Automated Image Detection of Retinal Pathology
of a randomized trial. Diabetic Retinopathy Vitrectomy Study Report 2, ArchOphthalmol, 103, 1644, 1985.
[93] The Diabetic Retinopathy Vitrectomy Study Research Group, Early vitrec-tomy for severe proliferative diabetic retinopathy in eyes with useful vision.Clinical application of results of a randomized trial—Diabetic RetinopathyVitrectomy Study Report 4, Ophthalmol, 95, 1321, 1988.
[94] Smiddy, W.E. and Flynn, H.W., Vitrectomy in the management of diabeticretinopathy, Surv Ophthalmol, 43, 491, 1999.
[95] Sakuraba, T., Suzuki, Y., Mizutani, H., et al., Visual improvement after re-moval of submacular exudates in patients with diabetic maculopathy, Oph-thalmic Surg Lasers, 31, 287, 2000.
[96] Takaya, K., Suzuki, Y., Mizutani, H., et al., Long-term results of vitrectomyfor removal of submacular hard exudates in patients with diabetic maculopa-thy, Retina, 24, 23, 2004.
[97] Wada, M., Ogata, N., Minamino, K., et al., Trans-tenon’s retrobulbar injectionof triamcinolone acetonide for diffuse diabetic macular edema, Jpn J Ophthal-mol, 49, 509, 2005.
[98] Bakri, S.J. and Kaiser, P.K., Posterior subtenon triamcinolone acetonide forrefractory diabetic macular edema, Am J Ophthalmol, 139, 290, 2005.
[99] Gillies, M.C., Sutter, F.K., Simpson, J.M., et al., Intravitreal triamcinolonefor refractory diabetic macular edema: Two-year results of a double-masked,placebo-controlled, randomized clinical trial, Ophthalmology, 113, 1533,2006.
[100] Martidis, A., Duker, J.S., Greenberg, P.B., et al., Intravitreal triamcinolone forrefractory diabetic macular edema, Ophthalmology, 109, 920, 2002.
[101] Massin, P., Audren, F., Haouchine, B., et al., Intravitreal triamcinolone ace-tonide for diabetic diffuse macular edema: Preliminary results of a prospectivecontrolled trial, Ophthalmology, 111, 218, 2004.
[102] Nguyen, Q.D., Tatlipinar, S., Shah, S.M., et al., Vascular endothelial growthfactor is a critical stimulus for diabetic macular edema, Am J Ophthalmol,142, 961, 2006.
[103] Chun, D.W., Heier, J.S., Topping, T.M., et al., A pilot study of multiple in-travitreal injections of ranibizumab in patients with center-involving clinicallysignificant diabetic macular edema, Ophthalmology, 113, 1706, 2006.
[104] Adamis, A.P., Altaweel, M., Aiello, L.P., et al., A phase II randomized double-masked trial of pegaptanib, an anti-vascular endothelial growth factor aptamer,for diabetic macular edema, Ophthalmol, 112, 1747, 2005.
[105] Krzystolik, M.G., Filippopoulos, T., Ducharme, J.F., et al., Pegaptanib as an

Diabetic Retinopathy and Public Health 63
adjunctive treatment for complicated neovascular diabetic retinopathy, ArchOphthalmol, 124, 920, 2006.
[106] Silva Paula, J., Jorge, R., Alves Costa, R., et al., Short-term results of intravit-real bevacizumab (avastin) on anterior segment neovascularization in neovas-cular glaucoma, Acta Ophthalmol Scand, 84, 556, 2006.
[107] Comer, G.M. and Ciulla, T.A., Pharmacotherapy for diabetic retinopathy,Curr Opin Ophthalmol, 15, 508, 2004.
[108] Aiello, L.P., Clermont, A., Arora, V., et al., Inhibition of PKC beta by oraladministration of ruboxistaurin is well tolerated and ameliorates diabetes-induced retinal hemodynamic abnormalities in patients, Invest Ophthalmol VisSci, 47, 86, 2005.
[109] Aiello, L.P., Davis, M.D., Girach, A., et al., Effect of ruboxistaurin on visualloss in patients with diabetic retinopathy, Ophthalmology, 113, 2221, 2006.
[110] PKC-DMES Study Group, Effect of ruboxistaurin in patients with diabeticmacular edema: Thirty-month results of the randomized PKC-DMES clinicaltrial, Arch Ophthalmol, 125, 318, 2007.
[111] Kuppermann, B.D., Thomas, E.L., de Smet, M.D., et al., Pooled efficacy re-sults from two multinational randomized controlled clinical trials of a singleintravitreous injection of highly purified ovine hyaluronidase (vitrase) for themanagement of vitreous hemorrhage, Am J Ophthalmol, 140, 573, 2005.
[112] Kuppermann, B.D., Thomas, E.L., de Smet, M.D., et al., Safety results oftwo phase III trials of an intravitreous injection of highly purified ovinehyaluronidase (vitrase) for the management of vitreous hemorrhage, Am JOphthalmol, 140, 585, 2005.
[113] Williams, J.G., Trese, M.T., Williams, G.A., et al., Autologous plasmin en-zyme in the surgical management of diabetic retinopathy, Ophthalmology,108, 1902, 2001.
[114] Trese, M.T., Enzymatic-assisted vitrectomy, Eye, 16, 365, 2002.
[115] Kristinsson, J.K., Stefansson, E., Jonasson, F., et al., Systematic screening fordiabetic eye disease in insulin dependent diabetes, Acta Ophthalmol, 72, 72,1994.
[116] Singer, D.E., Nathan, D.M., Fogel, H.A., et al., Screening for diabetic retino-pathy, Ann Intern Med, 116, 660, 1992.
[117] Taylor, R. and British Diabetic Association Mobile Retinal Screening Group,Practical community screening for diabetic retinopathy using the mobile reti-nal camera: Report of a 12 centre study, Diabet Med, 13, 946, 1996.
[118] Williams, G.A., Scott, I.U., Haller, J.A., et al., Single-field fundus photogra-phy for diabetic retinopathy screening: A report by the American Academy

64 Automated Image Detection of Retinal Pathology
of Ophthalmology, Ophthalmology, 111, 1055, 2004.
[119] Aldington, S.J., Kohner, E.M., Meuer, S., et al., Methodology for retinal pho-tography and assessment of diabetic retinopathy: The Eurodiab IDDM Com-plications Study, Diabetologia, 38, 437, 1995.
[120] Shiba, T., Yamamoto, T., Seki, U., et al., Screening and follow-up of diabeticretinopathy using a new mosaic 9-field fundus photography system, DiabetesRes Clin Pract, 55, 49, 2001.
[121] Newsom, R., Moate, B., and Casswell, T., Screening for diabetic retinopathyusing digital colour photography and oral fluorescein angiography, Eye, 14,579, 2000.
[122] Bursell, S.E., Cavallerano, J.D., Cavallerano, A.A., et al., Stereo nonmydri-atic digital-video color retinal imaging compared with early treatment diabeticretinopathy study seven standard field 35-mm stereo color photos for deter-mining level of diabetic retinopathy, Ophthalmology, 108, 572, 2001.
[123] Liesenfeld, B., Kohner, E., Piehlmeier, W., et al., A telemedical approach tothe screening of diabetic retinopathy: Digital fundus photography, DiabetesCare, 23, 345, 2000.
[124] Pugh, J.A., Jacobson, J.M., van Heuven, W.A., et al., Screening for diabeticretinopathy. The wide-angle retinal camera, Diabetes Care, 16, 889, 1993.
[125] Fransen, S.R., Leonard-Martin, T.C., Feuer, W.J., et al., Clinical evalua-tion of patients with diabetic retinopathy: Accuracy of the inoveon diabeticretinopathy-3DT system, Ophthalmology, 109, 595, 2002.
[126] Scanlon, P., Screening for diabetic retinopathy in Europe: 15 years after theSaint Vincent Declaration, in Proceedings of the Liverpool Declaration, S.P.Harding, ed., Liverpool, UK, 2005.
[127] Bjorvig, S., Johansen, M.A., and Fossen, K., An economic analysis of screen-ing for diabetic retinopathy, J Telemed Telecare, 8, 32, 2002.
[128] Cook, H.L., Heacock, G.L., Stanford, M.R., et al., Detection of retinal lesionsafter telemedicine transmission of digital images, Eye, 14 ( Pt 4), 563, 2000.
[129] Gomez-Ulla, F., Fernandez, M.I., Gonzalez, F., et al., Digital retinal imagesand teleophthalmology for detecting and grading diabetic retinopathy, Dia-betes Care, 25, 1384, 2002.
[130] Moss, S.E., Klein, R., Kessler, S.D., et al., Comparison between ophthal-moscopy and fundus photography in determining severity of diabetic retino-pathy, Ophthalmology, 92, 62, 1985.
[131] Owens, D.R., Gibbins, R.L., Lewis, P.A., et al., Screening for diabetic retino-pathy by general practitioners: Ophthalmoscopy or retinal photography as35 mm colour transparencies? Diabet Med, 15, 170, 1998.

Diabetic Retinopathy and Public Health 65
[132] Sussman, E.J., Tsiaras, W.G., and Soper, K.A., Diagnosis of diabetic eye dis-ease, JAMA, 247, 3231, 1982.
[133] Kinyoun, J.L., Martin, D.C., Fujimoto, W.Y., et al., Ophthalmoscopy ver-sus fundus photographs for detecting and grading diabetic retinopathy, InvestOphthalmol Vis Sci, 33, 1888, 1992.
[134] Harding, S.P., Broadbent, D.M., Neoh, C., et al., Sensitivity and specificity ofphotography and direct ophthalmoscopy in screening for sight threatening eyedisease: The Liverpool Diabetic Eye Study, BMJ, 311, 1131, 1995.
[135] World Health Organisation, Diabetes care and research in Europe: The St.Vincent Declaration. Diabetes mellitus in Europe: A problem for all ages inall countries. A model for prevention and self care, St. Vincent (Italy), 1989.
[136] Reda, E., Dunn, P., Straker, C., et al., Screening for diabetic retinopathy usingthe mobile retinal camera: The Waikato experience, New Zealand MedicalJournal, 116(1180), 562, 2003.
[137] Jelinek, H.J., Cree, M.J., Worsley, D., et al., An automated microaneurysmdetector as a tool for identification of diabetic retinopathy in rural optometricpractice, Clin Exp Optom, 89, 299, 2006.
[138] Hipwell, J.H., Strachan, F., Olson, J.A., et al., Automated detection of microa-neurysms in digital red-free photographs: A diabetic retinopathy screeningtool, Diabetic Medicine, 17(8), 588, 2000.
[139] Fong, D.S., Aiello, L., Gardner, T.W., et al., Diabetic retinopathy, DiabetesCare, 26, 226, 2002.
[140] Batchelder, T.J., Fireman, B., Friedman, G.D., et al., The value of routinedilated pupil screening examination, Arch Ophthalmol, 115, 1179, 1997.
[141] Vijan, S., Hofer, T.P., and Hayward, R.A., Cost-utility analysis of screeningintervals for diabetic retinopathy in patients with type 2 diabetes mellitus,JAMA, 283, 889, 2000.
[142] James, M., Turner, D.A., Broadbent, D.M., et al., Cost-effectiveness analysisof screening for sight threatening diabetic eye disease, British Medical Jour-nal, 320, 1627, 2000.
[143] James, M. and Little, R., Screening for diabetic retinopathy: Report tothe National Screening Committee, 2001, http://www.diabetic-retinopathy.screening.nhs.uk/decision-analysis.html.
[144] Madden, A.C., Simmons, D., McCarty, C.A., et al., Eye health in rural areas,Clinical and Experimental Ophthalmology, 30, 316, 2002.
[145] Simmons, D., Weblemoe, T., Voyle, J., et al., Personal barriers to diabetescare: Lessons from a multiethnic community in New Zealand, Diabet Med,15, 958, 1998.


3Detecting Retinal Pathology Automaticallywith Special Emphasis on DiabeticRetinopathy
Michael D. Abramoff and Meindert Niemeijer
CONTENTS
3.1 Historical Aside . . . . . . . . . . . . . . . . . . . . . . . . . . . . . . . . . . . . . . . . . . . . . . . . . . . . . . . . . . . 673.2 Approaches to Computer (Aided) Diagnosis . . . . . . . . . . . . . . . . . . . . . . . . . . . . . . . 683.3 Detection of Diabetic Retinopathy Lesions . . . . . . . . . . . . . . . . . . . . . . . . . . . . . . . . . 703.4 Detection of Lesions and Segmentation of Retinal Anatomy . . . . . . . . . . . . . . . . 713.5 Detection and Staging of Diabetic Retinopathy: Pixel to Patient . . . . . . . . . . . . 713.6 Directions for Research . . . . . . . . . . . . . . . . . . . . . . . . . . . . . . . . . . . . . . . . . . . . . . . . . . . 72
References . . . . . . . . . . . . . . . . . . . . . . . . . . . . . . . . . . . . . . . . . . . . . . . . . . . . . . . . . . . . . . . . 73
3.1 Historical AsideThe idea of computer assisted and computerized detection of retinal pathology has along history, starting in the 1970s. The earliest paper on retinal vessel segmentationof normal and abnormal vessels was published in 1973 [1]. Nevertheless, clinicalapplication of such systems was to remain nil for an extended period of time. Thereasons for this were common to most proposed systems for computer diagnosis,artificial intelligence, medical expert systems or what the fashionable term of theday might be, even outside of ophthalmology. Essentially, there was a lack of sci-entific evidence for disease categories and characteristics, based as they were on theimplicit or explicit knowledge of one or a limited number of clinicians. At manydifferent institutions in the world, elegant systems were designed and implemented.If a clinician from another institution came over to take a look and disagreed with thediagnosis, there would be no mechanism to decide which clinician, if any, was right.It is this fact that prevented application by anyone but the clinicians involved in thedesign of the system. In addition, these systems were solutions in search of a prob-lem, not addressing diagnostic problems that were relevant to clinical practice. Atthat moment it was not yet appreciated that the balance of diagnostic accuracy versus
67

68 Automated Image Detection of Retinal Pathology
system efficiency differs according to clinical need. For early detection of a diseaseby mass screening, high throughput at reduced accuracy is acceptable, while man-agement of a condition, once diagnosed, requires the integration of large amounts ofclinical data, and a high accuracy, with little need for high throughput. From hereon, this chapter will mostly deal with early detection of eye disease.
For clinicians to appreciate the potential for these systems, several things had tochange. Finally, in the 1980s and early 1990s, several positive circumstances becamealigned. Most important, evidence based medicine, meaning clinical diagnoses anddisease management based on scientific, well designed studies, and not on oral tradi-tion, gained traction. Specifically in ophthalmology, the Diabetes Control and Com-plications Trial (DCCT, 1983–1993) [2] and the Early Treatment Diabetic Retinopa-thy Study (ETDRS, 1979–1989) [3–8], the largest clinical trials of their time, weremonumental. As the reader may be aware, the reason we are discussing automaticscreening and screening for diabetic retinopathy at all is because these trials showedthat it was rational to look for early signs of retinopathy. If early diagnosis werepossible, but no effective treatment had been available, there would be no rationalefor screening.
Second, digital imaging of the retina became mainstream. Even though some ofthe most recent papers, including by our group, are still based on scanned slidesbecause there is so much historical data available, it is clear that these systems canonly work efficiently if digital images are available.
Finally, clinical data from representative patient populations, i.e., retinal pho-tographs coupled with clinical readings, started becoming available to image analysisgroups that previously had little or no access to clinicians. A pioneer was Hoover,who made available a set of 81 retinal images on the Internet to any interested re-searcher [9]. This contribution has allowed major strides to be made in vessel seg-mentation and optic disc localization [10], later enhanced by our DRIVE dataset [11].Also, we and likely others as well have shared their expert annotated lesion imagesets with other researchers on an informal basis. This sharing of clinical data iscurrently the most challenging issue. Though there are many advantages to shar-ing data, issues related to patient privacy, regulatory issues, for example, HIPAAin the United States or CBP in the Netherlands, investigational review boards re-quiring post hoc informed consent, fear of “losing the edge” in publishing papers,as well as patents based on supervised algorithms and therefore in part based onthese datasets make this a contested area. To mitigate this, we have recently orga-nized the first online challenge under the ROC (for Retinopathy Online Challenge) athttp://roc.healthcare.uiowa.edu, and we hope to organize many of these in the future.
3.2 Approaches to Computer (Aided) DiagnosisA system for computer aided diagnosis of the retina can either decide between dis-ease and nondisease, i.e., diagnosis or screening, or can decide the progression of

Detecting Retinal Pathology Automatically 69
disease in the same patient between two time points, i.e., progression measurementor staging. Such a system can be built with what I term a bottom-up approach: tosimulate as closely as possible the diagnosis or staging according to clinical stan-dards as performed by human experts. For example, a system to diagnose diabeticretinopathy will detect the lesions that are known to clinicians to be related to dia-betic retinopathy, such as hemorrhages and microaneurysms, and use the knowledgeabout the presence or absence of these lesions to estimate the probability of the pres-ence of diabetic retinopathy. The advantages of this bottom-up approach are:
• face validity, i.e., clinicians trust the system because it mimics to some degreewhat they do daily, easing translation of such a system into clinical practice.
• availability of evidence showing that these classifications are valid, in otherwords, allow progression or outcome or need for intervention to be measuredadequately. This avoids the need to evaluate the system against measuresof disease or severity. Examples include the ETDRS [6] and the Interna-tional Disease Severity Scale of diabetic retinopathy [12] gradings for diabeticretinopathy.
The disadvantages of the bottom-up approach are:
• a need to mimic the human visual system as closely as possible.
• a possibility of bias: the human expert may not be the optimal system fordiagnosis or staging and not be fully knowledgeable or aware of all the featuresin the image.
• inflexibility: in the case in which imaging modalities, such as 3D Optical Co-herence Tomography, are developed, human experts may not yet know whatthe important features are, and there is nothing to be mimicked.
Most research on computer (aided) diagnosis and staging from retinal images hasused the bottom-up approach.
What we will term the top-down approach is to start with images in the one handand diagnoses/stages or some other measurement of clinical outcome in the other,and design the system in an unbiased fashion by searching the feature detector spacefor the optimal characteristics of the image to predict the measurement of clinicaloutcome. In other words, those features of the images that are used by cliniciansare simply ignored, and the system is optimized against the measurement of clinicaloutcome, without an intervening stage of human expert-based lesion detection.
The advantages are:
• theoretically, such a system has optimal performance that a bottom-up systemcannot reach.
• if new characteristics or features are found that were not previously appre-ciated, these can help guide clinicians or researchers understand why thesecharacteristics are so important.

70 Automated Image Detection of Retinal Pathology
• the system can be used on new imaging modalities, where clinicians do not(yet) know what is relevant for diagnosis or progression.
The disadvantages are:
• the system may not have face validity, making clinicians reluctant to trust it inclinical practice.
• the space of potential feature detectors may be huge, and intractable computa-tionally.
To our knowledge, no systems based on such a top-down approach for diagnosis orstaging of retinal disease from retinal images have been published. In the remain-der of this chapter, we will therefore limit ourselves to a brief review of bottom-upsystems.
3.3 Detection of Diabetic Retinopathy LesionsWe briefly review here the characteristic lesions that occur on the retina affectedin diabetic retinopathy [8], and their approximate frequency in a typical screeningpopulation, in which 5 to 25% have some form of diabetic retinopathy [5; 8; 13–15].
• so-called “red lesions,” namely microaneurysms and intraretinal hemorrhages(frequency∼ 3.5%).
• so-called “bright lesions,” namely exudates and cotton wool spots (most likelyintraretinal infarcts) (frequency∼ 1.6%).
• retinal thickening if present without bright or red lesions (frequency∼ 1%).
• vascular beading (caliber changes of the vessels) (frequency∼ 1%).
• intraretinal microvascular abnormalities (IRMA) (frequency∼ 1%).
• new vessel growth on the optic disc (neovascularization of the disc or NVD)(frequency < 0.1%).
• new vessel growth elsewhere (NVE) (frequency < 0.1%).
• vitreous or subhyaloid hemorrhage (frequency < 0.1%).
In previous papers, other authors as well as our group have referred to microa-neurysms and intraretinal hemorrhages as “red lesions,” to exudates and cotton woolspots as “bright lesions,” and IRMA, NVD, and NVE as “neovascularizations.” Inmost regions in the world, screening is performed with nonstereo digital cameras,which means that it is impossible to detect retinal thickening if no bright or red le-sions are present. Neovascularizations are rare, but are important because they needurgent referral for management by an ophthalmologist. In the next section, we reviewthe literature on how each of these objects can be detected.

Detecting Retinal Pathology Automatically 71
3.4 Detection of Lesions and Segmentation of Retinal AnatomyResearch of methods for segmentation of retinal vessels shows that the most recentmethods can segment over 99% or more of the larger vessels (arbitrarily stated hereas > 2 pixels wide) [9; 11; 16–28], even in retinal images that exhibit some to severeretinopathy. The main research emphasis is on making these methods more robust inthe face of more severe retinal disease, making them independent of image scale as aparameter, improving the time and memory efficiency of the algorithms, and finallydetecting vessel abnormalities [29; 30].
Segmentation of red lesions (microaneurysms and hemorrhages) has also pro-ceeded rapidly, to the point where combined sensitivity/specificity of 95%/95% arereported [16; 31–39].
Bright lesions (exudates and cotton wool spots) have received less attention, buteven there, detection rates of up to 95% have been reported [40–46].
Neovascularizations have usually been grouped with red lesions, but merit a sepa-rate algorithm, because these can be subtle, which to date has not yet been published.
Many authors have successfully studied the localization of retinal landmarks, in-cluding the optic disc, large vessels, and fovea [16; 17; 42; 47–52]. In summary, asof 2007, detection of most lesions is possible with a degree of accuracy that com-pares favorably to human experts. We have not dealt with determination of imagequality, a very important subject that is briefly discussed in Chapter 6 in regard tomicroaneurysm detection.
3.5 Detection and Staging of Diabetic Retinopathy: Pixel toPatient
Either implicitly or explicitly, any bottom-up system must have stages where pixelsare classified into lesions or textures. Lesions or textures are detected in individualimages, the presence or absence of different lesions or textures is used to determinean estimate for the presence or stage of the retinopathy for a patient. Complete sys-tems have been published, but the authors usually have not dealt explicitly with howpixel features, lesion or texture features, and lesion location estimates are combinedinto this patient level estimate statement [37; 41; 44; 50; 53–55]. We have designeda supervised method for combining the output of bright-lesion and image quality al-gorithms and tested it on 10 000 exams (40 000 retinal images) from a communitydiabetic retinopathy screening project. Retinal images came from a variety of non-mydriatic camera types, as is typical for screening projects, and were read by onlya single reader. The results of this preliminary study showed that this system couldobtain an area under the ROC (receiver operating characteristic) curve of 0.84 [56].Meanwhile we have made further improvements to the system, and at ARVO 2008

72 Automated Image Detection of Retinal Pathology
we have presented the performance of a different sample of unique patients that ob-tained an area under the curve of 0.88.
3.6 Directions for ResearchFrom the above it can be concluded that there are several avenues to translate com-puter (aided) diagnosis of diabetic retinopathy into clinical practice. First, the valueof high quality, representative, expert graded image sets cannot be overrated. Highquality does not mean that the images should all be of excellent quality. High qual-ity means that the image sets represent the type, quality, and variety of images in areal world screening setting, as well as having the same distribution of lesion typesand frequency of the presence of diabetic retinopathy as true in such screening pop-ulations. In other words, the images should not come from a tertiary clinic, wherediabetic retinopathy is usually much more severe and may be easier to detect than ina screening setting, where commonly only a few subtle lesions may be detectable.Also, high quality means that the images have been read by multiple, internationallyrespected, expert readers, so that a reference standard is available that is not subjectto dispute by other experts. In the case of diabetes and diabetic retinopathy, the read-ings for the images of a patient, which are usually made with a nonmydriatic camera,should optimally not be obtained by having human experts read the same images, butfrom multiple or 7-field stereo fundus photographs read by a reading center, the goldstandard for clinical trials. If such datasets can be made publicly available, evalu-ation and comparison of algorithms will be much easier, hopefully leading to moremeaningful performance comparisons.
Second, given that the bottom-up approach, meaning detection of lesions and thenestimation of diabetic retinopathy diagnosis or stage, is currently the most popularapproach, it makes sense to mimic the human visual system as closely as possible, aswe and other authors have either implicitly or explicitly attempted using results fromvisual neuroscience experiments and knowledge about the primate visual cortex [57].
Third, vessel segmentation has always been a mainstay of retinal image analysisresearch, even though so far it has had limited relevance for systems that screenfor diabetic retinopathy. Detection of neovascularizations in diabetic retinopathy,or pigment texture changes in age-related macular degeneration, which are knownto have clinical relevance, have received little or no attention in the image analysiscommunity. If clinical needs and algorithmic development can be merged closer, thiswill benefit the field tremendously.
And finally, a top-down approach where images and clinical outcomes such as vi-sual loss or need for surgery can be combined directly, so that such a system predictsthe probability of outcome or of the need for treatment, has the potential to offerhigher accuracy. There may well be more in retinal images than the lesions that have“met the eye” of the clinical beholder of the past. The translation of such systems

Detecting Retinal Pathology Automatically 73
into clinical practice may be problematic, unless such systems can give at least someexplanation of their conclusion that is understandable by clinicians.
In summary, the field of automated detection of retinal disease, in general, anddiabetic retinopathy, in particular, is currently developing rapidly. Great strides havebeen made already and may soon lead to the first systems tested for clinical appli-cation, and thereby to decreasing blindness and visual loss in patients with retinaldiseases.
References[1] Matsui, M., Tashiro, T., Matsumoto, K., et al., A study on automatic and quan-
titative diagnosis of fundus photographs. I. Detection of contour line of reti-nal blood vessel images on color fundus photographs, Nippon Ganka GakkaiZasshi, 77(8), 907, 1973, In Japanese.
[2] DCCT Research Group, The Diabetes Control and Complications Trial(DCCT). Design and methodologic considerations for the feasibility phase, Di-abetes, 35, 530, 1986.
[3] Early Treatment Diabetic Retinopathy Study Research Group, Photocoagula-tion for diabetic macular edema. Early Treatment Diabetic Retinopathy StudyReport Number 1, Arch. Ophthalmol., 103(12), 1796, 1985.
[4] Early Treatment Diabetic Retinopathy Study Research Group, Treatment tech-niques and clinical guidelines for photocoagulation of diabetic macular edema.Early Treatment Diabetic Retinopathy Study Report Number 2, Ophthalmol-ogy, 94(7), 761, 1987.
[5] Early Treatment Diabetic Retinopathy Study Research Group, Fundus pho-tographic risk factors for progression of diabetic retinopathy. ETDRS ReportNumber 12, Ophthalmology, 98(5 Suppl), 823, 1991.
[6] Early Treatment Diabetic Retinopathy Study Research Group, Classification ofdiabetic retinopathy from fluorescein angiograms. ETDRS Report Number 11,Ophthalmology, 98(5 Suppl), 807, 1991.
[7] Early Treatment Diabetic Retinopathy Study Research Group, Early photoco-agulation for diabetic retinopathy. ETDRS Report Number 9, Ophthalmology,98(5 Suppl), 766, 1991.
[8] Early Treatment Diabetic Retinopathy Study Research Group, Focal photoco-agulation treatment of diabetic macular edema. relationship of treatment effectto fluorescein angiographic and other retinal characteristics at baseline: ETDRSReport Number 19, Arch. Ophthalmol., 113(9), 1144, 1995.

74 Automated Image Detection of Retinal Pathology
[9] Hoover, A., Kouznetsova, V., and Goldbaum, M., Locating blood vessels inretinal images by piecewise threshold probing of a matched filter response,IEEE Trans. Med. Im., 19(3), 203, 2000.
[10] Hoover, A. and Goldbaum, M., Locating the optic nerve in a retinal image usingthe fuzzy convergence of the blood vessels, IEEE Trans. Med. Im., 22(8), 951,2003.
[11] Niemeijer, M., Staal, J.S., van Ginneken, B., et al., Comparative study of retinalvessel segmentation on a new publicly available database, Proceedings of theSPIE, 5370–5379, 2004.
[12] Wilkinson, C.P., Ferris, F. L., I., Klein, R.E., et al., Proposed international clin-ical diabetic retinopathy and diabetic macular edema disease severity scales,Ophthalmology, 110(9), 1677, 2003.
[13] Bresnick, G.H., Mukamel, D.B., Dickinson, J.C., et al., A screening ap-proach to the surveillance of patients with diabetes for the presence of vision-threatening retinopathy, Ophthalmology, 107(1), 19, 2000.
[14] Lin, D.Y., Blumenkranz, M.S., Brothers, R.J., et al., The sensitivity and speci-ficity of single-field nonmydriatic monochromatic digital fundus photographywith remote image interpretation for diabetic retinopathy screening: A compar-ison with ophthalmoscopy and standardized mydriatic color photography, Am.J. Ophthalmol., 134(2), 204, 2002.
[15] Abramoff, M.D. and Suttorp-Schulten, M.S., Web-based screening for diabeticretinopathy in a primary care population: The EyeCheck project, Telemed. J.E. Health, 11(6), 668, 2005.
[16] Frame, A.J., Undrill, P.E., Cree, M.J., et al., A comparison of computer basedclassification methods applied to the detection of microaneurysms in oph-thalmic fluorescein angiograms, Comput. Biol. Med., 28(3), 225, 1998.
[17] Sinthanayothin, C., Boyce, J.F., Cook, H.L., et al., Automated localisation ofthe optic disc, fovea, and retinal blood vessels from digital colour fundus im-ages, Br. J. Ophthalmol., 83(8), 902, 1999.
[18] Staal, J.S., Kalitzin, S.N., Abramoff, M.D., et al., Classifying convex sets forvessel detection in retinal images, in Proceedings of the First InternationalSymposium on Biomedical Imaging, 2002, 269–272.
[19] Staal, J., Abramoff, M.D., Niemeijer, M., et al., Ridge-based vessel segmenta-tion in color images of the retina, IEEE Trans. Med. Im., 23(4), 501, 2004.
[20] Vermeer, K.A., Vos, F.M., Lemij, H.G., et al., A model based method for retinalblood vessel detection, Comput. Biol. Med., 34(3), 209, 2004.
[21] Fang, B. and Tang, Y.Y., Elastic registration for retinal images based on recon-structed vascular trees, IEEE Trans. Biomed. Eng., 53(6), 1183, 2006.

Detecting Retinal Pathology Automatically 75
[22] Chanwimaluang, T., Fan, G., and Fransen, S.R., Hybrid retinal image registra-tion, IEEE Trans. Inf. Technol. Biomed., 10(1), 129, 2006.
[23] Huang, K. and Yan, M., A region based algorithm for vessel detection in retinalimages, in Ninth International Conference on Medical Image Computing andComputer Assisted Intervention (MICCAI’06), 2006, vol. 9(1), 645–653.
[24] Cai, W. and Chung, A.C., Multi-resolution vessel segmentation using normal-ized cuts in retinal images, in Ninth International Conference on Medical ImageComputing and Computer Assisted Intervention (MICCAI’06), 2006, vol. 9, Pt2, 928–936.
[25] Soares, J.V., Leandro, J.J., Cesar Junior, R.M., et al., Retinal vessel segmen-tation using the 2-D Gabor wavelet and supervised classification, IEEE Trans.Med. Im., 25(9), 1214, 2006.
[26] Mendonca, A.M. and Campilho, A., Segmentation of retinal blood vessels bycombining the detection of centerlines and morphological reconstruction, IEEETrans. Med. Im., 25(9), 1200, 2006.
[27] Adjeroh, D.A., Kandaswamy, U., and Odom, J.V., Texton-based segmentationof retinal vessels, J. Opt. Soc. Am. A, 24(5), 1384, 2007.
[28] Wang, L., Bhalerao, A., and Wilson, R., Analysis of retinal vasculature using amultiresolution hermite model, IEEE Trans. Med. Im., 26(2), 137, 2007.
[29] Kozousek, V., Shen, Z., Gregson, P., et al., Automated detection and quantifi-cation of venous beading using Fourier analysis, Can. J. Ophthalmol., 27(6),288, 1992.
[30] Englmeier, K.H., Schmid, K., Hildebrand, C., et al., Early detection of diabetesretinopathy by new algorithms for automatic recognition of vascular changes,Eur. J. Med. Res., 9(10), 473, 2004.
[31] Baudoin, C.E., Lay, B.J., and Klein, J.C., Automatic detection of microa-neurysms in diabetic fluorescein angiography, Rev. Epidemiol. Sante Publique,32(3-4), 254, 1984.
[32] Spencer, T., Olson, J.A., McHardy, K.C., et al., An image-processing strategyfor the segmentation and quantification of microaneurysms in fluorescein an-giograms of the ocular fundus, Comput. Biomed. Res., 29(4), 284, 1996.
[33] Cree, M.J., Olson, J.A., McHardy, K.C., et al., A fully automated comparativemicroaneurysm digital detection system, Eye, 11, 622, 1997.
[34] Hipwell, J.H., Strachan, F., Olson, J.A., et al., Automated detection of microa-neurysms in digital red-free photographs: a diabetic retinopathy screening tool,Diabet. Med., 17(8), 588, 2000.
[35] Niemeijer, M., van Ginniken, B., and Abramoff, M.D., Automatic detectionand classification of microaneurysms and small hemorrhages in color fundus

76 Automated Image Detection of Retinal Pathology
photographs, in Proceedings Computer Aided Fundus Imaging and Analysis(CAFIA), 2003.
[36] Larsen, M., Godt, J., Larsen, N., et al., Automated detection of fundus photo-graphic red lesions in diabetic retinopathy, Invest. Ophthalmol. Vis. Sci., 44(2),761, 2003.
[37] Larsen, N., Godt, J., Grunkin, M., et al., Automated detection of diabetic retino-pathy in a fundus photographic screening population, Invest. Ophthalmol. Vis.Sci., 44(2), 767, 2003.
[38] Fleming, A.D., Philip, S., Goatman, K.A., et al., Automated microaneurysmdetection using local contrast normalization and local vessel detection, IEEETrans. Med. Im., 25(9), 1223, 2006.
[39] Niemeijer, M., van Ginneken, B., Staal, J., et al., Automatic detection of redlesions in digital color fundus photographs, IEEE Trans Med. Imaging, 24(5),584, 2005.
[40] Abramoff, M.D., Staal, J.S., Suttorp-van Schulten, M.S., et al., Low levelscreening of exudates and haemorraghes in background diabetic retinopathy, inProceedings Computer Assisted Fundus Imaging Workshop (CAFIA), Copen-hagen, Denmark, 2000.
[41] Sinthanayothin, C., Boyce, J.F., Williamson, T.H., et al., Automated detectionof diabetic retinopathy on digital fundus images, Diabet. Med., 19(2), 105,2002.
[42] Walter, T., Klein, J.C., Massin, P., et al., A contribution of image processing tothe diagnosis of diabetic retinopathy — detection of exudates in color fundusimages of the human retina, IEEE Trans. Med. Im., 21(10), 1236, 2002.
[43] Osareh, A., Mirmehdi, M., Thomas, B., et al., Automated identification of dia-betic retinal exudates in digital colour images, Br. J. Ophthalmol., 87(10), 1220,2003.
[44] Usher, D., Dumskyj, M., Himaga, M., et al., Automated detection of diabeticretinopathy in digital retinal images: a tool for diabetic retinopathy screening,Diabet. Med., 21(1), 84, 2004.
[45] Li, H. and Chutatape, O., Automated feature extraction in color retinal imagesby a model based approach, IEEE Trans. Biomed. Eng., 51(2), 246, 2004.
[46] Niemeijer, M., Russell, S.R., Suttorp, M.A., et al., Automated detection anddifferentiation of drusen, exudates, and cotton-wool spots in digital color fun-dus photographs for early diagnosis of diabetic retinopathy, Invest. Ophthalmol.Vis. Sci., 48, 2260, 2007.
[47] Goldbaum, M.H., Katz, N.P., Nelson, M.R., et al., The discrimination of simi-larly colored objects in computer images of the ocular fundus, Invest. Ophthal-mol. Vis. Sci., 31(4), 617, 1990.

Detecting Retinal Pathology Automatically 77
[48] Foracchia, M., Grisan, E., and Ruggeri, A., Detection of optic disc in retinalimages by means of a geometrical model of vessel structure, IEEE Trans. Med.Im., 23(10), 1189, 2004.
[49] Abramoff, M.D. and Niemeijer, M., Automatic detection of the optic disc lo-cation in retinal images using optic disc location regression, in IEEE EMBC2006, New York, NY, 2006, 4432–4435.
[50] Singalavanija, A., Supokavej, J., Bamroongsuk, P., et al., Feasibility study oncomputer-aided screening for diabetic retinopathy, Jpn. J. Ophthalmol., 50(4),361, 2006.
[51] Niemeijer, M., Abramoff, M.D., and van Ginneken, B., Segmentation of theoptic disc, macula and vascular arch in fundus photographs, IEEE Trans. Med.Im., 26(1), 116, 2007.
[52] Tobin, K.W., Chaum, E., Priya Govindasamy, V., et al., Detection of anatomicstructures in human retinal imagery, IEEE Trans. Med. Imaging, 26(12), 1729,2007.
[53] Gardner, G.G., Keating, D., Williamson, T.H., et al., Automatic detection ofdiabetic retinopathy using an artificial neural network: a screening tool, Br. J.Ophthalmol, 80(11), 940, 1996.
[54] Teng, T., Lefley, M., and Claremont, D., Progress towards automated diabeticocular screening: a review of image analysis and intelligent systems for diabeticretinopathy, Med. Biol. Eng. Comput., 40(1), 2, 2002.
[55] Patton, N., Aslam, T.M., MacGillivray, T., et al., Retinal image analysis: con-cepts, applications and potential, Prog. Retin. Eye Res., 25(1), 99, 2006.
[56] Abramoff, M.D., Niemeijer, M., Suttorp-Schulten, M.S.A., et al., Evaluationof a system for automatic detection of diabetic retinopathy from color fundusphotographs in a large population of patients with diabetes, Diabetes Care, 31,193, 2008.
[57] Abramoff, M.D., Alward, W.L., Greenlee, E.C., et al., Automated segmentationof the optic nerve head from stereo color photographs using physiologicallyplausible feature detectors, Inv. Ophthalmol. Vis. Sci., 48, 1665, 2007.


4Finding a Role for Computer-Aided EarlyDiagnosis of Diabetic Retinopathy
Lars B. Backlund
CONTENTS
4.1 Mass Examinations of Eyes in Diabetes . . . . . . . . . . . . . . . . . . . . . . . . . . . . . . . . . . . . 794.2 Developing and Defending a Risk Reduction Program . . . . . . . . . . . . . . . . . . . . . 824.3 Assessing Accuracy of a Diagnostic Test . . . . . . . . . . . . . . . . . . . . . . . . . . . . . . . . . . . 844.4 Improving Detection of Diabetic Retinopathy . . . . . . . . . . . . . . . . . . . . . . . . . . . . . . 904.5 Measuring Outcomes of Risk Reduction Programs . . . . . . . . . . . . . . . . . . . . . . . . . 934.6 User Experiences of Computer-Aided Diagnosis . . . . . . . . . . . . . . . . . . . . . . . . . . . 964.7 Planning a Study to Evaluate Accuracy . . . . . . . . . . . . . . . . . . . . . . . . . . . . . . . . . . . . 1034.8 Conclusion . . . . . . . . . . . . . . . . . . . . . . . . . . . . . . . . . . . . . . . . . . . . . . . . . . . . . . . . . . . . . . . . 110
References . . . . . . . . . . . . . . . . . . . . . . . . . . . . . . . . . . . . . . . . . . . . . . . . . . . . . . . . . . . . . . . . 1104.A Appendix: Measures of Binary Test Performance . . . . . . . . . . . . . . . . . . . . . . . . . . 120
There are strong reasons why well-designed retinopathy risk reduction programsneed to be implemented on a large scale. The importance of such programs, and thedifficulty of achieving reliable early diagnosis of diabetic retinopathy (DR) at reason-able cost, merit considerable efforts in order to develop and evaluate computer-aideddiagnosis (CAD). So why is CAD software not yet widely used in this setting? Prob-lems and diverse application possibilities encountered by people responsible for suchprograms need to be considered in conjunction with the opportunities and threats fac-ing anyone introducing computer-aided diagnosis in this field.
4.1 Mass Examinations of Eyes in DiabetesThere are many reasons why everybody who has diabetes should receive regulareye examinations. Vision loss due to diabetes is greatly feared by people with di-abetes; indeed, the results of a survey conducted by the American Foundation forthe Blind indicate that people with diabetes fear blindness even more than premature
79

80 Automated Image Detection of Retinal Pathology
death [1]. Considerable income losses and costs are borne by people with diabetesand their families, by society, and by health-care providers. Ocular complicationsof diabetes frequently occur [2], causing major economic and social problems andimpairing quality of life. Diabetic eye disease may progress to a level that is threat-ening sight without causing symptoms that may bring the person with diabetes toa doctor [3]. Hence, maximum uptake of screening and of timely re-screening isnecessary: there is incontrovertible evidence that timely treatment prevents or delaysloss of sight [4]. Large settlements have been paid to people diagnosed with sight-threatening diabetic retinopathy (STDR) — a family of conditions defined by somebut not all authors as severe nonproliferative DR and/or proliferative DR and/or hardexudates within one disc diameter of the center of the fovea — too late for effectivetreatment. Diabetes prevalence now seems to be increasing even more rapidly thanpreviously predicted [5].
It is thus not surprising that considerable efforts have been made to diagnose DRand STDR at early stages when timely treatment may slow or prevent worsening ofDR and prevent vision loss. There are, however, important lessons to be learnedregarding how to set up, carry out and monitor such a program.
4.1.1 Motive for accurate early diagnosis of retinopathy
To quote one of the maxims attributed to Publilius Syrus, who lived in the 1st centuryBC, “Better use medicines at the outset than at the last moment.” This should bepossible because accurate diagnosis of DR and its various stages can deliver feedbackinformation to patients and other members of diabetes teams. There is clear evidencefrom well-designed controlled clinical trials that improved medical treatment delaysor prevents the occurrence of STDR. For full effect, however, five to seven years areneeded. Therefore, early diagnosis of the earliest signs of DR and accurate follow-upof progression of DR at predefined intervals will provide necessary information fordiabetes management in order for prognosis to be deduced and, importantly, in timefor improved treatment to be effective.
As described in a prior chapter (Section 2.9.2.1), there is clear evidence from well-designed controlled clinical trials that the right kind of timely laser photocoagulationof STDR prevents or delays worsening of visual acuity. Moreover, promising newmethods for treatment of inflammation and other aspects of DR are underway, caus-ing increased interest among diabetologists for the reliable diagnosis of DR stagespreceding STDR.
From the point of view of ophthalmologists, it is important not to become over-loaded with large numbers of diabetic patients not strictly needing immediate treat-ment by a retinal specialist. From the patient’s point of view, however, securingtimely treatment is of high importance. There will probably never be enough oph-thalmologists to follow-up every person with diabetes by clinical examination. Thus,we need a systematic approach to delivering the right patient at the right time to theright doctor to ensure adequate and timely treatment.

Finding a Role for Computer-Aided Early Diagnosis of Diabetic Retinopathy 81
4.1.2 Definition of screening
Screening may be defined as a public health intervention intended to improve thehealth of a precisely defined target population (in this case, people with diabetes).Within this population are individuals considered at risk of the effects of a condition(in this case, diabetic retinopathy that may threaten sight).
Screening is justified by the awareness of that condition as an important publichealth problem. It is the anticipated identification of those who may have a problemand who might benefit from further investigation and treatment. It therefore involvesthe application of a quick and simple test, usually by paramedics, to large numbersof asymptomatic persons so that those with a possible problem can be identified —and interventions can be made.
Screening does not make the final diagnosis — this is why the term early diag-nosis is preferred by certain careful workers whose standards of image quality andreliability of grading are consistently high enough to enable a final diagnosis of DRor STDR to be made.
4.1.3 Practical importance of the concept of screening
Screening is never something that should be undertaken casually and it should al-ways be carefully monitored and evaluated. Without strict criteria, monitoring isimpossible.
“Opportunistic screening” is a concept and a term that should be avoided [6]. Un-fortunately, some ophthalmologists understand “screening” to mean hurried globaldiagnostic impressions unworthy of adequate recording of findings. Screening, incontrast, means a systematic approach that has nothing to do with improvisation.The term “ad hoc screening” is thus a misnomer.
Screening is expensive and is an intervention that is thrust on the public ratherthan a response to an individual seeking help for a symptom. It must, therefore, beconstantly and carefully monitored both for its processes and its effectiveness.
False negative tests are a constant source of concern, and there is often publicoutrage when an important condition such as STDR or cancer of the cervix has beenmissed. False positive tests cause undue anxiety and wasted resources (in the caseof DR misdiagnosed as STDR, invasive tests such as fluorescein angiography mayhave been performed unnecessarily).
4.1.4 Coverage and timely re-examination
For the screening program to be effective, it must reach a high proportion (ideally100%) of the population at risk. Failure to achieve this leads to the failure of theprogram to meet its targets. Coverage is defined as the proportion of the target pop-ulation successfully tested in each screening activity.
Reaching out into the community is important [7]. Keep in mind that those hardestto reach in a screening program may suffer from the worst disease. In diabetes, it

82 Automated Image Detection of Retinal Pathology
may be the bilateral amputee, the senior citizen who is in denial of “maybe just atouch of sugar” (and whose eyes have therefore never been examined), or the resent-ful/indifferent young person with diabetes who are the least likely to comply withan invitation for an eye examination — and yet they might be the most likely tobe in need of treatment [6]. There is some evidence that visual handicap is associ-ated with poor attendance at diabetes clinics [8], which underlines the importance offinding people with diabetes and making efforts to improve coverage of eye exami-nations.
Uptake, defined as the proportion attending of all those invited, is always higherthan population coverage, because some are not invited for various reasons. Somesuccessful programs have reached more than 75% initial screen uptake and morethan 85% reattendance. Ascertainment of diabetes is difficult because early stagesof the disease are asymptomatic — at best two out of three people with diabetes arediagnosed in everyday health-care settings. Coverage of DR screening is thus likelyto be overestimated. Coverage and uptake affect the recorded prevalence of DR andof its various stages, thus also influencing measured sensitivity and specificity ofCAD software.
Many barriers to care need to be overcome [9]. Working together with diabetesorganizations, patient groups, and primary health-care staff is one way of increasingcoverage [10]. Good advice on reaching out into the community is available fromthe Centre for Eye Research Australia [11, pp. 24–60]. Apparently, achieving timelyre-screening at predefined intervals is even more difficult than optimizing coverageof first examination [12]; both are important for long-term outcomes of the program.
4.2 Developing and Defending a Risk Reduction ProgramTo achieve the outcome of reducing the incidence of vision loss in diabetes, earlydiagnosis of DR is not enough. To emphasize the objective of the program and theneed to ensure timely treatment, the term risk reduction program is employed [12]in preference to “screening program.”
4.2.1 Explaining why retinopathy is suitable for screening
To ensure its success, a risk reduction program needs to be developed in coopera-tion with a great number of people, institutions, companies, and organizations, andthey may need convincing of the case for supporting DR screening when there areso many other screening proposals competing for interest and for resources [13]. Asuccinct overview of the available evidence is available from several sources, includ-ing the Scottish Intercollegiate Guidelines Network, SIGN (http://www.sign.ac.uk/guidelines/fulltext/55/section6.html#274).
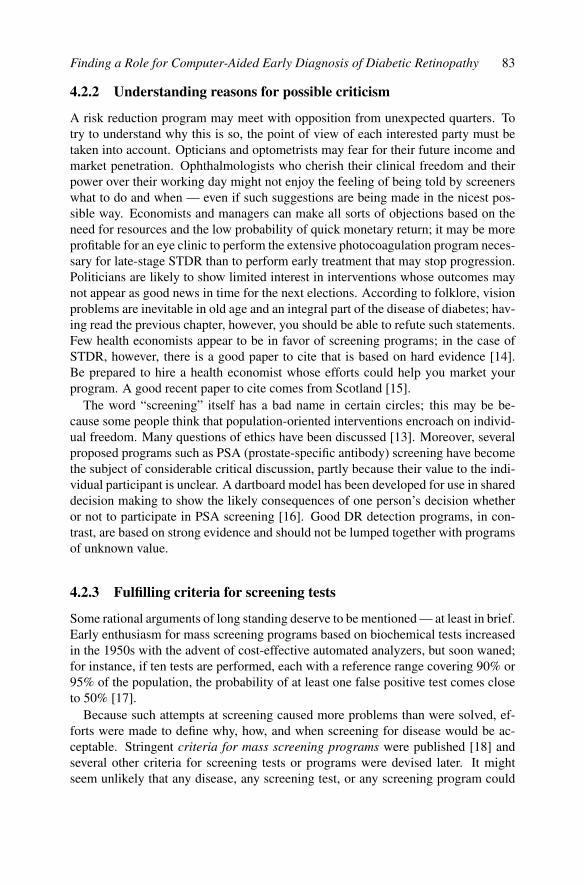
Finding a Role for Computer-Aided Early Diagnosis of Diabetic Retinopathy 83
4.2.2 Understanding reasons for possible criticism
A risk reduction program may meet with opposition from unexpected quarters. Totry to understand why this is so, the point of view of each interested party must betaken into account. Opticians and optometrists may fear for their future income andmarket penetration. Ophthalmologists who cherish their clinical freedom and theirpower over their working day might not enjoy the feeling of being told by screenerswhat to do and when — even if such suggestions are being made in the nicest pos-sible way. Economists and managers can make all sorts of objections based on theneed for resources and the low probability of quick monetary return; it may be moreprofitable for an eye clinic to perform the extensive photocoagulation program neces-sary for late-stage STDR than to perform early treatment that may stop progression.Politicians are likely to show limited interest in interventions whose outcomes maynot appear as good news in time for the next elections. According to folklore, visionproblems are inevitable in old age and an integral part of the disease of diabetes; hav-ing read the previous chapter, however, you should be able to refute such statements.Few health economists appear to be in favor of screening programs; in the case ofSTDR, however, there is a good paper to cite that is based on hard evidence [14].Be prepared to hire a health economist whose efforts could help you market yourprogram. A good recent paper to cite comes from Scotland [15].
The word “screening” itself has a bad name in certain circles; this may be be-cause some people think that population-oriented interventions encroach on individ-ual freedom. Many questions of ethics have been discussed [13]. Moreover, severalproposed programs such as PSA (prostate-specific antibody) screening have becomethe subject of considerable critical discussion, partly because their value to the indi-vidual participant is unclear. A dartboard model has been developed for use in shareddecision making to show the likely consequences of one person’s decision whetheror not to participate in PSA screening [16]. Good DR detection programs, in con-trast, are based on strong evidence and should not be lumped together with programsof unknown value.
4.2.3 Fulfilling criteria for screening tests
Some rational arguments of long standing deserve to be mentioned — at least in brief.Early enthusiasm for mass screening programs based on biochemical tests increasedin the 1950s with the advent of cost-effective automated analyzers, but soon waned;for instance, if ten tests are performed, each with a reference range covering 90% or95% of the population, the probability of at least one false positive test comes closeto 50% [17].
Because such attempts at screening caused more problems than were solved, ef-forts were made to define why, how, and when screening for disease would be ac-ceptable. Stringent criteria for mass screening programs were published [18] andseveral other criteria for screening tests or programs were devised later. It mightseem unlikely that any disease, any screening test, or any screening program could

84 Automated Image Detection of Retinal Pathology
be acceptable according to all such strict rules. Actually, DR is one of the few dis-eases for which screening programs exist that fulfill such criteria [19].
4.2.4 Setting quality assurance standards
There is consensus that a reliable list of patients, suitable equipment kept in goodworking order, trained photographers and graders, reference images, quality assur-ance schemes, as well as other factors ensuring good coverage and accurate diagnosisare necessary for success [20].
A particularly useful document is called Workbook (at the time of writing in its4th edition, January 2007, updated March 2008) describing essential elements indeveloping a program [21]. You should download it and read it now.
The Scottish national standards are worth reading [22]. Furthermore, in Ap-pendix 2 of the Workbook [21] there is a list of service objectives and quality as-surance standards; these targets are very hard to meet but extremely important. Apreliminary version of those standards was tested on 10 existing services [12] withvarying results. Further information on service objectives is available on the NSCWeb site (http://www.nscretinopathy.org.uk), providing links to other sites.
In 1998 the U.K. National Screening Committee, NSC, distinguished between ascreening program and a screening test. A program “‘consists of all those activitiesfrom the identification of the population likely to benefit through to the definitivediagnosis and treatment,’ with inherent characteristics: explicit quality standards; aninformation system, which allows comparison of performance with these standards;managerial authority to take action to improve quality” [12].
4.2.5 Training and assessment
Training courses and competence criteria are in development in many countries.See the United Kingdom NSC Web site (http://www.nscretinopathy.org.uk) underTraining documents and advice. The Scottish training manual [20] is highly recom-mended. An Australian manual [11] contains useful links. An American perspectiveon ophthalmic photography [23] and digital imaging for DR screening [24] is avail-able.
4.3 Assessing Accuracy of a Diagnostic TestSensitivity is the proportion of disease positive individuals who are detected by thetest, also known as the true positive fraction (TPF). An ideal test has a sensitivity of100% (TPF = 1).
Specificity is the proportion of disease free people correctly labeled as disease free.An ideal test has a specificity of 100% meaning that the false positive fraction (FPF)is zero and (1−FPF) = 1.

Finding a Role for Computer-Aided Early Diagnosis of Diabetic Retinopathy 85
Some experts [25] desire sensitivity for detection of STDR to be at least 80%(TPF ≥ 0.8). This has reportedly been achieved by a number of studies, most ofthem by high-quality fundus photography through pharmacologically dilated pupilsusing color transparency film, trained graders, and a quality assurance system [26].Because low sensitivity entails delayed detection of STDR and increased risk ofvision loss, high sensitivity is important to the patient. Note that the less advanced isthe disease, the lower the sensitivity will be [27].
Some experts [25] desire specificity for detection of STDR to be at least 95%, i.e.,(1−FPF)≥ 0.95, which is reportedly achievable by various methods [26] and impor-tant to the person making the final diagnosis, who might be subjected to unnecessaryeffort (while the patient risks unnecessary costs, travel, and workup procedures).
The “Exeter Standards” for sensitivity and specificity [25] were set in 1984 at ameeting organized by Diabetes UK (then the British Diabetic Association) and lateraccepted by the UK National Screening Framework. A recent review is availableon the Web at http://www.nscretinopathy.org.uk/pages/nsc.asp?ModT=A&Sec=16.Most published studies have insufficient statistical power for conclusions to be made.This criticism, however, does not apply to the Gloucestershire study [28] in whichone experienced ophthalmologist examined 1594 randomly selected people with di-abetes who also underwent mydriatic 45° two-field imaging; sensitivity for the lat-ter was 87.8%, specificity 86.1%. Improving on this result using new methods forimaging, quality assurance, and grading will indeed be challenging. Incidentally, thisophthalmologist did exceptionally well when compared to seven field stereo photog-raphy of 229 people with diabetes [29].
Since (1−TPF) is equal to the false negative fraction, the pair (FPF, TPF) definesthe probabilities with which errors occur when using the test. A note of caution:these are proportions or probabilities — never call them “rates” in front of an epi-demiologist [30]. Moreover, the pair (FPF, TPF) is just one point of the receiveroperating curve and thus of limited interest; see below.
Joint confidence regions for TPF and FPF can be presented as numbers (rectangu-lar regions derived from cross-products of confidence intervals for TPF and FPF) inorder to save space. As a reader I prefer graphs showing elliptical joint confidenceregions based on joint asymptotic normality. This is something to look for in pub-lished papers. Many studies of diagnostic methods are underpowered, which showsup as imprecise estimation (wide confidence regions).
4.3.1 Predictive value, estimation, power
Accuracy can be quantified by how well the test result predicts the true disease sta-tus [31]. Please note that the test should be studied in a wide variety of circumstancesin which its ability to predict true clinical status may vary. Predictive values quantifyaccuracy by how well the test predicts the status. They are often presented togetherwith sensitivity and specificity data for a test. The predictive value of a positive test,positive predictive value (PPV), is the probability that the subject is diseased if thetest is positive. The predictive value of a negative test, negative predictive value(NPV), is the probability that the subject is nondiseased when the test is negative.

86 Automated Image Detection of Retinal Pathology
A perfect test will predict disease perfectly, with PPV = 1 and NPV = 1. Thepredictive values depend not only on the performance of the test in diseased andnondiseased subjects, but also on the prevalence of disease. A low PPV may be aresult of low prevalence of disease, or an unreliable test, or both [32]. Predictivevalues quantify the clinical value of the test: the patient and the doctor want to knowhow likely it is that disease is present given the test result [33]. A screening testneeds to be more accurate if it is to work well in a low-prevalence situation such as ascreening program. Conversely, lower sensitivity may be acceptable in tertiary carewhere disease prevalence is high. A truism worth thinking about is that it is mucheasier to ascertain large advanced lesions (seen in a tertiary care setting) than subtleinitial lesions (such as those seen in screening programs). As every grader knows,it is quite difficult for graders to agree whether minimal DR is present or absentin an image from a screening program [34]. Interestingly, the Aberdeen group haspresented good results from “disease/no disease” CAD grading in Scotland [35];their papers are recommended reading. There is a recruitment effect known frompsychological research: once the first microaneurysm is identified, more of them aresuddenly perceived. A good CAD algorithm could be more sensitive than humans forminimal DR but perhaps less sensitive for advanced DR with atypical manifestations.Data such as TPF, FPF, PPV, and NPV are thus context dependent.
TPF, FPF, PPV, and NPV are proportions. Authors reporting them should alwaysprovide the raw data in a contingency table. Estimation is preferred to hypothesistesting. Confidence intervals for proportions and for differences between proportionscan be calculated and software is available in a book [36]; exact methods, which ac-cording to some statisticians may give conservative results [37], are available, e.g.,in StatXact software (www.cytelsoftware.com). I repeat that you are likely to findthat many studies of diagnostic tests are underpowered, yielding imprecise estimates(wide confidence intervals). This observation particularly applies when analyzingsubgroups whose properties may influence the outcome of the test. Consequently,prestudy power calculations have been recommended [38]. For instance, when thenumber of patients with the target condition is 49 the two-sided 95% confidence in-terval of a sensitivity of 81% (40 true positives) is 68% to 91%. One of the firstquestions your statistician is likely to ask is whether you want to falsify a null hy-pothesis of equivalence between the index test and the reference test, or if you wantto falsify a null hypothesis of nonsuperiority. The latter could need a larger studypopulation, depending on design and analysis methods.
Overcalling (reporting a higher-than-warranted DR grade) needlessly causes alarmin people with diabetes and wastes ophthalmology resources. Undercalling (report-ing a lower-than-warranted DR grade) can have serious consequences for the personwith diabetes, especially when STDR is missed and laser treatment is ineffectivebecause of delay. Slattery undertook a computer simulation of ways of samplingreferral decisions during grading and criteria for initiating intensive quality assur-ance (QA) investigations. Assessing the effectiveness of QA systems by the abilityto detect a grader (or a CAD program) making occasional errors, he found that sub-stantial sample sizes are needed to ensure against inappropriate failure to refer (falsenegatives). Under certain plausible assumptions, detection of a grader who fails to

Finding a Role for Computer-Aided Early Diagnosis of Diabetic Retinopathy 87
refer as many as 10% of cases with referrable STDR can only be achieved with aprobability of 0.58 using an annual sample size of 300, and 0.77 with 500. The samesample sizes would only have probabilities 0.33 and 0.55, respectively, of detectinga grader (or program) missing 5% of referrals [39].
Calculating statistical power, a job for your statistician, becomes more compli-cated when multiple tests are performed on one subject. In medical practice, the re-sults of several different tests (or algorithms) are combined to reach a threshold valueor decision rule. The diagnostic accuracy of combinations of tests can be assessedby applying multivariable regression analysis with receiver operating characteristiccurves.
4.3.2 Receiver operating characteristic curve
The receiver operating characteristic (ROC) curve is a useful way of describingthe performance of medical tests whose results are not simply positive or negative,but are measured on continuous or ordinal scales. Suitable use of ROC curves helpsdesigners of a test choose the optimal combination of sensitivity and specificity. ROCcurves, now in frequent use by developers of CAD software, were first used half acentury ago. They arose in the context of signal detection theory and were firstapplied to radar operators, coming into use in medicine from 1960 onwards [40],particularly in radiology [41].
Assume that larger values of the test result Y are more indicative of disease. Thenotion of using Y to define a dichotomous decision rule is fundamental to the evalua-tion of medical tests. The surgeon needs a yes or no answer on the question whetherto operate at once. The decision rule is based on whether or not the test result (orsome transformation of it) exceeds a threshold value. The choice of a suitable thresh-old will vary with circumstances and depends on the trade-off that is acceptable be-tween failing to detect disease and falsely identifying disease with the test. The ROCcurve describes the range of trade-offs that can be achieved by the test [42].
For continuous tests (e.g., microaneurysm counts, blood vessel diameter measure-ments), using a threshold c, define a binary test from the continuous test result Y aspositive if Y ≥ c, negative if Y < c. Let the corresponding true and false positivefractions at the threshold c be TPF(c) and FPF(c), respectively. The ROC curve isthe entire set of possible true and false positive fractions attainable by dichotomizingY with different thresholds.
An uninformative test is one such that Y is unrelated to disease status. That is,the probability distributions for Y are the same in the diseased and the nondiseasedpopulations, and for any threshold c we have TPF(c) = FPF(c) and the ROC curvebecomes a line with unit slope (Figure 4.1).
A perfect test on the other hand completely separates diseased and nondiseasedsubjects. That is, for some threshold c we have TPF(c) = 1 and FPF(c) = 0 (in otherwords 100% sensitivity and 100% specificity). Its ROC curve is along the left andupper borders of the positive unit quadrant (Figure 4.2).
Most tests have ROC curves that lie between those of the perfect and useless tests.Better tests have ROC curves closer to the upper left corner. The ROC curve depicts

88 Automated Image Detection of Retinal Pathology
0 1False positive fraction, FPF0
1
True
pos
itive
frac
tion,
TPF
Useless testFPF = TPF
FIGURE 4.1Receiver operating characteristic (ROC) for a useless diagnostic test shows a diag-onal line. True positive fraction equals false positive fraction (TPF = FPF). Areaunder curve (AUC) = 0.5. (Modified from Pepe, M. S. The Statistical Evaluation ofMedical Tests for Classification and Prediction, Oxford Statistical Science Series 28,p. 69, Oxford University Press, New York, 2003. With permission.)
0 1False positive fraction, FPF0
1
True
pos
itive
frac
tion,
TPF Perfect test
TPF = 1FPF = 0
FIGURE 4.2ROC for a perfect test. TPF = 1 and FPF = 0 (both sensitivity and specificity 100%).AUC = 1.0. (Modified from Pepe, M. S. The Statistical Evaluation of Medical Testsfor Classification and Prediction, Oxford Statistical Science Series 28, p. 69, OxfordUniversity Press, New York, 2003. With permission.)

Finding a Role for Computer-Aided Early Diagnosis of Diabetic Retinopathy 89
0 1False positive fraction, FPF0
1
True
pos
itive
frac
tion,
TPF
Test A is better than Test B
A
B
FIGURE 4.3ROC curves for two tests, A and B, where test A is unequivocally better (ROC curvecloser to upper left corner). (Modified from Pepe, M. S. The Statistical Evaluationof Medical Tests for Classification and Prediction, Oxford Statistical Science Series28, p. 69, Oxford University Press, New York, 2003. With permission.)
the entire set of operating characteristics (FPF, TPF) possible with the test. Reportingof the (FPF, TPF) attained at only a single threshold conveys little useful informationbut this all too often occurs. That makes it difficult to compare different studies ofthe same test, particularly when different thresholds are employed. By reporting theentire ROC curve, information about a test can be compared and possibly combinedacross studies. If two diagnostic methods are applied to the same subjects, their ROCcurves will be different (Figure 4.3). Confidence bands can be calculated and shown.There are several methods for comparing ROC curves for different tests [43].
4.3.3 Area under curve
The area under the ROC curve (AUC) is frequently reported. A perfect test has thevalue AUC = 1.0 and an uninformative test has AUC = 0.5, while most tests havevalues falling in between. The AUC is interpreted by [43] as an average TPF, aver-aged uniformly over the whole range of false positive fractions. Doctors sometimesrashly believe AUC to be a figure of merit for a test. This is unfortunate because sur-prisingly small differences in AUC can correspond to substantial differences in ROCcurves. Suppose, for instance, that two ROC curves are equal over most of (0,1) butdiffer by 0.3 over the interval (0.0,0.3). This substantial difference in test accuracycorresponds to a difference of only 0.06 in the AUCs [43].
The ROC for ordinal tests is of special interest in the field of DR and STDR di-agnosis. Grading scales for DR are not numeric at all but describe ordered discrete
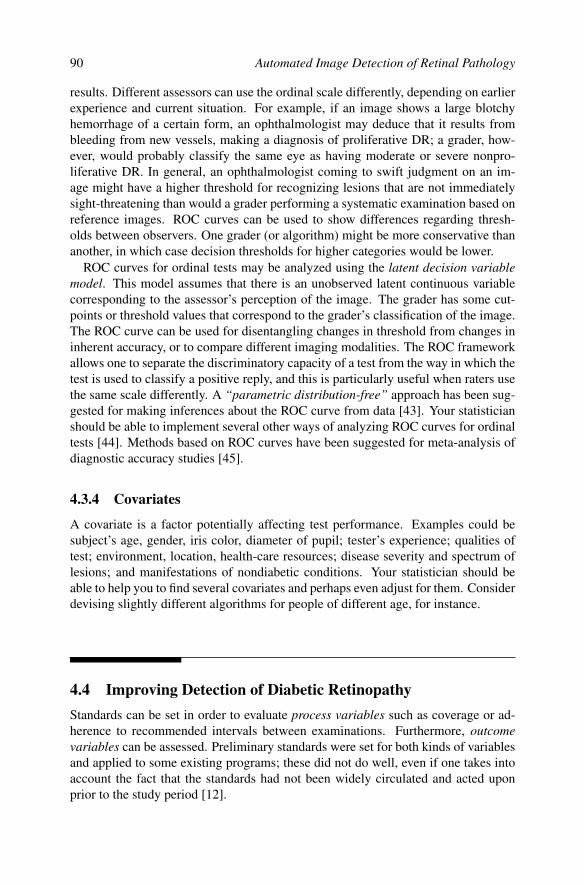
90 Automated Image Detection of Retinal Pathology
results. Different assessors can use the ordinal scale differently, depending on earlierexperience and current situation. For example, if an image shows a large blotchyhemorrhage of a certain form, an ophthalmologist may deduce that it results frombleeding from new vessels, making a diagnosis of proliferative DR; a grader, how-ever, would probably classify the same eye as having moderate or severe nonpro-liferative DR. In general, an ophthalmologist coming to swift judgment on an im-age might have a higher threshold for recognizing lesions that are not immediatelysight-threatening than would a grader performing a systematic examination based onreference images. ROC curves can be used to show differences regarding thresh-olds between observers. One grader (or algorithm) might be more conservative thananother, in which case decision thresholds for higher categories would be lower.
ROC curves for ordinal tests may be analyzed using the latent decision variablemodel. This model assumes that there is an unobserved latent continuous variablecorresponding to the assessor’s perception of the image. The grader has some cut-points or threshold values that correspond to the grader’s classification of the image.The ROC curve can be used for disentangling changes in threshold from changes ininherent accuracy, or to compare different imaging modalities. The ROC frameworkallows one to separate the discriminatory capacity of a test from the way in which thetest is used to classify a positive reply, and this is particularly useful when raters usethe same scale differently. A “parametric distribution-free” approach has been sug-gested for making inferences about the ROC curve from data [43]. Your statisticianshould be able to implement several other ways of analyzing ROC curves for ordinaltests [44]. Methods based on ROC curves have been suggested for meta-analysis ofdiagnostic accuracy studies [45].
4.3.4 Covariates
A covariate is a factor potentially affecting test performance. Examples could besubject’s age, gender, iris color, diameter of pupil; tester’s experience; qualities oftest; environment, location, health-care resources; disease severity and spectrum oflesions; and manifestations of nondiabetic conditions. Your statistician should beable to help you to find several covariates and perhaps even adjust for them. Considerdevising slightly different algorithms for people of different age, for instance.
4.4 Improving Detection of Diabetic RetinopathyStandards can be set in order to evaluate process variables such as coverage or ad-herence to recommended intervals between examinations. Furthermore, outcomevariables can be assessed. Preliminary standards were set for both kinds of variablesand applied to some existing programs; these did not do well, even if one takes intoaccount the fact that the standards had not been widely circulated and acted uponprior to the study period [12].

Finding a Role for Computer-Aided Early Diagnosis of Diabetic Retinopathy 91
Judging from reports presented at a meeting in Liverpool in November 2005, itappears that far from all DR screening programs are of adequate quality, and accessto ophthalmic lasers is uneven in Europe, particularly in less affluent areas. It is clearthat many programs need improving. One of the methods could be the introductionof accurate CAD software.
4.4.1 Improving work environment
Keep in mind that a stressful work situation can cause decreased concentration ca-pacity and mental fatigue that may become less easily reversible as exposure to stressis increased [46]. Thresholds for perceiving and being irritated by noise, flickeringlight, and so on are then lowered. Sifting input data, i.e., increasing signal-to-noiseratio, is hard work for the human brain; recall the sudden feeling of ease when sub-liminal noise stops, for example when an electric fan is turned off. This ability todiscriminate is important for the performance of DR screening graders. To optimizetheir signal detection performance, it is important to protect them from unneces-sary disturbances such as nagging from a computer program. Increasing signal-to-noise ratio of images by preventing artifacts and minimizing operator error also helpsgraders cope.
4.4.2 Going digital
Introducing digital imaging to existing risk reduction programs has not been a totalsuccess. Theoretical advantages have been described in an excellent review [47]. Inpractice, however, problems have occurred with many links in the chain of informa-tion gathering, transfer and assessment: fundus cameras, digital camera backs, infor-mation transfer to computers, viewing images, and the interface to existing medicalrecords and booking systems.
4.4.3 Obtaining clear images
The main principle behind the optical design of fundus cameras produced since the1930s has been illuminating the fundus with a hollow cone of light entering the eyeat the periphery of the pupil and obtaining information through its center. The frontlens system of the fundus camera is thus responsible for illumination as well as forimaging.
Should the pupil be too small, a situation that gets worse with exposure to hy-perglycemia and thus with time since diagnosis of diabetes, illumination becomesuneven and shadows obscure part of the image, particularly for images of nasal andtemporal fields, obtained through narrower elliptical pupil openings because the sub-ject is asked to look aside. Photography becomes more difficult with increasing ageof the subject [48], partly because the ocular lens becomes yellowed with age [49]and lets through less light.
If camera-to-eye distance is wrong, or if there is material on the front lens or inthe ocular media refracting or diffracting light, both illumination and imaging suffer.

92 Automated Image Detection of Retinal Pathology
A more detailed description of the fundus camera and its use, including examplesof images with optical artifacts, is recommended [23]. Keeping a fundus camerain perfect working order necessitates preventive maintenance in order to reach thegoal of less than 3% technical failures [10]. Unless the front lens and other glass-airinterfaces of the fundus camera are kept scrupulously clean, artifacts make diagnosisof DR difficult, tiring graders. These problems appear to be more important withdigital imaging because algorithms that remove artifacts may cause loss of usefulinformation and because existing systems have not equalled the color space, nuances,resolution, or dynamic range of film. Images from a low-resolution digital imagingscreening program with 12% technical failures were analyzed by CAD software thatreliably identified ungradeable images [50]. Such methods could be employed toincrease reliability of diagnosis and ease of grading.
4.4.4 Avoiding loss of information
Digital cameras of today are with few exceptions one-sensor designs with Bayercolor filters, necessitating interpolation and extrapolation in order for a color imageto be created. Users of some digital cameras have noted that certain small lesions aresuppressed while others are enlarged, apparently at random, sometimes causing dothemorrhages/microaneurysms or small hard exudates to disappear from view whena repeat image is obtained after an interval of a few seconds.
Questions remain whether the loss of information resulting from compression ofimage files, conceivably impairing detection of microaneurysms and other small le-sions, is acceptable [51]. Practical problems with connectors, cables, or file transferprotocols sometimes cause information to be lost.
4.4.5 Viewing images
It is still not completely known what information from images is needed for humangraders to arrive at a diagnosis with optimal ease and accuracy. The reference stan-dard remains Kodachrome color transparencies, viewed with optimum sharpness andcontrast with the right color temperature of retroillumination. Today, images are usu-ally graded using office-type LCD monitors that are not color-calibrated and whosecolor fidelity is dependent on angle of view. One study showed an LCD monitor to beinferior to a CRT monitor for the purpose of DR diagnosis [52]. Some informationmay also be lost because image files are down-sampled to screen resolution.
Many graders complain that using computer monitors for grading is more stressfuland tiring than viewing slides on a lightbox using magnifiers, or by optimal-qualityprojection, in a darkened room. Besides, it is now being realized that certain com-puterized medical records and booking systems are not as safe or reliable as theyought to be. All this may combine to form a stressful environment for graders. Onthe other hand, one screening program manager told me, tongue in cheek, that it isusually easier to obtain funding for IT-related products and services, e.g., US$3 Mfor a computerized system including software and support, than to get US$0.3 M ap-propriated for a corresponding number of film-based fundus cameras. That said, I

Finding a Role for Computer-Aided Early Diagnosis of Diabetic Retinopathy 93
personally find the opportunities promised by digital image manipulation and analy-sis to be absolutely fascinating.
4.4.6 Ensuring accurate grading
Few DR screening programs employ double grading, whether by two independentgraders with adjudication by a senior grader or grading by two persons concur-rently, with STDR positive images read by a senior grader. Still fewer have fullyimplemented quality assurance with reference images in everyday use, systematicre-grading and external validation. As regards reference images for human graders,these images should be compatible with the magnification, field of view, and othercharacteristics of the program’s usual screening images. A reference center forexternal validation of image quality and grading is the Retinopathy Grading Cen-tre at Hammersmith Hospital, London, United Kingdom (http://www1.imperial.ac.uk/medicine/about/divisions/is/meta/diabeticretinopathy/). Data on the prowess ofgraders have only been published for a few community-based programs that are notpart of research projects. Hence, it is far from easy to define a standard of perfor-mance that CAD software should meet or exceed.
4.4.7 Organizing for success
There are other reasons why it has been difficult to achieve on a large scale the re-duction in visual loss expected to result from full implementation of findings fromcontrolled trials of photocoagulation and diabetes treatment. Some existing pro-grams, but not all, have up-to-date diabetes registers. Not all manage to re-screenpeople with diabetes at recommended intervals. Many programs, but not all, havesystems in place to ensure timely photocoagulation. There is competition for scarceresources in ophthalmology; the number of people with diabetes is increasing, andso is the number of people with age-related macular degeneration now requiring orrequesting costly new treatment.
4.5 Measuring Outcomes of Risk Reduction ProgramsThe main outcome by which success of a DR risk reduction program should be mea-sured is the incidence rate of blindness and visual impairment in diabetes [53]. Animportant objective of diagnostic research is to evaluate the impact of one or morediagnostic strategies on therapy decisions and patient outcomes. This trend is in re-sponse to the recognition that increasing diagnostic accuracy is of little use if thereis no resulting change or improvement in patient care.
In 1989 the World Health Organization European Regional Office and the Euro-pean Region of the International Diabetes Federation held a joint meeting in St Vin-cent, Italy. Among the participants were people with diabetes, politicians, health-

94 Automated Image Detection of Retinal Pathology
care managers, doctors, and representatives of other professions. The meeting sug-gested many ways of improving the care of people with diabetes, setting clear aimsfor reducing complications. These were published as the St. Vincent Declaration forDiabetes Care and Research in Europe [54]. The target for ocular complications ofdiabetes was to reduce new blindness due to diabetes by one-third or more withinfive years.
4.5.1 Reducing new blindness and visual impairment
Meeting the St. Vincent Declaration target of reducing new blindness took longerthan hoped for. Five years after introduction of a screening system, a hospital-basedstudy from Lund, Sweden, showed low incidence of blindness in a group of type 1 di-abetes patients [55]. Ten years after systematic fundus photography was introducedon Iceland, covering more than 200 diabetic patients, all persons with type 1 diabetesand a large proportion of those with type 2 diabetes, the annual number of newlyblind people with diabetes fell to 0 [56]. Reduction of a proxy measure of new blind-ness by more than one-third in five years was reported for Stockholm County [57].Later, exciting data from Newcastle, United Kingdom, were published [58], confirm-ing that a risk reduction program really can work.
Looking back, it seems that at first patients with advanced proliferative DR weredetected. In the Stockholm region, for example, this first happened on a larger scalewhen greater numbers of people with diabetes were examined subsequent to a cam-paign to increase referral rate, many of them arriving too late for effective treatment.In that region, new blindness in diabetes peaked in 1984. Then, earlier cases ofproliferative DR were identified and treated as a result of larger-scale application ofscreening tests. From 1990, when a systematic photography-based risk reductionprogram took form, new blindness due to proliferative DR fell to near zero levels,while reduction of blindness and visual impairment due to diabetic maculopathy wasachieved at a slower rate [57].
Looking forward, an additional challenge will be to identify earlier lesions so thatnew drug treatments can be instituted at an early stage. Drugs now in developmentare hoped to reduce inflammation or prevent capillary closure resulting from whiteblood cells sticking to vessel walls and occluding capillaries. Other drugs are beingdesigned to reduce or prevent vascular leakage. An outcome measure for such studiescould be the proportion of subjects whose visual acuity, neither at baseline nor atstudy end, falls below Snellen 20/40 or 6/12 (Monoyer 0.5). In many countries thisis a legal requirement for driving a car. That threshold represents half of the visualacuity considered “normal” (i.e., the ability to perceive an object subtending an angleof one minute of arc, Snellen 20/20 or 6/6, Monoyer 1.0).
4.5.2 Counting people who lost vision
There are many ways of measuring visual acuity [59]. Using an illuminated chart(http://www.icoph.org/pdf/icovisualstandards.pdf) is regarded as good clinical prac-tice. Several definitions of blindness exist but IRS “legal blindness” and the WHO

Finding a Role for Computer-Aided Early Diagnosis of Diabetic Retinopathy 95
(ICD 10) definition are the most commonly used in the more recent literature;slight changes (http://whqlibdoc.who.int/hq/2003/WHO PBL 03.91.pdf) are beingcontemplated.
The point prevalence of a disease is the proportion of a defined population at riskfor the disease that is affected by it at a specified point on the time scale. Beinga proportion, prevalence carries no unit, and must lie between 0 and 1 (or between0 and 100%). The prevalence of “legal blindness” (a wide definition of blindness,coming from the U.S. Internal Revenue Service) in a population-based sample ofpeople with diabetes can be expected to be in the region of 1 to 4% [60].
A rate is defined as change in number relative to change in another quantity, e.g.,events per unit of time. The incidence rate of a disease over a specified time intervalis given by the number of new cases during the interval divided by the total amountof time at risk for the disease accumulated by the entire population over the sameinterval. The units of a rate are thus (time)−1.
For instance, in Stockholm County, Sweden, in the year 1984, 28 persons withdiabetes were newly blind (WHO definition) in a background mid-year populationof 1 556 828; incidence 1.8×10⁻⁵ yr−1 (95% confidence interval 1.2×10⁻⁵ yr−1 to2.6×10−5 yr−1). In 1994, 2 persons with diabetes were newly blind (WHO def-inition) in a background mid-year population of 1 697 366; incidence 0.12×10⁻⁵
yr−1 (95% confidence interval 0.01×10⁻⁵ yr−1 to 0.4×10⁻⁵ yr−1) when all causesof blindness were included [57]. In the Warmia and Mazury region of Poland,recorded blindness incidence rate believed due to diabetes fell from 5.2×10⁻⁵ yr−1
to 0.8×10⁻⁵ yr−1 when the periods 1989–1994 and 2000–2004 were compared [61].Few DR screening programs serve a large enough background population to make
it possible to document reductions in new blindness during a five-year period. Onemay assume that scarce events, such as cases of new blindness, follow a Poissondistribution, which has the attractive property that its variance equals its mean. Atable of confidence intervals for numbers of events from 1 to 40 (http://www.doh.wa.gov/Data/guidelines/ConfIntguide.htm) shows that estimation is imprecise forsmall numbers. Your statistician will know how to calculate exact confidence in-tervals and should be able to perform Poisson regression with a test for trend. Pois-son regression is useful for following repeated measures such as annual numbers ofnewly blind.
4.5.3 Understanding the importance of visual impairment
The inclusion of visual acuity testing in a DR screening program, as in the UnitedKingdom, has elsewhere been questioned for reasons of cost. Visual acuity is animportant process variable and a useful aid to treatment decisions. Treatable lesionssuch as cataracts can be discovered in time and acted upon, preserving or even in-creasing the patient’s quality of life. Moreover, even minor loss of visual acuitygreatly affects a person’s social situation and activities (http://cera.unimelb.edu.au/publications/reports/Focus%20on%20LowVision.pdf). Loss of visual acuity is use-ful information for graders. In research settings, visual acuity is expressed as thebase-10 logarithm of the minimum angle of resolution (LogMAR). These data are

96 Automated Image Detection of Retinal Pathology
useful when the results of new imaging modalities showing retinal thickening arecontrasted with findings from more conventional fundus images. For example, vi-sual acuity for MAR 1 minute of arc is Snellen 20/20 and LogMAR is 0; MAR10 minutes of arc (Snellen 20/200) corresponds to LogMAR 1. Visual acuity is arelevant outcome variable for a DR risk reduction program.
4.6 User Experiences of Computer-Aided DiagnosisUsers of DR CAD can be divided into two groups: pioneers and early adopters inone group, the other group consisting of people who have had this technology foistedon them. It is difficult to separate the performance of CAD software from the influ-ence of patient spectrum, image quality, characteristics of users, and their workplace,including technological environment. I have listened for expressions of remainingdistrust caused by inflated promises made for the primitive CAD software available15 or even 25 years ago. Moreover, I have attempted to find out why there has beensome resistance towards the adoption of this new technology.
Pioneers are often highly tolerant of program bugs and other glitches. Theirscreens are likely to be color-calibrated and many of them still swear by CRT moni-tors intended for the graphics industry. More than a few of them are proficient usersof SQL database management programs under some flavor of Unix. These are inner-directed people wielding considerable power over their own working day. Pioneerstend to have experience of selected images from patients with fairly advanced DRand are likely to work in centers where standards of image quality and equipmentmaintenance are high; therefore, the task for CAD software is easy and its predictivevalue may be high as a result of high DR prevalence.
Other users, however, are more likely to be critical of factors that disturb work flowand contribute towards making the work environment more stressful. The qualitiesof the associated database management software and the operating system play animportant part of the experiences of users not thrilled by the opportunity of matchingwits with programmers, particularly if several kinds of new software begin to intrudeon their work experience at the same time. Computer glitches and the qualities ofthe user interface are just part of the experience. Graders may not take kindly tothe thought of losing their job to a machine. To add insult to injury, the machineis felt to be looking over their shoulders, usurping authority. Experienced graderswith many years of reading images on film may decry the loss of information andthe increase in artifacts introduced with digital cameras and grading from office-type screens with a small color space (dependent on angle of view) and poor coloraccuracy. Graders see images of variable quality from unselected populations forwhich CAD software will achieve low predictive value; this will not increase theirconfidence in the new technology. Moreover, a program tuned for high sensitivitywill stress the grader with improbably frequently occurring indicators of putativelesions. Conversely, with software designed for high specificity, glaring errors of

Finding a Role for Computer-Aided Early Diagnosis of Diabetic Retinopathy 97
omission are possible, potentially giving graders and managers difficult ethical andmedicolegal problems to handle. The reception of CAD software and the effects ofits adoption on the work environment are suitable subjects for future research.
I have to make clear that I do not have experience of more than a few programsand about a dozen different algorithms. Most of them were in early stages of de-velopment. I do not claim to be abreast of the latest image analysis techniques andI cannot assess the quality of programming in Matlab or other environments. Nei-ther I nor my sources from other centers felt comfortable in making judgment on theachievements of a named company, institution, or programmer. What follows is anecessarily subjective collection of partly adverse opinions.
4.6.1 Perceived accuracy of lesion detection
Accuracy of lesion detection was reported to be affected by image quality, artifacts,and operator error. There were some differences of opinion between experiencedprofessional graders (particularly those performing systematic field-by-field, lesion-by-lesion grading) and my ophthalmologist friends (who are trained to obtain animmediate global impression of a fundus). The latter were more inclined to feel thatprograms (and indeed professional graders) overgrade.
Current consensus appears to be that CAD software does not yet offer potential forcompletely independent automated DR detection, mainly because specificity is feltto be insufficiently high. CAD is already, however, of interest for purposes such asdecision support. In the near future, validated software should become useful as anintegral part of well-run screening programs, safeguarding against loss of attentionbecause of grader fatigue, monitoring image quality, and improving repeatability.
Some programs, such as those based on ContextVision technology, were more orless capable of compensating for differences in texture such as vignetting (dark edgesof image); others showed poor accuracy in image areas that were underexposed be-cause of insufficient pupil dilation, operator error (wrong distance from fundus cam-era to eye or camera at wrong height) or optical artifacts including effects of ocularmedia opacities. Depending on make and model of fundus camera (for examplewith Canon CR series cameras), bright reflections from the inner limiting membranein eyes of young persons may obscure lesions inside the temporal vascular arcadeswithin about one to three mm from fixation; the remedy is to obtain images frommore nasal or temporal orientation of the eye. Indeed, imaging more than two fieldsand offering a stereo pair of the macula will help reduce the frequency of technicalfailure.
4.6.1.1 Hemorrhages and microaneurysms
Dark lesions (dot and blot hemorrhages): Detection was dependent on the ability ofsoftware to disregard retinal blood vessels; the RetinaLyze program was felt by someusers to be particularly good in this respect, but others prefer Aberdeen software.Brown dots (retinal pigment epithelium, RPE) were overdiagnosed as red dots (mi-croaneurysms) by several programs, particularly with monochrome images (called

98 Automated Image Detection of Retinal Pathology
red-free by ophthalmologists) suffering from compression artifacts. Microaneurysmdetection ability was affected by image quality including measurable resolution, sub-jective sharpness, number of bits (10-bit monochrome a little better than 8-bit; 16-bitcolor worse than 24-bit), image noise, denoising and sharpening algorithms, andcompression artifacts. Indeed, most programs worked best with uncompressed filesand with those only subjected to lossless compression. Another problem was re-peatability; the effect of certain algorithms built into digital camera backs apparentlywas to give different images from the same eye obtained a few minutes apart, par-ticularly as regards number and location of microaneurysms. Only a few camerasintended for professional photographers, such as the Canon EOS-1Ds Mk II (whichis rarely used for fundus photography), allow support staff, using a special program,to turn off most image manipulation containing a memory function for earlier imagesand intended to deliver pleasing pictures — but possibly affecting the appearance ofthe retinal pigment epithelium and small details such as small hard exudates, the tipsof perifoveal capillaries and small dot hemorrhages/microaneurysms, thus impairingtheir detection.
Microaneurysm counts are predictive of worsening of DR [62] and repeatable mea-surements should therefore provide useful information for members of diabetes careteams — less so for most ophthalmologists.
It should be noted that good CAD software detects more microaneurysms thando human observers who may consider this as tiresome overdiagnosis. On the otherhand, I quickly stopped using some programs that were unable to identify smallmicroaneurysms near fixation. That is a lesion widely believed to be indicative ofrisk for leakage and predicting possibly sight-threatening centrally located hard ex-udates — although this was not confirmed by one recent study [63]. Some but notall centrally located hard exudates are treatable by photocoagulation. The presentconsensus seems to be that centrally located microaneurysms ought not to be missedin a DR screening system.
4.6.1.2 Hard exudates
Bright lesions, also known as white lesions (for instance hard exudates), are report-edly accurately detected by some algorithms [64; 65] — but from what I have seenfor certain earlier algorithms more easily if sufficiently large to be apparent to thetrained observer. The RetinaLyze system examined “individual bright lesions with-out consideration of their dimension, orientation, location, pattern, chromaticity, ortopographical relation to red lesion” which limited its usefulness [66]. The presenceof hard exudates within one disc diameter of the center of the fovea is believed tobe sight-threatening; this is called macular involvement or diabetic maculopathy, butconfusingly sometimes referred to as “macular edema.” This is an important familyof conditions.
There are several possible causes of false positives. Some programs tended toconfuse hard exudates with bright optical artifacts caused, for example, by dust andother material on the fundus camera’s front lens or reflections from the internal lim-iting membrane. Retinal pigment epithelial (RPE) defects have existed for a long

Finding a Role for Computer-Aided Early Diagnosis of Diabetic Retinopathy 99
time but were not reported until a few decades ago, showing the ability of doctors todisregard information that does not fit the pattern looked for. RPE defects are highlyvisible as “window defects” in fluorescein angiograms. RPE defects can be distin-guished from hard exudates (appearing to lie on the plane of the retina) because thedefects on stereoscopic examination or in stereo images seem to lie beyond the planeof the retina. Some algorithms overdiagnose (as hard exudates) drusen, another reti-nal lesion not associated with DR. Drusen, resulting from deposition of debris fromphotoreceptors, are amorphous yellowish deposits beneath the sensory retina, beingimportant as an early sign of age-related macular degeneration (AMD) and the objectof current research interest [67]. Four main types of drusen can be detected in theretina. Hard drusen are discrete, yellow, nodular deposits, smaller than 50 micronsin diameter. Basal laminar drusen are tiny, whitish, multiple deposits with a “starrynight” appearance. Soft drusen are yellowish deposits with poorly defined margins,tending to coalesce, and are usually larger than 50 microns. Crystalline drusen arediscrete, calcific, refractile deposits. Because number, size, and confluence of drusenpredict development of sight-threatening AMD [68], drusen follow-up should be animportant application for CAD software. New hopes for a solution to the problemof false positives caused by nondiabetic bright lesions such as drusen were recentlypresented [50] which is very good news for screeners.
In my opinion, overdiagnosis of hard exudates is not a problem of such dimensionsas to invalidate a risk reduction program; depending on their workload, however, notall ophthalmologists might agree. Centrally located hard exudates ought not to bemissed in a DR screening system. Neither should one miss hard exudates locatedtemporal to the fovea [63].
4.6.1.3 Retinal thickening
Retinal thickening may be guessed at if parts of the macula seem structureless. Tra-ditionally, the gold standard is examination by stereoscopic biomicroscopy or fromstereo images, but there is a strong subjective element and data are very noisy. Dur-ing the past decade, it has become known that human observers do not comparewell with more objective methods such as the Retinal Thickness Analyzer (RTA) ortime-domain optical coherence tomography (OCT). The latter [69] has been avail-able since 1994 and yields images of sections through the retina useful for assessingmorphological changes associated with retinal thickening [70]. The use of OCT, asensitive, specific, and reproducible tool, has taught us much about the morphologyand pathophysiology of macular edema [71], but one problem for the user is that theprocess is slow and one does not always know from what area of the retina the dataare collected.
Spectral domain (SD-OCT) or frequency domain instruments (using fast-Fouriertransforms; entering the market during 2007) rapidly produce images of the macula,enabling the user to place optical sections at will, through (or in the vicinity of) le-sions such as vascular abnormalities, hard exudates, or foveal microaneurysms [72].This noninvasive technology should become very useful for accurate final diagnosisof local or widespread retinal thickening in order to optimize focal and/or grid laser

100 Automated Image Detection of Retinal Pathology
photocoagulation for each eye, as well as new methods of treatment. Perhaps usingthis method could help develop CAD for macular edema further.
4.6.1.4 Micro-infarctions
Cotton wool spots, in modern literature referred to as micro-infarctions (but stillcalled soft exudates by some doctors — despite the fact that these lesions are notsoft, neither do they result from exudation) are important indicators of local orwidespread retinal ischemia. They tend to appear when blood glucose levels havebeen lowered too much too quickly, i.e., when HbA1c levels are reduced by morethan two percentage units in 10 to 12 months [73]. Although micro-infarctionstend to disappear with time, their presence may indicate variability in blood glucoseconcentration, a risk factor for painful diabetic neuropathy [74]. Micro-infarctionsare part of the panorama of severe nonproliferative DR (the term “preproliferative”retinopathy was popular thirty years ago but is ill-defined and best avoided). Oc-casionally, photocoagulation scars or local areas of atrophy are mistaken for micro-infarctions.
Detection of micro-infarctions is easy for humans and CAD programs in case ofimmediately apparent lesions, but requires reasonably faithful recording of lumi-nance data in order to identify lesions characterized by diffuse borders and mini-mal local increased luminance; such minimally apparent lesions seen in high-qualitycolor images may indicate local areas of ischemia clearly confirmed on fluoresceinangiography. The main reason for accurate detection of micro-infarction is thatwidespread ischemia is a possible indication for scatter photocoagulation.
4.6.1.5 Vascular tree abnormalities
The vascular tree can be analyzed in various ways; an excellent review is avail-able [75]. There is considerable interest in the relationship between retinal vascularmorphology and metabolic and inflammatory diseases [76]. I hope that the sim-ilarities between cerebral and retinal microcirculation will help to attract funds tothe analysis of retinal vasculature by image analysis. Experimental RetinaLyze soft-ware and some published algorithms have assessed tortuosity of retinal blood vessels.Several researchers have measured blood vessel diameter, for the purposes of assess-ing retinal blood flow or variations of vascular diameter (venous beading). Therehave been attempts to detect venous loops, intraretinal microvascular abnormalities(IRMA) that predict the onset of proliferative DR, and small tufts of new blood ves-sels (proliferations) but I have not seen any algorithm in use that reliably detectedsuch lesions. This is an area that deserves further work.
To sum up, most of the programs that I have seen in use were calibrated usingimages showing advanced lesions whose existence is immediately obvious to thetrained observer; what I and many others would need is help finding minimal depar-tures from normality whose presence is predictive of progression to STDR.

Finding a Role for Computer-Aided Early Diagnosis of Diabetic Retinopathy 101
4.6.2 Finding and reading evaluations of software for retinopathydiagnosis
New diagnostic tests should receive thorough evaluation before being applied tomedical practice; such has not always been the case in the past, and many authorsincluding Feinstein [77] have called for reform. Published reports deserve criticalreading, and methods for systematic reviews are in development, not least becausemethods for assessing diagnostic test accuracy differ from the well established meth-ods for evaluating treatment methods [78]. The Cochrane Collaboration is plan-ning a register of diagnostic test accuracy studies (http://www.cochrane.org/docs/diagnostictestreviews.htm), and a handbook for reviewers of such studies is beingprepared. If you are not an experienced reader of papers published in medical jour-nals, an introduction to EBM (evidence-based medicine) should be of interest [79].
The quality of any study can be considered in terms of internal validity, externalvalidity, and the quality of data analysis and reporting. Internal validity can be de-fined as the degree to which estimates of diagnostic accuracy produced in a studyhave not been biased as a result of study design, conduct, analysis, or presentation(e.g., sample selection, problems with the reference standard and nonindependentassessment). External validity concerns the degree to which the results of a studycan be applied to patients in practice, and is affected by factors such as spectrum ofdisease or nondisease, setting, other patient characteristics, how the diagnostic testwas conducted, the threshold (or cut-off point) used, and the reproducibility of thetest. The QUADAS checklist [80], for which a helpful manual is available on the In-ternet [81, Ch. 9], is a useful quality assessment tool for diagnostic accuracy studiesthat was recently validated and modified [82].
Reports on diabetic retinopathy CAD software are not easy to find. To search med-ical journals, go to PubMed Services (http://www.ncbi.nlm.nih.gov/entrez/query/static/clinical.shtml), choosing Clinical Queries, Search by Clinical Study Category,enter diabetic retinopathy and diagnosis, computer-assisted or diabetic retinopathyand image processing, computer-assisted, choose “diagnosis” and broad search. Thisturns up more than 140 papers of varying relevance. One hopes that a medical librar-ian will devise a more sensitive and specific filter to find CAD software evaluations.The situation would improve if all authors provided more useful index terms to jour-nals and thus to the people doing the indexing for PubMed and other databases.
Several papers have described initial development and performance of the prema-turely marketed (but in my opinion interesting) RetinaLyze DR CAD software [66;83–86] whose evaluation in a well-designed multi-center trial was cut short by in-vestors who abruptly closed down the company. Several successful ongoing projectsare intended to produce CAD software useful for DR risk reduction programs. Whatcould they have in common?
There are numerous algorithms intended for the detection of some aspect of mor-phology. The results of using such algorithms need to be combined into a risk score.This combination score can be derived from a training dataset of images from aDR screening system, using methods such as logistic regression, neural networks or

102 Automated Image Detection of Retinal Pathology
machine learning techniques (e.g., support vector machines) and should be validatedusing a test dataset of other screening images [43]. To achieve adequate statisticalpower, large test sets are needed to provide a sufficient number of lesions for detec-tion even if their prevalence is low. For example, in a Scottish study, compared toa clinical reference standard, images containing hard exudates were detected withsensitivity 95.0% and specificity 84.6% in a test set of 13 219 images of which 300(2%) contained hard exudates [65]. Papers using this kind of approach have beenappearing recently and are worthy of close study.
Algorithms now exist that can identify some, but not all, of the lesions found in theEarly Treatment Diabetic Retinopathy Study (ETDRS) Standard Photographs (http://eyephoto.ophth.wisc.edu/ResearchAreas/Diabetes/DiabStds.htm) and the publiclyavailable images from the STARE project Web site [87]. The STARE images (http://www.ces.clemson.edu/∼ahoover/stare/) show a high proportion of advanced DR asdo the ETDRS Standard Photographs. Testing CAD software on unselected popu-lations of people with diabetes will be of greater interest but more expensive. Ofcourse, I do not wish to discourage the creation of new CAD software, but it shouldbe clear from the outset that the process of validating such programs entails con-siderable time, cost, and effort. Ideally, there should be post-marketing surveillanceshowing intermediate outcomes (numbers of adequate referrals vs false referrals) andfinal outcomes (years of sight saved) of full-scale application in DR screening pro-grams. Until recently, we have had to make do with smaller studies on more or lessselected groups of persons with diabetes.
To ensure market acceptance and approval by regulatory agencies such as the FDA(U.S. Food and Drug Administration) and from companies or government agenciespaying for health-care, nowadays quite rigorous and well-documented processes ofdevelopment and assessment appear to be required.
4.6.3 Opportunities and challenges for programmers
Speaking as a clinician, as a researcher, and last but not least as a senior grader withmany years of experience managing a large program, I am very interested in gettinghelp from CAD programmers. Accurate microaneurysm counts are of considerablepractical importance at present because of their proven prognostic value — this work,however, is tedious; automated detection should be welcomed if reliable [88]. Meth-ods for measuring microaneurysm turnover, for whose assessment human observersare far from ideal [89], should become an interesting research tool and are likely tobecome important for assessment of the earliest stages of DR [90].
Indication of image quality [91] including field definition [92] would help photog-raphers achieve the clear sharp artifact-free images with repeatable field localizationthat I like to see. While detection of the optic disc and the fovea presently takesone such program 120s using a 2.4 GHz Pentium PC, near real-time speed would bemost welcome. Future CAD software should help describe patterns of lesion type,location, turnover, and apparent movement, in aid of a better understanding of patho-physiology and improved prediction of STDR.

Finding a Role for Computer-Aided Early Diagnosis of Diabetic Retinopathy 103
My wish list for the future, in no particular order, thus includes: Objective assess-ment of image quality including field definition (as feedback to photographers andfor quality development), reliable early detection of changes to fundus cameras suchas optical artifacts (dust on sensor, material on glass surfaces, decentered flash tube,browning of images as a result of aging flash tube), relieving graders from boredom,increasing sensitivity for early changes, help with comparisons of lesions over time,improved grading of early lesions as feedback to diabetes care teams, and maximumsensitivity for the earliest possible detection of STDR.
4.7 Planning a Study to Evaluate AccuracyAs mentioned above, the closeness of a diagnosis to the true state is termed accuracy.Standards for reporting of diagnostic accuracy (STARD) have been developed [93],based on available evidence [94] to improve the quality of design and reporting.A useful checklist and a clarifying flowchart are available (www.consort-statement.org/stardstatement.htm). A book describing methods for the evaluation of diagnostictests is warmly recommended [95]. While you are looking for studies of DR CADsoftware, take note of how papers have been indexed (in PubMed, choose DisplayCitation) and list the relevant Medical Subject Headings (MeSH) index terms in yourmanuscript so that interested parties can find your work.
4.7.1 Getting help from a statistician
Designing studies to evaluate the accuracy of medical tests requires the expertise ofa statistician with an interest in epidemiology and ideally with experience of eval-uating diagnostic tests in medicine. The following treatment draws heavily on abook intended for graduates with a basic training in statistics [43]. Your statis-tician should read that book; useful STATA programs and help files are available(www.fhcrc.org/science/labs/pepe/book/) along with a few errata.
A commonly used design of an accuracy study compares the result of the indextest, the test under study, with the results from applying the reference test, the “goldstandard.”
4.7.2 Choosing a measurement scale
First let us consider the scale for the test result. Tests for certain conditions (e.g.,pregnancy, death) are expected to yield dichotomous results, positive if the conditionis present, negative if absent; this is a binary scale. CAD software can be expectedto help answer the question: Is any DR or STDR present or absent?
For tests that yield results on nonbinary scales, the classification rule is usuallyset by a threshold. Tests that yield results on a continuous scale (one that contains atrue zero) include the measurement of fasting plasma glucose concentration, where

104 Automated Image Detection of Retinal Pathology
a limit has been set for the diagnosis of diabetes from the results of repeated tests.Categorical data, also known as unordered discrete data, show no particular order,e.g., iris color.
Tests that involve subjective assessments are often measured on ordinal scales,e.g., the five main verbal categories of the 13-level ETDRS Final Scale most appli-cable to screening: no DR, mild-moderate-severe nonproliferative DR, proliferativeDR [96; 97]. Graders of seven-field stereo images state whether a certain lesion isabsent, questionably present or present in each field, referring to a Standard Photo-graph (SP). Stereo images are useful for the detection of retinal thickening whichis however quite difficult to do reproducibly. Unless some other scale is mandated,take a look at the proposed five-level international clinical diabetic retinopathy anddiabetic macular edema disease severity scales [98], mentioned in Chapter 2 (Sec-tion 2.5). Controversially, they do not specify distance of hard exudates from thecenter of the macula. The Scottish Diabetic Retinopathy Grading Scheme 2004,which does this, is now widely used in Scottish DR screening programs and in someother areas (http://www.nsd.scot.nhs.uk/services/drs/grading-scheme.pdf). Differingprevalence of diabetic macular edema has been described in mild, moderate, severenonproliferative DR and proliferative DR, respectively [99]. Graders could use afive-point scale to express their degree of confidence in findings[100]; so could CADprograms.
There are different statistical methods for handling data from binary, continuous,and ordinal scales. A common mistake is to calculate means for numerical represen-tations of ordinal and categorical scales, for instance 10 for no DR, 60 for prolifera-tive DR, 99 for “cannot grade” — which of course makes no sense.
4.7.3 Optimizing design
Now consider selection of study subjects. For an experimental study, a fixed num-ber of subjects with known disease and a fixed number of nondiseased subjects areselected, say, clinic attenders with diabetes with or without the kind of DR understudy, and the diagnostic test is applied to both categories. This is a low-cost design,useful for early stages of development of a new test, but applicability to the entirepopulation of, say, people with diabetes is unknown. To achieve generalizability, goon to a cohort study.
4.7.3.1 Cohort design and two-stage designs
For a cohort study, the diagnostic test can be applied to a set of study subjects fromthe population of interest, and true disease status, as measured by a gold standarddefinitive test, is also determined for all subjects [101]. The results of such a studyare dependent on the accuracy of the reference test.
Suppose that the prevalence of DR is 50% and that your new test is in truth 80%sensitive and 70% specific. Consider an imperfect reference test (such as clinical ex-amination by an eminent general ophthalmologist of your acquaintance) that missesdisease when it is there 20% of the time but that never falsely indicates disease.

Finding a Role for Computer-Aided Early Diagnosis of Diabetic Retinopathy 105
Relative to such a reference test, your new test is still 80% sensitive but only 62%specific. It will appear to be worse than it is.
On the other hand, if we also assume that both the reference test and the new testare better at detecting severe disease, the new test will appear to be better than ittruly is. Finally, if the new test is perfect (100% sensitive and 100% specific) butthe reference is somewhat imperfect (90% sensitive and 90% specific), the new testappears to be only 90% sensitive and only 90% specific. It is not unusual for a newtest to be better than the best available standard test.
A variation on the cohort design is the two-stage design where ascertainment oftrue disease status depends on the result of the diagnostic test. Two-stage designssave some costs for gold-standard tests and might be ethically justified if the defini-tive test, i.e., fluorescein angiography, is invasive and entails some risk for the sub-ject. In the context of a screening system, two-stage designs are fairly easy to im-plement. On the other hand, their statistical power is inferior to that of a true cohortstudy, which should be performed for a new test before two-stage designs are imple-mented. Special care is needed in analysis of the data, not least because results ofthe index test and the reference test are not independent [43].
4.7.3.2 Reference standard images and centers
The internationally recognized gold standard test for DR and STDR is seven-fieldstereo 30° fundus photography on color transparency film, performed by certifiedphotographers (the original work was done using Zeiss Oberkochen FF-3 and FF-4fundus cameras giving images with 2.5:1 magnification on Kodachrome film; certainother cameras and films are approved by the Fundus Photograph Reading Center inMadison, Wisconsin) with seven-field stereo photograph grading performed by cer-tified graders using the set of Standard Photographs (SPs) obtainable from the Fun-dus Photograph Reading Center in Madison, Wisconsin (http://eyephoto.ophth.wisc.edu/Photography/Protocols/Mod7&FA-ver1.pdf) and special grading forms; see theETDRS manual of operations [102].
The ETDRS Standard Photographs and data from the Wisconsin EpidemiologicStudy of Diabetic Retinopathy form the basis for the proposed international clin-ical diabetic retinopathy and diabetic macular edema disease severity scales [98].Disease severity is divided into five stages: no apparent retinopathy (i.e., no ab-normalities), mild nonproliferative DR (microaneurysms only), moderate nonprolif-erative DR (more than just microaneurysms, but less than severe nonproliferativeDR), severe nonproliferative DR follows the 4:2:1 rule (any of the following: morethan 20 intraretinal hemorrhages in each of 4 quadrants; definite venous beading in2+ quadrants; prominent intraretinal microvascular abnormalities in 1+ quadrants —and no signs of proliferative DR), and proliferative DR (one or more of the following:neovascularization, vitreous/preretinal hemorrhage). The four latter categories canbe combined with a separate diabetic macular edema severity scale: diabetic mac-ular edema apparently absent (no apparent retinal thickening or hard exudates inposterior pole) and diabetic macular edema apparently present (some apparent reti-nal thickening or hard exudates in posterior pole). This exceptionally wide definition

106 Automated Image Detection of Retinal Pathology
of macular edema is intended for general ophthalmologists and other caregivers notusing stereoscopic biomicroscopy or stereo photography, being the first part of a two-tier system. The second part divides diabetic macular edema, if present, into threecategories: mild diabetic macular edema (some retinal thickening or hard exudates inposterior pole but distant from the center of the macula), moderate diabetic macularedema (retinal thickening or hard exudates approaching the center of the macula butnot involving the center), and severe diabetic macular edema (retinal thickening orhard exudates involving the center of the macula). The specific distance from thefovea is not specified. This scale was used in a recently published paper describingvarying prevalence of diabetic macular edema in mild, moderate, severe nonprolifer-ative DR, and proliferative DR, respectively [99].
Another reference center is the Retinopathy Grading Centre at Hammersmith,London, United Kingdom (http://www1.imperial.ac.uk/medicine/about/divisions/is/meta/diabeticretinopathy/), which performs expert grading of two-field 45° imagesfor the EURODIAB study with its useful grading scale, which was found traceable tothe ETDRS scale [103], as well as different grading for other studies. Early contactwith a reference center is advisable when planning a study.
You should be very wary of using the nearest ophthalmologists to perform biomi-croscopy as this kind of reference test cannot be validated. Low intra- and inter-observer agreement in assessment of retinal thickening has been described [104].Cohort studies with adequate reference tests are necessarily expensive because alarge number of subjects must be recruited and examined, but only in this way cangeneralizable data of practical value be obtained.
4.7.3.3 Paired or unpaired test
Diagnostic methods can be compared in two ways. When two different methods areapplied to each study subject, each individual gives rise to a pair of results; this iscalled a paired design. Since an individual’s results are related, the statistical methodmust take this into account. For paired binary data, the hypothesis test of choice isMcNemar’s test, which has the advantage of simplicity, and one may calculate con-fidence intervals for the difference between paired proportions [105]. Paired ordinaldata can be analyzed using Svensson’s method [106]; methods based on the analysisof the ROC curve are the subject of considerable current interest.
An unpaired design is one in which each subject receives only one of the diagnos-tic tests. Because of inter-subject variability, unpaired designs have lower statisticalpower and a larger study size is needed than for paired designs.
4.7.3.4 Masking
Test integrity is important. Knowledge of the gold standard test result (supposedto describe true disease status of the individual) must not influence the assessmentof the diagnostic test, and vice versa. The persons administrating and assessing theresults of the diagnostic test should be masked to the study subject’s true diseasestatus. You should consider the ethical implications of including the diabetes patient

Finding a Role for Computer-Aided Early Diagnosis of Diabetic Retinopathy 107
in this group. The common term “blinded” is offensive to many ophthalmologistsand to their patients [107].
One must be aware that interference can enter in some subtle ways and take pre-cautions accordingly. For example, if there is a time delay between the experimen-tal diagnostic test and “gold standard” assessment of disease status, altering patientmanagement (e.g., insulin treatment) on the basis of the test might interfere with dis-ease and lead to biased results. Knowledge of true disease status may influence thecare with which the experimental diagnostic test is done [43].
4.7.3.5 Minimizing bias and variability
Bias is any systematic deviation of test results from the true state. Numerous sourcesof bias affect the assessment of diagnostic tests [108]. Most of them apply to previ-ous studies comparing different imaging modalities and diagnostic methods in DR.Verification bias denotes nonrandom selection for definitive assessment for diseasewith the gold standard reference test (as in two-stage designs). Imperfect referencetest bias means that true disease status is subject to misclassification (as when clin-ical examination is used instead of a validated method such as seven-field stereophotography); there is no way to compensate for this in subsequent statistical anal-ysis. Spectrum bias (a form of selection bias) means that subjects included are notrepresentative of the population (as when a convenience sample of diabetic patientsis taken from hospital attenders). “Berkson’s fallacy” denotes the choice of hospitalpatients to represent nondiseased subjects. Test interpretation bias occurs when in-formation is available that can distort the diagnostic test (this is why persons shouldbe masked from information from medical records and results of the reference test).Unsatisfactory tests are uninterpretable; they should be included among positive testresults in a DR screening study because the process variable of interest usually isreferral to an ophthalmologist and because media opacities and other factors caus-ing images to be uninterpretable may be associated with presence of severe DR— but on the other hand they should not be counted in favor of the accuracy of atest in itself [109]. Extrapolation bias occurs when the conditions or characteris-tics of populations in the study are different from those in which the test will beapplied (for instance, CAD software designed to detect STDR in high-quality colorphotographs taken through dilated pupils of young Europeans with type 1 diabetesneeded extensive re-programming in order to provide acceptable accuracy when ana-lyzing variable-quality images from undilated elderly American Indians with type 2diabetes). Note that the implicit or explicit criterion for defining a positive versusnegative test result can differ with the tester or the environment in which the test isdone [110]; this is one of the reasons why published sensitivity and specificity datashould be viewed with some caution. Lead time bias, part of screening efficacy studydebates, means that earlier detection by screening may erroneously appear to indi-cate beneficial effects on the outcome of a progressive disease (but remember that thecourse of diabetic complications is modifiable when timely interventions are made).Length bias implies that slowly progressing disease is overrepresented in screenedsubjects relative to all cases of disease that arise in the population. Overdiagnosis
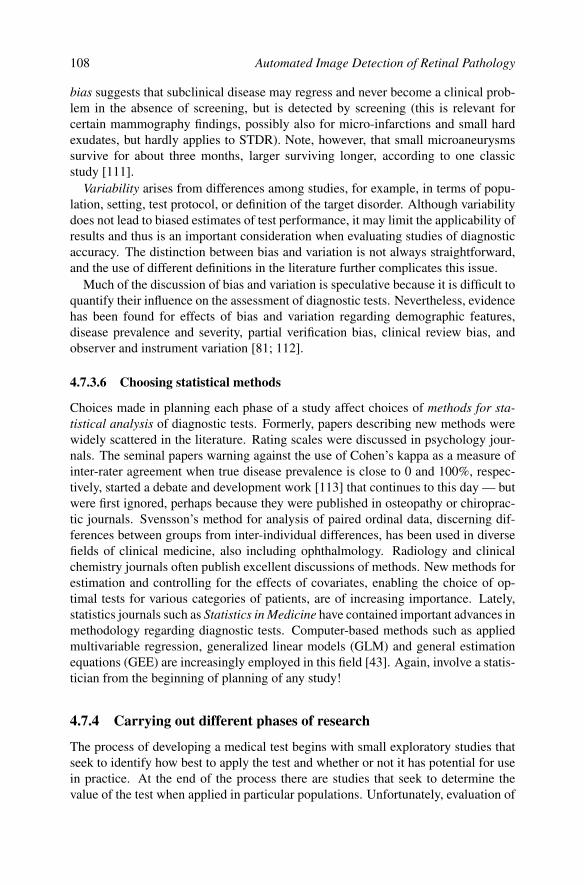
108 Automated Image Detection of Retinal Pathology
bias suggests that subclinical disease may regress and never become a clinical prob-lem in the absence of screening, but is detected by screening (this is relevant forcertain mammography findings, possibly also for micro-infarctions and small hardexudates, but hardly applies to STDR). Note, however, that small microaneurysmssurvive for about three months, larger surviving longer, according to one classicstudy [111].
Variability arises from differences among studies, for example, in terms of popu-lation, setting, test protocol, or definition of the target disorder. Although variabilitydoes not lead to biased estimates of test performance, it may limit the applicability ofresults and thus is an important consideration when evaluating studies of diagnosticaccuracy. The distinction between bias and variation is not always straightforward,and the use of different definitions in the literature further complicates this issue.
Much of the discussion of bias and variation is speculative because it is difficult toquantify their influence on the assessment of diagnostic tests. Nevertheless, evidencehas been found for effects of bias and variation regarding demographic features,disease prevalence and severity, partial verification bias, clinical review bias, andobserver and instrument variation [81; 112].
4.7.3.6 Choosing statistical methods
Choices made in planning each phase of a study affect choices of methods for sta-tistical analysis of diagnostic tests. Formerly, papers describing new methods werewidely scattered in the literature. Rating scales were discussed in psychology jour-nals. The seminal papers warning against the use of Cohen’s kappa as a measure ofinter-rater agreement when true disease prevalence is close to 0 and 100%, respec-tively, started a debate and development work [113] that continues to this day — butwere first ignored, perhaps because they were published in osteopathy or chiroprac-tic journals. Svensson’s method for analysis of paired ordinal data, discerning dif-ferences between groups from inter-individual differences, has been used in diversefields of clinical medicine, also including ophthalmology. Radiology and clinicalchemistry journals often publish excellent discussions of methods. New methods forestimation and controlling for the effects of covariates, enabling the choice of op-timal tests for various categories of patients, are of increasing importance. Lately,statistics journals such as Statistics in Medicine have contained important advances inmethodology regarding diagnostic tests. Computer-based methods such as appliedmultivariable regression, generalized linear models (GLM) and general estimationequations (GEE) are increasingly employed in this field [43]. Again, involve a statis-tician from the beginning of planning of any study!
4.7.4 Carrying out different phases of research
The process of developing a medical test begins with small exploratory studies thatseek to identify how best to apply the test and whether or not it has potential for usein practice. At the end of the process there are studies that seek to determine thevalue of the test when applied in particular populations. Unfortunately, evaluation of

Finding a Role for Computer-Aided Early Diagnosis of Diabetic Retinopathy 109
most DR CAD software algorithms (or combinations thereof) never gets beyond thefirst phase.
Much can be learned from the procedures developed to evaluate new drugs [114]with the caveat that narrow inclusion criteria of drug trials narrow the applicability oftheir results to unselected populations. What now follows is an introduction adaptedfrom Pepe [43, ch. 8].
Phase 1 is an exploratory investigation, intended to identify promising tests andsettings for application, usually performed on subjects from a convenience sample(people with diabetes, with or without DR/STDR, attending a diabetes clinic).
Phase 2, retrospective validation, determines if minimally acceptable sensitivityand specificity are achieved, ideally in a population-based sample of diseased andnondiseased subjects (this is the time to reach out to primary care).
Phase 3, retrospective refinement, determines criteria for screen positivity and co-variates affecting ROC, comparing promising tests and developing algorithms forcombining tests. Subjects are a large random sample from diseased and nondiseasedsubjects.
Phase 4, prospective application, determines positive predictive value and falsereferral probabilities when the test is applied in practice, using a cohort study design.
Phase 5 measures disease impact, determining effects of testing on cost and visualloss (and effects associated therewith) associated with DR and STDR, in a random-ized prospective trial comparing the new test with an existing standard of practice.
For each phase, there are specific methodological issues that you and your statis-tician need to consider at the earliest possible planning stage [43].
4.7.5 An example from another field
The impact of CAD on the performance of screening mammography has recentlybeen analyzed, with alarming results. Some background information [115] is neces-sary before an important recent paper is discussed. Mammography is unprofitable forradiologists in the United States. Mammograms are read by radiologists of widelyvarying experience. Double grading [116] — mandatory in many European countries— rarely occurs in North America. Numerous possible reasons have been suggestedfor the great variability of false positive fraction, and lower specificity than reportedother countries, reported for North America [117]; many of those reasons also ap-ply to DR screening programs. Screening mammography, the most common basisfor lawsuits in radiology, is a particularly stressful task for radiologists, associatedwith a relatively high rate of burnout. CAD software developed by R2 Technologieswas approved by the FDA in 1998. Medicare and many insurance companies nowreimburse for its use. Within three years after FDA approval, 10% of mammographyfacilities in the United States had adopted it.
The association between the use of CAD and the performance of screening mam-mography from 1998 through 2002 at 43 facilities in three states was determined for429 345 mammograms. Diagnostic specificity and PPV decreased after implemen-tation, while sensitivity increased insignificantly. No more cancers were detected.Accuracy fell; area under the ROC curve, 0.871 vs 0.919 [118].

110 Automated Image Detection of Retinal Pathology
Increased frequency of recall and increased false positive fraction may have beenrelated to increased indications of ductal carcinoma in situ (its hallmark, clusteredmicrocalcifications, detected by software), a condition that develops more slowlyand is less dangerous than invasive cancer. With the goal of alerting radiologiststo overlooked suspicious areas on mammograms, the CAD software inserts up tofour marks on the average screening mammograms. For every true positive mark(associated with underlying cancer), radiologists encounter nearly 2000 false positivemarks. In other words, signal-to-noise ratio is unacceptably poor. That is a verystressful situation. One hopes that later versions of the software are more accurate.
4.8 ConclusionThere is an urgent need for reliable CAD software that will decrease the amount ofstress experienced by DR graders, help increase image quality and improve qualityassurance, increase accuracy of DR detection, and thus help screeners reduce the in-cidence of visual problems in diabetes [50]. The performance of new algorithms andof combinations thereof should be compared to the performance of the best of currentpractice for DR detection [119], large, well-designed multi-phase studies conductedin a variety of settings and populations. CAD programs ought to be developed inclose cooperation with graders and adapted for use with electronic medical records.Proponents of CAD software will need to present high-quality evidence of a kind im-portant to clinicians (cf. five papers by the GRADE Working Group in BMJ 2008).Forthcoming software must meet the needs of patients, programs, and staff. Evi-dence for CAD software needs to be of sufficient quality and relevance to form thebasis of guidelines and strong recommendations according to the recently publishedGRADE criteria [120–124]. Such efforts should ensure market acceptance for DRCAD software.
References[1] Lions Clubs, U.S. adults with diabetes fear blindness or vision loss more
than premature death: Many respondents in international diabetes surveyworried about quality of life. News release of the Lions Clubs Interna-tional Foundation, 2006, http://www.lionsclubs.org/EN/content/news newsrelease58.shtml (Accessed March 22, 2007).
[2] Klein, R. and Klein, B.E.K., Vision disorders in diabetes, in Diabetes in Amer-ica, M.I. Harris, ed., National Institutes of Health, Bethesda, MD, 293–338,2nd ed., 1995, NIH Publication No. 95-1468.

Finding a Role for Computer-Aided Early Diagnosis of Diabetic Retinopathy 111
[3] Klein, R., Klein, B.E.K., Moss, S.E., et al., The validity of a survey questionto study diabetic retinopathy, Am J Epidemiol, 124, 104, 1986.
[4] Aiello, L.P., Gardner, T.W., King, G.L., et al., Diabetic retinopathy, DiabetesCare, 21, 143, 1998.
[5] Lipscombe, L.L. and Hux, J.E., Trends in diabetes prevalence, incidence, andmortality in Ontario, Canada 1995–2005: A population-based study, Lancet,369, 750, 2007.
[6] Wormald, R., Epidemiology in practice: Screening for eye disease, Commu-nity Eye Health, 12, 29, 1999, http://www.jceh.co.uk (Accessed March 22,2007).
[7] Lee, S.J., Sicari, C., Harper, C.A., et al., Examination compliance and screen-ing for diabetic retinopathy: A two-year study, Clin Exp Ophthalmol, 28, 159,2000.
[8] Rhatigan, M.C., Leese, G.P., Ellis, J., et al., Blindness in patients with diabeteswho have been screened for eye disease, Eye, 13 ( Pt 2), 166, 1999.
[9] Moss, S.E., Klein, R., and Klein, B.E.K., Factors associated with having eyeexaminations in persons with diabetes, Arch Fam Med, 4, 529, 1995.
[10] Backlund, L.B., Algvere, P.V., and Rosenqvist, U., Early detection of diabeticretinopathy by a mobile retinal photography service working in partnershipwith primary health care teams, Diabet Med, 15(Suppl 3), S32, 1998.
[11] Keeffe, J., Screening for diabetic retinopathy. A planning and resource guide,2003, http://cera.unimelb.edu.au/publications/reports/screening for diabeticretinopathy.pdf.
[12] Garvican, L. and Scanlon, P.H., A pilot quality assurance scheme for diabeticretinopathy risk reduction programmes, Diabet Med, 21, 1066, 2004.
[13] Holland, W.W. and Stewart, S., Screening in Disease Prevention: Whatworks?, Radcliffe Publishing, Abingdon, 2005.
[14] Javitt, J.C., Aiello, L.P., Chiang, Y., et al., Preventive eye care in people withdiabetes is cost-saving to the federal government. implications for health-carereform, Diabetes Care, 17, 909, 1994.
[15] Scotland, G.S., McNamee, P., Philip, S., et al., Cost-effectiveness of imple-menting automated grading within the national screening programme for dia-betic retinopathy in Scotland, Br J Ophthalmol, 91, 1518, 2007.
[16] Hoffman, J.R., Wilkes, M.S., Day, F.C., et al., The roulette wheel: An aid toinformed decision making, PLoS Med, 3, e137, 2006.
[17] Galen, R.S. and Gambino, S.R., Beyond Normality: The Predictive Value andEfficiency of Medical Diagnoses, John Wiley, New York, 1975.

112 Automated Image Detection of Retinal Pathology
[18] Wilson, J.M.G. and Jungner, G., Principles and practice of screening for dis-ease, WHO, Geneva, Switzerland, Public Health Papers No. 34, 1968.
[19] Kristinsson, J.K., Diabetic retinopathy. screening and prevention of blindness:A doctoral thesis, Acta Ophthalmol Scand, 223(Suppl), 1, 1997.
[20] Olson, J., ed., Diabetic Retinopathy Screening Services in Scotland: A Train-ing Handbook, 2003, http://www.abdn.ac.uk/%7Eopt065/Web%20pages%20only/drh-25.htm (Accessed March 22, 2007).
[21] UK National Screening Committee, Essential elements in developing a dia-betic retinopathy screening programme. Workbook 4.2, 2007, January (up-dated March 2008) http://www.nscretinopathy.org.uk (Accessed June 20,2008).
[22] NHS Quality Improvement Scotland, Clinical standards for diabetic retino-pathy screening, 2004, http://www.nhsqis.org.uk/nhsqis/1287.html (AccessedMarch 22, 2007).
[23] Saine, P.J. and Tyler, M.E., Ophthalmic Photography: Retinal Photography,Angiography, and Electronic Imaging, Butterworth-Heinemann, Boston, 2nded., 2002.
[24] Saine, P.J. and Tyler, M.E., Practical Retinal Photography and Digital Imag-ing Techniques, Butterworth-Heinemann, Boston, 2003.
[25] British Diabetic Association, Guidelines on Screening for Diabetic Retinopa-thy, British Diabetic Association, London, 1999.
[26] Hutchinson, A., McIntosh, A., Peters, J., et al., Clinical guidelines and ev-idence review for type 2 diabetes: Diabetic retinopathy: Early manage-ment and screening, 2001, http://guidance.nice.org.uk/page.aspx?o=28676(Accessed March 22, 2007).
[27] Taube, A. and Tholander, B., Over- and underestimation of the sensitivity of adiagnostic malignancy test due to various selections of the study population,Acta Oncol, 29, 1, 1990.
[28] Scanlon, P.H., Malhotra, R., Thomas, G., et al., The effectiveness of screen-ing for diabetic retinopathy by digital imaging photography and technicianophthalmoscopy, Diabet Med, 20, 467, 2003.
[29] Scanlon, P.H., Malhotra, R., Greenwood, R., et al., Comparison of two ref-erence standards in validating two field mydriatic digital photography as amethod of screening for diabetic retinopathy, Br J Ophthalmol, 87, 1258,2003.
[30] Elandt-Johnson, R.C., Definition of rates: Some remarks on their use andmisuse, Am J Epidemiol, 102, 267, 1975.
[31] Barratt, A., Irwig, L.M., Glasziou, P.P., et al., Users’ guides to the medical

Finding a Role for Computer-Aided Early Diagnosis of Diabetic Retinopathy 113
literature: XVII. How to use guidelines and recommendations about screen-ing. Evidence-based medicine working group, JAMA, 281, 2029, 1999.
[32] Sackett, D.L., Haynes, R.B., Guyatt, G.H., et al., The selection of diagnostictests, in Clinical Epidemiology. A basic science for clinical medicine, Little,Brown, London, 51–68, 2nd ed., 1991.
[33] Zweig, M.H. and Campbell, G., Receiver-operating characteristic (ROC)plots. a fundamental evaluation tool in clinical medicine, Clin Chem, 39, 561,1993.
[34] von Wendt, G., Heikkila, K., and Summanen, P., Assessment of diabeticretinopathy using two-field 60 degrees fundus photography. a comparison be-tween red-free, black-and-white prints and colour transparencies, Acta Oph-thalmol Scand, 77, 638, 1999.
[35] Philip, S., Fleming, A.D., Goatman, K.A., et al., The efficacy of automated“disease/no disease” grading for diabetic retinopathy in a systematic screeningprogramme, Br J Ophthalmol, 91, 1512, 2007.
[36] Altman, D.G., Machin, D., Bryant, T.N., et al., eds., Statistics with Confi-dence, BMJ Books, London, UK, 2nd ed., 2000.
[37] Agresti, A., Dealing with discreteness: Making “exact” confidence intervalsfor proportions, differences of proportions, and odds ratios more exact, StatMethod Med Res, 12, 3, 2003.
[38] Bachmann, L.M., Puhan, M.A., ter Riet, G., et al., Sample size of studies ondiagnostic accuracy: Literature survey, BMJ, 332, 1127, 2006.
[39] Slattery, J., Sampling for quality assurance of grading decisions in diabeticretinopathy screening: Designing the system to detect errors, Int J HealthCare Qual Assur, 18, 113, 2005.
[40] Metz, C.E., ROC methodology in radiologic imaging, Invest Radiol, 21, 720,1986.
[41] Swets, J.A. and Pickett, R.M., Evaluation of Diagnostic Systems: Methodsfrom signal detection theory, Academic Press, New York, 1982.
[42] Shapiro, D.E., The interpretation of diagnostic tests, Stat Methods Med Res,8, 113, 1999.
[43] Pepe, M.S., The Statistical Evaluation of Medical Tests for Classification andPrediction, Oxford University Press, New York, 2003.
[44] Zhou, X.H., McClish, D.K., and Obuchowski, N.A., Statistical Methods inDiagnostic Medicine, Wiley, New York, 2002.
[45] Harbord, R.M., Deeks, J.J., Egger, M., et al., A unification of models formeta-analysis of diagnostic accuracy studies, Biostatistics, 8, 239, 2007.

114 Automated Image Detection of Retinal Pathology
[46] DeLuca, J., ed., Fatigue as a Window to the Brain, The MIT Press, Cambridge,London, 2005.
[47] Sharp, P.F., Olson, J., Strachan, F., et al., The value of digital imaging indiabetic retinopathy, Health Technol Assess, 7(30), 1, 2003.
[48] Scanlon, P.H., Foy, C., Malhotra, R., et al., The influence of age, durationof diabetes, cataract, and pupil size on image quality in digital photographicretinal screening, Diabetes Care, 28, 2448, 2005.
[49] Ege, B.M., Hejlesen, O.K., Larsen, O.V., et al., The relationship between ageand colour content in fundus images, Acta Ophthalmol Scand, 80, 485, 2002.
[50] Niemeijer, M., van Ginnekan, B., Russell, S.R., et al., Automated detectionand differentiation of drusen, exudates, and cotton-wool spots in digital colorfundus photographs for diabetic retinopathy diagnosis, Invest Ophthalmol VisSci, 48, 2260, 2007.
[51] Basu, A., Digital image compression should be limited in diabetic retinopathyscreening, J Telemed Telecare, 12, 163, 2006.
[52] Costen, M.T.J., Newsom, R.S.B., Parkin, B., et al., Effect of video display onthe grading of diabetic retinopathy, Eye, 18, 169, 2004.
[53] Klein, R., Screening interval for retinopathy in type 2 diabetes, Lancet, 361,190, 2003.
[54] World Health Organization Europe, European Region of International Dia-betes Federation, The St. Vincent Declaration 1989, Diabet Med, 7, 36, 1990.
[55] Agardh, E., Agardh, C.D., and Hansson-Lundblad, C., The five-year incidenceof blindness after introducing a screening programme for early detection oftreatable diabetic retinopathy, Diabet Med, 10, 555, 1993.
[56] Kristinsson, J.K., Hauksdottir, H., Stefansson, E., et al., Active prevention indiabetic eye disease. A 4-year follow-up, Acta Ophthalmol Scand, 75, 249,1997.
[57] Backlund, L.B., Algvere, P.V., and Rosenqvist, U., New blindness in diabetesreduced by more than one-third in Stockholm County, Diabet Med, 14, 732,1997.
[58] Arun, C.S., Ngugi, N., Lovelock, L., et al., Effectiveness of screening in pre-venting blindness due to diabetic retinopathy, Diabet Med, 20, 186, 2003.
[59] Frisen, L., Clinical Tests of Vision, Raven Press, New York, 1990.
[60] Olafsdottir, E., Andersson, D.K., and Stefansson, E., Visual acuity in a popu-lation with regular screening for type 2 diabetes mellitus and eye disease, ActaOphthalmol Scand, 85, 40, 2007.
[61] Bandurska-Stankiewicz, E. and Wiatr, D., Diabetic blindness significantly

Finding a Role for Computer-Aided Early Diagnosis of Diabetic Retinopathy 115
reduced in the Warmia and Mazury Region of Poland: Saint Vincent Dec-laration targets achieved, Eur J Ophthalmol, 16, 722, 2006.
[62] Kohner, E.M., Stratton, I.M., Aldington, S.J., et al., Microaneurysms in thedevelopment of diabetic retinopathy (UKPDS 42), Diabetologia, 42, 1107,1999.
[63] Hove, M.N., Kristensen, J.K., Lauritzen, T., et al., The relationships betweenrisk factors and the distribution of retinopathy lesions in type 2 diabetes, ActaOphthalmol Scand, 84, 619, 2006.
[64] Walter, T., Klein, J.C., Massin, P., et al., A contribution of image processing tothe diagnosis of diabetic retinopathy — detection of exudates in color fundusimages of the human retina, IEEE Trans Med Imaging, 21, 1236, 2002.
[65] Fleming, A.D., Philip, S., Goatman, K.A., et al., Automated detection of exu-dates for diabetic retinopathy screening, Phys Med Biol, 52, 7385, 2007.
[66] Larsen, M., Gondolf, T., Godt, J., et al., Assessment of automated screeningfor treatment-requiring diabetic retinopathy, Curr Eye Res, 32, 331, 2007.
[67] Gehrs, K.M., Anderson, D.H., Johnson, L.V., et al., Age-related macular de-generation — emerging pathogenetic and therapeutic concepts, Ann Med, 38,450, 2006.
[68] Sarraf, D., Gin, T., Yu, F., et al., Long-term drusen study, Retina, 19, 513,1999.
[69] Voo, I., Mavrofrides, E.C., and Puliafito, C.A., Clinical applications of opticalcoherence tomography for the diagnosis and management of macular diseases,Ophthalmol Clin North Am, 17, 21, 2004.
[70] Goatman, K.A., A reference standard for the measurement of macularoedema, Br J Ophthalmol, 90, 1197, 2006.
[71] McDonald, H.R., Williams, G.A., Scott, I.U., et al., Laser scanning imagingfor macular disease: A report by the American Academy of Ophthalmology,Ophthalmol, 114, 1221, 2007.
[72] Srinivasan, V.J., Wojtkowski, M., Witkin, A.J., et al., High-definition and3-dimensional imaging of macular pathologies with high-speed ultrahigh-resolution optical coherence tomography, Ophthalmol, 113, 2054, 2006.
[73] Funatsu, H., Yamashita, H., Ohashi, Y., et al., Effect of rapid glycemic controlon progression of diabetic retinopathy, Jpn J Ophthalmol, 36, 356, 1992.
[74] Oyibo, S.O., Prasad, Y.D., Jackson, N.J., et al., The relationship betweenblood glucose excursions and painful diabetic peripheral neuropathy: A pi-lot study, Diabet Med, 19, 870, 2002.
[75] Patton, N., Aslam, T.M., MacGillivray, T., et al., Retinal image analysis. Con-cepts, applications and potential, Prog Retin Eye Res, 25, 99, 2006.

116 Automated Image Detection of Retinal Pathology
[76] Nguyen, T.T. and Wong, T.Y., Retinal vascular manifestations of metabolicdisorders, Trends Endocrinol Metab, 17, 262, 2006.
[77] Feinstein, A.R., Misguided efforts and future challenges for research on “di-agnostic tests,” J Epidemiol Community Health, 56, 330, 2002.
[78] Deeks, J., Systematic reviews of evaluations of diagnostic and screening tests,in Systematic Reviews in Health Care: meta-analysis in context, M. Egger,G. Davey-Smith, and D. Altman, eds., BMJ Publ., London, 248–282, 2nd ed.,2001.
[79] Greenhalgh, T., How to Read a Paper, Blackwell BMJ Books, Oxford, 3rded., 2006.
[80] Whiting, P., Rutjes, A.W., Reitsma, J.B., et al., The development of QUADAS:A tool for the quality assessment of studies of diagnostic accuracy includedin systematic reviews, BMC Med Res Methodol, 3, 25, 2003, http://www.biomedcentral.com/1471-2288/3/25.
[81] Whiting, P., Rutjes, A.W.S., Dinnes, J., et al., Development and valida-tion of methods for assessing the quality of diagnostic accuracy studies,Health Technol Assess, 8(25), 2004, http://www.hta.nhsweb.nhs.uk/fullmono/mon825.pdf.
[82] Whiting, P.F., Weswood, M.E., Rutjes, A.W., et al., Evaluation of QUADAS,a tool for the quality assessment of diagnostic accuracy studies, BMC MedRes Methodol, 9, 2006, http://www.biomedcentral.com/1471-2288/6/9.
[83] Larsen, M., Godt, J., Larsen, N., et al., Automated detection of fundus photo-graphic red lesions in diabetic retinopathy, Invest Ophthalmol Vis Sci, 44, 761,2003.
[84] Larsen, N., Godt, J., Grunkin, M., et al., Automated detection of diabeticretinopathy in a fundus photographic screening population, Invest OphthalmolVis Sci, 44, 767, 2003.
[85] Hansen, A.B., Hartvig, N.V., Jensen, M.S., et al., Diabetic retinopathy screen-ing using digital non-mydriatic fundus photography and automated imageanalysis, Acta Ophthalmol Scand, 82, 666, 2004.
[86] Bouhaimed, M., Gibbins, R., and Owens, D., Automated detection of diabeticretinopathy: results of a screening study, Diabetes Technol Ther, 10, 142,2008.
[87] Hoover, A. and Goldbaum, M., Locating the optic nerve in a retinal imageusing the fuzzy convergence of the blood vessels, IEEE Trans Med Imaging,22, 951, 2003.
[88] Fleming, A.D., Philip, S., Goatman, K., et al., Automated microaneurysmdetection using local contrast normalization and local vessel detection, IEEETrans Med Imaging, 25, 1223, 2006.

Finding a Role for Computer-Aided Early Diagnosis of Diabetic Retinopathy 117
[89] Swensson, R.G., Unified measurement of observer performance in detectingand localizing target objects on images, Med Phys, 23, 1709, 1996.
[90] Goatman, K.A., Cree, M.J., Olson, J.A., et al., Automated measurement ofmicroaneurysm turnover, Invest Ophthalmol Vis Sci, 44, 5335, 2003.
[91] Fleming, A.D., Philip, S., Goatman, K.A., et al., Automated assessment ofdiabetic retinal image quality based on clarity and field definition, Invest Oph-thalmol Vis Sci, 47, 1120, 2006.
[92] Fleming, A.D., Goatman, K.A., Philip, S., et al., Automatic detection of reti-nal anatomy to assist diabetic retinopathy screening, Phys Med Biol, 52, 331,2007.
[93] Bossuyt, P.M., Reitsma, J.B., Bruns, D.E., et al., Towards complete and accu-rate reporting of studies of diagnostic accuracy: The STARD initiative, BMJ,326, 41, 2003.
[94] Bossuyt, P.M., Reitsma, J.B., Bruns, D.E., et al., The STARD statement forreporting studies of diagnostic accuracy: Explanation and elaboration, ClinChem, 49, 7, 2003.
[95] Knottnerus, J.A., ed., The Evidence Base of Clinical Diagnosis, BMJ Books,London, 2002.
[96] Early Treatment Diabetic Retinopathy Study Research Group, Fundus pho-tographic risk factors for progression of diabetic retinopathy. ETDRS reportnumber 12, Ophthalmology, 98, 823, 1991.
[97] Early Treatment Diabetic Retinopathy Study Research Group, Grading dia-betic retinopathy from stereoscopic color fundus photographs: An extensionof the modified Airlie House classification. ETDRS report number 10, Oph-thalmology, 98(suppl), 786, 1991.
[98] Wilkinson, C.P., Ferris, III, F.L., Klein, R.E., et al., Proposed internationalclinical diabetic retinopathy and diabetic macular edema disease severityscales, Ophthalmology, 110, 1677, 2003.
[99] Knudsen, L.L., Lervang, H.H., Lundbye-Christensen, S., et al., The NorthJutland County Diabetic Retinopathy Study: Population characteristics, Br JOphthalmol, 90, 1404, 2006.
[100] American College of Radiology, Breast Imaging Reporting and Data System.,American College of Radiology, Reston, Virginia, 1995.
[101] Kraemer, H.C., Evaluating Medical Tests: Objective and Quantitative Guide-lines, Sage Publ., Newsbury Park, CA, 1992.
[102] Early Treatment Diabetic Retinopathy Study Research Group, Manual of Op-erations, (chapter 13), 1995, available from: National Technical InformationService, 52285 Port Royal Road, Springfield, VA 22161; Accession No. PB85

118 Automated Image Detection of Retinal Pathology
223006/AS Chapter 13, 1995.
[103] Aldington, S., Kohner, E., Meuer, S., et al., Methodology for retinal pho-tography and assessment of diabetic retinopathy — the EURODIAB IDDMComplications Study, Diabetologia, 38(437-444), 1995.
[104] Knudsen, L.L. and Skriver, K., A 3-dimensional evaluation of the macularregion: Comparing digitized and film-based media with a clinical evaluation,Acta Ophthalmol Scand, 84, 296, 2006.
[105] Swinscow, T.D.V. and Campbell, M., Statistics at Square One, BMJ Books,London, 10th ed., 2003.
[106] Svensson, E., Ordinal invariant measures for individual and group changes inordered categorical data, Stat Med, 17, 2923, 1998.
[107] Morris, D., Fraser, S., and Wormald, R., Masking is better than blinding, BMJ,334, 799, 2007.
[108] Begg, C.B., Biases in the assessment of diagnostic tests, Stat Med, 6, 411,1987.
[109] Begg, C.B., Greenes, R.A., and Iglewicz, B., The influence of uninterpretabil-ity on the assessment of diagnostic tests, J Chron Dis, 39, 575, 1986.
[110] Irwig, L., Bossuyt, P., Glasziou, P., et al., Designing studies to ensure thatestimates of test accuracy are transferable, BMJ, 324, 669, 2002.
[111] Kohner, E.M. and Dollery, C.T., The rate of formation and disappearance ofmicroaneurysms in diabetic retinopathy, Eur J Clin Invest, 1, 167, 1970.
[112] Whiting, P., Rutjes, A.W.S., Reitsma, J.B., et al., Sources of variation and biasin studies of diagnostic accuracy. A systematic review, Ann Intern Med, 140,189, 2004.
[113] Lantz, C.A. and Nebenzahl, E., Behavior and interpretation of the κ statistic:Resolution of the two paradoxes, J Clin Epidemiol, 49, 431, 1996.
[114] Pocock, S.J., Clinical Trials: A Practical Approach, John Wiley, Chichester,1983.
[115] Hall, F.M., Breast imaging and computer-aided detection, N Engl J Med, 356,1464, 2007.
[116] Thurfjell, E.L., Lernevall, K.A., and Taube, A.A., Benefit of independent dou-ble reading in a population-based mammography screening program, Radiol-ogy, 191, 241, 1994.
[117] Elmore, J.G., Nakano, C.Y., Koepsell, T.D., et al., International variationin screening mammography interpretations in community-based programs, JNatl Cancer Inst, 95, 1384, 2003.
[118] Fenton, J.J., Taplin, S.H., Carney, P.A., et al., Influence of computer-aided

Finding a Role for Computer-Aided Early Diagnosis of Diabetic Retinopathy 119
detection on performance of screening mammography, N Engl J Med, 356,1399, 2007.
[119] Lee, S.C., Lee, E.T., Wang, Y., et al., Computer classification of nonprolifera-tive diabetic retinopathy, Arch Ophthalmol, 123, 759, 2005.
[120] Guyatt, G.H., Oxman, A.D., Kunz, R., et al., Incorporating considerations ofresources use into grading recommendations, BMJ, 336, 1170, 2008.
[121] Schunemann, H.J., Oxman, A.D., Brozek, J., et al., Grading quality of ev-idence and strength of recommendations for diagnostic tests and strategies,BMJ, 336, 1106, 2008.
[122] Guyatt, G.H., Oxman, A.D., Kunz, R., et al., Going from evidence to recom-mendations, BMJ, 336, 1049, 2008.
[123] Guyatt, G.H., Oxman, A.D., Kunz, R., et al., What is “quality of evidence”and why is it important to clinicians? BMJ, 336, 995, 2008.
[124] Guyatt, G.H., Oxman, A.D., Vist, G.E., et al., GRADE: an emerging consen-sus on rating quality of evidence and strength of recommendations, BMJ, 336,924, 2008.

120 Automated Image Detection of Retinal Pathology
4.A Appendix: Measures of Binary Test Performance
Test
resu
ltDisease
Present Absent
pos. a b
neg. c d
True positives Correct positive test result: a = number of diseased persons with apositive test result.
True negatives Correct negative test results: d = number of nondiseased personswith a negative test result.
False positives Incorrect positive test result: b =number of nondiseased personswith a positive test result.
False negatives Incorrect negative test result: c = number of diseased persons witha negative test result.
Sensitivity (a/(a + c)) proportion of people with the target disorder who have apositive test result. Known as true positive fraction (TPF).
Specificity (d/(b+d)) proportion of people without the target disorder who have anegative test result. False positive fraction, FPF = (1− specificity).
Positive predictive value (PPV) the probability of disease among all persons witha positive test result. PPV = a/(a+b).
Negative predictive value (NPV) the probability of nondisease among all personswith a negative test result. NPV = d/(c+d).

5Retinal Markers for Early Detection of EyeDisease
Alireza Osareh
CONTENTS
5.1 Abstract . . . . . . . . . . . . . . . . . . . . . . . . . . . . . . . . . . . . . . . . . . . . . . . . . . . . . . . . . . . . . . . . . . . 1215.2 Introduction . . . . . . . . . . . . . . . . . . . . . . . . . . . . . . . . . . . . . . . . . . . . . . . . . . . . . . . . . . . . . . . 1225.3 Nonproliferative Diabetic Retinopathy . . . . . . . . . . . . . . . . . . . . . . . . . . . . . . . . . . . . . 1235.4 Chapter Overview . . . . . . . . . . . . . . . . . . . . . . . . . . . . . . . . . . . . . . . . . . . . . . . . . . . . . . . . . 1245.5 Related Works on Identification of Retinal Exudates and the Optic Disc . . . . 1285.6 Preprocessing . . . . . . . . . . . . . . . . . . . . . . . . . . . . . . . . . . . . . . . . . . . . . . . . . . . . . . . . . . . . 1325.7 Pixel-Level Exudate Recognition . . . . . . . . . . . . . . . . . . . . . . . . . . . . . . . . . . . . . . . . . . 1345.8 Application of Pixel-Level Exudate Recognition on the Whole Retinal Image 1375.9 Locating the Optic Disc in Retinal Images . . . . . . . . . . . . . . . . . . . . . . . . . . . . . . . . . 1395.10 Conclusion . . . . . . . . . . . . . . . . . . . . . . . . . . . . . . . . . . . . . . . . . . . . . . . . . . . . . . . . . . . . . . . . 148
References . . . . . . . . . . . . . . . . . . . . . . . . . . . . . . . . . . . . . . . . . . . . . . . . . . . . . . . . . . . . . . . . 150
5.1 AbstractDiabetic retinopathy (DR) is a severe and widely spread eye disease that can beregarded as manifestation of diabetes on the retina. Screening to detect retinopathydisease can lead to successful treatments in preventing visual loss. Intraretinal fatty(hard) exudates are a visible sign of diabetic retinopathy and also a marker for thepresence of coexistent retinal edema.
Detecting retinal exudate lesions in a large number of images generated by screen-ing programs is very expensive in professional time and open to human error. Thus,we explore the benefits of developing an automated decision support system for thepurpose of detecting and classifying exudate pathologies of diabetic retinopathy. Theretinal images are automatically analyzed in terms of pixel resolution and an assess-ment of the level of retinopathy is derived.
Following some key preprocessing steps, color retinal image pixels are classifiedto exudate and nonexudate classes. K nearest neighbor, Gaussian quadratic, and
121

122 Automated Image Detection of Retinal Pathology
Gaussian mixture model classifiers are investigated within the pixel-level exudaterecognition framework.
The location of the optic disc is of critical importance in retinal image analysisand is required as a prerequisite stage of exudate detection. Thus, we also addressoptic disc localization both to improve the overall diagnostic accuracy by maskingthe false positive optic disc regions from the other sought exudates and to measure itsboundary precisely. We develop a method based on color mathematical morphologyand active contours to accurately localize the optic disc region.
5.2 IntroductionDiabetes is an increasing health problem, both in the United Kingdom and the rest ofthe world. Approximately 1.4 million people in the United Kingdom are knownto have diabetes [1]. One of the most feared complications of diabetes is dam-age to the eye. It is estimated that people with diabetes have a 25 times greaterrisk of going blind than the nondiabetic population. Each year around 12% of pa-tients in the United Kingdom who are registered blind have diabetic eye disease asa cause. Diabetic retinopathy is the leading cause of blindness in the populationof working age in the United Kingdom and developed nations, and is of increasingimportance in developing nations [2]. Everyone who has diabetes is at risk for de-veloping DR, but not everyone develops it. It is estimated that at any time around10% of patients with diabetes will have DR requiring appropriate treatment [3]. Thegreat majority of DR complications can be prevented with proper examination andtreatment.
The chemical changes caused by diabetes affect retinal capillaries (the smallestblood vessels linking arteries to veins). This progressive damage is called diabeticretinopathy and occurs due to a combination of micro-vascular leakage and micro-vascular occlusion.
DR is conventionally classified according to the presence of clinical lesions indi-cating leakage or occlusion, and their position in the eye. The three main forms areknown as nonproliferative retinopathy, maculopathy, and proliferative retinopathy.
The form of DR caused by micro-vascular leakage away from the macula is callednonproliferative diabetic retinopathy (NPDR) [4], and is shown by the presenceof sacculations from the capillary walls (microaneurysms), blood (retinal hemor-rhages), lipid exudates (hard exudates), and retinal edema. This stage of the diseaseoften has no obvious warning signs and patients are unaware that they suffer fromthe disease until it progresses into more severe levels. Detection at this stage — oneof the purposes of this work — may allow treatment to prevent future complications
When this microvascular leakage of edema, blood, and lipid occurs in the centralregion of the retina (the macula), it results in blurred vision, and is called diabeticmaculopathy. Macular edema [4] is the most common cause of decreased visionin patients with nonproliferative DR. Less often, microvascular occlusion can also

Retinal Markers for Early Detection of Eye Disease 123
occur at the macula causing impaired vision because of an inadequate blood supply tothat area (it has few clinical signs and is not usually treatable). Sometimes, there areextensive areas of microvascular occlusion throughout the retina. The retinal tissue,which depends on those vessels for its nutrition, releases a vasoproliferative factorstimulating the growth of new abnormal blood vessels where the normal capillarieshave already closed. This form of DR caused by closure of capillaries and growthof new vessels is named proliferative diabetic retinopathy. It may result in bleedinginto the cavity of the eye and scarring with loss of vision.
5.3 Nonproliferative Diabetic RetinopathyNonproliferative diabetic retinopathy (NPDR) is the most common type of diabeticretinopathy, accounting for approximately 80% of all patients. It can develop at anypoint in time after the onset of diabetes. A qualified practitioner, such as a generalophthalmologist, may detect these changes by examining the patient’s retina. Thephysician looks for spots of bleeding, lipid exudation, or areas of retinal swellingcaused by the leakage of edema, and will be more concerned if such lesions arefound near the central retina (macula), when vision may become affected. Accu-rate assessment of retinopathy severity requires the ability to detect and record thefollowing clinical features:
Microaneurysms: The earliest clinically recognizable characteristics of DR aremicroaneurysms. Retinal microaneurysms are focal dilatations of retinal capillaries.They are about 10 to 100 microns in diameter and appear as small, round, darkred dots on the retinal surface (see Figure 2.2(b) of Chapter 2) [2]. The number ofmicroaneurysms increases as the degree of retinal involvement progresses.
Hemorrhages: As the degree of retinopathy advances retinal hemorrhages becomeevident. Retinal hemorrhages appear either as small red dots or blots indistinguish-able from microaneurysms or as larger flame-shaped hemorrhages (Figure 2.2(c)).As the retinal vessels become more damaged and leaky, their numbers increase.
Hard Exudates: Among lesions caused by DR, exudates are one of the most com-monly occurring lesions. They are associated with patches of vascular damage withleakage. The size and distribution of exudates may vary during the progress of thedisease. Hard exudates represent leakage from surrounding capillaries and microa-neurysms within the retina. If the lipid extends into the macula area, vision canbe severely compromized. Exudates are typically manifested as random yellow-ish/white patches of varying sizes, shapes, and locations [2]. These are either seenas individual spots, clusters, or are found in large rings around leaking capillaries(Figures 2.2(a) and (b)). Although exudates may absorb spontaneously, they usuallytend to increase in volume in an untreated retina. Occasionally, they may be con-fused with drusen (seen in age-related macular degeneration), which appear moreregularly distributed at the macula.

124 Automated Image Detection of Retinal Pathology
The detection and quantification of exudates will significantly contribute to themass screening and assessment of NPDR.
Cotton Wool Spots: Cotton wool spots represent a transitional stage betweenNPDR or maculopathy, and proliferative retinopathy. These abnormalities usuallyappear as little fluffy round or oval areas in the retina with a whitish color, usuallyadjacent to an area of hemorrhage (Figure 2.2(b)). Cotton wool spots come aboutdue to the swelling of the surface layer of the retina, which consists of nerve fibers.This swelling occurs because the blood supply to that area has been impaired andin the absence of normal blood flow through the retinal vessels, the nerve fibers areinjured in a particular location resulting in swelling and the appearance of a cottonwool spot [5].
If NPDR is not heeded and blood sugars are not controlled, the two later stages ofdamage to the eye may occur, i.e., diabetic maculopathy and proliferative retinopa-thy.
5.4 Chapter OverviewThe application of digital imaging to ophthalmology has now provided the possibilityof processing retinal images to assist clinical diagnosis and treatment. Retinal imageanalysis remarkably improves the diagnostic value of these images. In fact, withthe advent of better and inexpensive ophthalmic imaging devices, along with therapid growth of proper software for identifying those at risk of developing DR, aswell as the reduction in costs and increase in computational power of computers,an advanced and cost-effective fundus image analysis system can be developed toassist ophthalmologists to make the diagnosis more efficiently. Such a system shouldbe able to detect early signs of nonproliferative retinopathy and provide objectivediagnosis based on some criteria defined by the ophthalmologists.
Intraretinal fatty exudates are a visible sign of DR and also a marker for the pres-ence of co-existent retinal edema. If present in the macular area, edema and exudatesare a major cause of visual loss in the nonproliferative forms of DR. Retinal edemaand exudates in the central area are the clinical signs most closely linked with treat-able visual loss.
Here, we have concentrated on detecting exudates as the prime marker because it islikely that accumulating exudates is always associated with retinal edema, and unlikeedema, exudates are more visible in color retinal photographs. Detecting exudates inthe retina in a large number of images generated by screening programs, which needto be repeated at least annually, is very expensive in professional time and open tohuman error. Thus, the main objective of the investigation described in this work isto contribute novel methods to quantitatively diagnose and classify exudate lesionsin color retinal images from nonproliferative DR screening programs.
The optic disc is the entrance and exit region of blood vessels and optic nerves tothe retina, and its localization and segmentation is an important task in an automated

Retinal Markers for Early Detection of Eye Disease 125
retinal image analysis system. Indeed, optic disc localization is required as a prereq-uisite for the subsequent stages in most algorithms applied for identification of theanatomical structures and pathologies in retinal images. Since optic disc localiza-tion is also indispensable to our exudates identification task, another objective is todevelop a technique for optic disc localization and segmentation.
The overall scheme of the methods used in this work is shown in Figure 5.1. Theinput color retinal image is analyzed automatically and an assessment of the levelof retinopathy disease is derived after analysis. The proposed method will then beable to choose diabetic patients who need further examination. In addition to theexudate detection we will also quantify the areas of exudate lesions in a pixel-basedscheme. This will allow numerous measurements to be made of the deterioration inthe condition over time.
In the first stage of the work, as shown at the top of Figure 5.1, we put our datathrough two preprocessing steps. Typically, there is a wide variation in the color ofthe fundus from different patients, strongly correlated to skin pigmentation and iriscolor. Hence, the first step is to normalize the color of the images. In the secondstep, the contrast between the exudates and retinal background is enhanced to facil-itate later classification and segmentation. The contrast is not sufficient due to theinternal attributes of exudate lesions and decreasing color saturation, especially inthe peripheral retina.
Once the images have been preprocessed, exudate lesions can be identified auto-matically using our proposed pixel-level exudate recognition approach. Then, thediagnostic accuracy of this method is compared in terms of pixel resolution andimage-based criteria against a provided pixel-level ground truth dataset. Here, weintroduce two main criteria for assessing the diagnostic accuracy of our exudate de-tection techniques, i.e., lesion-based and image-based (Figure 5.2).
In lesion-based criteria each single exudate lesion is regarded as an individual con-nected region, where this region can be comprized of one or more pixels. Each ab-normal retinal image can be segmented into a number of exudate regions. By consid-ering a set of retinal images and applying an appropriate segmentation/classificationtechnique, a dataset of exudate regions will be created. Then, the lesion-based accu-racy can be measured in terms of lesion sensitivity and specificity by comparing thegained results against ophthalmologists’ outline of the lesions.
The lesion-based accuracy can be assessed either in a pixel resolution (Figure 5.2)basis or alternatively using a bigger collection of pixels, e.g., 10×10 patches (patchresolution). Although creating an accurate pixel-based ground truth by the physicianis not an easy task, a pixel resolution comparison of the results is more precise thanusing patch resolution, as a pixel patch may only partially cover exudate pixels. Thus,the effect of misclassification errors for individual patches (exudates/nonexudates)should be taken into consideration when the performance is not measured based onpixel resolution.
In image-based diagnostic based assessment, the objective is to provide a logicalpredicate of the condition of the analyzed image. In this case, each image is exam-ined and a decision is made to illustrate whether the image has some evidence of DR,purely based on the absence or presence of exudates anywhere in the image. Hence,

126 Automated Image Detection of Retinal Pathology
z
Q
z
FIGURE 5.1The outline of the proposed system for automatic identification of retinal exudatesand the optic disc in color retinal images. (See color insert following page 174.)

Retinal Markers for Early Detection of Eye Disease 127
Retinal Image
Region-level exudate recognition Pixel-level exudate recognition
Lesion-based Image-based
Patch resolution
Pixel resolution
Lesion-based Image-based
Pixel resolution
Figure 3: The stages in the scheme developed to identify the retinal exudates and different diagnostic accuracy criteria which can be used to assess the results.
FIGURE 5.2The stages in the scheme developed to identify the retinal exudates and differentdiagnostic accuracy criteria that can be used to assess the results.
the system’s global image-based accuracy can be measured using a proportion ofthe tested normal-abnormal images to the number of images, which are correctlyidentified.
Three classifiers, K nearest neighbor (KNN), Gaussian quadratic (GQ), and Gaus-sian mixture model (GMM), are investigated within the pixel-level exudate recog-nition framework. Each classifier is trained and tested against four different pixeldatasets of exudates and nonexudates. We consider separate GMMs to estimate thedistribution of each class, i.e., exudates and nonexudates, and combine the modelsinto a classifier through Bayesian theory. The GMM parameters are extracted bymeans of the expectation-maximization algorithm. To select an appropriate numberof Gaussian components the minimum description length criterion is applied. Theoptimum GMM classifier is used to evaluate the effectiveness of our proposed ap-proach by assessing the image-based accuracy of the system on a population of 67unseen retinal images.
During our initial exudate lesion identification (pixel-level exudate recognition),false positive exudate candidates arise due to other pale objects including light re-flection artifacts, cotton wool spots, and most significantly, the optic disc. The opticdisc is detected as candidate exudate pixels/regions due to the similarity of its colorto the exudates. To mask the false positive optic disc pixels/regions from the otherexudate lesions, and due to the critical importance of location of the optic disc, wealso address optic disc localization and segmentation problem with different levelsof accuracy. Two techniques are investigated including template matching and activecontours (snakes).
The first strategy provides an approximate location of the optic disc center. How-ever, the optic disc can sometimes have an elliptical shape, and thus baseline plottingof the exact boundaries is important. Consequently, a snake-based technique is de-
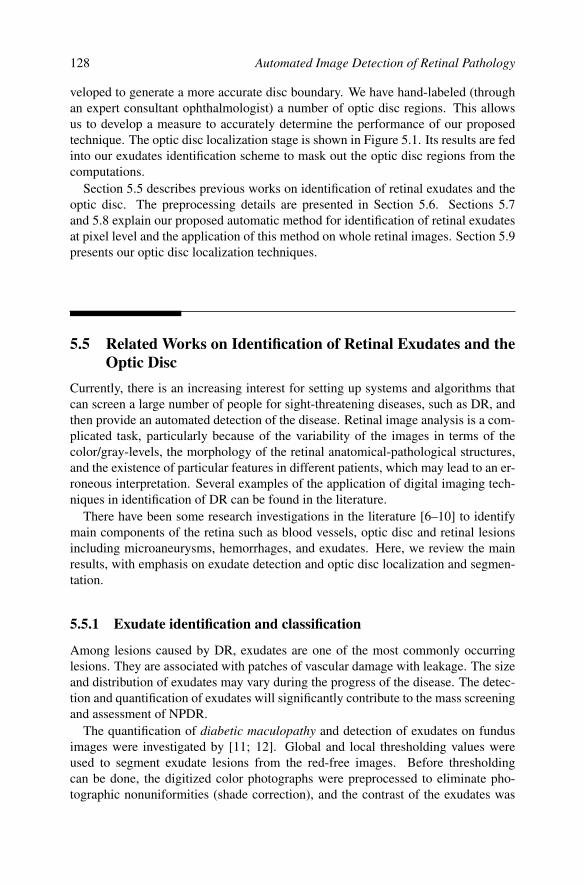
128 Automated Image Detection of Retinal Pathology
veloped to generate a more accurate disc boundary. We have hand-labeled (throughan expert consultant ophthalmologist) a number of optic disc regions. This allowsus to develop a measure to accurately determine the performance of our proposedtechnique. The optic disc localization stage is shown in Figure 5.1. Its results are fedinto our exudates identification scheme to mask out the optic disc regions from thecomputations.
Section 5.5 describes previous works on identification of retinal exudates and theoptic disc. The preprocessing details are presented in Section 5.6. Sections 5.7and 5.8 explain our proposed automatic method for identification of retinal exudatesat pixel level and the application of this method on whole retinal images. Section 5.9presents our optic disc localization techniques.
5.5 Related Works on Identification of Retinal Exudates and theOptic Disc
Currently, there is an increasing interest for setting up systems and algorithms thatcan screen a large number of people for sight-threatening diseases, such as DR, andthen provide an automated detection of the disease. Retinal image analysis is a com-plicated task, particularly because of the variability of the images in terms of thecolor/gray-levels, the morphology of the retinal anatomical-pathological structures,and the existence of particular features in different patients, which may lead to an er-roneous interpretation. Several examples of the application of digital imaging tech-niques in identification of DR can be found in the literature.
There have been some research investigations in the literature [6–10] to identifymain components of the retina such as blood vessels, optic disc and retinal lesionsincluding microaneurysms, hemorrhages, and exudates. Here, we review the mainresults, with emphasis on exudate detection and optic disc localization and segmen-tation.
5.5.1 Exudate identification and classification
Among lesions caused by DR, exudates are one of the most commonly occurringlesions. They are associated with patches of vascular damage with leakage. The sizeand distribution of exudates may vary during the progress of the disease. The detec-tion and quantification of exudates will significantly contribute to the mass screeningand assessment of NPDR.
The quantification of diabetic maculopathy and detection of exudates on fundusimages were investigated by [11; 12]. Global and local thresholding values wereused to segment exudate lesions from the red-free images. Before thresholdingcan be done, the digitized color photographs were preprocessed to eliminate pho-tographic nonuniformities (shade correction), and the contrast of the exudates was

Retinal Markers for Early Detection of Eye Disease 129
then enhanced. The lesion-based sensitivity of the exudate identification techniquewas reported between 61% and 100% (mean 87%) [12].
In [13] an algorithm was applied to detect and measure exudates in fundus images.A fundus transparency was imaged, digitized, and then preprocessed to reduce shadevariations in the image background and enhance the contrast between the backgroundand the exudate lesions. Exudates were then separated from the background on abrightness or gray-level basis. The proposed technique required user intervention forselecting the threshold value.
In [6] a prototype was presented on automated diagnosis and understanding ofretinal images. The system used images with a field of view of 10 or 60 to rec-ognize the bright objects including exudates, cotton wool spots, drusen, and scars.Different features like color, texture, and compactness were used within the classifi-cation stage. This method achieved a lesion-based accuracy of 89% for identificationof the bright objects.
Ege et al. [14] located the optic disc, fovea, and four red and yellow abnormalities(microaneurysms, hemorrhages, exudates, and cotton wool spots) in 38 color fun-dus images, which were previously graded by an ophthalmologist. The abnormali-ties were detected using a combination of template matching, region growing, andthresholding techniques. 87% of exudates were detected during the first stage whilethe detection rate for the cotton wool spots was up to 95% in terms of the lesion-basedcriterion. Following preliminary detection of the abnormalities, a Bayesian classi-fier was engaged to classify the yellow lesions into exudates, cotton wool spots, andnoise. The classification performance for this stage was only 62% for exudates and52% for the cotton wool spots.
Wang et al. [15] addressed the same problem by using a minimum distance dis-criminant classifier to categorize each pixel into yellow lesion (exudates, cotton woolspots) or nonlesion (vessels and background) class. The objective was to distinguishyellow lesions from red lesions, therefore other yellowish lesions (e.g. cotton woolspots) were incorrectly classified at the same time. The image-based diagnostic ac-curacy of this approach was reported as 100% sensitivity and 70% specificity.
In addition to the discussed techniques, neural networks have also been exploitedto classify the retinal abnormalities in a few studies. Gardner et al. [16] broke downthe retinal images into small squares and then presented them to a back propagationneural network. After median smoothing, the photographed red-free images witha field-of-view of 60 were fed directly into a large neural network (using 20× 20patches, with 400 inputs). This technique recognized the blood vessels, exudates,and hemorrhages. The neural network was trained for 5 days and the lesion-basedsensitivity of the exudate detection method was 93.1%. This performance was theresult of classifying the whole 20× 20 pixel patches rather than a pixel resolutionclassification.
Walter et al. [17] identified exudates from the green channel of retinal images,according to their gray-level variation. After initial localization, the exudate con-tours were subsequently determined by mathematical morphology techniques. Thisapproach had three parameters, the size of the local window, which was used forcalculation of the pixel local variation, and two other threshold values. The first

130 Automated Image Detection of Retinal Pathology
threshold determines the minimum variation value within each local window. Thecandidate exudate regions are initially found based on the first threshold value. Thesecond threshold represents the minimum value, by which a candidate must differfrom its surrounding background pixels to be classified as exudates. This techniqueachieved 92.8% mean sensitivity and 92.4% predictivity against a set of 15 abnormalretinal images. A set of 15 normal retinal images was also examined, of which 13had no exudates (88.6% specificity in terms of image-based accuracy).
As is apparent from the above reviewed methods, most proposed exudate identifi-cation techniques have only been assessed in terms of either lesion-based or image-based diagnostic performance criterion and against an approximately small numberof retinal images. Indeed, the reported lesion-based accuracies are often based on10× 10 or 20× 20 patches (patch resolution) and pixel resolution validation hasbeen reported in a couple of works. There are certain errors in reported patch resolu-tion accuracies due to the small areas, which some exudates can occupy. In medicaldecision support systems such as ours, an accurate diagnostic accuracy assessmentin terms of both pixel resolution and image-based is important.
5.5.2 Optic disc detection
Reliable and efficient optic disc localization and segmentation are significant tasksin an automatic screening system. Optic disc localization is required as a prereq-uisite for the subsequent stages in many algorithms applied for identification of theanatomical-pathological structures in retinal images. This is summarized in the fol-lowing.
Blood vessel tracking approaches: where blood vessels positioned in the neigh-borhood of the optic disc are used as seeds for vessel tracking [18].
Macula localization: in this case the approximate constant distance between theoptic disc and the macula can be used as a priori knowledge for locating the mac-ula [19].
Diabetic retinopathy lesions identification: to improve the lesion diagnosis perfor-mance by masking or removing the false positive optic disc from the other patholo-gies of interest, e.g., [17] and the author’s work towards exudates identification [20].
There have been relatively few works on locating the optic disc in retinal imageswithout user intervention. In fact, most of those only locate the optic disc center anddo not address the problem of optic disc boundary localization. Reliable optic disclocalization is surprisingly difficult, due to its highly variable appearance in retinalimages.
In [14; 21] an edge detection stage was followed by a circular Hough transformto locate the optic disc. The algorithm commenced with locating the optic disc can-didate area. This was defined as a 180×180 pixels region including the highest 2%gray-level in the red color component of the retinal image. Then, the Sobel operatorwas used to detect the edge points of the located candidate area. The contours werethen detected by means of the circular Hough transform, i.e., the gradient of the im-age was calculated, and the best fitting circle was then determined. These approachesare quite time consuming and rely on certain conditions regarding the shape of the

Retinal Markers for Early Detection of Eye Disease 131
optic disc that are not always met. Moreover, edge detection algorithms often failto provide an acceptable solution due to the fuzzy boundaries, inconsistent imagecontrast, or missing edge features.
Li and Chutatape [19] proposed a method for locating the optic disc using a com-bination of pixel clustering and principal component analysis techniques. They firstdetermined the optic disc candidate regions by clustering the brightest pixels in gray-level retinal images. This strategy can only work when there is no abnormality in theimage. On the other hand, a bright pixel clustering approach will fail when thereare large exudate lesions in the retinal image. This is due to the color and inten-sity similarities that exist between exudates and the optic disc. To cope with thisdifficulty principal component analysis was applied to finally locate the optic disc.They considered a small number of images as a training set and then determined thecorrespondent eigenvectors. Then, each new image was projected to a new space,i.e., “disc space,” using its eigenvectors in a similar way to face detection. Next, thedistance between the pixels belonging to the candidate regions and the provided pro-jection was calculated and the pixel with minimum distance was finally chosen as theoptic disc center. The technique was tested against 40 images and the results werereported satisfactory. However, the authors did not address the optic disc boundarylocalization.
Sinthanayothin [22] used an 80×80 sub-image to evaluate the intensity varianceof adjacent pixels, and marking the point with the largest variance as the optic disclocation. This technique has been shown to work well with 99.1% sensitivity andspecificity when there are no or only few small exudate pathologies that also appearvery bright and are also well contrasted. In fact, the authors made an assumption tolocate the optic disc from those retinal images with no visible symptoms. This workhas also mainly focused on locating the optic disc center.
Lalonde et al. [23] localized the optic disc using a combination of two proceduresincluding a Hausdorff-based template matching technique on the edge map, guidedby a pyramidal decomposition technique. A priori information of the image char-acteristics, e.g., right/left eye image and whether the input image is centered on themacula or an optic disc have to be provided. The edge maps were calculated usingCanny edge detection and therefore the low and high hysteresis thresholds must bedefined properly. The authors reported an average error of 7.0% in locating the disccenter and 80% area overlap between their ground truth optic disc and the localizedone against a database comprising 40 retinal images.
The optic disc boundary was found in Mendels et al. [24] using a twofold method.The optic disc boundary is highly influenced by the strong blood vessel edges cross-ing the optic disc region. Therefore, a preprocessing step was first applied based onlocal minima detection and morphological filtering to remove the interfering bloodvessels and locate the optic disc boundary accurately. To do that, a gray-level dilationoperator was applied based on a 5×5 pixel structuring element. This was followedby erosion using the same structuring element to re-establish the optic disc contourto its original place. A morphological reconstruction operator was then applied bymaintaining the maximum of the dilated/eroded image and the original one. Then,the optic disc contour was located using the deformable active contours (snakes)

132 Automated Image Detection of Retinal Pathology
technique. The snake was based on an external image field called Gradient VectorFlow (GVF). The technique was tested against a set of 9 retinal images and the authorreported an accurate optic disc boundary localization in all the test images.
To locate the optic disc in this study, two different techniques are investigatedincluding template matching and active contours. The first strategy provides an ap-proximate location of the optic disc center. The optic disc can sometimes have anelliptical shape, and therefore the baseline plotting of its exact boundaries is neces-sary. To achieve this goal a snake technique is applied to obtain a more accurate discboundary. We test these two approaches against an image dataset of 75 color retinalimages including 25 normal and 50 abnormal images. In all cases the template imagecould provide a good approximate match of the optic disc center even when large,albeit scattered, areas of similarly colored exudate pathologies exist in the image.
Here, we also develop a similar approach to [25], except we introduce two novelimprovements. First, we place the initial snake automatically using our earlier lev-els of processing. Second, we improve on the morphological step by using colormorphology, which results in a more homogeneous inner disc area and aids the ac-curacy of the optic disc localization. We can use either of the proposed methods toautomatically position an initial snake. In all our experiments this was performedsuccessfully, however, in optic disc images a snake is significantly affected by theblood vessels present in the optic disc region.
Hence, a preparation step is necessary. To do that we devise a more basic defi-nition of color morphology using a reduced ordering concept for color vectors, inwhich the definitions of maximum and minimum operations on color pixels reduceto the maximum and minimum of a scalar valued function in the structuring mask.Then, a closing morphological filtering is carried out in a more metric color spacesuch as Lab to remove the interfering blood vessels. After the color morphologicalpreprocessing step, the gradient image is obtained to compute the snake’s externalenergy to drive the GVF snake towards the desired accurate optic disc boundary.
To provide a more objective assessment of the performance of our algorithm weused an effective overlap measure of the match between two regions, i.e., localizedoptic disc region and the optic disc region ground truth provided by an ophthalmol-ogist. Using this measure, the GVF snake could achieve 90.32% overall accuracyagainst the provided image dataset when the morphological preprocessing were ap-plied using Lab components respectively. We also demonstrate the improvement ob-tained using the proposed color morphological closing over gray-level morphologyfor this application. The detail of our proposed optic disc localization approachesalong with a quantification of results are reported later this chapter.
5.6 PreprocessingWe used 142 color retinal images obtained from a Canon CR6-45 nonmydriatic cam-era with a 45° field of view. This consisted of 75 images for training and testing

Retinal Markers for Early Detection of Eye Disease 133
(a) Reference image (b) Typical retinal image
(c) Color normalized version (d) After contrast enhancement
FIGURE 5.3Color normalization and local contrast enhancement. (See color insert.)
our classifiers in the pixel-level classification stage. The remaining 67 images wereemployed to investigate the image-based diagnostic accuracy of our system. Theimage resolution was 760×570 at 24-bit red-green-blue (RGB) color.
One of the main obstacles for identification of retinal exudates is the wide variabil-ity in the color of the fundus from different patients. These variations are stronglycorrelated to skin pigmentation and iris color. Thus, the color of exudate lesions insome region of an image may appear dimmer than the background color of other re-gions. As a result, the exudates can wrongly be classified as the background. In fact,without some type of color normalization the large variation in the natural retinal pig-mentation across the patient dataset can hinder discrimination of the relatively smallvariations between the different lesion types. Thus, in the first step we selected a reti-nal image as a reference and applied the described histogram specification techniqueto modify the values of each image in the dataset such that its frequency histogrammatched the reference image distribution (see Figure 5.3(c)). The color normaliza-tion process was performed using histogram specification [20].
In the second preprocessing step, the contrast between the exudates and the back-ground is enhanced to facilitate later exudate identification. The contrast is not suffi-

134 Automated Image Detection of Retinal Pathology
cient due to the internal attributes of the lesions and decreasing color saturation, espe-cially in the area around the fovea. Here, we applied local contrast enhancement [22]to distribute the values of pixels around the local mean (see Figure 5.3(d)) [20].
5.7 Pixel-Level Exudate RecognitionImage segmentation plays a crucial role in most medical image analysis systemsby facilitating the description of anatomical structures and other regions of inter-est. Segmentation techniques vary widely depending on the specific application,image modality, and other factors [26]. Medical image segmentation is a challeng-ing task due to the complexity of the images, as well as the absence of models of theanatomical-pathological structures that fully capture the possible information.
A segmentation method ideally locates those sets that correspond to distinct ana-tomical or pathological regions of interest in the image. If the constraint that regionsbe connected is removed, then determining the sets is called pixel classification andthe sets themselves are called classes [27]. Pixel classification is often a desirableobjective in medical imaging, particularly when disconnected regions belonging tothe same tissue class need to be identified.
Here, we report on the investigations made into the application of exudate iden-tification at the pixel level based on statistical classifiers. For each image pixel x0a feature vector consisting of multi-spectral values of pixels in a defined neighbor-hood N(x0) was used as a feature representation. An odd-sized square window wascentered on each underlying pixel x0 in the dataset. Then the Luv color components(this color space was found the most appropriate space for our analysis) of the pixelsin the window were composed into the feature vector of x0.
The selection of a color space for image processing is application dependent. Toselect the most suitable space for our pixel-based classification approach, we con-ducted a quantitative analysis and applied a metric to evaluate the performance ofvarious color spaces. This metric [28] estimated the class separability of our exudateand nonexudate pixel classes in different spaces and was measured using within-classand between-class scatter matrices. After within-class (Sw) and between-class (Sb)matrices are measured the following metric J can be obtained:
J = Tr(
Sb
Sw
)(5.1)
A higher value of J indicates that the classes are more separated while the memberswithin each class are closer to each other. We have experimented with different colorspaces and found that the Luv color space is the most appropriate space for ourretinal image analysis (Table 5.1). Thus, we chose this color space to carry out ourpixel-level classification task.
There might be no constraint on the neighborhood window size N in theory, butit was assumed that most contextual information was presented in a small neigh-

Retinal Markers for Early Detection of Eye Disease 135
Table 5.1: Comparative Analysis of Different ColorSpaces
Color Space YIQ RGB HSL HSI Lab LuvJ 2.20 2.25 2.64 2.81 3.32 3.67
borhood of the x0 pixel. Here, to determine the optimal window size, we examinedvarious pixel patch sizes, i.e., 1× 1, 3× 3, 5× 5 and 7× 7. To construct learningdatasets of exudate and nonexudate (including cotton wool spots, red lesions, bloodvessels, and background) pixels, a consultant ophthalmologist manually segmented75 preprocessed images and marked the exudate lesions in these images. An almostbalanced learning dataset of exudates and nonexudates was then established to elim-inate any possible bias towards either of the two classes. This representative learningdataset was comprized of 62 501 exudate and 63 046 nonexudate pixels.
To model the exudate and nonexudate probability density function, we chose onevery commonly used classifier for every type of probability density estimation ap-proach, i.e., nonparametric KNN, parametric GQ, and semiparametric GMM. Eachclassifier was trained and tested against our four pixel datasets (1× 1, 3× 3, 5× 5,and 7×7).
In KNN classification, the number of neighbors, i.e., K, needs to be predefined.Here, we experimented with different K values ranging from 1 to 7 (K was chosen tobe odd to avoid ties), to find the optimum value with the lowest misclassification errorrate. Table 5.2 summarizes the best overall performances accomplished using theKNN classifier. As can be seen, this classifier achieved good generalization ability,with a best overall performance of 90.26% against 5×5 pixel patch size dataset. Inthis case, the correct classification rate for the exudate and nonexudate classes was88.92% and 91.60% respectively.
The Gaussian distribution is one of the most generally used density estimators.According to Bayes’ theorem, the posterior probability is written as:
P(Ci|x) =p(x|Ci)P(Ci)
p(x)(5.2)
The likelihood function p(x|Ci) was defined in terms of exudates and nonexudatesclass mean and covariance matrix. P(Ci) was the a priori probability denoting theprobability that a pixel (exudate or nonexudate) occurs in the entire set of pixels.The posterior probability measured the probability of the pixel belonging to eitherthe exudates (CExu) or nonexudates (CNon) class once we have observed the featurevector x. Here, the class attached to each feature vector x was selected based onthe maximum a posterior (MAP) rule. Table 5.2 illustrates the overall performancesachieved using the GQ classifier. The best obtained overall classification accuracywas 88.24% for a 5× 5 pixel patch size dataset, comprising 89.14% and 87.34%correct classification rates for exudates and nonexudates respectively.
A disadvantage of parametric density estimation techniques is their lack of flexi-bility when compared with nonparametric methods. Although single Gaussian den-sity estimation models can be set up easily, they are restricted in their ability to

136 Automated Image Detection of Retinal Pathology
Table 5.2: The Best Overall Pixel-Level Classifica-tion Performances
Pixel ClassifierPatch Size KNN GQ GMM
1×1 84.29% (K = 7) 82.25% 85.13%3×3 86.85% (K = 5) 86.15% 92.35%5×5 90.26% (K = 5) 88.24% 96.49%7×7 89.87% (K = 5) 87.58% 96.32%
efficiently estimate more complex distributions [29]. GMMs combine much of theflexibility of nonparametric methods with certain amounts of the analytical advan-tages of parametric approaches.
Basically, in a mixture model distribution the data is represented as a linear com-bination of component densities in the form:
p(xi) =K
∑k=1
p(xi|wk;Θk)P(wk) (5.3)
where K represents the number of components and each component is defined by wkand parameterized by Θk (mean vector and covariance matrix). The coefficient P(wk)is called the mixing parameter. We benefited from the theory behind these modelsand used a separate mixture of Gaussians to estimate the class densities p(x|Ci,Θ) ofexudates and nonexudates as follows:
p(x|Ci,Θ) =Ki
∑k=1
P(wk)
(2π)d2 det(∑k)
12
exp−1
2(x−µk)
T∑−1k (x−µk)
(5.4)
where µk and Σk represent the mean and covariance of the kth component of themixture density of class Ci. Ki denotes the numbers of components in class i and Cirefers to either the exudates or nonexudates class. Having estimated the likelihoodfunctions of these two classes the posterior probabilities were obtained. The decisionabout the affiliation of each new feature vector x was then taken by applying the MAPrule. We assumed a full covariance matrix for each component, since these types ofmatrices have higher flexibility in estimating the underlying distributions.
To determine the parameters of a GMM and fit a model to the data, the expec-tation maximization algorithm was utilized. This algorithm started with an initialguess for the parameters of the model and then iteratively modified these parame-ters to decrease an error function until a minimum was reached. The parameterswere initialized using a K-means clustering algorithm. The K-means algorithm par-titions the feature space into K clusters. To apply the K-means algorithm, the numberof clusters, i.e., K (or equivalently the number of components) needs to be known.Choosing too few components produces a model that cannot accurately model thedistributions. With an increasing number of components, the probability that themodel fits the dataset better will be increased, but the model also loses its capabilityto generalize well.

Retinal Markers for Early Detection of Eye Disease 137
Here, the appropriate number of components was chosen by repeating the den-sity model estimation and evaluating the minimum description length criterion [30].We obtained the optimum mixture model of each exudate and nonexudate pixel-level dataset separately by varying the number of components within a range of1 to 20. The optimum number of GMM components for exudate and nonexudatedatasets were found equal to 7 and 9 (for 1× 1 dataset), 10 and 11 (for 3× 3dataset), 15 and 17 (for 5× 5 dataset), 19 and 23 (for 7× 7 dataset) respectively.It is evident that by increasing the pixel patch size, the model complexity was alsoraised and necessitated a higher number of components for effective density estima-tion.
Table 5.2 summarizes the overall performance achieved using GMM. Typically,the performance of a classifier improves up to a certain point as additional featuresare added, and then deteriorates. This can be seen in Table 5.2, as performancecontinued to improve when the patch size was increased up to 5. At this point allclassifiers achieved their best results. However, by increasing the pixel patch size,i.e., to 7, the accuracy decreased.
In many situations, such as our application, it is valuable to obtain a 2D or 3Dprojection of the original multivariate data for visual examination. Here, principalcomponent analysis was applied to the pixel dataset that achieved the highest clas-sification accuracy, i.e., our 5× 5 dataset. The first two exudate principal modescontained 62.4% of the total variance, i.e., 49.7% + 12.7%. Similarly, the first twononexudate principal modes represent 53.2% of the total variance (38.0%+15.2%).
The GMM classifier performed better than the other two classifiers and providedthe best results irrespective of the choice of pixel patch size. The best GMM clas-sification demonstrated an overall performance equal to 96.49%, based on the 5×5pixel-level dataset (Table 5.2). In this case, the correct classification rates for exu-dates and nonexudates were 96.15% and 96.83% respectively. Therefore, the GMMclassifier with the 5×5 pixel level dataset was utilized to classify the pixels of a newset of images.
5.8 Application of Pixel-Level Exudate Recognition on the WholeRetinal Image
The performance of a medical diagnosis system is best described in terms of sen-sitivity and specificity. The sensitivity gives the percentage of correctly classifiedabnormal cases while the specificity defines the percentage of correctly classifiednormal cases. Classification of the whole retinal image pixels was required to workon an unbalanced dataset of exudate and nonexudate pixels where the number of truenegatives (TN) was much higher than the false positives (FPs). The specificity mea-sure was mostly near 100% and did not represent an informative measurement. Thus,we used the predictivity measure, which is the probability that a pixel classified as

138 Automated Image Detection of Retinal Pathology
(a) Original image (b) Ground truth (c) T = 0.3 (d) Superposition of(b) and (c)
(e) T = 0.5 (f) Superposition of(b) and (e)
(g) T = 0.7 (h) Superposition of(b) and (g)
FIGURE 5.4Pixel-level exudate recognition application on a retinal image using different ratioof exudate and nonexudate prior probabilities. The identified exudates are shown inblue and TPs are in white. (See color insert.)
exudate is really an exudate. This was defined as:
predictivity =T P
T P+FP(5.5)
where TP refers to the true positive. In real applications, such as ours, there is noprevious knowledge of actual prior probabilities of exudates and nonexudates. Forexample, the underlying test image can be either a normal image with no exudate, oran abnormal severe retinopathy image with a significant number of exudate pixels.Thus, to accomplish an efficient image classification process and control the balancebetween sensitivity and predictivity, we constructed a series of classifiers by varyingthe prior probability ratio of exudates to nonexudates using a decision threshold T .For instance, a threshold value equal to 0.8 sets the exudates’ prior probability to 0.8and nonexudates’ prior probability equal to 0.2 (i.e., 1− T ). Figure 5.4 shows anabnormal image that has been classified using our trained optimum GMM classifier.The original image and its ground truth are shown in Figure 5.4(a) and (b). Thecorresponding classification results for T values of 0.3, 0.5 and 0.7 are illustrated inFigure 5.4(c), (e), and (g).
By increasing the threshold value and assigning higher prior probabilities to theexudates, the number of TPs was increased while at the same time the false negatives(FNs) were decreased. Thus, the sensitivity measure was enhanced. Indeed, byincreasing the threshold value another reverse trend was noticed, where the FPs also

Retinal Markers for Early Detection of Eye Disease 139
Table 5.3: Pixel-Level Accuracy in Terms ofSensitivity-Predictivity Criteria
T Sensitivity Predictivity0.10 67.3 94.10.30 80.3 88.30.40 87.2 83.00.45 89.2 81.00.50 90.4 79.50.85 94.5 57.6
begin to intensify, which leads to a decrease in predictivity. The trade-off betweensensitivity and predictivity measures (choice of T ) needs to be appropriately balancedaccording to the diagnostic strategy. We considered a new set of 40 abnormal imagesand then each image was separately classified with different T values.
The overall pixel-level classification performance was obtained based on the aver-age of all images’ sensitivities and predictivities values. Table 5.3 summarizes someof these averaged sensitivity-predictivity values. As is evident, the threshold valuesthat provided the highest average of sensitivity and predictivity values were 0.40 and0.45. An important issue in choosing the threshold is ensuring that our classifierdoes not have a very high sensitivity for exudate detection; otherwise it can wronglyclassify the normal images as abnormal. Therefore, to assess the efficiency of ourproposed exudate recognition scheme in terms of image-based accuracy, we set thethreshold T equal to 0.45 and classified the whole set of 67 retinal images (40 abnor-mal and 27 normal) using the optimum GMM classifier. Then a final decision wasmade as to whether each image had some evidence of retinopathy.
When we manually analyzed the system’s decision on normal images we foundthat in most cases when a normal image had been wrongly identified as abnormalnot many FP pixels had been detected. To improve the image-based specificity of thesystem without sacrificing the sensitivity, a threshold value was defined. Based onthis threshold, each classified abnormal image with less than 50 identified exudatepixels in size was considered normal. This threshold was determined in agreementwith our experiments and our consultant clinician. The GMM classifier could iden-tify abnormal images with 92.5% sensitivity (correct identification of 37 abnormalimages out of 40), while it correctly classified 81.4% (correct identification of 22normal images out of 27) of the normal images (the specificity).
5.9 Locating the Optic Disc in Retinal ImagesThe location of the optic disc is of critical importance in retinal image analysis.Optic disc (OD) localization is necessary as a prerequisite stage in most algorithms

140 Automated Image Detection of Retinal Pathology
applied for identification of the retinal anatomical structures and lesions. These canbe summarized as follows:
Blood vessel detection approaches: where blood vessels positioned in the neigh-borhood of the optic disc provide possible seeds for vessel tracking.
Macula identification: where the approximately constant distance between the op-tic disc and the macula can be used as a priori knowledge for locating the macula.
Lesions classification: to improve the lesion diagnosis performance by masking orremoving the “false positive” optic disc regions from the other required pathologies.
Optic disc localization is indispensable in our automatic exudates identificationapproach, since it illustrates similar attributes to the exudates in terms of color,brightness, and contrast. By detecting it we can remove it from the exudate clas-sification process. In fact, the results reported in previous sections were all obtainedafter the removal of the optic disc using the work described in this section. De-spite its importance, an accurate localization is not an easy task as some parts of theboundary are not well defined in some images and several parts are obscured by thecrossing blood vessels. In these cases, the optic disc boundary is not always sharpand, more importantly, it is obscured in some places by blood vessels.
The optic disc size and shape may vary significantly. The disc diameter is about70 to 105 pixels in our retinal images. The optic disc part located on the nasal side isusually less bright than the temporal side portion and occasionally not visible at all.Sometimes the whole optic disc is brighter than the surrounding area, thus it can beseen as a disc; in others it can appear as a hollow ring. In either case the cup appearsas a smaller, brighter region within the optic disc. Whereas locating the optic discis an apparently simple task for an expert to trace the boundary, interpolating wherenecessary, traditional general-purpose boundary detection algorithms have not fullysucceeded in segmenting the optic disc due to fuzzy boundaries, inconsistent imagecontrast, variability in appearance, or missing edge features. Therefore, a reliableoptic disc localization is surprisingly difficult.
To locate the optic disc in this work, two different techniques are investigated in-cluding template matching and active contours. The first strategy provides an approx-imate location of the optic disc center. The optic disc region can then be estimatedas a circle using rough location of its center. Although template matching-basedtechnique is enough to estimate and remove the optic disc as candidate exudate re-gions, but the optic disc can sometimes have an elliptical shape, and thus baselineplotting of the exact boundaries is important. Thus, a snake-based technique is alsodeveloped to generate a more accurate disc boundary.
We tested these two approaches against a dataset of 75 color retinal images in-cluding 25 normal and 50 abnormal images. In all cases the template image couldprovide a good approximate match of the optic disc center even when large, albeitscattered, areas of similarly colored exudate pathologies exist in the image. We alsodeveloped an active contour-based approach similar to [24], except we introducedtwo novel improvements. First, we placed the initial snake automatically using ourearlier levels of processing. Second, we improved on the morphological step by us-ing color morphology, which resulted in a more homogeneous inner disc area andaided the accuracy of the optic disc localization.

Retinal Markers for Early Detection of Eye Disease 141
To provide a more objective assessment of the performance of this algorithm weused an overlap measure of the match between two regions, i.e. localized optic discregion and the optic disc ground truth provided by an ophthalmologist. According tothe applied overlap measure, a gradient vector flow (GVF) based snake could achieve90.32% overall accuracy for optic disc localization on our image dataset.
5.9.1 Template matching
Template matching is a technique used to isolate certain features in an image. Thiscan be implemented as a correlation of the original image and a suitable template.The best match is then located based on some criterion of optimality. According tothe size of the optic disc region in our retinal images, we generated a 110×110 pixelstemplate image by averaging the optic disc region in 25 retinal images selected fromour image dataset (Figure 5.5(a)). This was performed using gray levels only sincethe result is computationally less expensive and accurate enough. The normalizedcorrelation coefficient is defined as follows:
R(i, j) =∑k ∑l
(fk+i,l+ j− fi, j
)(tk,l− t
)√(∑k ∑l
(fk+i,l+ j− fi, j
)2)(
∑k ∑l(tk,l− t
)2) (5.6)
where f and t represent the original image and the template respectively, t is thetemplate pixels’ mean value and similarly f denotes the image pixels’ mean valuein the region that is defined by the template location. We measured the normalizedcorrelation coefficients for each retinal image to present an indication of the matchbetween the template image and each individual pixel in the image under consider-ation. The highest matched point emerges as the brightest point in the correlationimage. Here, we consider this point’s coordinate as potential location of the opticdisc center (Figure 5.5). The main weakness of template matching is that the largestcorrelation coefficient value does not necessarily correspond to the true optic disccenter. Indeed, this technique is prone to locate the optic disc center slightly to thetemporal side, due to the asymmetric nature of the optic disc (Figure 5.5).
In all 75 images the template image could provide a good approximate match ofthe optic disc center corresponding to the largest correlation coefficient value evenwhen large, albeit scattered, areas of similarly colored exudate pathologies existedin the image. However, as expressed earlier, template matching only approximatesthe optic disc center as can be easily seen in Figure 5.5. Since our aim is a preciselocalization of the optic disc boundary for use in clinical analysis, we use this centerapproximation purely as an automatic means of initializing a snake process.
5.9.2 Color morphology preprocessing
Snake methods work on a gradient image and lock onto homogeneous regions en-closed by strong gradient information. In this application, this task is made extremelydifficult since the optic disc region is invariably fragmented into multiple regions byblood vessels. Mendels et al. [24] used gray-level morphology to remove the blood

142 Automated Image Detection of Retinal Pathology
(a) Template image (b) Localized optic disc center (c) Localized optic disc center
FIGURE 5.5Localization of the optic disc center. The optic disc center approximation is markedin black.
vessels to create a fairly constant region before applying a snake method. Mathemat-ical morphology can extract important shape characteristics and also remove irrele-vant information. It typically probes an image with a small shape or template knownas a structuring element. Using gray-level morphology, the operation can be appliedto the intensity or lightness channel. We show that better results may be obtained byusing the Lab [31] color space using a simple definition of color morphology.
We carried out a series of experiments to determine the best method of obtaininga homogeneous optic disc region by performing gray-level morphology as in [24],gray-level morphology using the lightness channel L of the HLS (hue-lightness-saturation) color space, color morphology using the full HLS space, and two varia-tions of color morphology using the Lab space. In all these cases, we performed aclosing operation, i.e., a dilation to first remove the blood vessels and then an ero-sion to restore the boundaries to their former position. This can result in some minorinaccuracies, particularly if any boundary concavities are filled by the dilation, butin the main performs very well. We also used a symmetrical disc structuring elementof size 13, since the blood vessels were determined to be not wider than 11 pixels.Standard gray-level morphology was performed after a transformation of the RGBcolor image into a gray-level image (see Figure 5.6(b)). The same can be performedon the L channel of the HLS color space (Figure 5.6(c)), in which the blood vesseledges are less pronounced than in a normal intensity image, so their elimination iseasier.
Hanbury and Serra [32] have introduced a method for morphological preprocess-ing in the HLS color space using all the components. In color morphology, each pixelmust be considered as a vector of color components and definitions of maximum andminimum operations on ordered vectors are necessary to perform basic operations.Hence for each arbitary point x in the color space, the definition for dilation (Id) anderosion (Ie) by structuring element K is defined as:
Id (x) = I (y) : I (y) = max [I (z)] ,z ∈ Kx (5.7)Ie (x) = I (y) : I (y) = min [I (z)] ,z ∈ Kx (5.8)

Retinal Markers for Early Detection of Eye Disease 143
(a) Original image (b) Gray morphology (c) L morphology
(d) HLS (L first) (e) LCh (f) Lab
FIGURE 5.6Mathematical morphology closing in different color spaces. (See color insert.)
Hanbury and Serra introduced a lexicographical order to color morphology in theHLS space such that the basic morphological operations could be performed in aparticular order with any one of H, L, or S in the first position. The choice was statedto be dependent on the application at hand. For example, the lexicographical orderof two typical vectors x and y with saturation S in the first position was defined as:
x > y if
Sx > SyorSx = Sy and |Lx−0.5|<
∣∣Ly−0.5∣∣
orSx = Sy and |Lx−0.5|=
∣∣Ly−0.5∣∣ and d(Hx,Ho) < d(Hy,Ho)
(5.9)In this approach after choosing an origin Ho, the distance from the origin to eachpoint Hi in the structuring element is calculated as:
di = d(Hi,Ho) =
|Hi−Ho| |Hi−Ho| ≤ 180
360−|Hi−Ho| |Hi−Ho| ≥ 180(5.10)
Thus the point with smallest di is chosen as the infimum of the structuring element(erosion), and the point with the largest di as the supremum (dilation).
For our retinal images, operators based on the lexicographical order with L in thefirst position produced the best results in preserving the optic disc as the brightest

144 Automated Image Detection of Retinal Pathology
object and removing the blood vessels as one of the darker objects. Figure 5.6(d)shows an example of applying a closing operation in the HLS color space with Lin the first position. In a follow-up work, Hanbury and Serra [33] applied the sameprinciples to perform color morphology in the LCh color space a derivative of theLab space where C =
√(a)2 +(b)2 and h = arctan(b/a). In [33], the order of two
typical vectors x and y was defined as:
x > y if
wx < wyorwx = wy and Lx > Lyorwx = wy and Lx = Ly and d(hx,ho) > d(hy,ho)
(5.11)
where w is a weighting function imposing a complete order on the LCh space. Itis defined so that a lower weight represents a color closer to the extremal points ora more saturated color, and a higher weight implies a color close to the luminanceaxis or a less saturated color. It is computed based on the image LCh values andthe extremal points in L and C (in the general LCh space) for all values of h from 0to 359. Figure 5.6(e) illustrates the application of a closing operation in this LChspace.
Using the perceptually uniform Lab color space allows us to manipulate the light-ness and chromaticity of the optic disc region at the same time in a space wherecolor differences correspond to the metric distance between them. We devised a verybasic definition of color morphology in which the definition of maxima and minimaoperations on color pixels reduce to the maximum and minimum of the ordered setof vectors in the structuring mask.
This simple strategy works here because of the nature of the retinal image, butit may not necessarily be of use in other types of images. As expressed earlier, theoptic disc region contains contrasting pixels: bright, almost saturated regions crossedby dark blood vessel regions. These color differences will reside in well separatedregions of the Lab perceptual color space and hence our simple minima and maximadefinitions work extremely well. The definitions for dilation (Id) and erosion (Ie) inthe proposed simple color morphology domain are defined by (5.7) and (5.8). Thedilation is the furthest point from the origin, and the erosion is the point closest tothe origin. The origin was considered at (0,0,0) for simplicity and then the maximumand minimum distances from each pixel to the reference point were obtained usingthe Euclidean norm within the structuring mask. An example of closing using oursimple definitions of dilation and erosion in the Lab space is shown in Figure 5.6(f).This approach creates a more homogeneous region and preserves the optic disc edgesbetter. As will be shown later, it also results in a more accurate localization of theoptic disc.
5.9.3 Accurate localization of the optic disc-based snakes
Since the optic disc region is broken up by blood vessels, classical segmentation al-gorithms based exclusively on edge detection are not enough to accurately localize

Retinal Markers for Early Detection of Eye Disease 145
the optic disc as they do not incorporate the edge smoothness and continuity prop-erties. In contrast, active contours (snakes) represent the paradigm that the presenceof an edge depends not only on the gradient at a specific point but also on the spa-tial distribution [34]. In fact, snakes incorporate the global view of edge detectionby assessing continuity and curvature, combined with the local edge strength [35].The principal advantage of snakes is that they have the ability to interpolate missingedges of the objects while being locked on the visible parts. These properties makesnakes highly suitable for our optic disc localization application.
The initial contour for a snake must be close to the desired boundary otherwiseit can converge to the wrong resting place. In order to automatically position aninitial snake we introduced the template-matching step in Section 5.9.1. In general, asnake is a parametric curve X(s) = (x(s),y(s)). The snake moves under an evolutionequation that pushes it towards a configuration that minimizes internal and externalenergies. This energy function can be defined as:
Esnake =∫ 1
0
12
(α∣∣X ′(s)∣∣2 +β
∣∣X ′′(s)∣∣2)+Eext (X(s)) ds (5.12)
The first two terms within the above integral stand for the internal force that is de-termined by the physical properties of the snake. If α and β have large values, thenthe snake tends to assume a smooth outline. The third term Eext(X(s)) is the exter-nal energy, and is evaluated from the image. The external energy is the main issuediscussed in active contour models. In our application this external energy is an at-tractor towards optic disc boundary and in the classical formulation is defined as thegradient of a low pass filtered version of the image. Considering a gray-level im-age I(x,y) as a function of continuous variables (x,y), a typical external energy tolead the snake towards edges is defined as:
Eext (x,y) =−|∇∇∇ [Gσ (x,y)∗ I (x,y)]|2 (5.13)
where Gσ (x,y) is a two dimensional Gaussian function with standard deviation σ
and ∇∇∇ is the gradient operator. The external energy is minimized where the imagegradient is large, namely along the edges in the image. This encourages the snake tomove towards the edges.
The disadvantage of this external energy field is that it may lead to many localenergy minima that do not represent the desired boundary. Snakes also have difficul-ties progressing into boundary concavities. To overcome these problems we used theGVF field [36] that replaces the standard formulation of the external energy with aGVF field, V(x,y) = (u(x,y),v(x,y)), to minimize the following energy function:
γ =∫∫
µ(u2x +u2
y + v2x + v2
y)+ |∇∇∇ f |2 |V−∇∇∇ f |2 dxdy (5.14)
Where f represents the edge gradients, µ is a regularization parameter determininga trade-off between the first and second terms of the function. GVF’s larger capturerange and concavity tracking abilities are attributed to the diffusion operation shownin (5.14). On the other hand, µ is a parameter that determines the trade-off between

146 Automated Image Detection of Retinal Pathology
(a) A typical optic discimage
(b) After color mor-phology
(c) Lightness image (d) Gray-level mor-phology closing
(e) Gradient image ob-tained from lightnessimage
(f) Gradient image ob-tained from gray-levelmorphology closing
FIGURE 5.7A comparison between color morphology and gray-level morphology. (See colorinsert.)
smoothness of the vector field and how much the snake is attracted to the edge. Thisparameter is defined based on how much noise exists in the image, i.e., a bigger µ
indicates more noise.
5.9.4 Optic disc localization results
Once the vascular structures were removed, the gradient information required forevaluating the snake’s external energy to drive the snake towards the desired accurateoptic disc boundary was extracted from the filtered image lightness channel. In fact,for each image pixel with RGB tristimulus, the lightness value was defined as an av-erage between the maximum and minimum values of R, G, and B. This conversionof color images to their corresponding lightness versions provided a homogenousgray-level optic disc region as the blood vessels were less pronounced in the light-ness channel. More importantly, the definition of lightness effectively suppresses thegray-level differences that naturally exist between the optic disc temporal and thenasal side and between the optic cup and its neighboring pixels.
Figure 5.7 shows an example of converting a preprocessed color optic disc regionimage (Figure 5.7(b)) to its corresponding lightness component (Figure 5.7(c)). As isevident, the lightness information provided a highly smoothed region with no signif-icant difference between the temporal and nasal sides. In contrast, this difference can

Retinal Markers for Early Detection of Eye Disease 147
be clearly seen in Figure 5.7(d), which represents the gray-level morphology closingresult on the gray-scale version of the original image (Figure 5.7(a)). Figure 5.7(e)and (f) show the gradient images acquired from the lightness image (Figure 5.7(c))and the gray-level image (Figure 5.7(d)) respectively. By comparing these two gra-dient images, it is evident that the proposed approach provides a more accurate opticdisc edge map.
Another disadvantage of the standard gray-level approach is that when applying asnake, the stronger central region gradient values in Figure 5.7(f) can force the snaketo be pulled too far towards the interior part of the disc region and thus fail to locatethe true optic disc boundary.
Several different values were tested for the regularization parameter of the GVFand we found µ = 0.27 as the best for our images. The number of iterations dur-ing the evaluation of the GVF field was set to 40. We used α = 0.7 and β = 0.1,which control the snake’s tension and rigidity respectively. Finally, the number ofiterations for the snake convergence was determined experimentally and set to 175.All these parameters were determined empirically and kept constant throughout theexperiments.
The initial contour for a snake must be close to the desired boundary otherwise itcan converge to the wrong resting place. Here, we initialized the snake automaticallyas a circle with a center at the point found through template matching and with acircular radius set to half of the width of the template. In a number of cases this initialsnake intersected the real optic disc boundary, but the GVF snake has the ability toshrink or grow towards the final boundary. In Figures 5.8(a) to 5.8(d) we illustratea typical original image, the result of Lab color space morphological closing, theinitial snake, and the final snake. Figures 5.8(e) to 5.8(h) demonstrate a close-up ofthe optic disc region, Lab closing of optic disc region, close-up of final snake, andclose-up of hand-drawn ground truth. In Figure 5.8(i) we show a combined close-up of the hand-labeled boundary and the final snake to illustrate the close matchachieved.
We quantify and compare the accuracy of our active contour optic disc localizationtechnique against the manually labeled ground truth produced by a clinician (e.g., seeFigure 5.8(h)) for all the variations of optic disc morphology described earlier. Thesevariations were closing in gray-level images, closing using L and S channels of theHLS, opening using H channel of HLS, closing in Lab color space and openingin LCh color space. We use a simple and effective overlap measure of the matchbetween two regions as:
M =n(R∩T )n(R∪T )
(5.15)
where R and T correspond to the ground truth and the final localized optic disc regionrespectively and n (.) is the number of pixels in a region. This measure of accuracywas used to compare a ground truth region with that inside a snake. In this case R andT notations correspond to the ground truth and the final snake localized optic discregion, respectively. Table 5.4 summarizes measure M for a selection of 10 retinalimages as well as the overall average accuracy for all 75 images.
While many of the results in the 1-dimension and 3-dimension spaces are of asimilar order, the best average optic disc localization performance was achieved at

148 Automated Image Detection of Retinal Pathology
(a) A typical retinalimage
(b) Vessel elimina-tion in Lab
(c) Initial snake (d) Final snake
(e) Close-up ofoptic disc region
(f) Lab closing ofoptic disc region
(g) Close-up of fi-nal snake
(h) Close-up ofhand-drawnground truth
(i) Overlay of (g)and (h)
FIGURE 5.8Optic disc localization results. (See color insert.)
90.32% by employing a snake after our proposed Lab color morphological opera-tions. The gray-level based morphological closing accomplished 89.57% accuracy,which is the best after both color morphology variations in Lab space. Among theHLS color morphology results, L in the first position achieved an accuracy equalto 87.12%, which is significantly better than the S (saturation) and H (hue) in thefirst positions. The second best performance in this color space was obtained basedon S in the first position with 80.77% accuracy. However, the worst results in HLScolor space were based on H in first position where we achieved an accuracy of73.12%. The LCh space-based morphological preprocessing did not achieve a highlevel of overall accuracy as well as being a computationally expensive method. Thisapproach provided accuracy equal to 76.41%. Our Lab-based color morphologicalpreprocessing technique was much faster than the LCh where the weights had to berecomputed after each basic morphology operation in anticipation for the next oper-ation. The LCh space did not provide the same level of overall accuracy as the gray-level or HLS space when either L or S channels were assumed in the first position.
5.10 ConclusionThis chapter reported work undertaken to investigate the use of three well known sta-tistical classifiers, i.e., KNN, GQ, and GMM for the pixel-level exudate recognition.

Retinal Markers for Early Detection of Eye Disease 149
Table 5.4: Performance Evaluation of the Optic Disc Localization
Image Gray HLS HLS HLS LCh Lab(H 1st) (L 1st) (S 1st)
1 89.14 74.86 89.83 66.42 87.65 91.762 87.60 63.16 87.57 84.34 68.42 87.683 93.91 68.74 93.55 91.28 84.49 94.874 90.10 80.12 85.87 75.46 72.51 90.235 91.82 76.01 92.56 92.18 78.73 92.236 91.95 75.97 84.94 80.67 75.25 90.127 93.27 64.87 93.15 87.45 78.65 94.538 91.24 70.21 90.05 80.46 89.88 90.589 90.55 74.64 83.67 80.94 77.56 91.13
10 88.40 68.32 89.23 81.85 76.45 88.67Average 89.57% 73.12% 87.12% 80.77% 76.41% 90.32%
The purpose was to examine parametric, nonparametric, and semiparametric prob-ability density estimation techniques for distinguishing exudates from nonexudatesand highlight areas of retinal images that contain exudate lesions. Four differentdatasets of exudate and nonexudate pixels were utilized to take the spatial pixels’information. A square window of pixels (1× 1, 3× 3, 5× 5, 7× 7) centered on thepixel to be classified was used to establish a feature vector for the main underlyingpixel. This information was passed on to a classifier, which assigned a classificationlabel to the pixel under consideration.
It was found that the GMM classifiers performed better than the other two classi-fiers. KNN classifiers could outperform the GQs but the latter were much quicker todevelop. The effect of different pixel patch sizes was assessed for the three classi-fiers. There existed a distinct optimum for all the employed classifiers for a patch of5×5 pixels.
The proposed pixel-level exudate recognition approach was extended to a new setof 67 retinal images, including 40 abnormal and 27 normal images. Each retinalimage was then evaluated using the optimal GMM classifier and a final decision wasmade as to whether the image had some evidence of retinopathy.
An acceptable compromize between the system’s sensitivity and predictivity wasachieved by inspecting different ratios of exudate and nonexudate prior probabilities.The proposed scheme achieved 92.5% (correct classification of 37 abnormal imagesout of 40) sensitivity and 66.6% (correct classification of 18 normal images out of 27)specificity in terms of image-based classification accuracy. It also illustrated 89.2%sensitivity and 81.0% predictivity in terms of pixel resolution accuracy when theoutput threshold (prior probability ratio of exudates and nonexudates) was assumedto be 0.45.
Due to the importance of optic disc localization in retinal image analysis, two dif-ferent approaches for locating the optic disc were investigated. Template matchingcould only provide an approximate location of the optic disc center. The best opticdisc localization accuracy was achieved by employing a snake after morphological

150 Automated Image Detection of Retinal Pathology
operations in Lab color space. The final localized snake and hand-labeled groundtruth images were utilized to assess the performance of different employed prepro-cessing morphological approaches.
The purpose of locating the optic disc was twofold:
• to separate the false positive optic disc regions from the candidate segmentedexudates.
• its accurate segmentation is of more use in clinical analysis, e.g., in prolifer-ative diabetic retinopathy there may be development of new blood vessels onthe optic disc and therefore baseline plotting of the exact boundaries of thedisc is important.
Consequently, an active contour-based technique was developed to produce a moreaccurate boundary. The optic disc region is invariably fragmented into multiple re-gions by blood vessels. Thus, we used a color morphology preprocessing smoothingto remove the vessels and create a fairly constant region before applying a snakemethod. Here we implemented the concept of color morphology in different colorspaces including HLS, LCh, and Lab. As the hue component of HLS and LCh colorspaces is angular, the standard gray-scale morphological operations were not directlyapplicable to it. Thus, color morphology operations were implemented using a hueorigin and lexicographical orders.
We found a highly appropriate preprocessing color morphology scheme for re-moving the vessels based on the Lab components. We also demonstrated the im-provement obtained using the proposed color morphological closing over gray-levelmorphology for this application. The proposed method could localize the optic discin all 75 test images. It achieved 90.32% accuracy in terms of an area overlappingbetween the ground truth and the identified optic disc region using a snake approach.This showed that the proposed color morphology-based preprocessing method is par-ticularly suitable for the characteristics of our optic disc images. However, there is adegree of subjectivity in assigning the ground truth boundary in the test images andperfect correspondence would not be expected.
References[1] Evans, J., Causes of blindness and partial sight in England and Wales 1990–
1991, Technical Report 57, HMSO, London, 1995.
[2] Kanski, J., Diabetic Retinopathy, Clinical Ophthalmology, Butterworth-Heinmann, Oxford, UK, 1997.
[3] McLeod, B., Thompson, J., and Rosenthal, A., The prevalence of retinopathyin the insulin-requiring diabetic patients of an English country town, Eye, 2,424, 1988.

Retinal Markers for Early Detection of Eye Disease 151
[4] The Royal College of Ophthalmologists, Guidelines for diabetic retinopathy,Technical report, The Royal College of Ophthalmologists, 1997.
[5] Shah, P., Jacks, A., and Khaw, P., Eye disease in clinical practice, Manticore,1999.
[6] Goldbaum, M., Moezzi, S., Taylor, A., et al., Automated diagnosis and imageunderstanding with object extraction, object classification, and inferencing inretinal images, in International Conference on Image Processing, Lausanne,Switzerland, 1996, vol. 3, 695–698.
[7] Sinthanayothin, C., Boyce, J.F., Cook, H.L., et al., Automated localisation ofthe optic disc, fovea, and retinal blood vessels from digital colour fundus im-ages, British Journal of Ophthalmology, 83(8), 902, 1999.
[8] Frame, A.J., Undrill, P.E., Cree, M.J., et al., A comparison of computer basedclassification methods applied to the detection of microaneurysms in oph-thalmic fluorescein angiograms, Computers in Biology and Medicine, 28(3),225, 1998.
[9] Lee, S.C., Wang, Y., and Lee, E.T., Computer algorithm for automated detec-tion and quantification of microaneurysms and hemorrhages (HMAs) in colorretinal images, in Medical Imaging 1999: Image Perception and Performance,1999, vol. 3663 of Proceedings of the SPIE, 61–71.
[10] Pinz, A., Bernogger, S., Datlinger, P., et al., Mapping the human retina, IEEETransactions on Medical Imaging, 17(4), 606, 1998.
[11] Phillips, R.P., Spencer, T., Ross, P.G., et al., Quantification of diabetic macu-lopathy by digital imaging of the fundus, Eye, 5(1), 130, 1991.
[12] Phillips, R., Forrester, J., and Sharp, P., Automated detection and quantificationof retinal exudates, Graefes Arch Clin Exp Ophthalmol, 231(2), 90, 1993.
[13] Ward, N., Tomlinson, S., and Taylor, C., Image analysis of fundus photographs,Ophthalmology, 96, 80, 1989.
[14] Ege, B., Larsen, O.V., and Hejlesen, O.K., Detection of abnormalities in reti-nal images using digital image analysis, in 11th Scandinavian Conference onImage Analysis (SCIA99), 1999, 833–840.
[15] Wang, H., Hsu, W., Goh, K.G., et al., An effective approach to detect lesions incolor retinal images, in IEEE Conference Computer Vision and Pattern Recog-nition (CVPR’00), Hilton Head Island, SC, 2000, vol. 2, 181–186.
[16] Gardner, G.G., Keating, D., Williamson, T.H., et al., Automatic detection ofdiabetic retinopathy using an artificial neural network: A screening tool, BritishJournal of Ophthalmology, 80, 940, 1996.
[17] Walter, T., Klein, J.C., Massin, P., et al., A contribution of image processingto the diagnosis of diabetic retinopathy – detection of exudates in color fundus
152 Automated Image Detection of Retinal Pathology
images of the human retina, IEEE Transactions on Medical Imaging, 21(10),1236, 2002.
[18] Chutatape, O., Zheng, L., and Krishman, S.M., Retinal blood vessel detectionand tracking by matched Gaussian and Kalman filters, in Proceedings of the20th International Conference of the IEEE Engineering in Medicine and Biol-ogy Society, 1998, vol. 6, 3144–3149.
[19] Li, H. and Chutatape, O., Automatic location of optic disk in retinal images, in2001 International Conference on Image Processing (ICIP’01), 2001, vol. 2,837–840.
[20] Osareh, A., Mirmehdi, M., Thomas, B., et al., Classification and localisation ofdiabetic-related eye disease, in 7th European Conference on Computer Vision(ECCV2002), 2002, vol. 2353 of Lecture Notes in Computer Science, 502–516.
[21] Liu, Z., Opas, C., and Krishnan, S.M., Automatic image analysis of fundusphotograph, in Proceedings of the 19th Annual International Conference of theIEEE Engineering in Medicine and Biology Society, 1997, vol. 2, 524–525.
[22] Sinthanayothin, C., Image analysis for automatic diagnosis of diabetic retino-pathy, PhD thesis, King’s College of London, 1999.
[23] Lalonde, M., Beaulieu, M., and Gagnon, L., Fast and robust optic disc detectionusing pyramidal decomposition and Hausdorff-based template matching, IEEETransactions on Medical Imaging, 20(11), 1193, 2001.
[24] Mendels, F., Heneghan, C., and Thiran, J.P., Identification of the optic diskboundary in retinal images using active contours, in Irish Machine Vision andImage Processing Conference, 1999, 103–115.
[25] Osareh, A., Mirmehdi, M., and Markham, R., Comparison of colour spacesfor optic disc localisation in retinal images, in 16th International Conferenceon Pattern Recognition (ICPR’02), Quebec City, QC, Canada, 2002, vol. 1,10 743–10 746.
[26] Sonka, M. and Fitzpatrick, J., Handbook of Medical Imaging: Medical ImageProcessing and Analysis, vol. 2, SPIE, 2000.
[27] Sonka, M., Hlavac, V., and Boyle, R., Image Processing, Analysis and MachineVision, PWS, 1999.
[28] Fukunga, K., Statistical Pattern Recognition, Academic, 1990.
[29] Bishop, C., Pattern Recognition and Machine Learning, Springer, 2006.
[30] Rissanen, J., A universal prior for integers and estimation by minimum descrip-tion length, Annals of Statistics, 11, 416, 1983.
[31] Lukac, R. and Plataniotis, K., eds., Colour Image Processing: Methods andApplications, CRC, 2006.

Retinal Markers for Early Detection of Eye Disease 153
[32] Hanbury, A. and Serra, J., Mathematical morphology in the HLS colour spacce,in Proceedings of the 12th British Machine Vision Conference, 2001, 451–460.
[33] Hanbury, A. and Serra, J., Mathematical morphology in the Lab colour space,Image Analysis and Stereology, 21(3), 201, 2002.
[34] Gunn, S. and Nixon, M., A robust snake implementation; a dual active con-tour, IEEE Transactions on Pattern Analysis and Machine Intelligence, 19(1),1, 1997.
[35] Kass, M., Witkin, A., and Terzopoulos, D., Snakes: active contour models,International Journal of Computer Vision, 1(4), 321, 1987.
[36] Xu, C. and Prince, J., Snakes, shapes, and gradient vector flow, IEEE Transac-tions on Image Processing, 7(3), 359, 1998.


6Automated Microaneurysm Detection forScreening
Michael J. Cree
CONTENTS
6.1 Characteristics of Microaneurysms and Dot-Hemorrhages . . . . . . . . . . . . . . . . . . 1556.2 History of Automated Microaneurysm Detection . . . . . . . . . . . . . . . . . . . . . . . . . . . 1566.3 Microaneurysm Detection in Color Retinal Images . . . . . . . . . . . . . . . . . . . . . . . . . 1656.4 The Waikato Automated Microaneurysm Detector . . . . . . . . . . . . . . . . . . . . . . . . . 1676.5 Issues for Microaneurysm Detection . . . . . . . . . . . . . . . . . . . . . . . . . . . . . . . . . . . . . . . 1726.6 Research Application of Microaneurysm Detection . . . . . . . . . . . . . . . . . . . . . . . . 1776.7 Conclusion . . . . . . . . . . . . . . . . . . . . . . . . . . . . . . . . . . . . . . . . . . . . . . . . . . . . . . . . . . . . . . . . 178
References . . . . . . . . . . . . . . . . . . . . . . . . . . . . . . . . . . . . . . . . . . . . . . . . . . . . . . . . . . . . . . . . 178
6.1 Characteristics of Microaneurysms and Dot-HemorrhagesMicroaneurysms (MA) are small saccular bulges in the walls of the retinal capil-lary vessels. Although most commonly found in diabetic retinopathy, MAs may alsooccur in other retinopathies such as various congenital vascular abnormalities. Thepathogenesis of microaneurysms is not completely understood but damage to capil-lary pericytes is thought to be a factor [1].
As the retinal capillaries are too small to be resolved by normal fundus photogra-phy, microaneurysms are classically described as distinct small round objects, rang-ing from 10 µm to 100 µm in diameter. In color fundus images they appear red andin red-free images they appear dark. With fluorescein angiography microaneurysmsare hyperfluorescent, thus appear as bright dots in positive images. In practice, theappearance of microaneurysms can deviate somewhat from the classical description.They may appear in association with larger vessels or as a conglomeration of morethan one MA. Microaneurysms are difficult to distinguish from dot-hemorrhages incolor retinal images. Dot-hemorrhages appear as bright red dots the size of a largemicroaneurysm and rarely exceed 200 µm in diameter. As the clinical implications
155

156 Automated Image Detection of Retinal Pathology
of the presence of dot-hemorrhages and MAs are sufficiently similar there is usuallyno need for an automated MA detector to distinguish between them.
Microaneurysms are better visualized with fluorescein angiography with moreMAs visible than in color fundus images. Better discrimination between MAs anddot-hemorrhages is also achieved as dot-hemorrhages tend to block out the back-ground choroidal fluorescence and appear hypofluorescent. Nevertheless, other fea-tures, such as retinal pigment epithelium defects and capillaries seen end on, canappear similar to MAs and some care is needed when identifying individual MAs.
Microaneurysms are often the first sign of diabetic retinopathy. A positive correla-tion between the number of microaneurysms and the severity and likely progressionof diabetic retinopathy has been demonstrated, at least for the early stages of thedisease [2–5]. Microaneurysm formation and regression is a dynamic process withover half of the MA population observed to either form or regress within a 12 monthperiod [6]. There is evidence that the turnover of microaneurysms, in addition toabsolute counts, is a predictor of retinopathy [6; 7].
As microaneurysms are reasonably easy to describe, are a well visualizable tar-get, and their numbers have definite clinical implications, they were one of the firstlesions selected for automated image analysis. Early attempts focused on the de-tection of MAs in fluorescein angiographic images where they are better visualized.As fluorescein angiography poses an unacceptable health risk for eye-screening andcolor digital camera technology has advanced sufficiently, there is now a move toperform automated MA detection on color fundus images as an adjunct to automatedeye screening.
6.2 History of Automated Microaneurysm DetectionIn the following an overview of the historical development of automated microaneu-rysm detectors is given.
6.2.1 Early morphological approaches
The first attempts at automated microaneurysm detection date back to the early1980s, and were on fluorescein angiographic images. Lay et al. [8] described a mor-phological approach to MA detection. Image resolution and dynamic range were low(256×256 pixels with 100 gray levels), however, by using an imaging microscope todigitize film negatives, the digital image covered a small field-of-view of the maculaso that MAs were well resolved. As negatives were used, the MAs appeared as darkdots, thus as localized minima in the intensity image. A tophat transform was ap-plied to identify the local minima. Vessels were identified with the skeletonization ofa further tophat transform using a linear structuring element at various orientations,and any local minima lying on vessels were eliminated as MAs. Ten angiographicimages, containing a total of 177 MAs, were analyzed both by clinicians and the

Automated Microaneurysm Detection for Screening 157
automated MA detector. The automated MA detector achieved 58% sensitivity with4.2 false detections per image for detecting and locating MAs .
This process was extended by Baudoin et al. [9] with extra morphological pro-cessing to remove false detections such as objects too small to be MAs. In this study25 retinal images centered on the macula, containing a total of 936 MAs, were ana-lyzed both by clinicians and the automated processing. The automated MA detectorachieved 70% sensitivity for detecting and locating MAs with 4.4 false detectionsper image.
Spencer et al. [10] used matched-filtering to detect MAs and to remove false-detections on vessels in angiographic images of the retina. Film negatives of themacula were projected onto a screen and digitized with a monochrome CCD cameraat 512×512 pixel resolution. Preprocessing included radiometric correction for theillumination of the negatives, and subtractive shade-correction to remove choroidalfluorescence. MAs were identified by matched-filtering with a circularly symmetrictwo-dimensional Gaussian (σ = 1 pixel) and a mask of size 5× 5 pixels. Vesselswere identified by matched-filtering with a mask of size 5×5 pixels and σ = 2 pix-els, and extra shape-analysis to identify long linear structures. Any MAs detectedon the vessel network were removed. Testing was performed on six fluorescein an-giographic images. Five clinicians also marked the positions of MAs, on both thedigitized images and on standard photographs made from the film negatives. Theautomated detection performed almost as well as the clinicians working on the dig-itized images, however, the clinicians working on the digitized images performedpoorly compared to the clinicians working on the photographs. It was concludedthat the digitized image resolution was insufficient for reliable MA detection.
6.2.2 The “standard approach” to automated microaneurysmdetection
In response to the limits of the morphological processing developed by Baudoin andLay, and of the matched-filter approach of Spencer et al., researchers at AberdeenUniversity, Scotland, developed the image processing strategy for detection of MAsinto what we shall call the “standard approach” of automated MA detection. Thisapproach has since been adopted and enhanced by researchers not only at AberdeenUniversity, but also by a number of other groups. The standard approach [11] isdescribed in the following and illustrated in Figure 6.1.
First, digitized retinal images are shade-corrected to even up the background illu-mination of the retinal image. Shade-correction is normally performed by creatingan image of the background illumination often estimated by gross median or meanfiltering of the retinal image. The background image is either subtracted from or di-vided into the retinal image. On fluorescein angiographic images subtractive shade-correction is normally performed to remove choroidal background fluorescence asthe choroidal illumination is an additive process (e.g., see [11–13]; also see [14] formore description of the illumination contaminants to angiographic images). Micro-aneurysm detection on color retinal images is best with divisive shade-correction as

158 Automated Image Detection of Retinal Pathology
FilterMatched
RemovalVessel
CorrectionShade
DetectCandidateLocations
Region
CandidatesGrow
MeasureCandidateFeatures
CandidateClassifier MAs
Output
InputImage
FIGURE 6.1Flow diagram of the “standard approach” to microaneurysm detection.
intensity shading is mainly due to changing reflectances of the retina, a multiplicativeprocess.
In the standard approach, a matched-filter with a circularly symmetric 2-D Gaus-sian as the kernel is used to highlight MAs, but this process tends to false-detecton vessels. Vessels are therefore first detected by the morphological opening of theshade-corrected retinal image by a long linear structuring element that is rotated tovarious angles to pick up all vessel segments. The length of the structuring element ischosen to be short enough to fit inside curved vessels, and long enough that it cannotfit inside MAs [11] so that it detects vessels (and other large extended features) butnot MAs. The detected vessels are then subtracted from the shade-corrected retinalimage to effect a tophat transform. The resultant image contains small objects suchas MAs and also, in practice, small objects left over from the vessels, such as boli offluorescein if angiographic images are used.
The tophat transformed image is thresholded to detect likely MAs, which we referto as candidates. One could terminate the process at this stage and take all candi-dates as detected MAs, however it is normally found that an acceptable sensitivityleads to an unacceptable specificity. Therefore the candidate locations are used toinitiate region growing on the shade-corrected retinal image to delineate the under-lying morphology of the candidate. Shape and intensity features are measured onthe region-grown object and a classifier is used to refine MA detection. A muchbetter specificity can then be achieved with very little loss in sensitivity. Becausethe candidates are region grown this method typically cannot detect MAs attached tovessels.
This approach was first described by Spencer et al. [11], who tested the processon fluorescein angiographic film negatives digitized at a resolution of 1024× 1024pixels covering a 35° field of the macula. The preprocessing included illuminationcorrection to correct for vignetting incurred in the digitization. The tophat transformused a linear structuring element 11 pixels long rotated to eight orientations. Thematched filter kernel, of size 11×11 pixels, was a two-dimensional circularly sym-

Automated Microaneurysm Detection for Screening 159
metric Gaussian with σ = 1 pixel. Once candidate MAs were region-grown, simpleshape features (area, perimeter, aspect ratio, and complexity) and intensity measures(mean intensity of object) formed the input to a rule-based classifier. Five ophthal-mologists marked the positions of MAs on four high quality photographic prints ofthe retinal images. The automated computer detection of MAs on the four imageswas compared against the clinicians. The computer satisfactorily matched the re-sponse of the clinicians on a free-response receiver operating characteristic (ROC)graph.
This is the first reported use of an automated detection of MAs that comparedfavorably with clinicians. Note that the automated MA detector performed wellcompared to clinicians using photographic prints, thus the problem of poor digitalresolution of their earlier study [10] was resolved. Nevertheless, the test is of limitedgenerality as only four independent images were used and the total number of MAspresent in the images used are not reported.
Further improvements to the Aberdeen automated MA detector were made by Creeet al. [12, 13]. The region-growing algorithm was made computationally efficient,and the classifier was redesigned. Extra features using intensities of candidate MAsnormalized intra- and inter-image were added as was the peak response of the matched-filter that marked an object as a candidate [12]. Comparison of the manually con-structed rule-based classifier with two machine learning approaches (linear discrim-inant analysis and a neural network), found that the manually constructed rule-basedclassifier provided the best result [15]. Cree et al. [12] also reported an automatedmethod to detect the fovea based on Fourier-space correlation of a model of the grossshading of the fovea against a low-passed filtered version of the retinal image. Thusthe whole process of MA detection and counting, including locating the region-of-interest centered on the fovea, was automated.
The improved Aberdeen automated MA detector for detection of MAs in fluo-rescein angiographic images was trained on 64 retinal images and tested against anindependent test set of 20 retinal images of 1024× 1024 pixel resolution of a 35°field-of-view of the macula [13]. The locations of MAs in the test images wereestablished by consensus decision by a clinician and medical physicist using a com-puter program that enabled MAs to be highlighted on screen by mouse clicks. Thetest set contained 297 true MAs and the MA detector achieved a sensitivity of 82%for detecting and correctly locating MAs at 5.7 false-positives per image. MA detec-tion performed by four independent clinicians on the same 20 test images achievedthe same sensitivity at 3.2 false-positives per image. As the free-response ROC curveof the automated detector was close to that of the independent clinicians it was con-cluded that the computer system can reliably detect MAs. Due to the increased num-ber of images and the various stages of retinopathy used in this study, this conclusionis more secure than that of Spencer et al. [11].
6.2.3 Extensions of the standard approach
The standard approach for automated MA detection has been embraced by a numberof groups, including the University of Aberdeen, the research group established bythe author at the University of Waikato, New Zealand, and by others.

160 Automated Image Detection of Retinal Pathology
Hipwell et al. [16] of Aberdeen University modified the automated MA detectorof Cree et al. [13] to work on red-free images of 1024× 1024 pixel resolution of a50° FOV retina either centered on the macula or nasal of the optic disc. Against atesting set of 62 images, containing a total of 88 MAs that broadly reflected the levelof retinopathy expected in an eye-screening population, the automated MA detectorachieved 43% sensitivity with 0.11 false-positives per image for detecting and cor-rectly locating MAs. This less sensitive operating point was chosen as being moresuitable for eye-screening as only one MA per image needs to be detected to identifyretinopathy. The poorer ability to detect MAs in red-free images compared to usingfluorescein angiography seems to have adversely affected the overall ability of theautomated MA detector in this study. In an extensive trial using 3783 directly dig-itized red-free images from the diabetic eye-screening program the automated MAdetector achieved a sensitivity of 81% at a specificity of 93% for detecting imagesthat contained microaneurysms, and a sensitivity of 85% at a specificity of 76% forthe detection of subjects with retinopathy [16]. It was concluded that the automatedMA detector would be useful in a screening context to remove half the images thatcontained no retinopathy, thus would reduce the load of subsequent manual screen-ing.
The Aberdeen automated MA detector [16], in conjunction with an automatedexudate detector [17], was also reported in a comparative evaluation of digital imag-ing, retinal photography, optometrist examination, and automated retinopathy detec-tion [18]. The automated detection again used red-free images of 1024×1024 pixelresolution of a 50° field-of-view (FOV). A total of 586 participants, of which 157had retinopathy, were included. The automated retinopathy detector achieved 83%sensitivity at a specificity of 71% for detecting any retinopathy. This compares to83% sensitivity at 79% specificity for manual detection of retinopathy from the dig-ital red-free images, and 89% sensitivity at 89% specificity for manual detection ofretinopathy from color slides. Olson et al. [18] conclude that the automated retino-pathy detection is not yet ready for sole use as the screening mechanism but couldform an important adjunct to reducing the workload of manual screening.
A number of other groups have used the standard approach as a starting pointfor developing automated MA detectors. Mendonca et al. [19] implement the stan-dard approach for detecting MAs in fluorescein angiographic images but only reportresults of testing on one image. Acha and Serrano [20] used the preprocessing ofMendonca et al. [19] and extended the classifier to include features that are basedon the correlation of various shape filters with the candidates. On five angiographicimages with a mean of 100 MAs per image they achieve 82% sensitivity with 3.3false positives per image. Serrano et al. [21] further enhance the image processingstrategy by using the errors of linear prediction coefficients as a means of adaptivelythresholding the matched-filtered image to generate seed-points for region-growing.The classifier appears to be essentially the same as Acha and Serrano [20]. On 11angiographic images containing a total of 711 MAs they report a sensitivity of 91%for detecting MAs at 7 false-positives per image.
Yang et al. [22] report on the detection of MAs in low-resolution color retinalimages. The green-plane of the color images is used for preprocessing and detection

Automated Microaneurysm Detection for Screening 161
of candidates. The removal of blood vessels in the tophat stage is improved withthe use of a morphological reconstruction [23]. Notably, they dispense with thematched-filtering stage and threshold the tophat processed image to generate seedpoints for region growing. Basic shape features as well as the hue of the candidatesas determined from the full-color information is used in classification. A preliminarytest on 46 images (of healthy and diseased retinae) achieved 90% sensitivity at 80%specificity for detecting presence of MAs in the diseased retinal images. Lalondeet al. [24] use this MA detector in their RetsoftPlus retinal analysis software.
Raman et al. [25, 26] in a study on the effects of image resolution on automateddiabetic retinopathy (DR) detection use an MA detector based on the standard ap-proach. A tophat transform is used to isolate small objects in the shade-correctedimage, and matched-filtering with a Gaussian model to detect vessels. Any smallobjects detected in the tophat that occur on vessels were removed. A genetic algo-rithm processes the MA detections from three 45° fields of an eye to arrive at a reporton the presence of DR for the eye [26]. Color retinal images are used in the studybut no mention is made of how the color information is used. On high resolutionimages (10 DR; 8 no diabetic retinopathy [NDR]) a sensitivity of 90% at a speci-ficity of 88% was achieved for detecting retinopathy. The resolution of the imagesis not stated (other than they are digitized images of 35 mm film of 35° FOV usingmydriasis), and the images were used for both training and testing. On low resolu-tion images (640×480 pixels of a 45° FOV; nonmydriatic direct digitization) of 91subjects (35 DR; 56 NDR), that form an independent test set, a sensitivity of 69%with a specificity of 66% was achieved for detecting retinopathy. This reinforces theconclusion of Spencer et al. [11] that digitization at approximately quarter megapixelresolution is insufficient for automated detection of microaneurysms.
Niemeijer et al. [27] find that the standard approach for segmenting candidatesfails to segment all true MAs, thus they develop a new method to generate candidatesthat is based on pixel classification. After shade-correcting the image, the pixel inten-sities and first- and second-order Gaussian derivatives at various scales are providedto a k-nearest neighbor classifier that produces a probability map for each pixel tobe a small red lesion. This is thresholded and filtered to remove vessel segments andobjects that are too large, leaving the candidates. They test the standard approach andtheir new pixel-based approach for generating candidates and find that both methodsfail to detect 14% of true microaneurysms, but when combined together into a hybridsystem that figure is reduced to 10%. When coupled with the usual region-growingand final classification to detect MAs, the hybrid system achieved 100% sensitivityat 87% specificity for detecting the presence of retinopathy in the 50 training images(27 DR; 23 NDR) of 768×576 pixel resolution.
The standard approach suffers from other known problems. The region growingapplied to delineate candidates can be unreliable if the candidate is on or near avessel, in clusters of microaneurysms, or is in a region of unusual background tex-ture. Most papers based on the standard approach terminate region growing whenintensity increases beyond a locally determined threshold. If the resulting grown ob-ject does not accurately reflect the underlying shape, then the measured features arelikely to be inaccurate, resulting in false-detections or missed microaneurysms. The
162 Automated Image Detection of Retinal Pathology
other problem is local contrast variations — microaneurysms can have poor contrastin some parts of the image while background texture has higher contrast in otherparts of the image. The shade-correction of the retinal image compensates for lo-cal contrast variation, nevertheless close examination of automated microaneurysmdetection results suggest improvements can be made.
Fleming et al. [28] address these concerns. The region growing stopping condi-tion is based on the mean squared gradient magnitude of the boundary of the grownobject. They find that this function is maximized when region growing is terminatedon the boundary of microaneurysms, and its use improves delineation of candidateshape and extent. Fleming et al. measure the background contrast in a local regionabout each candidate with a watershed algorithm that excludes features such as otherMAs and vessels. The background local contrast is used to normalize the intensity-based features measured on the candidate. Features on the boundary of the candidateare measured as well. As a final adjunct vessels are detected in the local region aboutthe candidate (using an efficient scheme to detect linear structures) and any candidatelying on a vessel is removed.
In an earlier study, Fleming et al. [29] showed that the use of their local contrastnormalization and the detection of candidates lying on vessel improves sensitivityby about 6% and specificity by 8% for detecting retinal images containing MAson a database of 720 good quality retinal images, of which 216 contained MAs.Fleming et al. [28] compared a number of local contrast normalization schemes andfound that their proposed scheme performed best and gave a useful improvementto microaneurysm detection. The system achieved a sensitivity of 85.4% at 83.1%specificity for detecting images that contain MAs (1441 images of which 356 containMAs).
All the above implementations of the standard approach (except [22; 27] andmaybe [26]) used monochromatic images such as fluorescein angiographic images,red-free images, or the green plane only of color retinal images. Microaneurysmsare well distinguished in the green plane of color retinal images, nevertheless, onewonders whether using the full color information, particularly in the final classifier,may provide an edge in sensitivity and/or specificity. This is the approach that thepresent author has taken, but we delay discussion to Section 6.3 as the use of colorimages brings in a new set of problems.
6.2.4 Other approaches
The problem that global shade-correction does not normalize the contrast of microa-neurysms sufficiently has also been described by Huang and Yan [30]. They improvelocal contrast by first applying shade-correction coupled with a nonlinear contrastenhancing transform to local 120×120 pixel blocks of the image (that slightly over-lap with one another). Candidate microaneurysms (small circular objects) are foundwith a tophat transform, and the area and maximum intensity of the candidates mustbe greater than locally determined thresholds for the candidate to be accepted asa microaneurysm. The results were determined on far too few images (12 imagesfrom six subjects) for any meaningful comparison to implementations of the stan-

Automated Microaneurysm Detection for Screening 163
dard approach. Walter et al. [31] describe a similar approach to local image contrastnormalization.
Artificial neural networks have been explored for detecting microaneurysms andother lesions in retinal images [32–34]. Varying approaches, ranging from usingraw pixel data to substantially processed image data as inputs to the neural network,have been tried. While Gardner et al. [32] detected lesions and features other thanmicroaneurysms, their work is notable in that they break the image down into smallwindows and use the pixel data of the window (after preprocessing with median fil-ter noise suppression) as well as the result of the Sobel edge operator as inputs to aback propagation neural network. This approach is based on the philosophy that theneural network should be able to recognize the interrelationships between pixels thatenable lesions to be detected. Kamel et al. [33] take a similar approach to detect indi-vidual microaneurysms. Unfortunately the resolution and number of images used inthe study are not stated, thus one cannot use the results of this study. Morganti et al.[34] seem to take a similar approach for detecting microaneurysms and other lesions,though they use a preprocessing step to locate maxima (to detect exudate) and min-ima (to detect microaneurysms), with the pixel data in a 5× 5 pixel window aboutthese points as input to the neural network. They also apply committee techniques tothe neural networks. They use images of 512×768 pixels, which is insufficient reso-lution to detect microaneurysms reliably. Error rates ranging from 8.3% to 12.7% arereported for various algorithms to detect microaneurysms in small image segments.The nonstandard testing methodology makes it hard to compare to other publishedresults.
The output of image processing operators that aid segmentation, such as matched-filters and morphological operators, can be provided as input to the neural network,thus potentially giving the neural network better information to work with. This canbe taken to the extreme in which the standard approach can be used to segment can-didate microaneurysms, and then use a neural network to classify the candidates asmicroaneurysms or spurious objects. This is the approach taken by Frame et al. [15]in which the final classification stage of the microaneurysm detector of Cree et al.[13] was tested with various classifiers including a neural network. The manuallyconstructed rule-based classifier, as used by Cree et al. [13], was found to be best.
A variety of general purpose operators, other than those typified by the standardapproach, can be used to segment microaneurysms in retinal images. Huang et al.[35], after shade-correcting the retinal image, generate an edge map of the retinalimage with the Canny edge detector. The idea is to detect the closed circular edgethat surrounds a microaneurysm. Edges that are too long or too short to be a micro-aneurysm, as well as edges weak in intensity, are removed from the edge map. Edgesthat resemble small circles are identified and, with reference to the green plane of theretinal image, those that enclose a low-intensity region inside the circle are retainedas candidate microaneurysms. This still contains some false-detections, so intensityand shape features are measured on the candidates and used in a classifier to improvespecificity. An advantage of this method is that the segmentation algorithm naturallyprovides the underlying boundary of the microaneurysm without resorting to regiongrowing.

164 Automated Image Detection of Retinal Pathology
Walter et al. [31] note that the tophat transform of the standard approach tends todetect tortuous vessels as round small objects. This is because the linear structuringelement fails to fit inside such vessels at any orientation. They overcome this problemby using a morphological “bounding box” [36] or “diameter” [31] closing (similar tothe “area closing” described by Vincent [37]) to segment microaneurysms. Intensityand shape features are extracted for the candidates and classified with the Bayes clas-sifier with kernel density estimation. The system achieved 89% sensitivity at 2.13false-positives per images for detecting microaneurysms in 94 images (640× 480pixel resolution; 68 DR, 26 NDR) containing a total of 373 microaneurysms [31].This result compared favorably with the three human graders reported. One mayquestion the low resolution of the images, however, it is to be noted they do use a3 CCD color camera that produces better quality images than the equivalent resolu-tion (and typically used) 1 CCD camera with Bayer mask.
Quellec et al. [38] use a wavelet approach to detect microaneurysms. Out of threewavelets tested they find the Haar wavelet performed best with 88% sensitivity at96% specificity for detecting microaneurysms in retinal images. Their database in-cluded 995 images (1280× 1008 pixel resolution) including both angiographic im-ages and photographs. It is not clear how many images were used for training andhow many were used for testing. It is hard to believe that all 995 images were man-ually segmented by graders, as that is a very time-intensive task!
6.2.5 General red lesion detection
All the studies described above aim to detect microaneurysms and dot-hemorrhages,i.e., small red lesions, only. For diabetic eye screening, detecting more extensivehemorrhage in addition to microaneurysms and dot-hemorrhages would be benefi-cial. Some research groups have aimed at developing general automated red lesiondetection.
Lee et al. [39] present a system for the detection of a number of retinal fea-tures including flame and blot hemorrhages as well as dot-hemorrhages and mi-croaneurysms. They use two separate processing pathways, one to detect the largehemorrhages and the other to detect the dot-hemorrhages and MAs. Unfortunatelytheir paper (and an earlier one [40]) provide little detail on the algorithms. In a laterpaper [41] they report on comparison of their automated computer system againstretinal specialists though no details on the algorithms are given and their earlier pa-pers are not cited. On a test set of 428 color fundus images (resolution not stated; 129contain MAs; 275 without MAs; 24 images excluded due to questionable lesions) thecomputer system has a sensitivity of 87% at a specificity of 98% for detecting imageswith microaneurysms. They also report results for automated detection of exudateand cotton wool spots.
Larsen et al. [42, 43] report on testing of the RetinaLyze fundus analysis system.This system can detect a variety of retinal lesions, including hemorrhages and mi-croaneurysms, but no detail is given of the algorithm. On a test set of 400 imagesof 100 patients digitized from slide film at 1448×1296 pixel resolution (30 patients

Automated Microaneurysm Detection for Screening 165
DR; 70 NDR) the computerized system detected patients with diabetic retinopathywith 97% sensitivity at 71% specificity [43].
Sinthanayothin et al. [44] described a system for the detection of retinopathy. Theydetect hemorrhages, microaneurysms (HMAs), and other lesions with use of the“moat operator” (the subtraction of a high pass filtered version of the image from theimage) to create a trough around lesions in the image. The lesions are segmented byregion growing that is terminated at the troughs. A neural network is used to classifysegmented objects into HMAs and non-HMAs. On 30 images (570×550 pixel reso-lution; 14 contain hemorrhages and/or microaneurysms) the system achieved a sen-sitivity of 78% and specificity of 89% for detection of hemorrhage/microaneurysms.
6.3 Microaneurysm Detection in Color Retinal ImagesMost publications on automated microaneurysm detection use monochromatic data,even if full color information is available. The green part of the spectrum containsthe most useful information for discriminating microaneurysms and vascular struc-ture, but whether there is any useful extra information in the red and blue parts of thespectrum is an open question. It is interesting to note that Olson et al. [18] reportedimproved sensitivity and specificity for manual screening for DR with color slidescompared to manual screening with red-free images, though that may be linked tofactors other than the presence of color. Monochromatic automated microaneurysmdetection has achieved reasonable results and any possible further improvements arelikely to be small. Nevertheless, if using color enables a small improvement in speci-ficity for no loss in sensitivity, then this may be important for automated eye screen-ing.
It is normally said that in retinal images, the green plane contains the best detail;the red plane, while brighter and sometimes saturated, has poorer contrast; and theblue plane is dark and typically not much better than noise. Explanations of thecolor content of fundus images based on radiation transport models [45; 46] tell usthat the violet and blue light entering the eye is mostly absorbed by the lens, is furtherabsorbed by melanin and hemoglobin, and is the most scattered light, thus does notcontain much contrast. Hemoglobin has an absorption peak in the green part of thespectrum, thus features containing hemoglobin (e.g., microaneurysms) absorb moregreen light than surrounding tissues, and appear dark and well contrasted in the greenpart of the spectrum. The red light penetrates deeper into the layers of the inner eyeand is primarily reflected in the choroid, explaining the reddish appearance of fundusimages. Because red light has a lower absorption coefficient in the tissues of the eyethan green, the red part of the spectrum is less contrasted. It also depends on themelanin concentration in the choroid.
The author has observed retinal images of Polynesian subjects to have a muchincreased blue component. This observation agrees with the results of Preece andClaridge [46], who show that for a non-Caucasian subject the reflectance of the eye

166 Automated Image Detection of Retinal Pathology
in the red and green parts of the spectrum is much reduced when compared to Cau-casian subjects, whereas the blue reflectance remains similar. Assuming that thephotographer adjusts the fundus camera shutter exposure to increase the brightnessfor non-Caucasian subjects to better expose the captured image, this will appear incaptured retinal images as an increase in the blue component.
The upshot is that the appearance of color retinal images can vary between subjectsconsiderably due to changing shifts in balance between red and green, and betweenred-green and blue. If microaneurysm detection is to use all color information thensome form of color normalization is needed, particularly for mixed populations.
Histogram specification to force color retinal images to a reference histogram hasbeen investigated by a couple of groups [47; 48]. A comparison between gray worldnormalization, color histogram equalization and color histogram specification to astandard image was undertaken by Goatman et al. [48]. Interestingly they found his-togram specification performed best in the sense that the class separateness betweenexudates, cotton wool spots, hemorrhage, and blot hemorrhages in the chromaticitycomponents was best with this method. This result is a little surprising as certain le-sions (such as exudate) are often evident in the shape of the histogram and reshapingof the histogram to a reference that does not necessarily contain the lesion is likelyto mask the lesion.
This criticism of histogram specification lead Erin Gamble, a former master stu-dent of the author, to use a straightforward and general purpose scheme for colornormalization of retinal images [49] in order to modify the automated microaneu-rysm detector of Cree et al. [13] to work on color retinal images. Each color plane ofthe red-green-blue (RGB) color retinal image is processed independently of the oth-ers. First, divisive shade-correction to correct for illumination variation intra-imageis applied, then contrast normalization to a specified mean and standard deviationis applied to correct for illumination variation inter-image. This process retains theoverall shape of the color image histogram, but shifts the hue (which is often domi-nated by the ratio of green to red in retinal images) to be consistent between images.
In the top line of Figure 6.2 is shown two color retinal images, one of a Caucasianand one of a Polynesian. The corresponding color normalized images, using theprocedure of Cree et al. [49] are shown in the bottom line of Figure 6.2. The colornormalized images may not appear familiar to an ophthalmologist, nevertheless thecolor between the images is much more consistent than in the original retinal images.
This scheme for color normalization is straightforward, and now can be imple-mented very efficiently with the discovery of a median filter algorithm whose speedis (almost) independent of the kernel size [50]. It can be criticized for processingthe color planes independently (with the potential for unwanted chromaticity shifts)and not being based on a more robust model of illumination of retinal images. Withhigh resolution color retinal imaging becoming widely available, further researchinto better color normalization of retinal images, particularly to normalize images ofdifferent ethnic groups, is required.
Of the few papers on automated MA detection that use color information [22; 27;31], we leave discussion of their findings on the importance of the color features forMA detection to after discussion of the Waikato Automated Microaneurysm Detectorin the next section.

Automated Microaneurysm Detection for Screening 167
FIGURE 6.2Color normalization of retinal images. Top: color retinal images of a Caucasian anda Polynesian. Bottom: color normalized version of the image directly above. (Seecolor insert following page 174.)
6.4 The Waikato Automated Microaneurysm DetectorThe automated microaneurysm detector, developed by the authors and co-workersat the University of Waikato [49; 51], is a modification of the standard approach towork on color retinal images. The processing of the images for microaneurysms isas follows: The green plane only of the retinal image is used to segment candidatemicroaneurysms. It is divisive shade-corrected and then lightly median filtered fornoise-suppression. The tophat transform is followed by a morphological reconstruc-tion [23] to improve the removal of vessels from the image. A circularly symmet-ric 2-D Gaussian is used as the template for matched-filtering to highlight microa-neurysms. An adaptive threshold then isolates candidates from the match-filteredimage, and region-growing on the shade-corrected green plane at the positions ofcandidates is used to isolate the morphology of the underlying candidate.
The full color information is only used in the classification stage. The retinal

168 Automated Image Detection of Retinal Pathology
image is color normalized by the process described above. In the training stage52 features involving color, intensity, and shape were analyzed, but it was foundthat microaneurysm detection was almost optimal using only seven of the features.Taking r, g, and b to be the red components of the original retinal image, r, g, and bto be the color normalized retinal image, m to be the result of the matched-filter, Ω tobe the set of pixels of a candidate microaneurysm, A = ∑Ω 1 to be the area identicalto the number of pixels in the candidate, and µx
i j to be the 2D central moment oforder i, j of the candidate calculated over image x (where x can be any of r, g, etc.)then,
Red Mean R =1A ∑
i∈Ω
ri (6.1)
Norm Red Mean ¯R =1A ∑
i∈Ω
ri (6.2)
Green Std. Dev. σg =
√√√√ 1A
(∑i∈Ω
(g2i )−
(∑i∈Ω
gi)2
/A
)(6.3)
Norm Blue Std. Dev. σb =
√√√√ 1A
(∑i∈Ω
(b2i )−
(∑i∈Ω
bi)2
/A
)(6.4)
Matched Filter Mean M =1A ∑
i∈Ω
mi (6.5)
Norm Green Rot. Inert. IG =1A
(µ
g20 + µ
g02
)(6.6)
Minor Axis Length l− (6.7)
The minor axis length l− is the length of the minor axis of the ellipse that has thesame normalized second moments as the candidate.
The feature “norm green rot. inert.,” is the rotational inertia about the centroid ofa flat plate of the same shape as the candidate and with density given by the colornormalized green component, and scaled by the area. It depends usefully on both theshape and intensity distribution (in the color normalized green plane) of the micro-aneurysm. In the green plane microaneurysms are darker than the surrounding tissue,hence the normalized green rotational inertia feature is typically small for microa-neurysms. The further the candidate deviates from being a perfectly round disc, thegreater this feature, and if the boundary of the candidate does not approach the back-ground retinal intensity in the normal way this feature is likely to be increased. Thisfeature proves to be the most powerful of the list above for discriminating microa-neurysms from spurious objects.
The microaneurysm detector was trained on 80 retinal images (60 DR; 20 NDR),captured at 50 field-of-view with a Topcon fundus camera and a Nikon D1X 6 mega-pixel digital camera. The images contained JPEG quantization tables identical to
Automated Microaneurysm Detection for Screening 169
those produced by the Independent JPEG Group’s opensource code∗ when set to95% quality. A later closer examination of the images revealed an unusual distri-bution in the raw JPEG stream suggestive that these images have been JPEG com-pressed at least twice, putting into question the 95% quality claim. It also raisesquestions about quality control of retinal images, of which we have more to say inSection 6.5.2 below.
The microaneurysm detector was run on the images to the stage of segmentingthe candidates. Each candidate was labeled as a microaneurysm or a spurious objectby an expert in the field. The features listed above (plus others) were measuredover each candidate. There were 3053 candidates detected on the sixty, images ofwhich 401 were marked as microaneurysms by the expert, leaving the other 2652as spurious objects. The expert identified another 14 microaneurysms in the imagesthat were not segmented as candidates by the automated software, for a total of 415microaneurysms.
The retinal images used in this study were obtained from a mobile eye-screeningprogram, and the Nikon digital camera had to be removed from the fundus camerato fit it in the vehicle for transport from one eye center to another. Unfortunatelydust got into the camera optics, and the dust marks in the image bear a strikingsimilarity to microaneurysms. Indeed the trained expert originally identified 465“microaneurysms” in the training images before it was realized some were dust andremoved to leave the 415 microaneurysms in the gold standard. Because at leastfour retinal images were captured per patient at a visit on the same day, it wasstraight-forward to analyze all images of a patient with the automated microaneu-rysm detector and remove detections of candidates that occur at the same positionin a majority of the patient’s images. Presence of dust as a confounding issue fordetecting microaneurysms, even using direct digital retinal photography, has beennoted elsewhere [52].
A number of different classifiers were tested for their ability to distinguish mi-croaneurysms [49], and the naıve Bayes classifier [53] was finally chosen for im-plementation. Despite the potentially flimsy assumption it is based upon (statisticalindependence of the features) it is known to perform surprisingly well in some do-mains, and is very fast to run [54]. In our tests more sophisticated (and slower)classifiers only gave marginal improvements.
The receiver operating characteristic (ROC) curve for classifying the 3053 candi-dates correctly as microaneurysms or spurious objects is shown in Figure 6.3. Thenonparametric curve does not quite approach 100% (except at 0% specificity) asthere are 14 microaneurysms that are not detected by the candidate generation al-gorithm. The parametric curve is a fitting of the bi-normal ROC model [55] by anonlinear least squares fit to the nonparametric curve.
The detection of microaneurysms in an image can be used to predict the presenceof diabetic retinopathy. We use the number of detected microaneurysms in an imageas the predictor for the presence of diabetic retinopathy. The resultant ROC curve is
∗libjpeg version 6b, downloadable from www.ijg.org.

170 Automated Image Detection of Retinal Pathology
0 0.2 0.4 0.6 0.8 10
0.2
0.4
0.6
0.8
1
1 − specificity
se
nsitiv
ity
Detection of Microaneurysms in Training Images
Non-parametric ROC curve
Parametric ROC curve
FIGURE 6.3Result of classification of candidates as microaneurysms by the naıve Bayes classi-fier.
0 0.2 0.4 0.6 0.8 10
0.2
0.4
0.6
0.8
1Detection of Images with Retinopathy
1 − specificity
se
nsitiv
ity
Non-parametric ROC curve
Parametric ROC curve
FIGURE 6.4ROC graph for determining presence of diabetic retinopathy by the number of de-tected microaneurysms in the training images.
Automated Microaneurysm Detection for Screening 171
shown in Figure 6.4. This result is after a few false detections of microaneurysmsthat were in fact dust marks were automatically removed, however, dust detectiononly gave a marginal improvement, indicating that the microaneurysm detector isdistinguishing microaneurysms from dust reasonably reliably.
The Waikato Automated Microaneurysm Detector has been tested on images froma completely different source that was not affected by dust [56]. These images wereacquired at 2.8 megapixel resolution and were approximately 1560×1360 pixels af-ter cropping the black regions of the images away. As this is a lower resolution thanthe microaneurysm detector was trained on, the parameters (such as the tophat linearstructure size, and the matched filter template diameter) were adjusted proportion-ally to match. No changes were made to the naıve Bayes classifier. The automateddetector was run on 745 color retinal images (145 DR; 600 NDR). There were 34images with extensive white reflections (sometimes seen in retinal images of youngpeople), and the microaneurysm detector false-detected extensively as the white re-flections broke up the vessels into small segments. Such images were not present inthe database the automated microaneurysm detector was trained on, and are unlikelyto be seen in any numbers in an eye-screening program so were removed from thisstudy. The automated microaneurysm detector achieved 85% sensitivity and 90%specificity for detecting diabetic retinopathy on the remaining 711 images [56].
6.4.1 Further comments on the use of color
We return to further consider whether the use of full color information in color retinalimages provides a useful benefit over use of the green plane alone. In the WaikatoAutomated Microaneurysm Detector two red features and one blue feature (Equa-tions 6.1 through 6.7) were found to be beneficial. It is interesting that the standarddeviation of the normalized blue component over the candidate provided a smallbut useful improvement in microaneurysm detection. Since only eighty images areused in training, there remains a possibility that this improvement may be due to theparticular training set used, and would not be replicated with a much larger testingdatabase. But there is another possibility: it is possible that the blue field enabled theclassifier to better distinguish microaneurysms from the dust marks, and would notbe replicated in a study with clean retinal images.
This reliance on color-based features for classification of microaneurysms was notreplicated by Walter et al. [31]. They explored the use of various color features, butfound that only the Euclidean color difference measured in Lab color space providedextra discriminatory power. Yang et al. [22] find the hue of the candidate usefulfor discrimination but do not indicate whether they explored other color features.Niemeijer et al. [27] include a variety of color features (the contrast in red, green,blue, and hue) in their k-nearest neighbor classifier. They ran feature selection testsand report that no subset of their original set of 68 features improved classification,but do not report whether the removal of any features (such as the color features)impacts negatively on classification.
These experiences of using color to aid MA detection seem a little contradictory,and it remains an open question as to whether the use of color features, when color

172 Automated Image Detection of Retinal Pathology
retinal images are being analyzed, provides a useful improvement to automated MAdetection.
6.5 Issues for Microaneurysm DetectionThere are a number of issues for successful use of automated microaneurysm detec-tion in diabetic eye screening. We can split these into two classes: the actual issuesthat impact negatively on reliable microaneurysm detection, and the means of veri-fying that an automated microaneurysm detection system is reliable enough for itsintended use. In this section we first discuss things that impact negatively on reli-able microaneurysm detection, namely poor image quality, the use of lossy imagecompression, and the causes of false detections of microaneurysms. We then turn tothe issue of verifying automated microaneurysm detectors in a meaningful way thatallows cross-comparisons.
6.5.1 Image quality assessment
Largely ignored in the literature is the effect of image quality on automated micro-aneurysm detection (notable exceptions are [57; 58]). In eye screening studies anot insignificant proportion of images are of poor contrast or blurred due to factorssuch as lens cataract and teary eyes. In such situations automated microaneurysmdetection is impaired at best and may completely fail at worst. If automated micro-aneurysm detection is to be used as a means of determining the presence of diabeticretinopathy, then retinal image quality assessment needs to be automated, so thatpoor quality images can be reported. This is an area that needs further investiga-tion.
Also not often realized is that the single lens reflex (SLR) digital cameras nowtypically used with fundus cameras do not record full color at each pixel. A Bayermask is placed over the light sensor so that only one of the primary colors (in somecases secondary colors) of light is measured at each pixel. Software interpolation(within the camera) is used to estimate full color information at each pixel fromlower resolution measurements of different colors in its neighborhood. In contrast a3-CCD camera has three CCD sensors, one CCD for each primary color, so that fullcolor is acquired at full resolution. A 3-CCD camera normally performs substantiallybetter than a camera with a Bayer mask rated at the same resolution.
There is a criticism that high resolution digital cameras (greater than say 1 mega-pixel) are unnecessary for imaging the retina as their resolution exceeds the limit ofresolvable detail imageable through the eye. But considering the loss in detail dueto the typically used Bayer mask it is prudent to use a camera of higher specifiedresolution to ensure that the observeable detail is actually captured.

Automated Microaneurysm Detection for Screening 173
6.5.2 Image compression implications
The use of JPEG (Joint Photographic Experts Group) compression† at source in digi-tal retinal image acquisition is ubiquitous. JPEG compression is a lossy compression.Not only is it impossible to recover the original image data as provided by the camerasensor, there is also a loss of general image quality due to smoothing of image dataand introduced blockiness and ringing artifacts.
It is almost unavoidable to work with anything but JPEG compressed images inretinal imaging. The author is aware of one research center that purchased a funduscamera and retinal imaging suite, and were assured by the distributor that the sys-tem could capture and store the original uncompressed image data, but later foundthat the images saved in uncompressed TIFF format by the system contained theblatant signatures of JPEG compression in the image data. It is likely the digitalcamera JPEG compressed the image data before sending it to the client computer,despite the client software’s claim it was handling and saving uncompressed imagedata. We have already noted above how the training images for the Waikato Auto-mated Microaneurysm Detector contain evidence of being saved at least twice withJPEG compression. Each compression with JPEG degrades image data, and retinalimaging systems do not provide audit trials of degraded image data.
A number of studies on the ability of ophthalmologists to detect and grade thepresence of clinically significant disease in JPEG degraded retinal images have sup-ported the not uncommon assumption that a certain amount of JPEG compressioncan safely be tolerated in retinal images. All of these studies have focused on theability of expert graders and ophthalmologists to grade retinal images. There appearto be only two studies that consider the effect of JPEG compression on automateddetection of retinal lesions, both focusing on microaneurysm detection.
First it is worth summarizing the results of studies that consider the effect of JPEGcompression on manual grading of retinal images. Studies using questionable reso-lution (about 800× 600 pixels) find that specialists overly misgrade retinal imageswith compression ratios (raw image data size to JPEG compressed image size) as lowas 30:1 [59–61], whereas those that use a more suitable higher original image res-olution find that higher compression ratios can be sustained [62; 63]. For example,Baker et al. [64], who used image resolution of 3040× 2008 pixels‡ (6 megapixel)found no problems with image compression ratios as large as 113:1. This result isnot unexpected: the better the original image resolution and quality, the larger thecompression ratios that can be withstood.
It is typical, as in the above reported studies, to report JPEG compression ratiosas a measure of how much the images are compressed. Typically the larger thecompression ratio, the lower the quality of the image and the more noticeable theintroduced artifacts. Nevertheless compression ratios do not fully characterize theresultant image quality and may not be directly comparable between studies. There
†http://www.jpeg.org. The JPEG standard is available as ISO/IEC IS 10918-1.‡Baker et al. reported resolution as 2008× 3040 pixels, however, it is likely they have reported rows bycolumns rather than the more commonly reported width by height.

174 Automated Image Detection of Retinal Pathology
are two reasons for this. First, JPEG compression involves a number of steps andquite a few parameters that are not directly accessible to the user. The mapping of theuser-specified quality factor to the internal parameters (particularly the quantizationtables used for JPEG compression) is software package dependent, thus the qualityfactor of one package need not produce the same compression and image qualityas that of another package. The second reason arises from the final step in JPEGcompression, namely lossless Huffman encoding, which is used to further compressthe image bitstream. The amount of compression achieved by Huffman encoding isdependent on the nature of the original image. For example, areas of entirely blackpixels can be compressed very efficiently, so retinal images with large surroundingblack areas (which sometimes happens with digital camera backends that have a3:2 aspect ratio) achieve larger compression ratios, for the same image quality, thanretinal images where the fundus camera aperture is much more tightly cropped.
JPEG compression has three major effects: it smoothes image data, it introducesringing about sharp edges (a similar effect to the Gibbs phenomenon of the Fouriertransform) and it introduces blockiness artifacts on an 8× 8 pixel basis. Many im-plementations of JPEG compression also halve the resolution (at least in the verticaldirection) of the chroma components of color images. The smoothing of image data,provided that compression ratios are not too high, can actually be a benefit as it actsas a noise-suppression technique. In contrast, the blockiness artifacts, since they canbe of similar scale to microaneurysms, are particularly likely to be detrimental tomicroaneurysm detection. The ringing about sharp edges is likely to be detrimentalto measuring fine vessel characteristics and the detection of finely detailed lesionssuch as neovascularization.
Of importance here is Hansgen et al. [65] in which automated microaneurysm de-tection on JPEG and wavelet compressed fluorescein angiographic images was testedwith the microaneurysm detector of Cree et al. [13]. Using a test-bed of 20 retinalimages of 35° field-of-view (FOV) at 1024×1024 resolution, they found that a lossof sensitivity and an increasing false-positive detection rate of microaneurysms wasnoticeable at a JPEG compression ratio of 10:1 and started to become severe at about20:1 compression ratio. The wavelet compression proved to be less disastrous formicroaneurysm detection.
That wavelet compression is a better compression method than the discrete cosinetransform (DCT) used in standard JPEG compression has been recognized by JPEG.The newer 2000 standard replaces the DCT with a wavelet compression and poten-tially provides better image quality for the same compression ratio. Unfortunatelyadoption of this standard has been slow.
The most recent study on the effect of JPEG compression on automated micro-aneurysm detection [66] was performed by the current author. The eighty train-ing images for the Waikato Automated Microaneurysm Detector were further com-pressed with the Independent JPEG Group’s software to 70%, 50%, 30%, and 10%quality (recall the original images appeared to be 95% quality). The result of usingthe automated microaneurysm detection to detect retinopathy based on the presenceof microaneurysms is shown in Figure 6.5. Note the drop-off in sensitivity for the50% and 30% quality curves compared to the 75% and 95% quality curves. Assum-ing the drop in sensitivity for the 50% quality can be replicated with testing on a

Automated Microaneurysm Detection for Screening 175
ROC: Predicting Retinopathy on JPEG Images
1 − specificity
se
nsitiv
ity
FIGURE 6.5Predicting retinopathy based on the presence of microaneurysms on images that havebeen degraded by JPEG compression. (From Cree, M. J. and Jelinek, H. F. The Ef-fect of JPEG Compression on Automated Detection of Microaneurysms in RetinalImages, Proc. SPIE, 6813, p. 68130M-6, 2008. With permission.)
larger independent dataset, then the loss of sensitivity might mean the difference inmeeting required reliability targets for microaneurysm detection in an eye-screeningprogram.
Ideally the test should be performed on a larger independent set of retinal imagesthat are acquired without any JPEG compression so that a baseline can be set tocompare minimal JPEG compression against original image data. Cree and Jelinek[66] do present results using an independent test set, but it is only 20 images (12 DR;8 NDR) and the results are somewhat inconclusive due to too few images. Furtherresearch into the effects of JPEG image compression on automated retinal pathologydetection is required.
6.5.3 Optic disc detection
False detections of microaneurysms can occur on the optic disc. An effective auto-mated microaneurysm detector must detect the optic disc so that it can remove anydetections of microaneurysms in the vicinity of the optic disc. There are a numberof proposals for optic disc detection, however, many of them fail to detect abnormaloptic discs reliably or false detect in the presence of extensive yellow lesions.
6.5.4 Meaningful comparisons of implementations
In the review above results of testing of automated microaneurysm detectors havebeen reported whenever the studies have included results in their publications. It

176 Automated Image Detection of Retinal Pathology
would be a dangerous thing to say that one automated MA detector is better or moresuited than another based on these reported results. There are a number of reasonswhy this is so, ranging from a failure to sufficiently report the conditions under whichthe study has been performed, to testing on an image database, whether by numberor type of images included, that is not reflective of the anticipated application for theautomated MA detector.
A common failure is to test on image databases of far too few images. Some stud-ies hide this fact by breaking images down into small image segments, thus inflatingthe numbers of test cases but not their independence. Admittedly researchers oftenhave access only to a limited number of images that have suitable annotations of thepresence of lesions by experts. Nevertheless, if results are to be meaningful, auto-mated MA detectors (indeed any computer-aided detection of retinal lesions) mustbe tested on a large number of images that embody the breadth in quality, of ap-pearance, levels of retinopathy, and of confounding lesions that occur in practice.For example, to compare two systems, one with a true area under the curve (AUC)of 0.85 and the other with a true AUC of 0.9, one should plan on 350 healthy im-ages and 350 diseased images to achieve statistical significance at the 80% level toestablish the difference between the two systems [67].
Studies vary in the level of retinopathy present in their image databases, whichmay bias results from study to study. Microaneurysm detection on images with lotsof microaneurysms is likely to produce high false-positive rates because of the pres-ence of doubtful microaneurysms. Even expert human observers have a certain levelof disagreement not only with others but also with themselves on such images. It isimportant to report the level of retinopathy and the number of microaneurysms in thetest database.
Some studies have used images of low resolution in which microaneurysms are toopoorly resolved to be reliably detected. It is the opinion of this author that resolutionsbelow 1000× 1000 pixels are suboptimal for microaneurysm detection. If a colordigital camera is used then even higher resolution is preferable to counteract thedegradation in image quality at capture due to the camera Bayer mask and subsequentimage degradation due to JPEG compression.
Researchers are also developing automated lesion detection for various reasons.If the aim is a research tool that grades retinopathy by microaneurysm counts thenit is important to test the system for the ability to both detect and accurately locatemicroaneurysms in retinal images. On the other hand, if the aim is to develop asystem for the detection of diabetic retinopathy, say for use in eye screening, thenaccurate microaneurysm counts are not necessary. As long as one microaneurysmis detected per image that contains microaneurysms then the system may be quitesuccessful.
Thus meaningful comparisons between published studies are often hard to drawdue to variation in testing methodologies and test image banks. There is a needfor a publicly accessible and generally approved database of images with markedmicroaneurysms for testing automated microaneurysm detectors. The STARE [68]and DRIVE [69] databases of images with accompanying gold standards for vesseldetection, and the acceptance of testing new vessel detection algorithms against these

Automated Microaneurysm Detection for Screening 177
databases, are shining examples of what can be achieved. The recently announcedRetinopathy Online Challenge§ is an interesting development in this area, and weawait the results of the competition.
6.6 Research Application of Microaneurysm DetectionWhile much work on automated microaneurysm detection is motivated by the needto reduce costs in diabetic eye screening, some work is aimed at enabling other-wise labor-intensive research studies. That the number of microaneurysms reflect theseverity of diabetic retinopathy and its likely progression was established by labor-intensive research studies conducted over many years and involving a large numberof patients [3–5]. A computer system that could automatically grade retinal imageswould make collecting and analyzing data for such large studies more manageable.
The work of Goatman et al. [6] using automated microaneurysm detection to studythe life cycle of microaneurysms is a noteable move in this direction. In this studytwo fluorescein angiographic images of 35 patients with diabetic retinopathy weretaken (nominally) a year apart. The images of 10 patients (image set 1) were an-alyzed by manual grading and by automated detection of microaneurysms, and theimages of the remaining 25 patients (image set 2) by automated detection of mi-croaneurysms only. The small increase in the number of microaneurysms betweenbaseline and 1-year follow-up did not reach statistical significance.
The ability of the microaneurysm detector to detect new microaneurysms (thatis, MAs seen at 1-year follow-up but not at baseline), static microaneurysms (MAsseen at baseline and 1-year follow-up), and regressed microaneurysms (MAs seenat baseline and have disappeared at 1-year follow-up) was verified to be comparableto the manual graders. The determination of the total number of microaneurysms issomewhat resistant to operator error as errors of omissions tend to balance out errorsin inclusion. In contrast, detection of microaneurysm turnover (new and regressedMAs) is degraded by such errors.
Manual annotation of microaneurysms is subject to intra-observer variation. Ex-pert graders’ decisions can vary from one session to another, with a reproducibility(the ratio of the number of MAs that matched in both sessions to the number ofunique MAs found in both sessions) of 78%, the best reported [6; 70–72]. An auto-mated system is not subject to this error and has a 100% reproducibility. Even thoughthe automated system is not quite as sensitive as the manual observers, that it is ex-actly consistent may be more important for determining microaneurysm turnover.
Goatman et al. [6] found that 57% of microaneurysms at baseline of image set 1,(respectively 53% of image set 2) were present a year later (static MAs), the bal-ance being regressed microaneurysms. The small increase in the number of microa-neurysms between baseline and follow-up did not reflect the high level of turnover
§http://roc.healthcare.uiowa.edu/.

178 Automated Image Detection of Retinal Pathology
of microaneurysms measured. They suggest that turnover data may be more sensi-tive than counts of microaneurysms at predicting progression of diabetic retinopathy.Further larger studies are needed to test this claim, and are an area where automatedanalysis can have a role to play.
6.7 ConclusionBecause microaneurysms are normally the first lesion seen in early diabetic retinopa-thy and microaneurysm counts have an established relationship to severity of diabeticretinopathy, there is some impetus to develop CAD software for the automated de-tection of microaneurysms in retinal images. Early attempts focused on detection influorescein angiographic images where MAs are better visualized, whereas there isnow a drive to develop software for use on color retinal images for the automateddetection of diabetic retinopathy in eye-screening programs.
A range of image processing strategies have been proposed for automated MAwith a number of systems achieving over 80% sensitivity and 80% specificity for thedetection of images containing microaneurysms. Still better is required for an eye-screening program. Some systems have claimed sensitivities or specificities near90%, however, the variation in testing methodologies and substantial weaknessesand differences in test image sets make it difficult to compare systems or to assesswhether they would be suitable for their intended purpose. There is a need to estab-lish testing methodologies that enable useful comparison of automated MA detectionsystems.
In addition to the problems in testing methodologies, we have highlighted issuesin using color images, and the need for image quality assessment and optic discdetection for an effective automated MA detector. In addition, being able to deter-mine the retinal field and which eye is being viewed would be useful. Automatedmicroaneurysm detection may be useful to reduce the workload of manual screen-ing, however, for a fully automated eye screening system it will be necessary to beable to detect less commonly occurring lesions. Systems to meet such needs includeexudate and hemorrhage detection, however, for a robust system, being able to detectvessel lesions, such as venous beading and new vessel growth, will be essential.
References[1] Crick, R.P. and Khaw, P.T., A textbook of clinical ophthalmology, World Scien-
tific, New Jersey, 3rd ed., 2003.

Automated Microaneurysm Detection for Screening 179
[2] Kohner, E.M., Sleightholm, M., and KROC Collaborative Study Group, Doesmicroaneurysm count reflect severity of early diabetic retinopathy? Ophthal-mology, 93, 586, 1986.
[3] Kohner, E.M., Stratton, I.M., Aldington, S.J., et al., Microaneurysms in thedevelopment of diabetic retinopathy (UKPDS 42), Diabetologia, 42(9), 1107,1999.
[4] Klein, R., Meuer, S.M., Moss, S.E., et al., The relationship of retinal micro-aneurysm counts to the 4-year progresssion of diabetic retinopathy, Archives ofOphthalmology, 107, 1780, 1989.
[5] Klein, R., Meuer, S.M., Moss, S.E., et al., Retinal microaneurysm countsand 10-year progression of diabetic retinopathy, Archives of Ophthalmology,113(11), 1386, 1995.
[6] Goatman, K.A., Cree, M.J., Olson, J.A., et al., Automated measurementof microaneurysm turnover, Investigative Ophthalmology & Visual Science,44(12), 5335, 2003.
[7] Kohner, E.M. and Dollery, C.T., The rate of formation and disapearance ofmicroaneurysms in diabetic retinopathy, Eur J Clin Invest, 1(3), 167, 1970.
[8] Lay, B., Baudoin, C., and Klein, J.C., Automatic detection of microaneurysmsin retinopathy fluoro-angiogram, Proceedings of the SPIE, 432, 165, 1983.
[9] Baudoin, C.E., Lay, B.J., and Klein, J.C., Automatic detection of microa-neurysms in diabetic fluorescein angiography, Rev. Epidem. et. Sante Publ.,32, 254, 1984.
[10] Spencer, T., Phillips, R.P., Sharp, P.F., et al., Automated detection and quan-tification of microaneurysms in fluorescein angiograms, Graefes Arch Clin ExpOphthalmol, 230(1), 36, 1992.
[11] Spencer, T., Olson, J.A., McHardy, K.C., et al., An image-processing strategyfor the segmentation and quantification of microaneurysms in fluorescein an-giograms of the ocular fundus, Computers and Biomedical Research, 29, 284,1996.
[12] Cree, M.J., Olson, J.A., McHardy, K.C., et al., Automated microaneurysm de-tection, in International Conference on Image Processing, Lausanne, Switzer-land, 1996, vol. 3, 699–702.
[13] Cree, M.J., Olson, J.A., McHardy, K.C., et al., A fully automated comparativemicroaneurysm digital detection system, Eye, 11, 622, 1997.
[14] Cree, M.J., Olson, J.A., McHardy, K.C., et al., The preprocessing of retinal im-ages for the detection of fluorescein leakage, Physics in Medicine and Biology,44(1), 293, 1999.
[15] Frame, A.J., Undrill, P.E., Cree, M.J., et al., A comparison of computer based

180 Automated Image Detection of Retinal Pathology
classification methods applied to the detection of microaneurysms in oph-thalmic fluorescein angiograms, Computers in Biology and Medicine, 28(3),225, 1998.
[16] Hipwell, J.H., Strachan, F., Olson, J.A., et al., Automated detection of mi-croaneurysms in digital red-free photographs: A diabetic retinopathy screeningtool, Diabetic Medicine, 17(8), 588, 2000.
[17] Phillips, R., Forrester, J., and Sharp, P., Automated detection and quantificationof retinal exudates, Graefes Arch Clin Exp Ophthalmol, 231(2), 90, 1993.
[18] Olson, J.A., Strachan, F.M., Hipwell, J.H., et al., A comparative evaluation ofdigital imaging, retinal photography and optometrist examination in screeningfor diabetic retinopathy, Diabetic Medicine, 20(7), 528, 2003.
[19] Mendonca, A.M., Campilho, A.J., and Nunes, J.M., Automatic segmentationof microaneurysms in retinal angiograms of diabetic patients, in 10th Interna-tional Conference on Image Analysis and Processing, 1999, 728–733.
[20] Acha, B. and Serrano, C., Automatic detection of microaneurysms in retinalangiograms, International Congress Series, 1256, 1328, 2003.
[21] Serrano, C., Acha, B., and Revuelto, S., 2D adaptive filtering and region grow-ing algorithm for the detection of microaneurysms in retinal angiograms, inMedical Imaging 2004, San Diego, CA, 2004, vol. 5370 of Proceedings of theSPIE, 1924–1931.
[22] Yang, G., Gagnon, L., Wang, S., et al., Algorithm for detecting micro-aneurysms in low-resolution color retinal images, in Proceedings of Vision In-terface 2001, Ottawa, Canada, 2001, 265–271.
[23] Vincent, L., Morphological grayscale reconstruction in image analysis: Appli-cations and efficient algorithms, IEEE Transactions on Image Processing, 2,176, 1993.
[24] Lalonde, M., Laliberte, F., and Gagnon, L., Retsoftplus: A tool for retinal im-age analysis, in 17th IEEE Symposium on Computer-Based Medical Systems(CBMS’04), Bethesda, MD, 2004, 542–547.
[25] Raman, B., Wilson, M., Benche, I., et al., A JAVA-based system for segmen-tation and analysis of retinal images, in 16th IEEE Symposium on Computer-Based Medical Systems (CBMS’03), 2003, 336–339.
[26] Raman, B., Bursell, E.S., Wilson, M., et al., The effects of spatial resolutionon an automated diabetic retinopathy screening system’s performance in de-tecting microaneurysms for diabetic retinopathy, in 17th IEEE Symposium onComputer-Based Medical Systems (CBMS’04), 2004, 128.
[27] Niemeijer, M., van Ginneken, B., Staal, J., et al., Automatic detection of red le-sions in digital color fundus photographs, IEEE Transactions on Medical Imag-ing, 24(5), 584, 2005.

Automated Microaneurysm Detection for Screening 181
[28] Fleming, A.D., Philip, S., Goatman, K.A., et al., Automated microaneurysmdetection using local contrast normalization and local vessel detection, IEEETransactions on Medical Imaging, 25(9), 1223, 2006.
[29] Fleming, A.D., Goatman, K.A., Philip, S., et al., Local environment analysis toaid microaneurysm detection, in Medical Image Understanding and Analysis(MIUA2005), Bristol, UK, 2005, 15–18.
[30] Huang, K. and Yan, M., A local adaptive algorithm for microaneurysms detec-tion in digital fundus images, in Computer Vision for Biomedical Image Appli-cations, 2005, vol. 3765 of Lecture Notes in Computer Science, 103–113.
[31] Walter, T., Massin, P., Erginay, A., et al., Automatic detection of microa-neurysms in color fundus images, Medical Image Analysis, 11, 555, 2007.
[32] Gardner, G.G., Keating, D., Williamson, T.H., et al., Automatic detection ofdiabetic retinopathy using an artificial neural network: A screening tool, BritishJournal of Ophthalmology, 80, 940, 1996.
[33] Kamel, M., Belkassim, S., Mendonca, A.M., et al., A neural network approachfor the automatic detection of microaneurysms in retinal angiograms, in Inter-national Joint Conference on Neural Networks (IJCNN’01), Washington, DC,2001, vol. 4, 2695–2699.
[34] Morganti, M., Sperduti, A., and Starita, A., A multiple classifier system forthe automatic localization of anomalies in retinas of diabetic patients, in 3rdInternational Conference on Neural Networks and Expert Systems in Medicineand Healthcare, Pisa, Italy, 1998, 101–108.
[35] Huang, K., Yan, M., and Aviyente, S., Edge directed inference for microa-neurysms detection in digital fundus images, in Medical Imaging 2007: ImageProcessing, 2007, vol. 6512 of Proceedings of the SPIE, 51237.
[36] Walter, T. and Klein, J.C., Automatic detection of microaneurysms in colorfundus images of the human retina by means of the bounding box closing,in Medical Data Analysis, Proceedings, 2002, vol. 2526 of Lecture Notes inComputer Science, 210–220.
[37] Vincent, L., Morphological area openings and closings for greyscale images, inNATO Shape in Picture Workshop, Driebergen, The Netherlands, 1992, 197–208.
[38] Quellec, G., Lamard, M., Josselin, P.M., et al., Detection of lesions in retinaphotographs based on the wavelet transform, in 28th IEEE EMBS Annual In-ternational Conference, New York City, 2006, 2618–2621.
[39] Lee, S.C., Wang, Y., and Lee, E.T., Computer algorithm for automated detec-tion and quantification of microaneurysms and hemorrhages (HMAs) in colorretinal images, in Medical Imaging 1999: Image Perception and Performance,1999, vol. 3663 of Proceedings of the SPIE, 61–71.

182 Automated Image Detection of Retinal Pathology
[40] Lee, S.C. and Wang, Y., A general algorithm for recognizing small, vague,and imager-alike objects in a nonuniformly illuminated medical diagnostic im-age, in 32nd Asilomar Conference on Signals, Systems and Computers, PacificGrove, CA, 1998, vol. 2, 941–943.
[41] Lee, S.C., Wang, Y., and Tan, W., Automated detection of venous beading inretinal images, Proceedings of the SPIE, 4322, 1365, 2001.
[42] Larsen, N., Godt, J., Grunkin, M., et al., Automated detection of diabetic retino-pathy in a fundus photographic screening population, Investigative Ophthal-mology & Visual Science, 44(2), 767, 2003.
[43] Larsen, M., Godt, J., Larsen, N., et al., Automated detection of fundus photo-graphic red lesions in diabetic retinopathy, Invest Ophthalmol Vis Sci, 44(2),761, 2003.
[44] Sinthanayothin, C., Boyce, J.F., Williamson, T.H., et al., Automated detectionof diabetic retinopathy on digital fundus images, Diabet Med, 19(2), 105, 2002.
[45] Delori, F.C. and Pflibsen, K.P., Spectral reflectance of the human ocular fundus,Applied Optics, 28(6), 1061, 1989.
[46] Preece, S.J. and Claridge, E., Monte Carlo modelling of the spectral reflectanceof the human eye, Physics in Medicine and Biology, 47, 2863, 2002.
[47] Osareh, A., Mirmehdi, M., Thomas, B., et al., Classification and localisation ofdiabetic-related eye disease, in 7th European Conference on Computer Vision(ECCV2002), 2002, vol. 2353 of Lecture Notes in Computer Science, 502–516.
[48] Goatman, K.A., Whitwam, A.D., Manivannan, A., et al., Colour normalisationof retinal images, in Proceedings of Medical Image Understanding and Analy-sis, Sheffield, UK, 2003, 49–52.
[49] Cree, M.J., Gamble, E., and Cornforth, D.J., Colour normalisation to reduceinter-patient and intra-patient variability in microaneurysm detection in colourretinal images, in APRS Workshop on Digital Image Computing (WDIC2005),Brisbane, Australia, 2005, 163–168.
[50] Perreault, S. and Hebert, P., Median filtering in constant time, IEEE Transac-tions on Image Processing, 16, 2389, 2007.
[51] Streeter, L. and Cree, M.J., Microaneurysm detection in colour fundus images,in Proceedings of the Image and Vision Computing New Zealand Conference(IVCNZ’03), Palmerston North, New Zealand, 2003, 280–285.
[52] Sharp, P.F., Olson, J., Strachan, F., et al., The value of digital imaging in dia-betic retinopathy, Health Technology Assessment, 7(30), 1, 2003.
[53] Bayes, T., An essay towards solving a problem in the doctrine of chances,Philosophical Transactions of the Royal Society of London, 53, 370, 1763.
[54] Han, J. and Kamber, M., Data Mining Concepts and Techniques, Morgan Kauf-man, 2001.

Automated Microaneurysm Detection for Screening 183
[55] Metz, C.E., ROC methodology in radiologic imaging, Investigative Radiology,21, 720, 1986.
[56] Jelinek, H.F., Cree, M.J., Worsley, D., et al., An automated microaneurysmdetector as a tool for identification of diabetic retinopathy in rural optometricpractice, Clinical and Experimental Optometry, 89(5), 299, 2006.
[57] Lee, S.C. and Wang, Y., Automatic retinal image quality assessment and en-hancement, in Medical Imaging 1999: Image Processing, 1999, vol. 3661 ofProceedings of the SPIE, 1581–1590.
[58] Fleming, A., Philip, S., Goatman, K., et al., Automated assessment of reti-nal image field of view, in Medical Image Understanding and Analysis (MIUA2004), London, UK, 2004, 129–132.
[59] Newsom, R.S.B., Clover, A., Costen, M.T.J., et al., Effect of digital imagecompression on screening for diabetic retinopathy, British Journal of Ophthal-mology, 85(7), 799, 2001.
[60] Basu, A., Kamal, A.D., Illahi, W., et al., Is digital image compression accept-able within diabetic retinopathy screening? Diabetic Medicine, 20(9), 766,2003.
[61] Stellingwerf, C., Hardus, P.L.L.J., and Hooymans, J.M.M., Assessing diabeticretinopathy using two-field digital photography and the influence of JPEG-compression, Documenta Ophthalmologica, 108(3), 203, 2004.
[62] Anagnoste, S.R., Orlock, D., Spaide, R., et al., Digital compression of oph-thalmic images: Maximum JPEG compression undetectable by retina special-ists, Investigative Ophthalmology & Visual Science, 39, S922, 1998.
[63] Lee, M.S., Shin, D.S., and Berger, J.W., Grading, image analysis, and stereopsisof digitally compressed fundus images, Retina, 20(3), 275, 2000.
[64] Baker, C.F., Rudnisky, C.J., Tennant, M.T.S., et al., JPEG compressionof stereoscopic digital images for the diagnosis of diabetic retinopathy viateleophthalmology, Canadian Journal of Ophthalmology, 39(7), 746, 2004.
[65] Hansgen, P., Undrill, P.E., and Cree, M.J., The application of wavelets to reti-nal image compression and its effect on automatic microaneurysm analysis,Computer Methods and Programs in Biomedicine, 56(1), 1, 1998.
[66] Cree, M.J. and Jelinek, H.F., The effect of JPEG compression on automateddetection of microaneurysms in retinal images, in Electronic Imaging Sympo-sium: Image Processing: Machine Vision Applications, San Jose, CA, 2008,vol. 6813 of Proceedings of the SPIE, 68 130M–1.
[67] Hanley, J.A. and McNeil, B.J., The meaning and use of the area under a receiveroperating characteristic (ROC) curve, Radiology, 143, 29, 1982.
[68] Hoover, A., Kouznetsova, V., and Goldbaum, M., Locating blood vessels inretinal images by piecewise threshold probing of a matched filter response,

184 Automated Image Detection of Retinal Pathology
IEEE Transactions on Medical Imaging, 19(3), 203, 2000.
[69] Staal, J., Abramoff, M.D., Niemeijer, M., et al., Ridge-based vessel segmen-tation in color images of the retina, IEEE Transactions on Medical Imaging,23(4), 501, 2004.
[70] Hellstedt, T. and Immonen, I., Disappearance and formation rates of microa-neurysms in early diabetic retinopathy, British Journal of Ophthalmology, 80,135, 1996.
[71] Baudoin, C., Maneshi, F., Quentel, G., et al., Quantitative-evaluation of fluo-rescein angiograms-microaneurysm counts, Diabetes, 32, 8, 1983.
[72] Jalli, P.Y., Hellstedt, T.J., and Immonen, I.J., Early versus late staining of mi-croaneurysms in fluorescein angriography, Retina, 17, 211, 1997.

7Retinal Vascular Changes as Biomarkers ofSystemic Cardiovascular Diseases
Ning Cheung, Tien Y. Wong, and Lauren Hodgson
CONTENTS
7.1 Introduction . . . . . . . . . . . . . . . . . . . . . . . . . . . . . . . . . . . . . . . . . . . . . . . . . . . . . . . . . . . . . . . 1857.2 Early Description of Retinal Vascular Changes . . . . . . . . . . . . . . . . . . . . . . . . . . . . . 1867.3 Retinal Vascular Imaging . . . . . . . . . . . . . . . . . . . . . . . . . . . . . . . . . . . . . . . . . . . . . . . . . . 1877.4 Retinal Vascular Changes and Cardiovascular Disease. . . . . . . . . . . . . . . . . . . . . . 1897.5 Retinal Vascular Changes and Metabolic Diseases . . . . . . . . . . . . . . . . . . . . . . . . . 1947.6 Retinal Vascular Changes and Other Systemic Diseases . . . . . . . . . . . . . . . . . . . . 1977.7 Genetic Associations of Retinal Vascular Changes . . . . . . . . . . . . . . . . . . . . . . . . . 2007.8 Conclusion . . . . . . . . . . . . . . . . . . . . . . . . . . . . . . . . . . . . . . . . . . . . . . . . . . . . . . . . . . . . . . . . 2017.A Appendix: Retinal Vessel Caliber Grading Protocol . . . . . . . . . . . . . . . . . . . . . . . . 201
References . . . . . . . . . . . . . . . . . . . . . . . . . . . . . . . . . . . . . . . . . . . . . . . . . . . . . . . . . . . . . . . . 207
7.1 IntroductionThe retinal vasculature can be viewed directly and noninvasively, offering a uniqueand easily accessible “window” to study the health of the human microcirculation invivo. Pathological changes of the retinal vasculature, such as the appearance of mi-croaneurysms, focal areas of arteriolar narrowing, arteriovenous (AV) nicking, andretinal hemorrhages are common fundus findings in older people, even in those with-out hypertension or diabetes. Recent advances in retinal image analysis have allowedreliable and precise assessment of these retinal vascular changes, as well as objectivemeasurement of other topographic vascular characteristics such as generalized retinalvascular caliber. Using standardized protocols to evaluate retinal photographs, a newseries of population-based studies have furthered our understanding of the clinicalsignificance and systemic associations of these retinal vascular features. This chap-ter provides an overview of the standardized assessment of retinal vascular changesand the role of retinal image analysis as a means to investigate clinical and subclini-cal systemic diseases.
185

186 Automated Image Detection of Retinal Pathology
7.2 Early Description of Retinal Vascular ChangesCardiovascular disease remains the leading cause of death in developed countries.Clinicians have long been relying on a spectrum of “traditional” cardiovascular riskfactors, such as the presence of diabetes, hypertension, hyperlipidemia and cigarettesmoking to help identify, monitor, and treat high-risk individuals [1–4]. However,there is a belief that these “traditional” risk factors are inadequate in explaining asubstantial proportion of cardiovascular morbidity and mortality [5–7]. To pursuefurther refinement in cardiovascular risk stratification, there has been increasing in-terest in searching for other biomarkers of predictors that may provide additionalinformation regarding a person’s cardiovascular risk [8–10].
The human retina may provide an ideal platform to hunt for these variables as theretinal vasculature, which can be visualized directly, shares similar anatomical andphysiological properties with the cerebral and coronary circulation [11–14]. Retinalvascular damage in essence reflects damage from chronic hypertension, diabetes, andother processes [12; 15–19], and may therefore be a biomarker for cardiovasculardisease risk [11; 14].
Recognition of this potential dates back a century ago [20–23] when Keith, Wa-gener, and Barker showed that the severity of retinal vascular changes was predictiveof mortality in patients with hypertension [24]. Subsequent researchers describedassociations of various retinopathy signs with different cardiovascular diseases andmortality [25–32]. Nevertheless, since the 1960s there has been less interest in thisfield of research for a number of reasons. First, the association between retinal vas-cular changes and cardiovascular disease was not consistently demonstrated in allstudies [25; 26; 33–38], and the majority of studies had significant limitations, suchas lack of control for potential confounders and the use of clinic- or hospital-basedpatients not representative of the general population. Second, early studies wereconducted in populations with untreated hypertension, in which the more severe reti-nal abnormalities were observed (e.g. Keith, Wagener, and Barker Grade III and IVretinopathy [24].). This degree of retinopathy was felt to be uncommon in the mod-ern setting with better blood pressure control [39–43]. Third, despite many attemptsto improve previous grading systems, there was no general consensus regarding aclinically meaningful and standardized classification of retinal vascular signs [44].Finally, the detection of retinal vascular abnormalities using the direct ophthalmo-scope was found to be subjective and unreliable [36–38; 45–47].
These issues have been largely addressed in the last decade with advancements inthe field of retinal photography and image-analysis techniques, enabling objectivequantification of a range of retinal vascular parameters [48] and large population-based studies to determine clinical significance [49]. Furthermore, more subtlechanges in the retinal vasculature (e.g., degree of generalized retinal arteriolar nar-rowing) are now quantifiable from high-resolution digitized photographs [49–53].These new approaches to study retinal vascular characteristics have renewed the in-terest in using digital retinal photography as a potential tool for the prediction ofsystemic cardiovascular disorders.

Retinal Vascular Changes as Biomarkers of Systemic Cardiovascular Diseases 187
7.3 Retinal Vascular Imaging7.3.1 Assessment of retinal vascular signs from retinal photographs
Modern digital imaging systems have revolutionized the assessment of retinal pho-tographs. Using these newly developed quantitative methods, several studies havedemonstrated excellent reproducibility for the detection of well-defined retinopa-thy signs (kappa values have ranged from 0.80–0.99 for microaneurysms and reti-nal hemorrhages) and good reproducibility for more subtle retinal arteriolar lesions(0.40–0.79 for focal retinal arteriolar narrowing and arteriovenous nicking) [49; 50].
In addition, objective measurement of historically subjective retinal vascularchanges, such as generalized retinal arteriolar narrowing, is now possible with thesemi-automated retinal image-analysis software. Parr, Hubbard, and their associatesdeveloped formulae to generate summarized measures of retinal arteriolar (centralretinal arteriolar equivalent [CRAE]) and venular (central retinal venular equiva-lent [CRVE]) diameters, as well as their dimensionless quotient (arteriovenous ra-tio [AVR]) [49; 54; 55]. These retinal vascular indices have been used in severallarge-scale epidemiological studies [49; 50; 52; 53; 56], which demonstrated sub-stantial reproducibility for these vessel measurements (intra-class correlation coef-ficient ranged from 0.80–0.99), providing further evidence that retinal photographyoffers a more sensitive and precise means of assessing architectural changes in theretinal vascular network.
Based on these new standardized assessments of photographs, retinal vascularsigns have been found to be fairly common in adult people 40 years and older, evenin those without a history of diabetes or hypertension. Prevalence [40; 43; 57] andincidence [41; 58] rates ranging from 2 to 15% have been reported for various retinalvascular lesions.
Other emerging computer imaging systems have features such as automated detec-tion of optic disc, identification and tracking of arterioles and venules, batch process-ing of retinal images (i.e., analysis of multiple images at a time), and measurement ofretinal vessel diameters with greater precision and reproducibility [52; 59]. Whetherthese systems are superior to existing techniques in cardiovascular risk predictionremains to be seen.
7.3.2 Limitations in current retinal vascular imaging techniques
While retinal image analysis posts exciting possibilities [48], its applicability in clin-ical settings is yet to be established, partly due to a number of methodological issuesconcerning its use.
First, the formulae utilized to combine individual retinal vascular diameters intosummarized indices are based on theoretical and empiric models. The Parr [54; 55]and Hubbard [49] formulae for CRAE and CRVE were derived from examinationof a large number of retinal images with branching points, calculating the relation-ship between individual trunk vessels and their respective branch vessels using aroot mean square deviation model that best fit the observed data. Although used

188 Automated Image Detection of Retinal Pathology
widely in many epidemiological studies of cardiovascular and ocular diseases, thereare some drawbacks in using these formulae. Knudtson and associates made an im-portant observation that the Parr-Hubbard formulae were dependent on the numberof retinal vessels measured [60]. In addition, since the formulae contained constantswithin the equations, they were also dependent on the units with which the vesselswere measured. Knudtson and colleagues therefore developed a modified formulafor summarizing retinal vascular caliber, and demonstrated clear superiority of theirformula over the previously used Parr-Hubbard formulae [60]. It is likely that therewill be further refinement. Recently, for example, some investigators suggested arevised formula for more accurate estimation of arteriolar branch coefficient [61].This formula used a linear regression model that incorporated a relationship to theasymmetry index of the vessel branches being measured. However, whether this orother newer formulae can indeed improve the predictive ability to detect associationswith systemic cardiovascular diseases is unclear.
Second, existing retinal vascular research has largely focused on differences inretinal vascular changes between groups of people (e.g., people with smaller reti-nal arteriolar diameter are more likely to develop cardiovascular disease than peoplewith relatively larger arteriolar diameter). To allow the use of retinal vessel measure-ment as a potential risk stratification tool in a clinic setting, retinal image analysismust produce results that enable an assessment of absolute risk in individual pa-tients. The measurement of absolute retinal vascular caliber, for example, is criticalto this development [53; 62]. This requires addressing the issue of magnificationeffect from retinal photography, either by incorporating an adjusted measurement tocompensate for this effect or using dimensionless measurements. While there arealready a few methods to adjust for magnification using ocular biometric data (e.g.,axial length) [48], most were designed for telecentric cameras. For nontelecentriccameras, Rudnicka and colleagues have described a method to adjust for magnifi-cation using plan films [63], but its applicability on digitized retinal photographs isunknown.
To account for magnification effects and allow for comparison of measurementsof retinal topographical changes between individuals, studies have sought alternativegeometric attributes of retinal vasculature that are dimensionless in nature. Theseinclude the retinal AVR, junctional exponents, vascular bifurcation angles, vasculartortuosity, and length-to-diameter ratio [48]. Among these, the AVR has been themost commonly used measure. It is important to note, however, that the AVR hassignificant limitations, including the inability to capture separately the informationof the individual arteriolar and venular caliber component measurements [64; 65].For example, both narrower arterioles and wider venules may produce a smallerAVR. Thus, AVR cannot differentiate between changes in arteriolar and venular cal-iber. There is increasing evidence that this differentiation is important, as differentsystemic diseases appear to be associated with specific caliber changes in arteriolesand venules. While smaller retinal arteriolar caliber is associated with hypertension,and may even precede clinical hypertension development, larger retinal venular cal-iber has been associated with inflammation, smoking, hyperglycemia, obesity anddyslipidemia [56]. These observations suggest that changes in retinal arteriolar andvenular caliber may reflect different pathophysiological processes underlying the as-

Retinal Vascular Changes as Biomarkers of Systemic Cardiovascular Diseases 189
sociated systemic diseases. Combining these two components into one estimate, theAVR, without consideration of separate arteriolar or venular caliber measurements,therefore masks these associations.
Third, researchers have recently discovered another important concept in retinalvascular imaging analysis: the need to adjust for retinal arteriolar caliber in analysisof retinal venular caliber, and vice versa [66; 67]. Liew and colleagues showedthat the high correlation between retinal arteriolar and venular caliber means thatindividuals with narrower arterioles are more likely to have narrower venules [66;67]. As a result, the confounding effect of arteriolar and venular caliber for individualmeasurements should be taken into consideration. This is clearly demonstrated inthe Rotterdam Study, in which a counterintuitive association between retinal venularnarrowing and hypertension was initially reported [68], but after the use of the newanalytical approach, modeling retinal arteriolar and venular calibers simultaneously,retinal venular narrowing was shown to have no association with hypertension [69].
Finally, despite the vast amount of data on retinal vessel measures in numerouspopulation-based studies, there is a lack of knowledge about the normative data forthese measurements. Defining what is normal and abnormal is crucial for devel-opment of a clinical tool. One of the challenges in deriving normative data usingstudies in the adult population was that it was difficult to completely control for theconfounding effect of systemic (e.g., hypertension, diabetes, smoking, medications)and ocular (e.g., diabetic retinopathy, glaucoma) disease processes on retinal vesselmeasurements. Studying retinal vascular caliber in healthy children, who are gen-erally free of these influences, may provide a better understanding of the referencedata for this important vascular variable [70]. Several studies of retinal vascularmeasurements in children are currently underway.
7.4 Retinal Vascular Changes and Cardiovascular DiseaseOne of the major advances in retinal vascular imaging research in the last decadehas been the clear demonstration that physiological and pathological alterations inthe retinal vascular network are associated with a variety of cardiovascular diseases,including hypertension, stroke, coronary heart disease (CHD) and congestive heartfailure (Table 7.1).
7.4.1 Hypertension
It has long been known that hypertension exerts a profound effect on the retinalvasculature. The association of retinal vascular changes with blood pressure, in par-ticular, is strong, graded, and consistently seen in both adult [40; 41; 43; 56; 57; 71;72; 74; 96–98] and child populations [91].
The Beaver Dam Eye Study in Wisconsin has reported increases in both preva-lence [40] and 5-year incidence [41] of various retinal arteriolar abnormalities inhypertensive individuals compared to those without hypertension. Among these,

190 Automated Image Detection of Retinal Pathology
Table 7.1: Retinal Vascular Changes and Cardiovascular Disease,Selected Population-Based Studies
Retinal Vascular Signs Associations Strength* ReferencesRetinopathy Blood pressure +++ [40; 41; 71–74]
Incident hypertension ++ [75]Prevalent stroke +++ [57; 76; 77]Incident stroke +++ [76; 78–81]Prevalent CHD ++ [57]Incident CHD +++ [82]Incident hear failure +++ [83]Incident renal disease +++ [84; 85]
Smaller AVR Blood pressure +++ [40; 68; 71; 72][74; 86; 87]
Incident hypertension ++ [75; 88; 89]Incident stroke ++ [76; 78; 80]Incident CHD ++ [90]
Arteriolar narrowing Blood pressure +++ [56; 67; 91; 92]Prevalent hypertension – [56]Incident hypertension ++ [67; 92]Prevalent CHD – [87]Incident CHD ++ [93; 94]
Venular dilatation Incident CHD ++ [93; 94]Incident stroke ++ [93; 95]
CHD = coronary heart disease; AVR = arteriole-to-venule ratio; WESDR = WisconsinEpidemiological Study of Diabetic Retinopathy.*Odds ratio or relative risk < 1.5 (+), 1.5–2.0 (++), > 2.0 (+++) and quantified using othermeasures (–).
generalized retinal arteriolar narrowing has long been regarded as an early charac-teristic sign of hypertension [12; 44; 45]. Using a new semi-automated computer-based image-analytical technique, the Atherosclerosis Risk in Communities (ARIC)study in the United States reported that retinal arteriolar diameter is strongly andinversely related to higher blood pressure levels [71], a finding subsequently con-firmed in four other population-based studies [68; 73; 74; 96]. In the Beaver DamEye Study, each 10 mmHg increase in mean arterial blood pressure was associatedwith a 6 µm (or 3%) decrease in retinal arteriolar diameter, even after adjusting forage, gender, diabetes, smoking, and other vascular risk factors [73]. While these datasupport the strong link between generalized arteriolar narrowing and hypertension,the subtle degree of arteriolar narrowing also suggests that a clinical examinationbased on ophthalmoscopy is unlikely to be capable of detecting such small changes.While earlier studies have predominantly used smaller AVR as the only measure ofgeneralized retinal arteriolar narrowing, subsequent studies in both adults [67; 92]and children [91] evaluating retinal arteriolar and venular calibers separately havevalidated the strong association of hypertension with arteriolar narrowing.
In the last few years, researchers have attempted to answer a key research ques-tion: are retinal vascular changes markers of cumulative, long-term blood pres-sure damage, or do they only reflect a transient effect of acutely elevated blood

Retinal Vascular Changes as Biomarkers of Systemic Cardiovascular Diseases 191
pressure? Several studies addressed this question by analyzing the association ofspecific retinopathy signs with both concurrent and past blood pressure levels [71;74; 86]. These studies found that generalized arteriolar narrowing and AV nick-ing were independently related to past blood pressure levels, indicating that thesesigns may reflect persistent structural arteriolar changes from long-term hyperten-sion [71; 74; 86]. In contrast, studies show that focal arteriolar narrowing, retinalhemorrhages, microaneurysms, and cotton wool spots were related to only concur-rent but not past blood pressure levels, and therefore may be related more to fleeting,possibly physiological, changes caused by acute blood pressure elevation [71; 74].
Prospective data from four population-based studies have provided new under-standing into the relation of generalized retinal arteriolar narrowing to subsequentdevelopment of systemic hypertension [75; 88; 89; 92]. In the ARIC study, nor-motensive participants who had generalized retinal arteriolar narrowing at baselinewere 60% more likely to be diagnosed with hypertension over a three year periodthan individuals without arteriolar narrowing (relative risk 1.62, 95% CI, 1.21 to2.18) [75]. The severity of arteriolar narrowing also appeared to correlate positivelywith the degree of change in blood pressure, independent of preexisting blood pres-sure, body mass index, and other known hypertension risk factors. Similar resultswere generated from the Beaver Dam, Rotterdam, and the Blue Mountains Eye stud-ies [88; 89; 92], providing strong evidence that generalized arteriolar narrowing,possibly mirroring similar peripheral arteriolar changes elsewhere in the body, is apreclinical marker of hypertension. These observations support the concept that themicrocirculation is critical to the pathogenesis of hypertension [99].
There is increasing evidence, albeit from a limited number of clinical reports,that hypertensive retinopathy signs may regress with improved blood pressure con-trol [100–103]. For example, it has been reported that hypertensive retinopathycaused by accelerated hypertension can improve after normalization of blood pres-sure [100]. In addition, in a clinical study of 51 hypertensive patients, Pose-Reinoand colleagues presented objective and quantitative evidence of generalized retinalarteriolar narrowing regression associated with six months of hypertension treatmentwith losartan, an angiotensin II inhibitor [103]. In another small study of mildlyhypertensive patients randomized to treatment with enalapril (an angiotensin con-verting enzyme inhibitor) or hydrocholorthiazide, retinal arteriolar wall opacifica-tion (although not other retinopathy signs) was significantly reduced after 26 weeksof enalapril treatment while hydrochlorothiazide did not seem to have any effect onthe retinopathy signs [101]. As yet, however, due to the lack of controlled clinicaltrials, the important clinical question of whether regression of hypertensive retinopa-thy signs is also associated with a concurrent reduction in a person’s cardiovascularrisk remains unanswered.
7.4.2 Stroke and cerebrovascular disease
The retinal and cerebral vasculature share similar embryological origin, anatomicalfeatures, and physiological properties [104]. This concept provides strong biolog-ical rationale for the use of retinal image analysis to indirectly study the cerebralmicrovasculature and related diseases. In support of this theory is the strong and
192 Automated Image Detection of Retinal Pathology
consistent evidence that retinal vascular changes are associated with both clinicaland subclinical stroke and a variety of cerebrovascular conditions independent oftraditional risk factors such as hypertension, diabetes, and cigarette smoking.
Since the 1970s, physicians have reported that in people with hypertension,the presence of retinopathy signs is associated with both subclinical and clinicalstroke [34; 105–107]. Newer population-based studies, using standardized grad-ing of digitized retinal photographs, have confirmed these early observations. Inthe ARIC study, among more than 10 000 individuals without a history of stroke,those with microaneurysms, retinal hemorrhages, and cotton wool spots were two tothree times more likely to develop an incident clinical stroke in the next three yearsthan those without these retinopathy signs, even after factoring the effects of multi-ple vascular risk factors [78]. Similar associations were seen in persons with type2 diabetes [79]. Among the ARIC participants without clinical cerebrovascular dis-ease, these retinal vascular abnormalities were also related to cognitive decline [108],and magnetic resonance imaging (MRI) detected structural abnormalities includingcerebral white matter lesions [80] and atrophy [109]. Furthermore, the ARIC studysuggests a possible synergistic interaction between the presence of retinal vascularabnormalities and subclinical white matter lesions on the subsequent risk of clinicalstroke. Participants with both retinopathy and white matter lesions had a substan-tially higher stroke risk than those without either finding (relative risk 18.1, 95%confidence intervals, 5.9 to 55.4) [80]. Thus cerebrovascular pathology may be moresevere or extensive in persons with both cerebral and retinal signs of microvasculardisease.
The Cardiovascular Health Study, which examined older persons, found similarassociations. In a cross-sectional analysis, after controlling for blood pressure andrisk factors, participants with retinopathy were twice as likely to have a prevalentstroke as those without retinopathy (odds ratio 2.0, 95% confidence intervals, 1.1 to3.6) [57]. In this older population, retinal arteriolar abnormalities were also associ-ated with prevalent and incident MRI-defined cerebral infarcts, as well as presenceand progression of white matter changes [76]. These observations are consistent withdata from the Blue Mountains Eye Study in Australia, in which nondiabetic personswith retinopathy were 70% more likely to suffer stroke-related death than those with-out retinopathy [81]. Similarly, in a nested case-control study in the Beaver DamEye Study cohort, the presence of retinal microaneurysms, retinal hemorrhages, andretinal arteriolar narrowing was associated with an increased 10-year risk of strokemortality [110]. Finally, there is new evidence that in persons with impaired glucosetolerance, retinopathy signs are associated with prevalent stroke [77].
In addition to retinopathy signs, variations in retinal vascular caliber have alsobeen linked to stroke risk. The ARIC study previously showed that a smaller retinalAVR, interpreted as generalized retinal arteriolar narrowing, might be an indepen-dent predictor of incident stroke in middle-aged individuals. Smaller clinical inves-tigations support this finding [111–113]. In a series of patients with symptomaticatherosclerotic disease (recent ischemic stroke, myocardial infarction, or peripheralarterial disease), retinal arteriolar narrowing and sclerosis, defined from retinal pho-tographs, were related to presence of white matter lesions and lacunar infarcts de-

Retinal Vascular Changes as Biomarkers of Systemic Cardiovascular Diseases 193
tected on MRI [111]. Other researchers found that retinal microvascular flow isreduced in persons with cerebral small vessel disease [112; 114], and that retinal andcerebral arteriolar histopathology is similar in stroke decedents [113]. Subsequentdiscovery of the shortfalls relating to the use of retinal AVR prompted newer studiesto evaluate the association of retinal arteriolar and venular calibers separately withstroke risk [64; 65]. Using this approach, both the Rotterdam Eye Study [95] andthe Cardiovascular Health Study [93] showed that rather than narrower retinal arteri-olar caliber, wider retinal venular caliber predicted the future risk of clinical stroke,independent of other stroke-related risk factors. Thus, the relative importance ofarteriolar and venular caliber in stroke risk prediction remains to be determined
The importance of the reported associations of retinal vascular signs with stroke,white matter lesions, cerebral atrophy, and cognitive impairment is that it supportsa contribution of small vessel disease to the pathogenesis of a wide range of cere-brovascular disorders. In addition, because the retinal signs (e.g., microaneurysms,retinal hemorrhages and cotton wool spots) that are most strongly related to cere-brovascular diseases are usually the result of a disruption in the blood-retinal-barrier,it may be possible to infer that a breakdown of the cerebral blood-brain-barrier mayalso be a key pathophysiological process in the pathogenesis of cerebrovascular dis-eases [115].
7.4.3 Coronary heart disease and congestive heart failure
Similar to cerebrovascular disease, the current literature provides increasing evi-dence that retinal vascular changes are related to CHD and congestive heart fail-ure development. Previous clinical studies based on ophthalmoscopic examina-tions have linked retinopathy signs with ischemic T-wave changes on electrocardio-gram [25; 26], severity of coronary artery stenosis on angiography [116], and morerecently, with incident clinical CHD events [117].
Newer population-based studies using retinal imaging techniques have producedstronger evidence supportive of these findings, demonstrating associations of variousretinal vascular signs with CHD and CHD mortality. In the ARIC study, smaller AVR(initially interpreted as generalized retinal arteriolar narrowing and subsequentlyfound to be due to generalized retinal venular dilatation) was shown to be an in-dependent predictor of incident CHD in women (relative risk 2.2; 95% confidenceintervals: 1.0–4.6), but not in men [90]. This gender difference was also presentin the Blue Mountains Eye Study [94] and the National Health Examination Sur-vey [33]. These important observations suggest a more prominent role of microvas-cular disease in the pathogenesis of CHD in women than in men [118], a theory thathas been well described in the past [119]. However, gender difference in the rela-tionship between retinopathy signs and risk of CHD may not be present in high-riskpopulations. For example, the Lipid Research Clinic’s Coronary Primary PreventionTrial provides evidence of an independent association of retinopathy with incidentCHD in high-risk men. Additional analysis of the ARIC study data found that in per-sons with diabetes, CHD risk doubles in those with retinopathy signs as compared tothose without retinopathy (relative risk 2.07; 95% confidence intervals: 1.38–3.11),

194 Automated Image Detection of Retinal Pathology
independent of multiple CHD-related risk factors including carotid artery atheroscle-rosis and nephropathy [82]. This association appears to be graded with retinopathyseverity, strongest with CHD mortality (relative risk 3.35; 95% confidence intervals:1.40–8.01), and present in both men and women [82]. Consistent with these find-ings, others have reported a positive association of retinopathy with CHD in diabeticpopulations [120–122].
The finding of a relationship of retinopathy signs with CHD corroborates with ob-servations that retinopathy is associated with subclinical coronary macrovascular andmicrovascular pathology. Studies have found that individuals with retinopathy weremore likely to have myocardial perfusion defects [123–125], poorer coronary flowreserve [126], and a lower coronary collateral score [127] than those without retino-pathy. The presence of retinopathy signs has also been associated with a higher de-gree of coronary artery calcification [128; 129], and more diffuse and severe coronaryartery stenosis on angiograms [130], two strong markers of coronary atheroscleroticburden. However, the fundamental question of whether the association of retinopa-thy with CHD is driven by macrovascular or microvascular disease is unclear. It islikely that the associations are due to a mixture of microvascular and macrovascu-lar processes mediated by common pathogenic pathways. In diabetic populations,these may involve, for example, advanced glycation end products, which are knownto cause both micro- and macro-vascular injury in diabetes [131].
Finally, there is evidence that in addition to CHD, retinopathy signs are associatedwith the development of congestive heart failure. In the ARIC study, participantswith retinopathy were found to have a twofold higher risk of incident congestive heartfailure than those without retinopathy (relative risk 1.96; 95% confidence intervals:1.51–2.54) [83]. Interestingly, among those with a lower cardiovascular risk profile(without preexisting CHD, diabetes, or hypertension), the presence of retinopathywas associated with an even higher risk of congestive heart failure (relative risk 2.98;95% confidence intervals: 1.50–5.92) [83]. The reason for this phenomenon is notapparent, but it suggests that microvascular disease may be a more important riskfactor for cardiac pathology in the absence of established risk factors. These findingsalso underscore the potential of retinopathy signs in identifying people who are morelikely to develop heart disease despite having a more favorable cardiovascular riskprofile.
7.5 Retinal Vascular Changes and Metabolic Diseases
Retinal vascular signs may reflect the profound adverse effects of metabolic disor-ders, such as diabetes, metabolic syndrome, and obesity, on the systemic microcir-culation (Table 7.2).

Retinal Vascular Changes as Biomarkers of Systemic Cardiovascular Diseases 195
Tabl
e7.
2:R
etin
alV
ascu
larC
hang
esan
dM
etab
olic
Dis
ease
,Sel
ecte
dPo
pula
tion-
Bas
edSt
udie
s
Ret
inal
Vas
cula
rSig
nsA
ssoc
iatio
nsSt
reng
th*
Stud
ies
and
Ref
eren
ces
Ret
inop
athy
Prev
alen
tdia
bete
s++
+W
ESD
R[1
32;1
33]D
CC
T[1
34]U
KPD
S[1
35]
Inci
dent
diab
etes
+++
AR
IC[1
36](
with
fam
ilyhi
stor
y)M
etab
olic
synd
rom
e+
AR
IC[1
37]
IGT
+A
RIC
[137
]H
yper
lipid
emia
++W
ESD
R[1
38]E
TD
RS
[139
]FIE
LD
[140
]O
besi
ty–
ME
SA[1
41]
Neu
ropa
thy
+++
Aus
Dia
b[1
42]
Smal
lerA
VR
Met
abol
icsy
ndro
me
+A
RIC
[137
]In
cide
ntdi
abet
es++
AR
IC[1
43]B
DE
S[1
44]
Hyp
erlip
idem
ia–
AR
IC[9
8]A
rter
iola
rnar
row
ing
Prev
alen
tdia
bete
s–
ME
SA[5
6]V
enul
ardi
lata
tion
Prev
alen
tdia
bete
s–
ME
SA[5
6]R
otte
rdam
[145
]IG
T+
Rot
terd
am[1
45]
Obe
sity
+++
BM
ES
[146
]ME
SA[5
6]SC
OR
M[1
47]R
otte
rdam
[68]
WE
SDR
[87]
Hyp
erlip
idem
ia–
Rot
terd
am[6
8]M
ESA
[56]
IGT
=im
pair
edgl
ucos
eto
lera
nce;
AVR
=ar
teri
ole-
to-v
enul
era
tio;W
ESD
R=
Wis
cons
inE
pide
mio
logi
calS
tudy
ofD
iabe
ticR
etin
opat
hy;E
TD
RS
=E
arly
Trea
tmen
tD
iabe
ticR
etin
opat
hySt
udy;
FIE
LD
=Fe
nofib
rate
Inte
rven
tion
and
Eve
ntL
ower
ing
inD
iabe
tes;
UK
PDS
=U
nite
dK
ingd
omPr
ospe
ctiv
eD
iabe
tes
Stud
y;D
CC
T=
Dia
bete
sC
ontr
olan
dC
ompl
icat
ions
Tria
l.*O
dds
ratio
orre
lativ
eri
sk<
1.5
(+),
1.5–
2.0
(++)
,>2.
0(+
++)a
ndqu
antifi
edus
ing
othe
rmea
sure
s(–
).

196 Automated Image Detection of Retinal Pathology
7.5.1 Diabetes mellitus
The hypothesis that diabetes may have etiologic links with microvascular diseasehas been tested in recent studies using retinal vessel measurements. In the ARICand Beaver Dam Eye studies, nondiabetic individuals with smaller AVR were shownto have about a 50% to 70% higher risk of incidence with diabetes, independent ofother diabetes-related risk factor [143; 144]. The Beaver Dam Study showed thatthis association is noticeably stronger in individuals with hypertension at baseline(relative risk 3.41; 95% confidence intervals: 1.66–6.98) [144]. The Rotterdam EyeStudy proposed that this association may be due to retinal venular dilatation insteadof arteriolar narrowing and demonstrated an association of larger retinal venular cal-iber with impaired fasting glucose [145]. This finding is consistent with earlier find-ings of prevalence data from the ARIC study [137]. While the underlying biologicalmechanisms for these observations remain to be elucidated, experimental studieshave shown that administration of intravenous dextrose can cause dilatation of reti-nal venules in normoglycemic patients [148]. Moreover, reduced vascular reactivityassociated with endothelial dysfunction and inflammatory processes may also playan integral role in the development of wider retinal venules and diabetes [149].
Even though diabetic retinopathy is a classic example in which retinal vascularchanges evidently reflect the status of a metabolic disorder, there has been incon-sistent evidence to support the hypothesis that early retinopathy signs in nondiabeticpersons are preclinical markers of diabetes. Epidemiological data from several cross-sectional studies indicate that retinopathy signs are associated with impaired glucosemetabolism [77; 137; 150; 151] and prevalent diabetes [56]. Some investigatorsspeculated that retinopathy development may precede the onset of diabetes [152].This theory, nevertheless, is unsupported by currently available prospective data.The ARIC study reported that the presence of typical retinopathy signs in personswithout diabetes is not associated with subsequent development of diabetes over aperiod of 3.5 years [136], suggesting that these retinal lesions may reflect patholog-ical conditions other than diabetes (e.g., hypertension). This is in agreement withfindings from the Blue Mountain Eye Study [153]. Nonetheless, in stratified anal-ysis, the ARIC study revealed a possible association of retinopathy with twofoldincreased risk of incident diabetes in those with a family history of diabetes [136].The significance of this finding awaits further exploration.
7.5.2 The metabolic syndrome
Apart from diabetes, metabolic syndrome, defined by the presence of three out offive clinical or biochemical features (abdominal obesity, hypertriglyceridemia, lowhigh-density lipoprotein cholesterol, high blood pressure, and impaired fasting glu-cose), has also been associated with retinal vascular changes. The ARIC study foundthat persons with metabolic syndrome are more likely to have typical signs of retino-pathy as well as larger retinal venules [137]. The prevalence of these retinal vas-cular changes also appears to be higher with an increasing number of metabolicsyndrome components. These findings are further reinforced by data from the Multi-

Retinal Vascular Changes as Biomarkers of Systemic Cardiovascular Diseases 197
Ethnic Study of Atherosclerosis (MESA), reporting associations of larger retinalvenular caliber with a number of metabolic syndrome components in a multi-ethnicpopulation-based cohort [56].
7.5.3 Overweight and obesity
Obesity may have a profound effect on the eye [154], but the retinal vascular manifes-tations of obesity are poorly understood. There is evidence that obesity increases therisk of retinopathy development in both diabetic and nondiabetic populations [149].Interestingly, recent studies have shown that variations in retinal vascular caliber mayalso be associated with obesity correlates. The ARIC and Blue Mountain Eye studiesboth reported an association of larger retinal venular caliber with body mass indexand prevalent obesity [137; 146]. Prospective data from the Blue Mountains EyeStudy further indicated that larger retinal venular caliber may even predict the inci-dence of obesity over a 5-year period, suggesting the existence of altered microvas-cular function in the pathogenesis of obesity [146]. These findings are in keepingwith data from a cohort of young healthy children [147], in which confounding ef-fects of systemic and ocular disease processes are of less concern. Inflammation,oxidative stress, hyperleptinemia, and nitric oxide dysregulation have all been im-plicated as potential pathways in the link between larger retinal venules and obesitydevelopment [146; 147].
7.6 Retinal Vascular Changes and Other Systemic Diseases7.6.1 Renal disease
Retinopathy and nephropathy are two well known microvascular complications ofdiabetes [155; 156]. Experimental studies show a high correlation of pathologicalchanges in the retinal vessels with those that occur in the renal vasculature [157].However, there have been few studies that have explored the independent associa-tion of retinal vascular abnormalities with nephropathy, particularly in people with-out diabetes. An earlier study of individuals with hypertension demonstrated a strongrelationship of retinopathy grades with microalbuminuria, a preclinical marker of re-nal dysfunction [158]. This is supported by more recent studies of clinical renaldisease in the general population. In the ARIC study, various retinopathy signs, suchas AV nicking, retinal hemorrhages, microaneurysms, and cotton wool spots, wereassociated with a higher risk of renal dysfunction than those without these retinallesions [84]. This association was independent of vascular risk factors and was seenin persons with and without diabetes or hypertension. Similarly, in the Cardiovascu-lar Health Study, the presence of retinopathy was independently associated with anincreased risk of incident renal dysfunction as well as progression of renal impair-ment [85]. These findings raise the possibility that retinopathy and nephropathy mayshare common pathogenic pathways (e.g., endothelial dysfunction, inflammation),

198 Automated Image Detection of Retinal Pathology
even in nondiabetic individuals, and highlight the need to monitor renal function inindividuals with retinopathy.
7.6.2 Atherosclerosis
Atherosclerosis, the key pathophysiological disease process of CHD and stroke, hasbeen the focus of interest in studies of retinal vascular measurements (Table 7.3).The evidence of a link between direct measures of atherosclerosis and retinal vascu-lar changes, however, has not been consistently demonstrated. In the ARIC study,factoring the effect of blood pressure and other risk factors, smaller AVR was asso-ciated with carotid artery plaque but not intima-media thickness (IMT), whereas AVnicking was associated with carotid artery IMT but not plaque [98]. The Rotterdam
Eye Study, on the other hand, found an association of smaller AVR with carotid arteryIMT [68]. Moreover, smaller AVR has also been independently associated with in-creased carotid artery stiffness, an early marker of atherosclerosis [159]. These find-ings, nevertheless, are contradictory to data from the Cardiovascular Health Study(CHS),which revealed no consistent independent association between smaller AVRand measures of large artery atherosclerosis [57].
Apart from retinal vessel measurements, retinopathy signs (e.g., microaneurysms)have also been related to atherosclerosis. For example, the CHS showed an inde-pendent association of retinopathy with carotid artery plaque and increased carotidIMT [57]. This is supported by data from the Chennai Urban Rural EpidemiologyStudy, which demonstrate independent associations of retinopathy signs with bothincreased carotid IMT and arterial stiffness in diabetic individuals [165]. Further-more, newer data from the MESA indicate that retinopathy is positively associatedwith coronary artery calcification, a robust measure of coronary atherosclerotic bur-den, independent of blood pressure, diabetes, and other risk factors [129].
These data imply that while changes in retinal vascular caliber may be pathologi-cally distinct from atherosclerotic processes [98], there is need to further understandthe link between other retinopathy signs and atherosclerosis.
7.6.3 Inflammation and endothelial dysfunction
Retinal vascular changes in diabetes, hypertension,and other systemic disease pro-cesses may be related to inflammation and/or endothelial dysfunction (Table 7.3).This concept is supported by data from three population-based studies, in which var-ious inflammatory markers were demonstrated to be associated with larger retinalvenules [56; 68; 164]. In the Beaver Dam Eye Study, indicators of endothelial dys-function were also shown to be associated with larger retinal venular caliber [164].These observations agree with findings from experimental studies, which demon-strated an increase in the diameter of retinal venules, but not arterioles, after admin-istration of lipid hydroperoxide into the vitreous of rats with a resultant increase inthe number of leukocytes in the retinal microvasculature [166]. Dilatation of retinalvenules has been postulated to be a result of increased production of nitric oxide sec-ondary to release of inflammatory mediators [167]. The collective data from these

Retinal Vascular Changes as Biomarkers of Systemic Cardiovascular Diseases 199
Tabl
e7.
3:R
etin
alV
ascu
larC
hang
esan
dM
arke
rsof
Subc
linic
alD
isea
se,S
elec
ted
Popu
latio
n-B
ased
Stud
ies
Ret
inal
Vas
cula
rSig
nsA
ssoc
iatio
nsSt
reng
th*
Stud
ies
and
Ref
eren
ces
Ret
inop
athy
Cer
ebra
labn
orm
aliti
es++
+A
RIC
[80;
109;
160]
Car
otid
arte
rydi
seas
e++
+A
RIC
[98]
CH
S[5
7]C
ardi
acre
mod
elin
g++
ME
SA[1
61]
Cor
onar
yar
tery
dise
ase
+M
ESA
[129
]E
ndot
helia
ldys
func
tion
+A
RIC
[156
]In
flam
mat
ion
+A
RIC
[156
]Sm
alle
rAV
RC
arot
idar
tery
dise
ase
++A
RIC
[98]
AR
IC[1
59]R
otte
rdam
[68]
Infla
mm
atio
n+
AR
IC[9
8]R
otte
rdam
[68]
Art
erio
larn
arro
win
gPr
eclin
ical
hype
rten
sion
++R
otte
rdam
[92]
BM
ES
[67]
Lef
tven
tric
ular
hype
rtro
phy
and
rem
odel
ing
++A
RIC
[162
]ME
SA[1
61]
Ven
ular
dila
tatio
nC
ereb
rala
bnor
mal
ities
++R
otte
rdam
[163
]Su
bclin
ical
athe
rosc
lero
sis
+R
otte
rdam
[68]
Infla
mm
atio
n++
+B
DE
S[1
64]M
ESA
[56]
Rot
terd
am[6
8]
AVR
=ar
teri
ole-
to-v
enul
era
tio.
*Odd
sra
tioor
rela
tive
risk
<1.
5(+
),1.
5–2.
0(+
+),>
2.0
(+++
)and
quan
tified
usin
got
herm
easu
res
(–).

200 Automated Image Detection of Retinal Pathology
studies suggest that both inflammation and endothelial dysfunction may play keymechanistic roles in interlinking retinal venular dilatation with systemic diseases.
7.6.4 Subclinical cardiac morphology
Prospective data from the ARIC study indicate that retinopathy may predict clinicalCHD and congestive heart failure events in the general population [83]. There isnow evidence that retinal vascular changes may be associated with early geometricalterations in the heart prior to manifestation of clinical heart disease (Table 7.3).Previous studies have demonstrated strong correlations of retinopathy grades withleft ventricular hypertrophy (LVH) in persons with hypertension [102; 168; 169].In the ARIC study, both focal and generalized narrowing of retinal arterioles wereassociated with increased odds of LVH in middle-aged African-Americans, inde-pendent of blood pressure and other risk factors [162]. This is supported by recentanalysis of the cross-sectional data from the MESA, showing that in the general pop-ulation, narrower retinal arteriolar caliber is associated with left ventricular concen-tric remodeling, determined from cardiac MRI, even after adjusting for traditionalrisk factors (odds ratio 1.87; 95% confidence intervals: 1.41–2.48) [161]. This as-sociation remained significant in those without diabetes, hypertension,or significantcoronary calcification, but was strongest in diabetic persons (odds ratio 4.02; 95%confidence intervals: 2.05–7.88) [161]. Therefore narrowing of retinal arterioles maybe a marker of early subclinical myocardial abnormalities.
7.7 Genetic Associations of Retinal Vascular ChangesThe effects of genetic and environmental factors are intertwined in the developmentof cardiovascular diseases [170–173]. However, the genetic influence on the mi-crovasculature is unclear. Utilizing new retinal image-analysis technology, emergingstudies have begun exploring this important aspect.
For example, the Beaver Dam Eye Study reported that retinal vascular caliberswere more highly correlated between relatives than between unrelated individuals,an observation proposed to be due to shared genes [174]. This is in keeping withdata from a recent twin study, showing that 70% of the variance in retinal arteriolarcaliber and 83% of the variance in retinal venular caliber were attributable to geneticfactors [175]. Newer data from the Beaver Dam Eye Study, based on a genome-widelinkage scan, further reinforce the genetic contribution to the variation in retinal vas-cular calibers, independent of hypertension and other confounders [176]. The in-vestigators showed that the linkage regions for retinal vascular caliber overlap withregions that have been previously associated with essential hypertension, coronaryheart disease, endothelial dysfunction, and vasculogenesis [176]. These novel find-ings provide the first genetic evidence to support the clinical observations, as de-scribed in Section 7.4, that changes in retinal arteriolar and venular caliber may

Retinal Vascular Changes as Biomarkers of Systemic Cardiovascular Diseases 201
precede and contribute to the pathogenesis of cardiovascular disease (e.g., hyper-tension).
While the currently available data regarding the genetic basis of retinal vascularchanges are limited, findings from recent studies clearly demonstrate the usefulnessof retinal image analysis in advancing our understanding of the complex genetic-environmental interaction pathways involved in the pathogenesis of cardiovasculardisease. The exciting prospect of this expanding field of research opens many possi-bilities [177].
7.8 ConclusionThere is increasing recognition that retinal vascular image analysis presents greatpotential to advance our understanding of the role of microvascular disease in thedevelopment of various systemic disorders. Retinal vascular changes have now beenlinked to a spectrum of clinical and subclinical cardiovascular and metabolic out-comes. The mounting evidence generated from recent studies supports the notionthat the retinal vasculature may provide a lifetime summary measure of genetic andenvironmental exposure, and may therefore act as a valuable risk marker for futuresystemic diseases. Nonetheless, despite an increasing application of retinal imageanalysis in research settings, its clinical value remains to be determined. Epidemio-logical evidence that retinal vascular changes are significantly predictive of morbidevents does not necessarily translate directly into clinical practice. Further researchis clearly required, perhaps with a more directed focus in assessing the ability ofretinal imaging to provide clinically useful information above and beyond currentlyavailable risk stratification methods to aid prevention and management of cardio-vascular and metabolic diseases. Finally, there remain additional novel measures ofretinal vascular structure [178–182] that may offer additive value to the existing tra-ditional retinal vascular signs in predicting systemic diseases. The role of these newmeasures in retinal image analysis remains to be clarified.
7.A Appendix: Retinal Vessel Caliber Grading ProtocolIVAN is a semi-automated system used to measure retinal vessel widths from a digi-tal retinal image. IVAN is operated off of a two-monitor workstation with the imagefiles organized by reading lists. The software opens on the primary monitor withthree windows: the image display window, the control window, and the vessel dataparameters file.
The image display is viewed on the primary monitor (Figure 7.A.1) and the controlpanel is moved to the secondary monitor (Figure 7.A.2).

202 Automated Image Detection of Retinal Pathology
FIGURE 7.A.1Primary monitor — image display.
The concept of “zone” adopted from the Modified ARIC grid is used in IVAN;it is composed of three concentric circles that demarcate an average optic disc withZone A defined as the region from the disc margin to 1
2 disc diameter from the disc,and Zone B defined as the region from 1
2 disc diameter to 1 disc diameter from thedisc. All retinal vessels are measured in Zone B.
7.A.1 Grading an image
Upon opening IVAN, the software automatically places the overlying grid on thebrightest point of the image (usually the optic disc), detects vessels, and traces theirwidth. The color blue denotes venules and the color red denotes arterioles. The ves-sels are automatically assigned as arteriole or venule; in the case of uncertainty, thevessel is assigned as an arteriole. The data table on the control window locates eachvessel by its clockwise angle in degrees and displays the mean width and standarddeviation (sigma) for each measured vessel (Figure 7.A.2).
The grader is responsible for visual evaluation of the automated display and mak-ing any necessary modifications. This includes the option to override any of theinitial automated decisions or measurements such as adjusting the placement of thegrid, changing the vessel type, deleting vessels, remeasuring vessels, and addingsignificant vessels missed in the initial automation.

Retinal Vascular Changes as Biomarkers of Systemic Cardiovascular Diseases 203
ABC
FIGURE 7.A.2Secondary monitor — control panel (in arteriole view). The labels are: (A) angle ofvessel in degrees, (B) mean width, and (C) standard deviation (sigma). (See colorinsert following page 174.)
The grader determines the validity of a measurement by the visual display and thewidth and standard deviation values. More significance should be given to the visualdisplay.
An acceptable measurement is required to have the following:
• The visual vessel trace should have no obvious outliers from the visible edgesof the vessel and must have a sigma value ≤ 8.00.
• The length of the measured segment should be as long as possible throughZone B for each particular vessel. A reasonable length will depend on thebranching of the vessel and the photographic quality of the digital image.
All measurements must be taken proximal to all visible branching regardless of thelength of the trunk or the length of the measured segment. If the trunk length inZone B is short, it may be difficult to get a reliable measurement. In this case, acomment should be added to the saved data indicating the location of the possiblysuspect vessel width. If the trunk is ungradeable, then both branches should be mea-sured instead of the trunk.

204 Automated Image Detection of Retinal Pathology
V9
V8
V7
V6
V5
V4
V3
V2
V1A9
A8
A7
A6
A5 A4A3
A2
A1
FIGURE 7.A.3Automated display before grader interaction. (See color insert.)
7.A.2 Example of the grading process
The grader performs the following operations (see Figures 7.A.3 and 7.A.4 for pre-and post grader interaction):
A1 — proximal chop (after outliers) V1 — truncate (before outlier)A2 — proximal chop/truncate (out-liers)
V2 — change type/proximal chop/truncate
A3 — proximal chop/truncate (out-liers)
V3 — vein seed
A4 — delete/artery seed V4 — proximal chop/truncate (outliers)A5 — proximal chop V5 — change type/proximal chop/truncate
(outliers)A6 — artery seed V6 — truncate (before branch)A7 — artery seed V7 — change type/truncate (outliers)A8 — no change V8 — truncate (before branch)A9 — proximal chop/truncate (out-liers)
V9 — change type/truncate (outliers)

Retinal Vascular Changes as Biomarkers of Systemic Cardiovascular Diseases 205
V9
V8
V7
V6
V5
V4
V3
V2
V1A9
A8
A7
A6
A5 A4A3
A2
A1
FIGURE 7.A.4Completed grading with grader interaction. (See color insert.)
7.A.3 Obtaining results
When the grader is satisfied that the biggest six arterioles and venules have beentraced correctly and are within the acceptable standard deviation, they choose to cal-culate the image (Figure 7.A.5, label A) to obtain the required results (Figure 7.A.5,label B).
Following Knudtson’s revised formula [60] to calculate the Central Retinal ArteryEquivalent (CRAE) and the Central Retinal Vein Equivalent (CRVE), only the widthdata from the six largest venules and six largest arterioles are required. Artery-to-Vein ratio (A/V ratio) is simply calculated as CRAE divided by CRVE.
The algorithm is thus:
Arterioles: W = 0.88√
w21 +w2
2 (7.1)
Venules: W = 0.95√
w21 +w2
2 (7.2)
where W is the estimate of parent trunk arteriole or venule, and w1 and w2 are thewidths of the narrower branch and the wider branch, respectively.

206 Automated Image Detection of Retinal Pathology
A
B
CD
E
FIGURE 7.A.5Control panel view after calculation. The labels are: (A) Calculate button, (B) Re-sults panel, (C) APPROVE, (D) APPROVE W/COMMENT, and (E) REJECT. (Seecolor insert.)
7.A.4 Saving data
At the completion of grading, there are three options for saving the data:
1. APPROVE (Figure 7.A.5, label C)
2. APPROVE W/COMMENT (Figure 7.A.5, label D)
3. REJECT (Figure 7.A.5, label E)
The APPROVE option is used for images that are gradeable and no comment is nec-essary. The APPROVE W/COMMENT option is used for images that are gradeablebut had grading discrepancies that may affect the consistency of the data. These com-ments will be evaluated by the statisticians. The REJECT option is used for imagesthat are ungradeable and no comment is necessary. Images that are ungradeable veryoften will have no acceptable automated vessels on the initial display and the graderwill have difficulty discerning any vessels. Eyes that have fewer than four acceptablemeasurements of either vessel type will be considered ungradeable. Output data willautomatically be sent to the specified comma separated values (.csv) file upon select-

Retinal Vascular Changes as Biomarkers of Systemic Cardiovascular Diseases 207
ing one of the three saving options and the grader will be prompted to open the nextimage for grading.
References[1] van den Hoogen, P.C., Feskens, E.J., Nagelkerke, N.J., et al., The relation
between blood pressure and mortality due to coronary heart disease amongmen in different parts of the world. Seven Countries Study Research Group,N Engl J Med, 342, 1, 2000.
[2] MacMahon, S., Blood pressure and the risk of cardiovascular disease, N EnglJ Med, 342, 50, 2000.
[3] Stamler, J., Dyer, A.R., Shekelle, R.B., et al., Relationship of baseline majorrisk factors to coronary and all-cause mortality, and to longevity: findingsfrom long-term follow-up of Chicago cohorts, Cardiology, 82, 191, 1993.
[4] Wolf, P.A., D’Agostino, R.B., Kannel, W.B., et al., Cigarette smoking as arisk factor for stroke. the Framingham study, JAMA, 259, 1025, 1988.
[5] Langer, R.D., Ganiats, T.G., and Barrett-Connor, E., Paradoxical survival ofelderly men with high blood pressure, BMJ, 298, 1356, 1989.
[6] Pekkanen, J., Tervahauta, M., Nissinen, A., et al., Does the predictive value ofbaseline coronary risk factors change over a 30-year follow-up? Cardiology,82, 181, 1993.
[7] Prospective studies collaboration, Cholesterol, diastolic blood pressure, andstroke: 13,000 strokes in 450,000 people in 45 prospective cohorts, Lancet,346, 1647, 1995.
[8] Harjai, K.J., Potential new cardiovascular risk factors: left ventricular hyper-trophy, homocysteine, lipoprotein(a), triglycerides, oxidative stress, and fib-rinogen, Ann Intern Med, 131, 376, 1999.
[9] Oparil, S. and Oberman, A., Nontraditional cardiovascular risk factors, Am JMed Sci, 317, 193, 1999.
[10] Pahor, M., Elam, M.B., Garrison, R.J., et al., Emerging noninvasive biochem-ical measures to predict cardiovascular risk, Arch Intern Med, 159, 237, 1999.
[11] Goto, I., Katsuki, S., Ikui, H., et al., Pathological studies on the intracere-bral and retinal arteries in cerebrovascular and noncerebrovascular diseases,Stroke, 6, 263, 1975.
[12] Tso, M.O. and Jampol, L.M., Pathophysiology of hypertensive retinopathy,Ophthalmology, 89, 1132, 1982.

208 Automated Image Detection of Retinal Pathology
[13] Wendland, J.P., Retinal arteriolosclerosis in age, essential hypertension, anddiabetes mellitus, Trans Am Ophthalmol Soc, 64, 735, 1966.
[14] Wells, R.E., Herman, M., and Gorlin, R., Microvascular changes in coronaryartery disease, Circulation, 237, 33, 1966.
[15] Ashton, N. and Harry, J., The pathology of cotton wool spots and cytoid bod-ies in hypertensive retinopathy and other diseases, Trans Ophthalmol Soc UK,83, 91, 1963.
[16] Ashton, N., Peltier, S., and Garner, A., Experimental hypertensive retinopathyin the monkey, Trans Ophthalmol Soc UK, 88, 167, 1969.
[17] Ashton, N., The eye in malignant hypertension, Trans Am Acad OphthalmolOtolaryngol, 76, 17, 1972.
[18] Garner, A., Ashton, N., Tripathi, R., et al., Pathogenesis of hypertensiveretinopathy. an experimental study in the monkey, Br J Ophthalmol, 59, 3,1975.
[19] Garner, A. and Ashton, N., Pathogenesis of hypertensive retinopathy: a re-view, J R Soc Med, 72, 362, 1979.
[20] Gunn, R.M., Ophthalmoscopic evidence of (1) arterial changes associatedwith chronic renal diseases and (2) of increased arterial tension, Trans Oph-thalmol Soc UK, 12, 124, 1892.
[21] Gunn, R.M., On ophthalmoscopic evidence of general arterial disease, TransOphthalmol Soc UK, 18, 356, 1898.
[22] O’Hare, J.P. and Walker, W.G., Arteriosclerosis and hypertension, Arch InternMed, 33, 343, 1924.
[23] Friedenwald, H., The Doyne Memorial Lecture: Pathological changes in theretinal blood-vessels in arteriosclerosis and hypertension, Trans OphthalmolSoc UK, 50, 452, 1930.
[24] Keith, N.M., Wagener, H.P., and Barker, N.W., Some different types of es-sential hypertension: their course and prognosis, Am J Med Sci, 197, 332,1939.
[25] Breslin, D.J., Gifford, Jr., R.W., Fairbairn, 2nd, J.F., et al., Prognostic impor-tance of ophthalmoscopic findings in essential hypertension, JAMA, 195, 335,1966.
[26] Breslin, D.J., Gifford, Jr., R.W., and Fairbairn, 2nd, J.F., Essential hyperten-sion. A twenty-year follow-up study, Circulation, 33, 87, 1966.
[27] Scheie, H.G., Evaluation of ophthalmoscopic changes of hypertension andarteriolar sclerosis, AMA Arch Ophthalmol, 49, 117, 1953.
[28] Salus, R., A contribution to the diagnosis of arteriosclerosis and hypertension,

Retinal Vascular Changes as Biomarkers of Systemic Cardiovascular Diseases 209
Am J Ophthalmol, 45, 81, 1958.
[29] Leishman, R., The eye in general vascular disease: hypertension and arte-riosclerosis, Br J Ophthalmol, 41, 641, 1957.
[30] Evelyn, K.A., Nicholis, J.V., and Turnbull, W., A method of grading andrecording: the retinal changes in essential hypertension, Am J Ophthalmol,45, 165, 1958.
[31] Frant, R. and Groen, J., Prognosis of vascular hypertension; a 9 year follow-upstudy of 418 cases, Arch Med Interna, 85, 727, 1950.
[32] Cohen, M., Lesions of the fundus in essential hypertension and in arterial andrenal diseases, Arch Ophthalmol, 17, 99401007, 1937.
[33] Gillum, R.F., Retinal arteriolar findings and coronary heart disease, Am HeartJ, 122, 262, 1991.
[34] Nakayama, T., Date, C., Yokoyama, T., et al., A 15.5-year follow-up study ofstroke in a Japanese provincial city. The Shibata Study, Stroke, 28, 45, 1997.
[35] Ralph, R.A., Prediction of cardiovascular status from arteriovenous crossingphenomena, Ann Ophthalmol, 6, 323, 1974.
[36] Kagan, A., Aureli, E., and Dobree, J., A note on signs in the fundus oculi andarterial hypertension: conventional assessment and significance, Bull WorldHealth Organ, 34, 955, 1966.
[37] Dimmitt, S.B., West, J.N., Eames, S.M., et al., Usefulness of ophthalmoscopyin mild to moderate hypertension, Lancet, 1, 1103, 1989.
[38] Aoki, N., Horibe, H., Ohno, Y., et al., Epidemiological evaluation of fun-duscopic findings in cerebrovascular diseases. III. Observer variability andreproducibility for funduscopic findings, Jpn Circ J, 41, 11, 1977.
[39] Klein, R., Klein, B.E., Moss, S.E., et al., Blood pressure, hypertension andretinopathy in a population, Trans Am Ophthalmol Soc, 91, 207, 1993, discus-sion 222-6.
[40] Klein, R., Klein, B.E., Moss, S.E., et al., Hypertension and retinopathy, arteri-olar narrowing, and arteriovenous nicking in a population, Arch Ophthalmol,112, 92, 1994.
[41] Klein, R., Klein, B.E., and Moss, S.E., The relation of systemic hypertensionto changes in the retinal vasculature: the Beaver Dam Eye Study, Trans AmOphthalmol Soc, 95, 329, 1997, discussion 348-50.
[42] Klein, R., Retinopathy in a population-based study, Trans Am OphthalmolSoc, 90, 561, 1992.
[43] Yu, T., Mitchell, P., Berry, G., et al., Retinopathy in older persons withoutdiabetes and its relationship to hypertension, Arch Ophthalmol, 116, 83, 1998.

210 Automated Image Detection of Retinal Pathology
[44] Wong, T.Y. and Mitchell, P., Hypertensive retinopathy, N Engl J Med, 351,2310, 2004.
[45] Walsh, J.B., Hypertensive retinopathy. description, classification, and progno-sis, Ophthalmology, 89, 1127, 1982.
[46] Schubert, H.D., Ocular manifestations of systemic hypertension, Curr OpinOphthalmol, 9, 69, 1998.
[47] Dodson, P.M., Lip, G.Y., Eames, S.M., et al., Hypertensive retinopathy: a re-view of existing classification systems and a suggestion for a simplified grad-ing system, J Hum Hypertens, 10, 93, 1996.
[48] Patton, N., Aslam, T.M., MacGillivray, T., et al., Retinal image analysis: con-cepts, applications and potential, Prog Retin Eye Res, 25, 99, 2006.
[49] Hubbard, L.D., Brothers, R.J., King, W.N., et al., Methods for evaluation ofretinal microvascular abnormalities associated with hypertension/sclerosis inthe Atherosclerosis Risk in Communities Study, Ophthalmology, 106, 2269,1999.
[50] Couper, D.J., Klein, R., Hubbard, L.D., et al., Reliability of retinal photogra-phy in the assessment of retinal microvascular characteristics: the Atheroscle-rosis Risk in Communities Study, Am J Ophthalmol, 133, 78, 2002.
[51] Sherry, L.M., Wang, J.J., Rochtchina, E., et al., Reliability of computer-assisted retinal vessel measurementin a population, Clin Experiment Ophthal-mol, 30, 179, 2002.
[52] Li, H., Hsu, W., Lee, M.L., et al., Automatic grading of retinal vessel caliber,IEEE Trans Biomed Eng, 52, 1352, 2005.
[53] Wong, T.Y., Knudtson, M.D., Klein, R., et al., Computer-assisted measure-ment of retinal vessel diameters in the Beaver Dam Eye Study: methodology,correlation between eyes, and effect of refractive errors, Ophthalmology, 111,1183, 2004.
[54] Parr, J.C. and Spears, G.F., General caliber of the retinal arteries expressed asthe equivalent width of the central retinal artery, Am J Ophthalmol, 77, 472,1974.
[55] Parr, J.C. and Spears, G.F., Mathematic relationships between the width of aretinal artery and the widths of its branches, Am J Ophthalmol, 77, 478, 1974.
[56] Wong, T.Y., Islam, F.M., Klein, R., et al., Retinal vascular caliber, cardiovas-cular risk factors, and inflammation: the multi-ethnic study of atherosclerosis(MESA), Invest Ophthalmol Vis Sci, 47, 2341, 2006.
[57] Wong, T.Y., Klein, R., Sharrett, A.R., et al., The prevalence and risk factorsof retinal microvascular abnormalities in older persons: the CardiovascularHealth Study, Ophthalmology, 110, 658, 2003.

Retinal Vascular Changes as Biomarkers of Systemic Cardiovascular Diseases 211
[58] van Leiden, H.A., Dekker, J.M., Moll, A.C., et al., Risk factors for incidentretinopathy in a diabetic and nondiabetic population: the Hoorn study, ArchOphthalmol, 121, 245, 2003.
[59] Lowell, J., Hunter, A., Steel, D., et al., Measurement of retinal vessel widthsfrom fundus images based on 2-D modeling, IEEE Trans Med Imaging, 23,1196, 2004.
[60] Knudtson, M.D., Lee, K.E., Hubbard, L.D., et al., Revised formulas for sum-marizing retinal vessel diameters, Curr Eye Res, 27, 143, 2003.
[61] Patton, N., Aslam, T., Macgillivray, T., et al., Asymmetry of retinal arteriolarbranch widths at junctions affects ability of formulae to predict trunk arteriolarwidths, Invest Ophthalmol Vis Sci, 47, 1329, 2006.
[62] Wong, T.Y., Wang, J.J., Rochtchina, E., et al., Does refractive error influ-ence the association of blood pressure and retinal vessel diameters? The BlueMountains Eye Study, Am J Ophthalmol, 137, 1050, 2004.
[63] Rudnicka, A.R., Burk, R.O., Edgar, D.F., et al., Magnification characteristicsof fundus imaging systems, Ophthalmology, 105, 2186, 1998.
[64] Liew, G., Mitchell, P., Wang, J.J., et al., Effect of axial length on retinal vascu-lar network geometry, Am J Ophthalmol, 141, 597, 2006, author reply 597-8.
[65] Cheung, N. and Wong, T.Y., The retinal arteriole to venule ratio: informa-tive or deceptive? Graefe’s Clinical and Experimental Ophthalmology, 2007,forthcoming.
[66] Liew, G., Sharrett, A.R., Kronmal, R., et al., Measurements of retinal vascularcaliber: issues and alternatives to using the arteriole to venule ratio, InvestOphthalmol Vis Sci, 48, 52, 2007.
[67] Liew, G., Wong, T.Y., Mitchell, P., et al., Are narrower or wider retinal venulesassociated with incident hypertension? Hypertension, 48, e10, 2006, authorreply e11.
[68] Ikram, M.K., de Jong, F.J., Vingerling, J.R., et al., Are retinal arteriolar orvenular diameters associated with markers for cardiovascular disorders? TheRotterdam Study, Invest Ophthalmol Vis Sci, 45, 2129, 2004.
[69] Ikram, M.K., Witteman, J.C., Vingerling, J.R., et al., Response to are narroweror wider retinal venules associated with incident hypertension? Hypertension,2006.
[70] Cheung, N., Islam, F.M., Saw, S.M., et al., Distribution and associations ofretinal vascular caliber with ethnicity, gender and birth parameters in youngchildren, Invest Ophthalmol Vis Sci, 48, 1018, 2007.
[71] Sharrett, A.R., Hubbard, L.D., Cooper, L.S., et al., Retinal arteriolar diametersand elevated blood pressure: the Atherosclerosis Risk in Communities Study,

212 Automated Image Detection of Retinal Pathology
Am J Epidemiol, 150, 263, 1999.
[72] Wang, J.J., Mitchell, P., Leung, H., et al., Hypertensive retinal vessel wallsigns in a general older population: the Blue Mountains Eye Study, Hyperten-sion, 42, 534, 2003.
[73] Wong, T.Y., Klein, R., Klein, B.E., et al., Retinal vessel diameters and theirassociations with age and blood pressure, Invest Ophthalmol Vis Sci, 44, 4644,2003.
[74] Wong, T.Y., Hubbard, L.D., Klein, R., et al., Retinal microvascular abnormal-ities and blood pressure in older people: the Cardiovascular Health Study, BrJ Ophthalmol, 86, 1007, 2002.
[75] Wong, T.Y., Klein, R., Sharrett, A.R., et al., Retinal arteriolar diameter andrisk for hypertension, Ann Intern Med, 140, 248, 2004.
[76] Longstreth, Jr., W.T., Larsen, E.K., Klein, R., et al., Associations betweenfindings on cranial magnetic resonance imaging and retinal photography inthe elderly, Am J Epidemiol, 2006.
[77] Wong, T.Y., Barr, E.L., Tapp, R.J., et al., Retinopathy in persons with impairedglucose metabolism: the Australian Diabetes Obesity and Lifestyle (AusDiab)Study, Am J Ophthalmol, 140, 1157, 2005.
[78] Wong, T.Y., Klein, R., Couper, D.J., et al., Retinal microvascular abnormal-ities and incident stroke: the Atherosclerosis Risk in Communities Study,Lancet, 358, 1134, 2001.
[79] Cheung, N., Rogers, S., Couper, D.J., et al., Is diabetic retinopathy an inde-pendent risk factor for ischemic stroke? Stroke, 38, 398, 2007.
[80] Wong, T.Y., Klein, R., Sharrett, A.R., et al., Cerebral white matter lesions,retinopathy, and incident clinical stroke, JAMA, 288, 67, 2002.
[81] Mitchell, P., Wang, J.J., Wong, T.Y., et al., Retinal microvascular signs andrisk of stroke and stroke mortality, Neurology, 65, 1005, 2005.
[82] Cheung, N., Wang, J.J., Klein, R., et al., Diabetic retinopathy and risk of coro-nary heart disease: The Atherosclerosis Risk in Communities Study, DiabetesCare, 30, 1742, 2007.
[83] Wong, T.Y., Rosamond, W., Chang, P.P., et al., Retinopathy and risk of con-gestive heart failure, JAMA, 293, 63, 2005.
[84] Wong, T.Y., Coresh, J., Klein, R., et al., Retinal microvascular abnormalitiesand renal dysfunction: the atherosclerosis risk in communities study, J AmSoc Nephrol, 15, 2469, 2004.
[85] Edwards, M.S., Wilson, D.B., Craven, T.E., et al., Associations between reti-nal microvascular abnormalities and declining renal function in the elderlypopulation: the Cardiovascular Health Study, Am J Kidney Dis, 46, 214, 2005.

Retinal Vascular Changes as Biomarkers of Systemic Cardiovascular Diseases 213
[86] Leung, H., Wang, J.J., Rochtchina, E., et al., Impact of current and past bloodpressure on retinal arteriolar diameter in an older population, J Hypertens, 22,1543, 2004.
[87] Klein, R., Klein, B.E., Moss, S.E., et al., Retinal vascular abnormalities inpersons with type 1 diabetes: the Wisconsin Epidemiologic Study of DiabeticRetinopathy: XVIII, Ophthalmology, 110, 2118, 2003.
[88] Wong, T.Y., Shankar, A., Klein, R., et al., Prospective cohort study of retinalvessel diameters and risk of hypertension, BMJ, 329, 79, 2004.
[89] Smith, W., Wang, J.J., Wong, T.Y., et al., Retinal arteriolar narrowing is as-sociated with 5-year incident severe hypertension: the Blue Mountains EyeStudy, Hypertension, 44, 442, 2004.
[90] Wong, T.Y., Klein, R., Sharrett, A.R., et al., Retinal arteriolar narrowing andrisk of coronary heart disease in men and women. the Atherosclerosis Risk inCommunities Study, JAMA, 287, 1153, 2002.
[91] Mitchell, P., Cheung, N., de Haseth, K., et al., Blood pressure and retinalarteriolar narrowing in children, Hypertension, 49, 1156, 2007.
[92] Ikram, M.K., Witteman, J.C., Vingerling, J.R., et al., Retinal vessel diametersand risk of hypertension: the Rotterdam Study, Hypertension, 47, 189, 2006.
[93] Wong, T.Y., Kamineni, A., Klein, R., et al., Quantitative retinal venular caliberand risk of cardiovascular disease in older persons: the cardiovascular healthstudy, Arch Intern Med, 166, 2388, 2006.
[94] Wang, J.J., Liew, G., Wong, T.Y., et al., Retinal vascular caliber and the riskof coronary heart disease-related mortality, Heart, 2006.
[95] Ikram, M.K., de Jong, F.J., Bos, M.J., et al., Retinal vessel diameters and riskof stroke: the Rotterdam Study, Neurology, 66, 1339, 2006.
[96] Leung, H., Wang, J.J., Rochtchina, E., et al., Relationships between age, bloodpressure, and retinal vessel diameters in an older population, Invest Ophthal-mol Vis Sci, 44, 2900, 2003.
[97] Sharp, P.S., Chaturvedi, N., Wormald, R., et al., Hypertensive retinopathyin Afro-Caribbeans and Europeans. Prevalence and risk factor relationships,Hypertension, 25, 1322, 1995.
[98] Klein, R., Sharrett, A.R., Klein, B.E., et al., Are retinal arteriolar abnor-malities related to atherosclerosis?: the Atherosclerosis Risk in CommunitiesStudy, Arterioscler Thromb Vasc Biol, 20, 1644, 2000.
[99] Feihl, F., Liaudet, L., Waeber, B., et al., Hypertension: a disease of the micro-circulation? Hypertension, 48, 1012, 2006.
[100] Strachan, M.W. and McKnight, J.A., Images in clinical medicine. improve-ment in hypertensive retinopathy after treatment of hypertension, N Engl J

214 Automated Image Detection of Retinal Pathology
Med, 352, e17, 2005.
[101] Bock, K.D., Regression of retinal vascular changes by antihypertensive ther-apy, Hypertension, 6, III158, 1984.
[102] Dahlof, B., Stenkula, S., and Hansson, L., Hypertensive retinal vascularchanges: relationship to left ventricular hypertrophy and arteriolar changesbefore and after treatment, Blood Press, 1, 35, 1992.
[103] Pose-Reino, A., Rodriguez-Fernandez, M., Hayik, B., et al., Regression ofalterations in retinal microcirculation following treatment for arterial hyper-tension, J Clin Hypertens (Greenwich), 8, 590, 2006.
[104] Wong, T.Y., Is retinal photography useful in the measurement of stroke risk?Lancet Neurol, 3, 179, 2004.
[105] Okada, H., Horibe, H., Yoshiyuki, O., et al., A prospective study of cere-brovascular disease in Japanese rural communities, Akabane and Asahi. Part1: evaluation of risk factors in the occurrence of cerebral hemorrhage andthrombosis, Stroke, 7, 599, 1976.
[106] Tanaka, H., Hayashi, M., Date, C., et al., Epidemiologic studies of strokein Shibata, a Japanese provincial city: preliminary report on risk factors forcerebral infarction, Stroke, 16, 773, 1985.
[107] Svardsudd, K., Wedel, H., Aurell, E., et al., Hypertensive eye ground changes.prevalence, relation to blood pressure and prognostic importance. the study ofmen born in 1913, Acta Med Scand, 204, 159, 1978.
[108] Wong, T.Y., Klein, R., Sharrett, A.R., et al., Retinal microvascular abnormal-ities and cognitive impairment in middle-aged persons: the AtherosclerosisRisk in Communities Study, Stroke, 33, 1487, 2002.
[109] Wong, T.Y., Mosley, Jr., T.H., Klein, R., et al., Retinal microvascular changesand MRI signs of cerebral atrophy in healthy, middle-aged people, Neurology,61, 806, 2003.
[110] Wong, T.Y., Klein, R., Nieto, F.J., et al., Retinal microvascular abnormalitiesand 10-year cardiovascular mortality: a population-based case-control study,Ophthalmology, 110, 933, 2003.
[111] Kwa, V.I., van der Sande, J.J., Stam, J., et al., Retinal arterial changes correlatewith cerebral small-vessel disease, Neurology, 59, 1536, 2002.
[112] Schneider, R., Rademacher, M., and Wolf, S., Lacunar infarcts and white mat-ter attenuation. Ophthalmologic and microcirculatory aspects of the patho-physiology, Stroke, 24, 1874, 1993.
[113] Dozono, K., Ishii, N., Nishihara, Y., et al., An autopsy study of the incidenceof lacunes in relation to age, hypertension, and arteriosclerosis, Stroke, 22,993, 1991.

Retinal Vascular Changes as Biomarkers of Systemic Cardiovascular Diseases 215
[114] Hiroki, M., Miyashita, K., Yoshida, H., et al., Central retinal artery dopplerflow parameters reflect the severity of cerebral small-vessel disease, Stroke,34, e92, 2003.
[115] Wardlaw, J.M., Sandercock, P.A., Dennis, M.S., et al., Is breakdown of theblood-brain barrier responsible for lacunar stroke, leukoaraiosis, and demen-tia? Stroke, 34, 806, 2003.
[116] Michelson, E.L., Morganroth, J., Nichols, C.W., et al., Retinal arteriolarchanges as an indicator of coronary artery disease, Arch Intern Med, 139,1139, 1979.
[117] Duncan, B.B., Wong, T.Y., Tyroler, H.A., et al., Hypertensive retinopathy andincident coronary heart disease in high risk men, Br J Ophthalmol, 86, 1002,2002.
[118] Maguire, M.G., Explaining gender differences in coronary heart disease:hunting for clues with the ophthalmoscope, Arch Ophthalmol, 121, 1328,2003.
[119] Cannon, 3rd, R.O. and Balaban, R.S., Chest pain in women with normal coro-nary angiograms, N Engl J Med, 342, 885, 2000.
[120] Miettinen, H., Haffner, S.M., Lehto, S., et al., Retinopathy predicts coronaryheart disease events in NIDDM patients, Diabetes Care, 19, 1445, 1996.
[121] Klein, B.E., Klein, R., McBride, P.E., et al., Cardiovascular disease, mortal-ity, and retinal microvascular characteristics in type 1 diabetes: WisconsinEpidemiologic Study of Diabetic Retinopathy, Arch Intern Med, 164, 1917,2004.
[122] Faglia, E., Favales, F., Calia, P., et al., Cardiac events in 735 type 2 diabeticpatients who underwent screening for unknown asymptomatic coronary heartdisease: 5-year follow-up report from the Milan Study on Atherosclerosis andDiabetes (MiSAD), Diabetes Care, 25, 2032, 2002.
[123] Giugliano, D., Acampora, R., De Rosa, N., et al., Coronary artery disease intype-2 diabetes mellitus: a scintigraphic study, Diabete Metab, 19, 463, 1993.
[124] Ioannidis, G., Peppa, M., Rontogianni, P., et al., The concurrence of microal-buminuria and retinopathy with cardiovascular risk factors; reliable predic-tors of asymptomatic coronary artery disease in type 2 diabetes, Hormones(Athens), 3, 198, 2004.
[125] Yoon, J.K., Lee, K.H., Park, J.M., et al., Usefulness of diabetic retinopathyas a marker of risk for thallium myocardial perfusion defects in non-insulin-dependent diabetes mellitus, Am J Cardiol, 87, 456, 2001, a6.
[126] Akasaka, T., Yoshida, K., Hozumi, T., et al., Retinopathy identifies markedrestriction of coronary flow reserve in patients with diabetes mellitus, J AmColl Cardiol, 30, 935, 1997.

216 Automated Image Detection of Retinal Pathology
[127] Celik, T., Berdan, M.E., Iyisoy, A., et al., Impaired coronary collateral vesseldevelopment in patients with proliferative diabetic retinopathy, Clin Cardiol,28, 384, 2005.
[128] Yoshida, M., Takamatsu, J., Yoshida, S., et al., Scores of coronary calcificationdetermined by electron beam computed tomography are closely related to theextent of diabetes-specific complications, Horm Metab Res, 31, 558, 1999.
[129] Wong, T.Y., Cheung, N., Islam, F.M.A., et al., Microvascular retinopathy isassociated with coronary artery calcified plaque: the Multi-Ethnic Study ofAtherosclerosis, 2006, unpublished data.
[130] Norgaz, T., Hobikoglu, G., Aksu, H., et al., Retinopathy is related to the angio-graphically detected severity and extent of coronary artery disease in patientswith type 2 diabetes mellitus, Int Heart J, 46, 639, 2005.
[131] Goldin, A., Beckman, J.A., Schmidt, A.M., et al., Advanced glycation endproducts: sparking the development of diabetic vascular injury, Circulation,114, 597, 2006.
[132] Klein, R., Klein, B.E., Moss, S.E., et al., The Wisconsin Epidemiologic Studyof Diabetic Retinopathy. II. prevalence and risk of diabetic retinopathy whenage at diagnosis is less than 30 years, Arch Ophthalmol, 102, 520, 1984.
[133] Klein, R., Klein, B.E., Moss, S.E., et al., Glycosylated hemoglobin pre-dicts the incidence and progression of diabetic retinopathy, JAMA, 260, 2864,1988.
[134] The Diabetes Control and Complications Trial Research Group, The effect ofintensive treatment of diabetes on the development and progression of long-term complications in insulin-dependent diabetes mellitus, N Engl J Med, 329,977, 1993.
[135] UK Prospective Diabetes Study (UKPDS) Group, Intensive blood-glucosecontrol with sulphonylureas or insulin compared with conventional treat-ment and risk of complications in patients with type 2 diabetes (UKPDS 33),Lancet, 352, 837, 1998.
[136] Wong, T.Y., Mohamed, Q., Klein, R., et al., Do retinopathy signs in non-diabetic individuals predict the subsequent risk of diabetes? Br J Ophthalmol,90, 301, 2006.
[137] Wong, T.Y., Duncan, B.B., Golden, S.H., et al., Associations between themetabolic syndrome and retinal microvascular signs: the Atherosclerosis Riskin Communities Study, Invest Ophthalmol Vis Sci, 45, 2949, 2004.
[138] Klein, B.E., Moss, S.E., Klein, R., et al., The Wisconsin Epidemiologic Studyof Diabetic Retinopathy. XIII. relationship of serum cholesterol to retinopathyand hard exudate, Ophthalmology, 98, 1261, 1991.
[139] Chew, E.Y., Klein, M.L., Ferris, 3rd, F.L., et al., Association of elevated serum

Retinal Vascular Changes as Biomarkers of Systemic Cardiovascular Diseases 217
lipid levels with retinal hard exudate in diabetic retinopathy. Early Treat-ment Diabetic Retinopathy Study (ETDRS) Report 22, Arch Ophthalmol, 114,1079, 1996.
[140] Keech, A., Simes, R.J., Barter, P., et al., Effects of long-term fenofibrate ther-apy on cardiovascular events in 9795 people with type 2 diabetes mellitus (theFIELD study): randomised controlled trial, Lancet, 366, 1849, 2005.
[141] Wong, T.Y., Klein, R., Islam, F.M., et al., Diabetic retinopathy in a multi-ethnic cohort in the united states, Am J Ophthalmol, 141, 446, 2006.
[142] Barr, E.L., Wong, T.Y., Tapp, R.J., et al., Is peripheral neuropathy associ-ated with retinopathy and albuminuria in individuals with impaired glucosemetabolism? The 1999–2000 AusDiab, Diabetes Care, 29, 1114, 2006.
[143] Wong, T.Y., Klein, R., Sharrett, A.R., et al., Retinal arteriolar narrowing andrisk of diabetes mellitus in middle-aged persons, JAMA, 287, 2528, 2002.
[144] Wong, T.Y., Shankar, A., Klein, R., et al., Retinal arteriolar narrowing, hyper-tension, and subsequent risk of diabetes mellitus, Arch Intern Med, 165, 1060,2005.
[145] Ikram, M.K., Janssen, J.A., Roos, A.M., et al., Retinal vessel diameters andrisk of impaired fasting glucose or diabetes: the Rotterdam Study, Diabetes,55, 506, 2006.
[146] Wang, J.J., Taylor, B., Wong, T.Y., et al., Retinal vessel diameters and obesity:a population-based study in older persons, Obesity (Silver Spring), 14, 206,2006.
[147] Cheung, N., Saw, S.M., Islam, F.M.A., et al., Body mass index and retinalvascular caliber in children, Obesity, 15(1), 209, 2007.
[148] Falck, A. and Laatikainen, L., Retinal vasodilation and hyperglycaemia indiabetic children and adolescents, Acta Ophthalmol Scand, 73, 119, 1995.
[149] Nguyen, T.T. and Wong, T.Y., Retinal vascular manifestations of metabolicdisorders, Trends Endocrinol Metab, 17, 262, 2006.
[150] Rajala, U., Laakso, M., Qiao, Q., et al., Prevalence of retinopathy in peo-ple with diabetes, impaired glucose tolerance, and normal glucose tolerance,Diabetes Care, 21, 1664, 1998.
[151] Singleton, J.R., Smith, A.G., Russell, J.W., et al., Microvascular complica-tions of impaired glucose tolerance, Diabetes, 52, 2867, 2003.
[152] Harris, M.I., Klein, R., Welborn, T.A., et al., Onset of NIDDM occurs at least4–7 yr before clinical diagnosis, Diabetes Care, 15, 815, 1992.
[153] Cugati, S., Mitchell, P., and Wang, J.J., Do retinopathy signs in non-diabeticindividuals predict the subsequent risk of diabetes? Br J Ophthalmol, 90, 928,2006.

218 Automated Image Detection of Retinal Pathology
[154] Cheung, N. and Wong, T.Y., Obesity and eye diseases, Survey of Ophthalmol-ogy, 2007, forthcoming.
[155] Chavers, B.M., Mauer, S.M., Ramsay, R.C., et al., Relationship between reti-nal and glomerular lesions in iddm patients, Diabetes, 43, 441, 1994.
[156] Klein, R., Klein, B.E., Moss, S.E., et al., The 10-year incidence of renal in-sufficiency in people with type 1 diabetes, Diabetes Care, 22, 743, 1999.
[157] Nag, S., Robertson, D.M., and Dinsdale, H.B., Morphological changes inspontaneously hypertensive rats, Acta Neuropathol (Berl), 52, 27, 1980.
[158] Pontremoli, R., Cheli, V., Sofia, A., et al., Prevalence of micro- and macroal-buminuria and their relationship with other cardiovascular risk factors in es-sential hypertension, Nephrol Dial Transplant, 10(Suppl 6), 6, 1995.
[159] Liao, D., Wong, T.Y., Klein, R., et al., Relationship between carotid arterystiffness and retinal arteriolar narrowing in healthy middle-aged persons,Stroke, 35, 837, 2004.
[160] Cooper, L.S., Wong, T.Y., Klein, R., et al., Retinal microvascular abnormali-ties and MRI-defined subclinical cerebral infarction: the Atherosclerosis Riskin Communities Study, Stroke, 37, 82, 2006.
[161] Cheung, N., Bluemke, D.A., Klein, R., et al., Relation of retinal arteriolarcaliber to left ventricular mass and remodeling: the Multi-Ethnic Study ofAtherosclerosis, 2006.
[162] Tikellis, G., Arnett, D.K., Skelton, T., et al., Retinal arteriolar signs and leftventricular hypertrophy in African-Americans, 2006, unpublished data.
[163] Ikram, M.K., De Jong, F.J., Van Dijk, E.J., et al., Retinal vessel diametersand cerebral small vessel disease: the Rotterdam Scan Study, Brain, 129, 182,2006.
[164] Klein, R., Klein, B.E., Knudtson, M.D., et al., Are inflammatory factors re-lated to retinal vessel caliber? The Beaver Dam Eye Study, Arch Ophthalmol,124, 87, 2006.
[165] Rema, M., Mohan, V., Deepa, R., et al., Association of carotid intima-mediathickness and arterial stiffness with diabetic retinopathy: the Chennai UrbanRural Epidemiology Study (CURES-2), Diabetes Care, 27, 1962, 2004.
[166] Tamai, K., Matsubara, A., Tomida, K., et al., Lipid hydroperoxide stimu-lates leukocyte-endothelium interaction in the retinal microcirculation, ExpEye Res, 75, 69, 2002.
[167] Chester, A.H., Borland, J.A., Buttery, L.D., et al., Induction of nitric oxidesynthase in human vascular smooth muscle: interactions between proinflam-matory cytokines, Cardiovasc Res, 38, 814, 1998.
[168] Shigematsu, Y., Hamada, M., Mukai, M., et al., Clinical evidence for an asso-

Retinal Vascular Changes as Biomarkers of Systemic Cardiovascular Diseases 219
ciation between left ventricular geometric adaptation and extracardiac targetorgan damage in essential hypertension, J Hypertens, 13, 155, 1995.
[169] Saitoh, M., Matsuo, K., Nomoto, S., et al., Relationship between left ven-tricular hypertrophy and renal and retinal damage in untreated patients withessential hypertension, Intern Med, 37, 576, 1998.
[170] Tournier-Lasserve, E., New players in the genetics of stroke, N Engl J Med,347, 1711, 2002.
[171] Nabel, E.G., Cardiovascular disease, N Engl J Med, 349, 60, 2003.
[172] Kupper, N., Willemsen, G., Riese, H., et al., Heritability of daytime ambula-tory blood pressure in an extended twin design, Hypertension, 45, 80, 2005.
[173] McCaffery, J.M., Pogue-Geile, M.F., Debski, T.T., et al., Genetic and envi-ronmental causes of covariation among blood pressure, body mass and serumlipids during young adulthood: a twin study, J Hypertens, 17, 1677, 1999.
[174] Lee, K.E., Klein, B.E., Klein, R., et al., Familial aggregation of retinal vesselcaliber in the Beaver Dam Eye Study, Invest Ophthalmol Vis Sci, 45, 3929,2004.
[175] Taarnhoj, N.C., Larsen, M., Sander, B., et al., Heritability of retinal vesseldiameters and blood pressure: a twin study, Invest Ophthalmol Vis Sci, 47,3539, 2006.
[176] Xing, C., Klein, B.E., Klein, R., et al., Genome-wide linkage study of retinalvessel diameters in the Beaver Dam Eye Study, Hypertension, 47, 797, 2006.
[177] Wang, J.J. and Wong, T.Y., Genetic determinants of retinal vascular caliber:additional insights into hypertension pathogenesis, Hypertension, 47, 644,2006.
[178] Witt, N., Wong, T.Y., Hughes, A.D., et al., Abnormalities of retinal microvas-cular structure and risk of mortality from ischemic heart disease and stroke,Hypertension, 47, 975, 2006.
[179] Hughes, A.D., Martinez-Perez, E., Jabbar, A.S., et al., Quantification of topo-logical changes in retinal vascular architecture in essential and malignant hy-pertension, J Hypertens, 24, 889, 2006.
[180] Gould, D.B., Phalan, F.C., van Mil, S.E., et al., Role of COL4A1 in small-vessel disease and hemorrhagic stroke, N Engl J Med, 354, 1489, 2006.
[181] Gekeler, F., Shinoda, K., Junger, M., et al., Familial retinal arterial tortuosityassociated with tortuosity in nail bed capillaries, Arch Ophthalmol, 124, 1492,2006.
[182] Muiesan, M.L. and Grassi, G., Assessment of retinal vascular changes in hy-pertension: new perspectives, J Hypertens, 24, 813, 2006.


8Segmentation of Retinal Vasculature UsingWavelets and Supervised Classification:Theory and Implementation
Joao V. B. Soares and Roberto M. Cesar Jr.
CONTENTS
8.1 Introduction . . . . . . . . . . . . . . . . . . . . . . . . . . . . . . . . . . . . . . . . . . . . . . . . . . . . . . . . . . . . . . . 2218.2 Theoretical Background . . . . . . . . . . . . . . . . . . . . . . . . . . . . . . . . . . . . . . . . . . . . . . . . . . . 2248.3 Segmentation Using the 2-D Gabor Wavelet and Supervised Classification . 2358.4 Implementation and Graphical User Interface . . . . . . . . . . . . . . . . . . . . . . . . . . . . . . 2458.5 Experimental Results . . . . . . . . . . . . . . . . . . . . . . . . . . . . . . . . . . . . . . . . . . . . . . . . . . . . . . 2498.6 Conclusion . . . . . . . . . . . . . . . . . . . . . . . . . . . . . . . . . . . . . . . . . . . . . . . . . . . . . . . . . . . . . . . . 258
Acknowledgments . . . . . . . . . . . . . . . . . . . . . . . . . . . . . . . . . . . . . . . . . . . . . . . . . . . . . . . . 260References . . . . . . . . . . . . . . . . . . . . . . . . . . . . . . . . . . . . . . . . . . . . . . . . . . . . . . . . . . . . . . . . 261
8.1 IntroductionInspection of the optic fundus vasculature can reveal signs of hypertension, diabetes,arteriosclerosis, cardiovascular disease, and stroke [1]. Retinal vessel segmentationis a primary step towards automated analysis of the retina for detection of anomaliesand image registration. Automated assessment of the retinal vasculature morphologycan be used as part of a screening tool for early detection of diabetic retinopathy,while retinal image registration is of interest in detecting retinal changes, mosaicsynthesis, and real-time tracking and spatial referencing for assistance in laser surg-eries.
Different techniques are used for acquiring retinal images. Most common are col-ored or monochromatic photography and angiography using fluorescent dyes. Inmonochromatic photography, color filters are used to select light wavelengths thatenhance the visibility of various fundus structures. Lighting using wavelengths closeto the green region of the spectrum (known as red-free lighting) is frequently em-ployed, as it leaves vessels, hemorrhages, and exudates more apparent. Angiogra-phies, on the other hand, require the injection of a small amount of fluorescent dye
221

222 Automated Image Detection of Retinal Pathology
into the patient, usually sodium fluorescein or indocyanine green. Fluorescence an-giography permits recording of blood vessels and flow and also the detection ofeventual leakages, of interest for diagnostic purposes. However, it is inadequatefor screening programs, as angiograms can only be obtained by specialists in oph-thalmology clinics, and is invasive, presenting a certain risk of side effects to thepatient.
In face of the different forms of image acquisition, it is desirable that segmenta-tion methods be able to work on images from different modalities. As an additionaldifficulty, even images of the same modality present large variability depending onthe patient, presence of pathologies, camera model, illumination, and focus adjust-ment. Images with strong illumination variation or deficiency, light reflexes from thecornea, and inadequate focus are common and, depending on the application at hand,must be treated appropriately, posing an additional challenge in the development ofsegmentation methods [2].
The retinal vasculature is comprised of two complex networks — one of veins,the other of arteries — that spread out from the optic disc and branch successivelyto occupy different regions of the fundus. Retinal blood vessels are locally con-tinuous with respect to position, curvature, and width, with vessel width graduallydecreasing with distance from the optic disc [3–5]. These properties are speciallyimportant during the design of tracking algorithms [3; 6; 7]. Additionally, vesselsare defined by a pair of parallel borders in which the image derivative presents op-posite signs [3; 8; 9] in such a manner that the shapes of vessel cross-sections canbe locally approximated by Gaussian functions [10]. These properties provide forvessel models that are usually as valid for retinal photographs as for angiograms,with vessels appearing as lighter than the background in angiograms and darker incolored and red-free photographs.
Diabetic retinopathy screening involves assessment of the optic fundus with at-tention to a series of indicative features. Of great importance is the detection ofchanges in blood vessel structure and flow, due to either vessel narrowing, completeocclusion or neovascularization [11–13]. Neovascularization is a condition associ-ated with proliferative diabetic retinopathy (PDR), an advanced stage of the diseasein which new vessels are formed emerging from the area of the optic disc or fromperipheral vessels [1]. Prior to neovascularization, it is common to note vessel nar-rowing/dilation and increases in tortuosity. These changes can be detected by mor-phological analysis techniques through quantitative measures, such as vessel widthand length [14], tortuosity [15], and fractal dimension [16].
Another major application of retinal vessel segmentation is registration of imagescaptured at various instants of time or under different angles. Branching and crossingpoints or the skeletonized vasculature may be used as spatial landmarks that providefor registration of images, even from different modalities [17; 18]. Temporal reg-istration assists in the detection of diseases and assessing effects of treatment. Itmay also be used for analysis of blood flow in angiographic video sequences, asthe fluorescent dye reaches the optic fundus and retinal vessels. Partial views of theretina taken at different angles can also be combined to synthesize retinal mosaics.The mosaics can then be used for taking accurate morphological measurements or

Segmentation of Retinal Vasculature Using Wavelets 223
planning and assistance during laser surgeries, through real-time tracking and spa-tial referencing [2]. Finally, registration of images from different modalities allowsvisualizing superpositions of clinically important elements that previously appearedseparately.
The retinal and choroidal vessel structures are used in biometrics for identifica-tion/verification of persons in security systems. Among many possible biometricfeatures used, the optic fundus vascular patterns possess possibly the lowest errorrate, besides being very stable through time and practically impossible to counter-feit. However, its use has limited reach due to high cost and a slight discomfort tothe user during image acquisition. These disadvantages could possibly be surpassed,but with the variety of available biometrics, it is hard to predict the future of thisparticular application [19].
An automated assessment for pathologies of the optic fundus initially requires theprecise segmentation of the vessels from the background, so that suitable feature ex-traction and processing may be performed. Several methods have been developedfor vessel segmentation, but visual inspection and evaluation by receiver operatingcharacteristic (ROC) analysis have shown that there is still room for improvement:human observers are significantly more accurate than the methods, which show flawsaround the optic disc and in detection of the thinnest vessels [20; 21]. In addition, it isimportant to have segmentation algorithms that are fast and do not critically dependon configuring several parameters, so that untrained community health workers mayutilize this technology. This motivates the use of the supervised classification frame-work that only depends on manually segmented images and can be implementedefficiently.
The method and some of the results presented in this chapter were previously pub-lished in a journal paper [22]. Here, the method is presented in greater detail, includ-ing a denser theoretical review, new tests, and analysis of results. An open-sourceprototype of an interactive software implementation is also described, including de-tails on the most important steps of the segmentation process. The method developeduses the 2-D continuous wavelet transform (CWT) coupled with supervised pixelclassification into classes vessel and nonvessel. Wavelet detection works similarly tomatched filters, while at the same time incorporating the scale-angle representation,especially suited for the detection of blood vessels. A significant problem discussedin some works is the choice of an adequate scale for local detection filters. Filters ofdifferent scales have been combined empirically [23], while many other algorithmswork off only one scale [10; 24; 25]. The approach presented here combines waveletresponses from different scales in feature vectors, allowing for pixel classificationbased on the statistical training of classifiers.
An essential property of many methods is their foundation on sets of rules thatdeal with specific situations, leading to complex algorithms that are parameter de-pendent (for example, [10; 25–27]). Even with a large number of rules, situationssuch as central vessel reflexes and branching/crossing points usually fail to be dealtwith satisfactorily. In turn, the pixel classification approach is conceptually simpleand allows the classifier to handle more specific situations, avoiding the formulationof rules and need for parameter adjustment. The approach takes into account only
224 Automated Image Detection of Retinal Pathology
information local to each pixel, leaving space for improvement through the addi-tion of a global inference phase. Even so, it is capable of segmenting the completevascular networks and does not depend on user interaction, but on available manualsegmentation for training.
Algorithm efficiency must be taken into account in practical and real-time appli-cations, leading to specific considerations during method design [3]. Feature genera-tion and classification of all image pixels may turn out to be a slow process dependingon the choice of classifier [28]. In the method described in this chapter, a Bayesianclassifier using Gaussian mixture models for class likelihoods was evaluated. Theclassifier showed good results with respect to ROC analysis, as it allows for complexdecision surfaces, while at the same time providing a fast classification phase.
This chapter begins reviewing the theoretical foundations of the segmentationmethod (Section 8.2), including properties of the 2-D CWT and the 2-D Gaborwavelet, as well as the supervised classifiers evaluated. Section 8.3 describes the ap-proach adopted, which combines wavelet features generation with supervised pixelclassification. The same section also lays out the experimental evaluation performed,covering the description of image databases and a brief review of ROC analysis. Anoverview of the open-source implementation and graphical user interface developedfor tests is given in Section 8.4. Experimental results are presented in Section 8.5,followed by the conclusion in Section 8.6, containing a discussion and directions forfuture work.
8.2 Theoretical Background8.2.1 The 1-D CWT
Signal analysis may be carried out using transforms capable of emphasizing a sig-nal’s relevant properties, allowing processing tasks such as parameter estimation,noise filtering, and feature detection to be performed on the transformed signal. Thewavelet transform is an example of such a signal processing tool, that is based onthe Fourier transform, and is, as the latter, linear and invertible. Fourier analysis ex-tracts global frequencies from a signal and is therefore appropriate for signals whoseproperties do not evolve with time (stationary signals). However, it is incapable oflocating or analyzing frequencies of limited time duration (present in nonstation-ary signals). One of the first attempts to overcome this problem was the short-timeFourier transform (STFT), also known as Gabor transform [29; 30], in which a slid-ing window function delimits the signal portion to be analyzed by the Fourier trans-form. Notwithstanding, the STFT is restricted, as a constant resolution is used foranalyzing all frequencies, given by the window’s size.
The wavelet transform varies the size of the limiting window when analyzing dif-ferent frequencies, giving rise to a multiresolution analysis. As observed by Ga-bor [29], the product between the time and frequency resolutions is lower bounded.

Segmentation of Retinal Vasculature Using Wavelets 225
This implies that there is a trade-off between time and frequency resolution: in-creasing time precision leads to decreasing frequency precision and vice versa. Thewavelet transform is defined to maintain a constant relative bandwidth during analy-sis. This means that low frequencies are observed through large windows (i.e., lowtime precision, high frequency precision), whereas high frequencies are observedthrough small windows (i.e., high time precision, low frequency precision). Thistype of frequency varying behavior is encountered in a great variety of signals, thusexplaining the success of the wavelet transform. In fact, the development of theCWT theory was motivated by the problem of analyzing microseismic signals de-rived from oil prospecting, which present this type of behavior [31; 32]. Accordingly,the wavelet transform is specially suitable for detecting singularities and analyzinginstantaneous frequencies [33; 34].
The CWT is defined as
U(b,a) = |a|−1/2∫
ψ∗(a−1(x−b)) f (x)dx, (8.1)
where a ∈ R is the scale parameter, which relates the analyzing window size to thefrequency; b ∈ R is the central time position being analyzed; ψ is the analyzingwavelet (also called mother wavelet); and ψ∗ denotes the complex conjugate of ψ .The transform may be seen as a linear decomposition of the signal as projections ontobasis functions ψb,a(x) = ψ(a−1(x− b)), each one associated to a given location intime b and scale a. The domain of the transform U(b,a) is referred to as the time-scale plane.
There are various analyzing wavelets that may be used depending on the kindof information to be extracted from the signal. The Morlet wavelet is defined as aGaussian modulated by a complex exponential of frequency k0,
ψ(x) = g(x)exp(−ik0x)+ correction, (8.2)
where g(x) is a Gaussian function, i =√−1 and the correction term is included to
guarantee the wavelet admissibility condition (zero mean). The wavelet’s definitionshows a strong relation to the STFT, also minimizing the time-frequency joint uncer-tainty [30].
Wavelet theory represents a unified view of various signal processing techniquesdeveloped independently in fields such as pure mathematics, physics, and engineer-ing. Being a versatile tool, it is applied to a wide range of applications, such asproblems arising in physics [35]; audio, image, and video coding [30]; fractal andshape analysis [36]; and biomedical applications [37] (e.g., to detect brain activity infMRI [38]).
8.2.2 The 2-D CWT
The CWT may be extended to higher dimensional spaces, allowing, for instance, theanalysis of images (2-D signals) and video sequences (time-varying 2-D signals).This extension of the CWT preserves the fundamental properties of the 1-D case,being founded on coherent states and group theory. The theoretical framework allows

226 Automated Image Detection of Retinal Pathology
the definition of operations over the wavelet space that preserve notions of symmetry.For the 1-D case, the natural operations are translation and dilation, being extendedto the 2-D case as translation, dilation, and rotation [39; 40].
The CWT is mostly used for signal analysis and feature detection, in contrast to thediscrete wavelet transform (DWT), preferable for data synthesis and compression,yielding very efficient algorithms. The 2-D DWT provides orthogonal and biorthog-onal bases, thus allowing efficient signal representation, while the CWT necessarilyleads to a redundant representation. However, the 2-D DWT is formulated as a ten-sor product of two 1-D schemes. It is therefore restricted to the Cartesian geometry,where directional analysis is much more difficult. In contrast, the introduction ofthe rotation operation in the 2-D CWT is specially suited for the analysis of orientedimage structures by using the so called directional wavelets. This fact explains theadoption of the 2-D CWT with the Gabor wavelet to analyze the blood vessels, asproposed in Section 8.2.3.
The 2-D CWT has been used in a variety of applications in computer vision andimage processing, such as analysis of medical and astronomical images [41], tex-ture identification [42], edge detection [34; 43; 44], and fractal analysis [45; 46].There are also imaging applications in physical problems such as analysis of geo-logical faults and turbulence in fluids [47] or detection of dilation and rotation sym-metries [48]. The main 2-D CWT concepts and properties used in this chapter arepresented in the following.
The real plane R×R is denoted as R2 and 2-D vectors are represented as boldletters, e.g., x,b,k ∈ R2. Images are taken as finite energy functions (i.e., squareintegrable) f ∈ L2(R2). The vector x is used to represent a spatial position in theimage, while k is associated to a given spatial frequency. The spatial frequencydomain is defined by the 2-D Fourier transform f of a given image f as
f (k) = (2π)−1∫
exp(−ikx) f (x)d2x. (8.3)
An analyzing wavelet ψ ∈ L2(R2) may take on complex values and must satisfy theadmissibility condition, described below. A family of wavelets ψb,a,θ of sameshape is defined by translations, dilations, and rotations (by b, a and θ , respectively)of the analyzing wavelet:
ψb,a,θ (x) = a−1ψ(a−1r−θ (x−b)), (8.4)
ψb,a,θ (k) = aexp(−ibk)ψ(ar−θ (k)), (8.5)
where a > 0 and rθ denotes the usual 2-D rotation,
rθ (x) = (xcosθ − ysinθ ,xsinθ + ycosθ), 0≤ θ < 2π. (8.6)
The translation, dilation, and rotation operations generate the 2-D Euclidean groupwith dilations acting over L2(R2), denoted G [39].

Segmentation of Retinal Vasculature Using Wavelets 227
The CWT Tψ ∈ L2(G) is defined as the scalar product between f and each waveletψb,a,θ , as a function of (b,a,θ) ∈ G:
Tψ(b,a,θ) = 〈ψb,a,θ | f 〉 (8.7)
= a−1∫
ψ∗(a−1r−θ (x−b)) f (x)d2x, (8.8)
= a∫
exp(ibk)ψ∗(ar−θ (k)) f (k)d2k. (8.9)
The transform is thus a local representation in each of the four dimensions of G, ca-pable of revealing dilation and rotation symmetries [41; 48]. The wavelet transformmay be viewed as a series of correlation operations, presenting stronger responseswhenever the transformed wavelet ψb,a,θ matches the signal portion.
If ψ and ψ are well localized, the transform acts at constant relative bandwidth,i.e., the bandwidth of the filter is always proportional to the analyzing frequency.Thus, as in the 1-D case, the transform presents high frequency precision in lowfrequencies and high spatial precision in high frequencies. This explains why thewavelet transform is suitable for detecting image singularities, such as edges in im-ages [34; 43]. The wavelet transform conserves energy and provides a linear decom-position of f in terms of the wavelet family ψb,θ ,a with coefficients Tψ(b,θ ,a).The transform can be inverted, providing a reconstruction of the original signal fromthe coefficients as
f (x) = c−1ψ
∫∫∫T (b,a,θ)ψb,a,θ (x)a−3 d2bdadθ , (8.10)
where cψ is the normalization constant. For the above formula to hold, the waveletadmissibility condition must be met,
cψ = (2π)2∫|ψ(k)|2|k|−2 d2k < ∞. (8.11)
If ψ satisfies ψ ∈ L1(R2) ∩ L2(R2), then the admissibility condition reduces to re-quiring that the analyzing wavelet have zero mean,
ψ(0) = 0 ⇐⇒∫
ψ(x)d2x = 0. (8.12)
Besides the admissibility condition, additional desirable properties may be defined,such as that ψ and ψ be well localized and that ψ present a certain number of van-ishing moments, thus being blind to polynomials up to the corresponding degree.
The CWT can be implemented efficiently employing the Fast Fourier Transform(FFT) [49] and its Fourier domain definition (Equation 8.9). Otherwise, for analyzingonly small scales, the analyzing wavelet may be cropped off in the spatial domainso that the standard correlation implementation might actually become faster. TheCWT information is highly redundant and, in practice, it is generally calculated overa discrete family of wavelets ψbi,a j ,θk. An approximate reconstruction formula canthen be given by
f (x) = ∑i jk
ψbi,a j ,θk Tψ(bi,a j,θk), (8.13)

228 Automated Image Detection of Retinal Pathology
where f is the reconstructed version of f . The parameters bi,a j,θk should be cho-sen to provide a stable reconstruction, defining the so called frame. The precisionof the analyzing wavelet is studied in order to provide directives for defining a suit-able sampling, so that the frames may satisfactorily cover the spatial and frequencydomains [39; 50; 51]. Even so, the resulting representation will necessarily be re-dundant, in contrast to the DWT, which allows for deriving orthogonal bases.
8.2.3 The 2-D Gabor wavelet
The 2-D Gabor wavelet has been extensively used within the computer vision com-munity, with special attention to its relevance to studies of the human visual system.One of its most important properties is its capability of detecting and analyzing di-rectional structures. It is also optimal in the sense of minimizing the inherent un-certainty in the spatial and frequency domains. The 2-D version of the Gabor filterwas probably introduced in [52], which, together with [53], showed that the filterrepresents a good model for simple cells of the visual cortex. In a subsequent pa-per [54], Daugman suggested the generalization of the filter to a wavelet, which wasthen called the Gabor wavelet. On the other hand, Antoine, Murenzi, and collabora-tors [39; 40] introduced the generalization of the CWT to two or more dimensionsbased on coherent states and group theory, in which the same wavelet was calledMorlet wavelet, being the natural generalization of the 1-D Morlet wavelet. Thename most commonly adopted in the computer vision community is Gabor wavelet,which is therefore also used in this work. Applications of the 2-D Gabor waveletin computer vision include object representation [51; 55] (particularly, faces [56]),texture detection and segmentation [42; 57], and oriented structure analysis [41; 58].The 2-D Gabor wavelet has also been shown to outperform other linear filters fordetection of oriented features [59].
The 2-D Gabor wavelet is defined as
ψG(x) = exp(ik0x)exp(−1
2(xAx)
)+ correction, (8.14)
ψG(k) = (detB)1/2 exp(−1
2((k−k0)B(k−k0))
)+ correction, (8.15)
where A is a 2× 2 positive definite matrix that defines the wavelet anisotropy, B =A−1 and k0 ∈ R2 defines the complex exponential basic frequency. The anisotropymatrix is taken as
A =[
ε−1 00 1
], (8.16)
with elongation given by ε ≥ 1.The 2-D Gabor wavelet is therefore simply an elongated Gaussian modulated by
a complex exponential, which clarifies its relationship to the 1-D Morlet wavelet.The wavelet smoothes the signal in all directions, but detects sharp transitions in thedirection of k0. In spatial frequencies, the Gabor wavelet is given by a Gaussianfunction centered at k0 and elongated by ε in the ky direction. It is thus well local-ized both in position space, around the origin, and in the spatial frequency space,

Segmentation of Retinal Vasculature Using Wavelets 229
around k0. Angular selectivity increases with |k0| and ε . These effects can be com-bined choosing k0 = [0,ky] and ε 1. Figure 8.1 shows the effects of changing thewavelet’s parameters (both in space and spatial frequencies).
The correction term is necessary to enforce the admissibility condition (ψG(0) =0) [39]. However, it is worth noting that the term is numerically negligible for |k0| ≥5.6 and in many situations can be simply dropped. We do not use the correction term,since it implies a loss in spatial localization (|ψG|2 becomes bimodal [60]), and thisproblem should be addressed in future studies, as discussed in Section 8.6.2.
The definition of a directional wavelet is stated in terms of its spatial frequencydomain support [50]. An analyzing wavelet is said to be directional if its effectivesupport in the spatial frequency domain is contained within a convex cone with apexat the origin. Wavelets with directional support only in the spatial domain may notbe able to detect directional structures, as is the case with the anisotropic Mexicanhat [50], which does not satisfy the previously given definition. The Gabor waveletis thus said to be directional, as its spatial frequency domain support is an ellipsegiven by the elongated Gaussian of Equation 8.15, as can be seen in the examplesof Figure 8.1. If the definition is to be strictly observed, the Gabor wavelet is onlyapproximately directional, given the Gaussian tails that are outside the ellipse, but arenumerically negligible. The resolving power of the Gabor wavelet has been analyzedin terms of its scale and angular selectivity, helping define wavelet frames that tilethe spatial frequency domain [39; 50; 51]. Many other 2-D analyzing wavelets havebeen proposed in the literature, designed for specific problems, and the reader isreferred to [50] for a review.
In the case of vessel segmentation, the Gabor wavelet should be tuned to a suit-able frequency, so that vessels may be emphasized while noise and other undesir-able structures are filtered out. For the methods presented in this chapter (see Sec-tion 8.3.2), the parameters were set to ε = 4, resulting in an elongated wavelet, andk0 = [0,3], providing a low frequency complex exponential with transitions in thedirection of its smaller axis, as shown on the bottom row of Figure 8.1. The Ga-bor wavelet’s capability of detecting oriented features is fundamental in blood vesseldetection. It is interesting to note that the wavelet’s shape is locally similar to thatof a blood vessel and is preserved across different orientations and scales. There-fore, stronger wavelet responses are produced when the wavelet is found at the sameposition, orientation, and scale as a vessel in the image.
8.2.4 Supervised classification
In the proposed vessel segmentation approach, image pixels are seen as objects rep-resented by feature vectors, so that statistical classifiers might be applied for segmen-tation. In this case, each pixel is classified as vessel or nonvessel, using previouslytrained classifiers (supervised classification). The training sets for the classifiers arederived from manual segmentations of training images: pixels that were manuallysegmented out are labeled as vessel, while the remaining receive the nonvessel la-bel. The approach allows the use of different responses of the wavelet transform tocharacterize pixels, as well as application to different image modalities, provided a

230 Automated Image Detection of Retinal Pathology
−6 −3 0 3 6−6
−3
0
3
6
x
y
−6 −3 0 3 6−6
−3
0
3
6
kx
ky
−6 −3 0 3 6−6
−3
0
3
6
x
y
−6 −3 0 3 6−6
−3
0
3
6
kx
ky
−6 −3 0 3 6−6
−3
0
3
6
x
y
−6 −3 0 3 6−6
−3
0
3
6
kx
ky
FIGURE 8.1The Gabor wavelet in the spatial domain (represented by its real part) is shown in theleft column, while the frequency domain counterpart is shown in the right column.Different configurations of the parameters are shown to illustrate the correspondingeffects. Light and dark gray levels correspond to positive and negative coefficients,respectively. The parameters for the three rows are, from top to bottom: k0 = [2,3],ε = 1; k0 = [0,3], ε = 1; and k0 = [0,3], ε = 4.

Segmentation of Retinal Vasculature Using Wavelets 231
corresponding training set is available. The rest of this section contains descriptionspointing out important qualities of three classifiers: the Bayesian classifier using theGaussian mixture model (Sections 8.2.5 and 8.2.6), the k-nearest neighbor classifier(Section 8.2.7), and the linear minimum squared error classifier (Section 8.2.8).
8.2.5 Bayesian decision theory
Bayesian decision theory is one of the main approaches adopted in pattern recogni-tion problems. It is based on associating costs (or losses) to classification decisions,which are then chosen using the probability distributions of the objects being classi-fied. In most cases, the probability distributions are unknown and must be estimated,which can be done using prior knowledge of the problem structure along with theavailable training data. Bayes’s decision rule for an observed feature vector v in atwo class problem (classes C1 and C2) can be written in terms of posterior probabili-ties as:
decide C1 if P(C1|v) > P(C2|v);otherwise, decide C2.
(8.17)
The decision follows natural intuition and is shown to minimize the average proba-bility of error [61].
Bayes’s formula is written as
P(Ci|v) =p(v|Ci)P(Ci)
p(v), (8.18)
where p(v|Ci) is the class-conditional probability density function, also known aslikelihood, P(Ci) is the prior probability of class Ci, and p(v) is the probability den-sity function of v, also known as evidence. To obtain a decision rule based on esti-mates from the training data (as will be needed in Section 8.2.6), Bayes’s formula isapplied to Equation 8.17, resulting in the equivalent decision rule:
decide C1 if p(v|C1)P(C1) > p(v|C2)P(C2);otherwise, decide C2.
(8.19)
8.2.6 Bayesian Gaussian mixture model classifier
According to Bayesian decision theory, classification decisions can be made usingestimates of prior probabilities and likelihood functions. In the experiments per-formed by us, prior probabilities P(Ci) were estimated as Ni/N, the ratio of class Cisamples in the training set. The class likelihoods, in turn, were described using theGaussian mixture model (GMM), which consists of a linear combination of Gaus-sian functions [61; 62]. The Bayesian classifier using the GMM for class likelihoodswill be called the GMM classifier. The procedure for estimating the model’s param-eters was applied separately for each class likelihood. To simplify notation, suppose

232 Automated Image Detection of Retinal Pathology
the class Ci whose likelihood will be estimated is fixed. The likelihood of the class(earlier denoted p(v|Ci)) is then simply denoted p(v|φφφ), being modeled by
p(v|φφφ) =c
∑j=1
Pj p(v|φφφ j), (8.20)
where c Gaussians are used, given by p(v|φφφ j) and weights Pj. Each φφφ j describesthe parameters of Gaussian j, while the complete set of parameters that describe themodel is denoted φφφ ≡ φφφ 1, . . . ,φφφ c,P1, . . . ,Pc. The Gaussian functions are
p(v|φφφ j) =1√
det(2πΣ j)exp(−1
2(v−µµµ j)
TΣ−1j (v−µµµ j)
). (8.21)
where φφφ j = µµµ j,Σ j, µµµ j is the mean and Σ j the covariance matrix that describe theGaussian. In order for p(v|φφφ) to be a probability density function, it is necessary that
c
∑j=1
Pj = 1 and∫
p(v|φφφ j)dv = 1, j = 1, . . . ,c. (8.22)
GMMs are extensively used for clustering in unsupervised learning problems. Inthat context, each Gaussian models the likelihood of a class with previously unknowndistribution, with each Gaussian weight representing a prior class probability. Here,the GMM is used with a different purpose, in the description of class likelihoodsfrom samples with known labels. The GMM allows likelihoods to be representedwith arbitrary precision, being a flexible model applicable to complex and multi-modal distributions. In both applications, there is the need to estimate the Gaussians’parameters and weights from the available data.
The GMM parameters φφφ are estimated so as to maximize the likelihood of thetraining samples. The parameters enter the likelihood in a nonlinear fashion, requir-ing nonlinear optimization techniques. In the experiments performed, the parameterswere estimated using the Expectation-Maximization (EM) algorithm [61–63]. EM isan iterative process usually chosen for the estimation of mixture model parameters.It guarantees a local maximum of the function being optimized and can be appliedto maximize likelihoods or posterior probabilities.
A difficulty in estimating the GMMs is the choice of the number of Gaussians cto use. It can be shown that GMMs can approximate with arbitrary precision anycontinuous probability density function, given a sufficiently large number of Gaus-sians. However, large values of c may cause models to adjust excessively to thedata (a phenomenon known as over-fitting), while too small a c might not permitflexibility enough to properly describe the probability function. Experiments wereperformed varying the values of c for both classes, leading to different results. Fi-nally, EM guarantees only a local maximum of the likelihood, being dependent oninitialization. EM has received a good amount of attention in the last years, beingused in a variety of applications. Many methods were developed to overcome theabove mentioned problems [64], but were not explored in this work.

Segmentation of Retinal Vasculature Using Wavelets 233
GMMs fall between purely nonparametric and parametric approaches, providinga fast classification phase at the cost of a more expensive training algorithm. Non-parametric methods (as k-nearest neighbor classification presented in Section 8.2.7)are computationally demanding for large numbers of training samples, though theydo not impose restrictions on the underlying probability distributions. On the otherhand, GMMs guarantee a fast classification phase that depends only on the chosen c(i.e., independent of the number of training samples), while still allowing for model-ing complex distributions.
8.2.7 k-nearest neighbor classifier
A simple and popular classification approach is given by the k-nearest neighbor(kNN) rule. Let N be the total number of labeled training samples. Given an oddnumber k of neighbors, a distance measure, and a feature vector v, the k-nearestneighbor classification rule can be summarized in the following steps:
1. out of the N training samples, identify the k-nearest neighbors of v using thegiven distance measure;
2. out of the k-nearest samples identified, count the number of samples ki thatbelong to each class Ci;
3. classify v as belonging to the class Ci with the largest number ki of samples.
Various distance measures may be used, such as Euclidean or Mahalanobis distances,leading to different outcomes [61]. The Euclidean distance was used in this work forall experiments. The kNN classifier is nonparametric (independent of a probabilitydistribution model) and capable of producing complex nonlinear decision bound-aries. Theoretical superior limits on the classifier’s error probability can be estab-lished, which decrease with N, so that when k→ ∞, the error tends to the optimalBayesian error [61].
The classification rule may be interpreted as a decision taken based on estimatesof the posterior probabilities P(Ci|v) — simply estimated as ki/k — from the data.From this perspective, as k increases, so does the confidence on the estimates, butspatial precision is lost, as samples that are far from v start being considered. Thegreater the number of samples N, the smaller the effect of loss in spatial precision,allowing for larger values of k to be used. In this study, many training samples areavailable, allowing for good estimates, but demanding a large computational effort.A problem with nearest neighbor techniques is the computational complexity of thesearch for nearest neighbors among the N training samples. If the dimension of thefeature space is fixed, exhaustive search of the nearest neighbors of one sample takestime at least O(N), necessary for the calculation of distances. Being so, strategieshave been studied to improve performance, including efficient searches and reductionof the number of training samples used [61; 62]. Only the exhaustive search wasimplemented for the results shown in this chapter.

234 Automated Image Detection of Retinal Pathology
8.2.8 Linear minimum squared error classifier
The linear minimum squared error classifier [61; 62], denoted LMSE, was alsotested. Linear classifiers are defined by a linear decision function g in the d-dimen-sional feature space:
g(v) = wT v+w0, (8.23)
where v is a feature vector, w is the weight vector, and w0 is the threshold. Theclassification rule is to decide C1 if g(v) > 0 and C2 otherwise. To simplify theformulation, the threshold w0 is accommodated by defining the extended (d + 1)-dimensional vectors v′ ≡ [vT ,1]T and w′ ≡ [wT ,w0]T , so that g(v) = w′T v′.
The classifier is determined by finding w′ that minimizes the sum of squared errorcriterion on the training set, defined as
J(w′) =N
∑i=1
(v′Ti w′− yi)2, (8.24)
where N is the total number of training samples, v′i is the extended ith training sample,and yi is its desired output. The criterion measures the sum of squared errors betweenthe output of the classifier v′Ti w′ and the desired output yi. The desired outputs werearbitrarily set to yi = 1 for vi ∈C1 and yi =−1 for vi ∈C2.
Defining
V =
v′T1v′T2
...v′TN
, y =
y1y2...
yN
, (8.25)
the gradient of the criterion function can be written as
∇J(w′) =N
∑i=1
2(v′Ti w′− yi)v′i (8.26)
= 2V T (V w′−y). (8.27)
The criterion function is minimized by calculating w′ where the gradient equals zero,resulting in
(V TV )w′ = V T y⇒ w′ = (V TV )−1V T y. (8.28)
(V TV )−1V T is called the pseudoinverse of V and exists only if V TV is invertible.V TV is the correlation matrix of the training samples and will be invertible when Vhas full rank d + 1. Given the nature of the data used in tests and the large numberof training samples, this always occurred.
In comparison to the previously described kNN and GMM classifiers, the LMSEclassifier has faster training and test phases, but is restricted in the sense that it islinear, while the others allow for complex decision boundaries. However, as will beshown, the results obtained using LMSE are comparable to those using GMMs (seeSection 8.5), representing a reasonable trade-off.

Segmentation of Retinal Vasculature Using Wavelets 235
8.3 Segmentation Using the 2-D Gabor Wavelet and SupervisedClassification
Initially, promising results of vessel detection using the 2-D Gabor wavelet wereshown [11; 65]. The segmentation method evolved with the introduction of su-pervised pixel classification, allowing wavelet responses from different scales to becombined [66]. Finally, the Bayesian Gaussian mixture model classifier showed tobe specially appropriate for the segmentation task and was quantitatively evaluatedusing ROC analysis. A diagram illustrating the training of a classifier is presented inFigure 8.2(a). After training, the classifier can be applied to pixels of test images asshown in Figure 8.2(b). The process presented in the diagrams is described in greaterdetail throughout this section. The supervised learning approach combining differentwavelet scale responses simplifies method use, minimizing the need for interactionand parameter configuration.
The GMM classifier is shown to provide good results, while at the same time guar-anteeing a fast classification phase. For comparison, tests were performed in whichthe GMM classifier is substituted by the kNN and LMSE classifiers (see Section 8.2).Performance of the 2-D Gabor wavelet in enhancing blood vessels is demonstratedby comparing results of filtering using a single wavelet scale with results of the 2-DGaussian matched filter of Chaudhuri et al. [24]. Quantitative performance evalua-tion is performed using ROC analysis, which has been previously used for evaluationand comparison of retinal vessel segmentation methods on publicly available imagedatabases [25–28; 67].
8.3.1 Preprocessing
When the red-green-blue (RGB) components of colored images are visualized sepa-rately, the green channel shows the best vessel to background contrast, whereas thered and blue channels usually present low vessel contrast and are noisy [10]. Hence,for colored images, only the green channel is used for the generation of the waveletfeatures, as well as to compose the feature vector itself, i.e., the green channel inten-sity of each pixel is taken as one of its features. The green channel is inverted beforethe application of the wavelet transform to it, so that the vessels appear brighter thanthe background. Accordingly, the inversion is also applied to red-free, gray-scaleimages and fluorescein angiograms do not require inversion (see Section 8.1).
The Gabor wavelet responds strongly to high contrast edges, which may lead tofalse detection of the borders of the camera’s aperture. In order to reduce this effect,an iterative algorithm has been developed. The intent is to remove the strong contrastbetween the retinal fundus and the region outside the camera’s field-of-view (FOV)(see Figure 8.3).
The preprocessing algorithm starts with a region of interest (ROI) determined bythe camera’s aperture and iteratively grows this ROI. Each step of the algorithm con-sists of the following: first, the set of pixels of the exterior border of the ROI is deter-

236 Automated Image Detection of Retinal Pathology
(a) (b)
FIGURE 8.2Supervised pixel classification approach. The left diagram illustrates the supervisedtraining of a classifier. The trained classifier can then be applied to the segmentationof test images, as illustrated in the right diagram.

Segmentation of Retinal Vasculature Using Wavelets 237
(a) (b)
FIGURE 8.3Image preprocessing for removing undesired border effects. The inverted greenchannel of the image presented in Figure 8.6 appears on the left. The inverted greenchannel after preprocessing, presenting the extended border, appears on the right (theoriginal image limit is presented for illustration).
mined, i.e., pixels that are outside the ROI and are neighbors (using 4-neighborhood)to pixels inside it; then, each pixel value of this set is replaced with the mean valueof its neighbors (this time using 8-neighborhood) inside the ROI; finally, the ROI isexpanded by inclusion of this set of changed pixels. This process is repeated andmay be seen as artificially increasing the ROI, as shown in Figure 8.3(b).
8.3.2 2-D Gabor wavelet features
Among several available 2-D analyzing wavelets, the Gabor wavelet was adopted forvessel detection here and in previous works [65], based on the following properties.The wavelet is capable of detecting directional structures and of being tuned to spe-cific frequencies (see Section 8.2.3), which is specially important for filtering outthe background noise present in retinal images. Furthermore, it has been shown tooutperform other oriented feature detectors [59].
The Gabor wavelet parameters must be configured in order to enhance specificstructures or features of interest. In the tests performed, the elongation parameterwas set to ε = 4, making the filter elongated and k0 = [0,3], i.e., a low frequencycomplex exponential with few significant oscillations perpendicular to the large axisof the wavelet, as shown in Figure 8.4. These two characteristics are specially suitedfor the detection of directional features and have been chosen in order to enablethe transform to present stronger responses for pixels associated with vessels. Notethat the wavelet’s shape is similar to the vessels’, so that the transform yields strong
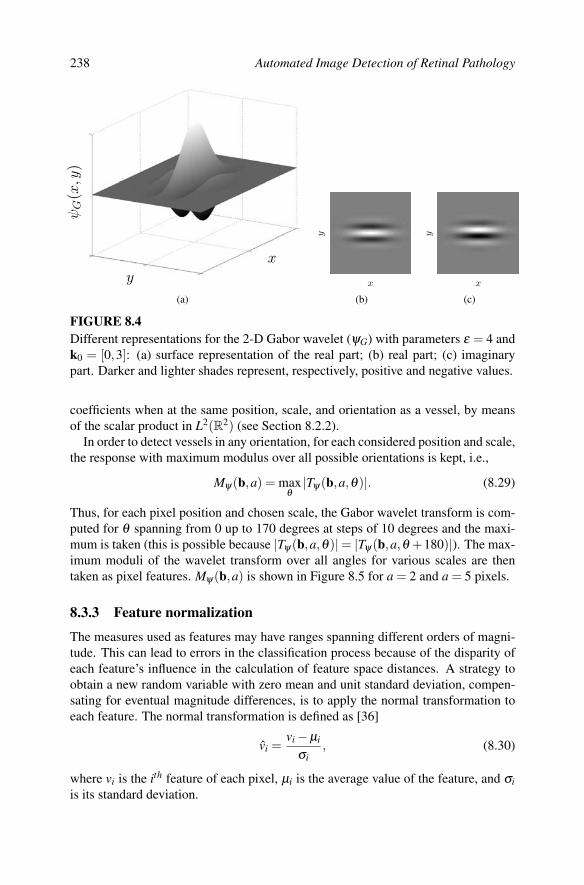
238 Automated Image Detection of Retinal Pathology
y
x
ψG(x,y
)
(a)
x
y
(b)
x
y
(c)
FIGURE 8.4Different representations for the 2-D Gabor wavelet (ψG) with parameters ε = 4 andk0 = [0,3]: (a) surface representation of the real part; (b) real part; (c) imaginarypart. Darker and lighter shades represent, respectively, positive and negative values.
coefficients when at the same position, scale, and orientation as a vessel, by meansof the scalar product in L2(R2) (see Section 8.2.2).
In order to detect vessels in any orientation, for each considered position and scale,the response with maximum modulus over all possible orientations is kept, i.e.,
Mψ(b,a) = maxθ
|Tψ(b,a,θ)|. (8.29)
Thus, for each pixel position and chosen scale, the Gabor wavelet transform is com-puted for θ spanning from 0 up to 170 degrees at steps of 10 degrees and the maxi-mum is taken (this is possible because |Tψ(b,a,θ)|= |Tψ(b,a,θ +180)|). The max-imum moduli of the wavelet transform over all angles for various scales are thentaken as pixel features. Mψ(b,a) is shown in Figure 8.5 for a = 2 and a = 5 pixels.
8.3.3 Feature normalization
The measures used as features may have ranges spanning different orders of magni-tude. This can lead to errors in the classification process because of the disparity ofeach feature’s influence in the calculation of feature space distances. A strategy toobtain a new random variable with zero mean and unit standard deviation, compen-sating for eventual magnitude differences, is to apply the normal transformation toeach feature. The normal transformation is defined as [36]
vi =vi−µi
σi, (8.30)
where vi is the ith feature of each pixel, µi is the average value of the feature, and σiis its standard deviation.

Segmentation of Retinal Vasculature Using Wavelets 239
FIGURE 8.5Maximum modulus of the Gabor wavelet transform over angles, Mψ(b,a) (Equa-tion 8.29), for scale values of a = 2 (left) and a = 5 (right) pixels.
The normal transformation was applied separately to each image, i.e., each im-age’s feature space was normalized using its own means and standard deviations,helping to compensate for intrinsic variation between images, such as global illumi-nation variation.
8.3.4 Supervised pixel classification
After feature generation and normalization, segmentations were obtained throughsupervised classification of image pixels into the classes C1 = vessel pixels andC2 = nonvessel pixels. Supervised classification involves using labeled trainingsamples (samples with known classes) to compose a training set, that then serves asa basis for future classification. Manual image segmentations (see Section 8.3.5) canbe used to provide these labels. Many classifiers then go through a training phase,involving, for example, parameter estimation on the training set, preparing them forclassification of new, unlabeled, pixel samples (see Figure 8.2).
In the experiments performed, the training sets were composed of labeled pixelsfrom several manually segmented retinal images. Due to the computational costof training the classifier and the large number of samples, subsets of the availablelabeled samples were randomly selected to actually be used for training.
Another approach for image segmentation through supervised classification, thatshowed interesting results, is to form the training set with labeled samples taken froma portion of the image to be segmented [68]. Using this approach, a semi-automatedfundus segmentation software could be developed, in which the user only has todraw a small portion of the vessels over the input image or simply click on severalpixels associated with vessels. The remaining image would then be automaticallysegmented based on this specific training set. This approach is interesting since it

240 Automated Image Detection of Retinal Pathology
requires a small effort from the user, which is compensated by the fact that imagepeculiarities are directly incorporated by the classifier.
8.3.5 Public image databases
There are different ways of obtaining retinal images, such as with colored digitalcameras or through angiography using fluorescent dyes (see Section 8.1). The pixelclassification approach can be applied to different image modalities, provided ap-propriate manual segmentations are available for training. The approach describedhere has been tested on colored images and gray-scale angiograms [65; 66]. In orderto facilitate comparisons with other methods, experiments are presented using twopublicly available databases of colored images and corresponding manual segmenta-tions: the DRIVE [28] and STARE [25] databases.
The DRIVE database consists of 40 images (7 of which present pathology), ran-domly selected from a diabetic retinopathy screening program in the Netherlands,along with manual segmentations of the vessels. They were captured in digital formfrom a Canon CR5 nonmydriatic 3CCD camera at 45 FOV. The images are of size768× 584 pixels, 8 bits per color channel and have an FOV of approximately 540pixels in diameter. The images are in compressed JPEG-format, which is unfortunatefor image processing, but is commonly used in screening practice.
The authors of this database divided the 40 images into fixed training and test sets,each containing 20 images (the training set has 3 images with pathology and thetest set, 4) [21; 28]. The images have been manually segmented by three observerstrained by an ophthalmologist. Images in the training set were segmented once, whileimages in the test set were segmented twice, resulting in sets A and B of manualsegmentations. The observers of sets A and B produced similar segmentations: in setA, 12.7% of pixels where marked as vessel, against 12.3% vessel for set B. A normalimage from the test set and its respective manual segmentations are illustrated inFigure 8.6. Performance is measured on the test set using the segmentations of set Aas ground truth. The segmentations of set B are tested against those of A, serving asa human observer reference for performance comparison.
The STARE database consists of 20 digitized slides captured by a TopCon TRV-50fundus camera at 35 FOV. The slides were digitized to 700×605 pixels, 8 bits percolor channel. The FOV in the images is approximately 650×550 pixels in diameter.Images were selected so that ten of them contained pathologies, which complicatesvessel detection. This choice was made so that the performance difference on normaland pathological images could be assessed. Two observers manually segmented all20 images. The first observer segmented 10.4% of pixels as vessel, against 14.9%vessels for the second observer. The segmentations of the two observers are fairlydifferent in that the second observer consistently segmented much more of the thin-ner vessels than the first. Figure 8.6 shows an image from the database and its respec-tive manual segmentations. Previous tests using this database [20; 25–28] calculatedperformance using segmentations from the first observer as ground truth, with thesecond observer’s segmentations being tested against the first. There is no predefined

Segmentation of Retinal Vasculature Using Wavelets 241
(a) (b) (c)
(d) (e) (f)
FIGURE 8.6Images from the DRIVE and STARE databases and their respective manual segmen-tations: (a) normal image from the test set of the DRIVE database; (b) manual seg-mentation from set A; (c) manual segmentation from set B; (d) normal image fromthe STARE database; (e) manual segmentation by the first observer; and (f) manualsegmentation by the second observer. (See color insert following page 174.)
separation into training and test sets, therefore leave-one-out tests are performed forsupervised method performance evaluation.
8.3.6 Experiments and settings
The methods described were tested on the DRIVE and STARE databases with thefollowing settings. The pixel features used for classification were the inverted greenchannel and its maximum Gabor wavelet transform response over angles Mψ(b,a)(Equation 8.29) for scales a = 2,3,4,5 pixels (see Subsection 8.3.2). These scaleswere chosen to span the possible widths of vessels throughout the images, so that allvessels could be detected.
For the DRIVE database, the training set was formed by pixel samples from the20 labeled training images. For the STARE database, leave-one-out tests were per-formed, i.e., every image was segmented using samples from the other 19 images forthe training set (see Section 8.3.5). The three classifiers presented in Section 8.2 wereevaluated to allow their comparison. Due to the large number of pixels, in all exper-

242 Automated Image Detection of Retinal Pathology
iments, samples were randomly chosen to train the classifiers. The three classifierswere compared using 100 000 training samples (N = 105), because of computationaldemands of kNN classification. However, for comparison with other methods fromthe literature, the GMM classifier was trained using 1 000 000 samples (N = 106).The GMM classifier was tested varying the number c of Gaussians modeling eachclass likelihood, while experiments with the kNN classifier used different values forthe number k of neighbors analyzed. Additionally, to verify the dependence of themethod on the training set, a test was performed in which the GMM classifier wastrained on each of the DRIVE and STARE databases, while being tested on the other.
To demonstrate the performance of the Gabor wavelet in enhancing blood vessels,results of filtering using a single wavelet scale are presented and compared withresults of the 2-D Gaussian matched filter of Chaudhuri et al. [24]. The parametersof both filters were chosen as to produce the best results: a = 4 pixels for waveletfiltering and σ = 1 pixel for the matched filter of Chaudhuri et al.
8.3.7 ROC analysis
The methods are evaluated using curves in receiver operating characteristic (ROC)graphs. ROC graphs have long been used in signal detection theory and more re-cently in pattern recognition and medical diagnostic systems [69]. They allow forvisualizing the performance of classifiers and diagnostic tests, expressing the trade-off between increased detection and false alarm rates.
ROC curves are formed by ordered pairs of true positive and false positive frac-tions. Different fractions are established varying each method’s parameters [25–27]or thresholds on posterior probabilities [28]. For each configuration of parametersor threshold value, a pair formed by a true positive and a false positive fraction cor-responding to the method’s outcome is marked on the graph, producing a curve asin Figure 8.7. In the scenario of evaluating vessel segmentations, true positives arepixels marked as vessel (positive) in both the segmentation given by a method andthe manual segmentation used as ground truth. False positives are pixels markedas vessel by the method, but are actually negative in the ground truth. Classificationmeasures are summarized in the confusion matrix (also known as contingency table),illustrated in Table 8.1. The total of positives and negatives in the ground truth aredenoted P and N; the total number of true and false positives are TP and FP; and trueand false negatives are denoted TN and FN, as shown in the confusion matrix. Met-rics used in evaluation can then be derived from the matrix elements. True positiveand false positive fractions, denoted TPF and FPF, are given by
TPF =TPP
FPF =FPN
. (8.31)
The accuracy (fraction of correctly classified pixels) of the methods and humanobservers tested against the ground truth are also measured during performance eval-uation. Accuracy is given by (TP + TN)/(P + N), simply measuring the fraction ofcorrect classification. Contrasting with ROC measures, accuracy does not express

Segmentation of Retinal Vasculature Using Wavelets 243
Table 8.1: Confusion matrix.
Ground Truth
Positive (P) Negative (N)
Method resultPositive True positive (TP) False positive (FP)
Negative False negative (FN) True negative (TN)
the relation between quantities of true positives and false positives, being sensitiveto skews in class distribution.
Some points on the ROC graph help give an intuitive idea of the representation(see Figure 8.7). The lower left point (0,0) represents an extremely conservativemethod that assigns only negative to all samples. Thus, it is incapable of producingtrue positives, though it also does not produce false positives. The opposite strategy,which is to assign positive to all samples, corresponds to the upper right point (1,1).The closer an ROC curve is to the upper left corner, the better the method’s perfor-mance, with the point (0,1) representing a perfect agreement with the ground truth.Accordingly, an ROC curve is said to dominate another if it is completely above andto the left of it. The diagonal line in which TPF = FPF represents a random assign-ment strategy, with different points of the line corresponding to different fractions ofrandom assignment of negatives and positives.
A very important property of ROC graphs is their invariance to changes in priorclass distributions, represented by the proportion of positive and negative samples.This is possible because the fractions analyzed are relative to the total of samples ineach class. The same does not apply to other measures, such as accuracy, describedpreviously. In an analogous manner, ROC graphs are also invariant to changes incosts associated with classification decisions [70].
The area under an ROC curve (Az) is used as a single scalar measure of a method’sperformance. Az values, being fractions of a unitary square, necessarily lie between 0and 1. Nevertheless, as a random classifier would produce a diagonal line connecting(0,0) and (1,1) with Az = 0.5, in practice, methods should always have Az ≥ 0.5. Amethod that agreed completely with the manual segmentations used as ground truthwould yield an Az = 1. It is possible for a method with larger area under the curveto have a worse performance in a given region of the graph than one with smallerarea, as illustrated in Figure 8.7. However, the area serves as good estimate of amethod’s overall performance. The areas under the ROC curves have an importantstatistical property: they are equivalent to the Wilcoxon statistic [71], the probabilitythat a method assign a larger chance or rank to a randomly chosen positive samplethan that assigned to a randomly chosen negative sample.
In order to draw conclusions about method superiority, it is not sufficient that amethod’s ROC curve calculated over a given dataset dominate that of another, asvariances must be taken into account. These variances can be estimated using ap-proaches such as cross-validation and bootstrapping [69]. The same principle appliesfor comparison of accuracy and Az measures. In [27; 28; 67], these measures were

244 Automated Image Detection of Retinal Pathology
false positive rate
true
posit
iverat
e
Method AMethod B
1
0.8
0.6
0.4
0.2
010.80.60.40.20
FIGURE 8.7Example of an ROC graph with two curves. The area under the curve (Az) of methodA is larger than that of method B, though B should be preferred for false positivefractions larger than approximately 0.5.
taken for different methods and compared in paired statistical hypothesis tests, withthe accuracy and Az of each image segmentation result representing an observation.Here, the evaluation does not include significance tests, though that may provide fora stronger statement.
In the experiments performed, measures were taken over all test images, consid-ering only pixels inside the FOV defined by the camera aperture. For the GMM andkNN classifiers, ROC curves are produced by varying the thresholds on posteriorpixel probability estimates, while the LMSE ROC curve is produced by varying thethreshold w0 applied to the scalar product between the classifier’s weight vector andpixel feature vectors (Equation 8.23). Finally, the ROC curves for filtering using asingle wavelet scale and the matched filter of Chaudhuri et al. are produced vary-ing the threshold on the filters’ responses. For the DRIVE database, performance iscalculated using manual segmentations from set A as ground truth and human ob-server performance is estimated from manual segmentations from set B, which onlyprovides one true/false positive fraction pair, appearing as a point in the ROC graph(Figure 8.13). For the STARE database, the first observer’s manual segmentations areused as ground truth and the second observer’s true/false positive rate pair is plottedon the graph (Figure 8.14). It is important to point out that the manual segmentationsevaluated do not present perfect true/false positive fractions, as they disagree on sev-eral pixels with the segmentations used as ground truth. Thus, the variance betweenobservers can be estimated, helping set a goal for method performance.

Segmentation of Retinal Vasculature Using Wavelets 245
8.4 Implementation and Graphical User Interface8.4.1 Overview
The implentation of the method for performing experiments led to a package ofMATLAB [72] scripts, that now also includes a graphical user interface (GUI) forpreliminary testing. The package, named mlvessel, is available as open-source codeunder the GNU General Public License (GPL) [73] at the project’s collaborative de-velopment Web site, http://retina.iv.fapesp.br. The Web site also contains some ofthe results presented here, allowing researchers to evaluate them in new and diversemanners. Experiments can be executed through function calls, with the specificationof options and parameters in configuration files. Results are then presented as im-ages and tables organized in HTML pages, as illustrated in Figure 8.8. Most of thepackage’s functionality is also accessible through the GUI, outlined in Section 8.4.4.
To facilitate testing, a pipeline architecture was used, in which intermediate re-sults are saved on disc for reutilization. In this manner, pixel features, training sets,and classifiers can be reused in different tests, saving up the computational effortnecessary for their creation. Components of the pipeline, such as feature generationor classifier training (refer to Figure 8.2), can then be substituted for comparativetests. The software implementation is organized as the modules listed below, eachcorresponding to a directory inside the src/ directory.
• tests: examples of tests, which manipulate other modules. For complete ex-amples, see scripts testmixed.m and testleaveoneout.m.
• gui: The GUI is initialized through its main window in guimain.m, whichprovides access to all others.
• ftrs: feature generation and manipulation, including creation of training sets.The createfeatures functions produce raw pixel features from images. The cre-atelabelled functions receive the raw features and also manual segmentations,saving everything as labeled pixel features. Finally, the function createpro-cessed normalizes the labeled features, forming a training set that can then befed to the classifiers.
• gmm: This module contains the GMM classifier. gmmcreatemodel receivesa processed training set in order to create and save a classifier. gmmclassifyreceives a saved classifier and raw pixel features, producing each pixel’s classas output.
• knn: an exhaustive implementation of the kNN classifier.
• lmse: This module contains the LMSE classifier. Creation and application ofthe classifier is analogous to that of the gmm module.
• stats: statistics generation from results. ROC graphs and statistics are orga-nized in HTML pages, as illustrated in Figure 8.8.

246 Automated Image Detection of Retinal Pathology
• html: functions for formatting and saving HTML pages.
• skel: postprocessing and scale-space skeletonization [36] for applicationto vasculature segmentations. Part of the module is written in C with aMATLAB® programming interface.
MATLAB is a software extensively used for tasks such as image processing andincludes an environment that provides for fast, prototypical software development.However, it is a commercial program and its use requires a license that is usuallypaid for. A new implementation of the method and interface is being developed inC++, which should be faster, have better usability, and be independent of MATLAB.
8.4.2 Installation
Installation should be simple, consisting of the following steps.
1. Download the mlvessel package, version 1.2 or later, from the project’s Website (http://retina.iv.fapesp.br).
2. Unpack the package (mlvessel.zip or mlvessel.tar.gz), using unzip or gnuzipand tar. Move the unzipped files to the directory where you wish the packageto be installed.
3. Run the mlvesselinstall.m script from within MATLAB.
The mlvesselinstall.m script compiles the C code in the skel module, records theinstallation directory for future use, adds the gui and tests modules to the MATLABpath, and creates shortcut files for starting the software. You might want to addthe gui and tests modules permanently to the paths in startup.m. Alternatively, thesoftware may be started through the shortcuts mlvessel.bat and mlvesselgui.bat onWindows or mlvessel.sh and mlvesselgui.sh on Unix platforms, which should addthe paths appropriately on startup. It is important to note that the package requiresstandard MATLAB toolboxes to run properly, such as the image processing toolbox.
8.4.3 Command line interface
All of the package’s features are available through functions accessible from thecommand prompt of the MATLAB environment. Some of the features, such as thestats module for generation of statistics from results, are currently only availablethrough function invocation, as the GUI has not yet been developed for them. Thetests’ outputs are saved as images, .mat files, and HTML pages as illustrated inFigure 8.8. The major experiments listed below serve as good starting points andexamples of use:
>> testmixed(someconfig): experiments for separate train and test sets, as usedhere for the DRIVE database;

Segmentation of Retinal Vasculature Using Wavelets 247
>> testleaveoneout(someconfig): leave-one-out experiments, as used here for theSTARE database.
someconfig describes a structure containing all experimental configurations, includ-ing testing and training image file names, classifier specifications, and pixel featuresto be used. Examples of configuration structures are in src/tests/driveconfig.m andsrc/tests/stareconfig.m. Images for tests were not included in the package, but can bedownloaded directly from the DRIVE and STARE databases.
8.4.4 Graphical user interface
A GUI has been implemented in MATLAB for preliminary testing by users. It canbe initialized through its main window (Figure 8.9(a)) in guimain.m, which providesaccess to all others. The interface currently comprehends:
• visualizing and saving images composed of pixel features;
• specifying, configuring, training, and saving classifiers;
• opening and visualizing classifiers and applying them for image segmentation.
Following is a brief description of GUI use, which illustrates the supervised classifi-cation framework, from feature generation and classifier training to image segmen-tation.
8.4.4.1 Visualizing Pixel Features
Images can be opened through the main window menu at File → Image → Open.After opening an image, pixel features are generated and viewed by accessing Im-age → View Features from the image window menu (Figure 8.9(b)). The Choosefeatures dialogue will then appear so that features may be specified. First, the imagetype must be informed. Depending on image type, possible pixel feature choices arethe inverted green channel (colored images), inverted gray-scale channel (red-freeimages), or original gray-scale channel (fluorescein angiograms) and each of theseprocessed by the Gabor wavelet (Mψ(b,a), as in Equation 8.29) for different possiblechoices of the parameters: vertical basic frequency ky, elongation ε , and scale a (seeEquation 8.14). After confirming feature selection, they are generated (feature gen-eration may take a few minutes), after which a window for visualization will appear,providing the option of saving pixel feature images.
8.4.4.2 Creating and Saving a Classifier
Figure 8.9(c) illustrates a classifier window in which a set of classifier options hasbeen chosen. The following steps should be followed in order to create a classifier.
1. In the main program window menu, choose File → Classifier → New. Thiswill open a new classifier window.

248 Automated Image Detection of Retinal Pathology
FIGURE 8.8Examples of HTML outputs produced using the mlvessel package. Top: segmen-tation results for an image from the DRIVE database. Bottom: statistics and ROCgraphs for results on the DRIVE database. (See color insert.)

Segmentation of Retinal Vasculature Using Wavelets 249
2. Specify the classifier properties: type of classifier (GMM, kNN, or LMSE), itsparameters, and number of training samples.
3. Choose the image type (colored, red-free, or fluorescein angiogram) for theclassifier and specify pixel features to be used.
4. Indicate training images and respective manual segmentations.
5. Click on Create classifier. Depending on the previous choices, the classifiercreation process may take from minutes to hours.
Once the classifier is created, it is ready to be used to segment new images. Clas-sifiers can be saved for future use through their menu at Classifier → Save as andshould be loaded through the main window menu at File → Classifier → Open,which also allows all of the classifier’s properties to be viewed.
8.4.4.3 Applying a Classifier for Image Segmentation
In order to segment an image, a suitable classifier must be chosen. The Segmentimage dialogue, shown in Figure 8.9(d), is used to match an image with a classifierfor segmentation. It can be reached through the image window menu at Image →
Segment Image or the classifier window at the Segment Image button. The imagechosen to be segmented should match the modality and approximate resolution ofthe images used to train the classifier, as the features generated for segmentation willbe the same as specified during classifier creation. In this manner, the segmentationstep does not require choosing features or any kind of parameter configuration. Theresult will then appear as a gray-scale image representing posterior probabilities,along with the final segmentation (see Figure 8.9(e)), both of which can then besaved.
8.5 Experimental ResultsIllustrative segmentation results for a pair of images from each of the DRIVE andSTARE databases (produced by the GMM classifier with c = 20 and N = 106), alongwith corresponding manual segmentations, are shown in Figures 8.10 and 8.11. Fig-ure 8.12 presents results for the same images and settings, but with the GMM classi-fier being trained on each of the DRIVE and STARE databases, while tested on theother. The results shown are images formed by estimated posterior probabilities ofeach pixel belonging to class C1 (vessel), as well as the final segmentation, producedby thresholding the posterior probabilities at p(C1|v) > 0.5.
Table 8.2 presents comparative results for the three different classifiers tested. Ar-eas under the ROC curves (Az) and accuracies are presented for the GMM clas-sifier with different values of c; kNN classifier with different values of k and theLMSE classifier. The results for this table were produced with classifiers trained
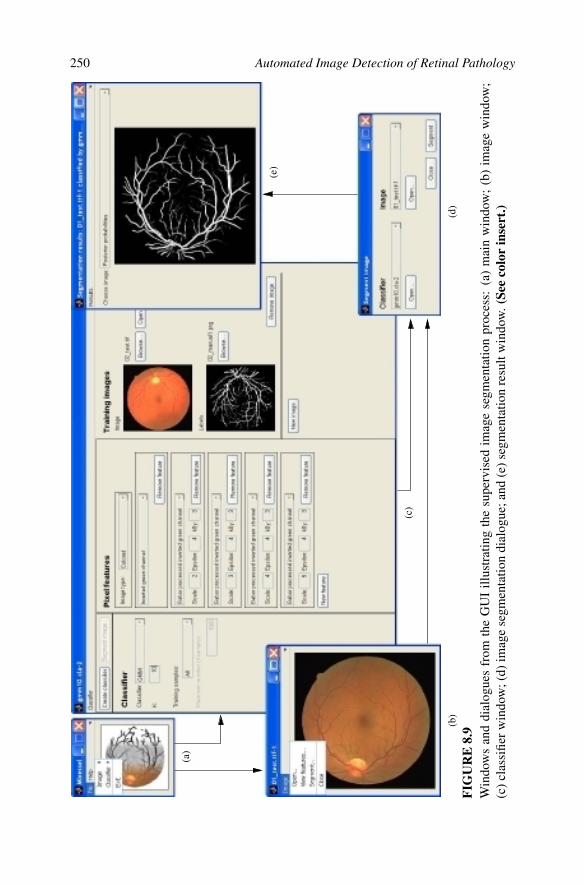
250 Automated Image Detection of Retinal Pathology
(a)
(b)
(c)
(d)
(e)
FIG
UR
E8.
9W
indo
ws
and
dial
ogue
sfr
omth
eG
UI
illus
trat
ing
the
supe
rvis
edim
age
segm
enta
tion
proc
ess:
(a)
mai
nw
indo
w;
(b)
imag
ew
indo
w;
(c)c
lass
ifier
win
dow
;(d)
imag
ese
gmen
tatio
ndi
alog
ue;a
nd(e
)seg
men
tatio
nre
sult
win
dow
.(Se
eco
lor
inse
rt.)

Segmentation of Retinal Vasculature Using Wavelets 251
FIG
UR
E8.
10R
esul
tspr
oduc
edby
the
GM
Mcl
assi
fier
with
c=
20an
dN
=10
6 ,alo
ngw
ithre
spec
tive
man
uals
egm
enta
tions
,for
two
imag
esfr
omth
eD
RIV
Eda
taba
se.
Firs
tcol
umn
imag
esar
eth
ees
timat
edpo
ster
ior
prob
abili
ties
ofea
chpi
xelb
elon
ging
tocl
ass
C1
(ves
sel)
,whi
leth
ese
cond
colu
mn
imag
esar
eth
efin
alse
gmen
tatio
ns,
prod
uced
byth
resh
oldi
ngpo
ster
ior
prob
abili
ties
atp(
C1|
v)>
0.5.
The
thir
dan
dfo
urth
colu
mns
are
man
uals
egm
enta
tions
from
sets
Aan
dB
,res
pect
ivel
y.T
hepo
ster
ior
prob
abili
tyim
ages
had
thei
rhi
stog
ram
sm
odifi
edfo
rbet
terv
isua
lizat
ion.

252 Automated Image Detection of Retinal Pathology
FIG
UR
E8.
11R
esul
tspr
oduc
edby
the
GM
Mcl
assi
fier
with
c=
20an
dN
=10
6 ,alo
ngw
ithre
spec
tive
man
uals
egm
enta
tions
,for
two
imag
esfr
omth
eST
AR
Eda
taba
se.
Firs
tcol
umn
imag
esar
eth
ees
timat
edpo
ster
ior
prob
abili
ties
ofea
chpi
xelb
elon
ging
tocl
ass
C1
(ves
sel)
,whi
leth
ese
cond
colu
mn
imag
esar
eth
efin
alse
gmen
tatio
ns,
prod
uced
byth
resh
oldi
ngpo
ster
ior
prob
abili
ties
atp(
C1|
v)>
0.5.
The
thir
dan
dfo
urth
colu
mns
are
man
uals
egm
enta
tions
from
the
first
and
seco
ndob
serv
er,r
espe
ctiv
ely.
The
post
erio
rpr
obab
ility
imag
esha
dth
eir
hist
ogra
ms
mod
ified
for
bette
rvi
sual
izat
ion.
Top
row
imag
esar
efr
oma
heal
thy
subj
ect,
whi
leth
ebo
ttom
ones
orig
inat
efr
oma
dise
ased
subj
ect.

Segmentation of Retinal Vasculature Using Wavelets 253
FIG
UR
E8.
12R
esul
tspr
oduc
edby
trai
ning
the
GM
Mcl
assi
fierw
ithc=
20an
dN
=10
6on
each
ofth
eD
RIV
Ean
dST
AR
Eda
taba
ses,
with
test
ing
onth
eot
her,
fori
mag
espr
esen
ted
inFi
gure
s8.
10an
d8.
11.F
irst
and
thir
dco
lum
nim
ages
are
the
estim
ated
post
erio
rpro
babi
litie
sof
each
pixe
lbel
ongi
ngto
clas
sC
1(v
esse
l),w
hile
the
seco
ndan
dfo
urth
colu
mn
imag
esar
eth
efin
alse
gmen
tatio
ns,p
rodu
ced
byth
resh
oldi
ngpo
ster
iorp
roba
bilit
ies
atp(
C1|
v)>
0.5.
The
post
erio
rpro
babi
lity
imag
esha
dth
eirh
isto
gram
sm
odifi
edfo
rbet
terv
isua
lizat
ion.

254 Automated Image Detection of Retinal Pathology
Table 8.2: Az and Accuracies for Using Different Classifiers(Az indicates the area under the ROC curve, while theaccuracy is the fraction of correctly classified pixels. Allclassifiers were trained using 100 000 samples (N = 105).)
Database
Classifier used DRIVE STARE
Az Accuracy Az Accuracy
LMSE 0.9532 0.9284 0.9602 0.9365
kNN, k = 1 0.8220 0.9201 0.8166 0.9273
kNN, k = 8 0.9339 0.9446 0.9336 0.9460
kNN, k = 32 0.9529 0.9473 0.9558 0.9480
kNN, k = 64 0.9568 0.9475 0.9612 0.9482
kNN, k = 128 0.9591 0.9479 0.9636 0.9480
kNN, k = 256 0.9605 0.9478 0.9653 0.9478
kNN, k = 512 0.9609 0.9476 0.9658 0.9472
GMM, c = 1 0.9287 0.9227 0.9409 0.9244
GMM, c = 5 0.9549 0.9419 0.9616 0.9437
GMM, c = 10 0.9582 0.9446 0.9657 0.9474
GMM, c = 15 0.9592 0.9454 0.9657 0.9469
GMM, c = 20 0.9600 0.9468 0.9666 0.9478
GMM, c = 30 0.9609 0.9468 0.9661 0.9476
GMM, c = 40 0.9610 0.9473 0.9665 0.9479
with 100 000 samples (N = 105). Diverse segmentation methods are compared inTable 8.3, that presents areas under the ROC curves and accuracies for the follow-ing methods: GMM classifier with c = 20 and N = 106; the same classifier beingtrained on each of the DRIVE and STARE databases and tested on the other (crossedtest); filtering using a single Gabor wavelet scale; the matched filter of Chaudhuriet al. [24]; and the methods of Jiang et al. [26] and Staal et al. [28], as publishedin [28]. Accuracies are also presented for manual segmentations from human ob-servers. ROC curves for the DRIVE and STARE databases produced using the GMMclassifier with c = 20 and N = 106, filtering using a single Gabor wavelet scale, thematched filter of Chaudhuri et al., as well as points representing human observerperformance, are shown in Figures 8.13 and 8.14.
The Expectation-Maximization training process for the GMMs is computation-ally more expensive as c increases, but can be done off-line, while the classifica-tion phase is fast. The kNN classifier, implemented in a straightforward exhaus-tive manner, does not go through training, but has a very demanding classification

Segmentation of Retinal Vasculature Using Wavelets 255
Table 8.3: Az and Accuracies for Different Segmentation Methods and a SecondHuman Observer (Az indicates the area under the ROC curve, while the accuracy isthe fraction of correctly classified pixels.)
Database
Classifier used DRIVE STARE
Az Accuracy Az Accuracy
GMM, c = 20, N = 106 0.9614 0.9466 0.9671 0.9480
Crossed test, GMM, c = 20, N = 106 0.9522 0.9404 0.9601 0.9328
Mψ(b,4) 0.9312 0.9351
Chaudhuri et al. [24] 0.9103 0.8987
Jiang et al. [26] 0.9327 0.8911 0.9298 0.9009
Staal et al. [28] 0.9520 0.9441 0.9614 0.9516
Second observer 0.9473 0.9349
false positive rate
true
posit
iverat
e
GMM, c = 2 0GMM, c = 20, p(C1|v ) > 0.5M!(b , 4)Chaudhuri et al.Set B
FIGURE 8.13ROC curves for results from the DRIVE database produced using the GMM classi-fier with c = 20 and N = 106, filtering using a single Gabor wavelet scale (Mψ(b,4))and the matched filter of Chaudhuri et al. Point marked as ••• corresponds to clas-sifications produced by applying the threshold p(C1|v) > 0.5 and the point markedas ××× corresponds to set B, the second set of manual segmentations. The GMM clas-sifier has Az = 0.9614.

256 Automated Image Detection of Retinal Pathology
false positive rate
truep
ositiv
erate
GMM, c = 2 0GMM, c = 20, p(C1|v ) > 0.5M!(b , 4)Chaudhuri et al.Second observer
FIGURE 8.14ROC curves for results from the STARE database produced using the GMM classi-fier with c = 20 and N = 106, filtering using a single Gabor wavelet scale (Mψ(b,4))and the matched filter of Chaudhuri et al. Point marked as ••• corresponds to clas-sifications produced by applying the threshold p(C1|v) > 0.5 and the point markedas ××× corresponds to the second observer’s manual segmentations. The GMM classi-fier has Az = 0.9671.
phase. In turn, the LMSE classifier is both fast in training and classification, butprovides poorer results, as shown in Table 8.2. Fixing the dimension of the fea-ture space, classification of an image’s pixel feature vectors using the GMM clas-sifier is fast, taking time O(cP), where P is the total number of pixels in the im-age. Comparatively, the kNN classifier takes time O(NP) solely for the calcula-tion of the distances used, where N is the number of training samples. The pro-cess of feature generation is basically the calculation of the wavelet coefficients,which is done by a series of correlations. By using the Fast Fourier Transform andthe Fourier definition of the wavelet transform (Equation 8.15), these are done inO(P log2 P) [49]. A nonoptimized MATLAB implementation was used for thesetests. On an AMD Athlon XP 2700+ PC (2167 MHz clock) with 1 GB memory,feature generation for typical images from the DRIVE and STARE databases takesabout 3 minutes. Estimation of the GMM parameters with c = 20 and N = 105
takes up to 2 hours (though this would speed up considerably with an optimizedimplementation), while the classification of an image’s pixels using this classifier

Segmentation of Retinal Vasculature Using Wavelets 257
takes less than 10 seconds. On the other hand, classification of an image’s pix-els with the kNN classifier with the same number of training samples takes about4 hours.
Note that the Az and accuracy for the GMM classifier increased with c (Table 8.2).After some value of c, though, it is expected that the performance declines, sincethe model will probably be excessively adjusted (over-fit) to the training data (seeSection 8.2.6). In a similar fashion, the Az of the kNN classifier increased with k,but after a certain value a loss in the spatial precision of estimates is expected, whichwould also lead to performance decline (see Section 8.2.7). This kind of behavioris observed by the decrease in accuracy of the kNN classifier for k ≥ 128. Thedecrease is caused by the small number of training samples coupled with high valuesof k, leading to an excessive amount of test samples being attributed to the nonvesselclass. As ROC analysis is invariant to skews in class distribution, the Az values werenot affected, though it is still expected they decrease for larger values of k.
The manual segmentations help give an estimate of the variance between humanobservers. On the DRIVE database, the GMM classifier ROC curve is very close tothe point representing the second set of manual segmentations (Figure 8.13). Themethod presents very good results on normal, well-behaved images, but pathologicalor poorly illuminated images (as discussed below) lower the overall performance.It is curious to note that, on the STARE database, the accuracy of some methodsis higher than that of the second observer (Table 8.3). The second observer’s man-ual segmentations contain much more of the thinnest vessels than the first observer(lowering their accuracy), while the method, trained by the first observer, is able tosegment the vessels at a similar fraction. Nevertheless, the ROC graph (Figure 8.14)still reflects the higher precision of the second observer, due to some difficultiesfound by the method, as discussed below.
Visual inspection reveals typical problems that must be solved by future work.The major errors are in false detection of noise and other artifacts. False detectionoccurs in some images at the border of the optic disc, hemorrhages, microaneurysms,exudates, and other types of pathologies that present strong contrast. Another dif-ficulty is the detection of the thinnest vessels that are barely perceived by humanobservers. Also, the method did not perform well for very large variations in lightingthroughout an image, but this occurred for only one image out of the 40 tested fromboth databases.
The crossed test, in which images from each database were segmented by a clas-sifier trained on the other, presented slightly worse results than the standard experi-ments (Table 8.3 and Figure 8.12). Though the databases are similar, there is a differ-ence in the typical vessel widths found in each database’s images, which contributedsignificantly to the performance loss. In the results from the DRIVE database, thethinner vessels are poorly detected and there is an increase in noise appearing asfalse positives. Results from the STARE database present much more noise andalso pathologies detected as false positives. While the performance difference is notlarge, this shows that even for the simple vessel structures there is a certain depen-dence of the method on the training set. The classifier is capable of adjusting tospecific acquisition conditions, but not able to generalize perfectly to others.

258 Automated Image Detection of Retinal Pathology
8.6 Conclusion8.6.1 Summary
The Gabor wavelet shows itself efficient in enhancing vessel contrast while filteringout noise, giving better performance than the matched filter of Chaudhuri et al. [24].Information from wavelet responses at different scales is combined through the su-pervised classification framework, allowing proper segmentation of vessels of vari-ous widths. Of the three classifiers tested, the LMSE gave the worst performance,but with fast training and classification phases. The kNN classifier showed goodperformance, but with a slow classification phase, complicating its use in interac-tive applications. Finally, the GMM classifier has a demanding training process, butguarantees a fast classification phase and good performance, similar to that of thekNN. Feature generation consists of computing a series of wavelet coefficients andcan be implemented efficiently, resulting in an approach that can be included in aninteractive tool. An open-source prototype of an interactive software for vessel seg-mentation — based on a graphical user interface that assists the process of classifiertraining and vessel segmentation — was described, including details on the mostimportant steps.
The supervised classification framework demands use of manual labelings, butallows classifiers to be trained for different image modalities, possibly adjusted tospecific camera or lighting conditions but are otherwise automatic, i.e., adjustment ofparameters or user interaction is not necessary. The experiments in which the GMMclassifier was trained on each of the DRIVE and STARE databases and tested on theother showed the dependence of the method on the training set. As an alternativetraining process, labeled samples from the image to be segmented provided by a usermay be used, allowing image peculiarities to be incorporated [68]. Recent supervisedmethods have shown good results with respect to ROC analysis, even though theyare restricted to local vessel detection [21; 28]. Supervised classification avoidsformulation of complex rules that deal with specific situations, as the complexitycan be directly incorporated by the classifier. Given the conceptual simplicity ofthe approach presented here, it could easily be applied to the segmentation of otheroriented structures, such as neurons or roads in aerial photography, in spite of noexperiment having been performed in this sense.
8.6.2 Future work
The work performed here can be improved. In particular, visual inspection of resultsreveals difficulties that suggest ideas for the future evolution of methods.
The method did not respond well to large lighting variations within images. Thesevariations could be compensated in a preprocessing step or otherwise somehow in-corporated into pixel feature vectors. The Gabor wavelet presented in Equation 8.14,when adjusted to low frequencies, does not present zero mean. Thus, in the imple-mentation evaluated, it was not totally insensitive to background variations. This

Segmentation of Retinal Vasculature Using Wavelets 259
could be corrected with the introduction of the wavelet’s correction term [39]. Theterm, however, when added to low frequency wavelets, leads to loss in spatial preci-sion, being prejudicial when analyzing the modulus. To overcome this, it is possibleto separately analyze the real and imaginary parts of the coefficients (or equivalently,modulus and phase) or modify the wavelet appropriately, as was done in [60].
In order to distinguish borders and other artifacts from vessels, information aboutthe presence of edges could be explicitly incorporated, possibly through the inclusionof new wavelet coefficients in the feature vectors. The wavelet transform is capableof providing a local representation of the image, revealing directional structures asthe vessels in this work. Representation using the Gabor wavelet is done by derivingframes that provide complete but redundant representations [39; 51]. It is worthnoting that there are fast algorithms for calculation of 2-D CWT frames, which couldspeed up considerably the application of the method [74].
The training approach that uses samples from the image being segmented providedby an operator may present better results, since image peculiarities are incorporatedby the classifier. It can be difficult or tiresome for a user to interactively supply arepresentative sampling. Being so, it would be interesting to study a strategy to takeadvantage of both the available samples from other images as well as those from theimage to be segmented. In this manner, with minimal user effort, information aboutspecific image conditions and the large number of examples from other images canbe taken into account.
A drawback of the approach presented here is that it only takes into account in-formation local to each pixel through the wavelet transform, ignoring useful infor-mation from image shapes and structures. The segmentation results can be slightlyimproved through a post-processing of the segmentations for removal of noise andinclusion of missing vessel pixels as in [66]. An intermediate result of the methodis the intensity image of posterior probabilities to which global vessel segmentationalgorithms could be applied, providing more precise results. Many approaches havebeen studied that take into account shape and structure for vessel segmentation, suchas tracking [3; 6; 7], threshold probing [25; 26], region growing [23], and deformablemodels [75; 76].
Depending on the application, different evaluation methods become more appro-priate [77]. For example, the evaluation of the vasculature skeleton or tracings wouldnot take into account vessel widths, but could measure other qualities such as thepresence of gaps and detection of branching and crossing points. Vessel widths arefundamental in change and pathology detection, but can be discarded in applica-tions like image registration or morphological analysis of the vasculature. In [78],true and false positives are defined from skeletons in the following manner: if apixel from some method’s skeleton is at a distance inferior to three pixels to a pixelfrom a manual segmentation, it is counted as a true positive; otherwise, it is a falsepositive. In [67], a similar approach is presented, in which thinned versions of themanual segmentations are used and, additionally, true and false negatives are defined.ROC analysis using complete vessel segmentations, on the other hand, takes vesselwidths into account in such a manner that wide vessels have a much larger influencethan thin ones. Another interesting form of evaluation would be directly through

260 Automated Image Detection of Retinal Pathology
an application, such as in detection of neovascularization by means of analysis andclassification of the vessel structure [11]. Qualitative visual assessment is still veryimportant for segmentation evaluation, allowing the identification of strengths andweaknesses of each method and localizing specific regions in which a given methodperforms better or worse. Still, it is a laborious and subjective analysis. Thoughvery good ROC results are presented, visual inspection (as discussed in Section 8.5)shows typical difficulties of the method to be worked on.
A major difficulty in evaluating the results is the establishment of a reliable groundtruth [2]. Human observers are subjective and prone to errors, resulting in large vari-ability between observations. Thus, it is desirable that multiple human-generatedsegmentations be combined to establish a ground truth, which was not the case in theanalysis presented. Moreover, in an ideal scenario, manual segmentations would beprovided by ophthalmologists, so that the classifier be calibrated accordingly. As analternative to manually segmenting several images, synthetic images might be used.The images would then have segmentations known beforehand and problems of hu-man observers such as subjectivity, errors, and workload would be avoided. Theproblem with synthetic images is that it is practically impossible to faithfully repro-duce the complexity of retinal image formation, yielding this approach inadequatefor a complete evaluation. Nonetheless, it could be applied in partial experiments,such as in measuring the adequacy of vessel models or robustness under differentkinds of noise. For future work, a more complete evaluation is desirable: it would beinteresting to evaluate performance on different image modalities; hypothesis testscould be performed for method comparison (as done in [27; 28; 67]); and confidencebands for ROC curves could also be presented [69].
Properties of the retinal vasculature can be quantified through morphological anal-ysis techniques, assisting in the diagnosis of diabetic retinopathy. Fractal [11] andmultifractal [12] analysis provide numeric indicators of the extent of neovascular-ization, while vessel lengths, widths [14], and curvature [15] have been identifiedas important characteristics for diagnosing diabetic retinopathy. The segmentationmethod presented shows good results and large potential for improvement, beingtheoretically founded on the 2-D CWT and statistical classification. It is capable ofproducing results in reasonable time and lessens the need for user interaction, repre-senting an effort towards automated retinal assessment. A new implementation of themethod is being developed that will be faster, have better usability, and be indepen-dent of the MATLAB platform, avoiding the need for licenses. It is expected that thesoftware and graphical user interfaces developed evolve while being tested by finalusers, including nonspecialized health workers, ophthalmologists, and researchers.
AcknowledgmentsThe authors are extremely grateful to H. F. Jelinek and M. J. Cree for their long-lasting collaboration. The authors would also like to thank J. J. Staal and colleagues

Segmentation of Retinal Vasculature Using Wavelets 261
and A. Hoover for making their databases publicly available, Dr. A. Luckie andC. McQuellin from the Albury Eye Clinic for providing fluorescein images usedduring research, and P. Mani for running the tests of the Chaudhuri et al. method aspart of her B. E. degree final year project. JVBS is grateful to CNPq (131403/2004-4) and FAPESP (2006/56128-1). RMC is also grateful to CNPq (300722/98-2,474596/2004-4 and 491323/2005-0) and FAPESP (2005/00587-5).
References[1] Kanski, J.J., Clinical Ophthalmology: A systematic approach, Butterworth-
Heinemann, London, 1989.
[2] Fritzsche, K.H., Can, A., Shen, H., et al., Automated model-based segmenta-tion, tracing, and analysis of retinal vasculature from digital fundus images, inAngiography and Plaque Imaging: Advanced Segmentation Techniques, J. Suriand S. Laxminarayan, eds., CRC Press, 225–297, 2003.
[3] Can, A., Shen, H., Turner, J.N., et al., Rapid automated tracing and feature ex-traction from retinal fundus images using direct exploratory algorithms, IEEETransactions on Information Technology in Biomedicine, 3(2), 125, 1999.
[4] Chutatape, O., Zheng, L., and Krishnan, S.M., Retinal blood vessel detectionand tracking by matched Gaussian and Kalman filters, in Proc. of the 20thAnnual International Conference of the IEEE Engineering in Medicine andBiology Society (EMBS), 1998, vol. 20, 3144–3149.
[5] Zhou, L., Rzeszotarski, M.S., Singerman, L.J., et al., The detection and quan-tification of retinopathy using digital angiograms, IEEE Transactions on Med-ical Imaging, 13(4), 619, 1994.
[6] Gang, L., Chutatape, O., and Krishnan, S.M., Detection and measurement ofretinal vessels in fundus images using amplitude modified second-order Gaus-sian filter, IEEE Transactions on Biomedical Engineering, 49(2), 168, 2002.
[7] Tolias, Y.A. and Panas, S.M., A fuzzy vessel tracking algorithm for retinalimages based on fuzzy clustering, IEEE Transactions on Medical Imaging, 17,263, 1998.
[8] Lalonde, M., Gagnon, L., and Boucher, M.C., Non-recursive paired trackingfor vessel extraction from retinal images, in Proc. of the Conference VisionInterface 2000, 2000, 61–68.
[9] Pinz, A., Bernogger, S., Datlinger, P., et al., Mapping the human retina, IEEETransactions on Medical Imaging, 17, 606, 1998.
[10] Zana, F. and Klein, J.C., Segmentation of vessel-like patterns using mathemat-

262 Automated Image Detection of Retinal Pathology
ical morphology and curvature evaluation, IEEE Transactions on Image Pro-cessing, 10, 1010, 2001.
[11] Cesar, Jr., R.M. and Jelinek, H.F., Segmentation of retinal fundus vasculaturein non-mydriatic camera images using wavelets, in Angiography and PlaqueImaging: Advanced Segmentation Techniques, J. Suri and T. Laxminarayan,eds., CRC Press, 193–224, 2003.
[12] McQuellin, C.P., Jelinek, H.F., and Joss, G., Characterisation of fluoresceinangiograms of retinal fundus using mathematical morphology: A pilot study,in 5th International Conference on Ophthalmic Photography, Adelaide, 2002,152.
[13] Wong, T.Y., Rosamond, W., Chang, P.P., et al., Retinopathy and risk of con-gestive heart failure, Journal of the American Medical Association, 293(1), 63,2005.
[14] Pedersen, L., Ersbøll, B., Madsen, K., et al., Quantitative measurement ofchanges in retinal vessel diameter in ocular fundus images, Pattern Recogni-tion Letters, 21(13-14), 1215, 2000.
[15] Hart, W.E., Goldbaum, M., Cote, B., et al., Measurement and classification ofretinal vascular tortuosity, International Journal of Medical Informatics, 53,239, 1999.
[16] Jelinek, H.F., Leandro, J.J.G., Cesar, Jr., R.M., et al., Classification of pathol-ogy in diabetic eye disease, in WDIC2005 ARPS Workshop on Digital ImageComputing, Brisbane, Australia, 2005, 9–13.
[17] Yang, G. and Stewart, C.V., Covariance-driven mosaic formation fromsparsely-overlapping image sets with application to retinal image mosaicing,in IEEE Computer Society Conference on Computer Vision and Pattern Recog-nition (CVPR), 2004, vol. 1, 804–810.
[18] Zana, F. and Klein, J.C., A multimodal registration algorithm of eye fundusimages using vessels detection and hough transform, IEEE Transactions onMedical Imaging, 18, 419, 1999.
[19] Hill, R., Retina identification, in Biometrics: Personal Identification in Net-worked Society, A.K. Jain, R. Bolle, and S. Pankanti, eds., Kluwer AcademicPublishers, 123–141, 1998.
[20] Cree, M.J., Leandro, J.J.G., Soares, J.V.B., et al., Comparison of variousmethods to delineate blood vessels in retinal images, in Proc. of the 16thNational Congress of the Australian Institute of Physics, Canberra, Aus-tralia, 2005, available from: http://aipcongress2005.anu.edu.au/index.php?req=CongressProceedings. Cited May 2006.
[21] Niemeijer, M., Staal, J.J., van Ginneken, B., et al., Comparative study of retinalvessel segmentation methods on a new publicly available database, in Medical

Segmentation of Retinal Vasculature Using Wavelets 263
Imaging 2004: Image Processing, J.M. Fitzpatrick and M. Sonka, eds., SanDiego, CA, 2004, vol. 5370 of Proc. SPIE, 648–656.
[22] Soares, J.V.B., Leandro, J.J.G., Cesar, Jr., R.M., et al., Retinal vessel segmen-tation using the 2-D Gabor wavelet and supervised classification, IEEE Trans-actions on Medical Imaging, 25, 1214, 2006.
[23] Martınez-Perez, M.E., Hughes, A.D., Stanton, A.V., et al., Retinal blood vesselsegmentation by means of scale-space analysis and region growing, in MedicalImage Computing and Computer-assisted Intervention (MICCAI), 1999, 90–97.
[24] Chaudhuri, S., Chatterjee, S., Katz, N., et al., Detection of blood vessels inretinal images using two-dimensional matched filters, IEEE Transactions onMedical Imaging, 8, 263, 1989.
[25] Hoover, A., Kouznetsova, V., and Goldbaum, M., Locating blood vessels inretinal images by piecewise threshold probing of a matched filter response,IEEE Transactions on Medical Imaging, 19, 203, 2000.
[26] Jiang, X. and Mojon, D., Adaptive local thresholding by verification-basedmultithreshold probing with application to vessel detection in retinal images,IEEE Transactions on Pattern Analysis and Machine Intelligence, 25(1), 131,2003.
[27] Mendonca, A.M. and Campilho, A., Segmentation of retinal blood vessels bycombining the detection of centerlines and morphological reconstruction, IEEETransactions on Medical Imaging, 25, 1200, 2006.
[28] Staal, J.J., Abramoff, M.D., Niemeijer, M., et al., Ridge based vessel segmen-tation in color images of the retina, IEEE Transactions on Medical Imaging,23(4), 501, 2004.
[29] Gabor, D., Theory of communication, Journal of the IEE, 93, 429, 1946.
[30] Rioul, O. and Vetterli, M., Wavelets and signal processing, IEEE Signal Pro-cessing Magazine, 8, 14, 1991.
[31] Goupillaud, P., Grossmann, A., and Morlet, J., Cycle-Octave and related trans-forms in seismic signal analysis, Geoexploration, 23, 85, 1984.
[32] Grossmann, A. and Morlet, J., Decomposition of hardy functions into squareintegrable wavelets of constant shape, SIAM Journal on Mathematical Analysis,15, 723, 1984.
[33] Grossmann, A., Wavelet transforms and edge detection, in Stochastic Processesin Physics and Engineering, S. Albeverio, P. Blanchard, M. Hazewinkel, andL. Streit, eds., D. Reidel Publishing Company, 1988, 149–157.
[34] Mallat, S. and Hwang, W.L., Singularity detection and processing withwavelets, IEEE Transactions on Information Theory, 38(2), 617, 1992.

264 Automated Image Detection of Retinal Pathology
[35] Daubechies, I., Ten lectures on wavelets, Society for Industrial and AppliedMathematics, Philadelphia, PA, 1992.
[36] Costa, L.F. and Cesar, Jr., R.M., Shape analysis and classification: Theory andpractice, CRC Press, 2001.
[37] Unser, M. and Aldroubi, A., A review of wavelets in biomedical applications,Proceedings of the IEEE, 84, 626, 1996.
[38] Van De Ville, D., Blu, T., and Unser, M., Integrated wavelet processing andspatial statistical testing of fMRI data, NeuroImage, 23(4), 1472, 2004.
[39] Antoine, J.P., Carette, P., Murenzi, R., et al., Image analysis with two-dimensional continuous wavelet transform, Signal Processing, 31, 241, 1993.
[40] Murenzi, R., Ondelettes multidimensionelles et application a l’analysed’images, PhD thesis, Universite Catholique de Louvain, 1990.
[41] Ferrari, R.J., Rangayyan, R.M., Desautels, J.E.L., et al., Analysis of asymmetryin mammograms via directional filtering with Gabor wavelets, IEEE Transac-tions on Medical Imaging, 20, 953, 2001.
[42] Manjunath, B.S. and Ma, W.Y., Texture features for browsing and retrieval ofimage data, IEEE Transactions on Pattern Analysis and Machine Intelligence,18(8), 837, 1996.
[43] Mallat, S. and Zhong, S., Characterization of signals from multiscale edges,IEEE Transactions on Pattern Analysis and Machine Intelligence, 14(7), 710,1992.
[44] Marr, D. and Hildreth, E., Theory of edge detection, Proceedings of the RoyalSociety of London. Series B, Biological Sciences, 207, 187, 1980.
[45] Argoul, F., Arneodo, A., Elezgaray, J., et al., Wavelet analysis of the self-similarity of diffusion-limited aggregates and electrodeposition clusters, Phys-ical Review A, 41(10), 5537, 1990.
[46] Arneodo, A., Decoster, N., and Roux, S.G., A wavelet-based method for mul-tifractal image analysis. I. Methodology and test applications on isotropic andanisotropic random rough surfaces, The European Physical Journal B, 15, 567,2000.
[47] Farge, M., Wavelet transforms and their applications to turbulence, Annual Re-view of Fluid Mechanics, 24, 395, 1992.
[48] Antoine, J.P., Murenzi, R., and Vandergheynst, P., Directional wavelets revis-ited: Cauchy wavelets and symmetry detection in patterns, Applied and Com-putational Harmonic Analysis, 6, 314, 1999.
[49] Gonzalez, R.C. and Woods, R.E., Digital Image Processing, Addison-Wesley,2nd ed., 2002.
Segmentation of Retinal Vasculature Using Wavelets 265
[50] Antoine, J.P. and Murenzi, R., Two-dimensional directional wavelets and thescale-angle representation, Signal Processing, 52, 259, 1996.
[51] Lee, T.S., Image representation using 2D Gabor wavelets, IEEE Transactionson Pattern Analysis and Machine Intelligence, 18(10), 959, 1996.
[52] Daugman, J.G., Two-dimensional spectral analysis of cortical receptive fieldprofiles, Vision Research, 20, 847, 1980.
[53] Marcelja, S., Mathematical description of the responses of simple cortical cells,Journal of the Optical Society of America, 70(11), 1297, 1980.
[54] Daugman, J.G., Complete discrete 2-D Gabor transforms by neural networksfor image analysis and compression, IEEE Transactions on Acoustics, Speech,and Signal Processing, 36(7), 1169, 1988.
[55] Krueger, V. and Sommer, G., Gabor wavelet networks for face processing, Jour-nal of the Optical Society of America, 19, 1112, 2002.
[56] Feris, R.S., Krueger, V., and Cesar, Jr., R.M., A wavelet subspace method forreal-time face tracking, Real-Time Imaging, 10, 339, 2004.
[57] Sagiv, C., Sochen, N.A., and Zeevi, Y.Y., Gabor features diffusion via the min-imal weighted area method, in Energy Minimization Methods in Computer Vi-sion and Pattern Recognition (EMMCVPR), 2002.
[58] Chen, J., Sato, Y., and Tamura, S., Orientation space filtering for multiple orien-tation line segmentation, IEEE Transactions on Pattern Analysis and MachineIntelligence, 22, 417, 2000.
[59] Ayres, F.J. and Rangayyan, R.M., Performance analysis of oriented feature de-tectors, in Proc. of the 18th Brazilian Symposium on Computer Graphics andImage Processing (SIBGRAPI), IEEE Computer Society, 2005, 147– 154.
[60] Harrop, J.D., Taraskin, S.N., and Elliott, S.R., Instantaneous frequency and am-plitude identification using wavelets: Application to glass structure, PhysicalReview E, 66(2), 026703, 2002.
[61] Duda, R.O., Hart, P.E., and Stork, D.G., Pattern Classification, John Wiley andSons, 2001.
[62] Theodoridis, S. and Koutroumbas, K., Pattern Recognition, Academic Press,San Diego, CA, 1st ed., 1999.
[63] Dempster, A.P., Laird, N.M., and Rubin, D.B., Maximum likelihood from in-complete data via the EM algorithm, Journal of the Royal Statistical Society,Series B, 39(1), 1, 1977.
[64] Figueiredo, M.A.T. and Jain, A.K., Unsupervised learning of finite mixturemodels, IEEE Transactions on Pattern Analysis and Machine Intelligence, 24,381, 2002.

266 Automated Image Detection of Retinal Pathology
[65] Leandro, J.J.G., Cesar, Jr., R.M., and Jelinek, H.F., Blood vessels segmenta-tion in retina: Preliminary assessment of the mathematical morphology and ofthe wavelet transform techniques, in Proc. of the 14th Brazilian Symposiumon Computer Graphics and Image Processing (SIBGRAPI), IEEE ComputerSociety, 2001, 84–90.
[66] Leandro, J.J.G., Soares, J.V.B., Cesar, Jr., R.M., et al., Blood vessels segmenta-tion in non-mydriatic images using wavelets and statistical classifiers, in Proc.of the 16th Brazilian Symposium on Computer Graphics and Image Processing(SIBGRAPI), IEEE Computer Society Press, 2003, 262–269.
[67] Sofka, M. and Stewart, C.V., Retinal vessel centerline extraction using mul-tiscale matched filters, confidence and edge measures, IEEE Transactions onMedical Imaging, 25, 1531, 2006.
[68] Cornforth, D.J., Jelinek, H.F., Leandro, J.J.G., et al., Development of retinalblood vessel segmentation methodology using wavelet transforms for assess-ment of diabetic retinopathy, Complexity International, 11, 2005, cited May2006, http://www.complexity.org.au/ci/vol11/.
[69] Fawcett, T., An introduction to ROC analysis, Pattern Recognition Letters, 27,861, 2006.
[70] Provost, F. and Fawcett, T., Robust classification for imprecise environments,Machine Learning, 42(3), 203, 2001.
[71] Hanley, J.A. and McNeil, B.J., The meaning and use of the area under a receiveroperating characteristic (ROC) curve, Radiology, 143, 29, 1982.
[72] MATLAB, MATLAB website at MathWorks, 2006, cited May 2006, http://www.mathworks.com/products/matlab.
[73] Free Software Foundation, GNU general public license, 1991, cited July 2006,http://www.gnu.org/copyleft/gpl.html.
[74] Vandergheynst, P. and Gobbers, J.F., Directional dyadic wavelet transforms:design and algorithms, IEEE Transactions on Image Processing, 11(4), 363,2002.
[75] Malladi, R., Sethian, J.A., and Vemuri, B.C., Shape modeling with front prop-agation: A level set approach, IEEE Transactions on Pattern Analysis and Ma-chine Intelligence, 17(2), 158, 1995.
[76] McInerney, T. and Terzopoulos, D., T-snakes: Topology adaptive snakes, Med-ical Image Analysis, 4, 73, 2000.
[77] Bowyer, K.W. and Phillips, P.J., eds., Empirical Evaluation Techniques in Com-puter Vision, IEEE Computer Society, 1998.

Segmentation of Retinal Vasculature Using Wavelets 267
[78] Lowell, J., Hunter, A., Steel, D., et al., Measurement of retinal vessel widthsfrom fundus images based on 2-D modeling, IEEE Transactions on MedicalImaging, 23(10), 1196, 2004.


9Determining Retinal Vessel Widths andDetection of Width Changes
Kenneth H. Fritzsche, Charles V. Stewart, and Bardrinath Roysam
CONTENTS
9.1 Identifying Blood Vessels . . . . . . . . . . . . . . . . . . . . . . . . . . . . . . . . . . . . . . . . . . . . . . . . . 2709.2 Vessel Models . . . . . . . . . . . . . . . . . . . . . . . . . . . . . . . . . . . . . . . . . . . . . . . . . . . . . . . . . . . . . 2709.3 Vessel Extraction Methods . . . . . . . . . . . . . . . . . . . . . . . . . . . . . . . . . . . . . . . . . . . . . . . . 2719.4 Can’s Vessel Extraction Algorithm . . . . . . . . . . . . . . . . . . . . . . . . . . . . . . . . . . . . . . . . . 2719.5 Measuring Vessel Width . . . . . . . . . . . . . . . . . . . . . . . . . . . . . . . . . . . . . . . . . . . . . . . . . . . 2769.6 Precise Boundary Detection . . . . . . . . . . . . . . . . . . . . . . . . . . . . . . . . . . . . . . . . . . . . . . . 2789.7 Continuous Vessel Models with Spline-Based Ribbons . . . . . . . . . . . . . . . . . . . . . 2799.8 Estimation of Vessel Boundaries Using Snakes . . . . . . . . . . . . . . . . . . . . . . . . . . . . . 2889.9 Vessel Width Change Detection . . . . . . . . . . . . . . . . . . . . . . . . . . . . . . . . . . . . . . . . . . . . 2949.10 Conclusion . . . . . . . . . . . . . . . . . . . . . . . . . . . . . . . . . . . . . . . . . . . . . . . . . . . . . . . . . . . . . . . . 298
References . . . . . . . . . . . . . . . . . . . . . . . . . . . . . . . . . . . . . . . . . . . . . . . . . . . . . . . . . . . . . . . . 299
Detection of width changes in blood vessels of the retina may be indicative of eyeor systemic disease. However, all fundus images, even those taken during a singlesitting, are acquired at different perspective geometries, have different scales, andare difficult to manually compare side by side. This problem is increased for imagesacquired over time and is in no way lessened when different cameras are used astechnology improves or patients change doctors. Indeed, even the method of imagerecording media has changed. In order to compare two images acquired at differenttimes, automated techniques must be used to detect vessels, register images, andidentify potential regions of blood vessel width change.
In order to detect vessel width change, vessels must first be identified in availabledigital images. Several methods for automated vessel detection exist, and this chapterdiscusses several and presents a method for parameterizing blood vessels in ribbon-like objects that provide continuous boundaries along the entire length of a vessel.
Once blood vessels are identified, these vessels can then be used to identify vesselintersections and bifurcations that are the basis for performing image registration.Once two images are registered and the blood vessels are continuously defined in
269

270 Automated Image Detection of Retinal Pathology
each, a method for finding common vessels in the image and performing changedetection is presented.
9.1 Identifying Blood VesselsThe processes of separating the portions of a retinal image that are vessels from therest of the image are known as vessel extraction (or tracing) and vessel segmenta-tion. These processes are similar in goal but typically are distinct in process. Eachhave complications due to such factors as poor contrast between vessels and back-ground; presence of noise; varying levels of illumination and contrast across theimage; physical inconsistencies of vessels such as central reflex [1–5]; and the pres-ence of pathologies. All these factors yield different results, both in terms of howthe results are modeled and the actual regions identified. Different methods yielddistinctly different results and even the same method will yield different results forimages taken from the same patient in a single session. These differences becomesignificant for images taken at different points in time as they could be mistaken aschange. Methods used to determine the vessel boundaries should strive to lessen thefrequency and severity of these inconsistencies.
9.2 Vessel ModelsMany models are used to describe and identify vessels in images. Most are based ondetectable image features such as edges, cross-sectional profiles, or regions of uni-form intensity. Edge models use algorithms that work by identifying vessel bound-aries typically by applying an edge detection operator such as differential or gra-dient operators [6–8]; Sobel operators [9; 10]; Kirsch operators [11]; or first orderGaussian filters [12]. Cross-sectional models employ algorithms that attempt to findregions of the image that closely approximate a predetermined shape such as a halfellipse [13]; Gaussian [1; 14–19]; or 6th degree polynomial [20]. Algorithms thatuse local areas of uniform intensity generally employ thresholding [21; 22], relax-ation [23], morphological operators [16; 24–26], or affine convex sets to identifyridges and valleys [27].
Blood vessel models can more generally be characterized as those that are bound-ary detection (or edge detection) based or those that are cross section or matched-filter based. Depending on the intended application for the vessels detected, differentaspects of the model may be more important. For vessel change detection, we de-cided that the most important aspect of the vessel model is the accurate and preciselocation of vessel boundaries.

Determining Retinal Vessel Widths and Detection of Width Changes 271
9.3 Vessel Extraction MethodsAlgorithms for identifying blood vessels in a retina image generally fall into twoclasses — those that segment vessel pixels and those that extract vessel informa-tion. Generally, segmentation is referred to as a process in which, for all pixels,certain characteristics of each pixel and its neighbors are examined. Then, based onsome criteria, each pixel is determined to belong to one of several groups or cat-egories. In retinal image segmentation, the simplest set of categories is binary —vessel or nonvessel (background). This is what we refer to as “vessel segmenta-tion.” Techniques for segmentation include thresholding [21], morphological oper-ations [16; 24–26; 28], matched filters [9; 15–17; 22; 29; 30], neural nets [31–33],FFTs [34], and edge detectors [6; 9; 11; 35; 36]. Segmentation algorithms generallyproduce binary segmentations, are computationally expensive and typically requirefurther analysis to calculate morphometric information such as vessel width.
Extraction algorithms [1; 8; 12; 14; 18; 36–39] on the other hand, generally useexploratory techniques. They are faster computationally and usually determine use-ful morphometric information as part of the discovery process. They work by startingon known vessel points and “tracing” or “tracking” the vasculature structure in theimage based on probing for certain vessel characteristics such as the vessel bound-aries. Since the vessel boundaries are part of the discovery process, these algorithmsgenerally contain information such as vessel widths, center points, and local orien-tation that can be used later in the change detection process. Many of these methodsemploy edge-centric models and are well suited for vessel change detection. Forthese reasons, we selected the exploratory algorithm in Section 9.4 as the basis forthe change detection algorithm described in Section 9.9.
9.4 Can’s Vessel Extraction AlgorithmCan’s vessel extraction (or “tracing”) algorithm [8] uses an iterative process of trac-ing the vasculature based on a localized model. The model is based on two physicalproperties of vessels — that vessels are locally straight and consist of two parallelsides. As such, it works by searching for two parallel vessel boundaries, found basedon detection of two parallel, locally straight edges. The entire algorithm consists oftwo stages.
Stage 1 (seed point initialization): The algorithm analyzes the image along acoarse grid to gather samples for determining greyscale statistics (contrast and bright-ness levels) and to detect initial locations of blood vessels using greyscale minima.These minima are considered as “seed points” at which a tracing algorithm will beinitiated. False seed points are filtered out by testing for the existence of a pair ofsufficiently strong parallel edges around the minima. A seed point is filtered out if

272 Automated Image Detection of Retinal Pathology
the two strongest edges do not both exceed a contrast threshold (generated from thegreyscale statistics) or if the directions of the two strongest edges are not sufficientlysimilar (within 22.5 degrees). On average, about 40% of the initial points are filteredout by this procedure.
Stage 2 (recursive tracing): The second stage is a sequence of recursive tracingsteps initiated at each of the filtered seed points. For each filtered seed, the tracingprocess proceeds along vessel centerlines by searching for vessel edges. These edgesare sought starting from a known vessel center point in a direction orthogonal to thelocal vessel direction. The search stops at a distance of one half the maximum ex-pected vessel width. Vessel boundaries are searched by checking for edges over adiscrete set of angles, usually 16 angles, with an interval of 22.5 degrees. Three an-gles are tested (the previous center point direction± 1) and the angle of the strongestedge is estimated. The next trace point is determined by taking a step from the cur-rent trace point along the direction of the strongest edge. The resulting point is thenrefined by applying a correction that is calculated based upon how far the new pointis from the center of the points at which the left and right boundaries are found. Thisnew point is kept only if (a) it does not intersect any previously detected vessels,(b) it is not outside the image frame, and (c) the sum of edge strengths is greater thanthe global contrast threshold calculated during seed point detection.
Can’s algorithm was created as a means to extract vessels to identify landmarks(vessel bifurcation and crossover points) as a basis for registration. While effectiveat producing landmarks, it often identified vessel boundaries that are not smoothand entire vessel segments are often missed. Further examination of the algorithmidentified several modifications that could improve the suitability of the algorithmfor use in the application of the detection of width change.
9.4.1 Improving Can’s algorithm
In order to overcome some of the limitations in Can’s algorithm, several modifica-tions were implemented that incorporated all of the basic features of the originalalgorithm, but added several innovations aimed at improving both the accuracy ofthe results and the efficiency of the algorithm. They are summarized in the followingsections. Throughout the remainder of this chapter, the improved version of Can’soriginal algorithm will be referred to as “vessel tracer” and the output will be referredto as “vessel tracing” results.
9.4.1.1 Smoothing vessel boundaries
As discussed in Section 9.4, in order to find the vessel boundaries, Can applied tem-plates iteratively from a point known to be a vessel center point outwards to somedistance M/2 where M is the expected maximum width of a blood vessel. The pointat which the template has the maximum response is determined to be the edge. Thistechnique allows vessel boundaries for adjacent vessel segments to vary significantly.In an attempt to produce smoother boundaries, this search strategy was modified toonly search for a vessel edge at a predicted edge location ±d/2, where d is the max-imum allowable change in width of a vessel at each step of the tracing algorithm.

Determining Retinal Vessel Widths and Detection of Width Changes 273
Taking into account that there are two boundaries, at each step of the algorithm thelargest possible difference in width between adjacent vessel segments is d. Note thatthe search space is also constrained in that the predicted edge location plus d/2 mustbe less than M/2, and the predicted edge location minus d/2 must be on the correctside of the predicted center.
9.4.1.2 Local thresholds
The next modification of Can’s base algorithm is the implementation of local thresh-olds. Can’s original algorithm computes and uses two global thresholds for differentportions of his algorithm. The first threshold was used in initial seed point detec-tion. Its value was computed as the mean intensity of selected sample points fromthe gridlines used in stage one of his tracing algorithm described in 9.4. The secondwas called “sensitivity” (denoted as S) and was used for determining the existenceof vessel boundaries. The value of this threshold was originally estimated based onthe difference between the average intensity of the background (Bav) and the averageintensity of a vessel (Lav). Lav was calculated based on the intensity of the seedsdiscovered in stage one. Bav was calculated using samples found elsewhere on thegridlines. S is calculated using the following equation:
S = 36(1+σ |Lav−Bav|).
In the above equation, the value of 36 represents the response of a pair of templates(of length 6) to a vessel that was one intensity level lower than the background andσ was empirically set to 0.21.
These thresholds were both modified in the methods used to arrive at their valuesand the region in which the are applicable. In Can’s algorithm, the thresholds wereapplied globally. Now, thresholds are calculated for each individual point in an im-age. This is done by calculating threshold values for centers of individual regions.For points in between the centers, bi-linear interpolation is used to determine theappropriate threshold. An example of how thresholds calculated in this manner varyacross an image can be seen in Figure 9.1.
In calculating the thresholds, the first threshold is modified to use the median in-tensity of samples from within a given region. For “sensitivity,” it is now definedbased on the mean and standard deviation of a directional derivative applied at eachsample in a region oriented in four directions 0, 45 deg, 90, and 135 deg. Thesederivatives are descriptive of the contrast for neighboring pixels or potential edgesites within the region. They are used to develop the minimum edge strength thresh-old referred to as “sensitivity,” S, for an edge within a region R, as follows:
S(R) = µd(R)+ασd(R), (9.1)
where µd(R) is the mean of the all the derivatives in the region, σd(R) is the standarddeviation of the derivatives in the region, and α is some weighting factor applied tothe standard deviation. In this research, a value for α of 1.5 is used.
Using the local thresholds described above, vessel tracing results are improved.The global thresholds in Can’s algorithm often resulted in missed vessels, particu-larly in images with a large degree of variation caused by uneven illumination or the

274 Automated Image Detection of Retinal Pathology
FIGURE 9.1This image illustrates how a local threshold for an indicator of contrast varies acrossthe entire image and is more appropriate for use than a single global threshold. The“×” points mark the region centers and the threshold at all points between are calcu-lated by bi-linear interpolation.
presence of pathologies. By breaking the image into smaller regions and calculatingthresholds for each region, more appropriate thresholds are used and better resultsachieved.
9.4.1.3 Vessel graph
A third modification concerns breaking vessels into segments. In order to identifyvessel crossings and bifurcations and identify associated vessel segments, it is nec-essary to present the results of the vessel extraction algorithm in a manner that isconsistent in all images. To accomplish this, a simple graph structure of the vascu-lature is built by treating all landmarks (i.e., bifurcation and cross-over points) asnodes and all traces as edges. Vessel segments are defined as starting and endingat either a landmark or at nothing. This requires that detected vessels be split intomultiple segments (i.e., graph edges) at each landmark. While this seems to be atrivial distinction, the original algorithm was not concerned with building a vesselgraph or with identifying segments. As such it made no effort to organize traces intoindividual vessel segments. So, in the original algorithm it was possible for a vesselthat contained a bifurcation to be represented by only two traces. In the modifiedversion it is now always represented by three.

Determining Retinal Vessel Widths and Detection of Width Changes 275
9.4.1.4 Other modifications to Can’s algorithm
Several other modifications improving the accuracy or efficiency of the tracing algo-rithm were implemented:
1. better initial seed point determination;
2. use of multiple lengths of templates to detect vessel boundaries;
3. use of a binning structure to cache results;
4. interpolation of vessel points to sub-pixel accuracy;
5. better accuracy and repeatability in determining landmark location;
6. inclusion of a momentum strategy to allow tracing to trace through noisy partsof an image;
7. merging of similarly aligned vessels with termination points in close proxim-ity;
8. decision criteria to split traces based on angle of convergence between vessels.
Can’s original algorithm with the mentioned modifications was implemented us-ing an open source, multi-platform, computer vision and understanding collection ofC++ libraries called VXL [40]. The algorithm is implemented in both a commandline and graphical user interface (GUI) version, with results being generated in bothtext and in any of multiple image formats. Both are easily configurable with param-eters in both versions being set at run time as either command line options or, inthe GUI version, using dialog boxes. Sample output of the modified vessel tracingalgorithm can be seen in Figure 9.2.
9.4.2 Limitations of the modified Can algorithm
While the above techniques have improved Can’s original algorithm, there are stillsome limitations, particularly in two areas. First is in the area of detecting extremelysmall vessels, particularly neovascular membranes. This is primarily caused by lowercontrast of the thin vessels (typically 1-2 pixels in width) and their highly tortuousnature. Thus, the locally straight parallel edge model fails.
The second limitation is in the area of precise location of the vessel boundaries.This is vital for detection of changes in vessel width. It is influenced by factors inthe image (such as poor contrast and noise) and by the methodology used to estimatevessel boundaries. Inaccuracies are caused by modeling the boundary with a set ofboundary points found by using a discrete set of edge detectors oriented over a dis-crete set of directions. Additionally, poor contrast and noise affect the response ofthe edge detection templates and result in yet more errors. These types of errors areillustrated in the results shown in Figure 9.3. This degree of error may be accept-able in certain applications such as low-resolution segmentation or feature extractionfor registration, but it is not tolerable at the level of resolution desired for change

276 Automated Image Detection of Retinal Pathology
FIGURE 9.2Figure illustrating an example of the results generated by the vessel-tracing algo-rithm. Circled areas highlight the areas of poor smoothness or erroneous vesseldetection. (See color insert following page 174.)
detection. A method that utilizes Can’s results but provides further refinement andaccuracy is described in Section 9.5.
9.5 Measuring Vessel WidthTwo potential issues arise when measuring a vessel’s width. First, as mentioned inthe preceding section, is the orientation at which to measure the width. The secondis the determination of the points at which to begin and end measurement (i.e., thevessel boundaries).
Most methods attempt to measure width in a direction perpendicular to the longi-tudinal orientation of the vessel (also referred to as the “normal” direction). How-ever, these methods suffer from errors induced when the orientations are discretizedinto a limited number of directions or when the longitudinal direction is determinedby a human operator. Additionally most methods measure the width directly as thedistance between edges determined by a vessel cross section (that is in the normal

Determining Retinal Vessel Widths and Detection of Width Changes 277
FIGURE 9.3Illustrating the inaccuracy in the boundaries. The figure on the left shows an imagewith a fairly accurate vessel (centerline) segmentation. The image on the right showsin detail the boxed region from the image on the left. Note the inaccuracies in thevessel boundary points caused by poor contrast or noise. Also note how for each tracepoint, the corresponding boundaries are often not perpendicular to the orientation ofthe vessel and as such are not accurate for use in measuring vessel width. (See colorinsert.)
direction from a point on a central axis). However, the definition of the edge locationand thus the width measurements vary from method to method.
One such method is to determine vessel boundaries at the locations on a cross sec-tion where the intensity is halfway between the maximum and minimum intensitiesof the cross-sectional profile [2; 41]. This method for determining the boundary isreferred to as half-height intensity change. This method was used in manual mi-crodensitometry, which used film exposure profiles, film density profiles, or filmtransmission profiles to determine the boundaries. A semi-automated procedure inwhich a user estimates the vessel central axis and the computer determines the halfheights is used in [42–45]. Another semi-automated algorithm [35] uses computermeasured widths based on user input to initialize computer-determined vessel edges.
A different method to determine the vessel boundaries uses parameters of a para-bola fit to a cross-sectional intensity profile to determine the width [46]. Others havefit Gaussian curves to the profile and define the boundaries at some distance fromthe Gaussian’s mean [14; 47]. These Gaussian curves are defined using a singleparameter, (σ ).
Not all methods require the determination of two points as boundaries in orderto determine width. Gregson et al. [48] determine width based on fitting an area-equivalent rectangle to the actual image cross section profile of a vessel. Gang et al.
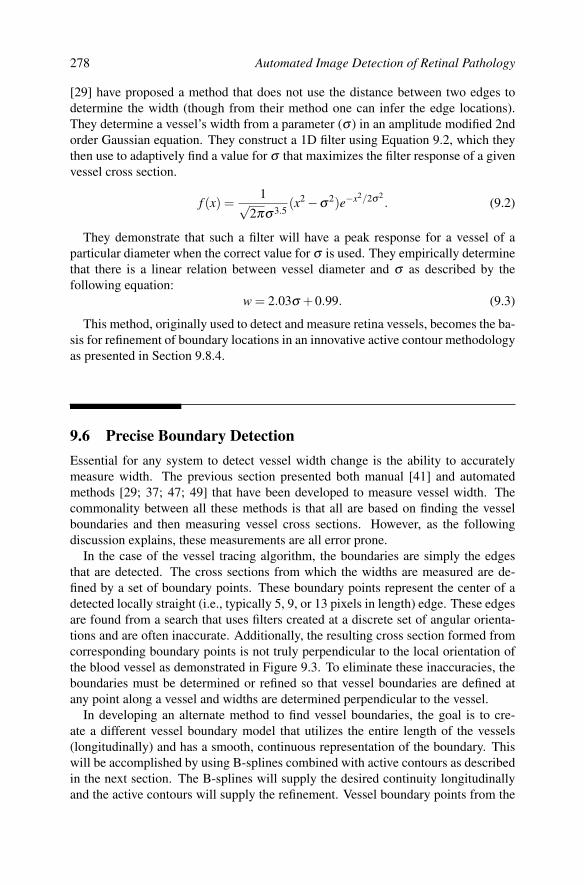
278 Automated Image Detection of Retinal Pathology
[29] have proposed a method that does not use the distance between two edges todetermine the width (though from their method one can infer the edge locations).They determine a vessel’s width from a parameter (σ ) in an amplitude modified 2ndorder Gaussian equation. They construct a 1D filter using Equation 9.2, which theythen use to adaptively find a value for σ that maximizes the filter response of a givenvessel cross section.
f (x) =1√
2πσ3.5(x2−σ
2)e−x2/2σ2. (9.2)
They demonstrate that such a filter will have a peak response for a vessel of aparticular diameter when the correct value for σ is used. They empirically determinethat there is a linear relation between vessel diameter and σ as described by thefollowing equation:
w = 2.03σ +0.99. (9.3)
This method, originally used to detect and measure retina vessels, becomes the ba-sis for refinement of boundary locations in an innovative active contour methodologyas presented in Section 9.8.4.
9.6 Precise Boundary DetectionEssential for any system to detect vessel width change is the ability to accuratelymeasure width. The previous section presented both manual [41] and automatedmethods [29; 37; 47; 49] that have been developed to measure vessel width. Thecommonality between all these methods is that all are based on finding the vesselboundaries and then measuring vessel cross sections. However, as the followingdiscussion explains, these measurements are all error prone.
In the case of the vessel tracing algorithm, the boundaries are simply the edgesthat are detected. The cross sections from which the widths are measured are de-fined by a set of boundary points. These boundary points represent the center of adetected locally straight (i.e., typically 5, 9, or 13 pixels in length) edge. These edgesare found from a search that uses filters created at a discrete set of angular orienta-tions and are often inaccurate. Additionally, the resulting cross section formed fromcorresponding boundary points is not truly perpendicular to the local orientation ofthe blood vessel as demonstrated in Figure 9.3. To eliminate these inaccuracies, theboundaries must be determined or refined so that vessel boundaries are defined atany point along a vessel and widths are determined perpendicular to the vessel.
In developing an alternate method to find vessel boundaries, the goal is to cre-ate a different vessel boundary model that utilizes the entire length of the vessels(longitudinally) and has a smooth, continuous representation of the boundary. Thiswill be accomplished by using B-splines combined with active contours as describedin the next section. The B-splines will supply the desired continuity longitudinallyand the active contours will supply the refinement. Vessel boundary points from the

Determining Retinal Vessel Widths and Detection of Width Changes 279
vessel tracing algorithm will be used to initialize the B-spline based models and theboundaries will be refined using active contours or “snakes” [50; 51]. This methodwill be subject to the constraint that the opposite boundary is near-parallel, whichintroduces another component to the model, producing what will be known as a“ribbon snake” [52]. In such a snake, two (near)-parallel boundaries are discoveredsimultaneously. This provides a basis for modeling smoother, more accurate vesselboundaries. This will be discussed in detail in the next section.
9.7 Continuous Vessel Models with Spline-Based RibbonsB-spline ribbon-like objects can be used to represent blood vessels. For a full under-standing, it is necessary to present foundation information about B-splines, ribbons,and active contours (or “snakes”). Multiple varieties of these objects will be dis-cussed, all of which can be used to provide a continuous representation of bloodvessels and used in algorithms to find vessel boundaries.
9.7.1 Spline representation of vessels
As discussed in Section 9.6, a vessel representation that is continuous at all pointsalong the vessel length is desired. One way to do this is with splines. A spline is arepresentation of a curve in which individual segments are each defined differently,often by polynomial equations of the same or varying degree. The places where eachsegment connects to the adjacent segments are called knots. Splines can be definedto ensure certain properties are met at knots, such as first or second order continuity.
An advantage of splines is that since they are defined by mathematical equations,they are defined continuously over a given interval. This now allows a vessel lo-cation to be precisely determined at any point between the vessel’s ends. Previouspoint-based methods, where a vessel is defined by a set of points as in the resultsgenerated by the vessel tracing algorithm, required that some form of interpolationbe performed to determine the vessel locations at points other than those in the set.This introduced a loss of precision depending on the spacing between points. Splineseliminate this need for interpolation and increase the precision in determining a ves-sel’s location.
9.7.1.1 B-Splines
A B-spline is a representation of a curve in which individual parametric segmentsare determined based on a combination of “basis” functions, where the basis func-tion can be of any polynomial order that meets the desired knot point characteris-tics [53]. Thus any spline is uniquely characterized based on its polynomial order,the number and the location of the knots/control points. If the desired spline is tohave as little curvature as possible to accurately represent the target curve, a thirdorder, or cubic B-spline is required. This is due to the minimum curvature property

280 Automated Image Detection of Retinal Pathology
of cubic B-splines (described in [54]) and is why cubic B-splines tend to be used inmost applications.
Cubic B-splines have the additional property that they are second-order continu-ous so long as control points are not permitted to be co-located. When two controlpoints are co-located, they allow a (first-order) discontinuity and allow corners tobe formed. The vessel boundaries modeled by the B-splines in this research are as-sumed to be without corners and, as such, co-located control points are not allowed.In the remainder of this research, cubic B-splines are defined using m+1 basis func-tions (where the minimum value for m is 3). Each basis function is defined as acombination of four individual pieces, each expressed as a function of parameter uas follows:
Bi(u) =
16 u3 i≤ u < i+116 (1+3u+3u2−3u3) i+1≤ u < i+216 (4−6u2 +3u3) i+2≤ u < i+316 (1−3u+3u2−u3) i+3≤ u < i+40 otherwise.
(9.4)
These spline segments combine to form a single curve or basis function.To form a curve, multiple (at least four) B-spline basis functions are necessary.
These functions differ only in that they are translated versions of the basis function Bidescribed above and are weighted by different values, the values of the correspondingcontrol points. The complete B-spline is evaluated across all intervals in which foursegments from four different basis functions are present. Each piece of the basisfunction is scaled or weighted based on the value of a control point that has a valuefor each dimension of the space in which the curve is embedded. For instance, fora curve in two dimensions, each basis function has control points with a value forthe x dimension and the y dimension. These control points have a local effect on thecurve (i.e., only across the four intervals for which the basis function is defined).
Before proceeding, a further explanation of the parameter u is necessary. Foreach individual spline segment, where a segment is defined as the combination offour basis functions weighted by the corresponding control points evaluated at u,u is defined from 0 to 1. However when describing the parameter over the m− 2intervals of the spline, the parameter u is defined on the range [3,m + 1]. Thus, theinteger portion of the parameter denotes the spline segment and the decimal portiondescribes the parameter within the segment. For example, when u is 4.7, the segmentis the second (i.e., the interval [4,5]) and the value of u used in the basis function is .7.Having now clarified the different contexts of u, let us now return to the discussionof B-splines.
Given the above definition of the basis function Bi, a simple equation can be usedto define a spline. The equation to represent an n-dimensional curve, p, as a functionof parameter u, consisting of m + 1 basis functions (Bi) with corresponding m + 1n-dimensional control points (ci), can be defined as:
p(u) =m
∑i=0
Bi(u)ci (9.5)

Determining Retinal Vessel Widths and Detection of Width Changes 281
9.7.1.2 Fitting a B-spline to a set of points
Two issues arise when considering the problem of fitting a B-spline to a set of points.The most obvious is how to arrive at the proper placement of the control points tobest fit the data. The second is how to arrive at the correct number of control pointsto use. If an interpolation of the data is required, then the number of control pointsmust equal the number of data points. However, if an approximation is satisfactory,then the number of control points can be significantly less. In this study, splinesare fit initially with control points at uniform arc length intervals as in [55; 56].Subsequent refinement of the splines using active contour permits the final splines tohave nonuniform arc-length control point intervals. The following sections describethe methods used in this research to arrive at an acceptable number and placement ofcontrol points.
9.7.1.3 Least squares fit
One way to fit a B-spline curve to a set of n+1 data points, d, is to find the m+1 con-trol points that minimize the distance between the B-spline and the data points. Thiscan be done using a least squares fitting approach in which the idea is to minimizethe total squared distance, S, as expressed in the following equation:
S =n
∑j=0
[d j−m
∑i=0
ciBi(u j)]2. (9.6)
The value of the parameter u j is determined based on an arc-length ratio describedas follows. If D is the total length of all the line segments connecting successive datapoints in dn and U is the total length of the B-spline curve, then
|d j−d0|D
=|u j−u0|
U(9.7)
where |d j−d0| and |u j−u0| are arc length distances. This allows us to compute thevalues for ui using the following recurrence
u0 = 3
ui+1 = ui +(m−2)|di+1−di|
D
To find the optimal set of control points to fit the data, we differentiate Equation9.6 with respect to the control points and equate to zero. This yields
∂E∂ck
=−2∑j([d j−
m
∑i=0
ciBi(u j)]Bk(u j)) = 0. (9.8)
Rearranging gives:
m
∑i=0
ci[∑j
Bi(u j)Bk(u j)] = ∑j
d jBk(u j). (9.9)

282 Automated Image Detection of Retinal Pathology
Setting up as a system of linear equations and expressing in matrix form yields asolution for the control points~c:
n
∑j=0
B0(u j)B0(u j) B1(u j)B0(u j) . . . Bn(u j)B0(u j)
......
......
B0(u j)Bk(u j) B1(u j)Bk(u j) . . . Bn(u j)Bk(u j)...
......
...B0(u j)Bn(u j) B1(u j)Bn(u j) . . . Bn(u j)Bn(u j)
c0...
ck...
cn
=n
∑j=0
d j
B0(u j)...
Bn(u j)
n
∑j=0
~B(u j)~B(u j)T~c =~r
~c = (n
∑j=0
~B(u j)~B(u j)T )−1~r
where the vector ~B(u j) is defined as:B0(u j)
...Bk(u j)
...Bn(u j)
.
9.7.1.4 Weighted least squares
While the last section dealt with determining the set of control points to best fit agiven set of data points, it may not be desired to attempt a fit to all data points equally.That is, it may be desired to fit some points more closely than others based on someprovided measure. This measure or “weight” may be indicative of the confidence ina given data point and as such indicates how closely the fit curve is desired to fit eachdata point. These weights can be constant or vary in an iterative procedure such as aniteratively weighted least squares fitting. The method for a weighted least squares fitusing the same notation and following the previously derived equations is presentedas follows:
S =n
∑j=0
w j[d j−m
∑i=0
ciBi(u j)]2 (9.10)
where w j is used to represent the weight of each data point.
∂E∂ck
=−2∑j
w j([d j−m
∑i=0
ciBi(u j)]Bk(u j)) = 0. (9.11)
m
∑i=0
ci[∑j
w jBi(u j)Bk(u j)] = ∑j
w jd jBk(u j). (9.12)

Determining Retinal Vessel Widths and Detection of Width Changes 283
n
∑j=0
w j
B0(u j)B0(u j) B1(u j)B0(u j) . . . Bn(u j)B0(u j)
......
......
B0(u j)Bk(u j) B1(u j)Bk(u j) . . . Bn(u j)Bk(u j)...
......
...B0(u j)Bn(u j) B1(u j)Bn(u j) . . . Bn(u j)Bn(u j)
c0...
ck...
cn
=n
∑j=0
w jd j
B0(u j)...
Bn(u j)
n
∑j=0
w j~B(u j)~B(u j)T~c =~r
~c = (n
∑j=0
w j~B(u j)~B(u j)T )−1~r
9.7.1.5 Determining the number of control points
The number and placement of control points determine the flexibility of the spline.As discussed in Section 9.7.1.2, this study initially places the control points uni-formly based on the total arc length of the curve. In determining the number ofcontrol points necessary to approximate the set of data points, an acceptable errortolerance needs to be determined. One such measure is that the mean of the residualvector be below a certain tolerance value, where the mean of the residuals, µr, iscomputed as:
µr =∑
nj=0 |d j−∑
mi=0 ciBi(u j)|
n(9.13)
where u j is the arc-length parameter corresponding to data point j. This tolerance µris equivalent to the “normalized distance” measure used by Saint-Marc and Medioniin [57]. As part of determining the correct number of control points, an acceptableminimum and maximum should be determined. The absolute minimum number ofcontrol points is four. The absolute maximum is equal to the number of data pointsand will result in an exact interpolation. To arrive at a suitable number of controlpoints, it is possible to start at the minimum and iteratively add control points untilµr is below the acceptable threshold. Since a sub-pixel boundary is desired, thisthreshold was set to 0.5.
An alternative method for adding control points is to weight the residuals based onhow closely the spline is expected to fit the points. These weights could be the sameused for the weighted least squares fitting or could be based on some other weightingcriteria. For instance, there may be a confidence score associated with each data pointindicating that some points are more accurate or relevant than others based on suchfactors as local contrast or edge strength of local curvature. This score would indicatethat the fit spline should better model the points with higher confidence and put lessemphasis on those of low confidence. These confidence levels can be assembled intoa weight vector, w, which is then used to scale the residuals, and changes Equation9.13 to
µr =∑
nj=0 |(d j−∑
mi=0 ciBi(u j))w j|n
. (9.14)

284 Automated Image Detection of Retinal Pathology
Once the residuals are weighted, there is no longer any relation between µr and thedesired accuracy of the fit unless care is taken in selecting the weights. To accomplishthis, all weights need to be between zero and one, where a one indicates a point withhighest confidence and hence the desire to be best fit. These weights can be scaledby normalizing or by using a robust estimator [58]. If the threshold for µr is setbelow 1 then intuitively the relationship between the fit curve and the desired sub-pixel accuracy can again be realized but only for the points of highest confidence.The lower confidence points will not have a guarantee of a close (i.e., sub-pixel)fit.
In this study, the mean weighted residual threshold is set to 0.25 pixels. Thenumber of control points is initially set to one-tenth the number of data points orfour, whichever is greater. The number of control points is then increased until themean weighted residual threshold is met or until the number of control points is morethan one-third the number of data points the spline is expected to fit. In practice thisupper limit is rarely met. The weights used are the strengths associated with eachtrace point, which is a measure of the image contrast at the vessel boundary (i.e., itis equal to the template response found during tracing). A final consideration isto normalize the weights so that each weight is between 0 and 1. This is done tomaintain the desired sub-pixel fit accuracy for points with the highest strength. Theweights are normalized using the infinity norm as shown in the following equation:
µr =∑
nj=0[(d j−∑
mi=0 ciBi(u j))
w j‖w‖∞ ]
n. (9.15)
9.7.2 B-spline ribbons
A variety of different models referred to as “ribbons” are used to describe a two-dimensional region/object that is symmetric about a central axis. These objects canbe described from both the perspective of generation (given the axis, create the shape)and recovery (given the shape, find the axis) [59]. A ribbon object is usually gener-ated by using a geometric “generator” such as a disc [60] or a line segment where theline segment is required to have a fixed angle with the axis [61] or a fixed angle withboth sides of the shape [62]. These generators can be constant in size and orientationor vary along the length of the axis. Amongst other things, ribbons have been usedto find skewed symmetries [63]; to segment wires, plant roots, and bacteria [64]; andto find roads in satellite images [52]. Ribbon-like objects were selected to modelretina vessels as most (nonpathological) vessels exhibit a symmetry about a centralaxis. These models were then used as the basis for active contour methods to moreprecisely identify the vessel boundaries as described in Section 9.8.3.
Initially, a form of a ribbon commonly referred to as Brooks ribbon [61] was usedto model a given vessel based on the data supplied from the modified vessel tracingalgorithm described in Section 9.4 (i.e., center point and width in normal direction).These ribbons are formed by line segments making a constant angle with the centralaxis (in this case they are orthogonal). To continuously and smoothly model the

Determining Retinal Vessel Widths and Detection of Width Changes 285
FIGURE 9.4Ribbon object definition. (xi,yi) is the axis center at point i, η(xi,yi) is the normal atcenter point i, and wi is the width. bl and br are the left and right boundary points,respectively.
vessels, each dimension (x, y, and width) is fit with a B-spline, each B-spline usingthe same parameterization as described in Section 9.7.1.1. The ribbons representedas a set of B-splines will be referred to interchangeably as “ribbon” or “B-splineribbon” in the remainder of this chapter. This definition of a ribbon can be seenin Figure 9.4. The B-spline representation provides (a) an implicit smoothness formodeling the vessel boundaries and (b) an implicit flexibility in the active contourmodels based on the number and location of the knots (or the parameterization of thedata points).
Since ribbons have only a single width they are most true to the idea that vesselshave near-parallel boundaries. However, vessels do not always have near-parallelboundaries, particularly in pathological cases. In these cases, vessels are not sym-metric around a central axis, or even if symmetry does exist, allowing only a sin-gle degree of freedom in the width parameter may not be sufficient to represent thevessel. This may be because the central axis is not truly centered or because the

286 Automated Image Detection of Retinal Pathology
FIGURE 9.5Dual Width Ribbon (DWibbon) object definition. (xi,yi) is the axis center at point i,η(xi,yi) is the normal at center point i, and w1i and w2i are both widths. bl and brare the left and right boundary points, respectively.
spline is not flexible enough to handle a specific region with varying widths. To ad-dress this issue, two other ribbon-like objects were examined, the dual-width ribbon(DWibbon) and the normal-offset ribbon (NORibbon) as described in the followingparagraphs. In both cases, a similar ribbon can created from each by identifyingthe corresponding boundary points for any point on the central axis and estimatinga new centered axis point and width. These new axis points and widths can then beconverted into a B-spline ribbon.
In attempting to allow more variability in the width along the central axis, theidea of having two widths (“dual widths”) one for each side of the central axis wasexamined. This resulting “DWibbon” object is actually no longer guaranteed to besymmetric about the axis and can be argued is technically not a ribbon. As mentionedabove, however, it can be easily transformed into a ribbon. This representation hasthe advantage that when used as the basis for an active contour, the central axis canbe fixed and then each width still has the ability to find the correct boundary, even

Determining Retinal Vessel Widths and Detection of Width Changes 287
FIGURE 9.6Normal Offset Ribbon (NORibbon) object definition. (xi,yi) is the axis center atpoint i, η(xi,yi) is the normal at center point i, wi is the width, and oi is the offset.bl and br are the left and right boundary points, respectively.
when the axis is not in the center of the vessel. This is not possible for ribbonswhen the ribbon axis is not located in the center of the vessel. The definition of theDWibbon is shown in Figure 9.5.
The final ribbon-like object studied is one that has a single width but rather thanapplying that width on the central axis, the width is applied at a point that is locatedat some offset in the normal direction. This is illustrated in Figure 9.6. Again, boththe width and the offset can be modeled with splines. This implies that like theDWibbon, the normal-offset ribbon is not truly a ribbon because it is not symmetricabout the central axis. But like the DWibbon, this allows the central axis to be fixedwhen used in an active contour method. It is also capable of being converted to aribbon. However, the real utility of a NORibbon lies in its ability to be used with anactive contour that uses a matched filter as its basis for determining the ribbon width.This will be described in Section 9.8.4.

288 Automated Image Detection of Retinal Pathology
9.8 Estimation of Vessel Boundaries Using SnakesPrevious sections discussed methods for modeling retina vessels. In this section wepresent a method for locating the vessels using active contour techniques based onthe ribbon models of Section 9.7 initialized with the results of the modified Can’salgorithm of Section 9.4.1.
9.8.1 Snakes
As originally introduced by Kass et al. [50], a snake is a curve or contour representedby a set of parametric points, with each position denoted as v(s) = (x(s),y(s)). Theidea is to position the snake by “attracting” it to certain image features. A snake’smotion is controlled by an energy function given by
Esnake =∫ 1
0Eint(v(s))+Eimage(v(s))+Econ(v(s))ds, (9.16)
where Eint denotes the internal energy of the snake; Eimage represents external imageforces for such features in an image as lines, edges, and terminations of line segmentsand corners; and Econ is an external constraint force. Eint is commonly representedas
Eint =α(s)|vs(s)|2 +β (s)|vss(s)|2
2(9.17)
where the first term controls the elasticity of the snake and the second term controlsthe rigidity. In the context of vessel boundary detection, Eimage should be attractedto edges. It is represented as Eimage =−|∇I(x,y)|2 and Econ = 0.
Using the set of detected boundary points for a single vessel boundary as the initialpoints, a snake can be used to solve for the final set of boundary points by minimizingthe energy in Equation 9.17. This can be done by expressing and solving Equation9.17 as the following set of Euler-Lagrange differential equations:
∂x∂ t
=∂Eimage
∂x− ∂
∂ s(α(s)
∂x∂ s
)+∂ 2
∂ s2 (β (s)∂ 2x∂ s2 ) (9.18)
∂y∂ t
=∂Eimage
∂y− ∂
∂ s(α(s)
∂y∂ s
)+∂ 2
∂ s2 (β (s)∂ 2y∂ s2 ) (9.19)
This method will yield a curve that is attracted to the boundary (as defined by thegradient). It is a better representation of the vessel boundary than the current vesseltracing code boundary points because the curve generated is smooth and is knownto have converged on the best local boundary. This methodology can be appliedto find both boundaries of a single vessel separately. However, a more appropriateapplication of snakes to vessel boundary location is described in the next section.

Determining Retinal Vessel Widths and Detection of Width Changes 289
9.8.2 Ribbon snakes
Ribbon snakes extend the basic idea of a snake to the detection of linear features thathave width. The idea is to attract the two boundaries of the ribbon to the boundariesof the linear feature. Ribbon snakes have been used to extract roads [52; 65; 66] inaerial images and are appropriate for vessel boundary detection because they can beused to model the road-like properties of a vessel. These properties can be describedas a locally linear feature with width, symmetric about a central axis, bounded bytwo edges of relatively high contrast.
Ribbon snakes are defined similarly to snakes by introducing a third paramet-ric component, namely a width component [67]. Where snakes are defined onlyin terms of x and y, in a ribbon snake each position is now represented as v(s) =(x(s),y(s),w(s)) where x(s),y(s) represents the blood vessel center and w(s) deter-mines the vessel boundaries. Since we are trying to find two boundaries, Eimage needsto be “attracted” to the two edges that have the locally greatest gradient. Thus Eimagebecomes
Eimage(v(s)) = |(∇I(vl(s))|2 + |∇I(vr(s)))|2 (9.20)
This energy term should be further modified to favor points of maximal gradientwhere the gradient is strongest in the direction perpendicular to the detected edge.This is equivalent to requiring that the direction of the gradient be (closely) alignedwith the normal. Taking a dot product of the normal and the gradient increases thecontribution to the final energy when the gradient and normal directions are closelyaligned while minimizing contributions from locations where the gradient and nor-mal are not so aligned. Thus Eimage can be modified as follows:
Eimage(v(s)) = (∇I(vr(s)) ·n(s))2 +(∇I(vl(s))) ·n(s))2 (9.21)
where n(s) is the unit normal at x(s),y(s) and vr(s) and vl(s) are the vessel right andleft boundaries, which can be expressed as
vr(s) = w(s)n(s), vl(s) =−w(s)n(s). (9.22)
By supplying the centerline positions and widths for a vessel obtained from themodified Can’s algorithm, the ribbon snake can be initialized and solved in much thesame manner as normal snakes. The major difference is that the results can be usedto generate two contours representing both boundaries of the vessel. Additionally,ribbon snakes intrinsically maintain the “almost parallel” boundaries while allowingsome degree of variability in width.
9.8.3 B-spline ribbon snake
The idea of combining splines with snakes is not new. Klein et al. used B-splinesnakes for vessel single-boundary detection in [68] and Leitner and Cinquin to findcontours in computed tomography (CT) and magnetic resonance imaging slices ofimages of the vertebra [69]. In this application, a B-spline ribbon snake is created tofind retina vessels and is a unique combination of B-splines, snakes, and ribbons. A

290 Automated Image Detection of Retinal Pathology
B-spline ribbon snake behaves similar to snakes described in Section 9.8.1. However,the internal energy is no longer explicitly a part of the snake energy. Instead thesmoothness of the snake is controlled implicitly by the parameters used to define theB-spline. Thus in a B-spline framework, the general equation for a snake describedin Equation 9.16 becomes:
Esnake =∫ 1
0Eimage(v(s))ds (9.23)
Similarly, the image energy Eimage for a B-spline ribbon snake is affected. Insteadof maximizing the energy equation to fit a single contour to the desired image feature,the idea is to fit the two sides of a ribbon B-spline to the desired image features,which in this study are the opposite boundaries of a blood vessel. This is done bysimultaneously fitting the two (near)-symmetric contours to the vessel boundaries oredges, where an edge is defined as local areas of maximum gradient. Given an initialestimate of the B-spline ribbon in which the control points are assumed to be evenlyspaced along the length of the curve, where the spacing is determined by arc-length,the energy equation for the ribbon B-spline is very similar to Equation 9.21 but ismodified based on the B-spline ribbon parameters. This is explained in the followingparagraphs. By maximizing the energy equation, an optimal solution representingthe best local boundaries is found.
Let Esnake be the energy function for the B-spline ribbon snake expressed as afunction of the m + 1 control points, ~c0, . . . , ~cm, and recall that each ~ci has threecomponents, namely x, y, and w (where w controls the width of the ribbon snake,and x and y control the x and y coordinates respectively). Recall that the B-splineribbon is defined as a parametric function of u where at each u, r(u) = (v(u),w(u))and v(u) = (x(u),y(u)) is the coordinate of the ribbon’s central axis which is also theaxis of symmetry, and w(u) is the corresponding width in the normal direction. TheB-spline’s m+1 control points make m−2 spline segments, numbered from 3 to m,with u defined on the interval (3..m+1).
Esnake(~c0, . . . , ~cm) =∫ m+1
31/2[∇I(~pl(u)) · η(u)]2 +1/2[∇I(~pr(u)) · η(u)]2du
(9.24)where η(u) is the unit normal, ~pl is the left boundary curve defined by ~pl(u) =~v(u)+w(u)η(u), and ~pr is the right boundary curve defined by ~pr(u) =~v(u)−w(u)η(u).The dot products with the unit normal in Equation 9.24 serve to emphasize the edgeswhere the gradient is more closely aligned with the normal. Having now definedthe energy function, all that needs to be done is to determine the control points thatmaximize the energy. Having now defined the energy equation for a ribbon, similarequations can be defined for both the DWibbon and NORibbon. The only differenceis in how ~pl(u) and ~pr(u) are calculated.
However, Equation 9.24 fails to take advantage of the direction of the gradientwhen computing the energy. The objective function is defined to give more “energy”to the gradient that is more closely perpendicular to the orientation of the vessel (i.e.,more closely aligned with the normal as shown in Figure 9.7). We do this by taking

Determining Retinal Vessel Widths and Detection of Width Changes 291
FIGURE 9.7Illustration showing the parameters of a ribbon snake. Note the projection of thegradient on the unit norm (n(s)) used to further improve the boundary extraction.(See color insert.)
the dot product of the normal and the gradient. When they are more closely aligned,the value of the dot product will be close to the value of |∇I| or −|∇I| and thuscontribute more to the energy.
However, we can leverage one additional piece of knowledge: the vessel is darkerthan the surrounding area. Thus on one side of the ribbon snake, the left, the intensitygoes from light background to dark vessel, and on the other side of the ribbon, theright, from dark to light. This information can be utilized to modify the energyequation. The idea is to use the same dot products to require the projection of thegradient vector onto the ribbon’s unit normal vector to be positive on the ribbon’sleft boundary and negative on its right. Thus Equation 9.24 is modified by droppingthe square term and changing the addition to a subtraction. Thus Eimage as used forall ribbon snake objects is defined as:
Esnake(~c0, . . . , ~cm) =∫ m+1
3∇I(~pl(u)) · η(u)−∇I(~pr(u)) · η(u)du (9.25)
For an image in which the vessels are lighter than the background (e.g., fluorescein

292 Automated Image Detection of Retinal Pathology
angiograms) the sign of dot products would be switched so that the dot product ofthe gradient and normal would be negative on the left boundary and positive on theright.
Using this equation offers two advantages over the previous. First, it is now im-possible during the active contour process for the sides of the ribbons to cross overand switch to the opposite side. Doing so would result in less energy as the side witha negative dot product would subtract a positive dot product, reducing the overall en-ergy. The second advantage involves vessels that are in close proximity to each other.It often happens that two vessels appear side by side in an image and this equationprevents the boundary from moving to the nearest boundary of a nearby vessel.
9.8.4 Cross section-based B-spline snakes
All of the ribbon snakes discussed thus far are based on aligning ribbon object edgesalong areas of maximum intensity gradient, with an additional criteria that the direc-tion of the gradient is close to perpendicular to the ribbon edge. These properties arerepresented in the objective function that we wish to maximize. For these reasons, aribbon snake can be thought of as “edge-based” where a good fit to a vessel is deter-mined by the magnitude and direction of the image gradient along the ribbon edges.Another approach is to determine a good fit based on an alternate criteria. One suchcriterion developed is the use of matched filters in conjunction with snakes.
In this research, the Amplitude Modified Second Order Gaussian (AMSOG) filter(discussed in Section 9.5) was selected based on its applicability for width changedetection. This filter has been demonstrated as effective at locating and measuringvessel widths [29]. It also provides a precise definition of a vessel width based onthe parameter σ given in Equation 9.3.
Given Equation 9.2 for the filter shape, an object that could utilize this filter in anactive contour method was created by using both the Ribbon and the NORibbon asdiscussed in Section 9.7.2. These objects will be referred to as an AMSOG Ribbonsand AMSOG NORibbons respectively and in more general terms are referred to as“cross section” snakes. Instead of fitting ribbon edges to the contours of maximumgradient, the idea is to position a ribbon-like object based on how closely its cross-sectional shape fits the image cross section.
The AMSOG Ribbon object is initialized by solving for the parameter σ usingEquation 9.3 based on the original vessel tracing width. This is done by calculatingthe value for σ based on a sampled cross section centered at the appropriate location.For the ribbon, this point is on the central axis. For the NORibbon, it is at the offsetpoint. The response of this cross section and filter is calculated with the filter centerand the cross section center aligned. This response contributes to the new objectivefunction, that is the new energy equation of the AMSOG NORibbon as shown by thefollowing equation:
E = ∑i
I(pi(x,y))⊗ f (σi) (9.26)
where f (σi) denotes the filter (i.e., Equation 9.2), σi is the value of the parametersigma at point i, I(pi(x,y)) is the cross section in the normal direction centered at pi

Determining Retinal Vessel Widths and Detection of Width Changes 293
Table 9.1: Summary of the Parameters of each B-Spline RibbonMethod (showing which parameters are fixed and which are allowedto vary in determining the final position of the ribbon.)
Method Fixed FreeRibbon x,y,wDWibbon x,y w1,w2NORibbon x,y o,wAMSOG Ribbon x,y,σAMSOG NORibbon x,y o,σ
and ⊗ represents the operation of calculating the filter response. For a ribbon,
pi = (xi,yi) (9.27)
and for a NORibbon,
pi = (xi,yi)+ηi ·oi (9.28)
where ηi and oi are the normal and offset at point i.
Maximizing the energy in Equation 9.26 yields an optimal solution of either ~σ forAMSOG Ribbons or ~σi and ~oi for AMSOG NORibbons.
9.8.5 B-spline ribbon snakes comparison
Several ribbon models have been discussed in an effort to produce vessel boundariesthat are smooth and continuous and from which a vessel width can be determined.Ribbon snakes are initialized with the results from the tracing algorithm but all thenuse the original image intensity structure to refine the final boundary locations. Eachsnake differs based on the ribbon it uses and its energy equation. Three-edge-basedribbon snakes, namely ribbon, DWibbon, and NORibbon were presented. Addition-ally, a new, novel methodology referred to as cross section-based ribbon snakes waspresented. Two cross section based snakes, the AMSOG Ribbon and the AMSOGNORibbon, were presented. Each ribbon method differed based on the parametersthat define it and each snake differs in the ribbons parameters that are held constantor allowed to vary within the “snake” framework. These differences are summarizedin Table 9.1.
All these methods address the identified shortcomings of the tracing algorithm,particularly in the areas of continuity and smoothness. Empirical evidence not re-ported in this chapter has suggested that the boundaries generated by the AMSOGNORibbon are more applicable for change detection.

294 Automated Image Detection of Retinal Pathology
9.9 Vessel Width Change DetectionA prerequisite in the task of detecting change is the ability to account for projectivegeometry differences between two images by aligning the images through a processknown as registration. By registering two images, transformations are created thatcan be used to convert images to a common scale space. These transformations en-sure that the distance and direction between any two corresponding points in trans-formed images are equal. Without this ability to register and transform images, itwould not be possible to compare distances and hence detect changes in width. TheDBICP Registration algorithm provides this needed capability to reliably and accu-rately register almost any set of fundus images that contain detectable features [70].
Once registered, differences in measurements between two images may be at-tributed to the variation in the method of estimation of vessel width from image toimage. This stochastic variation is influenced by multiple factors such as variablefocus, variable illumination, and physiological changes from pathologies or even thepulsation of vessels caused by the beating of the heart. These variations result invessel boundary estimation that is erroneous. This section presents a method thataddresses these stochastic challenges by presenting decision criteria designed to ac-count for this uncertainty.
9.9.1 Methodology
Any approach at width change detection would need to follow three basic steps. Thefirst step is to find the vessels in each image with the boundaries being identifiedto sub-pixel accuracy. Second is the step of transforming all vessels into the samecoordinate system and identifying corresponding vessel pieces. Last is the abilityto measure to sub-pixel accuracy the vessel widths and to identify changes in widthover time. These requirements will be discussed in the following sections. A finalstep not mentioned is displaying the detected differences. The object of detectingthe differences is to draw the attention of the physician to the regions that appearedto have changed. A method to call out the regions of change that does not obstructthe observer’s view of the region of change in the original image is needed. Toaccomplish this, a box is drawn around vessel segments that are determined to havechanged as can be seen in sample change detection results in Figure 9.9.
9.9.1.1 Vessel detection
The first requirement in the detection of vessel width change is to be able to accu-rately and consistently identify vessels in retinal images. This includes the accuratelocation and continuous definition of the vessel boundaries. The AMSOG NORibbondiscussed in Section 9.8.4 is used because it was empirically determined to identifymore repeatable continuous vessel boundaries than other methods.

Determining Retinal Vessel Widths and Detection of Width Changes 295
9.9.1.2 Image registration and determining corresponding vessels
The second requirement in the detection of vessel change is the ability to accuratelyregister images. By using the DBICP registration algorithm, it is possible to deter-mine transformations that can be used to accurately align both images as well asresults generated from these images. Once aligned it is then possible to determinecorresponding vessel cross sections and directly compare their widths. However,finding corresponding vessels is a challenge, particularly in the cases where a vesselhas disappeared or has failed detection in one image but is detected in another. Thusthis possibility must be considered when determining corresponding vessel sections.
When a vessel detected in one image coincides with a vessel in another image, thenthe vessels in both images are accepted as being the same. If a vessel is within somedistance δ of another vessel, such as one vessel width, then an additional constraintneeds to be applied to ensure they are the same vessel. This additional constraintis a check to see if both vessels are generally progressing in the same direction. Ifthis condition is not met, then it is assumed that the vessels are different. If no othervessel is found, then it can be concluded that the corresponding vessel has eitherescaped detection or does not exist. In this case, the image that is missing the vesselis once again consulted to determine if the vessel is truly not there or if it was a faileddetection. Only after this second attempt to test for the presence of the vessel is thevessel considered as being not present.
9.9.1.3 Width change detection
Once vessels are detected, the boundaries identified, and the images registered, it isthen possible to identify corresponding vessel points and compare widths to identifywidth change.
9.9.1.4 Comparison of widths
All widths for a given vessel segment are measured from two points on oppositesides of a vessel. These two points are determined from the B-spline ribbons repre-senting the detected vessel boundaries. The measured width between them is along aline that is guaranteed to be perpendicular to the vessel orientation. A separate algo-rithm determines corresponding cross sections between images. Once correspondingpoints on corresponding vessels are discovered, widths can be compared directly toidentify differences. By following these steps, there are no problems caused by dif-ferences in scale, discontinuities or discretization of the boundaries or cross sectionangle; and there are no issues with how a cross section’s end points are defined.
In determining vessel width change, it becomes necessary to define what consti-tutes change. What difference between corresponding vessel regions should be con-strued as change? Other research has shown that the “normal” expected differencebetween vessels over time caused by the cardiac cycle is approximately 5% (4.8%in [71], 5.4% in [45]). Thus this serves as the basis for comparison of two vessels— any vessel portions that exhibit more than this change should be flagged as siteswhere differences exist.
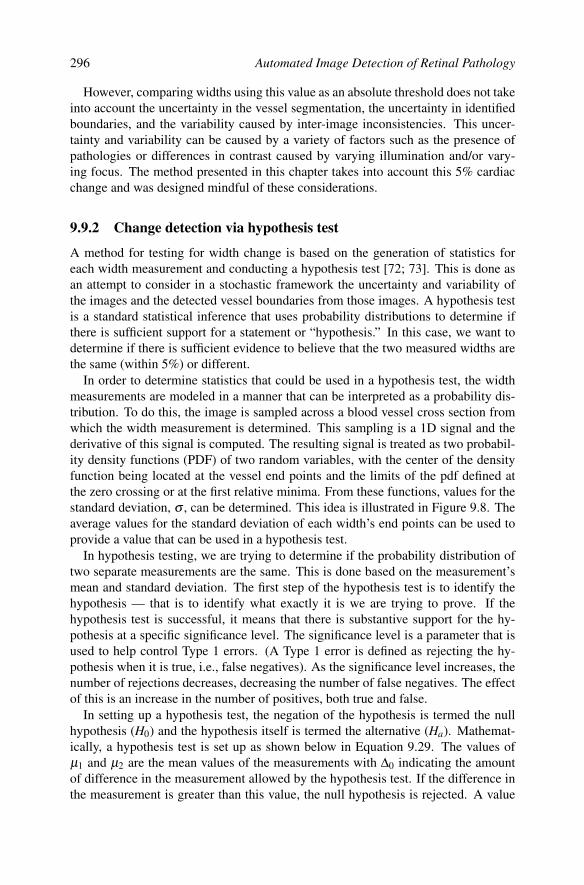
296 Automated Image Detection of Retinal Pathology
However, comparing widths using this value as an absolute threshold does not takeinto account the uncertainty in the vessel segmentation, the uncertainty in identifiedboundaries, and the variability caused by inter-image inconsistencies. This uncer-tainty and variability can be caused by a variety of factors such as the presence ofpathologies or differences in contrast caused by varying illumination and/or vary-ing focus. The method presented in this chapter takes into account this 5% cardiacchange and was designed mindful of these considerations.
9.9.2 Change detection via hypothesis test
A method for testing for width change is based on the generation of statistics foreach width measurement and conducting a hypothesis test [72; 73]. This is done asan attempt to consider in a stochastic framework the uncertainty and variability ofthe images and the detected vessel boundaries from those images. A hypothesis testis a standard statistical inference that uses probability distributions to determine ifthere is sufficient support for a statement or “hypothesis.” In this case, we want todetermine if there is sufficient evidence to believe that the two measured widths arethe same (within 5%) or different.
In order to determine statistics that could be used in a hypothesis test, the widthmeasurements are modeled in a manner that can be interpreted as a probability dis-tribution. To do this, the image is sampled across a blood vessel cross section fromwhich the width measurement is determined. This sampling is a 1D signal and thederivative of this signal is computed. The resulting signal is treated as two probabil-ity density functions (PDF) of two random variables, with the center of the densityfunction being located at the vessel end points and the limits of the pdf defined atthe zero crossing or at the first relative minima. From these functions, values for thestandard deviation, σ , can be determined. This idea is illustrated in Figure 9.8. Theaverage values for the standard deviation of each width’s end points can be used toprovide a value that can be used in a hypothesis test.
In hypothesis testing, we are trying to determine if the probability distribution oftwo separate measurements are the same. This is done based on the measurement’smean and standard deviation. The first step of the hypothesis test is to identify thehypothesis — that is to identify what exactly it is we are trying to prove. If thehypothesis test is successful, it means that there is substantive support for the hy-pothesis at a specific significance level. The significance level is a parameter that isused to help control Type 1 errors. (A Type 1 error is defined as rejecting the hy-pothesis when it is true, i.e., false negatives). As the significance level increases, thenumber of rejections decreases, decreasing the number of false negatives. The effectof this is an increase in the number of positives, both true and false.
In setting up a hypothesis test, the negation of the hypothesis is termed the nullhypothesis (H0) and the hypothesis itself is termed the alternative (Ha). Mathemat-ically, a hypothesis test is set up as shown below in Equation 9.29. The values ofµ1 and µ2 are the mean values of the measurements with ∆0 indicating the amountof difference in the measurement allowed by the hypothesis test. If the difference inthe measurement is greater than this value, the null hypothesis is rejected. A value

Determining Retinal Vessel Widths and Detection of Width Changes 297
FIGURE 9.8Two measured widths, w1 and w2 are illustrated. For each width measurement, thederivatives of the image intensity along the cross section on which the width is mea-sured result in two probability density functions centered at the end points. Fromthese, values for the standard deviation of the width measurement can be estimated.
of ∆ = 0 indicates that there is no tolerance for a difference in the measurements —both measurements are expected to be the same.
H0 : µ1−µ2 = ∆0 (9.29)Ha : µ1−µ2 6= ∆0 (9.30)
To conduct the hypothesis test, a test statistic, z, is computed as follows. Note that:
z =µ1−µ2−∆0√
σ21 +σ2
2
. (9.31)
This statistic is compared against a value, zα , that would be expected from a normaldistribution at a certain significance level, α .
The goal of this method is to determine if vessels have changed (where we havedefined change as a difference of more than 5%). However we only want to arriveat this conclusion when there is strong evidence to support it. Thus the hypothesis isthat changed vessels are those that show more than a 5% change. In Equation 9.29the values of µ1 and µ2 are the two widths that are to be compared. Replacing thiswith δw, the amount of measured change, (i.e., the difference between wi and w2),then the hypothesis is that there is change when δw > 0.05wmax where wmax is themaximum of the two widths and ∆0 in Equation 9.29 is replaced with 0.05wmax.
So, Equation 9.29 becomes
H0 : δw ≤ .05wmax(there is no change) (9.32)Ha : δw > .05wmax(there is change) (9.33)

298 Automated Image Detection of Retinal Pathology
FIGURE 9.9Illustrating the results of change detection. Boxes are drawn around vessels withsuspected width change. The image on the left has been transformed into the samecoordinate system as the image on the right. (See color insert.)
and Equation 9.31 becomes
z =δw− .05wmax√
σ21 +σ2
2
. (9.34)
Since we are interested in accepting the hypothesis when the change is greaterthan 5%, H0 is rejected if z ≥ zα . A value of α = 0.95 was used to generate thesample results shown in Figure 9.9.
9.9.3 Summary
This section presented a method for detection of vessel width change. This methodjudged change based on a 5% threshold of acceptable width variance due to thechanges in vessel widths caused by the cardiac cycle. The method judged changebased on descriptive statistics at each vessel end point. The end points of a crosssection are treated as random variables and the variance is computed based on thederivative of the intensities at the end point. These variances then are used in ahypothesis test.
9.10 ConclusionThis chapter presented a method by which to compare fundus images for indicationsof blood vessel width change. It started by presenting several blood vessel modelsand an improved algorithm for extracting blood vessels. Then several longitudinally

Determining Retinal Vessel Widths and Detection of Width Changes 299
continuous ribbon-like blood vessel models using B-splines were described, whosepurpose was to continuously define a blood vessel and allow the identification of anorthogonal cross section for accurate vessel width determination. These ribbons thenutilized a snake algorithm that allowed for further refinement of the vessel bound-ary locations. Once final blood vessel boundary locations are determined, it is thenpossible to transform images into common coordinate systems through the process ofregistration. Once registered, widths can be compared utilizing the described hypoth-esis test framework, attributing any change of 5% or less to normal vessel changescaused by the cardiac rhythm.
References[1] Gao, X., Bharath, A., Stanton, A., et al., A method of vessel tracking for vessel
diameter measurement on retinal images, in Proceedings IEEE InternationalConference on Image Processing, 2001, 881–884.
[2] Heier, H. and Brinchmann-Hansen, O., Theoretical relations between lightstreak characteristics and optical properties of retinal vessels, Acta Ophthal-mologica, 64, 33, 1986.
[3] Brinchmann-Hansen, O., Heier, H., and Myhre, K., Fundus photography ofwidth and intensity profile of the blood column and the light reflex in retinalvessels, Acta Ophthalmologica, 64, 20, 1986.
[4] Brinchmann-Hansen, O. and Sandvik, L., The intensity of the light reflex onretinal arteries and veins, Acta Ophthalmologica, 547–552, 1986.
[5] Roberts, D., Analysis of vessel absorption profiles in retinal oximetry, MedicalPhysics, 14, 124, 1987.
[6] Pinz, A., Bernogger, S., Datlinger, P., et al., Mapping the human retina, IEEETransactions on Medical Imaging, 17, 606, 1998.
[7] Tascini, G., Passerini, G., Puliti, P., et al., Retina vascular network recognition,in SPIE Conference on Image Processing, 1993, vol. 1898 of Proc. SPIE, 322–329.
[8] Can, A., Shen, H., Turner, J.N., et al., Rapid automated tracing and feature ex-traction from live high-resolution retinal fundus images using direct exploratoryalgorithms, IEEE Transactions on Information Technology in Biomedicine, 3,125, 1999.
[9] Wang, Y. and Lee, S., A fast method for automated detection of blood vesselsin retinal images, in Conference Record of the 32nd Asilomar Conference onSignals, Systems & Computers, 1997, vol. 2, 1700–1704.

300 Automated Image Detection of Retinal Pathology
[10] Solouma, N., Youssef, A., Badr, Y., et al., Real-time retinal tracking for lasertreatment planning and administration, in Medical Imaging 2001: Image Pro-cessing, 2001, vol. 4322 of Proc. SPIE, 1311–1321.
[11] Li, H. and Chutatape, O., Fundus image features extraction, in Proceedingsof the IEEE International Conference Engineering in Medicine and Biology,Chicago, IL, 2000, vol. 4, 3071–3073.
[12] Kochner, B., Schuhmann, D., Michaelis, M., et al., Course tracking and con-tour extraction of retinal vessels from color fundus photographs: Most efficientuse of steerable filters for model-based image analysis, in SPIE Conference onImage Processing, 1998, vol. 3338 of Proc. SPIE, 755–761.
[13] Jasiobedzki, P., Taylor, C., and Brunt, J., Automated analysis of retinal images,Image and Vision Computing, 3, 139, 1993.
[14] Zhou, L., Rzeszotarski, M., Singerman, L., et al., The detection and quantifi-cation of retinopathy using digital angiograms, IEEE Transactions on MedicalImaging, 619–626, 1994.
[15] Chaudhuri, S., Chatterjee, S., Katz, N., et al., Detection of blood vessels inretinal images using two-dimensional matched filters, IEEE Transactions onMedical Imaging, 8, 263, 1989.
[16] Hoover, A., Kouznetsova, V., and Goldbaum, M., Locating blood vessels inretinal images by piecewise threshold probing of a matched filter response,IEEE Transactions on Medical Imaging, 19, 203, 2000.
[17] Chutatape, O., Zheng, L., and Krishman, S., Retinal blood vessel detection andtracking by matched Gaussian and Kalman filters, in Proceedings of the 20thIEEE International Conference Engineering in Medicine and Biology, 1998,vol. 20, 3144–3149.
[18] Frame, A., Undrill, P., Olson, J., et al., Structural analysis of retinal vessels,in 6th International Conference on Image Processing and its Applications (IPA97), 1997, 824–827.
[19] Ballerini, L., An automatic system for the analysis of vascular lesions in retinalimages, in Proc. 1999 IEEE Nuclear Science Symposium, 1999, vol. 3, 1598–1602.
[20] Hammer, M., Leistritz, S., Leistritz, L., et al., Monte-Carlo simulation of reti-nal vessel profiles for the interpretation of in vivo oxymetric measurements byimaging fundus reflectometry, in Medical Applications of Lasers in Dermatol-ogy and Ophthalmology, Dentistry, and Endoscopy, 1997, vol. 3192 of Proc.SPIE, 211–218.
[21] Jagoe, J., Blauth, C., Smith, P., et al., Quantification of retinal damage done dur-ing cardiopulmonary bypass: Comparison of computer and human assessme-ment, IEE Proceedings Communications, Speech and Vision, 137, 170, 1990.

Determining Retinal Vessel Widths and Detection of Width Changes 301
[22] Jiang, X. and Mojon, D., Adaptive local thresholding by verification-basedmultithreshold probing with application to vessel detection in retinal images,IEEE Transactions on Pattern Analysis and Machine Intelligence, 25, 131,2003.
[23] Akita, K. and Kuga, H., A computer method of understanding ocular fundusimages, Pattern Recognition, 15, 431, 1982.
[24] Jasiobedzki, P., McLeod, D., and Taylor, C., Detection of non-perfused zones inretinal images, in Proceedings of the 4th IEEE Symposium on Computer-BasedMedical Systems, 1991, 162–169.
[25] Zana, F. and Klein, J.C., Robust segmentation of vessels from retinal angiogra-phy, in Proceeding International Conference Digital Signal Processing, 1997,1087–1090.
[26] Zana, F. and Klein, J.C., Segmentation of vessel-like patterns using mathemat-ical morphology and curvature evaluation, IEEE Transactions on Image Pro-cessing, 10, 1010, 2001.
[27] Staal, J., Kalitzin, S., Abramoff, M., et al., Classifying convex sets for vesseldetection in retinal images, in IEEE International Symposium on BiomedicalImaging, Washington, DC, 2002, 269–272.
[28] Heneghan, C., Flynn, J., O’Keefe, M., et al., Characterization of changes inblood vessel width and tortuosity in retinopathy of prematurity using imageanalysis, Medical Image Analysis, 6, 407, 2002.
[29] Gang, L., Chutatape, O., and Krishnan, S., Detection and measurement of reti-nal vessels in fundus images using amplitude modified second-order Gaussianfilter, IEEE Transactions on Biomedical Engineering, 49, 168, 2002.
[30] Luo, G., Chutatape, O., and Krishman, S., Performance of amplitude modifiedsecond order Gaussian filter for the detection of retinal blood vessel, in SPIEConference Ophthalmic Technologies XI, 2001, vol. 4245 of Proc. SPIE, 164–169.
[31] Jasiobedzki, P., Williams, C., and Lu, F., Detecting and reconstructing vasculartrees in retinal images, in SPIE Conference on Image Processing, 1994, vol.2167 of Proc. SPIE, 815–825.
[32] Sinthanayothin, C., Boyce, J., Cook, H., et al., Automated localisation of theoptic disc, fovea, and retinal blood vessels from digital colour fundus images,British Journal of Ophthalmology, 83, 902, 1999.
[33] Truitt, P., Soliz, P., Farnath, D., et al., Utility of color information for seg-mentation of digital retinal images: Neural network-based approach, in SPIEConference on Image Processing, 1998, vol. 3338 of Proc. SPIE, 1470–1481.
[34] Tan, W., Wang, Y., and Lee, S., Retinal blood vessel detection using frequencyanalysis and local-mean-interpolation filters, in Medical Imaging 2001: Image

302 Automated Image Detection of Retinal Pathology
Processing, 2001, vol. 4322 of Proc. SPIE, 1373–1384.
[35] Schwartz, B., Takamoto, T., and Lavin, P., Increase of retinal vessel width in oc-ular hypertensives with timolol therapy, Acta Ophthalmologica, 215, 41, 1995.
[36] Lalonde, M., Gagnon, L., and Boucher, M.C., Non-recursive paired trackingfor vessel extraction from retinal images, in Vision Interface 2000, Montreal,Quebec, 2000.
[37] Pedersen, L., Grunkin, M., Ersbøll, B., et al., Quantitative measurement ofchanges in retinal vessel diameter in ocular fundus images, Pattern Recogni-tion, 21, 1215, 2000.
[38] Kurokawa, T., Kondoh, M., Lee, S., et al., Maze-tracing algorithm applied toeye-fundus blood vessels, Electronics Letters, 34, 976, 1998.
[39] Gagnon, L., Lalonde, M., Beaulieu, M., et al., Procedure to detect anatomicalstructures in optical fundus images, in Medical Imaging 2001: Image Process-ing, 2001, vol. 4322 of Proc. SPIE, 1218–1225.
[40] TargetJr Consortium, The VXL book, 2000, http://public.kitware.com/vxl/doc/release/books/core/book.html.
[41] Delori, F., Fitch, K., Feke, G., et al., Evaluation of micrometric and microden-sitometric methods for measuring the width of retinal vessel images on fundusphotographs, Graefes Archive for Clinical and Experimental Ophthalmology,226, 393, 1988.
[42] Wong, T., Klein, R., Sharrett, A., et al., Retinal arteriolar narrowing and risk ofdiabetes mellitus in middle-aged persons, JAMA, 287, 2528, 2002.
[43] Wong, T., Klein, R., Sharrett, A., et al., Retinal arteriolar narrowing and risk ofdiabetes mellitus in middle-aged persons, JAMA, 287, 1153, 2002.
[44] Newsom, R., Sullivan, P., Rassam, S., et al., Retinal vessel measurement: com-parison between observer and computer driven methods, Graefes Archive forClinical and Experimental Ophthalmology, 230, 221, 1992.
[45] Dumskyj, M., Aldington, S., Dore, C., et al., The accurate assessment ofchanges in retinal vessel diameter using multiple frame electrocardiograph syn-chronized fundus photography, Current Eye Research, 15, 625, 1996.
[46] Miles, F. and Nutall, A., Matched filter estimation of serial blood vessel di-ameters from video images, IEEE Transactions on Medical Imaging, 12, 147,1993.
[47] Gao, X., Bharath, A., Stanton, A., et al., Measurement of vessel diameterson retinal images for cardiovascular studies, in Proceedings of Medical ImageUnderstanding and Analysis, 2001.
[48] Gregson, P., Shen, Z., Scott, R., et al., Automated grading of venous beading,Computers and Biomedical Research, 28, 291, 1995.

Determining Retinal Vessel Widths and Detection of Width Changes 303
[49] Chapman, N., Witt, N., Gao, X., et al., Computer algorithms for the automatedmeasurement of retinal arteriolar diameters, British Journal of Ophthalmology,85, 74, 2001.
[50] Kass, M., Witkin, A.P., and Terzopoulos, D., Snakes: Active contour models,International Journal of Computer Vision, 1, 321, 1988.
[51] Neuenschwander, W.M., Fua, P., Iverson, L., et al., Ziplock snakes, Interna-tional Journal of Computer Vision, 25, 191, 1997.
[52] Mayer, H., Laptev, I., Baumgartner, A., et al., Automatic road extraction basedon multiscale modeling, International Archives of Photogrammetry and RemoteSensing, 32, 47, 1997.
[53] Bartels, R.H., Beatty, J.C., and Barsky, B.A., An introduction to splines for usein computer graphics and geometric modeling, Morgan Kaufmann, San Mateo,CA, 1987.
[54] Unser, M., Splines a perfect fit for signal and image processing, IEEE Transac-tions on Signal Processing, 16, 22, 1999.
[55] Figueiredo, M., Leitao, J., and Jain, A., Unsupervised contour representationand estimation using B-splines and a minimum description length criterion,IEEE Transactions on Image Processing, 9, 1075, 2000.
[56] Menet, S., Saint-Marc, P., and Medioni, G., B-snakes: Implementation andapplication to stereo, in Proceedings of the DARPA Image Undertanding Work-shop, Pittsburgh, PA, 1990, 720–726.
[57] Saint-Marc, P. and Medioni, G., B-spline contour representation and symme-try detection, in Proceedings of the First European Conference on ComputerVision, 1990, 604–606.
[58] Stewart, C.V., Robust parameter estimation in computer vision, SIAM Reviews,41, 513, 1999.
[59] Rosenfeld, A., Axial representations of shape, Computer Vision, Graphics andImage Processing, 33, 156, 1986.
[60] Blum, H. and Nagel, R., Shape description using weighted symmetric axis fea-tures, Pattern Recognition, 10, 167, 1978.
[61] Brooks, A., Symbolic reasoning among 3-D models and 2-D images, ArtificialIntelligence, 17, 285, 1981.
[62] Brady, M. and Asada, H., Smoothed local symmetries and their implementa-tion, MIT Artifical Intelligence Laboratory Memo 757, 1984.
[63] Ponce, J., On characterizing ribbons and finding skewed symmetries, ComputerVision, Graphics and Image Processing, 52, 328, 1990.
[64] Huang, Q. and Stockman, G., Generalized tube model: Recognizing 3D elon-

304 Automated Image Detection of Retinal Pathology
gated objects from 2D intensity images, in Proceedings of the IEEE Conferenceon Computer Vision and Pattern Recognition, 1993, 104–109.
[65] Laptev, I., Road extraction based on snakes and sophisticated line extraction,Master’s thesis, Royal Institute of Technology, Stockholm, Sweden, 1997.
[66] Laptev, I., Mayer, H., Lindeberg, T., et al., Automatic extraction of roads fromaerial images based on scale space and snakes, Machine Vision and Applica-tions, 12, 23, 2000.
[67] Fua, P. and Leclerc, Y.G., Model driven edge detection, Machine Vision Appli-cations, 3, 45, 1990.
[68] Klein, A., Egglin, T., Pollak, J., et al., Identifying vascular features with ori-entation specific filters and B-spline snakes, in Proceedings of Computers inCardiology, 1994, 113–116.
[69] Leitner, F. and Cinquin, P., From splines and snakes to snake splines, GeometricReasoning: From Perception to Action, Lecture Notes in Computer Science,708, 477, 1990.
[70] Stewart, C., Tsai, C.L., and Roysam, B., The dual-bootstrap iterative closestpoint algorithm with application to retinal image registration, IEEE Transac-tions on Medical Imaging, 22, 1379, 2003.
[71] Chen, H., Patel, V., Wiek, J., et al., Vessel diameter changes during the cardiaccycle, Eye, 8, 97, 1994.
[72] Bhattacharyya, G.K. and Johnson, R.A., Statistical Concepts and Methods,John Wiley and Sons, Chichester, West Sussex, United Kingdom, 1977.
[73] Devore, J.L., Probability and Statisitics for Engineering and the Sciences,Duxbury, Belmont, CA, 2000.
10Geometrical and Topological Analysis ofVascular Branches from Fundus RetinalImages
Nicholas W. Witt, M. Elena Martınez-Perez, Kim H. Parker, SimonA. McG. Thom, and Alun D. Hughes
CONTENTS
10.1 Introduction . . . . . . . . . . . . . . . . . . . . . . . . . . . . . . . . . . . . . . . . . . . . . . . . . . . . . . . . . . . . . . . 30510.2 Geometry of Vessel Segments and Bifurcations . . . . . . . . . . . . . . . . . . . . . . . . . . . . 30610.3 Vessel Diameter Measurements from Retinal Images . . . . . . . . . . . . . . . . . . . . . . . 31210.4 Clinical Findings from Retinal Vascular Geometry . . . . . . . . . . . . . . . . . . . . . . . . . 31510.5 Topology of the Vascular Tree . . . . . . . . . . . . . . . . . . . . . . . . . . . . . . . . . . . . . . . . . . . . . 31810.6 Automated Segmentation and Analysis of Retinal Fundus Images . . . . . . . . . . 32310.7 Clinical Findings from Retinal Vascular Topology . . . . . . . . . . . . . . . . . . . . . . . . . 32810.8 Conclusion . . . . . . . . . . . . . . . . . . . . . . . . . . . . . . . . . . . . . . . . . . . . . . . . . . . . . . . . . . . . . . . . 329
References . . . . . . . . . . . . . . . . . . . . . . . . . . . . . . . . . . . . . . . . . . . . . . . . . . . . . . . . . . . . . . . . 330
10.1 IntroductionThe retinal fundus is a site where the microcirculation (arteries and veins between20–200 µm) can readily be viewed and imaged. Evidence that the retinal microcircu-lation is affected by diabetes [1], renal disease, and hypertension [2] followed rapidlyonce the ophthalmoscope was invented by Helmholtz in 1851 [1]. In the context ofhypertension, Keith, Wagener, and Barker showed that mortality increased with in-creasing severity of retinopathy [3] and their work led to the most widely knowneponymous classification system of hypertensive retinopathy. Subsequently, a num-ber of alternative classification schemes have been proposed [4; 5].
Fundoscopy is a routine part of the assessment of the hypertensive patient [6–8]. However with better levels of control of blood pressure the frequency of severeretinopathy such as that seen by Keith, Wagener, and Barker has declined markedly.Current estimates suggest that retinopathy occurs in only around 2% to 15% of thenondiabetic adult population aged 40 years and older [9–16]. Consequently the
305

306 Automated Image Detection of Retinal Pathology
value of routine fundoscopy in hypertension has been increasingly questioned onthe grounds of poor reproducibility and indifferent predictive value [17; 18]. Incontrast, diabetic retinopathy remains an immense health problem and is one of thecommonest causes of blindness in adults [19].
Hypertension is a major cause of mortality and morbidity, currently affectingnearly a billion individuals worldwide [20], and it accounts for approximately one ineight of all deaths [21]. Moreover, blood pressure shows a continuous relationshipwith cardiovascular disease risk [22] and the majority of cardiovascular disease thatis attributable to increased blood pressure occurs in individuals that are not catego-rized as hypertensive. Therefore, identification of individuals at risk of cardiovas-cular events within the range of “normal” blood pressure would be of considerablevalue.
10.2 Geometry of Vessel Segments and BifurcationsInterest in quantifiable geometrical parameters of vessel segments and bifurcationshas been driven by the hypothesis that alterations in such parameters can provide anindication of cardiovascular risk independent of blood pressure and other known riskfactors.
An important consideration in the measurement of retinal vascular geometry isthat an unknown refraction is introduced by the lens, cornea, and aqueous humourin the optical path of the eye through which a retinal image is captured, renderingabsolute measurements of physical distances uncertain [23]. It has been estimatedthat the effects of refraction may give rise to variability of up to 20% in absolute vas-cular diameter measurements from retinal fundus photographs [24]. Accordingly,the greatest attention has been given to nondimensional geometrical parameters, typ-ically involving a ratio of distances, which are more robust to confounding effects ofvariations in the optical path. Examples of geometrical parameters not influenced byocular refraction include:
• Arterial to venous diameter ratio (AVR)
• Bifurcation geometry, including diameter relationships and angles
• Vessel length to diameter ratio (LDR)
• Vessel tortuosity.
Further definitions of these parameters are given in the following sections.
10.2.1 Arterial to venous diameter ratio
One of the first parameters describing vascular geometry to receive attention wasthe ratio of arterial to venous vascular diameters, commonly known as the AVR,

Analysis of Vascular Branches 307
which can be found in the literature as early as 1879 [25]. The principal objectiveof this parameter is to provide sensitivity to general arterial narrowing, while reduc-ing the impact of refractive variation through normalization by the venous diameter.Confirmation of the insensitivity of AVR to refraction has been reported by Wonget al. [24].
Stokoe and Turner [25] drew attention to the importance of calculating the AVRfrom measurements of arterial and venous diameters at comparable orders of divi-sion in their respective vascular trees, and also highlighted the practical difficulty ofachieving this, not least because the more peripheral retinal arteries and veins tend tobe dissociated. In order to overcome some of these problems, the AVR for a singleeye has commonly been calculated by a technique based on work originated by Parrand Spears [26; 27], and subsequently modified by Hubbard [28], in which diametermeasurements of a series of arteries or veins are combined into an equivalent diam-eter of the central retinal artery or vein, respectively. The ratio of these equivalentcentral vessel diameters can then be calculated to yield the AVR.
Parr and Spears derived an empirical formula relating vessel diameters at an ar-terial bifurcation, based on measurements from a sample of red-free monochromeretinal photographs of normotensive adults [26]. Their approach was guided by theobservation that the ratio of areas of the daughter vessels to that of the parent gen-erally decreased with increasing asymmetry of the bifurcation, suggesting a generalform of an expression relating the diameters. A computer search algorithm was usedto determine the parameters based on a least-squares criterion, yielding a relationshipgiving the parent arterial diameter
da0 =√
0.87d2a2
+1.01d2a1−0.22da1 da2 −10.76 (10.1)
where da1 and da2 are the diameters of the larger and smaller daughter vessels respec-tively, all measured in µm. An equivalent formula for the veins was later derived byHubbard by a similar approach, giving the parent venous diameter as
dv0 =√
0.72d2v2
+0.91d2v1
+450.05 (10.2)
where dv1 and dv2 are defined in the same way as for the arteries, also measuredin µm.
In order to yield the central vessel equivalent diameter from a series of arterial di-ameter measurements, Hubbard [28] proposed a simplified pairing of vessels, com-pared to the original Parr and Spears technique that involved reconstructing the actualarterial tree [27]. In the simplified scheme, the largest vessel is paired with the small-est, the next largest with the next smallest and so on, irrespective of the bifurcationsactually observed. The parent vessel diameters are calculated by the appropriate for-mula, and are carried together with any odd remaining vessel to the next order ofdivision where the pairing procedure is repeated. The process is continued until adiameter estimate for the single central vessel has been achieved. This process isillustrated in Figure 10.1(a), where measured arterial vessels [27] are shown in theleft-hand column, and the diameters of subsequent orders of vessels are calculated by

308 Automated Image Detection of Retinal Pathology
the Parr and Spears empirical formula, eventually yielding the equivalent diameterof the central retinal artery, dcra.
The process is repeated separately for the venous tree, yielding the equivalentdiameter of the central retinal vein, dcrv. Hence the arterial to venous ratio is givenby
AVR =dcra
dcrv. (10.3)
In a previously unpublished analysis, we have compared the diameter relationshipspredicted at an arterial bifurcation by the empirical Parr and Spears formula withthose suggested theoretically in an optimum bifurcation by Murray’s Law [29], asdiscussed in the following section. In perfectly symmetrical bifurcations, the Parrand Spears formula consistently gives rise to a parent diameter in the region of 2.2%greater than that indicated by Murray’s Law, but more importantly, this relationshipappears to be maintained within a tolerance of better than ±0.5% of parent diameterover a wide range of bifurcations, the only exceptions being cases of extreme asym-metry. This consistency between the empirical Parr and Spears approach and thetheoretical treatment by Murray should not be unexpected, bearing in mind that theParr and Spears formula was derived from images of healthy normotensive subjects.It suggests that the AVR calculated by the Parr, Spears and Hubbard technique mightbe sensitive not only to general arterial narrowing, but also to deviations from theoptimal bifurcation geometry predicted by Murray’s Law.
The Parr and Spears technique depends on measurement of all vessel diameters be-ing undertaken at a consistent location in the vascular tree. One approach to achievethis involves an annular grid, consisting of concentric rings centered on the opticdisc, superimposed on a retinal image [28]. Diameter measurements are taken fromall vessels traversing a measurement zone between the concentric rings, as illustratedin Figure 10.1(b), before being combined by the method described earlier to yieldtheir central vessel equivalent diameters, from which the AVR can be calculated.
10.2.2 Bifurcation geometry
The geometry of bifurcating vessels may have a significant impact on the hemody-namics of the vascular network. Important parameters characterizing the geometryof an arterial bifurcation are the bifurcation angle ψ , defined as the internal angle be-tween the daughter vessels, and the junction exponent x, defined by the relationship
dx0 = dx
1 +dx2 (10.4)
where d0 and d1, d2 are the diameters of the parent and daughter vessels respectively.Early work by Murray [29; 30] predicted that optimum values of both the junctionexponent and bifurcation angle should exist, minimizing the power required to main-tain circulation through the bifurcation (including losses due to viscous drag, and themetabolic energy to maintain the blood and tissue volume). Murray indicated thatthe optimum value of the junction exponent is 3, generally referred to as Murray’sLaw. Sherman [31] and LaBarbera [32], based on data from a variety of other work-ers, have shown that with the exception of the very largest vessels, healthy arteries

Analysis of Vascular Branches 309
121
24
109
41
106
56
121
112
113
151
174
ArterialDiameter
Measurements(µm)
CRAEquivalentDiameter
(µm)
= Measured diameter (µm)
= Parr & Spears derived diameter (µm)
(a)
(b)
FIGURE 10.1Measurement of AVR by Parr, Spears, and Hubbard technique: (a) derivation ofcentral retinal arterial (CRA) equivalent diameter, and (b) measurement of vessels inzone defined by a predetermined annular grid.

310 Automated Image Detection of Retinal Pathology
d0d1
d2
l0
FIGURE 10.2A generalized vascular segment and bifurcation.
and veins appear to follow Murray’s Law reasonably well. Conversely, deviationsfrom the Murray optima have been observed in diseased coronary arteries [33].
Zamir [34; 35] extended Murray’s approach to consider asymmetry in bifurcat-ing vessels, together with alternative optimization criteria. In the general bifurcationillustrated in Figure 10.2, nondimensional parameters can be defined for the asym-metry ratio
α =d2
2
d21
(10.5)
and the ratio of vessel cross-sectional areas, sometimes referred to as expansion ratio
β =d2
1 +d22
d20
. (10.6)
From Murray’s principal hypothesis that the diameter of a vessel is proportionalto the cube root of the flow that the vessel is intended to carry, it can be shown that
β = (1+α)(
1+α3/2)−2/3
(10.7)
and that
d1
do=(
1+α3/2)−1/3
(10.8)
d2
d0= α
1/2(
1+α3/2)−1/3
, (10.9)
where d1 is the diameter of the larger daughter vessel. Experimental data from mea-surements of retinal vessels [36] appear to be consistent with these theoretical ratios,albeit with some scatter of observed data around the theoretical values.
From the above ratios, theoretical optimum branching angles can be predictedgiven the asymmetry ratio and taking into account specific optimization criteria. Foursuch criteria have been considered [34–37]: lumen surface, lumen volume, pumpingpower, and endothelial drag. The spread observed in data from retinal bifurcations

Analysis of Vascular Branches 311
suggests that more than one optimality criterion may be involved, although somebias in favor of the principles of minimum lumen volume and pumping power hasbeen observed [36]. In general, for a given optimality criterion, the optimum bi-furcation angle ψ depends on both the junction exponent x and also the asymme-try ratio α [37], but for reasonably symmetrical bifurcations (say α > 0.4) obeyingMurray’s Law, the optimum angle ψ for a bifurcation is approximately constant at75 degrees.
It is generally believed that the endothelium plays an important role in the main-tenance of optimal geometry at bifurcations. Inhibition of endothelial nitric oxidein vitro has been shown to cause deviations in the junction exponent from optimumvalues [38], and observations in the retina from young normal subjects have shownacute alteration of bifurcation geometry when synthesis of endothelial nitric oxidewas suppressed by infusion of NG-mono-methyl-L-arginine (L-NMMA) [39]. Ac-cordingly, it has been hypothesised that deviations from optimal bifurcation geome-try are associated with endothelial dysfunction. Given that impairment of endothelialfunction has been found in the early stages of atherosclerosis [40], speculation hasarisen that altered bifurcation geometry may even precede clinical presentation ofcardiovascular disease.
It has been noted that the junction exponent is not an ideal parameter to character-ize the optimality of diameter relationships at a bifurcation, since it is poorly behavedin the presence of measurement noise [41]. For this reason, an alternative parame-ter based on mean nondimensional daughter diameter, corrected for the effects ofasymmetry, was used in a recent study [41] as a more robust surrogate for junctionexponent.
10.2.3 Vessel length to diameter ratios
The length to diameter ratio (LDR) of a vessel segment is typically measured be-tween consecutive bifurcations, represented by l0/d0 in Figure 10.2. The LDR willtend to increase in value in the presence of general arterial narrowing, as well as rar-efaction, both of which are associated with increased peripheral vascular resistanceand hypertension [42]. Furthermore, the LDR, like the AVR, is robust to variabilityin refraction by virtue of its nondimensionality.
A practical issue arises in the measurement of LDR from typical retinal images.Since the length of a vessel segment is measured between consecutive bifurcations,a risk exists that a measurement of LDR may vary, depending on the ability to detecta bifurcation involving a very small daughter vessel branching from a larger par-ent. This, in turn, is likely to be affected by image quality, increasing scatter in L/Dmeasurements, and reducing reproducibility. In order to minimize any associationbetween L/D measurements and image quality, it is necessary to establish criteriato reject small daughter vessels close to the threshold of imaging or visualization,so that these are not regarded as terminating vessel segments undergoing LDR mea-surement.

312 Automated Image Detection of Retinal Pathology
10.2.4 Tortuosity
Vascular tortuosity in the retina has been qualitatively assessed by physicians sincethe invention of the ophthalmoscope, but quantitative measurement of tortuosity ofretinal vessels has been a more recent development. A large number of computa-tional techniques are available for the measurement of vascular tortuosity, and Hartet al. [43] have compared the characteristics of seven different measures, withoutconclusively recommending a particular approach.
A simple and widely used technique is based on the ratio of arc length la to chordlength lc in the form
τsimple =lalc−1. (10.10)
This measure is sensitive to the increase in arc length in a tortuous vessel, but doesnot necessarily reflect the extent to which a vessel changes direction. An alterna-tive measure of tortuosity also offering sensitivity to the latter characteristic can bederived from the curvature of the vessel κ , normalized by the arc length as follows
τcurve =1la
∫ξend
ξstart[κ(ξ )]2 dξ , (10.11)
where ξ is the distance along the vessel path. This measure benefits from a prop-erty referred to as “compositionality,” meaning that if a vessel is composed of twosmoothly connected segments, then the tortuosity of the entire vessel must lie be-tween those of the constituent segments [43]. Measures having such a property havebeen considered a priori to correspond most closely to the tortuosity judged qualita-tively by ophthalmologists [43]. However it should be noted that the curvature-basedmeasure (τcurve) is not dimensionless.
The distinction between these alternative measures may be appreciated by refer-ence to Figure 10.3 illustrating three vessels of equal arc and chord length, but withzero, one, and two inflection points. All three vessels are constructed from concate-nated semi-circles, allowing both measures of tortuosity to be calculated analytically.Bearing in mind that curvature-based tortuosity is not dimensionless, this measurehas been computed assuming a typical vessel length of 353 pixels from a retinal fieldof approximately 2800 pixels in diameter corresponding to a 30 degree view. Simpletortuosity is equal in all three cases since the arc or chord lengths remain unchanged,whereas curvature tortuosity progressively increases with the number of inflectionpoints.
10.3 Vessel Diameter Measurements from Retinal ImagesSeveral of the parameters discussed above, such as AVR, bifurcation diameter op-timality, and LDR, involve measurement of vessel diameter for their computation.The most accurate source from which to determine the diameter of retinal vessels

Analysis of Vascular Branches 313
Simple Tortuosity Curvature Tortuosity(for typical vessel length)
0.571 0.079×10⁻³
0.571 0.317×10⁻³
0.571 0.713×10⁻³
FIGURE 10.3Comparison of alternative tortuosity measures. (Adapted from Witt, N.W., Wong,T.Y., Chaturvedi, N., et al., Hypertension, 47, 975, 2006. With permission.)
would generally be considered to be fluorescein angiography, but such an invasiveprocedure is unsuitable for routine clinical imaging, and the preferred technique isto measure vascular geometry from red-free monochrome images, or else from colorimages, usually by selection of the green layer. Measurement of vessel diameter fromimages acquired without fluorescein is more challenging since the contrast betweenvessel and background is much lower, and the edges of vessels are poorly defined.The presence of a pronounced central light reflex may also cause problems. Threetechniques are described here, which have been proposed to tackle the challenge ofmeasuring the diameter of a retinal vessel from red-free images. All these techniquesare based upon measurement of diameter from a single intensity cross section normalto the direction of flow in the vessel and, typically, an overall estimate of diameterwould be made from a sequence of such cross sections a few pixels apart.
10.3.1 The half-height method
Brinchmann-Hansen and Engvold [44] proposed a method of measuring the width ofa retinal vessel from a single intensity cross section of a fundus photograph, basedupon measurement of distance between the points of half intensity. The principle isillustrated in Figure 10.4(a), where the vessel gives rise to increasing intensity, aswould arise from a red-free image on monochrome negative film. In summary, thepoints of maximum and minimum intensity are identified on each side of the vesselcenter line, and overall extreme intensities are taken to be the means of the valuesfrom opposite sides of the profile. The vessel diameter is measured between thepoints on the profile intercepting the half intensity value, taken to be the midpoint

314 Automated Image Detection of Retinal Pathology
between the overall extremes. A similar process can also be used to measure thewidth of the central light reflex. This half-height technique has been widely used, butit has been criticized [45] because it makes measurements based on only a limitedamount of information in the intensity cross section, making it vulnerable to theeffects of image intensity noise and other imaging imperfections. Implementation ofa practical measurement system based on this technique would rely on filtration ofthe image and/or the intensity profile prior to taking measurements.
10.3.2 Double Gaussian fitting
A more general model-based approach has been proposed [46], based on a doubleGaussian intensity profile, in which a main Gaussian curve representing the image ofthe vessel itself is summed with a smaller inverted Gaussian representing the centrallight reflex. This approach assumes that increased attenuation of red-free light occursin the lumen as it passes through the blood column, and that the attenuation varieslinearly with the path length through the blood. Under this assumption, it can beshown that a Gaussian function is a reasonable approximation of the intensity profileacross the vessel [46]. The central light reflex can be modeled as an optical scatteringfrom a rough column of blood, and under the assumption of elliptical scatteringfunctions, gives rise to the narrow inverted Gaussian [47–49]. The double Gaussiancurve can be characterized by up to seven parameters, a1 to a7, such that the intensityI varies as a function of the distance along the cross section x
I(x) = a1e−((x−a2)/a3)2+a4−a5e−((x−a6)/a7)2
(10.12)
as illustrated in Figure 10.4(b). Given an intensity cross section from a retinal pho-tograph, the seven parameters characterizing the double Gaussian profile can bedetermined from a nonlinear fitting technique, such as the Levenberg-Marquardtmethod [50], although robustness to noise can be improved by fixing some of theparameters, such as a2 and/or a7 to reduce the degrees of freedom. It should be notedthat the parameter a3 characterizing the width of the main Gaussian curve does notcorrespond directly to the diameter of the vessel, and must be multiplied by a scalingfactor to allow direct comparison with the results from other measurement methods.In a comparison of vessel measurement techniques, including the double Gaussianmodel, Chapman et al. [45] took the vessel diameter to be 2.33a3.
10.3.3 The sliding linear regression filter (SLRF)
The SLRF method [45] is based upon the fitting of a line by linear regression, relatingimage intensity against distance along the cross section, within a window of W pointscentered on the nth point. The window is progressively moved by a single point at atime across the entire cross section of interest, and the slope of the best least-squaresline attributed to the nth point as mn. Hence
mn =W ∑i xizi−∑i xi ∑i zi
W ∑i x2i − (∑i xi)
2 (10.13)

Analysis of Vascular Branches 315
for all i such that −W/2 ≤ (i−n)≤W/2, xi and zi being the position and intensityrespectively at the ith point. This principle is illustrated in Figure 10.4(c).
To determine the positions of the maximum positive going and negative goingslope, the resulting values of m are subject to a threshold test, and those points fallingbeyond a specified range are used to compute the actual position of the edge. Thediameter is taken as the distance between the opposite edges.
An important consideration in the SLRF method is the choice of window size W .Generally, a smaller window size gives better resolution of edges of small vessels, butat the expense of less noise rejection, whereas a larger window gives better consis-tency in measurements from larger vessels. It can be concluded that the window sizeshould be adapted to reflect the size of the vessel under examination, which has alsobeen found to improve the linearity of the measurement technique. A suitable valueof W can be derived from an initial estimate of the vessel under measurement, eitherfrom a moment-based calculation or else application of the half-height technique.
In a comparison of automated vessel measurement techniques [45], including thedouble Gaussian and SLRF techniques, it was found that the SLRF method yieldedthe most consistent and most repeatable automated measurements.
10.4 Clinical Findings from Retinal Vascular GeometryEarly clinical studies have pointed to associations between altered retinal vasculargeometry and cardiovascular risk. Increased LDR was found to be associated withhypertension in a small study comparing men with normal blood pressure and hy-pertension [51]. This is consistent with previous findings of increased vessel lengthand reduced caliber [42] in hypertension. Furthermore, a significant association hasbeen found between increasing age and decreasing junction exponent in retinal arte-rial bifurcations, both in normotensive and hypertensive individuals [52]. This studywas performed in a group of 25 subjects undergoing fluorescein angiography, and isconsistent with other reports of abnormal endothelial function with aging [53]. Thesame study found that bifurcation angles also reduced with age, and were smaller forpeople with hypertension than those with normal blood pressure.
A later study found significantly narrower bifurcation angles in a group of menwith low birth weight [54] (although no difference in junction exponent) comparedto a similar group having high birth weight, independent of blood pressure. Bearingin mind that interesting associations have been reported between low birth weightand increased cardiovascular mortality [55] as well as increased prevalence of hyper-tension [56–58], these findings in the retina may point to a mechanistic link betweenlow birth weight and subsequently increased cardiovascular risk, and add supportto the suggestion that abnormalities in retinal vascular geometry can precede othermanifestations of disease.
Significant deviations in junction exponents of retinal arterial bifurcations havealso been found in normotensive men with peripheral vascular disease [59], whereas

316 Automated Image Detection of Retinal Pathology
Intensity
x
d
h/2
h/2
h
(a)
x
Intensity
a1
a4
a2
a3
a5
a7
a6
(b)
Intensity
xxn
Sliding window of width W pointsmoves over entirecross-section
Measured intensity over cross-sectionof vessel
Edge gradient at xnmeasured by linearregression withinwindow
(c)
FIGURE 10.4Techniques for vessel diameter measurement: (a) the half-height method, (b) thedouble Gaussian method, and (c) the SLRF method. (Part (c) from Chapman, N.,Witt, N.W., Gao, X., Bharath, A.A., et al., Br. J. Ophthalmol., 85, 74, 2001. Withpermission.)

Analysis of Vascular Branches 317
healthy controls, matched for age and blood pressure, exhibited optimal junctionexponents as predicted by Murray’s Law.
Important evidence of the power of AVR and other geometrical characteristicsof the retinal vasculature to predict vascular disease have come from prospectivepopulation-based studies, most notably the Atherosclerosis Risk in Communities(ARIC) study [60] and the Beaver Dam Eye Study [61]. Reduced AVR measuredby the Parr, Spears, and Hubbard method has been shown to predict independentlyincident hypertension over a 3-year period in the ARIC study [62], and in the BeaverDam Eye Study [63] over a 10-year period. These findings are consistent with the hy-pothesis that arterial narrowing is associated with the occurrence and developmentof hypertension, although neither study distinguishes between functional or struc-tural narrowing of arteries. Furthermore, in the ARIC study reduced AVR has beenshown to predict stroke independently of other risk factors [64], coronary heart dis-ease (CHD) in women (but not men) [65], and type 2 diabetes mellitus [66]. In theBeaver Dam Eye Study, AVR was found to predict cardiovascular death in a cohortof 879 younger persons (age 43–74 years) although not in older individuals [67].However, in a larger analysis of 4926 individuals from the same population, a U-shaped association was found in which very large or very small values of AVR wereassociated with increased mortality over 10 years, both from all causes and vasculardisease [68]. This latter finding contrasts with those from earlier studies, suggestingthat further investigation is needed to understand fully the association between AVRand systemic disease.
An extensive analysis of retinal vascular geometry has been undertaken in a co-hort of 528 subjects participating in the Beaver Dam Eye Study [41]. This nestedcase-control study found that sub-optimal diameter relationships at retinal arterialbifurcations were associated with risk of death within 10 years from ischemic heartdisease (IHD), independently of other known risk factors including age, gender, andhistory of cardiovascular disease. This study provides the most compelling evidenceto date of the power of abnormal bifurcation geometry to predict incident cardiovas-cular disease. In the same study LDR was found again to be significantly associatedwith resting blood pressure, and furthermore was found to predict death from stroke,although not independently of blood pressure. Reduced simple tortuosity (τsimple)was found to be significantly associated with risk of death from IHD, independentlyof other risk factors. The association between reduced tortuosity and death from IHDwas unexpected and is not consistent with earlier qualitative assessments of retinalvascular tortuosity from fundoscopy of subjects with coronary artery disease [69].However, tortuosity assessed by fundoscopy may be less reliable than that measuredquantitatively from retinal photographs and, in addition, confounding factors suchas age, hypertension, and diabetes were not taken into account in the earlier study.Given that the endothelium plays a major role in the regulation of microvascular flowand angiogenesis, the finding from the Beaver Dam cohort has given rise to specula-tion that lowered retinal arterial tortuosity may be linked to endothelial dysfunction,and to widespread impairment of perfusion or oxygenation in the microvasculature.
In the Beaver Dam cohort discussed above, the trend observed in both simple andcurvature tortuosity was very similar, although increased scatter was observed in the

318 Automated Image Detection of Retinal Pathology
curvature-based parameter, most likely due to noise associated with the measurementof vector derivatives. However, in a study of plus disease in retinopathy of prema-turity (ROP) [70], it was found that measurements of tortuosity based on curvaturegave a more significant association with disease than simple tortuosity. Hence fur-ther work may be warranted to establish the clinical value of alternative quantitativemeasures of microvascular tortuosity.
10.5 Topology of the Vascular TreeThe foregoing discussion has focused on geometrical characteristics of individualvascular segments and bifurcations, but an association has also been found betweenmore global topological characteristics of the retinal vascular arcades and cardiovas-cular health [71].
Branching structures are common in nature, occurring in both geographical and bi-ological phenomena. Some of the earliest work on topology of branching structureswas performed by geographers, and subsequently applied to other branching struc-tures, particularly in biology, such as in the study of dendrites, bronchial airways,and arterial trees. Studies of biological branching trees, particularly from image pro-cessing techniques, can be found widely in the literature, such as coronary arterytrees from X-ray angiograms [72; 73], pulmonary vascular trees from X-ray com-puter tomography [74], and airway trees from computer tomography [75]. However,the topology of retinal vascular trees has been less widely studied.
Vascular trees are branching structures that are typically treated as binary rootedtrees, a special type of graph. A graph is a set of points (or vertices) connected byedges. A tree is a graph with no cycles. A rooted tree is one in which a single vertexis distinguished as the root and a binary tree is one in which at most three edgesare contiguous to any vertex [76]. Figure 10.5(a) shows a retinal vessel tree andFigure 10.5(b) shows its schematic representation as a rooted binary tree graph.
In order to study the global properties of branching structures, it has been usualto group bifurcations into schemes based on their order, or generation. The order isa number assigned to an edge, the value of this number depending on the orderingscheme in use, whereas the generation represents the hierarchical level at which aparticular bifurcation belongs, as in a family tree. The generational representationis found mainly in symmetrical models. Ordering schemes can be either centrifugal,ordering from the root of the tree toward the periphery, or else centripetal, com-mencing at the periphery and progressing toward the root. Some schemes assumeall branches are symmetrical, incorporating diameters and length but not branchingangles, whereas others assume all branches with the same order have the same diam-eter, the same length, and bifurcate with the same asymmetry. This means that someschemes are strictly topological whereas others combine geometry with topology intheir representations.

Analysis of Vascular Branches 319
(a)
Vertex
Internal edgeExternal edge
Root
(b)
FIGURE 10.5(a) Segmented retinal vessel tree and (b) its schematic representation as a rootedbinary tree graph.
The different methods give different assessments of the number of orders. Themore asymmetrical the branching structure, the more critical becomes the choiceof an appropriate ordering scheme. The consensus among geographers has led tothe choice of the Strahler method (1952) by the majority of biologists. Horsfieldand coworkers [77], who have worked extensively on bronchial trees, have adoptedStrahler ordering in their studies, which facilitates comparison of their results withthose of other authors.
Strahler ordering is a centripetal scheme that assigns all external edges (excludingthe root) an order of m = 1. Where two edges of order m come together, the thirdedge is assigned order m+1. Where an edge of order m meets an edge of order n, thethird edge is assigned order max(m,n). This ordering scheme is purely topological,and an example can be found in Figure 10.6(c).
A large amount of work has been done in relating geometrical features such aslengths, diameters, and cross-sectional areas as a function of order or generationin biological branching trees, most commonly those from lungs. A widely adoptedmodel has been the symmetrical model developed by Weibel in 1963, who carried outdetailed measurements of dimensions in casts of both arteries and airways in humanlungs. An alternative classification method, more suited to describe asymmetricaltrees, was developed by Horsfield and Cumming in 1968. They produced a series ofmodels based on their own ordering technique and on the Strahler system [76–78].Further interesting work was performed by Huang et al. [79], in which casts of ar-terial and venous trees from human lungs were prepared and measured. This modelmodified Horsfield’s Strahler ordering scheme, introducing a rule to adjust the orderbased on relative vessel diameters at junctions. Based on experimental and theoret-

320 Automated Image Detection of Retinal Pathology
ical work, other authors have focused their attention on mathematical modeling ofbronchial airways [78] and arterial trees in lungs [80], as well as computer modelsof coronary arterial trees [81]. The latter work sought to optimize the models usingdifferent functional seeds as parameters, and statistical morphometry was employedto characterize anatomical variations.
In the human retina, Schroder [82] developed an interesting description of the mi-crovascular network, including the branching pattern, the number of arterioles andvenules, and the distribution of vessel lengths and diameters per generation. Thestudy was made in vitro from histological preparations of normal human retinas,three days post mortem. The vascular network was recorded through a light mi-croscope onto photomicrographic montages, from which it was possible to dividethe network into dichotomous, asymmetric arteriolar and venular trees. Capillarieswere considered as order 1 using the Strahler method, but the precapillary and post-capillary vessels were not taken into account so as to avoid difficulties arising fromcapillary loops and to facilitate separation of arteriolar from venular trees. Vesseldiameters and lengths were measured directly from the micrographs with a semi-automatic calibrated morphometric analyzer. Vessel length in the microcirculationtypically shows a log-normal distribution, and so median lengths of different or-ders were compared. On the other hand, microvascular diameters typically showan almost symmetrical distribution within each vessel order, and so mean diametervalues were used. Both arterial and venous trees contained 6 Strahler orders, incor-porating 1173 and 507 vessel segments respectively in the largest trees. Their resultsshowed a tendency of vessel segments above the third order to increase progressivelyin length, which was approximated by a second degree polynomial curve. Diametersrose sharply with increasing orders both in arteriolar and venous trees, which wasapproximated by an exponential curve.
The studies mentioned above have generally involved analysis of geometrical fea-tures as a function of the order, across six or more generations. However, retinaltrees from fundus images often show fewer orders than this (sometimes only three),insufficient to allow effective analysis of diameters and lengths as a function of order.For this reason we confine our description here to purely topological indices that cancharacterize retinal vascular trees extracted from clinical fundus images and that maygive us insight into possible changes in the topology associated with cardiovasculardisease.
Some important topological features of a biological branching tree are those de-scribing whether it is unbalanced or elongated, in other words the extent to whichdeviates from a purely dichotomous tree, i.e., one that is perfectly balanced [76].Figures 10.6(a) and (b) show examples of two extreme branching topologies.
The topological indices we list here are the most commonly used indices withinbiological applications [83]:
• Strahler branching ratio (R)
• Maximum tree exterior path length or altitude (A)
• Total exterior path length (Pe)

Analysis of Vascular Branches 321
• Number of external-internal edges (NEI) and the total number of external (orterminal) edges (NT )
• Tree asymmetry index (As).
Further definitions are provided in the following sections.
10.5.1 Strahler branching ratio
The Strahler branching ratio is calculated by ordering all the edges within a giventree using the Strahler ordering scheme. At a given order m, the branching ratio isdefined as
Rm =Nm
Nm+1(10.14)
where N is the number of edges, as shown in Figure 10.6(c).The significance of Rm is that it indicates a degree of topological self-similarity in
the branching structure. This idea has been applied by other authors to investigateregularities corresponding to other geometrical self-similarity, such as
Rd =dm
dm+1; RL =
Lm
Lm+1(10.15)
where d is the mean diameter, L the mean length and m the order.The branching ratio R for the whole tree is typically calculated by taking the an-
tilog of the absolute value of the slope of logNm against m.
10.5.2 Path length
The altitude, A, is defined as the largest external path length, where an external pathlength is the number of edges between the root and the terminal edge. The totalpath length, Pe, is the sum of all the external path lengths. Figure 10.6(d) shows anexample where A = 5 and Pe = 30.
10.5.3 Number of edges
The count of external-internal edges is designated NEI , where an external-internaledge is terminal while its sister is nonterminal. The total count of terminal edges isdesignated NT . In Figure 10.6(e), NEI = 3 and the total number of terminal edges isNT = 7. The number of external-external edges NEE = NT −NEI . It should be notedthat the number of edges is very dependent on the field of view of the image underconsideration.

322 Automated Image Detection of Retinal Pathology
SymmetricCompact
Dichotomous
(a)
HerringboneAsymmetricElongated
(b)
(c) (d) (e)
FIGURE 10.6(a) and (b) two extreme branching topologies, (c) Strahler ordering gives N1 = 7,N2 = 4, and N3 = 2, (d) altitude A = 5 and total path length Pe = 30, and (e) numberof external-internal edges NEI = 3 and total number of terminal edges NT = 7.
10.5.4 Tree asymmetry index
The final index we consider is the tree asymmetry index, As. In order to renderit magnitude independent, it is defined in terms of the total number of segments,N = 2NT −1 and the altitude, A as:
As =N +1−2A
2A−2A. (10.16)
Its value ranges from 0 for a herringbone tree to 1 in a perfectly symmetric case.

Analysis of Vascular Branches 323
10.6 Automated Segmentation and Analysis of Retinal FundusImages
Algorithms have been described earlier that concentrate on measurement of vesseldiameters from a sequence of vessel intensity profiles, but to facilitate topologicalanalysis of the retinal vasculature, an automated approach to segmentation and anal-ysis of the whole vascular network from retinal fundus images is desirable.
Most of the work on segmentation of retinal blood vessels can be categorizedinto three approaches; those based on line or edge detectors with boundary trac-ing [84; 85], those based on matched filters, either 1-D profile matching with vesseltracking and local thresholding [86–89] or 2-D matched filters [90–92], and thosesupervised methods that require manually labeled images for training [93; 94]. How-ever, due to the large regional variations in intensity inherent in retinal images andthe very low contrast between vessels and the background, particularly in red-freephotographs, these techniques have several shortcomings. Techniques based on lineor edge detectors lack robustness in defining blood vessels without fragmentationand techniques based on matched filters are difficult to adapt to the variations ofwidths and orientation of blood vessels. Furthermore, most of these segmentationmethods have been developed to work either on red-free or fluorescein images, butnot on both.
During the last few decades the computer vision and image processing commu-nities have been studying and developing tools to describe image structures at dif-ferent scales. Koenderink [95] advocated deriving a set of images at multiple scalesby a process of diffusion, equivalent to convolution by a family of Gaussian ker-nels, and describing image properties in terms of differential geometric descriptorspossessing invariance properties under certain transformations. Detection of tube-like structure features using multiscale analysis has been carried out by many re-searchers [96–101]. The main principle underlying all of these works was to developa line-enhancement filter based on eigenvalue analysis of the Hessian matrix. Analy-sis of this kind has also been applied previously to optical images and particularly toretinal images [94; 102; 103], to extract the center lines and perform measurementsof diameter using a medialness function.
We present an approach for segmenting blood vessels from fundus images, ratherthan enhancing them, based upon the principles of multiscale differential geome-try in combination with gradient information and a region growing algorithm. Thisalgorithm was originally presented at MICCAII’99 [104], where the segmentationmethod was tested on a small sample of images without validation. As far as we areaware, this was the first reported analysis of this kind applied to retinal images. Anextension of this work [105] reports testing on two local databases and two publicdatabases of complete manually labeled images [92; 94] that have also been used byother authors for the same validation purposes [89; 92; 94]. In addition, validationof diameters and branching angles measured from segmented vessels has also beenpresented [106]. This approach works equally well with both red-free fundus images

324 Automated Image Detection of Retinal Pathology
(a) Original (b) s = 2 (c) s = 8 (d) s = 14
FIGURE 10.7Multiscale convolution outputs for s = 0, 2, 8 and 14 pixels of a portion (720×580pixels) of a negative of a red-free retinal image (2800×2400 pixels).
and fluorescein angiograms.Under the multiscale framework, representation of information at different scales
is achieved by convolving the original image I(x,y) with a Gaussian kernel G(x,y;s)of variance s2:
Is(x,y;s) = I(x,y)⊗G(x,y;s) (10.17)
where G is:
G(x,y;s) =1
2πs2 e−x2+y2
2s2 (10.18)
and s is a length scale factor. The effect of convolving an image with a Gaussiankernel is to suppress most of the structures in the image with a characteristic lengthless than s. Figure 10.7 shows different convolution outputs of a portion of a negativered-free retinal image, for s = 0, 2, 8, and 14 pixels, showing the progressive blurringof the image as the length scale factor increases.
The use of Gaussian kernels to generate multiscale information ensures that theimage analysis is invariant with respect to translation, rotation, and size [95; 107].To extract geometrical features from an image, a framework based on differentia-tion is used. Derivatives of an image can be numerically approximated by a linearconvolution of the image with scale-normalized derivatives of the Gaussian kernel:
δnIs(x,y;s) = I(x,y)⊗ sn
δnG(x,y;s) (10.19)
where n indicates the order of the derivative.
10.6.1 Feature extraction
The first directional derivatives describe the variation of image intensity in the neigh-borhood of a point. Under a multiscale framework, the magnitude of the gradient
|∇Is (s)|=√
(δxIs)2 +(δyIs)
2 (10.20)

Analysis of Vascular Branches 325
0 10 20 30 40 50 60 70 80 90 10050
100
150
Inte
nsity
Red-free vessel profile
(a)
0 10 20 30 40 50 60 70 80 90 100
!30
!20
!10
0
10
pixels
Eigenvalues
!+!!
(b)
FIGURE 10.8(a) Intensity profile across a blood vessel from a negative red-free image and(b) Eigenvalues, λ+ (dash-dot line) and λ− (solid line). Ridges are regions whereλ+ ≈ 0 and λ− 0.
represents the slope of the image intensity for a particular value of the scale parame-ter s.
The second directional derivatives describe the variation in the gradient of inten-sity in the neighborhood of a point. Since vessels appear as ridge-like structures inthe images, we look for pixels where the intensity image has a local maximum in thedirection for which the gradient of the image undergoes the largest change (largestconcavity) [108]. The second derivative information is derived from the Hessian ofthe intensity image I(x,y):
H =(
δxxIs δxyIsδyxIs δyyIs
). (10.21)
Since δxyIs = δyxIs, the Hessian matrix is symmetrical with real eigenvalues and or-thogonal eigenvectors that are rotation invariant. The eigenvalues λ+ and λ−, wherewe take λ+ ≥ λ−, measure convexity and concavity in the corresponding eigendi-rections. Figure 10.8 shows the profile across a negative red-free vessel and thecorresponding eigenvalues of the Hessian matrix, where λ+ ≈ 0 and λ− 0 for pix-els in the vessel. For a negative fluorescein vessel profile, where vessels are darkerthan the background, the eigenvalues are λ− ≈ 0 and λ+ 0 for vessel pixels.

326 Automated Image Detection of Retinal Pathology
In order to analyze both red-free and fluorescein images with the same algorithm,additional features are defined as
λ1 = min(|λ+| , |λ−|) ; λ2 = max(|λ+| , |λ−|) . (10.22)
The maximum eigenvalue λ2, corresponds to the maximum principal curvature ofthe Hessian tensor. Thus, a pixel belonging to a vessel region will be weighted as avessel pixel if λ2 1, for both red-free and fluorescein images.
The features are calculated for all integer values of s, smin ≤ s ≤ smax, wheresmin and smax are fixed a priori according to the approximate sizes of the smallestand largest vessel to be detected in the image, taking into account the pixel reso-lution of the image and the field of view of the fundus camera. The local maximaover the scales (pixel by pixel) is then determined for both measurements of featurestrength [109].
However, an adjustment is required, based on the diameter of the vessel that issought at each scale, since it is found that the local maximum response is muchhigher for large blood vessels than for small ones. This might be expected, particu-larly for maximum principal curvature, since the total amount of blood in the lightpath corresponding to each pixel is greater in large vessels, and is consistent with ob-servations from intensity cross sections that the relative intensity of absorption in ablood column increases with diameter [44]. To account for these effects, a diameter-dependent equalization factor is introduced for both strength features at each scale.Since vessels with diameter d ≈ 2s are most strongly detected when the scale factoris s, each feature is normalized along scales by d and the local maxima are soughtover the scales as follows:
γ = maxs
[|∇Is(s)|
d
]; κ = max
s
[λ2(s)
d
]. (10.23)
Figures 10.9(a) and (b) show the local maxima over the scales after applying thediameter-dependent equalization factor, d, to each scale.
10.6.2 Region growing
The features γ and κ are used to classify pixels in the image into two region classes,either background or vessel, using a multiple pass region growing procedure basedon an iterative relaxation technique. All the parameters used in the region growingare automatically calculated for each image from the histograms of the extractedfeatures.
The algorithm begins by planting seeds for each class based primarily upon themaximum principal curvature, using thresholds determined from the histogram of κ .This gives rise to each pixel being classified initially as either vessel, background,or unknown. After the seeds are planted, growth proceeds iteratively in two stages,based on classification of the 8-neighboring pixels. In the first stage growth is con-strained to regions of low gradient magnitude allowing a relatively broad and fastclassification while suppressing classification in the edge regions where the gradi-ents are large. In the second stage, the classification constraint is relaxed and classes

Analysis of Vascular Branches 327
(a) (b)
(c) (d) (e)
FIGURE 10.9Local maxima responses over the scales for (a) diameter-dependent equalized gra-dient magnitude γ , and (b) diameter-dependent equalized maximum principal cur-vature κ . Region growing algorithm consists of (c) planting seeds (white = vesselseeds, black = background seeds, and gray = unknown pixels) followed by (d) growthrestricted to regions with low gradients, and, finally, (e) growth without the gradientrestriction to define borders between classes.
grow based solely upon κ to allow the definition of borders between regions. Fig-ure 10.9(c) through Figure 10.9(e) illustrate the successive stages of the region grow-ing algorithm. The overall result is an adaptive thresholding that depends on bothspectral and spatial local information.
10.6.3 Analysis of binary images
Following completion of the segmentation process, a semi-automatic labeling of theskeleton trees is performed, followed by an automatic procedure to extract and mea-sure the basic topological and geometrical properties.

328 Automated Image Detection of Retinal Pathology
Labeling of each vascular tree involves three steps; thinning the segmented binaryimage to produce its skeleton, detecting branch and crossing points, and tracking theskeleton of the tree.
The skeleton of the vascular tree is first obtained from the segmented binary imageby a thinning process in which pixels are eliminated from the boundaries towards thecenter without destroying connectivity in an 8-connected scheme. This yields an ap-proximation to the medial axis of the tree. A pruning process is applied to eliminateshort, false spurs, due to small undulations in the vessel boundary. Significant pointsin the skeleton must then be detected and classified as either terminal points, bifurca-tion points, or crossing points. In a first pass, skeleton pixels with only one neighborin a 3×3 neighborhood are labeled as terminal points and pixels with three neighborsare labeled as candidate bifurcation points. Since vessel crossing points appear in theskeleton as two bifurcation points very close to each other, a second pass is made us-ing a fixed size window centered on the candidate bifurcations, and the number ofintersections of the skeleton with the window frame determines whether the point isa bifurcation or a crossing. Finally, each tree is tracked individually, commencing atthe root. When the first bifurcation point is reached the chain of the current branch isended and the coordinates of the starting points of the two daughters are found andsaved. The process is iteratively repeated for every branch of the tree until a terminalpoint is reached and all daughters have been detected and numbered. The completeprocess has been reported by Martinez-Perez et al. [106].
Using the data generated in the labeling stage, the topological parameters de-scribed earlier can be derived. In addition, three types of geometrical features canalso be measured automatically, these being bifurcation angles, together with lengthsand areas of vessel segments. From the latter two items, vessel diameters can be es-timated allowing nondimensional geometrical characteristics described earlier to becalculated, such as bifurcation optimality and length to diameter ratios.
10.7 Clinical Findings from Retinal Vascular TopologyA recent investigation compared the topology and architecture of the retinal mi-crovasculature in 20 normotensive subjects, 20 patients with uncomplicated essentialhypertension (EHT), and 20 patients with malignant phase hypertension (MHT) [71].Digitized red-free monochrome retinal photographs, reduced to 1400x1200 pixels,were analyzed to quantify geometrical and topological properties of arteriolar andvenular trees.
Mean arteriolar LDR was significantly increased in essential hypertensives (p =0.002) and malignant hypertensives (p < 0.001), as shown in Figure 10.10(a), con-sistent with other studies reported earlier. LDR in venules did not differ significantlybetween groups.
Both EHT and MHT were associated with significant changes in arteriolar topol-ogy. EHT and MHT were associated with reductions in NT ; this was most marked in

Analysis of Vascular Branches 329
Normal EHT MHT Normal EHT MHT
LD
R
NT
0
10
20
30
40
50
0
5
10
15
20
25
**
**
**
**
**
(a)
Normal EHT MHT Normal EHT MHT
LD
R
NT
0
10
20
30
40
50
0
5
10
15
20
25
**
**
**
**
**
(b)
FIGURE 10.10(a) Length diameter ratio (LDR) and (b) number of terminal branches (NT ) of ar-terioles (open bars) and venules (filled bars) in normal subjects (Normal), essentialhypertensives (EHT) and malignant hypertensives (MHT). Data are means ±SD,**p < 0.01 by ANOVA and Dunnett’s multiple comparison test. (From Hughes,A.D., Martinez-Perez, M., Jabbar, A.-S., Hassan, A., Witt, N.W., Mistry, P.D., et al.,J. Hypertens. 24, 889, 2006. With permission.)
MHT, as in Figure 10.10(b). Similarly, the total path length was reduced in EHT andsignificantly so in MHT, even after adjustment for NT . Neither EHT nor MHT wereassociated with significant changes in any measure of venular topology after adjust-ment for NT . The symmetry of the arteriolar and venous trees was also unaffectedby either EHT or MHT.
These changes in the arteriolar network topology are indicative of rarefaction andwere exaggerated in MHT. Furthermore, there was also increased venular tortuosityand venular rarefaction in MHT compared with normotensive subjects. This studydemonstrated that hypertension is associated with marked topological alterations inthe retinal vasculature. The use of automated or semi-automated retinal vascularanalyzes should facilitate future investigation of these questions in large populations.
10.8 ConclusionIn this chapter we have presented a growing collection of evidence indicating that al-teration of retinal vascular geometry and topology is not only associated with currentcardiovascular disease, but in fact arises in advance of other clinical indications, andoffers predictive power independent of other recognized risk factors. It may also beof benefit in the clinical assessment of target organ damage in hypertensive patients.
Much of the clinical investigation related to retinal vascular geometry has focusedon hypertension and cardiovascular disease, but less attention so far has been givento other systemic diseases such as diabetes. Early unpublished findings in diabetic
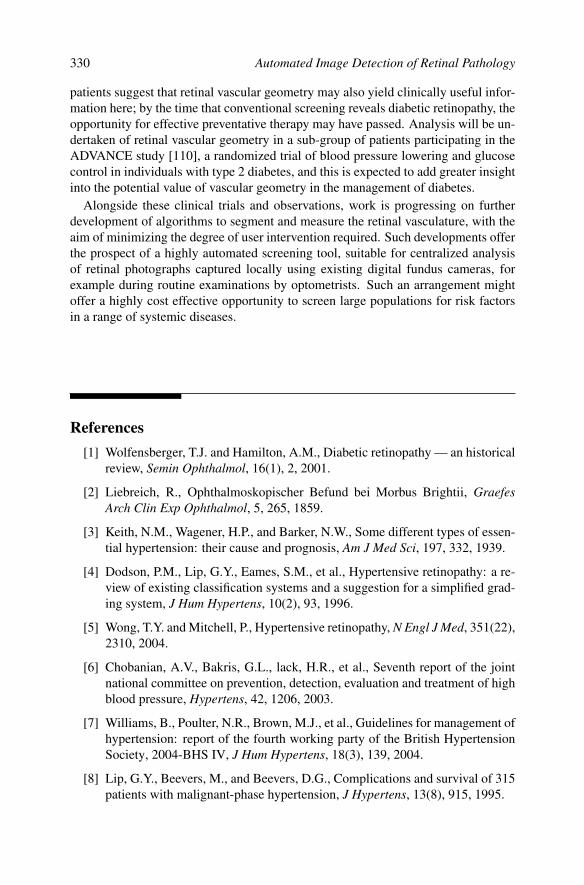
330 Automated Image Detection of Retinal Pathology
patients suggest that retinal vascular geometry may also yield clinically useful infor-mation here; by the time that conventional screening reveals diabetic retinopathy, theopportunity for effective preventative therapy may have passed. Analysis will be un-dertaken of retinal vascular geometry in a sub-group of patients participating in theADVANCE study [110], a randomized trial of blood pressure lowering and glucosecontrol in individuals with type 2 diabetes, and this is expected to add greater insightinto the potential value of vascular geometry in the management of diabetes.
Alongside these clinical trials and observations, work is progressing on furtherdevelopment of algorithms to segment and measure the retinal vasculature, with theaim of minimizing the degree of user intervention required. Such developments offerthe prospect of a highly automated screening tool, suitable for centralized analysisof retinal photographs captured locally using existing digital fundus cameras, forexample during routine examinations by optometrists. Such an arrangement mightoffer a highly cost effective opportunity to screen large populations for risk factorsin a range of systemic diseases.
References[1] Wolfensberger, T.J. and Hamilton, A.M., Diabetic retinopathy — an historical
review, Semin Ophthalmol, 16(1), 2, 2001.
[2] Liebreich, R., Ophthalmoskopischer Befund bei Morbus Brightii, GraefesArch Clin Exp Ophthalmol, 5, 265, 1859.
[3] Keith, N.M., Wagener, H.P., and Barker, N.W., Some different types of essen-tial hypertension: their cause and prognosis, Am J Med Sci, 197, 332, 1939.
[4] Dodson, P.M., Lip, G.Y., Eames, S.M., et al., Hypertensive retinopathy: a re-view of existing classification systems and a suggestion for a simplified grad-ing system, J Hum Hypertens, 10(2), 93, 1996.
[5] Wong, T.Y. and Mitchell, P., Hypertensive retinopathy, N Engl J Med, 351(22),2310, 2004.
[6] Chobanian, A.V., Bakris, G.L., lack, H.R., et al., Seventh report of the jointnational committee on prevention, detection, evaluation and treatment of highblood pressure, Hypertens, 42, 1206, 2003.
[7] Williams, B., Poulter, N.R., Brown, M.J., et al., Guidelines for management ofhypertension: report of the fourth working party of the British HypertensionSociety, 2004-BHS IV, J Hum Hypertens, 18(3), 139, 2004.
[8] Lip, G.Y., Beevers, M., and Beevers, D.G., Complications and survival of 315patients with malignant-phase hypertension, J Hypertens, 13(8), 915, 1995.

Analysis of Vascular Branches 331
[9] Wong, T.Y., Klein, R., Klein, B.E.K., et al., Retinal microvascular abnormali-ties and their relationship with hypertension, cardiovascular disease, and mor-tality, Surv Ophthalmol, 46(1), 59, 2001.
[10] Klein, R., Klein, B.E.K., and Moss, S.E., The relation of systemic hyperten-sion to changes in the retinal vasculature: the Beaver Dam Eye Study, TransAm Ophthalmol Soc, 95, 329, 1997.
[11] Wang, J.J., Mitchell, P., Leung, H., et al., Hypertensive retinal vessel wallsigns in a general older population: the Blue Mountains Eye Study, Hypertens,42(4), 534, 2003.
[12] Wong, T.Y., Klein, R., Klein, B.E.K., et al., Retinal vessel diameters and theirassociations with age and blood pressure, Invest Ophthalmol Vis Sci, 44(11),4644, 2003.
[13] Wong, T.Y., Hubbard, L.D., Klein, R., et al., Retinal microvascular abnormal-ities and blood pressure in older people: the Cardiovascular Health Study, BrJ Ophthalmol, 86(9), 1007, 2002.
[14] Klein, R., Sharrett, A.R., Klein, B.E., et al., Are retinal arteriolar abnormal-ities related to atherosclerosis?: The Atherosclerosis Risk in CommunitiesStudy, Arterioscler Thromb Vasc Biol, 20(6), 1644, 2000.
[15] Couper, D.J., Klein, R., Hubbard, L.D., et al., Reliability of retinal photogra-phy in the assessment of retinal microvascular characteristics: the Atheroscle-rosis Risk in Communities Study, Am J Ophthalmol, 133(1), 78, 2002.
[16] Cuspidi, C., Meani, S., Valerio, C., et al., Prevalence and correlates of ad-vanced retinopathy in a large selected hypertensive population. The evaluationof target organ damage in hypertension (ETODH) study, Blood Press, 14(1),25, 2005.
[17] Dimmitt, S.B., West, J.N., Eames, S.M., et al., Usefulness of ophthalmoscopyin mild to moderate hypertension, Lancet, 1(8647), 1103, 1989.
[18] van den Born, B.J., Hulsman, C.A., Hoekstra, J.B., et al., Value of rou-tine funduscopy in patients with hypertension: systematic review, Br Med J,331(7508), 73, 2005.
[19] Fong, D.S., Aiello, L., Gardner, T.W., et al., Retinopathy in diabetes, DiabetesCare, 27(Suppl 1), S84, 2004.
[20] Kearney, P.M., Whelton, M., Reynolds, K., et al., Global burden of hyperten-sion: analysis of worldwide data, Lancet, 365(9455), 217, 2005.
[21] World Health Organisation, The world health report 2002: reducing risks,promoting healthy life, 2002.
[22] Lewington, S., Clarke, R., Qizilbash, N., et al., Age-specific relevance of usualblood pressure to vascular mortality: a meta-analysis of individual data for one

332 Automated Image Detection of Retinal Pathology
million adults in 61 prospective studies, Lancet, 360(9349), 1903, 2002.
[23] Arnold, J.V., Gates, J.W.C., and Taylor, K.M., Possible errors in the measure-ment of retinal lesions, Invest Ophthalmol Vis Sci, 34, 2576, 1993.
[24] Wong, T.Y., Wang, J.J., Rochtchina, E., et al., Does refractive error influ-ence the association of blood pressure and retinal vessel diameters? The BlueMountains Eye Study, Am J Ophthalmol, 137, 1050, 2004.
[25] Stokoe, N.L. and Turner, R.W.D., Normal retinal vascular pattern. Arteriove-nous ratio as a measure of arterial calibre, Br J Ophthalmol, 50, 21, 1966.
[26] Parr, J.C. and Spears, G.F.S., Mathematic relationships between the width of aretinal artery and the widths of its branches, Am J Ophthalmol, 77, 478, 1974.
[27] Parr, J.C. and Spears, G.F.S., General calibre of the retinal arteries expressedas the equivalent width of the central retinal artery, Am J Ophthalmol, 77, 472,1974.
[28] Hubbard, L.D., Brothers, R.J., King, W.N., et al., Methods for evaluation ofretinal microvascular abnormalities associated with hypertension/sclerosis inthe Atherosclerosis Risk in Communities Study, Ophthalmology, 106, 2269,1999.
[29] Murray, C.D., The physiological principle of minimum work: the vascularsystem and the cost of blood volume, Proc Natl Acad Sci USA, 12, 207, 1926.
[30] Murray, C.D., The physiological principle of minimum work applied to theangle of branching of arteries, J Gen Physiol, 9, 835, 1926.
[31] Sherman, T.F., On connecting large vessels to small. The meaning of Murray’slaw, J Gen Physiol, 78, 431, 1981.
[32] LaBarbera, M., Principles of design of fluid transport systems in zoology,Science, 249(4972), 992, 1990.
[33] Hutchins, G.M., Miner, M.M., and Boitnott, J.K., Vessel caliber and branchangle of human coronary artery branch points, Circ Res, 38, 572, 1976.
[34] Zamir, M., Optimality principles in arterial branching, J Theor Biol, 62, 227,1976.
[35] Zamir, M., Nonsymmetrical bifurcations in arterial branching, J Gen Physiol,72, 837, 1978.
[36] Zamir, M., Medeiros, J.A., and Cunningham, T.K., Arterial bifurcations in thehuman retina, J Gen Physiol, 74, 537, 1979.
[37] Woldenberg, M.J. and Horsfield, K., Relation of branching angles to optimal-ity for four cost principles, J Theor Biol, 122, 187, 1986.
[38] Griffith, T.M., Edwards, D.H., Davies, R.L., et al., EDRF coordinates thebehaviour of vascular resistance vessels, Nature, 329, 442, 1987.

Analysis of Vascular Branches 333
[39] Chapman, N., Baharudin, S., King, L., et al., Acute effects of L-NMMA onthe retinal arteriolar circulation in man, J Hum Hypertens, 14, 841, 2000.
[40] McLenachan, J.M., Williams, J.K., Fish, R.D., et al., Loss of flow-mediated endothelium-dependent dilation occurs early in the development ofatherosclerosis, Circ, 84, 1273, 1991.
[41] Witt, N., Wong, T.Y., Hughes, A.D., et al., Abnormalities of retinal microvas-cular structure and risk of mortality from ischemic heart disease and stroke,Hypertension, 47, 975, 2006.
[42] Struijker-Boudier, H.A.J., le Noble, J.L.M.L., Messing, M.W.J., et al., Themicrocirculation and hypertension, J Hypertens, 10(Suppl 7), S147, 1992.
[43] Hart, W.E., Goldbaum, M., Cote, B., et al., Measurement and classification ofretinal vascular tortuosity, Int J Med Inform, 53, 239, 1999.
[44] Brinchmann-Hansen, O. and Engvold, O., Microphotometry of the bloodcolumn and the light streak on retinal vessels in fundus photographs, ActaOpthalmologica, Suppl 179, 9, 1986.
[45] Chapman, N., Witt, N., Gao, X., et al., Computer algorithms for the automatedmeasurement of retinal arteriolar diameters, Br J Ophthalmol, 85, 74, 2001.
[46] Gao, X., Bharath, A.A., Hughes, A.J., et al., Towards retinal vessel parame-terization, Proc SPIE, 3034, 734, 1997.
[47] Brinchmann-Hansen, O. and Heier, H., Theoretical relations between lightstreak characteristics and optical properties of retinal vessels, Acta Opthalmo-logica, Suppl 179, 33, 1986.
[48] Brinchmann-Hansen, O. and Engvold, O., The light streak on retinal vessels.I. A theoretical modelling of the reflex width, Acta Opthalmologica, Suppl179, 38, 1986.
[49] Brinchmann-Hansen, O. and Engvold, O., The light streak on retinal vessels.II. A theoretical modelling of the reflex intensity, Acta Opthalmologica, Suppl179, 46, 1986.
[50] Press, W.H., Teukolsky, S.A., Vetterling, W.T., et al., Numerical Recipes in C— The art of scientific computing, Cambridge University Press, Cambridge,2nd ed., 1997.
[51] King, L.A., Stanton, A.V., Sever, P.S., et al., Arteriolar length-diameter (L:D)ratio: a geometric parameter of the retinal vasculature diagnostic of hyperten-sion, J Human Hypertens, 10, 417, 1996.
[52] Stanton, A.V., Wasan, B., Cerutti, A., et al., Vascular network changes in theretina with age and hypertension, J Hypertens, 13(12 Pt2), 1724, 1995.
[53] Egashira, K., Inou, T., Hirooka, Y., et al., Effects of age on endothelium-dependent vasodilation of resistance coronary artery by acetylcholine in hu-

334 Automated Image Detection of Retinal Pathology
mans, Circ, 88, 77, 1993.
[54] Chapman, N., Mohamudally, A., Cerutti, A., et al., Retinal vascular networkarchitecture in low-birth-weight men, J Hypertens, 15(12 Pt1), 1449, 1997.
[55] Barker, D.J.P., Osmond, C., Golding, J., et al., Growth in utero, blood pressurein childhood and adult life, and mortality from cardiovascular disease, Br MedJ, 298, 564, 1989.
[56] Law, C.M. and Shiell, A.W., Is blood pressure inversely related to birth-weight? The strength of evidence from a systematic review of the literature, JHypertens, 14, 935, 1996.
[57] Curhan, G.C., Willet, W., Rimm, E.B., et al., Birth weight and adult hyperten-sion and diabetes mellitus in U.S. men, Am J Hypertens, 9(4 Suppl 1), 11A,1996.
[58] Poulter, N., Chang, C.L., McGregor, A., et al., Differences in birth weightbetween twins and subsequent differences in blood pressure levels, J HumanHypertens, 12(11), 792, 1998.
[59] Chapman, N., Dell’omo, G., Sartini, M.S., et al., Peripheral vascular disease isassociated with abnormal diameter relationships at bifurcations in the humanretina, Clinical Science, 103, 111, 2002.
[60] The ARIC Investigators, The Atherosclerosis Risk in Communities (ARIC)study: design and objectives, Am J Epidemiol, 129, 687, 1989.
[61] Klein, R., Klein, B.E.K., Linton, K.L.P., et al., The Beaver Dam Eye Study:visual acuity, Ophthalmology, 98, 1310, 1991.
[62] Wong, T.Y., Klein, R., Sharrett, A.R., et al., Retinal arteriolar diameter andrisk for hypertension, Ann Intern Med, 140, 248, 2004.
[63] Wong, T.Y., Shankar, A., Klein, R., et al., Prospective cohort study of retinalvessel diameters and risk of hypertension, Br Med J, 329, 79, 2004.
[64] Wong, T.Y., Klein, R., Couper, D.J., et al., Retinal microvascular abnormal-ities and incident stroke: the Atherosclerosis Risk in Communities Study,Lancet, 358(9288), 1134, 2001.
[65] Wong, T.Y., Klein, R., Sharrett, A.R., et al., Retinal arteriolar narrowing andrisk of coronary heart diseases in men and women: the Atherosclerosis Riskin Communities Study, JAMA, 287, 1153, 2002.
[66] Wong, T.Y., Klein, R., Sharrett, A.R., et al., Retinal arteriolar narrowing andrisk of diabetes mellitus in middle-aged persons, JAMA, 287, 2528, 2002.
[67] Wong, T.Y., Klein, R., Nieto, F.J., et al., Retinal microvascular abnormalitiesand 10-year cardiovascular mortality: a population based case-control study,Ophthalmology, 110, 933, 2003.

Analysis of Vascular Branches 335
[68] Wong, T.Y., Knudtson, M.D., Klein, R., et al., A prospective cohort study ofretinal arteriolar narrowing and mortality, Am J Epidemiol, 159, 819, 2004.
[69] Michelson, E.L., Morganroth, J., Nichols, C.W., et al., Retinal arteriolarchanges as an indicator of coronary artery disease, Arch Intern Med, 139,1139, 1979.
[70] Gelman, R., Martinez-Perez, M.E., Vanderveen, D.K., et al., Diagnosis of Plusdisease in retinopathy of prematurity using retinal image multi-scale analysis,Invest Ophthalmol Vis Sci, 46, 4734, 2005.
[71] Hughes, A.D., Martinez-Perez, M.E., Jabbar, A.S., et al., Quantification oftopological changes in retinal vascular architecture in essential and malignanthypertension, J Hypertens, 24(5), 889, 2006.
[72] Ezquerra, N., Capell, S., Klein, L., et al., Model-guided labeling of coronarystructure, IEEE Trans Med Imag, 17, 429, 1998.
[73] Harris, K., Efstratiadis, S.N., Maglaveras, N., et al., Model-based morpho-logical segmentation and labeling of coronary angiograms, IEEE Trans MedImag, 18, 1003, 1999.
[74] Williams, J. and Wolff, L., Analysis of the pulmonary vascular tree using dif-ferential geometry-based vector fields, Comp Vis Image Und, 65, 226, 1997.
[75] Sauret, V., Goatman, K.A., Fleming, J.S., et al., Semi-automatic tabulation ofthe 3D topology and morphology of branching networks using CT: applicationto the airway tree, Phys Med Biol, 44, 1625, 1999.
[76] MacDonald, N., Trees and Networks in Biological Models, John Wiley &Sons, New York, 1983.
[77] Horsfield, K., Relea, F.G., and Cumming, G., Diameter, length and branchingratios in the bronchial tree, Resp Physiol, 26, 351, 1976.
[78] Phillips, C.G., Kaye, S.R., and Schroter, R.C., Diameter-based reconstructionof the branching pattern of the human bronchial tree. Part I. Description andapplication, Resp Physiol, 98, 193, 1994.
[79] Huang, W., Yen, R.T., McLaurine, M., et al., Morphometry of the humanpulmonary vasculature, J Appl Physiol, 81(5), 2123, 1996.
[80] Dawson, C.A., Krenz, G.S., Karau, K.L., et al., Structure-function relation-ships in the pulmonary arterial tree, J Appl Physiol, 86(2), 569, 1999.
[81] Schreiner, W., Neumann, F., Neumann, M., et al., Anatomical variability andfuntional ability of vascular trees modeled by constrained constructive opti-mization, J Theor Biol, 187, 147, 1997.
[82] Schroder, S., Brab, M., Schmid-Schonbein, G.W., et al., Microvascular net-work topology of the human retinal vessels, Fortschr Ophthalmol, 87, 52,1990.

336 Automated Image Detection of Retinal Pathology
[83] Berntson, G.M., The characterization of topology: a comparison of four topo-logical indices for rooted binary trees, J Theor Biol, 177, 271, 1995.
[84] Akita, K. and Kuga, H., A computer method of understanding ocular fundusimages, Pattern Recogn, 15, 431, 1982.
[85] Wu, D.C., Schwartz, B., Schwoerer, J., et al., Retinal blood vessel widthmeasured on color fundus photographs by image analysis, Acta OphthalmolScand, Suppl 215, 33, 1995.
[86] Zhou, L., Rzeszotarski, M.S., Singerman, L.J., et al., The detection and quan-tification of retinopathy using digital angiograms, IEEE Trans Med Imag, 13,619, 1994.
[87] Tolias, Y.A. and Panas, S.M., A fuzzy vessel tracking algorithm for retinalimages based on fuzzy clustering, IEEE Trans Med Imag, 17, 263, 1998.
[88] Gao, X., Bharath, A., Stanton, A., et al., Quantification and characterisationof arteries in retinal images, Comput Meth Prog Biomed, 63(2), 133, 2000.
[89] Jiang, X. and Mojon, D., Adaptive local thresholding by verification-basedmultithreshold probing with application to vessel detection in retinal images,IEEE Trans Pattern Anal Mach Intell, 25, 131, 2003.
[90] Chaudhuri, S., Chatterjee, S., Katz, N., et al., Detection of blood vessels inretinal images using two-dimensional matched filters, IEEE Trans Med Imag,8, 263, 1989.
[91] Zana, F. and Klein, J.C., Robust segmentation of vessels from retinal angiog-raphy, in Proc 13th Int Conf Digital Signal Processing, Santorini, Greece,1997, vol. 2, 1087–90.
[92] Hoover, A., Kouznetsova, V., and Goldbaum, M., Locating blood vessels inretinal images by piecewise threshold probing of a matched filter response,IEEE Trans Med Imag, 19, 203, 2000.
[93] Sinthanayothin, C., Boyce, J.F., Cook, H.L., et al., Automated localisationof the optic disc, fovea and retinal blood vessels from digital colour fundusimages, Br J Ophthalmol, 83, 902, 1999.
[94] Staal, J., Abramoff, M.D., Niemeijer, M., et al., Ridge-based vessel segmen-tation in color images of the retina, IEEE Trans Med Imag, 23, 501, 2004.
[95] Koenderink, J.J., The structure of images, Biol Cybern, 50, 363, 1984.
[96] Koller, T.M., Gerig, G., Szekely, G., et al., Multiscale detection of curvilin-ear structures in 2D and 3D image data, in Fifth International Conference onComputer Vision, 1995, 864–69.
[97] Lorenz, C., Carlsen, I.C., Buzug, T.M., et al., Multi-scale line segmentationwith automatic estimation of width, contrast and tangential direction in 2D and3D medical images, in Proc CVRMed-MRCAS’97, J. Troccaz, E. Grimson,

Analysis of Vascular Branches 337
and R. Mosges, eds., 1997, vol. 1205 of Lecture Notes in Computer Science,233–242.
[98] Sato, Y., Nakajima, S., Atsumi, H., et al., 3D multi-scale line filter for seg-mentation and visualization of curvilinear structures in medical images, inCVRMed-MRCAS’97, J. Troccaz, E. Grimson, and R. Mosges, eds., 1997,vol. 1205 of Lecture Notes in Computer Science, 213–222.
[99] Frangi, A.F., Niessen, J.W., Vincken, K.L., et al., Multiscale vessel enhance-ment filtering., in Medical Image Computing and Computer-Assisted Inter-vention MICCAI’98, W.M. Wells, A. Colchester, and D. S., eds., Springer,1998, vol. 1496 of Lecture Notes in Computer Science, 130–7.
[100] Krissian, K., Malandain, G., Ayache, N., et al., Model-based detection oftubular structures in 3D images, Computer Vision and Image Understanding,80(2), 130, 2000.
[101] Aylward, S.R. and Bullitt, E., Initialization, noise, singularities, and scale inheight ridge traversal for tubular objects centerline extraction, IEEE TransMed Imag, 21(2), 61, 2002.
[102] Jomier, J., Wallace, D.K., and Aylward, S.R., Quantification of retinopathyof prematurity via vessel segmentation, in Medical Image Computing andComputer-Assisted Intervention (MICCAI’03), 2003, vol. 2879 of LectureNotes in Computer Science, 620–626.
[103] Sofka, M. and Stewart, C.V., Retinal vessel centerline extraction using multi-scale matched filters, confidence and edge measures, IEEE Trans Med Imag,25(12), 1531, 2006.
[104] Martinez-Perez, M.E., Hughes, A.D., Stanton, A.V., et al., Retinal bloodvessel segmentation by means of scale-space analysis and region growing,in Medical Image Computing and Computer-Assisted Intervention (MIC-CAI’99), 1999, vol. 1679 of Lecture Notes in Computer Science, 90–97.
[105] Martinez-Perez, M.E., Hughes, A.D., Thom, S.A., et al., Segmentation ofblood vessels from red-free and fluorescein retinal images, Med Image Anal,11(1), 47, 2007.
[106] Martinez-Perez, M.E., Hughes, A.D., Stanton, A.V., et al., Retinal vasculartree morphology: a semi-automatic quantification, IEEE Trans Biomed Eng,49(8), 912, 2002.
[107] Witkin, A.P., Scale-space filtering: a new apporach to multi-scale description,in Image Understanding, S. Ullman and W. Richards, eds., Ablex PublishingCo., Norwood, NJ, 79–95, 1984.
[108] Eberly, D., Ridges in Image and Data Analysis, Computational Imaging andVision, Kluwer Academic, Netherlands, 1996.
[109] Lindeberg, T., On scale selection for differential operators, in Proc 8th Scan-

338 Automated Image Detection of Retinal Pathology
dinavian Conference on Image Analysis, K. Heia, K.A. Hogdra, and B. B.,eds., Tromso, Norway, 1993, vol. 2, 857–866.
[110] Stolk, R.P., Vingerling, J.R., Cruickshank, J.K., et al., Rationale and designof the AdRem study: evaluating the effects of blood pressure lowering andintensive glucose control on vascular retinal disorders in patients with type 2diabetes mellitus, Contemp Clin Trials, 28, 6, 2007.

11Tele-Diabetic Retinopathy Screening andImage-Based Clinical Decision Support
Kanagasingam Yogesan, Fred Reinholz, and Ian J. Constable
CONTENTS
11.1 Introduction . . . . . . . . . . . . . . . . . . . . . . . . . . . . . . . . . . . . . . . . . . . . . . . . . . . . . . . . . . . . . . . 33911.2 Telemedicine . . . . . . . . . . . . . . . . . . . . . . . . . . . . . . . . . . . . . . . . . . . . . . . . . . . . . . . . . . . . . . 33911.3 Telemedicine Screening for Diabetic Retinopathy . . . . . . . . . . . . . . . . . . . . . . . . . 34411.4 Image-Based Clinical Decision Support Systems . . . . . . . . . . . . . . . . . . . . . . . . . . . 34611.5 Conclusion . . . . . . . . . . . . . . . . . . . . . . . . . . . . . . . . . . . . . . . . . . . . . . . . . . . . . . . . . . . . . . . . 347
References . . . . . . . . . . . . . . . . . . . . . . . . . . . . . . . . . . . . . . . . . . . . . . . . . . . . . . . . . . . . . . . . 348
11.1 IntroductionTelemedicine services such as specialist referral services, patient consultation, re-mote patient monitoring, medical education, and consumer medical and health infor-mation use provide major benefits to health systems. Telemedicine services reducehealth care costs and enables early detection of blinding eye conditions, e.g., dia-betic retinopathy. Several feasibility studies of telemedicine screening for diabeticretinopathy have been reported. These studies demonstrate the enormous usefulnessof the technology for the communities living in rural and remote areas. In combi-nation with automated image analysis tools and clinical decision support systems,telemedicine could provide widespread screening with the help of less expensivestaff and empower local clinicians in the decision making process for eye conditions.
11.2 TelemedicineWith an increasing population it is a challenge to provide specialist health care toall. The advent of telemedicine has opened new vistas in patient care and disease
339

340 Automated Image Detection of Retinal Pathology
management. Telemedicine means exchange of clinical data via communication net-works to improve patient care. Application of telemedicine in ophthalmology andteleophthalmology has already become a common tool in mainstream eye care de-livery in many countries [1]. Telemedicine service delivery offers a number of sig-nificant advantages over conventional face-to-face consultations. Major benefits oftelemedicine are: (1) service access can be improved considerably in remote areas,(2) telemedicine is cost effective due to reduction in patient or staff transfers [2],(3) patients have the benefit of receiving treatment where they live without travel-ling, and (4) training of local medical officers and nurses to gain knowledge abouteye diseases and diagnosis.
There are two modes of delivery in telemedicine. One is real-time video confer-encing, which is widely used for emergency and psychiatry consultations. Real-timeconsultations require high-bandwidth and scheduling. They need both clinician andpatient to be present at the same time. This may be not possible in the case of spe-cialists like ophthalmologists. In ophthalmology, high-resolution color images arerequired to capture the fine detail in the eye. Image files can be large and transmissionof these high-resolution images can be time intense. Therefore, teleophthalmologyis normally not suitable for video conferencing.
The second mode is called store-and-forward, where images are captured, com-pressed, and stored in the computer for transmission at a later stage. This is a cost-effective mode that utilizes low bandwidth (Internet) and can send high resolutionimages. Ophthalmology is an image-based diagnostic field, and most of the diseasescan be identified from retinal and anterior segment images. Therefore, specialistophthalmic care can be easily delivered using the store-and-forward method.
11.2.1 Image capture
One of the procedures of the store-and-forward method is image capture. It is themost important part of the system. There are three different imaging devices, namelythe slitlamp, fundus camera, and ophthalmoscope, to image the anterior segment andretina. Corneal opacification from trachomatous scarring, vitamin A deficiency, in-juries, or bacterial and viral keratitis can be readily imaged using a video slitlampbiomicroscope or external macro-photography. Cataract can also be documentedby each of these methods, or by the use of more complicated photographic systems.Glaucomatous cupping of the optic disc can be detected by standard ophthalmoscopy,fundus photography, and stereo fundus photographic systems or by scanning laserophthalmoscopy [3; 4]. Diabetic retinopathy is detected by slitlamp biomicroscopywith a fundus lens (+78 to +90D), fundus photography (large or small pupil instru-ments), or by conventional ophthalmoscopy. The relative efficacy of these methodshas been examined in several field trials [5; 6]. Each examination method has ad-vantages and disadvantages related to portability, cost of equipment, ability to obtainhard copy or digitized records, resolution of images, and ease of use. There are other,more advanced but also very expensive imaging devices such as OCT (Optical Co-herent Tomography) and SLO (Scanning Laser Ophthalmoscope) to study the retina.These devices are limited to major eye clinics.

Tele-Diabetic Retinopathy Screening 341
Table 11.1: Camera Pixel Number Required to Resolve Detail ofVarious Resolutions at the Retina
Resolution (µm) Pixel number (megapixels)30° FOV 50° FOV
3.5 (Sparrow limit) 12 324.5 (Rayleigh criterion) 7 2010 (Typical photographic
fundus camera resolution) 1.5 4.520 0.4 1
11.2.2 Image resolution
Image resolution, which impacts on image quality, is very important for the diagnosisof eye conditions. Poor quality images may lead to poor diagnosis. The resolutionof any optical instrument is defined as the shortest distance between two points ona specimen that can still be distinguished as separate entities, first by the opticalcamera system and second by the observer. The pixelated camera sensor samplesthe continuous optical images of the retina that the human ocular system and opticalcomponents form on the surface of the sensor. For both, the optical image formationand the periodic sampling at discrete points in time and space, there are well estab-lished theories that describe the dependence of the achievable resolution on myriadsof imaging conditions and parameters (such as wavelength, illumination or imag-ing cone, spatial or temporal cut-off frequencies, signal-to-noise ratio, and signalstrengths).
It is an important design consideration for ophthalmoscopic instruments to matchthe optical and the digital resolutions. If the digital resolution is too small, then in-formation may be lost. On the other hand, an increase in digital resolution abovethe optimum value will not improve the definition of the image. However, the dis-advantages are: (1) a sensor with a larger pixel number is more expensive; (2) thelight sensed per pixel is less, which gives rise to more noise in the image; and (3) theimage file size increases, making it more time consuming to process and transmit thefile.
Due to considerations for eye safety (maximum permissible exposure) and pa-tient comfort the power of the illuminating light is restricted to certain upper limits,depending on wavelengths and exposure time. As a consequence, the informationbeing reflected off the retina containing light is very weak. Or in other words, thenumber of signal photons arriving at the sensor for detection is small. This, togetherwith the inherent shot noise (Poisson statistics) of light bursts, limits the number ofdistinguishable grey levels in digital ophthalmic instruments. A dynamic range of8-bit in each color band is therefore more than sufficient for the presentation of suchimages to ophthalmologists or for quantitative data analyses.
In Table 11.1, the required digital image resolution (pixel number) of the camera isgiven in terms of the desired retinal feature size to be resolved (the smallest value of3.5 µm results from the maximum obtainable optical resolution with normal human

342 Automated Image Detection of Retinal Pathology
eyes) and the field of view (FOV). As can be seen, a 7 megapixel camera allows adiagnostic resolution similar to that of a photographic-based fundus camera with a50° field of view. The smallest lesions are microaneurysms with the size varyingfrom 10 to 25 µm in diameter [7]. If a camera achieves this resolution or better thenit can be suitable for diabetic retinopathy screenings.
11.2.3 Image transmission
Digital high resolution images require substantial storage space (> 3 MB) and thetransmission of these images over the Internet can be time consuming. The conven-tional telephone line with a maximum speed of 56 000 bits per second takes 140 sec-onds to send a 1 megabyte image. But a high speed Internet connection such as DSL(digital subscriber line) needs only 1 second to send a 1 megabyte image. Presently,high speed broadband connections are widely used at homes. The most commonbroadband connection is called ADSL (asymmetric digital subscriber line). ADSLoperates over the existing telephone line without interfering with the normal tele-phone line. There are two speeds involved with broadband. One is download speed— this is the speed at which information is received. The other is called the up-load speed — this is the speed at which information is sent from your computer.The standard ADSL connection provides speeds from 256 to 8000 kbps. Therefore,the time to send images is becoming less significant. However, this can still be anissue if large numbers of images or videos are to be transmitted for telemedicinepurposes.
A feasibility study of teleophthalmology by Chen et al. [8] indicated that im-age transmission via ADSL communication was not stable and required resendingof digital images in 88% of the cases (required five or fewer attempts at transmis-sion). The authors indicated that they used JPEG compression ratio of 20:1 for fun-dus photographs with an average transmission time of around 60 to 90 seconds perpatient.
In another study [9] of Web-based real-time telemedicine consultation over cableconnection, ADSL and VDSL (very high speed digital subscriber line), concludedthat ADSL may be not sufficient for use as a real-time transmission line of tele-medicine data. The study recommended a VDSL line for both transmitting and re-ceiving units.
11.2.4 Image compression
Image compression techniques are commonly used in telemedicine systems to in-crease the transmission speed and also to reduce the storage space. Image compres-sion can be lossy or lossless. The lossless techniques allow perfect reconstruction ofthe original images but yield modest compression rates. However, lossy compres-sion provides higher compression rates at the expense of some information loss fromthe original image when it is reconstructed. Loss of information may lead to wrong

Tele-Diabetic Retinopathy Screening 343
interpretation of the images. This is critical in the case of retinal images where smallpathologies (microaneurysms) provide significant information about disease.
In one of our previous studies [10] we have compared the effect of two com-monly used compression algorithms, JPEG (Joint Photographic Experts Group) andWavelet, on the quality of the retinal images. We investigated the effect of digitalcompression and the level of compression tolerable. The quality of the retinal imageswas assessed by both objective (root mean square error) and subjective methods (byfour ophthalmologists). Our results indicated that both JPEG and Wavelet compres-sion techniques are suitable for compression of retinal images. Wavelet compressionof a 1.5 MB image to 15 kB (compression ratio of 100:1) was recommended whentransmission time and costs are considered. The computational time for Wavelet wascomparably longer than for JPEG. JPEG compression of a 1.5 MB image to 29 kB(compression ratio of 71:1) was a good choice when compatibility and/or computa-tional time were issues.
In another study, Basu et al. [11] evaluated the JPEG compression technique onimages obtained from diabetic retinopathy screenings. An objective assessment wascarried out by counting the lesions in compressed and original images (compressedat four different compression levels). They concluded that compression ratios of 20:1to 12:1 with file sizes of 66–107 kB (original image size 1.3 MB) are acceptable fordiabetic retinopathy screenings.
Baker et al. [12] studied the effect of JPEG compression of stereoscopic imageson the diagnosis of diabetic retinopathy. The retinal images (original image size6 MB) from 20 patients with type 2 diabetes mellitus were compressed at two differ-ent compression ratios, 55:1 and 113:1 (file size of less than 110 kB). The outcomeof their study showed that JPEG compression at ratios as high as 113:1 did not sig-nificantly influence the identification of specific diabetic retinal pathology, diagnosisof level of retinopathy, or recommended follow-up. This study demonstrated thatJPEG compression could be successfully utilized in a teleophthalmology system forthe diagnosis of diabetic retinopathy.
Lee et al. [13] have studied the effects of image compression for drusen identifi-cation and quantification. They concluded that JPEG compression ratio of 30:1 maybe suitable for archiving and telemedicine application. A group from the Nether-lands [14] studied the influence of JPEG compression on diagnosis of diabetic retino-pathy using two-field digital images. Using JPEG compression ratio of 30:1, theyobtained a sensitivity of 0.72 to 0.74 and specificity of 0.93 to 0.98 for the detec-tion of vision threatening diabetic retinopathy. The original TIFF (tagged image fileformat) images gave a sensitivity of 0.86 to 0.92 and specificity of 0.93. The groupconcluded that the compression of digital images could influence the detection ofdiabetic retinopathy.
It is evident from these studies that the JPEG compression algorithm may be suit-able for use in teleophthalmology systems for the diagnosis of diabetic retinopathy.The JPEG compression ratios in the order of 50:1 can reduce the image file size from6 MB to around 100 kB in order to obtain real-time transmission of images over astandard modem.

344 Automated Image Detection of Retinal Pathology
11.3 Telemedicine Screening for Diabetic RetinopathyDiabetic eye disease is the most common cause of new cases of blindness in the West-ern world [15]. About one-third of diabetics have diabetic retinopathy at any giventime point and nearly all will develop it within 20 years after diagnosis. The earliestclinical indication (nonproliferative stage) can be microaneurysms (MA), hemor-rhages, hard exudates, cotton wool spots, intraretinal microvascular abnormalities,and venous beading. It is important to note that early stages of diabetic retinopa-thy are asymptomatic but they are the prelude to the sight-threatening complications.The outcome of treatment for diabetic retinopathy depends on the timing of lasertreatment. If the disease is identified early then appropriate laser treatment can bedelivered to prevent loss of vision. Regular eye screening for diabetic retinopathy canoptimize the timing for laser treatment. It is reported that the incidence and preva-lence of blindness can be much lower in communities where diabetic retinopathyscreening is well established compared to populations without proper screening forthe disease [16]. People living in rural and remote areas have limited access to spe-cialist care and therefore tele-diabetic retinopathy screening by trained staff can bean excellent alternative. The imaging devices such as nonmydriatic fundus camerasshould ideally be easy to operate and low cost such that allied health professionalsand laypeople can operate the devices and software to obtain high quality images andvideos. The patient data, images, medical history, and family history could be sentto a centralized disease control center for reading and diagnostic advice [17; 18].
Cavallerano et al. [19; 20] have successfully implemented and are using tele-medicine for diabetic retinopathy screening in the Veterans Affairs Medical Centre.They have been using the Joslin Vision Network (JVN) eye health care model, whichis based on a centralized image reading center. With the help of a health worker (im-ager) certified by the Joslin Diabetes Center, digital fundus images are obtained.Together with patient data images are transmitted via the Internet to the JVN Read-ing and Evaluation Center at the Joslin Diabetes Center in Boston. There the imagesare evaluated by an expert team of ophthalmologists, optometrists, and clinical staff.They provide appropriate treatment guidance based on the data received for each pa-tient. This model demonstrates the possibility of using telemedicine based diabeticretinopathy screening in a nonophthalmic setting.
The teleophthalmology program in Western Australia [2] is one of the ongoingand successful programs in the world. The Gascoyne region lies 900 km north ofthe Perth metropolitan area with a population of approximately 11 000. No perma-nent eye specialist services exist in the Gascoyne region. The current practice isfor an ophthalmologist and a registrar to make a week-long visit to Carnarvon Re-gional Hospital four times a year for consultations. Community-based screeningsfor early onset of eye-related disease including glaucoma, diabetic retinopathy, ac-tive trachoma, corneal scarring, trichiasis, pterygium, and cataract were conducted.A nurse is trained to use the fundus camera (Canon CR4-45NM), the portable slit-lamp (developed by the Lions Eye Institute; see Figure 11.1) and a puff tonometer.

Tele-Diabetic Retinopathy Screening 345
FIGURE 11.1Low-cost, easy-to-operate, and portable imaging device for both anterior segmentand retinal imaging. This device is ideal for telemedicine consultations. (Developedby the Lions Eye Institute in Perth, Australia.)
The nurse also obtains visual acuity and other relevant patient data (medical andfamily history, medications, and other complications). These data are then sent viaa Web-based secure telemedicine system to a centralized telemedicine server. Thenurse can choose the referring ophthalmologist and an automatic e-mail alert willbe sent to that ophthalmologist about the referral. On average 10 patients per weekare referred via this telemedicine service. About 37% of the referrals are related todiabetic retinopathy and 3% of the patients have been referred to ophthalmologistsin Perth. If this service were not available all the patients would have been sent toPerth.
During the trial period (one year), 352 people in the Gascoyne region presented fora face-to-face ophthalmic consultation at a cost of $91 760 or $260 per consultation.The Teleophthalmology Project Trial indicated that equivalent funding of teleoph-thalmology services would benefit 850 patients, costing $107 per consultation.
We have also analyzed the image quality (for diagnosis) during the trial period(Table 11.2). Analysis of the images showed that over time and with experience theimages taken by the newly recruited and trained nurse improved significantly. Forexample, 58% of images were assessed as either “good” or “excellent” in the first six

346 Automated Image Detection of Retinal Pathology
Table 11.2: Image Quality as a Function ofTime
Image Quality CodingCodes 1st semester 2nd semester
1 = Very Poor 2% 1%2 = Poor 40% 19%3 = Good 53% 68%4 = Excellent 5% 12%All images 100% 100%
months of the program. This figure increased to 80% in the second semester.The Lions Eye Institute provides regular training to upgrade the skills of the nurses
and local medical officers (twice a year). The training is provided for the use of theequipment and software. We also educate the participants about the eye disease,treatment, and disease grading. The imager should know the region of interest to beimaged for each disease, e.g., for glaucoma optic disc is the focal point. Training thetrainees could be made easier if image-based decision support systems and automaticdisease grading systems are used.
Advanced image processing techniques could improve human interpretation of theimages [21]. They could improve our understanding of the findings that may requirereferral for more thorough analysis by an ophthalmologist. Williamson and Keat-ing [22] have suggested that automated acquisition of images and analysis of digitalimages without intervention by technical staff either at the site or after transmissionto a centralized reading center will indicate to patients whether they have abnormalfundi. Advanced digital image analysis tools could provide objective and more ac-curate measurements from retinal images. It could be automatic counting and areameasurement of microaneurysm for diabetic retinopathy and cup:disc ratio and vol-ume of optic disc for glaucoma. These automatic measurements could be performedon images taken over a period of time to objectively compare them for patholog-ical changes over time. In other words, computer-aided diagnosis could provideobjective measurements to monitor disease progression. In teleophthalmology sys-tems, image compression, especially lossy compression techniques, could influencethe digital image analysis tools. However, more advanced image compression tech-niques are still evolving and could have less influence on the outcomes of advanceddigital imaging techniques.
11.4 Image-Based Clinical Decision Support SystemsClinical (or diagnostic) decision support systems (CDSS) are interactive software,which directly assist clinicians and other health professionals with decision-makingtasks using clinical observations and health knowledge. Advanced image analysis

Tele-Diabetic Retinopathy Screening 347
tools could further support the decision-making process. These tools could auto-matically identify abnormal pathologies. Presence or absence of various pathologiestogether with other parameters such as family history could lead to automatic diseasegrading. A medical decision support system for diabetic retinopathy will further en-hance the management of the disease and empower the rural and remote health pro-fessionals and patients. Image-based automatic grading systems could provide fasterand more efficient screening with the help of trained health care personnel [23; 24].Telemedicine and widespread screening combined with image-based clinical deci-sion support will enable early detection of disease and therefore prevent blindness.
In fundus photography, exposure setting and focus are the important and diffi-cult skills. Stumpf et al. [25] have demonstrated that an online continuous qual-ity improvement protocol could support and reinforce fundus imaging skills in dia-betic retinopathy screenings over a significant period of time even when considerableturnover was experienced.
The TOSCA-Imaging project established by European countries [26; 27] is oneof the advanced projects that utilizes advanced image analysis techniques for tele-medicine-based diabetic retinopathy screenings. An Internet-based image processingsoftware for screening and diagnosis of diabetic retinopathy was tested in the field. Apreliminary validation of this software showed a sensitivity and specificity of 80% forthe detection of normality based on precise detection of individual lesions. Decisionsthat depend on the detection of lesion patterns such as clinically significant macularedema showed a sensitivity and specificity of more than 95%. Validation by twoexpert graders suggested a sensitivity and specificity of below 90% for any lesionand of more than 95% for predicting overall retinopathy grade.
Another group from Spain, Hornero et. al [28], has evaluated an automated retinalimage analysis in a telemedicine screening program for diabetic retinopathy. Auto-matic image analysis technique was utilized to visually discriminate between hardexudates, cotton wool spots, and hemorrhages. The main focus of this programwas to detect all hard exudates. 35 out of 52 digital fundus photographs presentedhard exudates. A sensitivity of 75% and a specificity of 99% were obtained. Thelong-term goal of this project is to automate the telemedicine screening for diabeticretinopathy.
11.5 ConclusionMajor barriers for the introduction of teleophthalmology are fees for service and in-demnity, but we can see major changes happening around the world in recent times.In the United States, teleophthalmology consultations can be reimbursed in Califor-nia. The other states and other countries may follow the path in the very near future.
Telemedicine screening by nurses and primary care providers is a feasible solutionfor early detection and follow-up of diabetic retinopathy in rural, remote, and un-derserved areas. Teleophthalmology technology combined with image-based CDSS

348 Automated Image Detection of Retinal Pathology
will improve and upgrade skills of local clinicians. It will save many remote patientsfrom unnecessary visits to specialist centers on one hand, and allows more effectivediagnosis and intervention on the other.
References[1] Yogesan, K., Kumar, S., Goldschmidt, L., et al., Teleophthalmology, Springer-
Verlag, Germany, 2006.
[2] Kumar, S., Tay-Kearney, M.L., Chaves, F., et al., Remote ophthalmology ser-vices: cost comparison of telemedicine and alternative service delivery options,Journal of Telemedicine and Telecare, 12, 19, 2006.
[3] Wormald, R.P. and Rauf, A., Glaucoma screening, Journal of Medical Screen-ing, 2(2), 109, 1995.
[4] Komulainen, R., Tuulonen, A., and Airaksinen, P.J., The follow-up of patientsscreened for glaucoma with non-mydriatic fundus photography, Inter. Ophthal-mol, 16(6), 465, 1993.
[5] Buxton, M.J., Sculpher, M.J., Ferguson, B.A., et al., Screening for treatablediabetic retinopathy: A comparison of different methods, Diabetic Medicine,8(4), 371, 1991.
[6] Higgs, E.R., Harney, B.A., Kelleher, A., et al., Detection of diabetic retinopathyin the community using a non-mydriatic camera, Diabetic Medicine, 8(6), 551,1991.
[7] Kohner, E. and Hamilton, A.M.P., Vascular retinopathies — The managementof diabetic retinopathy, in Clinical Ophthalmology, S. Miller, ed., IOP Publish-ing Ltd, Bristol, 238, 1987.
[8] Chen, L.S., Tsai, C.Y., Lu, T.Y., et al., Feasibility of tele-ophthalmology forscreening for eye disease in remote communities, Journal of Telemedicine andTelecare, 10, 337, 2004.
[9] Yoo, S.K., Kim, D.K., Jung, S.M., et al., Performance of a web-based, real-time, tele-ultrasound consultation system over high-speed commercial telecom-munication lines, Journal of Telemedicine and Telecare, 10, 175, 2004.
[10] Eikelboom, R.H., Yogesan, K., Barry, C.J., et al., Methods and limits of digitalimage compression of retinal images for telemedicine, Invest. Ophthalmol. Vis.Sci., 41(7), 1916, 2000.
[11] Basu, A., Kamal, A.D., Illahi, W., et al., Is digital image compression accept-able within diabetic retinopathy screening? Diabet Med, 20(9), 766, 2003.

Tele-Diabetic Retinopathy Screening 349
[12] Baker, C.F., Rudnisky, C.J., Tennant, M.T., et al., JPEG compression of stereo-scopic digital images for the diagnosis of diabetic retinopathy via teleophthal-mology, Can J Opththalmol, 39(7), 746, 2004.
[13] Lee, M.S., Shin, D.S., and Berger, J.W., Grading, image analysis, and stereopsisof digitally compressed fundus images, Retina, 20(3), 275, 2000.
[14] Stellingwerf, C., Hardus, P.L.L.J., and Hooymans, J.M.M., Assessing diabeticretinopathy using two-field digital photography and the influence of JPEG-compression, Documenta Ophthalmologia, 108, 203, 2004.
[15] American Diabetes Association, Complications of diabetes in the UnitedStates, 2008, http://www.diabetes.org/diabetes-statistics/complications.jsp, ac-cessed 17th June 2008.
[16] Stefansson, E., Bek, T., Prota, M., et al., Screening and prevention of diabeticblindness, Acta Ophthalmologica Scandinavica, 78, 374, 2000.
[17] Boucher, M.C., Nguyen, Q.T., and Angioi, K., Mass community screening fordiabetic retinopathy using a nonmydriatic camera with telemedicine, CanadianJournal of Ophthalmology, 40(6), 734, 2005.
[18] Yogesan, K., Constable, I.J., and Chan, I., Telemedicine screening for diabeticretinopathy: Improving patient access to care, Disease Management and HealthOutcomes, 10(11), 673, 2002.
[19] Cavallerano, A.A., Cavallerano, J.D., Katalinic, P., et al., A telemedicine pro-gram for diabetic retinopathy in a veterans affairs medical center — The JoslinVision Network eye health care model, American Journal of Ophthalmology,139(4), 597, 2005.
[20] Aiello, L.M., Cavallerano, A.A., Bursell, S.E., et al., The Joslin Vision Networkinnovative telemedicine care for diabetes: Preserving human vision, Ophthal-mology Clinics of North America, 13(2), 213, 2000.
[21] Patton, N., Aslam, T.M., Macgillivray, T., et al., Retinal image analysis: Con-cepts, applications and potential, Prog Retin Eye Res, 25(1), 99, 2006.
[22] Williamson, T.H. and Keating, D., Telemedicine and computers in diabeticretinopathy screening, BJO, 82, 5, 1998.
[23] Jelinek, H.F., Cree, M.J., Worsely, D., et al., An automated microaneurysmdetector as a tool for identification of diabetic retinopathy in a rural optometrypractice, Clinical and Experimental Optometry, 89(5), 299, 2006.
[24] Cree, M.J., Olson, J.A., McHardy, K., et al., A fully automated comparativemicroaneurysm digital detection system, Eye, 11, 622, 1997.
[25] Stumpf, S.H., Verma, D., Zalunardo, R., et al., Online continuous quality im-provement for diabetic retinopathy tele-screening, Telemedicine Journal ande-Health, 10(2), S35, 2004.

350 Automated Image Detection of Retinal Pathology
[26] Hejlesen, O., Ege, B., Englmeier, K.H., et al., TOSCA-Imaging — develop-ing Internet based image processing software for screening and diagnosis ofdiabetic retinopathy, in Medinfo 2004, 2004, vol. 11, 222–226.
[27] Luzio, S., Hatcher, S., Zahlmann, G., et al., Feasibility of using the TOSCAtelescreening procedures for diabetic retinopathy, Diabetic Medicine, 21(10),1121, 2004.
[28] Hornero, R., Sanchez, C., and Lopez, M., Automated retinal image analysisin a teleophthalmology diabetic retinopathy screening program, TelemedicineJournal and e-Health, 10(1), S101, 2004.

Figure 2.1Moderate nonproliferative diabetic retinopathy with moderate diabetic macular edema.

(a) (b)
(c) (d)
Figure 2.2Nonproliferative diabetic retinopathy (NPDR). (a) Moderate NPDR and severe dia-betic macular edema; hard exudates involve the center of the macula. (b) Moderate NPDR; microaneurysms/dot hemorrhages, hard exudate (ring) and cotton wool spots. (c) Severe NPDR; > 20 intraretinal hemorrhages in four quadrants (three shown here) and IRMA (possibly NVE). Biomicroscopy showed the latter lesion to be intraretinal, hence it is IRMA. (d) Venous beading.

(a) (b)
(c) (d)
Figure 2.3Proliferative diabetic retinopathy (PDR) (a) PDR with moderate diabetic macular edema. There are new vessels disc, new vessels elsewhere, IRMA, blotchy hem-orrhages, microaneurysms/dot hemorrhages, and hard exudates. Hard exudate approach the center of the macula. Pan retinal photocoagulation scars are seen in the top left and top and bottom far right. (b) New vessels elsewhere. (c) PDR with preretinal hemorrhage. Hemorrhage is contained within the space between the ret-ina and the posterior vitreous face. The hemorrhage obscures the retinal new ves-sels. (d) Fibrous proliferation with traction macular detachment. PDR has regressed. Regressed fibro-vascular tissue along the inferior temporal vascular arcade has con-tracted causing traction macular detachment. Traction lines can be seen extending into the central macula.

Figure 5.1The outline of the proposed system for automatic identification of retinal exudates and the optic disc in color retinal images.

(a) Reference image (b) Typical retinal image
(c) Color normalized version (d) After contrast enhancement
Figure 5.3Color normalization and local contrast enhancement.
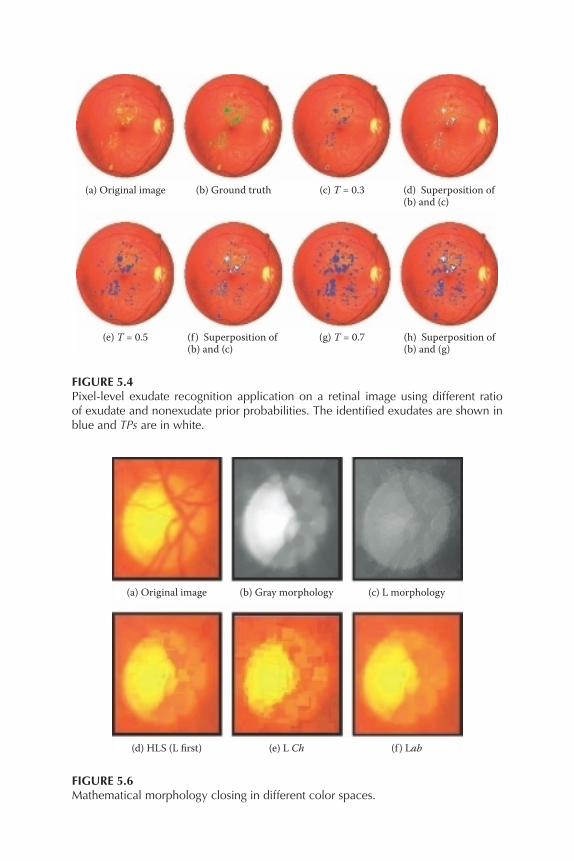
(a) Original image (b) Ground truth (c) T = 0.3 (d) Superposition of(b) and (c)
(g) T = 0.7(e) T = 0.5 (h) Superposition of(b) and (g)
(f ) Superposition of(b) and (c)
Figure 5.4Pixel-level exudate recognition application on a retinal image using different ratio of exudate and nonexudate prior probabilities. The identified exudates are shown in blue and TPs are in white.
(a) Original image (b) Gray morphology (c) L morphology
(d) HLS (L first) (e) L Ch (f ) Lab
Figure 5.6Mathematical morphology closing in different color spaces.

(a) A typical optic discimage
(b) After color mor-phology
(c) Lightness image
(e) Gradient image ob-tained from lightnessimage
(f) Gradient image ob-tained from gray-levelmorphology closing.
(d) Gray-level mor-phology closing
Figure 5.7A comparison between color morphology and gray-level morphology.
(a) A typical retinalimage
(b) Vessel elimina-tion in Lab
(c) Initial snake (d) Final snake
(e) Close-up ofoptic disc region
(f) Lab closing ofoptic disc region
(g) Close-up offinal snake
(h) Close-up ofhand-drawnground truth
(i) Overlay of(g) and (h)
Figure 5.8Optic disc localization results.

Figure 6.2Color normalization of retinal images. Top: color retinal images of a Caucasian and a Polynesian. Bottom: color normalized version of the image directly above.

ABC
Arterioles Venules Unknown
Angle
1 019 081.62 004.80
096 045.89 006.92
103 043.84 003.22
184 083.77 003.03
225 076.04 005.53
273 051.26 004.29
322 074.43 004.04
Change
Change
Change
Change
Change
Change
Change
Change
Change
Change
Change
Change
Change
Change
Change
Change
Change
Change
2
3
4
5
6
7
8
9
10
11
12
13
14
15
16
17
18
Width Sigma ADJUST IMAGE
ZOOM reset
Gray Color
Contrast
Splats
Full Image
Vessel Trace
Show Zones
Move DiskCalculate
Add Vein Seed
Draw Vein
Draw Artery
Add Artery Seed
Width
Width
Adjust Overlay
MANUAL OPERATIONS
CHANGE PARAMS
REJECT - NEXT
SKIP - NEXT
APPROVE W/COMMENT - NEXT
APPROVE - NEXT
IMAGE: Example Image.tif
Drawing Instructions:
Fine
Retinal Vessel Analysis Control
< >
Figure 7.A.2Secondary monitor — control panel (in arteriole view). The labels are: (A) angle of vessel in degrees, (B) mean width, and (C) standard deviation (sigma).
Retinal Vessel Analysis Image Display
A9 V8
V9V1
V2
V3
A3
V5
A6
A7
V7
V6
A8
A4A5
V4
A2
A1
Figure 7.A.3Automated display before grader interaction.

Retinal Vessel Analysis Image Display
A9 V8
V9V1
V2
V3
A3
V5
A6
A7
V7
V6
A8
A4A5
V4
A2
A1
Figure 7.A.4Completed grading with grader interaction.
A
B
CD
E
Arterioles Venules Unknown
Angle
1 019 081.62 004.80
096 045.89 006.92
103 043.84 003.22
184 083.77 003.03
225 076.04 005.53
273 051.26 004.29
322 074.43 004.04
Change
Change
Change
Change
Change
Change
Change
Change
Change
Change
Change
Change
Change
Change
Change
Change
Change
Change
2
3
4
5
6
7
8
9
10
11
12
13
14
15
16
17
18
Width Sigma ADJUST IMAGE
ZOOM reset
Gray Color
Contrast
Splats
Full Image
Vessel Trace
Show Zones
Move DiskCalculate
Paired:CRAE=141.17CRVE=207.12AVR=0.682Parr-HubbardCRAE=136.14CRVE=300.32AVR=0.453Big 6CRAE=122.74CRVE=204.75AVR=0.599
Add Vein Seed
Draw Vein
Draw Artery
Add Artery Seed
Width
Width
Adjust Overlay
MANUAL OPERATIONS
CHANGE PARAMS
REJECT - NEXT
SKIP - NEXT
APPROVE W/COMMENT - NEXT
APPROVE - NEXT
IMAGE: Example Image.tif
Drawing Instructions:
Fine
Retinal Vessel Analysis Control
< >
Figure 7.A.5Control panel view after calculation. The labels are: (A) Calculate button, (B) Results panel, (C) APPROVE, (D) APPROVE W/COMMENT, and (E) REJECT.

(a) (b) (c)
(d) (e) (f )
Figure 8.6Images from the DRIVE and STARE databases and their respective manual segmenta-tions: (a) normal image from the test set of the DRIVE database; (b) manual segmenta-tion from set A; (c) manual segmentation from set B; (d) normal image from the STARE database; (e) manual segmentation by the first observer; and (f) manual segmentation by the second observer.

Retina Image Processing for 02_test.tif
Original image
Posterior probabilities image and its transform
Automatic segmentation
Manual segmentation
For all imagesAccuracies and ROC areas
ROC curve
Statistics results
Figure 8.8Examples of HTML outputs produced using the mlvessel package. Top: segmentation results for an image from the DRIVE database. Bottom: statistics and ROC graphs for results on the DRIVE database.

Max
imum
num
ber o
f sam
ples
:
gmm
10.c
la-2
gmm
10.cl
a-2
01_t
est.t
if-1
Segm
ent i
mag
e
01_t
est.t
if-1
Mlv
esse
lFi
leHe
lpCl
assifi
er
Clas
sifier
Resu
lts
Clas
sifier
Pixe
l fea
ture
sTr
aini
ng im
ages
Imag
e
Crea
te cl
assifi
er
Clas
sifier
:
Imag
e typ
e:
Inve
rted g
reen
chan
nel
Gabo
r pro
cesse
d inv
erted
gree
n cha
nnel
Scale
:Ep
silon
:k0
y:
Rem
ove f
eatu
re
Rem
ove f
eatu
re
Rem
ove f
eatu
re
Rem
ove f
eatu
re
Rem
ove f
eatu
re
Rem
ove i
mag
e
Brow
se...
02_m
anua
l1.pn
g
Brow
se...
Ope
n
Ope
n...
Ope
n...
Clos
eSe
gmen
t
Choo
se im
age:
Poste
rior p
roba
biliti
es
02_t
est.t
if
New
featu
re
New
imag
e
24
3
Gabo
r pro
cesse
d inv
erted
gree
n cha
nnel
Scale
:Ep
silon
:k0
y:3
43
Gabo
r pro
cesse
d inv
erted
gree
n cha
nnel
Scale
:Ep
silon
:k0
y:4
43
Gabo
r pro
cesse
d inv
erted
gree
n cha
nnel
Scale
:Ep
silon
:k0
y:5
43
Colo
red
GMM All10
|K: Tr
ainin
g sam
ples
:
Segm
ent i
mag
e...
1000
Max
imum
num
ber o
f sam
ples:
Imag
eCl
assifi
er
Imag
eO
pen.
..Vi
ew fe
atur
es...
Segm
ent..
.Cl
ose
Exit
Segm
enta
tion
resu
lts: 0
1_te
st.ti
f-1
clas
sifie
d by
gm
m...
(b)
(d)
(e)
(c)
(a)
Imag
e
Labe
ls
Fig
ur
e 8.
9W
indo
ws
and
dial
ogue
s fr
om th
e G
UI i
llust
ratin
g th
e su
perv
ised
imag
e se
gmen
tatio
n pr
oces
s: (a
) mai
n w
indo
w; (
b) im
age
win
dow
; (c)
cla
s-si
fier
win
dow
; (d)
imag
e se
gmen
tatio
n di
alog
ue; a
nd (e
) seg
men
tatio
n re
sult
win
dow
.

Figure 9.2Figure illustrating an example of the results generated by the vessel-tracing algorithm. Circled areas highlight the areas of poor smoothness or erroneous vessel detection.
Figure 9.3Illustrating the inaccuracy in the boundaries. The figure on the left shows an image with a fairly accurate vessel (centerline) segmentation. The image on the right, shows in detail the boxed region from the image on the left. Note the inaccuracies in the vessel boundary points caused by poor contrast or noise. Also note how for each trace point, the corresponding boundaries are often not perpendicular to the orien-tation of the vessel and as such are not accurate for use in measuring vessel width.

x(s),y(s)
v(s) = (x(s),y(s),w(s))
I(v1(s))I(v1(s))
v1(s)
v1(s)n(s)
w(s))
Figure 9.7Illustration showing the parameters of a ribbon snake. Note the projection of the gra-dient on the unit norm (n(s)) used to further improve the boundary extraction.

1
2
3
4
5
678
9
10
1112 13
14
15
16
1
2
3
4
5
678
9
10
1112 1314
15
16
1
2
3
4
5
678
9
10
1112 1314
15
16
1
2
3
4
5
678
9
10
1112 1314
15
16
Figure 9.9Illustrating the results of change detection. Boxes are drawn around vessels with sus-pected width change. The image on the left has been transformed into the sameco-ordinate system as the image on the right.