Assessment of α-Synuclein Pathology
19
Copyright @ 200 by the American Association of Neuropathologists, Inc. Unauthorized reproduction of this article is prohibited. 8 ORIGINAL ARTICLE Assessment of >-Synuclein Pathology: A Study of the BrainNet Europe Consortium Irina Alafuzoff, MD, PhD, Laura Parkkinen, PhD, Safa Al-Sarraj, FRCPath, Thomas Arzberger, MD, Jeanne Bell, MD, FRCPath, Istvan Bodi, FRCPath, Nenad Bogdanovic, MD, PhD, Herbert Budka, MD, Isidro Ferrer, MD, Ellen Gelpi, MD, Stephen Gentleman, PhD, Giorgio Giaccone, MD, Wouter Kamphorst, MD, PhD, Andrew King, FRCPath, Penelope Korkolopoulou, MD, PhD, Ga ´bor G. Kova ´cs, MD, PhD, Sergey Larionov, MD, David Meyronet, MD, Camelia Monoranu, MD, Jodie Morris, PhD, Piero Parchi, MD, PhD, Efstratios Patsouris, MD, PhD, Wolfgang Roggendorf, MD, Danielle Seilhean, MD, PhD, Nathalie Streichenberger, MD, Dietmar R. Thal, MD, and Hans Kretzschmar, MD Abstract To determine the reliability of assessment of >-synuclein- immunoreactive (>S-IR) structures by neuropathologists, 28 eval- uators from 17 centers of BrainNet Europe examined current methods and reproducibility of >S-IR evaluation using a tissue microarray (TMA) technique. Tissue microarray blocks were constructed of samples from the participating centers that contained >S-IR structures. Slides from these blocks were stained in each center and assessed for neuronal perikaryal inclusions, neurites, and glial cytoplasmic inclusions. The study was performed in 2 phases. First, the TMA slides were stained with the antibody of the center’s choice. In this phase, 59% of the sections were of good or acceptable quality, and 4 of 9 antibodies used performed consis- tently. Differences in interpretation and categorization of >S-IR structures, however, led to differing results between the laboratories. Prior to the second phase, the neuropathologists participated in a training session on the evaluation of >S-IR structures. Based on the results of the first phase, selected antibodies using designated antigen retrieval methods were then applied to TMA slides in the second phase. When the designated methods of both staining and evaluation were applied, all 26 subsequently stained TMA sections evaluated were of good/acceptable quality, and a high level of concordance in the assessment of the presence or absence of specific >S-IR structures was achieved. A semiquantitative assessment of >S-IR neuronal perikaryal inclusions yielded agreements ranging from 49% to 82%, with best concordance in cortical core samples. These results suggest that rigorous methodology and dichotomized assessment (i.e. determining the presence or absence of >S-IR) should be applied, and that semiquantitative assessment can be recommended only for the cortical samples. Moreover, the study demonstrates that there are limitations in the scoring of >S-IR structures. Key Words: >-Synuclein, BrainNet Europe, Interrater reliability, Immunohistochemistry, Tissue microarray. INTRODUCTION The intracytoplasmic aggregation of >-synuclein (>S) is a common denominator found in a group of neuro- degenerative disorders currently known as synucleinopathies, including Parkinson disease, dementia with Lewy bodies (DLB), and multiple system atrophy (MSA). In these synucleinopathies, abnormal aggregates of >S are present as neuronal perikaryal inclusions (NPIs), neurites, or glial cytoplasmic inclusions (GCIs) (1). Thus, current consensus guidelines of Parkinson disease, DLB, and MSA recommend the use of >S immunohistochemistry (IHC) (2Y4) and 125 J Neuropathol Exp Neurol Volume 67, Number 2, February 2008 J Neuropathol Exp Neurol Copyright Ó 2008 by the American Association of Neuropathologists, Inc. Vol. 67, No. 2 February 2008 pp. 125Y143 From the Netherlands Brain Bank, Amsterdam, The Netherlands (WK); Department of Pathology, National and Capodistrian University of Athens, Athens, Greece (EP, PK); Institut de Neuropatologia, Universitat de Barcelona, Barcelona, Spain (IF); Dipartimento di Scienze Neurologiche, Universita ` di Bologna, Bologna, Italy (PP); Institute for Neuropathology, University of Bonn, Bonn, Germany (DRT, SL); OPNI, National Institute of Psychiatry and Neurology, Budapest, Hungary (GGK); Department of Pathology, University of Edinburgh, Western General Hospital, Edinburgh, UK (JB, JM); Department of Geriatrics, Karolinska Institutet, Huddinge, Sweden (NB); Department of Neuroscience and Neurology, Kuopio University, Kuopio, Finland (IA, LP); Department of Neuropathology, Imperial College London and Hammersmith Hospitals Trust, London, UK (SG); Department of Clinical Neuropathology, London Institute of Psychiatry, London, UK (SA-S, IB, AK); Hospices Civils de Lyon, Centre de Pathologie EstYNeuropathologie, Lyon, France (DM, NS); Istituto Nazionale Neurologico Carlo Besta, Milano, Italy (GG); Centre for Neuropathology and Prion Research, Mu ¨nchen Ludwig-Maximilians- University, Munich, Germany (HK, TA); Laboratoire de Neuropathologie Raymond Escourolle, Universite ´ Pierre et Marie Curie and INSERM, Paris, France (DS); Institute of Neurology, Medical University of Vienna, Vienna, Austria (EG, HB); Pathologisches Institut, Abteilung Neuro- pathologie der Universita ¨t Wu ¨rzburg, Wu ¨rzburg, Germany (CM, WR). BrainNet Europe: http://www.brainnet-europe.org/. Send correspondence and reprint requests to Irina Alafuzoff, MD, PhD, Department of Clinical Medicine, Unit of Neurology, Section of Neuropathology, Kuopio University, PO Box 1627, 70211 Kuopio, Finland; E-mail: [email protected] Supported by Grant No. FP6: BNEII No LSHM-CT-2004-503039 from the European Union. This article reflects only the authors’ views, and the Community is not liable for any use that may be made of the information contained therein.
-
Upload
independent -
Category
Documents
-
view
2 -
download
0
Transcript of Assessment of α-Synuclein Pathology

Copyright @ 200 by the American Association of Neuropathologists, Inc. Unauthorized reproduction of this article is prohibited.8
ORIGINAL ARTICLE
Assessment of >-Synuclein Pathology: A Study of the BrainNetEurope Consortium
Irina Alafuzoff, MD, PhD, Laura Parkkinen, PhD, Safa Al-Sarraj, FRCPath, Thomas Arzberger, MD,Jeanne Bell, MD, FRCPath, Istvan Bodi, FRCPath, Nenad Bogdanovic, MD, PhD, Herbert Budka, MD,
Isidro Ferrer, MD, Ellen Gelpi, MD, Stephen Gentleman, PhD, Giorgio Giaccone, MD,Wouter Kamphorst, MD, PhD, Andrew King, FRCPath, Penelope Korkolopoulou, MD, PhD,
Gabor G. Kovacs, MD, PhD, Sergey Larionov, MD, David Meyronet, MD, Camelia Monoranu, MD,Jodie Morris, PhD, Piero Parchi, MD, PhD, Efstratios Patsouris, MD, PhD, Wolfgang Roggendorf, MD,
Danielle Seilhean, MD, PhD, Nathalie Streichenberger, MD, Dietmar R. Thal, MD,and Hans Kretzschmar, MD
AbstractTo determine the reliability of assessment of >-synuclein-
immunoreactive (>S-IR) structures by neuropathologists, 28 eval-uators from 17 centers of BrainNet Europe examined currentmethods and reproducibility of >S-IR evaluation using a tissuemicroarray (TMA) technique. Tissue microarray blocks wereconstructed of samples from the participating centers that contained>S-IR structures. Slides from these blocks were stained in eachcenter and assessed for neuronal perikaryal inclusions, neurites, and
glial cytoplasmic inclusions. The study was performed in 2 phases.First, the TMA slides were stained with the antibody of the center’schoice. In this phase, 59% of the sections were of good oracceptable quality, and 4 of 9 antibodies used performed consis-tently. Differences in interpretation and categorization of >S-IRstructures, however, led to differing results between the laboratories.Prior to the second phase, the neuropathologists participated in atraining session on the evaluation of >S-IR structures. Based on theresults of the first phase, selected antibodies using designatedantigen retrieval methods were then applied to TMA slides in thesecond phase. When the designated methods of both staining andevaluation were applied, all 26 subsequently stained TMA sectionsevaluated were of good/acceptable quality, and a high level ofconcordance in the assessment of the presence or absence of specific>S-IR structures was achieved. A semiquantitative assessment of>S-IR neuronal perikaryal inclusions yielded agreements rangingfrom 49% to 82%, with best concordance in cortical core samples.These results suggest that rigorous methodology and dichotomizedassessment (i.e. determining the presence or absence of >S-IR)should be applied, and that semiquantitative assessment can berecommended only for the cortical samples. Moreover, the studydemonstrates that there are limitations in the scoring of >S-IRstructures.
Key Words: >-Synuclein, BrainNet Europe, Interrater reliability,Immunohistochemistry, Tissue microarray.
INTRODUCTIONThe intracytoplasmic aggregation of >-synuclein (>S)
is a common denominator found in a group of neuro-degenerative disorders currently known as synucleinopathies,including Parkinson disease, dementia with Lewy bodies(DLB), and multiple system atrophy (MSA). In thesesynucleinopathies, abnormal aggregates of >S are present asneuronal perikaryal inclusions (NPIs), neurites, or glialcytoplasmic inclusions (GCIs) (1). Thus, current consensusguidelines of Parkinson disease, DLB, and MSA recommendthe use of >S immunohistochemistry (IHC) (2Y4) and
125J Neuropathol Exp Neurol � Volume 67, Number 2, February 2008
J Neuropathol Exp NeurolCopyright � 2008 by the American Association of Neuropathologists, Inc.
Vol. 67, No. 2February 2008pp. 125Y143
From the Netherlands Brain Bank, Amsterdam, The Netherlands (WK);Department of Pathology, National and Capodistrian University of Athens,Athens, Greece (EP, PK); Institut de Neuropatologia, Universitat deBarcelona, Barcelona, Spain (IF); Dipartimento di Scienze Neurologiche,Universita di Bologna, Bologna, Italy (PP); Institute for Neuropathology,University of Bonn, Bonn, Germany (DRT, SL); OPNI, National Instituteof Psychiatry and Neurology, Budapest, Hungary (GGK); Department ofPathology, University of Edinburgh, Western General Hospital, Edinburgh,UK (JB, JM); Department of Geriatrics, Karolinska Institutet, Huddinge,Sweden (NB); Department of Neuroscience and Neurology, KuopioUniversity, Kuopio, Finland (IA, LP); Department of Neuropathology,Imperial College London and Hammersmith Hospitals Trust, London, UK(SG); Department of Clinical Neuropathology, London Institute ofPsychiatry, London, UK (SA-S, IB, AK); Hospices Civils de Lyon, Centrede Pathologie EstYNeuropathologie, Lyon, France (DM, NS); IstitutoNazionale Neurologico Carlo Besta, Milano, Italy (GG); Centre forNeuropathology and Prion Research, Munchen Ludwig-Maximilians-University, Munich, Germany (HK, TA); Laboratoire de NeuropathologieRaymond Escourolle, Universite Pierre et Marie Curie and INSERM, Paris,France (DS); Institute of Neurology, Medical University of Vienna,Vienna, Austria (EG, HB); Pathologisches Institut, Abteilung Neuro-pathologie der Universitat Wurzburg, Wurzburg, Germany (CM, WR).BrainNet Europe: http://www.brainnet-europe.org/.
Send correspondence and reprint requests to Irina Alafuzoff, MD, PhD,Department of Clinical Medicine, Unit of Neurology, Section ofNeuropathology, Kuopio University, PO Box 1627, 70211 Kuopio,Finland; E-mail: [email protected]
Supported by Grant No. FP6: BNEII No LSHM-CT-2004-503039 from theEuropean Union.
This article reflects only the authors’ views, and the Community is not liablefor any use that may be made of the information contained therein.

Copyright @ 200 by the American Association of Neuropathologists, Inc. Unauthorized reproduction of this article is prohibited.8
emphasize the importance of a semiquantitative rating ofimmunoreactive (IR) structures. However, it seems thatquantification might be greatly dependent on the method-ology and, specifically, on the antibodies (Abs) used, as was
recently reported by Croisier et al (5). Surprisingly, there areno large-scale interlaboratory studies that have assessed theinfluence of Abs and the tissue section pretreatments on thesemiquantitative rating or dichotomized assessment, that is,
TABLE 1. Brain Samples Received for the Construction of Tissue Microarray Blocks A to D
CaseNo.
Region
Sex
Age atDeath(yrs) Diagnosis
PMD(h) Fixative*
FixationTime(wk)
EmbeddingMedium/HighestTemperature
StorageTime of
Blocks (mo)Cx PigN AC Str
1 � F 77 MSA 21 3.7% formaldehyde 168 Histosec Merck/60-C Few
2 � � F 79 LBD 17 152 Few
3 � � M 54 MSA 48 3.7% formaldehyde 2 White paraffin/56-C 48
4 � � M 50 MSA 10 2 60
5 � � M 70 LBD 62 1 12
6 � � M 70 LBD 57 1 12
7 � � M 69 LBD 72 3.7% formaldehyde 13 Tissue Tech3paraffin wax/60-C
92
8 � M 60 MSA 48 2 27
9 � � M 60 LBD 36 4% formaldehyde 109 Histowax Leica/62-C NA
10 � F 65 MSA 48 208 NA
11 � � F 78 LBD NA 4.5% formaldehyde 4 Histosec Merck/61-C 24
12 � F 81 LBD 12 2 10
13 � � M 70 MSA NA 8 108
14 � M 55 MSA 24 3.7% formaldehyde 8 Bioplast/60-C 72
15 � � M 76 LBD 6 24 144
16 � M 67 LBD 20 24 108
17 � M 87 LBD 20 4% paraformaldehyde 32 Paraplast/57-C 1
18 � M 62 MSA 7 12 16
19 � M 82 LBD 16 4 2
20 � F 68 MSA 20 4% paraformaldehyde 20 White/bees/dentalwax mix/62-C
4
21 � M 66 LBD 24 8 6
22 � M 81 LBD 70 16 4
23 � F 85 LBD 8 8 2
24 � � � M 70 LBD 4 4% formaldehyde 5 Histowax Leica/65-C 30
25 � F 84 MSA 5 5 6
26 � � � F 81 LBD 144 4% formaldehyde 12 Paraplast/60-C 1
27 � M 77 LBD 14 3.7% formaldehyde 16 White paraffin mixedwith wax/56-C
G1
28 � � F 78 LBD 18 3 8
29 � M 68 MSA 12 20 108
30 � M 76 LBD 10 4% paraformaldehyde 6 Lamb wax andparaffin wax/65-C
2
31 � F 84 LBD 15 6 3
32 � M 42 MSA 24 NA 30 1
33 � M 71 LBD NA 24 G1
34 � M 78 LBD 24 FA + 4% formaldehyde+ eosin
1 Bayers paraffin/54-CY57-C
42
35 � � M 78 LBD 24 4% formaldehyde 156 5
36 � M 51 MSA 12 G1 84
37 � F 89 LBD 72 5% formaldehyde 6 Histosec Merck/63-C 2
38 � F 65 MSA 19 7 10
39 � F 74 LBD 26 32 36
40 � � M 65 LBD 68 2 48
All cases were used for the construction of the TMA blocks A to C, whereas the case numbers given in bold were used when constructing the TMA block D.*, Generally, 37% to 40% formaldehyde (formalin) is diluted in a 1:10 ratio (10% formalin) to phosphate-buffered saline, making it essentially 3.7% to 4.0% solution of
formaldehyde.AC, amygdala; Cx, cortex; F, female; FA, formic acid; LBD, Lewy body disease; M, male; MSA, multiple system atrophy; NA, not available; PigN, pigmented brainstem nuclei;
PMD, postmortem delay; Str, striatum; TMA, tissue microarray.
Alafuzoff et al J Neuropathol Exp Neurol � Volume 67, Number 2, February 2008
� 2008 American Association of Neuropathologists, Inc.126

Copyright @ 200 by the American Association of Neuropathologists, Inc. Unauthorized reproduction of this article is prohibited.8
the determination of the presence or absence of >S-IRstructures.
This BrainNet Europe (BNE) interlaboratory study wasdesigned to evaluate the reliability of assessment of >S-IRneuronal and glial inclusions by experienced neuropatholo-gists. This included an assessment of current practicesfollowed by each center, a microscope teaching exercisedesigned to reach a good concordance with respect tocategorization of >S-IR structures, and, finally, anotherassessment of results when methodologic aspects werestandardized. It is crucial for neuropathologic evaluations tobe comparable between centers, and the optimization andharmonization of methodologies are fundamental responsi-bilities of the BNE consortium. To ensure that the sametissue samples were analyzed by all evaluators, we used thetissue microarray (TMA) technique (6, 7), as describedpreviously (8). This report summarizes the results whenclose to 30 evaluators from 17 centers assessed the >S-IRstructures in the TMA core samples.
MATERIALS AND METHODS
Construction of the TMA BlocksThe flow chart in Figure 1 delineates the study design.
Each participating BNE center provided routinely processed,paraffin-embedded blocks of cortex, pigmented nuclei ofbrainstem, amygdala, and striatum with >S-IR inclusions tothe coordinating center. Sixty blocks from 40 cases (26 withLewy body disease and 14 with MSA) were obtained for theconstruction of the TMA blocks. The demographics of the
subjects from whom the tissue samples were obtained includepostmortem delay, fixation time, fixative type, embeddingmedium, and storage time (Table 1). The age at death of thesubjects (15 women/25 men) ranged from 50 to 89 years(mean, 71 years); the postmortem delay varied from 5 hoursto 6 days (mean, 31 hours); and the fixation time with variousfixatives ranged from 1 week to more than 4 years (mean, 29weeks). The maximum temperature of the embeddingmedium ranged from 54-C to 65-C, and the storage durationof the blocks ranged from 1 month to 12 years. Two coresamples were taken from most of the brain regions listedabove (a single sample was taken from 4 regions). Four TMAblocks were constructed, that is, blocks A, B, and Ccontained 128 core samples, and block D contained 43 coresamples (Fig. 2A, B).
The core biopsies were taken using a Manual TissueArrayer 1 instrument (Beecher Instruments, Sun Prairie, WI). A2-mm-diameter needle was used to obtain a representativesample, and serial 7-Km-thick sections were placed oncommercial SuperFrost Plus microscope slides (6, 7). Todetermine the uniformity of the sections shipped to differentlaboratories, 4 sections (every 10th) were stained by thecoordinating center using monoclonal Ab to rat synuclein 1,clone 42 (Transduction Laboratories, Lexington, KY) at adilution of 1:1000.
BNE Participant Efforts With CurrentIHC Practice
In the first phase, each participating center receivedsections cut from the TMA blocks A to C that were stained
FIGURE 1. The flowchart delineates the logistics of this study. Work performed by the 28 evaluators from 17 participating BNEcenters and by the coordinating center is represented. >S, >-Synuclein; BNE, BrainNet Europe; TMA, tissue microarray.
J Neuropathol Exp Neurol � Volume 67, Number 2, February 2008 Assessment of >-Synuclein Pathology: A BNE Study
� 2008 American Association of Neuropathologists, Inc. 127

Copyright @ 200 by the American Association of Neuropathologists, Inc. Unauthorized reproduction of this article is prohibited.8
Alafuzoff et al J Neuropathol Exp Neurol � Volume 67, Number 2, February 2008
� 2008 American Association of Neuropathologists, Inc.128

Copyright @ 200 by the American Association of Neuropathologists, Inc. Unauthorized reproduction of this article is prohibited.8
using their own choice of anti->S Ab with no recommenda-tions regarding antigen retrieval methods. The shipmentincluded data sheets for recording of assessments and arecent publication with figures of different >S-IR structures(9). The Abs, dilutions, and pretreatment methods used by theparticipating centers are summarized in Table 2. The 28participating neuropathologists were asked to assess each >S-IR structure within the core sample. They were instructed touse 100� magnification when counting, and they wererequested to count the number of somal NPIs (up to 25) ineach core sample. The participants evaluated >S-positiveneurites as follows: absent (0); some but needed to be soughtout (1); moderate when readily seen (2); and numerous (3).Glial cytoplasmic inclusions were rated to be absent (0);present occasionally, that is, they have to be sought out (1);moderately, approximately 20 to 30 (2), or extensively (3)(Fig. 2C). All assessment sheets and the stained slides wereshipped back to the coordinating center.
Training SessionTo standardize the assessment prior to the second phase
of this trial, a training session was held around a multiheadedmicroscope attended by 25 participants. Several either poorlyor well-stained sections that had been produced by theparticipants were examined. Many examples of labeledstructures were inspected and discussed. The participantsemphasized the need for detailed and specific guidelines forboth the categorization and scoring of the IR structures.Therefore, new instructions were designed to be unambiguous,simple, and easy to follow.
BNE Participant Efforts With DesignatedIHC Methodology
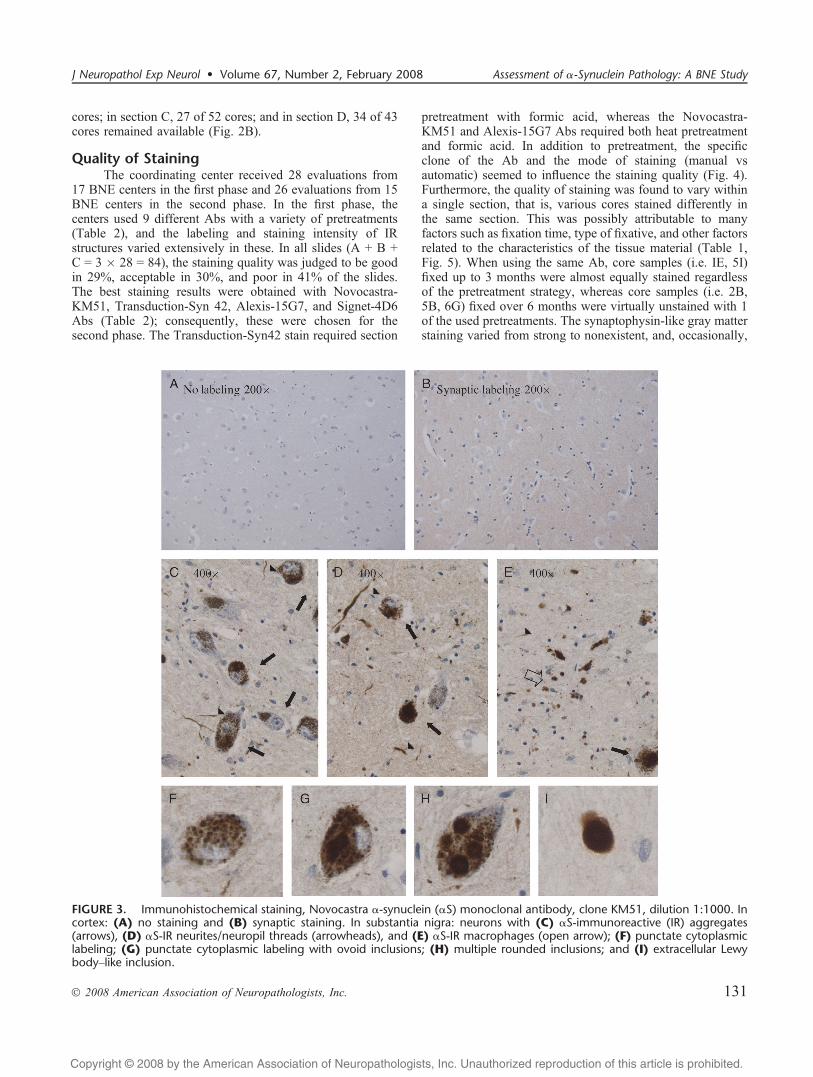
In the second phase of the study, the BNE participantsreceived 1 section (block D) to be stained with 1 of 4 Abs thathad been selected on the basis of the results obtained from thefirst phase. The guidelines included a protocol on Ab dilutionsand pretreatments (Table 3), written instructions for assess-ment based on the group discussions during the trainingsession, and representative photos of the lesions (Fig. 3). Asshown in Figure 2D, various patterns of immunoreactivitywere to be assessed and recorded into the assessment sheets.The details of lesions to be assessed were also given.
Data Analysis at the Coordinating CenterAll stained sections received were reassessed by 2
evaluators at the coordinating center (Fig. 2C). The sectionswere first evaluated with respect to loss and damage of cores
and quality of staining. They were scored in a scaleincorporating both staining intensity (good, acceptable orpoor) and background staining. The slides were thenreassessed following specific criteria. Only IR structuresfulfilling these criteria were included.
To simplify the comparison between primary andreassessments, the counts of NPIs were reassigned on asemiquantitative assessment scale (Fig. 2C). During thereassessment, it became evident that it was not possible todistinguish unequivocally a cross-sectioned neurite from aGCI when the nucleus of the glial cell was not clearlyvisible. Therefore, these 2 categories were modified(Fig. 2C). For statistical analysis, a mean value was obtainedfrom the semiquantitative scores of all included cores ineach of the following brain regions: cortex, pigmentednuclei of brainstem, amygdala, and striatum. By contrast, inthe second phase in which there were stringent instructions,the results were reported for each individual core,rather than as means of IR structures for different neuro-anatomical regions. This method was chosen to assess theuniformity of the semiquantitative assessment becausethere were variable numbers of IR structures in differentcores.
Statistical Analysis and PhotomicrographyFor statistical analyses, the SPSS program for Win-
dows (SPSS, Inc., Chicago, IL) was used. The statisticaldifferences in the distributions of semiquantitative assessmentof IR structures were estimated by the nonparametricKruskal-Wallis (between primary assessments and betweenreassessments) and Wilcoxon tests (between primary andreassessment). The Spearman correlation test was used toassess the linear relationship of core values between theprimary and reassessment. The value of absolute agreement(%) was calculated, that is, the proportion of core samplesassessed equivalently in the primary and reassessments. Digitalimages were taken using a Leica DM4000 B microscopeequipped with a Leica DFC 320 digital camera (LeicaMicrosystems Wetzlar, Ltd., Heerbrugg, Germany).
RESULTS
Comparability of Consecutive SectionsUniformity of the consecutive sections shipped to the
participants was verified by the coordinating center. Themean value of the semiquantitative scores of >S-IR NPIs inTMA blocks A to C was calculated for the whole section (4sections), and these values did not differ significantly
FIGURE 2. The flowchart summarizes the construction of the tissue microarray (TMA) blocks and the given assessmentinstructions. (A) Paraffin sections from tissue were first cut and stained with routine hematoxylin and eosin, and regions of interestwere marked carefully on these slides (circles). The hematoxylin and eosinYstained sections overlaid on the surface of the donorblocks then guided sampling from the morphologically representative areas. The TMA blocks were constructed by taking coretissue samples 2 mm in diameter at different locations of the donor block and inserting them into the recipient paraffin blocks A toD. (B) The final number of core samples to be analyzed in each block after the lost or damaged cores were excluded. (C)Summary of the instructions for the analyses and rating of the >S-positive structures in the first part of the study. (D) Thecategorization of the >S-positive structures after the training session, and the assessment sheet for the second phase of this trial isgiven. >S, >-Synuclein; BFB, basal forebrain; CG, cingulate gyrus; DMV, dorsal motor nucleus of vagus; ECx/CA2, entorhinalcortex/the CA2 region of the hippocampus; FCx, frontal cortex; LC, locus coeruleus; SN, substantia nigra; STR, striatum.
J Neuropathol Exp Neurol � Volume 67, Number 2, February 2008 Assessment of >-Synuclein Pathology: A BNE Study
� 2008 American Association of Neuropathologists, Inc. 129

Copyright @ 200 by the American Association of Neuropathologists, Inc. Unauthorized reproduction of this article is prohibited.8
(Kruskal-Wallis; p 9 0.4). In TMA block D, each core wasassessed with respect to >S-IR NPIs, neurites, and GCIs (4sections). Their dichotomous assessment values (i.e. present orabsent) did not differ significantly. Furthermore, regarding thesemiquantitative assessment of GCIs, a complete agreementwas achieved in all cores, whereas the agreement was 95% forneurites and 76% for NPIs.
Loss or Damage of Core SamplesThe estimated total loss of core samples was 6%. Only
those cores in which 75% of the tissue remained in more thanhalf of the evaluations were included in the reassessmentanalysis. Some cores were excluded when they were notrepresentative of a specific area; therefore, in TMA section A,29 of 37 cores remained available; in section B, 17 of 39
TABLE 2. Immunohistochemistry, Antibodies, and the Antigen Retrieval Strategies in Current Practices
Antibody/Company Clone
Quality ofStaining in
TMA Blocks Mode ofStaining Pretreatment Dilution
IncubationTime
AssessmentCodeA B C
NCL-ASYN/Novocastra(Newcastle upon Tyne, UK)
KM51 G G G Manual AC/100-C, 20 min; 80% FA, 3 min 1:100 +4-C overnight 1
G G A AC/100-C, 20 min; 80% FA, 3 min 1:35 RT, 60 min 2
G G A AC/120-C, 10 min; 80% FA, 5 min 1:1000 +4-C overnight 3
P P P None 1:20 +4-C overnight 4
Synuclein-1/TransductionLaboratories(Lexington, KY)
Syn42 G G G Manual 80% FA, 60 min 1:1000 +4-C overnight 5
G G G 100% FA, 3 min 1:300 +4-C overnight 6
A A G 80% FA, 20 min 1.4000 +4-C overnight 7
P P P MW, 15 min 1:500 RT, 60 min 8
>-Synuclein/Alexis(Lausen, Switzerland)
15G7 G G G Manual MW, 10 min; 80% FA, 5 min 1:20 RT, 30 min 9
A P P MW, 15 min 1:20 RT, 60 min 10
P P P Automatic MW, 15 min; 100% FA, 3 min 1:10 RT, 30 min 11
P P P RT, 30 min 12
>-Synuclein/Signet(Dedham, MA)
4D6 A G G Manual MW, 10 min; 80% FA, 1 min 1:10000 RT, 30 min 13
A G G 50% FA, 5 min 1:500 RT, 30 min 14
4B12 A A A AC/100-C, 10 min; 80% FA, 2 min 1:5000 RT, 30 min 15
>-Synuclein/Zymed(San Francisco, CA)
LB509 G A A Manual 80% FA, 60 min 1:1000 RT, 30 min 16
A A A 80% FA, 60 min 1:1000 +4-C overnight 17
A A A MW, 15 min 1:100 +4-C overnight 18
P A G MW, 10 min 1:100 RT, 30 min 19
P P A None 1:500 +4-C overnight 20
A A G Automatic Ventana buffer CC1 1:100 +35-C, 32 min 21
P P A Ventana buffer CC1 1:250 +37-C, 32 min 22
PanSyn/Abcam(Cambridgeshire, UK)
V A P P Manual 80% FA, 60 min 1:2000 RT, 30 min 23
P P P 1:1000 +4-C overnight 24
>-Synuclein/Chemicon(Temecula, CA)
Poly A P P Manual 80% FA, 3 min 1:2000 +4-C overnight 25
P P P None 1:1000 4-C overnight 26
Noncommercial Poly A P P Manual 98% FA, 15 min 1:800 +5-C overnight 27
Noncommercial Poly A P P Automatic 98% FA, 10 min 1:2000 RT, 60 min 28
A, acceptable; AC, autoclave; FA, formic acid; G, good; MW, microwave; P, poor; RT, room temperature; TMA, tissue microarray.
TABLE 3. Immunohistochemistry, Selected Antibodies, and Antigen Retrieval Strategies after Methodologic Harmonization
Company/Code Clone EpitopeNo. Evaluations/
SectionsMode ofStaining Pretreatment Dilution
IncubationTime
BD TransductionLaboratories/610787
Syn42 aa 15Y123 8 Manual 80% FA, 60 min 1:1000 +5-C overnight
Automatic 1:100 RT, 30 min
Alexis/ALX-804-258-L001 15G7 aa 116Y131 5 Manual MW in citrate buffer +80% FA, 5 min
1:10 +5-C overnight
Automatic 1:20 RT, 30 min
Signet/9720-05 (200 KL) 4D6 Full length 5 Manual MW in citrate buffer +80% FA, 1 min
1:10 000 +5-C overnight
Automatic RT, 30 min
Novocastra/NCL-ASYN KM51 Full length 8 Manual AC in citrate buffer +80% FA, 5 min
1:500 +5-C overnight
Automatic RT, 30 min
aa, amino acids; AC, autoclave; FA, formic acid; MW, microwave; RT, room temperature.
Alafuzoff et al J Neuropathol Exp Neurol � Volume 67, Number 2, February 2008
� 2008 American Association of Neuropathologists, Inc.130
Copyright @ 200 by the American Association of Neuropathologists, Inc. Unauthorized reproduction of this article is prohibited.8
cores; in section C, 27 of 52 cores; and in section D, 34 of 43cores remained available (Fig. 2B).
Quality of StainingThe coordinating center received 28 evaluations from
17 BNE centers in the first phase and 26 evaluations from 15BNE centers in the second phase. In the first phase, thecenters used 9 different Abs with a variety of pretreatments(Table 2), and the labeling and staining intensity of IRstructures varied extensively in these. In all slides (A + B +C = 3 � 28 = 84), the staining quality was judged to be goodin 29%, acceptable in 30%, and poor in 41% of the slides.The best staining results were obtained with Novocastra-KM51, Transduction-Syn 42, Alexis-15G7, and Signet-4D6Abs (Table 2); consequently, these were chosen for thesecond phase. The Transduction-Syn42 stain required section
pretreatment with formic acid, whereas the Novocastra-KM51 and Alexis-15G7 Abs required both heat pretreatmentand formic acid. In addition to pretreatment, the specificclone of the Ab and the mode of staining (manual vsautomatic) seemed to influence the staining quality (Fig. 4).Furthermore, the quality of staining was found to vary withina single section, that is, various cores stained differently inthe same section. This was possibly attributable to manyfactors such as fixation time, type of fixative, and other factorsrelated to the characteristics of the tissue material (Table 1,Fig. 5). When using the same Ab, core samples (i.e. IE, 5I)fixed up to 3 months were almost equally stained regardlessof the pretreatment strategy, whereas core samples (i.e. 2B,5B, 6G) fixed over 6 months were virtually unstained with 1of the used pretreatments. The synaptophysin-like gray matterstaining varied from strong to nonexistent, and, occasionally,
FIGURE 3. Immunohistochemical staining, Novocastra >-synuclein (>S) monoclonal antibody, clone KM51, dilution 1:1000. Incortex: (A) no staining and (B) synaptic staining. In substantia nigra: neurons with (C) >S-immunoreactive (IR) aggregates(arrows), (D) >S-IR neurites/neuropil threads (arrowheads), and (E) >S-IR macrophages (open arrow); (F) punctate cytoplasmiclabeling; (G) punctate cytoplasmic labeling with ovoid inclusions; (H) multiple rounded inclusions; and (I) extracellular LewybodyYlike inclusion.
J Neuropathol Exp Neurol � Volume 67, Number 2, February 2008 Assessment of >-Synuclein Pathology: A BNE Study
� 2008 American Association of Neuropathologists, Inc. 131

Copyright @ 200 by the American Association of Neuropathologists, Inc. Unauthorized reproduction of this article is prohibited.8
nonspecific staining was seen irrespective of the type oftissue, gray, or white matter. Other occasionally encounteredlabeling that can be mistaken for >S-IR inclusions includedthe staining of corpora amylacea (Fig. 6A), Nissl substance,and/or lipofuscin/lipopigment (Fig. 6B and, in some cases,evidence of starlike glial >S-IR; Fig. 6C).
In the second round, all 26 sections were assessed to begood/acceptable in quality, and, in general, all 4 of the selectedAbs performed similarly. Eight sections were stained withNovocastra-KM51 and Transduction-Syn 42, whereas 5evaluations were performed on both Alexis-15G7 and Sig-net-4D6 (Table 3).
Results in the First Phase: Current IHC PracticesResults are given when only evaluations of the sections
of good/acceptable staining quality are included (Tables 4Y8).
CortexTable 4 shows that the semiquantitative scores differed
significantly in the primary assessments (NPIs ranged from0.4 T 0.1 to 2.2 T 0.3 and neurites/GCIs from 0 to 1.8 T 0.2;Kruskal-Wallis; p G 0.000), whereas the variation betweenreassessment results of NPIs was nonsignificant (Kruskal-Wallis; p 9 0.05). Moreover, the primary and reassessmentmean values differed significantly (Wilcoxon; p G 0.05) in56% of evaluations for the NPIs and in 46% of evaluationsfor neurites/GCIs. An Bexcellent[ correlation (Spearman r,0.8Y1.0) was found in 63% of evaluations for NPIs and in
22% of evaluations for neurites/GCIs. Furthermore, theabsolute agreement between the primary and reassessmentsranged from 52% to 86% for NPIs and from 19% to 95% forneurites/GCIs.
Pigmented NucleiThe mean values (TSE) for the semiquantitative scores
differed significantly among the primary assessments (NPIrange, 0.8 T 0.2Y2.6 T 0.5; neurites/GCIs, 0.9 T 0.2Y2.6 T 0.5;Kruskal-Wallis; p G 0.000) (Table 5), whereas the variationbetween the reassessment results of both NPIs and neurites/GCIs was nonsignificant (Kruskal-Wallis; p 9 0.05). Theprimary and reassessment mean values differed significantly(Wilcoxon; p G 0.05) in 56% of evaluations for both NPIsand neurites/GCIs. An excellent correlation (Spearman r,0.8Y1.0) was found in 53% of evaluations for NPIs and in33% of evaluations for neurites/GCIs. Furthermore, theabsolute agreement between the primary and reassessmentsranged from 14% to 87% for NPIs and from 20% to 65% forneurites/GCIs.
AmygdalaThe mean values (TSE) for the semiquantitative scores
differed significantly between the primary (NPI range, 1.2 T0.3Y3.9 T 0.4; neurites/GCIs, 1.0 T 0.3Y3.2 T 0.3; Kruskal-Wallis; p G 0.000/p G 0.001) and reassessment (NPI range,0.4 T 0.2Y2.9 T 0.6; neurites/GCIs, 0.9 T 0.3Y2.2 T 0.2;Kruskal-Wallis; both p G 0.000) (Table 6). The primary andreassessment mean values differed significantly (Wilcoxon;
FIGURE 4. The effect of different clones of the same antibody (Ab) and modes of staining on the quality of staining in 200�magnification (scale bars = 20 Km). (A, B) The same core sample of substantia nigra (tissue microarray [TMA] block B, core 1A)stained by 2 centers using different clones of the same monoclonal Ab (A) 4D6 (B) 4B12 produced by Signet using human >-synuclein (>S) as immunogen. Note the difference in visualization of neuronal inclusions that are clearly demarcated in (A) butonly faintly visible and difficult to discern from the neuromelanin in (B) (arrows). (C, D) The same core sample of pons (TMAblock B, core 5F) stained with Alexis 15G7 Ab by 2 centers using different modes of stainings, (C) manual and (D) automatic. The>S-positive oligodendroglial inclusions were rated to be present extensively (C), whereas only a few weakly positive structureswere detected (D).
Alafuzoff et al J Neuropathol Exp Neurol � Volume 67, Number 2, February 2008
� 2008 American Association of Neuropathologists, Inc.132

Copyright @ 200 by the American Association of Neuropathologists, Inc. Unauthorized reproduction of this article is prohibited.8
p G 0.05) in 53% of evaluations for NPIs and in 36% ofevaluations for neurites/GCIs. An excellent correlation(Spearman r, 0.8Y1.0) was found in only 41% of evaluationsfor NPIs but in 65% of evaluations for neurites/GCIs.Furthermore, the absolute agreement between the primaryand reassessments ranged from 20% to 79% for NPIs andfrom 13% to 73% for neurites/GCIs.
StriatumThe mean values (T SE) for the semiquantitative scores
differed significantly among the primary assessments of both
types of labeled structures (NPI range, 0Y4.3 T 0.4; neurites/GCIs, 1.4 T 0.4Y2.8 T 0.5; Kruskal-Wallis; p G 0.000),whereas the variation between reassessment results of bothNPIs and neurites/GCIs was nonsignificant (Kruskal-Wallis;p 9 0.05) (Table 7). The primary and reassessment meanvalues differed significantly (Wilcoxon; p G 0.05) in 57% ofevaluations for NPIs and in 25% of evaluations for neurites/GCIs. None of the evaluations of NPIs exhibited an excellentcorrelation (Spearman r, 0.8Y1.0), whereas this was found in56% of evaluations for neurites/GCIs. Furthermore, theabsolute agreement between the primary and reassessments
FIGURE 5. The effect of pretreatment and characteristics of the tissue (i.e. fixation time) on the quality of staining.Magnification: 200�; scale bars = 20 Km). Five core samples from the section of tissue microarray (TMA) block C (cores 1E, 2B,5B, 5I, 6G) were stained by the same Signet 4D6 antibody (same clone) by 2 different centers (for pretreatments, see Table 2,assessment codes 13 and 14). Note the variability in labeling of the >-synucleinYpositive structures in the same core sample fixedover 6 months (C vs D, E vs F, and I vs J).
J Neuropathol Exp Neurol � Volume 67, Number 2, February 2008 Assessment of >-Synuclein Pathology: A BNE Study
� 2008 American Association of Neuropathologists, Inc. 133

Copyright @ 200 by the American Association of Neuropathologists, Inc. Unauthorized reproduction of this article is prohibited.8
ranged from 0% to 100% for NPIs and from 42% to 75% forneurites/GCIs.
Agreement in the Scoring of >S-PositiveStructures on a Single Core Level
Table 8 shows variation in the agreement of scoring ofIR structures within a core sample. The absolute agreementlevels indicate the proportion of cores evaluated with thesame value in both primary and reassessments. With respectto >S-positive NPIs in the entorhinal cortex, considerablevariation was detected between the primary assessments. Therange of scores extended over a few stages in most cores, andin 15% of cores, all possible ratings were given. Absoluteagreement in scoring of entorhinal core samples between theprimary and reassessments ranged extensively from 18% to95%, and it was excellent (Q80%) in only 4 of the 20 corticalcore samples.
Some variation was also detected in the assessment ofneurites in the substantia nigra between the primary assess-ments, and all possible ratings from none to numerous weregiven in 2 of the 17 nigral core samples (12%). Theproportion of matching scores between the primary andreassessments varied significantly from 27% to 83%, andabsolute agreement was excellent (Q80%) in only 2 of the 17nigral core samples.
In the assessment of >S-IR GCIs in the striatum, asignificant variation was detected between the primaryassessments such that in 4 of the 12 striatal core samples,the rater assessment ranged from none to extensive.Absolute agreement ranged extensively from 13% to 81%,being excellent (Q80%) in only 3 of the 12 striatal coresamples.
Training SessionDuring the exercise around the multiheaded micro-
scope, several issues were raised, including 1) the difficultyof strictly specifying whether a rounded labeled structurewithout a notable nucleus represented a cross section of alarge neurite or was an intracellular inclusion, and 2) whethera tiny dot-like structure represented a GCI or a cross sectionof smaller threads. Therefore, prior to proceeding, there wasan agreement on the categorization of >S-IR structures to befollowed in the second phase (Figs. 2D, 3). Furthermore,other possible pitfalls were discussed, including IR corporaamylacea, Nissl substance, lipofuscin pigment, and glialprocesses (Fig. 6).
Results in the Second Phase With StandardizedIHC Methodology
Table 9 lists the results of the dichotomous andsemiquantitative assessments using the 4 selected Abs. Therewas a good agreement between the dichotomous assessmentsin which only the presence or absence of >S-IR wasdetermined. This was particularly good among the 8 evalua-tions that had used the Transduction-Syn42 Ab to stain >S-IRWhen the Alexis-15G7 Ab was used in 3 cores and withSignet-4D6 in 2 cores, negative results were reported bysome evaluators. The most variable results were obtainedusing the Novocastra-KM51 Ab. In contrast, the agreementbetween semiquantitative assessments of >S-IR (NPIs +neurites + GCIs) was poor, and this was not independent ofthe Ab used. With Signet-4D6, in 71% of core samples, atleast 2 different scores were given. The range of scoresextended over a few stages also with Alexis-15G7 (74%),Novocastra-KM51 (79%), and Transduction-Syn42 (82%).
Assessment of >S-Labeled Morphologic EntitiesIrrespective of which Ab had been used (Tables 10,
11), a similar trend in dichotomous and semiquantitativeassessments was found. Both NPIs and neurites were rathereasily detected and dichotomously assessed in all brainregions except the striatum. Neuronal perikaryal inclusionswere reported to be present by all evaluators in 12 of the 24core samples representing cortex, substantia nigra, or amyg-dala (Table 10). In these 12 cores, the absolute agreement ofdichotomized assessment of NPIs between the primary andreassessments also reached 100%. In the remaining 12 cores,some false-negative results were obtained mostly in thecortex. Overall, the absolute agreement between the primaryand reassessment regarding the dichotomous assessment ofNPIs was excellent (Q80%) in most (20/24) cores. Addition-ally, >S-IR neurites and threads were reported as beinghomogenously present in 11 of 24 cores, where absoluteagreement also reached 100%. In general, absolute agreementof neurites/threads was excellent (Q80%) with the exceptionof 1 core.
In contrast, the semiquantitative assessment of bothNPIs and neurites achieved poorer agreement within theprimary assessments and between the primary and reassess-ments (absolute agreement values). With respect to NPIs, allpossible ratings from zero to greater than 20 inclusions weregiven in 17%, 3 possible ratings in 50%, and 2 differentratings in 29% of cores. In the cortical core samples,
FIGURE 6. Staining of corpora amylacea (A), Nissl substance, and/or lipofuscin/lipopigment (B) and starlike glia (C).Magnification: 400�; scale bars = 10 Km.
Alafuzoff et al J Neuropathol Exp Neurol � Volume 67, Number 2, February 2008
� 2008 American Association of Neuropathologists, Inc.134

Copyright @ 200 by the American Association of Neuropathologists, Inc. Unauthorized reproduction of this article is prohibited.8
TABLE
4.Assessm
entof
>-Syn
uclein-Positive
Lesion
sin
theCortex,
TMASe
ctionA,Includ
ing29
CoreSa
mples
Assessm
ent
Cod
e*Qualityof
Staining
Neuronal
PerikaryalInclusion
sNeurites/Glial
Cytop
lasm
icInclusion
s
Primary
Assessm
ent,
MeanTSE†
Reassessm
ent,
MeanTSE‡
Wilcoxon
Test§
Spearm
an(r)¶
Absolute
Agreement,
%$
Primary
Assessm
ent,
MeanTSE†
Reassessm
ent,
MeanTSE‡
Wilcoxon
Test§
Spearm
an(r)¶
Absolute
Agreement,
%$
6G
2.2T0.3
1.5T0.3
**0.62
521.8T0.2
1.9T0.2
NS
0.81
48
9G
1.6T0.3
1.1T0.2
**0.87
570.9T0.2
1.1T0.2
NS
0.70
57
2G
1.3T0.2
0.9T0.2
††0.86
590.6T0.2
0.5T0.2
NS
0.50
6
5G
1.1T0.3
1.2T0.3
NS
0.82
720.4T0.1
0.6T0.2
NS
0.60
72
3G
1.1T0.2
1.1T0.2
NS
0.94
720.7T0.2
0.8T0.2
NS
0.90
90
1G
1.1T0.2
1.3T0.2
‡‡0.90
760.8T0.2
1.5T0.2
††0.85
32
16G
0.9T0.2
0.9T0.2
NS
0.90
860.6T0.2
0.3T0.1
NS
0.51
62
14A
1.8T0.3
1.2T0.2
**0.75
521.8T0.3
1.3T0.2
**0.59
41
21A
1.7T0.3
1.3T0.2
**0.87
671.2T0.2
1.4T0.2
‡‡0.80
56
15A
1.6T0.3
1.2T0.3
**0.78
700.7T0.2
0.8T0.2
NS
0.69
63
27A
1.6T0.2
1.2T0.2
**0.83
621.2T0.2
1.4T0.2
NS
0.73
55
18A
1.3T0.3
1.2T0.3
NS
0.68
780.6T0.2
1.3T0.2
††0.66
19
13A
1.3T0.3
0.8T0.2
‡‡0.82
541.2T0.2
0.8T0.2
‡‡0.79
64
25A
1.2T0.2
1.2T0.2
NS
0.81
561.5T0.1
0.9T0.2
††0.73
37
7A
1.2T0.2
0.9T0.2
‡‡0.80
560.4T0.1
1.0T0.2
**0.18
42
23A
1.0T0.2
1.0T0.2
NS
0.64
540.9T0.1
0.4T0.1
‡‡j0.34
39
17A
0.8T0.2
0.7T0.2
NS
0.73
720.2T0.1
0.5T0.2
**0.54
72
28A
0.6T0.1
1.1T0.3
**0.87
680.8T0.2
0.7T0.2
NS
0.59
61
10A
0.4T0.1
0.5T0.1
NS
0.60
800.0T0.0
0.1T0.1
§§§§
95
+9evaluation
sP
K-W
¶¶G
+A
0.00
00.176
0.000
0.000
*,Num
bering
iscomputedaccordingto
ascendingnumbersequence
ofTable
2.†,
Meanvalues
ofthesemiquantitativescores
oflesionsTSEin
theprim
aryassessment(doneby
theBNEparticipants).
‡,Meanvalues
ofthesemiquantitativescores
oflesionsTSEin
thereassessment(doneby
thecoordinating
center).
§,Level
ofagreem
entbetweenprim
aryandreassessments
was
estimated
usingnonparam
etricWilcoxonsigned
rank
test.
¶,The
bivariatecorrelationprocedurewas
used
tocompute
thepairwiseassociations
forscorevalues
ofprim
aryandreassessments.
$,Absoluteagreem
entrepresentstheproportion
ofcore
samples
assessed
equallyin
theprim
aryandreassessments.
**,Correlation
issignificant
atthelevelof
0.01.
††,Correlation
issignificant
atthelevelof
0.001.
‡‡,Correlation
issignificant
atthelevelof
0.05.
§§,Cannotbe
calculated
becauseat
least1of
thevariablesisconstant.
¶¶,Statistical
differencesin
theprim
aryandreassessments
wereestimated
bythenonparam
etricKruskal-W
allistestwhenonly
good/acceptablestaining
qualitieswereincluded.
A,acceptable;G,good;NS,notsignificant;P,poor;SE,standard
errorof
mean;
TMA,tissue
microarray.
J Neuropathol Exp Neurol � Volume 67, Number 2, February 2008 Assessment of >-Synuclein Pathology: A BNE Study
� 2008 American Association of Neuropathologists, Inc. 135

Copyright @ 200 by the American Association of Neuropathologists, Inc. Unauthorized reproduction of this article is prohibited.8
TABLE
5.Assessm
entof
>-Syn
uclein-Positive
Lesion
sin
theBrainstem
Pigm
entedNuc
lei,TM
ASe
ctionB,
Includ
ing17
CoreSa
mples
Assessm
ent
Cod
e*Qualityof
Staining
Neuronal
Perikarya
lInclusion
sNeurites/Glial
Cytop
lasm
icInclusion
s
Primary
Assessm
ent,
MeanTSE†
Reassessm
ent,
MeanTSE‡
Wilcoxon
Test§
Spearm
an(r)¶
Absolute
Agreement,
%$
Primary
Assessm
ent,
MeanTSE†
Reassessm
ent,
MeanTSE‡
Wilcoxo
nTest§
Spearm
an(r)¶
Absolute
Agreement,
%$
14G
2.6T0.5
1.1T0.2
**0.90
142.4T0.3
1.9T0.2
††76
40
6G
2.6T0.4
1.0T0.2
**0.72
181.6T0.2
2.1T0.2
††72
59
9G
1.8T0.4
1.4T0.4
††0.94
651.6T0.3
1.5T0.3
NS
8053
13G
1.8T0.4
1.2T0.3
‡‡0.76
501.7T0.3
1.8T0.3
NS
8250
2G
1.5T0.2
1.8T0.3
NS
0.82
651.1T0.2
1.3T0.2
NS
6753
3G
1.5T0.4
1.2T0.4
NS
0.82
531.1T0.3
1.4T0.3
NS
8353
5G
1.1T0.2
1.2T0.3
NS
0.59
531.5T0.3
1.7T0.2
NS
5953
1G
1.1T0.2
1.7T0.3
††0.53
501.9T0.2
1.8T0.2
NS
6338
19A
2.1T0.5
1.1T0.3
††0.69
402.6T0.5
1.3T0.3
‡‡69
20
15A
1.9T0.4
1.0T0.3
‡‡0.86
351.8T0.3
1.5T0.3
NS
7959
21A
1.5T0.3
1.7T0.3
NS
0.68
591.4T0.3
2.4T0.3
‡‡82
65
7A
1.4T0.3
1.5T0.3
NS
0.81
761.3T0.2
2.0T0.2
‡‡55
59
17A
1.2T0.3
1.0T0.2
NS
0.86
590.8T0.2
1.2T0.2
††77
53
16A
1.1T0.3
1.3T0.4
NS
0.78
631.8T0.3
1.8T0.3
NS
8550
18A
0.8T0.2
0.9T0.2
NS
0.90
870.9T0.2
1.7T0.2
‡‡63
27
+13
evaluation
sP
K-W
§§G
+A
0.010
0.412
0.001
0.077
*,Num
bering
iscomputedaccordingto
ascendingnumbersequence
ofTable
2.†,
Meanvalues
ofthesemiquantitativescores
oflesionsTSEin
theprim
aryassessment(doneby
theBNEparticipants).
‡,Meanvalues
ofthesemiquantitativescores
oflesionsTSEin
thereassessment(doneby
thecoordinating
center).
§,Level
ofagreem
entbetweenprim
aryandreassessmentswas
estimated
usingnonparam
etricWilcoxonsigned
rank
test.
¶,The
bivariatecorrelationprocedurewas
used
tocompute
thepairwiseassociations
forscorevalues
ofprim
aryandreassessments.
$,Absoluteagreem
entrepresents
theproportion
ofcore
samples
assessed
equallyin
theprim
aryandreassessments.
**,Correlation
issignificant
atthelevelof
0.001.
††,Correlation
issignificant
atthelevelof
0.05.
‡‡,Correlation
issignificant
atthelevelof
0.01.
§§,Statistical
differencesin
theprim
aryandreassessmentswereestimated
bythenonparam
etricKruskal-W
allistestwhenonly
good/acceptablestaining
qualitieswereincluded.
A,acceptable;G,good;NS,notsignificant;P,poor;SE,standard
errorof
mean;
TMA,tissue
microarray.
Alafuzoff et al J Neuropathol Exp Neurol � Volume 67, Number 2, February 2008
� 2008 American Association of Neuropathologists, Inc.136

Copyright @ 200 by the American Association of Neuropathologists, Inc. Unauthorized reproduction of this article is prohibited.8
TABLE
6.Assessm
entof
>-Syn
uclein-Positive
Lesion
sin
theAmyg
dala,TM
ASe
ctionC,Includ
ing15
CoreSa
mples
Assessm
ent
Cod
e*Qualityof
Staining
Neuronal
PerikaryalInclusion
sNeurites/Glial
Cytop
lasm
icInclusion
s
Primary
Assessm
ent,
MeanTSE†
Reassessm
ent,
MeanTSE‡
Wilcoxon
Test§
Spearm
an(r)¶
Absolute
Agreement,
%$
Primary
Assessm
ent,
MeanTSE†
Reassessm
ent,
MeanTSE‡
Wilcoxo
nTest§
Spearm
an(r)¶
Absolute
Agreement,
%$
6G
3.9T0.4
2.5T0.5
**0.78
312.1T0.2
1.9T0.2
NS
0.6
46
14G
3.5T0.4
2.9T0.6
NS
0.90
463.2T0.3
2.2T0.2
**0.83
31
19G
3.4T0.5
1.3T0.5
††0.20
272.1T0.3
1.5T0.3
††0.64
36
7G
3.3T0.5
1.9T0.4
**0.74
201.3T0.2
2.3T0.2
‡‡0.65
13
1G
2.9T0.5
2.9T0.5
NS
0.69
461.2T0.3
1.5T0.3
NS
0.80
54
13G
2.3T0.6
1.5T0.4
NS
0.59
571.5T0.3
1.3T0.3
NS
0.80
71
9G
2.2T0.6
1.4T0.5
††0.98
501.4T0.4
1.4T0.4
NS
0.89
71
5G
2.1T0.5
2.3T0.5
NS
0.91
791.7T0.4
2.1T0.3
**0.84
64
2A
3.1T0.4
2.4T0.4
NS
0.75
501.7T0.3
1.4T0.2
NS
0.52
50
15A
2.5T0.6
1.0T0.5
††0.66
421.4T0.3
1.1T0.3
NS
0.95
75
27A
2.5T0.4
1.8T0.4
**0.72
331.5T0.3
1.9T0.3
NS
0.87
58
21A
2.1T0.6
2.3T0.7
NS
0.94
551.0T0.3
1.5T0.4
NS
0.86
73
20A
2.1T0.5
1.4T0.4
††0.88
621.9T0.5
1.1T0.3
††0.68
38
18A
1.9T0.5
1.7T0.5
NS
0.90
691.0T0.2
1.5T0.3
NS
0.71
53
3A
1.8T0.4
0.4T0.2
**0.53
361.3T0.3
1.8T0.5
††0.92
64
16A
1.3T0.4
1.6T0.5
NS
0.97
790.7T0.2
1.0T0.3
NS
0.88
71
17A
1.2T0.3
0.7T0.3
††0.72
621.0T0.3
0.9T0.3
NS
0.90
62
+11
evaluation
sP
§§K-W
G+A
0.000
0.001
0.000
0.027
*,Num
bering
iscomputedaccordingto
ascendingnumbersequence
ofTable
2.†,
Meanvalues
ofthesemiquantitativescores
oflesionsTSEin
theprim
aryassessment(doneby
theBNEparticipants).
‡,Meanvalues
ofthesemiquantitativescores
oflesionsTSEin
thereassessment(doneby
thecoordinating
center).
§,Level
ofagreem
entbetweenprim
aryandreassessmentswas
estimated
usingnonparam
etricWilcoxonsigned
rank
test.
¶,The
bivariatecorrelationprocedurewas
used
tocompute
thepairwiseassociations
forscorevalues
ofprim
aryandreassessments.
$,Absoluteagreem
entrepresentstheproportion
ofcore
samples
assessed
equallyin
theprim
aryandreassessments.
**,Correlation
issignificant
atthelevelof
0.01.
††,Correlation
issignificant
atthelevelof
0.05.
‡‡,Correlation
issignificant
atthelevelof
0.001.
§§,Statistical
differencesin
theprim
aryandreassessmentswereestimated
bythenonparam
etricKruskal-W
allistestwhenonly
good/acceptablestaining
qualitieswereincluded.
A,acceptable;G,good;NS,notsignificant;P,poor;SE,standard
errorof
mean;
TMA,tissue
microarray.
J Neuropathol Exp Neurol � Volume 67, Number 2, February 2008 Assessment of >-Synuclein Pathology: A BNE Study
� 2008 American Association of Neuropathologists, Inc. 137

Copyright @ 200 by the American Association of Neuropathologists, Inc. Unauthorized reproduction of this article is prohibited.8
TABLE
7.Assessm
entof
>-Syn
uclein-Positive
Lesion
sin
theStria
tum,TM
ASe
ctionC,Includ
ing12
CoreSa
mples
Assessm
ent
Cod
e*Qualityof
Staining
Neuronal
PerikaryalInclusion
sNeurites/Glial
Cytop
lasm
icInclusion
s
Primary
Assessm
ent,
MeanTSE†
Reassessm
ent,
MeanTSE‡
Wilcoxo
nTest§
Spearm
an(r)¶
Absolute
Agreement,
%$
Primary
Assessm
ent,
MeanTSE†
Reassessm
ent,
MeanTSE‡
Wilcoxon
Test§
Spearm
an(r)¶
Absolute
Agreement,
%$
14G
4.3T0.4
0.3T0.1
**j0.43
82.8T0.3
2.6T0.2
NS
0.72
50
19G
4.2T0.4
0.1T0.1
**0.21
01.6T0.3
1.8T0.4
NS
0.63
50
7G
2.3T0.4
0.2T0.1
**0.10
82.5T0.2
2.5T0.4
NS
0.89
50
13G
1.8T0.5
0.1T0.1
**0.46
252.8T0.5
2.4T0.4
NS
0.80
42
9G
1.6T0.6
0.1T0.1
††0.47
362.8T0.5
2.2T0.5
NS
0.87
45
6G
0.5T0.2
0.0
††§§
582.8T0.3
2.4T0.2
NS
0.56
42
1G
0.4T0.2
0.1T0.1
NS
0.58
752.4T0.4
2.2T0.3
NS
0.84
58
5G
0.1T0.1
0.2T0.2
NS
j0.91
832.2T0.3
2.4T0.5
NS
0.94
42
15A
1.8T0.4
0.1T0.1
**0.32
172.7T0.4
2.5T0.4
NS
0.78
75
20A
0.6T0.2
0.1T0.1
††0.55
452.4T0.4
1.8T0.4
**0.91
55
16A
0.3T0.2
0.2T0.1
NS
0.44
731.7T0.4
1.9T0.4
††0.91
58
2A
0.3T0.1
0.0
NS
§§75
2.3T0.4
1.3T0.2
**0.76
25
18A
0.1T0.1
0.0
NS
§§92
2.3T0.4
2.4T0.3
NS
0.90
75
21A
0.1T0.1
0.0
NS
§§92
2.3T0.4
2.3T0.4
NS
0.72
50
3A
0.0
0.0
§§§§
100
1.8T0.4
2.3T0.4
††0.98
50
17A
0.0
0.0
§§§§
100
1.4T0.4
1.5T0.3
NS
0.67
58
+12
evaluation
sP
K-W
¶¶G
+A
0.000
0.489
0.00
90.248
*,Num
bering
iscomputedaccordingto
ascendingnumbersequence
ofTable
2.†,
Meanvalues
ofthesemiquantitativescores
oflesionsTSEin
theprim
aryassessment(doneby
theBNEparticipants).
‡,Meanvalues
ofthesemiquantitativescores
oflesionsTSEin
thereassessment(doneby
thecoordinating
center).
§,evel
ofagreem
entbetweenprim
aryandreassessmentswas
estimated
usingnonparam
etricWilcoxonsigned
rank
test.
¶,The
bivariatecorrelationprocedurewas
used
tocompute
thepairwiseassociations
forscorevalues
ofprim
aryandreassessments.
$,Absoluteagreem
entrepresentstheproportion
ofcore
samples
assessed
equallyin
theprim
aryandreassessments.
§§,Cannotbe
calculated
becauseat
least1of
thevariablesisconstant.
¶¶,Statistical
differencesin
theprim
aryandreassessmentswereestimated
bythenonparam
etricKruskal-W
allistestwhenonly
good/acceptablestaining
qualitieswereincluded.
**,Correlation
issignificant
atthelevelof
0.01.
††,Correlation
issignificant
atthelevelof
0.05.
A,acceptable;G,good;NS,notsignificant;P,poor;SE,standard
errorof
mean;
TMA,tissue
microarray.
Alafuzoff et al J Neuropathol Exp Neurol � Volume 67, Number 2, February 2008
� 2008 American Association of Neuropathologists, Inc.138

Copyright @ 200 by the American Association of Neuropathologists, Inc. Unauthorized reproduction of this article is prohibited.8
agreement regarding the extent of NPIs ranged from 69% to100% (mean, 82%), and in only 1 core was agreementabsolute. Agreement was even poorer for the primarysemiquantitative assessment of neurites, where all possibleratings were given for 21%, 3 possible ratings for 63%, and 2different scores for 17% of cores. None of the cores achieveda complete agreement. Absolute agreement for NPIs wasexcellent (Q80%) in most cortical core samples (7/8), whereasin substantia nigra in only 1 of 10 core samples and in noneof 6 core samples in amygdala was an excellent agreementachieved. The proportion of matching scores betweenthe primary and reassessment for neurites and threads waseven poorer, achieving excellent values (Q80%) in only 2 of24 cores.
In the striatum, GCIs were easily identified dichoto-mously, and 100% agreement between primary and reassess-ments was achieved in most (8/10) core samples (Table 11).Nonetheless, the semiquantitative assessment of GCIs was
again poorer, so that 2 or more ratings were given for mostcore samples. The absolute agreement between the primaryand reassessment of semiquantitative assessments of GCIsreached excellent agreement (Q80%) in only 3 of 10 coresamples. Neuronal perikaryal inclusions and neurites weremore challenging to identify in this region, and in none of thecores did the absolute agreement of semiquantitative assess-ments reach excellent values.
DISCUSSIONThis interlaboratory study is the first of a series devoted
to problems encountered in the methodology and interpreta-tion of >S-labeled structures. The study was designed toevaluate both the quality of immunostainings and the level ofagreement in assessments. These are important issuesbecause the current guidelines for the assessment of >S-IRstructures emphasize both regional distribution (3) and
TABLE 8. Assessment of >S-Positive Structures in a Single Core When Only Sections of Good/AcceptableStaining Quality Are Included
Core
TMA Block A, Entorhinal Cortex NeuronalPerikaryal Inclusions TMA Block B, Substantia Nigra Neurites
TMA Block C, Striatum GlialCytoplasmic Inclusions
RangeMost Frequent
Score, %Absolute
Agreement, % RangeMost Frequent
Score, %Absolute
Agreement, % RangeMost Frequent
Score, %Absolute
Agreement, %
1A 1Y5 5 (19) 63 0Y3 0 (47) 73 V V V
1B 0Y3 2 (47) 47 0Y1 0 (73) 80 V V V
1C 0Y1 0 (8) 95 1Y3 2 (60) 33 V V V
1D V V V 0Y2 1 (80) 67 V V V
1E V V V 1Y2 1 (73) 67 1Y3 3 (75) 81
1F 0Y2 1 (67) 80 0Y2 1 (47) 53 1Y3 3 (81) 81
1G V V 0Y3 1 (40) 40 V V V
1H 0Y5 0 (53) 68 0Y1 1 (67) 67 V V V
2A 0Y2 1 (50) 61 0Y2 0 (60) 60 0Y3 0 (75) 75
2B 0Y2 1 (74) 79 0Y2 0 (60) 53 0Y3 0 (69) 63
2C 0Y2 1 (53) 79 V V V V V V
2D 1Y5 2 (37) 47 V V V V V V
2E 0Y3 0 (58) 79 V V V V V V
2F 1Y3 2 (47) 68 V V V V V V
2G 0Y2 1 (86) 79 V V V V V V
2H 0Y2 1 (47) 65 V V V 0Y1 0 (81) 38
3A V V V 2Y3 3 (67) 83 2Y3 3 (75) 69
3B V V V V V V V V V
3C V V V 1Y3 1 (47) 27 2Y3 3 (86) 79
3D V V V 0Y2 1 (50) 52 1Y3 3 (81) 44
3E 0Y5 5 (36) 18 V V V 3 3 (100) 63
3F V V V V V V 2Y3 3 (94) 81
4A 0Y3 1 (31) 63 V V V V V V
4B 0Y5 0 (37) 58 V V V V V V
4C 0Y1 0 (89) 89 2Y3 3 (86) 71 V V V
4D 0Y1 0 (94) 94 2Y3 2 (67) 33 0Y3 3 (53) 13
4E 0Y1 1 (83) 61 0Y2 1 (62) 15 0Y3 3 (44) 25
4F 0Y1 0 (72) 72 1Y2 1 (60) 53 V V V
The range of scores, the most frequent score, and its percentage (%) are given for each core sample. Absolute agreement indicates the proportion of matched scores comparingprimary assessment and reassessment values.V, no cores available on these locations.
TMA, tissue microarray.
J Neuropathol Exp Neurol � Volume 67, Number 2, February 2008 Assessment of >-Synuclein Pathology: A BNE Study
� 2008 American Association of Neuropathologists, Inc. 139

Copyright @ 200 by the American Association of Neuropathologists, Inc. Unauthorized reproduction of this article is prohibited.8
TABLE
9.>S-Po
sitiv
eAgg
rega
tesin
aSing
leCoreLevelinTM
ASe
ctionD,Includ
ing34
Cores
(Row
s)Antibod
y15G7(5
Evaluations)
Syn
42(8
Evaluations)
4D6(5
Evaluations)
KM51
(8Evaluations)
Region,
No.
Cores
Core
>SAgg
regates
Density
of>S
Agg
rega
tes
>SAgg
rega
tes
Density
of>S
Agg
regates
>SAgg
rega
tes
Density
of>S
Agg
regates
>SAgg
regates
Density
of>S
Agg
rega
tes
Yes
No
0+
++
+++
Yes
No
0+
++
+++
Yes
No
0+
++
+++
Yes
No
0+
++
+++
Cortex
(n=8)
A1
5V
V2
3V
8V
V6
2V
5V
V4
1V
71
17
VV
B1
5V
VV
V5
8V
VV
V8
5V
VV
V5
62
2V
24
C1
5V
V3
2V
8V
V2
42
5V
V3
2V
8V
V1
52
D1
5V
V2
21
8V
VV
62
5V
V3
2V
8V
V2
51
E1
5V
V5
VV
8V
V6
2V
5V
V4
1V
71
17
VV
F1*
4V
V3
1V
8V
V5
21
5V
V5
VV
62
24
2V
G2
5V
V3
11
8V
V6
2V
5V
V4
1V
8V
V5
3V
H2
5V
V4
1V
8V
V7
1V
5V
V5
VV
8V
V8
VV
Sub
stantia
nigra
(n=10
)
A2
23
31
V1
8V
V1
7V
32
21
2V
8V
V7
1V
B2
5V
VV
41
8V
VV
35
5V
VV
23
8V
VV
44
D2
5V
VV
14
8V
VV
V8
5V
VV
V5
8V
VV
V8
E2
5V
VV
14
8V
VV
17
5V
VV
V5
8V
VV
V8
A3
5V
VV
23
8V
VV
17
5V
VV
14
8V
VV
35
B3
5V
VV
32
8V
VV
53
5V
V1
31
8V
VV
44
C3
5V
V3
1V
8V
V4
4V
5V
V4
1V
8V
V5
3V
D3
5V
VV
V5
8V
VV
26
5V
VV
14
8V
V1
V7
E3
5V
V2
3V
8V
V5
21
5V
V1
4V
8V
V4
31
F3
5V
V5
VV
8V
V5
3V
5V
V5
VV
8V
V8
VV
Striatum
(n=10
)A4
5V
V1
4V
8V
V6
2V
5V
V1
4V
8V
VV
8V
B4
5V
V5
VV
8V
V8
VV
5V
V5
VV
8V
V3
5V
G4
5V
VV
V5
8V
VV
V8
5V
VV
V5
8V
VV
26
A5
5V
VV
41
8V
V1
52
5V
VV
14
8V
V4
4V
B5*
32
21
2V
7V
V3
4V
41
1V
4V
62
24
11
C5
5V
13
1V
8V
VV
53
5V
V1
13
8V
V4
4V
D5
5V
VV
V5
8V
VV
V8
5V
VV
V5
8V
VV
V8
E5
5V
VV
V5
8V
VV
V8
5V
VV
V5
8V
VV
V8
F5*
5V
VV
41
7V
24
15
VV
V2
38
VV
15
2
G5
5V
VV
41
8V
25
15
VV
11
38
VV
34
1
Amyg
dala
(n=6)
C6
5V
V5
VV
8V
VV
53
5V
V3
11
71
14
21
D6
41
13
1V
8V
V1
43
5V
V2
21
8V
V5
3V
E6
5V
V1
4V
8V
V4
4V
5V
V2
3V
8V
V1
52
F6
5V
VV
32
8V
V1
61
5V
VV
5V
8V
V1
34
G6*
4V
VV
4V
8V
VV
44
4V
VV
13
7V
V1
15
H6*
5V
VV
23
7V
V2
55
VV
14
V8
VV
V3
5
*Som
eevaluationsaremissing
dueto
loss
ofcore
samples.
+,some,
needed
tobe
sought
out.
++,moderate,
readilyseen.
+++,numerous.
Colum
nsrepresentdifferentantibodies.Num
bers
givenin
bold
representacompleteagreem
entbetweenevaluations.
>S,>-synuclein;TMA,tissue
microarray.
Alafuzoff et al J Neuropathol Exp Neurol � Volume 67, Number 2, February 2008
� 2008 American Association of Neuropathologists, Inc.140

Copyright @ 200 by the American Association of Neuropathologists, Inc. Unauthorized reproduction of this article is prohibited.8
semiquantitative grading of >S-IR structures (4). To addressthe variability in estimates that might be caused by thetopography (10), we used a 2-mm-punch TMA technique (6).Battifora (11) predicted in 1986 that the TMA techniquewould be of value in large-scale quality control studies. Thesuccess of this technique has recently been confirmed in ourlarge interlaboratory assessment of Alzheimer diseaseYrelatedpathology (8). Furthermore, the advantage of using TMA as atool in interlaboratory quality control trials has beendiscussed by Mengel et al (12), who evaluated the prolifer-ation activity in tumor cells by using Ki-67 IHC in amulticenter study. One significant benefit of using the TMAmethod is that all of the participating observers evaluated thesame regions with only minor, but not significant, variationsdue to the sectioning process. The latter factor was controlledby staining a series of sections from all 4 TMA blocks, andthe results did not significantly differ.
To our surprise, when participating laboratories fol-lowed their own current methodologic practices in visualiz-ing >S-IR structures, the variations were remarkable; some
Abs and specific clones were clearly better than the others.This is consistent with the recent study by Croisier et al (5),who examined the influence of Abs in labeling structures ofdiagnostic relevance. The diverse labeling of IR structuresreported by Croisier et al when the sections were stained in 1laboratory was clearly exaggerated by the multiplicity oflaboratories in the present study. We found that the same Abyielded both good and poor results, indicating that the keyfactor for the quality of staining was not only the Ab but alsothe antigen retrieval method. For example, with transduction-Syn42, the lack of formic acid pretreatment abolished thestaining almost completely. In line with this, Pletnikova et al(13) showed that with this same Ab, formic acid pretreatmentgreatly enhanced the immunoreactivity. Overall, the poorestquality (and, therefore, the lowest counts of >S-IR structures)was obtained with all Abs without pretreatment. Thus, thestandardized use of formic acid and heat pretreatments toenhance the >S immunoreactivity is a prerequisite forobtaining good results with most current commercial Abs(14, 15). In addition to pretreatment, the characteristics of the
TABLE 10. Dichotomized and Semiquantitative Assessment of >S-Positive Structures in the TMA Section D in the Cores of Cortex,Substantia Nigra, and Amygdala
Region,No. Cores Core
Neuronal Perikaryal Inclusions Neurites/Threads
DichotomousAssessment
SemiquantitativeAssessment
DichotomousAssessment
SemiquantitativeAssessment
Yes No
AbsoluteAgreement,
% 01–10
11–20 920
AbsoluteAgreement,
% Yes No
AbsoluteAgreement,
% 0 + ++ +++
AbsoluteAgreement,
%
Cortex(n = 8)
A1 25 1 96 1 23 2 V 88 24 2 92 2 19 5 V 58
B1 24 2 100 2 1 2 21 92 24 2 92 2 2 2 20 54
C1 19 7 62 7 18 V 1 58 26 V 100 V 7 13 6 42
D1 25 1 92 1 23 1 1 85 24 2 92 2 6 13 5 35
E1 18 8 80 8 18 V V 80 25 1 96 1 20 5 V 64
F1* 22 3 92 3 22 V V 92 21 4 84 4 17 4 V 64
G2 25 1 96 1 22 3 V 85 22 4 81 4 19 3 V 62
H2 26 96 V 26 V V 100 19 7 69 7 16 3 V 58
Substantianigra(n = 10)
A2 19 7 72 7 18 1 V 68 16 10 88 10 9 5 2 80
B2 26 V 100 V 5 13 8 33 26 V 100 V 3 17 6 48
D2 26 V 100 V V 4 22 58 26 V 100 V V 5 21 69
E2 26 V 100 V 2 3 21 38 26 V 100 V V 5 21 69
A3 26 V 100 V 7 12 7 69 26 V 100 V 1 11 14 75
B3 26 V 96 V 17 9 V 62 26 V 100 V 1 12 13 50
C3 20 6 81 6 20 V V 81 25 1 96 1 14 11 V 65
D3 26 V 100 V 5 11 10 27 26 V 100 V 1 6 19 58
E3 24 2 77 2 22 V 2 69 26 V 96 V 15 11 V 62
F3 26 V 73 V 24 2 V 65 25 1 96 1 23 2 V 77
Amygdala(n = 6)
C6 24 2 88 2 14 9 1 58 22 4 96 4 10 7 5 81
D6 24 2 88 2 12 6 6 38 22 4 88 4 10 7 5 62
E6 26 V 100 V 14 12 V 69 26 V 100 V 8 15 3 65
F6 26 V 100 V 7 17 2 69 26 V 100 V 4 14 8 65
G6* 23 V 100 V 7 7 9 59 23 V 100 V 1 11 11 41
H6* 25 V 100 V 10 5 10 52 25 V 100 V V 9 16 48
*Some evaluations are missing due to loss of core samples.+, some, needed to be sought out.++, moderate, readily seen.+++, numerous.TMA, tissue microarray.
J Neuropathol Exp Neurol � Volume 67, Number 2, February 2008 Assessment of >-Synuclein Pathology: A BNE Study
� 2008 American Association of Neuropathologists, Inc. 141

Copyright @ 200 by the American Association of Neuropathologists, Inc. Unauthorized reproduction of this article is prohibited.8
tissue (i.e. fixation time and postmortem delay) seemed toinfluence the staining results significantly. It was noted, forexample, that when samples were fixed for more than 6months, staining was abolished with certain pretreatmentstrategies. This indicates that the IHC labeling of >S in fixedbrain tissue is more complex than is currently appreciated,and further assessment of the influence of tissue character-istics on the quality of >S labeling is urgently required.
Even when only good and acceptable stainings wereincluded, the assessments of the 15 to 17 BNE participants inthe first phase differed significantly for all types of IRstructures in each anatomic region. This is partly explainedby diverse categorization of the labeled structures. In the firstphase, the raters were asked to interpret the stained structuresand assess them according to criteria from the currentliterature without receiving any additional detailed descrip-tions. The variability among observers of these assessmentsof >S-IR structures was clearly evident during the jointevaluation of stained sections performed around a multi-headed microscope.
Interestingly, in almost all regions, the variability in thereassessments diminished in the second phase. This isexplained by the stringency in the evaluation criteria for thereassessor, and most importantly, when there were strictcriteria for the categorization of IR structures. Both fromslide to slide and from staining to staining, the interpretationsof IR structures were more uniform. However, there were stillsignificant differences in the reassessment of neurites/GCIs inthe cortex and problems in the reassessment of all IRstructures in the amygdala. The differences found in assess-ing IR structures might partly be explained by the variousAbs used (5). In approximately half of the good/acceptablestainings, when current methodologic practices were applied,we found a significant difference between the primary and
the reassessment. Although the correlations between assess-ments were relatively good in most examined areas, therewere significant differences between the semiquantitativeassessments. Thus, even if the 2 raters (primary andreassessor) detected >S-IR structures in the same cores, theytended to score them differently. The BNE centers occasion-ally assessed the NPIs more generously than the reassessor inall of the examined brain regions. Hence, the question arisesas to why different evaluations give discordant ratings for thesame IR structures. As discussed above, this is partly due tovariations in the interpretation and categorization of thelabeled structures. In addition, in many instances, the heavystaining of background in a synaptophysin-like manner madeit very difficult to discern labeled structures. When thisoccurred, the counting or rating of labeled structures becamearbitrary and not reproducible.
In contrast, in the second phase, when designatedmethodologic instructions were applied both regarding thechoice of Ab and particularly the antigen retrieval method,concordant and reliable >S IHC staining results wereachieved by the different laboratories. The Abs used hereare not the only good Abs available, but each productrequires thorough testing, and, moreover, each staining batchshould include a good positive control. In addition, adherenceto continuous quality control is advisable.
Regretfully, our results in the second phase followingdesignated methodologic instructions indicated that evenwhen the staining quality was optimal, there were limitationsin what could be expected of a semiquantitative assessmentof the >S-IR structures. In contrast, concordance betweenraters was found to be good with a dichotomous assessment.In particular, when disregarding the type of IR structures andonly assessing the overall presence or absence of >S-IR (NPI+ neurite + GCI), a very high level of agreement was reached
TABLE 11. Dichotomized and Semiquantitative Assessment of >S-Positive Structures in TMA Section D in 10 Cores of Striatum
Region,No. Cores Core
Glial Cytoplasmic InclusionsPerikaryal Neuronal
Inclusions Neurites/Threads
Dichotomous Assessment Semiquantitative Assessment Dichotomous Assessment Dichotomous Assessment
Yes No
AbsoluteAgreement,
% 0 + ++ +++
AbsoluteAgreement,
% Yes No
AbsoluteAgreement,
% Yes No
AbsoluteAgreement,
%
Striatum(n = 10)
A4 26 V 100 V 8 18 V 62 11 15 58 10 16 58
B4 26 V 100 V 21 5 V 73 11 15 62 9 17 73
G4 26 V 100 V V 2 24 88 17 9 62 21 5 85
A5 26 V 100 V 5 14 7 54 19 7 62 15 11 81
B5* 20 5 96 5 8 11 1 63 6 19 79 6 19 79
C5 25 1 96 1 8 11 6 65 6 20 62 4 22 77
D5 26 V 100 V V V 26 100 19 7 77 18 8 77
E5 26 V 100 V V V 26 100 22 4 85 17 9 73
F5* 25 V 100 V 3 15 7 50 6 19 67 8 17 71
G5 26 V 100 V 6 14 6 54 6 20 77 12 14 69
evaluations are missing due to loss of core samples.+, some, needed to be sought out.++, moderate, readily seen.+++, numerous.TMA, tissue microarray.
Alafuzoff et al J Neuropathol Exp Neurol � Volume 67, Number 2, February 2008
� 2008 American Association of Neuropathologists, Inc.142
*Some

Copyright @ 200 by the American Association of Neuropathologists, Inc. Unauthorized reproduction of this article is prohibited.8
by the 26 evaluators. The study by Muller et al (16) alsoaddressed interrater variability by undertaking a dichotom-ized assessment of >S-IR, and they found a good interraterreliability when the 5 raters evaluated one and the same set ofstained sections. When our participants assessed 26 stainedsections, they achieved a high agreement level not onlyoverall but also when the raters were asked to identifydifferent types of IR structures (NPIs, neurites, and GCIs). Inthe recently revised consensus guidelines of DLB (5), inaddition to regional distribution and dichotomized assess-ment, significant emphasis is assigned to the semiquantitativeassessment of >S-IR structures. As shown here, this kind ofquantitative classification is prone to problems. All raterswith expertise and practice reached full agreement inassessing NPIs in only 1 core sample of 24. Interestingly,however, when assessing NPIs in 8 cortical samples, theagreement in semiquantitative assessments was quite high(mean, 82%) when compared with other brain regions.Semiquantitative assessment of neurites never yielded fullagreement because 2 or more possible ratings were given inall core samples. Based on the poor agreement in thesemiquantitative assessment of both NPIs and neurites, webelieve that a high concordance following the currentconsensus criteria of DLB might be difficult to achieve inan interlaboratory setting.
Immunohistochemistry has been used since the 1980sas a diagnostic tool, although it is known to be capricious.This is well illustrated in our study, where the resultsdepended on the characteristic of the tissue, staining quality,and the expertise of the evaluator. The first phase of our trialclearly highlights the urgent need to acknowledge all pitfallsregarding >S IHC, that is, those related to characteristics ofthe tissue methodology and categorization of the >S-IRstructures. The second phase of our trial indicates that even iftraining and standardizing methodology are prerequisites toachieving reliable results between different laboratories, thereare still limitations that need to be acknowledged regardingthe scoring of labeled structures.
ACKNOWLEDGMENTSThe authors thank Helen C. Cairns, Frances Carnie,
Lynne Christian, Louisa Djerbib, Helga Flicker, TarjaKauppinen, Maria Kemerli, M. Kooreman, Tanja Treutlein,A. Van den Berg, J. Wouda and all other laboratorytechnicians of BNE members for their skillful technicalassistance; Vesa Kiviniemi for his assistance in statistics;Ewen MacDonald for critical reading of the article; and
Dr Kirstin Goldring, manager of the UK Parkinson’sDisease Society Tissue Bank.
The study has been authorized by the Ethics Committeeof Kuopio University Hospital.
REFERENCES1. Spillantini MG, Crowther RA, Jakes R, et al. Filamentous alpha-
synuclein inclusions link multiple system atrophy with Parkinson’sdisease and dementia with Lewy bodies. Neurosci Lett 1998;251:205Y8
2. Gilman S, Low PA, Quinn N, et al. Consensus statement on thediagnosis of multiple system atrophy. J Neurol Sci 1999;163:94Y98
3. Braak H, Del Tredici K, Rub U, et al. Staging of brain pathology relatedto sporadic Parkinson’s disease. Neurobiol Aging 2003;24:197Y211
4. McKeith IG, Dickson DW, Lowe J, et al. Diagnosis and management ofdementia with Lewy bodies: third report of the DLB Consortium.Neurology 2005;65:1863Y72
5. Croisier E, MRes DE, Deprez M, et al. Comparative study ofcommercially available antiYalpha-synuclein antibodies. NeuropatholAppl Neurobiol 2006;32:351Y56
6. Kononen J, Bubendorf L, Kallioniemi A. Tissue microarrays forhigh-throughput molecular profiling of tumor specimens. Nat Med1998;4:844Y47
7. Kauppinen T, Martikainen P, Alafuzoff I. Human post mortem braintissue and 2-mm tissue microarrays. Appl Immunohistochem MolMorphol 2005;14:353Y59
8. Alafuzoff I, Pikkarainen M, Al-Sarraj S, et al. Interlaboratory compar-ison of assessments of Alzheimer diseaseYrelated lesions: A study of theBrainNet Europe Consortium. J Neuropathol Exp Neurol 2006;65:740Y57
9. Kuusisto E, Parkkinen L, Alafuzoff I. Morphogenesis of Lewy bodies:Dissimilar incorporation of alpha-synuclein, ubiquitin, and p62. JNeuropathol Exp Neurol 2003;62:1241Y53
10. Mirra SS, Gearing M, McKeel DW Jr, et al. Interlaboratory comparisonof neuropathology assessments in Alzheimer’s disease: A study of theConsortium to Establish a Registry for Alzheimer’s Disease (CERAD). JNeuropathol Exp Neurol 1994;53:303Y15
11. Battifora H. The multitumor (sausage) tissue block: Novel methodfor immunohistochemical antibody testing. Lab Invest 1986;55:244Y48
12. Mengel M, von Vasielewski R, Wiese B, et al. Inter-laboratory andinter-observer reproducibility of immunohistochemical assessment of theKi-67 labeling index in a large multicentre trail. J Pathol 2002;198:292Y99
13. Pletnikova O, West N, Lee MK, et al. AA deposition is associated withenhanced cortical >-synuclein lesions in Lewy body diseases. NeurobiolAging 2005;26:1183Y92
14. Hladik CL, White CL. Comparison of digestive enzyme and formic acidpretreatment for optimal immunohistochemical demonstration of alpha-synucleinYimmunoreactive cerebral cortical Lewy neuritis. J Neuro-pathol Exp Neurol 2003;62:554
15. Takeda A, Hashimoto M, Mallory M, et al. Abnormal distribution of thenon-Abeta component of Alzheimer’s disease amyloid precursor/alpha-synuclein in Lewy body disease as revealed by proteinase K and formicacid pretreatment. Lab Invest 1998;78:1169Y77
16. Muller CM, de Vos RAI, Maurage C-A, et al. Staging of ParkinsondiseaseYrelated >-synuclein pathology: Inter- and intra-rater reliability. JNeuropathol Exp Neurol 2005;64:623Y28
J Neuropathol Exp Neurol � Volume 67, Number 2, February 2008 Assessment of >-Synuclein Pathology: A BNE Study
� 2008 American Association of Neuropathologists, Inc. 143