Location Quotient
21
Location-Quotient Analysis and Porter’s Cluster Identification Chart Economic Based Theory Urban Planning
-
Upload
teknologimalaysia -
Category
Documents
-
view
0 -
download
0
Transcript of Location Quotient

Location-Quotient Analysis and
Porter’s Cluster Identification Chart
Economic Based Theory
Urban Planning


Introduction: Location-Quotient (LQ) is a method to analyse a region’s economic condition. The main functions are: i. to identify the main
(specialized/core/basic) economic sectors of a region,
ii. to evaluate condition of each economic sector (Strong & Growing, Weak & Growing, Strong but Declining, or Weak and Declining)
iii. to evaluate the impact of new investment or development.
Location-Quotient’s Formula
Definition: LQ is the ratio of an industry share of local economy, compared to a larger region (referenced region) economy. Ex. A state economy compared to its nation/contry (referenced) economy.

Economic Based Theory & Interpretation of LQ
LQ Interpretation Industries with: • LQ’s > 1 (Basic Industries, Exporter, Specialized) • LQ’s < 1 (Non-Basic Industries, Importer) • LQ’s = 1 (Non-Basic Industries, Self-Sufficient)
Economic Base Theory • LQ model is outlined based on the
principles accepted in Economic Based Theory.
• This theory assume that all economic activities can be categorized either as basic or non-basic sector.
• Local economic strength and growth depend very much depend on its basic sectors. Basic sectors (exports) are the “engine” of a region economic growth. Thus, any development of basic sector will also catalyst or have spill over effect on non-basic sectors.
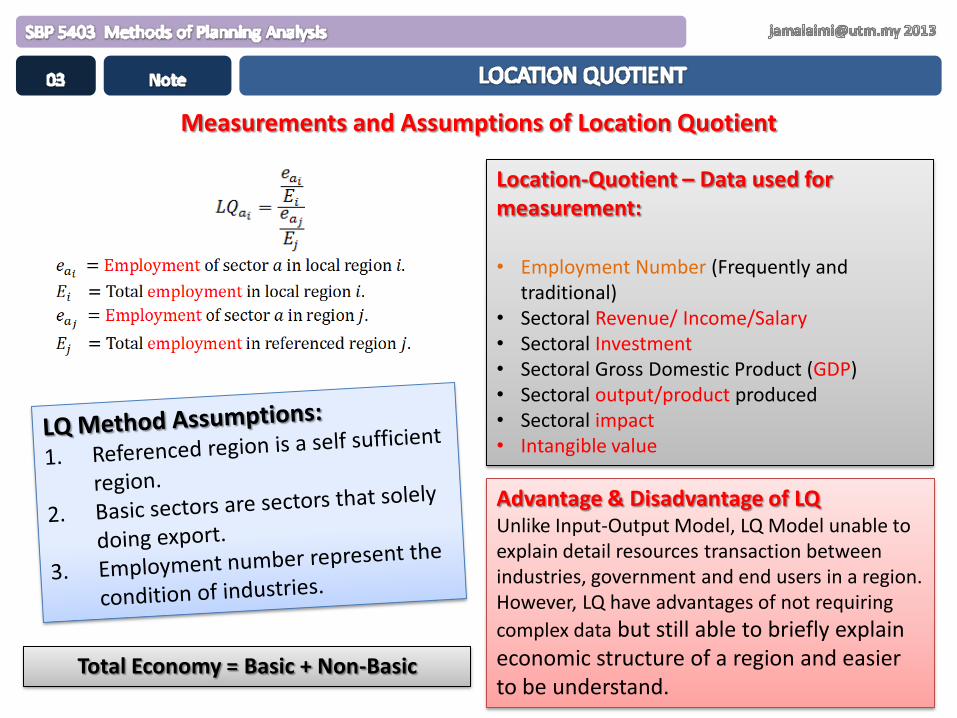
Measurements and Assumptions of Location Quotient
Location-Quotient – Data used for measurement:
• Employment Number (Frequently and
traditional) • Sectoral Revenue/ Income/Salary • Sectoral Investment • Sectoral Gross Domestic Product (GDP) • Sectoral output/product produced • Sectoral impact • Intangible value
Total Economy = Basic + Non-Basic
Advantage & Disadvantage of LQ Unlike Input-Output Model, LQ Model unable to explain detail resources transaction between industries, government and end users in a region. However, LQ have advantages of not requiring
complex data but still able to briefly explain economic structure of a region and easier to be understand.

LQ Analysis and Employment Data
Location-Quotient’s Formula
Given are number of employment based on economic sectors of District i and State j on 2000 and 2010. Based on these data: i. Determine core (basic) and supporting
(non-basic) economic sector for District i in year 2010.
ii. Analyze the condition of each economic sector, whether growing or declining in year 2010, and discuss possible mitigation actions for each sector.
iii. Calculate the based multiplier for District i in 2010, and what is the effect if there are new investment that create 10000 new employment in service sector?
iv. Why economic analysis is important for planner in planning an urban area?
(10 carry marks) * Make your answer straight forward and discussions as
comprehensive as possible, Submit on the following week.
Economic Sector
Employment Number (000') District i State j
2000 2010 2000 2010 Services 24 29 84 100 Manufacturing 30 47 102 125 Mining 9 7 52 52 Forestry 6 17 40 81 Total Employment 69 101 278 357

Qi: STEP 1 : Apply the LQ formula 1. Add a new column named LQ 2010 into the data
table. 2. Apply the LQ formula as given just for 2010 data as
required in question.
i. Determine core (basic) and supporting (non-basic) economic sector for District i in year 2010.

Qi: STEP 2: Deter Basic and Non-Basic Sectors 1. Based on the LQ value calculated, categorized each
sectors into the below categorization: • LQ’s > 1 (Basic Industries, Exporter, Specialized) • LQ’s < 1 (Non-Basic Industries, Importer) • LQ’s = 1 (Non-Basic Industries, Self-Sufficient)
Answer Qi:
Services and Manufacturing with LQ value more than 1.00 are the Basic or Core Economic sectors for District i with export based, while Mining and Forestry are both Non-Basic.

ii. Analyze the condition of each economic sector, whether growing or declining in year 2010.
Qii: STEP 1 : Calculate LQ of year t and t-1 1. Add a new column named LQ 2000 into the data table. 2. Apply the LQ formula to calculate LQ value of each
sector for year 2000. 3. Deter whether they are Basic or a non-basic sector.

Qii: STEP 2 : Calculate Differences in LQ 2000 and LQ2010
1. Calculate LQ for each sector for both year t and t-1 which respectively year 2010 and 2000. 2. Next, calculate the differences in value of LQ2000 and LQ 2010 by using the following formula:
∆ LQ2010-2000 = LQ2010 - LQ2000 3. Negative value shows negative growth, while positive value show positive growth for
respective sectors.
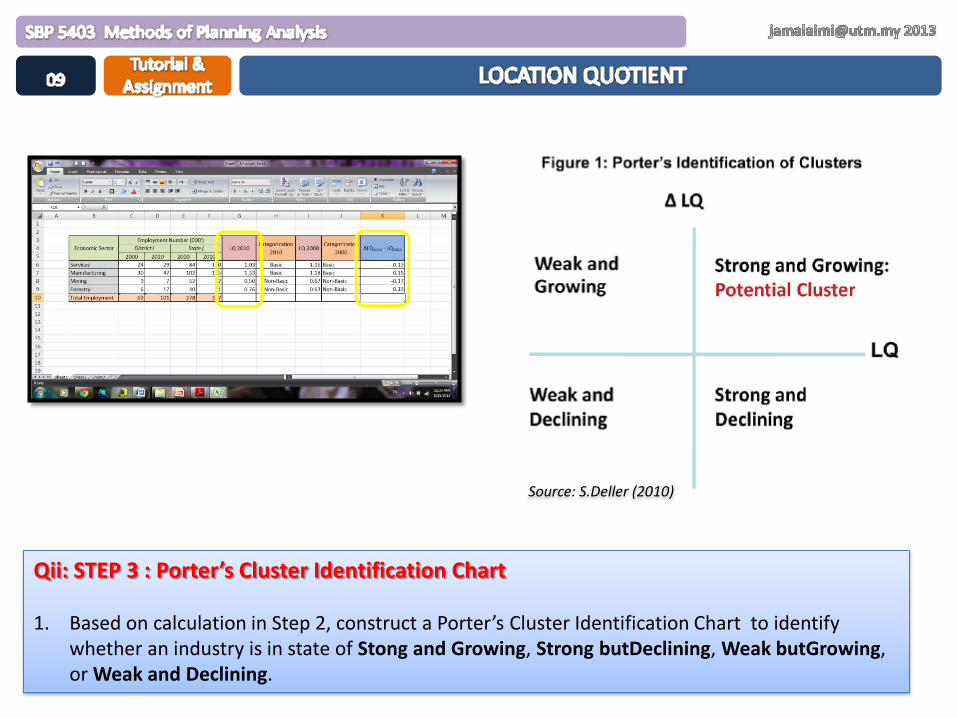
Qii: STEP 3 : Porter’s Cluster Identification Chart
1. Based on calculation in Step 2, construct a Porter’s Cluster Identification Chart to identify
whether an industry is in state of Stong and Growing, Strong butDeclining, Weak butGrowing, or Weak and Declining.
Source: S.Deller (2010)

Qii: STEP 4 : Constructing Porter’s Cluster Identification Chart
1. To constuct Porter’s Chart in Microsoft Excel, select the Insert Tab > Others Chart > Bubble
Chart.

Qii: STEP 5 : Constructing Porter’s Cluster Identification Chart
1. For Series X Value, select columnLQ2010. 2. For Series Y Value, select column ∆ LQ2010-2000. 3. For Series Buble Size, select column No. of Employment of District i on 2010.

Qii: STEP 6 : Constructing Porter’s Cluster Identification Chart
1. Under Chart Tools > Layout > Axes > Primary Horizontal Axis > Option. 2. Under Vertical Axis Crosses > Axis Value = 1.0

Answer Qii: Intrepertation of Porter’s Cluster Identification Chart
1. Based on the Porter’s Chart plotted for District i, Manufacturing is identified as a strong and
growing industry in the future, Services Industry is strong but Declining, Forestry is weak but growing, while Mining Industry in District i is weak and continuing to decline from year 2000 to 2010 and expected to continue declining. ++ Discussions on mitigation actions for each sector…
-0.25
-0.20
-0.15
-0.10
-0.05
0.00
0.05
0.10
0.15
0.20
0.25
0.00 0.50 1.00 1.50 2.00 LQ
LQ Changes
Manufacturing
Services Mining
Forestry

Possible Actions to be Taken
-0.25
-0.20
-0.15
-0.10
-0.05
0.00
0.05
0.10
0.15
0.20
0.25
0.00 0.50 1.00 1.50 2.00 LQ
LQ Changes
Manufacturing
Services Mining
Forestry

iii. Calculate the based multiplier for District i in 2010 and what is the effect if there are new investments that create 10 (000’) new employment in service sector in year 2010?
Qiii: Finding Impact of a new investment to regional economy.
1. Based on the above formula, multiplier for District i in year 2010 is 1.32. Which means, for every
1 new employment in Basic sector, will generate 0.32 (1.32-1.00) new employment in Non-Basic Sectors.

Answer Qiii: Impact of 10,000 new employments in Service (Basic) sector.
In year 2010, 10,000 new employment in the Service (Basic) sectors, have trigger another 3,246 new employments in total in other non-basic sectors due to multiplier and economic spill over effect. Resulting in total of 13,246 new employments created in District i due to the new investment in year 2010.
Thus, TotalNewEmployment2010 = New Basic + New Non-Basic
= 10,000 + 3246 = 13246


Book Wang, X. & Hofe, R.V. ,(2007) Research Methods in Urban and Regional Planning. Springer Berlin Heidelberg, New York. ISBN 978-3-540-49657-1. Article S.Deller. (2010) Location-Quotients and TRED. University of Wisconsin. Obtain from http://nercrd/psu.edu/TRED/index.html on April 2012. Excel Maria Langer (1999) Excel 2000 for Windows; Visual Quick Start Guide, Peachpit Press (HF 5548.4 M523 L36 1999 c.1) 15 Palani Murugappan (2002) EXCEL; Functions for the daily serve, Venton publishing (HF 5548.4. M523 P36 2002 c.1)
THANK YOU

• When LQ = 1 (Self-Sufficiency) the local economy is the same as the share of that industry in the national economy
--In this situation, a given industry’s share of.
--Local production is assumed to be just sufficient to meet local demand, so all of the employment in this industry is considered Non-Basic.
• When LQ < 1 (Net Imports)
--In this situation, a given industry’s share of the local economy is less than the share of that industry in the national economy.
--Local production is assumed to be insufficient to meet local demand, so all of this employment is considered Non-Basic.
• When LQ > 1 (Net Exports)
--In this situation, a given industry’s share of the local economy is greater than the share of that industry in the national economy.
--Local employment is concentrated in these industries (relative to the nation) and is therefore assumed to exceed local demand and any excess production is exported.
--With an LQ > 1, that proportion of the industry that accounts for this excess production is considered Basic Employment.