On the quotient of the regularized determinant of two elliptic operators

B R A I N R E S E A R C H 1 0 7 9 ( 2 0 0 6 ) 4 7 – 5 6
ava i l ab l e a t www.sc i enced i rec t . com
www.e l sev i e r. com/ l oca te /b ra in res
Research Report
PredictingAutismSpectrumQuotient (AQ ) fromtheSystemizingQuotient-Revised (SQ-R) and Empathy Quotient (EQ )
S. Wheelwright a, S. Baron-Cohena,⁎, N. Goldenfeld b, J. Delaney a,D. Fine a, R. Smitha, L. Weil a, A. Wakabayashi c
aAutism Research Centre, Department of Psychiatry, University of Cambridge, Douglas House, 18b Trumpington Rd., Cambridge CB2 2AH, UKbDepartment of Physics, University of Illinois at Urbana-Champaign, 1110 West Green Street, Urbana, IL 61801, USAcDepartment of Psychology, Chiba University, 1-33 Yayoi-cho, Inage, Chiba 263-8522, Japan
A R T I C L E I N F O
⁎ Corresponding author.E-mail address: [email protected] (S. Baro
0006-8993/$ – see front matter © 2006 Elsevidoi:10.1016/j.brainres.2006.01.012
A B S T R A C T
Article history:Accepted 1 January 2006Available online 13 February 2006
Background: Empathizing is a specific component of social cognition. Empathizing is alsospecifically impaired in autism spectrum condition (ASC). These are two dimensions,measurable using the Empathy Quotient (EQ) and the Autism Spectrum Quotient (AQ). ASCalso involves strong systemizing, a dimension measured using the Systemizing Quotient (SQ).The present study examined the relationship between the EQ, AQ and SQ. The EQ and SQ havebeen used previously to test for sex differences in 5 ‘brain types’ (Types S, E, B and extremes ofType S or E). Finally, peoplewith ASC have been conceptualized as an extreme of themale brain.Method: We revised the SQ to avoid a traditionalist bias, thus producing the SQ-Revised (SQ-R). AQ and EQ were not modified. All 3 were administered online. Sample: Students (723males, 1038 females) were compared to a group of adults with ASC group (69 males, 56females). Aims: (1) To report scores from the SQ-R. (2) To test for SQ-R differences amongstudents in the sciences vs. humanities. (3) To test if AQ can be predicted from EQ and SQ-Rscores. (4) To test for sex differences on each of these in a typical sample, and for the absenceof a sex difference in a sample with ASC if both males and females with ASC are hyper-masculinized. (5) To report percentages ofmales, females and peoplewith an ASCwho showeach brain type. Results:AQ score was successfully predicted from EQ and SQ-R scores. In thetypical group, males scored significantly higher than females on the AQ and SQ-R, and loweron the EQ. The ASC group scored higher than sex-matched controls on the SQ-R, andshowed no sex differences on any of the 3measures. More than twice asmany typical malesas females were Type S, andmore than twice asmany typical females asmales were Type E.The majority of adults with ASC were Extreme Type S, compared to 5% of typical males and0.9% of typical females. The EQ had a weak negative correlation with the SQ-R. Discussion:Empathizing is largely but not completely independent of systemizing. The weak butsignificant negative correlation may indicate a trade-off between them. ASC involvesimpaired empathizing alongside intact or superior systemizing. Future work shouldinvestigate the biological basis of these dimensions, and the small trade-off between them.
© 2006 Elsevier B.V. All rights reserved.
Keywords:EmpathizingSystemizingAutism Spectrum Quotient
n-Cohen).
er B.V. All rights reserved.

48 B R A I N R E S E A R C H 1 0 7 9 ( 2 0 0 6 ) 4 7 – 5 6
1. Introduction
1.1. Empathizing: a specific component of social cognition
Social cognition is too broad a construct to be useful. This isbecause social information derives from very different sources(e.g., faces, voices, actions), and the information conveyedmaybe of different types (e.g., emotional, intentional, bodily cues,social rules). Finally, the demands of a situation may requiredifferent psychological processes (e.g., emotion–recognition,attribution of intent, identity recognition, lip-reading or gaze-following). For this reason, research has tended to focus onspecific aspects of social cognition.
Empathizing is one such specific component of socialcognition. Empathizing is defined as the drive to identifyanother person's emotions and thoughts, and to respond tothese with an appropriate emotion (Baron-Cohen, 2003). Werefer to it as a drive rather than an ability, butwe recognize thatit may be a mix of these, since our ability tends to reflect howstrong our drive is in a particular area. When we use the term‘drive’, we also do not make any claim as to how much of thisstems from innate or experiential factors, since there havebeen insufficient studies into the heritability of empathy. It isalso apparent that one's level of empathy can be influenced bya range of situational factors (e.g., fatigue, threat, alcohol ormood can all temporarily reduce one's empathy), individualdifferences (e.g., sex, females tending to score better on tests ofempathy) (Baron-Cohen and Wheelwright, 2004) and neuro-logical conditions (e.g., autism and psychopathy both entailreduced empathy (Baron-Cohen, 1995; Blair, 1995). The keyfeature we wish to highlight is that empathizing is a dimensionalong which individuals differ. For this reason, the EmpathyQuotient (EQ), a self-report questionnaire, has been developedto measure such individual differences (Baron-Cohen andWheelwright, 2004). Other empathy measures (such as theInterpersonal Reactivity Index)have also beenused (seeBaron-Cohen and Wheelwright for a review of these).
The value of isolating empathizing as a specific componentfor studywithin social cognition is three-fold. First, neuroimagingstudies reveal a unique set of brain regions involved inrecognizing other's emotions and mental states (Baron-Cohenet al., 1994, 1999; Brothers, 1990; Frith and Frith, 2001), key amongthese being the medial- and orbito-frontal cortex and theamygdala. Secondly, sex differences in the general populationsuggest that both experiential, hormonal and even geneticfactors underpin empathizing (Hughes and Cutting, 1999;Knickmeyer et al., 2005). Thirdly, and as mentioned earlier, theneurodevelopmental condition of autism involves a specificimpairment in empathy (Baron-Cohen and Wheelwright, 2004).The study of empathizing therefore holds the promise not only ofcasting light on this most important of human characteristics,but on sexual dimorphism in the brain and the neural basis of amajor medical condition.
1.2. The Autism Spectrum Quotient
The diagnosis of an autism spectrum condition (ASC) involvesdifficulties in social development and communication, along-side the presence of unusually strong repetitive behavior or
‘obsessive’ interests (A.P.A., 1994; I.C.D-10, 1994). Autistic traitsare found not only at a high level in people with suchdiagnoses but are also found on a continuum at lower levelsthroughout the population. This continuum is revealed usinga second instrument, the Autism Spectrum Quotient (AQ),which measures such individual differences (Baron-Cohen etal., 2001). There are other instruments that have beendeveloped to measure autistic traits (see Baron-Cohen et al.,2001 for a review) but the AQ is specifically designed for self-report by adults with an IQ in the average range or above.
1.3. Systemizing
ASC not only involves difficulties in empathy, but alsoinvolves a strong drive to ‘systemize’ (Baron-Cohen, 2002).Systemizing is defined as the drive to analyze, understand,predict, control and construct rule-based systems. It is ofinterest that while a female advantage is seen on the EQ, amale advantage is seen on the self-report questionnaire thatmeasures individual differences in systemizing, the System-izing Quotient (SQ) (Baron-Cohen et al., 2003). While manytests are relevant to systemizing (such as map-reading,intuitive physics or mathematics), the value of the SQ is thatit cuts across these separate examples of systemizing to lookat an individual's interest in a range of systems. Findingopposite patterns of sex differences on the EQ and SQ suggeststhat empathizing and systemizing are independent of eachother. However, given that ASC appears to involve both strongsystemizing and impaired empathizing suggests that theremay be important neurobiological links between these.
To date, only one study has used both the SQ and EQ in thesame sample (Baron-Cohen et al., 2003), and no study so farhas used all 3 questionnaires (SQ, EQ, AQ) on the sameindividuals to understand how these relate to each other. Oneaim of the present study is to test if an individual's AQ scorecan be predicted from their EQ and SQ scores. If it can be, thissuggests that ASC is determined by the specific combinationof these two dimensions.
1.4. The E–S and EMB theories
The Empathizing–Systemizing (E–S) theory of typical sexdifferences (Baron-Cohen, 2002) proposes that more femalesthan males show the profile of empathizing being strongerthan systemizing (E N S, also referred to a Type E), and moremales than females show the opposite profile (S N E, or Type S).The ‘extreme male brain’ (EMB) theory (Baron-Cohen, 2002)holds that the cognitive profile seen in ASC is an extreme ofthat seen in typicalmales. That is, they should have the profileS NN E (or Extreme Type S). Furthermore, if this applies to ASCas a whole, then the typical sex difference in the generalpopulation should not be found.
These predictions have been confirmed (Baron-Cohen et al.,2003; Baron-Cohen and Wheelwright, 2004). On the EQ, femalesin the general population score 47.2 (SD = 10.2), which issignificantly higher than the male mean of 41.8 (SD = 11.2),while people with ASC score significantly lower than typicalmales, with a mean score of 20.4 (SD = 11.6). On the SQ, typicalmales score a mean of 30.3 (SD = 11.5), which is significantlyhigher than themean for typical females of 24.1 (SD = 9.5). People
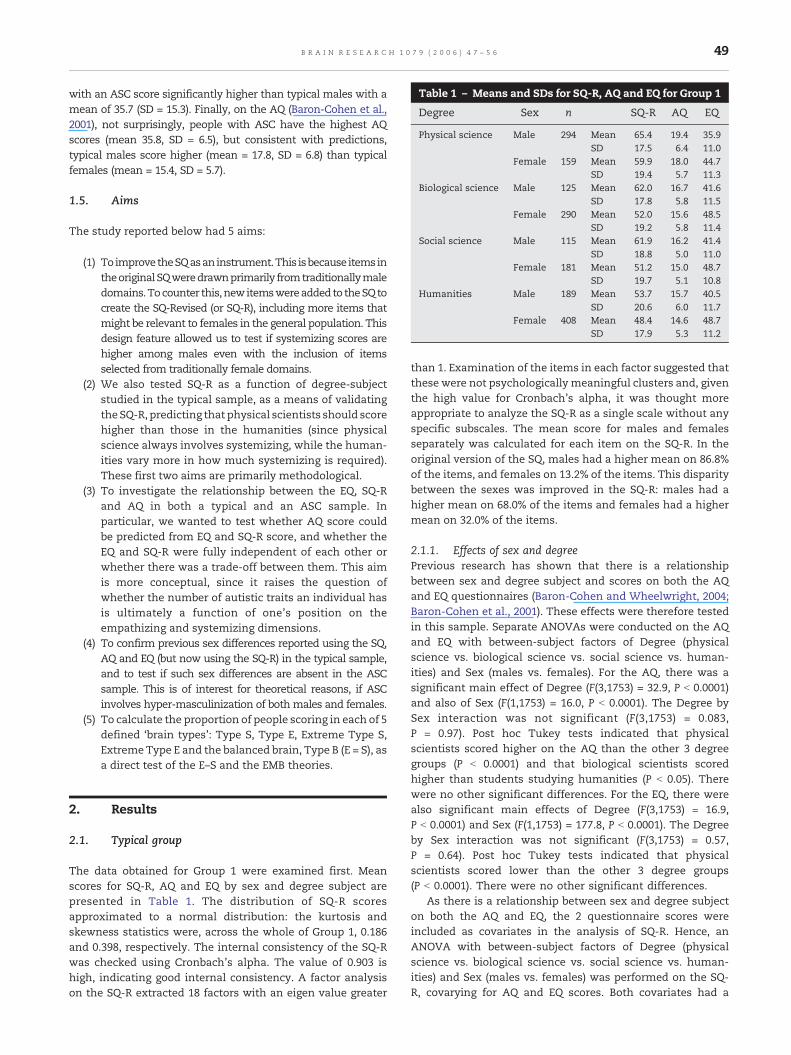
Table 1 – Means and SDs for SQ-R, AQ and EQ for Group 1
Degree Sex n SQ-R AQ EQ
Physical science Male 294 Mean 65.4 19.4 35.9SD 17.5 6.4 11.0
Female 159 Mean 59.9 18.0 44.7SD 19.4 5.7 11.3
Biological science Male 125 Mean 62.0 16.7 41.6SD 17.8 5.8 11.5
Female 290 Mean 52.0 15.6 48.5SD 19.2 5.8 11.4
Social science Male 115 Mean 61.9 16.2 41.4SD 18.8 5.0 11.0
Female 181 Mean 51.2 15.0 48.7SD 19.7 5.1 10.8
Humanities Male 189 Mean 53.7 15.7 40.5SD 20.6 6.0 11.7
Female 408 Mean 48.4 14.6 48.7SD 17.9 5.3 11.2
49B R A I N R E S E A R C H 1 0 7 9 ( 2 0 0 6 ) 4 7 – 5 6
with an ASC score significantly higher than typical males with amean of 35.7 (SD = 15.3). Finally, on the AQ (Baron-Cohen et al.,2001), not surprisingly, people with ASC have the highest AQscores (mean 35.8, SD = 6.5), but consistent with predictions,typical males score higher (mean = 17.8, SD = 6.8) than typicalfemales (mean = 15.4, SD = 5.7).
1.5. Aims
The study reported below had 5 aims:
(1) To improvetheSQasaninstrument.This isbecause itemsintheoriginalSQweredrawnprimarily fromtraditionallymaledomains.Tocounter this,newitemswereaddedto theSQtocreate the SQ-Revised (or SQ-R), including more items thatmight be relevant to females in the general population. Thisdesign feature allowed us to test if systemizing scores arehigher among males even with the inclusion of itemsselected from traditionally female domains.
(2) We also tested SQ-R as a function of degree-subjectstudied in the typical sample, as a means of validatingtheSQ-R, predicting that physical scientists should scorehigher than those in the humanities (since physicalscience always involves systemizing, while the human-ities vary more in how much systemizing is required).These first two aims are primarily methodological.
(3) To investigate the relationship between the EQ, SQ-Rand AQ in both a typical and an ASC sample. Inparticular, we wanted to test whether AQ score couldbe predicted from EQ and SQ-R score, and whether theEQ and SQ-R were fully independent of each other orwhether there was a trade-off between them. This aimis more conceptual, since it raises the question ofwhether the number of autistic traits an individual hasis ultimately a function of one's position on theempathizing and systemizing dimensions.
(4) To confirm previous sex differences reported using the SQ,AQ and EQ (but now using the SQ-R) in the typical sample,and to test if such sex differences are absent in the ASCsample. This is of interest for theoretical reasons, if ASCinvolves hyper-masculinization of bothmales and females.
(5) To calculate the proportion of people scoring in each of 5defined ‘brain types’: Type S, Type E, Extreme Type S,Extreme Type E and the balanced brain, Type B (E = S), asa direct test of the E–S and the EMB theories.
2. Results
2.1. Typical group
The data obtained for Group 1 were examined first. Meanscores for SQ-R, AQ and EQ by sex and degree subject arepresented in Table 1. The distribution of SQ-R scoresapproximated to a normal distribution: the kurtosis andskewness statistics were, across the whole of Group 1, 0.186and 0.398, respectively. The internal consistency of the SQ-Rwas checked using Cronbach's alpha. The value of 0.903 ishigh, indicating good internal consistency. A factor analysison the SQ-R extracted 18 factors with an eigen value greater
than 1. Examination of the items in each factor suggested thatthese were not psychologically meaningful clusters and, giventhe high value for Cronbach's alpha, it was thought moreappropriate to analyze the SQ-R as a single scale without anyspecific subscales. The mean score for males and femalesseparately was calculated for each item on the SQ-R. In theoriginal version of the SQ, males had a higher mean on 86.8%of the items, and females on 13.2% of the items. This disparitybetween the sexes was improved in the SQ-R: males had ahigher mean on 68.0% of the items and females had a highermean on 32.0% of the items.
2.1.1. Effects of sex and degreePrevious research has shown that there is a relationshipbetween sex and degree subject and scores on both the AQand EQ questionnaires (Baron-Cohen and Wheelwright, 2004;Baron-Cohen et al., 2001). These effects were therefore testedin this sample. Separate ANOVAs were conducted on the AQand EQ with between-subject factors of Degree (physicalscience vs. biological science vs. social science vs. human-ities) and Sex (males vs. females). For the AQ, there was asignificant main effect of Degree (F(3,1753) = 32.9, P b 0.0001)and also of Sex (F(1,1753) = 16.0, P b 0.0001). The Degree bySex interaction was not significant (F(3,1753) = 0.083,P = 0.97). Post hoc Tukey tests indicated that physicalscientists scored higher on the AQ than the other 3 degreegroups (P b 0.0001) and that biological scientists scoredhigher than students studying humanities (P b 0.05). Therewere no other significant differences. For the EQ, there werealso significant main effects of Degree (F(3,1753) = 16.9,P b 0.0001) and Sex (F(1,1753) = 177.8, P b 0.0001). The Degreeby Sex interaction was not significant (F(3,1753) = 0.57,P = 0.64). Post hoc Tukey tests indicated that physicalscientists scored lower than the other 3 degree groups(P b 0.0001). There were no other significant differences.
As there is a relationship between sex and degree subjecton both the AQ and EQ, the 2 questionnaire scores wereincluded as covariates in the analysis of SQ-R. Hence, anANOVA with between-subject factors of Degree (physicalscience vs. biological science vs. social science vs. human-ities) and Sex (males vs. females) was performed on the SQ-R, covarying for AQ and EQ scores. Both covariates had a

Table 2 – Means and SDs for SQ-R, AQ and EQ for the ASCgroup and typical group
Group Sex n SQ-R AQ EQ
ASC Male 69 Mean 77.8 35.9 18.7SD 22.9 7.8 9.8
Female 56 Mean 76.4 37.4 18.5SD 25.1 8.2 10.1
Total 125 Mean 77.2 36.5 18.6SD 23.8 8.0 9.9
Typicalgroup
Male 723 Mean 61.2 17.4 39.0SD 19.2 6.2 11.6
Female 1038 Mean 51.7 15.5 48.0SD 19.2 5.6 11.3
Total 1761 Mean 55.6 16.3 44.3SD 19.7 5.9 12.2
50 B R A I N R E S E A R C H 1 0 7 9 ( 2 0 0 6 ) 4 7 – 5 6
significant effect: AQ (F(1,1751) = 182 P b 0.0001), EQ(F(1,1751) = 51.2, P b 0.0001). There was a significant maineffect of Degree (F(3,1751) = 18.4, P b 0.0001) and Sex(F(1,1751) = 83.9, P b 0.0001), with males scoring higher thanfemales. Post hoc pairwise comparisons, using Bonferronicorrection to adjust for multiple comparisons, indicated thatphysical scientists scored the highest, there was no differ-ence between social scientists and biological scientists,while students studying humanities scored lowest of all(P b 0.05 for all comparisons). The interaction betweenDegree and Sex was not significant (F(3,1751) = 2.12, P = 0.1).
2.2. Predicting AQ from SQ-R and EQ
The relationship between SQ-R, EQ and AQ was specificallyexamined in Group 1 by first testing the correlations betweeneach pair of questionnaires. The correlations were all signif-
Fig. 1 – Distribution of SQ-R scores in the ASC
icant at the P b 0.01 level. There was a strong negativecorrelation between the AQ and EQ (r = −0.50), a moderatepositive correlation between the AQ and SQ-R (r = 0.32) and aweak, but significant, negative correlation between the SQ-Rand the EQ (r = −0.09).
In order to investigate the relationship between the SQ-R, EQand AQ further, a factor analysis was carried out on the totalscores from each questionnaire. One factor with an eigen valuegreater than 1 was extracted, which accounted for 54.7% of thetotal variance. This factor accounted for 76.1%of the variance inthe AQ scores, 58.3% in the EQ and 30.0% in the SQ-R. The AQhad a strong positive loading on the factor (0.87), the EQ had astrong negative loading (−0.76) and the SQ-R had a positiveloading (0.55). These results suggest that it is most appropriateto produce a model which predicts AQ score based on EQ andSQ-R scores. It was decided to retain sex in the model but notdegree subject to increase its applicability. The model wasproduced by running a univariate ANOVA on AQ score, with asingle factor of sex, and covarying for EQ and SQ-R. As expected,both covariates had a significant effect: SQ-R (F(1,1757) = 219.4P b 0.0001), EQ (F(1.1757) = 598.9, P b 0.0001) and there was asignificant main effect of Sex (F(1.1757) = 18.9, P b 0.0001).
Using the parameters generated in the model, for males,AQ score can be estimated using the formula AQ = [0.089SQ-R − 0.25EQ + 21.6], while for females AQ = [0.089SQ-R − 0.25EQ + 22.7].
2.3. Results from the ASC group
Table 2 presents themean AQ, EQ and SQ-R scores for the ASCgroup and the typical group. Fig. 1 shows the distribution ofSQ-R in the ASC group and typical males and femalesseparately. The 3 groups have overlapping but distinguishable
group, typical males and typical females.

51B R A I N R E S E A R C H 1 0 7 9 ( 2 0 0 6 ) 4 7 – 5 6
distributions, which is an improvement on the distributionsfor the original version of the SQ (Baron-Cohen et al., 2003).The mean age of the typical group was 21.0 years (SD = 2.6years), which is significantly younger than the ASC groupmean of 37.6 years (SD = 13.1 years) (t = 43.1, df = 1884,P b 0.0001). Age was therefore included as a covariate in theANOVA on the SQ-R, with Group and Sex factors. There weresignificant main effects of Group (F(1,1881) = 34.8, P b 0.0001)and Sex (F(1,1881) = 9.5, P b 0.01), and the Group by Sexinteraction was also significant (F(1,1881) = 4.7, P b 0.05). Theage covariate had a significant effect (F(1,1881) = 9.9, P b 0.01).Inspection of the means suggests that the interaction arisesbecause there was no difference on SQ-R scores between themales and females with ASC. This prediction was confirmedby an independent t test (t = 0.33, df = 123, P = 0.74).
2.3.1. Predicting AQ from SQ-R and EQThe relationship between SQ-R, EQ and AQwas first examinedin the ASC group by testing the correlations between each pairof questionnaires. All the correlations were significant at theP b 0.01 level, in the expected directions: r = −0.51 for the AQand EQ, r = 0.36 for the AQ and SQ and r = −0.29 for the EQ andSQ.
In order to investigate the relationship between the SQ-R,EQ and AQ in the ASC group further, a factor analysis wascarried out on the total scores from each questionnaire. Onefactor with an eigen value greater than 1 was extracted, whichaccounted for 53.9% of the total variance. This factoraccounted for 78.7% of the variance in the AQ scores, 59.1%in the EQ and 23.7% in the SQ-R. The AQ had a strong positiveloading on the factor (0.89), the EQ had a strong negativeloading (−0.77) and the SQ-R had a positive loading (0.49).These results are similar to those found in Group 1 and suggestthat it is most appropriate to produce a model which predictsAQ scores based on EQ and SQ-R scores. The model wasproduced by running a univariate ANOVA on AQ score, with asingle factor of sex, covarying for EQ and SQ-R. As expected,both covariates had a significant effect: SQ-R (F(1,121) = 8.5,P b 0.01), EQ (F(1,121) = 31.9, P b 0.0001) and there was nosignificant main effect of Sex (F(1,121) = 1.6, P = 0.21). Since themain effect of sex was not significant, there was no need toproduce different formulae for estimating AQ score in malesand females with ASC.
Using the other parameters generated in the model, AQscore in the ASC group can be estimated using the formula:AQ = [0.077SQ-R − 0.36EQ + 38.1].
In previous research, there have been insufficient numbersof males and females with ASC to test whether there is any
Table 3 – Percent of participants with each brain type. D is the
Brain type D percentile(per)
Brain typeboundary
Extreme Type E per b 2.5 D b −0.21Type E 2.5 ≤ per b 35 −0.21 ≤ D b −0.041Type B 35 ≤ per b 65 −0.041 ≤ D b 0.040Type S 65 ≤ per b 97.5 0.040 ≤ D b 0.21Extreme Type S per ≥ 97.5 D ≥ 0.21
difference between the sexes on the AQ and EQ. With thecurrent sample, independent t tests were carried out for eachquestionnaire separately and no significant difference be-tween males and females was found for either questionnaire(t = −1.04, P = 0.30 for the AQ, t = 0.12, P = 0.90 for the EQ, df = 123for both).
2.3.2. Percentage of each group showing each ‘brain type’To calculate the proportion of people scoring in each of 5defined ‘brain types’ predicted by the E–S theory (Baron-Cohenet al., 2003) (Type S, Type E, Extreme Type S, Extreme Type Eand Type B), we used a method reported elsewhere (Gold-enfeld et al., in press). First, the SQ-R and EQ scores werestandardized for the whole of Group 1 (n = 1761) using thefollowing formulae S = [(SQ-R − bSQ-RN)/150 andE = (EQ − bEQN)/80]. That is, we first subtracted the typicalpopulation mean (denoted by b…N) from the scores, thendivided this by the maximum possible score (150 for the SQ-R,and 80 for the EQ). The means were 55.6 (SQ-R) and 44.3 (EQ).The original EQ and SQ-R axes were then rotated by 45°,essentially factor analyzing S and E, to produce two newvariables, D and C. We normalized by the factors of 1/2 as isappropriate for an axis rotation. These new variables aredefined as follows:
D ¼ ðS� EÞ=2 ði:e:; the difference between the normalized SQ
and EQ scoresÞ and C ¼ ðSþ EÞ=2 ði:e:; the sum of the
normalized SQ and EQ scoresÞ:
Because variable D is a measure of the difference betweenan individual's empathizing and systemizing scores, it allowsus to determine an individual's brain type: a positive scoreindicates brain Type S, or Extreme Type S, a negative scoreindicates brain Type E, or Extreme Type E, and a score close tozero indicates brain Type B. In numerical terms, these braintypes were assigned according to the percentiles of Group 1 ontheD axis. The lowest scoring 2.5% on theD axis was classifiedas Extreme Type E and the top 2.5% was classified as ExtremeType S. Those scoring between the 35th and 65th percentilewere classified as Type B. Participantswho scored between the2.5th and 35th percentiles were Type E, and Type S wasdefined by scoring between the 65th and 97.5th percentile.
Table 3 shows the percent of participants from both Group1 and 2with each brain type. Group 1 is divided intomales andfemaleswhile Group 2 is not, since there are no sex differenceson the EQ and SQ-R for this group. Fig. 2 shows the resultstranslated back into raw scores on the SQ-R and EQ tests sothat individual brain types can be classified. Note that the D
difference score between EQ and SQ
Group
ASC group,n = 125
Typical males,n = 723
Typical females,n = 1038
0 0.1 4.30 15.1 44.86.4 30.3 29.3
32.0 49.5 20.761.6 5.0 0.9

Fig. 2 – SQ-R and EQ scores for all participants with the proposed boundaries for different brain types.
52 B R A I N R E S E A R C H 1 0 7 9 ( 2 0 0 6 ) 4 7 – 5 6
axis, which is not shown, runs from the top left hand corner tothe bottom right hand corner. Starting in the top left handcorner and passing along this axis, it can be seen that thehighest concentration of participants changes from typicalfemales to typical males and finally to participants from theASC group. This observation is supported by inspection ofTable 3: a larger proportion of typical females have a Type Ebrain, a larger proportion of typical males have a Type S brainand most people with ASC have an Extreme Type S brain.
This finding was supported by running a one-way ANOVAon the D scores, comparing the ASC group, typical males andtypical females. There was a significant main effect of Group,F(2,1883) = 510.2, P b 0.0001 and post hoc Tukey tests confirmedthat people with ASC had the highest D scores (mean = 0.24,SD = 0.11), followed by typical males (mean = 0.05, SD = 0.092)with typical females having the lowest D scores (mean = −0.04,SD = 0.099) (all Ps b 0.0001). These results indicate that, onaverage, people with ASC have a much stronger drive tosystemize than to empathize, typical males also systemize toa higher level than they empathize, while typical femalesempathize to a higher level than they systemize.
To test whether EQ and SQ are a ‘zero sum game’ (whichwould be the case if C scores [the sum of the normalized EQ andSQ-R scores] did not differ between groups, despite there beinggroup differences on the EQ and SQ), a one-way ANOVA wasperformed on the C scores. There was a significant main effectof Group (F(2,1883) = 66.0). Post hoc Tukey tests indicated thattypical females had thehighest C score (mean = 0.01, SD = 0.092),followed by typical males (mean = −0.015, SD = 0.10) with theASC group scoring the lowest (mean = −0.089, SD = 0.86) (allP b 0.0001). This suggests that empathizing and systemizing arelargely independent of one another.
3. Discussion
This study attempts to better understand one aspect of socialcognition—empathy. It does this by investigating the rela-tionship between scores on the Empathy Quotient (EQ),Systemizing Quotient-Revised (SQ-R) and Autism SpectrumQuotient (AQ) in both a large sample of typical participants,and a sample of adults with autism spectrum conditions(ASC). A revised version of the SQ, the SQ-R, was used whichwas an improvement on the previously reported SQ as it waslessmale-biased. AQ score was successfully predicted from EQand SQ-R scores. This means that the position of an individualon the autism spectrum, as defined by the number of autistictraits an individual possesses, is a function of their empathiz-ing and systemizing scores.
In the typical group, therewas a strong negative correlationbetween the AQ and EQ, and a moderate positive correlationbetween the AQ and SQ-R. The negative correlation betweenthe EQ and SQ-R was significant, but relatively weak. Thissuggests that there is only a weak trade-off between empa-thizing and systemizing in the normal population. In the ASCgroup, however, the negative correlation between EQ and SQ-Rwas much greater, and on par with the other correlations,suggesting that there may be a stronger trade-off betweenempathizing and systemizing in this group. This needs to bebetter understood.
The relationship between EQ and SQ-R was also examinedby calculating the percentage of participants scoring in the 5defined brain types. The E–S theory predicts that more typicalfemales should have Type E (E N S) brains and more typicalmales should have Type S (S N E) brains. The EMB theorypredicts thatmost people with ASC should have Extreme Type

1 Physical sciences included: mathematics, physics, physicanatural sciences, chemistry, computer science, geology, commu-nications, engineering, manufacturing engineering, chemicaengineering, mineral science, material science, astrophysicsastronomy and geophysics.2 Biological sciences included: experimental psychology, neuro-
physiology, biochemistry, molecular biology, biological anthro-pology, biology, neuroscience, medicine, veterinary medicineanatomy, genetics, pharmacology, physiology, plant sciences andzoology.3 Social sciences included: geography, economics, commerce
social and political sciences, archaeology, anthropology, landeconomy, international relations and management.4 Humanities included: classics, languages, drama, education
law, architecture, philosophy, oriental studies, English, linguis-tics, theology, history, history and philosophy of science, historyof art and music. We acknowledge that some humanities (such aslaw or linguistics) or social sciences (such as economics) involvemore systemizing than others, but these ways of dividing degreesubjects may still capture some important differences betweenthe highly lawful physical sciences and less lawful domains.
53B R A I N R E S E A R C H 1 0 7 9 ( 2 0 0 6 ) 4 7 – 5 6
S (S NN E) brains. These predictionswere supported by the data:the largest proportion (45%) of typical females had a Type Ebrain, the largest proportion (50%) of typical males had a TypeS brain and the largest proportion (62%) of adults with an ASChad an Extreme Type S brain. The same proportion (30%) oftypical males and females had a Type B (E = S) brain. Thepercentages of each group showing each ‘brain type’ closelymatch those figures reported previously (Goldenfeld et al., inpress) based on EQ and SQ data from a smaller generalpopulation (non-student) sample, and a group of people withASC. It is striking that, in the present study, in the typicalgroup, more than twice as many males as females had a TypeS brain, and more than twice as many females as males had aType E brain.
When the standardized EQ and SQ-R scores were com-bined, typical females achieved the highest combined score,followed by typical males, with the ASC group scoring lowest.Our earlier study (Goldenfeld et al., in press) found nodifference in the combined score of the males and females,interpreting this in terms of differences in EQ and SQ-R scores‘compensating’ each other. Needless to say, it is important toreplicate all of these results in a general population sample.However, previous studies have not found a differencebetween student and general population samples on the EQ,SQ and AQ (Baron-Cohen and Wheelwright, 2004; Baron-Cohen et al., 2001, 2003).
In a direct comparison of the ASC group and typical group,the ASC group scored higher on the SQ-R than the typicalgroup. Within the ASC group, there was no sex difference onthe SQ-R, the EQ or AQ. This is in contrast with the typicalgroup where the predicted sex differences were all found, i.e.,males scored higher on the SQ-R and AQ, but lower on the EQ,than females. The EMB theory does not make any predictionsabout whether there should be sex differences in an ASCsample, but the absence of the typical sex difference in theASC group suggests that bothmales and females with ASC arehyper-masculinized. Naturally, to move from the typical malerange of SQ-R scores to the AS range involves a smaller shiftthan tomove from the typical female range of SQ-R scores intothe AS range. This could explain why there are more malesthan females diagnosed with ASC. It would be of interest totest if there is an equivalent dose–effect in candidatebiological mechanisms (Baron-Cohen et al., 2005) needed toproduce autism in males than in females.
Within the typical group, similar results were found interms of sex differences and university-degree differences ashave been reported in previous studies (Baron-Cohen et al.,2001, 2003; Baron-Cohen and Wheelwright, 2004). Malesscored higher on the AQ and lower on the EQ than females.Students studying physical sciences scored higher on the AQand lower on the EQ than students studying other degrees. Inaddition, on the AQ, biological scientists scored higher thanstudents studying humanities. On the SQ-R, males scoredhigher than females, even taking into consideration AQ andEQ scores. Again allowing for the effect of AQ and EQ, physicalscientists scored the highest on the SQ-R, there was nodifference between social and biological scientists and stu-dents studying humanities scored the lowest. These resultswould be predicted on the basis of assumptions about the levelof systemizing needed for different degree subjects.
Weconclude that empathizingappears to be largely (butnotcompletely) independent of systemizing. The fact that thenumber of autistic traits an individual possesses can bepredicted in termsof their empathizingand systemizing scoressuggests that empathizing and systemizing may be linked inimportant ways. Future research needs to examine this link.For example, theymaysharea commonbiologicalmechanism.A recent candidate biological mechanism is fetal testosterone,which has a positive correlation with empathizing but anegative correlation with systemizing (as indexed by ‘narrowinterests’) (Knickmeyer et al., 2005). Future researchshould testthe neural basis of empathizing and systemizing using fMRI insamples that are drawn from the EQ and SQ continua.
4. Experimental procedures
4.1. Participants
Group 1, later referred to as the typical group, consisted of 1761members of Cambridge University, comprising 723males and 1038females. Average age was 21.0 years (SD = 2.58 years). 85.5% of thesample described themselves as right-handed, 10.8% were left-handed and 3.7% were ambidextrous. They were recruited viaseveral routes including email, post, newspaper adverts andnotices around the university, and invited to complete the 3questionnaires online via a website constructed by the authors.An incentive to participate was offered, in that everyone whocompleted all three questionnaires was entered into a draw to wina prize. Only participants who completed all three questionnaireswere included in the final analysis. Participants who reported ahistory of psychiatric difficulties (depression, ASC, bipolar illness,psychosis or anorexia) were excluded from the analysis. Partici-pants indicated their undergraduate degree subject and thesewere classified as physical sciences,1 biological sciences,2 socialsciences3 and humanities.4
Group 2 consisted of 125 adults, 69males and 56 females, with adiagnosis on the autism spectrum. Of these 125, 110 had AspergerSyndrome (AS) and 15 had high-functioning autism (HFA). Theseare distinguished primarily in terms of age at which languagedevelopment began (phrase speech before 3 years old beingrequired for AS, and after 3 leading to a diagnosis of HFA, assumingthe social and obsessional criteria are also met). The mean age ofGroup 2 was 37.6 years (SD = 13.1 years). 73.8% of the sample
l
l,
,
,
,

54 B R A I N R E S E A R C H 1 0 7 9 ( 2 0 0 6 ) 4 7 – 5 6
described themselves as right-handed, 9.5% were left-handed and16.7% were ambidextrous. All participants were diagnosed byexperienced clinicians according to DSM-IV or ICD-10 criteria.
4.2. Instruments
Full details about the construction of the AQ and EQ areavailable elsewhere (Baron-Cohen and Wheelwright, 2004;Baron-Cohen et al., 2001). The EQ was developed because otherinstruments purporting to measure empathy also include itemsunrelated to empathy. The AQ and SQ are the only self-reportinstruments of their kind, for use in the adult population. TheSQ used in the present study was a modification of the onedescribed earlier (Baron-Cohen et al., 2003), and the modifica-tions are described below. All three questionnaires were self-administered on-line, and have a forced choice format. Partici-pants are asked to indicate whether they ‘strongly agree’,‘slightly agree’, ‘slightly disagree’ or ‘strongly disagree’ with astatement. Approximately half the items on each questionnaireare worded so that a high scorer will agree with the item, toavoid response bias. The AQ consists of 50 questions, each ofwhich scores one point if the participant chooses the ‘autistictrait’ response, or zero otherwise. The EQ comprises 40 items,with 2 points available for a ‘strongly’ response and 1 point foran appropriate ‘slightly’ response.
4.3. Modifications of the SQ
The original version of the SQ comprised 40 scoring items and20 filler items. The SQ-R initially had 80 scoring items, and thisis the version that all participants completed. The 80-itemversion of the questionnaire was piloted on 10 typical malesand 10 typical females, to check that all items were easilycomprehensible. Following data collection, 5 items were re-moved from the questionnaire because they were too similar toother items in the SQ-R, AQ or EQ. 2 out of the 5 items werefrom the original version of the SQ. Therefore, the final versionof the SQ-R had 75 items. It is shown in Appendix A. The 37new items were items 1, 2, 3, 5, 8, 10, 11, 13, 19, 20, 21, 22, 23,27, 28, 30, 31, 34, 36, 38, 39, 40, 42, 44, 48, 49, 55, 56, 57, 59, 61,62, 65, 68, 71, 72 and 75, and were included to provide a greater
coverage of social systems and domestic systems, not justmechanical or abstract systems.
4.4. Scoring the SQ-R
On the following 39 items, ‘strongly agree’ responses score twopoints and ‘slightly agree’ responses score one point: 1, 2, 4, 5, 7, 9,11, 12, 13, 14, 16, 18, 19, 20, 21, 23, 25, 27, 29, 30, 32, 36, 38, 41, 42, 43,46, 50, 53, 55, 60, 61, 62, 66, 68, 69, 72, 74 and 75. On the following 36items, ‘strongly disagree’ responses score two points and ‘slightlydisagree’ responses score one point: 3, 6, 8, 10, 15, 17, 22, 24, 26, 28,31, 33, 34, 35, 37, 39, 40, 44, 45, 47, 48, 49, 51, 52, 54, 56, 57, 58, 59, 63,64, 65, 67, 70, 71 and 73. Since there were 75 items and each couldbe scored with amaximum of 2 points, themaximum score on theinstrument was 150 and the minimum was zero.
4.5. Procedure
All participants completed the EQ, SQ-R and AQ online, using acustom-designed website. After registering on the website andproviding some basic information, participants were invited to fillout the three questionnaires, which were labeled as AdultQuestionnaires A–C. For each questionnaire, participants wereinstructed to read each statement very carefully and rate howstrongly they agreed or disagreed by selecting the appropriateoption opposite each question. Participants could choose in whatorder to complete the questionnaires and, as they could log in andout of the site, all three questionnaires did not have to becompleted in the same session.
Acknowledgments
SW and SBC were supported by the MRC, the Nancy LurieMarks (NLM) Family Foundation and Target Autism Genome(TAG) during the period of this work. LW, DF, RS and JDsubmitted this work as part of a Part 2 Project towards theDegree of BA in Psychology, University of Cambridge. We aregrateful to Mike Aitken for valuable discussion of the results.
Appendix A. The SQ-R
Stronglyagree
Slightlyagree
Slightlydisagree
Stronglydisagree
1.
I find it very easy to use train timetables, even if this involvesseveral connections.2.
I like music or book shops because they are clearly organised. 3. I would not enjoy organising events e.g. fundraising evenings, fetes, conferences. 4. When I read something, I always notice whether it is grammatically correct. 5. I find myself categorising people into types (in my own mind). 6. I find it difficult to read and understand maps. 7. When I look at a mountain, I think about how precisely it was formed. 8. I am not interested in the details of exchange rates, interest rates, stocks andshares.
9. If I were buying a car, I would want to obtain specific information about its enginecapacity.
10. I find it difficult to learn how to programme video recorders. 11. When I like something I like to collect a lot of different examples of that type ofobject, so I can see how they differ from each other.
12. When I learn a language, I become intrigued by its grammatical rules. 13. I like to know how committees are structured in terms of who the differentcommittee members represent or what their functions are.
14. If I had a collection (e.g. CDs, coins, stamps), it would be highly organised. 15. I find it difficult to understand instruction manuals for putting appliances together.
Appendix A (continued)
55B R A I N R E S E A R C H 1 0 7 9 ( 2 0 0 6 ) 4 7 – 5 6
Stronglyagree
Slightlyagree
Slightlydisagree
Stronglydisagree
16.
When I look at a building, I am curious about the precise way it was constructed. 17. I am not interested in understanding how wireless communication works (e.g.mobile phones).
18. When travelling by train, I often wonder exactly how the rail networks are coordinated.19.
I enjoy looking through catalogues of products to see the details of each productand how it compares to others.20.
Whenever I run out of something at home, I always add it to a shopping list. 21. I know, with reasonable accuracy, how much money has come in and gone out ofmy bank account this month.
22. When I was young, I did not enjoy collecting sets of things e.g. stickers, football cards, etc. 23. I am interested in my family tree and in understanding how everyone is related to eachother in the family.
24. When I learn about historical events, I do not focus on exact dates. 25. I find it easy to grasp exactly how odds work in betting. 26. I do not enjoy games that involve a high degree of strategy (e.g. chess, Risk, GamesWorkshop).
27. When I learn about a new category, I like to go into detail to understand the smalldifferences between different members of that category.
28. I do not find it distressing if people who live with me upset my routines. 29. When I look at an animal, I like to know the precise species it belongs to. 30. I can remember large amounts of information about a topic that interests me e.g. flagsof the world, airline logos.
31. At home, I do not carefully file all important documents e.g. guarantees, insurance policies. 32. I am fascinated by how machines work. 33. When I look at a piece of furniture, I do not notice the details of how it was constructed. 34. I know very little about the different stages of the legislation process in my country. 35. I do not tend to watch science documentaries on television or read articles about scienceand nature.
36. If someone stops to ask me the way, I'd be able to give directions to any part of myhome town.
37. When I look at a painting, I do not usually think about the technique involved inmaking it.
38. I prefer social interactions that are structured around a clear activity, e.g. a hobby. 39. I do not always check off receipts etc. against my bank statement. 40. I am not interested in how the government is organised into different ministries anddepartments.
41. I am interested in knowing the path a river takes from its source to the sea. 42. I have a large collection e.g. of books, CDs, videos etc. 43. If there was a problem with the electrical wiring in my home, I'd be able to fix it myself. 44. My clothes are not carefully organised into different types in my wardrobe. 45. I rarely read articles or webpages about new technology. 46. I can easily visualise how the motorways in my region link up. 47. When an election is being held, I am not interested in the results for each constituency. 48. I do not particularly enjoy learning about facts and figures in history. 49. I do not tend to remember people's birthdays (in terms of which day and month this falls). 50. When I am walking in the country, I am curious about how the various kinds of trees differ. 51. I find it difficult to understand information the bank sendsme on different investment andsaving systems.
52. If I were buying a camera, I would not look carefully into the quality of the lens. 53. If I were buying a computer, I would want to know exact details about its harddrive capacity and processor speed.
54. I do not read legal documents very carefully. 55. When I get to the checkout at a supermarket, I pack different categories of goods intoseparate bags.
56. I do not follow any particular system when I'm cleaning at home. 57. I do not enjoy in-depth political discussions. 58. I am not very meticulous when I carry out D.I.Y or home improvements. 59. I would not enjoy planning a business from scratch to completion. 60. If I were buying a stereo, I would want to know about its precise technical features. 61. I tend to keep things that other people might throw away, in case they might be useful forsomething in the future.
62. I avoid situations which I cannot control.(continued on next page)

Appendix A (continued)
56 B R A I N R E S E A R C H 1 0 7 9 ( 2 0 0 6 ) 4 7 – 5 6
Stronglyagree
Slightlyagree
Slightlydisagree
Stronglydisagree
63.
I do not care to know the names of the plants I see. 64. When I hear the weather forecast, I am not very interested in the meteorological patterns. 65. It does not bother me if things in the house are not in their proper place. 66. In maths, I am intrigued by the rules and patterns governing numbers. 67. I find it difficult to learn my way around a new city. 68. I could list my favourite 10 books, recalling titles and authors' names from memory. 69. When I read the newspaper, I am drawn to tables of information, such as football leaguescores or stock market indices.
70.
When I'm in a plane, I do not think about the aerodynamics. 71. I do not keep careful records of my household bills. 72. When I have a lot of shopping to do, I like to plan which shops I am going to visit and inwhat order.
73. When I cook, I do not think about exactly how different methods and ingredientscontribute to the final product.
74. When I listen to a piece of music, I always notice the way it's structured. 75. I could generate a list of my favourite 10 songs from memory, including the title and theartist's name who performed each song.
©SW/SBC June 2005.
R E F E R E N C E S
A.P.A., 1994. DSM-IV Diagnostic and Statistical Manual of MentalDisorders, fourth ed. American Psychiatric Association,Washington, DC.
Baron-Cohen, S., 1995. Mindblindness: An Essay on Autism andTheory of Mind. MIT Press/Bradford Books, Boston.
Baron-Cohen, S., 2002. The extreme male brain theory of autism.Trends Cogn. Sci. 6, 248–254.
Baron-Cohen, S., 2003. The Essential Difference: Men, Women andthe Extreme Male Brain. Penguin, London.
Baron-Cohen, S., Wheelwright, S., 2004. The empathy quotient(EQ). An investigation of adults with asperger syndrome orhigh functioning autism, and normal sex differences. J. AutismDev. Disord. 34, 163–175.
Baron-Cohen, S., Ring, H., Moriarty, J., Shmitz, P., Costa, D., Ell, P.,1994. Recognition of mental state terms: a clinical study ofautism, and a functional neuroimaging study of normal adults.Br. J. Psychiatry 165, 640–649.
Baron-Cohen, S., Ring, H., Wheelwright, S., Bullmore, E.T.,Brammer, M.J., Simmons, A., et al., 1999. Social intelligence inthe normal and autistic brain: an fMRI study. Eur. J. Neurosci.11, 1891–1898.
Baron-Cohen, S., Wheelwright, S., Skinner, R., Martin, J., Clubley,E., 2001. The autism spectrum quotient (AQ): evidence fromasperger syndrome/high functioning autism, males and
females, scientists andmathematicians. J. Autism Dev. Disord.31, 5–17.
Baron-Cohen, S., Richler, J., Bisarya, D., Gurunathan, N.,Wheelwright, S., 2003. The systemising quotient (SQ): aninvestigation of adults with asperger syndrome or highfunctioning autism and normal sex differences. Philos. Trans.R. Soc. 358, 361–374.
Baron-Cohen, S., Knickmeyer, R., Belmonte, M.K., 2005. Sexdifferences in the brain: implications for explaining autism.Science 310, 819–823.
Blair, R.J., 1995. A cognitive developmental approach to morality:investigating the psychopath. Cognition 57, 1–29.
Brothers, L., 1990. The neural basis of primate socialcommunication. Motiv. Emot. 14, 81–91.
Frith, U., Frith, C., 2001. The biological basis of social interaction.Am. Pyschol. Soc. 10, 5.
Goldenfeld, N., Baron-Cohen, S., and Wheelwright, S. (in press).Empathizing and systemizing in males, females and autism.Int. J. Clin. Neuropyschol.
Hughes, C., Cutting, A.L., 1999. Nature, nurture and individualdifferences in early understanding of mind. Psychol. Sci. 10,429–433.
I.C.D-10, 1994. International Classification of Diseases, 10th ed.World Health Organisation, Geneva, Switzerland.
Knickmeyer, R., Baron-Cohen, S., Raggatt, P., Taylor, K., 2005.Foetal testosterone, social cognition, and restricted interests inchildren. J. Child Psychol. Psychiatry 45, 1–13.
Copyright © 2022 FDOKUMEN