
Global Leadership, IQ and Global Quotient - North American ...
Upload
khangminh22Category
view
2download
0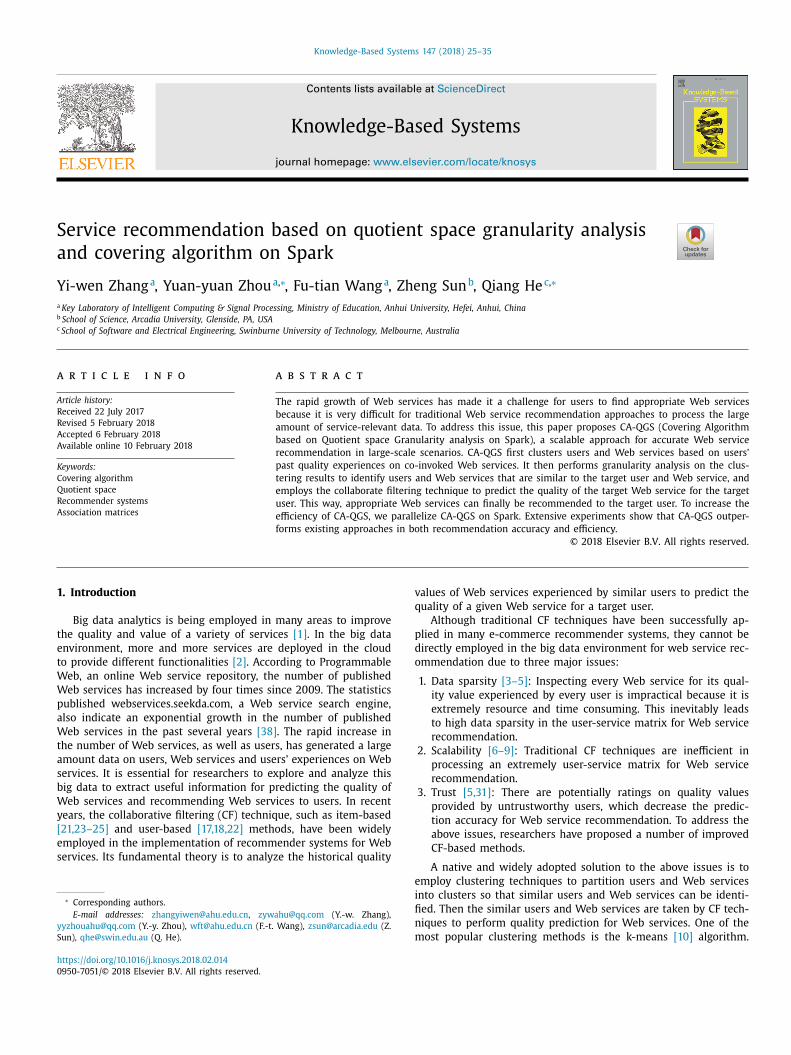
Knowledge-Based Systems 147 (2018) 25–35
Contents lists available at ScienceDirect
Knowle dge-Base d Systems
journal homepage: www.elsevier.com/locate/knosys
Service recommendation based on quotient space granularity analysis
and covering algorithm on Spark
Yi-wen Zhang
a , Yuan-yuan Zhou
a , ∗, Fu-tian Wang
a , Zheng Sun
b , Qiang He
c , ∗
a Key Laboratory of Intelligent Computing & Signal Processing, Ministry of Education, Anhui University, Hefei, Anhui, China b School of Science, Arcadia University, Glenside, PA, USA c School of Software and Electrical Engineering, Swinburne University of Technology, Melbourne, Australia
a r t i c l e i n f o
Article history:
Received 22 July 2017
Revised 5 February 2018
Accepted 6 February 2018
Available online 10 February 2018
Keywords:
Covering algorithm
Quotient space
Recommender systems
Association matrices
a b s t r a c t
The rapid growth of Web services has made it a challenge for users to find appropriate Web services
because it is very difficult for traditional Web service recommendation approaches to process the large
amount of service-relevant data. To address this issue, this paper proposes CA-QGS (Covering Algorithm
based on Quotient space Granularity analysis on Spark), a scalable approach for accurate Web service
recommendation in large-scale scenarios. CA-QGS first clusters users and Web services based on users’
past quality experiences on co-invoked Web services. It then performs granularity analysis on the clus-
tering results to identify users and Web services that are similar to the target user and Web service, and
employs the collaborate filtering technique to predict the quality of the target Web service for the target
user. This way, appropriate Web services can finally be recommended to the target user. To increase the
efficiency of CA-QGS, we parallelize CA-QGS on Spark. Extensive experiments show that CA-QGS outper-
forms existing approaches in both recommendation accuracy and efficiency.
© 2018 Elsevier B.V. All rights reserved.
1
t
e
t
W
W
p
a
W
t
a
s
b
W
y
[
e
s
y
S
v
q
p
d
o
h
0
. Introduction
Big data analytics is being employed in many areas to improve
he quality and value of a variety of services [1] . In the big data
nvironment, more and more services are deployed in the cloud
o provide different functionalities [2] . According to Programmable
eb, an online Web service repository, the number of published
eb services has increased by four times since 2009. The statistics
ublished webservices.seekda.com, a Web service search engine,
lso indicate an exponential growth in the number of published
eb services in the past several years [38] . The rapid increase in
he number of Web services, as well as users, has generated a large
mount data on users, Web services and users’ experiences on Web
ervices. It is essential for researchers to explore and analyze this
ig data to extract useful information for predicting the quality of
eb services and recommending Web services to users. In recent
ears, the collaborative filtering (CF) technique, such as item-based
21,23–25] and user-based [17,18,22] methods, have been widely
mployed in the implementation of recommender systems for Web
ervices. Its fundamental theory is to analyze the historical quality
∗ Corresponding authors.
E-mail addresses: [email protected] , [email protected] (Y.-w. Zhang),
[email protected] (Y.-y. Zhou), [email protected] (F.-t. Wang), [email protected] (Z.
un), [email protected] (Q. He).
e
i
fi
n
m
ttps://doi.org/10.1016/j.knosys.2018.02.014
950-7051/© 2018 Elsevier B.V. All rights reserved.
alues of Web services experienced by similar users to predict the
uality of a given Web service for a target user.
Although traditional CF techniques have been successfully ap-
lied in many e-commerce recommender systems, they cannot be
irectly employed in the big data environment for web service rec-
mmendation due to three major issues:
1. Data sparsity [3–5] : Inspecting every Web service for its qual-
ity value experienced by every user is impractical because it is
extremely resource and time consuming. This inevitably leads
to high data sparsity in the user-service matrix for Web service
recommendation.
2. Scalability [6–9] : Traditional CF techniques are inefficient in
processing an extremely user-service matrix for Web service
recommendation.
3. Trust [5,31] : There are potentially ratings on quality values
provided by untrustworthy users, which decrease the predic-
tion accuracy for Web service recommendation. To address the
above issues, researchers have proposed a number of improved
CF-based methods.
A native and widely adopted solution to the above issues is to
mploy clustering techniques to partition users and Web services
nto clusters so that similar users and Web services can be identi-
ed. Then the similar users and Web services are taken by CF tech-
iques to perform quality prediction for Web services. One of the
ost popular clustering methods is the k-means [10] algorithm.

26 Y.-w. Zhang et al. / Knowledge-Based Systems 147 (2018) 25–35
i
c
D
u
i
b
c
n
u
u
l
M
M
D
t
p
b
s
w
v
s
M
M
D
d
e
u
u
e
u
D
i
s
g
s
…
o
t
u
f
s
t
s
W
a
The k-means algorithm is an unsupervised method that partitions
given data points into a manually chosen number ( k ) of clusters
with one initial center randomly selected for each cluster. How-
ever, there are two major inherent limitations to Web service rec-
ommendation approaches based on k-means. First, it is difficult to
determine a proper k to ensure that the corresponding clustering
results can properly indicate the similarity between users as well
as Web services. Second, the clustering results heavily rely on the
random selection of the initial centers. Thus, k-means based qual-
ity prediction approaches cannot ensure the accuracy and stability
of the prediction results.
To address the above issues, this paper proposes CA-QGS (Cov-
ering Algorithm based on Quotient space Granularity analysis on
Spark), a novel approach for Web service recommendation. Given
a set of users and Web services, CA-QGS first employs a covering-
based clustering algorithm to partition users into clusters based on
the similarity between their historical quality experiences on each
of the co-invoked Web services through granularity analysis. The
granularity analysis visualizes the initial clustering results which
help users understand the meanings of within-class and among-
class from different perspectives. Following a similar procedure,
CA-QGS also partitions Web services into clusters based on each
user’s quality experiences on Web services. Then, from the final
clustering results, CA-QGS chooses a number of users and Web ser-
vices that are most similar to the target user u and the target Web
service s to predict the quality of Web service s for user u . Finally,
CA-QGS recommends Web services with the best quality to user
u . In order to increase the efficiency of CA-QGS in processing big
data, we parallelize the partitioning operation of CA-QGS on Spark.
The major contributions of this paper are:
1. We employ an improved covering-based clustering algorithm
to partition users and Web services into clusters respectively
based on users’ historical quality experiences through granular-
ity analysis to increase the prediction accuracy. This clustering
approach does not require the number of clusters to be pre-
specified or the initial centers to be manually selected.
2. We present a novel approach for rapid identification of users
and Web services that are most similar to the target user and
the target Web service by implementing descending operations
on each row element in the user-service matrix. This novel
mechanism can address the issue of user trust.
3. We propose a parallel covering algorithm on the Spark plat-
form. Spark is a distributed compute system that allows an ef-
ficient, general-purpose programming language to be used in-
teractively to process large-scale datasets on resilient distributed
datasets (RDDs). The parallelized covering algorithm signifi-
cantly improves the efficiency and effectiveness of Web service
recommendation in the big data environment.
4. We conduct extensive experiments to comprehensively com-
pare CA-QGS with existing approaches, i.e., traditional col-
laborative filtering based approaches and k-means-based ap-
proaches in prediction accuracy based on a real-world dataset
named WS-Dream. The experimental results demonstrate that
CA-QGS outperforms those approaches significantly.
This paper is organized as follows. Section 2 overviews the pre-
liminary knowledge. Section 3 discusses the technical details of
CA-QGS. Section 4 introduces CA-QAS’s procedure for Web service
recommendation. Section 5 presents the experimental results and
analysis. Section 6 reviews the related work and Section 7 con-
cludes this paper.
2. Preliminary knowledge
In this section, we first formally define four concepts: user as-
sociation matrix M u , service association matrix M s , the set of sim-
lar users A ( u ) and the set of similar services A ( s ). Then, we give
orresponding examples.
efinition 1. ( User association matrix M u ). M u is an m × m matrix
sed to record the number of times that m users are partitioned
nto the same clusters.
An element in M u denoted by u i,j , 1 ≤ i,j ≤ m , is the total num-
er of times that user i and user j are partitioned into the same
lusters during the n executions of the clustering algorithm, where
is the number of Web services. Element u i,j is updated when
ser i and user j are partitioned into the same cluster by setting
i,j = u i,j + 1 and u j,i = u j,i + 1 simultaneously. M u is illustrated be-
ow:
u =
⎡
⎢ ⎣
u 11 u 12 ... u 1 m
u 21 u 22 ... u 2 m
... ... ... ...
u m 1 u m 2 ... u mm
⎤
⎥ ⎦
(1)
The user similarity matrix is a symmetric matrix, where M
u =
T u , u i,j = u j,i , 1 ≤ i,j ≤ m and u i,j = u j,i = 0 if i = j .
efinition 2 (. Service association matrix M s ). M s is an n × n ma-
rix used to record the number of times that n Web services are
artitioned into the same clusters.
An element in M s denoted by s i,j ,1 ≤ i,j ≤ n , is the total num-
er of times that service i and service j are partitioned into the
ame clusters during the m executions of the clustering algorithm,
here m is the number of users. Element s i,j is updated when ser-
ice i and service j are partitioned into the same cluster by setting
i,j = s i,j + 1 and s j,i = s j,i + 1 simultaneously. M s is illustrated below:
s =
⎡
⎢ ⎣
S 11 S 12 ... S 1 m
S 21 S 22 ... S 2 m
... ... ... ...
S n 1 S n 2 ... S nn
⎤
⎥ ⎦
(2)
The service similarity matrix is a symmetric matrix, where
s = M
T s , s i,j = s j,i , 1 ≤ i , j ≤ n and s i,j = s j,i = 0 if i = j .
efinition 3. ( Similar users A(u) ). Given a user u , its similar users,
enoted by A ( u ), are defined as the users that have similar quality
xperiences on a same set of co-invoked Web services.
A(u) is expressed as A(u i ) = { u a | u i, a ≥ u i, k , u i, a > 0, 1 ≤ a ≤ m,
a ∈ U, u i, k ∈ M u }, where U = { u 1 , u 2 , …, u m
} represents a set of
sers, u i, k denotes the k th element obtained by the descending op-
ration of the i th row elements in the Mu and the same applies to
i, a .
efinition 4. ( Similar Web services A ( s )). Given a Web service s ,
ts similar Web services, denoted by A ( s ), are defined as the Web
ervices that have delivered similar quality experiences to a same
roup of users.
A ( s ) is expressed as A ( s i ) = { s b | s i, b > s i, k , s i, b > 0, 1 ≤ b ≤ n, s b ∈ S,
i, k ∈ M s }, where S represents a set of Web services and S = { s 1 , s 2 ,
, s n }, s i, k denotes the k th element obtained by the descending
peration of the i th row elements in the Ms and the same applies
o s i, b .
Given a user u , a Web service s , a set of users U = { u 1 , u 2 , …,
m
} and a set of Web services S = { s 1 , s 2 , …, s n }, the procedure
or predicting the quality of Web service s consists of two major
teps: (1) to identify A ( u ) from U , and A ( s ) from S ; (2) to predict
he quality of Web service s for user u based on A ( u ) and A ( s ).
Fig. 1 presents an example with 9 users, u 1 , …, u 9 , and 9 Web
ervices, s 1 , …, s 9 . The matrix contains the response times of the
eb services experienced by the users. Such a matrix is referred to
s a user-service matrix , denoted by M = [ q u , s ] m ×n , where m is the
Y.-w. Zhang et al. / Knowledge-Based Systems 147 (2018) 25–35 27
s1 s2 s3 s4 s5 s6 s7 s8 s9u1 380 ? 490 280 480 390
u2 280 330 470 390
u3 380 410 400 460 290
u4 300 310 420 410
u5 430 460 270 440
u6 ? 320 460 410 440 310
u7 480 400 250 310 390
u8 440 430 350 270
u9 370 410 380 460
Fig. 1. A user-service matrix of response time (milliseconds).
n
m
q
c
r
i
b
T
b
d
t
s
s
W
o
i
q
i
g
I
u
a
D
m
c
t
u
d
s
3
i
p
S
3
i
a
a
t
o
l
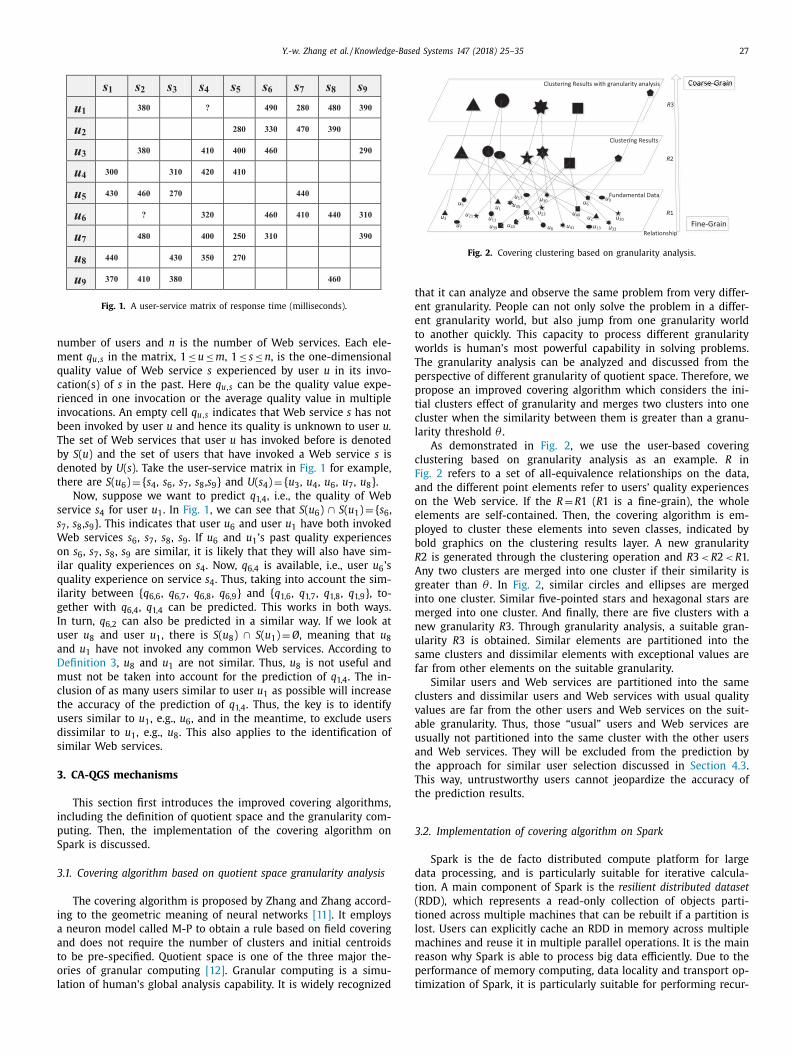
Fig. 2. Covering clustering based on granularity analysis.
t
e
e
t
w
T
p
p
t
c
l
c
F
a
o
e
p
b
R
A
g
i
m
n
u
s
f
c
v
a
u
a
t
T
t
3
d
t
(
t
l
m
r
p
t
umber of users and n is the number of Web services. Each ele-
ent q u , s in the matrix, 1 ≤ u ≤ m , 1 ≤ s ≤ n , is the one-dimensional
uality value of Web service s experienced by user u in its invo-
ation(s) of s in the past. Here q u , s can be the quality value expe-
ienced in one invocation or the average quality value in multiple
nvocations. An empty cell q u , s indicates that Web service s has not
een invoked by user u and hence its quality is unknown to user u.
he set of Web services that user u has invoked before is denoted
y S ( u ) and the set of users that have invoked a Web service s is
enoted by U ( s ). Take the user-service matrix in Fig. 1 for example,
here are S ( u 6 ) = { s 4 , s 6 , s 7 , s 8 , s 9 } and U ( s 4 ) = { u 3 , u 4 , u 6 , u 7 , u 8 }.
Now, suppose we want to predict q 1,4 , i.e., the quality of Web
ervice s 4 for user u 1 . In Fig. 1 , we can see that S ( u 6 ) ∩ S ( u 1 ) = { s 6 ,
7 , s 8 , s 9 }. This indicates that user u 6 and user u 1 have both invoked
eb services s 6 , s 7 , s 8 , s 9 . If u 6 and u 1 ’s past quality experiences
n s 6 , s 7 , s 8 , s 9 are similar, it is likely that they will also have sim-
lar quality experiences on s 4 . Now, q 6,4 is available, i.e., user u 6 ’s
uality experience on service s 4 . Thus, taking into account the sim-
larity between { q 6,6 , q 6,7 , q 6,8 , q 6,9 } and { q 1,6 , q 1,7 , q 1,8 , q 1,9 }, to-
ether with q 6,4 , q 1,4 can be predicted. This works in both ways.
n turn, q 6,2 can also be predicted in a similar way. If we look at
ser u 8 and user u 1 , there is S ( u 8 ) ∩ S ( u 1 ) = Ø, meaning that u 8 nd u 1 have not invoked any common Web services. According to
efinition 3 , u 8 and u 1 are not similar. Thus, u 8 is not useful and
ust not be taken into account for the prediction of q 1,4 . The in-
lusion of as many users similar to user u 1 as possible will increase
he accuracy of the prediction of q 1,4 . Thus, the key is to identify
sers similar to u 1 , e.g., u 6 , and in the meantime, to exclude users
issimilar to u 1 , e.g., u 8 . This also applies to the identification of
imilar Web services.
. CA-QGS mechanisms
This section first introduces the improved covering algorithms,
ncluding the definition of quotient space and the granularity com-
uting. Then, the implementation of the covering algorithm on
park is discussed.
.1. Covering algorithm based on quotient space granularity analysis
The covering algorithm is proposed by Zhang and Zhang accord-
ng to the geometric meaning of neural networks [11] . It employs
neuron model called M-P to obtain a rule based on field covering
nd does not require the number of clusters and initial centroids
o be pre-specified. Quotient space is one of the three major the-
ries of granular computing [12] . Granular computing is a simu-
ation of human’s global analysis capability. It is widely recognized
hat it can analyze and observe the same problem from very differ-
nt granularity. People can not only solve the problem in a differ-
nt granularity world, but also jump from one granularity world
o another quickly. This capacity to process different granularity
orlds is human’s most powerful capability in solving problems.
he granularity analysis can be analyzed and discussed from the
erspective of different granularity of quotient space. Therefore, we
ropose an improved covering algorithm which considers the ini-
ial clusters effect of granularity and merges two clusters into one
luster when the similarity between them is greater than a granu-
arity threshold θ .
As demonstrated in Fig. 2 , we use the user-based covering
lustering based on granularity analysis as an example. R in
ig. 2 refers to a set of all-equivalence relationships on the data,
nd the different point elements refer to users’ quality experiences
n the Web service. If the R = R 1 ( R 1 is a fine-grain), the whole
lements are self-contained. Then, the covering algorithm is em-
loyed to cluster these elements into seven classes, indicated by
old graphics on the clustering results layer. A new granularity
2 is generated through the clustering operation and R 3 < R 2 < R 1.
ny two clusters are merged into one cluster if their similarity is
reater than θ . In Fig. 2 , similar circles and ellipses are merged
nto one cluster. Similar five-pointed stars and hexagonal stars are
erged into one cluster. And finally, there are five clusters with a
ew granularity R 3. Through granularity analysis, a suitable gran-
larity R 3 is obtained. Similar elements are partitioned into the
ame clusters and dissimilar elements with exceptional values are
ar from other elements on the suitable granularity.
Similar users and Web services are partitioned into the same
lusters and dissimilar users and Web services with usual quality
alues are far from the other users and Web services on the suit-
ble granularity. Thus, those “usual” users and Web services are
sually not partitioned into the same cluster with the other users
nd Web services. They will be excluded from the prediction by
he approach for similar user selection discussed in Section 4.3 .
his way, untrustworthy users cannot jeopardize the accuracy of
he prediction results.
.2. Implementation of covering algorithm on Spark
Spark is the de facto distributed compute platform for large
ata processing, and is particularly suitable for iterative calcula-
ion. A main component of Spark is the resilient distributed dataset
RDD), which represents a read-only collection of objects parti-
ioned across multiple machines that can be rebuilt if a partition is
ost. Users can explicitly cache an RDD in memory across multiple
achines and reuse it in multiple parallel operations. It is the main
eason why Spark is able to process big data efficiently. Due to the
erformance of memory computing, data locality and transport op-
imization of Spark, it is particularly suitable for performing recur-
28 Y.-w. Zhang et al. / Knowledge-Based Systems 147 (2018) 25–35
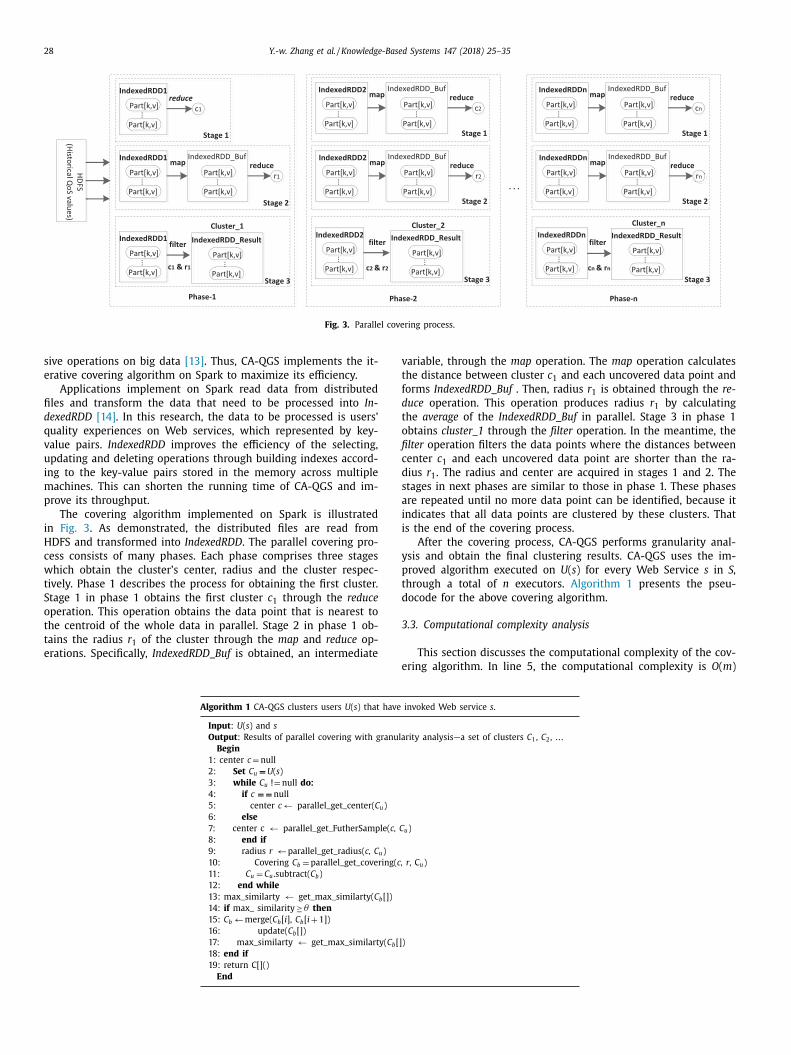
Fig. 3. Parallel covering process.
v
t
f
d
t
o
fi
c
d
s
a
i
i
y
p
t
d
3
sive operations on big data [13] . Thus, CA-QGS implements the it-
erative covering algorithm on Spark to maximize its efficiency.
Applications implement on Spark read data from distributed
files and transform the data that need to be processed into In-
dexedRDD [14] . In this research, the data to be processed is users’
quality experiences on Web services, which represented by key-
value pairs. IndexedRDD improves the efficiency of the selecting,
updating and deleting operations through building indexes accord-
ing to the key-value pairs stored in the memory across multiple
machines. This can shorten the running time of CA-QGS and im-
prove its throughput.
The covering algorithm implemented on Spark is illustrated
in Fig. 3 . As demonstrated, the distributed files are read from
HDFS and transformed into IndexedRDD . The parallel covering pro-
cess consists of many phases. Each phase comprises three stages
which obtain the cluster’s center, radius and the cluster respec-
tively. Phase 1 describes the process for obtaining the first cluster.
Stage 1 in phase 1 obtains the first cluster c 1 through the reduce
operation. This operation obtains the data point that is nearest to
the centroid of the whole data in parallel. Stage 2 in phase 1 ob-
tains the radius r 1 of the cluster through the map and reduce op-
erations. Specifically, IndexedRDD_Buf is obtained, an intermediate
eAlgorithm 1 CA-QGS clusters users U ( s ) that have
Input : U ( s ) and s
Output : Results of parallel covering with granula
Begin
1: center c = null
2: Set C u = U ( s )
3: while C u ! = null do:
4: if c = = null
5: center c ← parallel_get_center( C u )
6: else
7: center c ← parallel_get_FutherSample( c, C
8: end if
9: radius r ← parallel_get_radius( c, C u )
10: Covering C b = parallel_get_covering( c,
11: C u = C u .subtract( C b )
12: end while
13: max_similarty ← get_max_similarty( C b [])
14: if max_ similarity ≥ θ then
15: C b ← merge( C b [ i ], C b [ i + 1])
16: update( C b [])
17: max_similarty ← get_max_similarty( C b []
18: end if
19: return C[]()
End
ariable, through the map operation. The map operation calculates
he distance between cluster c 1 and each uncovered data point and
orms IndexedRDD_Buf . Then, radius r 1 is obtained through the re-
uce operation. This operation produces radius r 1 by calculating
he average of the IndexedRDD_Buf in parallel. Stage 3 in phase 1
btains cluster_1 through the filter operation. In the meantime, the
lter operation filters the data points where the distances between
enter c 1 and each uncovered data point are shorter than the ra-
ius r 1 . The radius and center are acquired in stages 1 and 2. The
tages in next phases are similar to those in phase 1. These phases
re repeated until no more data point can be identified, because it
ndicates that all data points are clustered by these clusters. That
s the end of the covering process.
After the covering process, CA-QGS performs granularity anal-
sis and obtain the final clustering results. CA-QGS uses the im-
roved algorithm executed on U ( s ) for every Web Service s in S,
hrough a total of n executors. Algorithm 1 presents the pseu-
ocode for the above covering algorithm.
.3. Computational complexity analysis
This section discusses the computational complexity of the cov-
ring algorithm. In line 5, the computational complexity is O ( m )
invoked Web service s .
rity analysis—a set of clusters C 1 , C 2 , …
u )
r , C u )
)
Y.-w. Zhang et al. / Knowledge-Based Systems 147 (2018) 25–35 29
User set
Historical QosValues
Historical QosValues
RecommendationRecommendation
HDFS
Parallel Clustering user
IndexedRDD1
. ..
SimUsSimilarUsers
QoSPredicting
Predictingbased-on UsersPredicting
based-on Users
Preddictingbased-onServices
Predictingbased-onServices
Users QoSvalues ondifferentservices
Users QoSvalues ondifferentservices
Stage 1 Stage 2 Stage 3
Predictingbased-on Usersand Services
Predictingbased-on Usersand Services
Targetuser
Stage 4
Part[k,v]
Part[k,v]
User AssociatedMAtrix:Mu
User AssociatedMAtrix:Mu
PredictedQos ValuesPredictedQos Values
ervices QoSvalues on
different users
Services QoSvalues on
different users
Web Service set
Part[k,v]
yGranularityAnalysis
llel Clustering ServicesParallel Clustering Services
IndexedRDD2
...
SimilarServicesSimilarServicesPart[k,v]
Part[k,v]
Part[k,v]
GranularityAnalysis
GranularityAnalysis
Parallel Covering on Spark
iiiService Associated
MAtrix:MsService Associated
MAtrix:Ms
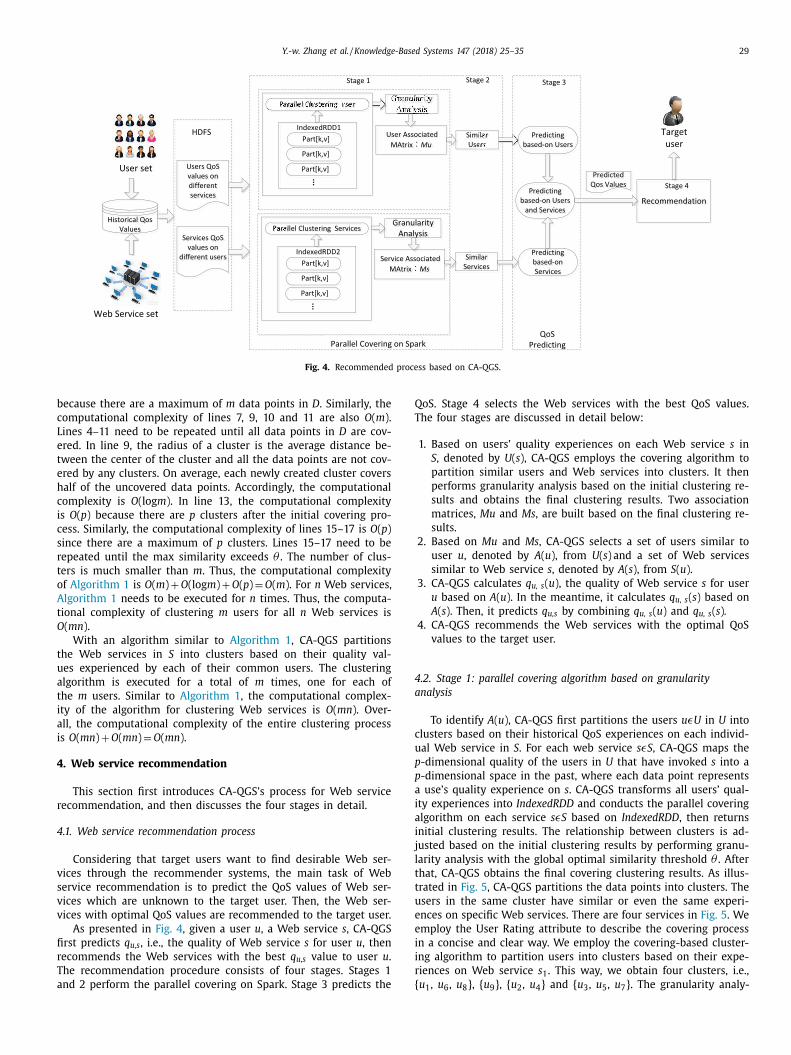
Fig. 4. Recommended process based on CA-QGS.
b
c
L
e
t
e
h
c
i
c
s
r
t
o
A
t
O
t
u
a
t
i
a
i
4
r
4
v
s
v
v
fi
r
T
a
Q
T
4
a
c
u
p
p
a
i
a
i
j
l
t
t
u
e
e
i
i
r
{
ecause there are a maximum of m data points in D . Similarly, the
omputational complexity of lines 7, 9, 10 and 11 are also O ( m ).
ines 4–11 need to be repeated until all data points in D are cov-
red. In line 9, the radius of a cluster is the average distance be-
ween the center of the cluster and all the data points are not cov-
red by any clusters. On average, each newly created cluster covers
alf of the uncovered data points. Accordingly, the computational
omplexity is O (log m ). In line 13, the computational complexity
s O ( p ) because there are p clusters after the initial covering pro-
ess. Similarly, the computational complexity of lines 15–17 is O ( p )
ince there are a maximum of p clusters. Lines 15–17 need to be
epeated until the max similarity exceeds θ . The number of clus-
ers is much smaller than m . Thus, the computational complexity
f Algorithm 1 is O ( m ) + O (log m ) + O ( p ) = O ( m ). For n Web services,
lgorithm 1 needs to be executed for n times. Thus, the computa-
ional complexity of clustering m users for all n Web services is
( mn ).
With an algorithm similar to Algorithm 1 , CA-QGS partitions
he Web services in S into clusters based on their quality val-
es experienced by each of their common users. The clustering
lgorithm is executed for a total of m times, one for each of
he m users. Similar to Algorithm 1 , the computational complex-
ty of the algorithm for clustering Web services is O ( mn ). Over-
ll, the computational complexity of the entire clustering process
s O ( mn ) + O ( mn ) = O ( mn ).
. Web service recommendation
This section first introduces CA-QGS’s process for Web service
ecommendation, and then discusses the four stages in detail.
.1. Web service recommendation process
Considering that target users want to find desirable Web ser-
ices through the recommender systems, the main task of Web
ervice recommendation is to predict the QoS values of Web ser-
ices which are unknown to the target user. Then, the Web ser-
ices with optimal QoS values are recommended to the target user.
As presented in Fig. 4 , given a user u , a Web service s , CA-QGS
rst predicts q u,s , i.e., the quality of Web service s for user u , then
ecommends the Web services with the best q u,s value to user u .
he recommendation procedure consists of four stages. Stages 1
nd 2 perform the parallel covering on Spark. Stage 3 predicts the
oS. Stage 4 selects the Web services with the best QoS values.
he four stages are discussed in detail below:
1. Based on users’ quality experiences on each Web service s in
S , denoted by U ( s ), CA-QGS employs the covering algorithm to
partition similar users and Web services into clusters. It then
performs granularity analysis based on the initial clustering re-
sults and obtains the final clustering results. Two association
matrices, Mu and Ms , are built based on the final clustering re-
sults.
2. Based on Mu and Ms , CA-QGS selects a set of users similar to
user u , denoted by A ( u ), from U ( s ) and a set of Web services
similar to Web service s , denoted by A ( s ), from S ( u ).
3. CA-QGS calculates q u, s ( u ), the quality of Web service s for user
u based on A ( u ). In the meantime, it calculates q u, s ( s ) based on
A ( s ). Then, it predicts q u,s by combining q u, s ( u ) and q u, s ( s ) .
4. CA-QGS recommends the Web services with the optimal QoS
values to the target user.
.2. Stage 1: parallel covering algorithm based on granularity
nalysis
To identify A ( u ), CA-QGS first partitions the users u εU in U into
lusters based on their historical QoS experiences on each individ-
al Web service in S . For each web service s εS , CA-QGS maps the
-dimensional quality of the users in U that have invoked s into a
-dimensional space in the past, where each data point represents
use’s quality experience on s . CA-QGS transforms all users’ qual-
ty experiences into IndexedRDD and conducts the parallel covering
lgorithm on each service s εS based on IndexedRDD , then returns
nitial clustering results. The relationship between clusters is ad-
usted based on the initial clustering results by performing granu-
arity analysis with the global optimal similarity threshold θ . After
hat, CA-QGS obtains the final covering clustering results. As illus-
rated in Fig. 5 , CA-QGS partitions the data points into clusters. The
sers in the same cluster have similar or even the same experi-
nces on specific Web services. There are four services in Fig. 5 . We
mploy the User Rating attribute to describe the covering process
n a concise and clear way. We employ the covering-based cluster-
ng algorithm to partition users into clusters based on their expe-
iences on Web service s 1 . This way, we obtain four clusters, i.e.,
u , u , u }, { u }, { u , u } and { u , u , u }. The granularity analy-
1 6 8 9 2 4 3 5 7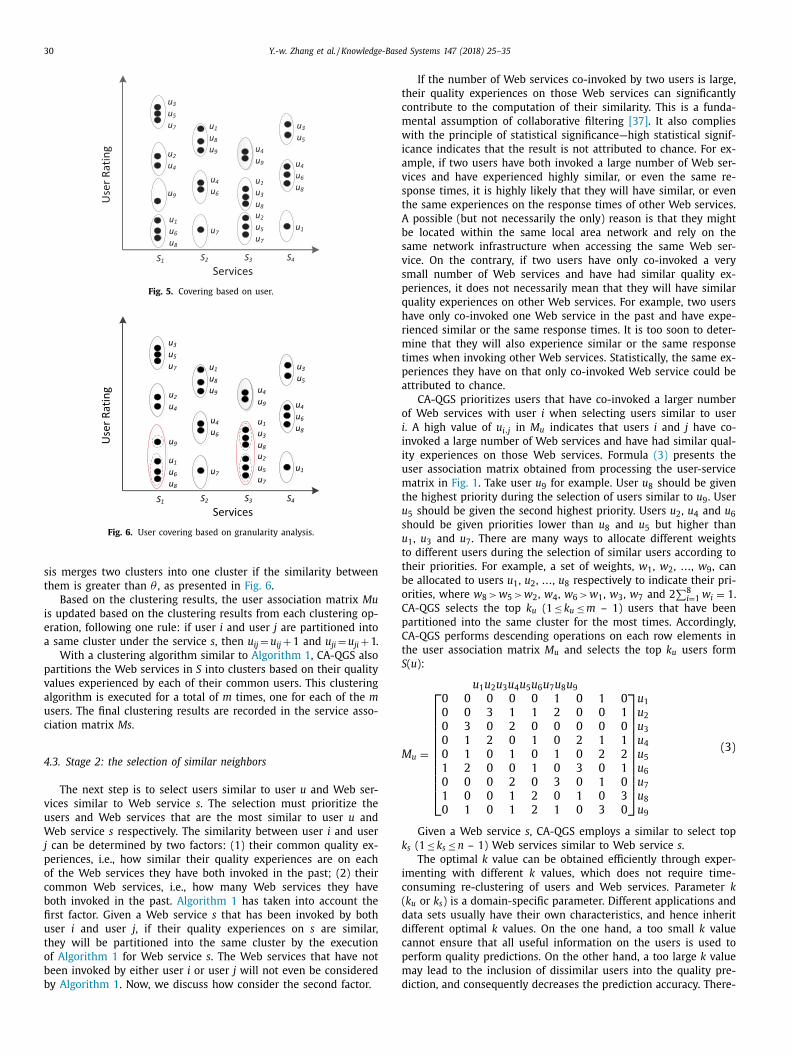
30 Y.-w. Zhang et al. / Knowledge-Based Systems 147 (2018) 25–35
Fig. 5. Covering based on user.
Fig. 6. User covering based on granularity analysis.
t
c
m
w
i
a
v
s
t
A
b
s
v
s
p
q
h
r
m
t
p
a
o
i
i
i
u
m
t
u
s
u
t
t
b
o
C
p
C
t
S
M
k
i
c
(
d
d
c
p
m
d
sis merges two clusters into one cluster if the similarity between
them is greater than θ , as presented in Fig. 6 .
Based on the clustering results, the user association matrix Mu
is updated based on the clustering results from each clustering op-
eration, following one rule: if user i and user j are partitioned into
a same cluster under the service s , then u ij = u ij + 1 and u ji = u ji + 1.
With a clustering algorithm similar to Algorithm 1 , CA-QGS also
partitions the Web services in S into clusters based on their quality
values experienced by each of their common users. This clustering
algorithm is executed for a total of m times, one for each of the m
users. The final clustering results are recorded in the service asso-
ciation matrix Ms .
4.3. Stage 2: the selection of similar neighbors
The next step is to select users similar to user u and Web ser-
vices similar to Web service s . The selection must prioritize the
users and Web services that are the most similar to user u and
Web service s respectively. The similarity between user i and user
j can be determined by two factors: (1) their common quality ex-
periences, i.e., how similar their quality experiences are on each
of the Web services they have both invoked in the past; (2) their
common Web services, i.e., how many Web services they have
both invoked in the past. Algorithm 1 has taken into account the
first factor. Given a Web service s that has been invoked by both
user i and user j , if their quality experiences on s are similar,
they will be partitioned into the same cluster by the execution
of Algorithm 1 for Web service s . The Web services that have not
been invoked by either user i or user j will not even be considered
by Algorithm 1 . Now, we discuss how consider the second factor.
If the number of Web services co-invoked by two users is large,
heir quality experiences on those Web services can significantly
ontribute to the computation of their similarity. This is a funda-
ental assumption of collaborative filtering [37] . It also complies
ith the principle of statistical significance—high statistical signif-
cance indicates that the result is not attributed to chance. For ex-
mple, if two users have both invoked a large number of Web ser-
ices and have experienced highly similar, or even the same re-
ponse times, it is highly likely that they will have similar, or even
he same experiences on the response times of other Web services.
possible (but not necessarily the only) reason is that they might
e located within the same local area network and rely on the
ame network infrastructure when accessing the same Web ser-
ice. On the contrary, if two users have only co-invoked a very
mall number of Web services and have had similar quality ex-
eriences, it does not necessarily mean that they will have similar
uality experiences on other Web services. For example, two users
ave only co-invoked one Web service in the past and have expe-
ienced similar or the same response times. It is too soon to deter-
ine that they will also experience similar or the same response
imes when invoking other Web services. Statistically, the same ex-
eriences they have on that only co-invoked Web service could be
ttributed to chance.
CA-QGS prioritizes users that have co-invoked a larger number
f Web services with user i when selecting users similar to user
. A high value of u i , j in M u indicates that users i and j have co-
nvoked a large number of Web services and have had similar qual-
ty experiences on those Web services. Formula (3) presents the
ser association matrix obtained from processing the user-service
atrix in Fig. 1 . Take user u 9 for example. User u 8 should be given
he highest priority during the selection of users similar to u 9 . User
5 should be given the second highest priority. Users u 2 , u 4 and u 6 hould be given priorities lower than u 8 and u 5 but higher than
1 , u 3 and u 7 . There are many ways to allocate different weights
o different users during the selection of similar users according to
heir priorities. For example, a set of weights, w 1 , w 2 , …, w 9 , can
e allocated to users u 1 , u 2 , …, u 8 respectively to indicate their pri-
rities, where w 8 > w 5 > w 2 , w 4 , w 6 > w 1 , w 3 , w 7 and 2 ∑ 8
i =1 w i = 1 .
A-QGS selects the top k u (1 ≤ k u ≤ m – 1) users that have been
artitioned into the same cluster for the most times. Accordingly,
A-QGS performs descending operations on each row elements in
he user association matrix M u and selects the top k u users form
( u ):
u 1 u 2 u 3 u 4 u 5 u 6 u 7 u 8 u 9
u =
⎡
⎢ ⎢ ⎢ ⎢ ⎢ ⎢ ⎢ ⎢ ⎢ ⎣
0 0 0 0 0 1 0 1 0
0 0 3 1 1 2 0 0 1
0 3 0 2 0 0 0 0 0
0 1 2 0 1 0 2 1 1
0 1 0 1 0 1 0 2 2
1 2 0 0 1 0 3 0 1
0 0 0 2 0 3 0 1 0
1 0 0 1 2 0 1 0 3
0 1 0 1 2 1 0 3 0
⎤
⎥ ⎥ ⎥ ⎥ ⎥ ⎥ ⎥ ⎥ ⎥ ⎦
u 1
u 2
u 3
u 4
u 5
u 6
u 7
u 8
u 9
(3)
Given a Web service s , CA-QGS employs a similar to select top
s (1 ≤ k s ≤ n – 1) Web services similar to Web service s .
The optimal k value can be obtained efficiently through exper-
menting with different k values, which does not require time-
onsuming re-clustering of users and Web services. Parameter k
k u or k s ) is a domain-specific parameter. Different applications and
ata sets usually have their own characteristics, and hence inherit
ifferent optimal k values. On the one hand, a too small k value
annot ensure that all useful information on the users is used to
erform quality predictions. On the other hand, a too large k value
ay lead to the inclusion of dissimilar users into the quality pre-
iction, and consequently decreases the prediction accuracy. There-
Y.-w. Zhang et al. / Knowledge-Based Systems 147 (2018) 25–35 31
f
r
k
4
u
a
u
k
q
w
a
r
d
i
t
t
m
w
t
q
w
v
s
u
c
o
s
s
s
b
t
p
s
s
C
λ
a
q
w
g
t
e
0
n
u
q
q
4
(
r
5
s
p
o
e
t
t
a
n
5
w
5
(
t
a
s
f
t
o
i
s
d
t
h
d
e
t
k
c
5
n
(
M
w
u
a
o
R
r
5
t
ore, the k value should be set domain-specifically based on expe-
iences and/or experiments. In Section 5.4 , we study the impact of
on the prediction accuracy with a real-world data set.
.4. Stage 3: prediction
Based on the quality experiences obtained from the selected k s sers similar to user u , i.e., A ( u ), CA-QGS employs Formula (4) as
user-based method to predict the quality of Web service s for
ser u with a weighted average of the quality experienced by the
u users:
u,s ( u ) =
∑ k u t=1 ( r a u (t) × n a u (t) )
N u (4)
here k u is the number of users similar to the target user u,
u ( t ) represents the t th user in the set of users similar to user u ,
a u (t) denotes the user a u ( t ) that invoked Web service s , n a u (t) in-
icates the number of times that user u and a u ( t ) are partitioned
nto a same cluster, and N u represents the total number of times
hat user u and its similar users are partitioned into a same clus-
er.
Similarly, CA-QGS employs formula (5) as an item-based
ethod to predict the quality of Web service s for user u with a
eighted average of the quality of the selected k s services similar
o Web service s , i.e., A ( s ):
u,s ( s ) =
∑ k s t=1 ( r a s (t) × n a s (t) )
N s (5)
here k s is the number of Web services similar to the target ser-
ice s, a s ( t ) represents the t th service in the set of Web service
imilar to s , r a s (t) denotes service a s ( t ) that was invoked by user
, n a s (t) indicates the number of times that service s and a s ( t ) are
lustered into a same cluster, and N s represents the total number
f times that service s and its similar services are clustered into a
ame cluster.
Formulas (4) and (5) are used to predict the quality of a Web
ervice based on only similar users and similar Web services re-
pectively. However, it is possible that there are only a small num-
er of similar users or similar Web services due to the sparsity of
he user-service matrix. Quality prediction by formula (4) or (5) is
rone to be inaccurate due to the lack of adequate data in the user-
ervice matrix. Thus, it is necessary to combine the prediction re-
ults obtained by the user-based and item-based methods. Thus,
A-QGS combines formulas (4) and (5) with the weighting factor
, which is experimentally studied in Section 5.4 , to achieve more
ccurate prediction results:
u,s = λq u,s (u ) + (1 − λ) q u,s (s ) (6)
here λε[0,1] is a weighting parameter that indicates the priority
iven for the results obtained from Formula (4) . Parameter λ allows
he prediction to adapt to different environments. When λ= 1, it is
quivalent to prediction solely based on users. On the contrary, λ= is equivalent to prediction solely based on services. If user u has
ot invoked any services and service i has not been invoked by any
sers, the average quality of all services is used as the predicted
uality. Formula (7) summarizes the three different scenarios:
us =
⎧ ⎪ ⎨
⎪ ⎩
λq us (u ) + (1 − λ) q us (s ) q us (u ) q us (s ) null
A (u ) � = ∅ and A (s ) � = ∅ A (u ) � = ∅ and A (s ) = ∅ A (u ) = ∅ and A (s ) � = ∅ A (u ) = ∅ and A (s ) = ∅
(7)
.5. Stage 4: Web service recommendation
After predicting the quality values of Web services with formula
7) , the Web services with the optimal QoS values are selected and
ecommended to user u .
. Experimental evaluation
In this section, we experimentally compare CA-QGS with six
tate-of-the-art approaches in their effectiveness (measured by
redication accuracy) and efficiency (measured by computational
verhead). In the experiments, we change the values of differ-
nt parameters, including the matrix density, λ, k , the similarity
hreshold θ and the number of clusters.
The Spark cluster used to implement CA-QGS is built on a clus-
er with nine connected nodes. Each node runs Windows 7 64 bit
nd Spark 1.4 on Intel Core i7-4970 3.6 GHZ, 16G RAM. The total
umber of CPU cores is 72 and the total memory capacity is 450G.
.1. Experimental setup
The experiments are conducted on WS-Dream [15–17] , a real-
orld dataset that contains two-dimensional quality values of
,825 real-world Web services, including their round-trip times
RTT) and throughput (TP). The data were collected from 339 dis-
ributed users’ invocations on those Web services. In total, there
re 1,974,675 records. This dataset has been used by many re-
earchers [10,32] . In this section, we present the results obtained
rom experiments on the RTT data. The ones from experiments on
he TP data are similar, thus are omitted.
In the experiments, we randomly select a certain percentage
f Web services from the dataset as a training set. The remain-
ng Web services are used as a test set. The percentage of training
et varies from 5% to 30% in step of 5%. We also change the matrix
ensity from 0.1 to 0.3 in steps of 0.05, k from 1 to 10, λ from 0.1
o 1, and the similarity threshold θ from 0.4. This way, we compre-
ensively evaluate the ability of CA-QGS to handle datasets with
ifferent characteristics in various application scenarios. We also
valuate the efficiency of CA-QGS by comparing the time consump-
ion with a state-of-the-art parallel prediction approach based on
-means. In those experiments, we change the total number of CPU
ores from 10 to 50 in step of 10.
.2. Evaluation metrics
To evaluate the prediction accuracy, we employ two metrics,
amely mean absolute error (MAE) and root mean square error
RMSE), in the experiments.
MAE is defined as:
AE =
∑
u,s | r(u, s ) − p(u, s ) | N
(8)
here r ( u, s ) denotes the predicted QoS values between service
ser u and Web service s, p ( u, s ) denotes the measured QoS value,
nd N is the number of Web services in the prediction results.
Root mean square error (RMSE) presents the standard deviation
f the prediction error, which is expressed as follow:
MSE =
√ ∑
u , s (r(u, s ) − p(u, s )) 2
N
(9)
Lower MAE and RMSE values indicate higher prediction accu-
acy.
.3. Performance comparison
CA-QGS is compared with the following state-of-the-art predic-
ion approaches:
• UPCC (User-based collaborative filtering method using Pear-
son Correlation Coefficient): This method employs values con-
tributed by similar users to predict missing QoS values [17] .
32 Y.-w. Zhang et al. / Knowledge-Based Systems 147 (2018) 25–35
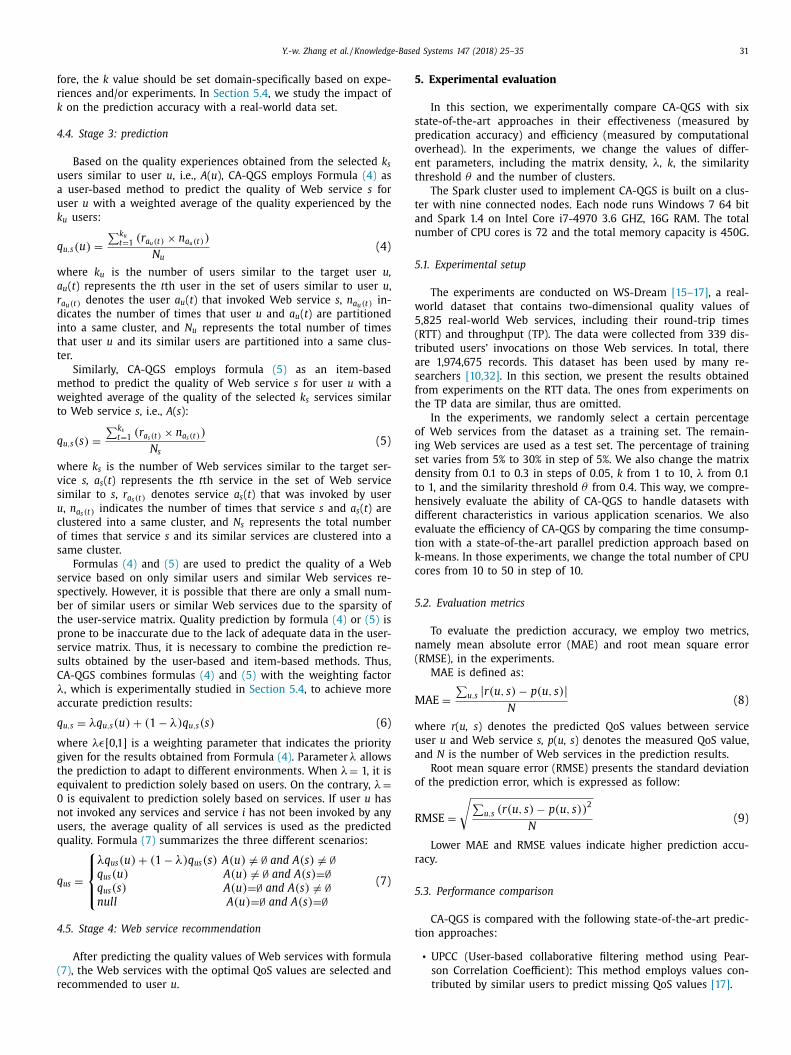
Table 1
Accuracy comparison (Top- k = 2, λ= 0.4).
Quality dimension Method MAE RMSE
Matrix density
0.05 0.10 0.15 0.20 0.25 0.3 0.05 0.10 0.15 0.20 0.25 0.3
RT UPCC 0.6274 0.5346 0.486 0.4665 0.4523 0.4365 1.4877 1.3845 1.312 1.2944 1.2669 1.2265
IPCC 0.8685 0.8581 0.8256 0.7116 0.671 0.6129 1.6641 1.6915 1.5274 1.4674 1.4652 1.3936
UIPCC 0.7121 0.682 0.6356 0.5626 0.5346 0.4985 1.4784 1.4464 1.3276 1.2826 1.2642 1.21
PKU 0.5365 0.4845 0.4539 0.433 0.418 0.4018 1.5863 1.51 1.4 4 4 4 1.4064 1.3912 1.3388
PKI 0.4079 0.3757 0.3675 0.3598 0.3544 0.3431 1.3791 1.3296 1.308 1.3082 1.3071 1.2535
PKUI 0.4202 0.3864 0.3718 0.363 0.3521 0.3401 1.3036 1.251 1.2173 1.2139 1.1998 1.1547
UCA-QGS 0.4851 0.4347 0.4074 0.389 0.3786 0.3708 1.471 1.3807 1.3232 1.2874 1.2772 1.251
ICA-QGS 0.4173 0.3899 0.3763 0.369 0.3612 0.3491 1.2934 1.2389 1.2011 1.1966 1.1871 1.14 4 4
CA-QGS 0.4054 0.3715 0.354 0.3437 0.3355 0.3268 1.2401 1.1808 1.1365 1.1298 1.1163 1.0828
Fig. 7. Impact of k on CA-QGS.
Fig. 8. Impact of λ.
n
W
5
u
o
C
c
Q
e
s
2
C
w
M
S
s
e
a
5
p
• IPCC (Item-based collaborative filtering method using Pear-
son Correlation Coefficient): This method employs values con-
tributed by similar services to predict missing QoS values [23] .
• UIPCC: This method combines UPCC and IPCC with a specific
parameter lambda to predict missing values based on both sim-
ilar users and similar services [27] .
• PKU: The parallel K-means method is used to cluster users and
the similar users are obtained. Then, the missing QoS values of
unused Web services are predicted based on similar users for
recommendation.
PKU shares the same methodology as our user-based prediction
approach UCA-QGS to cluster users for the identification of simi-
lar users. To ensure the comprehensiveness of the comparison, we
have also implemented the following two prediction approaches:
• PKI: The parallel K-means method is used to cluster Web ser-
vices to identify similar Web services. Then, the missing QoS
values of unused Web services are predicted based on similar
users for recommendation.
• PKUI: Combining PKU and PKI, this approach predicts the miss-
ing quality values of unused Web services based on both similar
users and similar Web services.
In this series of experiments, the matrix density varies from 5%
to 30% in steps of 5%. The value of k is set to 2, and λ= 0.4. The ac-
curacies achieved by different approaches are presented in Table 1 .
The experimental results show that CA-QGS achieves the high-
est prediction accuracy across all scenarios. The increase in the
matrix density increases the prediction accuracy obtained by CA-
QGS.
5.4. Impact of parameters
5.4.1. Impact of Top- k
Parameter k determines the number of similar users or services
selected for prediction. In order to investigate the impact of k on
prediction accuracy, we set the matrix density as 20%, λ as 0.4 and
similarity threshold θ as 0.6, and change the value of k from 1 to
10 in steps of 1. The experimental results are illustrated in Fig. 7 .
According to the experimental results, the increase in the value
of k does not necessarily lead to a higher prediction accuracy. Over-
all, as the value of k increases, the prediction accuracy increases at
the beginning before reaching its optimal value 2, and then starts
to decrease because k continues to increase. This indicates that k
must not be too small or too big. A k value that is too small does
not include adequate information on similar users and Web ser-
vices in the prediction. This is demonstrated in Fig. 7 by the de-
creases in MAE and RMSE in both series of experiments as the
value of k starts to increase from 1. On the other hand, a k value
that is too large may involves users and/or Web services that are
ot similar to target user and target Web service. Such users and
eb services may decrease the prediction accuracy significantly.
.4.2. Impact of λParameter λ determines how much CA-QGS replies on similar
sers and similar services respectively, when predicting the quality
f a Web service for a user. As discussed in Section 4.4 , when λ= 0,
A-QGS is equivalent to ICA-QGS as only similar Web services are
onsidered. Similarly, when λ= 1.0, CA-QGS is equivalent to UCA-
GS. Thus, we vary the λ value from 0.1 to 0.9 in steps of 0.1 to
valuate its impact on CA-QGS. In this series of experiments, we
et the matrix density to 0.2, similarity threshold θ to 0.6 and k to
. The experimental results are illustrated in Fig. 8 .
Fig. 8 demonstrates that λ impacts the prediction accuracy of
A-QGS significantly. Overall, MAE and RMSE in Fig. 8 increase
ith the increase of λ before reaching their optimal values. Then,
AE and RMSE decrease because the λ value continues to increase.
imilar to our findings of k, λ must not be too small or too big. A
uitable λ value provides the best prediction accuracy because it
nables a proper combination of the information on similar users
nd similar Web services.
.4.3. Impact of θFinding the global optimal similarity threshold θ is vital to im-
rove the prediction accuracy of CA-QGS. We conduct extensive ex-
Y.-w. Zhang et al. / Knowledge-Based Systems 147 (2018) 25–35 33
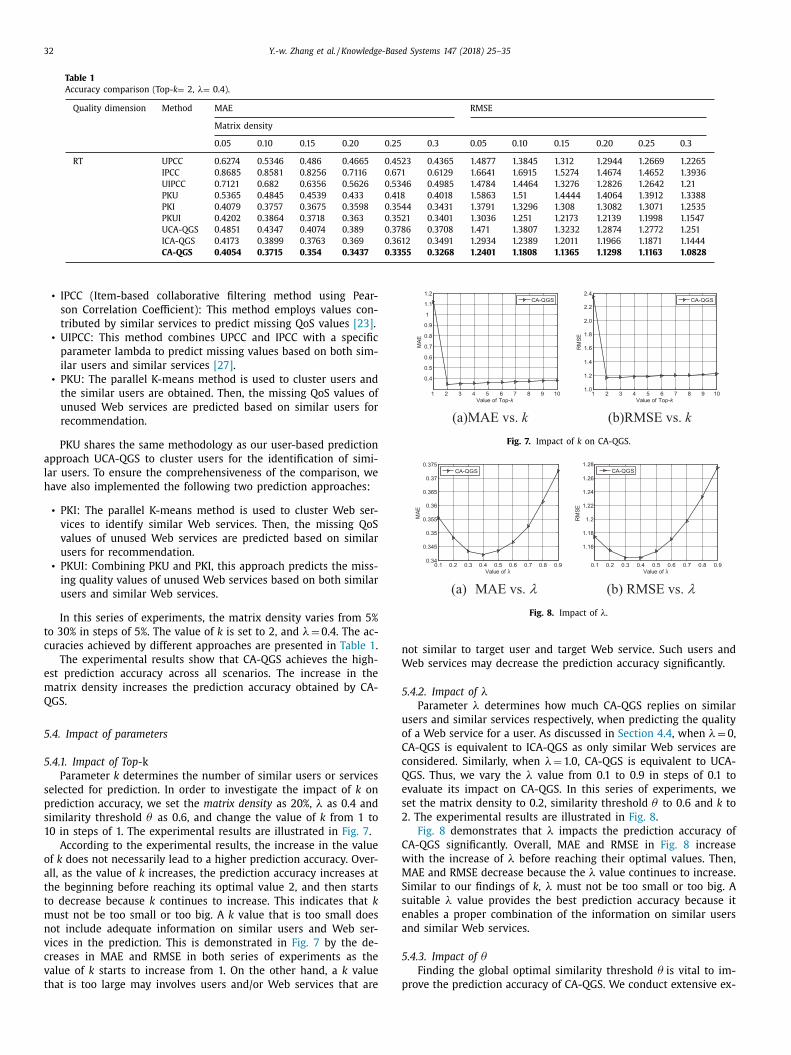
Fig. 9. Impact of θ .
Fig. 10. Impact of matrix density.
p
w
t
w
c
p
m
t
l
o
t
θ
r
p
s
w
a
5
f
s
Q
t
r
c
w
a
i
5
t
t
d
t
i
Fig. 11. Efficiency of CA-QGS and CA.
Fig. 12. Efficiency of CA-QGS and K-means.
W
m
b
d
w
r
W
1
v
i
o
g
t
o
s
r
t
s
v
d
o
1
d
m
i
c
s
o
p
t
s
s
t
a
v
t
eriments to study the impact of θ . In this series of experiments,
e set the matrix density to 0.2, λ to 0.4 and k to 2. In the mean-
ime, we vary the value of θ from 0.3 to 1 in steps of 0.1. Then,
e obtain user association matrices and service association matri-
es with different values of θ . Finally, we employ those matrices to
erform prediction and obtain the optimal value of θ . The experi-
ental results are illustrated in Fig. 9 .
If θ is set to a small number, the data may be only clus-
ered into a few clusters. In contrast, if the threshold is set to a
arge number, the data may be clustered into many clusters with-
ut considering the correlation between the clusters after the ini-
ial clustering. Fig. 9 shows the clustering results with different
values. It demonstrates that an appropriate θ allows an accu-
ate prediction. In our experiments, we obtain the most accurate
rediction results when θ = 0.6. Once θ changes, the clustering re-
ults will change. This leads to changes in the association matrices,
hich impact the prediction results. Therefore, the change in θ has
great influence on the prediction results.
.4.4. Impact of matrix density
Section 5.2 compares the prediction accuracy achieved by dif-
erent approaches under various matrix density settings. In this
ection, we investigate the impact of the matrix density on CA-
GS. The experimental results shown in Fig. 10 demonstrate that
he matrix density has a significant impact on the prediction accu-
acy obtained by CA-QGS.
The experimental results show that both MAE and RMSE de-
rease because the matrix density increases in all cases. A data set
ith a higher matrix density contains more information on users
nd Web services that can be employed to make predictions. Thus,
t allows CA-QGS to achieve higher prediction accuracy.
.5. Efficiency evaluation
Besides the effectiveness measured by the prediction accuracy,
he efficiency of a recommendation approach also plays an impor-
ant role in its practicality. The time consumption of a recommen-
ation approach with high effectiveness might still not be prac-
ical in very large-scale scenarios. In recent years, cloud comput-
ng has significantly promoted the development of big data [26] .
ith the prevalence of cloud computing and service computing,
ore and more services have been co-invoked by a large num-
er of users, resulting in massive invoking records. We also con-
uct a series of experiments to compare the efficiency of CA-QGS
ith K-means in processing a large number of service invocation
ecords. We synthetically generate five large datasets based on the
S-Dream dataset, which include 10 0,0 0 0, 1,0 0 0,0 0 0, 5,0 0 0,0 0 0,
0,0 0 0,0 0 0, and 20,0 0 0,0 0 0 service invocation records to simulate
ery large-scale scenarios. These datasets are generated by extract-
ng the corresponding number of users’ service invocation records
n each Web service and the all service invocation records are re-
arded as those generated by many users on a Web service.
To evaluate the performance of the parallel covering-based clus-
ering algorithm introduced in Section 4.2 , we compare it with the
riginal covering algorithm (CA) on the five abovementioned large-
cale datasets. The results are shown in Fig. 11 where Differ-DSs
efer to five large data sets. Fig. 11 (a) shows the time consumption
aken by CA-QGS and CA respectively, while Fig. 11 (b) shows the
peedup of CA-QGS against CA.
CA-QGS takes 10 s to process the dataset with 10 0,0 0 0 ser-
ice invocation records and CA takes 12 s. To process the largest
atasets with 20,0 0 0,0 0 0 service invocation records, CA-QGS takes
nly 192 s, 18 times more (192 s versus 10 s), while CA takes
230 s, 102 (1230 s versus 12 s). The results indicate that, as the
ataset becomes larger, the time taken by CA increases more much
ore rapidly than CA-QGS. As we can see in Fig. 11 (b), with the
ncrease in the size of the dataset, the speedup of CA-QGS also in-
reases. This demonstrates that CA-QGS is suitable for large-scale
cenarios.
We also implement extensive experiments to study the impact
f the total number of CPU cores on CA-QGS and the prediction ap-
roach based on k-means. In Fig. 12 , Speedup refers to the ratio of
he time spent by a single processor system and a multi-processor
ystem. DS1 and DS2 refer to the two datasets, one with 5,0 0 0,0 0 0
ervice invocation records and the other with 10,0 0 0,0 0 0, used in
his series of experiments.
Fig. 12 (a) demonstrates the time consumption taken by CA-QGS
nd k-means to process the dataset with 10,0 0 0,0 0 0 service in-
ocation records. With the increase in the number of CPU cores,
he time taken by CA-QGS and k-means gradually decrease. How-
34 Y.-w. Zhang et al. / Knowledge-Based Systems 147 (2018) 25–35
i
a
r
r
u
v
m
C
s
a
6
t
d
s
v
m
t
q
a
g
a
g
h
o
W
g
c
p
t
t
n
s
h
t
n
a
u
t
t
S
k
c
o
t
a
g
t
t
o
l
T
t
t
r
s
i
g
o
n
t
Q
ever, CA-QGS consumes much less time than k-means which in-
dicates that the efficiency of our method is significantly better
than the prediction approach based on k-means. The speedups of
CA-QGS are shown in Fig. 12 (b). We can observe that, with the
same number of CPU cores, a bigger dataset results in a more sig-
nificant speedup. When the number of CPU cores increases, the
speedup also increases but has less significant. This is caused by
the increase in the communication between CPU cores, which con-
tributes to the total clustering time. Thus, in scenarios with an
even larger dataset or where extremely fast predictions are needed,
CA-QGS is a more suitable choice due to its outstanding advantage
in efficiency over the traditional covering algorithm and the pre-
diction approach based on k-means.
6. Related works
Web service recommendation has become a very active re-
search area in the past few years. CF is the dominant technique
in current recommender systems [4,5,19,20] for Web service rec-
ommendation. In recent years, many researchers have employed
clustering techniques to improve the drawbacks of CF in predict-
ing the quality of Web services. This section will first review the
related work on CF-based approaches for Web service recommen-
dation in general, then the approaches based on clustering.
6.1. CF-based approaches
CF approaches are widely adopted in recommender systems
[4,19,20] for Web services. Many approaches based on CF have
been proposed in recent years for Web service recommendation
[9,18,21–25] . To name a few, the approach proposed by Shao et al.
[17] first calculates the similarity measured by the Pearson Corre-
lation Coefficient (PCC) between users based on their past experi-
ences on the quality of Web services. It then predicts the quality
values of the target Web services based on users’ experiences that
are similar to the target user. This method is implemented in our
experiments as UPCC. The method named IPCC, which is also im-
plemented in our experiments, is a prediction approach based on
only similar Web services. This approach was first invented and
used by Amazon [23] and has been extensively investigated and
widely employed [24] . This approach identifies similar Web ser-
vices using PCC and predicts the missing quality values of unused
Web services based on identified similar Web services.
Making predictions only based on similar users like UPCC suffer
from poor prediction accuracy when there are not adequate similar
users and the same for IPCC when there are not adequate similar
Web services. To address this issue, Zheng et al. [27] combine the
user-based and item-based CF techniques and introduce weights to
balance the impact of user-based and item-based CF approaches.
Their approach improves the prediction accuracy significantly. Re-
searchers have also employed other modified CF-based approaches
to perform Web service recommendation. Liu et al. [28] present a
new user similarity model to improve the recommendation accu-
racy while only a few service invocation records are available for
the calculation of user similarity. The model considers not only the
local context information of service invocation records, but also the
global preferences for user behaviors. Luo et al. [29] design an in-
cremental CF-based approach enhanced with the Regularized Ma-
trix Factorization (RMF). They investigate the training process of
MF-based recommendation approaches, and incrementally update
the trained parameters according to new data. As a result, they
can obtain an efficient strategy used in Recommender. Liu et al.
[30] propose a combination of location-aware and personalized CF
method. They employ not only the quality values but also the loca-
tion of Web services to perform service recommendation. The loca-
tion of a user is estimated based on its IP address. Similar users are
dentified based on both their quality experiences on Web services
nd their locations. A location-aware and personalized Web service
ecommendation approach is designed. Wang et al. [31] propose a
eputation measurement method to prevent biased and malicious
sers’ quality ratings of Web services from being used in Web ser-
ice recommendation. This approach detects user preferences and
alicious users’ quality ratings of Web services by adopting the
umulative Sum Control Chart. It then reduces the influence of
ubjective users’ quality ratings using PCC. This way, the prediction
ccuracy can be improved.
.2. Clustering-based approaches
Data sparsity, poor scalability the computational overhead are
he three major issues that CF techniques have yet to properly ad-
ress. Many researchers have attempted to cluster users and Web
ervices to identify similar users and Web services before Web ser-
ice recommendation.
Kumara et al. [32] propose a clustering-based service recom-
endation approach that employs the bottom-up hierarchical clus-
ering technique to cluster users and Web services based on their
uality experiences and semantic similarity. They also consider the
ssociation between services and recommend services using the
enerated clusters and services with better QoS values selected by
filtering process. Chen et al. [33] cluster users into different re-
ions according to their locations and quality experiences with the
ierarchical clustering technique. Web services are clustered based
nly on the similarity between their QoS values. The quality of
eb services are then performed by finding target user’s or tar-
et service’s similar neighbors. However, their approach does not
onsider the information on similar users. Zhang et al. [34] pro-
ose an approach that employs a fuzzy clustering approach to clus-
er users. The approach takes the advantages of both fuzzy clus-
ering and PCC. The major limitation of their approach is the sig-
ificant impact of initially selected centroids on the clustering re-
ults. Due to its simplicity and popularity, the k-means algorithm
as also attracted many researchers’ attention as a means for clus-
ering users and Web services. Yu et al. [3] propose an approach
amed CluCF that employs the k-means algorithm to cluster users
nd Web services with the focus on lowering the complexity of
pdating clusters upon new users and new Web services. Similar
o [3] , Wu et al. [10] also employ the k-means algorithm to clus-
er users, but with a different aim to identify untrustworthy users.
u et al. [35] propose a trust-aware approach TAP that combines
-means for Web service recommendation. They use k-means to
luster users and Web services and then calculate the reputation
f users and Web services based on the clustering information and
heir beta reputation. Next, they identify trustworthy similar users
nd similar Web services. Finally, they perform predictions for tar-
et users by combining similar users and similar Web services. Al-
hough those recommendation approaches perform well in off-line
esting on small datasets, they are too computationally expensive
n large datasets. Therefore, Wang et al. [36] propose a new col-
aborative filtering recommendation algorithm based on k-means.
his approach first clusters the longitude and latitude of users and
hen calculates the similarity of users within each cluster. However,
he critical limitation to prediction approaches based on k-means
emains unsolved - the clustering results heavily rely on the pre-
pecified number of clusters and the initially selected centroids.
In this paper, we propose CA-QGS, a novel approach for predict-
ng the quality of Web services and recommending services to tar-
et users. CA-QGS efficiently addresses the limitations and issues
f existing approaches with a novel covering-based clustering tech-
ique. CA-QGS does not require the number of clusters or the cen-
roids of clusters to be pre-specified. Implemented on Spark, CA-
GS can efficiently mitigate the issue of data scalability. The exper-
Y.-w. Zhang et al. / Knowledge-Based Systems 147 (2018) 25–35 35
i
s
d
7
p
u
t
t
w
t
a
c
C
u
r
a
t
a
u
v
t
o
s
d
t
s
i
s
A
P
a
1
U
R
[
[
[
[
[
[
[
[
[
[
[
[
[
[
[
mental results demonstrate that CA-QGS significantly outperforms
tate-of-the-art prediction approaches for Web service recommen-
ations in both effectiveness and efficiency.
. Conclusion and further study
In this paper, we propose CA-QGS, a novel covering-based ap-
roach for Web service recommendation with quotient space gran-
larity analysis. CA-QGS first employs a covering algorithm to par-
ition users into clusters based on the similarity between their his-
orical quality experiences on each of the co-invoked Web services
ith a granularity analysis mechanism. Based on the initial clus-
ering results, the granularity analysis mechanism helps users visu-
lly understand the physical meaning of within-class and among-
lass from different perspectives. Following a similar procedure,
A-QGS also partitions Web services into clusters based on each
ser’s quality experiences on them. Then, from the final clustering
esults, CA-QGS chooses a number of users and Web services that
re most similar to the target user and the target Web service as
he basis for quality prediction. Based on the selected similar users
nd Web services, CA-QGS predicts the quality of Web service s for
. Finally, CA-QGS recommends the Web services with optimal QoS
alues to the target user. CA-QGS can be implemented on Spark
o increase its efficiency in processing large datasets. The results
f the experiments on the real-world WS-Dream dataset demon-
trate that CA-QGS significantly outperforms state-of-the-art pre-
iction approaches for Web services. The results also demonstrate
hat CA-QGS is more efficient in both clustering and prediction.
In our future work, we will enhance CA-QGS to solve the cold-
tart problem and consider other QoS values, such as the location
nformation of the Web services, to facilitate more accurate Web
ervice recommendation.
cknowledgments
This work was supported by the National Key Technology R&D
rogram (no. 2015BAK24B01), the General Research for Humanities
nd Social Sciences Project of Chinese Ministry of Education (no.
5YJAZH112 ) and the Key Project of Nature Science Research for
niversities of Anhui Province of China (no. KJ2016A038).
eferences
[1] J. Yin , Y. Tang , W. Lo , et al. , From big data to great services, in: IEEE Interna-
tional Congress on Big Data, IEEE, 2016, pp. 165–172 . [2] R. Hu , W. Dou , J. Liu , Clubcf: a clustering-based collaborative filtering approach
for big data application, IEEE Trans. Emerg. Top. Comput. 2 (3) (2014) 302–313 .
[3] C. Yu , L. Huang , CluCF: a clustering CF algorithm to address data sparsity prob-lem, Serv. Oriented Comput. Appl. 11 (1) (2017) 33–45 .
[4] M. Al-Hassan , H. Lu , J. Lu , A semantic enhanced hybrid recommendation ap-proach: a case study of e-Government tourism service recommendation sys-
tem, Decis. Support Syst. 72 (2015) 97–109 . [5] Q. Shambour , J. Lu , An effective recommender system by unifying user and
item trust information for B2B applications, J. Comput. Syst. Sci. 81 (7) (2015)
1110–1126 . [6] L. Song , C. Tekin , M. van der Schaar , Online learning in large-scale contextual
recommender systems, IEEE Trans. Serv. Comput. 9 (3) (2016) 433–445 . [7] S. Deng , L. Huang , G. Xu , et al. , On deep learning for trust-aware recommen-
dations in social networks, IEEE Trans. Neural Netw. Learn. Syst. 28 (5) (2016)1164–1177 .
[8] S. Wang , Z. Zheng , Z. Wu , M.R. Lyu , F. Yang , Reputation measurement and ma-
licious feedback rating prevention in web service recommendation systems,IEEE Trans. Serv. Comput. 8 (5) (2015) 755–767 .
[9] K. Huang , Y. Liu , S. Nepal , Y. Fan , S. Chen , W. Tan , A novel equitable trustwor-thy mechanism for service recommendation in the evolving service ecosystem,
in: Proceedings of the International Conference on Service-Oriented Comput-ing (ICSOC), 2014, pp. 510–517 .
[10] C. Wu , W. Qiu , Z. Zheng , et al. , QoS prediction of web services based ontwo-phase K-means clustering, in: 2015 IEEE International Conference on Web
Services (ICWS), IEEE, 2015, pp. 161–168 . [11] L. Zhang , B. Zhang , A geometrical representation of McCulloch-Pitts neural
model and its applications, IEEE Trans. Neural Netw. 10 (4) (1999) 925–929 . [12] L. Zhang , B. Zhang , The quotient space theory of problem solving, Fundam. Inf.
59 (2–3) (2004) 287–298 . [13] A.G. Shoro , T.R. Soomro , Big data analysis: apache spark perspective, Global J.
Comput. Sci. Technol. 15 (1) (2015) 9–14 .
[14] S. Peng , J. Sankaranarayanan , H. Samet , SPDO: high-throughput road distancecomputations on spark using distance oracles, in: 2016 IEEE 32nd International
Conference on Data Engineering (ICDE), IEEE, 2016, pp. 1239–1250 . [15] Z. Zheng , M.R. Lyu , Personalized reliability prediction of web services, ACM
Trans. Softw. Eng. Methodol. 22 (2) (2013) 1–25 . [16] Z. Zheng , X. Wu , Y. Zhang , et al. , QoS ranking prediction for cloud services,
IEEE Trans. Parallel Distrib. Syst. 24 (6) (2013) 1213–1222 .
[17] L. Shao , J. Zhang , Y. Wei , et al. , Personalized QoS prediction for web servicesvia collaborative filtering, in: IEEE International Conference on Web Services
(ICWS), 2007, pp. 439–446 . [18] T. Könik , R. Mukherjee , J. Katukuri , Subjective similarity: personalizing alter-
native item recommendations, in: Proceedings of the 24th International WorldWide Web Conference (WWW), 2015, pp. 1275–1279 .
[19] J. Lu , D. Wu , M. Mao , W. Wang , G. Zhang , Recommender system application
developments: a survey, Decis. Support Syst. 74 (2015) 12–32 . 20] W. Wang , G. Zhang , J. Lu , Collaborative filtering with entropy-driven user sim-
ilarity in recommender systems, Int. J. Intell. Syst. 30 (8) (2015) 854–870 . [21] J. Yao , W. Tan , S. Nepal , S. Chen , J. Zhang , D. De Roure , C. Goble , Reputation-
net: reputation-based service recommendation for e-science, IEEE Trans. Serv.Comput. 8 (3) (2015) 439–452 .
22] Z. Zheng , H. Ma , M.R. Lyu , et al. , Wsrec: a collaborative filtering based web ser-
vice recommender system, in: IEEE International Conference on Web Services(ICWS), IEEE, 2009, pp. 437–4 4 4 .
23] G. Linden , B. Smith , J. York , Amazon.com recommendations: item-to-item col-laborative filtering, IEEE Internet Comput. 7 (1) (2003) 76–80 .
24] B. Sarwar , G. Karypis , J. Konstan , et al. , Item-based collaborative filtering rec-ommendation algorithms, in: Proceedings of the 10th International Conference
on World Wide Web, ACM, 2001, pp. 285–295 .
25] M. Deshpande , G. Karypis , Item-based top-n recommendation algorithms, ACMTrans. Inf. Syst. 22 (1) (2004) 143–177 .
26] Y.N. Xia , M.C. Zhou , X. Luo , et al. , A stochastic approach to analysis of ener-gy-aware DVS-enabled cloud datacenters, IEEE Trans. Syst. Man Cybern. Syst.
45 (1) (2015) 73–83 . [27] Z. Zheng , H. Ma , M.R. Lyu , I. King , QoS-aware web service recommendation by
collaborative filtering, IEEE Trans. Serv. Comput. 4 (2) (2011) 140–152 .
28] H. Liu , Z. Hu , A. Mian , et al. , A new user similarity model to improve the ac-curacy of collaborative filtering, Knowl. Based Syst. 56 (2014) 156–166 .
29] X. Luo , Y. Xia , Q. Zhu , Incremental collaborative filtering recommender basedon regularized matrix factorization, Knowl. Based Syst. 27 (2012) 271–280 .
30] J. Liu , M. Tang , Z. Zheng , et al. , Location-aware and personalized collabora-tive filtering for web service recommendation, IEEE Trans. Serv. Comput. 9 (5)
(2016) 686–699 . [31] S. Wang , Z. Zheng , Z. Wu , M.R. Lyu , F. Yang , Reputation measurement and ma-
licious feedback rating prevention in web service recommendation Systems,
IEEE Trans. Serv. Comput. 8 (5) (2015) 755–767 . 32] B.T.G.S. Kumara , I. Paik , T. Siriweera , et al. , Cluster-based web service rec-
ommendation, in: 2016 IEEE International Conference on Services Computing(SCC), IEEE, 2016, pp. 348–355 .
33] X. Chen , Z. Zheng , Q. Yu , M.R. Lyu , Web service recommendation via exploitinglocation and QoS information, IEEE Trans. Parallel Distrib. Syst. 25 (7) (2014)
1913–1924 .
34] M. Zhang , X. Liu , R. Zhang , et al. , A web service recommendation approachbased on QoS prediction using fuzzy clustering, in: 2012 IEEE Ninth Interna-
tional Conference on Services Computing (SCC), IEEE, 2012, pp. 138–145 . 35] K. Su , B. Xiao , B. Liu , et al. , TAP: a personalized trust-aware QoS prediction ap-
proach for web service recommendation, Knowl. Based Syst. 115 (2017) 55–65 .36] Z. Wang , N. Yu , J. Wang , User attributes clustering-based collaborative filtering
recommendation algorithm and its parallelization on spark, in: Asian Simula-
tion Conference, Springer, Singapore, 2016, pp. 442–451 . [37] K. Goldberg , T. Roeder , D. Gupta , et al. , Eigentaste: a constant time collabora-
tive filtering algorithm, Inf. Retriev. 4 (2) (2001) 133–151 . 38] Q. He , J. Yan , H. Jin , et al. , Quality-aware service selection for service-based
systems based on iterative multi-attribute combinatorial auction, IEEE Trans.Softw. Eng. 40 (2) (2014) 192–215 .
Copyright © 2022 FDOKUMEN