MTN Group Limited
125
MTN Group Limited Integrated Report for the year ended 31 December 2021 Leading digital solutions for Africa’s progress
-
Upload
khangminh22 -
Category
Documents
-
view
2 -
download
0
Transcript of MTN Group Limited

MTN Group LimitedIntegrated Report for the year ended 31 December 2021
Leading digital solutions for Africa’s progress

www.mtn.com
Tel: +27 83 912 3000/+27 83 869 3000/+27 11 912 3000 Innovation Centre 216 14th Avenue Fairland, 2195South Africa

Social capital
Doing for tomorrow, today01 About this report02 Who we are and where we are going03 Where we operate and how we performed04 The view of our Chairman06 Q&A with the CEO09 Our market context10 Ambition 2025 – Delivering leading digital
solutions for Africa's progress12 Investment case – a compelling African
growth story13 Creating and preserving shared value14 Our outlook
Doing for shared value15 Creating and preserving value through our
business model16 Material matters impacting value creation26 Social, Ethics and Sustainability Committee
Chair’s review 27 Relationships on which we rely to create value32 Doing more in the fight against COVID-1933 The key issues we face35 Risk Management and Compliance Committee
Chair’s review36 How we manage risk37 Top risks to value creation
Strategic and financial review45 Q&A with the Group CFO47 Key financial tables and operations performance
summary54 Audit Committee Chair’s review55 Group Finance and Investment Committee Chair's
review56 Our strategic performance dashboard57 Build the largest most valuable platforms63 Drive industry-leading connectivity operations68 Create shared value71 Accelerate portfolio transformation
Governance and remuneration73 Directors Affairs and Governance Committee
Chair’s review74 Our Board of Directors75 Governance in action81 Our International Advisory Board82 Our Executive Committee83 Remuneration Report
121 Glossary122 Administration
Throughout this report we use the *symbol:* Constant currency and after taking into account pro forma
adjustments.
For a detailed explanation of this and other financial definitions, see page 47.
The forward-looking financial information disclosed in this Integrated Report has not been reviewed or audited or otherwise reported on by our external joint auditors.
Contents is to enable the benefits of a modern connected life for everyone
Our reporting suiteThese reports are available on , or on request from Group Investor Relations – [email protected].
Our material stakeholders:
MTNers
Subscribers/customers
Investment community
Civil society
Government and regulators
2025 strategic priorities:
Other icons:
LA
Our capitals: Material matters:
Human capital
Manufacturedcapital
Financial capital
Natural capital
Navigating this reportThroughout our Integrated Report, the following icons are used to show the connectivity between our Ambition 2025 strategic priorities, our capitals, our material matters and value creation for our stakeholders.
Annual Financial Statements
AFS
Detailed statements, analysis of the Group’s financial results and the full Audit Committee report.
DRIVING SUSTAINABLE ECONOMIES
CDP Report
CDP
Global environmental disclosure, reporting on risks and opportunities in climate change, water security and deforestation.
King IVTM Report
KIV
MTN’s application of the King IVTM principles.
Five-Year Review
5Y
Comprehensive view over five years of the income statement; statements of financial position and cash flows; performance per share; as well as key non-financial information.
Sustainability Report
SR
MTN’s detailed environmental, social and governance performance.
Transparency Report
TR
Insight on how the policies and actions of governments and corporations affect privacy, security and access to information.
GRI Report
GRI
Structured disclosure on the impacts of the Group’s activities.
Create shared value
Accelerate portfolio transformation
Build the largest and most valuable platforms
Drive industry-leading connectivity operations
In the year we took a step change in our approach to ESG, placing it at the core of our strategy. This aligns with our work to advance the United Nations Sustainable Development Goals through our business activities and our support of governments, communities and customers. The SDGs target a sustainable society with a plan to end poverty, protect the planet and ensure equality for all by 2030. We are committed to bridging the digital divide, furthering financial inclusion to advance the attainment of the goals. For details of how we determine the SDGs on which we have the greatest impact, see page 121.
Indirect impactMTN focus
Tax Report
TAX
MTN’s approach to tax and dealing with uncertain tax positions; views on specific tax risks; and our total tax contribution.
ESG at the core www.mtn.comLimited assurance obtained
Evolving regulatory and compliance requirements
MM
9
MM
8
MM
1MM
2MM
3MM
4MM
5MM
6MM
7
COVID-19 impact
Challenging economic environment
Cybersecurity
Dynamic geopolitical environment
Disruptive technologies
Balance sheet resilience
Fintech and digital skills and expertise
Greater focus on ESG
Intellectual capital

This Integrated Report is MTN Group Limited’s primary communication to all stakeholders and aims to enable them to make an informed assessment of our performance and prospects and the value we create and preserve through our activities.
Life under COVID-19 COVID-19 showed us how inter-connected we all are: the health and prosperity of one depends on the health and prosperity of all. It also accelerated digital transformation and laid bare the extent of the digital and financial divide. We remain focused on the sustainability of the communities and markets we serve. At the heart of our Ambition 2025 is to lead digital and financial inclusion across Africa over the long term, creating shared value and a more inclusive and sustainable tomorrow.
Changes in reporting and enhancementsAs part of our refreshed strategy, early in 2022 we overhauled our brand, with a new visual identity, which is modern, simple, bold and digitally dynamic. Indicative of how we look to secure a better future for all, our brand promises: Doing for tomorrow, today. For details of our enhancements in the year, refer to page 121.
Basis for preparationOur report reflects integrated thinking at MTN: it is prepared by the Investor Relations team, reporting to the Group CFO. In determining its content, we assess the annual business plan, Ambition 2025, the issues that materially impact our ability to create and preserve value, as well as those that could erode value. The material matters and the materiality determination process are on page 16.
We also draw on our monthly standardised reports prepared by management across the Group and submitted to the Board. These serve as mini integrated reports and include details of our operating context, our strategic performance, our stakeholder engagement, as well as risks and opportunities. The Integrated Report is scrutinised by the Executive Committee and then presented to the Audit Committee for review, before being recommended to the Board of Directors.
Controls and combined assuranceThe Board ensures an effective control environment which supports the integrity of our information. We use a combined assurance model which considers the role of management, control functions, internal and external audit and Board committees. For 2021, we assessed our controls to be adequate and effective.
The material matters, as well as our strategy Ambition 2025 form the anchor of the report, which endeavours to tell the MTN value-creation story clearly and concisely. It explains who we are and where we operate, the context in which we work, our governance and business model, our strategy and investment case, our risks and opportunities, as well as our operational and financial performance in the period 1 January to 31 December 2021. Financial and non-financial data from our subsidiaries are fully consolidated.
The report gives commentary, performance and prospects for our main operations: MTN South Africa and MTN Nigeria, which make up two-thirds of the business, as well as our three operating regions, which make up the other third:• SEA (Southern and East Africa).• WECA (West and Central Africa).• MENA (Middle East and North Africa).
For details of our listed operating companies, MTN Nigeria, MTN Ghana, MTN Rwanda and MTN Uganda, please see their separate integrated reports online . These will be available on or about 31 May 2022.
We consider the future over three time horizons:• The short term (less than three years).• The medium term (three to five years).• The long term (beyond five years).
The structure and layout of this report, dated 25 April 2022, draw on the Value Reporting Foundation’s guidance. The 2020 Integrated Report was published on 23 April 2021.
Non-financial information on certain aspects has been assured by PricewaterhouseCoopers and is identified by LA . The assurance statement and MTN’s definition of the KPIs assured are online .
Supplementary information is on our website in associated reports, the icons of which are on the contents page.
Our suite of reports complies with the following reporting standards:
The Value Reporting Foundation’s <IR> Framework
IR AFS
Companies Act, No 71 of 2008 (as amended) IR AFS
JSE Listings Requirements IR AFS
FTSE/JSE Responsible Investment Index SR
King IV Report on Corporate Governance for South Africa 2016 (King IV)
IR AFS SR
International Financial Reporting Standards (IFRS)
IR AFS
UN Global Reporting Initiative (GRI) SR GRI
UN Sustainable Development Goals SR IR GRI
CDP SR CDP
Reporting boundary for this report (risks and opportunities, outcomes)
Stakeholders (see page 27)
Financial reporting entity (control and significant influence)
MTN Group Limited
(see our portfolio, page 03)
SubsidiariesOther
investmentsJoint
ventures
Approval by the BoardMTN’s Board of Directors acknowledges its responsibility to ensure the integrity of the Integrated Report. We, as the Board, believe that this report has been prepared in accordance with the Value Reporting Foundation’s <IR> Framework. We are of the opinion that it addresses all material matters and offers a balanced view of MTN’s strategy and how it relates to the organisation’s ability to create and preserve value in the short, medium and long term, as well as how it relates to efforts to prevent instances where value is eroded. The report adequately addresses the use of, and effects on, the capitals and the way the availability of capitals is impacting MTN’s strategic positioning.
Mcebisi JonasChairman
Khotso MokheleLID
Ralph MupitaGroup CEO
Tsholofelo MolefeGroup CFO
Noluthando Gosa Paul Hanratty
Shaygan Kheradpir Sindi Mabaso-Koyana Nosipho Molope
Stan Miller Vincent Rague Lamido Sanusi
Nkululeko Sowazi Swazi Tshabalala
Approval date: 25 April 2022
Scope and boundary
Doing for tomorrow, today
Doing for shared value
Strategic and financial review
Governance and remuneration
01
Integrated Report 2021
About this report
Guided by our
the MTN of tomorrow:
And delivering on our
MTN is a pan-African mobile operator with the strategic intent of ‘Leading digital solutions for Africa’s progress’. Inspired by our belief that everyone deserves the benefits of a modern connected life, we provide a diverse range of voice, data, fintech, digital, enterprise, wholesale, and API services to more than 272 million customers in 19 markets.
We were established in South Africa at the dawn of democracy in 1994 as a leader in transformation. Since then, we have grown by investing in sophisticated communication infrastructure, developing new technologies and by harnessing the talent of our diverse people to now offer services to communities across Africa and the Middle East.
MTN Group Limited is a publicly owned entity whose shares are traded on the JSE. At the end of 2021 our market capitalisation was R321.7 billion (US$20 billion).
2025 Strategic priorities
Creating value for all
272m subscribers
122m active data users
57m active
MoMo users
11m active
ayoba users
R172bn in service revenue
16 390 skilled MTNers^
Africa’s largest fixed and mobile network: invested capex of
R32.7bnEconomic value of
~R115bn added across our markets
Reduction of
~16% in GHG emissions
(targeting 47% reduction by 2030 and Net Zero by 2040)
Rural broadband coverage
~83%(targeting 95% by 2025)
Women are
39% of our workforce(targeting 50% by 2030)
^After exiting MTN Syria and MTN Yemen in the year
Strategic intentAmbition 2025
‘Leading digital solutions for Africa’s progress’
is to enable the benefits of a modern connected life for everyone
For us, value is progress in achieving our strategic intent and delivering on our belief that everyone deserves the benefits of a modern connected life in our footprint.
How we define value:
With ESG at the core
Create shared value
Accelerate portfolio transformation
Build the largest and
most valuable platforms
Drive industry-leading
connectivity operations
• Purposeful • Inclusive and diverse • Innovative
• Agile • Resilient • Partner to nation states
We are creating
Doing for tomorrow, today.
Doing for tomorrow, today
Doing for shared value
Strategic and financial review
Governance and remuneration
02
Integrated Report 2021
Who we are and where we are going
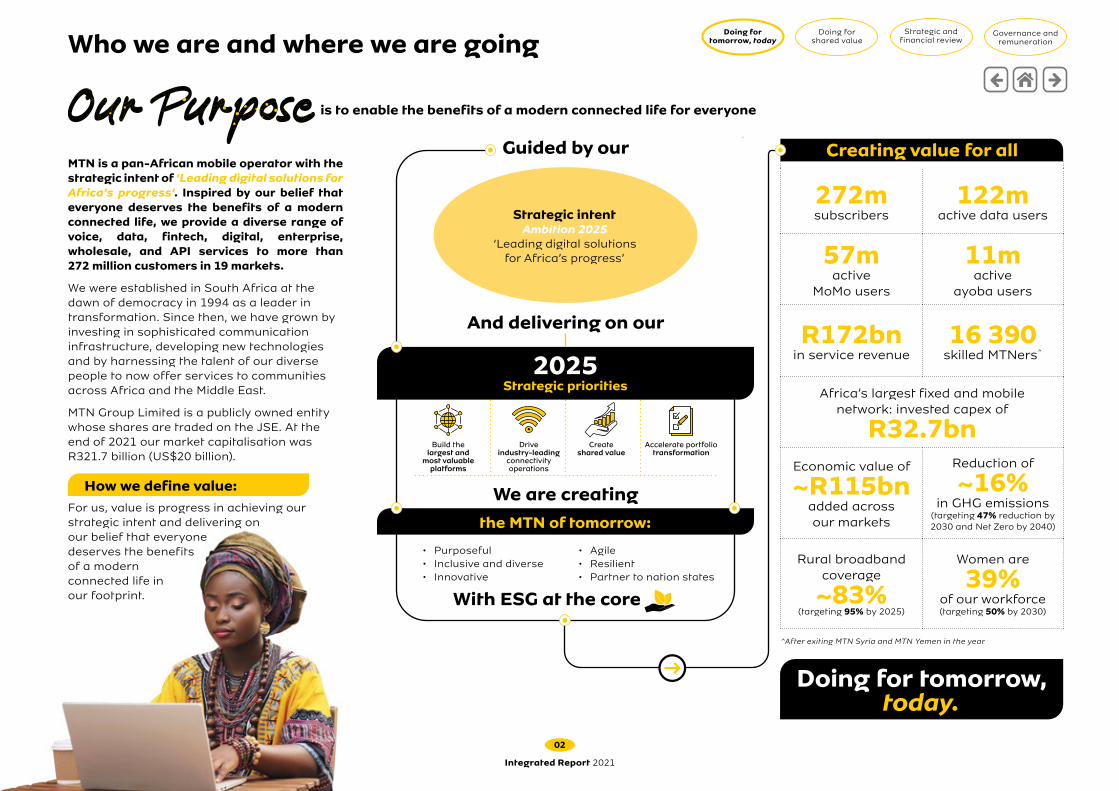
Our geographic footprint is wide, stretching over 19 markets on two continents, therefore robust operational oversight is critical. We secure this through a management structure that reflects almost equal contributions of around a third to Group earnings of each of our operations in South Africa and Nigeria and that of our regions – SEA, WECA and MENA – combined.
Our portfolioat 1 April 2022
MTN South Africa 100.0%
MTN Nigeria ▲ 75.6%
SEA
MTN Uganda ▲ 83.1%
MTN Rwanda ▲ 80.0%
MTN Zambia ▲ 89.8%
MTN South Sudan 100.0%
Mascom Botswana Δ 53.3%
MTN eSwatini Δ 30.0%
WECA
MTN Ghana ▲ 85.5%
MTN Cameroon 80.0%
MTN Côte d’Ivoire 66.8%
MTN Benin 75.0%
MTN Guinea-Conakry 75.0%
MTN Congo-Brazzaville 100.0%
LonestarCell (MTN Liberia) 60.0%
MTN Guinea-Bissau 100.0%
MENA
MTN Sudan 85.0%
MTN Afghanistan ■ 100.0%
MTN Irancell ■Δ 49.0%
Associates, JVs and other investments
aYo 100.0%
IHS Group ≠ 25.9%
Iran Internet Group ≠ Δ 29.5%
Middle East Internet Holding ≠ Δ 50.0%
▲ Localisations≠ Not long-term strategic assets■ Exiting in an orderly manner over the medium
term Δ Equity accounted
Service revenuecontribution
EBITDA^ contribution
^ Based on IAS 17* Constant currency
+2.2pp* to 44.5% Group EBITDA margin
+2.9m to 272.4m Group subscribers
+18.3%* to R171.8bnGroup service revenue
+36.5%* to R56.5bn Group data revenue
+30.9%* to R15.9bn Group fintech revenue
+23.7%* to R80.8bn Group EBITDA
+14.3% to R32.7bnGroup capex^
South Africa Nigeria SEA WECA MENA
+11.1m to 122.0m Group data users
+10.4m to 56.8m Group active MoMo users
16 390 Group employees
Congo-Brazzaville
Cameroon
Côte d’Ivoire
Liberia
Guinea-Conakry
Ghana
BeninNigeria
South Africa
Zambia
Rwanda
Uganda
eSwatini
Afghanistan
Iran
Sudan
Guinea-Bissau
Botswana
South Sudan
Changes in our portfolio
Our asset realisation programmeOur ARP was launched in 2019 with an aim to realise assets that were viewed as not long-term strategic. In February, we completed the sale of our 20% shareholding in BICS. In October, IHS Towers listed and started trading on the New York Stock Exchange. We will look to sell our 26% interest when market conditions are conducive.
Another important element of our ARP is broadening local participation. We listed by introduction in Rwanda. We also listed in Uganda, localised ~13% of our shareholding. In Nigeria we localised a further ~3% of our shareholding in early 2022.
Portfolio transformation In 2020, we announced our intention to exit the Middle East operations over the medium term in line with our pan-Africa focus and to simplify our portfolio and reduce risk.
In August 2021, we exited Syria. Given regulatory actions and demands that made operating there untenable, we abandoned the operation. We also exited our operation in Yemen through a transfer of our shareholding. This brought the number of MTN operations to 19 from 21. We continue to explore options to exit Afghanistan in an orderly manner.
Diversity by nationality
South Africa 23.0% Nigeria 34.9% SEA 9.7% WECA 27.8% MENA 3.8% Head offices including GlobalConnect 0.8%
By geography
R171.8bn(2020:
R170.1bn)
EBITDA^
South Africa 23.8% Nigeria 39.9% SEA 9.8% WECA 24.3% MENA 2.6% ^Excludinghyperinflation 0.4%
By geography
R80.8bn(2020:
R81.3bn)
Diversity by nationality
Voice 48.0% Data 32.9% Digital 1.9% Fintech 9.3% SMS 2.4% Wholesale 3.5% Other 2.0%
By services
^Excluding hyperinflation -0.4%
(MTN Groupownership)
How we performed in 2021
Doing for tomorrow, today
Doing for shared value
Strategic and financial review
Governance and remuneration
03
Integrated Report 2021
Where we operate and how we performed

Dear Stakeholders
Ensuring resilience in a challenging macroeconomic contextCOVID-19 continued to impact the world in 2021. We supported the African Union’s efforts to secure vaccines at a time of considerable vaccine inequity between the developed and developing world. Leveraging our position as the most valuable African brand, we launched the #OneMorePush awareness campaign in partnership with the AU. Within MTN, we approved a mandatory vaccination policy for staff and continued the many initiatives to safeguard the wellbeing of our people, communities and other stakeholders.
While we all adapted to the new normal, lives continued to be lost. Among the Group’s 16 390 employees, 5 278 infections were reported, and 30 employees sadly succumbed to complications brought on by the virus. We mourn their loss and extend our sincere condolences to their families, friends and colleagues.
Despite ongoing challenges, 2021 was encouragingly a year where the global economy showed signs of recovery, recording 5.9% GDP growth. Economies across our markets also saw a robust recovery with growth of 3.7% in sub-Saharan Africa (after contracting by 1.7% in 2020), driven in the main by the bounce back in global trade and the commodities upcycle. This recovery helped support higher demand for digital services, which underpinned our strong performance in 2021. As MTN, we have done a lot of work to position ourselves to capture growth opportunities across our markets.
The ability of African economies to sustain this recovery will depend on the capacity of respective governments to increase vaccine coverage, manage public debt and execute governance and economic reforms. Growth in African economies in 2022 was initially expected to be at similar rates as 2021, however expectations have now been revised down to factor in the potential impact of the war in Ukraine.
The risks associated with an inflationary upcycle will need to be carefully managed. I have confidence in our resilience as an organisation and our ability to work with strategic stakeholders to mitigate risks and unlock the opportunities that present themselves.
Chairman Mcebisi Jonas
Delivering on strategy to drive growth and deleveragingIn 2021, we set to work implementing Ambition 2025 to shape the medium-term future of MTN. The Q&A with the CEO on page 06 outlines the considerable progress made to date on each of the four strategic priorities, with details in the strategic performance section starting on page 56.
On the back of this new strategy, we improved mobile internet access and affordability. Guided by a disciplined capital allocation framework, we accelerated investment in our connectivity and platform business, enhanced returns to shareholders and made headway in delivering on our belief that everyone deserves the benefits of a modern connected life.
During the year, we delivered service revenue growth of 18.3%* with pleasing operating leverage to drive EBITDA growth of 23.7%* and an improvement in EBITDA margin of 2.2pp* to 44.5%. We also made further inroads in reducing our Holdco leverage to 1.0x, from 2.2x, supported by strong cash flow generation and progress in our ARP. Our financial performance is covered in more detail in the CFO Q&A section on page 45.
Our contribution to society, measured as economic value-added, totalled R115 billion in the year, and we recorded a total tax contribution of R43.9 billion LA in support of the fiscal resources of the nation states in which we operate, up from R35.1 billion in 2020. This includes the R11.0 billion in cash taxes paid in 2021 TAX .
Engaging more, enhancing governanceWe are deeply committed to playing a more considered role in providing leading digital solutions for Africa’s progress. Following the hard COVID-19 lockdown restrictions of the prior year, the Board and management materially increased engagement with a broad range of stakeholders during 2021, across a number of platforms.
During 2021, the Board has made progress in actively pursuing the key issues highlighted by an external evaluation conducted by the International Institute for Management Development (IMD). The assessment noted areas of composition and diversity, structure, strategy process as well as subsidiary governance. We have outlined the steps taken in addressing these matters on page 78.
Doing for tomorrow, today
Doing for shared value
Strategic and financial review
Governance and remuneration
04
Integrated Report 2021
The view of our Chairman

The Board of Directors improved its independence and transparency, enhanced its structure and increased the representation of women. Tsholofelo Molefe, a new executive director, became Group Chief Financial Officer on 1 April 2021. Nosipho Molope and Noluthando Gosa, independent non-executive directors, joined the same day. This raised the number of women directors on the Board to five.
Azmi Mikati retired from the Board on 28 May 2021: I would like to thank him for his valuable contribution as a representative of major shareholder M1 over almost 15 years. M1 remains a key shareholder of the MTN Group.
Making compliance non-negotiableEvolving regulatory and compliance requirements remained a material matter for the Group in the year. MTN has zero tolerance of non-compliance and is committed to fulfilling all compliance, disclosure and reporting obligations.
The implications of the material matters identified in the year on MTN’s ability to create value, as well as the Group’s strategic response are on pages 16 to 25, with details on the specific key issues on page 33 and 34.
Creating shared value and prioritising ESGOn the priority to ‘create shared value’, the step change in our approach to ESG delivered particularly encouraging results. Apart from references to progress in this regard throughout the Integrated Report, I urge you to read the Sustainability Report SR as well as the Transparency Report TR for a more comprehensive picture, including our innovation efforts and greater disclosure on issues such as digital human rights.
To give effect to ESG oversight obligations and to address overlaps in committee activities, the Board re-examined the mandates of its committees. We also evaluated the skills on the Board, identifying the need to recruit and retain more of the digital and fintech, IT governance and sustainability talent that complement our Ambition 2025 strategy (see page 77).
During a governance roadshow in May 2021, we heard – among other things – how stakeholders want MTN to focus increasingly on ESG imperatives and initiatives, continue to enhance the remuneration policy (see page 83) and plan for key employees as well as increase transparency regarding governance matters. The feedback was well received and
encouraged MTN to work harder to meet and exceed the expectations of our varied stakeholders across many geographies (see page 28).
Improving performance, resuming dividendsThe Group’s reputation survey index score increased to its highest level yet, showing a better level of trust stakeholders have in MTN. An improvement in stakeholder perceptions was also evident in the tripling in the Group’s share price and market capitalisation in the year. This was also supported by stronger operational and financial results: service revenue growth to R171.8 billion and a 26.6% rise in adjusted headline earnings per share to 1 110 cents.
In 2020 we had suspended dividends in consideration of delayed upstreaming of cash from MTN Nigeria; uncertainty over the timing of proceeds of the Group’s asset realisation programme; and other COVID-19 impacts, which had highlighted the importance of deleveraging the balance sheet faster. Progress on these is detailed on page 72.
The Board resolved to reinstate the dividend, declaring a final dividend of 300 cps (having guided to a payout of at least 260 cps) and adopted a new medium-term policy, committing to provide guidance at the announcement of full-year results in March every year on the minimum dividend expected for the year ahead. In this regard, the Board anticipates paying a minimum ordinary final dividend of 330 cps for 2022.
The annual dividend policy is aligned to our capital allocation priorities, which safeguards the flexibility of our balance sheet to accelerate investment into faster growth areas as well as our focus on paying down non-rand debt faster.
Looking ahead and thanksJust as the world was starting to recover from the devastating impacts of COVID-19, the outbreak of war in Europe in early 2022 reminded us of the volatility of global events and how far-reaching their impacts can be. Apart from the heavy humanitarian toll, the sharp rise in oil prices – at the time of writing up more than 50% since end-2021 – has significant implications for our markets in 2022.
Issues of food prices and security also became front-of-mind, which – along with the spike in the price of oil and other soft commodities – has raised risks of increased inflation in our markets. These are developments that the Board is monitoring closely.
With the outlook for global economic growth remaining uncertain, and amid the increased geopolitical volatility, MTN will stay focused on delivering on Ambition 2025 and remaining a reliable partner to stakeholders across our markets. Our strategy is robust and we have sufficient adaptability and resilience built into our operating model. We will continue to play our part in ensuring a more sustainable and equal future.
We know that access to affordable communication and digital services has the power to change lives and bridge inequalities. Given our position and brand in the markets we serve, we are confident that we will continue to play a leading role in building a more digitally inclusive society. We will leave no-one behind.
I would like to thank all our stakeholders for their ongoing support and look forward to engaging with them more in 2022. As our refreshed brand promises, we are Doing for tomorrow, today.
Mcebisi JonasChairmanFairland25 April 2022
Doing for tomorrow, today
Doing for shared value
Strategic and financial review
Governance and remuneration
05
Integrated Report 2021
The view of our Chairman continued
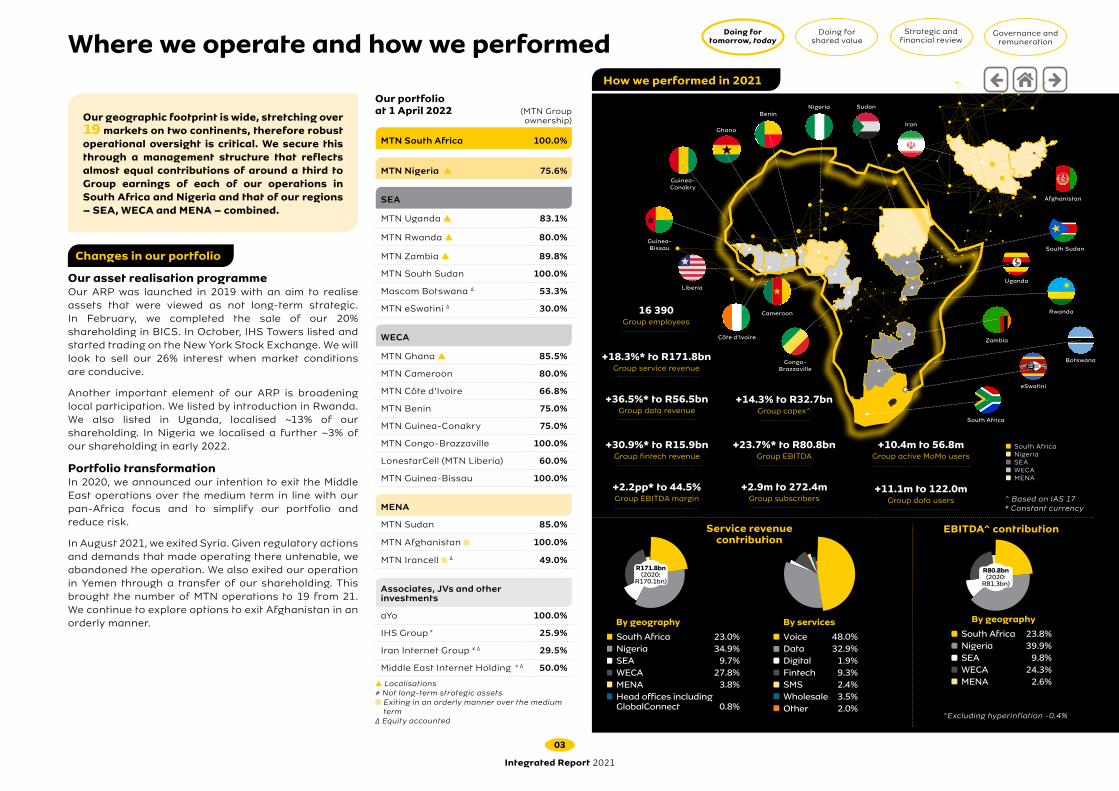
Ambition 2025, the new Group strategy was officially launched at the beginning of 2021; what were the key achievements and advances made in the past year?
In executing on Ambition 2025 during 2021 we accelerated the exciting journey of shaping the MTN of the future and, encouragingly, we reported a strong overall performance and demonstrated noteworthy resilience in a difficult macroeconomic context. We made very good progress towards meeting our strategic targets, details of which are on page 56.
In driving industry-leading connectivity operations, we reported solid voice and data revenue growth, supported by strong commercial execution. In 2021, we maintained good operational momentum, closing the year with approximately 272 million subscribers – an increase of 2.9 million in the year. Excluding Nigeria, the subscriber base in the rest of the portfolio rose by 11 million. Encouragingly, subscriber additions in Nigeria returned to a positive trajectory in the fourth quarter adding around one million subscribers.
We added 11.1 million active data users, closing 2021 with 122.0 million active users connected to our network across our 19 markets. Data usage accelerated by 53.3% to an average of 6.4GB per user per month – it is remarkable that in less than three years, we have increased the volume of data traffic on our networks by five times.
In MTN GlobalConnect, we rolled out 15 000km of additional terrestrial fibre, which brought our total inventory to approximately 100 000km of proprietary fibre. In 2021, we also increased our subsea fibre capabilities and are preparing for the landing of 2AFRICA in four of our markets, where MTN GlobalConnect will own fibre pairs around Africa to strengthen the network.
Our efforts to structurally separate the fibre business continued and we aim to complete this process in 2023. Asset separations are already underway and progressing well in markets such as South Africa, Nigeria, Ghana, Côte d’Ivoire and Uganda. We already
Q
A
A
have separate Fibrecos established in Zambia and Kenya and are making excellent progress towards our strategic target to reach a fibre footprint of 135 000km by 2025.
We made strides in our work to build the largest and most valuable platforms. In fintech, we added 10.4 million users to reach a total of 56.8 million. By focusing on base penetration, we encouraged an increasing number of our GSM customers to use MTN Mobile Money. By year-end, the fintech business had processed 10 billion transactions worth a total US$239.4 billion – up by 56.8% and supporting greater financial and digital inclusion across Africa.
In Nigeria, we secured approval in principle for a Payment Services Banking licence. In April 2022, we received final approval for MoMo PSB to commence operations. This paves the way for MTN Nigeria to expand its service offerings and scale its fintech business, thereby achieving more meaningful financial inclusion.
Important to our strategy is the structural separation of the fintech business. At this stage, we are focused on the accounting and legal separation of the fintech business from the GSM business; the creation of its own financial and commercial agreements with the GSM business; and the onboarding of strategic partners to help accelerate fintech. The separation is progressing well and should be completed by the end of Q2 2022, subject to regulatory and other approvals.
We advanced our ARP and portfolio transformation, which is discussed in the Group CFO section on page 45. We raised approximately R13 billion in proceeds, including transactions that closed post the year-end. This brought total ARP proceeds to R15.4 billion, against the medium-term target of at least R25 billion set out in March 2020. The exits of Syria and Yemen represented important progress in our strategic focus on pan-African markets.
Early in 2022, we overhauled our brand as an extension of the refreshed strategy, with a new visual identity, which is modern, simple, bold and digitally dynamic and targeted at the youth that will be our customers of the future. Our logo changed after 18 years, signifying an evolution as a company into the bold new digital world.
Group President and CEO Ralph Mupita
Doing for tomorrow, today
Doing for shared value
Strategic and financial review
Governance and remuneration
06
Integrated Report 2021
Q&A with the CEO

AA
How did COVID-19 continue to impact the operating context and how did MTN manage this?
COVID-19 continued to have a significant impact on lives and livelihoods across our markets. We were honoured to have played a humble role in supporting the African Union’s (AU) efforts to secure vaccines when it faced difficulties in accessing vaccines equitably with other continents.
We are encouraged by the increased vaccination rates across Africa as this will help keep people healthier, contribute to a return to normality in our social and professional lives as well as improve overall economic activity. Through our donation, 1.5 million vaccination doses were delivered to 14 countries and another 1.3 million doses were scheduled for delivery to six countries by the end of the first quarter of 2022.
We also partnered with the AU to launch the #OneMorePush campaign which encouraged people to not give up in the fight against COVID-19, and to keep wearing their masks, washing their hands and practising social distancing.
In managing the effects of the pandemic, we continued to focus on four key areas: social; commercial; network and supply chain; and funding and liquidity (see page 32). For our people, we followed a hybrid working policy, with a mix of on-site and WFH solutions. We also approved a mandatory COVID-19 vaccination policy to encourage more MTNers to vaccinate.
The pandemic accelerated the development of digital ecosystems across our markets and the increased demand for data and fintech solutions is now sustained at higher levels. Our investment in our networks and platforms, our disciplined capital allocation and strong market leadership enable us to provide ongoing support to the societies in which we operate.
Tell us about MTN’s ESG performance.
One of Ambition 2025’s four strategic priorities is to create shared value, with ESG at the core. In 2021, we took a step change in our sustainability approach, further improving our risk profile. Among highlights in this regard are a ~16% reduction in scope 1 and 2 greenhouse gas emissions and an increase to 83% in rural broadband coverage. We remain committed to reducing scope 1, 2 and 3 emissions by 47% by 2030 and increasing rural broadband coverage to 95%.
We are also driving diversity and inclusion, achieving workforce gender equality by 2030 (from 39% in 2021). We have some work ahead of us to achieving our targets in this regard and have a very clear plan to get there. We recognise that without gender equality today, a sustainable and equal future is out of reach. So, as our brand promises, we are Doing for tomorrow, today.
We also linked our ESG agenda to executive remuneration. As of 2022, the LTI has a 25% link to our ESG performance, made up of progress on reaching Net Zero, enhancing diversity and inclusion and extending rural broadband.
We are committed to driving digital and financial inclusion and in 2021 we connected 69 million more people to broadband and improved its affordability, with a 15.3% reduction in the blended cost of data across our markets.
Our social and economic contribution also made a meaningful impact, amounting to approximately R115 billion. We paid taxes of R11.0 billion in support of the fiscal resources of the nation states in which we operate and invested R67.0 billion in our networks, advancing fixed investment. On the ground, we continued to support the livelihoods of approximately six million people.
The inclusion of MTN Group in the FTSE/JSE Responsible Investment Top 30 Index reflected the work done to date on ESG practices, encouraging us to work towards even more notable improvements ahead.
QQ What does ‘leading digital solutions for
Africa’s progress’ mean and what does success in this regard look like?
Since the start of COVID-19, digital technologies and online platforms have become fundamental to everyday life. In emerging markets, their role is increasingly essential to accelerate development and further equality. At MTN we recognise our incredible responsibility to ensure inclusive growth and progress: no one should be left behind in this profound evolution to a digital future.
The lockdowns have stimulated demand for more flexible and affordable access to digital services in financial, entertainment, lifestyle and consumer sectors. Our platforms are distinctly African digital marketplaces with the widest variety of products and services.
We have the brand power, the distribution footprint and the best-in-class connectivity infrastructure to host and develop the digital marketplace to facilitate a real change in terms of Africa’s digital and financial inclusion. In this regard, we have put in place bold targets in terms of coverage and connectivity, localisation as well as fintech and digital user metrics which focus our efforts. We will measure our success by the progress we make towards our ambitious targets as we fulfil our commitment to create shared value for all.
A
Q
Doing for tomorrow, today
Doing for shared value
Strategic and financial review
Governance and remuneration
07
Integrated Report 2021
Q&A with the CEO continued

What is the outlook for 2022?
The macroeconomic environment remains challenging. With the Ukraine and Russian conflict that started in the early stages of 2022, the economies that we operate in are likely to be impacted by higher inflation, energy and food costs in the period ahead. We will need to continue to manage our operating costs and capital deployment in a disciplined manner as well as sustainably reduce the cost to communicate for our customers, particularly those with modest levels of disposable income. Against this backdrop, we believe that the need for reliable connectivity services and a world where cashless transactions increase, will remain.
Our priorities will, however, remain largely the same as 2021, which provides continuity and will enable us to entrench the momentum generated thus far. We are focusing on accelerating growth in South Africa and Nigeria, increasing coverage through the further rollout of 4G and building out 5G services for individuals and businesses now that we have procured the necessary spectrum in these markets.
As part of the shared value creation pillar, MTN has taken action to understand and demonstrate the social, environmental and economic value that we create for society through our operations. Using KPMG’s True Value methodology, in 2021 we started identifying the most material socioeconomic and environmental impacts and quantifying them in financial terms, so that we show both where we can reduce our negative impacts, as well as find guidance on where we add positive impact to society. We undertake to share the results for some of our markets this year and for the group in 2023.
In fintech, we are focused on two major things: completing the structural separation and then securing strategic partners to support the acceleration of the business.
On the asset realisation programme, we have so far delivered over R15 billion of the targeted R25 billion in proceeds and look forward to progressing with the second part of our sell down of shares in MTN Nigeria. We are also focusing on the further
A
A
execution of our localisation objectives as well as exiting Afghanistan in an orderly manner.
Our networks remain the foundation of the Company, so we are investing R34 billion in them in 2022 to deliver the returns our stakeholders expect.
We remain focused on our vision to provide leading digital solutions for Africa’s progress and creating shared value. Our enhanced medium-term guidance reflects the growth we see across our markets, as we play our part in driving digital and financial inclusion. As we move forward as chance takers, change makers and world shapers, we are Doing for tomorrow, today.
Ralph MupitaGroup President and CEOFairland25 April 2022
Q
Doing for tomorrow, today
Doing for shared value
Strategic and financial review
Governance and remuneration
08
Integrated Report 2021
Q&A with the CEO continued

By considering our market context, we are better able to determine our material matters; to understand the impact these have on our business model; and to develop and execute on our strategy by leveraging off our competitive advantages.
We are also able to better align our priorities to those of our stakeholders as we strive to create greater shared value. In line with recent changes in our operating model and our Exco responsibilities, here we present our operating context by the geographies of the biggest contributors to our business: South Africa, Nigeria and other markets:
The world continues to wrangle with high levels of uncertainty, brought about by the spread of COVID-19 and the recent invasion of Ukraine by Russia. Amid this unpredictability, we see not only challenges but also opportunities.
South Africa Nigeria Other markets
Despite some economic and political challenges, South Africa remains an attractive market in which to operate.
Africa’s biggest economy is also home to its biggest population and offers significant opportunities. However, there are challenges, including growing civil dissatisfaction, greater regulatory requirements and fierce competition.
The markets environment remains highly competitive and evolving, with new entrants with disruptive business models in financial services. Regulatory scrutiny is growing.
• Unemployment is rising.
• COVID-19 is exacerbating an already weak economy, even though government grants have eased the impact somewhat. An electricity crisis is also hobbling growth. The recent spike in oil prices is putting pressure on consumers.
• Rising inflation and a depreciating currency is putting pressure on the disposable incomes of consumers and leading to a high cost of doing business. The unemployment rate is high. Foreign exchange hard currency is often difficult to secure, impacting multinational companies’ ability to repatriate earnings.
• COVID-19 restrictions are still impacting economic growth and increasing the rate of poverty. Economic recovery is uneven and patchy.
• High debt among some state-owned enterprises is a burden on state resources, limiting funding available for social grants.
• Authorities are working on establishing greater regulation of the digital economy.
• Insecurity in the northern and south-eastern regions impact businesses.
• Political campaigning ahead of elections often leads to increased tensions and unrest.
• Regulations from various regulators are evolving, requiring companies to make procedural changes.
• In many markets, there is political uncertainty and social unrest.
• Various regulatory constraints are features of many markets.
• After years of constraints on spectrum, in March 2022, MTN was awarded permanent spectrum in ICASA’s auction.
• Fibre infrastructure: The fragmented and low-margin FTTX sector is under pressure to consolidate.
• Fintech: Banks are expanding their mobile offerings and there is increased competition from various fintech start-ups.
• Cloud: Various organisations are partnering with hyperscalers to drive application modernisation and joint product development, enabling digital transformation. Data centres are becoming more competitive, with more opportunity for professional and managed services. Hyperscalers are looking to use South Africa as a launch pad into the rest of the continent.
• There is growing competition for technology leadership after the government’s approval of commercial 5G deployment.
• Consumers continue to shift from conventional voice to rich-media communication. Competition in the voice and data segments is becoming stiffer.
• Fibre infrastructure: The FTTx sector is still very small.
• Fintech: The approval from the CBN for MoMo PSB to commence operations could unlock significant value. Traditional banks are expanding their digital propositions and agent networks. There are an increasing number of new entrants into this market and more venture capital funding of the sector.
• Cloud: More and more companies are expected to migrate from on-premises data centres to the cloud, as well as to co-locating their data centres with others. The Nigerian Cloud Computing Policy (NCCP) aims to achieve a 30% increase in cloud adoption by 2024.
• Traditional GSM business remains highly competitive with increased pressure on pricing. There is greater substitution between voice and data, with strong growth in data revenue.
• Fibre infrastructure: The opportunity for fibre networks is significant in many markets, buoyed by the strong growth in data traffic across Africa.
• Fintech: A number of new entrants in many markets are leading to aggressive competitive activity and putting pressure on fintech revenues across the sector.
Relevant risks
All material matters are relevant to all
our markets
For details of the ways in which we are responding to these factors, see page 56 to 72, where we discuss how our strategy is making the most of the opportunities we have identified.
Macroeconomic
Sociopolitical
Competitivelandscape
RISK
2
MM
9MM
8MM
7MM
6
RISK
1RISK
7RISK
2
MM
1MM
2MM
3MM
4MM
5
RISK
2RISK
1
Doing for tomorrow, today
Doing for shared value
Strategic and financial review
Governance and remuneration
09
Integrated Report 2021
Our market context

Driven by a pioneering spirit, in the past two and half decades MTN has played a bold role in accelerating Africa’s development. When we started our journey in 1994, our ambition was to brighten lives through the power of connectivity. Today, extending digital and financial inclusion are more critical than ever. To support this, we are harnessing the power of MTN – our brand, footprint, connectivity infrastructure and technology platforms – through Ambition 2025: Leading digital solutions for Africa’s progress.
This strategy is anchored in building the largest and most valuable platform business with a clear focus on Africa. This rests on a scale connectivity and infrastructure business – mobile and fixed access networks in consumer, enterprise and wholesale segments.
We are accelerating implementation through partnerships and by leveraging MTN’s brand as the most valuable African brand. Our strategy is supported and funded through enhanced cost and capex efficiencies. It is focused on four strategic priorities, assisted by five vital enablers.
‘Everyone deserves the benefits of a modern connected life’
Strategicpriorities
Leading customer
experience
Best talent, culture and future skills
Value-based capital
allocation
ESG at the core
Technologyplatforms
second to none
Build the largest and most valuable
platforms
Drive industry-leading
connectivity operations
Createshared value
Accelerate portfolio
transformation
Ambition 2025
Leadership Innovation Relationships Integrity Can do
Ambition 2025: ‘Leading digital solutions for Africa’s progress’
Belief statement
Strategic intent
Vital enablers
Values
Doing for tomorrow, today
Doing for shared value
Strategic and financial review
Governance and remuneration
10
Integrated Report 2021
Our Ambition 2025 strategy

We are building five scale platform businesses
Growth platforms, underpinned by Africa’s largest connectivity networkAs part of Ambition 2025, we want to build five scale platform businesses on top of a very strong connectivity network. The platforms are at different levels of maturity, with – at one end – the fintech platform, which is relatively mature, and – at the other end – the API marketplace, Chenosis, which we launched last year.
We see the opportunity for
mobile commerce where the fintech
business intersects with our ayoba
business.
In recent years we have focused on connectivity:
building and indexing up on enterprise. With increasing industrial IoT – workloads moving to the cloud – we see opportunity to create
a significant and scale enterprise business.
We see opportunity to improve the economics of
our businesses across markets by extending our well-invested networks to support #3 or #4 players in certain
markets.
We have built a scale fintech business, but we
have ambitions to double the size of the platform over the next three to
five years and broaden the product proposition, moving from payments to lending to insurance
to savings.
We look to aggregate APIs and ultimately monetise
them over time.
Ambition 2025
‘Everyone deserves the benefits of a modern connected life’
Ambition 2025 ‘Leading digital solutions for Africa’s progress’
largest and most valuable
platforms
Drive industry-leading
connectivity operations
Createshared value
Accelerate portfolio
transformation Strategicpriorities
Leading customer
experience
Best talent, culture and future skills
Value-based capital
allocation
ESG at the core
Technologyplatforms second to
none
Leadership Innovation Relationships Integrity Can do
Fintech solutions
Digital services
Enterprise services
Network as a service
API marketplace
For details on our strategic performance, refer to page 56 to 72
Belief statement
Strategic intent
Vital enablers
Values
One network
One API layer
One data lake
Doing for tomorrow, today
Doing for shared value
Strategic and financial review
Governance and remuneration
11
Integrated Report 2021
Our growth platforms
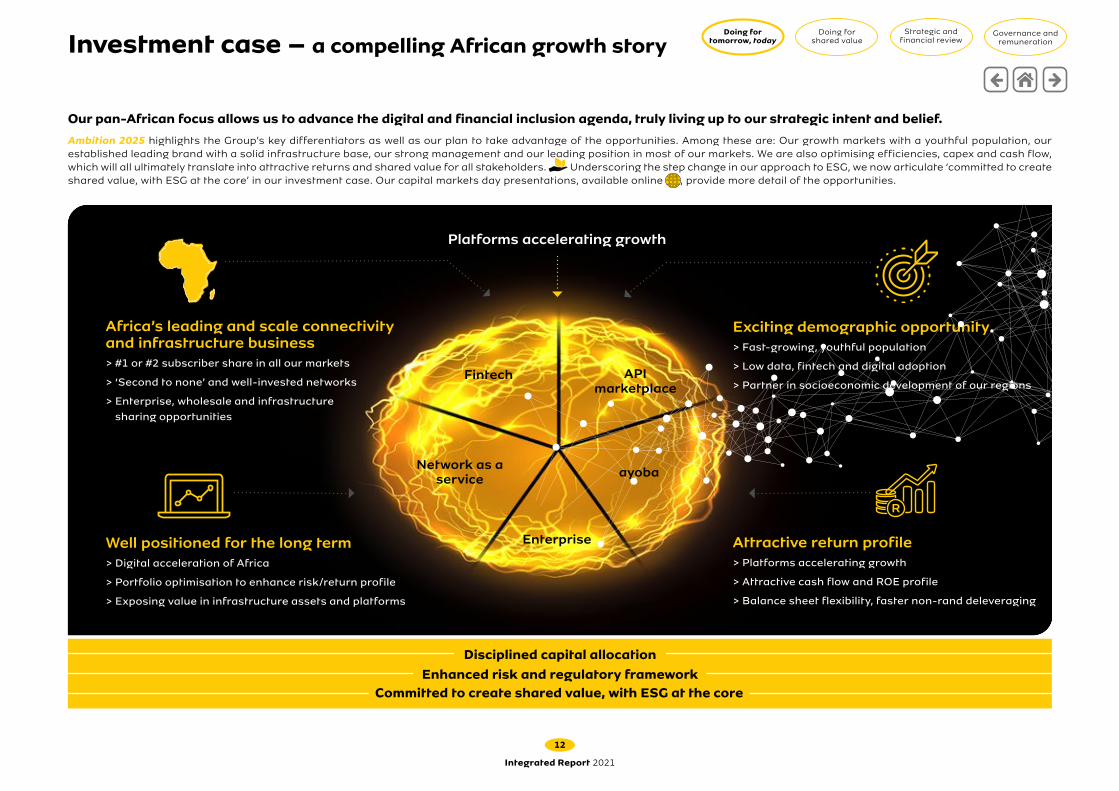
Africa’s leading and scale connectivity and infrastructure business> #1 or #2 subscriber share in all our markets
> ‘Second to none’ and well-invested networks
> Enterprise, wholesale and infrastructure sharing opportunities
Exciting demographic opportunity> Fast-growing, youthful population
> Low data, fintech and digital adoption
> Partner in socioeconomic development of our regions
Well positioned for the long term> Digital acceleration of Africa
> Portfolio optimisation to enhance risk/return profile
> Exposing value in infrastructure assets and platforms
Platforms accelerating growth
Fintech
Disciplined capital allocationEnhanced risk and regulatory framework
Enterprise
API marketplace
Network as a service ayoba
Committed to create shared value, with ESG at the core
Attractive return profile> Platforms accelerating growth
> Attractive cash flow and ROE profile
> Balance sheet flexibility, faster non-rand deleveraging
Our pan-African focus allows us to advance the digital and financial inclusion agenda, truly living up to our strategic intent and belief.
Ambition 2025 highlights the Group’s key differentiators as well as our plan to take advantage of the opportunities. Among these are: Our growth markets with a youthful population, our established leading brand with a solid infrastructure base, our strong management and our leading position in most of our markets. We are also optimising efficiencies, capex and cash flow, which will all ultimately translate into attractive returns and shared value for all stakeholders. Underscoring the step change in our approach to ESG, we now articulate ‘committed to create shared value, with ESG at the core’ in our investment case. Our capital markets day presentations, available online , provide more detail of the opportunities.
Doing for tomorrow, today
Doing for shared value
Strategic and financial review
Governance and remuneration
12
Integrated Report 2021
Investment case – a compelling African growth story

Governments and society
Supported the fight against COVID-19 with R486m vaccination donation to the AU and CACOVID (see page 32 and SR )
Localisation and local participation in Nigeria, Ghana, Rwanda and Uganda
~6m jobs sustained across MTN value chain
Empowered 974k people to become MoMo agents
~R115bn economic value added
ESG
~16% scope 1 and 2 GHG emissions reduction
~39% (+1pp) women in our workforce
Ranked Most improved company on the Ranking Digital Rights 2020 Corporate Accountability Index
Driving digital and financial inclusion
Educated ~24m people on digital literacy
122.0m (+11.1m) connected to internet
56.8m (+10.4m) accessing financial
services
10bn fintech transactions processed
US$239.4bn transaction value
Employees
Named as one of the Best Employers in 2021 by Forbes
Paid R11.7bn in staff costs
Invested R190m in skills
Our customers
Named the most valuable African brand worth US$2.7bn
Covered 69m rural people on our 3G and 4G network
Improving affordability with a 15.3% reduction in the blended cost of data
Provided support to connect to loved ones in Ukraine through waived SMS and voice call fees
At MTN, our ‘doing’ is purposeful, to provide leading digital solutions for Africa’s progress
Doing fortomorrow, today.
Our belief that everyone deserves the benefits of a modern connected life
drives everything that we do.
We work to preserve and create value for all our stakeholders, and limit
instances in which value is eroded.
Typically, the traditional measure of value creation for companies has been
their financial results – revenue and profits. For 2021, MTN reported:
Revenue of
R181.6bnProfits of
R17.0bn
Intellectual capital
Human capital
Manufactured capital
Financial capital
Natural capital
Socialcapital
We listen.We care.We do.
Doing for tomorrow, today
Doing for shared value
Strategic and financial review
Governance and remuneration
13
Integrated Report 2021
Creating and preserving shared value#DoingGoodTogether

781m (72%) people in SSA still not connected to mobile internet
SSA mobile internet users to grow to 474m by 2025 from 303m in 2020
~46% of Africa’s population is unbanked
95% of payments remain cash based with 90% of economies driven by small business
Enhanced targets – medium term outlook Opportunity
When developing our strategy, we took into consideration the outlook in the run-up to 2025. Here we provide our views on our operating context over the short and medium term.
Macro environment – short and medium term
Russia’s invasion of Ukraine is impacting the outlook. Beyond the humanitarian crisis, the global economy is expected to feel the effects of slower growth, with increased oil and food prices and higher inflation. There are uncertainties as to when the war will be resolved as well as the looming fifth wave of COVID-19 infections in Africa where vaccination rates remain low.
For 2022, GDP in many of our major markets is forecast to return to pre-pandemic levels. However, South Africa is constrained by high unemployment, the electricity crisis and rising inflation. The recent award of high-demand spectrum, which supports our 4G and 5G expansion drive, is a significant positive in the implementation of structural reforms needed to drive growth.
In Nigeria, economic activity is expected to normalise, and should benefit from higher oil prices and moderating inflation. MTN Nigeria is well-positioned to sustain accelerated growth in the medium term. The macro context could be potentially challenging in the year ahead but we are confident on the business resilience, strong networks, strong brand and economies of scale that allow us to withstand uncertainties and achieve our targets.
We see structurally higher demand for data services and accelerating transaction values in our fintech businesses. To support this, we will invest in the coverage, capacity and resilience of our networks, as well as the scaling of our platforms. We are increasing our investment in the networks to R34.4 billion. We expect capex intensity to decelerate as the business grows, with Group capex intensity anticipated to reduce in the range of 18% to 15%. We have enhanced our medium-term guidance, raising our targets for Group service revenue growth and returns, in turn creating shared value.
KPI Enhanced target
Service revenue
Group: at least mid-teens growth
South Africa: mid-single-digit growth
Nigeria: at least 20% growth
Accelerate fintech platform growth >20% service revenue contribution
Holdco leverage ≤ 1.5x, faster non-ZAR deleveraging
Asset realisation >R25 billion
Adjusted RoE Improvement towards 25%
Source: GSMA , World Bank, Market sizing, internal desktop research, Delta Partners market sizing.
Source: WHO, AU, Africa CDC.
COVID-19
Emerging from 4th wave of infections
Economies open with greater mobility
~15% of Africa fully vaccinated at 4 April 2022
We see attractive opportunities ahead, but the outlook also presents uncertainties that could affect the execution of our strategy and the targets we want to achieve. We provide outlook information throughout this report, particularly in:
Page
The view of our chairman 04
Q&A with the CEO 06
Our strategic performance 56
Investment case 12
Material matters 16
The key issues we face 33
Top risks to value creation 35
Q&A with the CFO 45
Doing for tomorrow, today
Doing for shared value
Strategic and financial review
Governance and remuneration
14
Integrated Report 2021
Our outlook

We create and preserve value by developing and distributing a range of innovative services. We depend on various resources and relationships, known as the six capitals, to do this. We require inputs of each capital to deliver on our strategy, advance some of the UN SDGs and generate value for our stakeholders. When making decisions on allocating capital, we consider the trade-offs between the capitals and seek to maximise positive outcomes and limit instances in which value is eroded. While transforming the stocks of capitals, we seek to grow inclusively, responsibly and sustainably.
Inputs Our business model Outputs Key outcomes Trade offs
Natural
• Radio spectrum2021 2020
Energy consumption - Electricity 4.1 6.5Energy consumption - Diesel 15.8 13.9Energy consumption - Other^ 0.3 0.1^Petrol, LPG, cooling and natural gas
Our five-step business model is informed by our belief, our strategic
intent and values. It is underpinned by our governance
and supports the delivery of our strategy.
Services:
Communication
Fintech
Digital
Enterprise
NaaS
Chenosis
• Net Zero by 2040• Committed to 47% absolute average reduction by 2030
(science-based target)2021 2020
Carbon emissions - Scope 1 (tCO2e) 0.3 0.3
Carbon emissions - Scope 2 (tCO2e) 0.8 0.9
Carbon emissions - Scope 3 (tCO2e) 4.1 0.9
Total alternative energy sites (’000) 10 8E-waste recycled (t) 16 31
• Capital outlay required to maintain network and payment for spectrum puts pressure on financial capital in the short term. However, this creates opportunities for employment in communities, thus increasing social capital
• Investments in greener economy initiatives might be expensive in the short term but these create a lasting positive effect on our environments and improve social capital
Financial
2021 2020
Market cap (Rbn) 321.7 108Interest received (Rm) 1.2 1.3Holdco debt (Rbn) 30.1 43.3
2021 2020
EBITDA (Rbn) 76.2 81.3Profit after tax (Rbn) 17.0 19.7Cash generated from operating activities
67.3 58.5
Holdco debt to EBITDA ratio (x) 1.1 2.2Dividend (cps) 300 –Return on equity % 19.6 17.0Adjusted headline earnings per share (cents)
1 110 877
• Improved financial capital through localisation initiatives in MTN Uganda and MTN Nigeria and these had a positive impact on social capital
• Human capital negatively impacted by cost-cutting initiatives
• Resumption of dividend payments positively impacted social capital, but financial capital declined
• Asset sales and cash upstreaming improved financial capital, however the funds were invested for growth and used to reduce gearing
Intellectual
• Strong established brand• Skilled, experienced and diverse Board and employees• Partnerships and joint ventures
2021 2020
Goodwill and intangible assets (Rbn) 43.8 39.1 Maintained most valuable African brand rank, worth (US$)
2.7 3.3
• Continued investment in our digital and fintech offerings reduces financial capital
• Ongoing improvements on remuneration policy, addressing shareholder concerns and retaining future-fit employees impacted social and financial capital positively
Human
2021 2020
Employees 16 390^ 19 295Those who are contractors and temporary employees (%)
15 16
Investment in employees (Rm) 190 136
^ After exiting MTN Syria and MTN Yemen in the year
2021 2020
Staff costs (Rbn) 11.7 12.6Voluntary staff turnover (%) 6.5 5.6Employee sustainable engagement score (%) LA
80 81
Time spent on employee development (total hours)
252 127 898 300
Female representation (%) 39 38
• Investment in employee training improved human capital and negatively impacting financial capital
• Further cost-cutting measures implemented that supported financial capital but affected staff morale (social capital negatively)
• WFH increased traffic on our network, negatively impacting natural capital
Manufactured
2021 2020
Value of property, plant equipment (Rbn) 99.8 100.6Capex (IFRS 16) (Rbn) 39.4 33.0 Number of smartphones (m) 145.5 140
2021 2020
2G sites rolled out 3 196 2 435 3G sites rolled out 3 566 3 342 4G sites rolled out 9 158 8 354 5G sites rolled out 849 109Network NPS (#1 in markets) 14 13Depreciation (Rbn) 29.9 27.3
• Network expansion increases the stock of manufactured capital while reducing financial capital in the short term
• In the medium term, increased manufactured capital will realise value to shareholders
• Infrastructure sharing limits the impact on manufactured capital and natural capital
Social
• Improved relationships with regulators, customers, trade unions, employees, communities and civil society.
• Ongoing interactions with government and tax authorities.• Regular engagement with shareholders and the investor
community• 272m subscribers in 19 markets
2021 2020
Total tax contribution (Rbn) LA 43.9 35.1
Economic value added (Rbn) 115 105CSI spend (Rm) 159.0 168.0B-BBEE status MTN South Africa Level 1 Level 1
Calls to whistle-blower line LA 137 188
MoMo active subscribers (m) 56.8 46.4
Net Promoter Score (NPS) LA %South Africa 47 48Nigeria 61 57Other key markets# 48 43
• Programmes aimed at assisting staff will positively affect all capitals as engaged staff are more productive
• Investment in fintech and digital offerings reduces financial capital, however it increases digital and financial inclusion in our communities and transforms society through various skills and enterprise development
• Driving localisation and preferential procurement ultimately builds stocks of social, human, intellectual and financial capital
1We secure access to spectrum, licences and technologies based on a disciplined capital allocation framework
2We attract, develop and retain the best talent and future skills, which we combine with the resources in step 1 to create, build and operate technology platforms that are second to none
3We drive industry-leading connectivity operations and build the largest and most valuable platforms, creating shared value by advancing digital and financial inclusion
4This is achieved through the sale and distribution of our differentiated products and services which provide the leading customer experience leveraging the #1 African brand
5With ESG at the core, and while accelerating our portfolio transformation, we provide leading digital solutions for Africa’s progress
Total GHG emissions
5.2 million tCO2e
value created value eroded value preserved
• Scooped three awards in Intellidex Top Investor Relations survey
# Includes Cameroon, Côte d’ Ivoire, Iran, Uganda
Doing for tomorrow, today
Doing for shared value
Strategic and financial review
Governance and remuneration
15
Integrated Report 2021
Creating and preserving value through our business model

Managing material matters We manage material matters by identifying, prioritising, responding and reporting on them.
Identify Prioritise Respond ReportWe determine our material matters by considering matters of significant importance to our stakeholders and factors that receive the most management and Board attention during the year. These themes take into account:• The priority interests of our key
stakeholders (pages 27 to 31) and the impact of these on our strategy (pages 56 to 72)
• The Group’s top risks and opportunities (pages 37 to 42)
• The context in which we operate (page 09)
These central themes then form the basis of discussion at workshops at which representatives of key departments participate.
They prioritise the Group’s material matters by considering the scale and nature of their impact on business operations, financial performance and interest of our stakeholders. These are then scrutinised and ultimately endorsed by the CFO, CEO, the Executive Committee and then the Board.
We respond to our material matters by putting in place appropriate management actions to capitalise on those factors that offer opportunity for greater value creation as well as interventions to mitigate those which have the potential to disrupt it. We reference our material matters throughout the Integrated Report.
We report on the material matters identified to all our stakeholders, both internal and external.
Those matters that impact value creation, preservation and erosionOur material matters are those that could substantially affect the Group’s ability to create and preserve value in the short, medium and long term. In 2021, we progressed our materiality determination process, endeavouring to make it more thorough, inclusive and integrated.Material matters that were noted over the years resulted in the enhancement of our strategy and are influenced by stakeholder concerns, company risks and the operating environment across our markets. We list nine material matters identified in the year. All material matters are important to the business, the numbering does not reflect the relative importance of each matter.
At a special workshop, representatives of all key departments discussed issues impacting value creation, preservation and erosion, drawing on various MTN internal and external perspectives and reports, feedback from stakeholders, as well as views from the industry.
The materiality determination process is in line with recommendations of the Value Reporting Foundation’s Integrated Reporting Framework as well as of the Sustainability Accounting Standards Board. It considers materiality in terms of financial and ESG aspects.
For a matter to be considered material, it
needs to be sufficiently important in terms
of its known or potential effect – both
positive and negative – on value creation,
and hence our strategy (page 10) and
business model (page 15). This process
involves evaluating the magnitude of effect
and likelihood of occurrence.
CEO review
Exco review and
endorsement
CFO review
Board review and approval
Workshop participants
Investor RelationsStrategy
Internal AuditTreasury
RiskCompany Secretariat
Human ResourcesMergers and acquisitions
and business development
Regulatory and Corporate Affairs
Technology
Workshop
Material matters
approval process
Doing for tomorrow, today
Doing for shared value
Strategic and financial review
Governance and remuneration
16
Integrated Report 2021
Material matters impacting value creation

Key: ST Short term MT Medium term LT Long term
MM
1COVID-19 impacts The pandemic accelerated demand for data and fintech services, a trend that has been sustained since lockdown restrictions have eased.
Implications for value Strategic response and opportunities Outlook
• Pandemic restrictions support increased demand for services, underpinning our resilient results, but the long-term damage to lives and livelihoods remains a challenge.
• We mourned the loss of 30 of our people since the pandemic began.
• COVID-19 demonstrated just how fundamentally important our services – communications and digital technologies – are.
• Amid ongoing socioeconomic impacts, our response to COVID-19 was well received by stakeholders, enhancing our reputation.
• Accelerated development of digital ecosystems across our markets led to a significant uptake in telecommunication services and supported shifts to cashless payments.
• Structurally higher demand for data services and accelerating fintech transactions despite the reopening of the economies.
• Through our comprehensive COVID-19 response plan, we continue to manage the impacts of the pandemic on our people, communities, networks and financial position.
• Among our many initiatives are the vaccine mandate for staff and the support for vaccinations across Africa.
• Investment in the resilience of our networks and platforms.
• Our multi-vendor approach is designed to mitigate supply chain disruptions.
• The pandemic together with the shift in the global operating environment highlighted opportunities and informed the case for change and the need to revise our strategy to Ambition 2025.
• Looming wave of COVID-19 infections in Africa where vaccination rates remain low. ST
• With the MTN vaccine mandate in force, employees have greater protection against the virus and are better able to interact and deliver our strategy. ST
• Economies are expected to become increasingly more open as vaccination rates increase and normal activities resume. However, the pandemic is not over, with numerous risks remaining.
ST MT
• MTN is well positioned to take advantage of the opportunities identified and has the resilience to deliver on our Ambition 2025. This is supported by our leading African brand, strong market share positions, well invested connectivity networks and platforms as well as committed employees. MT LT
• For details on COVID-19 refer to page 32.
RISK
6
RISK
2
Opportunity • To win in digital services in our markets as customers come online for the first time.• To align our priorities more closely with the development agendas of our operating markets including through our support for greater
vaccine equity in turn creating shared value.• Enhance elements of our medium-term (three to five years) guidance framework.
Doing for tomorrow, today
Doing for shared value
Strategic and financial review
Governance and remuneration
17
Integrated Report 2021
Material matters impacting value creation continued

MM
2Challenging economic environment Despite ongoing challenges in 2021 the global economy showed signs of recovery, recording 5.9% GDP growth. Sub-Saharan Africa grew by 3.7% after contracting by 1.7% in 2020. This was driven mainly by the bounce back in global trade and the commodities upcycle.
Implications for value Strategic response and opportunities Outlook
• This recovery helped support higher demand for digital services, which underpinned our strong performance in 2021. As MTN, we have done a lot of work to position ourselves to capture growth opportunities across our markets.
• South Africa’s economy is experiencing pressure, particularly in the lower-income consumer segment due in part to job losses. This is impacting MTN SA’s consumer prepaid segment.
• The spectrum auction is encouraging, suggesting that the long awaited structural reforms are now underway.
• The stronger average rand against most local currencies has a negative overall translation impact on rand-reported results.
• Tailoring our propositions through our customer value management initiatives to mitigate the pressure on share of wallet.
• Improving affordability of data services.
• Our expense efficiency programme focuses on cutting costs.
• We are also working to reduce our exposure to US dollar debt, with improvements in the debt mix.
• Delivery against our strategic priority to build the largest and most valuable platforms and drive industry-leading connectivity operations is supporting the heightened demand for data and fintech services.
• Our strategy is robust and we have sufficient adaptability and resilience built into our operating model. We will continue to play our part in ensuring a more sustainable and equal future.
• The ability of African economies to sustain this recovery will depend on the capacity of respective governments to increase vaccine coverage, manage public debt and execute governance and economic reforms. ST
• Growth in African economies in 2022 was initially expected to be at similar rates as 2021, however expectations have now been revised down to factor in the potential impact of the war in Ukraine. ST
• Potentially challenging macro, but the business has resilience, strong networks, strong brand and economies of scale that allow us to withstand shock. ST
• More structural reforms are needed in South Africa to get higher GDP growth.
ST MT
• The sharp rise in oil prices in early 2022 if sustained will support Nigeria’s economic activity and forex reserves.
ST
• The global economy is expected to feel the effects of the war in Europe in slower growth, with increased oil and food prices and higher inflation.
ST MT LT
• The upgrade in South Africa’s sovereign credit outlook to stable from negative improves the attractiveness of MTN as an investment. ST MT
RISK
2
Opportunity • The risks associated with an inflationary upcycle will need to be carefully managed but our ability to work with strategic stakeholders
to mitigate these will unlock the opportunities that present themselves. • Structurally higher demand for data services and accelerating fintech transactions.• Mobile Money remains a prime growth driver as it plays a critical role in enhancing financial inclusion.• Access to affordable communication and digital services has the power to change lives and bridge inequalities.
Doing for tomorrow, today
Doing for shared value
Strategic and financial review
Governance and remuneration
18
Integrated Report 2021
Material matters impacting value creation continued

MM
3Dynamic geopolitical environment In many of the markets in which we operate, there is political and policy uncertainty and social unrest, however the overall quality of governance in many markets continues to improve.
Implications for value Strategic response and opportunities Outlook
• The markets in which we operate offer many opportunities, refer to page 12 for our investment case.
• Political instability in some markets disrupts business and our ability to create value for all our stakeholders.
• Changing relations between Iran and the West and associated sanctions impact our ability to repatriate cash from MTN Irancell.
• Internet shutdowns are not uncommon in some markets, hampering citizens’ ability to communicate freely, disrupting our business activity and harming our reputation.
• Reputational and relationship risks in the Middle East in particular.
• With our focus firmly on pan-African operations and transforming our portfolio, we exited operations in Syria and Yemen in 2021.
• Explored options to exit Afghanistan.
• MTN's business resilience strategy and maturity assessment accelerates the resilience of critical services, to protect against potential shocks, disruptive events, and geopolitical factors.
• We endeavour to protect the rights of all people who use our services. Our approach to digital human rights is underpinned by a sound policy and due diligence framework.
• The use of political and economic scenario analysis plays an integral part in our risk management.
• MTN’s policy on the protection of digital human rights being shared more widely with stakeholders together with practical examples of how the Group has implemented this policy as part of MTN’s Transparency Report efforts.
• Improving our disclosure over the years including through the release of our Transparency Report TR .
• Greater engagement with stakeholders to address the evolving socioeconomic needs of our host nation and stakeholders.
• We continue to explore options to exit Afghanistan in an orderly manner. ST
• Reduce our risk profile. ST MT
• Finalising annual update to digital human rights policy, incorporating feedback from stakeholders. ST
• Remain committed to protecting the rights of all people who use our services.
ST MT LT
RISK
2
Opportunity • An orderly exit from the Middle East operations to simplify the portfolio, reduce risks and improve returns. • Greater stakeholder engagement to raise awareness and understanding of our digital human rights policy and process.• Should sanctions on Iran be eased, we see opportunity to repatriate loans and receivables.
Doing for tomorrow, today
Doing for shared value
Strategic and financial review
Governance and remuneration
19
Integrated Report 2021
Material matters impacting value creation continued

MM
4Evolving regulatory and compliance requirements In all our markets, regulatory requirements evolve. We continuously monitor developments across politically and economically sensitive markets and enhance our response capability as required.
Implications for value Strategic response and opportunities Outlook
• Some requirements may reduce our competitive edge and put pressure on our revenue and profitability.
• Greater local participation, such as stock exchange listings of local operations and more in-country hiring and procurement, will support value creation for all.
• In Nigeria, in December 2020, the NCC suspended the sale and activation of new SIMs for all operators in Nigeria, directing them to update SIM registration records with national identification numbers (NINs) for every SIM connected to networks in the country. In April 2022, the NCC directed all telecom operators in Nigeria to restrict only outgoing voice calls for subscribers who have not yet submitted their NINs for linking to their SIMs.
• In 2020, Ghana’s regulator classified MTN Ghana as a significant market power and decided that special regulatory conditions would be enforced to potentially limit the Company. In 2022, the parliament voted in favour of a new e-levy, which still requires presidential approval.
• It is very important to maintain our reputation, which can be harmed by any non-compliance.
• Since December 2020, MTN Nigeria made good progress, with ~47 million subscribers having submitted their NINs by 31 December 2021. This represents ~67% of the subscriber base and ~76% of service revenue and deployed more than 4 000 points of enrolment across the country in Nigeria. In April 2022, we complied with the NCC directive.
• In Ghana, we follow the regulator’s directives and continue to engage.
• Stakeholder engagement remains critical in all we do.
• In the year we made very good progress with localisations, which also supports our work to create shared value, broadening local participation and deepening the capital markets in which we operate. For more on our localisations refer to page 72.
• Further entrench the position of MTN as the partner of choice for nation states across our markets, focusing on creating shared value. MT
• MTN Nigeria continues to engage with the NCC and NIMC – including through relevant industry bodies to support Nigeria’s efforts to create a secure and sustainable digital economy. ST
• MTN Ghana SMP/Market dominance. We continue to focus on compliance and self-regulation. ST MT
• Further de-risk our profile and further improve our reputation. ST MT
• We promote the active engagement of our Opco teams in the development of the regulatory frameworks and structure to ensure the requisite participation and understanding of goals, processes and procedures.
ST MT LT
• We continue to sell down our stakes in operating companies deepening our capital markets and enhancing local participation in our businesses. To localise in total: ST MT
› MTN Nigeria (localise 35%) › MTN Ghana (localise 25%) › MTN Uganda (localise 20%)
RISK
3
RISK
8
RISK
1
Opportunity • MTN Nigeria supports the work being done by the government to build a reliable and sustainable National Identity Management
system, which is a critical enabler that will deliver multiple benefits to the telecoms industry and Nigeria as a whole. It will aid national economic planning and enhance security, governance and service delivery at all levels.
• Supporting the fiscal resources of nation states.• Even greater collaboration with key stakeholders.• By deepening the capital markets in the countries in which we operate, we are supporting their economic development. • More opportunity ahead for greater localisation in Nigeria, Ghana and Uganda.
Doing for tomorrow, today
Doing for shared value
Strategic and financial review
Governance and remuneration
20
Integrated Report 2021
Material matters impacting value creation continued

MM
5Disruptive technologies New technologies continue to displace established ones and alter the way businesses operate and consumers behave. Connectivity is the lifeline of modern societies and access is a digital human right. Digital disruption is accelerating economic development and supporting the ambitions of the nation states in which we operate.
Implications for value Strategic response and opportunities Outlook
• Quality network performance and strong population coverage provide MTN with a competitive advantage, supporting greater subscriber uptake and increased market share.
• By supporting the accelerating digital needs of our customers, we can double the number of those people who access the internet. But the availability of affordable spectrum is key.
• We believe that everyone deserves the benefits of modern connected life, where we lead the digital race through the power of our brand, our distribution footprint, and best-in-class connectivity infrastructure.
• We increased the number of people covered by our 3G and 4G networks, and we added 14.5m and 54.6m respectively.
• MTN SA sustained the best network quality in South Africa, as shown in both customer and independent measures. In early 2022 we obtained secured high-demand spectrum to support our 4G and 5G expansion drive (20MHz in the 800MHz band, 40MHz in the 2.6GHz band, 40MHz in the 3.5GHz band).
• MTN Nigeria also secured spectrum (two 100MHz spectrum licences in the 3.5GHz spectrum band).
• Rural broadband expansion through our rapid rural programme, we now have rural coverage of 83% and rolled out 912 additional rural sites, expanding rural coverage to a total of more than 23 million people supporting delivery of our belief.
• Continue to scale up our digital, fintech and wholesale offerings in support of Ambition 2025. ST MT LT
• Focus on digital transformation through the launch of our new campaign management system and continue to deploy advanced analytics models across our operating companies to improve active data subscriber retention. ST
• Drive dominance in home connectivity. MT LT
• Continue to make investments to help build technology platforms to provide customers with a seamless and distinctive network experience.
ST MT LT
• Increased our 2022 planned capex investment to R34.4bn from R32.7bn in 2021. ST
• Ensuring widespread coverage. Rapid rural rollout programme closing the coverage gap in rural areas through collaboration with several partners and OpenRAN technology. MT
• High-speed data networks via innovative low-cost technologies.
• 4G network expansion to population coverage of 70% by 2025. MT
• Fibre infrastructure expansion. MT LT
• Accelerating 5G through the newly acquired high-demand spectrum, reaching 5G population coverage of 10% to 30%. MT LT
• Capex intensity reducing in the range of 18% to 15%. MT
RISK
7
Opportunity • Having technology platforms that are second-to-none is one of the vital enablers of Ambition 2025 and hinges on superior network
performance which is aided by spectrum acquisition.• Having secured spectrum in SA and Nigeria we will be able to accelerate 5G to unlock the digital economy. • Extend financial and digital inclusion through closing the coverage gap.
RISK
4
Doing for tomorrow, today
Doing for shared value
Strategic and financial review
Governance and remuneration
21
Integrated Report 2021
Material matters impacting value creation continued
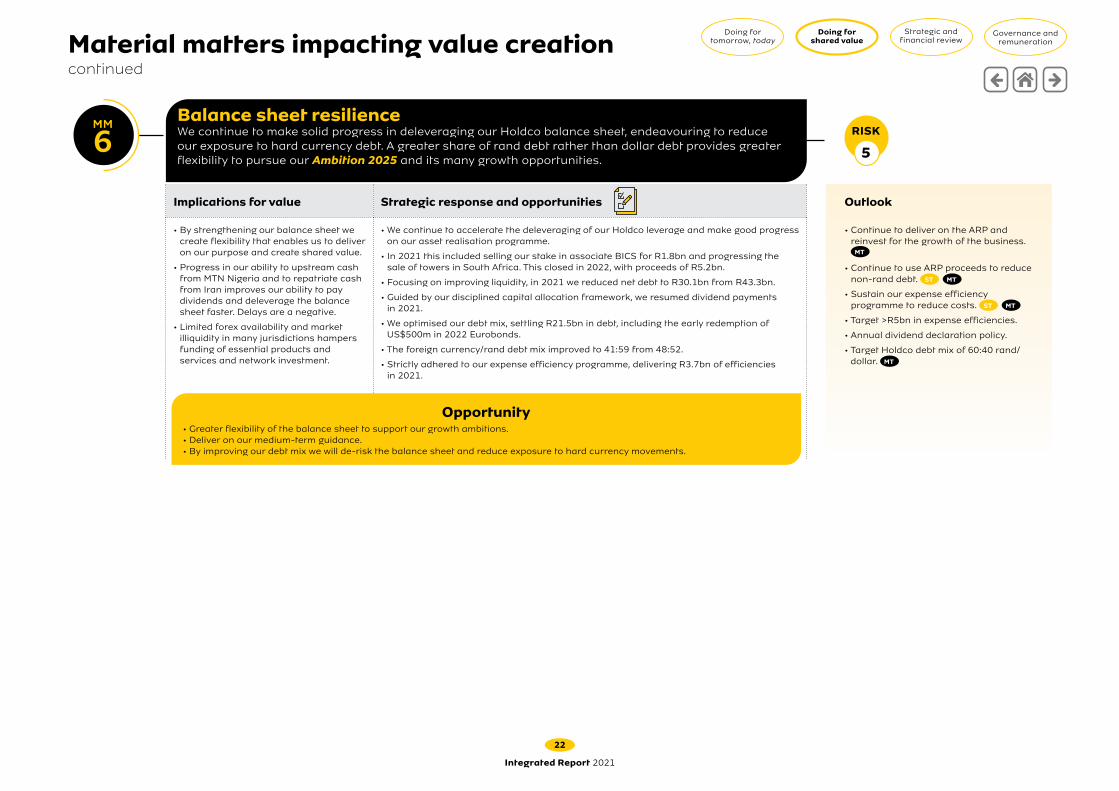
MM
6Balance sheet resilience We continue to make solid progress in deleveraging our Holdco balance sheet, endeavouring to reduce our exposure to hard currency debt. A greater share of rand debt rather than dollar debt provides greater flexibility to pursue our Ambition 2025 and its many growth opportunities.
Implications for value Strategic response and opportunities Outlook
• By strengthening our balance sheet we create flexibility that enables us to deliver on our purpose and create shared value.
• Progress in our ability to upstream cash from MTN Nigeria and to repatriate cash from Iran improves our ability to pay dividends and deleverage the balance sheet faster. Delays are a negative.
• Limited forex availability and market illiquidity in many jurisdictions hampers funding of essential products and services and network investment.
• We continue to accelerate the deleveraging of our Holdco leverage and make good progress on our asset realisation programme.
• In 2021 this included selling our stake in associate BICS for R1.8bn and progressing the sale of towers in South Africa. This closed in 2022, with proceeds of R5.2bn.
• Focusing on improving liquidity, in 2021 we reduced net debt to R30.1bn from R43.3bn.
• Guided by our disciplined capital allocation framework, we resumed dividend payments in 2021.
• We optimised our debt mix, settling R21.5bn in debt, including the early redemption of US$500m in 2022 Eurobonds.
• The foreign currency/rand debt mix improved to 41:59 from 48:52.
• Strictly adhered to our expense efficiency programme, delivering R3.7bn of efficiencies in 2021.
• Continue to deliver on the ARP and reinvest for the growth of the business.
MT
• Continue to use ARP proceeds to reduce non-rand debt. ST MT
• Sustain our expense efficiency programme to reduce costs. ST MT
• Target >R5bn in expense efficiencies.
• Annual dividend declaration policy.
• Target Holdco debt mix of 60:40 rand/dollar. MT
RISK
5
Opportunity • Greater flexibility of the balance sheet to support our growth ambitions. • Deliver on our medium-term guidance. • By improving our debt mix we will de-risk the balance sheet and reduce exposure to hard currency movements.
Doing for tomorrow, today
Doing for shared value
Strategic and financial review
Governance and remuneration
22
Integrated Report 2021
Material matters impacting value creation continued

MM
7Greater focus on ESG The growing prominence of ESG in investor strategies, coupled with greater consistency of international ESG standards is cementing ESG as a mainstream business concept influencing investment returns and corporate strategies.
Implications for value Strategic response and opportunities Outlook
MTN’s reputation is increasingly linked to its performance on various ESG metrics.
A step change in our approach to ESG, which includes greater disclosure and commitment, is reflected in an improvement in our reputation. The increase in the value investors ascribe to our shares is another indicator of this improvement.
Creating shared value is integral to the sustainability of our business as we work to play our part in the socioeconomic development of our markets and, in turn, our continent.
• One of Ambition 2025’s four strategic priorities is ‘Create shared value’, with ‘ESG at the core’.
• As part of this we have materially improved our performance and commitment to numerous ESG metrics.
• Across our markets we remain committed to driving digital and financial inclusion. We connected 23 million more people to broadband and improved affordability, with a 15.3% YoY reduction in the blended cost of data across our markets.
• The work to close the coverage gap in rural areas continued through our rapid rural rollout programme (R3) by rolling out 912 additional rural sites (2020: 684). Since the inception of the programme, we have expanded our coverage to more than 23 million (2020: 8.5 million) people in rural areas.
• Our commitment to improve our ESG performance led to a significant upgrade in the Group’s ESG rating by FTSE Russell to an overall rating of 4.3 (out of 5) at end-December 2021 from 2.9 previously. MTN is now placed above the mobile telecoms sub-sector average and was also included in the FTSE/JSE Responsible Investment Top 30 Index.
• We have increased women representation by 1pp to 39%.
• As a critical step to ensuring its progress in the Group, we have linked 2022 executive remuneration for STIs and LTIs to ESG, with a focus on Net Zero, diversity, inclusion and the expansion of rural broadband.
• Appointment of the Chairman of the Social and Ethics Committee as the Climate Change Director for the Group. The Social and Ethics Committee was reconstituted to reflect the step change in approach to ESG and renamed ‘The Social, Ethics and Sustainability Committee’.
• Elevation of Sustainability Executive to the Exco through the appointment of a Group Chief Sustainability and Corporate Affairs Officer..
• Drive responsible use of environmental resources; greater use of alternative energy. MT
• Remain committed to transparency and greater disclosure. ST MT
• Focus on being the partner of choice for nation states in socioeconomic development. ST MT LT
• Diversity and inclusion, we set a target of 50% women representation of executives and boards across our Opcos and 50% women in the workforce overall by 2030. LT
• We remain committed to reduction of carbon emissions by 47% (off a 2019 base) by 2030 across scope 1, scope 2 and scope 3 emissions, and to achieving Net Zero by 2040. LT
• Improve rural broadband coverage to 95% by 2025. MT
• Executive remuneration for LTI is linked to ESG performance with a focus on Net Zero, diversity and inclusion and rural broadband. ST MT
• We remained steadfast in contributing to Africa’s progress, driven by our belief that everyone deserves the benefits of a modern connected life and our strategic intent of ‘Leading digital solutions for Africa’s progress’. MT LT
RISK
9
Opportunity • Better ESG performance gives us exposure to a greater investor base. • Contributing to the SDGs and the sustainability of our markets. • To contribute to more diverse and inclusive societies, supporting a sustainable future.• To contribute to Africa’s progress.
Doing for tomorrow, today
Doing for shared value
Strategic and financial review
Governance and remuneration
23
Integrated Report 2021
Material matters impacting value creation continued

MM
8 Cybersecurity Cybersecurity threat remains a key challenge that organisations must continuously assess and mitigate.
Implications for value Strategic response and opportunities Outlook
• Cybersecurity is a growing priority as cyber-attacks become more sophisticated.
• A cyber-attack aimed at MTN could lead to service interruption and the infringement of personal and confidential data, causing business interruption, financial loss and exposure to increased regulatory scrutiny and reputational damage.
• Improved cybersecurity crisis readiness, through embedding cybersecurity crisis simulation as an integral part of the Group’s business resilience programme.
• Focused on enhancing controls to reduce cyber risks, fraud risks and revenue leakage.
• Created security awareness with MTNers by sending test phishing emails to determine their response to potential cyber-attacks.
• Held a ‘Global Cybersecurity Awareness Month’ where we created awareness initiatives and covered topics such as working securely from anywhere, cyber hygiene and social media sharing.
• Compulsory Policy Training for MTNers.
• Independent third party conducted an annual employee security awareness survey. The 2021 evaluation of the Secure Behaviour Index improved to 89% from 87.3% in 2020, maintaining a consistent trend of improvement since 2017.
• Appointed a GCRO which elevates both Risk & Compliance and Internal Audit to Group Exco level representation.
• Both the information security and the business resilience teams, will continue to focus on continued control effectiveness and enhancement across all operating companies.
ST MT
• MTN will continue to implement the programmes on cybersecurity across our markets which is aimed at accelerating the execution of the information security plans.
ST MT
• Embed security by design in all deployment. LT
RISK
4
Opportunity • Continue to contribute to efforts to strengthen the security control environment through the adoption of new technologies and
creating awareness.• Refresh and continue to improve the security plans to enhance MTN's overall security position.• Further enhance cyber resilience programmes that anticipate uncertainty and ensure the sustainability of the business.
Material matters impacting value creation continued
Doing for tomorrow, today
Doing for shared value
Strategic and financial review
Governance and remuneration
24
Integrated Report 2021

MM
9 Fintech and digital skills and expertise Digitalisation and the application of emerging technologies have accelerated the demand for digital skills.
Implications for value Strategic response and opportunities Outlook
• Digital skills gap is widening, as well as its implications for digital and social inequalities.
• A shortage in digital skills adds financial risks and may impact the sustainability of the business.
• As we continue on our journey to deliver on our strategic intent of leading digital solutions for Africa’s progress, we are acutely aware of the role of people in achieving these outcomes which is why we have placed best talent, culture and future skills as a vital enabler to ensuring success.
• MTN is one of the few global organisations that has proactively implemented an Employee Value Proposition (EVP). Refer to SR .
• Bridging this skills gap enabling employees that are already in the workforce to become digitally-empowered and more hybrid. We have invested R190m in skills in 2021.
• Encouraged MTNers to explore their career options and learning paths to ensure their skillset remains relevant.
• Provided learning opportunities to employees in the language of their choice through access to our online learning platform.
• Evaluated the skills of the Board, identifying the need to recruit and retain more of the digital and fintech, IT governance and sustainability talent that complement our Ambition 2025 strategy.
• Developing a flagship programme and fostering partnerships to facilitate the rollout of the digital skills. ST
• Investment in Disrupter Talent and Skills (Build/Buy). ST MT
• Future-proofing talent pipelines across the Connectivity and Platform value-chain. ST MT
• Preparing the teams for digitalisation utilising a current skill set that already understands the organisation, and in turn boosting efficiency while retaining and developing talent. ST MT
• The Board is looking to retain more fintech and digital skills. The process to identify directors with suitable skill is ongoing and should be finalised towards the end of 2022. ST
RISK
9
Opportunity • To upskill our employees and in turn bridge the digital skills gap internally which leads to improved employee morale and retention
together with higher productivity rates.• Build agile and innovative talent to drive collaboration for shared purpose.• Pivot from a traditional talent mindset to one that repositions our skills base for the future of the business, ensuring that we are able
to support both the platform and connectivity businesses.• Drive digital skills for digital jobs to reach one million people by 2025.
Material matters impacting value creation continued
Doing for tomorrow, today
Doing for shared value
Strategic and financial review
Governance and remuneration
25
Integrated Report 2021

Members
Attendance at applicable
meetings
Nkululeko Sowazi 4/4
Noluthando Gosa^ 3/3
Stan Miller 4/4
Khotso Mokhele 4/4
Lamido Sanusi 4/4
By invitation: Group President and CEO, Group Chief Regulatory and Corporate Affairs Officer, Group Chief Human Resources Officer, Group Chief Risk Officer, Group Chief Legal Officer^Member effective 1 April 2021
“MTN has demonstrated a step change in managing its environmental, social and governance (ESG) impacts as evidenced by the improvement in our ESG performance across multiple ESG raters and rankers. In 2021, the committee fulfilled its mandate as prescribed by the Companies Regulations to the Companies Act, with no material non-compliance.”
Mandate: The Committee performs an oversight and monitoring role to ensure that MTN’s business is conducted in an ethical and properly governed manner. The Committee assists the Board with creating shared value in a sustainable manner through responsible environmental, social and governance business practices across MTN’s operating markets.
Key features of 2021 • Approved our Sustainability Strategic Framework, outlining KPIs
and driving executive remuneration for LTIs linked to ESG. • Signed pledge with the Science-Based Target initiative to
commit to our target of Net Zero by 2040; achieved ~16% reduction in scope 1 and 2 GHG emissions.
• Entrenched diversity and inclusion; reported incremental increase to 39% women in the workforce.
• Continued to close coverage gap in rural areas by rolling out 912 more rural sites (2020: 684), covering more than 23 million people.
• Embedded ethical behaviour through our ethics strategy, using the results of our ethics risk assessment.
• Donated US$25m to support the African Union’s COVID-19 vaccination programme.
• Supported the livelihoods of communities, including job creation and skills development, of some six million people.
• Addressed material stakeholder issues and improved both our reputation index survey score and stakeholder relationship score from 72 to 78.
• Enhanced our response to socioeconomic challenges through our B-BBEE strategy: improved MTN Group contributor status from level 3 (2019) to level 2 (2020).
• More details of the activities overseen by the committee are available in the Sustainability Report online SR .
Chair Nkululeko Sowazi
Key focus areas for 2022
> Ensure operating companies develop country-specific action plans to align with our Net Zero goal.
> Focus on increasing women in the workforce to 50% by 2030.
> Expand rural broadband population coverage to 95% by 2025.
> Drive digital skills for digital jobs to reach one million people by 2025.
> Incrementally improve our reputation by addressing stakeholder needs.
> Introduce an ethical culture maturity ‘pulse-check’ to supplement the Group-wide ethics risk assessment
conducted every three years.
> Improve MTN Group B-BBEE contributor status to level 1.
Previously known as the Social and Ethics Committee
Doing for tomorrow, today
Doing for shared value
Strategic and financial review
Governance and remuneration
26
Integrated Report 2021
Social, Ethics and Sustainability Committee Chair’s review
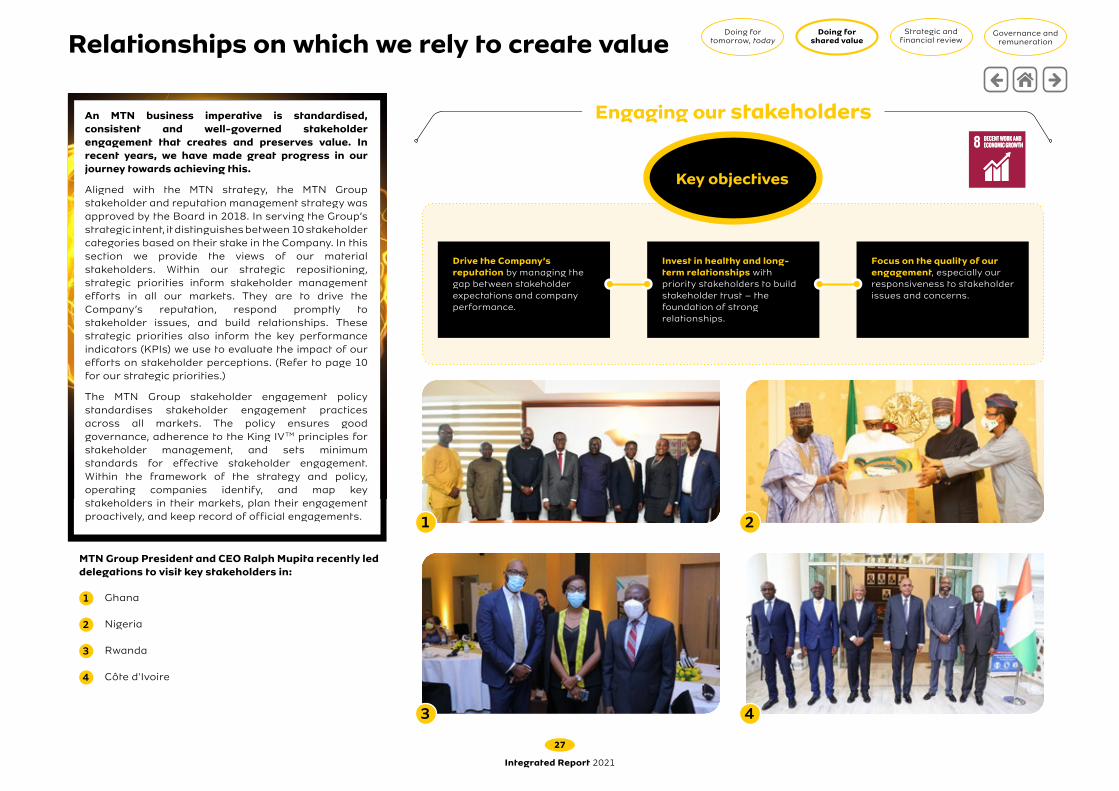
Focus on the quality of our engagement, especially our responsiveness to stakeholder issues and concerns.
Drive the Company’s reputation by managing the gap between stakeholder expectations and company performance.
Invest in healthy and long-term relationships with priority stakeholders to build stakeholder trust – the foundation of strong relationships.
An MTN business imperative is standardised, consistent and well-governed stakeholder engagement that creates and preserves value. In recent years, we have made great progress in our journey towards achieving this.
Aligned with the MTN strategy, the MTN Group stakeholder and reputation management strategy was approved by the Board in 2018. In serving the Group’s strategic intent, it distinguishes between 10 stakeholder categories based on their stake in the Company. In this section we provide the views of our material stakeholders. Within our strategic repositioning, strategic priorities inform stakeholder management efforts in all our markets. They are to drive the Company’s reputation, respond promptly to stakeholder issues, and build relationships. These strategic priorities also inform the key performance indicators (KPIs) we use to evaluate the impact of our efforts on stakeholder perceptions. (Refer to page 10 for our strategic priorities.)
The MTN Group stakeholder engagement policy standardises stakeholder engagement practices across all markets. The policy ensures good governance, adherence to the King IVTM principles for stakeholder management, and sets minimum standards for effective stakeholder engagement. Within the framework of the strategy and policy, operating companies identify, and map key stakeholders in their markets, plan their engagement proactively, and keep record of official engagements.
Engaging our stakeholders
4
2
3
1
1
2
3
4
Ghana
Nigeria
Rwanda
Côte d'Ivoire
MTN Group President and CEO Ralph Mupita recently led delegations to visit key stakeholders in:
Doing for tomorrow, today
Doing for shared value
Strategic and financial review
Governance and remuneration
27
Integrated Report 2021
Relationships on which we rely to create value
Key objectives

The objectives of our stakeholder engagements inform the key performance indicators which we use to evaluate the impact of our efforts on stakeholder engagements. We rely on stakeholder feedback in our everyday engagement as well as our Reputation Index Survey, NPS tracking (for customers) and our Sentimeter Survey (for employees) to measure our performance. As part of the Reputation index process, we better understand how our valued stakeholder perceives the Company. This survey is conducted by an independent third-party research service provider.
The 2021 MTN Reputation Index Survey set a record for stakeholder participation, surveying 5 219 stakeholder representatives of government, regulators, the investment community, media, civil society, subscribers/customers, suppliers, trade partners, industry and organised business across 19 markets. This represents participation of 647 more respondents than in 2020.
The results showed that the stakeholder categories that were particularly satisfied – scoring MTN’s reputation at 80% and higher in 2021 – were the investment community, civil society, the mobile industry, suppliers/vendors, trade partners and subscribers. Those stakeholders who rated their level of satisfaction below 80% included government/regulators, organised business, the media and employees.
+0.9% to 79.6%Reputation
+2.0% to 76.5%Quality of engagement
+6.3% to 78.0%Relationship health
+2.5% to 76.7%Responsiveness
+4.9% to 78.0%Trust
+10.5% to 83.6%Response to COVID-19
88%82%
76%
85%
83%84%
Environmental performance
71%
Fair andtransparent
billing
74%
Business performanceand financial
results
Localisation
76%
Customerservice
Compliancewith legislation and regulation
Networkperformance
Impact onsocioeconomicdevelopment
81%
Good corporate
governance
Contributionto the
industry
Doing builds strong relationships
The issues that are material to our stakeholders are articulated through 10 reputation drivers. In the context of Ambition 2025’s strategic priority to ‘create shared value’, a seven point increase in stakeholder perceptions of MTN’s impact on socioeconomic development is noteworthy. This shift resulted from positive sentiment about MTN’s impact on digital and financial inclusion.
Survey results Reputation drivers
Score key:
Above 75% – above the target % that we have set for ourselves
Need to improve – below the target % that we set for ourselves
Doing for tomorrow, today
Doing for shared value
Strategic and financial review
Governance and remuneration
28
Integrated Report 2021
Relationships on which we rely to create value continued

Aligned with our strategy, we distinguish between 10 stakeholder categories. Here we provide the views of our five most material stakeholder groups.
While all stakeholders are important to our operations, at the Group we identify five groups with the largest impact on our ability to create and preserve value at a multinational level.
Governments and regulators
• MTN’s responsiveness is an area identified for improvement.
• Score can be improved in Iran, Uganda, Côte d’Ivoire, eSwatini, South Africa and Ghana.
What matters most to them1. Network performance.2. A positive impact on socioeconomic
development.3. Strong business performance and financial
results.4. Compliance with legislation and regulations.5. A constructive contribution to Industry.
Our response:• Involved government in efforts to enhance network performance and create shared value.• Partnered on matters of national and business interest and honoured our obligations as a
reliable partner.• Maintained a stringent compliance regime through our three lines of defence and regular
reporting.• Monitored the strategic intent behind emerging policy and regulatory trends.• Engaged regulators for enhanced mutual understanding on what may appear to be
conflicting positions on matters material to government and business sustainability.• Ensured the supply of temporary spectrum was managed well in South Africa.• Supported COVID-19 efforts through vaccine donation and partnering on campaigns.• Contributed to tax base and added economic value.
78%(up 1.3pp since 2020)
How we engage:• Personal quarterly leadership
engagements.• Country visits.• Public forum participation.• Webinars. • Participation and consultation on
industry bills.
Steady improvement
Provide enabling environment for value creation and access to licences and spectrum.
Stakeholders’ sentiment on how we engage(measured by the quality of our engagement score)
Civil society
What matters most to them1. A positive impact on socioeconomic
development.2. Network performance.3. Strong business performance and financial
results.4. Good customer service.5. A constructive contribution to Industry.
Our response:• Partnered with the AU in support of the COVID-19 vaccination programme.• Invested in programmes to empower youth to access decent work and become
economically active.• Supported programmes aligned to countries’ national development plans.• Advanced programmes to ensure girls and women have the skills and knowledge
to understand, develop content, participate in and benefit fully from ICTs and their applications.
How we engage:• Ongoing meetings and webinars. • Ad hoc community visits.• Quarterly stakeholder days.
Provides the basis from which MTN’s services are generated, workforce skills are acquired and where our business derives its legitimacy.
• Score can be improved in Iran as it is below our 75% target.
78%(up 1.0pp since 2020)
Steady improvement
Stakeholders’ sentiment on how we engage(measured by the quality of our engagement score)
Doing for tomorrow, today
Doing for shared value
Strategic and financial review
Governance and remuneration
29
Integrated Report 2021
Relationships on which we rely to create value continued
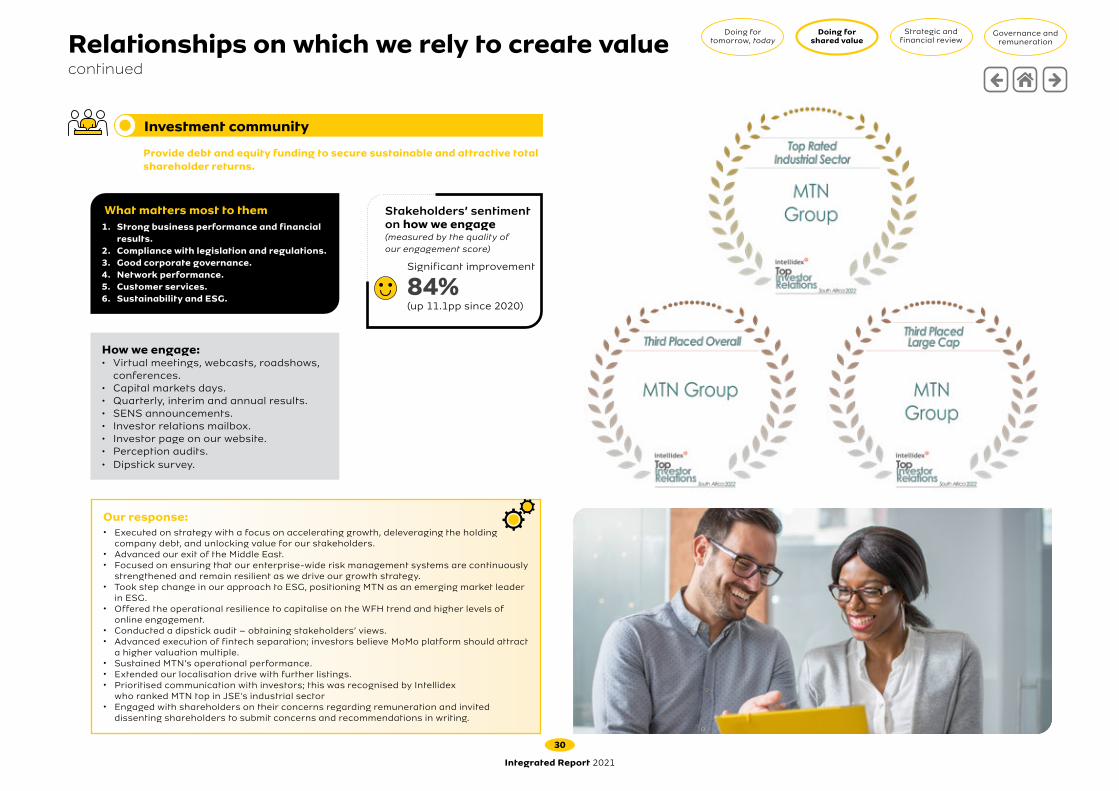
Investment community
What matters most to them1. Strong business performance and financial
results.2. Compliance with legislation and regulations.3. Good corporate governance.4. Network performance.5. Customer services.6. Sustainability and ESG.
Our response:• Executed on strategy with a focus on accelerating growth, deleveraging the holding
company debt, and unlocking value for our stakeholders.• Advanced our exit of the Middle East.• Focused on ensuring that our enterprise-wide risk management systems are continuously
strengthened and remain resilient as we drive our growth strategy.• Took step change in our approach to ESG, positioning MTN as an emerging market leader
in ESG.• Offered the operational resilience to capitalise on the WFH trend and higher levels of
online engagement.• Conducted a dipstick audit – obtaining stakeholders’ views.• Advanced execution of fintech separation; investors believe MoMo platform should attract
a higher valuation multiple. • Sustained MTN’s operational performance.• Extended our localisation drive with further listings.• Prioritised communication with investors; this was recognised by Intellidex
who ranked MTN top in JSE's industrial sector• Engaged with shareholders on their concerns regarding remuneration and invited
dissenting shareholders to submit concerns and recommendations in writing.
How we engage:• Virtual meetings, webcasts, roadshows,
conferences.• Capital markets days.• Quarterly, interim and annual results.• SENS announcements.• Investor relations mailbox. • Investor page on our website.• Perception audits.• Dipstick survey.
Provide debt and equity funding to secure sustainable and attractive total shareholder returns.
84%(up 11.1pp since 2020)
Significant improvement
Stakeholders’ sentiment on how we engage(measured by the quality of our engagement score)
Doing for tomorrow, today
Doing for shared value
Strategic and financial review
Governance and remuneration
30
Integrated Report 2021
Relationships on which we rely to create value continued
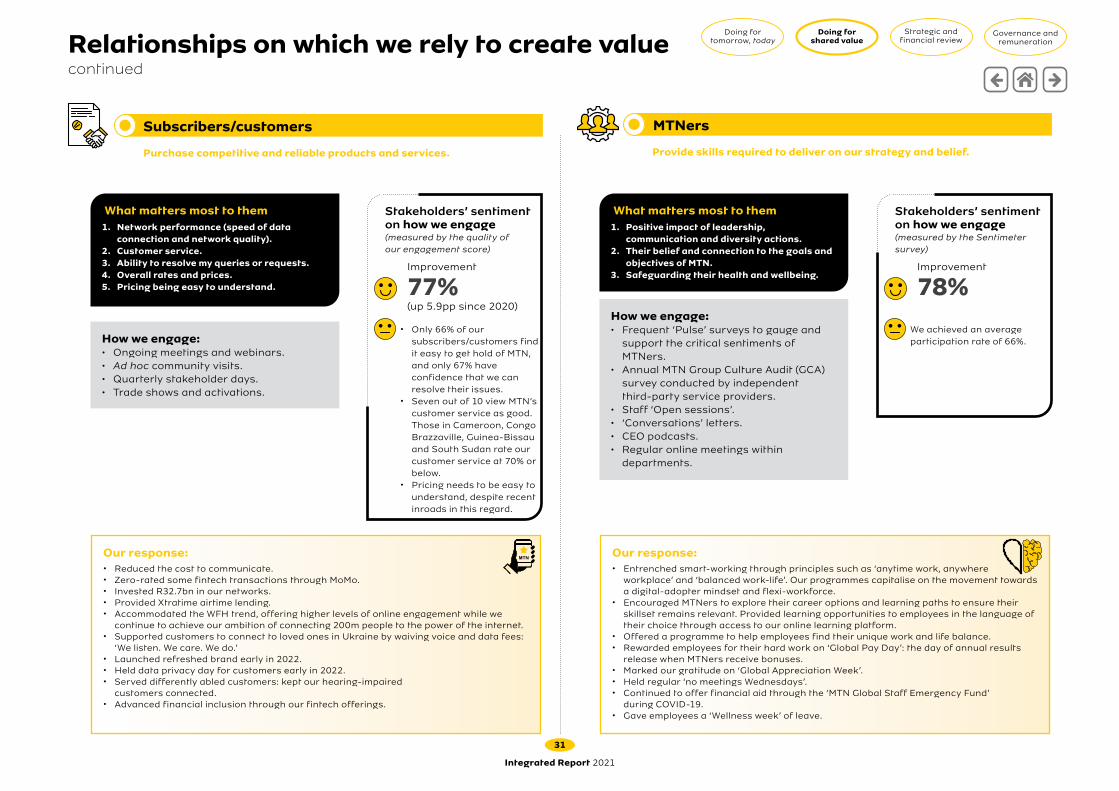
Subscribers/customers
• Only 66% of our subscribers/customers find it easy to get hold of MTN, and only 67% have confidence that we can resolve their issues.
• Seven out of 10 view MTN’s customer service as good. Those in Cameroon, Congo Brazzaville, Guinea-Bissau and South Sudan rate our customer service at 70% or below.
• Pricing needs to be easy to understand, despite recent inroads in this regard.
What matters most to them1. Network performance (speed of data
connection and network quality).2. Customer service.3. Ability to resolve my queries or requests.4. Overall rates and prices.5. Pricing being easy to understand.
Our response:• Reduced the cost to communicate. • Zero-rated some fintech transactions through MoMo. • Invested R32.7bn in our networks.• Provided Xtratime airtime lending. • Accommodated the WFH trend, offering higher levels of online engagement while we
continue to achieve our ambition of connecting 200m people to the power of the internet.• Supported customers to connect to loved ones in Ukraine by waiving voice and data fees:
‘We listen. We care. We do.’• Launched refreshed brand early in 2022. • Held data privacy day for customers early in 2022.• Served differently abled customers: kept our hearing-impaired
customers connected. • Advanced financial inclusion through our fintech offerings.
77% (up 5.9pp since 2020)
How we engage:• Ongoing meetings and webinars. • Ad hoc community visits.• Quarterly stakeholder days.• Trade shows and activations.
Improvement
Purchase competitive and reliable products and services.
Stakeholders’ sentiment on how we engage(measured by the quality of our engagement score)
MTNers
What matters most to them1. Positive impact of leadership,
communication and diversity actions.2. Their belief and connection to the goals and
objectives of MTN.3. Safeguarding their health and wellbeing.
How we engage:• Frequent ‘Pulse’ surveys to gauge and
support the critical sentiments of MTNers.
• Annual MTN Group Culture Audit (GCA) survey conducted by independent third-party service providers.
• Staff ‘Open sessions’. • ‘Conversations’ letters.• CEO podcasts.• Regular online meetings within
departments.
Provide skills required to deliver on our strategy and belief.
We achieved an average participation rate of 66%.
78% Improvement
Stakeholders’ sentiment on how we engage(measured by the Sentimeter survey)
Our response:• Entrenched smart-working through principles such as ‘anytime work, anywhere
workplace’ and ‘balanced work-life’. Our programmes capitalise on the movement towards a digital-adopter mindset and flexi-workforce.
• Encouraged MTNers to explore their career options and learning paths to ensure their skillset remains relevant. Provided learning opportunities to employees in the language of their choice through access to our online learning platform.
• Offered a programme to help employees find their unique work and life balance.• Rewarded employees for their hard work on ‘Global Pay Day’: the day of annual results
release when MTNers receive bonuses.• Marked our gratitude on ‘Global Appreciation Week’. • Held regular ‘no meetings Wednesdays’. • Continued to offer financial aid through the ‘MTN Global Staff Emergency Fund’
during COVID-19.• Gave employees a ‘Wellness week’ of leave.
Doing for tomorrow, today
Doing for shared value
Strategic and financial review
Governance and remuneration
31
Integrated Report 2021
Relationships on which we rely to create value continued

COVID-19 continued to impact lives and livelihoods, with the Delta and Omicron variants dominating infections in 2021. By year-end, we had mourned the loss of 30 of our people since the pandemic began. Some markets saw rapid increases in cases and tighter lockdown restrictions. We heeded the call by the Africa Union to support its efforts to bring vaccines to our markets amid high degrees of global vaccine inequity.
Vaccination rates increased, with ~15% of all Africans fully vaccinated by 4 April 2022 .̂ Africa needs to vaccinate ~70% of her people by end-2022. Increased vaccination rates will help keep people healthier, contribute to a return to normality in our social and professional lives as well as improve overall economic activity.
Social
• Partnered with AU in #OneMorePush campaign to encourage people to not give up the fight.
• Made R486m in donations, including to AU and CACOVID for vaccines.
• Supported delivery of 1.5m doses to 14 countries.
• Approved mandatory vaccination policy for staff.
• Adopted hybrid working policy; enforced strict workplace safety protocols.
• Extended MTN Global Staff Emergency Fund.
• Provided support through various Y’ello Hope initiatives (see SR ), including zero-rating some MoMo transactions.
Commercial Network and supply chain
• Added 3 566 3G, 9 158 4G and 849 5G radio sites, including 912 new rural sites.
• Ensured headroom in our core data networks at peak utilisation of ~27% in Nigeria, ~26% in South Africa and ~35% in Ghana.
• Continued to progress upgrades to meet demand.
• Implemented supply chain resilience programme to review the impact of unpredictable events. This defined pre-emptive actions to minimise the impact of operations.
In the year, we continued to manage the impact of COVID-19 by focusing on four key areas:
Funding and liquidity
Note: ^ Africa Centres for Disease Control and Prevention.
■ Data traffic ■ Fintech
Data traffic and fintech transaction volumesQ
1 1
9
Q2
19
Q3
19
Q4
19
Q1
20
Q2
20
Q3
20
Q4
20
Q1
21
Q2
21
Q3
21
Q4
21
Ea
sin
g o
f re
stri
ctio
ns
Sta
rt o
f C
OV
ID-1
9
COVID-19 at MTN at 1 April 2022 Vaccines at MTN at 1 April 2022
Total cases
5 341Active cases
49Recoveries
5 262Deaths
30Fully vaccinated
~67%1 dose
~6%
• Sustained the resilience of our balance sheet, repaying R20bn in debt, including reducing dollar debt by US$800m.
• Ensured liquidity headroom of R54.1bn.
• After 2020’s sharp rise, our commercial voice and data trends remained resilient in 2021.
• Group data traffic grew by 53.3%: MTN Nigeria +85.3%; MTN South Africa +58.3%; MTN Ghana +54.9%.
• Group fintech transaction volumes grew 41.1% to 10bn. Fintech transaction value grew 56.8%.
Doing for tomorrow, today
Doing for shared value
Strategic and financial review
Governance and remuneration
32
Integrated Report 2021
Doing more in the fight against COVID-19
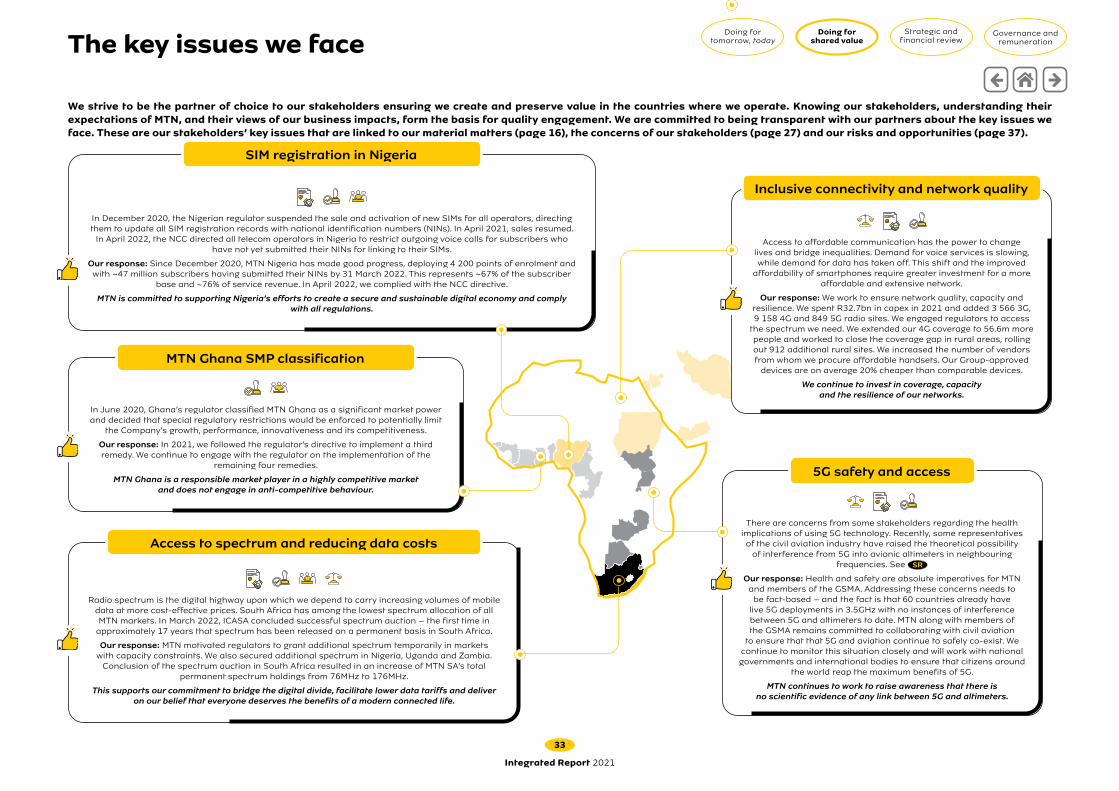
In December 2020, the Nigerian regulator suspended the sale and activation of new SIMs for all operators, directing them to update all SIM registration records with national identification numbers (NINs). In April 2021, sales resumed.
In April 2022, the NCC directed all telecom operators in Nigeria to restrict outgoing voice calls for subscribers who have not yet submitted their NINs for linking to their SIMs.
Our response: Since December 2020, MTN Nigeria has made good progress, deploying 4 200 points of enrolment and with ~47 million subscribers having submitted their NINs by 31 March 2022. This represents ~67% of the subscriber
base and ~76% of service revenue. In April 2022, we complied with the NCC directive.
MTN is committed to supporting Nigeria’s efforts to create a secure and sustainable digital economy and comply with all regulations.
In June 2020, Ghana’s regulator classified MTN Ghana as a significant market power and decided that special regulatory restrictions would be enforced to potentially limit
the Company’s growth, performance, innovativeness and its competitiveness.
Our response: In 2021, we followed the regulator’s directive to implement a third remedy. We continue to engage with the regulator on the implementation of the
remaining four remedies.
MTN Ghana is a responsible market player in a highly competitive market and does not engage in anti-competitive behaviour.
Radio spectrum is the digital highway upon which we depend to carry increasing volumes of mobile data at more cost-effective prices. South Africa has among the lowest spectrum allocation of all MTN markets. In March 2022, ICASA concluded successful spectrum auction – the first time in
approximately 17 years that spectrum has been released on a permanent basis in South Africa.
Our response: MTN motivated regulators to grant additional spectrum temporarily in markets with capacity constraints. We also secured additional spectrum in Nigeria, Uganda and Zambia.
Conclusion of the spectrum auction in South Africa resulted in an increase of MTN SA’s total permanent spectrum holdings from 76MHz to 176MHz.
This supports our commitment to bridge the digital divide, facilitate lower data tariffs and deliver on our belief that everyone deserves the benefits of a modern connected life.
We strive to be the partner of choice to our stakeholders ensuring we create and preserve value in the countries where we operate. Knowing our stakeholders, understanding their expectations of MTN, and their views of our business impacts, form the basis for quality engagement. We are committed to being transparent with our partners about the key issues we face. These are our stakeholders’ key issues that are linked to our material matters (page 16), the concerns of our stakeholders (page 27) and our risks and opportunities (page 37).
There are concerns from some stakeholders regarding the health implications of using 5G technology. Recently, some representatives of the civil aviation industry have raised the theoretical possibility
of interference from 5G into avionic altimeters in neighbouring frequencies. See SR
Our response: Health and safety are absolute imperatives for MTN and members of the GSMA. Addressing these concerns needs to
be fact-based – and the fact is that 60 countries already have live 5G deployments in 3.5GHz with no instances of interference between 5G and altimeters to date. MTN along with members of the GSMA remains committed to collaborating with civil aviation
to ensure that that 5G and aviation continue to safely co-exist. We continue to monitor this situation closely and will work with national governments and international bodies to ensure that citizens around
the world reap the maximum benefits of 5G.
MTN continues to work to raise awareness that there is no scientific evidence of any link between 5G and altimeters.
Access to affordable communication has the power to change lives and bridge inequalities. Demand for voice services is slowing, while demand for data has taken off. This shift and the improved
affordability of smartphones require greater investment for a more affordable and extensive network.
Our response: We work to ensure network quality, capacity and resilience. We spent R32.7bn in capex in 2021 and added 3 566 3G, 9 158 4G and 849 5G radio sites. We engaged regulators to access
the spectrum we need. We extended our 4G coverage to 56.6m more people and worked to close the coverage gap in rural areas, rolling out 912 additional rural sites. We increased the number of vendors from whom we procure affordable handsets. Our Group-approved
devices are on average 20% cheaper than comparable devices.
We continue to invest in coverage, capacity and the resilience of our networks.
Inclusive connectivity and network quality
SIM registration in Nigeria
5G safety and access
MTN Ghana SMP classification
Access to spectrum and reducing data costs
Doing for tomorrow, today
Doing for shared value
Strategic and financial review
Governance and remuneration
33
Integrated Report 2021
The key issues we face

Our earnings per share have been negatively impacted by our exit from MTN Yemen and MTN Syria in the last year. While we had planned an orderly exit from MTN Syria, issues with the government complicated our efforts to do so, and we had to abandon the operation in August 2021. We are currently in discussions with several parties to
accelerate our exit from MTN Afghanistan.
Our response: The remaining Middle East operations will remain part of the Group until they have been fully exited. We realise that our decision to exit will have
implications for customers in those markets. We are working closely with our key stakeholders to ensure a smooth transition. Our next phase of exiting the Middle East
will focus on MTN Iran.
MTN is committed to an orderly exit.
MTN relies on its information to provide services to customers, and as such, security of information is fundamental to our daily operations and success.
Cyber-attacks, or DDoS (distributed denial of service) attacks, have negatively impact us and our customers, when they do occur. In 2022, our Liberian
operating company sued Orange over damages caused by cyber-attacks on its network from 2015 to 2017.
Our response: Our information security team ensures cybersecurity controls are implemented by all our operating companies this includes cyber crisis
management plans. To strengthen our cybersecurity defences, we streamlined the deployment, configuration, and management of endpoint security across the
Group. We also focus on security awareness across all our employees.
MTN is committed to securing the information of MTN and its customers.
Cyber-attacks
MTN protects the rights of all people using our services in the respective jurisdictions in which we operate. In 2021, there have been some human
rights incidents that have been raised by stakeholders. This includes MTN eSwatini, which switched off internet services in its operating
country in June 2021 following a government directive.
Our response: We believe in the rights of all people to communicate, access, and share information freely and responsibly, and to enjoy
privacy and security regarding their data and their use of digital communications. MTN attempts to avoid negative human rights impacts
by exploring possible alternatives where it identifies a risk of these rights being infringed. Where operating conditions render it impossible
to meet this commitment fully, we will seek opportunities to limit the scope, extent, or duration of any negative impacts. In MTN eSwatini’s
case, it carefully assessed the request in line with its licence conditions and our digital human rights due diligence framework. It then engaged
government stakeholders to end the shutdown as soon as possible.
MTN strives to conduct business in a way that is respectful of the rights of all people.
Human rights
Planned exit from the Middle East
Doing for tomorrow, today
Doing for shared value
Strategic and financial review
Governance and remuneration
34
Integrated Report 2021
The key issues we face continued
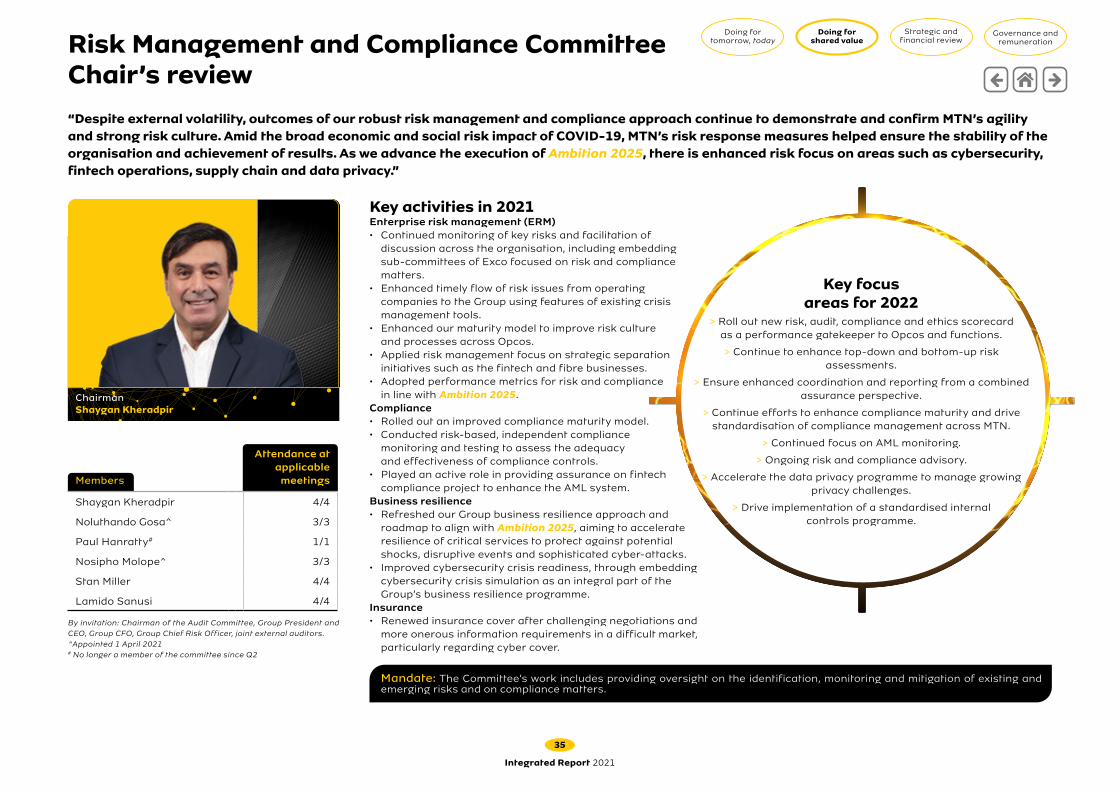
Members
Attendance at applicable
meetings
Shaygan Kheradpir 4/4
Noluthando Gosa^ 3/3
Paul Hanratty# 1/1
Nosipho Molope^ 3/3
Stan Miller 4/4
Lamido Sanusi 4/4
By invitation: Chairman of the Audit Committee, Group President and CEO, Group CFO, Group Chief Risk Officer, joint external auditors.^Appointed 1 April 2021# No longer a member of the committee since Q2
“Despite external volatility, outcomes of our robust risk management and compliance approach continue to demonstrate and confirm MTN’s agility and strong risk culture. Amid the broad economic and social risk impact of COVID-19, MTN’s risk response measures helped ensure the stability of the organisation and achievement of results. As we advance the execution of Ambition 2025, there is enhanced risk focus on areas such as cybersecurity, fintech operations, supply chain and data privacy.”
Mandate: The Committee’s work includes providing oversight on the identification, monitoring and mitigation of existing and emerging risks and on compliance matters.
Key activities in 2021 Enterprise risk management (ERM)• Continued monitoring of key risks and facilitation of
discussion across the organisation, including embedding sub-committees of Exco focused on risk and compliance matters.
• Enhanced timely flow of risk issues from operating companies to the Group using features of existing crisis management tools.
• Enhanced our maturity model to improve risk culture and processes across Opcos.
• Applied risk management focus on strategic separation initiatives such as the fintech and fibre businesses.
• Adopted performance metrics for risk and compliance in line with Ambition 2025.
Compliance• Rolled out an improved compliance maturity model.• Conducted risk-based, independent compliance
monitoring and testing to assess the adequacy and effectiveness of compliance controls.
• Played an active role in providing assurance on fintech compliance project to enhance the AML system.
Business resilience• Refreshed our Group business resilience approach and
roadmap to align with Ambition 2025, aiming to accelerate resilience of critical services to protect against potential shocks, disruptive events and sophisticated cyber-attacks.
• Improved cybersecurity crisis readiness, through embedding cybersecurity crisis simulation as an integral part of the Group’s business resilience programme.
Insurance• Renewed insurance cover after challenging negotiations and
more onerous information requirements in a difficult market, particularly regarding cyber cover.
Chairman Shaygan Kheradpir
Key focus areas for 2022
> Roll out new risk, audit, compliance and ethics scorecard as a performance gatekeeper to Opcos and functions.
> Continue to enhance top-down and bottom-up risk assessments.
> Ensure enhanced coordination and reporting from a combined assurance perspective.
> Continue efforts to enhance compliance maturity and drive standardisation of compliance management across MTN.
> Continued focus on AML monitoring.
> Ongoing risk and compliance advisory.
> Accelerate the data privacy programme to manage growing privacy challenges.
> Drive implementation of a standardised internal controls programme.
Doing for tomorrow, today
Doing for shared value
Strategic and financial review
Governance and remuneration
35
Integrated Report 2021
Risk Management and Compliance Committee Chair’s review

How we manage risk
Principal risk universe and risk appetiteA key component of enterprise risk management (ERM) entails the use of a focused principal risk universe. In the first instance, the risk universe provides a two-tiered risk categorisation that enables uniform mapping of risk issues across all Opcos for bottom-up integration and consistency. From the top-down perspective, the principal risk universe guides management to achieve completeness of risk identification. The principal risk universe is dynamic and is periodically reviewed to reflect changes in strategy, organisation and operations.
The organisation’s risk appetite philosophy and statements are operationalised by applying risk preferences to each principal risk. This helps guide the articulation of mitigations and resource planning. Furthermore, key risk indicators (KRIs) with tolerance levels are developed for principal risks to further embed and operationalise the Board’s risk appetite guidance. The graphic below shows the current universe underpinning ERM.
We use risk appetite and tolerance levels with business planning and decision, aligning with a continuously evolving business and to ensure that we are not exposed to risk levels
beyond our defined risk preference levels while in pursuit of delivery of Ambition 2025. Our focus in 2022 will be to further mature our risk
management capability.
Combined assuranceMTN undertakes a combined assurance approach to optimise and enhance the level of risk, governance and control oversight of risk management. The combined assurance model ensures that all assurance activities provided by internal and external assurance providers adequately address material risks facing the Group (see page 76).
Our top risksWe take an enterprise-wide approach to risk management which defines the processes and practices in place across MTN for management to proactively identify and manage risks and opportunities that impact strategic and operational objectives. We view risk management as a core competency by embedding a risk culture supported by top-down and bottom-up processes, ensuring completeness, proportionality to our business and the robustness of mitigating actions. This results in a profile of the most material risk issues based on residual risk. Residual risk considers the likelihood of events occurring, the impact should these materialise and the effectiveness of existing mitigations and controls.
MTN’s Board and its sub-committees oversee an integrated risk management process through regular engagement with management across a wide scope of activities to ensure the effectiveness of risk management. Opco-level risks are discussed at Opco exco and Opco audit and risk committees.
Compliance managementIn 2021, we continued to enhance our compliance programme in line with Ambition 2025. We developed a new compliance maturity model, which assisted our Opco compliance functions to evolve to a more mature state. Risk-based, independent compliance monitoring and testing was conducted to assess the adequacy and effectiveness of compliance controls and adherence to all compliance obligations. We established a focused control improvement programme, which serves to enhance MTN’s control environment.
Stress testing and scenario planning
In addition to using risk categories and principal risks to achieve completeness
of risk identification, as part of proactive forward-looking risk
management we have incorporated stress testing and catastrophic scenario planning exercises into the process. Stress test scenarios are applied to different elements of the budgeting process at an Opco and MTN Group level, with high-level mitigations developed for each scenario. Examples of
catastrophic scenarios considered include: a dramatic depreciation of
a key market currency; difficulties in renewal of licences or nationalisation
in key markets; failure of a major network supplier; a cyber-attack crippling
large parts of the network; and technology disruption leading to a more rapid move away from voice to data/digital.
Governance• Compliance• Internal control environment• Fraud and financial crime• Governance• Social and ethics
• Human capital• Environmental• Reputation, branding and marketing
Operational• Supply chain• Sales and distribution• Customer experience• Continuity risk
Principal risk
categories
External• Competition• Legal• Political and macroeconomy
Financial• Financial markets• Liquidity and funding• Tax• Financial accounting and reporting• Credit risk• Financial performance and returns
Strategic• Strategy and execution• Regulatory and stakeholders• Products and innovation (telco, digital, fintech)• M&A, divestitures, and strategic partnerships
Technology• Network• Information technology• Information security
Business resilienceWe refreshed our Group business resilience approach to align with Ambition 2025. It aims to accelerate resilience of critical services, to protect against potential shocks, disruptive events and sophisticated cyber-attacks and includes:
• Improved cybersecurity crisis readiness, through embedding cybersecurity crisis simulation as an integral part of the Group business resilience programme and minimum controls requirement for all Opcos and completing exco-level cybersecurity crisis simulations in 10 Opcos.
• Supply chain crisis contingency planning to mitigate the impact of a global semi-conductor shortage on critical projects.
• Coordination of COVID-19 response activities, including facilitating the rollout of the mandatory COVID-19 vaccination policy.
Robust risk management remains the mainstay of our business and underpins operational excellence.
Doing for tomorrow, today
Doing for shared value
Strategic and financial review
Governance and remuneration
36
Integrated Report 2021

2021 2020
1 Increased regulatory pressure 1
2 Challenging political and macroeconomic conditions 2
3 Increased tax-related uncertainty 9
4 Cyber and information security risks 7
5 Liquidity and funding 5
6 Supply chain 4
7 Strategy and execution 8
8 Compliance 6
9 Environmental, social and governance issues New
10 Network and spectrum cost and availability 10
Operational risksFinancial r
isks
Gove
rnance risks
Tech
no
log
y ri
sks
Stra
tegic risk
s
External risks
10
4
6 5
3
7
1
2
9
8
Risk profile
Our 2021 risks
Top risks to value creationDoing for
tomorrow, todayDoing for
shared valueStrategic and
financial reviewGovernance and
remuneration
37
Integrated Report 2021

RankingPrincipal risk and risk
issuesDoing through
mitigation and controlsDoing in 2021
2021
1
2020
1
Principal risk: RegulatoryIncreasing regulatory pressureMTN operates in multiple jurisdictions that require compliance with wide-ranging laws and regulations. These include licence obligations; regulatory prescriptions; sanctions laws; capital importation and repatriation stipulations; data privacy prescriptions; cross-border data flow restrictions; quality of service (QoS) performance indicators; SIM registration and Know Your Customer (KYC) requirements. These continue to increase and are often elevated by economic conditions in the markets in which we operate.
The timeous availability of adequate, suitable and affordable spectrum and technology-neutral licensing of spectrum in our operating market is critical. It is vital that spectrum that was identified for 5G in the ITU’s 2019 World Radio Communication Conference be made available as soon as possible to ensure speedy deployment of 5G networks. The slow pace of achieving 5G policy certainty in our ecosystem is a key risk issue.
In 2021 we noted ongoing regulatory pressures in key markets in areas such as subscriber registration, tax, data privacy and market dominance.
• Targeted stakeholder engagement on regulatory issues.
• Proactive engagement with key stakeholders to secure renewal of operating licences on the best possible commercial, technical and financial terms.
• Active engagement with industry bodies such as the GSMA and its subgroups for guidance and best practice in relation to spectrum, EMF, excessive fees, QoS.
• Adherence to localisation and regulation obligations.• Concerted regulatory and industry advocacy.• Strict compliance with laws and regulations and
continuous enhancement of compliance testing programmes.
• Support from the Group including advice, guidance and research on key risk issues and events to mitigate risk and ensure the effective resolution of issues.
• Continued capacity building and development of tools, e.g., playbooks and knowledge share.
• Proactive engagement with stakeholders on the release of 5G spectrum and the repurposing of spectrum bands where services have become obsolete.
• Regulators in Uganda and Zambia conducted consultations on 5G spectrum in 2021, paving the way for 5G deployment. Markets such as eSwatini, Cameroon and Côte d’Ivoire displayed movement in terms of discussions around securing 5G spectrum.
• Further developed support frameworks, including one for stakeholder management.
• MTN Nigeria was awarded 3.5GHz spectrum for deployment of 5G.
• MTN Ghana complied with regulated significant market player remedies.
• MTN Zambia was licensed spectrum in the 800MHz and 2 100MHz bands.
• MTN South Africa secured approval for extension of provisional spectrum.
• Made submissions on proposed legislation and regulations and regimes in Nigeria, South Africa, Rwanda, Zambia, Ethiopia, eSwatini and Afghanistan.
• Completed licence renewals in Nigeria, Rwanda, Guinea-Conakry and Iran.
• Carried out a Group-wide assessment on readiness for 5G commercial launches.
• Worked with the GSMA to keep abreast of the 5G EMF safety ecosystem to ensure safety of our stakeholders (see SR ).
Opportunity Our environment allows us to proactively engage regulators and other industry stakeholders on traditional and emerging issues and thus improve our ability to comply with regulatory
requirements and have relationships to work more closely with regulators and policy makers.
Doing for tomorrow, today
Doing for shared value
Strategic and financial review
Governance and remuneration
38
Integrated Report 2021
Top risks to value creation continued

RankingPrincipal risk and risk
issuesDoing through
mitigation and controlsDoing in 2021
2021
2
2020
2
Principal risk: Political and macroeconomyChallenging political conditionsGeopolitical tensions have a direct impact on our business. The unlikely revival of the JCPOA continues to expose our Iran business to sanction laws. Heightened tensions in Afghanistan following the US exit and Taliban takeover particularly as it relates to women’s rights. Risks associated with terror attacks in Nigeria continue to weigh on consumer and business confidence and have a material impact on MTN. South Africa experienced a slower-than-expected economic recovery in the second half owing to social unrest and power outages.
Challenging macroeconomic conditionsMacroeconomic uncertainty including concerns around currency devaluation, inflation, rising debt service cost and increased scrutiny and investigations negatively impact investor confidence. Debt financing and capex commitments are often foreign denominated. Inherent volatility and long-term weakening trend of currencies in key markets impact Opco and Group profitability. Lack of currency availability in markets such as Nigeria impacts cash upstreaming to the Group which, in turn, has a negative impact on liquidity and debt ratios.
Although new COVID-19 infections in Africa declined from mid-2021 peaks amid tighter restrictions and a pickup in vaccinations, the modest economic rebound was fragile due to lingering uncertainties about the course of the pandemic. Financial markets remained weak in 2021. In South Africa, violent protests in July 2021 negatively impacted near-term growth.
• Proactive stakeholder management and engagement of relevant authorities on the impact of the pandemic on the business’s operations.
• Continuously monitor developments across politically and economically sensitive markets with scenario and sensitivity analysis to enhance response capabilities.
• Business resilience measures in place in each Opco.• Use of available instruments for forex hedging.• Strict compliance to laws and regulations.• Ensure sufficient levels of committed funding facilities
at Group to respond to market stress and maintain the Group’s approach of Opco self-funding.
• Ensure protection of staff and assets and continuity of operations through strong business continuity controls.
• Strict compliance with international sanctions laws.• Stress testing business plan against currency volatility
to understand impact on profitability, allowing for formulation of appropriate response measures including plans for adverse key currency fluctuations.
• Optimise levels of local versus foreign currency debt at the Holdco.
• Maximise local currency debt in Opcos to reduce forex risk.
• Ensure conversion of large contracts into local currencies where possible and financially prudent.
• Repatriation of dividends when possible.
• Established a COVID-19 response project to coordinate mitigation of all categories of risk impacted by the pandemic, especially financial and human capital risks. Mitigations included facilitation of vaccine rollouts, ongoing monitoring of economic developments, credit risk monitoring and financial stress testing.
• Supported, where possible, public-private partnerships and government initiatives that promote the socioeconomic welfare and growth of host countries.
• Enhanced business resilience maturity in line with targets.• Exited Syria and Yemen in line with our pan-African focus.• Ensured consistent use of political and economic scenario
analysis as an integral part of risk management and contingency planning process.
• Implemented enhanced issue and stakeholder management activities.
• MENA Opco staff performed extremely well in the face of severe challenges.
• Performed stress testing in respect of gearing ratios; completed stress testing of business plan for key currency volatility.
• Used cash-backed letters of credit in place of trade lines to reduce forex exposure and obligations on equipment importations.
• Continued use of hedging instruments for applicable foreign-denominated opex and capex.
Opportunity Develop a world-class business by capturing opportunities for innovation through addressing the macroeconomic challenges that face our markets.
This includes our segmented digital and fintech business offerings and fibre rollouts.
Doing for tomorrow, today
Doing for shared value
Strategic and financial review
Governance and remuneration
39
Integrated Report 2021
Top risks to value creation continued

RankingPrincipal risk and risk
issuesDoing through
mitigation and controlsDoing in 2021
2021
3
2020
9
Principal risk: TaxIncreased tax-related uncertaintyAs a prominent corporate citizen in many markets, MTN faces risks such as adverse changes in tax laws and regulations aimed at the sector. These lead to complex tax regimes that require robust programmes and resources to ensure full compliance and tax efficiency.
• Appropriate and convincing positions presented to the tax authorities.
• Making provisions where deemed necessary.• Once guidelines have been implemented, undertaking
random checks to ensure that these are implemented correctly.
• Implement control mechanisms that include documenting all tax planning and reviewing transactions regularly for changes in law and judicial interpretation. An effective tax risk management system through the application of our robust tax approach and policy.
• Enhanced structures at, and concerted support from, the Group on regulatory and tax issues. Participated in stakeholder consultations where tax regimes have been proposed to avoid, among others, the incidence of multiple taxation.
• Ensured robust revenue and tax management processes were in place and regularly consulted tax advisers to understand the impact of our operating environment. Where necessary, sensitised MTN stakeholders on this impact.
Opportunity Proactive tax readiness through enhanced data retention and management.
2021
4
2020
7
Principal risk: Information securityCyber and information security risksCybersecurity is a growing priority as cyber-attacks become more sophisticated. The uncertainty caused by the pandemic along with changes to the working environment increased the activity of cyber-criminals.
A cyber-attack aimed at MTN could lead to service interruption and the infringement of personal and confidential data. This could lead to significant business interruption and expose MTN to increased regulatory scrutiny and reputational damage.
• Ensure adequate monitoring and reporting on performance against milestones defined in the Group’s information security plan.
• Continue to strengthen our incident detection and response capability.
• Continue efforts to strengthen the security control environment.
• Review and enhance security governance and operational structures.
• Continued investment in the upgrade of the security environment across the organisation.
• Enhance playbooks for management of security crises.
• Continued implementation of strategic programmes to fast-track implementation of security capabilities.
• Continue to develop capabilities to address third-party security risk and compliance management.
• Refresh security approach in support of Ambition 2025 and the wider threat landscape.
• Met our 2021 information security plan targets. • Conducted a Board-level cybersecurity awareness engagement
session.• Concluded a three-year programme to fast-track
implementation of security capabilities.• Maintained consistent improvements in the annual Gartner/CEB
Secure Behavior Index evaluation, placing MTN above its industry peers.
• Continued security assessments on various MTN systems to proactively identify vulnerabilities requiring remediation.
• Established fintech security compliance management structures.
• Deployed various security detection, response and monitoring solutions.
Opportunity Deployment and optimisation of integrated and scalable security capabilities to drive a matured security posture.
Doing for tomorrow, today
Doing for shared value
Strategic and financial review
Governance and remuneration
40
Integrated Report 2021
Top risks to value creation continued

RankingPrincipal risk and risk
issuesDoing through
mitigation and controlsDoing in 2021
2021
5
2020
5
Principal risk: Liquidity and fundingIn addition to generating profitable returns, it is vital for our Opcos to generate sufficient cash and have optimal capital structures to fund capital-intensive programmes and repatriate earnings to the Group. An inability to secure debt at the local balance sheet level and repatriate earnings, due to factors such as inadequate market capacity, foreign currency availability and/or restrictive forex laws or sanctions, impacts our ability to keep adjusted Group leverage stable and increase distributions to shareholders. This may also lead to ineffective management of free cash flows due to an imbalance between revenue growth and capex intensity. Execution risk on ARP or an inability to secure sufficient liquidity for upcoming maturities will heighten refinance risk. Outstanding dividend payments from Iran and Nigeria remain key challenges.
Continued success in upstreaming in 2021, with flows exceeding budget and resulting in improved Holdco leverage. Strong signalling of improved financial stability and forex markets.
• Focus on attaining double-digit growth in constant currency service revenue as well as improving EBITDA margins.
• Continue to implement our smart capex agenda.• Proactive management of capex intensity.• Prioritise securing ARP proceeds to improve the
leverage at the Holdco and reduce forex volatility caused by excessive hard currency debt.
• Continue optimising the rand: dollar debt mix at the Holdco by reducing dollar debt.
• Proactive management and optimisation of the debt and maturity profile at the Holdco to mitigate refinance risk and ensure sufficient liquidity to meet the needs of the Group.
• Maximise local currency debt in Opcos for capex to optimise capital structure and reduce forex risk.
• Optimise excess cash balances in Opcos and cash upstreaming to the Group.
• Ensure that Holdco leverage remains within the target range.
• Maintain adequate and sustainable headroom, liquidity ratios and buffers to navigate through a liquidity stress event.
• Reduced Holdco leverage from 2.2x to 1.0x.• Improved the mix of dollar: rand debt at the Holdco from
48:52 at end-2020 to 41:59 at end-2021.• Focused on securing rand-denominated long-term debt at the
Holdco. Closed funding of R6.65bn, allowing us to refinance debt maturities and smooth our maturity profile.
• Reduced dollar debt at the Holdco by early redemption of US$500m of Eurobonds due in 2022.
• Continued to raise local currency debt in Opcos; closed funding transactions in Nigeria, Zambia and Rwanda.
• Secured upgrade by S&P of MTN’s standalone credit profile to ‘bbb-‘, from ‘bb+’.
• Concluded the sale of BICS; closed the sale of passive tower infrastructure in South Africa for R6.4bn in Q1 22.
• Reported Holdco liquidity headroom of R51.9bn.
Opportunity Continued success in upstreaming, with flows exceeding budget, will result in further improved Holdco leverage. It will also provide strong signalling of improved financial stability and forex
markets in the countries we operate in.
2021
6
2020
4
Principal risk: Supply chainSupply chain disruptions included a global shortage of semi-conductors critical to our operations. Suppliers were also affected by the energy crisis in India and COVID-19 restrictions globally. A multi-vendor approach is crucial for the sustainability of our operations.
Fallout from Russia-Ukraine conflict further impacts supply of rare earth materials for semi-conductors, chips and SIM cards and has as an inflationary impact on fuel and freight costs.
• Implement enhanced supplier risk management plan.• Enhance business resilience.• Enhance crisis management structures.• Continue to embed the supplier risk and concentration
approach framework.
• Implemented a supply chain resilience programme to review the impact of unpredictable events (such as COVID-19, Suez Canal blockage, semiconductor crisis). Defined pre-emptive actions on upstream supply chain, freight and commodities to minimise the impact on operations.
• Developed risk models and monitoring systems to support the supply chain resilience programme.
• Revised the terms of the Supplier Code of Conduct to cover aspects related to anti-money laundering, sanctions, trade compliance and anti-competitive practices.
• Strengthened the supplier onboarding process with addition of an information security section covering data breaches and privacy.
• Integrated control tower platform with order management systems of suppliers to monitor shipments in real time and intervene based on proactive alerts.
OpportunityDiversification of the supply chain and closer collaboration with suppliers to proactively understand supply chain challenges.
The telco industry depends on certain key suppliers. We continuously monitor our operations to detect a risk of disruption and take proactive measures to counteract these.
Doing for tomorrow, today
Doing for shared value
Strategic and financial review
Governance and remuneration
41
Integrated Report 2021
Top risks to value creation continued

RankingPrincipal risk and risk
issuesDoing through
mitigation and controlsDoing in 2021
2021
7
2020
8
Principal risk: Strategy and executionOperating across diverse markets and in a dynamic sector increases risks, such as failing to establish and/or embed a clear vision and direction for the Group; lack of buy-in; and failure to identify and exploit opportunities in chosen markets and domains. From an execution perspective, the realisation of complex strategic objectives (including fintech separation for example) requires robust programme and project management as well as flexible change management.
• An annual strategy and business planning process: Board strategic reviews in March/April; Board approval of strategic updates in June/July; Board budget approval in November.
• Comprehensive resource allocation and functional KPIs for strategic initiatives are formulated and tracked.
• Alignment of individual performance metrics with strategic objectives.
• Comprehensive communication plans to rollout strategic intent.
• Well-established capital projects management.
• Ensured that Ambition 2025 was well embedded.• Entrenched monthly Exco priority programme tracking and
reporting on 17 strategic programmes, ensuring tight management and delivery. Set up special steering committee governance structures to ensure delivery of all priority programmes.
• Made sure that the Ambition 2025 risk universe and related mitigations were well understood.
• Progressed structural separation processes: fintech separation delivered and infraco separation due in 12 to 24 months.
• Focused on localisation: completed MTN Uganda IPO.• Worked on establishing and growing our strategic partnerships
to enhance our value propositions and our Africa footprint.• Progressed evolution of our talent base to deliver on
Ambition 2025.• Delivered exit of Syria and Yemen.
OpportunityA clear strategy, executed and governed in a coordinated manner, will enable MTN to build a future-fit organisation
focused on clear execution and shared value priorities toward delivering on Ambition 2025.
2021
8
2020
6
Principal risk: ComplianceOperational and compliance challengesThese risks result from the strategic challenge of standardising internal control maturity across decentralised Opcos with very different operating environments which need to be balanced with commercial agility. In addition, ongoing changes in the regulatory environment add pressure to the compliance environment. MTN has made good progress improving and standardising its control environment.
Areas of ongoing focus include the fast-growing fintech environment, subscriber registration requirements, credit risk management, information security controls and more demanding data privacy requirements.
• Continued focus on reviewing internal policies and procedures, as required, and developing new ones.
• Continuous enhancement and implementation of compliance maturity objectives and internal controls improvement plans.
• Ongoing monitoring of key compliance risks in Opcos.• Advanced risk management practices in most Opcos.• Further engagement with regulators to ensure clear,
concise and unambiguous regulatory requirements by first-line assurance functions.
• Focused on top compliance and combined assurance risk issues, as well as risk acceptance and escalation reporting.
• Implemented numerous new policies.• Achieved significant maturity improvements on ERM and
compliance programmes.• Completed increased compliance monitoring and testing
initiatives.• Continued to improve methodologies to adapt to future
changes. Passed various stages of alignment with MTN Group Data Privacy Policy and, where applicable, national data privacy legislation.
OpportunityDriving thought leadership of MTN’s compliance maturity through proactive and integrated strategies.
Doing for tomorrow, today
Doing for shared value
Strategic and financial review
Governance and remuneration
42
Integrated Report 2021
Top risks to value creation continued

RankingPrincipal risk and risk
issuesDoing through
mitigation and controlsDoing in 2021
2021
9
2020
–
Principal risk: ESGThe growing prominence of ESG in investor strategies, coupled with greater consistency of international ESG standards is cementing ESG as mainstream business concept influencing investment returns and corporate strategies.
There is an increased focus on cybersecurity, data privacy and internet shutdowns.
For MTN, climate change could disrupt our operations and the supply of our products and services. It is an especially disruptive time in the global transition from fossil fuels to renewables. The result will be both higher energy prices for consumers and a near-term policy collision with climate goals.
• Ensure MTN's Sustainability Strategic Framework is built into the culture and business strategy, both in terms of risks and opportunities across the organisation.
• Entrenching a culture of ethics in line with King IV™.• Understanding the evolving nature of ESG and building
resilience for both short and long-term material ESG issues for MTN.
• Achieved a step change in our approach to sustainability, with ESG at the core as part of embedding MTN's ESG Framework across the organisation.
• Furthered digital and financial inclusion, connecting 23 million more people to broadband and improved its affordability, with 15.3% average reduction in the data tariff across markets.
• Our social and economic contribution made a meaningful impact on lives and livelihoods in our markets, amounting to R115bn for 2021.
• Paid taxes of R11bn (up R8.4bn in 2020) in support of fiscal resources of the nation states.
• Invested R67bn in our networks, advancing fixed investment. • Supported the livelihoods, including job creation and skills
development, of six million people. • Continued to close the coverage gap in rural areas by rolling out
912 rural sites, expanding our coverage to 23 million more people in rural areas.
• Advanced our efforts to reach Net Zero emissions by 2040, including working closely with suppliers to reduce our scope 3 emissions.
• Ranked at 71st percentile by The Ethics Institute compared to 52 other organisations in Southern Africa.
• Advanced work to reach Net Zero emissions by 2040.• Secured significant upgrade in our ESG rating by FTSE Russell
and inclusion in the FTSE/JSE Responsible Investment Top 30 index.
OpportunityESG risks present the opportunity to collaborate as a company, empower and support our stakeholders, including driving deeper engagements with our investors to unlock long-term value.
Doing for tomorrow, today
Doing for shared value
Strategic and financial review
Governance and remuneration
43
Integrated Report 2021
Top risks to value creation continued

RankingPrincipal risk and risk
issuesDoing through
mitigation and controlsDoing in 2021
2021
10
2020
10
Principal risk: Network and spectrum cost and availabilitySpectrum cost and availabilityNon-availability of adequate spectrum has a direct impact on our QoS and our ability to deliver on our strategy. Increased cost of spectrum impacts the cost of our products and services and puts pressure on profit margins.
5G frequency bands interference with aircrafts’ altimeters and the potential ramifications to MTN for the suspension of certain bands continue to pose a threat.
NetworkNetwork performance and continuity is paramount to MTN’s success and disruptions can have a disastrous impact. During the pandemic this risk was elevated especially due to the risks of supplier disruptions. Adequate capacity planning to ensure MTN meets growing capacity demands is vital.
• Creating and maintaining an updated Exco-agreed spectrum plan that recognises traffic growth, technology uptake/maturity and existing and planned customer value propositions.
• Enhancing governance and compliance through annual revisions in the MTN Group spectrum policy and performance contracting between Opco regulatory and technical heads.
• Maximising efficiency of spectrum utilisation through reframing of existing allocations (licence permitting), frequent network hardware and software upgrades and effective handset capability management.
• Ensure frequency bands spectrum acquired falls within the range of 3.4GHz to 3.8GHz outside the frequency range of aircraft altimeters (4.2GHz to 4.4GHz).
• Adequate financial planning to ensure Opco capability/readiness to invest in new/further spectrum when available.
• Extensive QoS and network uptime measures in place.• Long-term network capacity planning aligned to
strategy.• Implementation of a network policy to provide
governing principles on the mandatory requirements for all network initiatives and ensure a consistent and standard way of work for networks throughout the Group.
• Proactively engaged with regulators on the cost and acquisition of spectrum.
• Engaged in broader government objectives and public interest issues including spectrum in South Africa through organisations such as GSMA.
• Provided proactive webinars and workshops to selected regulators and policy makers to promote understanding of the steps between identification and classification of spectrum bands and the awarding thereof through market-driven processes.
• Focused specifically on home connectivity (ensuring dedicated spectrum for non-mobile data traffic); and the 5G roadmap (analysing each Opco to identify the tactical approach to secure ideal 5G bands in timely and affordable manner).
• Secured extension of provisional spectrum for MTN South Africa.
• MTN Nigeria awarded 100MHz of 3.5GHz spectrum via auction for deployment of 5G in 2022.
• MTN Zambia acquired 2x10MHz on 800MHz spectrum and 2x5MHz on 2100Mhz spectrum for LTE coverage expansion and 3G capacity expansion.
• MTN Uganda acquired 2x1.8MHz on 900MHz spectrum and 2x5MHz on 1800MHz spectrum.
• MTN Nigeria renewed licence for 900MHz and 1 800MHz spectrum.
• In early 2022, MTN South Africa secured high-demand spectrum to support our 4G and 5G expansion drive (20MHz in the 800MHz band, 40MHz in the 2.6GHz band, 40MHz in the 3.5GHz band).
• Participated in industry groups such as ITU, GSMA and GSA to ensure that MTN’s strategy finds accommodation inside ITU World Radio Conference agenda items.
• Ensured that our networks performed well during the pandemic. Experienced no major disruptions despite major rise in data demand. Accelerated our investment when lockdown restrictions eased. Continued to expand the capacity of our networks.
OpportunitySharing spectrum with other operators to increase spectral resources utilised by MTN and improve our performance.
Doing for tomorrow, today
Doing for shared value
Strategic and financial review
Governance and remuneration
44
Integrated Report 2021
Top risks to value creation continued

Group Chief Financial Officer Tsholofelo Molefe, CA(SA)
Q
A
What were the highlights of MTN’s financial performance?
Under challenging trading conditions, MTN delivered strong results which were largely ahead of medium-term targets and demonstrated the business’s resilience and execution strength.
Service revenue grew by 18.3%* driven by our focus on industry-leading connectivity operations which produced solid voice and data revenue growth of 5.2%* and 36.5%* respectively. Voice was supported by well-executed customer value management initiatives and segmented propositions. Data continued to benefit from a surge in usage, which was supported by continued investment in our ‘second to none’ networks. Our Fibreco, MTN GlobalConnect, delivered a strong commercial performance to report growth in external revenue of 30.0%.
The results were also underpinned by our work to build the largest and most valuable platforms. Fintech revenue increased by 30.9%*, driven by more MoMo users and our progress towards more advanced services. Digital revenue was up by 22.8%*. Enterprise revenue grew by 13.4%*, benefiting from higher data usage through WFH solutions. Wholesale accelerated by 49.7%* on the back of strong national roaming at MTN SA.
Pleasing was the strong operating leverage that the business continued to demonstrate. EBITDA grew by 23.7%* with the EBITDA margin expanding by 2.2pp* to 44.5%*. Our results were supported by broad-based growth in our portfolio, including the larger operating companies and the benefits of our expense efficiency programme. All MTN SA’s business units achieved healthy growth, and both MTN Nigeria and MTN Ghana delivered increases in service revenue of more than 20% (see page 49).
Reported HEPS rose by 31.8%, impacted by a number of non-operational and once-off items. Adjusting for these, HEPS grew by 26.6%. The improvement in earnings also helped to drive further expansion in our adjusted ROE by 2.6pp to 19.6%.
A
We continued to build the resilience in our balance sheet and made substantial progress in deleveraging faster, with Holdco leverage improving to 1.0x from 2.2x. Group operating free cash flow (OpFCF) increased by 13.2% to R32.1 billion, benefiting from a good underlying EBITDA performance. Excluding licence and spectrum payments, the underlying growth in our OpFCF was 35.2%.
Is there room for more efficiencies ahead?
Our expense efficiency programme includes enhanced oversight of expenditure such as distribution, IT and network costs. In 2021 we realised R3.7 billion worth of efficiencies, mostly in the network, sales and distribution and general expense areas. Total savings included R1.4 billion, R0.9 billion and R0.3 billion from MTN Nigeria, MTN SA and MTN Côte d’Ivoire respectively.
We are pleased with the execution of the programme, containing overall costs across our markets. We continue to drive efficiencies in network and IT costs, sales and distribution. As we accelerate our ESG initiatives we will also realise savings through greater energy efficiency.
Having guided to a targeted savings of more than R5 billion over three years, off a 2020 baseline, we expect to realise further efficiencies of approximately R2 billion in the financial year ahead.
How is MTN tracking against the ARP and portfolio optimisation?
We advanced our ARP, with net proceeds of R4.1 billion in the year. IHS Towers, in which MTN Group now holds a 26% stake, listed and started trading on the NYSE – presenting a liquidity platform and future opportunities to monetise the asset. We also concluded, in early 2022, the sale of MTN SA’s passive tower infrastructure for anticipated net proceeds of R5.2 billion.
Q
Q
A
A
Doing for tomorrow, today
Doing for shared value
Strategic and financial review
Governance and remuneration
45
Integrated Report 2021
Q&A with the Group CFO

A
A
On the localisation front, we listed MTN Rwanda by introduction on the Rwandan Stock Exchange and sold down our ownership in MTN Uganda through an IPO process. We also reduced the Group stake in MTN Nigeria, in line with our stated intention, with net proceeds of R3.6 billion to flow in early 2022.
So far, in aggregate, we have delivered approximately R15.4 billion of the R25 billion ARP target set out in March 2020. Going forward, we aim to complete the next series in our sell down of MTN Nigeria during 2022 as well as executing on further localisations such as in MTN Ghana.
In terms of simplifying the portfolio and driving our strategic focus on pan-Africa, we made progress divesting the Middle East assets, with exits of Yemen and Syria during 2021. We continue to evaluate options to exit Afghanistan in an orderly manner (see page 72).
How was balance sheet resilience achieved and how will it be sustained?
We accelerated the deleveraging of the Holdco balance sheet, enabled by solid operational performance and cash flow generation, cash upstreaming, asset realisations and the prudent management of potential liabilities. At year-end, Group debt was R30.5 billion and our net debt-to-EBITDA ratio of 0.4x (from 0.8x at December 2020)remained well within our covenant limit of 2.5x.
We recorded a healthy liquidity position, with Holdco net debt of R30.1 billion down from R43.3 billion in December 2020. Our Holdco leverage was 1.0x (vs 2.2x in December 2020) – tracking well within our medium-term target of 1.5x. This was aided by R18.4 billion of cash repatriated from our operating companies – including R7.8 billion from Nigeria – as well as the ARP’s R4.1 billion net proceeds.
We optimised our debt mix, settling R21.5 billion of debt, including the early redemption of US$500 million in 2022 Eurobonds. This improved our non-rand to rand-denominated debt ratio at the
Holdco in line with our target to 41:59, from 48:52 in December 2020. Our prudent approach to liquidity management resulted in liquidity headroom of R54.1 billion at the end of FY 21.
In line with our disciplined capital allocation framework, which has guided our financial discipline, our focus going forward will remain on reducing our dollar debt faster and maximising the financial flexibility in our balance sheet to pursue our growth ambitions.
How will MTN’s financial position be shaped in 2022?
Our disciplined capital allocation framework guides our financial discipline at MTN. It prioritises investment in the growth of our core connectivity businesses and platforms as well as faster deleveraging of the Holdco.
As outlined by our Group President and CEO, we see structurally higher demand for our services. So, as we work to deliver accelerated growth across our operations and defend our ‘second-to-none’ networks and platforms position, investing appropriately in the capacity and resilience of our networks and technology platforms will be crucial. On current currency assumptions, we plan to invest R34.4 billion in 2022. Importantly, as the business continues to grow over the medium term, we will maintain an emphasis on capex intensity which we expect to decelerate in a range of 18% to 15%.
In ensuring that we have adequate resources to fund the structural growth in our markets, we will also continue to improve the Group’s risk profile, particularly through reducing the dollar debt and flattening our debt maturity profile. In pursuing this objective we aim to grow our free cash flow, with a focus on repatriating cash from our Opcos, as well as executing on our ARP and portfolio transformation.
As our medium-term guidance reflects the structural growth trends that we see in our markets, it also captures the emphasis on continuing to de-risk our balance sheet over the next three to five years.
Managing our working capital will be key as we preserve our balance sheet and liquidity position in challenging trading conditions. This will provide the Group with the financial flexibility to execute on Ambition 2025 priorities, including to drive growth, deleverage the Holdco balance sheet and unlock value.
Tsholofelo Molefe CA (SA)Group CFOFairland25 April 2022
Q
A
A
Q
A
Guided by our disciplined capital allocation framework
Return cash to shareholders through dividendsRevised MT dividend policy I Annual dividend declaration
Selective mergers and acquisitionsOpportunities aligned to the investment case, subject to strict risk and financial criteria
Share repurchases or special dividendsOnly considered when other capital allocation priorities have been met
Organic growthCapital Investment to grow networks and platforms I Licences/spectrum I Reducing capex intensity (between 18% to 15%)
Reduce leverageMaintain Holdco leverage within guidance levels I Focus on optimising debt, paying down no-ZAR debt
2
3
4
5
1
2
3
4
5
1
2
3
4
5
1
2
3
4
5
1
2
3
4
5
1
Doing for tomorrow, today
Doing for shared value
Strategic and financial review
Governance and remuneration
46
Integrated Report 2021
Q&A with the Group CFO continued
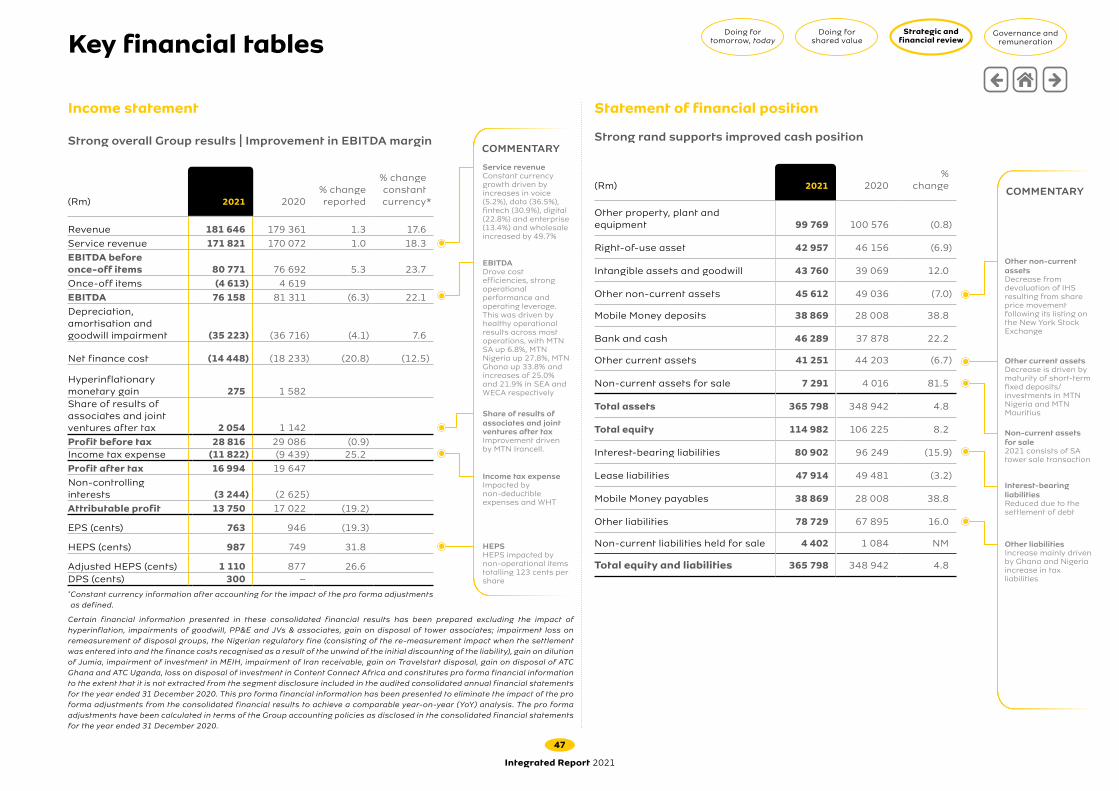
Statement of financial position
Strong overall Group results | Improvement in EBITDA margin
(Rm) 2021 2020% changereported
% change constant currency*
Revenue 181 646 179 361 1.3 17.6Service revenue 171 821 170 072 1.0 18.3EBITDA before once-off items 80 771 76 692 5.3 23.7Once-off items (4 613) 4 619EBITDA 76 158 81 311 (6.3) 22.1Depreciation, amortisation and goodwill impairment (35 223) (36 716) (4.1) 7.6
Net finance cost (14 448) (18 233) (20.8) (12.5)
Hyperinflationary monetary gain 275 1 582Share of results of associates and joint ventures after tax 2 054 1 142Profit before tax 28 816 29 086 (0.9)Income tax expense (11 822) (9 439) 25.2Profit after tax 16 994 19 647Non-controlling interests (3 244) (2 625)Attributable profit 13 750 17 022 (19.2)
EPS (cents) 763 946 (19.3)
HEPS (cents) 987 749 31.8
Adjusted HEPS (cents) 1 110 877 26.6DPS (cents) 300 –* Constant currency information after accounting for the impact of the pro forma adjustments as defined.
Income statement
COMMENTARY
COMMENTARY
Service revenue Constant currency growth driven by increases in voice (5.2%), data (36.5%), fintech (30.9%), digital (22.8%) and enterprise (13.4%) and wholesale increased by 49.7%
Income tax expense Impacted by non-deductible expenses and WHT
HEPSHEPS impacted by non-operational items totalling 123 cents per share
Strong rand supports improved cash position
(Rm) 2021 2020%
change
Other property, plant and equipment 99 769 100 576 (0.8)
Right-of-use asset 42 957 46 156 (6.9)
Intangible assets and goodwill 43 760 39 069 12.0
Other non-current assets 45 612 49 036 (7.0)
Mobile Money deposits 38 869 28 008 38.8
Bank and cash 46 289 37 878 22.2
Other current assets 41 251 44 203 (6.7)
Non-current assets for sale 7 291 4 016 81.5
Total assets 365 798 348 942 4.8
Total equity 114 982 106 225 8.2
Interest-bearing liabilities 80 902 96 249 (15.9)
Lease liabilities 47 914 49 481 (3.2)
Mobile Money payables 38 869 28 008 38.8
Other liabilities 78 729 67 895 16.0
Non-current liabilities held for sale 4 402 1 084 NM
Total equity and liabilities 365 798 348 942 4.8
Other liabilitiesIncrease mainly driven by Ghana and Nigeria increase in tax liabilities
Other non-current assetsDecrease from devaluation of IHS resulting from share price movement following its listing on the New York Stock Exchange
Interest-bearing liabilitiesReduced due to the settlement of debt
EBITDADrove cost efficiencies, strong operational performance and operating leverage. This was driven by healthy operational results across most operations, with MTN SA up 6.8%, MTN Nigeria up 27.8%, MTN Ghana up 33.8% and increases of 25.0% and 21.9% in SEA and WECA respectively
Share of results of associates and joint ventures after tax Improvement driven by MTN Irancell.
Other current assetsDecrease is driven by maturity of short-term fixed deposits/ investments in MTN Nigeria and MTN Mauritius
Non-current assets for sale2021 consists of SA tower sale transaction
Certain financial information presented in these consolidated financial results has been prepared excluding the impact of hyperinflation, impairments of goodwill, PP&E and JVs & associates, gain on disposal of tower associates; impairment loss on remeasurement of disposal groups, the Nigerian regulatory fine (consisting of the re-measurement impact when the settlement was entered into and the finance costs recognised as a result of the unwind of the initial discounting of the liability), gain on dilution of Jumia, impairment of investment in MEIH, impairment of Iran receivable, gain on Travelstart disposal, gain on disposal of ATC Ghana and ATC Uganda, loss on disposal of investment in Content Connect Africa and constitutes pro forma financial information to the extent that it is not extracted from the segment disclosure included in the audited consolidated annual financial statements for the year ended 31 December 2020. This pro forma financial information has been presented to eliminate the impact of the pro forma adjustments from the consolidated financial results to achieve a comparable year-on-year (YoY) analysis. The pro forma adjustments have been calculated in terms of the Group accounting policies as disclosed in the consolidated financial statements for the year ended 31 December 2020.
Doing for tomorrow, today
Doing for shared value
Strategic and financial review
Governance and remuneration
47
Integrated Report 2021
Key financial tables

Higher cash generated from operations due to better performance across the Group
(Rm) 2021 2020%
change
Cash generated from operations 88 670 78 580 12.8
Dividends received from associates and joint ventures 554 608 (8.9)
Net interest (paid)/received (10 984) (12 271) 10.5
Tax paid (10 954) (8 404) (30.3)
Cash generated by operating activities 67 286 58 513 15.0
Acquisition of property, plant and equipment and intangible assets (35 225) (30 180) (16.7)
Movement in investments and other investing activities 4 272 (3 332) NM
Cash used in investing activities (30 953) (33 512) 7.6
Dividends paid to equity holders of the Company – (6 462) 100.0
Dividends paid to non-controlling interests (2 084) (2 093) 0.4
Other financing activities (24 095) (5 150) NM
Cash used in financing activities (26 179) (13 705) (91.0)
Cash movement 10 154 11 296 10.1
Cash and cash equivalents at the beginning of the year 30 636 21 607 41.8
Effect of exchange rates and net monetary gain (1 895) (2 143) 11.6
Cash classified as held for sale 124 (124) NM
Cash and cash equivalents at the end of the period 39 019 30 636 27.4
Selected cash flow information
COMMENTARY
Tax paidThe increase is predominantly as a result of this high profit compared to prior year.
Dividends paid to equity holders of the CompanyNo dividend declared in 2020
Other financing activitiesDriven by net repayment of debt and settlement of lease obligations of about R6 billion
Cash generated from operationsIncrease was driven by a strong operational performance across our markets
Doing for tomorrow, today
Doing for shared value
Strategic and financial review
Governance and remuneration
48
Integrated Report 2021
Key financial tables continued
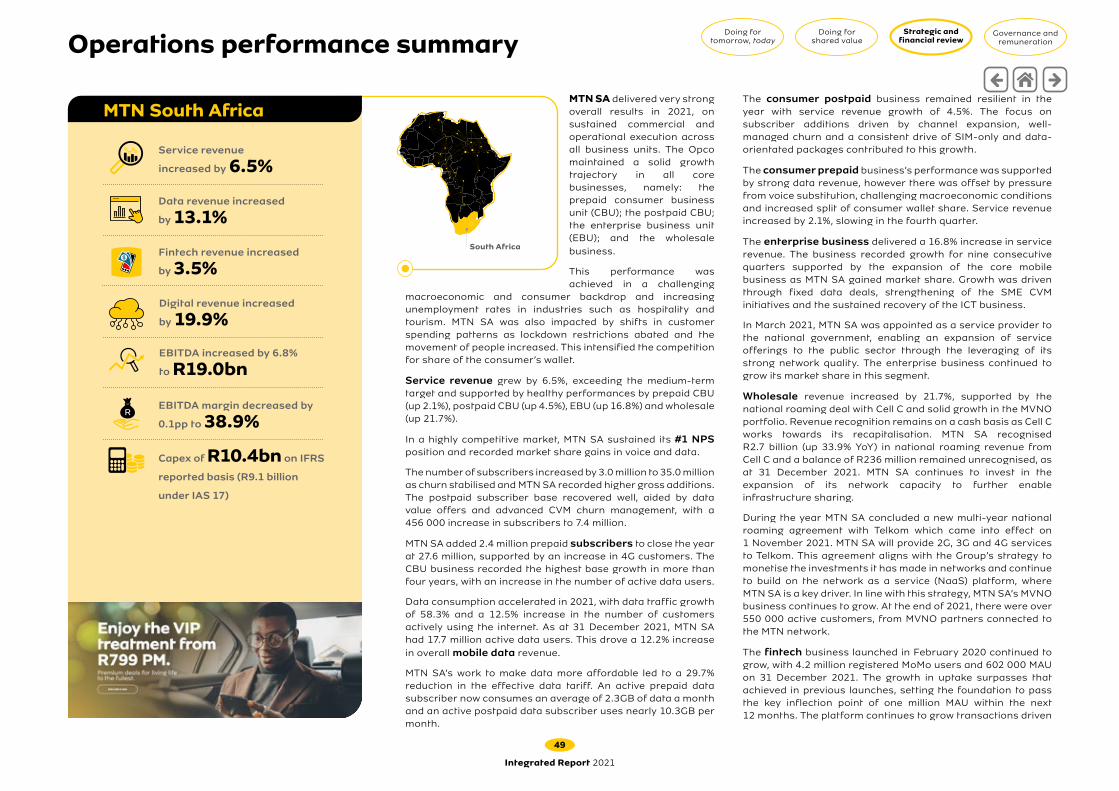
Service revenue
increased by 6.5%
Data revenue increased
by 13.1%
Fintech revenue increased
by 3.5%
Digital revenue increased
by 19.9%
EBITDA increased by 6.8%
to R19.0bn
EBITDA margin decreased by
0.1pp to 38.9%
Capex of R10.4bn on IFRS
reported basis (R9.1 billion
under IAS 17)
R
MTN South AfricaMTN SA delivered very strong overall results in 2021, on sustained commercial and operational execution across all business units. The Opco maintained a solid growth trajectory in all core businesses, namely: the prepaid consumer business unit (CBU); the postpaid CBU; the enterprise business unit (EBU); and the wholesale business.
This performance was achieved in a challenging
macroeconomic and consumer backdrop and increasing unemployment rates in industries such as hospitality and tourism. MTN SA was also impacted by shifts in customer spending patterns as lockdown restrictions abated and the movement of people increased. This intensified the competition for share of the consumer’s wallet.
Service revenue grew by 6.5%, exceeding the medium-term target and supported by healthy performances by prepaid CBU (up 2.1%), postpaid CBU (up 4.5%), EBU (up 16.8%) and wholesale (up 21.7%).
In a highly competitive market, MTN SA sustained its #1 NPS position and recorded market share gains in voice and data.
The number of subscribers increased by 3.0 million to 35.0 million as churn stabilised and MTN SA recorded higher gross additions. The postpaid subscriber base recovered well, aided by data value offers and advanced CVM churn management, with a 456 000 increase in subscribers to 7.4 million.
MTN SA added 2.4 million prepaid subscribers to close the year at 27.6 million, supported by an increase in 4G customers. The CBU business recorded the highest base growth in more than four years, with an increase in the number of active data users.
Data consumption accelerated in 2021, with data traffic growth of 58.3% and a 12.5% increase in the number of customers actively using the internet. As at 31 December 2021, MTN SA had 17.7 million active data users. This drove a 12.2% increase in overall mobile data revenue.
MTN SA’s work to make data more affordable led to a 29.7% reduction in the effective data tariff. An active prepaid data subscriber now consumes an average of 2.3GB of data a month and an active postpaid data subscriber uses nearly 10.3GB per month.
The consumer postpaid business remained resilient in the year with service revenue growth of 4.5%. The focus on subscriber additions driven by channel expansion, well-managed churn and a consistent drive of SIM-only and data-orientated packages contributed to this growth.
The consumer prepaid business’s performance was supported by strong data revenue, however there was offset by pressure from voice substitution, challenging macroeconomic conditions and increased split of consumer wallet share. Service revenue increased by 2.1%, slowing in the fourth quarter.
The enterprise business delivered a 16.8% increase in service revenue. The business recorded growth for nine consecutive quarters supported by the expansion of the core mobile business as MTN SA gained market share. Growth was driven through fixed data deals, strengthening of the SME CVM initiatives and the sustained recovery of the ICT business.
In March 2021, MTN SA was appointed as a service provider to the national government, enabling an expansion of service offerings to the public sector through the leveraging of its strong network quality. The enterprise business continued to grow its market share in this segment.
Wholesale revenue increased by 21.7%, supported by the national roaming deal with Cell C and solid growth in the MVNO portfolio. Revenue recognition remains on a cash basis as Cell C works towards its recapitalisation. MTN SA recognised R2.7 billion (up 33.9% YoY) in national roaming revenue from Cell C and a balance of R236 million remained unrecognised, as at 31 December 2021. MTN SA continues to invest in the expansion of its network capacity to further enable infrastructure sharing.
During the year MTN SA concluded a new multi-year national roaming agreement with Telkom which came into effect on 1 November 2021. MTN SA will provide 2G, 3G and 4G services to Telkom. This agreement aligns with the Group’s strategy to monetise the investments it has made in networks and continue to build on the network as a service (NaaS) platform, where MTN SA is a key driver. In line with this strategy, MTN SA’s MVNO business continues to grow. At the end of 2021, there were over 550 000 active customers, from MVNO partners connected to the MTN network.
The fintech business launched in February 2020 continued to grow, with 4.2 million registered MoMo users and 602 000 MAU on 31 December 2021. The growth in uptake surpasses that achieved in previous launches, setting the foundation to pass the key inflection point of one million MAU within the next 12 months. The platform continues to grow transactions driven
South Africa
Doing for tomorrow, today
Doing for shared value
Strategic and financial review
Governance and remuneration
49
Integrated Report 2021
Operations performance summary

by innovative and relevant solutions – such as airtime, electricity, gaming, e-commerce and e-government services.
MTN SA achieved EBITDA of R19.0 billion (up 6.8% YoY) with an EBITDA margin of 38.9%. Share price appreciation had a significant impact on the IFRS 2 expenses recorded by MTN SA. Excluding these impacts, MTN SA would have recorded EBITDA growth of 13.8% with a margin of 41.4%, within the medium-term guidance range.
This 2.4pp* YoY EBITDA margin improvement resulted from a solid service revenue performance and the successful execution of the expense efficiency programme. MTN SA improved device gross margins through the optimisation of device subsidies, which contributed 0.5pp to the EBITDA margin expansion.
The profitability of the business was supported by a strong operational performance. Profit after tax (PAT) of R4.7 billion was up 82.1%, also benefiting from lower finance costs and operational improvements. MTN SA’s adjusted free cash flow grew to R8.3 billion (up 32.1%) on the back of EBITDA growth and improvement in working capital.
MTN SA sustained the best network quality in South Africa, as shown in both customer and independent measures over the course of 2021. MTN SA has now maintained this leadership position for three years in a row. The Opco maintained its #1 network NPS through most of the year, with a clear focus on accelerating 5G, launched in June 2020. MTN SA currently has over 1 000 5G sites across several spectrum bands, with plans to significantly scale up should it be allocated 3 500MHz high-demand spectrum.
Network availability and leadership came under some pressure in Q4 due to increased frequency in electricity outages and MTN SA is rolling out a comprehensive resilience plan aimed at maintaining network leadership.
MTN SA was announced as a 2022 Top Employer in South Africa. The Top Employers Institute programme certifies organisations based on the participation and results of their HR Best Practices Survey. Being certified as a Top Employer showcases an organisation’s dedication to a better world of work and exhibits this through excellent HR policies and people practices.
MTN SA’s outlook will continue to be shaped by the macroeconomic conditions in the country and the impact on consumer behaviour. In this regard, there is increased pressure in the consumer prepaid business, particularly for lower-income customers impacted by job losses. MTN SA is accelerating its high growth business areas, with ongoing emphasis on the overall expense efficiency programme to deliver EBITDA and cash flow growth.
Doing for tomorrow, today
Doing for shared value
Strategic and financial review
Governance and remuneration
50
Integrated Report 2021
Operations performance summary continued

Digital adoption in Nigeria continues to accelerate as customers use more digital products and services, a trend accelerated by COVID-19. As a result, digital revenue grew by 91.5%* as the active user base grew and penetration of our digital products deepened. The active user base rose by 162.1% to 7.5 million led by instant messaging platform ayoba, with active users up 172.9% to approximately 3.8 million.
Enterprise business performance was underpinned by the onboarding of new customers across key segments and the uptake of enhanced services. As a result, service revenue from MTN Nigeria’s enterprise business was up by 10.9%*. Pleasingly, the implementation of the new pricing framework for USSD services will pave the way for full recovery of the outstanding debts.
On the costs side, MTN Nigeria made good progress with its expense efficiency programme realising R1.4 billion in cost savings, representing a 1.5pp* margin impact. However, the continued effects of naira depreciation on lease rental costs, acceleration in site rollout, and ongoing COVID-19-related expenditure resulted in operating expenses increasing by 21.7%*. Despite this, MTN Nigeria’s ability to drive operating leverage drove EBITDA growth of 27.8%* and a 2.0pp* expansion in EBITDA margin to 53.0%*.
MTN Nigeria sustained higher demand for data, which extended beyond the usage spikes seen during COVID-19 lockdowns. This drove acceleration of capex investment. As a result, capex in the period was up by 27.7%* to R14.9 billion, as MTN Nigeria ramped up investment in its network to capture growth through service quality leadership and aggressive coverage expansion, focusing on the 4G network.
MTN Nigeria deployed 9 336 4G sites representing approximately 75% of the total sites deployed during the period, reflecting solid data revenue growth.
Free cash flow was up by 21.1%*, substantiating the quality of MTN Nigeria’s accelerated investment. Capex under IAS 17 was R11.1 billion, with capex intensity remaining within target levels at 18.5%*.
Service revenue grew by 23.2%* despite the 10.6% decline in MTN Nigeria’s subscriber base. Data continued to lead service revenue growth, supported by voice, fintech and digital service.
Voice revenue grew by 8.0%* due to higher usage in the active SIM base, resulting in a 7.9% growth in minutes of use. This was supported by the success of customer value
management (CVM) initiatives, reducing the impact of SIM registration and activation restrictions in H1 and network restrictions in some locations towards the end of 2021.
In addition, MTN Nigeria continued to ramp up gross connections through our rural telephony initiatives while expanding our customer acquisition points, further supporting growth in voice revenue.
MTN Nigeria’s data revenue rose by 55.3%*, maintaining an accelerated growth trajectory in Q4 as it continued to accelerate the expansion of our 4G coverage, enhance the quality and capacity of its network to support increasing data traffic, and grow active data users.
Average MB per active user rose by 62.7%, enabling overall data traffic growth of 85.3%. Also, smartphone penetration on the network grew by 4.0pp to 50%. MTN Nigeria’s 4G network now covers 70.3% of the population, up from 60.1% in December 2020.
Fintech revenue rose by 57.0%* due to sustained growth in the use of Xtratime and broader fintech services by customers. MTN Nigeria expanded its MoMo agent network, through its one distribution strategy, with the addition of over 374 000 registered agents bringing the total number to approximately 770 000, up 94.8%. As a result, transaction volume rose by 167.0% to 137.5 million from an active user base of 9.4 million, up 102.0%.
Service revenue
increased by 23.2%*
Data revenue increased
by 55.3%*
Fintech revenue increased
by 57.0%*
Digital revenue increased
by 91.5%*
EBITDA grew by 27.8%*
to R31.9bn
EBITDA margin increased by
2.0pp* to 53.0%*
Capex of R14.9bn on
IFRS 16 reported basis
(R11.1 billion under IAS 17)
Nigeria
R
MTN Nigeria
Doing for tomorrow, today
Doing for shared value
Strategic and financial review
Governance and remuneration
51
Integrated Report 2021
Operations performance summary continued

Digital revenue increased
by 6.6%*
on the back of revenue growth and effective implementation of expense efficiencies.
MTN Rwanda demonstrated its resilience through the year, delivering strong service revenue growth of 24.0%*. The uplift in service revenue was supported by solid fintech revenue growth (up 65.4%*) driven by growth in the active base, data revenue (up 18.8%*) and voice revenue (up 12.1%*). The Opco delivered EBITDA margin of 47.6%*, down 1.2pp, impacted mainly by higher cost of sales as a result of increased interconnect and fintech costs.
The rest of the SEA portfolio also reported a pleasing set of results for the year, with MTN Zambia and MTN South Sudan growing at a double-digit rate. A positive operating leverage was achieved in the year with service revenue growing ahead of costs in most markets. Disciplined cost containment measures across the region supported a 1.0pp* YoY expansion in the blended SEA portfolio EBITDA margin to 46.3%*.
Our associate investment in eSwatini has also delivered strong results for the year, driven by data and fintech; both supported by the underlying penetration into the base (smartphone penetration of 57% and MoMo penetration of 58.6%).
In the year, MTN’s SEA region weathered persistently challenging trading conditions including the ongoing health crisis, slow economic recovery and higher inflation to yield double-digit top-line growth across most markets. This result was achieved on the back of strong growth in data and fintech revenue. Total subscribers increased by 2.2 million to 35.1 million.
MTN Uganda recorded service revenue growth of 9.3%*. This was supported by an uplift in data revenue (up 22.5%*) which was driven by sustained growth in the base and usage and fintech revenue (up 10.0%*) as basic services continued to grow steadily. Voice revenue (up 3.4%*) came under some pressure in H2 due in part to revised offerings that provided more value to customers, particularly during lockdown periods. Despite the challenging conditions in the market, MTN Uganda’s EBITDA margin expanded by 1.8pp* to 51.3%*
Service revenue
increased by 22.5%*
Data revenue increased
by 39.5%*
Fintech revenue increased
by 22.6%*
Digital revenue declined
by 39.2%*
Data revenue increased
by 43.6%*
Fintech revenue increased
by 32.9%*
Digital revenue increased
by 6.6%*
The WECA region recorded a decent performance for the year, supported by double-digit growth across most Opcos as well as an expansion of the subscriber base. The solid performance was brought about by the work that was carried out to accelerate data and fintech revenue in the year.
Service revenue growth of 18.4%* was well in excess of the blended inflation (8.0%) of the region. The continued momentum in the year on the expense efficiency programme which delivered cost optimisation resulted in most WECA Opcos improving their EBITDA margins for the year. The aggregate EBITDA margin of WECA increased by 1.2pp* to 40.3%*. Total subscribers increased by 4.5 million to 68.1 million.
MTN Ghana delivered a solid result, as the country began its recovery from COVID-19 impacts. The resilience of the business and diligent execution of Ambition 2025 commercial initiatives led to service revenue growth of 28.6%*. This performance was boosted mainly by data (up 56.1%*) and fintech (up 37.3%*) as the Opco drove increased digital and financial inclusion in the year. The EBITDA margin increased by 2.3pp* to 55.0%*.
MTN Côte d’Ivoire’s ongoing base growth, segmented marketing approach and aggressive sales and distribution led to service revenue growth of 9.0%*. The positive result was supported by growth in data revenue (up 41.4%*) and fintech revenue (up 5.0%*). The EBITDA margin rose by 0.1pp* to 34.8%*.
MTN Cameroon reported service revenue growth of 16.4%* in a challenging environment where the Opco continues to have leading market share. This was supported by focused value propositions which led to growth in data (up 34.8%*), fintech (up 35.0%*) and digital (up 47.6%*) revenue. The EBITDA margin for MTN Cameroon expanded by 2.6pp* to 34.6%*.
Overall, excluding MTN Ghana, the WECA markets grew service revenue by 12.5%* – compared to blended inflation of 5.3%, on the same basis – and reported a 0.6pp* decline in EBITDA margin to 30.6%*.
Guinea-Bissau
Guinea-Conakry
LiberiaCôte
d’Ivoire
Benin
Cameroon
Congo- Brazzaville
Ghana
SEA
WECA
South Sudan
Uganda
Rwanda
Botswana
Zambia
eSwatini
Service revenue increased
by 18.4%*
Doing for tomorrow, today
Doing for shared value
Strategic and financial review
Governance and remuneration
52
Integrated Report 2021
Operations performance summary continued
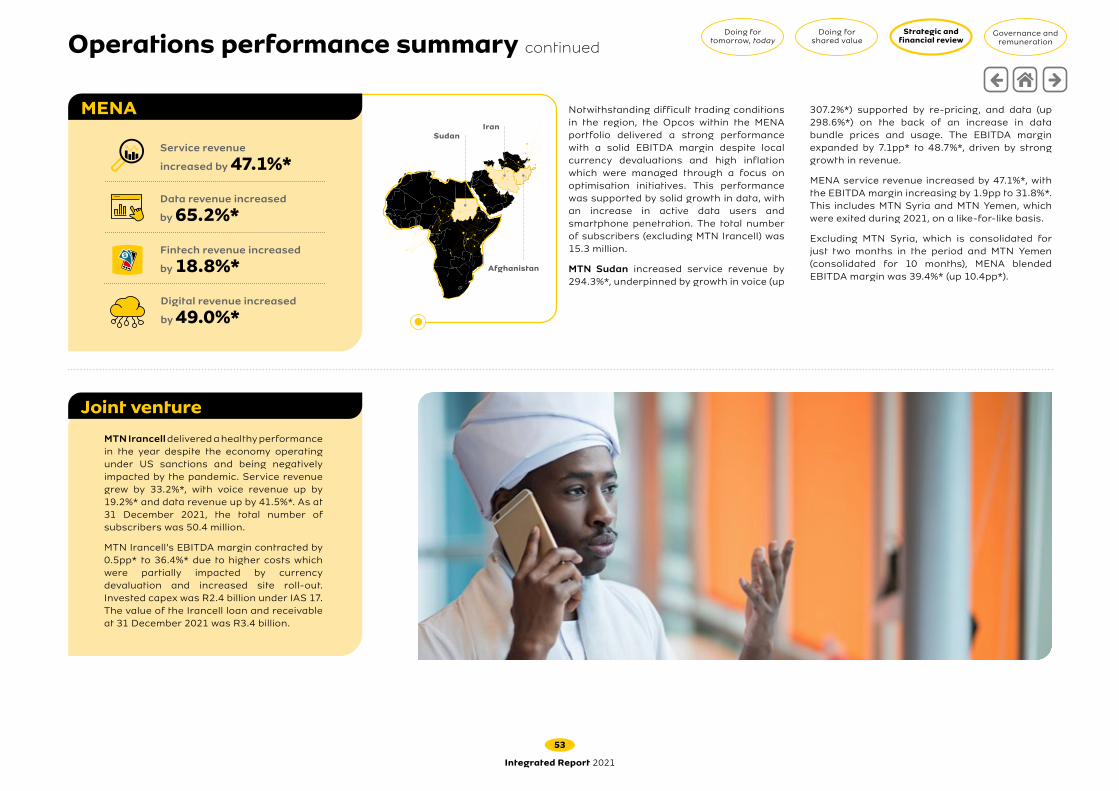
Joint venture
Service revenue
increased by 47.1%*
Data revenue increased
by 65.2%*
Fintech revenue increased
by 18.8%*
Digital revenue increased
by 49.0%*
MTN Irancell delivered a healthy performance in the year despite the economy operating under US sanctions and being negatively impacted by the pandemic. Service revenue grew by 33.2%*, with voice revenue up by 19.2%* and data revenue up by 41.5%*. As at 31 December 2021, the total number of subscribers was 50.4 million.
MTN Irancell’s EBITDA margin contracted by 0.5pp* to 36.4%* due to higher costs which were partially impacted by currency devaluation and increased site roll-out. Invested capex was R2.4 billion under IAS 17. The value of the Irancell loan and receivable at 31 December 2021 was R3.4 billion.
SudanIran
Afghanistan
MENA 307.2%*) supported by re-pricing, and data (up 298.6%*) on the back of an increase in data bundle prices and usage. The EBITDA margin expanded by 7.1pp* to 48.7%*, driven by strong growth in revenue.
MENA service revenue increased by 47.1%*, with the EBITDA margin increasing by 1.9pp to 31.8%*. This includes MTN Syria and MTN Yemen, which were exited during 2021, on a like-for-like basis.
Excluding MTN Syria, which is consolidated for just two months in the period and MTN Yemen (consolidated for 10 months), MENA blended EBITDA margin was 39.4%* (up 10.4pp*).
Notwithstanding difficult trading conditions in the region, the Opcos within the MENA portfolio delivered a strong performance with a solid EBITDA margin despite local currency devaluations and high inflation which were managed through a focus on optimisation initiatives. This performance was supported by solid growth in data, with an increase in active data users and smartphone penetration. The total number of subscribers (excluding MTN Irancell) was 15.3 million.
MTN Sudan increased service revenue by 294.3%*, underpinned by growth in voice (up
Doing for tomorrow, today
Doing for shared value
Strategic and financial review
Governance and remuneration
53
Integrated Report 2021
Operations performance summary continued

Members
Attendance at applicable
meetings
Sindi Mabaso-Koyana 6/6
Noluthando Gosa# 5/5
Paul Hanratty^ 1/1
Nosipho Molope# 5/5
Vincent Rague 5/6
Swazi Tshabalala 6/6
By invitation: Group President and CEO, Group CFO, Group Business Risk Officer, Group Internal Audit and Forensics Officer and joint external auditors#Member effective 1 April 2021^Ceased being a member 31 March 2021
“The Group remained resolute in its drive for continuous enhancements to its control environment as it builds and grows new platform businesses and accelerates its portfolio transformation to create shared value.”
Mandate: The Committee’s work includes monitoring the strength of the operational, financial and control processes. These include internal financial controls; ensuring that assurance services and functions enable an effective control environment; and supporting the integrity of information produced in compliance with legal and regulatory requirements.
Key features of 2021 • Evaluated progress of implementation of the Group’s enterprise
resource planning cloud process to improve the overall internal financial control environment. Numerous milestones achieved.
• Monitored transition processes for audit firm rotation, with EY becoming joint auditors, as well as oversight and evaluation of external audit function.
• Evaluated ongoing operational, financial and control risks posed by the pandemic and Group’s response and mitigation processes, including deleveraging and response activities.
• Considered financial impact and disclosure of corporate transactions in scope of Middle East exit plan, with Group exiting Syria and Yemen.
• Considered impact of MoMo business on control environment and monitored separation of MoMo business from GSM business.
• Evaluated progress on consolidation and standardisation of key controls to further enhance overall control environment.
• Focused on enhancing controls to reduce cyber risks, fraud risks and revenue leakage.
• Reviewed the internal financial controls for the purposes of the CEO and CFO attestation on the Annual Financial Statements required by the JSE.
• Executed its responsibilities in terms of the JSE Listings Requirements regarding corporate governance.
• Ensured that MTN establishes appropriate financial reporting procedures which, include the consideration of all entities included in the consolidated Group IFRS financial statements and that those procedures are operating to ensure that it has access to all the financial information of MTN to allow MTN to effectively prepare and report on the financial statements.
• Assessed the suitability of external auditors, internal audit, CFO and finance function.
Chair Sindi Mabaso-Koyana CA(SA)
AFS The full Audit Committee report is in the AFS.
Key focus areas for 2022> Monitor progress on implementation and standardisation of key controls to further enhance overall control environment.
> Assess progress on embedding internal control and compliance environment and governance and oversight functions resulting from
separation of FinCo businesses.
> Review progress on implementation of enterprise cloud solution across Group, including new FinCo businesses.
> Consider initiatives to improve specific security key controls over data privacy, cyber and fraud.
> Evaluate impact of anticipated tax changes in UAE as well as impact of Global Anti-Base Erosion Model Rules as part of
OECD’s Pillar Two solution.
Doing for tomorrow, today
Doing for shared value
Strategic and financial review
Governance and remuneration
54
Integrated Report 2021
Audit Committee Chair’s review

Members
Attendance at applicable meetingss
Paul Hanratty 4/4
Azmi Mikati^ 1/1
Sindi Mabaso-Koyana 4/4
Lamido Sanusi 4/4
Nkululeko Sowazi 4/4
Nosipho Molope 4/4
^Retired
“The committee had a busy year reviewing a large number of significant transactions and major contracts proposed by management. We remained comfortable with the quality of the input and proposals provided by management and were able to provide recommendations to the Board around the various matters considered, enabling the Board to fulfil its role in overseeing strategic execution.”
Mandate: The committee has over the last few years been in existence as an ad hoc committee. In 2021 it was formalised as a standing committee of the Board to assess all investment cases against a predetermined set of criteria to ensure the viability and feasibility of the investment. The focus is assessing the cost benefit analysis, considering key risks and the short and long-term environmental and social-economic impacts, ensuring the necessary mitigation controls are implemented. This includes requirements for capital expenditure, funding strategies and mergers and acquisition activities.
Key features of 2021 • Considered the extent and business implications of the Middle East
exits: › Syria › Yemen › Afghanistan
• Considered and approved: › The Nigeria, Ghana and Uganda localisation programmes › The Ethiopia new licence opportunity approach › The IHS Towers IPO › The MTN Uganda IPO
• Considered MTN Zakhele Futhi funding. • Provided oversight:
› On the various Opco licence renewals › On the execution of the SA towers disposal
process › Together with the Group Audit Committee on
various loan facility agreements › Together with the Group Risk and Compliance
Committee on the MTN SA spectrum auction • Ensured all the opportunities considered followed a strict
financial criteria and risk assessment in line with our disciplined capital allocation framework.
Chair Paul Hanratty
Key focus areas for 2022
• Remain committed to our disciplined capital allocation framework
• Consider selective M&A and business development opportunities, aligned to our investment case as well as
strict risk and financial criteria
• Review and approve the Group funding plan
• Oversee:
> The setup of the Group fintech holding company and its work to secure strategic partners to support the
accelerated growth of the business
> The structural separation of the fibre and data centre businesses
> The planned Series 2 public offer of shares in MTN Nigeria, should market conditions be conducive
> Further localisation of MTN Ghana
> The case for new market expansion opportunities
> The planned exit of the Group from Afghanistan
> Further Opco licence renewals
Doing for tomorrow, today
Doing for shared value
Strategic and financial review
Governance and remuneration
55
Integrated Report 2021
Finance and Investment Committee Chair’s review

Strategic priorities ObjectivesHow we measure success –
Ambition 2025Performance 2020 Performance 2021
Build the largest and most valuable platforms
Pivot from ‘product’ to ‘platform’ play
>20% platform revenue to service revenue contribution
7.6% 9.3%
100m MoMo users 46.4m 56.8m
100m ayoba users 5.5m 11.6m
Drive industry-leading connectivity operations
Doubling of consumer mobile data 200m active data users 111m 122m ‘Own the home’ +10m home broadband users Not tracked previously 1.9mLeading Fibreco in Africa Fibre footprint > 135 000km ~85 000km ~100 000kmDigital transformation | Step change in efficiencies and service levels
>R5bn of expense savings ~R2.0bn R3.7bn
Create shared value
Step change in ESG positioning of the Group Top quartile ESG ratings Improving, refer to page 79 Improving, see page 79Broad-based ownership and inclusion Localisations:across markets – MTN Nigeria (localise 35%) – 3.1% sold
– MTN Ghana (localise 25%) – –– MTN Uganda (localise 20%) – 13.1% sold– MTN Rwanda – Listed by introduction
Sentiment shift through stakeholder management efforts
MTN reputation 78.7% 79.6 %
Continuous growth in contribution to society Continue to contribute to society ~R105bn ~R115bnGHG emissions ~47% average reduction target
by 2030 and Net Zero by 204010% ~16%
Rural broadband 95% by 2025 Not tracked previously ~83%Diversity and inclusion 50% women representation by
2030– 39%
Accelerate portfolio transformation
Execute on ARP and reduction of leverage ARP proceeds >R25bn Delivered R4.3bn proceeds ~R12.8bn^
Middle East exit | Selective expansion in SSA Orderly exit of Middle East – Exited Syria and Yemen
Reveal and crystallise value of infrastructure assets and platforms
Fintech I Fibreco separation – In progress Q2: Fintech 2022 I Fibreco 2023
In 2021 we refreshed our strategy Ambition 2025 to shape the future of MTN. We disclosed KPIs – many of them new – that we will use to measure our performance aligned to our four strategic priorities. Although our strategic priority targets are for 2025, executive remuneration is dependent on delivery every year against annual goals towards achieving these 2025 KPIs. For more information, see page 83 to 119 for the Remuneration Report.
pg 63
pg 68
pg 71
pg 57
^ Anticipated R8.8bn to be received in 1H 22
Key: Achieved annual targets In progress
Pages 57 to 72 unpack our 2021 strategic performance in detail. As our refreshed strategy was only introduced in early 2021, it initially only comprised medium to long-term targets. Since then, we have created specific short-term focuses that will help us to monitor and ultimately reach our medium- to long-term targets.
Doing for tomorrow, today
Doing for shared value
Strategic and financial review
Governance and remuneration
56
Integrated Report 2021
Our strategic performance dashboard

We are building the largest and most valuable platforms that are distinctly African digital marketplaces for the widest variety of products and services. They are MoMo, ayoba, Enterprise Services, NaaS and Chenosis. These platforms are the drivers of innovation and growth. Some will be structurally separated as they scale within different regulatory domains, revealing and crystallising shared value for all stakeholders.
Relevant capitals
In Africa, financial services and e-commerce penetration is marginal. We see opportunity to accelerate digital disruption within financial services, insurance, lending, remittances, payments and e-commerce. We want to be Africa’s leading digital platform, unlocking economic growth through financial and digital solutions for consumers and businesses of all sizes. As we grow our service offering, we aim to create a marketplace that supports cashless and digital economies through affordable, inclusive, understandable and comprehensive financial services. We are playing a key role in the evolution of mobile financial services (MFS) to mobile financial platforms (fintech) by offering in-store payments, remittances, prepaid services, mobile wallets, micro-loans and micro-insurance. 17 of our markets offer fintech services.
Fintech
Relevant material matters
MM
2
MM
7
MM
3MM
4MM
1
MM
5
Done in 2021
10bn transaction volume
+41.1% YoY
Fintech revenue up
30.9% R15.9bn
56.8m MoMo users
+22.6%
24% of MTN airtime sales
+77.8%
US$239.4bn transaction value
+56.8% YoY
974k MoMo active agents
+21.5%
785k active merchants
+78.3%
US$13.3bn GMV
+66.5
6.4m
active users+67.4%
US$2.3bn +56.3%
US$1.1bn loan value
+47.4%
2.4m active users
6.3m active aYo policies
+5.6%
16.1m registered customers
TOTAL FINTECH TRANSACTIONS AND REVENUE
WALLET MERCHANT PAYMENT AND E-COMMERCE REMITTANCES INSURTECH
BANKTECH
Social capital
Intellectual capitalHuman capital Manufacturedcapital
Financial capitalNatural capital
Doing for tomorrow, today
Doing for shared value
Strategic and financial review
Governance and remuneration
57
Integrated Report 2021
Our strategic performance l Build the largest and most valuable platforms

• Obtained final approval of MoMo PSB licence to commence operations in Nigeria.
• Separate the Fintech business across the footprint; and secure strategic partners to support the acceleration of Group fintech.
• Accelerate our plans specifically MoMo, e-commerce, BankTech, InsurTech and remittances.
• Develop BankTech by deploying MoMoAdvance, Agent Advance and Merchant Advance as a suite of revolving credit products.
• Revamp the MoMo brand and its channels.• Launch MoMo in Nigeria, Sudan and South Sudan.• Support the acceleration of e-commerce.• Expand and refine our aYo product offering;
launch in Nigeria and Cameroon.• Receive GSMA mobile money certification in
eSwatini and renew certification in Uganda, Ghana and Cameroon.
Doing more in 2022
Although we planned to launch full MFS in several markets in 2021, we experienced some delays:• Sudan – launch planned in early 2022 after a
system migration from the central bank system to the Ericsson mobile money system.
• South Sudan – full licence for mobile money services granted in 2021, with launch planned for early 2022.
• Nigeria – regulatory approval granted in principle with a launch planned mid-2022.
How we are doing • 12 markets served through MoMo open API (2020: 10).
• 17 948 MoMo open API users (2020: 2 000): 17 000 developers and 948 partners in production.
• 785 000 merchants served through MoMoPay (2020: 440 000).
• 369m MoMoPay transactions (2020: 163m).• 8.2m MoMoPay unique users (2020: 3.8m).
In 2021, we supported customers through MoMoKash loans and our savings facility. Lending recovered to pre-pandemic levels and we grew our network of MoMo Kash partners, adding another lending partner in Uganda.• 7 markets served (2020: 7)• Average monthly disbursements: US$100m (2020:
US$77m)• Average daily loans 76 994 (2020: 58 000)
Our BankTech offering is building a full-service, cloud-based digitised financial services solution across our markets, leveraging MTN’s data and technology capabilities. As a first step, we launched MoMo Advance, available in Uganda and through which qualifying MTN MoMo customers can complete their transactions when they have insufficient funds in their MTN MoMo wallet through a revolving credit model. Providing affordable insurance through aYo.
MTN InsurTech offers device insurance products and life and funeral insurance. It provides quick access to insurance products integrated into our Mobile Money platforms to ensure safe, convenient payment of premiums and claims. In 2021 MTN and InsurTech had 16m customers enrolled in aYo (2020:11.3m), of which 6.6m were active. aYo provides simple, flexible, affordable insurance and hospital and life products in Uganda, Ghana, Zambia and Côte d’Ivoire. In South Africa,
MTN InsurTech offers a range of device insurance products as well as life and funeral insurance.
Remittances: People living in Africa can receive money and airtime from relatives in the UK through MTN Homeland, an instant, reliable and affordable service. Remittances cost as little as 3% of the value remitted. Through the launch of remittances in Guinea-Conakry and new partnerships, we now have 144 remittance corridors across eight countries. We now offer remittances from Uganda to China and India.
Strategic partnerships delivered in 2021
Fintech continued
We continued to develop solutions through e-commerce and transport platforms. In 2021, these included: • Implementing transport solutions in Liberia,
eSwatini and Cameroon with a pilot launched in Uganda. The solution digitised the routes of more than 2 500 taxi drivers.
• Developing an e-commerce platform in Ghana with key industry players: launch planned in 2022.
• Continuing to support the processing of social grant payments through MoMo in eSwatini.
Through MoMoPay, we offer small businesses a secure and efficient payment method that can be tailored to meet their needs. Merchants can sign up through various channels including self-onboarding. The MoMoPay API platform allows partners and vendors to integrate the MoMo platform into their own applications seamlessly.
In 2021, we recorded a record number of financial transactions facilitated by MoMo open API, which is live in 12 countries. New capabilities built into the MoMo open API platform include authentication and channel as a service. These will be rolled out across the footprint in 2022.
Doing for tomorrow, today
Doing for shared value
Strategic and financial review
Governance and remuneration
58
Integrated Report 2021
Our strategic performance l Build the largest and most valuable platforms continued

Ambition 2025 Performance 2020 Performance 2021
• 70% GSM base penetration
• Full offering in Nigeria (PSB)
• Expand in new markets
• 40% GSM base penetration
• MoMo Agent Banking in Nigeria
• MoMo in 16 markets +2 markets
• 46% GSM-based penetration
• PSB AIP in Nigeria
• Ready to launch MoMo: Sudan and South Sudan
• Grow and leverage MTN distribution
• Grow ecosystem and merchant network
• Digitise airtime sales
• Airtime distribution digitisation
• Accelerate informal merchant acquisition
• 15% of MTN airtime sold through MoMo
• Distribution transformation
• Roll-out of merchant self onboarding
• 24% of MTN airtime sold through MoMo
• Grow advanced services and recurring usages
• Partnership ecosystem growth
• New products launched
• Advanced services, 16% of MoMo revenue transactions
• 45m open API transactions from partners
• Launched MoMoBusiness
• Advanced services, 23% of MoMo revenue transactions
• 155m open API transactions from over 1k partners
• Launched MoMoAdvance
MoMo MAU (m)
4657
100
20
20
20
21
20
25
100
80
60
40
20
0
44,243,4
Merchants and agents (’000)
801
440785
974
3 000
2 000
20
20
20
21
20
25
■ Merchant ■ Agents
3 000
2 500
2 000
1 500
1 000
500
0
Transaction value (US$bn)
150239
750
20
20
20
21
20
25
800
600
400
200
0
Fintech ecosystem expansion
> Reach 100m active MoMo users.
> Achieve 20% Fintech contribution to MTN Group service revenue.
> Move to more advanced services offerings leveraging the wallet.
> Grow and expand beyond MTN customers and markets.
Doing more over the medium term
Fintech continued
Doing for tomorrow, today
Doing for shared value
Strategic and financial review
Governance and remuneration
59
Integrated Report 2021
Our strategic performance l Build the largest and most valuable platforms continued

• Develop MTN Play 2.0 digital marketplace as central destination for all MTN’s digital services including music, gaming and video while developing and expanding e-health and e-education products.
• Continue to upgrade the music homepage in ayoba.• Launch Mobucks, a self-service advertising platform
for small businesses.
Doing more in 2022
ayoba
11.6 millionactive monthly users (2020: 5.5 million)
17 live markets (2020: 16)
23 languages supported (2020: 22)
950 000 average active monthly channel users
26 000 average active monthly micro-app users
160 000 average monthly active gaming users
Launched iOS and progressive web app versions of ayoba
Voice and video calling is available in ayoba
MoMo is available as a micro-app in Ghana, while peer-to-peer transfers are now available in MTN Cameroon, Ghana, Uganda and Congo-Brazzaville
Bot functionality has been added to the ayoba app through a micro-app
Our instant messaging super app is our platform to harness Africa’s unique digital ecosystem. Launched in May 2019, ayoba is globally available with a focus on Africa and has been updated to include music, gaming, channels and money transfer services. It aims to break down barriers such as limited access to the internet and digital services, low smartphone penetration, lack of locally relevant content and affordability.
How we are doing
• Launched MoMo in the ayoba app in Congo-Brazzaville. • Voice and video call (VoIP) developed in ayoba.• ayoba is pre-loaded on devices in certain markets and
promoted within MyMTN app and youth value propositions.
• Allocated free data to customers to use ayoba features including messaging, gaming and music.
• Provided factual content on COVID-19 to 1.9m customers through channels in ayoba.
• Increased integration of MusicTime in ayoba in many markets.
• Achieved 450 000 average monthly MusicTime users.
MTN Mobile Money and our ayoba superapp are making doing business easier for entrepreneurs everywhere, supporting the development of their enterprises and the growth of economies in Africa.
Take Daniela Fosuhene, a shop owner in Angola in Kumasi, Ghana, some 250km northwest of Accra. She uses MoMo – tried and trusted in Ghana since 2011 – to manage her small retail business ‘Mega Dan Ventures’ and to make payments to her suppliers.
To enable her to explore other business opportunities she recently took a business loan with MoMo-Advance. She also wanted to reduce her risks, so she used MTN’s aYo insurance offering to insure herself.
“MoMo is such a fantastic service which I totally depend on for almost everything I do,” says Daniela. “Most importantly, it has given me a livelihood. It is easy to use, convenient, reliable and safe. Indeed, I can confidently call MoMo a lifesaver.”
Daniela uses MoMo to regularly send money to her children and other relatives. She also often shares ‘wisewords’ (a local ayoba content channel) with them.
Daniela is the leader of an ayoba group chat on which she and other small shop owners coordinate bulk purchases of products, so that they can share in the savings that buying this way affords.
Over the weekends, Daniela enjoys listening to one of ayoba’s church channels. When she is looking for quality entertainment, she also enjoys watching live events on ayoba.
ayoba
> Reach 100m active ayoba users by 2025.
Doing more over the medium term
Done in 2021
Doing for tomorrow, today
Doing for shared value
Strategic and financial review
Governance and remuneration
60
Integrated Report 2021
Our strategic performance l Build the largest and most valuable platforms continued

• Incubated the ‘Centre of Excellence’ in MTN South Africa, the nerve-centre of digital innovation within MTN, to address opportunities in managed networks, unified communications, cloud communication, internet of things and security-as-a-service.
• Provided SMEs with tailored propositions across our markets, focusing on mobile and fixed solutions that enable both voice and data connectivity.
• Continued to rollout enhanced segmentation models that provide richer insight into SME customer needs.
• Provided innovative and relevant connectivity and business productivity-led solutions for SMEs.• MTN SA delivered Enterprise growth of 14.4%, benefiting from increased data usage through
WFH solutions; fixed data deals, strengthening SME CVM initiatives and sustained recovery of the ICT business. MTN SA was also appointed as a service provider to the national government.
• MTN Nigeria grew Enterprise revenue by 10.4%*, supported by the expansion of the core mobile business.
• Supporting more than 4 million SMEs• MTN SA continued national roaming deal with Cell C.• MTN SA concluded new multi-year national roaming agreement with Telkom, effective
1 November 2021 to provide 2G, 3G and 4G services.
Managed networks• Business broadband and fibre
Unified communication• Fixed voice• Hosted communication services
Cloud communication• Cloud backup service• Data centre and web hosting
Security-as-a-service• Vulnerability assessments• Device and network security
Internet of things• Connected devices and
associated data analytics
How we are doing
• As the business enabler of choice in Africa, continuous investment is paramount to ensure that MTN’s Enterprise business solutions are able to meet the communication and ICT demands of business clients.
• Increase our reach to better serve SMEs.• Drive increased awareness of the MTN
Business brand. • Grow market share in the segment.• Continue to increase our reach to better
serve SMEs.
Doing more in 2022
In our plans for NaaS, we want to exploit monetisation opportunities for the active radio access network. We believe that in the long term, only two to three infrastructure-based national networks will be viable in most African markets. Marginal MNOs will need to adopt hybrid approaches that piggy-back on market leaders. MTN South Africa is leading national roaming in our portfolio.
Wholesale revenue increased by 21.7% to R6.0bn:
• MTN SA continued national roaming deal with Cell C.
• MTN SA concluded new multi-year national roaming agreement with Telkom, effective 1 November 2021
to provide 2G, 3G and 4G services.
Enterprise services
> R30bn revenue from Enterprise.
> Complete Centre of Excellence for converged services.
Doing more over the medium term
> Six national roaming deals.
> R7bn revenue target.
Doing more over the medium term
Done in 2021
Provided work-from-home propositions in 14 markets (2020: 14)
Increased Enterprise revenue by 13.4%*
Assisted by establishment of dedicated ‘Centre of Excellence’ focused on converged services solutions
Done in 2021
MTN's enterprise converged services
NaaS
Doing for tomorrow, today
Doing for shared value
Strategic and financial review
Governance and remuneration
61
Integrated Report 2021
Our strategic performance l Build the largest and most valuable platforms continued

Chenosis is Africa’s first cross-industry sector API marketplace for developers, start-ups and businesses. It provides a single platform to create, publish, discover and subscribe to APIs from across the continent. Available Open API products and services range from telecoms, e-health, e-government, IoT, Fintech, e-commerce, identity and authentication, payments and collections to location and more from a single marketplace.
We focused on exposing and monetising APIs from MTN operating companies, aiming to create new revenue streams and allowing Chenosis to scale its platform in a phased approach. To achieve this, we optimised the Chenosis operating model.
Chenosis partnered with a hyperscaler to support its evolution and growth. It also partnered with MTN GlobalConnect and MTN Nigeria to launch the first set of APIs and is in the process of onboarding four international partners to consume these.
How we are doing
• Growing the catalogue of APIs into other product lines.
• Opening the marketplace of APIs published by MTN operating companies to all developers, start-ups and enterprises.
• Launching into the wider open API pan-African marketplace with a cohort of third-party publishers to serve the potential continental marketplace of over one million enterprise developers.
Doing more in 2022
Chenosis – API marketplace
> Capture up to 20% to 35% of API market to become Africa’s number 1 API gateway.
Doing more over the medium term
Done in 2021
Currently working with several MTN
Operating companies to integrate and monetise their APIs.
In the process of onboarding four
international partners to consume these APIs
Doing for tomorrow, today
Doing for shared value
Strategic and financial review
Governance and remuneration
62
Integrated Report 2021
Our strategic performance l Build the largest and most valuable platforms continued

We continue to invest in our strong connectivity business: the important foundation and access to GSM subscribers that the platforms leverage. We focus on doubling consumer mobile data; owning the home; being the leading Fibreco in Africa; and achieving a step change in efficiencies and service levels. We aim to provide increased access; reducing the cost of communication of voice and data services; and advancing digital inclusion.
We drove industry-leading connectivity operations with
1.9m homes connected
Expanded our foot print to include
~100 000km proprietary owned fibre
R3.7bn inexpense efficiencies
+3.3% voice traffic
+ 2.9m to
272m subscribers
+36.5% data
revenue to R56.5bn
+5.2% voice revenue
to R82.4bn • Continue to execute the USME plan across our markets• Assess and select the most viable innovation opportunities to focus on unlocking voice
elasticity
• In 2020, we introduced a voice plan called ‘USME’ to increase the sustainability of voice services by boosting our offering. This complements our data-focused ‘CHASE’ framework. The development and implementation of both affirm our commitment to providing both data and voice services at affordable rates.
• Growth in voice subscribers of 2.9m to 272m, with traffic up 3.3%• Growth in integrated bundles to 14% penetration, helping protect voice usage by bundling
voice and data services together• As customer behaviour is shifting from voice usage to data usage, many customers own
multiple SIM cards and are looking for affordable voice offers. Though our Buzz Service, customers with zero or limited airtime balance can leave a missed call, prompting the other party to call back. The service has been well received across our markets and we will focus on scaling it further in 2022.
How we are doing
Doing more in 2022
VoiceDone in 2021
Relevant capitals Relevant material matters
MM
2
MM
7
MM
3MM
4MM
1
MM
5
Social capital
Human capital Manufacturedcapital
Financial capitalNatural capital
Even though global demand for voice services is declining as the industry shifts towards data, voice continues to provide a lifeline to customers where coverage gaps prevent the use of data-enabled services
Doing for tomorrow, today
Doing for shared value
Strategic and financial review
Governance and remuneration
63
Integrated Report 2021
Our strategic performance l Drive industry-leading connectivity operations

Data is the single largest structural growth opportunity in the next five years and the biggest source of revenue for MTN by 2025. Our data-driven approach and network modernisation has enabled strong subscriber growth and higher data usage
• In 2021, we reached 122m active data subscribers
Increased population coverage: • People covered by our 2G, 3G
and 4G networks increased as we added 9.6million, 14.5 million and 54.6 million respectively.
• People covered 2G = 89.6%; 3G = 82.8%; 4G = 68.3%.
• People reached by our coverage 589m (2G); 544m (3G) and 422m people (4G).
• Increased rural coverage to 23m people (2020: 8.5m).• Site roll out
› 2G: 2021: 3 196 (2020: 2 435) › 3G: 2021: 3 566 (2020: 3 342) › 4G: 2021: 9 158 (2020: 8 354) › 5G: 2021: 852 (2020: 150)
• Rapid rural rollout programme.
Increased smartphone penetration by enabling low-cost ownership and access of data-enabled devices:• Recorded 145.5 million
smartphones on our network (53.4% penetration of our customer base).
Increased data affordability and lowered barrier to entry for first-time data users:• Reduced effective data tariff by
15.3%.
Helped subscribers experience the benefits of data usage:• Increased data usage by 53.3%
(to average 6.4GB/user/month).
Continued digital literacy support through scaling of MTN Data-Smart content from GSMA:• Educated ~24m people on
digital literacy. Increased availability of digital literacy content through our flagship educational programme, MTN Data-Smart which is based on the GSMA Mobile Internet Skills Training Toolkit to improve people’s basic understanding of mobile internet and applications.
• Extended MTN Data-Smart to four more markets – Ghana, Zambia, eSwatini, Afghanistan – bringing to 12 the markets where we offer this.
• Trained 24m people in using internet services and accessing content primarily through digital channels. MTN Nigeria represented 18m of those trained. All training was provided at zero data cost to customers since Data-Smart is zero-rated. Customers are incentivised to complete the training through free data made available at the end of Data-Smart’s educational videos.
• Using new technologies: OpenRAN enables development and installation of 2G to 5G networks in previously unconnected areas; in 2021 we installed more than 700 (2020: 1 000) commercial network base station sites in rural areas.
• Network modernisation.
• Placed a total of 3.1m affordable 3G and 4G devices (2020: 2.5m) in customers’ hands.
• Increasing the number of vendors from whom we procure handsets and with whom we have agreements to ensure our customers can access after-sales service.
• Providing an onboarding data bundle for three to six months so customers can explore functionality of new smartphones.
• Offering MTN-approved devices that are 20% cheaper than comparable devices.
• Supporting device financing in Uganda and Ghana by partnering with M-KOPA. (In Uganda, customers receive 50MB of data when they make daily repayments.)
• Benchmarking: We developed a P.I.E. (price, income, elasticity) score to determine whether data pricing across our Opcos meets affordability guidelines of bodies such as the UN and ECOWAS. The UN says 1GB of mobile broadband data should cost 2% or less of gross national income per capita. MTN markets are within the UN recommended affordability range.
• MTN markets are within the UN recommended affordability range.
• 11 markets are within the UN recommended affordability range.
• Tailoring bundles: microbundles, social media bundles, XtraByte, P2P social data and digital products such as ayoba.
• Providing different customer groups with relevant value propositions: driving down cost to communicate and ensuring new users do not experience ‘bill shock’. In 2021, we introduced YouTube streaming bundles for entry-level customers.
Th
rou
gh
Ach
ieve
me
nts
Our data initiatives are enabled through the ‘CHASE’ framework: How we are doing
Doubling of data
CCoverage – Ensure
sufficient and affordable coverage in rural and low-income areas.
HHandsets – Increase
affordability and access to data-enabled devices.
AAffordability – Increasing data service affordability.
SService bundling – Create service offerings that are relevant, simple
and meaningful to customers.
EEducation and ease of access – Enhance digital literacy and ease with which data can be accessed.
Doing for tomorrow, today
Doing for shared value
Strategic and financial review
Governance and remuneration
64
Integrated Report 2021
Our strategic performance l Drive industry-leading connectivity operations continued
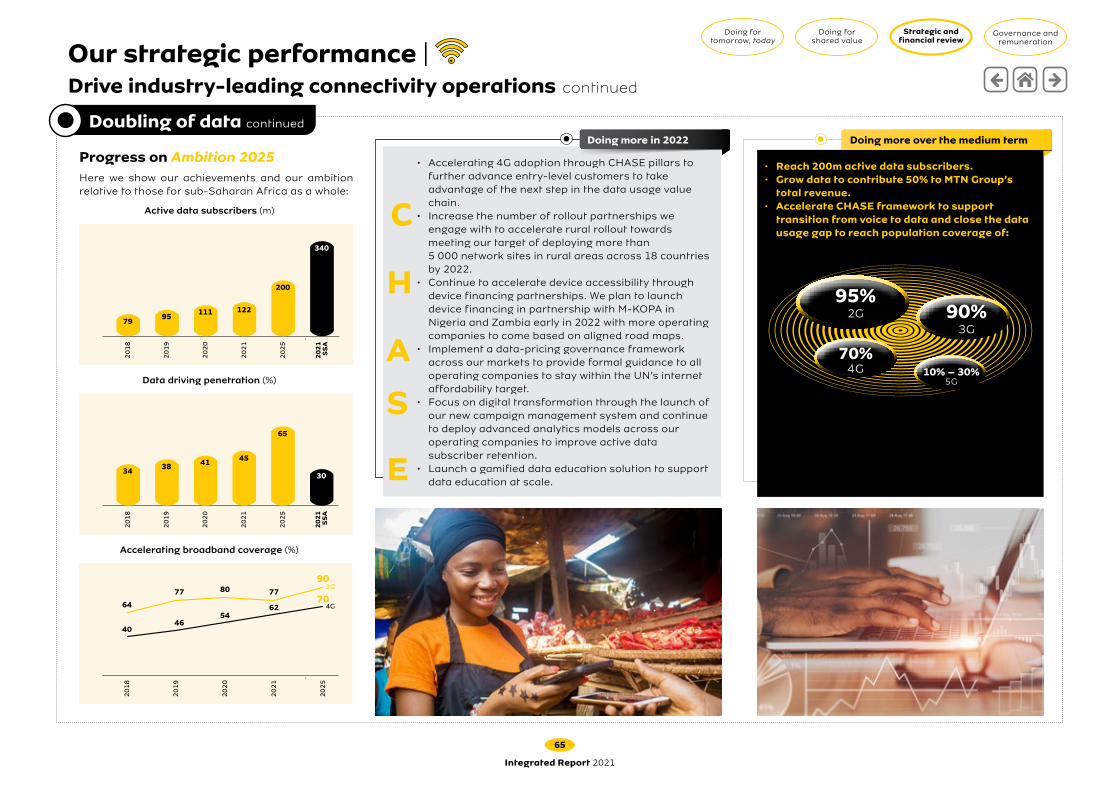
• Reach 200m active data subscribers. • Grow data to contribute 50% to MTN Group’s
total revenue. • Accelerate CHASE framework to support
transition from voice to data and close the data usage gap to reach population coverage of:
• Accelerating 4G adoption through CHASE pillars to further advance entry-level customers to take advantage of the next step in the data usage value chain.
• Increase the number of rollout partnerships we engage with to accelerate rural rollout towards meeting our target of deploying more than 5 000 network sites in rural areas across 18 countries by 2022.
• Continue to accelerate device accessibility through device financing partnerships. We plan to launch device financing in partnership with M-KOPA in Nigeria and Zambia early in 2022 with more operating companies to come based on aligned road maps.
• Implement a data-pricing governance framework across our markets to provide formal guidance to all operating companies to stay within the UN’s internet affordability target.
• Focus on digital transformation through the launch of our new campaign management system and continue to deploy advanced analytics models across our operating companies to improve active data subscriber retention.
• Launch a gamified data education solution to support data education at scale.
Doing more in 2022
Active data subscribers (m)
7995 111 122
200
340
20
18
20
19
20
20
20
21
20
21
S
SA
20
25
Data driving penetration (%)
20
18
20
19
20
20
20
21
20
21
S
SA
20
25
34 38 41 45
65
30
64
77 80 77
90
4046
5462
70
Accelerating broadband coverage (%)
20
18
20
19
20
20
3G
4G
20
21
20
25
Here we show our achievements and our ambition relative to those for sub-Saharan Africa as a whole:
Progress on Ambition 2025
Doubling of data continuedDoing more over the medium term
95%2G
70%4G
90%3G
10% – 30%5G
E
C
H
A
S
Doing for tomorrow, today
Doing for shared value
Strategic and financial review
Governance and remuneration
65
Integrated Report 2021
Our strategic performance l Drive industry-leading connectivity operations continued

‘Own-the-home’ aims at accelerating MTN’s penetration in the home segment – a new and incremental data growth opportunity. This will be achieved through dedicated home resources, a flexible bearer strategy across mobile broadband, 5G fixed wireless access, air fibre and fixed fibre and B2C-focused propositions spanning e-learning and entertainment.
We are building scale infrastructure assets to meet explosive growth in data traffic and an accelerating the digital economy in Africa, building a pan-African fibre railroad, delivered as an Open Access service to customers. MTN GlobalConnect is the main driver for the consolidation of our international and national major wholesale and fixed connectivity activities.
The fixed connectivity business offers access to 15 submarine cables and operates fibre networks in Africa. Wholesale mobility includes signalling, voice and messaging Y’ello Connect hubs, roaming and value-added services such as cloud numbering, detection and authentication.
How we are doing
• Added ~304 000 subscribers since we started focusing on this segment; reached 1.9m home-based users.
• Mobile broadband (MBB) grew 20%.• MTN SA and MTN Nigeria on track; MTN Ghana and
MTN Uganda achieved double-digit growth.• MTN SA launched Supersonic AirFibre.• MTN Nigeria deployed fibre-optic capabilities to
residential users.• MTN Nigeria partnered with real estate firm
Landafrique to deploy fibre-optic infrastructure to connect homes and businesses in Agbara Estate. The 10-year partnership covers the deployment of MTN Fibrenet Broadband internet services with at least 5Mbps and internet throughput to each housing unit, as well as industrial and commercial units within the estate.
• MTN GlobalConnect continues to scale its fixed connectivity and wholesale mobility services.
• We rolled out terrestrial fibre in markets including SA, Nigeria, Ghana, Uganda, Kenya, Zambia and Zimbabwe. We concluded 15 new cross-border links across Africa.
• We rolled out over 15 000km of terrestrial fibre, bringing our total inventory to approximately 100 000km of proprietary fibre.
• We increased our subsea fibre capabilities and are preparing for the landing of 2AFRICA in four markets, where we will own fibre pairs to strengthen the network.
How we are doing
Own the home
> Accelerate data connectivity and capture growing customer data demand in the home.
> Look at flexible and competitive offer portfolio addressing different segment needs, including Air Fibre based on Tarana Wireless’s innovative technology which operates in unlicensed spectrum.
> Achieve 10m broadband subscribers, generating R18bn in revenue by 2025 and rollout the home framework across our markets, driven by larger markets.
> Rollout a total of 135 000km of proprietary fibre by 2025, generating up to US$1bn of revenue.
> Entrench MTN as #1 African fibre player by building subsea scalable capacity and resilience.
Doing more over the medium term
Doing more over the medium term
Leading Fibreco in Africa
Doing for tomorrow, today
Doing for shared value
Strategic and financial review
Governance and remuneration
66
Integrated Report 2021
Our strategic performance l Drive industry-leading connectivity operations continued

How we are doing
• We realised R3.7bn of efficiencies, mainly from network and sales and efficiency. These included R1.4bn from MTN Nigeria, R0.9bn from MTN SA and R0.3bn from MTN Côte d’Ivoire.
• Cost savings in the mobile network, including energy savings and digital tools, will contribute 44% to savings. Other key areas include interconnect and roaming, sales and efficiency, general admin and trading goods.
We worked to drive down costs to improve our margins and adopted five key initiatives to achieve >R5bn in expense efficiencies over the next three years.
Savings realised by area
Mobile network 37% Interconnect and roaming 3% Sales and efficiency 29%
General and administrationfunds 31%
Savings realised by region
South Africa 25% Nigeria 38% SEA 5%
WECA 17%MENA 15%
Digital transformation | Step change in efficiencies and service levels
> Achieve more than R5bn in expense efficiencies over three years (off 2020 baseline).
> Work with hyperscalers to move more than 80% of our network and IT workloads to the cloud over time. This will drive efficiencies to support improved returns.
Doing more over the medium term
Doing for tomorrow, today
Doing for shared value
Strategic and financial review
Governance and remuneration
67
Integrated Report 2021
Our strategic performance l Drive industry-leading connectivity operations continued

• We worked to close the coverage gap in rural areas, rolling out 912 more rural sites through the rapid rural rollout programme.
• Contributed ~R115bn economic value add (up 10.7% since 2020).
• Paid taxes of R11bn (R8.4bn in 2020) in support of fiscal resources of nation states.
• Invested R67bn (up 33.5%) in our networks, advancing fixed investment.
• Continued to support the livelihoods, through job creation and skills development of ~6 million people (5 million in 2020).
Contributed ~R115bn in economic value added
• We broadened local participation and ownership across our markets, see page 72 for details.
Creating shared value is integral to the sustainability of our business and our markets. We have taken a step change in our approach to ESG matters, and are driving digital and financial inclusion. We want to complete various localisation transactions and ensure that MTN is broad-based and inclusive across our markets. We require the continued support of our nation-state hosts. Trust underpins our success and sustainability.
Diversity by nationality
Network and IT investment 58% Commercial procurement 21% Salaries and wages 10% Taxes paid 10% CSI 1%
Relevant capitals
Natural capital Human capital
Increased the
representation of women at MTN to 39%
External rural
broadband coverage
to 83%
Done in 2021
Relevant material matters
MM
2
MM
8
MM
3MM
4MM
1
MM
7MM
9
Extending local ownership
Contributing to society
Accelerating digital and financial inclusion
Were included in
FTSE/JSE Top 30 Responsible
Investment Index
Reduced scope 1 and 2
GHG emissions by ~16%
Broadened local
participation by: > Listing MTN Rwanda
by introduction
> Listing MTN Uganda and localised 13%
> Localised 3% of MTN Nigeria
ROADTOZERO
Linked 2022 executive remuneration for STIs
and LTIs to ESG
Social Financial
• Offered broadband coverage to 23m people from 8.5m in 2020 – taking coverage to 83% of the rural population.
• Improved affordability, with a 15.3% reduction in the blended cost of data across our markets.
• Refer to page 57 for more on digital and financial inclusion.
Doing for tomorrow, today
Doing for shared value
Strategic and financial review
Governance and remuneration
68
Integrated Report 2021
Our strategic performance l Create shared value

• Pledged to actively promote gender equality: to ensure women have equal opportunity.• Held a ‘Gender equality today for a sustainable tomorrow’ event: MTN leaders committed to play their part. • Carried out study of pay levels for MTN men and women: Found disparity and committed to close this gap.• Integrated diversity target ambitions with sustainability and HR measures and KPIs.
Doing more in 2022
Diversity and inclusion are core to MTN’s people agenda.Key commitments in 2021 included:• Achieving workforce gender equality by 2030.• Reaching gender pay parity by end 2022.• Attaining better gender representation in our
strategic programmes: at least 30% women representation in business transformations, upskilling and specialised initiatives of Ambition 2025.
2021 metrics39% women in the workforce (2020: 38%).31% women in management (1pp increase since 2020).28% women in succession pool (8pp increase since 2020).46% women new hires (4.5pp increase since 2020).
• Introduced ‘Global Diversity Awareness’ month to raise awareness of everyday challenges experienced by women and differently abled people in the workplace.
• Included three new cohorts of C-suite women successors into our Rising Leaders programme: 138 women across 74 positions.
• Introduced plan to develop, grow and coach managerial women through a specialised Managerial Rising Leaders programme: inducted 152 candidates across 72 senior management positions.
• Improved diversity and inclusion culture sentiments among women employees by 5pp to 83% satisfaction in H2 from H1 2021.
How we are doing
• Accelerate diversity and inclusion, targeting 50% women representation in the workforce, and among executives and directors across our operations by 2030.
Our ambition
Women in the workforce
Women in tech
Women in platform
Women in management
Women in succession
2022 2025 2030
21%
31%
41% 45%
17%25% 28%
39% 44%
30%
35% 40%
50% 50%
35%
Diversity and inclusion
Doing more over the medium term
Doing for tomorrow, today
Doing for shared value
Strategic and financial review
Governance and remuneration
69
Integrated Report 2021
Our strategic performance l Create shared value continued

Taking a step change in ESG positioning
We changed our approach to sustainability matters, improving the Group’s risk profile and linking executive remuneration from 2022 to performance against ESG targets with a focus on Net Zero, rural broadband and diversity and inclusion.
Our commitment to improve our ESG performance led to a significant upgrade to the Group’s ESG rating by FTSE Russell to an overall rating of 4.3 (out of 5) from 2.9 previously. MTN is now placed above the mobile telecoms sub-sector average and is included in the FTSE/JSE Responsible Investment Top 30 Index.
How we are doing
• Noting an improvement across each of the ESG pillars, FTSE upgraded MTN’s overall rating to 4.3 at end-December 2021 from 2.9 previously. The ratings are scored out of 5.0.
• In the telecoms sector, MTN moved from the 34th percentile in December 2019 – the last time such a ranking was performed – to the 97th percentile in December MTN Group received the maximum 5.0 points as a social score (compared to 3.2 previously), 4.5 points (from 4.0) as a governance score and 3.6 (from 1.9) as an environment score.
• Group President and CEO Ralph Mupita signed a pledge with the Science-Based Target initiative (SBTi) which formally commits the MTN Group to our target of Net Zero by 2040.
• A key element in reaching Net Zero is establishing a baseline built on robust and accurate data from which to measure our GHG emission-reduction pathway across our operations. During the year under review, we reassessed and updated our baseline year, to use 2021 as the baseline year against which our Group progress will be measured and tracked.
• Group-wide, 208 suppliers have pledged to join MTN’s road to Net Zero to reduce scope 3 emissions, exceeding our initial target of 150 Group-wide suppliers.
• MTN has called on partners to work together to setting science-based targets to reach a Net Zero future together and recently Ericsson has joined MTN in pledging to commit to a Road to Zero strategy and by leveraging Ericsson’s latest and most advanced sustainable technologies.
Net Zero> Reduce carbon emissions by 47% (off a 2019 base) by 2030
(scope 1, 2 and 3) and achieve Net Zero by 2040.
Diversity and inclusion> Accelerate diversity and inclusion, targeting 50% women representation in
the workforce, and among executives and directors across our operations by 2030.
Rural broadband> Close the coverage gap to reach rural broadband coverage (at least 3G)
of 95% by 2025.
Localisation> Target localisations of 35%, 25% and 20% in MTN Nigeria, MTN Ghana and
MTN Uganda respectively.
Doing more over the medium term
Doing for tomorrow, today
Doing for shared value
Strategic and financial review
Governance and remuneration
70
Integrated Report 2021
Our strategic performance l Create shared value continued

Broadenedlocal
participationby:
> Listing MTN Rwanda by introduction
> Listing MTN Uganda and localised 13% for proceeds of R2.3bn
> Localised 3% of MTN Nigeria for anticipated proceeds of
R3.6bn
Reduced Holdco leverage to 1.0x
Made good progress with
the structural separation of fintech
Progressed with
South Africa tower
transaction, with R5.2bn
proceeds anticipated
There are three elements in our work to accelerate portfolio transformation. The first is executing on the ARP and deleveraging the balance sheet. The second is to continue to exit the Middle East in an orderly fashion, allowing us to simplify the business. The third is to reveal the value in fintech and the fibre infrastructure assets over the medium term.
Asset realisation programme and deleveraging
How we are doing
In March 2022, the Competition Commission approved with conditions MTN South Africa’s passive tower infrastructure transaction with IHS Towers. This entails the sale and leaseback of 5 713 towers and their associated business operations. We expect to receive net proceeds of R5.2bn.
In October 2021, IHS Towers listed on the NYSE after a public offering of 18m ordinary shares priced at US$21.00 each. MTN now holds just over 85m ordinary shares, or 26% of IHS. There was no secondary offer and MTN did not sell any shares, however the listing creates a liquidity platform and opportunity to monetise our investment in future. IHS’s share price has declined since the listing and traded at US$14.10 at end-2021.
Done in 2021
Relevant capitals Relevant material matters
MM
4MM
1MM
6MM
7Social capital Intellectual capitalFinancial capital
Sold our stake in associate
BICS for R1.8bn
Launched in March 2019 and enhanced in March 2020, our ARP targets realisations of >R25 billion over the medium term. It aims to reduce debt, simplify our portfolio, reduce risk and improve returns. In the past 12 months, we have received net proceeds of R4.1bn. Another R8.8bn is in the pipeline. Since March 2020, we have secured R15.4bn in proceeds.
Doing for tomorrow, today
Doing for shared value
Strategic and financial review
Governance and remuneration
71
Integrated Report 2021
Our strategic performance l Accelerate portfolio transformation

• In the year, we progressed with local listings, supporting our work to create shared value, broaden local participation and deepen the capital markets in which we operate.
> In May, MTN Rwanda listed on the Rwanda Stock Exchange.
> In December, we offered 575m shares in MTN Nigeria, with a bookbuild to institutional investors and a fixed price of NGN169 to retail investors. In January 2022, we completed the offer, which was 1.39 times oversubscribed. More than 126 000 investors applied for 802m shares. Dealogic called this the largest public offer in sub-Saharan Africa in 2021, with gross proceeds of R4.3bn in 2022 and a reduction to 75.6% of MTN Group’s shareholding in MTN Nigeria from 78.8%.
> In December, MTN Uganda listed on the Uganda Securities Exchange. Of the 4.5bn shares (20% of MTN Uganda) on offer, 2.9bn were allocated, realising gross proceeds of R2.3bn. Dealogic ranked the listing the second-largest IPO in sub-Saharan Africa in 2021.
• We made substantial progress in deleveraging
the balance sheet faster, with consolidated net debt-to-EBITDA improving to 0.4x (from 0.8x) and Holdco leverage improving to 1.0x (from 2.2x). This was boosted by cash of R18.4bn repatriated from operations – including R7.8bn from Nigeria, and R4.1bn in net proceeds from our ARP.
We aim to have a clear operational and resourcing focus to accelerate growth of the fintech and fibre infrastructure businesses while allowing the various entities to leverage the MTN base, brand, network and footprint. The separated operations will remain controlled by the Group but will be better able to engage value-adding partnerships to scale and accelerate their growth as well as reveal the value held within the Group. In 2021, we:
• Made good progress on the structural separations, creating the accounting separation of the fintech business out of the GSM business, and with that creating its own set of financials and its own set of commercial agreements with the GSM business.
Structurally separate the fintech and fibre infrastructure businesses
Asset realisation programme and deleveraging continued
How we are doingHow we are doing
In line with our pan-Africa focus, we:• Abandoned the operation in Syria in
August 2021 given the regulatory actions and demands that made operating there untenable.
• Exited from our operation in Yemen in November 2021 through a transfer of our shareholding to a third party for AED1.
• Bid US$600m in April 2021 for an Ethiopian licence. We were unsuccessful but were comfortable that we had applied our capital allocation framework consistently, maintaining the discipline.
Portfolio transformation
How we are doing
Doing more over the medium term
ARP> Oversee IHS sell down when market conditions
are conducive (value of R19.1bn).
> Broaden the local shareholder base in MTN Nigeria, subject to market conditions and regulatory approvals, aiming to hold 65% after a further 11% sell down.
> Further localise MTN Ghana, targeting another 12.5%, including through a 5% staff ESOP to achieve a 30% localisation outcome.
> Sell down a further 7% of MTN Uganda.
Portfolio transformation> Explore options to exit Afghanistan in an orderly
manner.
> Explore M&A opportunities aligned to the investment case, subject to strict risk and financial criteria in line with the capital allocation framework.
Structural separation> Set up the fintech businesses separately; secure
partners to help scale the business.
> Target structural separation of fibre infrastructure businesses for 2023, depending on regulatory approvals required for cross-market fibre deployment.
Doing for tomorrow, today
Doing for shared value
Strategic and financial review
Governance and remuneration
72
Integrated Report 2021
Our strategic performance l Accelerate portfolio transformation continued

Members Meetings
Mcebisi Jonas (Chairman) 4/4
Khotso Mokhele (LID) 4/4
Nkululeko Sowazi 4/4
Swazi Tshabalala 3/4
Vincent Rague 4/4
“In the year MTN worked to continue to build the capabilities of all directors, understanding the strengths and weaknesses of the Board and align them with the responsibilities and objectives to optimise performance and reinforce governance.”
Mandate: Governance The Committee assists the Board with discharging the corporate governance oversight and acts as a sounding board on governance practices. It provides an oversight on the effectiveness of governance processes and systems ensuring that these are appropriately implemented in accordance with relevant legislation, codes and governance policies.
Key activities in 2021 • Reviewed and approved the resolutions to be presented to the shareholders
at the AGM and recommended them for approval by the Board. • Reviewed the IMD Board evaluation outcomes and
recommendations. Considered the remedial actions and the implementation plan.
• Evaluated the performance of the Group President and CEO.• Reviewed and evaluated the independence, performance
and suitability of the directors to be presented for re-election and recommended the directors for approval by the Board.
• Reviewed the competence and suitability of the Group Secretariat function. Satisfied itself that the Group Company Secretary is suitably qualified for the role.
• Reviewed and approved the structure and composition of Board Committees for 2021, making the necessary changes where required.
• Identified and approved the Group’s Prescribed Officers for 2022.
• Reviewed the Group operating model and made recommendations to management.
• Considered the current status of governance of the Group and its subsidiaries and authorised the undertaking of a governance maturity assessment to be conducted by an independent service provider on the Group and the operating companies.
• Provided oversight on the succession planning process for the CEO and other Group key executives.
• Provided input on the ‘governance strategy’ as part of the ESG strategy. • Reviewed and provided oversight on the significant governance risks identified by
IMD as part of the Board evaluation.• Reviewed the key insights and concerns arising from the governance roadshows in respect
of matters on Board effectiveness, diversity, and succession.
Chairman Mcebisi Jonas
Key focus areas for 2022 > Oversee the finalisation of the Group operating
model.
> Finalisation of the Group Board composition and evolution of the Board.
> Review the outcomes of the governance maturity assessment, provide direction and monitor the implementation of the remedial
actions.
> Monitor and drive the progress of the ESG imperatives, specifically as they relate to the governance-related imperatives.
> Continue to monitor and provide oversight on the entrenchment of governance practices across the Group.
> Continue to monitor the succession planning process in respect of the Group President and CEO, CFO and Group
Company Secretary.
.
Directors Affairs and Governance Committee Chair’s review
Directors affairsThe Committee also assists the Board to ensure that the Board has the appropriate composition of skills to execute its duties effectively; the directors are appointed through a transparent and formal process that is free from undue influence and the induction and ongoing training and development of directors take place to align to the Company’s strategy and changing environment.
Doing for tomorrow, today
Doing for shared value
Strategic and financial review
Governance and remuneration
73
Integrated Report 2021

The Company acknowledges that an effective Board must have the expertise and competence to promptly and appropriately address current and emerging issues to ensure the delivery of its strategy. For detailed profiles of our Board of Directors please refer to .
Mcebisi Jonas (Born 1960) Chairman Independent non-executive directorBA HDEMeeting attendance: 7/8
Ralph Mupita (Born 1972) Group President and CEOBScEng (Hons), MBA,GMP (Harvard)Meeting attendance: 8/8
Lamido Sanusi (Born 1961) Nigerian Independent non-executive directorBachelor’s degrees inEconomics and Islamic LawMeeting attendance: 8/8
Dr Khotso Mokhele(Born 1954) Lead independent non-executive directorBSc (Agriculture), MSc (Food Science),PhD (Microbiology) andhonorary doctoratesMeeting attendance: 8/8
Sindi Mabaso-Koyana (Born 1969) Independent non-executive directorBCom (Hons)(Accounting), CA(SA)Meeting attendance: 8/8
Vincent Rague (Born 1958) Kenyan Independent non-executive directorBA (Hons) (Econ/Statistics), Executivedevelopment programs atHarvard and IMD MBAMeeting attendance: 8/8
Swazi Tshabalala (Born 1965) Independent non-executive directorBA in Economics, MBA, Oxford Fintech ProgrammeMeeting attendance: 8/8
Nosipho Molope (Born 1964) Independent non-executive directorBSc, BAccSc with aCTA, CA(SA)Meeting attendance: 7/7
Nkululeko Sowazi (Born 1963) Independent non-executive directorMaster’s degree (UCLA)Meeting attendance: 6/8
Noluthando Gosa(Born 1963) Independent non-executive director BA Communications (Hons); MBA; Post graduate certificate in Business Admin, International Certificate in Telecommunications RegulationMeeting attendance: 7/7
Paul Hanratty(Born 1961) Irish Independent non-executive directorBBusSc (Hons), Fellow of Institute of Actuaries, Advanced Management Programme (Harvard)Meeting attendance: 7/8
Tsholofelo Molefe (Born 1968) Group Chief Financial OfficerBCompt (Hons), CTA, BA (Hons) Accounting & Finance, CA(SA)Meeting attendance: 7/7
Shaygan Kheradpir(Born 1960) American Independent non-executive directorBA, Masters and PhDElectricalEngineering (Cornell)Meeting attendance: 8/8
Stan Miller (Born 1958) Belgian Independent non-executive directorIntDip, Diploma in Law,Administration, ProteusLeadership Programmes, Private Equity ProgrammesMeeting attendance: 8/8
Doing for tomorrow, today
Doing for shared value
Strategic and financial review
Governance and remuneration
74
Integrated Report 2021
Our Board of Directors

As COVID-19 remained at the top of the world’s agenda, the
Board provided the stewardship required for MTN to navigate
the associated uncertainties. The difficulties of running a
business during a pandemic tested people everywhere, however
the Board led from the front, making decisions to protect MTN’s
assets and to enable the Company to be more flexible and responsive.
Apart from health adaptations, MTN put in place governance measures such as
new policies and practices to manage the health, welfare and livelihoods of
employees and customers as we navigate the new normal. The Board continues
to monitor the pandemic’s economic effects and is comfortable that MTN is well
positioned to withstand these.
Value creation and preservation through robust governanceMTN is committed to the highest standards of governance, business integrity, ethics and professionalism. Corporate governance is the cornerstone of our business and ensures that we work responsibly as required by the King IV Report.
We deliver on our belief and ensure the relevance and sustainability of our business by monitoring the macro environment, the availability of appropriate capital inputs and our impact on these, as well as the needs of our stakeholders. All of these inform our strategy. This strategy enables MTN to maintain operational focus and deliver on our targets. Our governance processes ensure that we are a sustainable business and that we create and preserve value for ourselves and our stakeholders.
• Set the tone for ethical and effective leadership.• Improved Board independence, structure and female representation.• Enhanced transparency.• Supported an ethical culture in our operations and supply chain.• Developed action plans to address data and privacy security gaps.• Appointed the Chairman of the Social and Ethics Committee as designated
climate change Board member.• Delegated the management of MTN to a competent executive management
team.• Ensured that the management team defined and executed a robust
Ambition 2025 strategy process that included the approval of the separation
of the Group Fintech business.• Reviewed the assets of the Company, making critical decisions to exit key
markets.• Reviewed the operating model to ensure the Group operates optimally. • Protected the interests of MTN’s stakeholders by ensuring fair, responsible
and transparent practices across all MTN operations. • Oversaw the combined assurance and control function and ensured that it
informed management’s development and implementation of the strategy.• Ensured that innovation remained at the heart of MTN.• Ensured the implementation of key ESG performance indicators and
improvement plans. • Elevated the alignment of governance with key subsidiaries.
Our governance philosophy, framework and ecosystemOur governance philosophy, framework and ecosystem are grounded on the core elements of good governance, including transparency, integrity, sound policy, stakeholder participation, accountability and anti-corruption.
The Board is committed to efficient governance and to observing the trends in international sound governance standards to attain best practice. It is committed to ensuring an unequivocal tone at the top that requires a commitment by all directors and employees to the MTN Group values, including that of integrity. Our application of the King IV principles is set out in our King IV Assessment Report KIV on our website.
Our governance ecosystem reflects sound governance principles and practices which serve as a foundation for our Ambition 2025:
Ethical and effective
leadership
Stakeholder inclusivity
Strategic direction
and stewardship
Internal controls and
assurance
Board composition
Governancerisks and
opportunities
Board and committee
effectiveness
The MTN Group’s governance ecosystem
reflects the connection in establishing sound
governance principles and practices, which serve as a foundation for our
Ambition 2025
1
2
43 5
6
7
Governing in a time of COVID-19
Doing better in 2021
Refer to page 32 for more doing during COVID-19
Doing for tomorrow, today
Doing for shared value
Strategic and financial review
Governance and remuneration
75
Integrated Report 2021
Governance in action

Committee mandates and membership In 2021, we re-examined our committees’ mandates, mainly to give effect to oversight obligations arising from ESG imperatives and to address overlaps in committee activities. In particular, this was to review the mandate of the Social and Ethics Committee and assign some of its responsibilities to more appropriate committees.
We evaluated each committee’s terms of reference in light of current governance trends, worldwide standards and best practices. We carefully assessed committee membership, considering the skills and knowledge required by each committee, as well as the need for cross-pollination of information across all committees.
After an exhaustive evaluation, the Board was satisfied that the committees effectively executed their obligations in 2021.
For meeting attendance, see pages 26, 35, 54, 55 and 73.
Board composition that is fit for purposeOur Board comprises a suitable balance of knowledge, skills, experience, diversity and independence to carry out its governance role and responsibilities objectively and effectively.
In 2021, three new women directors joined the Board, taking the number of women directors to five. Tsholofelo Molefe, a new executive director, assumed the role of GCFO on 1 April 2021. Noluthando Gosa and Nosipho Molope – independent non-executive directors – joined on the same day. Swazi Tshabalala will retire at the 2022 AGM.
Governance structureGovernance at MTN is structured in line with best practice and is substantially cascaded down to subsidiaries across the Group. In 2021 we evolved the operational governance framework and structure to better align it with Ambition 2025.
The Board delegates its authority to committees with the mandate to deal with relevant governance issues and report to the Board on them on a quarterly basis. Each committee operates under terms of reference setting out roles and responsibilities, composition and scope of authority. These are reviewed every year.
Internal controls and combined assurance
Our combined assurance modelMTN’s directors and executives provide oversight using a combined assurance model which considers the role of management, control functions, internal and external audit and the Board committees of subsidiaries. They use a simplified governance approach in often complex environments as they strive to create and preserve shared value through all subsidiary companies. The Group Audit Committee is responsible for oversight of the implementation of combined assurance.
The combined assurance model means there are numerous lines of defence to identify, prevent and mitigate risks and provide independent assurance to both the Group Exco and the Board either through the Group Audit Committee or the Group Risk Management and Compliance Committee. The model is implemented as follows:
Management
External assurance providers
Internal assurance providers
Human Capital and
Remuneration
Strategic Talent and Diversity
Risk Management
and Compliance
GroupTreasury
Social, Ethics and
Sustainability
Capital Allocation and Management
Board committeesGroup
Executive committees
Audit
Enterprise Risk
Management, Combined Assurance
Directors Affairs and Governance
GroupSourcing
Group Finance and Investment
GroupOperations
Group Exco and its sub-committees The Group Executive Committee (Exco) facilitates the effective control of the Group’s operational activities in terms of the authority delegated to it by the Board through the Group President and CEO. The Group Exco is responsible for recommendations to the Board on the Group’s policies and strategy as well as being responsible for monitoring implementation.
Doing for tomorrow, today
Doing for shared value
Strategic and financial review
Governance and remuneration
76
Integrated Report 2021
Governance in action continued
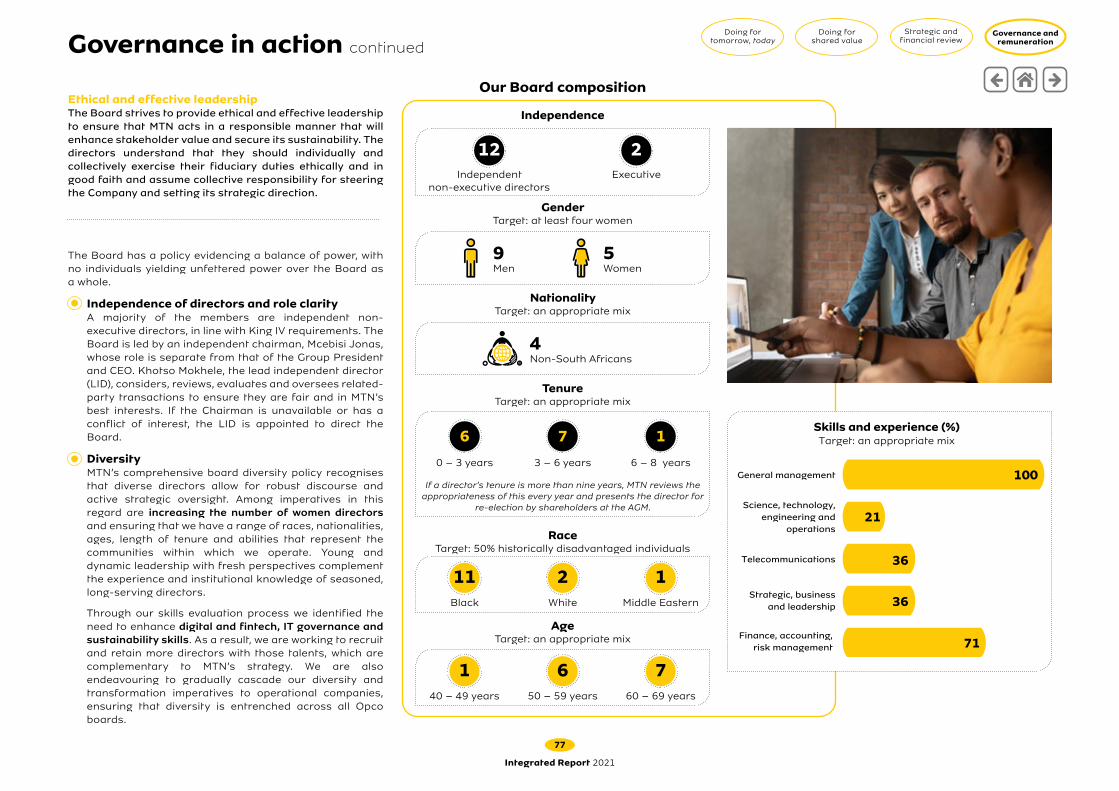
GenderTarget: at least four women
9Men
5Women
NationalityTarget: an appropriate mix
4Non-South Africans
TenureTarget: an appropriate mix
6
0 – 3 years
7
3 – 6 years
1
6 – 8 years
If a director’s tenure is more than nine years, MTN reviews the appropriateness of this every year and presents the director for
re-election by shareholders at the AGM.
RaceTarget: 50% historically disadvantaged individuals
AgeTarget: an appropriate mix
Ethical and effective leadershipThe Board strives to provide ethical and effective leadership to ensure that MTN acts in a responsible manner that will enhance stakeholder value and secure its sustainability. The directors understand that they should individually and collectively exercise their fiduciary duties ethically and in good faith and assume collective responsibility for steering the Company and setting its strategic direction.
The Board has a policy evidencing a balance of power, with no individuals yielding unfettered power over the Board as a whole.
Independence of directors and role clarityA majority of the members are independent non-executive directors, in line with King IV requirements. The Board is led by an independent chairman, Mcebisi Jonas, whose role is separate from that of the Group President and CEO. Khotso Mokhele, the lead independent director (LID), considers, reviews, evaluates and oversees related-party transactions to ensure they are fair and in MTN’s best interests. If the Chairman is unavailable or has a conflict of interest, the LID is appointed to direct the Board.
DiversityMTN’s comprehensive board diversity policy recognises that diverse directors allow for robust discourse and active strategic oversight. Among imperatives in this regard are increasing the number of women directors and ensuring that we have a range of races, nationalities, ages, length of tenure and abilities that represent the communities within which we operate. Young and dynamic leadership with fresh perspectives complement the experience and institutional knowledge of seasoned, long-serving directors.
Through our skills evaluation process we identified the need to enhance digital and fintech, IT governance and sustainability skills. As a result, we are working to recruit and retain more directors with those talents, which are complementary to MTN’s strategy. We are also endeavouring to gradually cascade our diversity and transformation imperatives to operational companies, ensuring that diversity is entrenched across all Opco boards.
Our Board composition
Independence
12 2Independent
non-executive directorsExecutive
760 – 69 years
140 – 49 years
650 – 59 years
1Middle Eastern
11Black
2White
General management
Science, technology,engineering and
operations
Telecommunications
Strategic, business and leadership
Finance, accounting, risk management
Skills and experience (%)Target: an appropriate mix
100
21
36
36
71
Doing for tomorrow, today
Doing for shared value
Strategic and financial review
Governance and remuneration
77
Integrated Report 2021
Governance in action continued
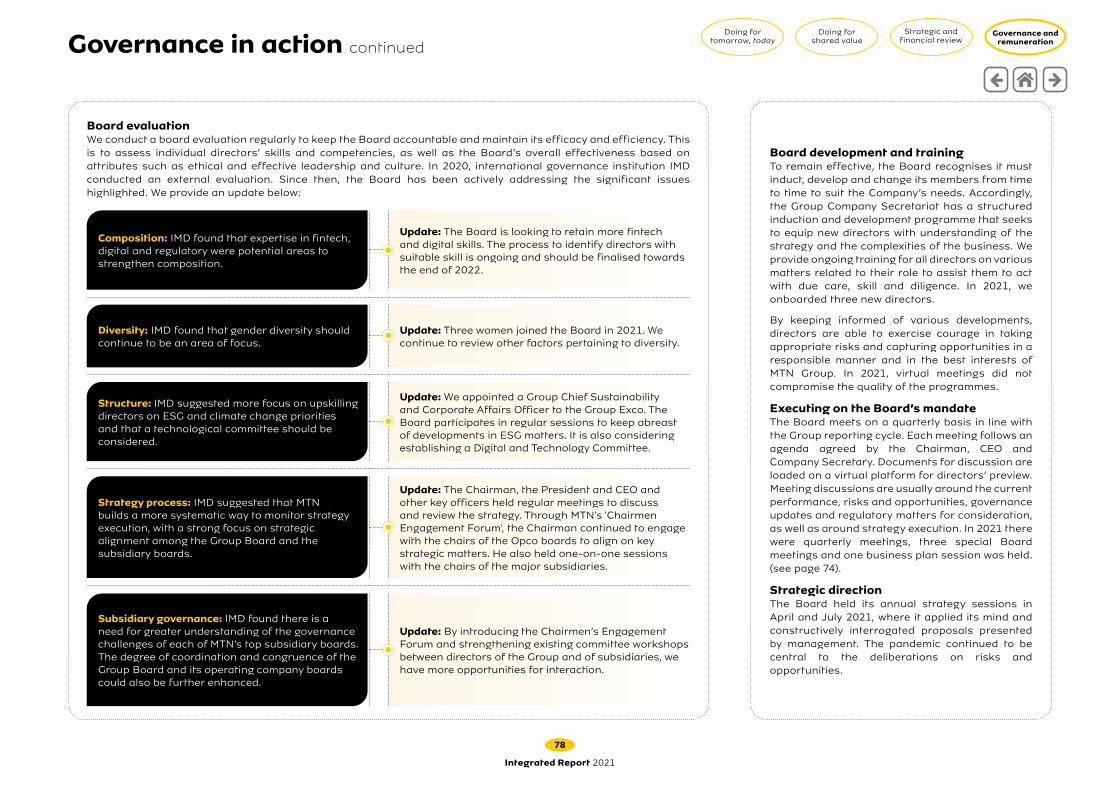
Board evaluationWe conduct a board evaluation regularly to keep the Board accountable and maintain its efficacy and efficiency. This is to assess individual directors’ skills and competencies, as well as the Board’s overall effectiveness based on attributes such as ethical and effective leadership and culture. In 2020, international governance institution IMD conducted an external evaluation. Since then, the Board has been actively addressing the significant issues highlighted. We provide an update below:
Composition: IMD found that expertise in fintech, digital and regulatory were potential areas to strengthen composition.
Update: The Board is looking to retain more fintech and digital skills. The process to identify directors with suitable skill is ongoing and should be finalised towards the end of 2022.
Diversity: IMD found that gender diversity should continue to be an area of focus.
Update: Three women joined the Board in 2021. We continue to review other factors pertaining to diversity.
Structure: IMD suggested more focus on upskilling directors on ESG and climate change priorities and that a technological committee should be considered.
Update: We appointed a Group Chief Sustainability and Corporate Affairs Officer to the Group Exco. The Board participates in regular sessions to keep abreast of developments in ESG matters. It is also considering establishing a Digital and Technology Committee.
Strategy process: IMD suggested that MTN builds a more systematic way to monitor strategy execution, with a strong focus on strategic alignment among the Group Board and the subsidiary boards.
Update: The Chairman, the President and CEO and other key officers held regular meetings to discuss and review the strategy. Through MTN's 'Chairmen Engagement Forum', the Chairman continued to engage with the chairs of the Opco boards to align on key strategic matters. He also held one-on-one sessions with the chairs of the major subsidiaries.
Subsidiary governance: IMD found there is a need for greater understanding of the governance challenges of each of MTN’s top subsidiary boards. The degree of coordination and congruence of the Group Board and its operating company boards could also be further enhanced.
Update: By introducing the Chairmen’s Engagement Forum and strengthening existing committee workshops between directors of the Group and of subsidiaries, we have more opportunities for interaction.
Board development and trainingTo remain effective, the Board recognises it must induct, develop and change its members from time to time to suit the Company’s needs. Accordingly, the Group Company Secretariat has a structured induction and development programme that seeks to equip new directors with understanding of the strategy and the complexities of the business. We provide ongoing training for all directors on various matters related to their role to assist them to act with due care, skill and diligence. In 2021, we onboarded three new directors.
By keeping informed of various developments, directors are able to exercise courage in taking appropriate risks and capturing opportunities in a responsible manner and in the best interests of MTN Group. In 2021, virtual meetings did not compromise the quality of the programmes.
Executing on the Board’s mandateThe Board meets on a quarterly basis in line with the Group reporting cycle. Each meeting follows an agenda agreed by the Chairman, CEO and Company Secretary. Documents for discussion are loaded on a virtual platform for directors’ preview. Meeting discussions are usually around the current performance, risks and opportunities, governance updates and regulatory matters for consideration, as well as around strategy execution. In 2021 there were quarterly meetings, three special Board meetings and one business plan session was held. (see page 74).
Strategic directionThe Board held its annual strategy sessions in April and July 2021, where it applied its mind and constructively interrogated proposals presented by management. The pandemic continued to be central to the deliberations on risks and opportunities.
Doing for tomorrow, today
Doing for shared value
Strategic and financial review
Governance and remuneration
78
Integrated Report 2021
Governance in action continued

What the Board focused on
2021
ESG at the coreMTN has continued to make significant progress in gaining a deeper grasp of sustainability issues and ensuring that ESG issues are carefully considered in the Group’s operations. One of the four strategic priorities of Ambition 2025 is ‘Creating shared value’; ‘ESG at the core’ is a critical enabler.
The Board continues to engage in discussions about ESG, ESG trends, and best practices, with the goal of assisting management in better connecting with global ESG challenges and opportunities that are relevant to the Group’s day-to-day operations, strategy and risk profile.
The Board provided oversight on the important areas of MTN’s ESG credentials that can be enhanced by focusing on the Group’s approved the sustainability strategic framework, which has clearly defined targets and deadlines.
The establishment of key performance indicators for key Group Executives and CEOs has been a significant breakthrough in this regard. This will enable the improvement plans to be cascaded down to the various operations and business units.
MTN Group published its first Transparency Report in 2020, which garnered positive feedback; 2021 provided an opportunity to strengthen the report as well as the Group’s yearly Sustainability Report.
The work on ESG is still in progress, and both the Board and Management have indicated that they are committed to continuing to make progress in this area.
• Approved the budget and strategic business plan.
• Reviewed Group operating model.• Reviewed Opco spectrum auctions.
• Reviewed the Group’s performance and key priorities.
• Reviewed and approved ARP localisations.• Approved a new market opportunity.• Approved IPO initiatives.• Reviewed MTN Zakhele financial assistance and
funding arrangements.• Approved revised Group delegation of authority.• Reviewed ESG matters, including sustainability
reporting and climate change approach.
• Approved the 2020 AFS, Integrated Report and notice of AGM.
• Reviewed the Group’s performance and key priorities.
• Approved funding of vaccinations.
• Approved the re-election of directors; appointments to the Audit Committee and the Social and Ethics Committee; prescribed officers; the Board charter; and the committees' terms of reference.
• Approved interim financial results.• Reviewed the Group’s performance and key priorities.• Reviewed COVID-19 management.• Reviewed implementation of localisation plan.• Approved Middle East exit.• Reviewed Opco spectrum auctions• Reviewed and approved separation of Fintech and
Infraco from the GSM business.
Q1
Q2 Q3
Q4
ESG ratingsBloomberg
MTN improved to 47.9% from 43.8%Peer average 40%
FTSE4Good IndexMTN improved to 4.3 from 3.7 (out of 5)Industry average 2.9 (out of 5)
MSCIMTN improved to A from BBBIndustry A
Sustainalytics^MTN improved to 27.7 (medium risk) from 29.1Peer average 39.7
S&P: Dow Jones Corp MTN improved to 46% from 30%Industry average 42%
How we are doing:
^ Sustainalytics ranks companies from 100 as severe risk to 0 as negligible risk
Peer average excludes MTN's performance
Doing for tomorrow, today
Doing for shared value
Strategic and financial review
Governance and remuneration
79
Integrated Report 2021
Governance in action continued

All appointments to the Board for 2021 were conducted through a formal and transparent process, guided by an approved policy and assisted by the Directors and Corporate Governance Affairs Committee in consultation with the Group Company Secretary.
The Company is committed to and has mechanisms in place to ensure that, in all its activities, it complies with and respects the laws, regulations and governance codes in all the jurisdictions in which it operates. The Company is operating in conformity with the Companies Act, Memorandum of Incorporation (MOI), charters and terms of reference.
26th Annual General MeetingIn 2021, we held our second virtual AGM, focusing on ensuring that all shareholders were afforded the opportunity to adequately engage on all the resolutions tabled. Most shareholders submitted their questions before the meeting and some were able to ‘raise their hands’ at the meeting. We made a concerted effort to ensure that all the questions were addressed and responded to.
All the resolutions were passed with a sufficient majority votes save for Ordinary Resolution 9 pertaining to the Remuneration Implementation Report. This did not receive the requisite majority and MTN made the necessary arrangements to engage with shareholders. Details are on page 86 of the Remuneration Report.
Governance roadshowIn May 2021, MTN held a virtual governance roadshow with shareholders to discuss various matters, such as the AGM notice and broader governance concerns including remuneration. It was led by Chairman Mcebisi Jonas and Lead Independent Director Khotso Mokhele, who is also Chairman of the Remuneration Committee. The conversations were constructive and the key take outs were that MTN needs to:
• Focus on ESG imperatives and enhance its ESG initiatives;• Continue to address and improve the Remuneration Policy and
Plan for key employees; and• Continue to enhance transparency on governance matters
in general.
The feedback was positively embraced.
In 2021, we revised the Share Dealing and Insider Trading Policy which governs share dealing processes for directors, prescribed officers and employees. The revision was to align with the JSE Listings Requirements, to enhance administrative and disclosure processes and to impose more provisions to safeguard employees from contravening the Financial Markets Act.
The Board is assisted by a competent and suitably qualified Group Company Secretary function, led by Thobeka Sishuba Bonoyi. She and her representatives have an arm’s length relationship with the Board. Following a rigorous assessment of performance in March 2021, the Board is satisfied that the function has the competency, qualifications and experience to provide sound governance advisory and stewardship to the Board and management.
To align with Ambition 2025, the Group Company Secretariat function is re-evaluating and improving its operating model across the Group to ensure that the department is fit for purpose, independent and adequately resourced.
Engaging with stakeholders
Compliance
Group Company Secretary
Directors’ dealings
Board appointments
MTN recognises that the management of conflicts of interest is critically important in promoting ethical conduct and protecting the integrity of MTN decision-making processes. Accordingly, directors and employees are encouraged to act in a responsible and ethical manner, taking into consideration the Group’s best interests. They are required to complete a declaration of interest at the start of each year.
In 2021, we continued to embed the policy.
There has been significant improvement in the understanding of the process; this has been as a result of the awareness created with the MTN Conduct Passport and the guidance framework provided to employees and rolled out in all operations.
Conflicts of interest
Doing for tomorrow, today
Doing for shared value
Strategic and financial review
Governance and remuneration
80
Integrated Report 2021
Governance in action continued

Our IAB was established in 2019 and is comprised of eminent persons to counsel, guide and support the MTN Group. Non-statutory in nature and without any fiduciary responsibility, the IAB meets twice a year, assisting MTN in creating shared value by further developing connectivity and digital and financial inclusion.
The IAB shares its perspectives on geopolitical matters which impact on the continued development of the regions in which we operate. It also assists MTN in our work to be a responsible and exemplary corporate citizen. The mandate of the IAB does not include operational matters.
His Excellency President Thabo Mbeki
Former President of the Republic of South Africa (Chair)
His Excellency President John Kufuor
Former President of Ghana
Dr Aisha AbdullahiFormer African Union
Commissioner for Political Affairs
Dr Mohammed ElBaradeiFormer Director General of the
International Atomic Energy Agency
Dr Momar NguerPresident of Marketing &
Services Total S.A. (France)
FeesThe annual fees for each member of the IAB are US$100 000. The fee for the chairman of the IAB is US$150 000.
Key focus areas in 2021In 2021, the IAB met once on 15 July 2021.
Among the key matters on which it deliberated were:> Areas of focus for expansion for MTN Group.
> Middle East relations. > Domestic security issues.
> Policy reforms. > Geopolitical risks.
> Emerging regulatory challenges.> Localisation.
> Pan-African positioning and identity.
In 2021, Phuthuma Nhleko resigned from the IAB, effective 4 September 2021 following his appointment to the board of one of MTN’s key suppliers. This was to avoid any perception and/or potential conflict of interest.
Doing for tomorrow, today
Doing for shared value
Strategic and financial review
Governance and remuneration
81
Integrated Report 2021
Our International Advisory Board

The Exco facilitates the effective control of the Group’s operational activities in terms of its delegated authority approved by the Board. It is responsible for recommendations to the Board on the Group’s policies and strategy and for monitoring its implementation in line with the Board’s mandate. It meets at least monthly, and more often as required. For detailed profiles of our Exco members, please refer to the website.
In support of the execution and acceleration of Ambition 2025, we announced an evolution to the Exco structure where MTN’s core connectivity business will be streamlined into South Africa, Nigeria and Markets (comprising of SEA, WECA and MENA), the legal and regulatory responsibilities are now consolidated into one and sustainability as well as strategy will form part of the Exco going forward.
Ebenezer Asante(Born 1968)
Senior Vice-President: Markets
Ralph Mupita (Born 1972)
Group President and CEO
Tsholofelo Molefe (Born 1968)
Group Chief Financial Officer
Jens Schulte-Bockum(Born 1966)
Group Chief Operating Officer
Ismail Jaroudi (Born 1970)
Vice-President: MENA
Yolanda Cuba (Born 1977)
Vice-President: SEA
Charles Molapisi (Born 1975)
Chief Executive Officer: MTN South Africa
Serigne Dioum (Born 1974) Group Chief
Fintech Officer
Ferdi Moolman (Born 1963)
Group Chief Risk Officer
Paul Norman (Born 1965)
Group Chief Human Resources Officer
Lele Modise (Born 1978)
Group Chief Legal and Regulatory Officer
Nompilo Morafo (Born 1979)
Group Chief Sustainability and
Corporate Affairs Officer
Karl Toriola (Born 1972)
Chief Executive Officer: MTN Nigeria
Mazen Mroué (Born 1971)
Group Chief Information and Technology Officer
Chika Ekeji(Born 1981)
Group Chief Strategy and Transformation Officer
Diversity by race
Diversity by nationality
Diversity by gender
25%Women
75%Men
Diversity by age(years)
35-40 41-45 46-50 >50
1 5 5 5
MTN continues to improve on Exco diversity. Following changes announced in December 2021, the committee now includes four women, and diverse ethnicities, ages, nationalities and skill sets.
Kholekile Ndamase (Born 1980)
Group Chief M&A and Business Development
Officer
Diversity by nationality
South African 56% International 44%
Diversity by race
Black 75% White 12.5%
Middle Eastern 12.5%
Stats are based on Exco at 31 March 2022
Doing for tomorrow, today
Doing for shared value
Strategic and financial review
Governance and remuneration
82
Integrated Report 2021
Our Executive Committee

MTN stakeholdersThis report has been prepared for our shareholders, employees, customers, partners and suppliers and the broader public.
Part I: Background84 The year in review
86 Shareholder engagement and voting results
88 Focus areas and closing remarks
Part II: Remuneration policy89 Our remuneration philosophy and principles
90 Overview of Total Reward elements
91 Detailed breakdown of Total Reward elements
92 Key changes to our remuneration framework
93 Approach to variable remuneration – short‑term incentives
96 Approach to variable remuneration – long‑term incentives
100 Executive pay mix and potential remuneration outcome scenarios
101 Shareholding requirements, malus and clawback and service contracts
103 Non‑executive director policy and fee determination
Part III: Implementation report106 Summary of key performance and leadership
changes
107 Guaranteed pay outcomes
108 STI outcomes
108 LTI outcomes
110 Single figure remuneration summary
110 Remuneration outcomes – Group President and CEO
112 Remuneration paid to executive directors, prescribed officers, regional VPs and select Exco members
114 Share allocations for executive directors, prescribed officers, regional VPs and select Exco members
118 Remuneration paid to non‑executive directors
ContentsRemuneration Report approvalThe Board has considered the integrity of this report and has concluded that it adequately provides material disclosures of the MTN Group’s remuneration policy and implementation thereof. This report was approved by the Board on 25 April 2022.
Structure of the reportTo improve the understanding of remuneration matters, we have amended the structure and content of the report to enhance the clarity of policies. The report is structured in three parts in line with the guidance of the King IV Report on Corporate Governance™ for South Africa, 2016 (King IV).
About this report The Remuneration Committee at a glanceThe Group Remuneration and Human Resources Committee (Remco, or ‘the committee’) has been mandated by the Board to independently oversee and approve the remuneration policies and human resource approach for MTN to ensure these are fair, consistent, compliant and provide an objective, independent and constructive view of the Company’s plans and decisions. The committee is responsible for evaluating and recommending to the Board critical strategic remuneration decisions.
In ensuring fair and responsible remuneration by the Group, the committee was comprised of six independent non‑executive director members until 31 May 2021 and five independent non‑executive directors from June 2021. The collective skills and experience profile of members includes telecommunications, finance, managing businesses in Africa and the Middle East, human capital, remuneration and risk management.
Doing for tomorrow, today
Doing for shared value
Strategic and financial review
Governance and remuneration
83
Integrated Report 2021
Remuneration report

Dear stakeholdersOn behalf of the Board, I am pleased to present our Remuneration Report for 2021.
IntroductionAs MTN works to deliver on its strategic intent of leading digital solutions for Africa’s progress, our ‘Live Inspired’ employee value proposition remains key.
In line with the evolution of our business and our Ambition 2025 strategy, MTN introduced a refreshed organisation‑wide approach, that involved a shift away from conventional ways of working into the new normal. This meant repositioning and attracting new skills and adopting a more agile, decentralised and empowering culture. Recognising that employees value choice and flexibility, we entrenched smart‑working principles such as Anywhere, Anytime flexibility and balanced work‑life. This will continue to be a key component of our overall employee value proposition.
To future‑proof MTN and capitalise on our move towards a digital‑adopter mindset and flexi‑workforce, we are shifting our thinking from traditional reward to creative reward employee sustainable engagement approaches. This will ensure that our reward offerings, practices and policies evolve, remain relevant and stay true to the business requirements.
Business performanceWe continue to optimise our portfolio to deliver on our strategic intent of leading digital solutions for Africa’s progress.
At the end of 2021, we had 272 million subscribers across our 19 markets.
The return to shareholders, measured as the 30‑day weighted total shareholder return (TSR), which includes both share appreciation and declared dividends, was 155% in 2021. This was a turnaround from 2020 (‑19.9%) and materially up from 2019 (7.2%). This places MTN as the top performing company by TSR in the MSCI EM Communication Services Index, driven by the sharp increase in the share price over the year. This stands testament to our efforts to create shared value.
The committee continues to make every effort to act in accordance with the interest and benefits of shareholders to improve shareholder alignment.
Performance, reward and cultureWe continued our drive of enabling a high performance and rewarding culture at work. Our engagements with employees through various platforms on culture and reward matters, transformed many of our human capital metrics. Multiple interventions beyond the traditional performance management approach were implemented to ensure that each MTNer is driven by purpose and is aligned with the Group’s Ambition 2025.
Throughout the year, we encouraged employees to strive for team collaboration and to be driven by a larger purpose and contribute to the organisation’s success in the long run.
Here are a few highlights of our key human capital metrics:
Achieved all PSP scheme conditions100%
Launched our refreshed employee value proposition
Ranked 1st in Africa MTN's overall rank improved by 287 positions to 132
Maintained YoY and in-line with global Telco Norm
80%
EMPLOYEE SUSTAINABLE ENGAGEMENT
FORBES WORLDSBEST EMPLOYER
LAUNCH OF NEW EVPLive inspired
FULL VESTING OF PERFORMANCE SHARES
Gender diversityOur journey towards a deliberate diversity and inclusion approach and plan has been central to MTN’s people agenda. Highlights of our commitments in 2021 include:• Workforce gender equality by 2030.• Gender pay parity as a measure to enhance diversity,
equality and inclusion.• Deliberate gender representation in our strategic
programmes: at least 30% women representation in business transformations, upskilling programmes and specialised initiatives that form part of Ambition 2025.
We are also committed to improving the representation of differently abled communities, with our long and short‑term targets linked to strategy and performance.
Chairman Khotso Mokhele
Part I: Background
Doing for tomorrow, today
Doing for shared value
Strategic and financial review
Governance and remuneration
84
Integrated Report 2021
Remuneration report continued

The committee had four scheduled meetings and one workshop on succession planning. The committee is constituted by the following members:
Dr Khotso MokheleBSc (Agriculture), MSc (Food Science), PhD (Microbiology) and a number of honorary doctorates from various institutions
Appointed effectively from 1 July 2018
Attended all four meetings and one workshop
Bajabulile Swazi TshabalalaMasters in Business Administration, Oxford Fintech Programme
Appointed effectively from 1 July 2019
Attended two meetings and one workshop
Mcebisi Hubert JonasBachelor of Arts in History and Sociology, Higher Diploma in Education
Appointed effectively from 1 July 2019
Attended four meetings and one workshop
Vincent RagueMBA, BA; Hons – Econ/Statistics, Executive development programmes
Appointed effectively from 1 July 2019
Attended four meetings, did not attended workshop
Nkululeko Leonard SowaziMasters Degree
Appointed effectively from 1 November 2016
Attended four meetings and one workshop
Azmi Mikati (he was a member until 28 May 2021)B Engineering
Appointed effectively from 18 July 2016
Attended one meeting only
MandateThe committee oversees the formulation of a remuneration philosophy and human resources approach, ensuring that MTN remunerates fairly and transparently. It also ensures that MTN employs and retains the best human capital for its business needs and maximises the potential of its employees.
Focus areasMTN’s remuneration policies aim to ensure that the Company has the right reward levers to remain relevant, are aligned to recommendations of King IV and best practice and that benchmarks are appropriately set to maintain market competitiveness and alignment to corporate goals.
We focus on ensuring that MTN’s remuneration strategies and policies are designed to attract, motivate and retain quality employees, senior management and directors committed to achieving the overall goals of the Company.
Key features of 2021In 2021, the committee reviewed and approved the following key remuneration decisions and policy developments:• 2021 Remuneration Report enhancements.• Targeted remuneration policy elements and changes.• Group annual performance bonus policy and changes.• Group performance management framework changes.• Annual Group share allocations under the employee share
ownership plan (ESOP) and performance share plan (PSP) scheme, including establishment of the ESOP and PSP scheme for MTN Nigeria and MTN Ghana.
• Salary increases for executive directors, general executives, non‑executive management and non‑management employees.
• Annual target setting, performance scorecard outcomes and pay‑outs for short‑term incentives (STIs) and long‑term incentives (LTIs).
• Benchmarking process and proposed annual fees for non‑executive directors.
• Review and refinement of malus and clawback provisions and minimum shareholding requirements.
• Review of succession planning for executive management and closing of gender pay gap.
• Group ‘anywhere anytime flexibility work policy’.• Environmental, Social and Governance (ESG) performance
conditions.• Repositioning of our employee value proposition (EVP).• Approval of a COVID‑19 vaccine policy.
Outcomes of remuneration reviewOur 2021 remuneration outcomes are summarised below:
Annual fixed remuneration review• For 2021 pay reviews, we approved a 2.38% increase for
executive management. For non‑executive management, an average of 2.42% was approved and for non‑management employees an average of 3.66% was approved. Expatriate employees were allotted a 1% increase. An increase towards the market median, capped at 2%, was awarded to NED fees.
Short-term incentives• The overall actual weighted company performance
(CP), comprising financial and non‑financial measures was 19% above budget.
• The actual average of business unit or team performances across financial and non‑financial measures was marginally above 100%.
STI outcomes (%)
128108 110
144
110
Group attributable
earnings
Service revenue
EBITDA Net operating cash flow
Nonfinancial – competitive
performance
■ Achievement ■ Threshold ■ Target ■ Maximum
11010090
Long-term incentives• Our performance shares allocated in 2018 under the
PSP vested in December 2021 with an overall actual achievement of 100% of the three‑year target for all participating employees.
These remuneration outcomes were aligned to our remuneration philosophy and cognisant of the expectations of our many stakeholders.
TSR (rank)Vesing
100%
Cashflow (Rm) ROACE (%)
Th
resh
old
Ta
rge
t
Act
ua
l
19
10
7
Th
resh
old
Ta
rge
t
Act
ua
l
13
86
0
16
94
0 21
27
7
Th
resh
old
Ta
rge
t
Act
ua
l
17
.5 19
.5
20
.2
Remuneration Committee composition
Doing for tomorrow, today
Doing for shared value
Strategic and financial review
Governance and remuneration
85
Integrated Report 2021
Remuneration report continued
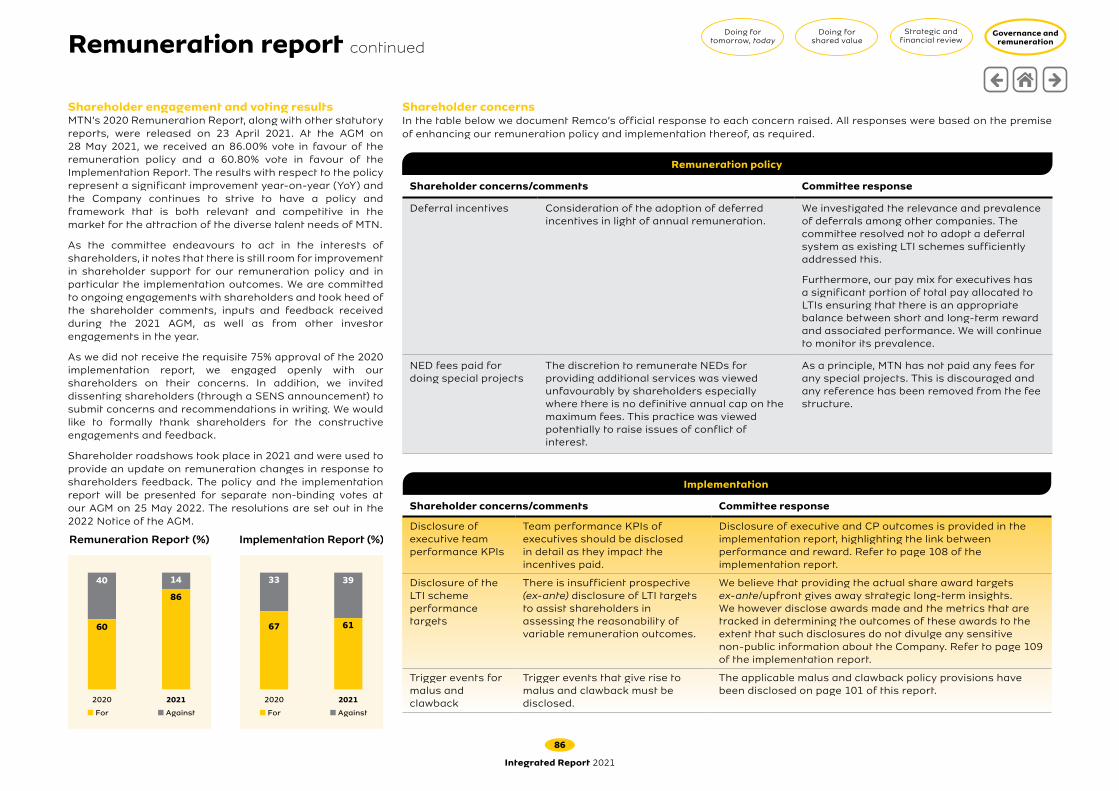
Shareholder engagement and voting resultsMTN’s 2020 Remuneration Report, along with other statutory reports, were released on 23 April 2021. At the AGM on 28 May 2021, we received an 86.00% vote in favour of the remuneration policy and a 60.80% vote in favour of the Implementation Report. The results with respect to the policy represent a significant improvement year‑on‑year (YoY) and the Company continues to strive to have a policy and framework that is both relevant and competitive in the market for the attraction of the diverse talent needs of MTN.
As the committee endeavours to act in the interests of shareholders, it notes that there is still room for improvement in shareholder support for our remuneration policy and in particular the implementation outcomes. We are committed to ongoing engagements with shareholders and took heed of the shareholder comments, inputs and feedback received during the 2021 AGM, as well as from other investor engagements in the year.
As we did not receive the requisite 75% approval of the 2020 implementation report, we engaged openly with our shareholders on their concerns. In addition, we invited dissenting shareholders (through a SENS announcement) to submit concerns and recommendations in writing. We would like to formally thank shareholders for the constructive engagements and feedback.
Shareholder roadshows took place in 2021 and were used to provide an update on remuneration changes in response to shareholders feedback. The policy and the implementation report will be presented for separate non‑binding votes at our AGM on 25 May 2022. The resolutions are set out in the 2022 Notice of the AGM.
Shareholder concernsIn the table below we document Remco’s official response to each concern raised. All responses were based on the premise of enhancing our remuneration policy and implementation thereof, as required.
Remuneration policy
Shareholder concerns/comments Committee response
Deferral incentives Consideration of the adoption of deferred incentives in light of annual remuneration.
We investigated the relevance and prevalence of deferrals among other companies. The committee resolved not to adopt a deferral system as existing LTI schemes sufficiently addressed this.
Furthermore, our pay mix for executives has a significant portion of total pay allocated to LTIs ensuring that there is an appropriate balance between short and long‑term reward and associated performance. We will continue to monitor its prevalence.
NED fees paid for doing special projects
The discretion to remunerate NEDs for providing additional services was viewed unfavourably by shareholders especially where there is no definitive annual cap on the maximum fees. This practice was viewed potentially to raise issues of conflict of interest.
As a principle, MTN has not paid any fees for any special projects. This is discouraged and any reference has been removed from the fee structure.
Implementation
Shareholder concerns/comments Committee response
Disclosure of executive team performance KPIs
Team performance KPIs of executives should be disclosed in detail as they impact the incentives paid.
Disclosure of executive and CP outcomes is provided in the implementation report, highlighting the link between performance and reward. Refer to page 108 of the implementation report.
Disclosure of the LTI scheme performance targets
There is insufficient prospective (ex-ante) disclosure of LTI targets to assist shareholders in assessing the reasonability of variable remuneration outcomes.
We believe that providing the actual share award targets ex-ante/upfront gives away strategic long‑term insights.We however disclose awards made and the metrics that are tracked in determining the outcomes of these awards to the extent that such disclosures do not divulge any sensitive non‑public information about the Company. Refer to page 109 of the implementation report.
Trigger events for malus and clawback
Trigger events that give rise to malus and clawback must be disclosed.
The applicable malus and clawback policy provisions have been disclosed on page 101 of this report.
Implementation Report (%)
67 61
33 39
2020 2021
■ For ■ Against
Remuneration Report (%)
60
86
40 14
2020 2021
■ For ■ Against
Doing for tomorrow, today
Doing for shared value
Strategic and financial review
Governance and remuneration
86
Integrated Report 2021
Remuneration report continued

Our commitment to shareholders and alignment with voting guidelinesWe are committed to documenting a remuneration policy and implementation report that is transparent and provides for the full disclosure of all material facts that are relevant to the Group’s ongoing business operations and that informs shareholder voting.
To this end, we have also reviewed the voting policy guidelines from prominent proxy advisory services and ensured alignment to these guidelines, a summary of which is provided here:
Theme/consideration for positive voting outcome MTN alignment
Executive remuneration and pay for performance• There is no evidence of excessive
remuneration i.e., any fixed and variable remuneration opportunities perceived as relatively high must have adequate justification.
• Incentive (LTI and STI) outcomes must be tied to performance of the Company and incentive payments must be aligned with the remuneration policy framework.
• Our remuneration decisions are informed by market information on comparator companies, which guides us in setting the appropriate mix of fixed and variable pay. Our pay structure and remuneration outcomes indicate that remuneration is fair and not excessive, with a high proportion of ‘at risk’ performance‑driven variable pay. Refer to page 100 for executive directors’ pay mix.
• Both our LTI and STI schemes comprise performance conditions to support our strategy. There is a clear link on remuneration paid at minimum, threshold, target, and above‑target performance outcomes.
• Pay‑outs outlined in the implementation report are consistent with the remuneration policy and the application thereof, with our policy formulated to drive our strategy and deliver long‑term value to shareholders and stakeholders.
Service contracts and policies• There should be no ex-gratia, sign‑on,
retention or other non‑contractual payments made without adequate justification.
• Abnormally high termination payments have been fully explained and justified.
• Unvested incentives should not be allowed to vest without respect of time elapsed or performance achieved.
• Ex-gratia, sign‑on, retention or other non‑contractual payments have not been made without any justification. Refer to Implementation Report, the emoluments section for explanatory notes of all remuneration paid.
• Severance provisions of the executive directors’ service contracts, including any potential termination payments, have been disclosed.
• Incentives awarded to executives are all performance‑linked and will not vest without concomitant performance.
Application of PolicyRemuneration‑related policy decisions must be aligned with shareholder interests.
• All material remuneration decisions received approval from the Board and our shareholders at our AGM. Where concerns were noted, engagements were held with shareholders through various platforms. With our continued commitment to engaging shareholders, we believe this will further strengthen the formulation and delivery of our policies.
We are satisfied with the thoroughness with which we have considered all remuneration elements in relation to global best practice and aligned where relevant for MTN.
Our fight against COVID-19
The Committee approved several COVID‑19 relief measures in the form of:• Wellness week – where five wellness days’ leave was
granted to all staff members that could be taken at their discretion, subject to subsidiary management approval.
• Flexible working – approved the Group ‘anywhere anytime flexible policy’ across the Group. The formal launch was held in early 2022.
• COVID‑19 vaccination – establishment of an onsite vaccination site for employees and their families.
• Recognition – several employee appreciation initiatives.• Enhanced remuneration – payment of an additional
bonus for lower‑level employees.
Information access and external advisersMembers of the committee may access any information to inform their independent judgement on remuneration and related matters. This includes any impact that might arise regarding risk, regulation, compliance, control or conduct.
All strategic reward decisions are prepared and guided by our executive management team for approval by the committee. The Remco has delegated approval authority at various levels, with roles and responsibilities.
The committee contracted the following service providers and consultancies for independent external advice:• DG Capital• PwC• Remchannel• Vasdex• Deloitte
The Remco is satisfied with their independence and objectivity.
Doing for tomorrow, today
Doing for shared value
Strategic and financial review
Governance and remuneration
87
Integrated Report 2021
Remuneration report continued

Regulatory complianceOur reporting aligns with the South African Companies Act requirements, the principles and recommended practices of King IV and the related Johannesburg Stock Exchange (JSE) Listings Requirements. We have been mindful of broader remuneration governance guidance and frameworks and will maintain compliance to relevant developments as and when they mature, including the proposed changes to the Companies Amendment Act, 2008, which were recently published for public commentary.
We continue to engage with regulators regarding evolving remuneration governance and good practice requirements. Aligned to King IV, the Group will engage with shareholders in the event of a vote of over 25% against our remuneration policy or implementation report.
In closingI believe the committee has responded well to challenges faced in the year and has executed its duties with great care. The most recent independent Board effectiveness review found that the committee is proactive and engaged and that deliberations are balanced and representative of diverse views. The committee is satisfied that it has fulfilled its responsibilities in accordance with its terms of reference and that the objectives of the Group remuneration policy have been met without material deviation. I thank you for your support and continued feedback and look forward to future engagements.
Dr Khotso MokheleChair: Human Capital and Remuneration Committee
Key focus areas for 2022• Strengthening remuneration governance frameworks.
• Continuing with policy and reward structure reviews and improvements to ensure MTN has a market‑leading and relevant
offering to employees, with specific focus on:
> Fintech business and associated rewards.
> Gender pay gap.
> Review of share schemes for non‑listed operations and any future operations listings.
• Further improving our internal employee sustainable engagement rating.
• Facilitating the adoption and understanding of ESG as a new metric across our operations.
• Launch our Group ‘anywhere anytime flexible policy’.
Doing for tomorrow, today
Doing for shared value
Strategic and financial review
Governance and remuneration
88
Integrated Report 2021
Remuneration report continued
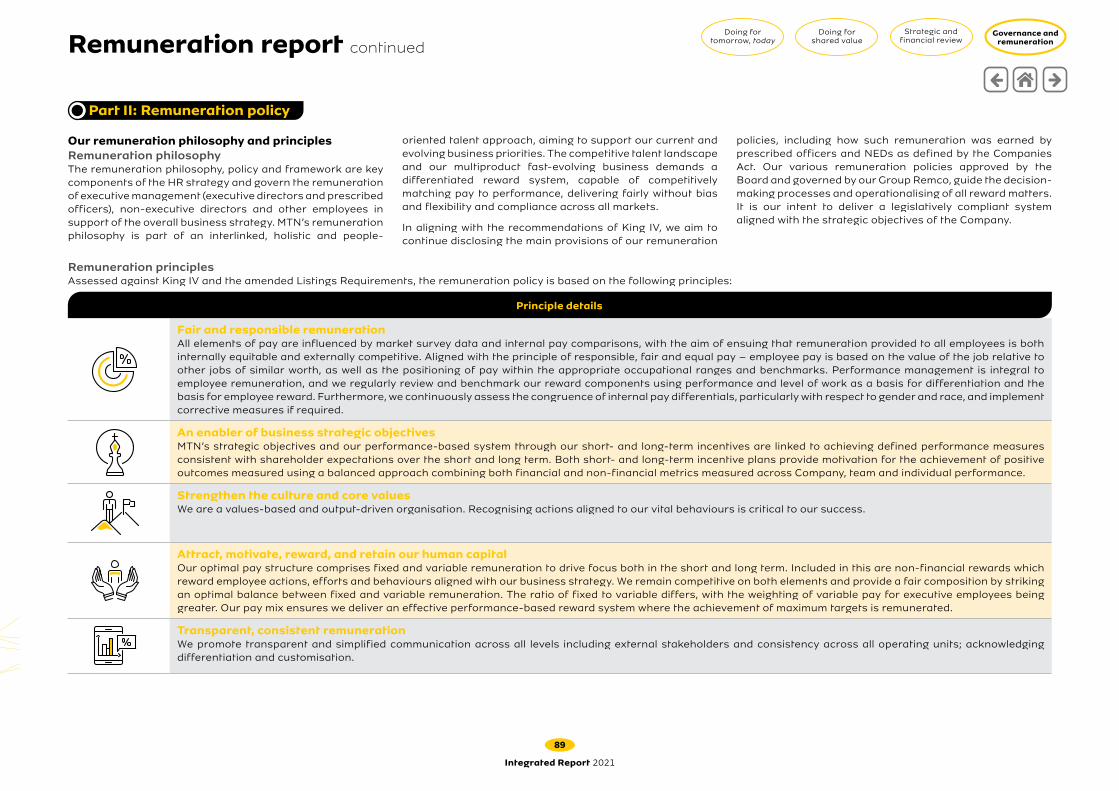
Our remuneration philosophy and principlesRemuneration philosophyThe remuneration philosophy, policy and framework are key components of the HR strategy and govern the remuneration of executive management (executive directors and prescribed officers), non‑executive directors and other employees in support of the overall business strategy. MTN’s remuneration philosophy is part of an interlinked, holistic and people‑
oriented talent approach, aiming to support our current and evolving business priorities. The competitive talent landscape and our multiproduct fast‑evolving business demands a differentiated reward system, capable of competitively matching pay to performance, delivering fairly without bias and flexibility and compliance across all markets.
In aligning with the recommendations of King IV, we aim to continue disclosing the main provisions of our remuneration
policies, including how such remuneration was earned by prescribed officers and NEDs as defined by the Companies Act. Our various remuneration policies approved by the Board and governed by our Group Remco, guide the decision‑making processes and operationalising of all reward matters. It is our intent to deliver a legislatively compliant system aligned with the strategic objectives of the Company.
Remuneration principlesAssessed against King IV and the amended Listings Requirements, the remuneration policy is based on the following principles:
Principle details
Fair and responsible remunerationAll elements of pay are influenced by market survey data and internal pay comparisons, with the aim of ensuing that remuneration provided to all employees is both internally equitable and externally competitive. Aligned with the principle of responsible, fair and equal pay – employee pay is based on the value of the job relative to other jobs of similar worth, as well as the positioning of pay within the appropriate occupational ranges and benchmarks. Performance management is integral to employee remuneration, and we regularly review and benchmark our reward components using performance and level of work as a basis for differentiation and the basis for employee reward. Furthermore, we continuously assess the congruence of internal pay differentials, particularly with respect to gender and race, and implement corrective measures if required.
An enabler of business strategic objectivesMTN’s strategic objectives and our performance‑based system through our short‑ and long‑term incentives are linked to achieving defined performance measures consistent with shareholder expectations over the short and long term. Both short‑ and long‑term incentive plans provide motivation for the achievement of positive outcomes measured using a balanced approach combining both financial and non‑financial metrics measured across Company, team and individual performance.
Strengthen the culture and core valuesWe are a values‑based and output‑driven organisation. Recognising actions aligned to our vital behaviours is critical to our success.
Attract, motivate, reward, and retain our human capitalOur optimal pay structure comprises fixed and variable remuneration to drive focus both in the short and long term. Included in this are non‑financial rewards which reward employee actions, efforts and behaviours aligned with our business strategy. We remain competitive on both elements and provide a fair composition by striking an optimal balance between fixed and variable remuneration. The ratio of fixed to variable differs, with the weighting of variable pay for executive employees being greater. Our pay mix ensures we deliver an effective performance‑based reward system where the achievement of maximum targets is remunerated.
Transparent, consistent remunerationWe promote transparent and simplified communication across all levels including external stakeholders and consistency across all operating units; acknowledging differentiation and customisation.
Part II: Remuneration policy
Doing for tomorrow, today
Doing for shared value
Strategic and financial review
Governance and remuneration
89
Integrated Report 2021
Remuneration report continued

Total Rewards Framework and componentsOur reward policies and structures are designed to attract, engage, retain, and motivate our workforce. MTN’s reward framework is holistic and encompasses multiple elements that make up a total reward value proposition that strives to achieve an appropriate mix of reward elements for our employees.
Our structure is comprised of the following key elements:• Annual fixed package – consisting of fixed pay and benefits, benchmarked to the general market and industry comparatives.• Short-term incentives – variable pay consisting of STIs based on the achievement of a combination of Company, team, and individual performance, where applicable.• Long-term incentives – variable pay consisting of LTIs based on the Company’s success in achieving its long‑term objectives.• Non-financial rewards – consisting of qualitative programmes that recognise and celebrate high performance by giving special attention to employee actions, efforts, and behaviours in
support of our business strategy by reinforcing behaviours that contribute to organisational success. This is enabled through our flexible workplace and recognition policies.
The diagram below illustrates our total rewards framework.
Annual fixed package Short-term incentives Long-term incentives Additional rewards
Fixed pay
Based on grade
market pay levels
(general and
industry specific)
and experience
Retirement fund,
disability and death
plans and medical aid
(all based on flexible
contribution levels
Short‑term incentive
awards based on the
achievement of a
combination of
Company, team and/or
individual performance
(as applicable)
Long‑term incentive
awards based on the
Company's success
in implementing its
objectives
Employer provided
benefits such as
lifestyle benefits etc
Driving recognition
between employees
within and across
the business
Maintaining employee
job satisfaction and
achieving a balance
of demands and
quality of life
BenefitsAnnual
performance bonusShare scheme
allocations and awardsIn-kind benefits Recognition Workplace flexibility
Total reward framework
Doing for tomorrow, today
Doing for shared value
Strategic and financial review
Governance and remuneration
90
Integrated Report 2021
Remuneration report continued
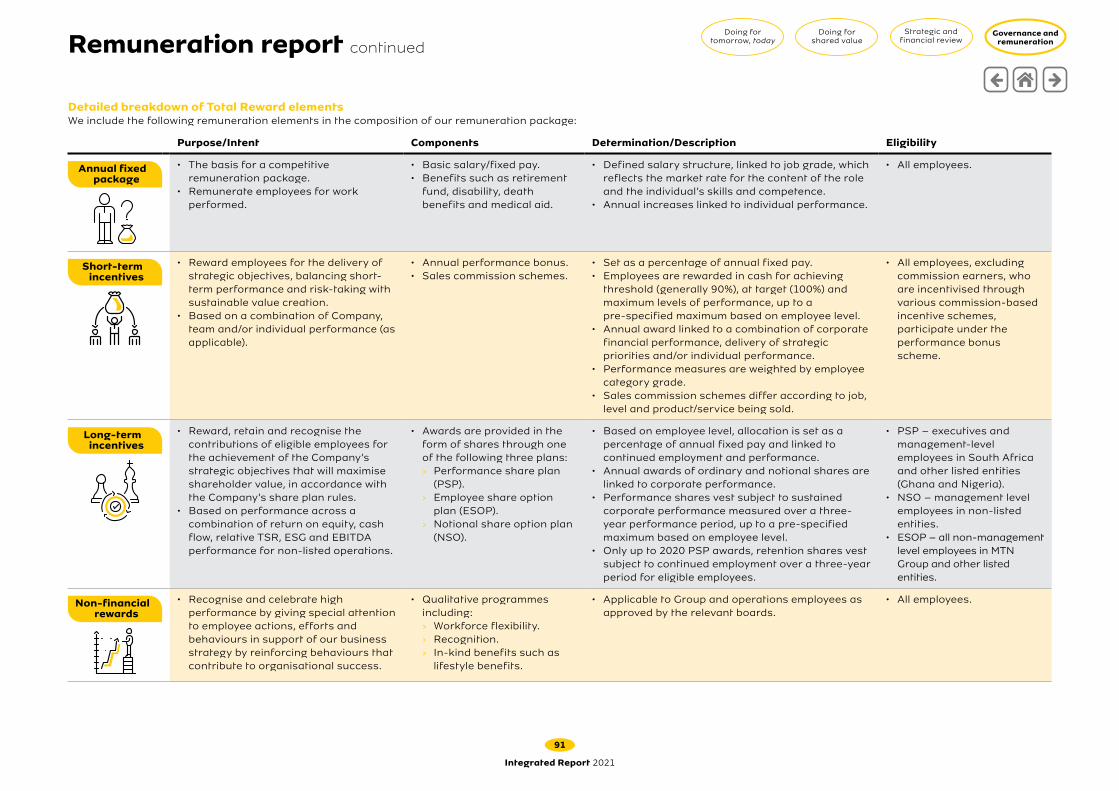
Detailed breakdown of Total Reward elementsWe include the following remuneration elements in the composition of our remuneration package:
Purpose/Intent Components Determination/Description Eligibility
Annual fixed package
• The basis for a competitive remuneration package.
• Remunerate employees for work performed.
• Basic salary/fixed pay.• Benefits such as retirement
fund, disability, death benefits and medical aid.
• Defined salary structure, linked to job grade, which reflects the market rate for the content of the role and the individual’s skills and competence.
• Annual increases linked to individual performance.
• All employees.
Short-term incentives
• Reward employees for the delivery of strategic objectives, balancing short‑term performance and risk‑taking with sustainable value creation.
• Based on a combination of Company, team and/or individual performance (as applicable).
• Annual performance bonus.• Sales commission schemes.
• Set as a percentage of annual fixed pay.• Employees are rewarded in cash for achieving
threshold (generally 90%), at target (100%) and maximum levels of performance, up to a pre‑specified maximum based on employee level.
• Annual award linked to a combination of corporate financial performance, delivery of strategic priorities and/or individual performance.
• Performance measures are weighted by employee category grade.
• Sales commission schemes differ according to job, level and product/service being sold.
• All employees, excluding commission earners, who are incentivised through various commission‑based incentive schemes, participate under the performance bonus scheme.
Long-term incentives
• Reward, retain and recognise the contributions of eligible employees for the achievement of the Company’s strategic objectives that will maximise shareholder value, in accordance with the Company’s share plan rules.
• Based on performance across a combination of return on equity, cash flow, relative TSR, ESG and EBITDA performance for non‑listed operations.
• Awards are provided in the form of shares through one of the following three plans: › Performance share plan
(PSP). › Employee share option
plan (ESOP). › Notional share option plan
(NSO).
• Based on employee level, allocation is set as a percentage of annual fixed pay and linked to continued employment and performance.
• Annual awards of ordinary and notional shares are linked to corporate performance.
• Performance shares vest subject to sustained corporate performance measured over a three‑year performance period, up to a pre‑specified maximum based on employee level.
• Only up to 2020 PSP awards, retention shares vest subject to continued employment over a three‑year period for eligible employees.
• PSP – executives and management‑level employees in South Africa and other listed entities (Ghana and Nigeria).
• NSO – management level employees in non‑listed entities.
• ESOP – all non‑management level employees in MTN Group and other listed entities.
Non-financial rewards
• Recognise and celebrate high performance by giving special attention to employee actions, efforts and behaviours in support of our business strategy by reinforcing behaviours that contribute to organisational success.
• Qualitative programmes including: › Workforce flexibility. › Recognition. › In‑kind benefits such as
lifestyle benefits.
• Applicable to Group and operations employees as approved by the relevant boards.
• All employees.
Doing for tomorrow, today
Doing for shared value
Strategic and financial review
Governance and remuneration
91
Integrated Report 2021
Remuneration report continued

Change 1: Performance share plan
To align with our business strategy, the Board approved the following changes to the Company’s PSP scheme:• The 25% non‑performance retention element was discontinued for all employees
participating in the PSP scheme effective from the December 2021 share allocation.• The ESG metric was introduced for all employees and has been further embedded in our
executive scorecards across the Group.
Change 2: Disclosure of LTI conditionsAt the last AGM, shareholders raised a concern that performance conditions related to the Company’s PSP were insufficiently disclosed. A request was made to consider disclosing the absolute performance targets upfront. After a benchmark and assessment of the request, the committee resolved as follows:• The TSR metric will be disclosed ex-ante (upfront) in ranking terms to MSCI peer comparator
companies.• The return on equity (ROE) metric will be disclosed ex-ante (upfront), aligning with the
medium‑term guidance published annually.• The cash flow metric will be disclosed ex-ante (upfront) relative to the business plan.
However, for reasons of confidentiality, there will be no absolute statement of the three‑year cashflow target.
Upon vesting of the shares after three years, all the historical performance targets and actual performance achievements will be disclosed under the implementation report as this will be public information. Refer to page 109 of the implementation report for the 2021 performance and vesting outcomes.
Change 3: Malus and clawbackAs applicable to the Malus and Clawback Trigger Policy, trigger events that give rise to either malus or clawback are disclosed on page 101.
Performance management/salary increases/short-term incentives• Following the review of our performance management framework, the
Board resolved that employee performance as a component of calculating performance bonuses be replaced with talent outcomes, which evaluate employee’s potential categorised as i) unique contributors, ii) continue to grow and develop, or iii) needs improvement.
• Further to this change, our annual salary increases effective 1 January 2022 are now based on individual talent outcomes and broader macroeconomic and business factors.
• Our annual performance bonus will now be calculated to exclude the individual component i.e., talent outcomes. Only the Company and business unit/team performance will be used for calculating bonuses.
• This review was rolled out to six of our operations. The remaining operations are planned for 2022 onwards.
Review of STI and LTI parameters for Tier 1 CEOs and Senior VPIn recognition of the Tier 1 CEOs (i.e., MTN South Africa and MTN Nigeria) and the Senior VP as material risk‑takers, and taking into consideration the Tier 1 contribution to the Group revenue (59%) and significant cashflows, their STI and LTI awards were equated to that of the Group CFO and Group COO.
Changes addressing shareholder concernsGeneral changes to our remuneration framework
Doing for tomorrow, today
Doing for shared value
Strategic and financial review
Governance and remuneration
92
Integrated Report 2021
Remuneration report continued

Financial performance
Company Performance (CP)
Financial performance looks at four key categories for executives that are extracted from the Board‑approved business plan and carry equal weighting. These are service revenue; EBITDA; operating free cash flow (OFCF); and Group attributable earnings.
CP Measurement Weighting
Description of objective and link to business strategy
Below threshold
%Threshold
%At target
%Maximum
%
Group management
company %
Subsidiary%
Financial Element
Service Revenue A key indicator reflective of the sales performance of our services with respect to the overall Group strategy and business objectives. < 90 90 100 110 20 25
EBITDA^ EBITDA is earnings before interest, taxation, depreciation and amortisation. In simple terms, it is the net income power of the Company through its operations. It measures earnings that can be generated if MTN had zero debt, no tax burden and does not have any goods whose value depreciates over time. < 90 90 100 110 20 25
Operating free cash flow
Represents the cash generated by the Company after cash outflows to support operations and maintain its capital assets. < 90 90 100 110 20 25
Group attributable earnings
Part of the Company’s profit, which is ‘attributable’ to the ordinary shareholders. In other words, after the normal operating expenses have been deducted, together with finance costs, extraordinary items, taxation and preference dividends. < 90 90 100 110 20 –
^ Effective 2022 financial year, EBITDA was replaced with EBIT.
Except for sales commission employees, all other employees participate in an annual performance-based bonus plan. For executive employees, performance is measured on two levels, namely (i) Company performance (element 1) and (ii) team performance (element 2).
Malus and clawback provisions apply to all awards and across all participants of the annual performance bonus scheme.
Our approach to variable pay: STIs
Doing for tomorrow, today
Doing for shared value
Strategic and financial review
Governance and remuneration
93
Integrated Report 2021
Remuneration report continued
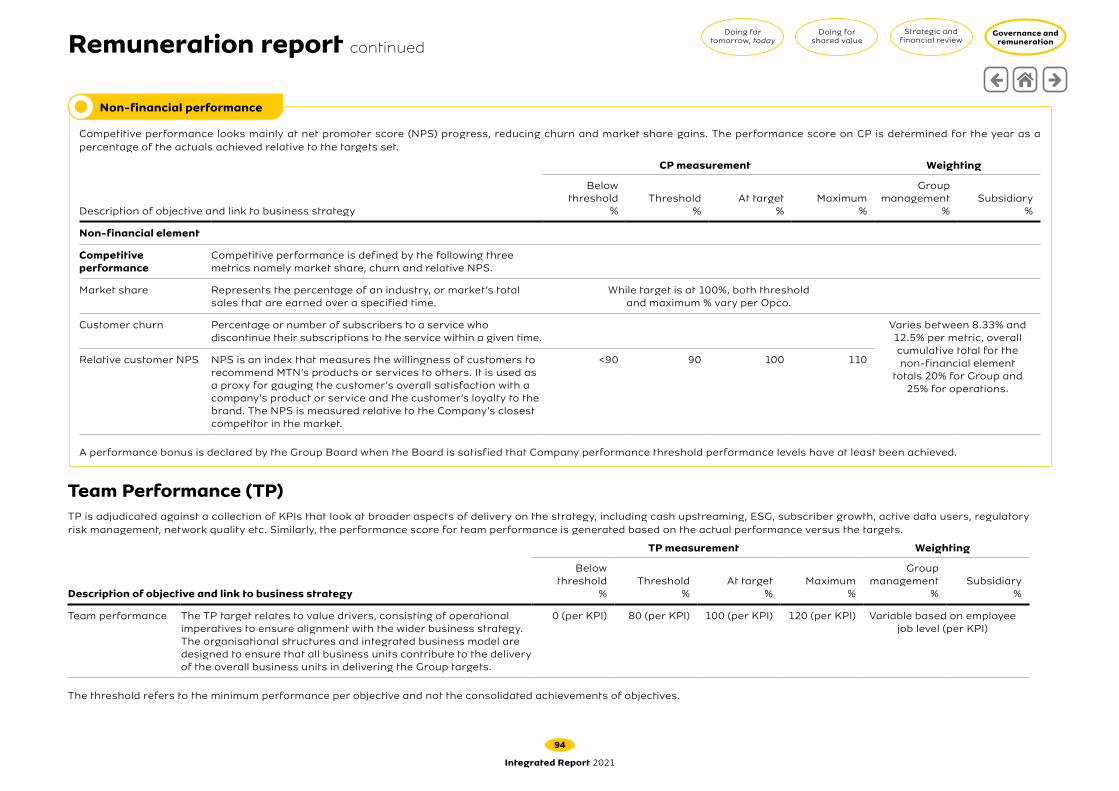
Non-financial performance
Competitive performance looks mainly at net promoter score (NPS) progress, reducing churn and market share gains. The performance score on CP is determined for the year as a percentage of the actuals achieved relative to the targets set.
CP measurement Weighting
Description of objective and link to business strategy
Below threshold
%Threshold
%At target
%Maximum
%
Group management
%Subsidiary
%
Non-financial element
Competitive performance
Competitive performance is defined by the following three metrics namely market share, churn and relative NPS.
Market share Represents the percentage of an industry, or market’s total sales that are earned over a specified time.
While target is at 100%, both threshold and maximum % vary per Opco.
Customer churn Percentage or number of subscribers to a service who discontinue their subscriptions to the service within a given time.
Varies between 8.33% and 12.5% per metric, overall cumulative total for the non‑financial element
totals 20% for Group and 25% for operations.
Relative customer NPS NPS is an index that measures the willingness of customers to recommend MTN’s products or services to others. It is used as a proxy for gauging the customer’s overall satisfaction with a company’s product or service and the customer’s loyalty to the brand. The NPS is measured relative to the Company’s closest competitor in the market.
<90 90 100 110
A performance bonus is declared by the Group Board when the Board is satisfied that Company performance threshold performance levels have at least been achieved.
Team Performance (TP)TP is adjudicated against a collection of KPIs that look at broader aspects of delivery on the strategy, including cash upstreaming, ESG, subscriber growth, active data users, regulatory risk management, network quality etc. Similarly, the performance score for team performance is generated based on the actual performance versus the targets.
TP measurement Weighting
Description of objective and link to business strategy
Below threshold
%Threshold
%At target
%Maximum
%
Group management
%Subsidiary
%
Team performance The TP target relates to value drivers, consisting of operational imperatives to ensure alignment with the wider business strategy. The organisational structures and integrated business model are designed to ensure that all business units contribute to the delivery of the overall business units in delivering the Group targets.
0 (per KPI) 80 (per KPI) 100 (per KPI) 120 (per KPI) Variable based on employee job level (per KPI)
The threshold refers to the minimum performance per objective and not the consolidated achievements of objectives.
Doing for tomorrow, today
Doing for shared value
Strategic and financial review
Governance and remuneration
94
Integrated Report 2021
Remuneration report continued
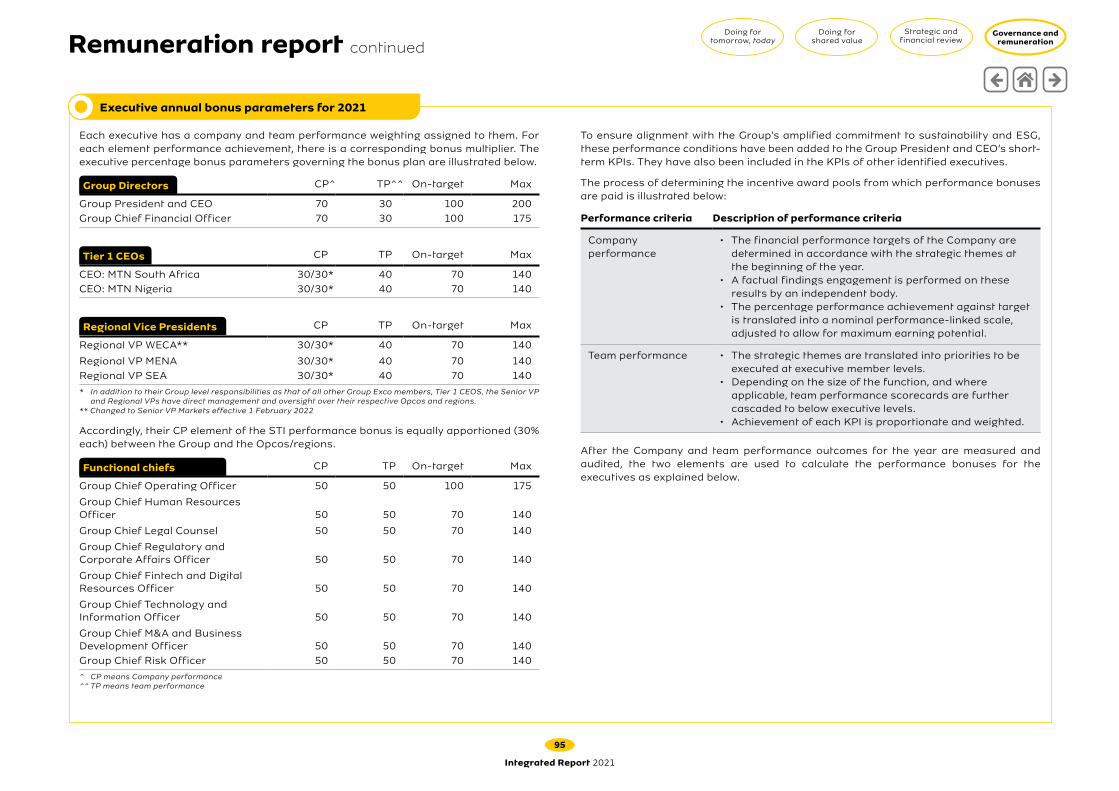
Executive annual bonus parameters for 2021
Each executive has a company and team performance weighting assigned to them. For each element performance achievement, there is a corresponding bonus multiplier. The executive percentage bonus parameters governing the bonus plan are illustrated below.
Group Directors CP^ TP^^ On‑target Max
Group President and CEO 70 30 100 200Group Chief Financial Officer 70 30 100 175
Tier 1 CEOs CP TP On‑target Max
CEO: MTN South Africa 30/30* 40 70 140CEO: MTN Nigeria 30/30* 40 70 140
Regional Vice Presidents CP TP On‑target Max
Regional VP WECA** 30/30* 40 70 140
Regional VP MENA 30/30* 40 70 140Regional VP SEA 30/30* 40 70 140
* In addition to their Group level responsibilities as that of all other Group Exco members, Tier 1 CEOS, the Senior VP and Regional VPs have direct management and oversight over their respective Opcos and regions.
** Changed to Senior VP Markets effective 1 February 2022
Accordingly, their CP element of the STI performance bonus is equally apportioned (30% each) between the Group and the Opcos/regions.
Functional chiefs CP TP On‑target Max
Group Chief Operating Officer 50 50 100 175
Group Chief Human Resources Officer 50 50 70 140
Group Chief Legal Counsel 50 50 70 140
Group Chief Regulatory and Corporate Affairs Officer 50 50 70 140
Group Chief Fintech and Digital Resources Officer 50 50 70 140
Group Chief Technology and Information Officer 50 50 70 140
Group Chief M&A and Business Development Officer 50 50 70 140Group Chief Risk Officer 50 50 70 140
^ CP means Company performance^^ TP means team performance
To ensure alignment with the Group’s amplified commitment to sustainability and ESG, these performance conditions have been added to the Group President and CEO’s short‑term KPIs. They have also been included in the KPIs of other identified executives.
The process of determining the incentive award pools from which performance bonuses are paid is illustrated below:
Performance criteria Description of performance criteria
Company performance
• The financial performance targets of the Company are determined in accordance with the strategic themes at the beginning of the year.
• A factual findings engagement is performed on these results by an independent body.
• The percentage performance achievement against target is translated into a nominal performance‑linked scale, adjusted to allow for maximum earning potential.
Team performance • The strategic themes are translated into priorities to be executed at executive member levels.
• Depending on the size of the function, and where applicable, team performance scorecards are further cascaded to below executive levels.
• Achievement of each KPI is proportionate and weighted.
After the Company and team performance outcomes for the year are measured and audited, the two elements are used to calculate the performance bonuses for the executives as explained below.
Doing for tomorrow, today
Doing for shared value
Strategic and financial review
Governance and remuneration
95
Integrated Report 2021
Remuneration report continued

How a bonus is calculated
1. For each executive, CP and TP elements are used as inputs to a bonus calculation.2. Targets for each element are set at the beginning of the performance cycle and measured at the end of the performance cycle where a corresponding ‘nominal/multiplier %’ is
determined.3. CP as a ‘qualifier’ for bonus declaration is first assessed for each operation.4. For each weighted element, there is a job level related on‑target and maximum earning potential.
Upon assessment of CP by the Board, a bonus is either declared or not. If a bonus is declared, the amount payable is calculated as follows:
Total bonus payableThe total bonus payable is calculating by summing the ‘Actual CP bonus payable’ and ‘Actual TP bonus payable’
Actual CP bonus payable
CP bonusCalculating bonus per performance
element in respect of company performance
AFP x OTB% x CPW
CP scorecard multiplierActual CP performance is measured to determine a bonus nominal/multiplier
percentage
x
Range: 0‑200% subject to actual CP Score
(Range: 0‑110%)
TP bonusCalculating bonus per performance
element in respect of team performance
AFP x OTB% x TPW
xTP scorecard multiplier
Actual TP performance is measured to determine a bonus nominal/multiplier
percentage
+ Range: 0‑200% subject to actual TP Score
(Range: 0‑110%)
Actual TP bonus payable
The following LTI plans are currently in operation at MTN:• Performance Share Plan (PSP scheme)• Notional Share Option Plan (ESOP scheme)• The 2016 Employee Share Ownership Plan Trust (the 2016
ESOP Trust)
The purpose of these share schemes is primarily to drive performance as well as to retain and recognise the contributions of eligible employees by providing an additional incentive to contribute to the MTN Group’s continued growth in accordance with the Company’s medium and long‑term strategy.
Performance share plan (PSP)Eligibility: executives and management level employees in South Africa and other listed entities (in Ghana and Nigeria)MTN operates a PSP that awards performance‑based shares to executive and management employees for the achievement of strategic targets over a three‑year measurement period. Awards are determined as a percentage of Annual Fixed Package (AFP), ensuring an appropriate pay mix for the relevant role. Awards take place annually in December. Malus and clawback provisions apply to all awards and across all participants of the scheme.
The following table presents allocation multiples for employees participating in the Group PSP scheme:
Job level
Group President and CEO 200Group CFO and Group COO 175Tier 1 CEOs and Senior VP Markets^ 125Other Group Exco members 125General Executives 100General managers 60Senior managers 40Managers 20
^ Multiple changed to 175% effective 1 February 2022
PSP allocation multiple
%
AFP – Annual fixed package OTB% – On‑target bonus % (varies according to designation – refer to previous page)
Our approach to variable pay: LTIs
TPW – Team performance weighting (varies according to designation – refer to previous page)
Doing for tomorrow, today
Doing for shared value
Strategic and financial review
Governance and remuneration
96
Integrated Report 2021
Remuneration report continued

The following award conditions apply in different combinations for the last four awards made.
Condition Description of condition
TSR – MSCI EM Index Sliding scale of 100% vesting at the 75th percentile as compared to MSCI EM Telecoms Index and 25% vesting at the median with straight‑line vesting in between the two points. 0% vesting for below the median. TSR will be measured by comparing the 30‑day (VWAP) at the beginning and end of the three‑year measurement period, plus reinvested dividends. TSR must be positive and to be measured on common currency (rand).
Cumulative operating free cash flow (COFCF)
Targeted at the sum of the budgeted OFCF established each year for the three‑year measurement period: 25% vesting at 90% of the target; 100% vesting at 110% of the target; sliding scale between each point. OFCF will be measured on constant currency.
Return on average capital employed (ROACE)^
Defined as the sum of (EBIT/(equity + net debt)) for each year divided by three. There is a 25% vesting at 90% of budget (kick‑in); a 100% vesting at 100% of budget; and a straight‑line vesting between the kick‑in and budget rate. (Only applicable for awards up to December 2019).
Return on equity (ROE)^ Defined as adjusted headline earnings per share/equity excluding NCI (non‑controlling interest) and such non‑operational items as approved by the Group Remco for each year divided by three. There is a 25% vesting at 90% of budget/target (kick‑in), a 100% vesting at 100% of budget/target and a straight‑line vesting between the kick‑in and budget/target rate. (Only applicable for awards from December 2020).
Retention~ No retention components for awards from 2021 onwards for all employees participating in the scheme.
Compliance to DTIC and ICASA (Compliance)
As applicable to the Group CEO, making all reasonable efforts to ensure that the Company is compliant with the relevant targets and codes in terms of labour legislation and/established by the DTIC and ICASA.
Black economic empowerment (BEE)
As applicable to the Group CEO, achievement of the BEE deliverables as set out in employment contracts.
ESG* ESG comprises of three elements: emissions; broadband coverage; and diversity and inclusion as per the Board‑approved business plan. ESG will be measured over the three‑year measurement period with a 25% vesting at threshold value (kick‑in); 100% vesting at 100% of target; and a straight‑line vesting between the kick‑in and target rate.
Notes^ Only applicable for the awards up to 2019. This KPI was replaced with ROE from 2020 awards.~ For Group Exco members, the retention component was only applicable for the 2019 allocation.* The ESG KPI was introduced in 2021 awards for all employees and replaced the ‘retention’ condition.
Doing for tomorrow, today
Doing for shared value
Strategic and financial review
Governance and remuneration
97
Integrated Report 2021
Remuneration report continued

The following table sets out the performance metrics, weightings and targets for awards that have vested in prior years as well as unvested allocations. As evidenced in the table below, ‘ESG at the core’ has become a key focus area for MTN and has replaced the retention performance condition entirely, for all levels of eligible employees, for the 2021 PSP award allocations.
Award condition weightings
Performance targets 2018/19 PSP 2020 PSP 2021 PSP
Performance conditions Minimum On‑target Maximum
Group CEO, COO, CFO
%
Group Exco
%
Othermanagement
%
Group CEO, COO, CFO
%
Group Exco
%
Othermanagement
%
GroupCEO
%
Group Exco
%
Othermanagement
%
TSR – MSCI EM Median 75th percentile 25 25 25 30 33.33 25 22.5 25 25
COFCF 90% of three year business plan
110% of three year business plan (stretched) 25 25 25 30 33.33 25 22.5 25 25
ROACE^ 90% of three year business plan
100% of three year business plan8.33 25 25 – – – – –
ROE^ 90% of three year business plan
100% of three year business plan– – – 30 33.33 25 22.5 25 25
Retention~ – – – 25 25 25 – – 25 N/A N/A N/A
Compliance 8.33% Per LOA Per LOA 8.33 – – 5 – – 5 – –
BEE 8.33% Per LOA Per LOA 8.33 – – 5 – – 5 – –
ESG+ – – – – – – – – – 22.5 25 25
Environment, Social and Governance+
ESG is at the core of our business strategy as we strive to create shared value for our stakeholders. We realise the importance of driving economic value sharing through responsible environmental, social and governance practices as outlined within our sustainability framework. MTN recognises the distinction between sustainability and environmental, social and governance practices, which lie at the heart of measuring a company’s performance from an environmental, social and governance perspective. ESG will be measured using a subset of non‑financial performance indicators, which include ethical, sustainable,
and corporate government issues such as making sure there are systems in place to ensure accountability and managing the corporation’s carbon footprint.
Raising the impact and visibility of the value we create for society across our markets is a fundamental part of elevating our social licence to operate. Part of creating this visibility lies in acting as a partner to stakeholders, including nation‑states and local regulatory bodies, to create and protect value.
The three‑year LTI scorecard particularly for the two internal financial indicators, ROE and COFCF are maximum targets representing average incremental value creation over the measurement period. Refer to page 109 of the implementation report for details of the 2021 vesting outcomes and allocations details for Group Executive Committee members
Doing for tomorrow, today
Doing for shared value
Strategic and financial review
Governance and remuneration
98
Integrated Report 2021
Remuneration report continued

National share option plan (NSO)Eligibility: management level employees in non-listed entitiesThe NSO scheme is our non‑equity scheme for non‑executive employees in managerial and senior positions in non‑listed operations outside of South Africa. Qualifying employees own options and participate in the growth of the Group and its operations, as applicable.
Purpose Detail How allocations are determined
• The main objective of the NSO scheme is to encourage an alignment between the individual interests of senior employees and the long‑term success of the Opco.
• Thus, the scheme’s design rewards managerial and senior employees for the value gain derived from the NSO price per share appreciation between the allocation and vesting dates.
• Share awards are at the discretion of the MTN Group Board and the operating entities.
• Participation is limited to managerial employees and those in more senior positions only in the operations.
• Employees of MTN Group Management Services, MTN Dubai, MTN South Africa, MTN Nigeria and MTN Ghana are not eligible to participate in the NSO scheme.
• Performance is measured using the Group share price and the operation’s EBITDA performance. Thus, the NSO scheme is divided into: › Group aligned notional (GAN) share options measured using MTN
Group share price ensuring the operation aligns to the Group strategy; and
› Locally aligned notional (LAN) share options measured using the operation’s EBITDA performance.
The quantum of the awards is based on the future increase in the value of the NSO awards. Allocation multiples of annual salary are used to determine the annual allocation of NSO to qualifying employees. Awards are made annually and vest after three years. The detail regarding the allocation multiples and performance measurement are set out below.
Job level
Annual allocation multiple (as a % of salary) for
both LAN and GAN
General manager 60%
Senior manager 40%Manager 20%
The 2016 Employee Share Ownership Trust (‘the 2016 ESOP Trust’)Eligibility: all non-management level employees in South Africa and other listed entitiesDuring 2016, the MTN Group established the Employee Share Ownership Plan (‘2016 ESOP’) for the purposes of incentivising, rewarding and retaining employees. Under this scheme, employer companies, from time to time, procure the Grant of Participation Shares to designated participating employees.
Purpose Vesting of awards Allocations made since 2017
The main objective of the NSO scheme is to encourage an alignment between the individual interests of non‑managerial employees and the long‑term success of the Company.
Participation Shares will vest as follows:• 33.3% vest on the third anniversary of the Grant Date.• 33.3% vest on the fourth anniversary of the Grant Date.• The remaining balance vests on the fifth anniversary of the Grant Date.
Since establishment of the ESOP Trust, a total of nine allocations have been made to 5 066 employees. The overall market value of the vested and unvested awards at the end of 2021 was R492 million.
Award dateESOPs
awardedAward
price
Award value/
employee
Dec 2017 516 125 65 000
Jun 2018 565 120 68 000
Dec 2018 834 86 71 000
Jun 2019 732 101 74 000
Dec 2019 807 95 77 000
Jun 2020 1 619 49 80 000
Dec 2020 1280 64 82 000
Jun 2021 894 95 85 000Dec 2021 573 155 89 000
Doing for tomorrow, today
Doing for shared value
Strategic and financial review
Governance and remuneration
99
Integrated Report 2021
Remuneration report continued

Group CFOGroup President and CEOExecutive pay mix and potential remuneration outcome scenarios• Executives are remunerated in line with short and long‑term
business objectives using an optimal mix of fixed pay, benefits, short and LTIs. This supports the alignment of strategy and desired individual behaviour. The pay mix is aimed at driving the strategic outcomes of the business as well as to be market competitive. Our pay mix varies with seniority, with an increasing element of at‑risk performance variable pay inherent in the pay mix at senior levels. The Group President and CEO and Group Exco members have the largest proportion of pay being subject to performance conditions. This is intended to create a significant degree of alignment with shareholder interests, with the aim of driving sustainable value creation over a longer‑term period.
• The proportion of fixed to performance‑based incentives varies between the Group President and CEO and the Group CFO. Both roles comprise a higher weighting on performance incentives or ‘at risk pay’ and less on the fixed package. While the fixed package does not vary based on performance, the variable portion does.
• In line with King IV recommendations and proxy adviser guidelines, the remuneration pay mix scenarios, as well as the total figures of potential remuneration outcomes for below target/minimum, on‑target, and maximum performance outcomes, have been detailed in the graphs presented alongside for the Group President and CEO and Group CFO.
• As shown in the graphics, from a total reward perspective, a large proportion of pay is ‘at risk’ for both executives and a large portion of pay is aligned with long‑term performance. Strong or out‑performance is rewarded through higher variable pay aligning both shareholder and executive outcomes. If the executive underperforms, there is a big downside where the Group President and CEO would only earn 25% of his potential on‑target remuneration outcome, while the Group CFO would earn 27% of her potential on‑target remuneration outcome.
We are satisfied that the potential pay mixes and remuneration outcomes for our executives under different performance outcomes are fair and in line with shareholder expectations. We further believe that executive pay is demonstrably tied to performance, with upside potential for over performance and significant downside for underperformance.
Group CFO (Rm)
6 9006 9001 6561 725
6 9006 900
12 0756 900
12 07512 075
Belowthreshold
Atthreshold
At target Above target
GP STI LTI
Group President and CEO (%)
100
16
68
15
Belowthreshold
At threshold
40
20
40
50
25
25
GP
At target Above target
STI LTI
Group CFO (%)
100
1667
17
Belowthreshold
At threshold
39
22
39
47
27
27
GP
At target Above target
STI LTI
Group President and CEO (Rm)
16 38616 3863 9333 687
16 3861638632 772
16 38632 77232 772
Belowthreshold
Atthreshold
At target Above target
GP STI LTI
Doing for tomorrow, today
Doing for shared value
Strategic and financial review
Governance and remuneration
100
Integrated Report 2021
Remuneration report continued

Minimum shareholding requirementsTo ensure executives maintain a high level of shareholder alignment, the following minimum shareholding requirements apply:• Group President and CEO – 250% of fixed salary.• Group CFO – 175% of fixed salary.• Other prescribed officers – 150% of fixed salary.
The adoption of minimum shareholding requirements was effective 1 January 2021 and was based on benchmark results against JSE listed companies.
Malus and clawbackTo align the interests of management with the long‑term shareholder interests and to ensure that excessive risk taking is not rewarded, the Company operates a malus and clawback policy.
Under the malus and clawback provisions, remuneration outcomes may be subject to malus or clawback where circumstances demand.• Malus means where an Incentive Remuneration amount
has not vested, not been settled, and not been paid or otherwise made available, a Trigger Event occurs, and the Board in its sole discretion seeks to reduce or cancel the ‘at risk’ Incentive Remuneration amount in full or in part.
• Clawback means where an Incentive Remuneration amount that has already vested, been settled, paid, or otherwise made available, and a Trigger Event(s), which indicate an error or an irregularity in the calculation of a participant’s remuneration, the Board, in its sole discretion seeks to recoup such an Incentive Remuneration amount in full or in part as the case may be.
In keeping with the emerging best practice in corporate governance, the Board may act on recommendations of the Remuneration Committee to adjust (malus) or recover (clawback) ‘at risk’ remuneration where there is reasonable evidence that an employee has materially contributed to, or been materially responsible for, the need for the restatement of financial results for reasons (‘Trigger Events’) including:1. Material misstatement of the financial results, resulting in
an adjustment in the audited consolidated accounts of the Company or the audited accounts of any member of the Group; and/or
2. The fact that any information used to determine the quantum of an incentive remuneration amount was based on error, or inaccurate or misleading information; and/or
3. Action or conduct of a participant which, in the reasonable opinion of the Board, amounts to serious misconduct; and/or
4. Events or behaviour of a participant or the existence of events attributable to a participant that have led to, inter alia,• the censure under applicable rules of, or• reputational/financial damage.
Members of executive management are employed on standard employment contracts, except for the Group President and CEO and Group COO, who are both on limited duration contracts. These employment agreements provide for a notice period of six (6) months by either party. The Group President and CEO, Group CFO and Group COO have a 12 month restraint and all other executives have 6 months restraint of trade. Executives are entitled to standard benefits and participate in the short and long‑term incentive schemes, subject to the rules of these schemes.
Details of the current service contracts for the year ended 31 December 2021 for our prescribed officers:
Name and designation Employment contract
RT Mupita: Group President and CEO On a fixed duration contract ending 30 September 2025
TBL Molefe: Group Chief Financial Officer Employed in 2021 on a permanent employment contract
J Schulte‑Bockum: Group Chief Operating Officer^ Employed in 2017 on a limited duration contract which expired in January 2021 and was extended to 31 March 2024
G Motsa: CEO – MTN South Africa~ Employed in 2017 on a permanent employment contract
K Toriola: CEO – MTN Nigeria* Employed in 2006 on a permanent employment contract
E Twum Asante: Senior VP – Markets Employed in 2008 on a permanent employment contract
I Jaroudi: Regional VP – MENA Employed in 1992 on a permanent employment contract
Y Cuba: Regional VP – SEA Employed in 2020 on a permanent employment contract
P Norman: Group Chief Human Resources Officer Employed in 1997 on a permanent employment contractF Moolman: Group Chief Risk Officer# Employed in 2014 on a permanent employment contract
^ Contract expired 15 January 2021 and was extended to 31 March 2024.~ Stepped down effective 31 December 2021 and was replaced by C Molapisi on 1 January 2022.* Appointed as MTN Nigeria CEO, previously VP: WECA.# Appointed as Group Chief Risk Officer. Previously MTN Nigeria CEO.
Details of the service contracts for the year ended 31 December 2021 for other Group Exco members who are not prescribed officers:
Name and designation Employment contract
S Dioum: Group Chief Fintech and Digital Resources Officer Employed in 2010 on a permanent employment contract
K Ndamase: Group Chief Mergers and Acquisitions and Business Development Officer Employed in 2016 on a permanent employment contract
L Modise: Group Chief Legal Counsel Employed in 2019 on a permanent employment contract
F Sekha: Group Chief Regulatory and Corporate Affairs Officer^ Employed in 2016 on a permanent employment contractC Molapisi: CEO – MTN South Africa~ Employed in 2009 on a permanent employment contract
^ Resigned effective 31 March 2022.~ Appointed as CEO MTN South Africa effective 1 January 2022.
Doing for tomorrow, today
Doing for shared value
Strategic and financial review
Governance and remuneration
101
Integrated Report 2021
Remuneration report continued

Note on remuneration disclosure changesAt the beginning of 2021, as contemplated and defined in the Companies Act, the Group Board made a determination of persons deemed to be prescribed officers for the year, taking into consideration the Group’s Ambition 2025 strategy, which includes the separation of the Fintech business and the fibre infrastructure business. Henceforth, we provide disclosure only for those employees who are deemed to be prescribed officers for the purposes of remuneration.
Refer to Part III of the implementation report for a full disclosure of remuneration details for the year under review.
Termination of employment paymentsEmployees are required to retire at age 60 and where their service is terminated as ‘no fault’ terminations (retirement, retrenchment, disability or death) or at the end of the limited‑duration contract, any shares awarded will be pro‑rated and will vest under normal vesting conditions according to the pre‑set vesting dates (subject to CP over that future period). In the case of resignations and terminations, these will be forfeited.
The following applies in the event of termination of employment:
Element‘Fault terminations’ – resignation, abscondment, early retirement, dismissal
‘No-fault terminations’ – retrenchment, retirement, restructuring, disability, death
Fixed pay Paid over the notice period or as a lump sum. Paid over the notice period or as a lump sum or as per statutory requirement.
Benefits Applicable benefits may continue to be provided during the notice period.
Benefits will fall away at such time that employment ceases.
STIs No payment will be made, unless incentive payment is payable while the employee is serving notice, in which case it will be paid on the bonus pay day.
Any Board‑approved incentive, e.g. annual performance bonus becomes payable on a pro rata basis at the same time as other active employees subject to the incentive policy.
LTIs No payment will be made. Only incentives which vest during active employment will be paid out.
Any Board‑approved incentive, e.g. shares become payable on a pro rata basis at the same time as other active employees subject to the incentive policy. Only shares equivalent to time served between grant and vesting are paid. No adjustment to performance is performed.
Doing for tomorrow, today
Doing for shared value
Strategic and financial review
Governance and remuneration
102
Integrated Report 2021
Remuneration report continued

Non-executive directors’ remunerationNon‑executive director appointments are made in terms of the Company’s memorandum of incorporation (MOI) and confirmed at the first AGM of shareholders after their appointment. Fees reflect the director’s role and committee membership. A fee applies for any additional special meetings over and above Board and committee meetings. In addition to the fees, a single annual retainer, reflective of the role and responsibilities being discharged by a non‑executive director, forms part of annual earnings.
Non‑executive directors do not participate in any of the Company’s short or long‑term incentive plans, and they are not employees of the Company. MTN provides them with communication devices such as a mobile phone to conduct their duties. The Company reimburses them for out‑of‑pocket expenses, such as travel and accommodation costs, incurred in the execution of their responsibilities.
The committee reviews fees annually, requiring approval from shareholders at the AGM. Recommendations regarding non‑executive director emoluments are informed by independent market data considering market practice with reference to the size of the Company, time, commitment and responsibilities associated with the roles.
DG Capital benchmarks the non‑executive director fees against selected companies listed on the JSE and companies operating in the telecoms emerging markets. Information gleaned from these analyses is used to inform fees and associated policies.
NED fee benchmark comparator groupThe following companies were used to benchmark 2022 South Africa‑resident and non‑resident NED fees:
JSE listed comparator group
Absa Naspers*
AngloGold Ashanti* Nedbank
Anglo Platinum Old Mutual
Aspen Sanlam
Bidcorp Sappi*
Bidvest Sasol*
Capitec Shoprite
Clicks Sibanye Gold
Discovery South 32*
Exxaro Standard Bank
FNB Telkom
Gold Fields* Tiger Brands
Impala Platinum Vodacom
Kumba Iron Ore WoolworthsMultichoice
* JSE listed company that is either dual listed or reports in a foreign currency and was used to benchmark non-resident NED fees.
International emerging markets telcos
Company Reporting currency
Bhati Airtel INR, USD
Millicom USD
OrangeTM EUR
VEON EUR, USDVodafone® GBP
NED policy and fee proposed adjustmentsApproach to NED fees settingMTN’s NED policy targets the market median for all NEDs. In line with this policy, where MTN’s are pitched below the market median, an adjustment is recommended to the Board to adjust to the median. However, where required adjustments are more than the average approved budgets, caps are at times applied accordingly.
For the 2022 NED fee structure, the Board approved a 4.4% overall budget for NEDs paid in rand and a 1.9% budget for NEDs paid in foreign currency. From the overall budget pool, adjustments to the market median were approved but within the budgeted amounts. Based on the position of current fees to the market median, increases to NED fees were applied as follows:
Group Board of Directors:• The Chair did not receive an increase as current fees were
already above the market median.• Members received 0.68% adjustments to the market
median.• The LID received an adjustment of 1.9% to the market
median.• No adjustments were made to non‑resident NED fees.
Remco:• The Chair received a 4.95% adjustment to the market
median.• Members received a 2.93% adjustment to the market
median.• No adjustments were made to non‑resident NED fees.
Social and Ethics Committee:• The Chair received a 6.34% adjustment to the market
median.• Members did not receive an adjustment as current fees
were already above the market median.• A 1.9% capped increase was applied to non‑resident
member NED fees.
Audit Committee:• The Chair received a 1.15% adjustment to the market
median.• Members received 7.87% adjustment to the market
median.• No adjustments were made to non‑resident member
NED fees.
Doing for tomorrow, today
Doing for shared value
Strategic and financial review
Governance and remuneration
103
Integrated Report 2021
Remuneration report continued

Risk Committee:• The Chair received a 5.92% adjustment to the market
median.• Members received 2.92% adjustment to the market
median.• A 1.9% capped increase was applied to non‑resident Chair
and member NED fees.Nominations Committee (later reconstituted as the Director Affairs and Governance Committee):
• The Chair received a special once‑off increase of 21.11% to the market median.
• Members received a special once‑off increase of 11.60% to the market median.
• A 1.9% capped increase was applied to non‑resident member NED fees.
Proposed 2022 NED fee structureIn the table below, we have disclosed the policy fees payable for both local and international. Where the NED is a local, they will only be paid using the local fees and where the NED is foreign, the international fee will apply. It does not imply both fees are paid for a NED.
Accordingly, the proposed fee structure for 2022 is:
Approved 2021 fees Proposed 2022 fees
Annual retainer fee
Meeting attendance fee Total fee
Annual retainer fee
Meeting attendance fee Total fee
MTN Group Board
Chairperson R3 000 000 R173 500 R3 694 000 R3 000 000 R173 500 R3 694 000
International Chairperson € 265 787 € 15 371 € 327 271 € 265 787 € 15 371 € 327 271
Local member R192 512 R72 156 R481 134 R193 815 R72 644 R484 390
International member € 78 863 € 7 886 € 110 407 € 78 863 € 7 886 € 110 407
Lead independent director R379 238 R94 769 R758 315 R386 425 R96 565 R772 687
International lead independent director € 71 767 € 17 934 € 143 504 € 71 767 € 17 934 € 143 504
Human Capital and Remuneration Committee
Local Chairperson R125 567 R47 064 R313 823 R131 777 R49 391 R329 342
International Chairperson € 11 415 € 4 279 € 28 531 € 11 415 € 4 279 € 28 531
Local member R54 983 R25 804 R158 199 R56 596 R26 561 R162 839
International member € 5 199 € 2 924 € 16 895 € 5 199 € 2 924 € 16 895
Social, Ethics and Sustainability Committee
Local Chairperson R95 706 R35 871 R239 191 R101 774 R38 145 R254 356
International Chairperson € 8 405 € 3 150 € 21 005 € 8 405 € 3 150 € 21 005
Local member R54 983 R25 804 R158 199 R54 983 R25 804 R158 199
International member € 4 016 € 1 885 € 11 556 € 4 092 € 1 921 € 11 776
Acquisition, Investment and Board Finance:• The Chair received a special once‑off increase of 23.43%
to the market median.• Members received a special once‑off increase of 11.47%
to the market median.• A 1.9% capped increase was applied to non‑resident
member NED fees.
Information Technology:The Chair received a special once‑off increase of 11.31% to the market median.• Members received a special once‑off increase of 10.25%
to the market median.• A 1.9% capped increase was applied to non‑resident NED
fees.
Group Share Trust• The Chair received a 4.4% adjustment.• The member received 4.4% adjustment.
Group Sourcing Committee• The Chair received a 4.4% adjustment.• The member received 4.4% adjustment.
Furthermore, based on the benchmark outcomes, the Board recommended a special increase for the Chairman of the MTN South Africa Board of Directors of R1.6m.
Doing for tomorrow, today
Doing for shared value
Strategic and financial review
Governance and remuneration
104
Integrated Report 2021
Remuneration report continued

Approved 2021 fees Proposed 2022 fees
Annual retainer fee
Meeting attendance fee Total fee
Annual retainer fee
Meeting attendance fee Total fee
Audit Committee
Local Chairperson R172 453 R64 637 R431 001 R174 437 R65 381 R435 960
International Chairperson € 15 678 € 5 876 € 39 182 € 15 678 € 5 876 € 39 182
Local member R74 106 R34 779 R213 222 R79 937 R37 516 R230 000
International member € 6 605 € 3 100 € 19 005 € 6 605 € 3 100 € 19 005
Risk Management and Compliance Committee
Local Chairperson R144 807 R54 548 R363 000 R153 384 R57 779 R384 500
International Chairperson € 12 360 € 4 656 € 30 984 € 12 595 € 4 744 € 31 573
Local member R67 119 R31 641 R193 683 R69 081 R32 566 R199 344
International member € 3 379 € 3 379 € 16 895 € 3 443 € 3 443 € 17 216
MTN Group Share Trust (Trustees)
Local Chairperson R85 064 R31 902 R212 670 R88 807 R33 306 R222 030
International Chairperson € 7 581 € 2 843 € 18 953 € 7 581 € 2 843 € 18 953
Local member R37 399 R17 553 R107 612 R39 045 R18 325 R112 346
International member € 3 333 € 1 564 € 9 589 € 3 333 € 1 564 € 9 589
Sourcing Committee
Local Chairperson R85 064 R31 902 R212 670 R88 807 R33 306 R222 030
International Chairperson € 7 581 € 2 843 € 18 953 € 7 581 € 2 843 € 18 953
Local member R49 706 R23 324 R143 003 R51 893 R24 350 R149 294
International member € 4 430 € 2 079 € 12 746 € 4 430 € 2 079 € 12 746
Directors Affairs and Governance Committee
Local Chairperson R81 600 R30 600 R204 000 R98 826 R37 060 R247 065
International Chairperson € 7 418 € 2 782 € 18 545 € 8 513 € 3 193 € 21 281
Local member R41 442 R19 449 R119 239 R46 248 R21 705 R133 068
International member € 3 694 € 1 733 € 10 626 € 3 764 € 1 766 € 10 828
Group Finance and Investment Committee
Local Chairperson R88 290 R41 428 R254 000 R108 972 R51 133 R313 504
Local member R52 140 R24 465 R150 000 R58 119 R27 270 R167 199
Information Technology Committee
Local Chairperson R109 842 R51 540 R316 000 R122 268 R57 370 R351 748Local member R54 226 R25 444 R156 000 R59 783 R28 051 R171 987
Doing for tomorrow, today
Doing for shared value
Strategic and financial review
Governance and remuneration
105
Integrated Report 2021
Remuneration report continued

OverviewThis report outlines the outcomes of implementing the remuneration policy, as approved by Remco, in 2021.
Leadership changesTo support the execution of the Group’s Ambition 2025 strategy, the following leadership changes and appointments were made:• Charles Molapisi assumed the position of CEO at MTN SA, effective 1 January 2022; • Mazen Mroué was appointed as Group Chief Technology Information Officer (CTIO);• Ebenezer Asante (previously, Regional VP – WECA) will assume the new role of Senior Vice‑President (SVP): Markets, with
overall P&L responsibility of the three regions.• Jens Schulte‑Bockum, the Group COO, will be responsible for driving the faster scaling of all platforms other than fintech.
The digital, infraco, enterprise services, network‑as‑a‑service and Chenosis platforms will all report to Jens effective 1 February 2022.
• In order to enhance the capacity to accelerate growth of MTN’s fintech and other platforms, Serigne Dioum will assume the streamlined role of Group Chief Fintech Officer effective 1 February 2022.
• Given the strong interdependence of the two functions, the legal and regulatory functions on Exco will be combined under Lele Modise in a revised role of Chief Legal and Regulatory Officer, effective 1 February 2022.
• To reinforce the implementation of our strategic priority to create shared value and the integration of ESG at the core of our business, Nompilo Morafo (previously, Group Executive: Sustainability and Corporate Affairs) has been appointed as the Group Chief Sustainability and Corporate Affairs Officer, effective 1 February 2022.
• To ensure that Ambition 2025 and MTN’s change programmes are well resourced and sequenced and that execution risks are well managed and mitigated, Strategy and Transformation will move from reporting to the Group COO to the Group President and CEO. Accordingly, Chika Ekeji (previously, Group Executive: Strategy and Transformation has been appointed as the Group Chief Strategy and Transformation Officer, effective 1 February 2022.
2021 guaranteed pay outcomesOur approach to performance management is an integral part of our short‑term planning process and is a vital input into our short‑term incentive decisions. We want to ensure that CP objectives are achieved and that employees are adequately rewarded for their contributions towards team performance.
We regularly review and benchmark our reward components using performance and level of work as a basis for differentiation and the basis for employee reward.
Performance overview. I also suggest as review of the positioning as it it confusing. The point of this was to give an overall performance perspective, then unpack payments made. Perhaps position this at the top.
The 2021 MTN Group salary increase outcomes, as approved by Remco:
MTN Group
2021 overall increase
budget allocation
(%)
All executives at the Group^ 2.38
Management employees^ 2.42
All other employees in South Africa^ 3.66
Dubai‑based employees 0.9Expatriate employees 1
^ The mentioned increases represent the distribution of a total approved budget of 2.52%.
Actual increases for all other employees were based on individual performance outcomes and broader macroeconomic and business factors. Furthermore, actual increases were strongly differentiated to ensure that those meeting and exceeding performance requirements and who are positioned below market levels receive attention. Focus is also given to addressing pay differentials based on race, gender and identified anomalies to the extent that these exist.
We continue to prioritise lower‑paid employees, and within that group, those who are performing to at least the required standard and who are below market median levels. Salary increases for expatriates and senior employees operating from Dubai were determined based on local market conditions with further consideration to the level of skills scarcity.
Part III: Implementation report
+18.3%Service revenueR171.8bn
+36.5%Data revenueR56.5bn
+30.9%Fintech revenue
R15.9bn+23.7%EBITDA
R80.8bn
+2.2ppEBITDA margin
44.5%
+26.6ppAdjusted HEPS1 110cps
18.0%Capex
R32.7bn
Net debt/EBITDA +35.2ppOperating free cash flow
R38.3bnHoldco1.0x
Group0.4x
ROE+2.6pp to R19.6%Final dividend declared of 300cps
Strong performance in 2021Informs the remuneration outlined in this section.
Doing for tomorrow, today
Doing for shared value
Strategic and financial review
Governance and remuneration
106
Integrated Report 2021
Remuneration report continued

2021 executive directors’ guaranteed payThe committee undertakes an annual review of executive directors’ annual guaranteed pay which includes an analysis of pay relative to the market and considers the risks associated with the role and level of skills scarcity.
Remco approved a 2.38% and 1% salary increase for the Group President and CEO’s South Africa and Dubai portion, respectively. As the CFO was appointed in 2021, no increase was considered.
2021 executive directors’ guaranteed pay
Name and designation Currency2021
GP2020
GPIncrease
(%)
RT Mupita
Group President and CEO ZAR^ 8 724 974 8 522 147 2.38USD^ 505 000 500 000 1
TBL Molefe
Group Chief Financial Officer ZAR 9 200 000 – –
Notes^ RT Mupita has a dual contract with a 50/50 split between MTN Dubai Limited and MTN Group Management Services South Africa. His remuneration is thus split between the two employer companies. However, remuneration relating to STI and LTI are
represented on a ZAR only basis.
2021 STI performance overview2021 STI outcomesPerformance against Company financial and non‑financial measures for the year ended 31 December 2021:
Company performance measures
Weighting%
Threshold 90%
At target 100%
Maximum 110%
Actual performance
R’bn
Actual performance
%
Financial measures
Group attributable earnings 20 14bn 15.5bn 17.1bn 19.89 128
Service revenue 20 155bn 173bn 190bn 186.68 108
EBITDA 20 70bn 79bn 87bn 86.39 110
Net operating cash flow 20 20bn 22bn 24bn 31.67 144
Non-financial measures
Customer churn (%) 20 90 100 110 110 110
Total (CP) 100 120
Overall average actual achievement of CP against target is 120%.
Doing for tomorrow, today
Doing for shared value
Strategic and financial review
Governance and remuneration
107
Integrated Report 2021
Remuneration report continued

2021 executive directors’ STI outcomesThe following table highlights the team performance objectives assigned to each functional Group Exco member of the Group. Each objective is measured and validated by the Group President and CEO and externally audited by PricewaterhouseCoopers in accordance with the audit agreed‑upon procedures.
The individual objectives per function are based on a balanced scorecard with shared KPIs as cascaded from the Company strategic objectives.
Summary of team measures and achievements during 2021:
Item number Key performance indicator
Number of sub KPIs Overview of performance rating %
<90 90 – 99 100 – 109 110 – 119 120+
1 Financial performance 5
2Building largest and most valuable platforms
9
3 Driving leading connectivity operations 7
4 Creating Shared Value 8
5 Accelerate Portfolio Transformation 4
6Risk Management and other critical priorities
14
7 Best Talent and Culture 5
8 Tech Platforms second to none 2
The overall achievement of company and team performance translates to STI bonus multipliers, which resulted in the following STI outcomes for executive directors for the 2021 financial period:
2021 executive directors’ STI outcomes
Name and designation2021
STI2020
STIChange
(%)
RT Mupita^
Group President and CEO R28.9m R17.7m 63
TBL Molefe*Group Chief Financial Officer R10.9m – –
^ The 2020 financial year bonus was partly calculated for position as CFO and partly for CEO.* Employed in 2021 hence no bonus paid in 2020 financial year.
2021 LTI performance overview2021 LTI outcomes – vesting of 2018 PSP awardAchievement of the 2021 LTIP represents the final vesting percentage for PSP awards made in December 2018. The allocation of shares made under the PSP scheme in December 2018 vested in December 2021, this period being three years after allocation.
This allocation was a conditional award of shares dependent on the following performance conditions: TSR MSCI EM, COFCF, ROACE and retention. For the Group President and CEO, additional conditions linked to BEE and compliance to ICASA (all ESG related) were applicable (as outlined in the remuneration policy).
An assessment of the performance conditions was performed. Based on the externally audited results, overall:• TSR was fully achieved owing to the Group’s share
performance during the measurement period i.e., 2019 to 2021.
• The cash flow performance condition was achieved in full at 100%.
• The ROACE condition was achieved in full at 100%.
The overall weighted vesting approved by Remco was as follows:• MTN Group directors: 100%• MTN Group Exco members: 100%• Other participants: 100%
These vesting percentages include the 25% retainer as was approved at allocation.
Doing for tomorrow, today
Doing for shared value
Strategic and financial review
Governance and remuneration
108
Integrated Report 2021
Remuneration report continued

Performance outcomes of the 2018 PSP grant
Award condition Vesting conditions Target Performance achievement Vesting %
Total Shareholder Return (TSR MSCI)
TSR100% vesting at the 75th percentile25% vesting at the median0% vesting for below the median
Minimum: 19th rank (TSR ranking)Target: 10th rank/below (TSR ranking)
Actual ranking: 7 TSR (rank)
Threshold Target Actual
19
10
7
100%
Operating Free Cash Flow (OFCF)^^
Cash flow growth100% vesting at 110% of target25% vesting at 90% of target0% vesting below 90% of target
Minimum: 14bn (90% of business plan)Target: 15bn (business plan)Max: 17bn (110% of business plan)
Actual: 21.3bn (38% above business plan)
Cashflow (Rm)
Threshold Target Actual
13 86016 940
21 277
100%
Return on Average Capital Employed (ROACE)^^
Capital returns100% vesting at 100% of budget25% vesting at 90% of budget0% vesting below 90% of budget
Minimum: 17.5% (90% of business plan)Target: 19.5% (business plan)
Actual: 20.2% (4% above business plan)
ROACE (%)
Threshold Target Actual
17.519.5 20.2
100%
Service/Retention Service requirementEmployee must be employed as at the date of vesting
In service at vesting date In service at vesting date 100%
^^ The above business plan and actuals are averaged over three years as per plan rules.
2021 executive directors’ LTI outcomes – vesting of 2018 PSP award
Name and designation2021 vested
LTI2020 vested
LTIIncrease
(R)
RT MupitaGroup President and CEO R37.7m R5.3m R32.4mNumber of shares 190 200 62 107
TBL Molefe*
Group Chief Financial Officer Not applicable Not applicable Not applicable
* Employed in 2021 hence no shares vested in 2021.
Minimum shareholding requirementsThe personal shareholding and the value of shares as a percentage of fixed salary for each executive director is set out below. The holdings at 31 December 2021 for the minimum shareholding requirements as outlined in the remuneration policy are as follows.
DesignationNumber of
shares Value of sharesValue as a % of
fixed salary
Group President and CEO 246 000 R29.5m 73%
Group CFO Nil Nil Nil
Doing for tomorrow, today
Doing for shared value
Strategic and financial review
Governance and remuneration
109
Integrated Report 2021
Remuneration report continued

Summary of single figure remuneration for executive directors
Overview of personal contribution Under Ralph’s leadership in 2021, the Group continued to adapt to the extraordinary circumstances brought about by the COVID‑19 pandemic and positioned the business for accelerated growth and aligned to the execution of our Ambition 2025 strategy.
The MTN Group demonstrated resilience under a challenging trading environment which featured ongoing COVID‑19 uncertainties and the focus Ralph brought to strategy execution as well as sustaining commercial momentum led to the delivery of service revenue that tracked favourably against our medium‑term guidance and expanded EBITDA margins. Ralph continued to oversee our impressive run of 15 successive quarters of operating improvements as well as exceeded most of the Group’s medium‑term targets. The Company has seen an acceleration in growth and momentum in the platform business and our strategy around structurally separating our Fintech business.
Group President and CEO outcomes
The disclosures that follow set out the details of the 2021 performance and the associated remuneration for the Group President and CEO. The disclosures include target, awarded and single‑figure remuneration figures.
Performance overviewCompany performance highlights• Group service revenue grew by 1.0% (18.3%*)
› Group data revenue up by 16.0% (36.5%*) › Group Fintech revenue up by 17.4% (30.9%*)
• EBITDA (before once‑off items) grew by 5.3% (23.7%*)• EBITDA margin (before once‑off items) up 1.7 percentage points (pp) to 44.5% (up 2.2pp* to 44.5%*)• Reported headline earnings per share (HEPS) at 987 cps, up 31.8%; non‑operational impacts decreased HEPS by
123 cps• Holding company (Holdco) net debt down to R30.1 billion (from R43.3 billion); leverage improved to 1.0x from 2.2x
in December 2020• ROE improved by 2.6pp to 19.6%• Capex of R39.4 billion (R32.7 billion under IAS 17, with capex intensity of 18.0%)• Subscribers increased by 2.9 million to 272.4 million, impacted by new SIM registration regulations in Nigeria
(excluding Nigeria, subscribers were up 11.0 million)• Active Mobile Money (MoMo) customers increased by 22.6% YoY to 56.8 million• MoMo value of transactions up 56.8% YoY to US$239.4 billion• Final dividend declared of 300 cps (2020: 0 cps)
Determination of single figure of remunerationIn accordance with the Companies Act, the following table provides remuneration reflecting the total sign figure of remuneration of directors and prescribed officers. The total single figure includes remuneration received and receivable for the 2021 reporting period, split into the following remuneration elements.
Salaries – cash payments received during the applicable financial year.
Post-employment benefits – company contributions to retirement fund
Other benefits – Includes medical aid, expense allowances and unemployment insurance fund.
Short term incentives (STI) – Reflected as the amount attributable to the applicable financial‑year performance, even where it was only settled early in the following financial year.
Long term incentives (LTIs) – Reflected in the final financial year of the share allocation performance measurement period, even where they were settled in following financial year. In the 2020 and 2021 financial year disclosures that follow, this relates to performance shares that were awarded in December 2017 and 2018, which vested in December 2020 and 2021 respectively. Performance for these awards was measured over the periods 1 January 2018 to 31 December 2020, and 1 January 2019 to 31 December 2021 respectively for the 2020 and 2021 financial year. The values of the vested awards are disclosed as “LTI reflected”.
Qualifying dividends – Reflective of dividends paid in the applicable financial year following the vesting of the share award, even where such dividend was only settled in the following financial year.
Doing for tomorrow, today
Doing for shared value
Strategic and financial review
Governance and remuneration
110
Integrated Report 2021
Remuneration report continued
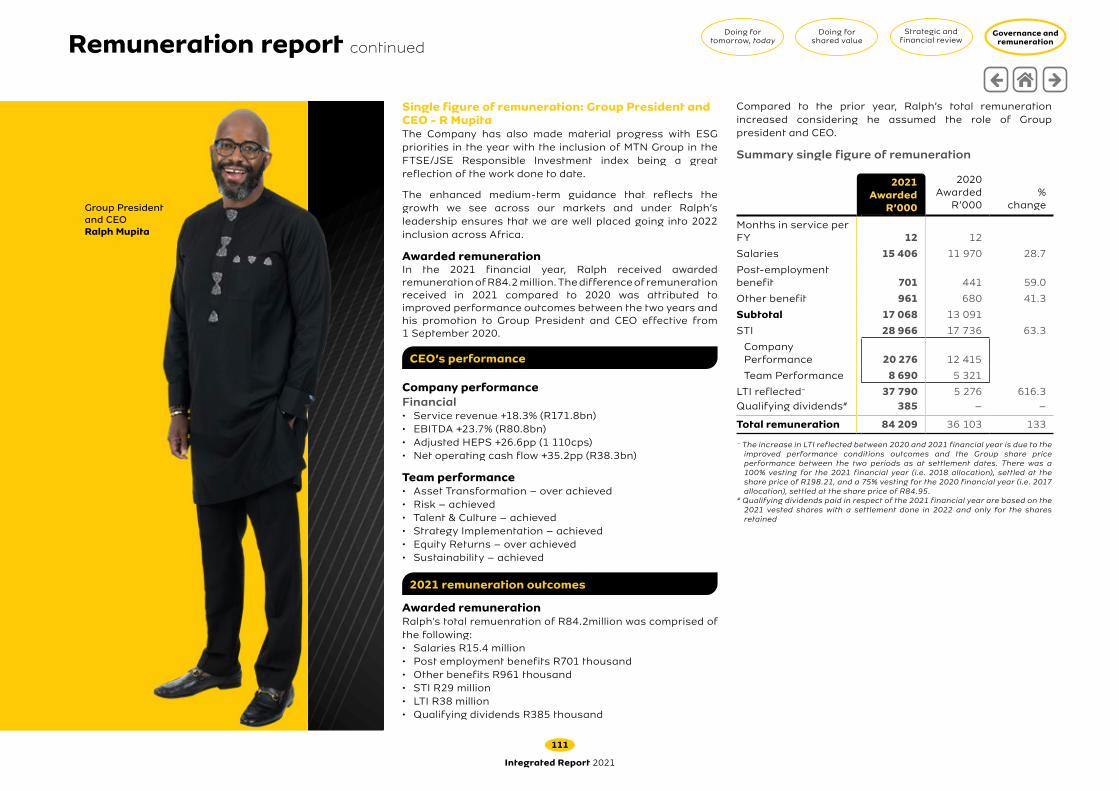
Single figure of remuneration: Group President and CEO - R Mupita The Company has also made material progress with ESG priorities in the year with the inclusion of MTN Group in the FTSE/JSE Responsible Investment index being a great reflection of the work done to date.
The enhanced medium‑term guidance that reflects the growth we see across our markets and under Ralph’s leadership ensures that we are well placed going into 2022 inclusion across Africa.
Awarded remunerationIn the 2021 financial year, Ralph received awarded remuneration of R84.2 million. The difference of remuneration received in 2021 compared to 2020 was attributed to improved performance outcomes between the two years and his promotion to Group President and CEO effective from 1 September 2020.
CEO’s performance
Company performanceFinancial• Service revenue +18.3% (R171.8bn)• EBITDA +23.7% (R80.8bn)• Adjusted HEPS +26.6pp (1 110cps)• Net operating cash flow +35.2pp (R38.3bn)
Team performance • Asset Transformation – over achieved• Risk – achieved• Talent & Culture – achieved• Strategy Implementation – achieved• Equity Returns – over achieved• Sustainability – achieved
2021 remuneration outcomes
Awarded remunerationRalph's total remuenration of R84.2million was comprised of the following:• Salaries R15.4 million• Post employment benefits R701 thousand• Other benefits R961 thousand• STI R29 million• LTI R38 million• Qualifying dividends R385 thousand
Group President and CEO Ralph Mupita
Compared to the prior year, Ralph’s total remuneration increased considering he assumed the role of Group president and CEO.
Summary single figure of remuneration
2021Awarded
R’000
2020Awarded
R’000%
change
Months in service per FY 12 12
Salaries 15 406 11 970 28.7
Post‑employment benefit 701 441 59.0
Other benefit 961 680 41.3
Subtotal 17 068 13 091
STI 28 966 17 736 63.3
Company Performance 20 276 12 415
Team Performance 8 690 5 321
LTI reflected~ 37 790 5 276 616.3Qualifying dividends# 385 – –
Total remuneration 84 209 36 103 133
~ The increase in LTI reflected between 2020 and 2021 financial year is due to the improved performance conditions outcomes and the Group share price performance between the two periods as at settlement dates. There was a 100% vesting for the 2021 financial year (i.e. 2018 allocation), settled at the share price of R198.21, and a 75% vesting for the 2020 financial year (i.e. 2017 allocation), settled at the share price of R84.95.
# Qualifying dividends paid in respect of the 2021 financial year are based on the 2021 vested shares with a settlement done in 2022 and only for the shares retained
Doing for tomorrow, today
Doing for shared value
Strategic and financial review
Governance and remuneration
111
Integrated Report 2021
Remuneration report continued

Year-on-year comparison of remuneration paid to executive directors
2021Salaries
R’000
Post-employment
benefits R’000
Other benefits
R’000Subtotal
R’000STI
R’000
LTIreflected
R’000
Qualifying dividends
R’000
Total single figure of
remuneration R’000
Executive directors
RT Mupita 15 406 701 961 17 068 28 966 37 790 385 84 209 TBL Molefe^ 6 475 708 5 778 12 961 10 978 – – 23 939
^ Included in Other benefits is a payment made in lieu of forfeiture of performance bonus from previous employer.
2020Salaries
R’000
Post‑employment
benefits R’000
Other benefits
R’000Subtotal
R’000STI
R’000
LTIreflected
R’000
Qualifying dividends
R’000
Total single figure of
remuneration R’000
Executive directors
RA Shuter 18 154 1 997 17 807 37 958 30 104 13 129 – 81 191 RT Mupita 11 970 441 680 13 091 17 736 5 276 – 36 103
Doing for tomorrow, today
Doing for shared value
Strategic and financial review
Governance and remuneration
112
Integrated Report 2021
Remuneration report continued

Year-on-year comparison of remuneration paid to prescribed officers
2021Salaries
R’000
Post-employment
benefits R’000
Other benefits
R’000Subtotal
R’000STI
R’000
LTIreflected
R’000
Qualifying dividends
R’000
Total single figure of
remuneration R’000
Prescribed officers
E Asante 10 321 2 167 3 759 16 247 9 464 27 254 – 52 965
Y Cuba* 7 091 777 3 885 11 753 7 309 – – 19 062
I Jaroudi 11 196 990 2 034 14 220 9 675 25 917 47 49 859
F Moolman 7 423 799 1 557 9 779 9 596 22 378 – 41 753
G Motsa^ 7 614 827 11 982 20 423 8 370 22 616 – 51 409
PD Norman 6 246 684 256 7 186 7 884 18 796 191 34 057
S Perumal 1 311 119 80 1 510 – 9 478 16 11 004
J Schulte‑Bockum 9 930 1 039 753 11 722 14 899 40 733 – 67 354 K Toriola 9 870 934 5 295 16 099 11 359 22 596 – 50 054
* Included in Other benefits is a payment made in lieu of forfeiture of participation in share schemes from previous employer^ Included in Other benefits is compensation comprising of notice pay and a restraint of trade payment.
2020Salaries
R’000
Post‑employment
benefits R’000
Other benefits
R’000Subtotal
R’000STI
R’000
LTIreflected
R’000
Qualifying dividends
R’000
Total single figure of
remuneration R’000
Prescribed officers
E Asante 10 115 809 4 885 15 809 9 969 4 789 – 30 567
I Jaroudi 11 644 953 616 13 213 8 396 2 079 – 23 688
F Moolman 8 227 1 633 5 794 15 654 7 203 4 212 – 27 069
G Motsa 7 421 816 607 8 844 8 435 4 441 – 21 720
PD Norman 6 138 675 820 7 633 8 044 2 574 – 18 251
S Perumal 1 759 160 307 2 226 4 135 – – 6 361
J Schulte‑Bockum~ 9 648 1 012 6 078 16 738 14 576 4 046 – 35 360 K Toriola 8 474 847 4 871 14 192 7 279 3 586 – 25 057
~ Included in Other benefits is a payment of cash-settled share-based incentives
Doing for tomorrow, today
Doing for shared value
Strategic and financial review
Governance and remuneration
113
Integrated Report 2021
Remuneration report continued

Details of share allocations for executive directors and prescribed officers
Award date Vesting date
Number outstanding as
at 31 December 2020 Awarded Accrued/settled Forfeited Settlement date
Exercise price
R
Number outstanding as at 31 December
2021
RA Shuter+1
18/12/2017 18/12/2020 200 200 – (150 150) (50 050) 12/04/2021 91.21 –
28/12/2018 29/12/2021 436 600 – – – – – 436 60020/12/2019 20/12/2022 457 100 – – – – – 457 100
Total 1 093 900 – (150 150) (50 050) – – 893 700
RT Mupita
18/12/2017 18/12/2020 118 300 – (88 724) (29 576) 24/03/2021 84.95 –
28/12/2018 28/12/2021 190 200 – – – – – 190 200
20/12/2019 20/12/2022 223 300 – – – – – 223 300
21/12/2020 21/12/2023 530 800 – – – – – 530 80013/12/2021 13/12/2024 – 205 200 – – – – 205 200
Total 1 062 600 205 200 (88 724) (29 576) – – 1 149 500
PD Norman
18/12/2017 18/12/2020 57 700 – (43 275) (14 425) 13/04/2021 84.95 –
28/12/2018 28/12/2021 94 600 – – – – – 94 600
20/12/2019 20/12/2022 100 900 – – – – – 100 900
21/12/2020 21/12/2023 139 100 – – – – – 139 10013/12/2021 13/12/2024 – 56 900 – – – – 56 900
Total 392 300 56 900 (43 275) (14 425) – – 391 500
G Motsa**
18/12/2017 18/12/2020 69 700 – (52 275) (17 425) 12/04/2021 84.95 –
28/12/2018 28/12/2021 114 100 – – – – – 114 100
20/12/2019 20/12/2022 121 800 – – (39 305) – – 82 49521/12/2020 21/12/2023 167 800 – – (110 182) – – 57 618
Total 473 400 – (52 275) (166 912) – – 254 213
J Schulte-Bockum
18/12/2017 18/12/2020 125 500 – (94 125) (31 375) 09/04/2021 84.95 –
28/12/2018 28/12/2021 205 500 – – – – – 205 500
20/12/2019 20/12/2022 216 400 – – – – – 216 400
21/12/2020 21/12/2023 315 800 – – – – – 315 80013/12/2021 13/12/2024 – 121 500 – – – – 121 500
Total 863 200 121 500 (94 125) (31 375) – – 859 200
Doing for tomorrow, today
Doing for shared value
Strategic and financial review
Governance and remuneration
114
Integrated Report 2021
Remuneration report continued

Award date Vesting date
Number outstanding as
at 31 December 2020 Awarded Accrued/settled Forfeited Settlement date
Exercise price
R
Number outstanding as at 31 December
2021
F Moolman
18/12/2017 18/12/2020 66 100 – (49 575) (16 525) 09/04/2021 84.95 –
28/12/2018 28/12/2021 112 900 – – – – – 112 900
20/12/2019 20/12/2022 117 300 – – – – – 117 300
21/12/2020 21/12/2023 180 700 – – – – – 180 70013/12/2021 13/12/2024 – 64 900 – – – – 64 900
Total 477 000 64 900 (49 575) (16 525) – 475 800
PT Sishuba-Bonoyi
20/12/2019 20/12/2022 36 800 – – – – – 36 800
21/12/2020 21/12/2023 52 100 – – – – – 52 10013/12/2021 13/12/2024 – 21 300 – – – – 21 300
Total 88 900 21 300 – – – – 110 200
TBL Molefe
01/04/2021 21/12/2023 – 126 100 – – – – 126 10013/12/2021 13/12/2024 – 101 900 – – – – 101 900
Total – 228 000 – – – – 228 000
I Jaroudi
18/12/2017 18/12/2020 77 600 – (58 200) (19 400) 12/04/2021 84.95 –
28/12/2018 28/12/2021 133 700 – – – – – 133 700
20/12/2019 20/12/2022 135 900 – – – – – 135 900
21/12/2020 21/12/2023 209 300 – – – – – 209 30013/12/2021 13/12/2024 – 76 000 – – – – 76 000
Total 556 500 76 000 (58 200) (19 400) – – 554 900
E Asante
18/12/2017 18/12/2020 78 000 – (58 500) (19 500) 09/04/2021 84.95 –
28/12/2018 28/12/2021 137 500 – – – – – 137 500
20/12/2019 20/12/2022 143 200 – – – – – 143 200
21/12/2020 21/12/2023 221 600 – – – – – 221 60013/12/2021 13/12/2024 – 81 000 – – – – 81 000
Total 580 300 81 000 (58 500) (19 500) – – 583 300
Doing for tomorrow, today
Doing for shared value
Strategic and financial review
Governance and remuneration
115
Integrated Report 2021
Remuneration report continued

Award date Vesting date
Number outstanding as
at 31 December 2020 Awarded Accrued/settled Forfeited Settlement date
Exercise price
R
Number outstanding as at 31 December
2021
K Toriola18/12/2017 18/12/2020 69 100 – (51 825) (17 275) 12/04/2021 84.95 –28/12/2018 28/12/2021 114 000 – – – – – 114 00020/12/2019 20/12/2022 120 800 – – – – – 120 80021/12/2020 21/12/2023 186 200 – – – – – 186 20013/12/2021 13/12/2024 – 50 850 – – – – 50 850
Total 490 100 50 850 (51 825) (17 275) – – 471 850
S Perumal^20/12/2019 20/12/2022 56 200 – – – – – 56 20021/12/2020 21/12/2023 79 400 – – – – – 79 400
Total 135 600 – – – – – –
D Molefe20/12/2020 20/12/2023 71 300 – – – – – 71 30013/12/2021 13/12/2024 – 28 500 – – – – 28 500
Total 71 300 28 500 – – – – 99 800
Y Cuba***13/12/2021 13/12/2024 – 63 300 – – – – 63 300
Total – 63 300 – – – – 63 300
+ Appointed on 13 March 2017. On appointment, RA Shuter was granted a cash-settled share-based payment incentive in lieu of unvested stocks or equity relinquished upon resignation from previous employment. The value of the incentive was determined based on the market value of 327 214 ordinary listed shares in MTN Group Limited. The incentive was paid on 12 March 2020.
1 Ceased to be Group President and CEO on 31 August 2020.^ Ceased to be acting GCFO on 31 March 2021.** G Motsa is due two additional share payments vesting in 2022 and 2023 according to vesting rules.*** Appointed as prescribed officer on 1 January 2021.
Doing for tomorrow, today
Doing for shared value
Strategic and financial review
Governance and remuneration
116
Integrated Report 2021
Remuneration report continued

Special note on RA Shuter’s LTIPs in accordance with his termination agreementRA Shuter ended his four‑year contract with MTN on 31 August 2020. As part of his exit agreement, the Board in 2021, agreed that shares allocated under the Group Performance Share Plan in 2018 and 2019, each vesting after three years, would all be retained and settled at the applicable settlement date. For the year ended December 2021, the allocation made in 2018 vested. Although Rob was not an executive director of the Company during the year under review and did not receive any other remuneration after his exit, for transparency purposes, the Committee wishes to provide an update in respect of his shares under the aforementioned terms.
This table presents the status of his shares for the 2021 financial year.
Settlement details
Date grantedVesting date as per scheme rules
Number of shares awarded on grant date
Number of shares vested in 2021^
Number of shares outstanding as at
31 December 2021
Exercise priceR
Settlement valueR 000
Exercisedate
28/12/2018 28/12/2021 436 600 436 600 – 198.2141 R86 540 18/12/202220/12/2019 20/12/2022 457 100 – 457 100 – – –
^ The vested shares were settled in March 2022 and the related SENS announcement was issued on 25 March 2022. Refer to settlement details above for more information of the transaction.
Special note on G Motsa's LTIPs in accordance with his termination agreementThe share allocations referred to in the above footnote on page 116, vesting in 2022 and 2023 according to vesting rules, are presented in the table below.
Settlement details
Date grantedVesting date as per scheme rules
Number of shares awarded on grant date
Pro‑rata of shares forfeited on termination
Number of shares outstanding as at
31 December 2021
Exercise priceR
Settlement valueR 000
Exercisedate
20/12/2019 20/12/2022 121 800 39 305 82 495 – – –21/12/2020 20/12/2022 167 800 110 182 57 618 – – –
Doing for tomorrow, today
Doing for shared value
Strategic and financial review
Governance and remuneration
117
Integrated Report 2021
Remuneration report continued

Year-on-year comparison of remuneration paid to non-executive directors
2021 Date appointedRetainer#
R’000Attendance#
R’000
Special Board R’000
Strategy session
R’000Ad hoc work
R’000Total R000
Non-executive directors
MH Jonas 01/06/2018 3 135 917 547 1 271 – 5 870
SN Mabaso‑Koyana 01/09/2020 376 535 244 315 75 1 545
NP Gosa^ 01/04/2021 292 494 185 290 9 1 270
PB Hanratty+ 01/08/2016 275 326 230 218 66 1 115
S Kheradpir+ 08/07/2015 1 603 882 443 616 9 3 553
AT Mikati†^^ 18/07/2006 771 359 166 139 18 1 453
SP Miller+ 01/08/2016 1 516 924 443 616 9 3 508
KDK Mokhele 01/07/2018 582 767 330 379 9 2 067
CWN Molope^ 01/04/2021 250 417 95 290 75 1 127
VM Rague+ 01/07/2019 1 760 998 438 616 18 3 830
SLA M Sanusi+ 01/07/2019 1 516 924 443 616 68 3 567
NL Sowazi 01/08/2016 395 600 230 218 66 1 509BS Tshabalala 01/06/2018 373 548 153 290 9 1 373
Total 12 844 8 691 3 947 5 874 431 31 787
+ Fees have been paid in euros.† Fees are paid to Lombard Odier Darier Hentsch and Cie (M1 Limited).# Retainer and attendance fees include fees for Board and committee representation and meetings.^ Appointed on 1 April 2021.^^ Retired on 28 May 2021.
Doing for tomorrow, today
Doing for shared value
Strategic and financial review
Governance and remuneration
118
Integrated Report 2021
Remuneration report continued

2020 Date appointedRetainer#
R’000Attendance#
R’000
Special Board R’000
Strategy session
R’000Ad hoc work
R’000Total R000
Non-executive directors
MH Jonas 01/06/2018 3 190 1 078 686 174 – 5 128
SN Mabaso‑Koyana^ 01/09/2020 136 173 59 — 9 377
PB Hanratty+ 01/08/2016 518 403 148 59 54 1 182
S Kheradpir+ 08/07/2015 1 572 317 172 132 – 2 193
NP Mageza^^ 01/01/2010 163 234 26 59 25 507
MLD Marole^^ 01/01/2010 252 540 26 118 25 961
AT Mikati+ 18/07/2006 1 678 986 717 152 235 3 768
SP Miller+ 01/08/2016 1 441 904 816 132 – 3 293
KDK Mokhele 01/07/2018 578 706 310 114 152 1 860
VM Rague+ 01/07/2019 1 497 1 050 831 132 293 3 803
KC Ramon@^^^ 01/07/2014 268 354 203 59 47 931
SLA M Sanusi+ 01/07/2019 1 471 371 420 132 204 2 598
NL Sowazi 01/08/2016 434 578 320 59 44 1 435BS Tshabalala 01/06/2018 445 414 249 59 – 1 167
Total 13 643 8 108 4 983 1 381 1 088 29 203
# Retainer and attendance fees include fees for Board and committee representation and meetings.
@ Fees paid to AngloGold Ashanti Limited.^ Appointed on 1 September 2020.+ Fees have been paid in euros.^^ Resigned on 30 April 2020.^^^ Resigned on 30 September 2020.
Doing for tomorrow, today
Doing for shared value
Strategic and financial review
Governance and remuneration
119
Integrated Report 2021
Remuneration report continued

KPI Criteria
Employee sustainable engagement score (%)
The MTN Group employee culture survey is conducted annually across each of the MTN Group’s operating countries (referred to as opcos), and within the MTN Group head office (management company referred to as manco).
The survey reviews Sustainable Engagement across three major components: • Engagement: measuring the rational connection, emotional attachment and motivational aspect of Engagement. • Enablement: measuring if employees have an appropriate level of support in their work environment to ensure they are capable of doing their jobs well. • Energy: measuring employees’ wellbeing to ensure people have capacity to perform at their best.
Calls to whistle-blower line The anonymous tip‑offs line is managed by a third party, who collects the tip‑offs and reports to MTN. MTN is responsible for the investigation of the tip‑off. The tip‑off items received include fraudulent tip‑offs and other administrative matters.
An incident is regarded as received when the call is logged on the anonymous tip‑offs line, evaluated by the contracted third party to eliminate dropped calls, prank calls and other non‑events. Formal whistle‑blowing reports are issued to MTN through the Deloitte Tip‑offs Anonymous website.
Net promoter score percentage for MTN South Africa, MTN Nigeria, and other key markets
Net promoter score (NPS) measures customers’ experience with a brand through a simple question:
“On a scale of 0 to 10, how likely would you be to recommend MTN to a friend or family member?”
Responses of nine or 10 are considered ‘promoters’ while responses of seven or eight are considered ‘passives’. Any score of six or below is considered to be a ‘detractor’. Each country’s NPS is calculated by subtracting the percentage of ‘detractors’ from the percentage of ‘promoters’. Combined scores of multiple operations are calculated by weighting responses according to subscriber base within each operation.
Other key markets include: Cameroon, Cote d'Ivoire, Iran and Uganda.
Total tax contribution (Rbn) Tax‑related payments made during the 1 January 2021 to 31 December 2021 period which relate to:
1. Taxes borne through the operation of the Company, including: • Corporate income tax. • Product and indirect taxes such as:
– Custom duties. – Excise duties. – Value added tax (borne). – Other indirect taxes (e.g. but not limited to, country‑specific taxes on services).
• People and payroll taxes such as: – Unemployment insurance fund levy. – Occupational injuries and diseases levy. – Skills development levy. – Pay‑as‑you‑earn settlements.
• Withholding taxes. • Property taxes. • Stamp duty. • Operating licence fees. • Other government‑specific levies (e.g. but not limited to local government permits, motor vehicle permits, property and municipal levies, registration fees and
other government levies).
2. Taxes collected on behalf, and paid over, to the tax authorities, including: • Product and indirect taxes such as:
– Value added tax (net of VAT collected by, and VAT refunded to, MTN). • People and payroll taxes such as:
– Pay‑as‑you‑earn. – Other employee taxes. – Unemployment insurance fund levy.
• Withholding taxes such as: – Dividends tax.
Doing for tomorrow, today
Doing for shared value
Strategic and financial review
Governance and remuneration
120
Integrated Report 2021
Definitions for assured non-financial data

2G Second generation mobile communications3G Third generation mobile communications4G/LTE Fourth generation or long‑term evolution mobile communications5G Fifth generation mobile communicationsAFCF Adjusted free cash flowAfrica CDC Africa Centres for Disease Control and PreventionAFS Annual Financial StatementsAI Artificial intelligenceAPI Application programming interfaceARP Asset realisation programmeBCM Business continuity managementB‑BBEE Black economic empowermentCAGR Compound annual growth rateCapex Capital expenditureCapex intensity Capex divided by revenueCBN Central Bank of NigeriaCEO Chief Executive OfficerCFO Chief Financial OfficerCHASE MTN’s framework to drive adoption of data servicesChurn Average disconnections in a period divided by average monthly customersCSI Corporate social investmentCODM EBITDA Earnings before finance income and finance costs (which includes gains or
losses on foreign exchange transactions and a loss on revision of cash flows from a JV), tax, depreciation and amortisation, and is also presented before recognising the following items:• impairment of JV and goodwill;• net monetary gain resulting from the application of hyperinflation;• share of results of associates and JVs after tax;• hyperinflation;• tower sale profits;• gain on disposal/dilution of investment in associate and JV;• gain on disposal of subsidiary; and• impairment loss on remeasurement of non‑current assets held for sale.
COO Chief Operating OfficerCOVID‑19 The novel coronavirusCP Company performanceCVM Customer value managementECOWAS Economic Community of West African StatesEPS Earnings per shareESG Environmental, social and governanceESOP Employee share ownership planExco Executive CommitteeEP Employee performanceFinancial capital Debt and equity financing, cash generated from operations and investmentsFintech Includes MTN Mobile Money, e‑commerce, insurance, airtime lending and data
monetisation streamsForex Foreign exchangeFTTX Fibre to the x. Any broadband architecture using fibre to provide all or part of
the local loop for last mile telecomsGDP Gross domestic productGHG Greenhouse gasGSMA The GSM AssociationHEPS Headline earnings per shareHoldco Holding companyHuman capital The motivation, skills, safety and diversity of our employees, contractors,
partners and suppliersHyperscaler An operator of a data centre that offers scalable cloud computing services.ICASA Independent Communications Authority of South Africa
ICT Information and communication technologies IFRS International Financial Reporting StandardsIntellectual capital Our culture; our know‑how; proprietary and licensed technology: procedures
and processesIPO Initial public offeringIoT Internet of ThingsISP Internet service providerITU International Telecommunication UnionJSE Johannesburg Stock ExchangeJV Joint ventureKPI Key performance indicatorsKYC Know your customer: a process to identify and verify customer identity LA Limited assuranceLTI Long‑term incentiveM&A Mergers and acquisitionsManco MTN’s group management companyManufactured capital
Our networks; 2G, 3G, 4G and 5G base stations and fibre; electronic devices; public infrastructure.
MB MegabyteMENA Middle East and North AfricaMFS Mobile financial servicesMNO Mobile network operatorMoMo MTN Mobile MoneyMSR Minimum shareholding requirementMOU Minutes of useNatural capital Spectrum, energy and landNIN National identification numbersNM Not measurableNPS Net promoter scoreOpcos Our operating companiesOpex Operating expenditureOTT Over the top servicesPSB Public Services BankQoS Quality of serviceRAN Radio access networkROACE Return on average capital employedROE Return on equityROI Return on investmentROIC Return on invested capitalSARS Share appreciation rights schemeSDG Sustainable Development GoalsSEA Southern and East Africa regionSIM Subscriber identity moduleSME Small and medium enterpriseSMP Significant market powerSMS Short message serviceSocial capital Trusted relationships with customers, communities, governments and
regulators, suppliers, trade unions, industry bodies and civil rights groupsSRP Share rights planSSA Sub‑Saharan AfricaTP Team performanceTSR Total shareholder returnUN United NationsUSME MTN’s programme to sustain demand for voice servicesUSSD Unstructured supplementary service data VP Vice‑presidentWECA West and Central AfricaWFH Work from homeYoY Year‑on‑year
Doing for tomorrow, today
Doing for shared value
Strategic and financial review
Governance and remuneration
121
Integrated Report 2021
Glossary

Administration
MTN GROUP LIMITEDIncorporated in the Republic of South Africa
Company registration number: 1994/009584/06ISIN: ZAE000042164Share code: MTN
Board of directorsMH Jonas*KDK Mokhele*RT Mupita1
TBL Molefe1 (appointed 1 April 2021)NP Gosa* (appointed 1 April 2021)CWN Molope* (appointed 1 April 2021) PB Hanratty2*S Kheradpir3*SN Mabaso‑Koyana*SP Miller4*NL Sowazi* BS Tshabalala*SLA Sanusi5* VM Rague6* 1 Executive 2 Irish3 American 4 Belgian5 Nigerian6 Kenyan * Independent non-executive director
Group Company SecretaryPT Sishuba‑BonoyiPrivate Bag X9955, Cresta, 2118
Registered office216 – 14th AvenueFairlandGauteng, 2195
American depository receipt (ADR) programmeCusip No. 62474M108 ADR to ordinary share 1:1
Depository: The Bank of New York Mellon101 Barclay Street, New York NY, 10286, USA
Forward-looking information Opinions and forward‑looking statements expressed in this report represent those of the Company at the time. Undue reliance should not be placed on such statements and opinions because by nature, they are subjective to known and unknown risk and uncertainties and can be affected by other factors that could cause actual results and company plans and objectives to differ materially from those expressed or implied in the forward‑looking statements.
Neither the Company nor any of its respective affiliates, advisers or representatives shall have any liability whatsoever (based on negligence or otherwise) for any loss howsoever arising from any use of this report or its contents or otherwise arising in connection with this presentation and do not undertake to publicly update or revise any of its opinions or forward‑looking statements whether to reflect new information or future events or circumstances otherwise.
Mapping our SDG impact:In 2021, MTN Group implemented an SDG prioritisation tool to determine the SDGs and SDG Ambition Benchmarks on which we could deliver the biggest impact, while creating business value. It considers three dimensions – impact potential, strategic alignment and risk management potential – for which scores are attributed against defined qualitative criteria. The tool considers various internal and external assessments such as our risk register and industry research. It also incorporates stakeholder views collected through surveys, workshops and materially assessments. The results are then refined to ensure alignment with our strategy.
MTN Group sharecare lineToll free: 0800 202 360 or +27 11 870 8206 if phoning from outside South Africa
Transfer secretariesComputershare Investor Services Proprietary LimitedRegistration number 2004/003647/070Rosebank Towers, 15 Biermann AvenueRosebank, 2196PO Box 61051, Marshalltown, 2107
Joint auditorsPricewaterhouseCoopers Inc.4 Lisbon Lane, Waterfall City, Jukskei View, Johannesburg, South Africa, 2090
Ernst & Young Inc.102 Rivonia Road, Sandton, Johannesburg, South Africa, 2146
Lead sponsorTamela Holdings Proprietary LimitedGround Floor, Golden Oak House,35 Ballyclare Drive, Bryanston, 2021
Joint sponsorJP Morgan Equities (SA) Proprietary Limited1 Fricker Road, cnr Hurlingham Road, Illovo, 2196
AttorneysWebber Wentzel90 Rivonia Road, Sandton, 2196PO Box 61771, Marshalltown, 2107
Contact detailsTelephone: National 083 869 3000
International +27 11 912 3000Facsimile: National 011 912 4093
International +27 11 912 4093E-mail: [email protected]: http://www.mtn.comDate of release: 25 April 2022
Enhancements in our report in 2021We work to improve our Integrated Report every year, enhancing its usefulness to readers. The report has a clear strategic focus, an emphasis on value creation and a high level of connectivity between the various elements, providing a coherent value creation and preservation narrative. For the 2021 report, we made numerous enhancements, some of which are:
• Greater disclosure of our strategic priorities, including details on our progress, plans and targets, with an emphasis on the MTN of tomorrow and how we are going to get there.
• Clear articulation of the step change in our approach to ESG and what this entails, including progress, plans and targets and how we map our impact on the SDGs. Adding ‘Committed to create share value’ to our investment case.
• Simpler design and improved connectivity and flow, as well as links to relevant strategic priorities, capitals, material matters, risks, stakeholders and SDGs.
• Greater use of market‑relevant images and advertising collateral from our opcos.• Clearly defining what value means to us and articulating our purpose.• Evolution of our market context disclosure, providing country‑specific issues
rather than a thematic view. We give this in terms of how we manage our business – by the geography of the biggest contributors to MTN’s activities.
Doing for tomorrow, today
Doing for shared value
Strategic and financial review
Governance and remuneration
122
Integrated Report 2021