lakshmi ring travellers (coimbatore) limited - lrt group page
Upload
khangminh22Category
view
0download
0
Absa Group LimitedFinancial results for the reporting
period ended 31 December 2019
1. Reportable segment changes Rest of Africa (RoA) Banking was renamed to Absa Regional
Operations (ARO) to align with the Absa Group brand. Wealth, Investment Management and Insurance (WIMI) has
been removed from the Group’s segmental disclosures to align with how the operations are now managed:
Life Insurance and Short-term Insurance (including Insurance Absa Regional Operations) are disclosed as the Insurance Cluster in Retail and Business Banking South Africa (RBB SA).
Wealth, Distribution and Fiduciary services have moved to the Relationship Banking segment in RBB SA.
WIMI Other is part of Retail and Business Banking Other in RBB SA.
Investment Management is reported in Head Office, Treasury and other operations in South Africa.
Terminating lines is reported in Head Office, Treasury and other operations in South Africa.
The aforementioned segment changes have resulted in the
but have not impacted the overall position or net earnings of the Group.
2. Business portfolio changesThe following business portfolio changes have taken place during the reporting period:
RBB SA operating model: RBB SA has aligned its operating model to enable a more customer-centric approach, which offers more holistic product offerings. The business has now been arranged into the following units:
Home Loans; Vehicle and Asset Finance; Everyday Banking; Relationship Banking; Insurance Cluster; Retail and Business Banking Other.
Software projects and other assets, liabilities (together with the funding provided by Treasury) and associated income and expenses, which were previously centrally maintained, have
responsible segments to ensure end-to-end accountability of business activities.
previously reported in ARO, has been moved to Corporate and Investment Banking South Africa (CIB SA) to support its regional expansion strategy.
The business portfolio changes have resulted in the restatement of
the overall position or net earnings of the Group.
In October 2019, Absa Bank Limited entered into an agreement to sell the Edcon loan book within RBB SA.
current assets held for sale as required by IFRS 5. The loan book continued to be measured in accordance with IFRS 9.
2020, with the effective date of the transfer being 1 February 2020.
3. Adoption of new International Financial Reporting Standards (IFRS)New IFRSs have been adopted, of which IFRS 16 Leases
Refer to note 17 for more information.
Dividend per shareFinal: 620 cents Interim: 505 cents
Key datesDividend payment: 20 April 2020
Shareholder communicationsShareholder information page 162Contact details page 172
• The Board of Directors oversees the Group’s activities and holds management accountable for adhering to the risk governance framework. To do so, directors view reports prepared by the businesses, risk and others. They exercise sound independent judgement, and probe and challenge recommendations, as well as decisions made by management.
• Finance is responsible for establishing a strong control
and serves as an independent control function advising
establishing policies or processes to manage risk.• Finance is led by the Financial Director who reports directly
to the Group Chief Executive. The Financial Director has regular and unrestricted access to the Board of Directors as well as to the Group Audit and Compliance Committee (GACC).
• Together with the GACC, the Board has reviewed and approved
announcement released on 11 March 2020.
Report overview
The full set of documents is available on www.absa.africa
www.absa.africa
Contents
Absa Group Limited Financial results for the reporting period ended 31 December 2019 1
The term Absa Group or the Group refers to Absa Group Limited and its subsidiaries.
Date of publication: 11 March 2020.
no harmful chemicals used during the bleaching process. The byproducts of production of the paper are recycled into fertiliser, building materials and heat.
ifc Report overview
2 The Absa Group today
3 Normalised Group performance
4 Normalised Group performance overview
8 Normalised salient features
9 Normalised salient features by segment
10
14 Basis of presentation
15 Dividend announcement
16 Consolidated normalised statement of comprehensive income
18
20 Consolidated normalised statement of changes in equity
24
25
59 Segment performance
60 WIMI (as previously disclosed) segment change
61 Segment performance overview
64 Segment report per market segment
66 Segment report per geographical segment
68 RBB South Africa
90 CIB
106 Absa Regional Operations
122
123 Group IFRS performance
124 Consolidated IFRS salient features
125 Consolidated IFRS statement of comprehensive income
127
128 Consolidated IFRS statement of changes in equity
statements
Reconciliation of IFRS to normalised results
140 Barclays separation effects
142 Risk management
Risk management overview
155 Capital management and RWA
160 Appendices
161 Share performance
162 Shareholder information and diary
Glossary
170 Abbreviations and acronyms
172 Contact information
Icons used with this report
Negative
Remains the same
Increase/decrease
Marginal
2 Absa Group Limited Financial results for the reporting period ended 31 December 2019
The Absa Group today
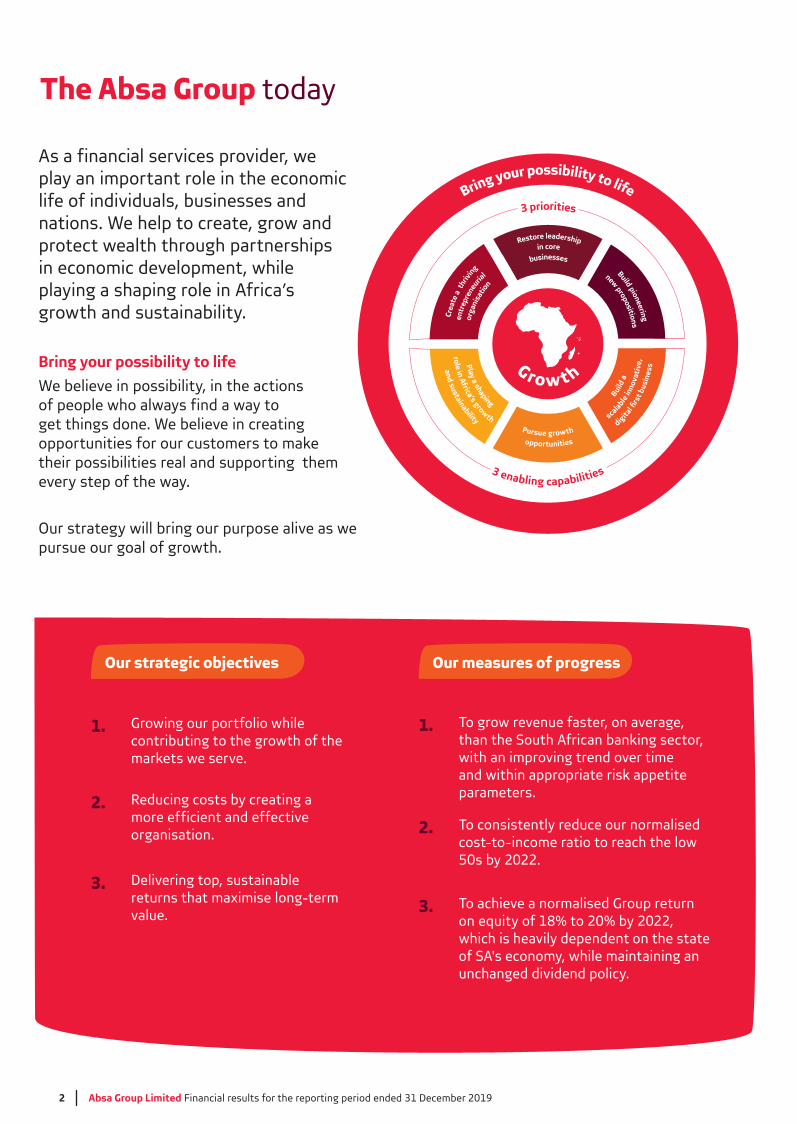
Growing our portfolio while contributing to the growth of the markets we serve.
1.
Reducing costs by creating a more efficient and effective organisation.
2.
Delivering top, sustainable returns that maximise long-term value.
3.
To grow revenue faster, on average, than the South African banking sector, with an improving trend over time and within appropriate risk appetite parameters.
1.
To consistently reduce our normalised cost-to-income ratio to reach the low 50s by 2022.
2.
To achieve a normalised Group return on equity of 18% to 20% by 2022, which is heavily dependent on the state of SA's economy, while maintaining an unchanged dividend policy.
3.
G ro w t h
Restore leadershipin core
businesses
Crea
te a
thr
ivin
g
entr
epre
neuria
l
orga
nisa
tion
Build pioneering
new propositions
opportunities
Pursue growth dig
ital
rst b
usin
ess
scalable
inno
vati
ve,
Build
a
role in Africa’s growth
and sustainability
Play a shaping
3 enabling capabilities
3 priorities Bring your possibility to life
Our strategic objectives Our measures of progress
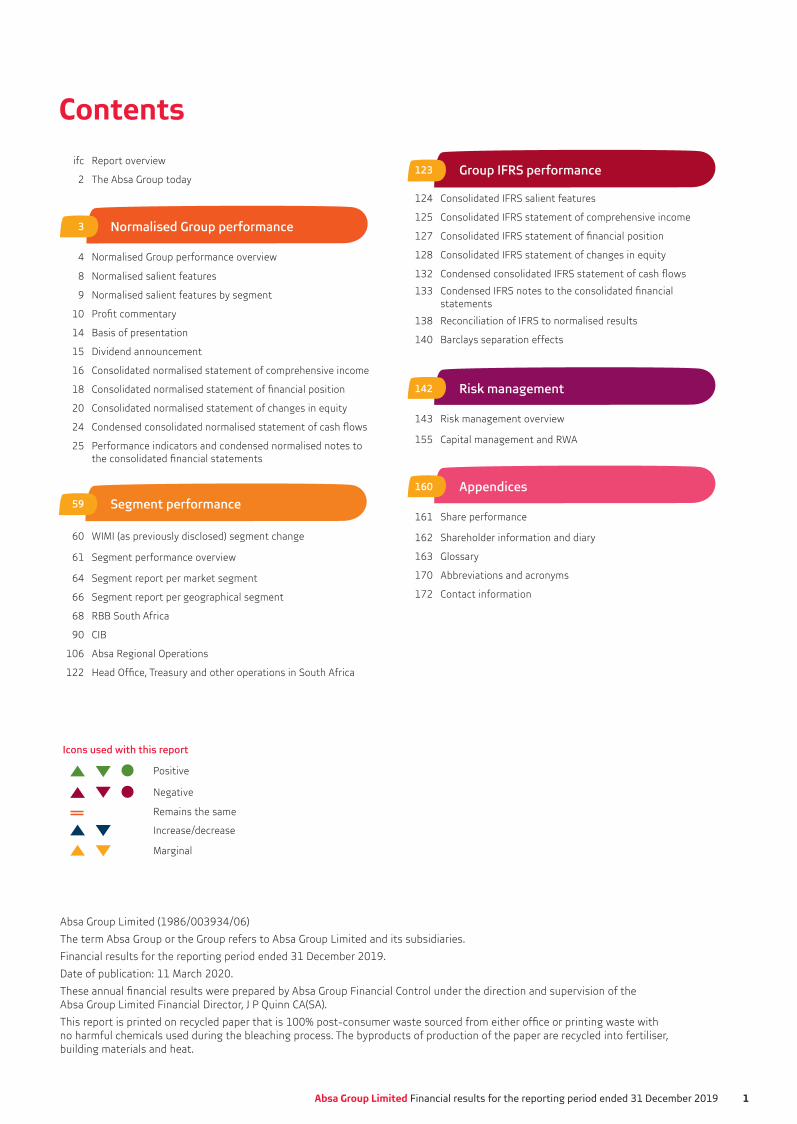
As a financial services provider, we play an important role in the economic life of individuals, businesses and nations. We help to create, grow and protect wealth through partnerships in economic development, while playing a shaping role in Africa’s growth and sustainability.
Our strategy will bring our purpose alive as we pursue our goal of growth.
We believe in possibility, in the actions of people who always find a way to get things done. We believe in creating opportunities for our customers to make their possibilities real and supporting them every step of the way.
Bring your possibility to life

Normalised Group performance
Normalised Group performance overview 4Normalised salient features 8Normalised salient features by segment 9
10Basis of presentation 14Dividend announcement 15Consolidated normalised statement of comprehensive income 16
18Consolidated normalised statement of changes in equity 20
24Performance indicators and condensed normalised notes to the
25
Absa Group Limited Financial results for the reporting period ended 31 December 2019 3
4 Absa Group Limited Financial results for the reporting period ended 31 December 2019
3 Normalised Group performance59 Segment performance
123 Group IFRS performance
142 Risk management
160 Appendices
4 Overview8 Normalised salient features9 Normalised salient features by segment
1014 Basis of presentation15 Dividend announcement16
60 WIMI segment change61 Overview64 Per market segment66 Per geographical segment
68 RBB South Africa90 CIB
106 Absa Regional Operations122
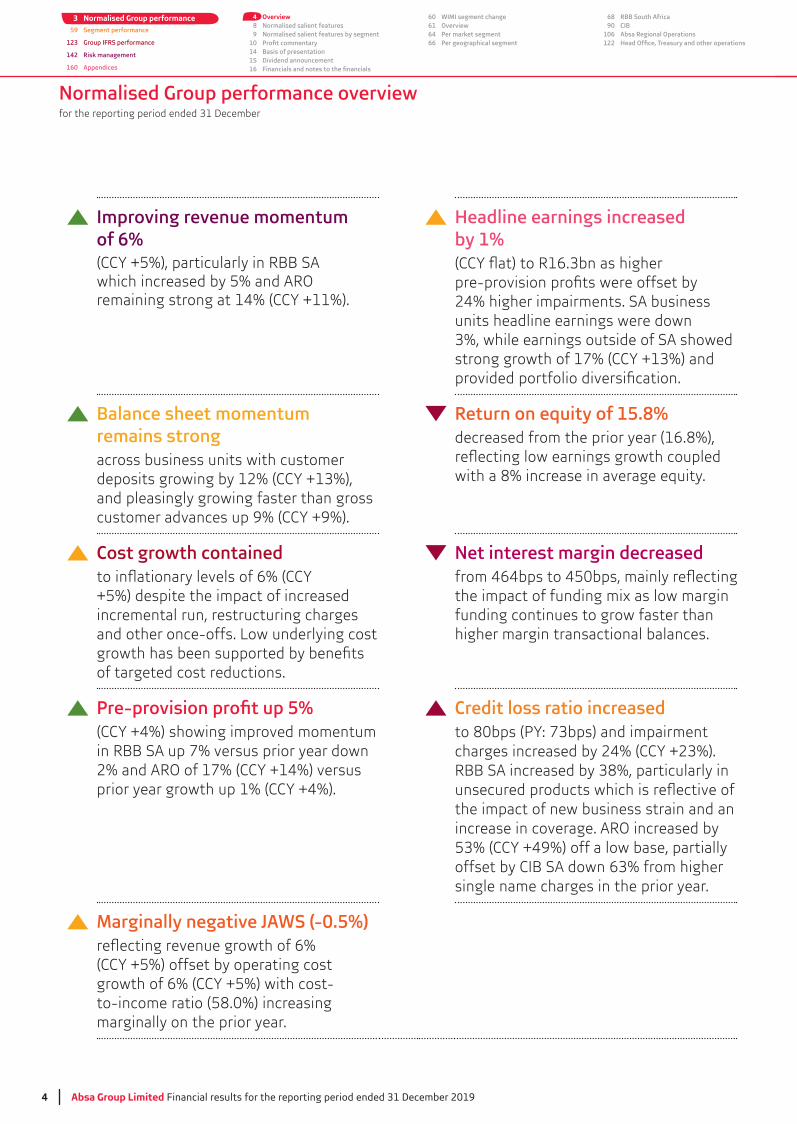
Improving revenue momentum of 6% (CCY +5%), particularly in RBB SA which increased by 5% and ARO remaining strong at 14% (CCY +11%).
Headline earnings increased by 1%
24% higher impairments. SA business units headline earnings were down
Balance sheet momentum remains strong across business units with customer
and pleasingly growing faster than gross customer advances up 9% (CCY +9%).
Return on equity of 15.8% decreased from the prior year (16.8%),
with a 8% increase in average equity.
Cost growth contained
+5%) despite the impact of increased incremental run, restructuring charges and other once-offs. Low underlying cost
of targeted cost reductions.
Net interest margin decreased
the impact of funding mix as low margin funding continues to grow faster than higher margin transactional balances.
(CCY +4%) showing improved momentum in RBB SA up 7% versus prior year down 2% and ARO of 17% (CCY +14%) versus prior year growth up 1% (CCY +4%).
Credit loss ratio increased
the impact of new business strain and an increase in coverage. ARO increased by
single name charges in the prior year.
Marginally negative JAWS (-0.5%)
(CCY +5%) offset by operating cost growth of 6% (CCY +5%) with cost-to-income ratio (58.0%) increasing marginally on the prior year.
Normalised Group performance overview
Absa Group Limited Financial results for the reporting period ended 31 December 2019 5
124 IFRS salient features
125 Financials133138 Reconciliation140 Barclays separation
143 Risk management overview155 Capital management
161 Share performance162 Shareholder information and diary163 Glossary170 Abbreviations and acronyms172 Contact information
Normalised Group performance overview
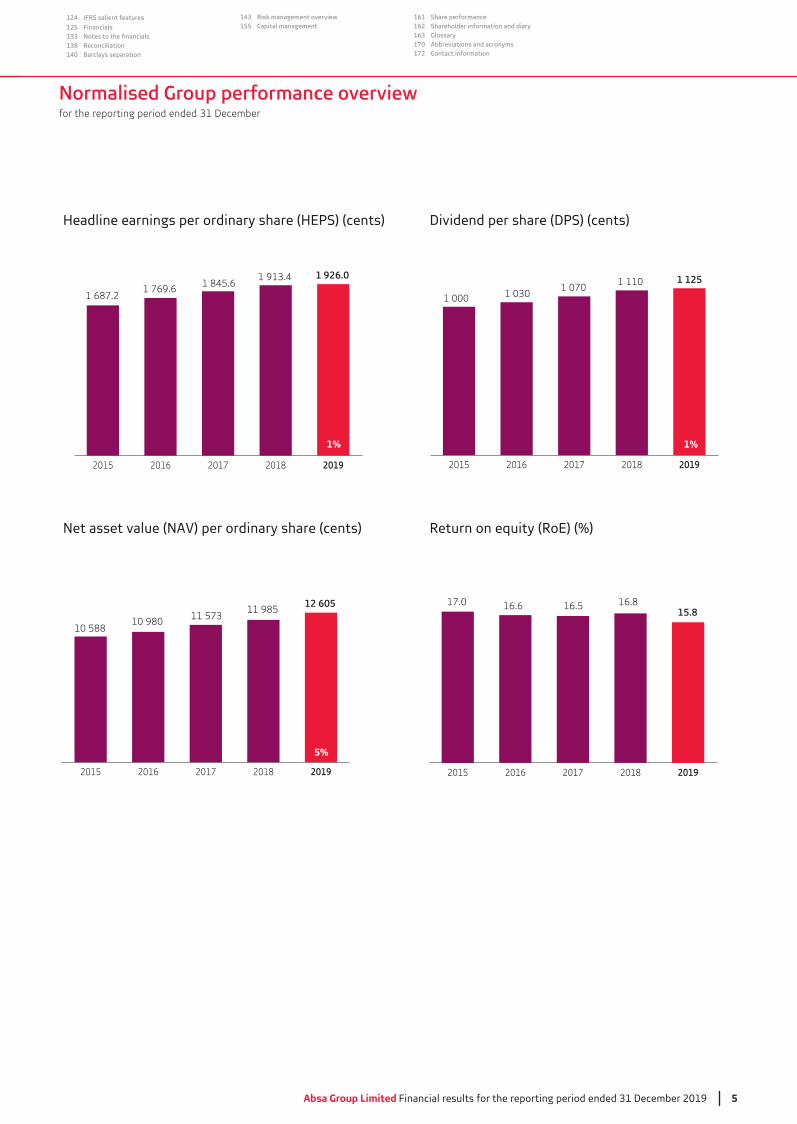
Headline earnings per ordinary share (HEPS) (cents)
10 980 11 57310 588
Dividend per share (DPS) (cents)
11 985
1 769.6 1 845.61 687.2
1 913.4
595570
1 0301 070
550
1 000
Net asset value (NAV) per ordinary share (cents) Return on equity (RoE) (%)
17.0 16.6 16.5 16.815.8
1 110
12 605
1 125
620
2019201820172016201520192018201720162015
1 926.0
20192018201720162015 20192018201720162015
1%
5%
1%
6 Absa Group Limited Financial results for the reporting period ended 31 December 2019
Normalised Group performance overview
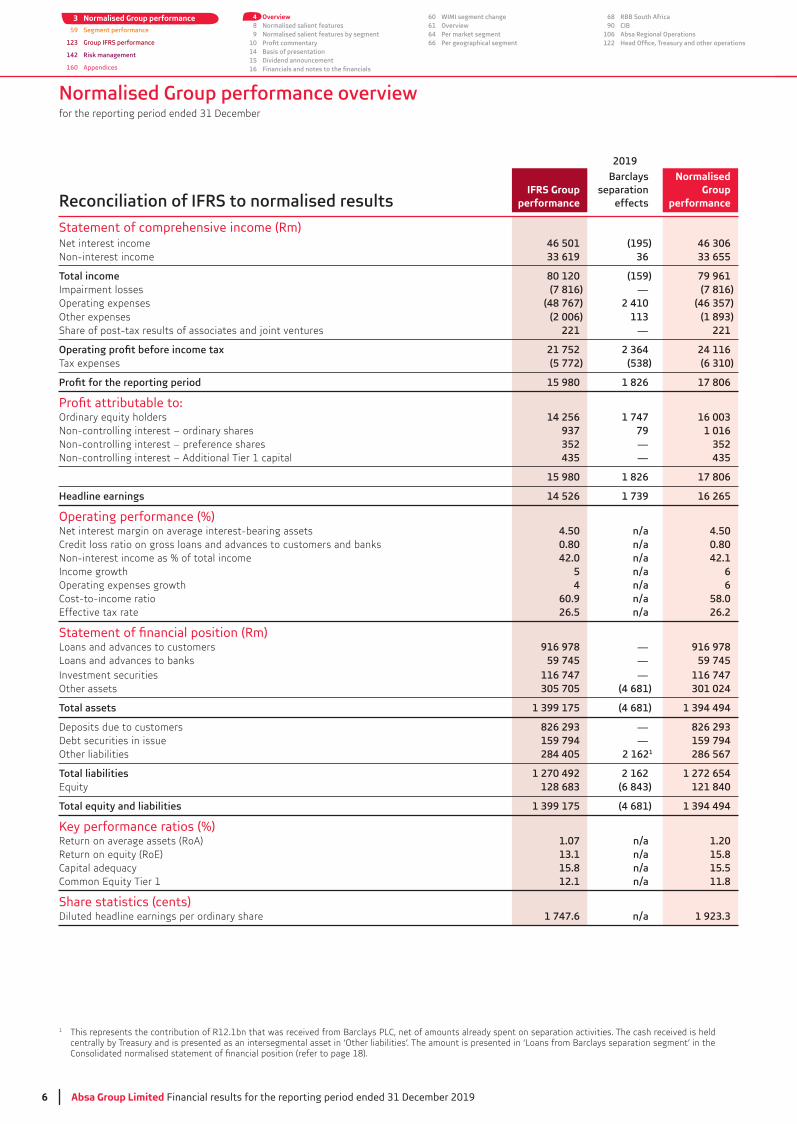
2019
Reconciliation of IFRS to normalised resultsIFRS Group
performance
Barclays separation
effects
Normalised Group
performance
Statement of comprehensive income (Rm)Net interest income 46 501 (195) 46 306Non-interest income 33 619 36 33 655
80 120 (159) 79 961Impairment losses (7 816) — (7 816)Operating expenses (48 767) 2 410 (46 357)Other expenses (2 006) 113 (1 893)Share of post-tax results of associates and joint ventures 221 — 221
21 752 2 364 24 116Tax expenses (5 772) (538) (6 310)
15 980 1 826 17 806
Ordinary equity holders 14 256 1 747 16 003Non-controlling interest – ordinary shares 937 79 1 016Non-controlling interest – preference shares 352 — 352Non-controlling interest – Additional Tier 1 capital 435 — 435
15 980 1 826 17 806
Headline earnings 14 526 1 739 16 265
Operating performance (%) Net interest margin on average interest-bearing assets 4.50 n/a 4.50Credit loss ratio on gross loans and advances to customers and banks 0.80 n/a 0.80Non-interest income as % of total income 42.0 n/a 42.1Income growth 5 n/a 6Operating expenses growth 4 n/a 6Cost-to-income ratio 60.9 n/a 58.0Effective tax rate 26.5 n/a 26.2
Loans and advances to customers 916 978 — 916 978Loans and advances to banks 59 745 — 59 745Investment securities 116 747 — 116 747Other assets 305 705 (4 681) 301 024
1 399 175 (4 681) 1 394 494
Deposits due to customers 826 293 — 826 293Debt securities in issue 159 794 — 159 794Other liabilities 284 405 2 1621 286 567
1 270 492 2 162 1 272 654Equity 128 683 (6 843) 121 840
1 399 175 (4 681) 1 394 494
Key performance ratios (%)Return on average assets (RoA) 1.07 n/a 1.20Return on equity (RoE) 13.1 n/a 15.8Capital adequacy 15.8 n/a 15.5Common Equity Tier 1 12.1 n/a 11.8
Share statistics (cents)Diluted headline earnings per ordinary share 1 747.6 n/a 1 923.3
1
centrally by Treasury and is presented as an intersegmental asset in ‘Other liabilities’. The amount is presented in ‘Loans from Barclays separation segment’ in the
3 Normalised Group performance59 Segment performance
123 Group IFRS performance
142 Risk management
160 Appendices
4 Overview8 Normalised salient features9 Normalised salient features by segment
1014 Basis of presentation15 Dividend announcement16
60 WIMI segment change61 Overview64 Per market segment66 Per geographical segment
68 RBB South Africa90 CIB
106 Absa Regional Operations122
Absa Group Limited Financial results for the reporting period ended 31 December 2019 7
124 IFRS salient features
125 Financials133138 Reconciliation140 Barclays separation
143 Risk management overview155 Capital management
161 Share performance162 Shareholder information and diary163 Glossary170 Abbreviations and acronyms172 Contact information
Normalised Group performance overview
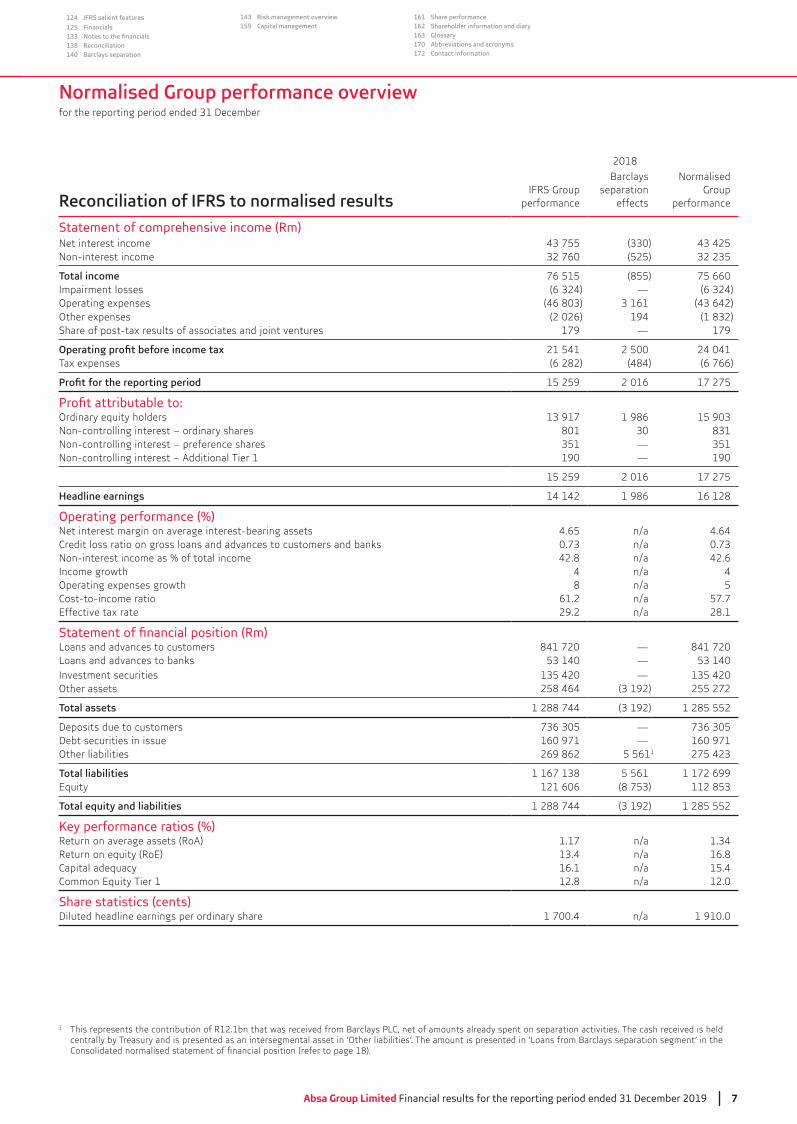
1
centrally by Treasury and is presented as an intersegmental asset in ‘Other liabilities’. The amount is presented in ‘Loans from Barclays separation segment’ in the
2018
Reconciliation of IFRS to normalised resultsIFRS Group
performance
Barclays separation
effects
Normalised Group
performance
Statement of comprehensive income (Rm)Net interest income Non-interest income (525)
76 515 (855) 75 660Impairment losses —Operating expenses Other expenses (2 026) 194Share of post-tax results of associates and joint ventures 179 — 179
21 541 2 500 24 041Tax expenses (6 282) (484) (6 766)
15 259 2 016 17 275
Ordinary equity holders 1 986Non-controlling interest – ordinary shares 801Non-controlling interest – preference shares —Non-controlling interest – Additional Tier 1 190 — 190
15 259 2 016 17 275
Headline earnings 14 142 1 986 16 128
Operating performance (%) Net interest margin on average interest-bearing assets 4.65 n/a 4.64Credit loss ratio on gross loans and advances to customers and banks n/aNon-interest income as % of total income 42.8 n/a 42.6Income growth 4 n/a 4Operating expenses growth 8 n/a 5Cost-to-income ratio 61.2 n/a 57.7Effective tax rate 29.2 n/a 28.1
Loans and advances to customers 841 720 — 841 720Loans and advances to banks —Investment securities —Other assets 258 464 255 272
1 288 744 1 285 552
Deposits due to customers —Debt securities in issue 160 971 — 160 971Other liabilities 269 862 5 5611
5 561 1 172 699Equity 121 606
1 288 744 1 285 552
Key performance ratios (%) Return on average assets (RoA) 1.17 n/aReturn on equity (RoE) n/a 16.8Capital adequacy 16.1 n/a 15.4Common Equity Tier 1 12.8 n/a 12.0
Share statistics (cents)Diluted headline earnings per ordinary share 1 700.4 n/a 1 910.0
8 Absa Group Limited Financial results for the reporting period ended 31 December 2019
3 Normalised Group performance59 Segment performance
123 Group IFRS performance
142 Risk management
160 Appendices
4 Overview8 Normalised salient features9 Normalised salient features by segment
1014 Basis of presentation15 Dividend announcement16
60 WIMI segment change61 Overview64 Per market segment66 Per geographical segment
68 RBB South Africa90 CIB
106 Absa Regional Operations122
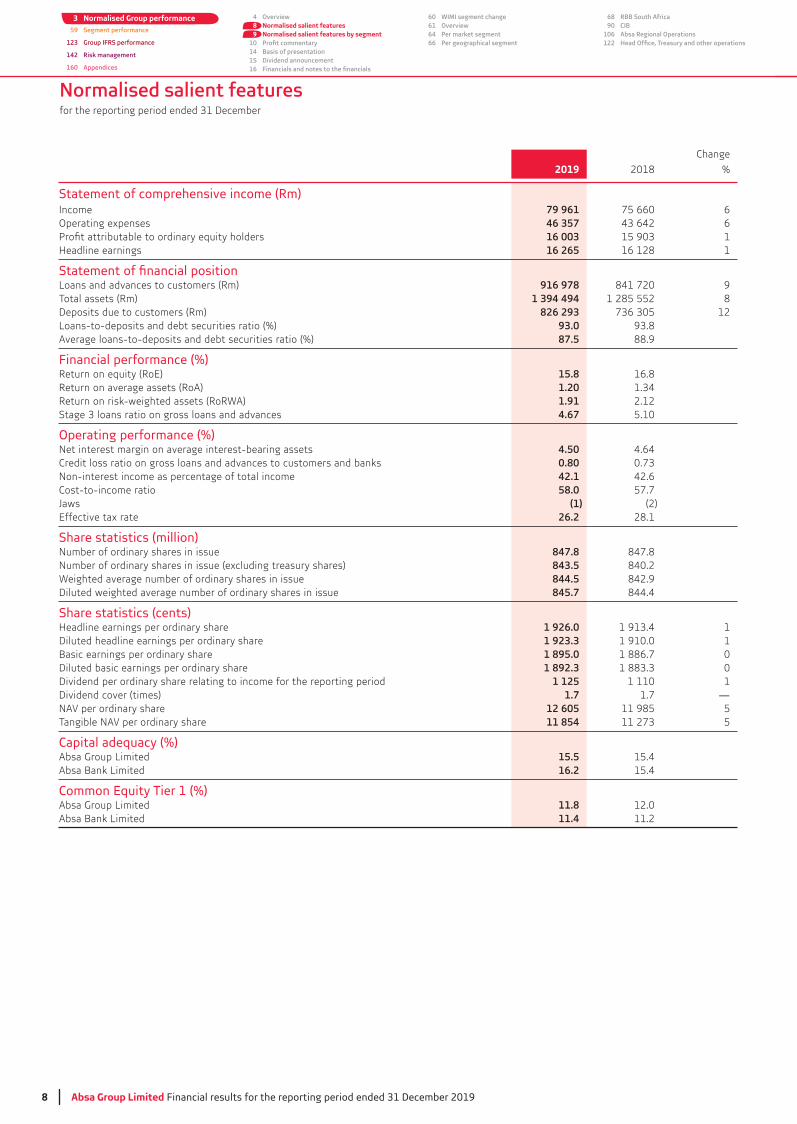
Normalised salient features
Change
2019 2018 %
Statement of comprehensive income (Rm)Income 79 961 75 660 6Operating expenses 46 357 6
16 003 1Headline earnings 16 265 16 128 1
Loans and advances to customers (Rm) 916 978 841 720 9Total assets (Rm) 1 394 494 1 285 552 8Deposits due to customers (Rm) 826 293 12Loans-to-deposits and debt securities ratio (%) 93.0Average loans-to-deposits and debt securities ratio (%) 87.5 88.9
Financial performance (%)Return on equity (RoE) 15.8 16.8Return on average assets (RoA) 1.20Return on risk-weighted assets (RoRWA) 1.91 2.12
4.67 5.10
Operating performance (%)Net interest margin on average interest-bearing assets 4.50 4.64Credit loss ratio on gross loans and advances to customers and banks 0.80Non-interest income as percentage of total income 42.1 42.6Cost-to-income ratio 58.0 57.7
(1) (2)Effective tax rate 26.2 28.1
Share statistics (million)Number of ordinary shares in issue 847.8 847.8Number of ordinary shares in issue (excluding treasury shares) 843.5 840.2Weighted average number of ordinary shares in issue 844.5 842.9Diluted weighted average number of ordinary shares in issue 845.7 844.4
Share statistics (cents)Headline earnings per ordinary share 1 926.0 1Diluted headline earnings per ordinary share 1 923.3 1 910.0 1Basic earnings per ordinary share 1 895.0 1 886.7 0Diluted basic earnings per ordinary share 1 892.3 0Dividend per ordinary share relating to income for the reporting period 1 125 1 110 1Dividend cover (times) 1.7 1.7 —NAV per ordinary share 12 605 11 985 5Tangible NAV per ordinary share 11 854 5
Capital adequacy (%)Absa Group Limited 15.5 15.4Absa Bank Limited 16.2 15.4
Common Equity Tier 1 (%)Absa Group Limited 11.8 12.0Absa Bank Limited 11.4 11.2
Absa Group Limited Financial results for the reporting period ended 31 December 2019 9
124 IFRS salient features
125 Financials133138 Reconciliation140 Barclays separation
143 Risk management overview155 Capital management
161 Share performance162 Shareholder information and diary163 Glossary170 Abbreviations and acronyms172 Contact information
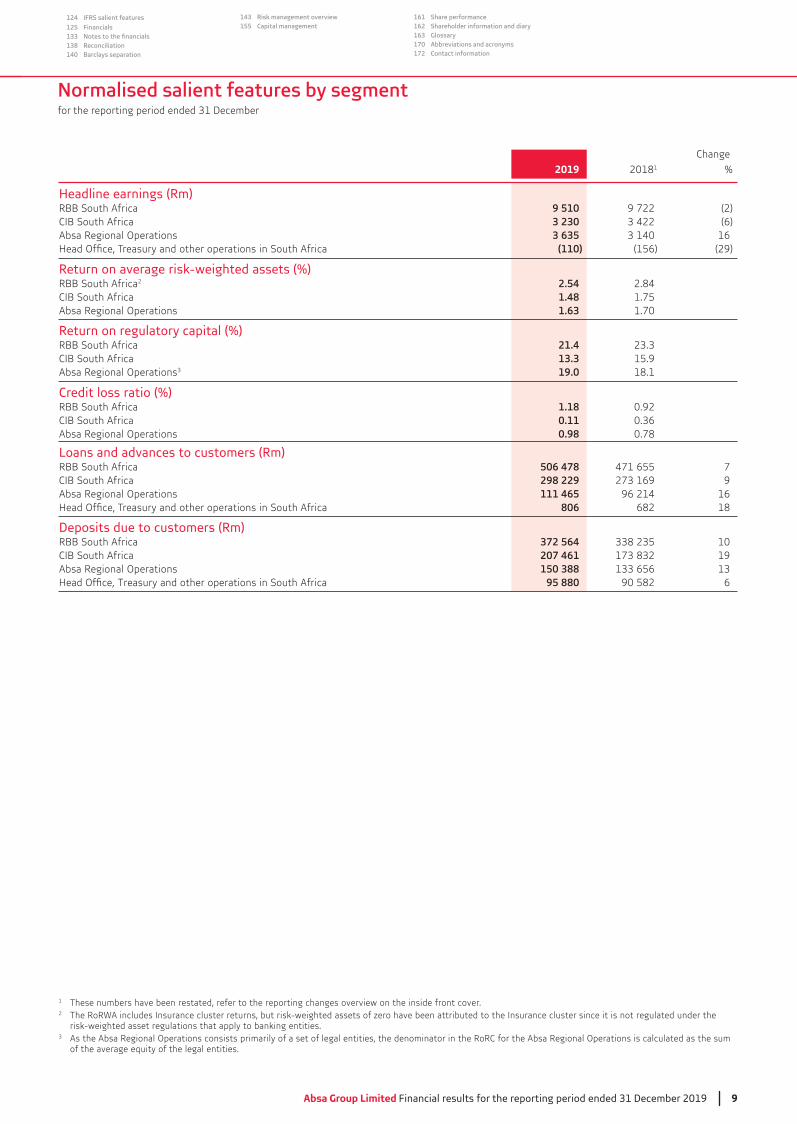
Normalised salient features by segment
Change
2019 20181 %
Headline earnings (Rm)RBB South Africa 9 510 9 722 (2)CIB South Africa 3 230 (6)Absa Regional Operations 3 635 16
(110) (156) (29)
Return on average risk-weighted assets (%)RBB South Africa2 2.54 2.84CIB South Africa 1.48 1.75Absa Regional Operations 1.63 1.70
Return on regulatory capital (%)RBB South Africa 21.4CIB South Africa 13.3 15.9Absa Regional Operations 19.0 18.1
Credit loss ratio (%)RBB South Africa 1.18 0.92CIB South Africa 0.11Absa Regional Operations 0.98 0.78
Loans and advances to customers (Rm)RBB South Africa 506 478 471 655 7CIB South Africa 298 229 9Absa Regional Operations 111 465 96 214 16
806 682 18
Deposits due to customers (Rm)RBB South Africa 372 564 10CIB South Africa 207 461 19Absa Regional Operations 150 388
95 880 90 582 6
1 These numbers have been restated, refer to the reporting changes overview on the inside front cover.2 The RoRWA includes Insurance cluster returns, but risk-weighted assets of zero have been attributed to the Insurance cluster since it is not regulated under the
risk-weighted asset regulations that apply to banking entities. As the Absa Regional Operations consists primarily of a set of legal entities, the denominator in the RoRC for the Absa Regional Operations is calculated as the sum
of the average equity of the legal entities.

10 Absa Group Limited Financial results for the reporting period ended 31 December 2019
3 Normalised Group performance59 Segment performance
123 Group IFRS performance
142 Risk management
160 Appendices
4 Overview8 Normalised salient features9 Normalised salient features by segment
1014 Basis of presentation15 Dividend announcement16
60 WIMI segment change61 Overview64 Per market segment66 Per geographical segment
68 RBB South Africa90 CIB
106 Absa Regional Operations122
Salient features
The Group declared a 1% higher full-year dividend per share of 1 125 cents.
Normalised return on equity (RoE) decreased to 15.8% from 16.8%.Normalised revenue increased 6% to R80.0bn and operating expenses rose 6% to R46.4bn, resulting in a 58.0% cost-to-income ratio.
Absa Group’s normalised Common Equity Tier 1 (CET 1) ratio of 11.8% remains above regulatory requirements and at the top end of the Board’s target range.
Normalised NAV per share rose 5% to 12 605 cents.
Normalised reporting
headline earnings during the period (2018: R1 986m). Since normalisation occurs at a Group level, it does not affect divisional disclosures.
Overview of results
R79 961bn, with net interest income and non-interest income rising 7% and 4% respectively. The Group’s net interest margin (on average interest-bearing assets) decreased to 4.50% from 4.64%, largely due to lower deposit margins. Gross loans and advances to customers grew 9% to R947bn, while deposits due to customers rose 12% to R826bn. With operating expenses growing 6%, the normalised cost-to-income ratio
Operating environmentThe global economy slowed in the current year, driven by weakness in global trade and investment. The International Monetary Fund (IMF)
prompted major central banks to cut interest rates and monetary policy is likely to remain accommodative.
South Africa’s economy contracted in the third and fourth quarters by 0.8% and 1.4%, respectively, the second recession in two years. The
slowed to 0.2%, the weakest outcome since the 2009 recession. Despite stagnant growth and challenging labour market conditions, household credit extension picked up gradually through the year, reaching 6.1% y/y in December.
persistent slack in the economy, but picked up to 4.0% in December. The South African Reserve Bank (SARB) reduced the repo rate by 25 bps in
slightly higher as a favourable turn in global risk appetite helped offset a generally downbeat assessment of South Africa’s risks.
Beyond South Africa, economic growth in our ARO presence countries slowed to a forecast 5.0% in 2019, compared to 5.6% the previous year.
related challenges.
Absa Group Limited Financial results for the reporting period ended 31 December 2019 11
124 IFRS salient features
125 Financials133138 Reconciliation140 Barclays separation
143 Risk management overview155 Capital management
161 Share performance162 Shareholder information and diary163 Glossary170 Abbreviations and acronyms172 Contact information
Group performance
Gross loans and advances to customers
credit agreements, 4% higher mortgages, 5% growth in credit cards and a 20% increase in personal and term loans. CIB South Africa’s gross loans
Operations’ gross loans increased 15% to R116bn or 21% in CCY.
Funding
hurdle of 100% during the current year. Deposits due to customers grew 12% to R826bn. Loans to deposit and debt securities ratio decreased to
Net asset valueThe Group’s normalised NAV rose 6% to R106bn and its NAV per share grew 5% to 12 605 cents. During the year it generated retained earnings of
Capital to risk-weighted assets
capitalised, comfortably above minimum regulatory capital requirements. Its normalised CET 1 and total capital adequacy ratios were 11.8% and 15.5% respectively (from 12.0% and 15.4%). The Group generated 1.8% of CET 1 capital internally during the year. Declaring a 1% higher full-year
capital generation, strategy and growth plans.
Statement of comprehensive income
Net interest income
interest margin (to average interest-bearing assets) declined to 4.50% from 4.64%, mostly due to a lower deposit margin. Loan pricing decreased 7 bps, primarily due to the Investment Bank and Relationship Banking in SA. Slower growth in Home Loans than overall loans had a positive loan
reliance on wholesale funding had an adverse composition effect. Endowment on equity and liabilities after hedging contributed 4bps less as they grew slower than overall interest-bearing assets. The structural hedge released R595m to the income statement, or 6 bps, from R518m. The after tax
Non-interest income
increased 25%.
12 Absa Group Limited Financial results for the reporting period ended 31 December 2019
3 Normalised Group performance59 Segment performance
123 Group IFRS performance
142 Risk management
160 Appendices
4 Overview8 Normalised salient features9 Normalised salient features by segment
1014 Basis of presentation15 Dividend announcement16
60 WIMI segment change61 Overview64 Per market segment66 Per geographical segment
68 RBB South Africa90 CIB
106 Absa Regional Operations122
Group performance (continued)
Statement of comprehensive income (continued)
Impairment losses on loans and advances
resulting in a 0.08% credit loss ratio from 0.05%. Vehicle and Asset Finance credit impairments grew 8% to R1 099m, improving its credit loss
Operating expenses
and stationary decreased 7%. Operating leases on properties decreased 89%, while depreciation increased 54%, both due to the impact of IFRS 16.
network. CIB ARO increased 20% and RBB Regional Operations grew 9%.
Taxation
Segment performanceRBB South Africa
R49 572m, with non-interest income increasing 6%. Costs rose 4% to R28 581m, resulting in a decrease of its cost-to-income ratio from 58.4% to 57.7%. Its credit loss ratio increased to 1.18% from 0.92%. RBB South Africa generated a return on regulatory capital (RoRC) of 21.4% and constituted 58% of total normalised headline earnings excluding the Group centre.
CIB South Africa
excluding the Group centre and produced an 18.2% RoRC.
Absa Group Limited Financial results for the reporting period ended 31 December 2019 13
124 IFRS salient features
125 Financials133138 Reconciliation140 Barclays separation
143 Risk management overview155 Capital management
161 Share performance162 Shareholder information and diary163 Glossary170 Abbreviations and acronyms172 Contact information
Segment performance (continued)
Absa Regional Operations
R2 716m due to 15% revenue growth. Absa Regional Operations accounted for 22% of total headline earnings excluding the Group centre and produced a 19.0% RoE.
Prospects
protracted load shedding, a sharper global slowdown due to the coronavirus outbreak and the impact of a potential sovereign credit rating
probability of two further 25 bps rate cuts during 2020.
shocks, as well as the potential for a coronavirus-led deterioration in the global outlook dampening Africa’s economic outlook.
On the basis described above our current assumptions, and excluding any major unforeseen political, macroeconomic or regulatory developments, we forecast reasonably similar balance sheet growth, although loans could grow faster than deposits, particularly in CIB. The Group continues to expect better loan growth from ARO in CCY than from South Africa. The Group’s net interest margin is expected to be similar to 2019, given positive mix impacts from higher growth in retail unsecured lending and ARO, partially offset by low margin deposit growth and slightly lower
Group’s credit loss ratio is expected to increase slightly, but remain in the bottom half of the Group’s through-the-cycle target range. There is increased risk of further strain in the Group’s SA retail portfolios. The Group’s RoE is likely to be similar to 2019. We still believe that an RoE target of 18% to 20% is appropriate for our Group, although we do not envisage achieving it until 2022 at the earliest, which is heavily dependent on the state of SA’s economy. However, we expect to see consistent progression on our cost-to-income ratio. Lastly, the Group’s CET 1 ratio should remain at the top end of the Board’s target range and we remain comfortable with the Group’s dividend cover at current levels.
14 Absa Group Limited Financial results for the reporting period ended 31 December 2019
3 Normalised Group performance59 Segment performance
123 Group IFRS performance
142 Risk management
160 Appendices
4 Overview8 Normalised salient features9 Normalised salient features by segment
1014 Basis of presentation15 Dividend announcement16
60 WIMI segment change61 Overview64 Per market segment66 Per geographical segment
68 RBB South Africa90 CIB
106 Absa Regional Operations122
Basis of presentation
Basis of presentation
Financial Reporting Standards (IFRS), interpretations issued by the IFRS Interpretations Committee (IFRS-IC), the South African Institute of
application of judgement are inherent in the formation of estimates. The accounting policies that are deemed critical to the Group’s results and
Accounting policies
Changes of the Group’s operating segments and business portfolios, which have been presented in the report overview on the inside front cover;
Change in the presentation of interest expense and similar charges in the statement of comprehensive income.
Auditor’s report
Events after the reporting period
of impairment of loans and advances, were based on a range of forecast economic conditions as at that date. The outbreak of coronavirus has
monitored and assessed for its impact on the business.
On behalf of the Board
W E Lucas-Bull J P QuinnGroup Chairman Financial Director
11 March 2020

Absa Group Limited Financial results for the reporting period ended 31 December 2019 15
124 IFRS salient features
125 Financials133138 Reconciliation140 Barclays separation
143 Risk management overview155 Capital management
161 Share performance162 Shareholder information and diary163 Glossary170 Abbreviations and acronyms172 Contact information
Declaration of ordinary dividend number 67620 cents per ordinary share was declared on 11 March 2020, for the period ended
completion of the dividend distribution.
The dividend will be subject to local dividends withholding tax at a rate of 20%. In accordance with paragraphs 11.17 (a) (i) to (ix) and 11.17 (c) of
The dividend has been declared out of income reserves.
The local dividend tax rate is twenty per cent (20%).
The gross local dividend amount is 620 cents per ordinary share for shareholders exempt from the dividend tax.
The net local dividend amount is 496 cents per ordinary share for shareholders liable to pay the dividend tax.1 treasury shares).
Absa Group Limited’s income tax reference number is 9150116714.
for the payment of the dividend are applicable:
Last day to trade cum dividend Tuesday, 14 April 2020
Shares commence trading ex-dividend Wednesday, 15 April 2020
Record date Friday, 17 April 2020
shareholders who have dematerialised their shares (which are held at their participant or broker) will also be credited on Monday, 20 April 2020.
On behalf of the Board
N R Drutman
Group Company Secretary
11 March 2020
Dividend announcement
1 Includes shares to be utilised when establishing a BBBEE structure.

16 Absa Group Limited Financial results for the reporting period ended 31 December 2019
3 Normalised Group performance59 Segment performance
123 Group IFRS performance
142 Risk management
160 Appendices
4 Overview8 Normalised salient features9 Normalised salient features by segment
1014 Basis of presentation15 Dividend announcement16
60 WIMI segment change61 Overview64 Per market segment66 Per geographical segment
68 RBB South Africa90 CIB
106 Absa Regional Operations122
Consolidated normalised statement of comprehensive income
2019 2018 ChangeNote Rm Rm %
Net interest income 2 46 306 7
Interest and similar income 97 796 89 177 10
Effective interest income 95 998 87 575 10Other interest income 1 798 1 602 12
Interest expense and similar charges1 (51 490) (45 752)
Non-interest income 33 655 4
Net fee and commission income 23 606 5
Fee and commission income 26 759 25 675 4Fee and commission expense (3 153) (0)
Net insurance premium income 7 830 7 190 9(3 747) 5
Changes in investment and insurance contract liabilities (1 589) 808 <(100)Gains from banking and trading activities 5 419 5 270Gains and losses from investment activities 1 600 <(100)Other operating income 536 645 (17)
79 961 75 660 6Impairment losses 4 (7 816) 24
72 145 4Operating expenses 5 (46 357) 6Other expenses (1 893)
Other impairments (319) (26)Indirect taxation 6 (1 574)
Share of post-tax results of associates and joint ventures 221 179
24 116 24 041 0Taxation expense 7 (6 310) (6 766) (7)
17 806 17 275
Ordinary equity holders 16 003 1Non-controlling interest – ordinary shares 1 016 22Non-controlling interest – preference shares 352 0Non-controlling interest – Additional Tier 1 capital 435 190 >100
17 806 17 275
Basic earnings per share (cents) 1 1 895.0 1 886.7 0Diluted earnings per share (cents) 1 1 892.3 0
1 The Group has elected to change its accounting policy to no longer present other interest expense and similar charges separately from interest expense calculated using the effective interest method. This results in more relevant information as in this manner, the Group achieves consistency with its peers. There is no impact on the 2018 SOCI, as total other interest expense and similar charges was nil.
Absa Group Limited Financial results for the reporting period ended 31 December 2019 17
124 IFRS salient features
125 Financials133138 Reconciliation140 Barclays separation
143 Risk management overview155 Capital management
161 Share performance162 Shareholder information and diary163 Glossary170 Abbreviations and acronyms172 Contact information
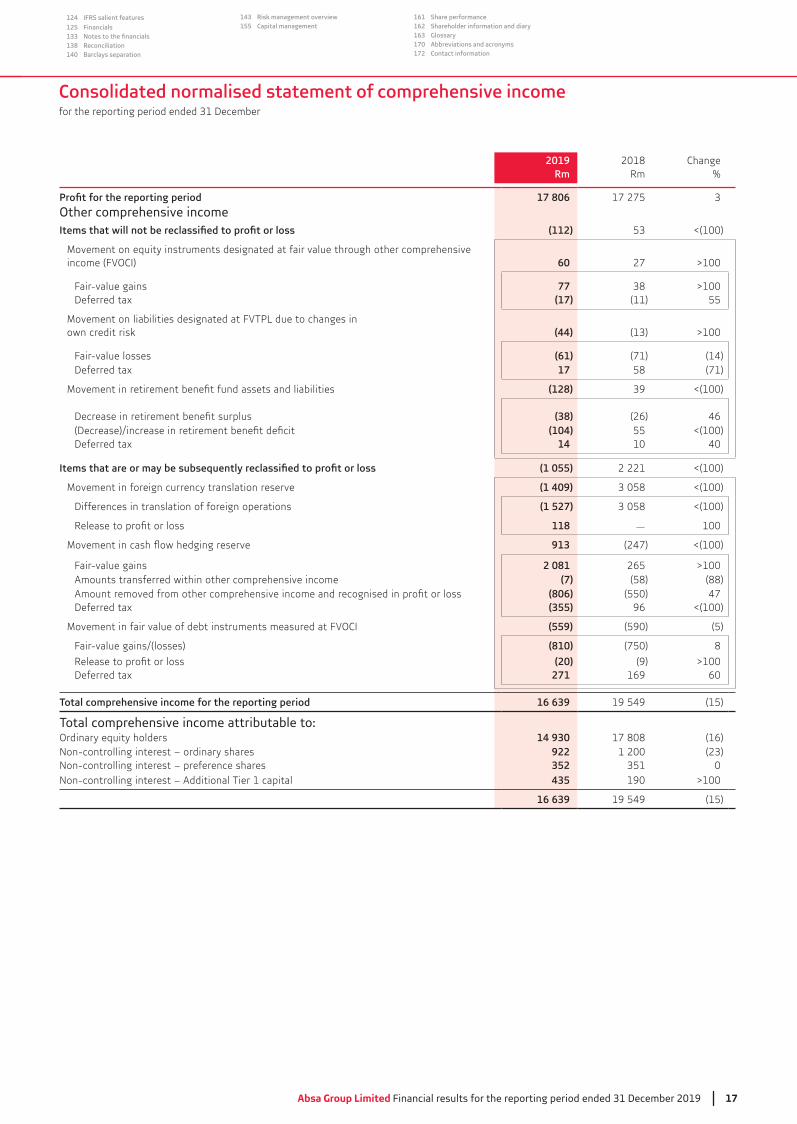
Consolidated normalised statement of comprehensive income
2019 2018 ChangeRm Rm %
17 806 17 275
Other comprehensive income(112) <(100)
Movement on equity instruments designated at fair value through other comprehensive income (FVOCI) 60 27 >100
Fair-value gains 77 >100 Deferred tax (17) (11) 55
own credit risk (44) >100
Fair-value losses (61) (71) (14)Deferred tax 17 58 (71)
(128) <(100)
(38) (26) 46(104) 55 <(100)
Deferred tax 14 10 40
(1 055) 2 221 <(100)
Movement in foreign currency translation reserve (1 409) <(100)
Differences in translation of foreign operations (1 527) <(100)
118 — 100
913 (247) <(100)
Fair-value gains 2 081 265 >100 Amounts transferred within other comprehensive income (7) (58) (88)
(806) (550) 47Deferred tax (355) 96 <(100)
Movement in fair value of debt instruments measured at FVOCI (559) (590) (5)
Fair-value gains/(losses) (810) (750) 8
(20) (9) >100 Deferred tax 271 169 60
16 639 19 549 (15)
Ordinary equity holders 14 930 17 808 (16)Non-controlling interest – ordinary shares 922 1 200Non-controlling interest – preference shares 352 0Non-controlling interest – Additional Tier 1 capital 435 190 >100
16 639 19 549 (15)
18 Absa Group Limited Financial results for the reporting period ended 31 December 2019
2019 2018 ChangeNote Rm Rm %
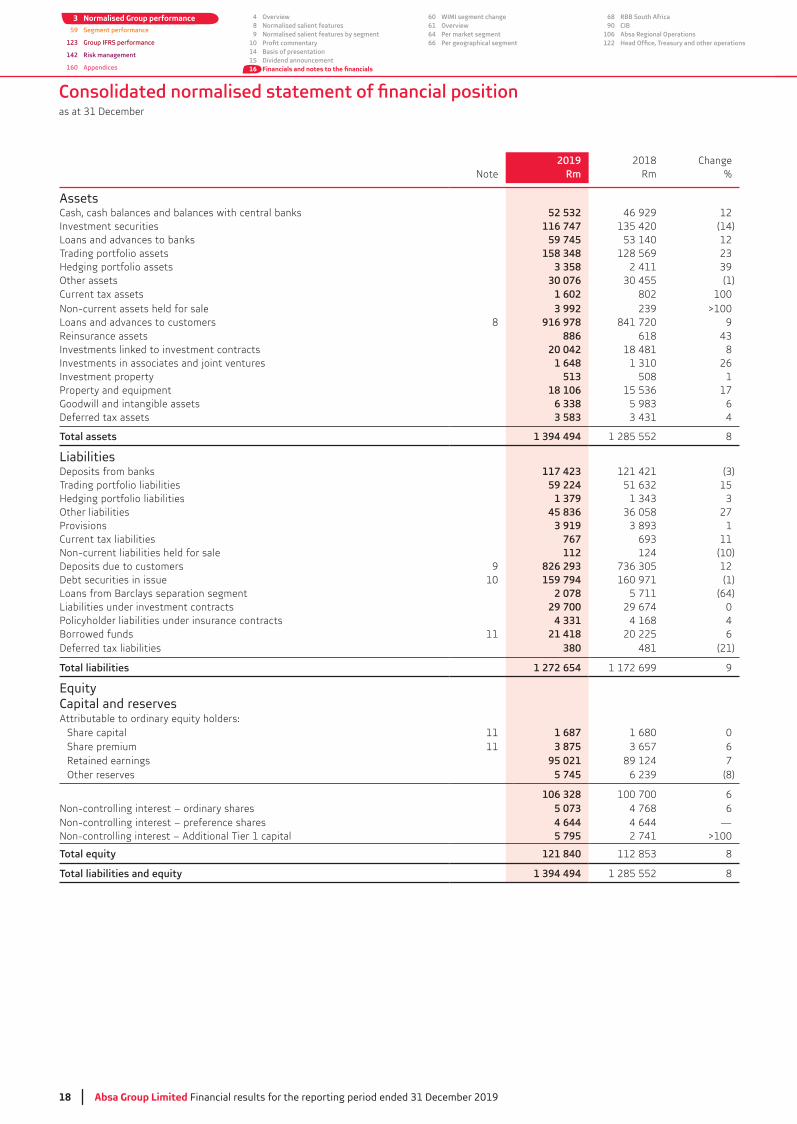
AssetsCash, cash balances and balances with central banks 52 532 46 929 12Investment securities 116 747 (14)Loans and advances to banks 59 745 12Trading portfolio assets 158 348 128 569Hedging portfolio assets 3 358 2 411Other assets 30 076 (1)Current tax assets 1 602 802 100Non-current assets held for sale 3 992 >100 Loans and advances to customers 8 916 978 841 720 9Reinsurance assets 886 618Investments linked to investment contracts 20 042 18 481 8Investments in associates and joint ventures 1 648 26Investment property 513 508 1
18 106 17Goodwill and intangible assets 6 338 6Deferred tax assets 3 583 4
1 394 494 1 285 552 8
LiabilitiesDeposits from banks 117 423 121 421Trading portfolio liabilities 59 224 15Hedging portfolio liabilities 1 379Other liabilities 45 836 27
3 919 1Current tax liabilities 767 11Non-current liabilities held for sale 112 124 (10)Deposits due to customers 9 826 293 12Debt securities in issue 10 159 794 160 971 (1)Loans from Barclays separation segment 2 078 5 711 (64)Liabilities under investment contracts 29 700 29 674 0
4 331 4 168 4Borrowed funds 11 21 418 20 225 6Deferred tax liabilities 380 481 (21)
1 272 654 1 172 699 9
EquityCapital and reservesAttributable to ordinary equity holders:
Share capital 11 1 687 1 680 0Share premium 11 3 875 6Retained earnings 95 021 89 124 7Other reserves 5 745 (8)
106 328 100 700 6Non-controlling interest – ordinary shares 5 073 4 768 6Non-controlling interest – preference shares 4 644 4 644 —Non-controlling interest – Additional Tier 1 capital 5 795 2 741 >100
121 840 8
1 394 494 1 285 552 8
3 Normalised Group performance59 Segment performance
123 Group IFRS performance
142 Risk management
160 Appendices
4 Overview8 Normalised salient features9 Normalised salient features by segment
1014 Basis of presentation15 Dividend announcement16
60 WIMI segment change61 Overview64 Per market segment66 Per geographical segment
68 RBB South Africa90 CIB
106 Absa Regional Operations122

Absa Group Limited Financial results for the reporting period ended 31 December 2019 19
124 IFRS salient features
125 Financials133138 Reconciliation140 Barclays separation
143 Risk management overview155 Capital management
161 Share performance162 Shareholder information and diary163 Glossary170 Abbreviations and acronyms172 Contact information
This page has been left blank intentionally

20 Absa Group Limited Financial results for the reporting period ended 31 December 2019
Consolidated normalised statement of changes in equity
Number of ordinary
shares’000
Sharecapital
Rm
Sharepremium
Rm
Retainedearnings
Rm
otherreserves
Rm
Generalcredit
riskreserve
Rm
Balance at the end of the previous reporting period 840 193 1 680 3 657 89 124 6 239 823Impact of adopting new accounting standards at
IFRS 16 — — — (243) — —
Adjusted balance at the beginning of the reporting period 840 193 1 680 3 657 88 881 6 239 823Total comprehensive income — — — 15 895 (965) —
— — — 16 003 — —Other comprehensive income — — — (108) (965) —
Dividends paid during the reporting period — — — (9 377) — —Transactions with non-controlling interest holders — — — — — —Distributions paid during the reporting period — — — — — —Issuance of Additional Tier 1 capital — — — — — —
share-based payment arrangements — — (400) (62) — —Elimination of the movement in Treasury shares held by Group entities 3 337 7 218 — — —Movement in share-based payment reserve — — 400 — 155 —
Transfer from share-based payment reserve — — 400 — (400) —Value of employee services — — — — 575 —Deferred tax — — — — (20) —
Movement in general credit risk reserve — — — (89) 89 89Movement in foreign insurance subsidiary regulatory reserve — — — (6) 6 —Share of post-tax results of associates and joint ventures — — — (221) 221 —
Balance at the end of the reporting period 843 530 1 687 3 875 95 021 5 745 912
3 Normalised Group performance59 Segment performance
123 Group IFRS performance
142 Risk management
160 Appendices
4 Overview8 Normalised salient features9 Normalised salient features by segment
1014 Basis of presentation15 Dividend announcement16
60 WIMI segment change61 Overview64 Per market segment66 Per geographical segment
68 RBB South Africa90 CIB
106 Absa Regional Operations122
Absa Group Limited Financial results for the reporting period ended 31 December 2019 21
124 IFRS salient features
125 Financials133138 Reconciliation140 Barclays separation
143 Risk management overview155 Capital management
161 Share performance162 Shareholder information and diary163 Glossary170 Abbreviations and acronyms172 Contact information
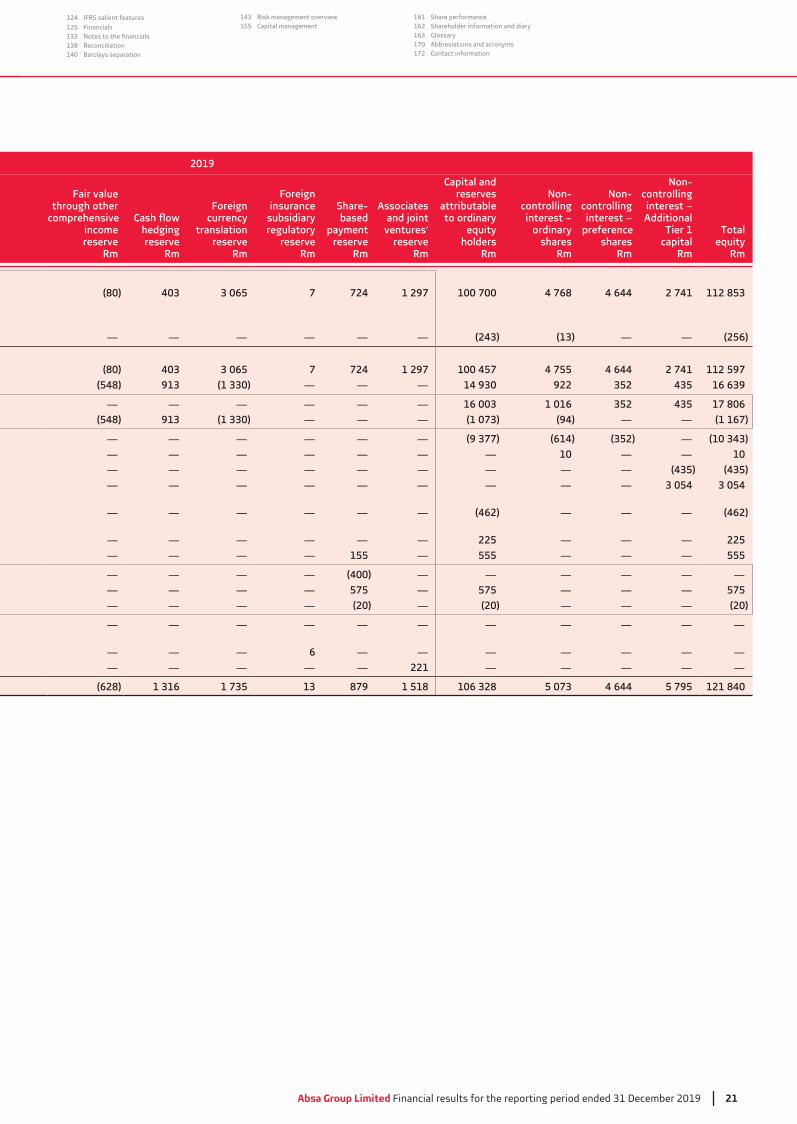
2019
Fair value through other
comprehensive income reserve
Rm
hedging reserve
Rm
Foreign currency
translation reserve
Rm
Foreign insurance
subsidiary regulatory
reserveRm
Share-based
payment reserve
Rm
Associates and joint
ventures’ reserve
Rm
Capital and reserves
attributable to ordinary
equityholders
Rm
Non-controlling interest – ordinary
sharesRm
Non-controlling interest –
preference shares
Rm
Non-controlling interest – Additional
capitalRm
equityRm
(80) 403 3 065 7 724 1 297 100 700 4 768 4 644 2 741 112 853
— — — — — — (243) (13) — — (256)
(80) 403 3 065 7 724 1 297 100 457 4 755 4 644 2 741 112 597(548) 913 (1 330) — — — 14 930 922 352 435 16 639
— — — — — — 16 003 1 016 352 435 17 806(548) 913 (1 330) — — — (1 073) (94) — — (1 167)
— — — — — — (9 377) (614) (352) — (10 343)— — — — — — — 10 — — 10— — — — — — — — — (435) (435)— — — — — — — — — 3 054 3 054
— — — — — — (462) — — — (462)
— — — — — — 225 — — — 225— — — — 155 — 555 — — — 555
— — — — (400) — — — — — —— — — — 575 — 575 — — — 575— — — — (20) — (20) — — — (20)
— — — — — — — — — — —
— — — 6 — — — — — — —— — — — — 221 — — — — —
(628) 1 316 1 735 13 879 1 518 106 328 5 073 4 644 5 795 121 840

22 Absa Group Limited Financial results for the reporting period ended 31 December 2019
Number of ordinary
shares’000
Sharecapital
Rm
Sharepremium
Rm
Retainedearnings
Rm
Totalother
reservesRm
Generalcredit
riskreserve
Rm
Balance at the end of the previous reporting period 845 554 1 691 87 982 4 240 779Impact of adopting new accounting standards at
IFRS 9 — — — (126) —IFRS 15 — — — (44) — —
Adjusted balance at the beginning of the reporting period 845 554 1 691 82 525 4 114 779Total comprehensive income — — — 15 924 1 884 —
— — — — —Other comprehensive income — — — 21 1 884 —
Dividends paid during the reporting period — — — — —Distributions paid during the reporting period — — — — — —Issuance of Additional Tier 1 capital — — — — — —
share-based payment arrangements — — (491) (68) — —Elimination of the movement in Treasury shares held by Group entities (11) (292) — — —Movement in share-based payment reserve — — 491 — 17 —
Transfer from share-based payment reserve — — 491 — (491) —Value of employee services — — — — —Deferred tax — — — — —
Movement in general credit risk reserve — — — (44) 44 44Movement in foreign insurance subsidiary regulatory reserve — — — (1) 1 —Share of post-tax results of associates and joint ventures — — — (179) 179 —
Balance at the end of the reporting period 1 680 89 124
Consolidated normalised statement of changes in equity
3 Normalised Group performance59 Segment performance
123 Group IFRS performance
142 Risk management
160 Appendices
4 Overview8 Normalised salient features9 Normalised salient features by segment
1014 Basis of presentation15 Dividend announcement16
60 WIMI segment change61 Overview64 Per market segment66 Per geographical segment
68 RBB South Africa90 CIB
106 Absa Regional Operations122
Absa Group Limited Financial results for the reporting period ended 31 December 2019 23
124 IFRS salient features
125 Financials133138 Reconciliation140 Barclays separation
143 Risk management overview155 Capital management
161 Share performance162 Shareholder information and diary163 Glossary170 Abbreviations and acronyms172 Contact information
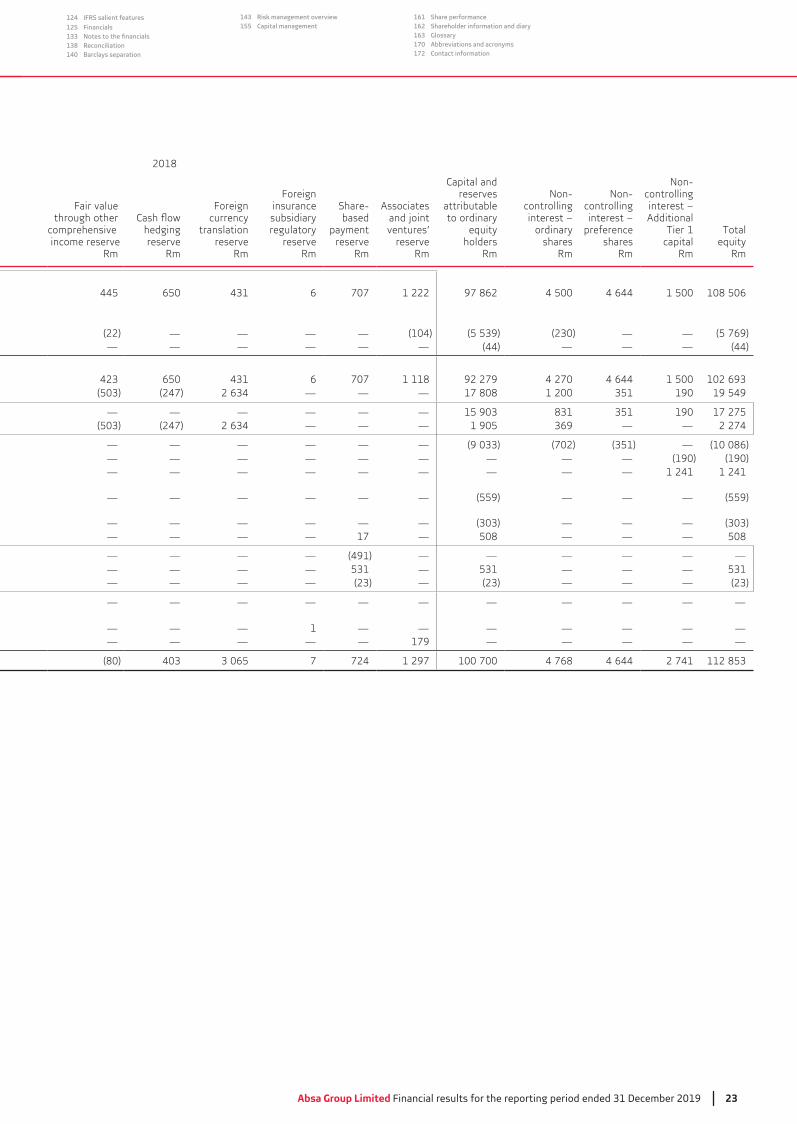
2018
Fair value through other
comprehensive income reserve
Rm
hedging reserve
Rm
Foreign currency
translation reserve
Rm
Foreign insurance subsidiary
regulatory reserve
Rm
Share-based
payment reserve
Rm
Associates and joint ventures’
reserveRm
Capital and reserves
attributable to ordinary
equityholders
Rm
Non-controlling interest – ordinary
sharesRm
Non-controlling interest –
preference shares
Rm
Non-controlling interest – Additional
Tier 1capital
Rm
Totalequity
Rm
445 650 6 707 1 222 97 862 4 500 4 644 1 500 108 506
(22) — — — — (104) — — (5 769)— — — — — — (44) — — — (44)
650 6 707 1 118 92 279 4 270 4 644 1 500(247) — — — 17 808 1 200 190 19 549
— — — — — — 190 17 275(247) — — — 1 905 — — 2 274
— — — — — — (702) — (10 086)— — — — — — — — — (190) (190)— — — — — — — — — 1 241 1 241
— — — — — — (559) — — — (559)
— — — — — — — — —— — — — 17 — 508 — — — 508
— — — — (491) — — — — — —— — — — — — — —— — — — — — — —
— — — — — — — — — — —
— — — 1 — — — — — — —— — — — — 179 — — — — —
(80) 7 724 1 297 100 700 4 768 4 644 2 741
24 Absa Group Limited Financial results for the reporting period ended 31 December 2019
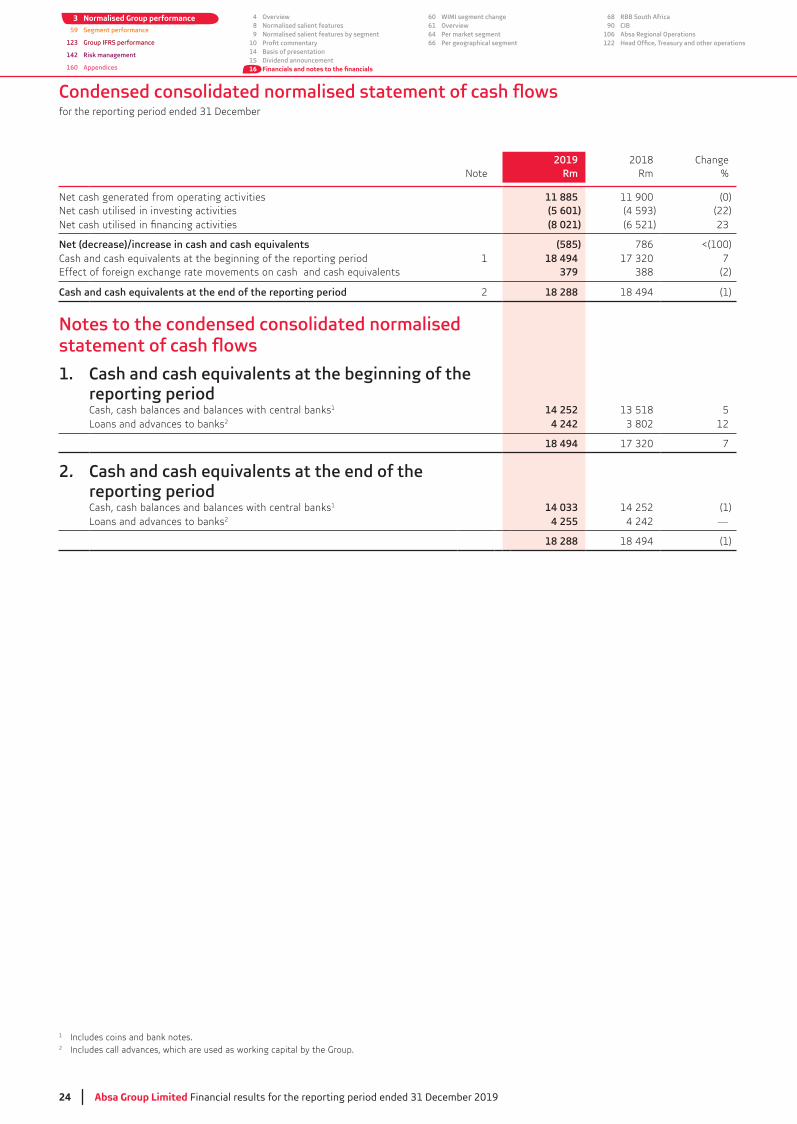
2019 2018 ChangeNote Rm Rm %
Net cash generated from operating activities 11 885 11 900 (0)Net cash utilised in investing activities (5 601) (22)
(8 021) (6 521)
Net (decrease)/increase in cash and cash equivalents (585) 786 <(100)Cash and cash equivalents at the beginning of the reporting period 1 18 494 7Effect of foreign exchange rate movements on cash and cash equivalents 379 (2)
Cash and cash equivalents at the end of the reporting period 2 18 288 18 494 (1)
Notes to the condensed consolidated normalised
1. Cash and cash equivalents at the beginning of the reporting periodCash, cash balances and balances with central banks1 14 252 5Loans and advances to banks2 4 242 12
18 494 7
2. Cash and cash equivalents at the end of the reporting periodCash, cash balances and balances with central banks1 14 033 14 252 (1)Loans and advances to banks2 4 255 4 242 —
18 288 18 494 (1)
1 Includes coins and bank notes.2 Includes call advances, which are used as working capital by the Group.
3 Normalised Group performance59 Segment performance
123 Group IFRS performance
142 Risk management
160 Appendices
4 Overview8 Normalised salient features9 Normalised salient features by segment
1014 Basis of presentation15 Dividend announcement16
60 WIMI segment change61 Overview64 Per market segment66 Per geographical segment
68 RBB South Africa90 CIB
106 Absa Regional Operations122
Performance indicators and condensed normalised notes to the consolidated
for the reporting period ended 31 December
Absa Group Limited Financial results for the reporting period ended 31 December 2019 25
124 IFRS salient features
125 Financials133138 Reconciliation140 Barclays separation
143 Risk management overview155 Capital management
161 Share performance162 Shareholder information and diary163 Glossary170 Abbreviations and acronyms172 Contact information
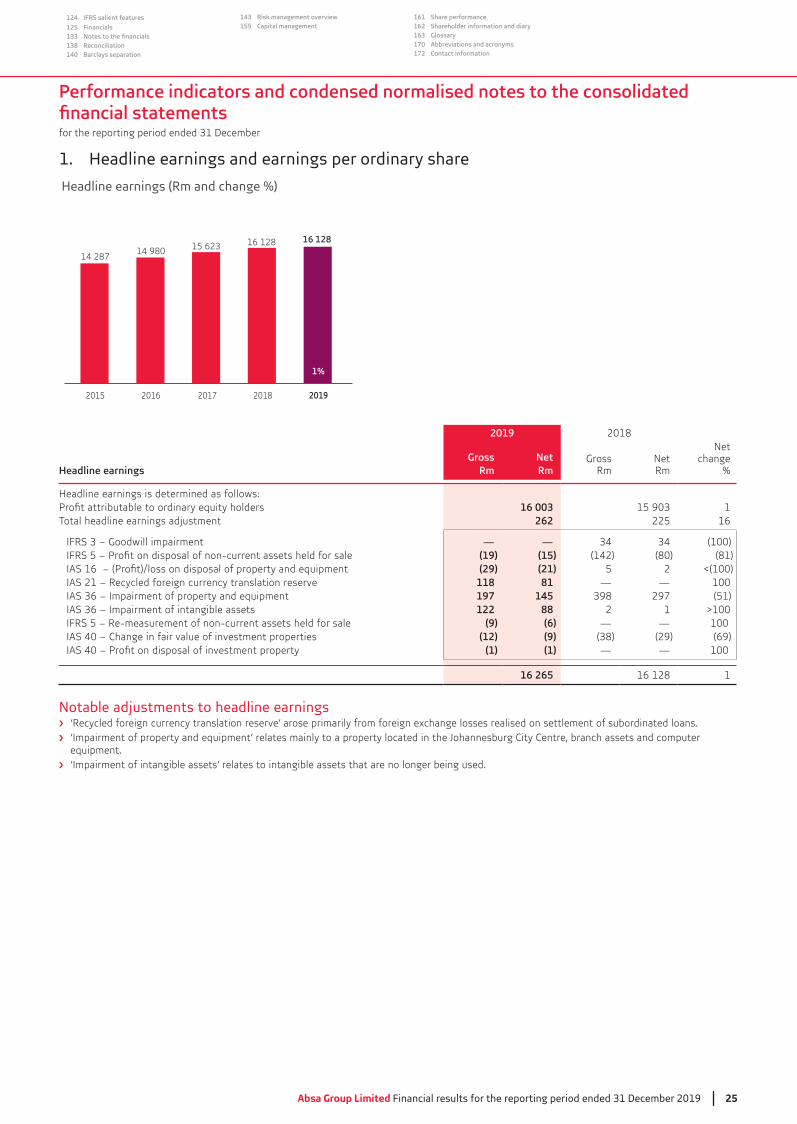
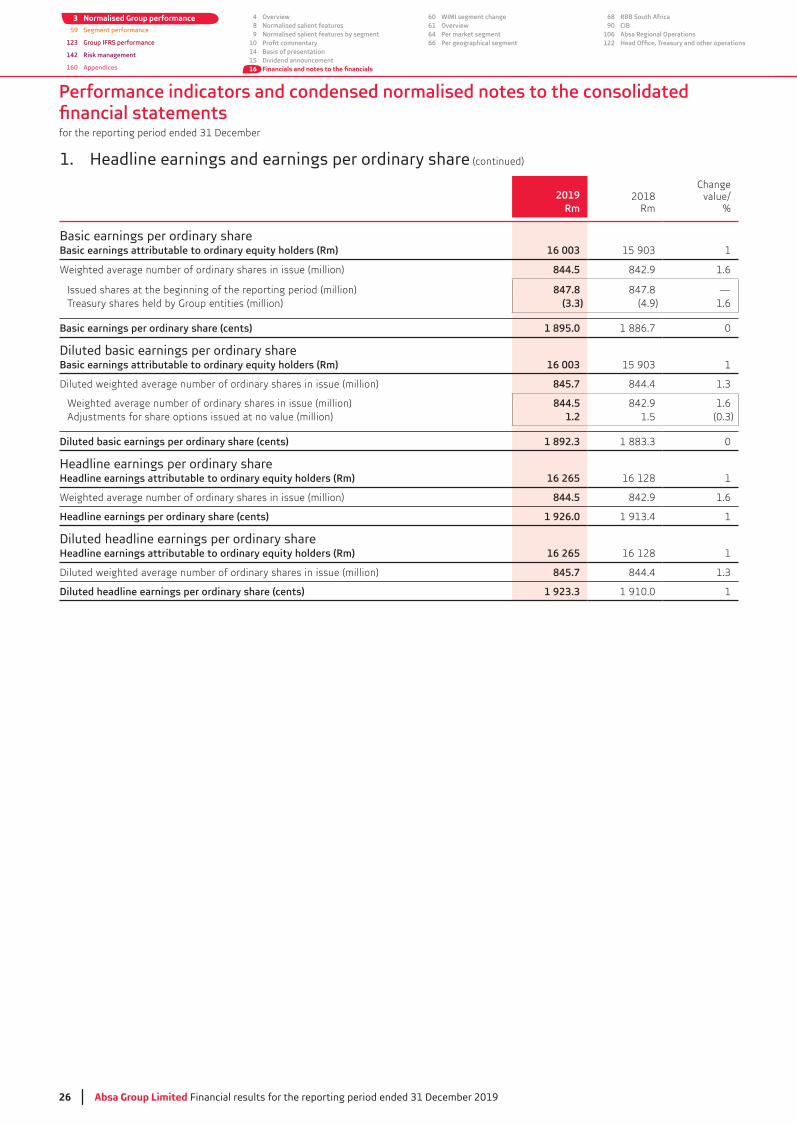
1. Headline earnings and earnings per ordinary share
14 28714 980 15 623
16 128
2018 201920172015 2016
1%
16 128
Headline earnings (Rm and change %)
2019 2018
Headline earningsGross
RmNetRm
GrossRm
NetRm
Net change
%
Headline earnings is determined as follows:16 003 1
Total headline earnings adjustment 262 225 16
— — (100)(19) (15) (142) (80) (81)(29) (21) 5 2 <(100)
IAS 21 – Recycled foreign currency translation reserve 118 81 — — 100197 145 297 (51)122 88 2 1 >100
IFRS 5 – Re-measurement of non-current assets held for sale (9) (6) — — 100IAS 40 – Change in fair value of investment properties (12) (9) (29) (69)
(1) (1) — — 100
16 265 16 128 1
Notable adjustments to headline earnings ‘Recycled foreign currency translation reserve’ arose primarily from foreign exchange losses realised on settlement of subordinated loans.
equipment. ‘Impairment of intangible assets’ relates to intangible assets that are no longer being used.
Performance indicators and condensed normalised notes to the consolidated
for the reporting period ended 31 December
26 Absa Group Limited Financial results for the reporting period ended 31 December 2019
3 Normalised Group performance59 Segment performance
123 Group IFRS performance
142 Risk management
160 Appendices
4 Overview8 Normalised salient features9 Normalised salient features by segment
1014 Basis of presentation15 Dividend announcement16
60 WIMI segment change61 Overview64 Per market segment66 Per geographical segment
68 RBB South Africa90 CIB
106 Absa Regional Operations122
1. Headline earnings and earnings per ordinary share (continued)
2019Rm
2018Rm
Changevalue/
%
Basic earnings per ordinary shareBasic earnings attributable to ordinary equity holders (Rm) 16 003 1
Weighted average number of ordinary shares in issue (million) 844.5 842.9 1.6
Issued shares at the beginning of the reporting period (million) 847.8 847.8 —Treasury shares held by Group entities (million) (3.3) (4.9) 1.6
Basic earnings per ordinary share (cents) 1 895.0 1 886.7 0
Diluted basic earnings per ordinary shareBasic earnings attributable to ordinary equity holders (Rm) 16 003 1
Diluted weighted average number of ordinary shares in issue (million) 845.7 844.4
Weighted average number of ordinary shares in issue (million) 844.5 842.9 1.6Adjustments for share options issued at no value (million) 1.2 1.5
Diluted basic earnings per ordinary share (cents) 1 892.3 0
Headline earnings per ordinary shareHeadline earnings attributable to ordinary equity holders (Rm) 16 265 16 128 1
Weighted average number of ordinary shares in issue (million) 844.5 842.9 1.6
Headline earnings per ordinary share (cents) 1 926.0 1
Diluted headline earnings per ordinary shareHeadline earnings attributable to ordinary equity holders (Rm) 16 265 16 128 1
Diluted weighted average number of ordinary shares in issue (million) 845.7 844.4
Diluted headline earnings per ordinary share (cents) 1 923.3 1 910.0 1
Performance indicators and condensed normalised notes to the consolidated
for the reporting period ended 31 December
Absa Group Limited Financial results for the reporting period ended 31 December 2019 27
124 IFRS salient features
125 Financials133138 Reconciliation140 Barclays separation
143 Risk management overview155 Capital management
161 Share performance162 Shareholder information and diary163 Glossary170 Abbreviations and acronyms172 Contact information
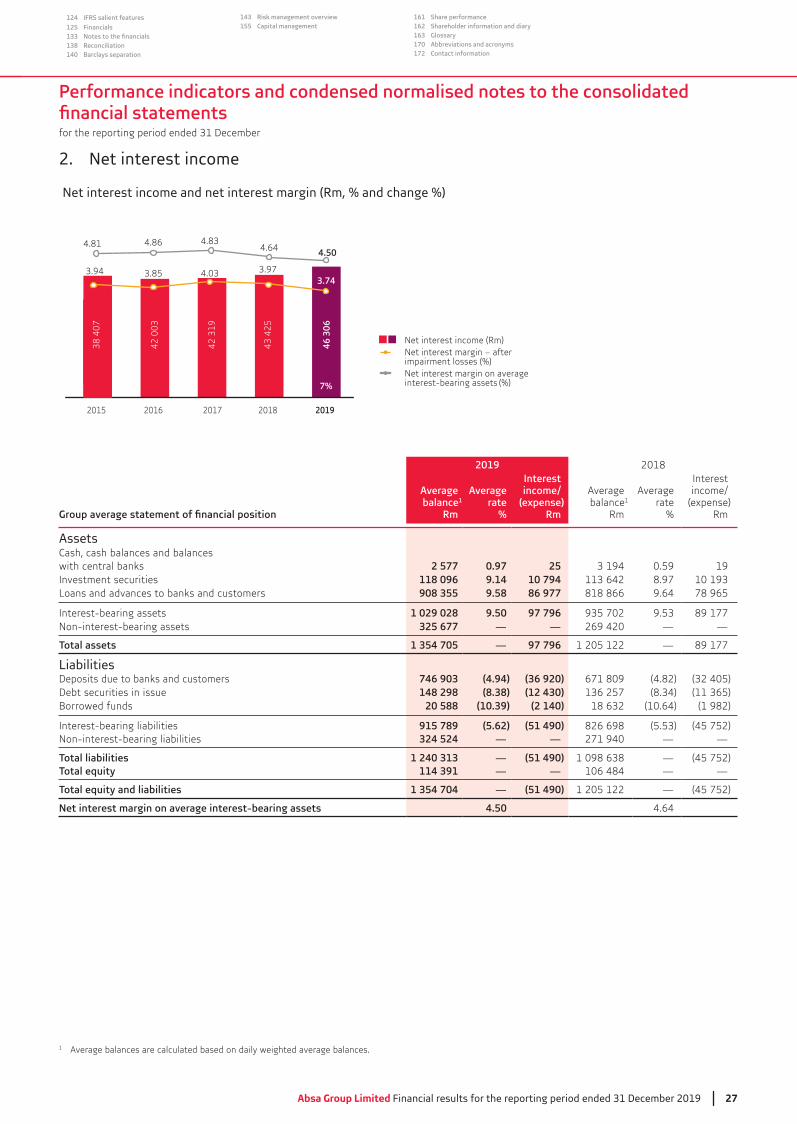
2. Net interest income
Net interest income and net interest margin (Rm, % and change %)
2018 201920172015 2016
7%
35 6
0135
601
35 6
0135
601
38 4
07
42 0
03
42 3
19
43 4
25
46 3
06
4.81
3.94
4.86
3.85
4.83
4.03
4.64
3.97
Net interest income (Rm)Net interest margin – after impairment losses (%)Net interest margin on average interest-bearing assets (%)
4.50
3.74
2019 2018
Average balance1
Rm
Averagerate
%
Interestincome/
Rm
Average balance1
Rm
Averagerate
%
Interestincome/
(expense)Rm
AssetsCash, cash balances and balances with central banks 2 577 0.97 25 0.59 19Investment securities 118 096 9.14 10 794 8.97Loans and advances to banks and customers 908 355 9.58 86 977 818 866 9.64 78 965
Interest-bearing assets 1 029 028 9.50 97 796 89 177Non-interest-bearing assets 325 677 — — 269 420 — —
1 354 705 — 97 796 1 205 122 — 89 177
LiabilitiesDeposits due to banks and customers 746 903 (4.94) (36 920) 671 809 (4.82)Debt securities in issue 148 298 (8.38) (12 430)Borrowed funds 20 588 (10.39) (2 140) (10.64) (1 982)
Interest-bearing liabilities 915 789 (5.62) (51 490) 826 698 (45 752)Non-interest-bearing liabilities 324 524 — — 271 940 — —
1 240 313 — (51 490) — (45 752)114 391 — — 106 484 — —
1 354 704 — (51 490) 1 205 122 — (45 752)
Net interest margin on average interest-bearing assets 4.50 4.64
1 Average balances are calculated based on daily weighted average balances.
Performance indicators and condensed normalised notes to the consolidated
for the reporting period ended 31 December
28 Absa Group Limited Financial results for the reporting period ended 31 December 2019
3 Normalised Group performance59 Segment performance
123 Group IFRS performance
142 Risk management
160 Appendices
4 Overview8 Normalised salient features9 Normalised salient features by segment
1014 Basis of presentation15 Dividend announcement16
60 WIMI segment change61 Overview64 Per market segment66 Per geographical segment
68 RBB South Africa90 CIB
106 Absa Regional Operations122
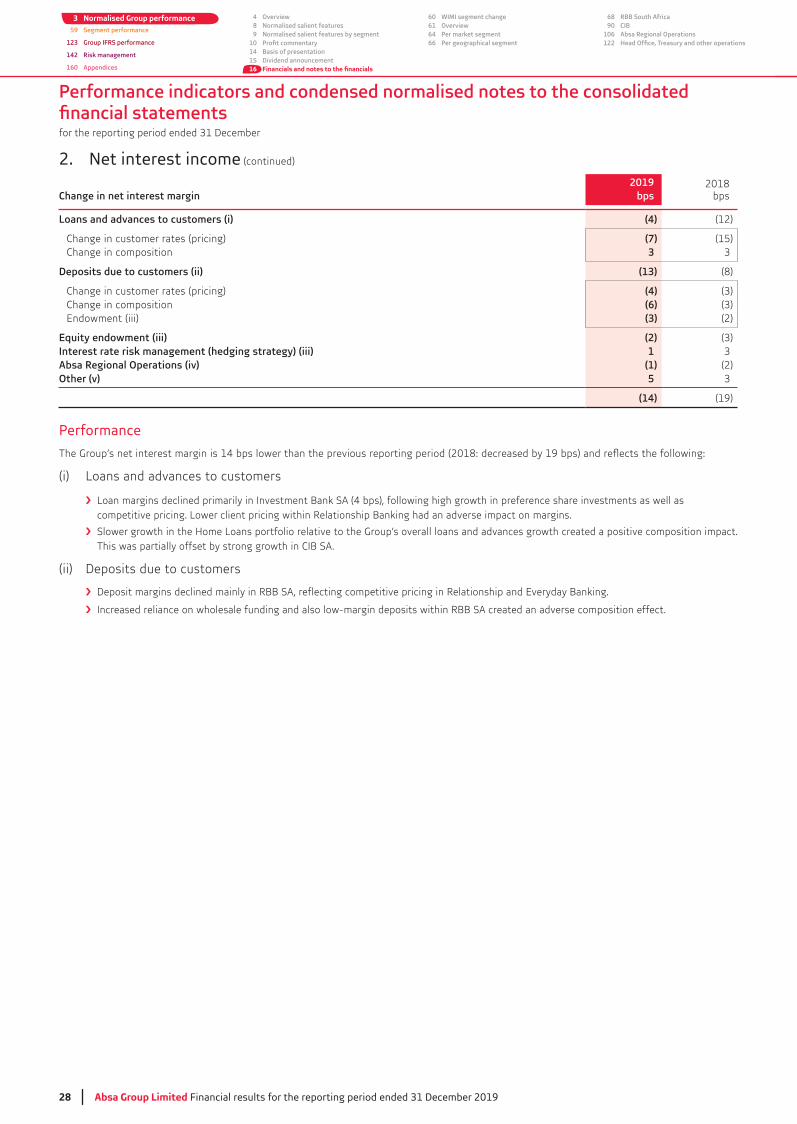
2. Net interest income (continued)
Change in net interest margin2019
bps2018
bps
Loans and advances to customers (i) (4) (12)
Change in customer rates (pricing) (7) (15)Change in composition 3
Deposits due to customers (ii) (13) (8)
Change in customer rates (pricing) (4)Change in composition (6)Endowment (iii) (3) (2)
Equity endowment (iii) (2)Interest rate risk management (hedging strategy) (iii) 1Absa Regional Operations (iv) (1) (2)Other (v) 5
(14) (19)
Performance
(i) Loans and advances to customers
Loan margins declined primarily in Investment Bank SA (4 bps), following high growth in preference share investments as well as competitive pricing. Lower client pricing within Relationship Banking had an adverse impact on margins.
Slower growth in the Home Loans portfolio relative to the Group’s overall loans and advances growth created a positive composition impact. This was partially offset by strong growth in CIB SA.
(ii) Deposits due to customers
Deposit margins declined mainly in RBB SA, reflecting competitive pricing in Relationship and Everyday Banking.
Increased reliance on wholesale funding and also low-margin deposits within RBB SA created an adverse composition effect.

Performance indicators and condensed normalised notes to the consolidated
for the reporting period ended 31 December
Absa Group Limited Financial results for the reporting period ended 31 December 2019 29
124 IFRS salient features
125 Financials133138 Reconciliation140 Barclays separation
143 Risk management overview155 Capital management
161 Share performance162 Shareholder information and diary163 Glossary170 Abbreviations and acronyms172 Contact information
2. Net interest income (continued)
Performance (continued)
(iii) Hedging strategy and equity endowment
15
13
11
9
7
5
3.5
3.0
2.5
2.0
1.5
1.0
Rat
e
Spre
ad
Hedging impact on net interest margin (%)
Prime rate (Left-hand side)
Cost of fundng rate (Left-hand side)
Spread before hedging (Right-hand side)
Spread after hedging (Right-hand side)Ju
n 20
15
Dec
201
4
Jun
2017
Dec
201
5
Jun
2016
Dec
201
6
Dec
201
7
Jun
2018
Dec
201
9
Dec
201
8
Jun
2019
Absa Bank Limited employs a governed interest rate strategy (hedging programme) through the interest rate cycle to reduce margin volatility associated with structural balances (i.e. rate-insensitive liabilities as well as the endowment associated with equity).
13%
Cash flow hedge accounting is applied to account for the interest rate swaps executed as part of the hedging programme. The after-tax ‘cash flow hedging reserve’ relating to the hedging programme reflected a credit balance of R1.1bnthe current reporting period of 6 bps was in line with the previous reporting period, releasing R595mstatement of comprehensive income.
Endowment on equity and liabilities after hedging had a 4 bps negative contribution, reflecting the mix impact of slower growth in endowment balances relative to the Group’s overall interest-bearing assets.
(iv) Absa Regional Operations
Absa Regional Operations had a negative 1 bps from the negative pricing impact of lower benchmark interest rates in a number of markets and also competitive pricing on foreign currency assets and liabilities. This was partially offset by a positive mix impact of the balance sheet growing faster than the Group’s overall interest-bearing assets.
(v) Other
Other items had a cumulative 5 bps positive impact, mainly representing:
LCR position relative to the Group’s overall interest-bearing assets, which had a positive composition impact (+5 bps).
1 Absa Bank Limited hedging strategy: The hedging programme provides greater margin stability from an interest rate risk perspective over the entire cycle. In a decreasing rate scenario, the hedging programme enhances the net interest margin while the opposite is true for an increasing rate scenario.
Performance indicators and condensed normalised notes to the consolidated
for the reporting period ended 31 December
30 Absa Group Limited Financial results for the reporting period ended 31 December 2019
3 Normalised Group performance59 Segment performance
123 Group IFRS performance
142 Risk management
160 Appendices
4 Overview8 Normalised salient features9 Normalised salient features by segment
1014 Basis of presentation15 Dividend announcement16
60 WIMI segment change61 Overview64 Per market segment66 Per geographical segment
68 RBB South Africa90 CIB
106 Absa Regional Operations122
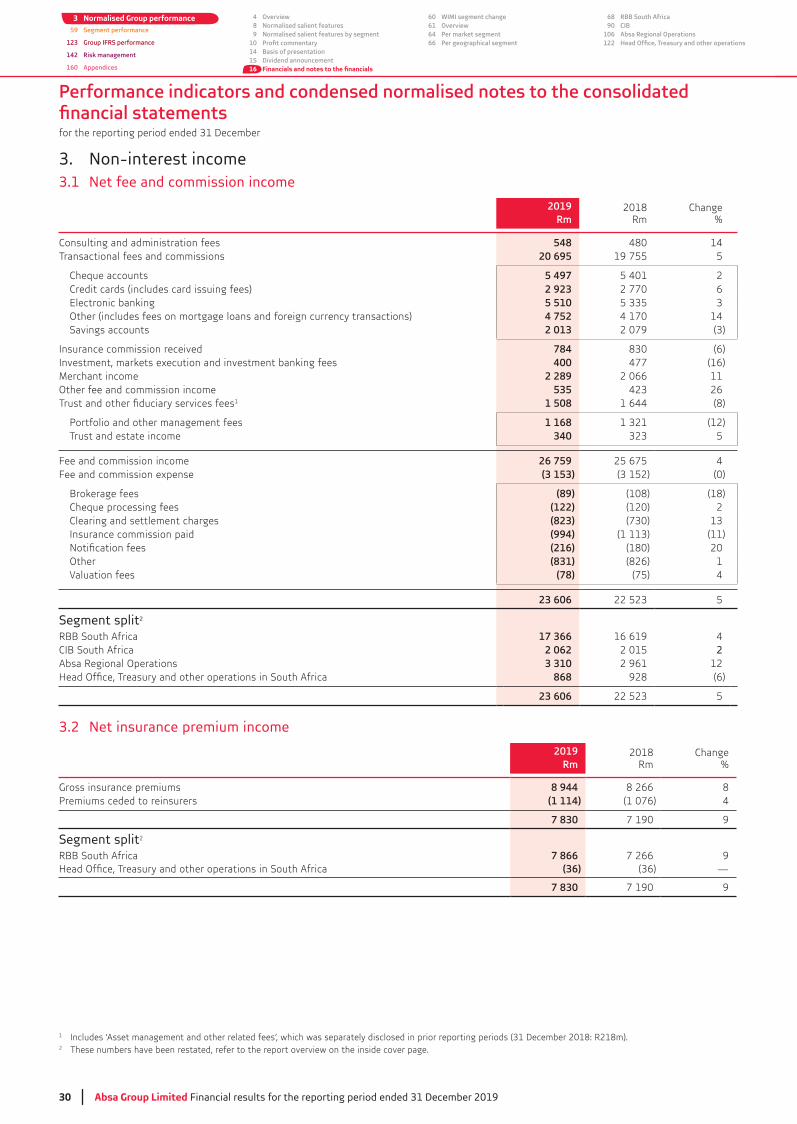
3. Non-interest income3.1 Net fee and commission income
2019Rm
2018Rm
Change%
Consulting and administration fees 548 480 14Transactional fees and commissions 20 695 19 755 5
Cheque accounts 5 497 5 401 2 Credit cards (includes card issuing fees) 2 923 2 770 6 Electronic banking 5 510 Other (includes fees on mortgage loans and foreign currency transactions) 4 752 4 170 14 Savings accounts 2 013 2 079
Insurance commission received 784 (6)Investment, markets execution and investment banking fees 400 477 (16)Merchant income 2 289 2 066 11Other fee and commission income 535 26
1 1 508 1 644 (8)
1 168 (12) Trust and estate income 340 5
Fee and commission income 26 759 25 675 4Fee and commission expense (3 153) (0)
Brokerage fees (89) (108) (18) Cheque processing fees (122) (120) 2 Clearing and settlement charges (823) Insurance commission paid (994) (11)
(216) (180) 20 Other (831) (826) 1 Valuation fees (78) (75) 4
23 606 5
Segment split2
RBB South Africa 17 366 16 619 4CIB South Africa 2 062 2 015 2Absa Regional Operations 3 310 2 961 12
868 928 (6)
23 606 5
3.2 Net insurance premium income
2019Rm
2018Rm
Change%
Gross insurance premiums 8 944 8 266 8(1 114) (1 076) 4
7 830 7 190 9
Segment split2
RBB South Africa 7 866 7 266 9(36) —
7 830 7 190 9
1
2 These numbers have been restated, refer to the report overview on the inside cover page.
Performance indicators and condensed normalised notes to the consolidated
for the reporting period ended 31 December
Absa Group Limited Financial results for the reporting period ended 31 December 2019 31
124 IFRS salient features
125 Financials133138 Reconciliation140 Barclays separation
143 Risk management overview155 Capital management
161 Share performance162 Shareholder information and diary163 Glossary170 Abbreviations and acronyms172 Contact information
3. Non-interest income (continued)
3.3 2019
Rm2018
RmChange
%
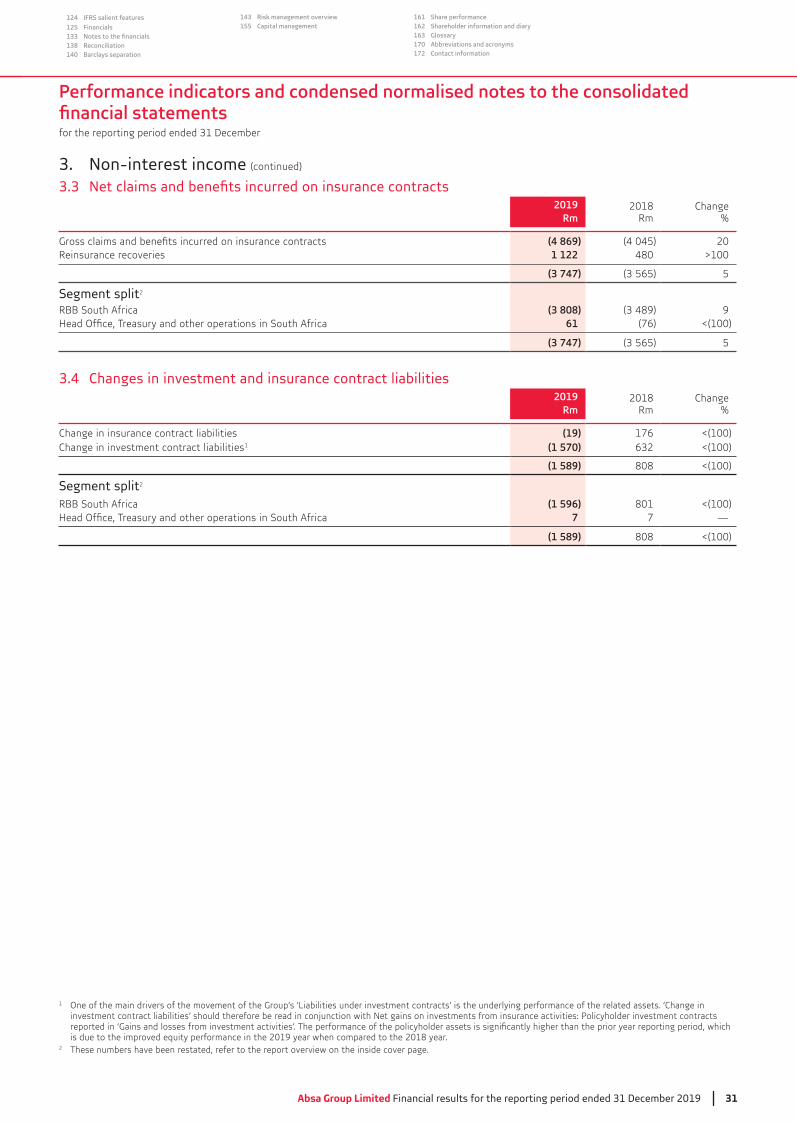
(4 869) (4 045) 20Reinsurance recoveries 1 122 480 >100
(3 747) 5
Segment split2
RBB South Africa (3 808) 961 (76) <(100)
(3 747) 5
3.4 Changes in investment and insurance contract liabilities2019
Rm2018
RmChange
%
Change in insurance contract liabilities (19) 176 <(100)Change in investment contract liabilities1 (1 570) <(100)
(1 589) 808 <(100)
Segment split2
RBB South Africa (1 596) 801 <(100)7 7 —
(1 589) 808 <(100)
1 One of the main drivers of the movement of the Group’s ‘Liabilities under investment contracts’ is the underlying performance of the related assets. ‘Change in
is due to the improved equity performance in the 2019 year when compared to the 2018 year.2 These numbers have been restated, refer to the report overview on the inside cover page.
Performance indicators and condensed normalised notes to the consolidated
for the reporting period ended 31 December
32 Absa Group Limited Financial results for the reporting period ended 31 December 2019
3 Normalised Group performance59 Segment performance
123 Group IFRS performance
142 Risk management
160 Appendices
4 Overview8 Normalised salient features9 Normalised salient features by segment
1014 Basis of presentation15 Dividend announcement16
60 WIMI segment change61 Overview64 Per market segment66 Per geographical segment
68 RBB South Africa90 CIB
106 Absa Regional Operations122
3. Non-interest income (continued)
3.5 Gains and losses from banking and trading activities
2019Rm
2018Rm
Change%
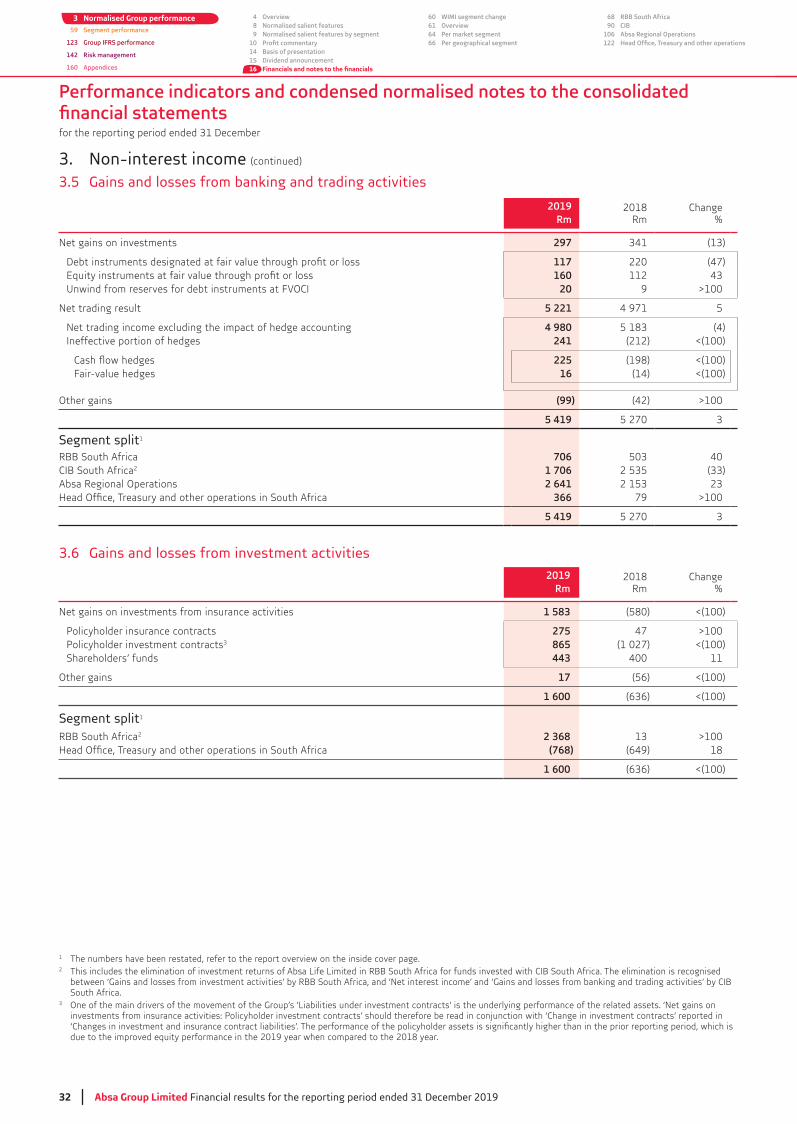
Net gains on investments 297
117 220 (47)160 112
Unwind from reserves for debt instruments at FVOCI 20 9 >100
Net trading result 5 221 4 971 5
Net trading income excluding the impact of hedge accounting 4 980 (4)Ineffective portion of hedges 241 (212) <(100)
225 (198) <(100)Fair-value hedges 16 (14) <(100)
Other gains (99) (42) >100
5 419 5 270
Segment split1
RBB South Africa 706 40CIB South Africa2 1 706Absa Regional Operations 2 641
366 79 >100
5 419 5 270
3.6 Gains and losses from investment activities
2019Rm
2018Rm
Change%
Net gains on investments from insurance activities 1 583 (580) <(100)
275 47 >100 865 (1 027) <(100)
Shareholders’ funds 443 400 11
Other gains 17 (56) <(100)
1 600 <(100)
Segment split1
RBB South Africa2 2 368 >100 (768) (649) 18
1 600 <(100)
1 The numbers have been restated, refer to the report overview on the inside cover page.2 This includes the elimination of investment returns of Absa Life Limited in RBB South Africa for funds invested with CIB South Africa. The elimination is recognised
between ‘Gains and losses from investment activities’ by RBB South Africa, and ‘Net interest income’ and ‘Gains and losses from banking and trading activities’ by CIB South Africa.
One of the main drivers of the movement of the Group’s ‘Liabilities under investment contracts’ is the underlying performance of the related assets. ‘Net gains on
due to the improved equity performance in the 2019 year when compared to the 2018 year.
Performance indicators and condensed normalised notes to the consolidated
for the reporting period ended 31 December
Absa Group Limited Financial results for the reporting period ended 31 December 2019 33
124 IFRS salient features
125 Financials133138 Reconciliation140 Barclays separation
143 Risk management overview155 Capital management
161 Share performance162 Shareholder information and diary163 Glossary170 Abbreviations and acronyms172 Contact information
3. Non-interest income (continued)
3.7 Other operating income
2019Rm
2018Rm
Change%
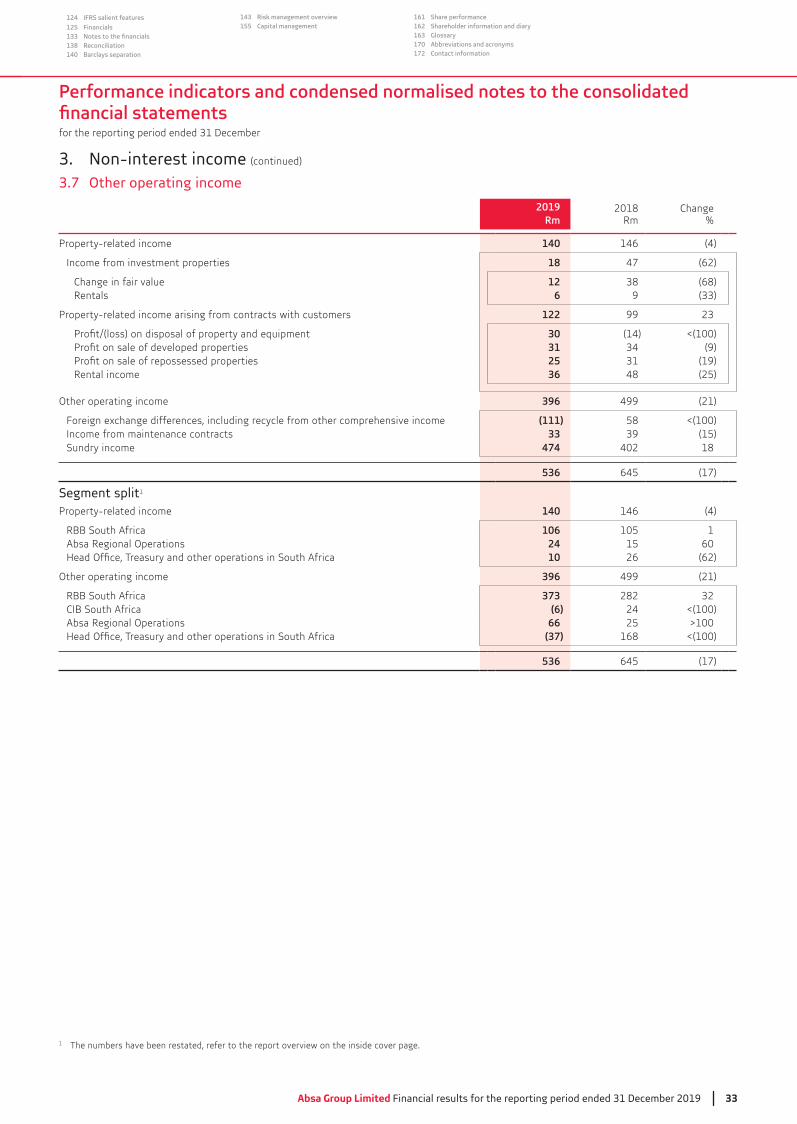
140 146 (4)
Income from investment properties 18 47 (62)
Change in fair value 12 (68)Rentals 6 9
122 99
30 (14) <(100)31 (9)25 (19)
Rental income 36 48 (25)
Other operating income 396 499 (21)
Foreign exchange differences, including recycle from other comprehensive income (111) 58 <(100)Income from maintenance contracts 33 (15)Sundry income 474 402 18
536 645 (17)
Segment split1
140 146 (4)
RBB South Africa 106 105 1Absa Regional Operations 24 15 60
10 26 (62)
Other operating income 396 499 (21)
RBB South Africa 373 282CIB South Africa (6) 24 <(100)Absa Regional Operations 66 25 >100
(37) 168 <(100)
536 645 (17)
1 The numbers have been restated, refer to the report overview on the inside cover page.
Performance indicators and condensed normalised notes to the consolidated
for the reporting period ended 31 December
34 Absa Group Limited Financial results for the reporting period ended 31 December 2019
3 Normalised Group performance59 Segment performance
123 Group IFRS performance
142 Risk management
160 Appendices
4 Overview8 Normalised salient features9 Normalised salient features by segment
1014 Basis of presentation15 Dividend announcement16
60 WIMI segment change61 Overview64 Per market segment66 Per geographical segment
68 RBB South Africa90 CIB
106 Absa Regional Operations122
4. Impairment losses
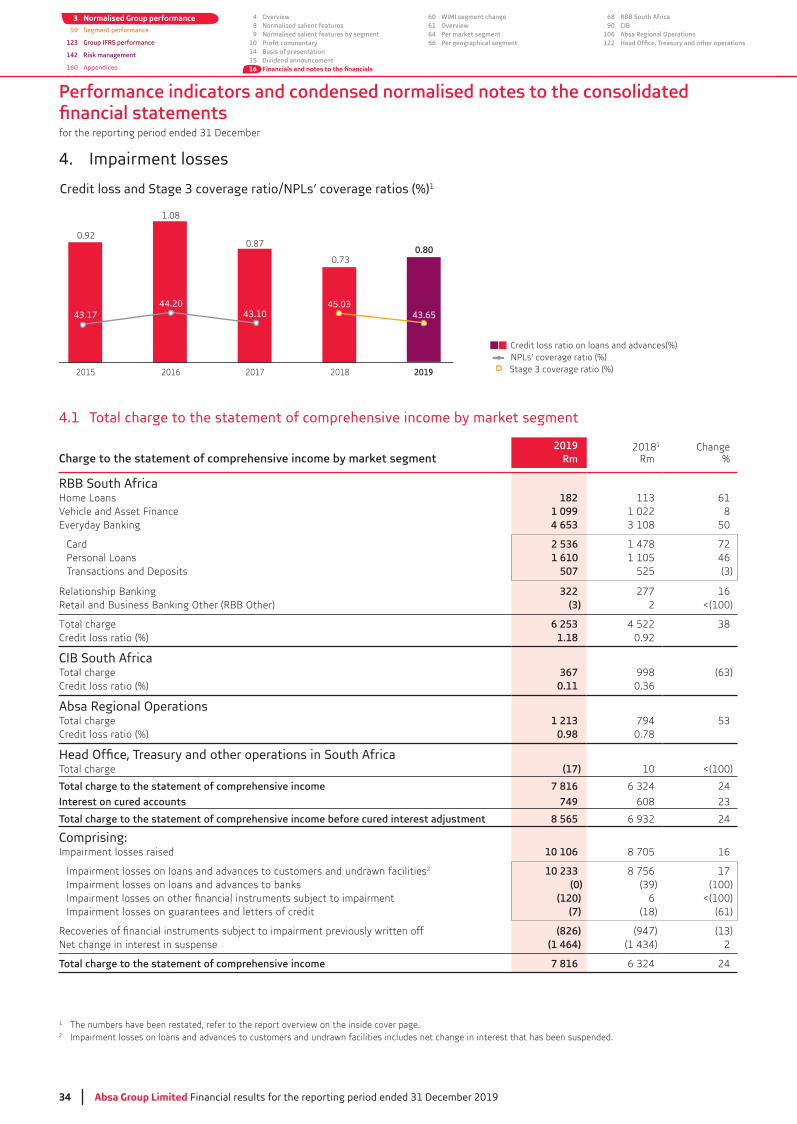
Credit loss ratio on loans and advances(%) NPLs’ coverage ratio (%) Stage 3 coverage ratio (%)2015 2016 2017 20192018
Credit loss and Stage 3 coverage ratio/NPLs’ coverage ratios (%)1
43.1744.20
43.1045.03
0.92
1.08
0.87
0.730.80
43.65
4.1 Total charge to the statement of comprehensive income by market segment
Charge to the statement of comprehensive income by market segment2019
Rm20181
RmChange
%
RBB South AfricaHome Loans 182 61Vehicle and Asset Finance 1 099 1 022 8Everyday Banking 4 653 50
Card 2 536 1 478 721 610 1 105 46
Transactions and Deposits 507 525
Relationship Banking 322 277 16Retail and Business Banking Other (RBB Other) (3) 2 <(100)
Total charge 6 253 4 522Credit loss ratio (%) 1.18 0.92
CIB South AfricaTotal charge 367 998Credit loss ratio (%) 0.11
Absa Regional OperationsTotal charge 1 213 794Credit loss ratio (%) 0.98 0.78
Total charge (17) 10 <(100)
7 816 24
Interest on cured accounts 749 608
8 565 24
Impairment losses raised 10 106 8 705 16
Impairment losses on loans and advances to customers and undrawn facilities2 10 233 8 756 17Impairment losses on loans and advances to banks (0) (100)
(120) 6 <(100)Impairment losses on guarantees and letters of credit (7) (18) (61)
(826) (947)Net change in interest in suspense (1 464) 2
7 816 24
1 The numbers have been restated, refer to the report overview on the inside cover page.2 Impairment losses on loans and advances to customers and undrawn facilities includes net change in interest that has been suspended.

Absa Group Limited Financial results for the reporting period ended 31 December 2019 35
124 IFRS salient features
125 Financials133138 Reconciliation140 Barclays separation
143 Risk management overview155 Capital management
161 Share performance162 Shareholder information and diary163 Glossary170 Abbreviations and acronyms172 Contact information
This page has been left blank intentionally
Performance indicators and condensed normalised notes to the consolidated
for the reporting period ended 31 December
36 Absa Group Limited Financial results for the reporting period ended 31 December 2019
3 Normalised Group performance59 Segment performance
123 Group IFRS performance
142 Risk management
160 Appendices
4 Overview8 Normalised salient features9 Normalised salient features by segment
1014 Basis of presentation15 Dividend announcement16
60 WIMI segment change61 Overview64 Per market segment66 Per geographical segment
68 RBB South Africa90 CIB
106 Absa Regional Operations122
4. Impairment losses (continued)
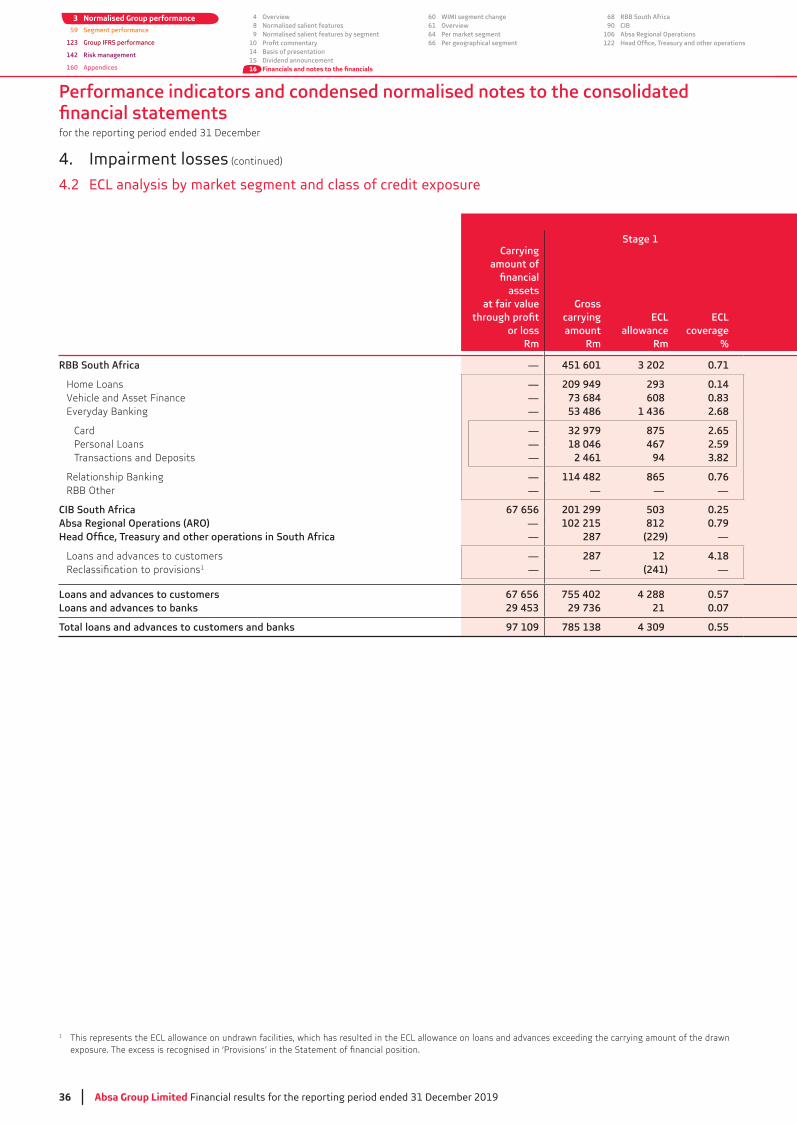
4.2 ECL analysis by market segment and class of credit exposure
Stage 1Carrying
amount of
assets at fair value
or lossRm
Gross carryingamount
Rm
ECLallowance
Rm
ECL coverage
%
RBB South Africa — 451 601 3 202 0.71
Home Loans — 209 949 293 0.14Vehicle and Asset Finance — 73 684 608 0.83Everyday Banking — 53 486 1 436 2.68
Card — 32 979 875 2.65— 18 046 467 2.59
Transactions and Deposits — 2 461 94 3.82
Relationship Banking — 114 482 865 0.76RBB Other — — — —
CIB South Africa 67 656 201 299 503 0.25Absa Regional Operations (ARO) — 102 215 812 0.79
— 287 (229) —
Loans and advances to customers — 287 12 4.181 — — (241) —
Loans and advances to customers 67 656 755 402 4 288 0.57Loans and advances to banks 29 453 29 736 21 0.07
97 109 785 138 4 309 0.55
1 This represents the ECL allowance on undrawn facilities, which has resulted in the ECL allowance on loans and advances exceeding the carrying amount of the drawn
Absa Group Limited Financial results for the reporting period ended 31 December 2019 37
124 IFRS salient features
125 Financials133138 Reconciliation140 Barclays separation
143 Risk management overview155 Capital management
161 Share performance162 Shareholder information and diary163 Glossary170 Abbreviations and acronyms172 Contact information
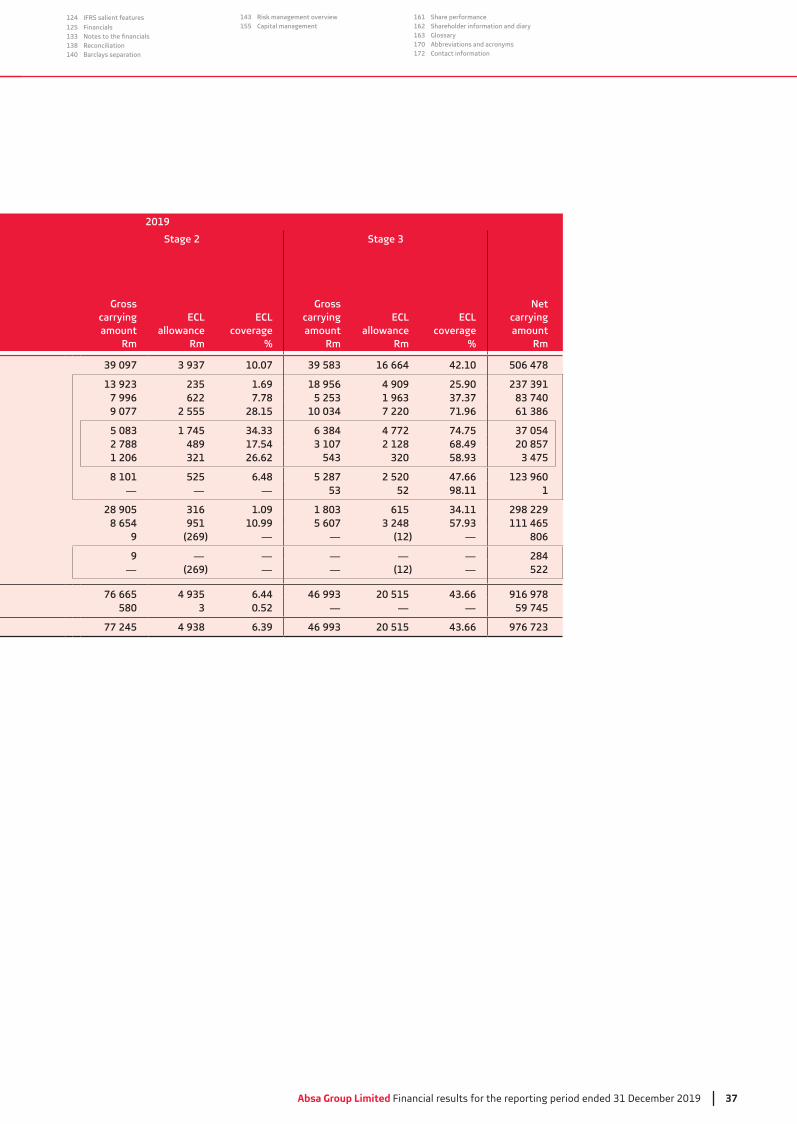
2019
Stage 2 Stage 3
Gross carrying amount
Rm
ECLallowance
Rm
ECL coverage
%
Gross carrying amount
Rm
ECLallowance
Rm
ECL coverage
%
Netcarrying amount
Rm
39 097 3 937 10.07 39 583 16 664 42.10 506 478
13 923 235 1.69 18 956 4 909 25.90 237 391 7 996 622 7.78 5 253 1 963 37.37 83 740 9 077 2 555 28.15 10 034 7 220 71.96 61 386
5 083 1 745 34.33 6 384 4 772 74.75 37 054 2 788 489 17.54 3 107 2 128 68.49 20 857 1 206 321 26.62 543 320 58.93 3 475
8 101 525 6.48 5 287 2 520 47.66 123 960— — — 53 52 98.11 1
28 905 316 1.09 1 803 615 34.11 298 2298 654 951 10.99 5 607 3 248 57.93 111 465
9 (269) — — (12) — 806
9 — — — — — 284— (269) — — (12) — 522
76 665 4 935 6.44 46 993 20 515 43.66 916 978 580 3 0.52 — — — 59 745
77 245 4 938 6.39 46 993 20 515 43.66 976 723
Performance indicators and condensed normalised notes to the consolidated
for the reporting period ended 31 December
38 Absa Group Limited Financial results for the reporting period ended 31 December 2019
3 Normalised Group performance59 Segment performance
123 Group IFRS performance
142 Risk management
160 Appendices
4 Overview8 Normalised salient features9 Normalised salient features by segment
1014 Basis of presentation15 Dividend announcement16
60 WIMI segment change61 Overview64 Per market segment66 Per geographical segment
68 RBB South Africa90 CIB
106 Absa Regional Operations122
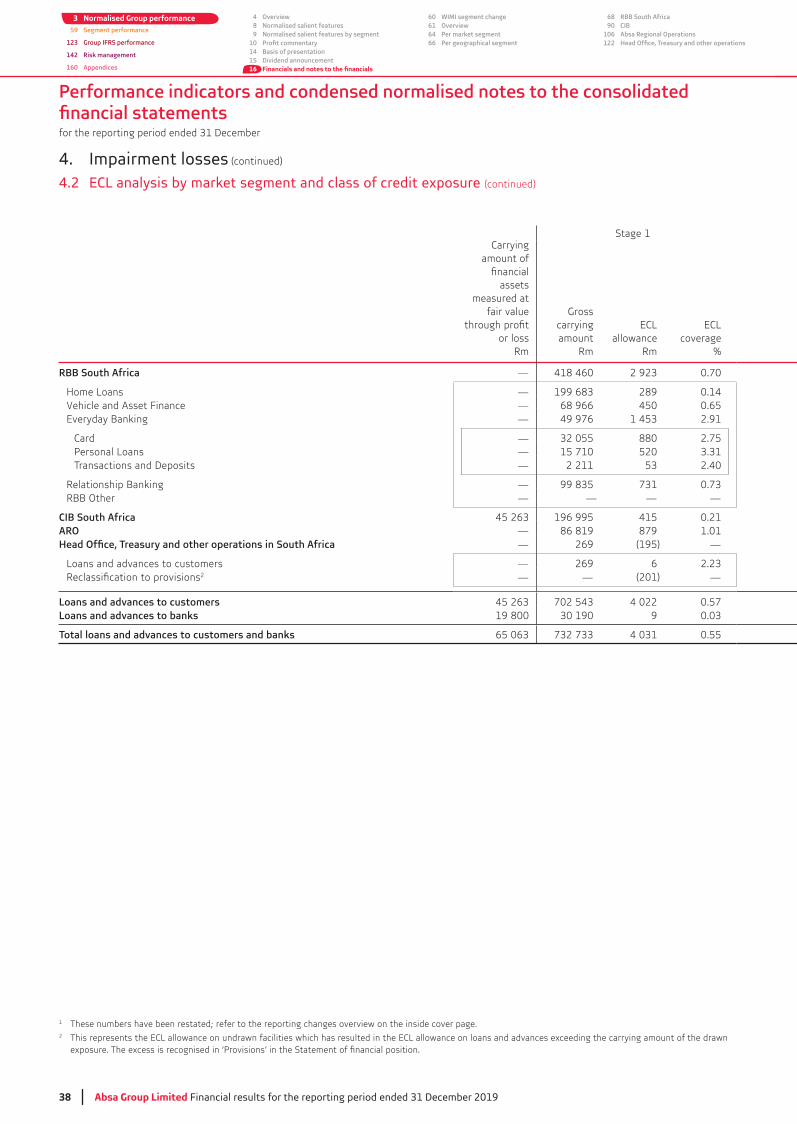
1 These numbers have been restated; refer to the reporting changes overview on the inside cover page. 2 This represents the ECL allowance on undrawn facilities which has resulted in the ECL allowance on loans and advances exceeding the carrying amount of the drawn
4. Impairment losses (continued)
4.2 ECL analysis by market segment and class of credit exposure (continued)
Stage 1Carrying
amount of
assets measured at
fair value
or lossRm
Gross carryingamount
Rm
ECLallowance
Rm
ECL coverage
%
RBB South Africa — 418 460 0.70
Home Loans — 289 0.14Vehicle and Asset Finance — 68 966 450 0.65Everyday Banking — 49 976 2.91
Card — 880 2.75— 15 710 520
Transactions and Deposits — 2 211 2.40
Relationship Banking —RBB Other — — — —
CIB South Africa 196 995 415 0.21ARO — 86 819 879 1.01
— 269 (195) —
Loans and advances to customers — 269 62 — — (201) —
Loans and advances to customers 4 022 0.57Loans and advances to banks 19 800 9
0.55
Absa Group Limited Financial results for the reporting period ended 31 December 2019 39
124 IFRS salient features
125 Financials133138 Reconciliation140 Barclays separation
143 Risk management overview155 Capital management
161 Share performance162 Shareholder information and diary163 Glossary170 Abbreviations and acronyms172 Contact information
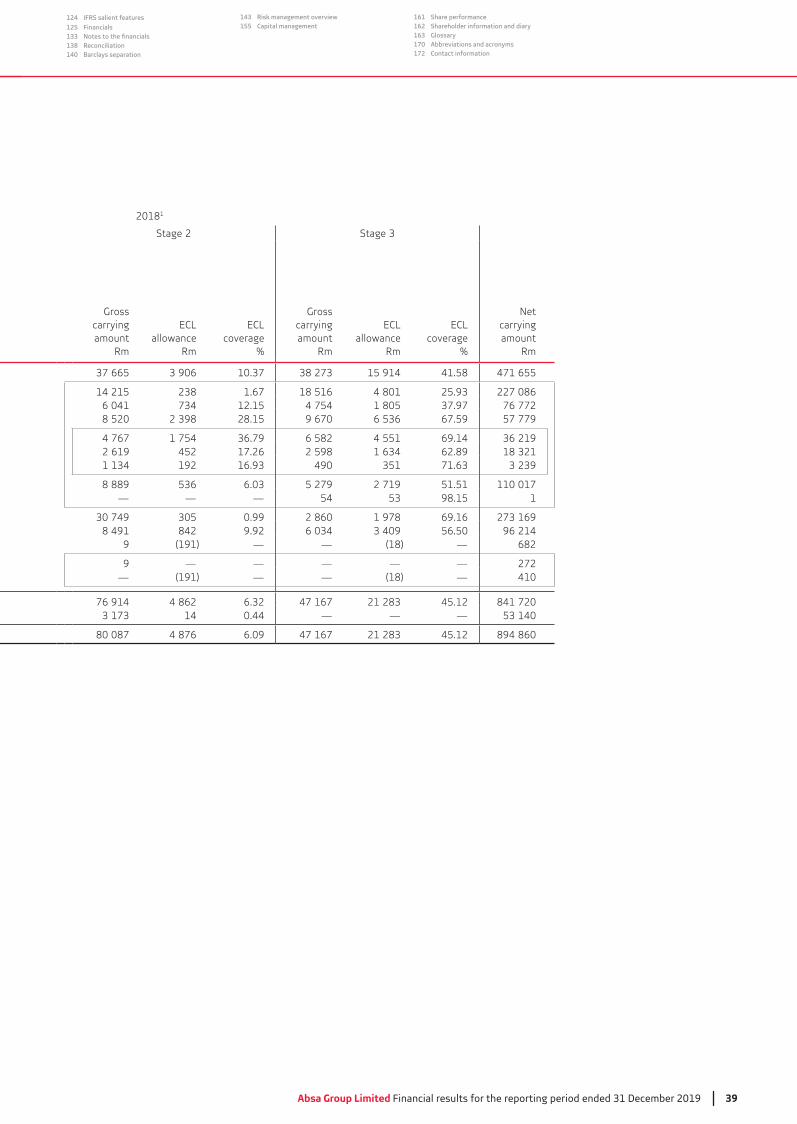
20181
Stage 2
Gross carrying amount
Rm
ECLallowance
Rm
ECL coverage
%
Gross carrying amount
Rm
ECLallowance
Rm
ECL coverage
%
Netcarrying amount
Rm
15 914 41.58 471 655
14 215 1.67 18 516 4 801 227 086 6 041 12.15 4 754 1 805 76 772 8 520 28.15 9 670 67.59 57 779
4 767 1 754 6 582 4 551 69.142 619 452 17.26 2 598 62.89
192 490
8 889 5 279 2 719 51.51 110 017 — — — 54 98.15 1
0.99 2 860 1 978 69.168 491 842 9.92 56.50 96 214
9 (191) — — (18) — 682
9 — — — — — 272 — (191) — — (18) — 410
76 914 4 862 47 167 45.12 841 720 14 0.44 — — —
80 087 4 876 6.09 47 167 45.12 894 860
Performance indicators and condensed normalised notes to the consolidated
for the reporting period ended 31 December
40 Absa Group Limited Financial results for the reporting period ended 31 December 2019
3 Normalised Group performance59 Segment performance
123 Group IFRS performance
142 Risk management
160 Appendices
4 Overview8 Normalised salient features9 Normalised salient features by segment
1014 Basis of presentation15 Dividend announcement16
60 WIMI segment change61 Overview64 Per market segment66 Per geographical segment
68 RBB South Africa90 CIB
106 Absa Regional Operations122
4. Impairment losses (continued)
4.2 ECL analysis by market segment and class of credit exposure (continued)
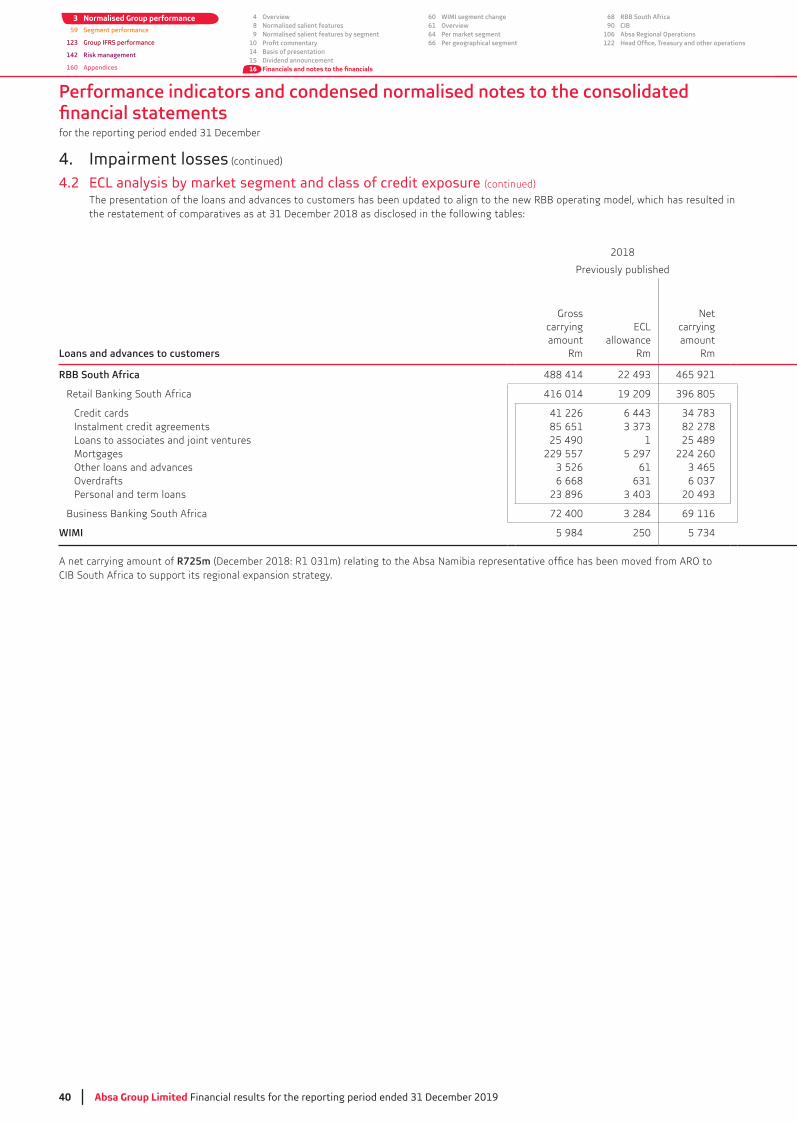
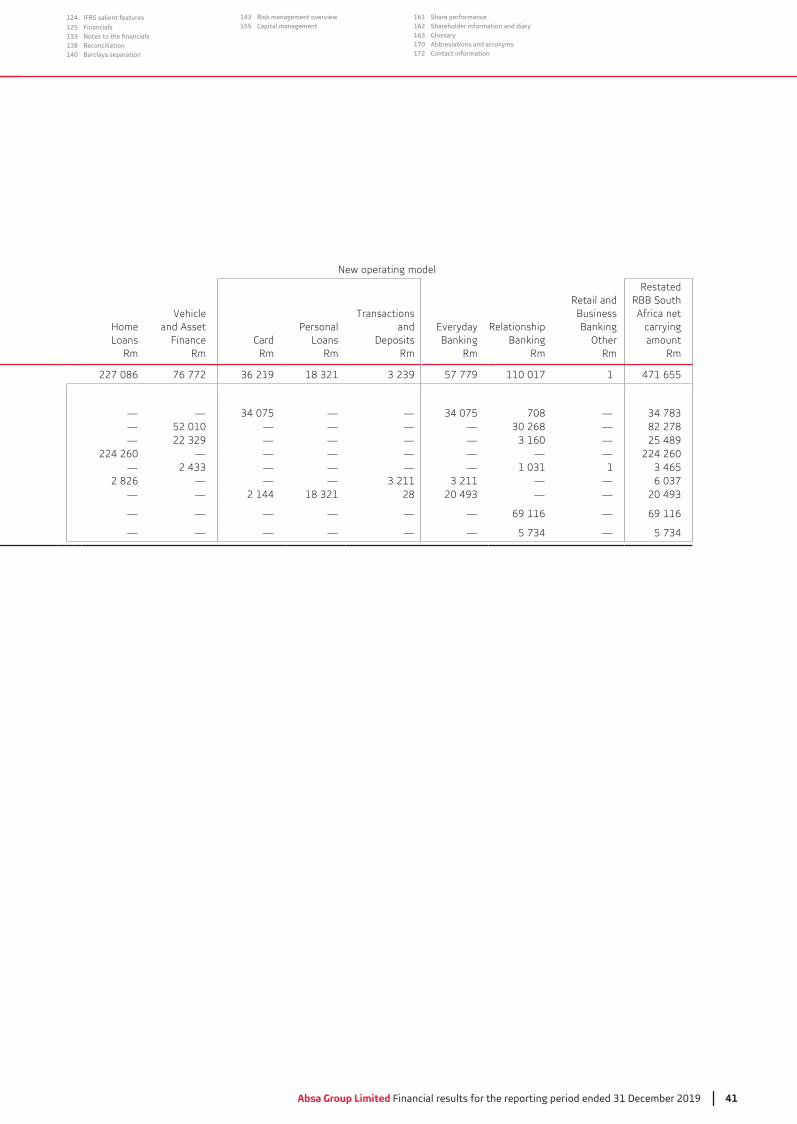
The presentation of the loans and advances to customers has been updated to align to the new RBB operating model, which has resulted in
2018
Loans and advances to customers
Gross carryingamount
Rm
ECLallowance
Rm
Netcarryingamount
Rm
RBB South Africa 488 414 465 921
Retail Banking South Africa 416 014 19 209
Credit cards 41 226Instalment credit agreements 85 651 82 278Loans to associates and joint ventures 25 490 1 25 489Mortgages 229 557 5 297 224 260Other loans and advances 61Overdrafts 6 668
Business Banking South Africa 72 400 69 116
WIMI 5 984 250
A net carrying amount of R725m CIB South Africa to support its regional expansion strategy.
Absa Group Limited Financial results for the reporting period ended 31 December 2019 41
124 IFRS salient features
125 Financials133138 Reconciliation140 Barclays separation
143 Risk management overview155 Capital management
161 Share performance162 Shareholder information and diary163 Glossary170 Abbreviations and acronyms172 Contact information
New operating model
HomeLoans
Rm
Vehicleand Asset
FinanceRm
CardRm
LoansRm
Transactionsand
DepositsRm
EverydayBanking
Rm
Relationship Banking
Rm
Retail andBusinessBanking
OtherRm
RestatedRBB SouthAfrica net
carrying amount
Rm
227 086 76 772 57 779 110 017 1 471 655
— — — — 708 —— 52 010 — — — — — 82 278— — — — — — 25 489
224 260 — — — — — — — 224 260— — — — — 1
2 826 — — — — —— — 2 144 28 — —
— — — — — — 69 116 — 69 116
— — — — — — —
Performance indicators and condensed normalised notes to the consolidated
for the reporting period ended 31 December
42 Absa Group Limited Financial results for the reporting period ended 31 December 2019
3 Normalised Group performance59 Segment performance
123 Group IFRS performance
142 Risk management
160 Appendices
4 Overview8 Normalised salient features9 Normalised salient features by segment
1014 Basis of presentation15 Dividend announcement16
60 WIMI segment change61 Overview64 Per market segment66 Per geographical segment
68 RBB South Africa90 CIB
106 Absa Regional Operations122
4. Impairment losses (continued)
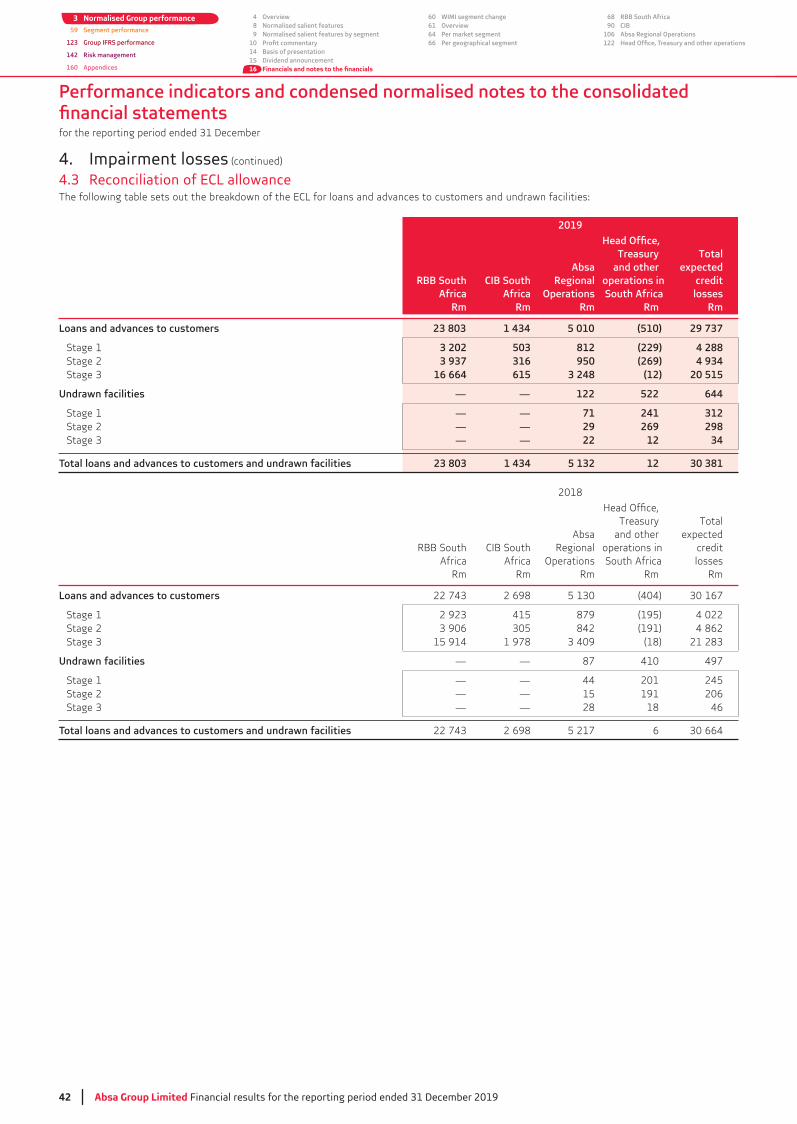
4.3 Reconciliation of ECL allowanceThe following table sets out the breakdown of the ECL for loans and advances to customers and undrawn facilities:
2019
RBB SouthAfrica
Rm
CIB SouthAfrica
Rm
Absa Regional
OperationsRm
and other operations in South Africa
Rm
credit losses
Rm
Loans and advances to customers 23 803 1 434 5 010 (510) 29 737
Stage 1 3 202 503 812 (229) 4 288Stage 2 3 937 316 950 (269) 4 934
16 664 615 3 248 (12) 20 515
Undrawn facilities — — 122 522 644
Stage 1 — — 71 241 312Stage 2 — — 29 269 298
— — 22 12 34
23 803 1 434 5 132 12 30 381
2018
RBB SouthAfrica
Rm
CIB SouthAfrica
Rm
Absa Regional
OperationsRm
Treasuryand other
operations in South Africa
Rm
Total expected
credit losses
Rm
Loans and advances to customers 2 698 (404)
Stage 1 415 879 (195) 4 022Stage 2 842 (191) 4 862
15 914 1 978 (18)
Undrawn facilities — — 87 410 497
Stage 1 — — 44 201 245Stage 2 — — 15 191 206
— — 28 18 46
2 698 5 217 6
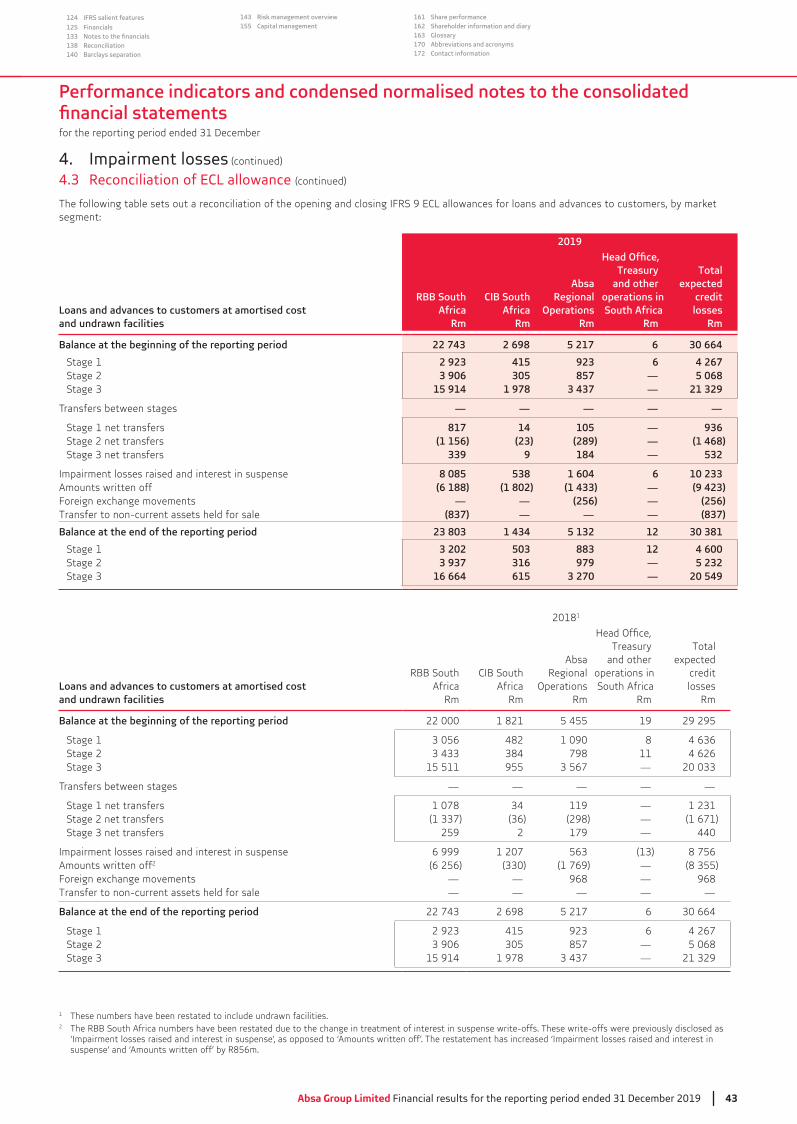
Performance indicators and condensed normalised notes to the consolidated
for the reporting period ended 31 December
Absa Group Limited Financial results for the reporting period ended 31 December 2019 43
124 IFRS salient features
125 Financials133138 Reconciliation140 Barclays separation
143 Risk management overview155 Capital management
161 Share performance162 Shareholder information and diary163 Glossary170 Abbreviations and acronyms172 Contact information
4. Impairment losses (continued)
4.3 Reconciliation of ECL allowance (continued)
The following table sets out a reconciliation of the opening and closing IFRS 9 ECL allowances for loans and advances to customers, by market segment:
2019
Loans and advances to customers at amortised cost and undrawn facilities
RBB SouthAfrica
Rm
CIB SouthAfrica
Rm
Absa Regional
OperationsRm
and other operations in South Africa
Rm
credit losses
Rm
Balance at the beginning of the reporting period 22 743 2 698 5 217 6 30 664
Stage 1 2 923 415 923 6 4 267Stage 2 3 906 305 857 — 5 068
15 914 1 978 3 437 — 21 329
Transfers between stages — — — — —
Stage 1 net transfers 817 14 105 — 936Stage 2 net transfers (1 156) (23) (289) — (1 468)
339 9 184 — 532
Impairment losses raised and interest in suspense 8 085 538 1 604 6 10 233Amounts written off (6 188) (1 802) (1 433) — (9 423)Foreign exchange movements — — (256) — (256)Transfer to non-current assets held for sale (837) — — — (837)
Balance at the end of the reporting period 23 803 1 434 5 132 12 30 381
Stage 1 3 202 503 883 12 4 600Stage 2 3 937 316 979 — 5 232
16 664 615 3 270 — 20 549
20181
Loans and advances to customers at amortised cost and undrawn facilities
RBB SouthAfrica
Rm
CIB SouthAfrica
Rm
Absa Regional
OperationsRm
Treasuryand other
operations in South Africa
Rm
Total expected
credit losses
Rm
Balance at the beginning of the reporting period 22 000 1 821 5 455 19 29 295
Stage 1 482 1 090 8Stage 2 798 11 4 626
15 511 955 —
Transfers between stages — — — — —
Stage 1 net transfers 1 078 119 —Stage 2 net transfers (298) — (1 671)
259 2 179 — 440
Impairment losses raised and interest in suspense 6 999 1 207 8 756Amounts written off2 (6 256) (1 769) —Foreign exchange movements — — 968 — 968Transfer to non-current assets held for sale — — — — —
Balance at the end of the reporting period 2 698 5 217 6
Stage 1 415 6 4 267Stage 2 857 — 5 068
15 914 1 978 —
1 These numbers have been restated to include undrawn facilities.2 The RBB South Africa numbers have been restated due to the change in treatment of interest in suspense write-offs. These write-offs were previously disclosed as
‘Impairment losses raised and interest in suspense’, as opposed to ‘Amounts written off’. The restatement has increased ‘Impairment losses raised and interest in suspense’ and ‘Amounts written off’ by R856m.

Performance indicators and condensed normalised notes to the consolidated
for the reporting period ended 31 December
44 Absa Group Limited Financial results for the reporting period ended 31 December 2019
3 Normalised Group performance59 Segment performance
123 Group IFRS performance
142 Risk management
160 Appendices
4 Overview8 Normalised salient features9 Normalised salient features by segment
1014 Basis of presentation15 Dividend announcement16
60 WIMI segment change61 Overview64 Per market segment66 Per geographical segment
68 RBB South Africa90 CIB
106 Absa Regional Operations122
4. Impairment losses (continued)
4.3 Reconciliation of ECL allowance (continued)
The following table sets out a reconciliation of the opening and closing IFRS 9 ECL allowances for banks, by market segment:
2019
Loans and advances to banks at amortised cost
RBB SouthAfrica
Rm
CIB SouthAfrica
Rm
Absa Regional
OperationsRm
and other operations
in South Africa
Rm
credit losses
Rm
Balance at the beginning of the reporting period — 15 3 5 23
Stage 1 — 6 2 1 9Stage 2 — 9 1 4 14
Impairment losses raised — 3 — (3) —Foreign exchange movements — — 1 — 1
Balance at the end of the reporting period — 18 4 2 24
Stage 1 — 15 4 2 21Stage 2 — 3 — — 3
2018
Loans and advances to banks at amortised cost
RBB SouthAfrica
Rm
CIB SouthAfrica
Rm
Absa Regional
OperationsRm
Treasuryand other
operations in South
AfricaRm
Total expected
credit losses
Rm
Balance at the beginning of the reporting period — 26 41 — 67
Stage 1 — 4 — 40Stage 2 — 22 5 — 27
Impairment losses raised — (11) 5Foreign exchange movements — — (5) — (5)
Balance at the end of the reporting period — 15 5
Stage 1 — 6 2 1 9Stage 2 — 9 1 4 14
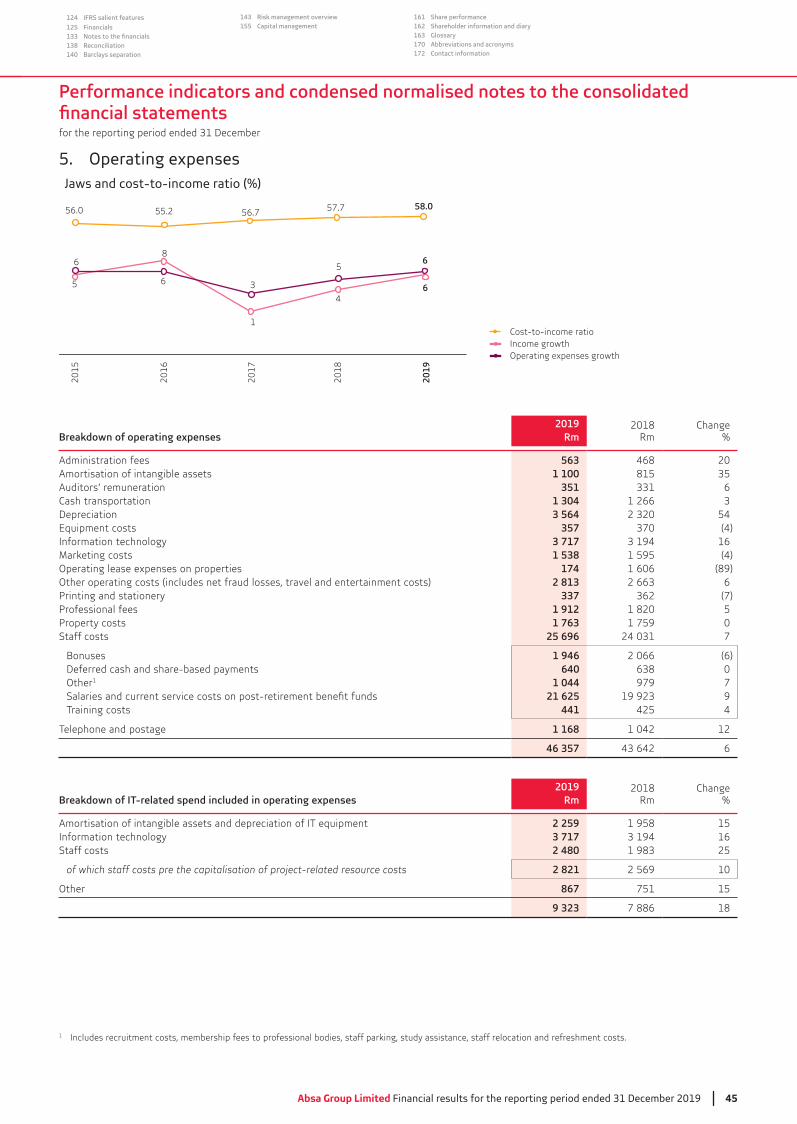
Performance indicators and condensed normalised notes to the consolidated
for the reporting period ended 31 December
Absa Group Limited Financial results for the reporting period ended 31 December 2019 45
124 IFRS salient features
125 Financials133138 Reconciliation140 Barclays separation
143 Risk management overview155 Capital management
161 Share performance162 Shareholder information and diary163 Glossary170 Abbreviations and acronyms172 Contact information
1 Includes recruitment costs, membership fees to professional bodies, staff parking, study assistance, staff relocation and refreshment costs.
2015
201
6
201
7
2018
2019
Cost-to-income ratioIncome growthOperating expenses growth
Jaws and cost-to-income ratio (%)
56.0 55.2 56.7 57.7
6
6
1
3
5
6
6
4
8
5
58.0
5. Operating expenses
2019Rm
2018Rm
Change%
Administration fees 563 468 20Amortisation of intangible assets 1 100 815Auditors’ remuneration 351 6Cash transportation 1 304 1 266Depreciation 3 564 54Equipment costs 357 (4)Information technology 3 717 16Marketing costs 1 538 1 595 (4)Operating lease expenses on properties 174 1 606 (89)Other operating costs (includes net fraud losses, travel and entertainment costs) 2 813 6
337 (7)1 912 1 820 51 763 1 759 0
Staff costs 25 696 7
Bonuses 1 946 2 066 (6)Deferred cash and share-based payments 640 0Other1 1 044 979 7
21 625 9Training costs 441 425 4
Telephone and postage 1 168 1 042 12
46 357 6
2019Rm
2018Rm
Change%
Amortisation of intangible assets and depreciation of IT equipment 2 259 1 958 15Information technology 3 717 16Staff costs 2 480 25
of which staff costs pre the capitalisation of project-related resource costs 2 821 2 569 10
Other 867 751 15
9 323 7 886 18
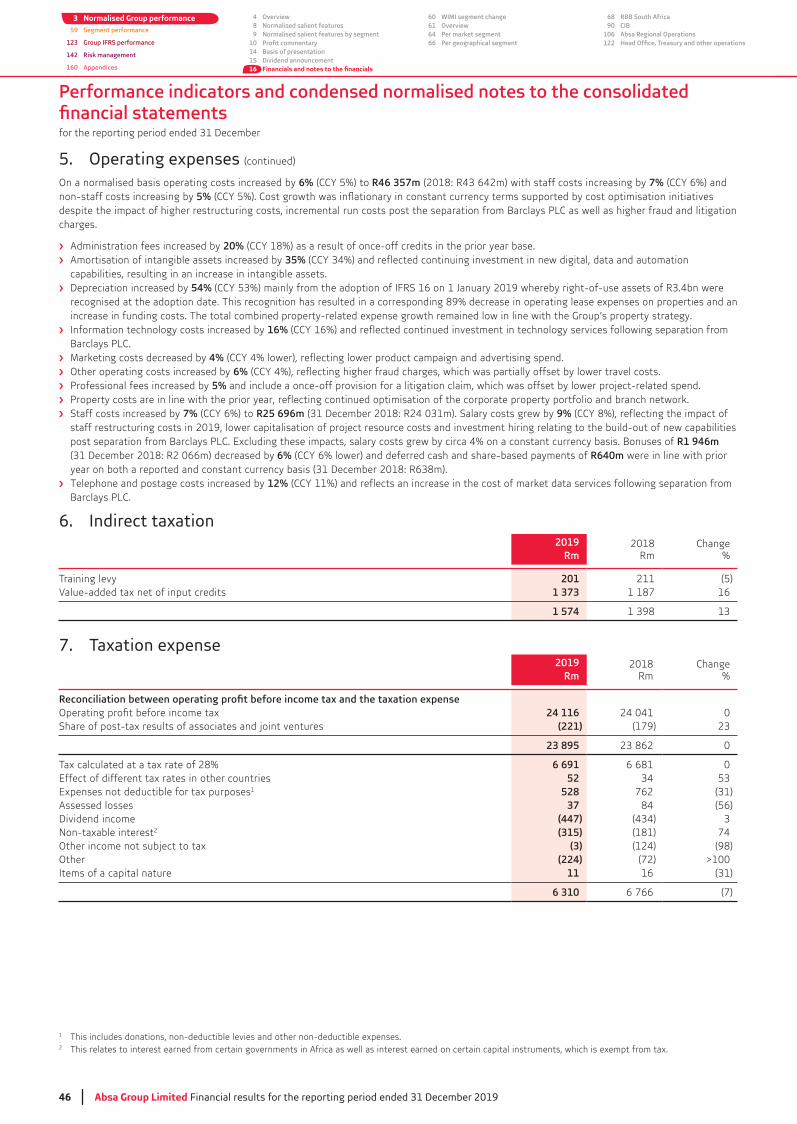
Performance indicators and condensed normalised notes to the consolidated
for the reporting period ended 31 December
46 Absa Group Limited Financial results for the reporting period ended 31 December 2019
3 Normalised Group performance59 Segment performance
123 Group IFRS performance
142 Risk management
160 Appendices
4 Overview8 Normalised salient features9 Normalised salient features by segment
1014 Basis of presentation15 Dividend announcement16
60 WIMI segment change61 Overview64 Per market segment66 Per geographical segment
68 RBB South Africa90 CIB
106 Absa Regional Operations122
5. Operating expenses (continued)
On a normalised basis operating costs increased by 6% (CCY 5%) to R46 357m 7% (CCY 6%) and non-staff costs increasing by 5%
charges.
Administration fees increased by 20% (CCY 18%) as a result of once-off credits in the prior year base.Amortisation of intangible assets increased by 35% capabilities, resulting in an increase in intangible assets.Depreciation increased by 54% recognised at the adoption date. This recognition has resulted in a corresponding 89% decrease in operating lease expenses on properties and an increase in funding costs. The total combined property-related expense growth remained low in line with the Group’s property strategy.Information technology costs increased by 16% (CCY 16%) and reflected continued investment in technology services following separation from
Marketing costs decreased by 4% (CCY 4% lower), reflecting lower product campaign and advertising spend. Other operating costs increased by 6% (CCY 4%), reflecting higher fraud charges, which was partially offset by lower travel costs.
5% and include a once-off provision for a litigation claim, which was offset by lower project-related spend.
Staff costs increased by 7% (CCY 6%) to R25 696m 9% (CCY 8%), reflecting the impact of staff restructuring costs in 2019, lower capitalisation of project resource costs and investment hiring relating to the build-out of new capabilities
R1 946m 6% (CCY 6% lower) and deferred cash and share-based payments of R640m were in line with prior
Telephone and postage costs increased by 12% (CCY 11%) and reflects an increase in the cost of market data services following separation from
6. Indirect taxation2019
Rm2018
RmChange
%
Training levy 201 211 (5)Value-added tax net of input credits 1 373 1 187 16
1 574
7. Taxation expense2019
Rm2018
RmChange
%
24 116 24 041 0Share of post-tax results of associates and joint ventures (221) (179)
23 895 0
Tax calculated at a tax rate of 28% 6 691 6 681 0Effect of different tax rates in other countries 52Expenses not deductible for tax purposes1 528 762Assessed losses 37 84 (56)Dividend income (447)Non-taxable interest2 (315) (181) 74Other income not subject to tax (3) (124) (98)Other (224) (72) >100Items of a capital nature 11 16
6 310 6 766 (7)
1 This includes donations, non-deductible levies and other non-deductible expenses. 2 This relates to interest earned from certain governments in Africa as well as interest earned on certain capital instruments, which is exempt from tax.
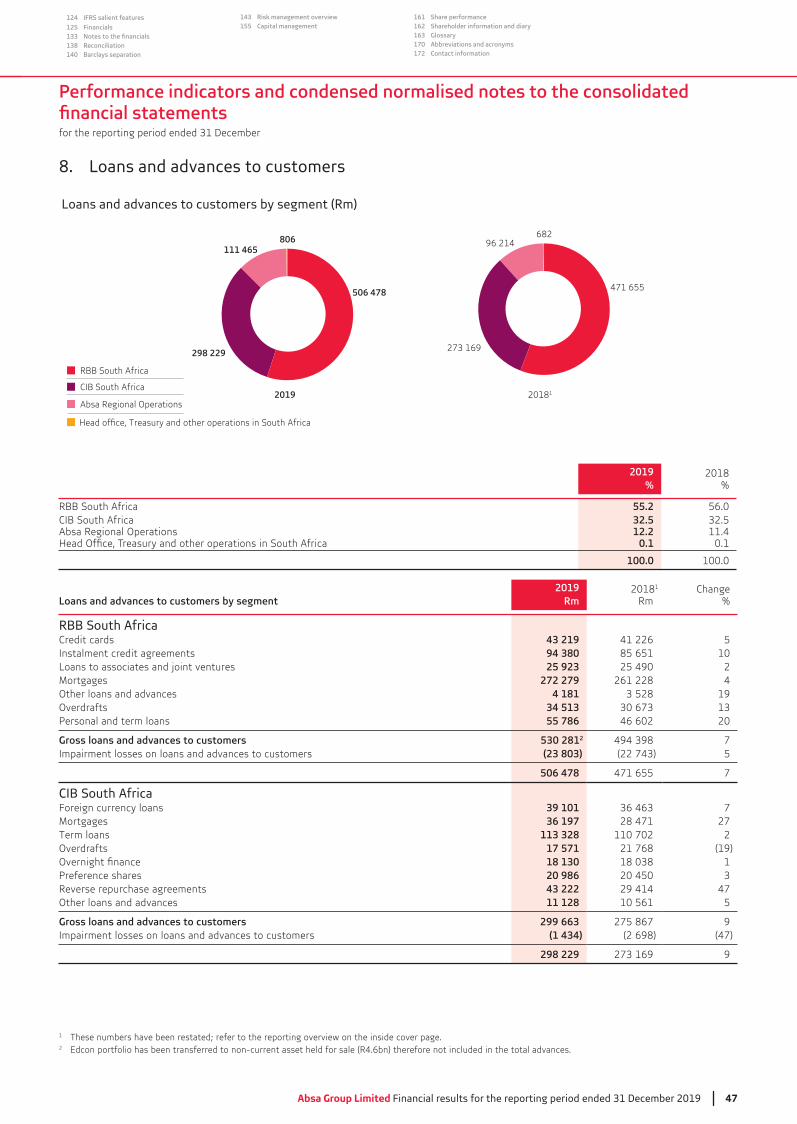
Performance indicators and condensed normalised notes to the consolidated
for the reporting period ended 31 December
Absa Group Limited Financial results for the reporting period ended 31 December 2019 47
124 IFRS salient features
125 Financials133138 Reconciliation140 Barclays separation
143 Risk management overview155 Capital management
161 Share performance162 Shareholder information and diary163 Glossary170 Abbreviations and acronyms172 Contact information
8. Loans and advances to customers
Loans and advances to customers by segment (Rm)
CIB South Africa
Absa Regional Operations
Head office, Treasury and other operations in South Africa
RBB South Africa
20181
96 214682
471 655
273 169
111 465806
506 478
298 229
2019
2019%
2018%
RBB South Africa 55.2 56.0CIB South Africa 32.5 32.5Absa Regional Operations 12.2 11.4
0.1 0.1
100.0 100.0
Loans and advances to customers by segment2019
Rm20181
RmChange
%
RBB South AfricaCredit cards 43 219 41 226 5Instalment credit agreements 94 380 85 651 10Loans to associates and joint ventures 25 923 25 490 2Mortgages 272 279 261 228 4Other loans and advances 4 181 3 528 19Overdrafts 34 513 30 673 13Personal and term loans 55 786 46 602 20
Gross loans and advances to customers 530 2812 494 398 7Impairment losses on loans and advances to customers (23 803) (22 743) 5
506 478 471 655 7
CIB South Africa39 101 36 463 7
Mortgages 36 197 28 471 27113 328 110 702 2
Overdrafts 17 571 21 768 (19)18 130 18 038 1
Preference shares 20 986 20 450 3Reverse repurchase agreements 43 222 29 414 47Other loans and advances 11 128 10 561 5
Gross loans and advances to customers 299 663 275 867 9Impairment losses on loans and advances to customers (1 434) (2 698) (47)
298 229 273 169 9
1
2 Edcon portfolio has been transferred to non-current asset held for sale (R4.6bn) therefore not included in the total advances.
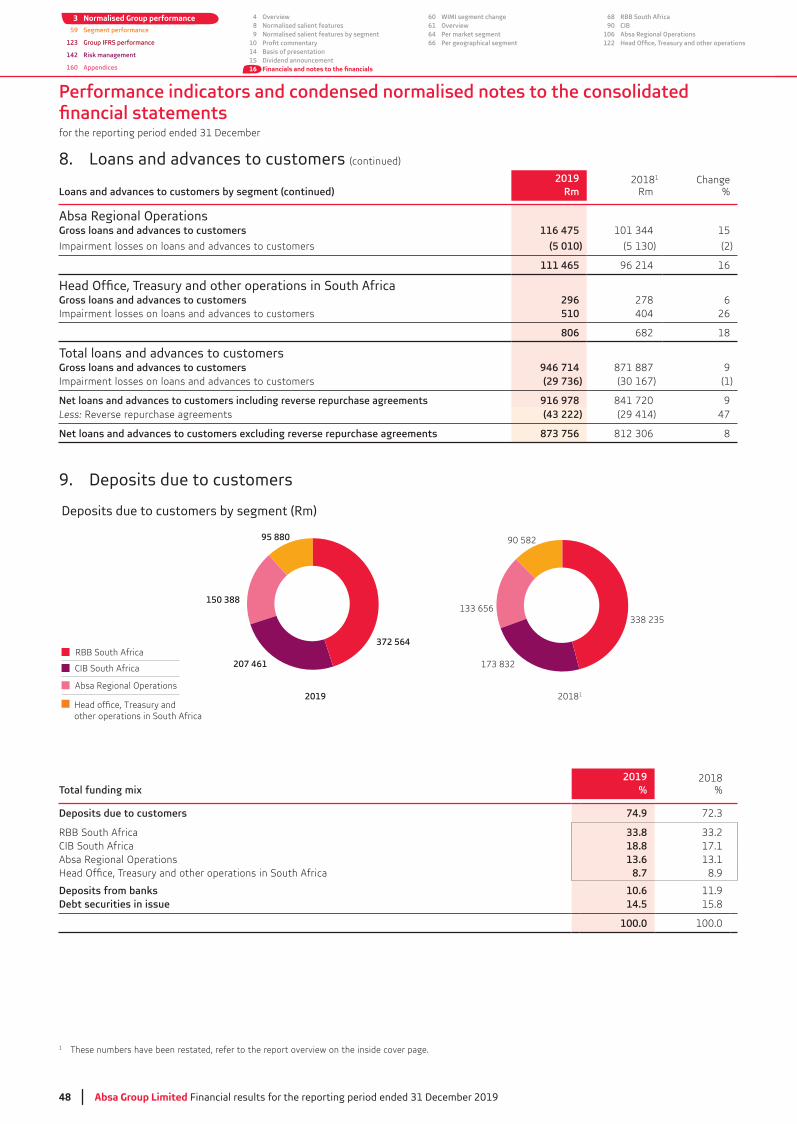
Performance indicators and condensed normalised notes to the consolidated
for the reporting period ended 31 December
48 Absa Group Limited Financial results for the reporting period ended 31 December 2019
3 Normalised Group performance59 Segment performance
123 Group IFRS performance
142 Risk management
160 Appendices
4 Overview8 Normalised salient features9 Normalised salient features by segment
1014 Basis of presentation15 Dividend announcement16
60 WIMI segment change61 Overview64 Per market segment66 Per geographical segment
68 RBB South Africa90 CIB
106 Absa Regional Operations122
8. Loans and advances to customers (continued)
Loans and advances to customers by segment (continued)2019
Rm20181
RmChange
%
Absa Regional OperationsGross loans and advances to customers 116 475 15
Impairment losses on loans and advances to customers (5 010) (2)
111 465 96 214 16
Gross loans and advances to customers 296 278 6Impairment losses on loans and advances to customers 510 404 26
806 682 18
Total loans and advances to customersGross loans and advances to customers 946 714 871 887 9Impairment losses on loans and advances to customers (29 736) (1)
Net loans and advances to customers including reverse repurchase agreements 916 978 841 720 9Less: Reverse repurchase agreements (43 222) (29 414) 47
873 756 8
9. Deposits due to customers
Deposits due to customers by segment (Rm)
CIB South Africa
Absa Regional Operations
other operations in South Africa
RBB South Africa
20181
90 582
133 656338 235
173 832
2019
95 880
207 461
372 564
150 388
2019%
2018%
Deposits due to customers 74.9
RBB South Africa 33.8CIB South Africa 18.8 17.1Absa Regional Operations 13.6
8.7 8.9
Deposits from banks 10.6 11.9Debt securities in issue 14.5 15.8
100.0 100.0
1 These numbers have been restated, refer to the report overview on the inside cover page.
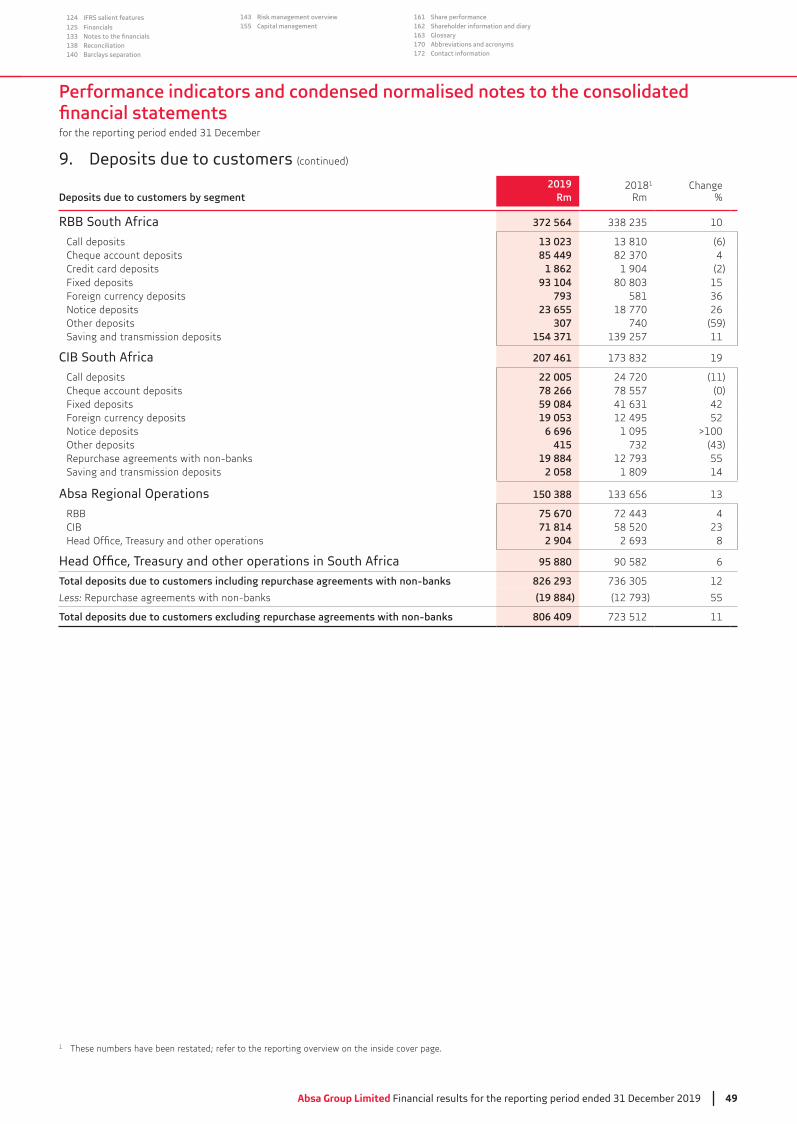
Performance indicators and condensed normalised notes to the consolidated
for the reporting period ended 31 December
Absa Group Limited Financial results for the reporting period ended 31 December 2019 49
124 IFRS salient features
125 Financials133138 Reconciliation140 Barclays separation
143 Risk management overview155 Capital management
161 Share performance162 Shareholder information and diary163 Glossary170 Abbreviations and acronyms172 Contact information
9. Deposits due to customers (continued)
Deposits due to customers by segment2019
Rm20181
RmChange
%
RBB South Africa 372 564 10
Call deposits 13 023 (6)Cheque account deposits 85 449 4Credit card deposits 1 862 1 904 (2)Fixed deposits 93 104 15Foreign currency deposits 793 581Notice deposits 23 655 18 770 26Other deposits 307 740 (59)Saving and transmission deposits 154 371 11
CIB South Africa 207 461 19
Call deposits 22 005 24 720 (11)Cheque account deposits 78 266 78 557 (0)Fixed deposits 59 084 42Foreign currency deposits 19 053 12 495 52Notice deposits 6 696 1 095 >100 Other deposits 415Repurchase agreements with non-banks 19 884 55Saving and transmission deposits 2 058 1 809 14
Absa Regional Operations 150 388
RBB 75 670 4CIB 71 814 58 520
2 904 8
95 880 90 582 6
826 293 12
Less: Repurchase agreements with non-banks (19 884) 55
806 409 11
1 These numbers have been restated; refer to the reporting overview on the inside cover page.
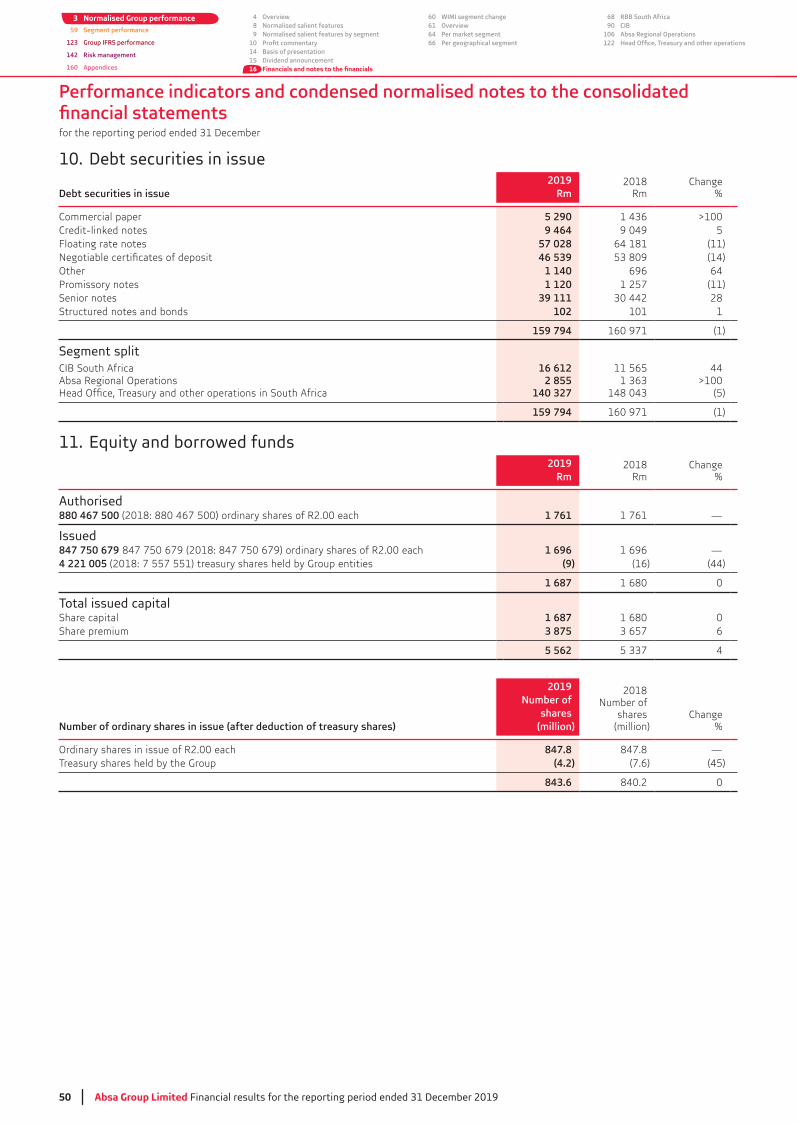
Performance indicators and condensed normalised notes to the consolidated
for the reporting period ended 31 December
50 Absa Group Limited Financial results for the reporting period ended 31 December 2019
3 Normalised Group performance59 Segment performance
123 Group IFRS performance
142 Risk management
160 Appendices
4 Overview8 Normalised salient features9 Normalised salient features by segment
1014 Basis of presentation15 Dividend announcement16
60 WIMI segment change61 Overview64 Per market segment66 Per geographical segment
68 RBB South Africa90 CIB
106 Absa Regional Operations122
10. Debt securities in issue
Debt securities in issue2019
Rm2018
RmChange
%
Commercial paper 5 290 >100 Credit-linked notes 9 464 9 049 5Floating rate notes 57 028 64 181 (11)
46 539 (14)Other 1 140 696 64
1 120 1 257 (11)Senior notes 39 111 28Structured notes and bonds 102 101 1
159 794 160 971 (1)
Segment splitCIB South Africa 16 612 11 565 44Absa Regional Operations 2 855 >100
140 327 (5)
159 794 160 971 (1)
11. Equity and borrowed funds2019
Rm2018
RmChange
%
Authorised880 467 500 (2018: 880 467 500) ordinary shares of R2.00 each 1 761 1 761 —
Issued847 750 679 847 750 679 (2018: 847 750 679) ordinary shares of R2.00 each 1 696 1 696 —4 221 005 (2018: 7 557 551) treasury shares held by Group entities (9) (16) (44)
1 687 1 680 0
Total issued capitalShare capital 1 687 1 680 0Share premium 3 875 6
5 562 4
Number of ordinary shares in issue (after deduction of treasury shares)
2019Number of
shares(million)
2018Number of
shares(million)
Change%
Ordinary shares in issue of R2.00 each 847.8 847.8 —Treasury shares held by the Group (4.2) (7.6) (45)
843.6 840.2 0
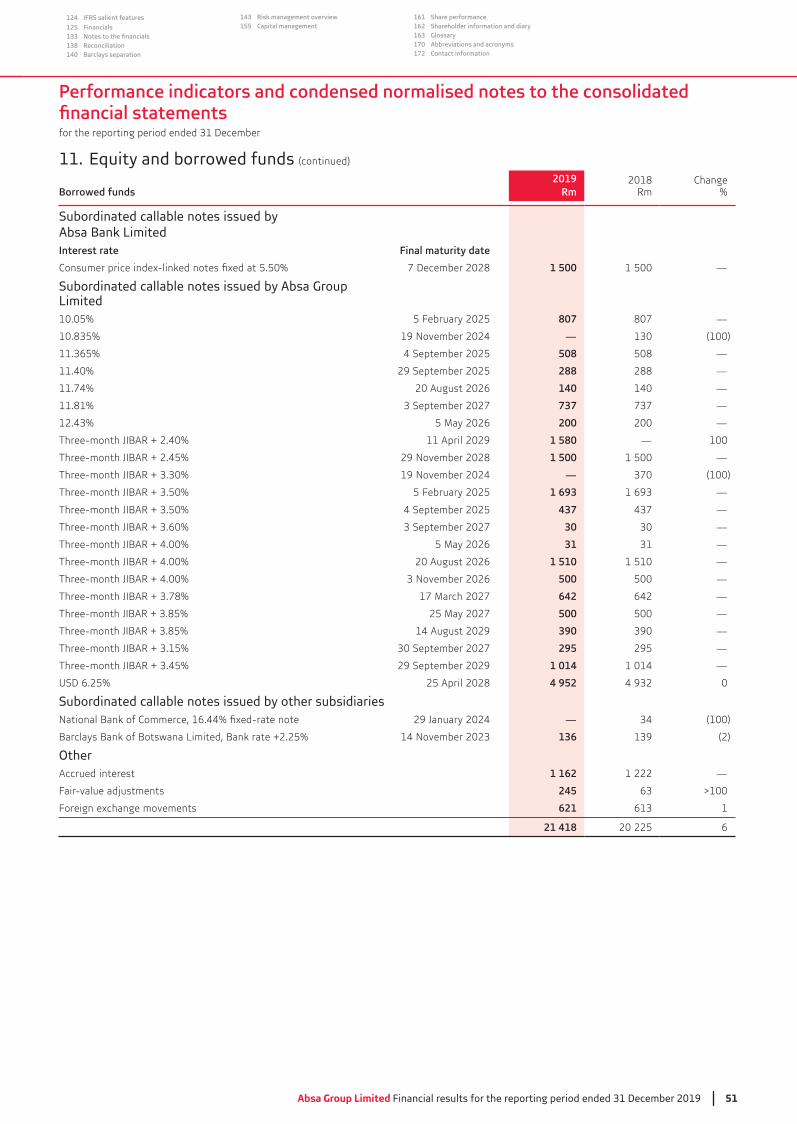
Performance indicators and condensed normalised notes to the consolidated
for the reporting period ended 31 December
Absa Group Limited Financial results for the reporting period ended 31 December 2019 51
124 IFRS salient features
125 Financials133138 Reconciliation140 Barclays separation
143 Risk management overview155 Capital management
161 Share performance162 Shareholder information and diary163 Glossary170 Abbreviations and acronyms172 Contact information
11. Equity and borrowed funds (continued)
Borrowed funds2019
Rm2018
RmChange
%
Subordinated callable notes issued by Absa Bank LimitedInterest rate Final maturity date
7 December 2028 1 500 1 500 —
Subordinated callable notes issued by Absa Group Limited10.05% 5 February 2025 807 807 —
19 November 2024 — (100)
4 September 2025 508 508 —
11.40% 29 September 2025 288 288 —
11.74% 20 August 2026 140 140 —
11.81% 737 —
5 May 2026 200 200 —
11 April 2029 1 580 — 100
29 November 2028 1 500 1 500 —
19 November 2024 — (100)
5 February 2025 1 693 —
4 September 2025 437 —
30 —
5 May 2026 31 —
20 August 2026 1 510 1 510 —
500 500 —
17 March 2027 642 642 —
25 May 2027 500 500 —
14 August 2029 390 —
295 295 —
29 September 2029 1 014 1 014 —
USD 6.25% 25 April 2028 4 952 0
Subordinated callable notes issued by other subsidiaries— (100)
Barclays Bank of Botswana Limited, Bank rate +2.25% 136 (2)
OtherAccrued interest 1 162 1 222 —
Fair-value adjustments 245 >100
Foreign exchange movements 621 1
21 418 20 225 6

Performance indicators and condensed normalised notes to the consolidated
for the reporting period ended 31 December
52 Absa Group Limited Financial results for the reporting period ended 31 December 2019
3 Normalised Group performance59 Segment performance
123 Group IFRS performance
142 Risk management
160 Appendices
4 Overview8 Normalised salient features9 Normalised salient features by segment
1014 Basis of presentation15 Dividend announcement16
60 WIMI segment change61 Overview64 Per market segment66 Per geographical segment
68 RBB South Africa90 CIB
106 Absa Regional Operations122
11. Equity and borrowed funds (continued)
NAV per share and closing price/NAV per share (cents and %)
2015 2016 2017 20192018
NAV per ordinary share (cents)
Closing price/NAV per share (price-to-book) (%)
10 55810 980
11 573
12 605
1.361.54
1,86
1.581.35
1.34
11 985
12. Returns
15.8
RoE, RoA and RoRWA (%)
17.0 16.6 16.5 16.8
2.18
1.37 1.34 1.39
2.14 2.17
1.34
2.12
RoERoRWARoA
1.20
1.91
2015 2016 2017 20192018
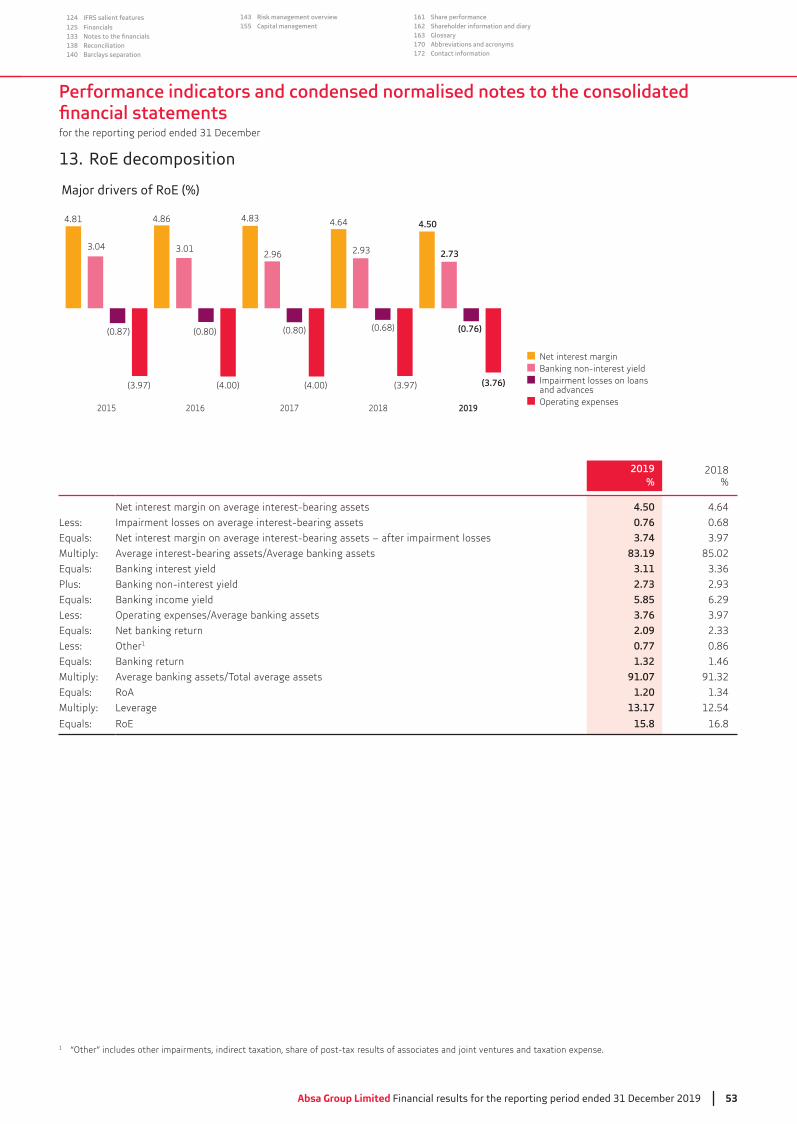
Performance indicators and condensed normalised notes to the consolidated
for the reporting period ended 31 December
Absa Group Limited Financial results for the reporting period ended 31 December 2019 53
124 IFRS salient features
125 Financials133138 Reconciliation140 Barclays separation
143 Risk management overview155 Capital management
161 Share performance162 Shareholder information and diary163 Glossary170 Abbreviations and acronyms172 Contact information
13. RoE decomposition
Major drivers of RoE (%)
4.81
3.04
(0.87)
(3.97)
4.86
3.01
(0.80)
(4.00)
4.83
(0.80) (0.68)
(4.00)
2.96
4.64 4.50
2.73
(0.76)
(3.76)
2.93
2015 2016 2017 2018 2019
Net interest marginBanking non-interest yieldImpairment losses on loans and advancesOperating expenses
(3.97)
2019%
2018%
Net interest margin on average interest-bearing assets 4.50 4.64
Less: Impairment losses on average interest-bearing assets 0.76 0.68
Equals: Net interest margin on average interest-bearing assets – after impairment losses 3.74Multiply: Average interest-bearing assets/Average banking assets 83.19 85.02
Equals: Banking interest yield 3.11Banking non-interest yield 2.73
Equals: Banking income yield 5.85 6.29
Less: Operating expenses/Average banking assets 3.76Equals: Net banking return 2.09Less: Other1 0.77 0.86
Equals: Banking return 1.32 1.46
Multiply: Average banking assets/Total average assets 91.07Equals: RoA 1.20Multiply: Leverage 13.17 12.54
Equals: RoE 15.8 16.8
1 “Other” includes other impairments, indirect taxation, share of post-tax results of associates and joint ventures and taxation expense.
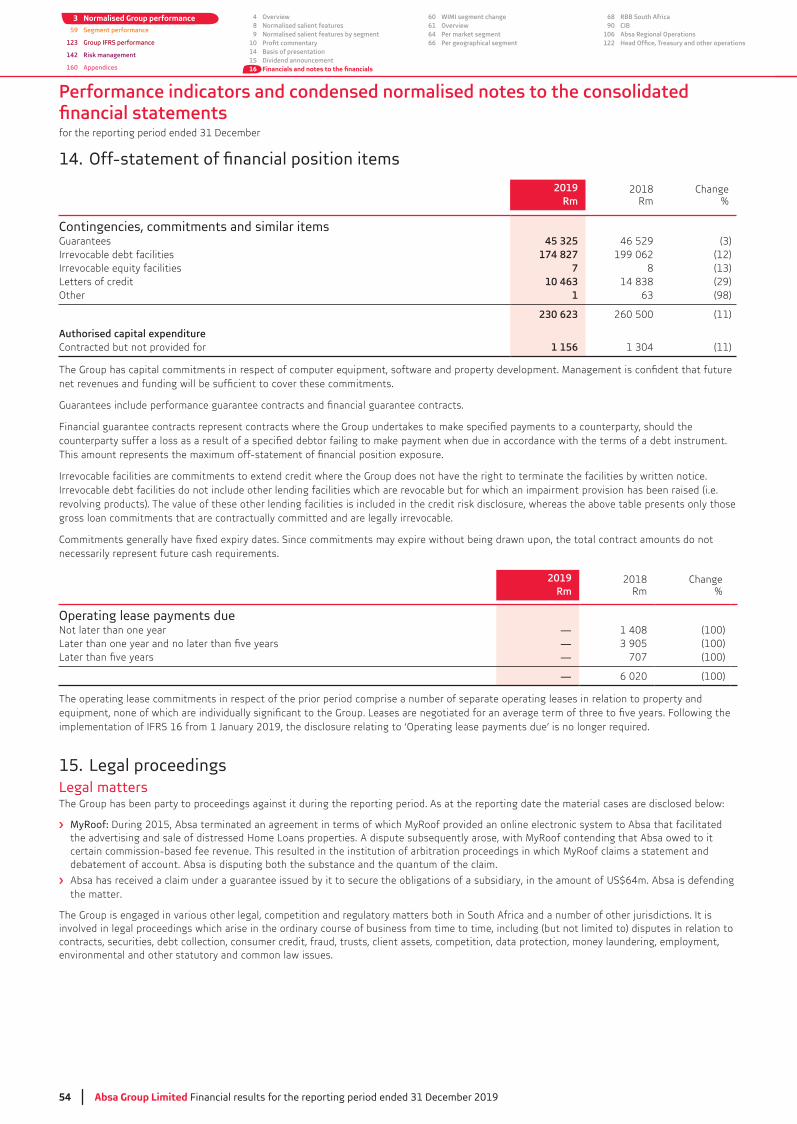
Performance indicators and condensed normalised notes to the consolidated
for the reporting period ended 31 December
54 Absa Group Limited Financial results for the reporting period ended 31 December 2019
3 Normalised Group performance59 Segment performance
123 Group IFRS performance
142 Risk management
160 Appendices
4 Overview8 Normalised salient features9 Normalised salient features by segment
1014 Basis of presentation15 Dividend announcement16
60 WIMI segment change61 Overview64 Per market segment66 Per geographical segment
68 RBB South Africa90 CIB
106 Absa Regional Operations122
2019Rm
2018Rm
Change%
Contingencies, commitments and similar itemsGuarantees 45 325 46 529Irrevocable debt facilities 174 827 199 062 (12)Irrevocable equity facilities 7 8Letters of credit 10 463 (29)Other 1 (98)
230 623 260 500 (11)
Contracted but not provided for 1 156 (11)
Irrevocable facilities are commitments to extend credit where the Group does not have the right to terminate the facilities by written notice. Irrevocable debt facilities do not include other lending facilities which are revocable but for which an impairment provision has been raised (i.e. revolving products). The value of these other lending facilities is included in the credit risk disclosure, whereas the above table presents only those gross loan commitments that are contractually committed and are legally irrevocable.
necessarily represent future cash requirements.
2019Rm
2018Rm
Change%
Operating lease payments dueNot later than one year — 1 408 (100)
— (100)— 707 (100)
— 6 020 (100)
The operating lease commitments in respect of the prior period comprise a number of separate operating leases in relation to property and
15. Legal proceedingsLegal mattersThe Group has been party to proceedings against it during the reporting period. As at the reporting date the material cases are disclosed below:
During 2015, Absa terminated an agreement in terms of which MyRoof provided an online electronic system to Absa that facilitated the advertising and sale of distressed Home Loans properties. A dispute subsequently arose, with MyRoof contending that Absa owed to it certain commission-based fee revenue. This resulted in the institution of arbitration proceedings in which MyRoof claims a statement and debatement of account. Absa is disputing both the substance and the quantum of the claim.
Absa has received a claim under a guarantee issued by it to secure the obligations of a subsidiary, in the amount of US$64m. Absa is defending the matter.
The Group is engaged in various other legal, competition and regulatory matters both in South Africa and a number of other jurisdictions. It is involved in legal proceedings which arise in the ordinary course of business from time to time, including (but not limited to) disputes in relation to contracts, securities, debt collection, consumer credit, fraud, trusts, client assets, competition, data protection, money laundering, employment, environmental and other statutory and common law issues.
Performance indicators and condensed normalised notes to the consolidated
for the reporting period ended 31 December
Absa Group Limited Financial results for the reporting period ended 31 December 2019 55
124 IFRS salient features
125 Financials133138 Reconciliation140 Barclays separation
143 Risk management overview155 Capital management
161 Share performance162 Shareholder information and diary163 Glossary170 Abbreviations and acronyms172 Contact information
15. Legal proceedings (continued)
Legal matters (continued)The Group is also subject to enquiries and examinations, requests for information, audits, investigations and legal and other proceedings by regulators, governmental and other public bodies in connection with (but not limited to) consumer protection measures, compliance with legislation and regulation, wholesale trading activity and other areas of banking and business activities in which the Group is or has been engaged.
At the present time, the Group does not expect the ultimate resolution of any of these other matters to have a material adverse effect on its
particular period, depending on, amongst other things, the amount of the loss resulting from the matter(s) and the amount of income otherwise reported for the reporting period.
The Group has not disclosed the contingent liabilities associated with these matters either because they cannot reasonably be estimated or
remote. The case relating to the Ayanda Collective Investment Scheme was amicably resolved during the year under review.
Regulatory matters
to regulatory structures globally and locally, especially for companies that are deemed to be of systemic importance. Concurrently, there is continuing political and regulatory scrutiny of the operation of the banking and consumer credit industries globally which, in some cases, is leading to increased regulation.
and insurance regulation, cannot currently be fully predicted and are beyond the Group’s control. Some of these are likely to have an impact on the Group’s businesses, systems and earnings.
The Group is continuously evaluating its programmes and controls in general relating to compliance with regulation. The Group undertakes monitoring, review and assurance activities, and the Group has also adopted appropriate remedial and/or mitigating steps, where necessary or
The Group’s possible obligation with regards to the matter previously disclosed relating to the SACC seeking sanction against Barclays/Absa has, in the current reporting period, been reassessed to be remote.
16. Income taxesThe Group is subject to income taxes in numerous jurisdictions and the calculation of the Group’s tax charge and provisions for income taxes necessarily involves a degree of estimation and judgement. There are many transactions and calculations for which the ultimate tax treatment is
charge cannot be determined until resolution has been reached with the relevant tax authority.
The Group recognises provisions for anticipated tax audit issues based on estimates of whether additional taxes will be due after taking into account external advice where appropriate. The carrying amount of any resulting provisions will be sensitive to the manner in which tax matters
informed by a number of factors including, inter alia, the progress made in discussions or negotiations with the tax authorities, the advice of expert legal counsel, precedent set by the outcome of any previous claims, as well as the nature of the relevant tax environment.
and deferred income tax assets and liabilities in the reporting period in which such determination is made. These risks are managed in accordance with the Group’s Tax Risk Framework.
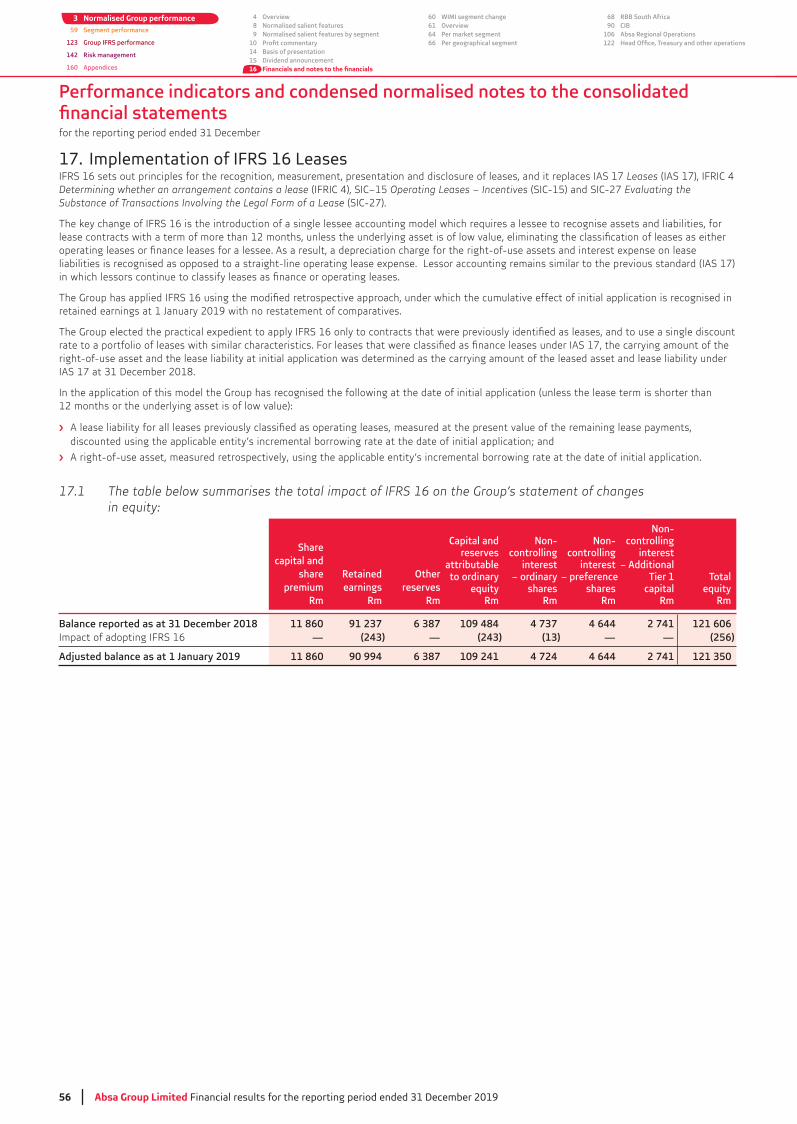
Performance indicators and condensed normalised notes to the consolidated
for the reporting period ended 31 December
56 Absa Group Limited Financial results for the reporting period ended 31 December 2019
3 Normalised Group performance59 Segment performance
123 Group IFRS performance
142 Risk management
160 Appendices
4 Overview8 Normalised salient features9 Normalised salient features by segment
1014 Basis of presentation15 Dividend announcement16
60 WIMI segment change61 Overview64 Per market segment66 Per geographical segment
68 RBB South Africa90 CIB
106 Absa Regional Operations122
17. Implementation of IFRS 16 LeasesIFRS 16 sets out principles for the recognition, measurement, presentation and disclosure of leases, and it replaces IAS 17 Leases (IAS 17), IFRIC 4 Determining whether an arrangement contains a lease (IFRIC 4), SIC–15 Operating Leases – Incentives (SIC-15) and SIC-27 Evaluating the Substance of Transactions Involving the Legal Form of a Lease (SIC-27).
The key change of IFRS 16 is the introduction of a single lessee accounting model which requires a lessee to recognise assets and liabilities, for
liabilities is recognised as opposed to a straight-line operating lease expense. Lessor accounting remains similar to the previous standard (IAS 17)
right-of-use asset and the lease liability at initial application was determined as the carrying amount of the leased asset and lease liability under
In the application of this model the Group has recognised the following at the date of initial application (unless the lease term is shorter than 12 months or the underlying asset is of low value):
discounted using the applicable entity’s incremental borrowing rate at the date of initial application; and
A right-of-use asset, measured retrospectively, using the applicable entity’s incremental borrowing rate at the date of initial application.
17.1 The table below summarises the total impact of IFRS 16 on the Group’s statement of changes in equity:
Share capital and
share premium
Rm
Retained earnings
Rm
Other reserves
Rm
Capital and reserves
attributable to ordinary
equityRm
Non-controlling
interest – ordinary
sharesRm
Non-controlling
interest – preference
sharesRm
Non-controlling
interest – Additional
capital Rm
equityRm
Balance reported as at 31 December 2018 11 860 91 237 6 387 109 484 4 737 4 644 2 741 121 606Impact of adopting IFRS 16 — (243) — (243) (13) — — (256)
Adjusted balance as at 1 January 2019 11 860 90 994 6 387 109 241 4 724 4 644 2 741 121 350
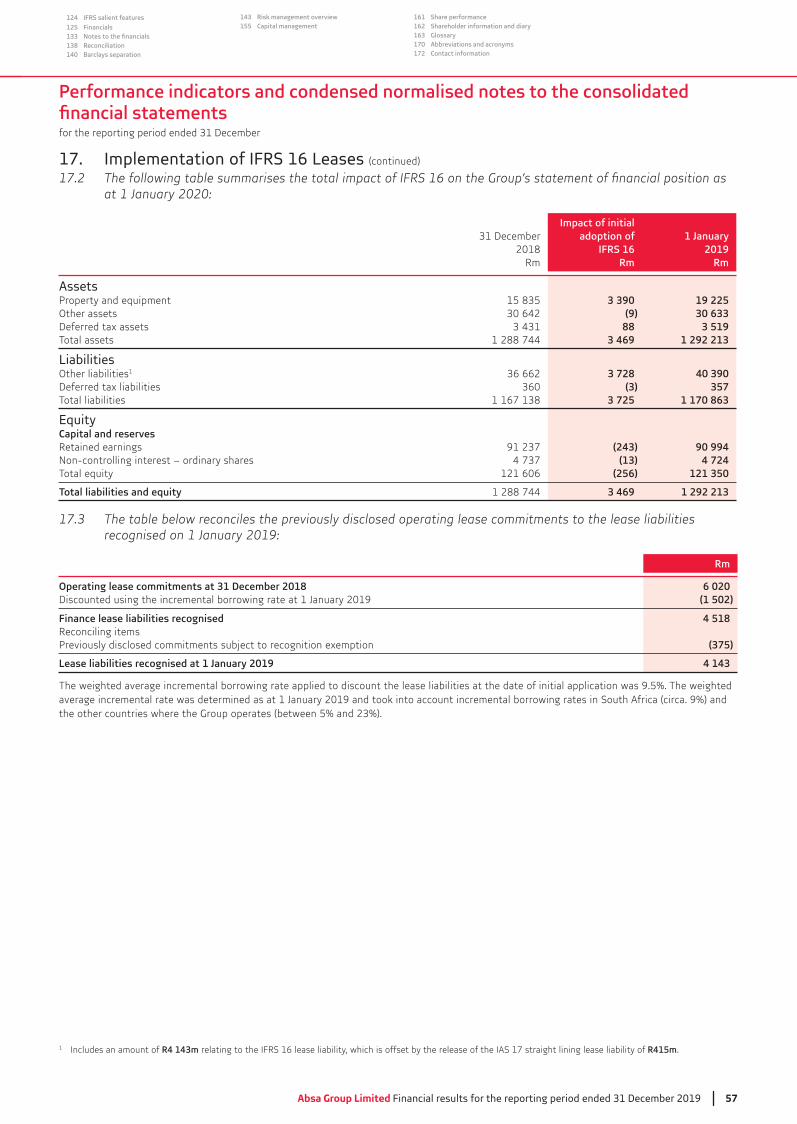
Performance indicators and condensed normalised notes to the consolidated
for the reporting period ended 31 December
Absa Group Limited Financial results for the reporting period ended 31 December 2019 57
124 IFRS salient features
125 Financials133138 Reconciliation140 Barclays separation
143 Risk management overview155 Capital management
161 Share performance162 Shareholder information and diary163 Glossary170 Abbreviations and acronyms172 Contact information
17. Implementation of IFRS 16 Leases (continued)
at 1 January 2020:
31 December 2018
Impact of initial adoption of
IFRS 161 January
2019Rm Rm Rm
AssetsProperty and equipment 15 835 3 390 19 225Other assets 30 642 (9) 30 633Deferred tax assets 3 431 88 3 519Total assets 1 288 744 3 469 1 292 213
LiabilitiesOther liabilities1 36 662 3 728 40 390Deferred tax liabilities 360 (3) 357Total liabilities 1 167 138 3 725 1 170 863
EquityCapital and reservesRetained earnings 91 237 (243) 90 994Non-controlling interest – ordinary shares 4 737 (13) 4 724Total equity 121 606 (256) 121 350
Total liabilities and equity 1 288 744 3 469 1 292 213
17.3 The table below reconciles the previously disclosed operating lease commitments to the lease liabilities recognised on 1 January 2019:
Rm
Operating lease commitments at 31 December 2018 6 020Discounted using the incremental borrowing rate at 1 January 2019 (1 502)
Finance lease liabilities recognised 4 518Reconciling itemsPreviously disclosed commitments subject to recognition exemption (375)
Lease liabilities recognised at 1 January 2019 4 143
The weighted average incremental borrowing rate applied to discount the lease liabilities at the date of initial application was 9.5%. The weighted average incremental rate was determined as at 1 January 2019 and took into account incremental borrowing rates in South Africa (circa. 9%) and the other countries where the Group operates (between 5% and 23%).
1 Includes an amount of R4 143m relating to the IFRS 16 lease liability, which is offset by the release of the IAS 17 straight lining lease liability of R415m.
Performance indicators and condensed normalised notes to the consolidated
for the reporting period ended 31 December
58 Absa Group Limited Financial results for the reporting period ended 31 December 2019
3 Normalised Group performance59 Segment performance
123 Group IFRS performance
142 Risk management
160 Appendices
4 Overview8 Normalised salient features9 Normalised salient features by segment
1014 Basis of presentation15 Dividend announcement16
60 WIMI segment change61 Overview64 Per market segment66 Per geographical segment
68 RBB South Africa90 CIB
106 Absa Regional Operations122
18. Standards issued not yet effectiveIFRS 17 – Insurance contractsIFRS 17 Insurance Contracts establishes principles for the recognition, measurement, presentation and disclosure of insurance contracts issued. It also requires similar principles for reinsurance contracts held and issued investment contracts with discretionary participation features.
in-force insurance business.
recommendation on the effective date of IFRS 17, and the recommendation to extend the temporary exemption from applying IFRS 9, during its meeting in the week of 16 March 2020.
During 2018, the Group’s joint insurance programme focused on interpreting the requirements of the new accounting standard, solution design, model prototyping as well as the commencement of an impact assessment. During 2019, the solution design was approved and development
activities are scheduled for 2020. The programme is on track to commence with end-to-end solution testing in the second half of 2020 in preparation for parallel run activities that are planned to commence in 2021.
Revised Conceptual Framework for Financial Reporting The purpose of the Framework for Financial Reporting (Conceptual Framework) is to assist the IASB in developing standards, to help preparers develop consistent accounting policies if there is no applicable standard in place, and to assist all parties to understand and interpret the standards. The Conceptual Framework issued in March 2018 is effective immediately for the IASB and the IFRS Interpretations Committee. For companies that use the Conceptual Framework to develop accounting policies when no IFRS Standard applies to a particular transaction, the
Amendments to IFRS 9, IAS 39 and IFRS 7 Interest Rate Benchmark Reform (IBOR)
related to uncertainties arising in the period leading up to the replacement of IBORs with alternative nearly risk-free rates, and provide reliefs to allow hedge accounting to continue during the period of uncertainty before an IBOR is replaced. The amendments are mandatory for all hedge relationships directly affected by interest rate benchmark reform, and are required to be applied on a retrospective basis.
124 IFRS salient features
125 Financials133138 Reconciliation140 Barclays separation
143 Risk management overview155 Capital management
161 Share performance162 Shareholder information and diary163 Glossary170 Abbreviations and acronyms172 Contact information
Segment performance
WIMI (as previously disclosed) segment change 60Segment performance overview 61Segment report per market segment 64Segment report per geographical segment 66RBB South Africa 68CIB 90Absa Regional Operations 106
122
Absa Group Limited Financial results for the reporting period ended 31 December 2019 59
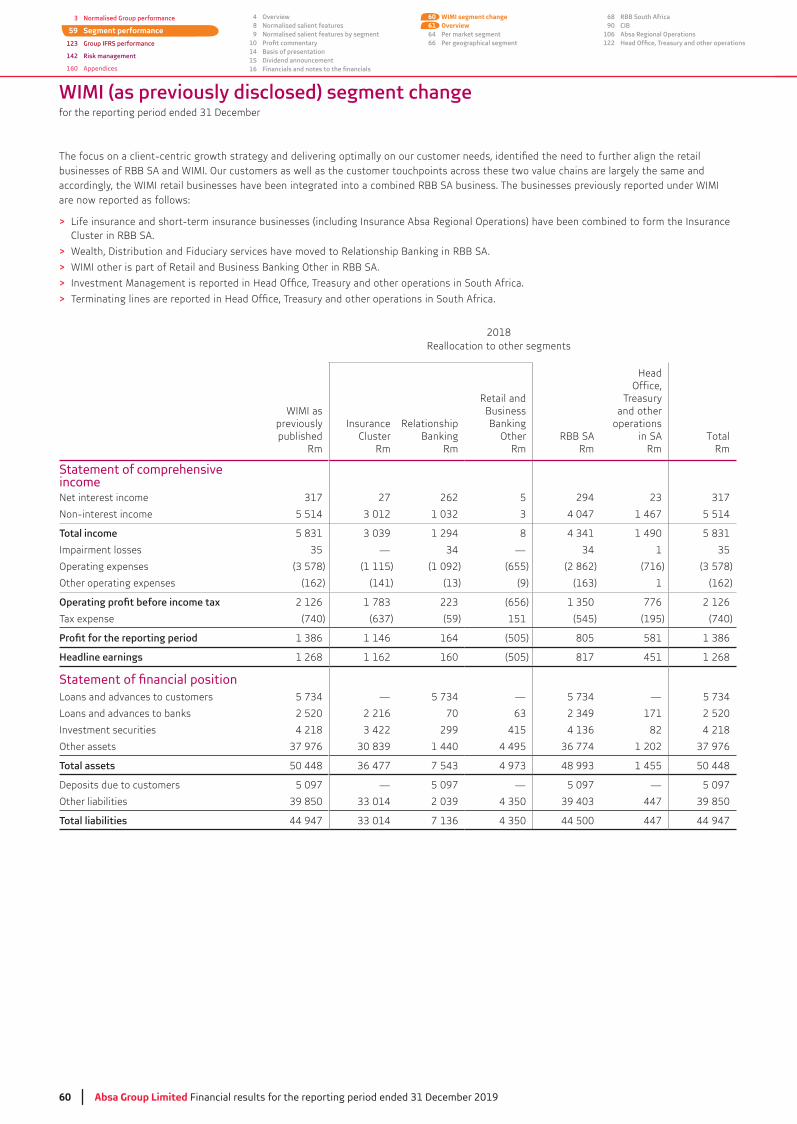
60 Absa Group Limited Financial results for the reporting period ended 31 December 2019
3 Normalised Group performance
59 Segment performance
123 Group IFRS performance
142 Risk management
160 Appendices
4 Overview8 Normalised salient features9 Normalised salient features by segment
1014 Basis of presentation15 Dividend announcement16
60 WIMI segment change61 Overview64 Per market segment66 Per geographical segment
68 RBB South Africa90 CIB
106 Absa Regional Operations122
WIMI (as previously disclosed) segment change
businesses of RBB SA and WIMI. Our customers as well as the customer touchpoints across these two value chains are largely the same and accordingly, the WIMI retail businesses have been integrated into a combined RBB SA business. The businesses previously reported under WIMI are now reported as follows:
> Life insurance and short-term insurance businesses (including Insurance Absa Regional Operations) have been combined to form the Insurance Cluster in RBB SA.
> Wealth, Distribution and Fiduciary services have moved to Relationship Banking in RBB SA.
> WIMI other is part of Retail and Business Banking Other in RBB SA.
>
>
2018Reallocation to other segments
WIMI as previously published
Rm
Insurance Cluster
Rm
Relationship Banking
Rm
Retail and Business Banking
OtherRm
RBB SARm
Head Office,
Treasury and other
operations in SA
RmTotal
Rm
Statement of comprehensive income Net interest income 27 262 5 294
Non-interest income 5 514 4 047 1 467 5 514
1 294 8 1 490
Impairment losses — — 1
Operating expenses (1 115) (1 092) (655) (2 862) (716)
Other operating expenses (162) (141) (9) 1 (162)
2 126 (656) 776 2 126
Tax expense (740) (59) 151 (545) (195) (740)
1 146 164 (505) 805 581
Headline earnings 1 268 1 162 160 (505) 817 451 1 268
Loans and advances to customers — — —
Loans and advances to banks 2 520 2 216 70 171 2 520
Investment securities 4 218 299 415 82 4 218
Other assets 1 440 4 495 1 202
50 448 1 455 50 448
Deposits due to customers 5 097 — 5 097 — 5 097 — 5 097
Other liabilities 447
44 947 44 500 447 44 947
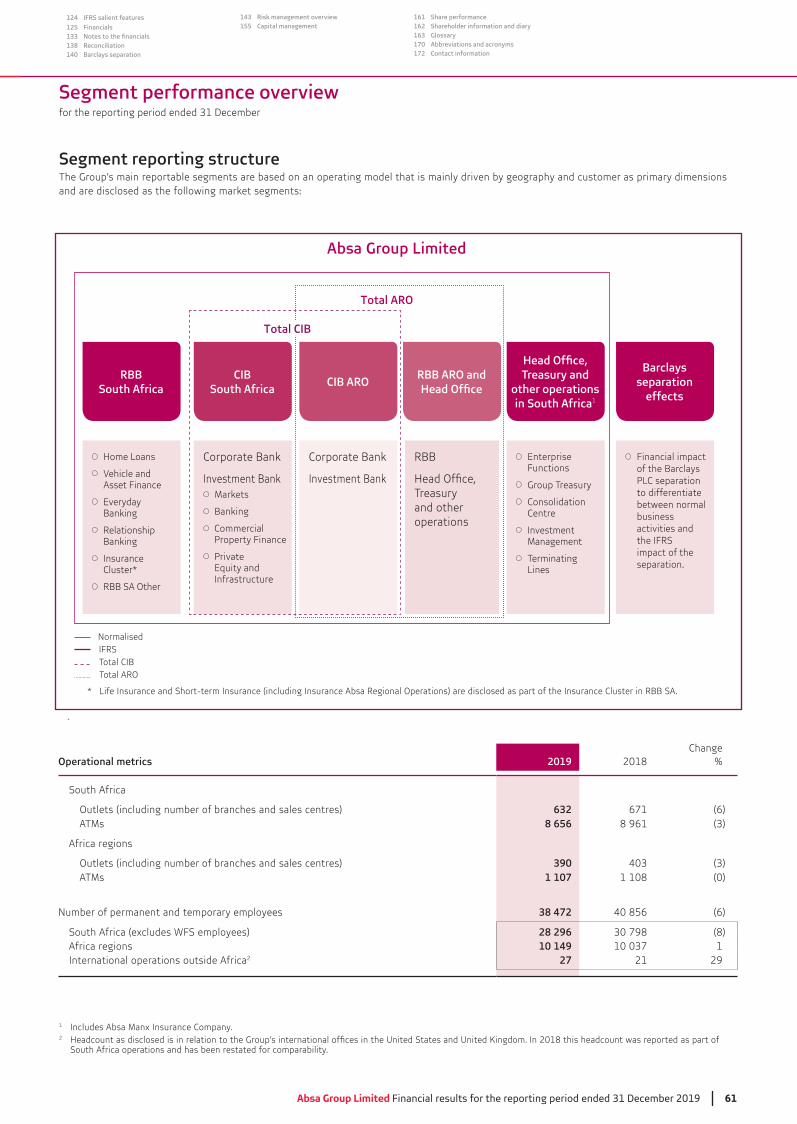
Absa Group Limited Financial results for the reporting period ended 31 December 2019 61
124 IFRS salient features
125 Financials133138 Reconciliation140 Barclays separation
143 Risk management overview155 Capital management
161 Share performance162 Shareholder information and diary163 Glossary170 Abbreviations and acronyms172 Contact information
RBB South Africa
CIB South Africa
CIB ARORBB ARO and
other operations 1
Barclays separation
effects
Home Loans
Vehicle and Asset Finance
Everyday Banking
Relationship Banking
Insurance Cluster*
RBB SA Other
Corporate Bank
Investment Bank Markets
Banking
Commercial
Equity and Infrastructure
Corporate Bank
Investment Bank
RBB
Treasury and other operations
Enterprise Functions
Group Treasury
Consolidation Centre
Investment Management
Terminating Lines
Financial impact of the Barclays
to differentiate between normal business activities and the IFRS impact of the separation.
Segment performance overview
1 Includes Absa Manx Insurance Company.2
South Africa operations and has been restated for comparability.
Segment reporting structureThe Group’s main reportable segments are based on an operating model that is mainly driven by geography and customer as primary dimensions and are disclosed as the following market segments:
ChangeOperational metrics 2019 2018 %
South Africa
Outlets (including number of branches and sales centres) 632 671 (6) ATMs 8 656 8 961
Africa regions
Outlets (including number of branches and sales centres) 390 ATMs 1 107 1 108 (0)
Number of permanent and temporary employees 38 472 40 856 (6)
South Africa (excludes WFS employees) 28 296 (8) Africa regions 10 149 1 International operations outside Africa2 27 21 29
Normalised IFRS Total CIB Total ARO
* Life Insurance and Short-term Insurance (including Insurance Absa Regional Operations) are disclosed as part of the Insurance Cluster in RBB SA.
Absa Group Limited
ARO
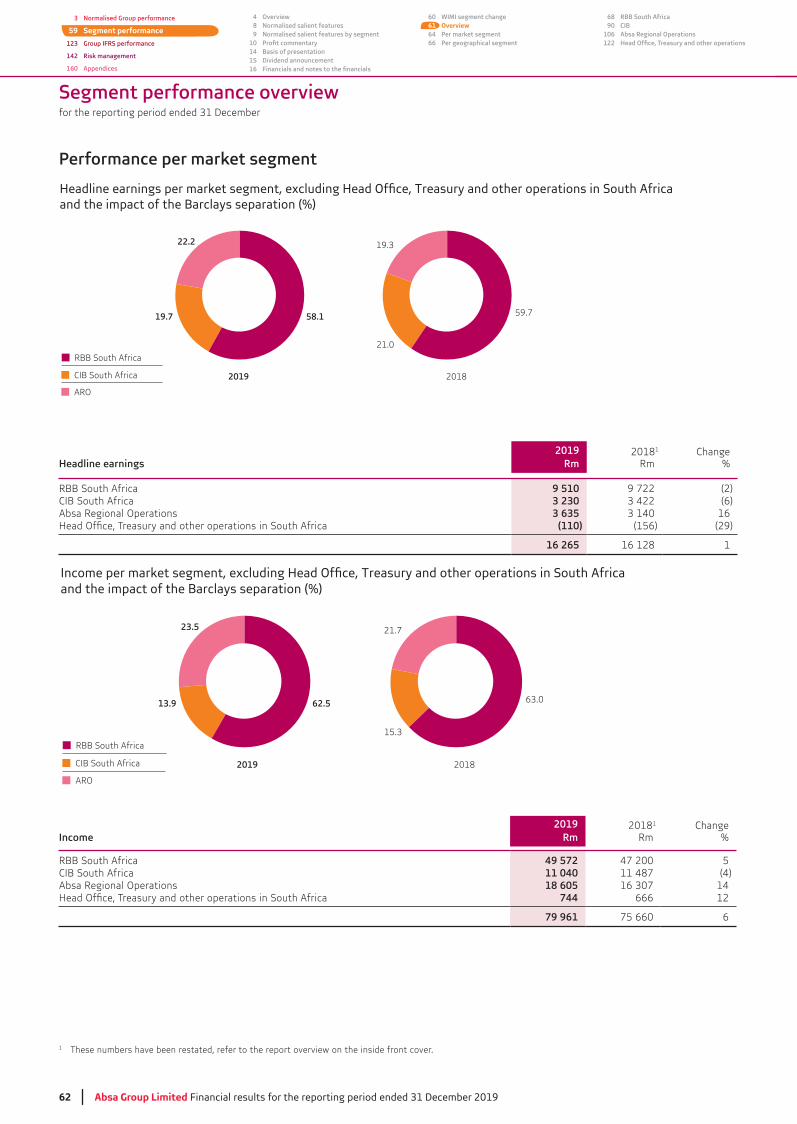
62 Absa Group Limited Financial results for the reporting period ended 31 December 2019
Segment performance overview
Performance per market segment
Headline earnings2019
Rm20181
RmChange
%
RBB South Africa 9 510 9 722 (2)CIB South Africa 3 230 (6)Absa Regional Operations 3 635 16
(110) (156) (29)
16 265 16 128 1
2019
Income per market segment, excluding Head Office, Treasury and other operations in South Africa and the impact of the Barclays separation (%)
CIB South Africa
ARO
RBB South Africa
2018
21.7
15.3
62.5 63.013.9
23.5
Income2019
Rm20181
RmChange
%
RBB South Africa 49 572 47 200 5CIB South Africa 11 040 11 487 (4)Absa Regional Operations 18 605 14
744 666 12
79 961 75 660 6
1 These numbers have been restated, refer to the report overview on the inside front cover.
2019
Headline earnings per market segment, excluding Head Office, Treasury and other operations in South Africa and the impact of the Barclays separation (%)
CIB South Africa
ARO
RBB South Africa
2018
19.3
21.0
58.1 59.719.7
22.2
3 Normalised Group performance
59 Segment performance
123 Group IFRS performance
142 Risk management
160 Appendices
4 Overview8 Normalised salient features9 Normalised salient features by segment
1014 Basis of presentation15 Dividend announcement16
60 WIMI segment change61 Overview64 Per market segment66 Per geographical segment
68 RBB South Africa90 CIB
106 Absa Regional Operations122

Absa Group Limited Financial results for the reporting period ended 31 December 2019 63
124 IFRS salient features
125 Financials133138 Reconciliation140 Barclays separation
143 Risk management overview155 Capital management
161 Share performance162 Shareholder information and diary163 Glossary170 Abbreviations and acronyms172 Contact information
This page has been left blank intentionally
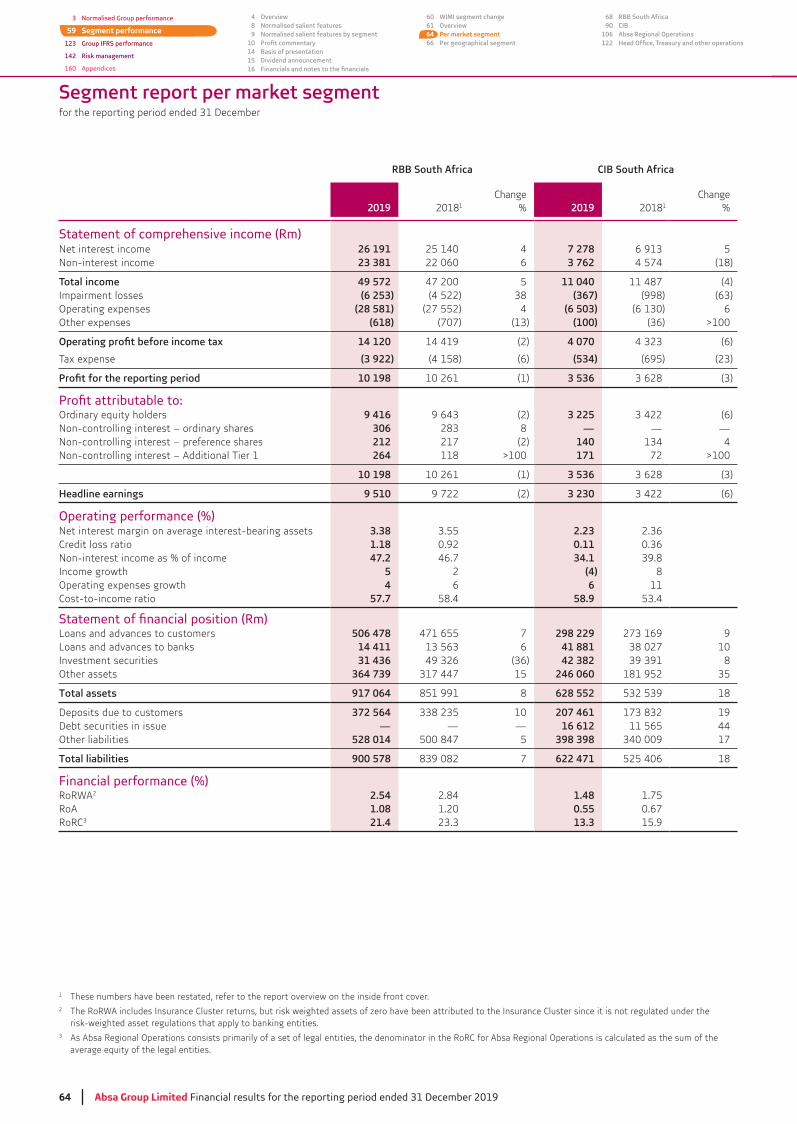
64 Absa Group Limited Financial results for the reporting period ended 31 December 2019
Segment report per market segment
1 These numbers have been restated, refer to the report overview on the inside front cover.2 The RoRWA includes Insurance Cluster returns, but risk weighted assets of zero have been attributed to the Insurance Cluster since it is not regulated under the
risk-weighted asset regulations that apply to banking entities.
As Absa Regional Operations consists primarily of a set of legal entities, the denominator in the RoRC for Absa Regional Operations is calculated as the sum of the average equity of the legal entities.
RBB South Africa CIB South Africa
2019 20181
Change% 2019 20181
Change%
Statement of comprehensive income (Rm)Net interest income 26 191 25 140 4 7 278 5Non-interest income 23 381 22 060 6 3 762 4 574 (18)
49 572 47 200 5 11 040 11 487 (4)Impairment losses (6 253) (4 522) (367) (998)Operating expenses (28 581) (27 552) 4 (6 503) 6Other expenses (618) (707) (100) >100
14 120 14 419 (2) 4 070 (6)
Tax expense (3 922) (4 158) (6) (534) (695)
10 198 10 261 (1) 3 536
Ordinary equity holders 9 416 (2) 3 225 (6)Non-controlling interest – ordinary shares 306 8 — — —Non-controlling interest – preference shares 212 217 (2) 140 4Non-controlling interest – Additional Tier 1 264 118 >100 171 72 >100
10 198 10 261 (1) 3 536
Headline earnings 9 510 9 722 (2) 3 230 (6)
Operating performance (%) Net interest margin on average interest-bearing assets 3.38 2.23Credit loss ratio 1.18 0.92 0.11Non-interest income as % of income 47.2 46.7 34.1Income growth 5 2 (4) 8Operating expenses growth 4 6 6 11Cost-to-income ratio 57.7 58.4 58.9
Loans and advances to customers 506 478 471 655 7 298 229 9Loans and advances to banks 14 411 6 41 881 10Investment securities 31 436 42 382 8Other assets 364 739 15 246 060 181 952
917 064 851 991 8 628 552 18
Deposits due to customers 372 564 10 207 461 19Debt securities in issue — — — 16 612 11 565 44Other liabilities 528 014 500 847 5 398 398 17
900 578 7 622 471 525 406 18
Financial performance (%)RoRWA2 2.54 2.84 1.48 1.75RoA 1.08 1.20 0.55 0.67RoRC 21.4 13.3 15.9
3 Normalised Group performance
59 Segment performance
123 Group IFRS performance
142 Risk management
160 Appendices
4 Overview8 Normalised salient features9 Normalised salient features by segment
1014 Basis of presentation15 Dividend announcement16
60 WIMI segment change61 Overview64 Per market segment66 Per geographical segment
68 RBB South Africa90 CIB
106 Absa Regional Operations122
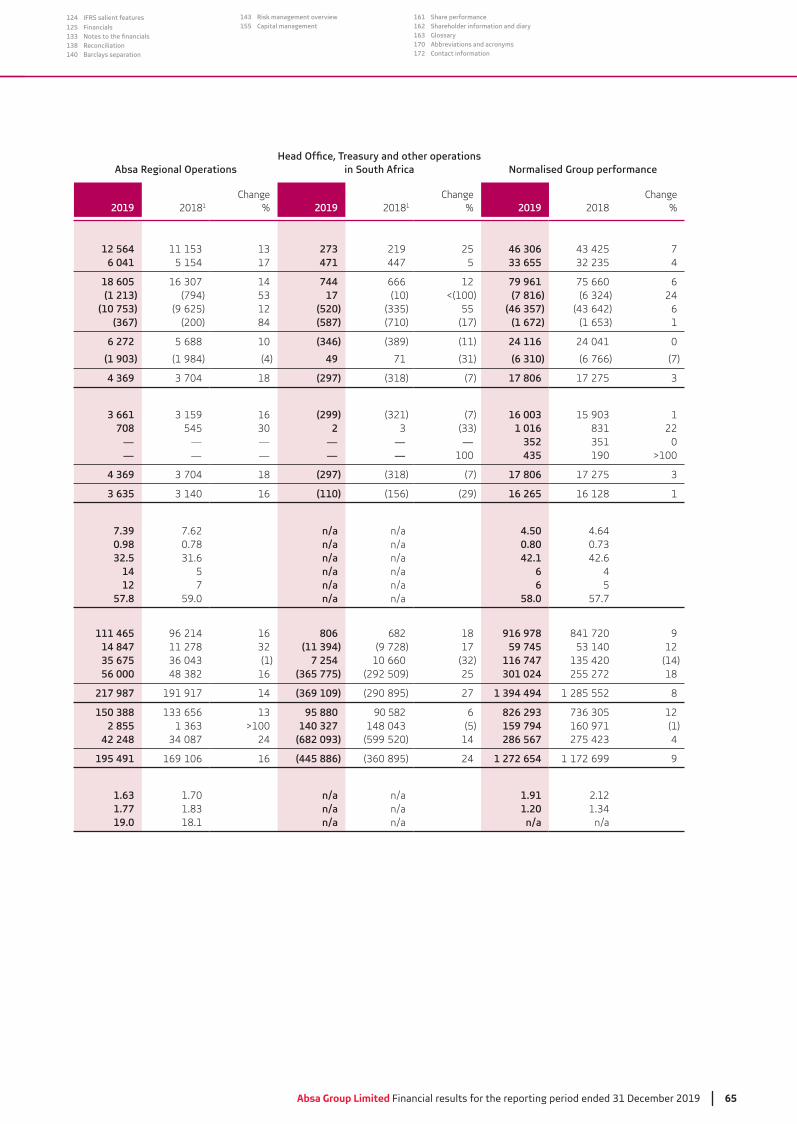
Absa Group Limited Financial results for the reporting period ended 31 December 2019 65
124 IFRS salient features
125 Financials133138 Reconciliation140 Barclays separation
143 Risk management overview155 Capital management
161 Share performance162 Shareholder information and diary163 Glossary170 Abbreviations and acronyms172 Contact information
Absa Regional Operations in South Africa Normalised Group performance
2019 20181
Change% 2019 20181
Change% 2019 2018
Change%
12 564 273 219 25 46 306 76 041 5 154 17 471 447 5 33 655 4
18 605 14 744 666 12 79 961 75 660 6(1 213) (794) 17 (10) <(100) (7 816) 24
(10 753) (9 625) 12 (520) 55 (46 357) 6(367) (200) 84 (587) (710) (17) (1 672) 1
6 272 5 688 10 (346) (11) 24 116 24 041 0
(1 903) (1 984) (4) 49 71 (6 310) (6 766) (7)
4 369 18 (297) (7) 17 806 17 275
3 661 16 (299) (7) 16 003 1708 545 2 1 016 22
— — — — — — 352 0— — — — — 100 435 190 >100
4 369 18 (297) (7) 17 806 17 275
3 635 16 (110) (156) (29) 16 265 16 128 1
7.39 7.62 n/a n/a 4.50 4.640.98 0.78 n/a n/a 0.8032.5 n/a n/a 42.1 42.6
14 5 n/a n/a 6 412 7 n/a n/a 6 5
57.8 59.0 n/a n/a 58.0 57.7
111 465 96 214 16 806 682 18 916 978 841 720 914 847 11 278 (11 394) (9 728) 17 59 745 1235 675 (1) 7 254 10 660 116 747 (14)56 000 16 (365 775) (292 509) 25 301 024 255 272 18
217 987 191 917 14 (369 109) (290 895) 27 1 394 494 1 285 552 8
150 388 95 880 90 582 6 826 293 122 855 >100 140 327 (5) 159 794 160 971 (1)
42 248 24 (682 093) (599 520) 14 286 567 4
195 491 169 106 16 (445 886) 24 1 272 654 1 172 699 9
1.63 1.70 n/a n/a 1.91 2.121.77 n/a n/a 1.2019.0 18.1 n/a n/a n/a n/a
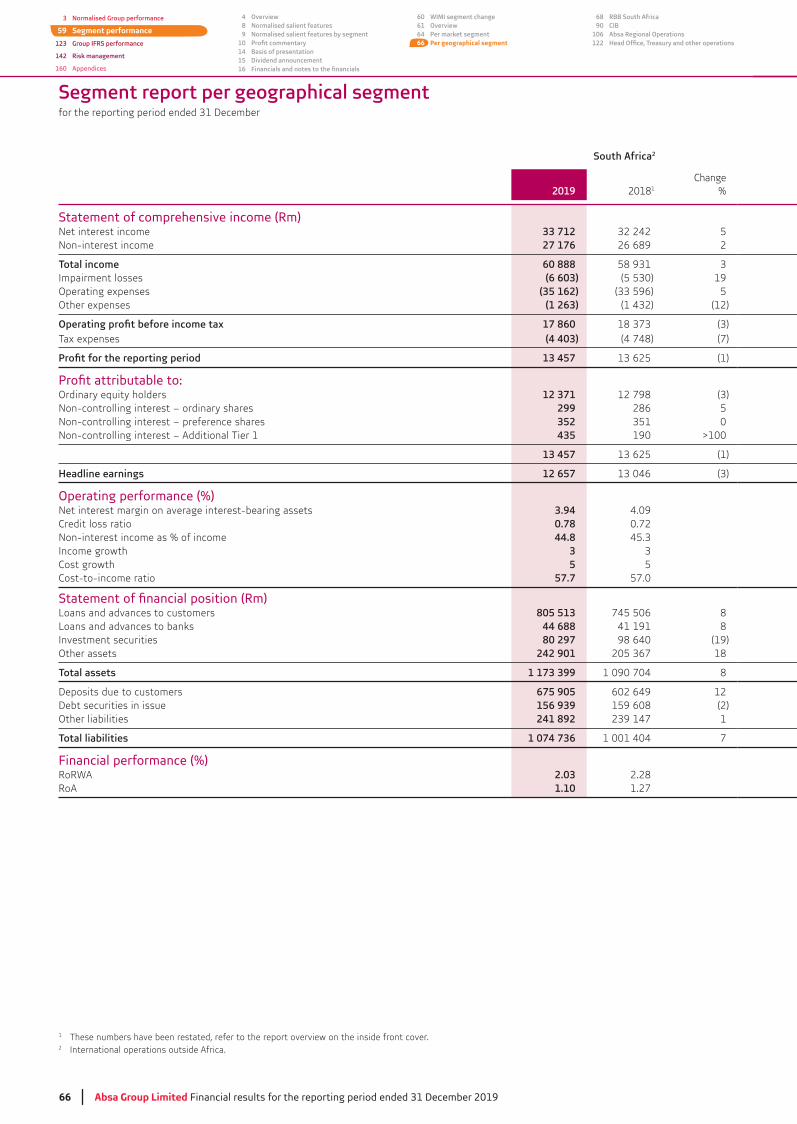
66 Absa Group Limited Financial results for the reporting period ended 31 December 2019
Segment report per geographical segment
1 These numbers have been restated, refer to the report overview on the inside front cover.2 International operations outside Africa.
South Africa2
2019 20181
Change%
Statement of comprehensive income (Rm)Net interest income 33 712 5Non-interest income 27 176 26 689 2
60 888Impairment losses (6 603) 19Operating expenses (35 162) 5Other expenses (1 263) (12)
17 860Tax expenses (4 403) (4 748) (7)
13 457 (1)
Ordinary equity holders 12 371 12 798Non-controlling interest – ordinary shares 299 286 5Non-controlling interest – preference shares 352 0Non-controlling interest – Additional Tier 1 435 190 >100
13 457 (1)
Headline earnings 12 657
Operating performance (%) Net interest margin on average interest-bearing assets 3.94 4.09Credit loss ratio 0.78 0.72Non-interest income as % of income 44.8Income growth 3Cost growth 5 5Cost-to-income ratio 57.7 57.0
Loans and advances to customers 805 513 745 506 8Loans and advances to banks 44 688 41 191 8Investment securities 80 297 98 640 (19)Other assets 242 901 18
1 173 399 1 090 704 8
Deposits due to customers 675 905 602 649 12Debt securities in issue 156 939 159 608 (2)Other liabilities 241 892 1
1 074 736 1 001 404 7
Financial performance (%)RoRWA 2.03 2.28RoA 1.10 1.27
3 Normalised Group performance
59 Segment performance
123 Group IFRS performance
142 Risk management
160 Appendices
4 Overview8 Normalised salient features9 Normalised salient features by segment
1014 Basis of presentation15 Dividend announcement16
60 WIMI segment change61 Overview64 Per market segment66 Per geographical segment
68 RBB South Africa90 CIB
106 Absa Regional Operations122
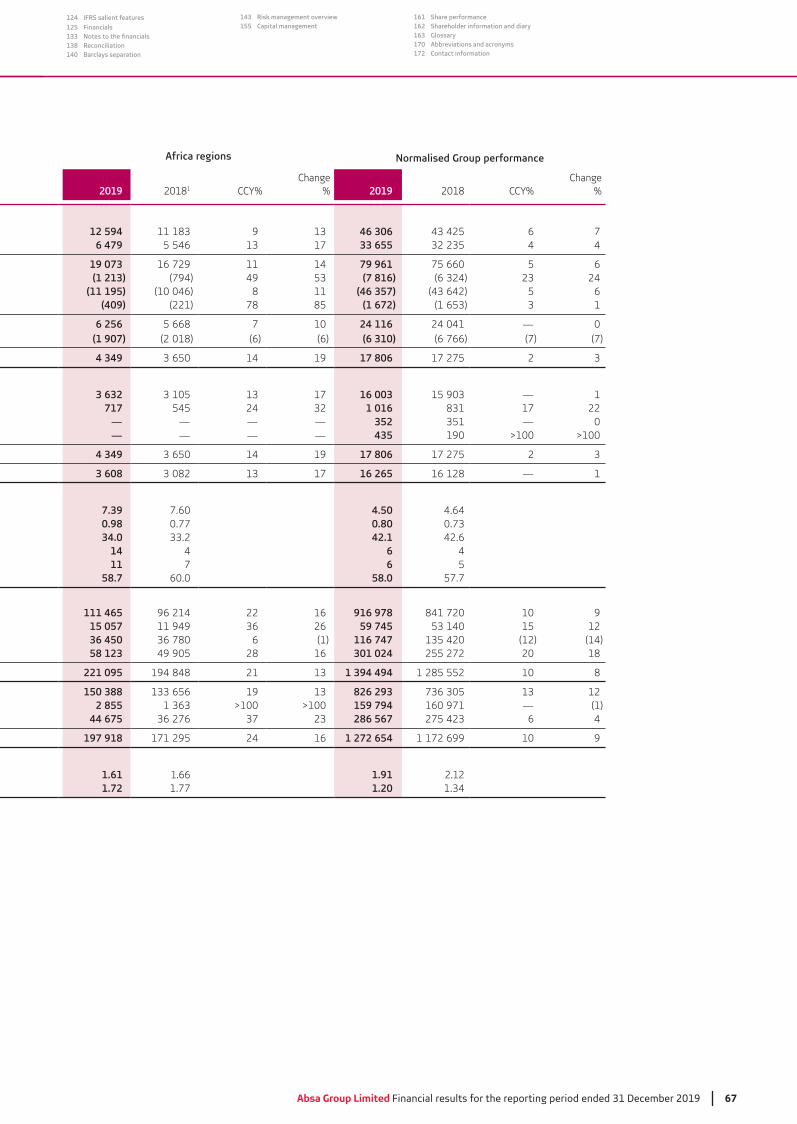
Absa Group Limited Financial results for the reporting period ended 31 December 2019 67
124 IFRS salient features
125 Financials133138 Reconciliation140 Barclays separation
143 Risk management overview155 Capital management
161 Share performance162 Shareholder information and diary163 Glossary170 Abbreviations and acronyms172 Contact information
Africa regions Normalised Group performance
2019 20181 CCY%Change
% 2019 2018 CCY%Change
%
12 594 9 46 306 6 76 479 5 546 17 33 655 4 4
19 073 16 729 11 14 79 961 75 660 5 6(1 213) (794) 49 (7 816) 24
(11 195) (10 046) 8 11 (46 357) 5 6(409) (221) 78 85 (1 672) 1
6 256 5 668 7 10 24 116 24 041 — 0(1 907) (2 018) (6) (6) (6 310) (6 766) (7) (7)
4 349 14 19 17 806 17 275 2
3 632 17 16 003 — 1717 545 24 1 016 17 22
— — — — 352 — 0— — — — 435 190 >100 >100
4 349 14 19 17 806 17 275 2
3 608 17 16 265 16 128 — 1
7.39 7.60 4.50 4.640.98 0.77 0.8034.0 42.1 42.6
14 4 6 411 7 6 5
58.7 60.0 58.0 57.7
111 465 96 214 22 16 916 978 841 720 10 915 057 11 949 26 59 745 15 1236 450 6 (1) 116 747 (12) (14)58 123 49 905 28 16 301 024 255 272 20 18
221 095 194 848 21 1 394 494 1 285 552 10 8
150 388 19 826 293 122 855 >100 >100 159 794 160 971 — (1)
44 675 286 567 6 4
197 918 171 295 24 16 1 272 654 1 172 699 10 9
1.61 1.66 1.91 2.121.72 1.77 1.20
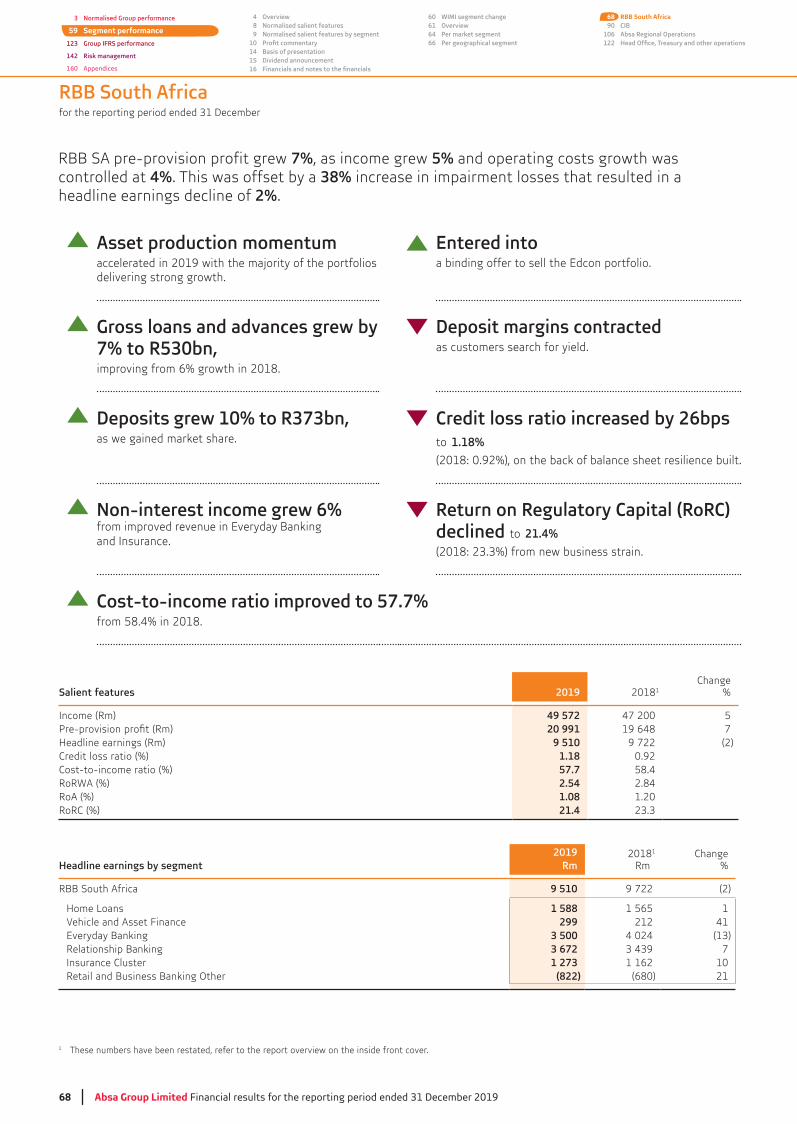
68 Absa Group Limited Financial results for the reporting period ended 31 December 2019
3 Normalised Group performance
59 Segment performance
123 Group IFRS performance
142 Risk management
160 Appendices
4 Overview8 Normalised salient features9 Normalised salient features by segment
1014 Basis of presentation15 Dividend announcement16
60 WIMI segment change61 Overview64 Per market segment66 Per geographical segment
68 RBB South Africa90 CIB
106 Absa Regional Operations122
Salient features 2019 20181Change
%
Income (Rm) 49 572 47 200 520 991 19 648 7
Headline earnings (Rm) 9 510 9 722 (2)Credit loss ratio (%) 1.18 0.92Cost-to-income ratio (%) 57.7 58.4RoRWA (%) 2.54 2.84RoA (%) 1.08 1.20RoRC (%) 21.4
Headline earnings by segment2019
Rm20181
RmChange
%
RBB South Africa 9 510 9 722 (2)
Home Loans 1 588 1 565 1Vehicle and Asset Finance 299 212 41Everyday Banking 3 500 4 024Relationship Banking 3 672 7Insurance Cluster 1 273 1 162 10Retail and Business Banking Other (822) (680) 21
RBB SA pre-provision profit grew 7%, as income grew 5% and operating costs growth was controlled at 4%. This was offset by a 38% increase in impairment losses that resulted in a headline earnings decline of 2%.
1 These numbers have been restated, refer to the report overview on the inside front cover.
RBB South Africa
Asset production momentumaccelerated in 2019 with the majority of the portfolios delivering strong growth.
Entered into a binding offer to sell the Edcon portfolio.
Gross loans and advances grew by
improving from 6% growth in 2018.
Deposit margins contracted as customers search for yield.
as we gained market share.
Credit loss ratio increased by 26bps to 1.18% (2018: 0.92%), on the back of balance sheet resilience built.
Non-interest income grew 6%from improved revenue in Everyday Banking and Insurance.
Return on Regulatory Capital (RoRC) declined to 21.4%
Cost-to-income ratio improved to 57.7% from 58.4% in 2018.

Absa Group Limited Financial results for the reporting period ended 31 December 2019 69
124 IFRS salient features
125 Financials133138 Reconciliation140 Barclays separation
143 Risk management overview155 Capital management
161 Share performance162 Shareholder information and diary163 Glossary170 Abbreviations and acronyms172 Contact information
RBB South Africa
1 Source: SARB BA900.
Customer numbers (millions and % change)
Physical footprint(number and change %)
Digital footprint (#’000 and change %)
2019
The number of registered AbsaBanking App users continued to grow
Physical footprint reduced butcontinued to maintain optimal scale
Branches ATMs
671
8 961
1 2038 656
632
1 479
2018 20182019
9.6 9.7
(6%) (3%)1% 23%
Retail Deposits market share (%)1
Retail Banking Advancesmarket share (%)1
2018
Retail and Business Banking Penetration rate (average number)
20192019 2021TargetMarketShare
20182017
21.222.021.9
21.6
2019 2021TargetMarketShare
20182017
21.5
23.0
2.29
21.3
2.31
21.2
Average number of products percustomer increased marginally

70 Absa Group Limited Financial results for the reporting period ended 31 December 2019
RBB South Africa
RBB offers a comprehensive suite of banking and insurance products and services to individual, enterprise and commercial customers. It caters for
providing a consistently superior experience across each of the channels, matched closely to the needs and expectations of each customer
bankers as well as dealerships, originators, alliances and joint ventures.
Key business areas Home Loans –
channels, and intermediaries such as estate agents and mortgage originators.
Vehicle and Asset Finance (VAF) – offers funding solutions for passenger and light commercial vehicles to individual customers through
strategic intent of establishing and harnessing relationships with dealers and customers.
Everyday Banking – offers day-to-day banking services to the retail customer and includes:
o Card – offers credit cards via a mix of Absa-branded and co-branded offerings, including British Airways, Avios and Virgin Money. Included in this portfolio are partnerships with Woolworths Financial Services, which offers in-store cards, credit cards, personal loans and short-term insurance products and Edcon, which offers in-store cards.
o Personal Loans – offers unsecured instalment loans through face-to-face engagements and digital channels.
o – offers a full range of transactional banking, savings and investment products, a rewards programme and services through a variety of channels. These include the branch and self-service terminal network, digital channels as well as through a third-party retailer.
Relationship Banking – consists of the business units and associated products where a named relationship exists and was formed to provide customers with a single ‘warm-body’ relationship manager rather than multiple touchpoints with the Group. The businesses consolidated into Relationship Banking include Card Acquiring, Commercial Asset Finance (CAF), Business Banking (including associated lending, transactional and
Relationship Banking also includes an Equity portfolio, which is being reduced in an orderly manner.
Insurance Cluster (Life Insurance and Short-term Insurance, including Insurance Absa Regional Operations, are disclosed as the Insurance Cluster in RBB South Africa):
o Life Insurance – offers life insurance, covering death, disability and retrenchment, as well as funeral and life wrapped investment products.
o Short-term Insurance – provides short-term insurance solutions to the retail and commercial market segments. A direct-to-client short-term solution, Absa idirect, is also available to the retail market.
Retail and Business Banking Other – includes investment spend, cost associated with the restructure, holding companies and related consolidation entries and allocated shareholder overhead expenses.
o Customer Value Management (not reported separately) – supports the businesses to provide a singular view of the customer across RBB SA while ensuring alignment of the customer value propositions and a consistent voice in the market.
3 Normalised Group performance
59 Segment performance
123 Group IFRS performance
142 Risk management
160 Appendices
4 Overview8 Normalised salient features9 Normalised salient features by segment
1014 Basis of presentation15 Dividend announcement16
60 WIMI segment change61 Overview64 Per market segment66 Per geographical segment
68 RBB South Africa90 CIB
106 Absa Regional Operations122
Absa Group Limited Financial results for the reporting period ended 31 December 2019 71
124 IFRS salient features
125 Financials133138 Reconciliation140 Barclays separation
143 Risk management overview155 Capital management
161 Share performance162 Shareholder information and diary163 Glossary170 Abbreviations and acronyms172 Contact information
This page has been left blank intentionally
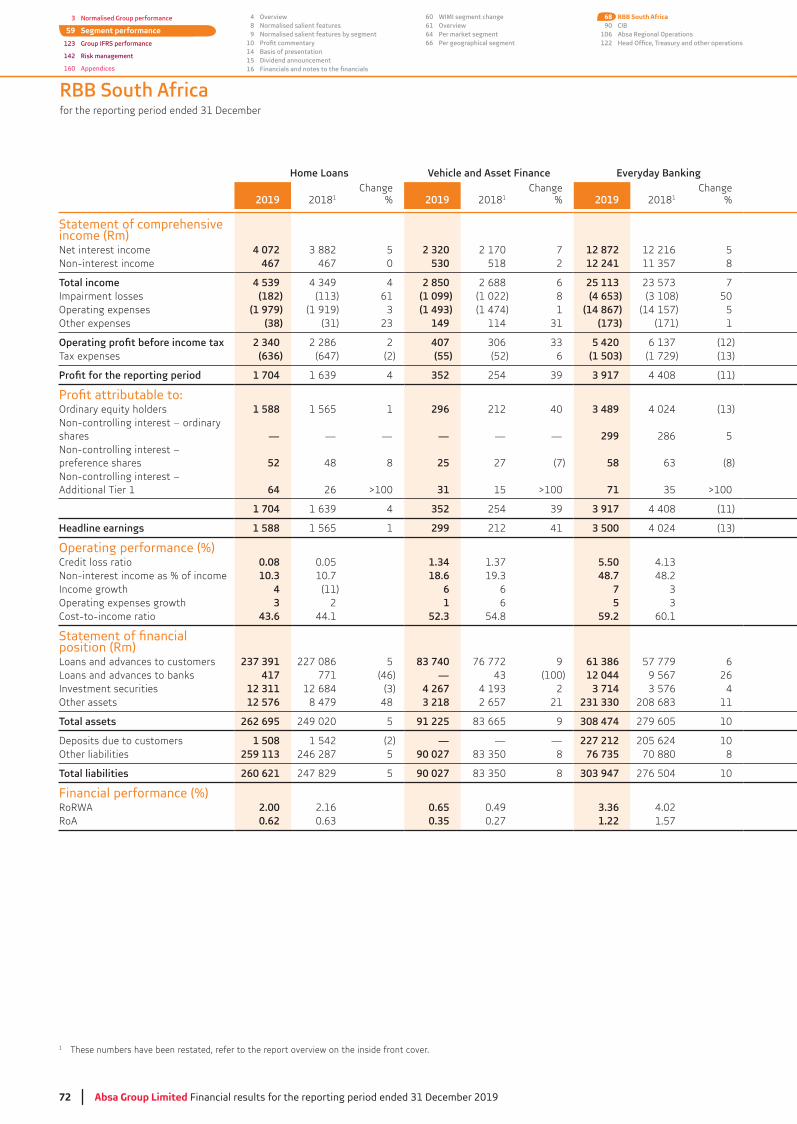
72 Absa Group Limited Financial results for the reporting period ended 31 December 2019
RBB South Africa
Home Loans Vehicle and Asset Finance Everyday Banking
2019 20181Change
% 2019 20181Change
% 2019 20181Change
%
Statement of comprehensive income (Rm)Net interest income 4 072 5 2 320 2 170 7 12 872 12 216 5Non-interest income 467 467 0 530 518 2 12 241 8
4 539 4 2 850 2 688 6 25 113 7Impairment losses (182) 61 (1 099) (1 022) 8 (4 653) 50Operating expenses (1 979) (1 919) (1 493) (1 474) 1 (14 867) (14 157) 5Other expenses (38) 149 114 (173) (171) 1
2 340 2 286 2 407 5 420 (12)Tax expenses (636) (647) (2) (55) (52) 6 (1 503) (1 729)
1 704 4 352 254 3 917 4 408 (11)
Ordinary equity holders 1 588 1 565 1 296 212 40 3 489 4 024Non-controlling interest – ordinary shares — — — — — — 299 286 5Non-controlling interest – preference shares 52 48 8 25 27 (7) 58 (8)Non-controlling interest – Additional Tier 1 64 26 >100 31 15 >100 71 >100
1 704 4 352 254 3 917 4 408 (11)
Headline earnings 1 588 1 565 1 299 212 41 3 500 4 024
Operating performance (%) Credit loss ratio 0.08 0.05 1.34 5.50Non-interest income as % of income 10.3 10.7 18.6 48.7 48.2Income growth 4 (11) 6 6 7Operating expenses growth 3 2 1 6 5Cost-to-income ratio 43.6 44.1 52.3 54.8 59.2 60.1
position (Rm)Loans and advances to customers 237 391 227 086 5 83 740 76 772 9 61 386 57 779 6Loans and advances to banks 417 771 (46) — (100) 12 044 9 567 26Investment securities 12 311 12 684 4 267 2 3 714 4Other assets 12 576 8 479 48 3 218 2 657 21 231 330 11
262 695 249 020 5 91 225 9 308 474 279 605 10
Deposits due to customers 1 508 1 542 (2) — — — 227 212 205 624 10Other liabilities 259 113 246 287 5 90 027 8 76 735 70 880 8
260 621 247 829 5 90 027 8 303 947 276 504 10
Financial performance (%)RoRWA 2.00 2.16 0.65 0.49 3.36 4.02RoA 0.62 0.35 0.27 1.22 1.57
1 These numbers have been restated, refer to the report overview on the inside front cover.
3 Normalised Group performance
59 Segment performance
123 Group IFRS performance
142 Risk management
160 Appendices
4 Overview8 Normalised salient features9 Normalised salient features by segment
1014 Basis of presentation15 Dividend announcement16
60 WIMI segment change61 Overview64 Per market segment66 Per geographical segment
68 RBB South Africa90 CIB
106 Absa Regional Operations122

Absa Group Limited Financial results for the reporting period ended 31 December 2019 73
124 IFRS salient features
125 Financials133138 Reconciliation140 Barclays separation
143 Risk management overview155 Capital management
161 Share performance162 Shareholder information and diary163 Glossary170 Abbreviations and acronyms172 Contact information
Relationship Banking Insurance ClusterRetail and Business Banking
OtherRetail and Business Banking
South Africa
2019 20181Change
% 2019 20181Change
% 2019 20181Change
% 2019 20181Change
%
7 538 7 245 4 27 27 0 (638) (400) 60 26 191 25 140 46 349 6 155 3 208 7 586 551 6 23 381 22 060 6
13 887 4 3 235 6 (52) 151 <(100) 49 572 47 200 5(322) (277) 16 — — — 3 (2) <(100) (6 253) (4 522)
(8 175) 2 (1 224) (1 115) 10 (843) (884) (5) (28 581) (27 552) 4(85) (126) (134) (141) (5) (337) (4) (618) (707)
5 305 4 994 6 1 877 5 (1 229) (1 087) 14 120 14 419 (2)(1 460) (1 456) (0) (598) (6) 330 (9) (3 922) (4 158) (6)
3 845 9 1 279 1 146 12 (899) (724) 24 10 198 10 261 (1)
3 673 7 1 272 1 149 11 (902) (726) 24 9 416 (2)
— — — 7 <(100) — — — 306 8
76 77 (1) — — — 1 2 (50) 212 217 (2)
96 42 >100 — — — 2 — 100 264 118 >100
3 845 9 1 279 1 146 12 (899) (724) 24 10 198 10 261 (1)
3 672 7 1 273 1 162 10 (822) (680) 21 9 510 9 722 (2)
0.26 0.25 n/a n/a n/a n/a 1.18 0.9245. 7 45.9 n/a n/a n/a n/a 47.2 46.7
4 6 16 n/a n/a 5 22 2 10 8 n/a n/a 4 6
58.9 59.7 37.8 n/a n/a 57.7 58.4
123 960 110 017 — — — 1 1 — 506 478 471 655 7170 (44) 1 326 2 216 (40) 454 665 14 411 6
6 615 (46) 3 460 1 1 069 (92) 31 43668 048 16 32 003 4 17 564 >100 364 739 15
198 793 181 064 10 36 789 1 19 088 22 160 (14) 917 064 851 991 8
143 833 10 — — — 11 12 (8) 372 564 1049 728 45 824 9 33 515 2 18 896 (12) 528 014 500 847 5
193 561 176 881 9 33 515 2 18 907 21 505 (12) 900 578 7
2.82 2.88 n/a n/a n/a n/a 2.54 2.841.91 3.39 n/a n/a 1.08 1.20

74 Absa Group Limited Financial results for the reporting period ended 31 December 2019
RBB South Africa
Business performanceRBB SA continued to execute on its transformation journey, articulated in December 2018, and execution is following a staged approach across the universal product offering. Balance sheet growth was first and foremost in the transformation journey in order to reignite the business in the market, while transactional banking processes and product development were enhanced to leverage the balance sheet growth. In 2019 the implementation of the redesigned operating model, which simplifies the organisational structure as well as enabling efficient decision-making across all business units, was completed. Empowering colleagues by moving decision-making closer to customers resonated across the business and employees adoption to date has been encouraging. Together with the revised operating model and consistent execution of the strategy reflected in the performance trajectory, with progress evident in the key performance metrics across each of the businesses:
Home Loans registrations have increased 24% while the market grew 4.9% (Lightstone);
VAF production increased 11% in a market that declined 2.9% (NAAMSA);
23% with growth in voice and digital channels augmenting strong branch network sales;
Total Card credit limits in issue increased 17% from limits granted to new customers 34% and limit increases on existing customers 69%;
Credit and debit card turnover increased 8% and 7% respectively;
Retail deposits grew 10% while the market grew 9%;
Relationship Banking advances increased 12% mainly in the commercial segment;
Merchant acquiring turnover increased 12%;
Embedded value of new business increased 6% to R734m;
The average number of products per customer improved to 2.31 (2018: 2.29); and
The digitally active customers grew by 9% to 34.5% driven by a 23% increase in the number of App users.
RBB SA’s customer numbers increased by 1% to 9.7m (2018: 9.6m) while primary customers remained stable at 3.1m customers. Leveraging the universal banking product model resulted in improved customer product holding of 2.31 (2018: 2.29).
The improved momentum in asset production levels in 2019 was driven by the alignment of internal processes, improved credit strategies, changes in acquisition channel mix as well as a shift towards digital end-to-end fulfilment. This translated into a 7% growth in gross loans and advances to R530bn (2018: R494bn). Normalising for the disposal of the Edcon book in 2019, advances growth was 9%. Advances market share as per BA900 increased to 21.3% in 2019 (2018: 21.2%).
Deposit growth of 10% reflected faster growth in Savings and Investment products of 15% driven by new product development, which offset slower growth in core transactional deposits, a key focus area in the strategy evolution. This change in product mix and customers continuing to search for yield, compressed deposit margins in the current year.
Credit vintage construct has remained stable and within appetite. While vintages in the unsecured portfolio ended the year within threshold, marginal signs of deterioration during the year were mitigated by revised acquisition strategies and heightened focus on collections.
The credit risk profile improved across the majority of the portfolios primarily driven by proactive credit risk mitigating strategies, the quality of new
exposures reducing by 20bps and 30bps respectively. The expected credit loss allowance increased by 5% to R23.8bn (2018: 22.7bn) driven by
Stage 1 coverage increased to 71bps (2018: 70bps) reflecting the impact of changing book mix from the stronger growth in the unsecured portfolio.
The insurance business generated growth at solid returns for the business. In the Life Insurance business, new business growth in funeral and credit life sales, primarily linked to the bancassurance opportunity, and retention improvements have resulted in growth in the in-force book. The construct of the in-force book has remained stable, without any notable change in the average duration of the book. The soft economic environment resulted in increased mortality and retrenchment claims, however these remain below our reserving assumptions. Growth in the Short-term business was driven by improved sales and retentions in both Homeowner’s insurance and the direct insurance offering. Underwriting margin improved from ongoing portfolio management actions and fewer weather-related events in the year.
The implementation of a multi-year cost transformation plan, which leverages digital capabilities to deliver operating efficiencies and improve 1% and the cost-to-income ratio improving to 57.7% (2018: 58.4%), notwithstanding increased
investment spending to bolster improved customer experience.
The increase in non-controlling interest for Additional Tier 1 Instruments is aligned with increased issuances at Group level.
A decline in returns was largely expected given the growth in loans and advances to customers, although the build of expected credit losses did exacerbate the decline. RoRC of 21.4%
Looking ahead, the focus remains on building a single customer-facing franchise through:
Focused execution of the strategy;
Leveraging the single view of customer created by the integration of the insurance businesses; and
Remaining cognisant of the macro environment.
3 Normalised Group performance
59 Segment performance
123 Group IFRS performance
142 Risk management
160 Appendices
4 Overview8 Normalised salient features9 Normalised salient features by segment
1014 Basis of presentation15 Dividend announcement16
60 WIMI segment change61 Overview64 Per market segment66 Per geographical segment
68 RBB South Africa90 CIB
106 Absa Regional Operations122

Absa Group Limited Financial results for the reporting period ended 31 December 2019 75
124 IFRS salient features
125 Financials133138 Reconciliation140 Barclays separation
143 Risk management overview155 Capital management
161 Share performance162 Shareholder information and diary163 Glossary170 Abbreviations and acronyms172 Contact information
This page has been left blank intentionally
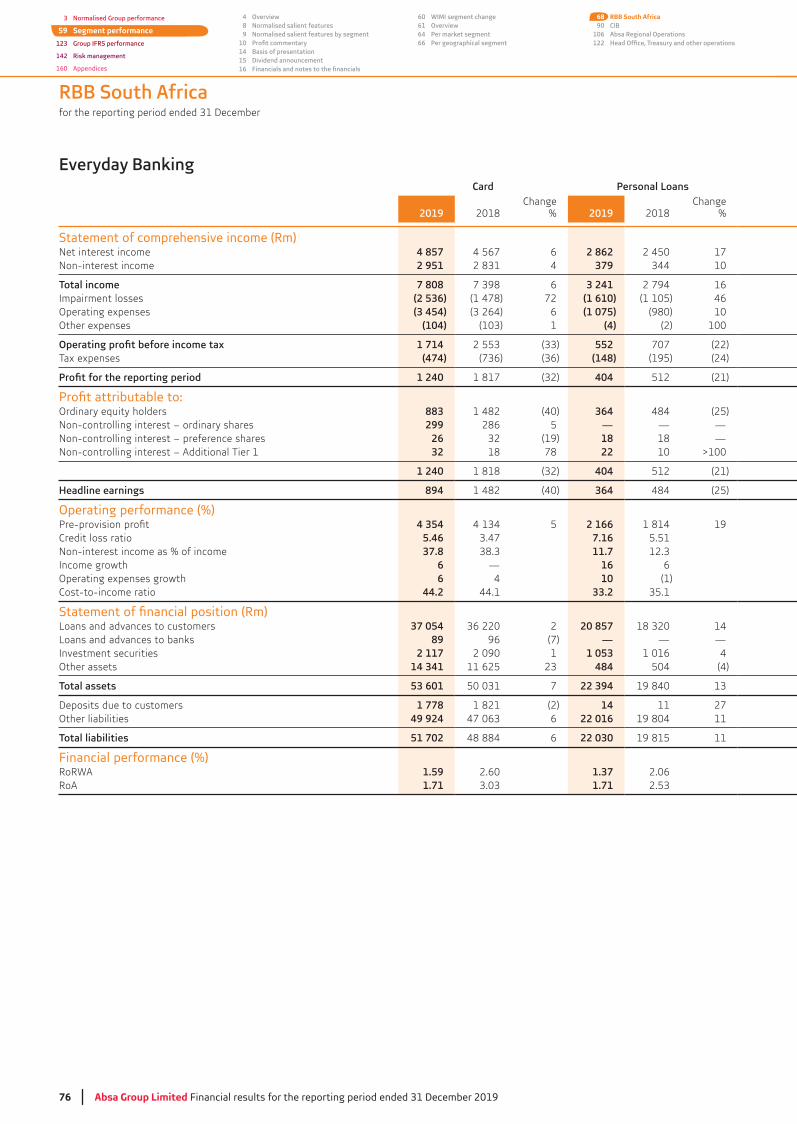
76 Absa Group Limited Financial results for the reporting period ended 31 December 2019
Everyday BankingCard Personal Loans
2019 2018Change
% 2019 2018Change
%
Statement of comprehensive income (Rm)Net interest income 4 857 4 567 6 2 862 2 450 17Non-interest income 2 951 4 379 10
7 808 6 3 241 2 794 16Impairment losses (2 536) (1 478) 72 (1 610) (1 105) 46Operating expenses (3 454) 6 (1 075) (980) 10Other expenses (104) 1 (4) (2) 100
1 714 552 707 (22)Tax expenses (474) (148) (195) (24)
1 240 1 817 404 512 (21)
Ordinary equity holders 883 1 482 (40) 364 484 (25)Non-controlling interest – ordinary shares 299 286 5 — — —Non-controlling interest – preference shares 26 (19) 18 18 —Non-controlling interest – Additional Tier 1 32 18 78 22 10 >100
1 240 1 818 404 512 (21)
Headline earnings 894 1 482 (40) 364 484 (25)
Operating performance (%) 4 354 5 2 166 1 814 19
Credit loss ratio 5.46 7.16 5.51Non-interest income as % of income 37.8 11.7Income growth 6 — 16 6Operating expenses growth 6 4 10 (1)Cost-to-income ratio 44.2 44.1 33.2
Loans and advances to customers 37 054 2 20 857 14Loans and advances to banks 89 96 (7) — — —Investment securities 2 117 2 090 1 1 053 1 016 4Other assets 14 341 11 625 484 504 (4)
53 601 7 22 394 19 840
Deposits due to customers 1 778 1 821 (2) 14 11 27Other liabilities 49 924 6 22 016 19 804 11
51 702 48 884 6 22 030 19 815 11
Financial performance (%)RoRWA 1.59 2.60 1.37 2.06RoA 1.71 1.71
RBB South Africa
3 Normalised Group performance
59 Segment performance
123 Group IFRS performance
142 Risk management
160 Appendices
4 Overview8 Normalised salient features9 Normalised salient features by segment
1014 Basis of presentation15 Dividend announcement16
60 WIMI segment change61 Overview64 Per market segment66 Per geographical segment
68 RBB South Africa90 CIB
106 Absa Regional Operations122

Absa Group Limited Financial results for the reporting period ended 31 December 2019 77
124 IFRS salient features
125 Financials133138 Reconciliation140 Barclays separation
143 Risk management overview155 Capital management
161 Share performance162 Shareholder information and diary163 Glossary170 Abbreviations and acronyms172 Contact information
Everyday Banking
2019 2018Change
% 2019 2018Change
%
5 153 5 199 (1) 12 872 12 216 58 911 8 181 9 12 241 8
14 064 5 25 113 7(507) (525) (4 653) 50
(10 338) (9 911) 4 (14 867) (14 157) 5(65) (66) (2) (173) (171) 1
3 154 2 877 10 5 420 (12)(881) (799) 10 (1 503) (1 729)
2 273 2 078 9 3 917 4 408 (11)
2 242 2 058 9 3 489 4 024— — — 299 286 514 8 58 (8)17 7 >100 71 >100
2 273 2 078 9 3 917 4 408 (11)
2 242 2 058 9 3 500 4 024
3 726 7 10 246 9 416 93.25 4.14 5.5063.4 61.1 48.7 48.2
5 5 74 4 5
73.5 59.2 60.1
3 475 7 61 386 57 779 611 955 9 471 26 12 044 9 567 26
544 470 16 3 714 4216 505 196 554 10 231 330 11
232 479 11 308 474 279 605 10
225 420 11 227 212 205 624 104 795 19 76 735 70 880 8
230 215 207 805 11 303 947 276 504 10
10.45 10.42 3.36 4.021.06 1.09 1.22 1.57
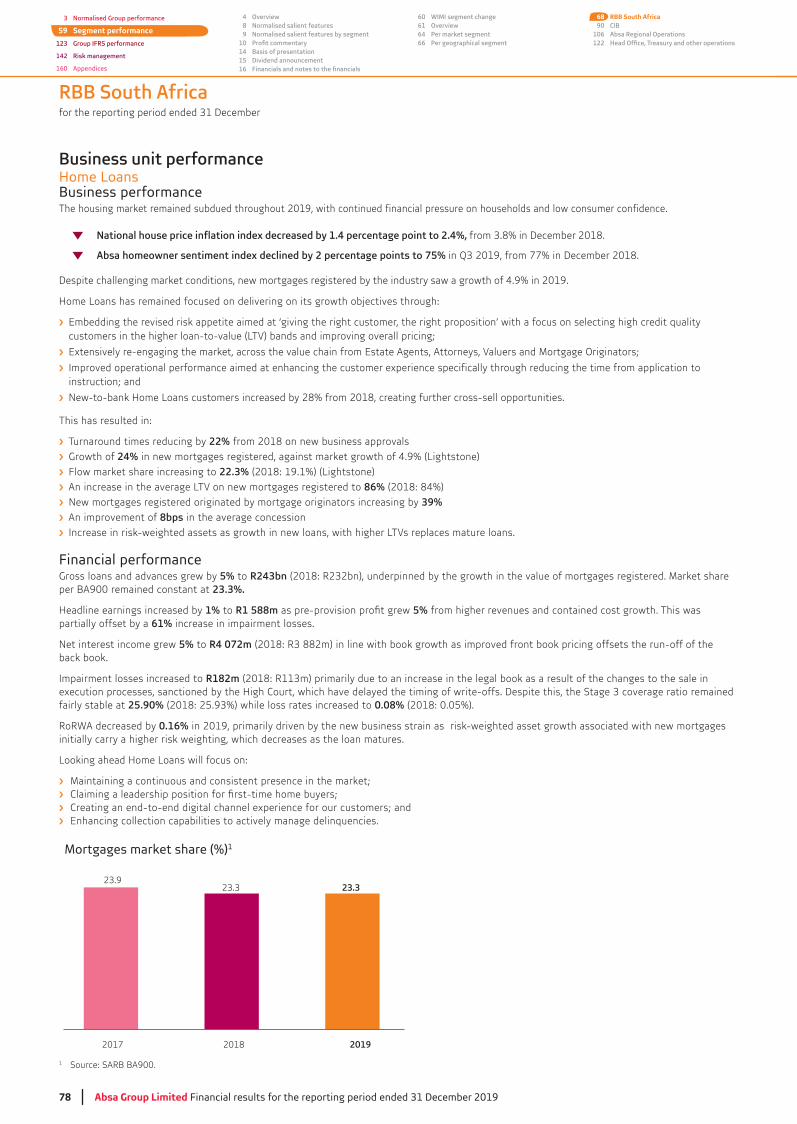
78 Absa Group Limited Financial results for the reporting period ended 31 December 2019
RBB South Africa
Business unit performanceHome LoansBusiness performanceThe housing market remained subdued throughout 2019, with continued financial pressure on households and low consumer confidence.
Despite challenging market conditions, new mortgages registered by the industry saw a growth of 4.9% in 2019.
Home Loans has remained focused on delivering on its growth objectives through:
Embedding the revised risk appetite aimed at ‘giving the right customer, the right proposition’ with a focus on selecting high credit quality customers in the higher loan-to-value (LTV) bands and improving overall pricing;
Extensively re-engaging the market, across the value chain from Estate Agents, Attorneys, Valuers and Mortgage Originators;
Improved operational performance aimed at enhancing the customer experience specifically through reducing the time from application to instruction; and
New-to-bank Home Loans customers increased by 28% from 2018, creating further cross-sell opportunities.
This has resulted in:
Turnaround times reducing by 22% from 2018 on new business approvals Growth of 24% in new mortgages registered, against market growth of 4.9% (Lightstone) Flow market share increasing to 22.3% (2018: 19.1%) (Lightstone) An increase in the average LTV on new mortgages registered to 86% (2018: 84%) New mortgages registered originated by mortgage originators increasing by 39% An improvement of 8bps in the average concession Increase in risk-weighted assets as growth in new loans, with higher LTVs replaces mature loans.
Financial performanceGross loans and advances grew by 5% to R243bnper BA900 remained constant at 23.3%.
Headline earnings increased by 1% to R1 588m 5% from higher revenues and contained cost growth. This was partially offset by a 61% increase in impairment losses.
Net interest income grew 5% to R4 072m back book.
Impairment losses increased to R182m
fairly stable at 25.90% 0.08% (2018: 0.05%).
RoRWA decreased by 0.16% in 2019, primarily driven by the new business strain as risk-weighted asset growth associated with new mortgages initially carry a higher risk weighting, which decreases as the loan matures.
Looking ahead Home Loans will focus on:
Maintaining a continuous and consistent presence in the market;
Creating an end-to-end digital channel experience for our customers; andEnhancing collection capabilities to actively manage delinquencies.
3 Normalised Group performance
59 Segment performance
123 Group IFRS performance
142 Risk management
160 Appendices
4 Overview8 Normalised salient features9 Normalised salient features by segment
1014 Basis of presentation15 Dividend announcement16
60 WIMI segment change61 Overview64 Per market segment66 Per geographical segment
68 RBB South Africa90 CIB
106 Absa Regional Operations122
1 Source: SARB BA900.
2018 20192017
Mortgages market share (%)1
23.323.9
23.3
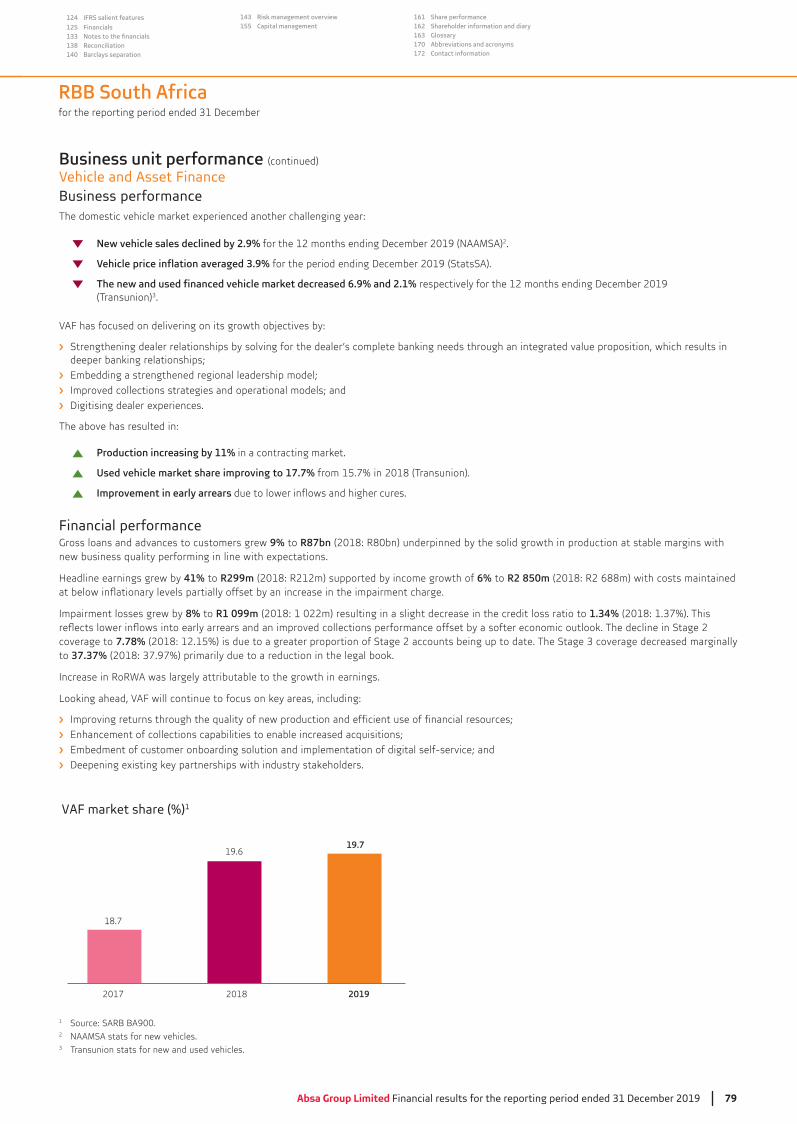
Absa Group Limited Financial results for the reporting period ended 31 December 2019 79
124 IFRS salient features
125 Financials133138 Reconciliation140 Barclays separation
143 Risk management overview155 Capital management
161 Share performance162 Shareholder information and diary163 Glossary170 Abbreviations and acronyms172 Contact information
Business unit performance (continued)
Vehicle and Asset FinanceBusiness performanceThe domestic vehicle market experienced another challenging year:
New vehicle sales declined by 2.9% for the 12 months ending December 2019 (NAAMSA)2.
Vehicle price inflation averaged 3.9% for the period ending December 2019 (StatsSA).
and 2.1% respectively for the 12 months ending December 2019 (Transunion) .
VAF has focused on delivering on its growth objectives by:
Strengthening dealer relationships by solving for the dealer’s complete banking needs through an integrated value proposition, which results in deeper banking relationships;Embedding a strengthened regional leadership model; Improved collections strategies and operational models; andDigitising dealer experiences.
The above has resulted in:
Production increasing by 11% in a contracting market.
Used vehicle market share improving to 17.7% from 15.7% in 2018 (Transunion).
Improvement in early arrears due to lower inflows and higher cures.
Financial performanceGross loans and advances to customers grew 9% to R87bn (2018: R80bn) underpinned by the solid growth in production at stable margins with new business quality performing in line with expectations.
Headline earnings grew by 41% to R299m (2018: R212m) supported by income growth of 6% to R2 850m (2018: R2 688m) with costs maintained
Impairment losses grew by 8% to R1 099m (2018: 1 022m) resulting in a slight decrease in the credit loss ratio to 1.34%
coverage to 7.78%to 37.37%
Increase in RoRWA was largely attributable to the growth in earnings.
Looking ahead, VAF will continue to focus on key areas, including:
Improving returns through the quality of new production and efficient use of financial resources;Enhancement of collections capabilities to enable increased acquisitions;Embedment of customer onboarding solution and implementation of digital self-service; andDeepening existing key partnerships with industry stakeholders.
2018 20192017
VAF market share (%)1
19.7
18.7
19.6
1 Source: SARB BA900.2 NAAMSA stats for new vehicles.
Transunion stats for new and used vehicles.
RBB South Africa
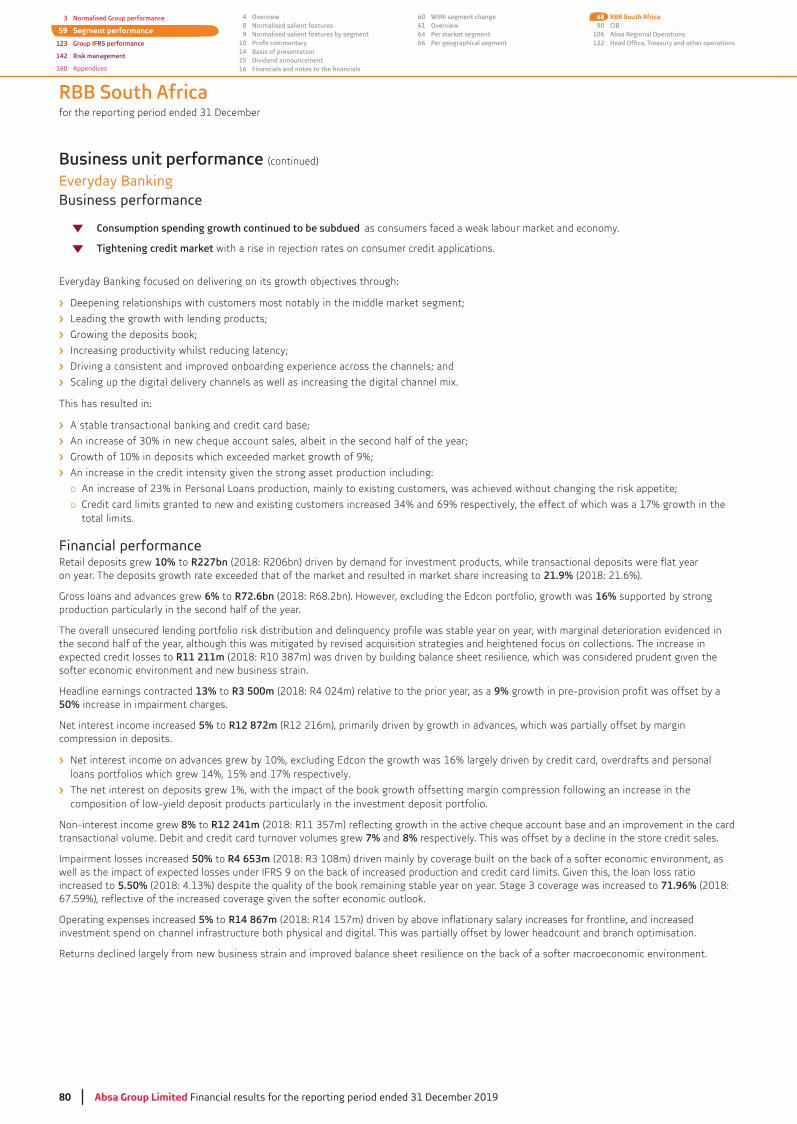
80 Absa Group Limited Financial results for the reporting period ended 31 December 2019
Business unit performance (continued)
Everyday BankingBusiness performance
Consumption spending growth continued to be subdued as consumers faced a weak labour market and economy.
with a rise in rejection rates on consumer credit applications.
Everyday Banking focused on delivering on its growth objectives through:
Deepening relationships with customers most notably in the middle market segment;
Leading the growth with lending products;
Growing the deposits book;
Increasing productivity whilst reducing latency;
Driving a consistent and improved onboarding experience across the channels; and
Scaling up the digital delivery channels as well as increasing the digital channel mix.
This has resulted in:
A stable transactional banking and credit card base;
Growth of 10% in deposits which exceeded market growth of 9%;
An increase in the credit intensity given the strong asset production including:
o
o total limits.
Financial performanceRetail deposits grew 10% to R227bn (2018: R206bn) driven by demand for investment products, while transactional deposits were flat year on year. The deposits growth rate exceeded that of the market and resulted in market share increasing to 21.9% (2018: 21.6%).
Gross loans and advances grew 6% to R72.6bn (2018: R68.2bn). However, excluding the Edcon portfolio, growth was 16% supported by strong production particularly in the second half of the year.
The overall unsecured lending portfolio risk distribution and delinquency profile was stable year on year, with marginal deterioration evidenced in the second half of the year, although this was mitigated by revised acquisition strategies and heightened focus on collections. The increase in expected credit losses to R11 211msofter economic environment and new business strain.
Headline earnings contracted 13% to R3 500m (2018: R4 024m) relative to the prior year, as a 9% growth in pre-provision profit was offset by a 50% increase in impairment charges.
Net interest income increased 5% to R12 872m (R12 216m), primarily driven by growth in advances, which was partially offset by margin compression in deposits.
Net interest income on advances grew by 10%, excluding Edcon the growth was 16% largely driven by credit card, overdrafts and personal loans portfolios which grew 14%, 15% and 17% respectively.
The net interest on deposits grew 1%, with the impact of the book growth offsetting margin compression following an increase in the composition of low-yield deposit products particularly in the investment deposit portfolio.
Non-interest income grew 8% to R12 241mtransactional volume. Debit and credit card turnover volumes grew 7% and 8% respectively. This was offset by a decline in the store credit sales.
Impairment losses increased 50% to R4 653mwell as the impact of expected losses under IFRS 9 on the back of increased production and credit card limits. Given this, the loan loss ratio increased to 5.50% 71.96% (2018: 67.59%), reflective of the increased coverage given the softer economic outlook.
Operating expenses increased 5% to R14 867m (2018: R14 157m) driven by above inflationary salary increases for frontline, and increased investment spend on channel infrastructure both physical and digital. This was partially offset by lower headcount and branch optimisation.
Returns declined largely from new business strain and improved balance sheet resilience on the back of a softer macroeconomic environment.
RBB South Africa
3 Normalised Group performance
59 Segment performance
123 Group IFRS performance
142 Risk management
160 Appendices
4 Overview8 Normalised salient features9 Normalised salient features by segment
1014 Basis of presentation15 Dividend announcement16
60 WIMI segment change61 Overview64 Per market segment66 Per geographical segment
68 RBB South Africa90 CIB
106 Absa Regional Operations122

Absa Group Limited Financial results for the reporting period ended 31 December 2019 81
124 IFRS salient features
125 Financials133138 Reconciliation140 Barclays separation
143 Risk management overview155 Capital management
161 Share performance162 Shareholder information and diary163 Glossary170 Abbreviations and acronyms172 Contact information
RBB South Africa
Business unit performance (continued)
Everyday Banking (continued)
Looking ahead, Everyday Banking will focus on the following:
Sustaining balance sheet momentum;
Leveraging the lending base to grow the transactional base and increase primacy;
Cost optimisation;
Further expansion of the digital capabilities; and
Continuous optimisation of the credit and collections strategy.
2018 20192017
Card market share stock (%)1
21.7
25.3
22.3
Personal loans market share (%)1
11.110.7 10.7
2018 20192017
Deposits market share (%) 1
2018 20192017
21.3
21.9
21.7
Deposits (Rbn and change %)
20182019Cheque and savings
depositsInvestment products Fixed deposits Call and notice deposits
51 52
8187
5767
1722
2% 7% 28%18%
Gross loans and advances (Rbn and change %)
20182019Credit card
(excluding Edcon)Overdraft Personal loan
38
44
4 4
2124
14%18%
1 Source: SARB BA900.

82 Absa Group Limited Financial results for the reporting period ended 31 December 2019
Business unit performance (continued)
Relationship BankingBusiness performance The changes required to align the organisational structure with the operating model were completed during the year, with the benefits of the simplified and optimised organisational structure already starting to bear fruit. The focus was on integrating the Wealth and Fiduciary businesses, enhancing frontline and credit capabilities to improve customer experience as well as streamlining fulfilment processes.
Relationship Banking successfully completed the roll-out of the Universal Banker model to serve a customer’s holistic personal and business financial requirements. Furthermore, focus remained on leveraging the relationship ecosystem across the Group to the benefit of clients.
Financial performanceDeposits growth of 10% to R144bn 3% and 16% respectively, reflecting the uplift from new product development and growth in focus segments and sectors.
Gross loans and advances to customers increased by 12% to R128bn (2018: R114bn) driven by sustained momentum in the Commercial segment, while growth in the Enterprise segment slowed as the softer economic environment resulted in a more challenging operating environment.
Headline earnings increased 7% to R3 672m 6% partially offset by a 16% growth in impairment losses.
Net interest income increased by 4% to R7 538m (2018: R7 245m) reflecting healthy growth in both advances and deposits, partially offset by margin compression in Commercial asset-backed lending and lower deposit margins reflecting negative composition changes from faster growth in savings and investment products.
Non-interest income increased by 3% to R6 349m (2018: R6 155m) reflecting growth in the core transactional offering, a 12% increase in merchant turnover and momentum in value-added services, which grew 35%, partially offset by pressures on cash-related revenues from the migration of clients to more efficient cash products which attract lower margins.
Impairment losses increased 16% to R322m (2018: R277m) driven by a 13% growth in net advances and deterioration in Commercial Asset Finance and the Small and Medium Enterprise (SME) segment, partially offset by recoveries of amounts impaired in prior financial periods. The credit loss ratio increased marginally to 0.26% 47.67% (2018: 51.51%) was due to higher levels of collateral
Operating expenses increased by 2% to R8 175mThis was partially offset by above inflationary salary increases in the frontline and higher cash transportation costs.
Looking ahead, Relationship Banking will continue to focus on:
Embedding the Universal Banker model and expanding the relationship ecosystem;Growing presence in the young and self-employed professionals;Redefining the value proposition for entrepreneurs;Diversifying the premium segment into key growth sectors and products; andOptimising cash and other payment offerings.
RBB South Africa
3 Normalised Group performance
59 Segment performance
123 Group IFRS performance
142 Risk management
160 Appendices
4 Overview8 Normalised salient features9 Normalised salient features by segment
1014 Basis of presentation15 Dividend announcement16
60 WIMI segment change61 Overview64 Per market segment66 Per geographical segment
68 RBB South Africa90 CIB
106 Absa Regional Operations122
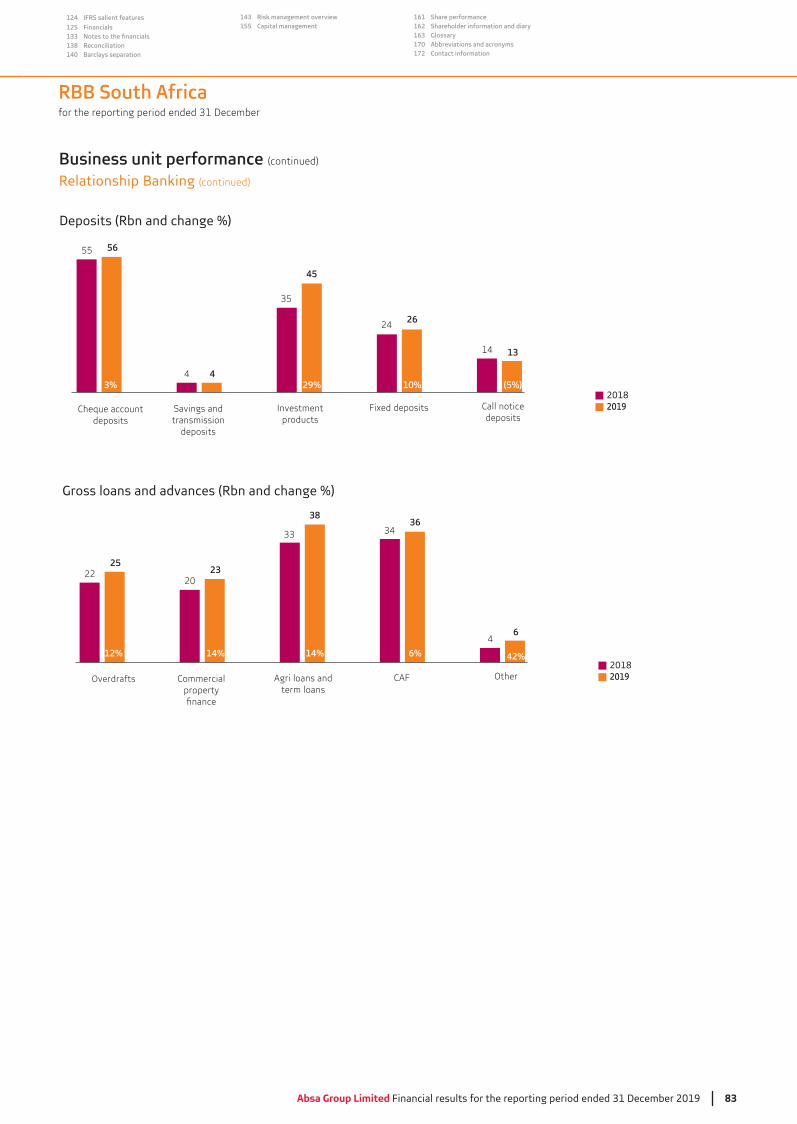
Absa Group Limited Financial results for the reporting period ended 31 December 2019 83
124 IFRS salient features
125 Financials133138 Reconciliation140 Barclays separation
143 Risk management overview155 Capital management
161 Share performance162 Shareholder information and diary163 Glossary170 Abbreviations and acronyms172 Contact information
RBB South Africa
Gross loans and advances (Rbn and change %)
20182019Overdrafts Commercial
propertyfinance
Agri loans andterm loans
CAF Other
2225
2023
33
38
3436
46
12% 14% 14% 6% 42%
Deposits (Rbn and change %)
20182019Cheque account
depositsSavings andtransmission
deposits
Investmentproducts
Fixed deposits Call noticedeposits
55 56
4 4
35
45
2426
14 13
29% 10% (5%)3%
Business unit performance (continued)
Relationship Banking (continued)
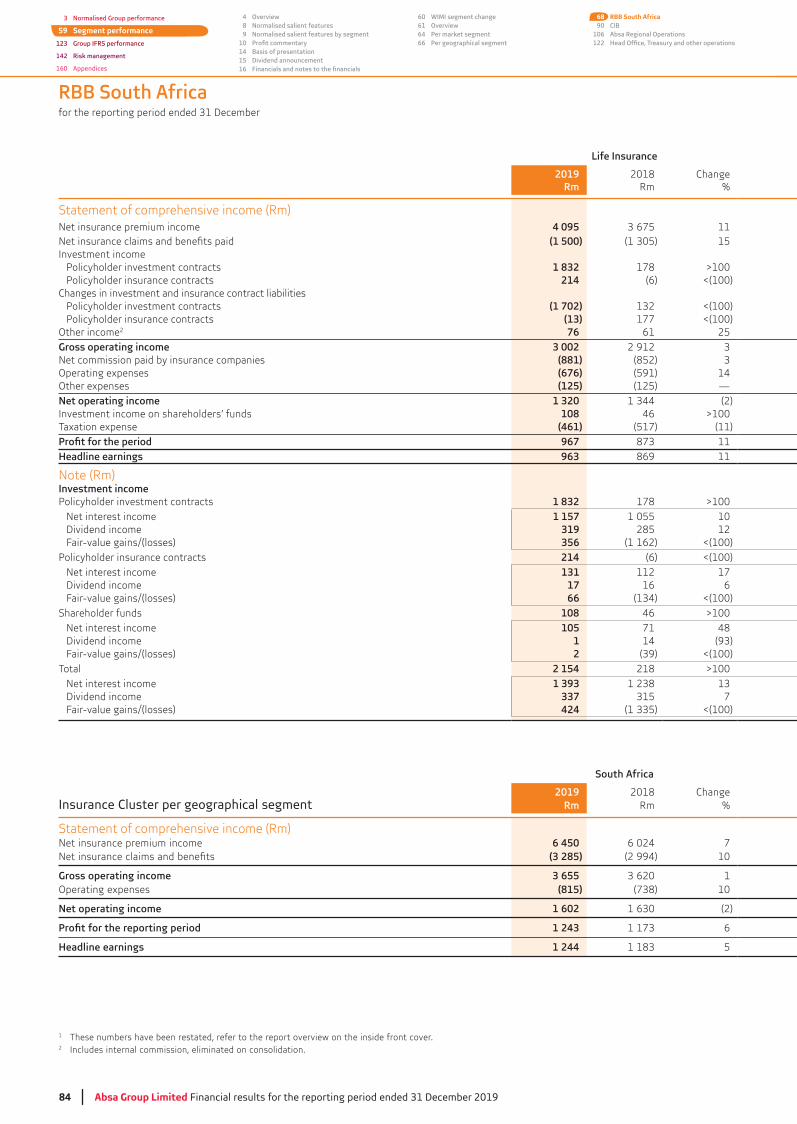
84 Absa Group Limited Financial results for the reporting period ended 31 December 2019
Life Insurance
2019Rm
2018Rm
Change%
Statement of comprehensive income (Rm)Net insurance premium income 4 095 11
(1 500) 15Investment income
1 832 178 >100 214 (6) <(100)
Changes in investment and insurance contract liabilities(1 702) <(100)
(13) 177 <(100)Other income2 76 61 25Gross operating income 3 002 2 912Net commission paid by insurance companies (881) (852)Operating expenses (676) (591) 14Other expenses (125) (125) —Net operating income 1 320 (2)Investment income on shareholders’ funds 108 46 >100 Taxation expense (461) (517) (11)
967 11Headline earnings 963 869 11
Note (Rm)Investment income
1 832 178 >100 Net interest income 1 157 1 055 10Dividend income 319 285 12Fair-value gains/(losses) 356 (1 162) <(100)
214 (6) <(100)Net interest income 131 112 17Dividend income 17 16 6Fair-value gains/(losses) 66 <(100)
Shareholder funds 108 46 >100 Net interest income 105 71 48Dividend income 1 14Fair-value gains/(losses) 2 <(100)
Total 2 154 218 >100 Net interest income 1 393Dividend income 337 7Fair-value gains/(losses) 424 <(100)
1 These numbers have been restated, refer to the report overview on the inside front cover.2 Includes internal commission, eliminated on consolidation.
South Africa
Insurance Cluster per geographical segment2019
Rm2018
RmChange
%
Statement of comprehensive income (Rm)Net insurance premium income 6 450 6 024 7
(3 285) (2 994) 10
Gross operating income 3 655 1Operating expenses (815) 10
Net operating income 1 602 (2)
1 243 6
Headline earnings 1 244 5
RBB South Africa
3 Normalised Group performance
59 Segment performance
123 Group IFRS performance
142 Risk management
160 Appendices
4 Overview8 Normalised salient features9 Normalised salient features by segment
1014 Basis of presentation15 Dividend announcement16
60 WIMI segment change61 Overview64 Per market segment66 Per geographical segment
68 RBB South Africa90 CIB
106 Absa Regional Operations122
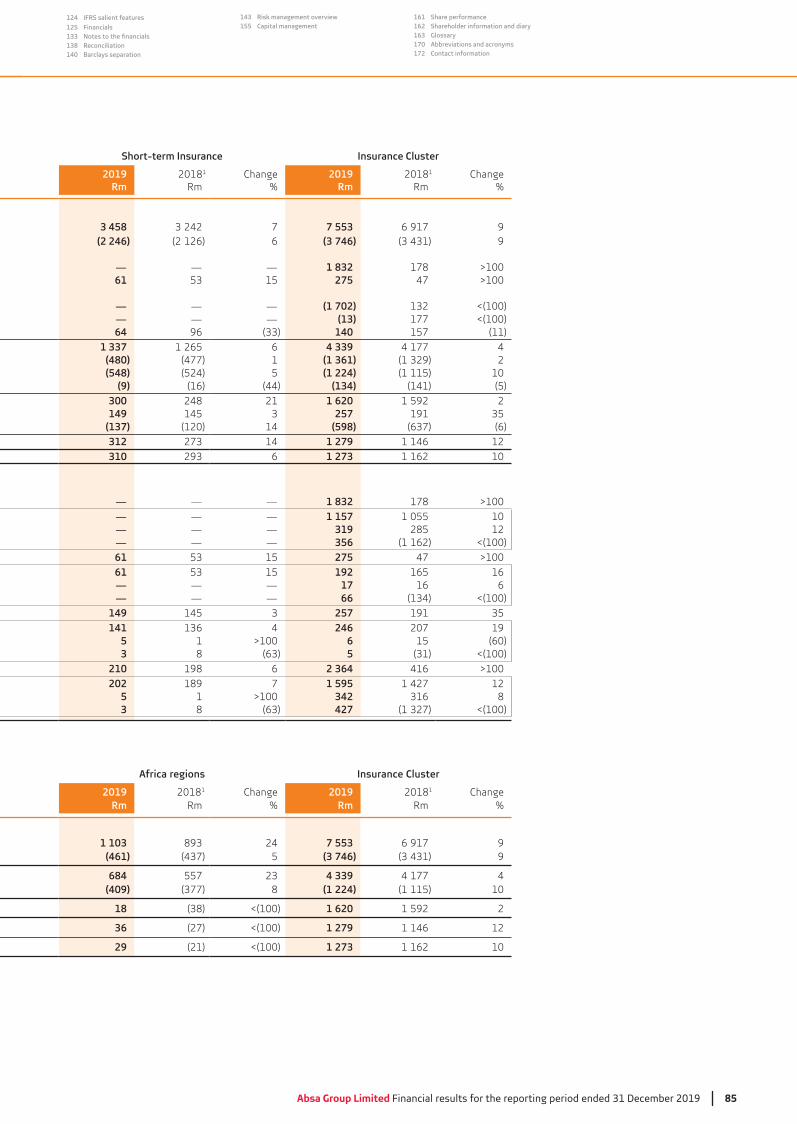
Absa Group Limited Financial results for the reporting period ended 31 December 2019 85
124 IFRS salient features
125 Financials133138 Reconciliation140 Barclays separation
143 Risk management overview155 Capital management
161 Share performance162 Shareholder information and diary163 Glossary170 Abbreviations and acronyms172 Contact information
Short-term Insurance Insurance Cluster
2019Rm
20181
RmChange
%2019
Rm20181
RmChange
%
3 458 7 7 553 6 917 9(2 246) (2 126) 6 (3 746) 9
— — — 1 832 178 >100 61 15 275 47 >100
— — — (1 702) <(100)— — — (13) 177 <(100)64 96 140 157 (11)
1 337 1 265 6 4 339 4 177 4(480) (477) 1 (1 361) 2(548) (524) 5 (1 224) (1 115) 10
(9) (16) (44) (134) (141) (5)300 248 21 1 620 1 592 2149 145 257 191
(137) (120) 14 (598) (6)312 14 1 279 1 146 12310 6 1 273 1 162 10
— — — 1 832 178 >100 — — — 1 157 1 055 10— — — 319 285 12— — — 356 (1 162) <(100)61 15 275 47 >100 61 15 192 165 16— — — 17 16 6— — — 66 <(100)
149 145 257 191141 4 246 207 19
5 1 >100 6 15 (60)3 8 5 <(100)
210 198 6 2 364 416 >100 202 189 7 1 595 1 427 12
5 1 >100 342 83 8 427 <(100)
Africa regions Insurance Cluster
2019Rm
20181
RmChange
%2019
Rm20181
RmChange
%
1 103 24 7 553 6 917 9(461) 5 (3 746) 9
684 557 4 339 4 177 4(409) 8 (1 224) (1 115) 10
18 <(100) 1 620 1 592 2
36 (27) <(100) 1 279 1 146 12
29 (21) <(100) 1 273 1 162 10
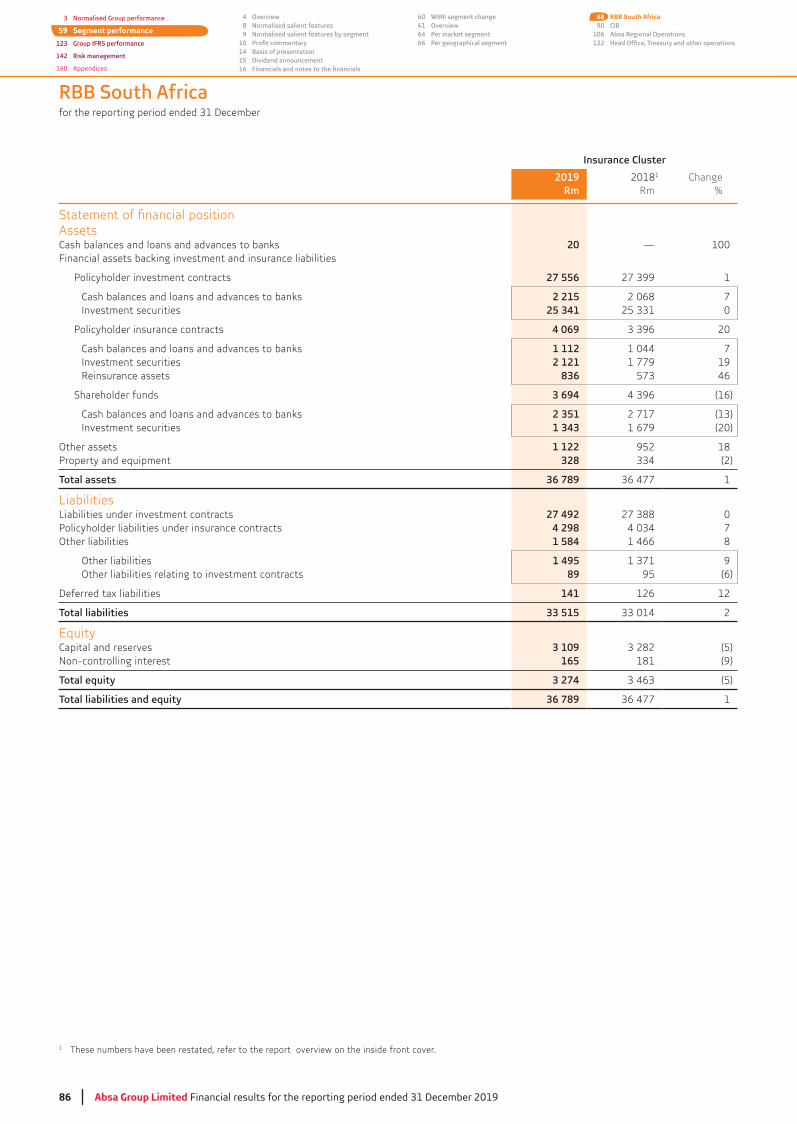
86 Absa Group Limited Financial results for the reporting period ended 31 December 2019
Insurance Cluster
2019Rm
20181
RmChange
%
AssetsCash balances and loans and advances to banks 20 — 100Financial assets backing investment and insurance liabilities
27 556 1
Cash balances and loans and advances to banks 2 215 2 068 7Investment securities 25 341 0
4 069 20
Cash balances and loans and advances to banks 1 112 1 044 7Investment securities 2 121 1 779 19Reinsurance assets 836 46
Shareholder funds 3 694 (16)
Cash balances and loans and advances to banks 2 351 2 717Investment securities 1 343 1 679 (20)
Other assets 1 122 952 18328 (2)
36 789 1
LiabilitiesLiabilities under investment contracts 27 492 0
4 298 7Other liabilities 1 584 1 466 8
Other liabilities 1 495 9Other liabilities relating to investment contracts 89 95 (6)
Deferred tax liabilities 141 126 12
33 515 2
EquityCapital and reserves 3 109 (5)Non-controlling interest 165 181 (9)
3 274 (5)
36 789 1
RBB South Africa
1 These numbers have been restated, refer to the report overview on the inside front cover.
3 Normalised Group performance
59 Segment performance
123 Group IFRS performance
142 Risk management
160 Appendices
4 Overview8 Normalised salient features9 Normalised salient features by segment
1014 Basis of presentation15 Dividend announcement16
60 WIMI segment change61 Overview64 Per market segment66 Per geographical segment
68 RBB South Africa90 CIB
106 Absa Regional Operations122

Absa Group Limited Financial results for the reporting period ended 31 December 2019 87
124 IFRS salient features
125 Financials133138 Reconciliation140 Barclays separation
143 Risk management overview155 Capital management
161 Share performance162 Shareholder information and diary163 Glossary170 Abbreviations and acronyms172 Contact information
Business unit performance (continued)
Insurance ClusterBusiness performanceThe operating environment for the year has remained subdued:
Increased policyholder indebtedness lead to an increase in lapse rates and fraudulent claims.
The Insurance Cluster remained focused on delivering on its growth objectives through:
Delivery of refreshed credit life and funeral products;
Leveraging data analytics to improve sales retention and collections;
Re-engineering of claims and supplier management process in Short-term Insurance to improve service as well as reduce claim turnaround time; and
Focusing on improving the performance of the Insurance Absa Regional Operations.
This has resulted in:
An increase of 17% in branch sales volumes from the revised funeral product;
114 000 (2018 H2: 101 000) per month in the second half of the year;
Number of new policies in Instant Life growing by 36%;
An increase in new business volumes of 23% for Homeowner’s insurance on the back of strong production in Home Loans; and
47% in 2019.
Life Insurance
The life insurance book has seen growth of 2% in the 2019 year, this builds on the growth seen in the previous two years. We have seen a significant improvement in the book losses in the 2019 year when compared to the previous two years. This can be attributed to the improved collections in the standalone funeral book achieved in the 2019 year.
11% to R963m (2018: R869m). Net insurance premium income grew by 11% to R4 095m 135%, partially offset by 15% increase in claims. Embedded Value of New
Business (EVNB) grew by 6% from improved funeral and underwritten product sales while being adversely impacted by reduced personal loans lending in our Africa Regional Operations.
Return on embedded value decreased primarily from a 38% decline in Embedded Value earnings. This was driven by the non-recurrence of Solvency Assessment and Management modelling changes in 2018, a weakening in mortality assumptions and an increase in expense assumptions in 2019. This was partially offset by positive investment return variances from changes in asset allocation mandates.
Salient features – Life Insurance 2019 2018Change
%
Shareholders’ net assets (Rm) 1 844 1 894Cost of solvency capital (Rm) (203) (180)Value of business in-force (Rm) 4 850 4 749 2
Embedded value (Rm) 6 491 0
Embedded value earnings (Rm) 1 058 1 717Return on embedded value (%) 16.3EVNB (Rm) 734 690 6Value of new business as a percentage of the present value of future premiums (%) (gross) 11.1
RBB South Africa
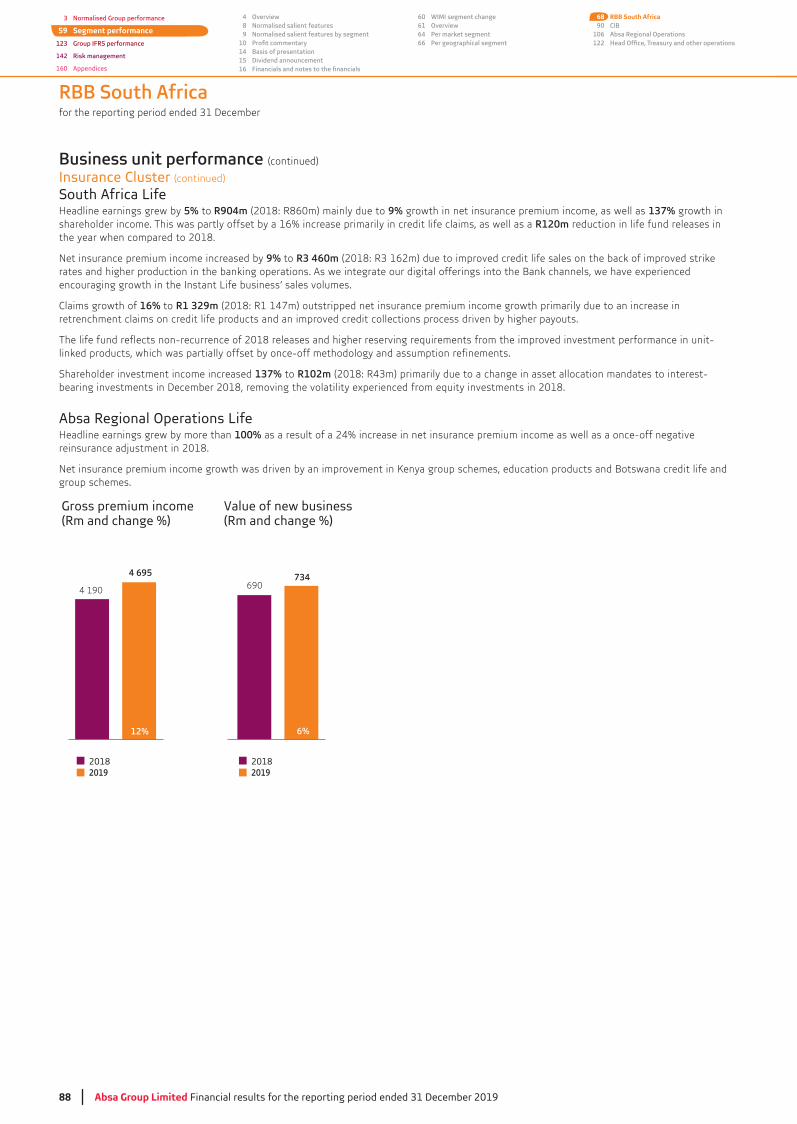
88 Absa Group Limited Financial results for the reporting period ended 31 December 2019
Business unit performance (continued)
Insurance Cluster (continued)
South Africa LifeHeadline earnings grew by 5% to R904m (2018: R860m) mainly due to 9% growth in net insurance premium income, as well as 137% growth in shareholder income. This was partly offset by a 16% increase primarily in credit life claims, as well as a R120m reduction in life fund releases in the year when compared to 2018.
Net insurance premium income increased by 9% to R3 460mrates and higher production in the banking operations. As we integrate our digital offerings into the Bank channels, we have experienced encouraging growth in the Instant Life business’ sales volumes.
Claims growth of 16% to R1 329m (2018: R1 147m) outstripped net insurance premium income growth primarily due to an increase in retrenchment claims on credit life products and an improved credit collections process driven by higher payouts.
The life fund reflects non-recurrence of 2018 releases and higher reserving requirements from the improved investment performance in unit-linked products, which was partially offset by once-off methodology and assumption refinements.
Shareholder investment income increased 137% to R102mbearing investments in December 2018, removing the volatility experienced from equity investments in 2018.
Absa Regional Operations LifeHeadline earnings grew by more than 100% as a result of a 24% increase in net insurance premium income as well as a once-off negative reinsurance adjustment in 2018.
group schemes.
20182019
20182019
4 695
Gross premium income (Rm and change %)
12%
Value of new business (Rm and change %)
4 190 690734
6%
RBB South Africa
3 Normalised Group performance
59 Segment performance
123 Group IFRS performance
142 Risk management
160 Appendices
4 Overview8 Normalised salient features9 Normalised salient features by segment
1014 Basis of presentation15 Dividend announcement16
60 WIMI segment change61 Overview64 Per market segment66 Per geographical segment
68 RBB South Africa90 CIB
106 Absa Regional Operations122
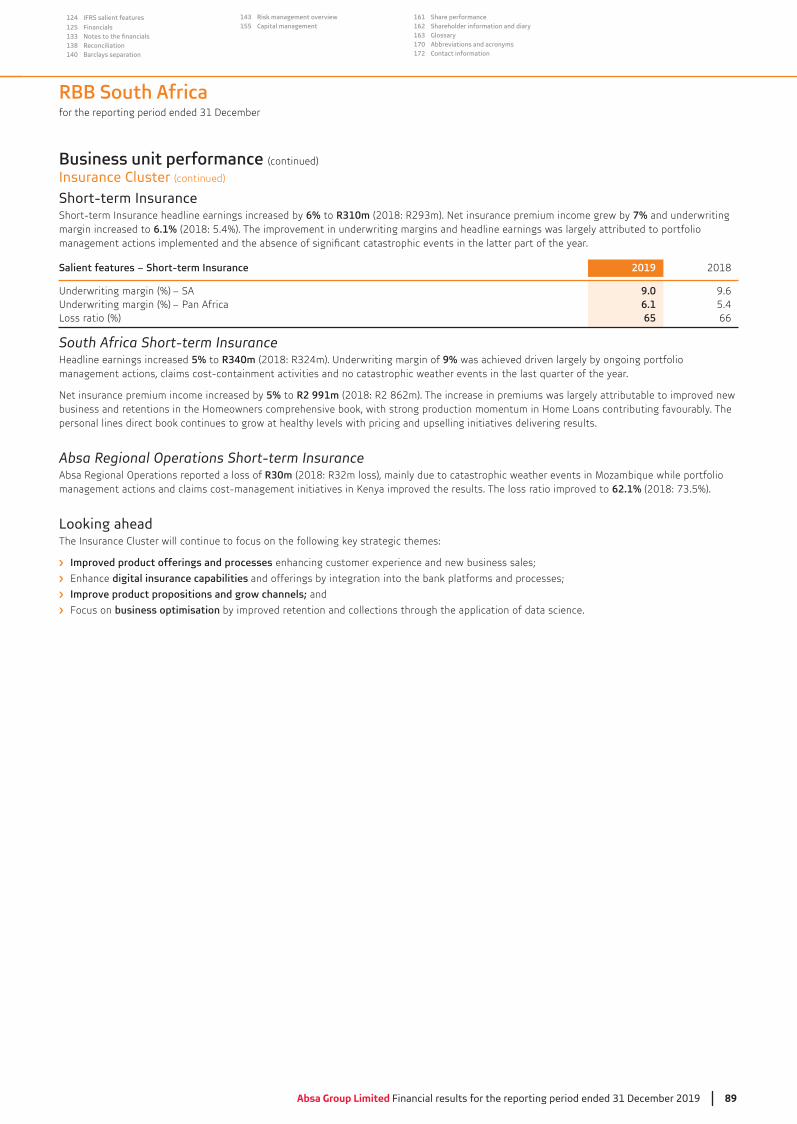
Absa Group Limited Financial results for the reporting period ended 31 December 2019 89
124 IFRS salient features
125 Financials133138 Reconciliation140 Barclays separation
143 Risk management overview155 Capital management
161 Share performance162 Shareholder information and diary163 Glossary170 Abbreviations and acronyms172 Contact information
RBB South Africa
Business unit performance (continued)
Insurance Cluster (continued)
Short-term InsuranceShort-term Insurance headline earnings increased by 6% to R310m 7% and underwriting margin increased to 6.1% (2018: 5.4%). The improvement in underwriting margins and headline earnings was largely attributed to portfolio
Salient features – Short-term Insurance 2019 2018
Underwriting margin (%) – SA 9.0 9.6Underwriting margin (%) 6.1 5.4Loss ratio (%) 65 66
South Africa Short-term InsuranceHeadline earnings increased 5% to R340m 9% was achieved driven largely by ongoing portfolio management actions, claims cost-containment activities and no catastrophic weather events in the last quarter of the year.
Net insurance premium income increased by 5% to R2 991m (2018: R2 862m). The increase in premiums was largely attributable to improved new business and retentions in the Homeowners comprehensive book, with strong production momentum in Home Loans contributing favourably. The personal lines direct book continues to grow at healthy levels with pricing and upselling initiatives delivering results.
Absa Regional Operations Short-term InsuranceAbsa Regional Operations reported a loss of R30m
62.1%
Looking aheadThe Insurance Cluster will continue to focus on the following key strategic themes:
Improved product offerings and processes enhancing customer experience and new business sales;
Enhance digital insurance capabilities and offerings by integration into the bank platforms and processes;
Improve product propositions and grow channels; and
Focus on business optimisation by improved retention and collections through the application of data science.
90 Absa Group Limit Financial results for the reporting period ended 31 December 2019
3 Normalised Group performance
59 Segment performance
123 Group IFRS performance
142 Risk management
160 Appendices
4 Overview8 Normalised salient features9 Normalised salient features by segment
1014 Basis of presentation15 Dividend announcement16
60 WIMI segment change61 Overview64 Per market segment66 Per geographical segment
68 RBB South Africa90 CIB
106 Absa Regional Operations122
R5 946m
(9% in constant currency).
Continued growth momentum in ARO with total income up 15% to R7 368m
4% decline in Investment Bank incometo R7 854mconstant currency), driven by a decrease in Markets SA (down 28%) and Banking SA (down 2%) income; offset by growth from the remaining businesses, which includes the
up 40% and 25% (up 21% in constant currency) respectively.
Solid income growth from the Corporate Bank franchise, up 9% to R10 554mconstant currency), with both SA (up 7%) and ARO (up 12%) contributing positively towards this performance.
Proportion of non-interest income to total income tracking behind target at 36%; this is an area of focus for the business.
Strong growth momentum
portfolio at a compound annual growth of 19% in the last four years.
of 10% to R9 590m9% in constant currency) mainly due to ongoing run costs following separation of systems and international coverage
52.1% from 48.7% in the prior period.
Introduced the Absa Access Deposit Notean innovative investment product, which supported overall deposits growth of 20%.
Lower returns of 18.2%capital management.
Positive balance sheet Jaws with customer deposits growing faster than customer loans. Customer deposits up 20% to R279.3bn
R357.7bn12% in constant currency).

Absa Group Limited Financial results for the reporting period ended 31 December 2019 91
124 IFRS salient features
125 Financials133138 Reconciliation140 Barclays separation
143 Risk management overview155 Capital management
161 Share performance162 Shareholder information and diary163 Glossary170 Abbreviations and acronyms172 Contact information
CIB salient features 2019 20181 CCY%Change
%1
Income (Rm) 18 408 17 878 2Headline earnings (Rm) 5 946 5 794 1
8 818 9 178 (5) (4)Cost-to-income ratio (%) 52.1 48.7Credit loss ratio (%) 0.14RoRC (%) 18.2 21.1RoRWA (%) 2.02RoA (%) 0.87 1.00
1 These numbers have been restated, refer to the report overview on the inside front cover.
Headline earnings contribution (%)
ARO
SA
4654
Revenue mix (%)
Net interest income
6436
Non-interest income
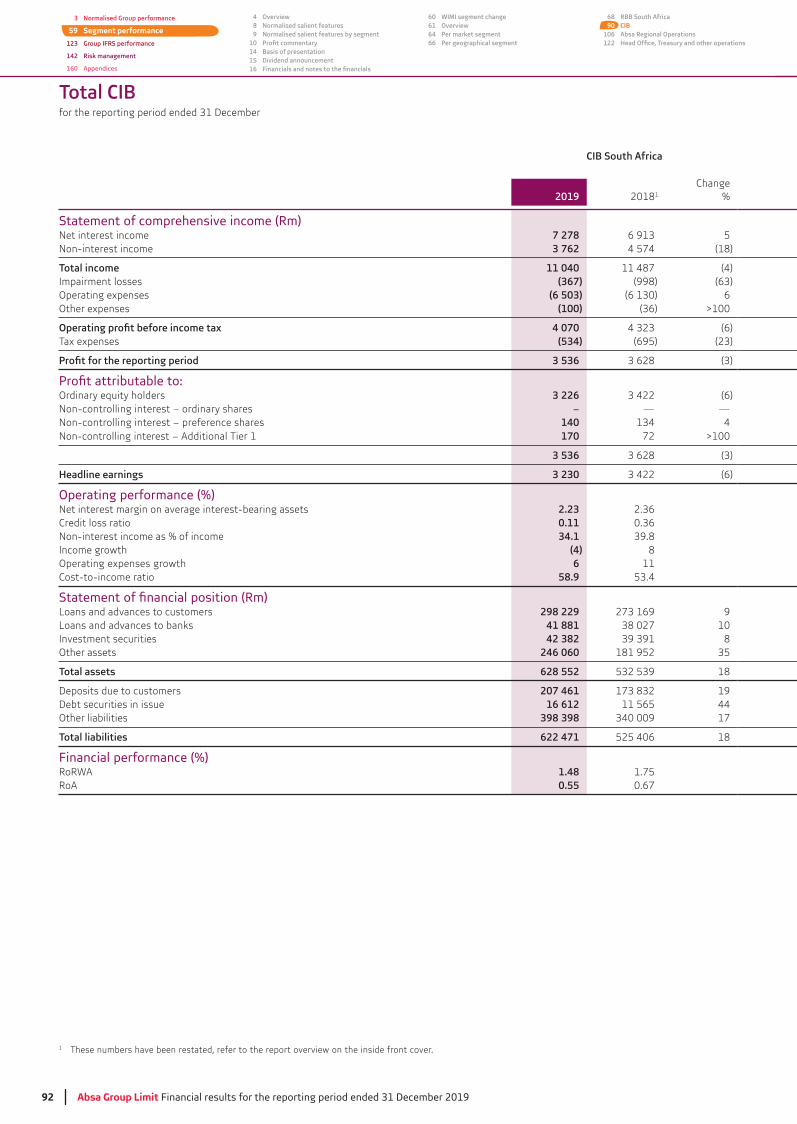
92 Absa Group Limit Financial results for the reporting period ended 31 December 2019
3 Normalised Group performance
59 Segment performance
123 Group IFRS performance
142 Risk management
160 Appendices
4 Overview8 Normalised salient features9 Normalised salient features by segment
1014 Basis of presentation15 Dividend announcement16
60 WIMI segment change61 Overview64 Per market segment66 Per geographical segment
68 RBB South Africa90 CIB
106 Absa Regional Operations122
CIB South Africa
2019 20181
Change%
Statement of comprehensive income (Rm)Net interest income 7 278 5Non-interest income 3 762 4 574 (18)
11 040 11 487 (4)Impairment losses (367) (998)Operating expenses (6 503) 6Other expenses (100) >100
4 070 (6)Tax expenses (534) (695)
3 536
Ordinary equity holders 3 226 (6)Non-controlling interest – ordinary shares – — —Non-controlling interest – preference shares 140 4Non-controlling interest – Additional Tier 1 170 72 >100
3 536
Headline earnings 3 230 (6)
Operating performance (%) Net interest margin on average interest-bearing assets 2.23Credit loss ratio 0.11Non-interest income as % of income 34.1Income growth (4) 8Operating expenses growth 6 11Cost-to-income ratio 58.9
Loans and advances to customers 298 229 9Loans and advances to banks 41 881 10Investment securities 42 382 8Other assets 246 060 181 952
628 552 18
Deposits due to customers 207 461 19Debt securities in issue 16 612 11 565 44Other liabilities 398 398 17
622 471 525 406 18
Financial performance (%)RoRWA 1.48 1.75RoA 0.55 0.67
1 These numbers have been restated, refer to the report overview on the inside front cover.
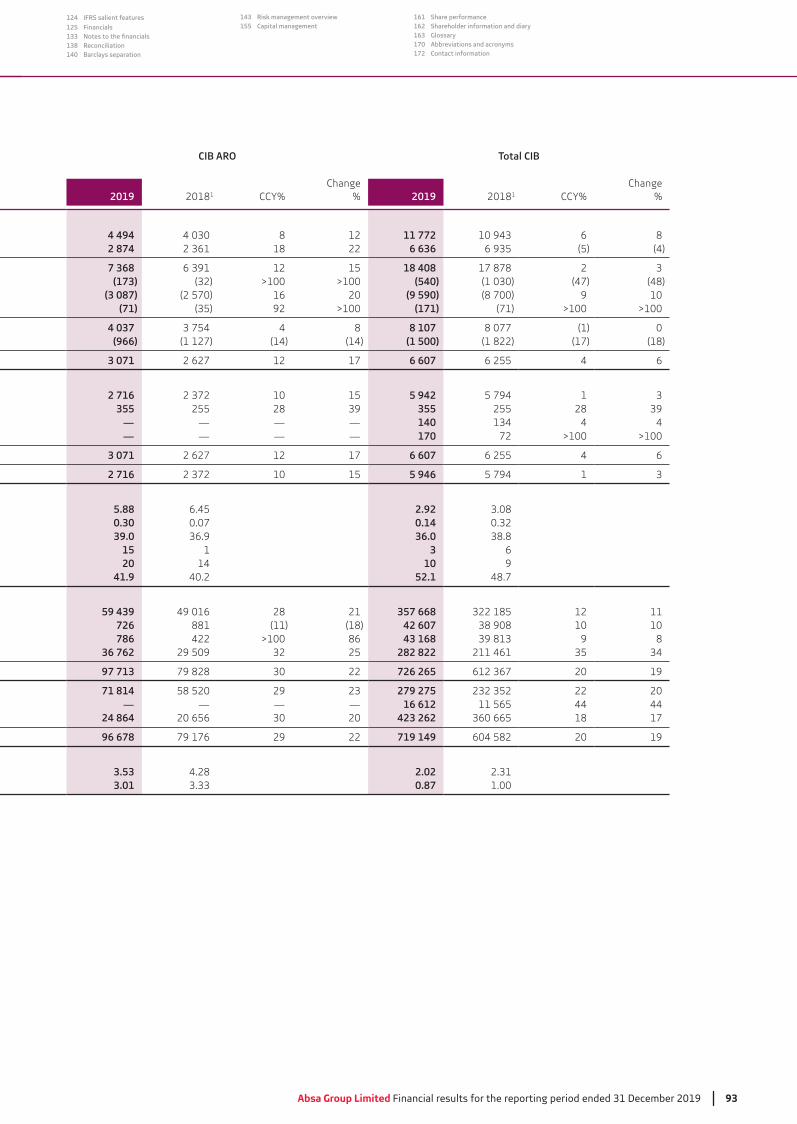
Absa Group Limited Financial results for the reporting period ended 31 December 2019 93
124 IFRS salient features
125 Financials133138 Reconciliation140 Barclays separation
143 Risk management overview155 Capital management
161 Share performance162 Shareholder information and diary163 Glossary170 Abbreviations and acronyms172 Contact information
CIB ARO
2019 20181 CCY%Change
% 2019 20181 CCY%Change
%
4 494 8 12 11 772 6 82 874 18 22 6 636 (5) (4)
7 368 12 15 18 408 17 878 2(173) >100 >100 (540) (47) (48)
(3 087) (2 570) 16 20 (9 590) (8 700) 9 10(71) 92 >100 (171) (71) >100 >100
4 037 4 8 8 107 8 077 (1) 0(966) (1 127) (14) (14) (1 500) (1 822) (17) (18)
3 071 2 627 12 17 6 607 6 255 4 6
2 716 10 15 5 942 5 794 1355 255 28 355 255 28
— — — — 140 4 4— — — — 170 72 >100 >100
3 071 2 627 12 17 6 607 6 255 4 6
2 716 10 15 5 946 5 794 1
5.88 6.45 2.920.30 0.07 0.1439.0 36.0
15 1 3 620 14 10 9
41.9 40.2 52.1 48.7
59 439 49 016 28 21 357 668 12 11726 881 (11) (18) 42 607 10 10786 422 >100 86 43 168 9 8
36 762 29 509 25 282 822 211 461
97 713 79 828 22 726 265 20 19
71 814 58 520 29 279 275 22 20— — — — 16 612 11 565 44 44
24 864 20 656 20 423 262 18 17
96 678 79 176 29 22 719 149 604 582 20 19
3.53 4.28 2.023.01 0.87 1.00
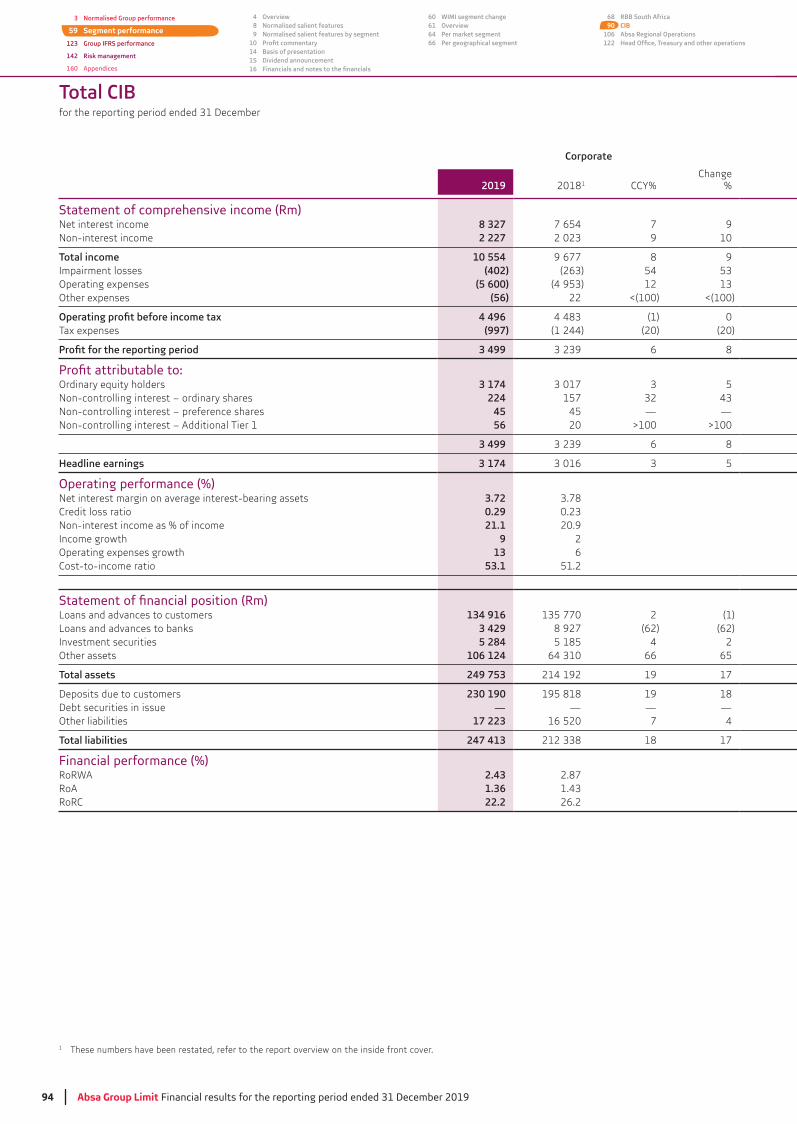
94 Absa Group Limit Financial results for the reporting period ended 31 December 2019
3 Normalised Group performance
59 Segment performance
123 Group IFRS performance
142 Risk management
160 Appendices
4 Overview8 Normalised salient features9 Normalised salient features by segment
1014 Basis of presentation15 Dividend announcement16
60 WIMI segment change61 Overview64 Per market segment66 Per geographical segment
68 RBB South Africa90 CIB
106 Absa Regional Operations122
Corporate
2019 20181 CCY%Change
%
Statement of comprehensive income (Rm)Net interest income 8 327 7 654 7 9Non-interest income 2 227 9 10
10 554 9 677 8 9Impairment losses (402) 54Operating expenses (5 600) 12Other expenses (56) 22 <(100) <(100)
4 496 (1) 0Tax expenses (997) (1 244) (20) (20)
3 499 6 8
Ordinary equity holders 3 174 5Non-controlling interest – ordinary shares 224 157Non-controlling interest – preference shares 45 45 — —Non-controlling interest – Additional Tier 1 56 20 >100 >100
3 499 6 8
Headline earnings 3 174 5
Operating performance (%) Net interest margin on average interest-bearing assets 3.72Credit loss ratio 0.29Non-interest income as % of income 21.1 20.9Income growth 9 2Operating expenses growth 13 6Cost-to-income ratio 53.1 51.2
Loans and advances to customers 134 916 2 (1)Loans and advances to banks 3 429 8 927 (62) (62)Investment securities 5 284 5 185 4 2Other assets 106 124 66 65
249 753 214 192 19 17
Deposits due to customers 230 190 195 818 19 18Debt securities in issue — — — —Other liabilities 17 223 16 520 7 4
247 413 18 17
Financial performance (%)RoRWA 2.43 2.87RoA 1.36RoRC 22.2 26.2
1 These numbers have been restated, refer to the report overview on the inside front cover.
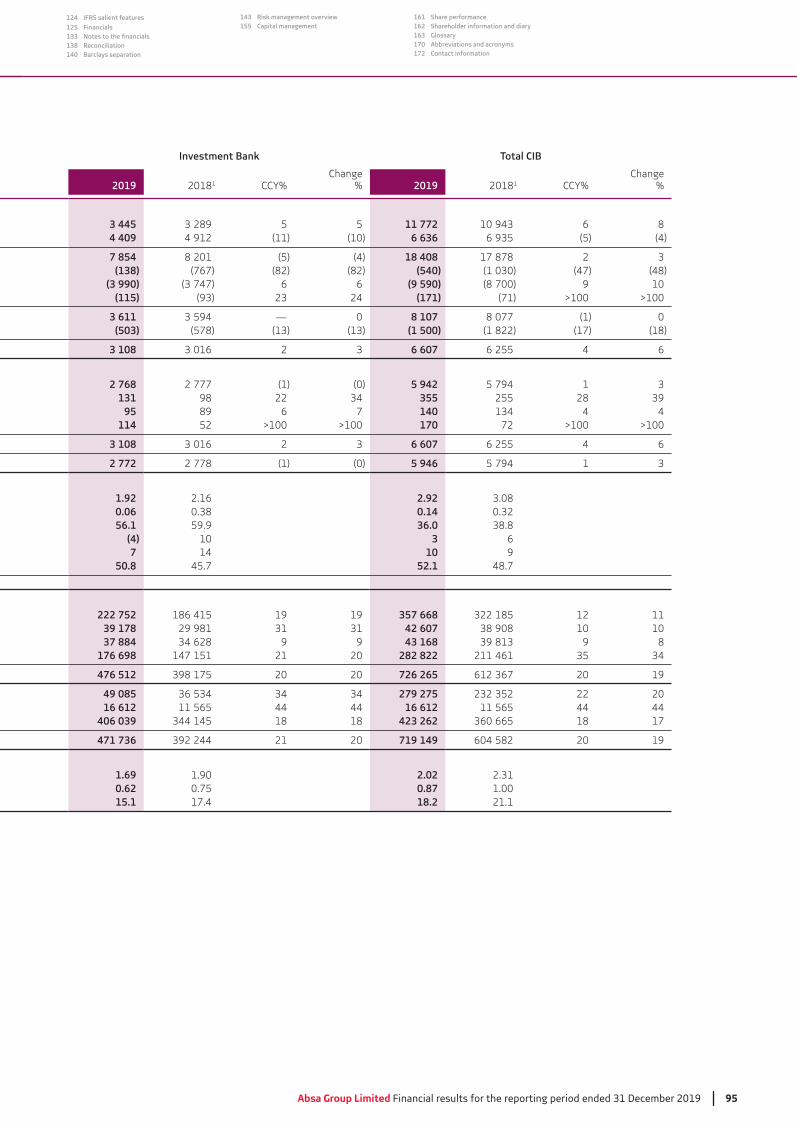
Absa Group Limited Financial results for the reporting period ended 31 December 2019 95
124 IFRS salient features
125 Financials133138 Reconciliation140 Barclays separation
143 Risk management overview155 Capital management
161 Share performance162 Shareholder information and diary163 Glossary170 Abbreviations and acronyms172 Contact information
Investment Bank
2019 20181 CCY%Change
% 2019 20181 CCY%Change
%
3 445 5 5 11 772 6 84 409 4 912 (11) (10) 6 636 (5) (4)
7 854 8 201 (5) (4) 18 408 17 878 2(138) (767) (82) (82) (540) (47) (48)
(3 990) 6 6 (9 590) (8 700) 9 10(115) 24 (171) (71) >100 >100
3 611 — 0 8 107 8 077 (1) 0(503) (578) (1 500) (1 822) (17) (18)
3 108 2 6 607 6 255 4 6
2 768 2 777 (1) (0) 5 942 5 794 1131 98 22 355 255 28
95 89 6 7 140 4 4114 52 >100 >100 170 72 >100 >100
3 108 2 6 607 6 255 4 6
2 772 2 778 (1) (0) 5 946 5 794 1
1.92 2.16 2.920.06 0.1456.1 59.9 36.0
(4) 10 3 67 14 10 9
50.8 45.7 52.1 48.7
222 752 186 415 19 19 357 668 12 1139 178 29 981 42 607 10 1037 884 9 9 43 168 9 8
176 698 147 151 21 20 282 822 211 461
476 512 20 20 726 265 20 19
49 085 279 275 22 2016 612 11 565 44 44 16 612 11 565 44 44
406 039 18 18 423 262 18 17
471 736 21 20 719 149 604 582 20 19
1.69 1.90 2.020.62 0.75 0.87 1.0015.1 17.4 18.2 21.1
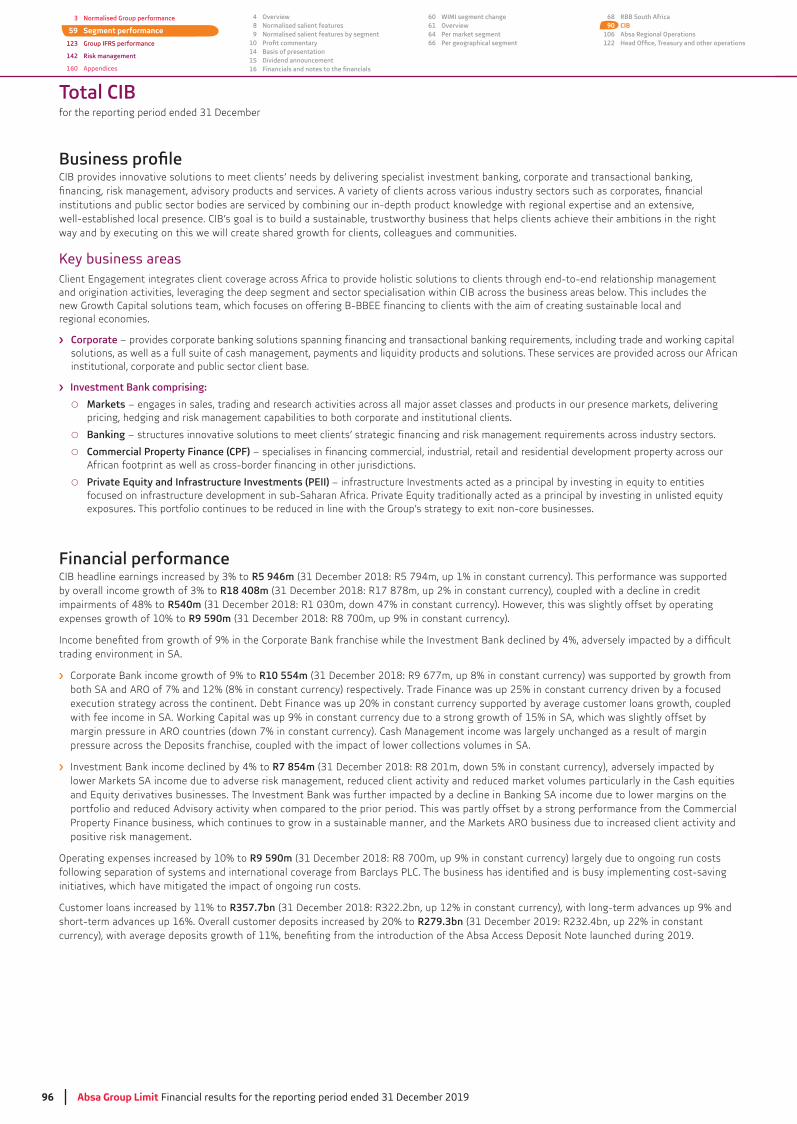
96 Absa Group Limit Financial results for the reporting period ended 31 December 2019
3 Normalised Group performance
59 Segment performance
123 Group IFRS performance
142 Risk management
160 Appendices
4 Overview8 Normalised salient features9 Normalised salient features by segment
1014 Basis of presentation15 Dividend announcement16
60 WIMI segment change61 Overview64 Per market segment66 Per geographical segment
68 RBB South Africa90 CIB
106 Absa Regional Operations122
CIB provides innovative solutions to meet clients’ needs by delivering specialist investment banking, corporate and transactional banking,
institutions and public sector bodies are serviced by combining our in-depth product knowledge with regional expertise and an extensive, well-established local presence. CIB’s goal is to build a sustainable, trustworthy business that helps clients achieve their ambitions in the right way and by executing on this we will create shared growth for clients, colleagues and communities.
Key business areasClient Engagement integrates client coverage across Africa to provide holistic solutions to clients through end-to-end relationship management and origination activities, leveraging the deep segment and sector specialisation within CIB across the business areas below. This includes the new Growth Capital solutions team, which focuses on offering B-BBEE financing to clients with the aim of creating sustainable local and regional economies.
Corporate – provides corporate banking solutions spanning financing and transactional banking requirements, including trade and working capital solutions, as well as a full suite of cash management, payments and liquidity products and solutions. These services are provided across our African institutional, corporate and public sector client base.
Investment Bank comprising:
Markets – engages in sales, trading and research activities across all major asset classes and products in our presence markets, delivering pricing, hedging and risk management capabilities to both corporate and institutional clients.
Banking – structures innovative solutions to meet clients’ strategic financing and risk management requirements across industry sectors.
Commercial Property Finance (CPF) – specialises in financing commercial, industrial, retail and residential development property across our African footprint as well as cross-border financing in other jurisdictions.
Private Equity and Infrastructure Investments (PEII) – infrastructure Investments acted as a principal by investing in equity to entities
exposures. This portfolio continues to be reduced in line with the Group’s strategy to exit non-core businesses.
Financial performanceR5 946m
R18 408mimpairments of 48% to R540mexpenses growth of 10% to R9 590m
trading environment in SA.
Corporate Bank income growth of 9% to R10 554mboth SA and ARO of 7% and 12% (8% in constant currency) respectively. Trade Finance was up 25% in constant currency driven by a focused execution strategy across the continent. Debt Finance was up 20% in constant currency supported by average customer loans growth, coupled with fee income in SA. Working Capital was up 9% in constant currency due to a strong growth of 15% in SA, which was slightly offset by margin pressure in ARO countries (down 7% in constant currency). Cash Management income was largely unchanged as a result of margin pressure across the Deposits franchise, coupled with the impact of lower collections volumes in SA.
Investment Bank income declined by 4% to R7 854mlower Markets SA income due to adverse risk management, reduced client activity and reduced market volumes particularly in the Cash equities and Equity derivatives businesses. The Investment Bank was further impacted by a decline in Banking SA income due to lower margins on the portfolio and reduced Advisory activity when compared to the prior period. This was partly offset by a strong performance from the Commercial
positive risk management.
Operating expenses increased by 10% to R9 590m
initiatives, which have mitigated the impact of ongoing run costs.
Customer loans increased by 11% to R357.7bnshort-term advances up 16%. Overall customer deposits increased by 20% to R279.3bn

Absa Group Limited Financial results for the reporting period ended 31 December 2019 97
124 IFRS salient features
125 Financials133138 Reconciliation140 Barclays separation
143 Risk management overview155 Capital management
161 Share performance162 Shareholder information and diary163 Glossary170 Abbreviations and acronyms172 Contact information
Financial performance (continued)
Headline earnings (Rm and change %)
2018 2019
SAARO
5%
2018 20192018 2019
Corporate Bank
(0%)
Investment Bank
3%
Total CIB
1 223 2 0073 230
2 716
765
1 951
1 202
1 814
2 220
558
3 422
2 372
8% 37% 15%
(6%)
(10%)
2%
3 0163 174 2 778 2 772
5 794 5 946
Gross income mix (Rm and change %)
9 677
10 554
4 659
215475 666
79 (43)89
5 197
(1)(28%)
(98%)
CorporateBank
Markets Banking CommercialPropertyFinance
Private Equityand Infrastructure
Investments
Other
7%
40%13%
5 237
4 687
4 9905 317
2 493 2 441
3 493
2 528
1 7042 131
12%
9%
(10%)
(2%)
CIB SA 2018CIB SA 2019CIB ARO 2018CIB ARO 2019
25%
2018 2019 2018 2019 2018 2019 2018 2019 2018 2019 2018 2019
Business performance The Corporate and Investment Bank delivered a credible performance in a challenging local, regional and global economy. The financial performance was adversely impacted by tough trading conditions in SA, which in turn impacted returns.
These were the key milestones from this period:
The business completed the operating model review and implementation, with notable progress made towards transforming the business to
business to be a globally scalable business by bolstering relationships and driving more connectivity with global clients.
the China corridor.
Overall client experience improved, mainly driven by increased satisfaction with operational touchpoints and more effective complaints handling, this being further validated by numerous awards from Euromoney and Global Finance including best Investment Bank in Africa.
In addition to the above, 75% of the Separation programme is now complete. The programme is delivering within the time and budget.

98 Absa Group Limit Financial results for the reporting period ended 31 December 2019
3 Normalised Group performance
59 Segment performance
123 Group IFRS performance
142 Risk management
160 Appendices
4 Overview8 Normalised salient features9 Normalised salient features by segment
1014 Basis of presentation15 Dividend announcement16
60 WIMI segment change61 Overview64 Per market segment66 Per geographical segment
68 RBB South Africa90 CIB
106 Absa Regional Operations122
Business performance (continued)
First half of the year:
Investment Bank of the Year, African Banker Awards;
Sales team, Financial Mail;
1st place in Research in Fixed Income Securities, Financial Mail;
2nd place: Innovative Research, Domestic Economic Trends, Credit Analysis, Technical Analysis, Small and Medium-Cap Equities, Financial Mail;
Execution in Derivatives;
Best M&A Bank in Africa, Global Finance;
Financial Institutions deal of the year 2019, Bonds, Loans and Sukuk Middle East;
Structured deal of the year 2019, Bonds, Loans and Sukuk Middle East;
Export Finance deal of the year 2019, Bonds, Loans and Sukuk Middle East.
Second half of the year:
Best Investment Bank – Botswana, EMEA Africa Banking Awards;
Best Investment Bank – South Africa, EMEA Africa Banking Awards;
Best Investment Bank – Tanzania, EMEA Africa Banking Awards;
Best Investment Bank – Zambia, EMEA Africa Banking Awards;
Best Loan House – South Africa, EMEA Africa Banking Awards;
Best Equity House – Mozambique, EMEA Africa Banking Awards;
Best Cash Management, Euromoney;
Market leader in Ghana and Zambia, Euromoney;
Best Service, Ghana, Euromoney;
Best Transaction Bank – Botswana, The Asian Banker;
Best Trade Finance Bank – Uganda, The Asian Banker;
Best Cash Management – Botswana, The Asian Banker;
Best Cash Management – Tanzania, The Asian Banker;
Best Cash Management – Zambia, The Asian Banker;
Best Islamic Corporate Bank South Africa, Global Banking & Finance Awards;
New Funds Shari’ah Top 40 Index Equity Exchange Traded Fund, Global Islamic Finance Awards.
Corporate BankThe Corporate Bank franchise delivered income growth of 9% to R10 554m
R5 317mby 12% to R5 237m
Non-interest income increased by 10% to R2 227m
in the collections book.
Net interest income increased by 9% to R8 327mgrowth of 15% to R126.8bnR216.9bn
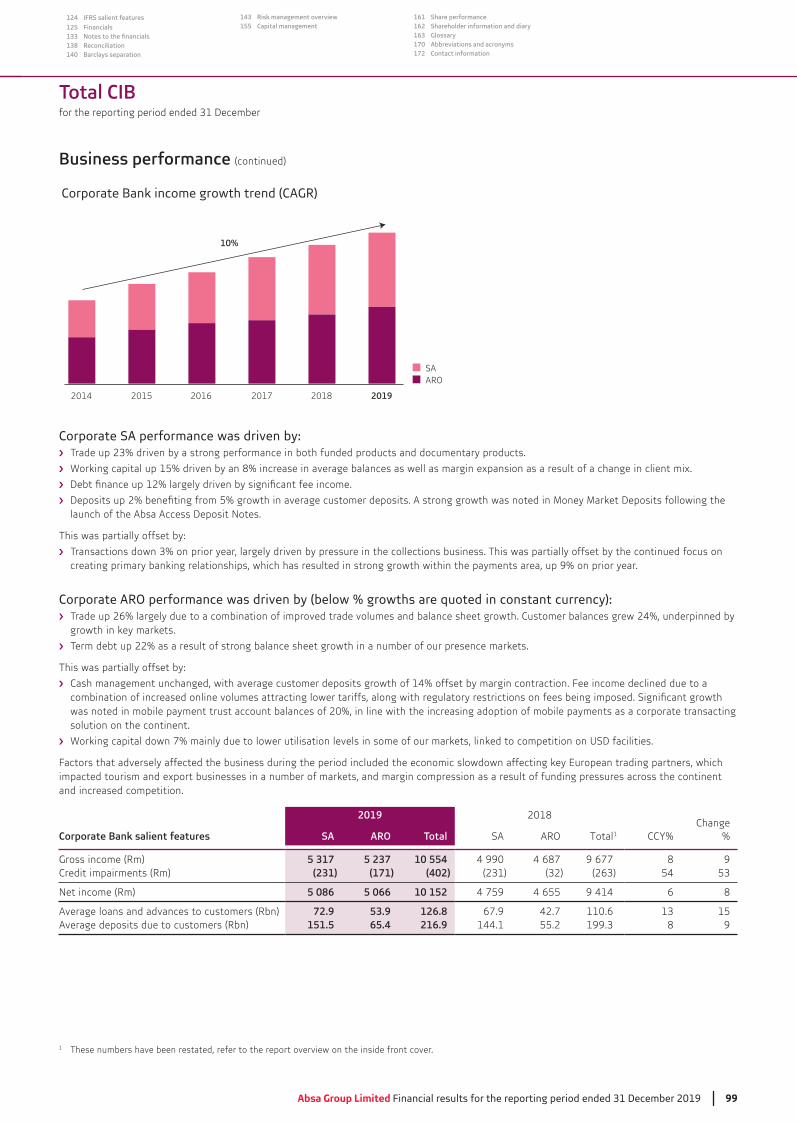
Absa Group Limited Financial results for the reporting period ended 31 December 2019 99
124 IFRS salient features
125 Financials133138 Reconciliation140 Barclays separation
143 Risk management overview155 Capital management
161 Share performance162 Shareholder information and diary163 Glossary170 Abbreviations and acronyms172 Contact information
Business performance (continued)
2016 2017 2018 20192015
Corporate Bank income growth trend (CAGR)
10%
2014
SAARO
Working capital up 15% driven by an 8% increase in average balances as well as margin expansion as a result of a change in client mix.
launch of the Absa Access Deposit Notes.
This was partially offset by:
creating primary banking relationships, which has resulted in strong growth within the payments area, up 9% on prior year.
Trade up 26% largely due to a combination of improved trade volumes and balance sheet growth. Customer balances grew 24%, underpinned by growth in key markets.
Term debt up 22% as a result of strong balance sheet growth in a number of our presence markets.
This was partially offset by:
Cash management unchanged, with average customer deposits growth of 14% offset by margin contraction. Fee income declined due to a
was noted in mobile payment trust account balances of 20%, in line with the increasing adoption of mobile payments as a corporate transacting solution on the continent.
Working capital down 7% mainly due to lower utilisation levels in some of our markets, linked to competition on USD facilities.
Factors that adversely affected the business during the period included the economic slowdown affecting key European trading partners, which impacted tourism and export businesses in a number of markets, and margin compression as a result of funding pressures across the continent and increased competition.
2019 2018
Corporate Bank salient features SA ARO SA ARO Total1 CCY%Change
%
Gross income (Rm) 5 317 5 237 10 554 4 990 4 687 9 677 8 9Credit impairments (Rm) (231) (171) (402) 54
Net income (Rm) 5 086 5 066 10 152 4 759 4 655 9 414 6 8
Average loans and advances to customers (Rbn) 72.9 53.9 126.8 67.9 42.7 110.6 15Average deposits due to customers (Rbn) 151.5 65.4 216.9 144.1 55.2 8 9
1 These numbers have been restated, refer to the report overview on the inside front cover.

100 Absa Group Limit Financial results for the reporting period ended 31 December 2019
3 Normalised Group performance
59 Segment performance
123 Group IFRS performance
142 Risk management
160 Appendices
4 Overview8 Normalised salient features9 Normalised salient features by segment
1014 Basis of presentation15 Dividend announcement16
60 WIMI segment change61 Overview64 Per market segment66 Per geographical segment
68 RBB South Africa90 CIB
106 Absa Regional Operations122
Investment BankTotal Investment Bank income declined by 4% to R7 854mR5 723m R2 131m
The performance by business unit is below:
Global MarketsGlobal Markets income declined by 10% to R4 659mR2 528m R2 131m
The Markets SA performance was driven by:
R1 359m Decemberdid not repeat in this period, coupled with adverse risk management and market illiquidity driven by challenging macroeconomic conditions (both locally and globally). The offshore representative office continues to grow as the business model is embedded with increased institutional client on-boarding.
decreased by 7% to R823m December 2018: R882) due to difficult trading conditions resulting in adverse risk management, however, the client franchise has continued to grow and build momentum by deepening client relationships and driving the acquisition strategy. Furthermore, the Corporate options business increased as a result of continued focus on cross-selling and new client acquisitions.
Equities and Prime Services decreased by 65% to R255m December 2018: R724m) due to a reduction in client and market volumes globally. The institutional equities derivatives business was negatively impacted by a reduction in realised volatility, leading to a decrease in volumes and challenges in exiting risk. The Cash Equities business continued to build momentum through the on-boarding of International clients and the extension of research coverage to key sectors in SA.
The replacement, refresh and build-out of the electronic platforms within Global Markets continued making good progress during the period with a number of key initiatives completed.
Markets ARO delivered a strong performance across the portfolio with increased sales activity on account of broad-based FX market share gains as well as harnessing of the new institutional client base, while the business also reported positive risk management revenue. Year-on-year growth was seen in eight countries, driven by:
leading to product market share gains particularly in the Business Bank segment;
Discipline and dynamism regarding margin management for Corporate clients transacting on electronic trading platforms;
Effective risk management resulting in preservation of client margins.
This was partly offset by the following factors:
Interbank funding pressures in some key markets negatively impacted ability to price derivatives;
Increased competition from local banks;
Changes in liquidity across the continent providing fewer revenue opportunities.
20192018
Markets SA revenue client vs risk (Rbn)
Client facilitation riskInstitutionalCorporate
0.4
1.3
1.8
1.3
1.7
(0.5)

Absa Group Limited Financial results for the reporting period ended 31 December 2019 101
124 IFRS salient features
125 Financials133138 Reconciliation140 Barclays separation
143 Risk management overview155 Capital management
161 Share performance162 Shareholder information and diary163 Glossary170 Abbreviations and acronyms172 Contact information
Business performance (continued)
Investment Bank (continued)
Global Markets (continued)
20182019
Global markets gross income split (Rm and change %)
1 761
1 359
882 823 724
255126 91
Fixed incomeand credit
Foreign exchange and commodities
Equities and prime services
(23%)
Other
(7%) 25%(65%)
ARO
1 704
2 131
28%
0
5
10
15
20
25
20182019
Daily markets income distribution (%)
< -3
5
-35
to <
-30
-30
to <
-25
-25
to <
-20
-20
to <
-15
-15
to <
-10
-10
to <
-5
-5 t
o <
0
0 to
< 5
5 to
< 1
0
10 t
o <
15
15 t
o <
20
20 t
o <
25
25 t
o <
30
30 t
o <
35
35 t
o <
40
40 t
o <
45
45 t
o <
50
> 5
0
Banking SABanking SA income declined by 2% at R2 441m
Continued pressure on the SA business landscape affecting the debt portfolio, coupled with lower fee income from the Advisory business
adversely impacted by continued margin compression due to competitive pricing and growth in preference share investments.
Overall average customer advances growth of 14% to R118.4bn
Credit impairments have declined by 88%, from a high base.
Salient features 2019 20181
Change%
Gross income (Rm) 2 441 (2)Credit impairment (Rm) (94) (805) (88)
Net income (Rm) 2 347 1 688
Average loans and advances to customers (Rbn) 118.4 104.2 14
Commercial Property Finance SA (CPF)
R666m
increased presence therein, as well as margin expansion. Non-interest income increased by 9%.
Salient features 2019 20181
Change%
Gross income (Rm) 666 475 40Credit impairment (Rm) (40) 17 <(100)
Net income (Rm) 626 492 27
Average portfolio assets (Rbn) 44.6
1 These numbers have been restated, refer to the report overview on the inside front cover.
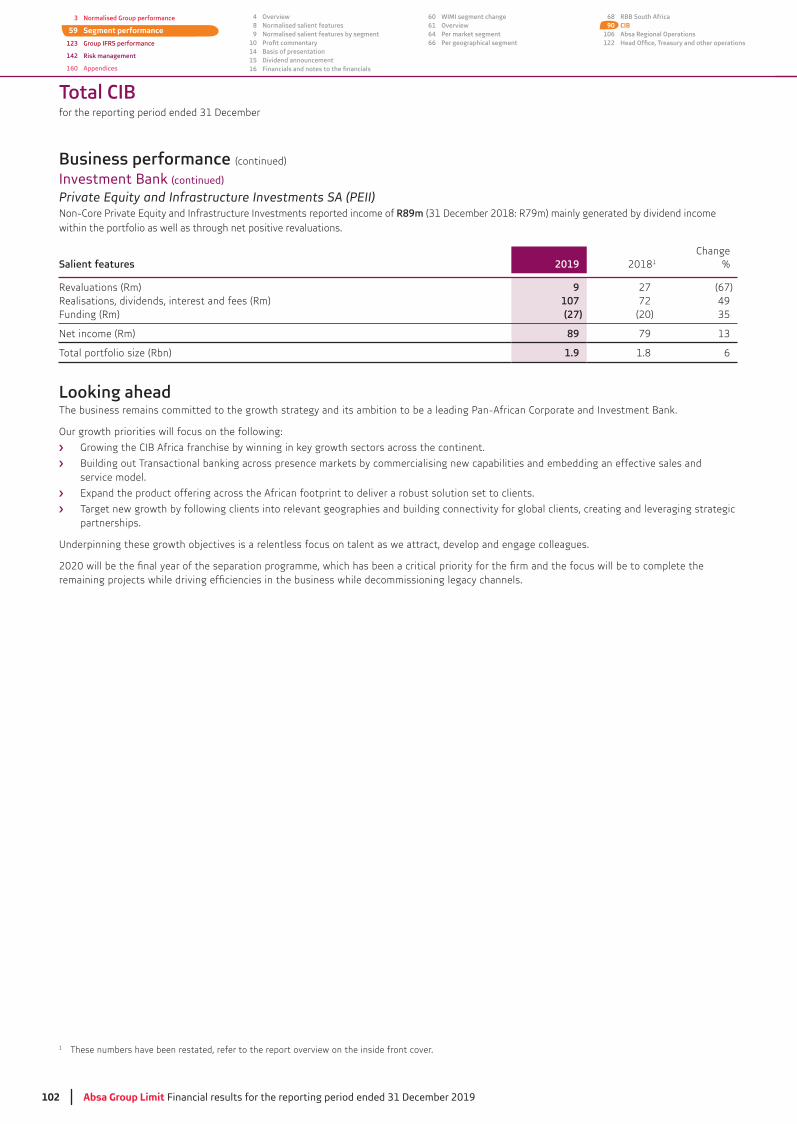
102 Absa Group Limit Financial results for the reporting period ended 31 December 2019
3 Normalised Group performance
59 Segment performance
123 Group IFRS performance
142 Risk management
160 Appendices
4 Overview8 Normalised salient features9 Normalised salient features by segment
1014 Basis of presentation15 Dividend announcement16
60 WIMI segment change61 Overview64 Per market segment66 Per geographical segment
68 RBB South Africa90 CIB
106 Absa Regional Operations122
Business performance (continued)
Investment Bank (continued)
Private Equity and Infrastructure Investments SA (PEII)R89m
within the portfolio as well as through net positive revaluations.
Salient features 2019 20181
Change%
Revaluations (Rm) 9 27 (67)Realisations, dividends, interest and fees (Rm) 107 72 49Funding (Rm) (27) (20)
Net income (Rm) 89 79
Total portfolio size (Rbn) 1.9 1.8 6
Looking ahead
Our growth priorities will focus on the following:
Growing the CIB Africa franchise by winning in key growth sectors across the continent.
Building out Transactional banking across presence markets by commercialising new capabilities and embedding an effective sales and service model.
Expand the product offering across the African footprint to deliver a robust solution set to clients.
Target new growth by following clients into relevant geographies and building connectivity for global clients, creating and leveraging strategic partnerships.
Underpinning these growth objectives is a relentless focus on talent as we attract, develop and engage colleagues.
1 These numbers have been restated, refer to the report overview on the inside front cover.

Absa Group Limited Financial results for the reporting period ended 31 December 2019 103
124 IFRS salient features
125 Financials133138 Reconciliation140 Barclays separation
143 Risk management overview155 Capital management
161 Share performance162 Shareholder information and diary163 Glossary170 Abbreviations and acronyms172 Contact information
This page has been left blank intentionally
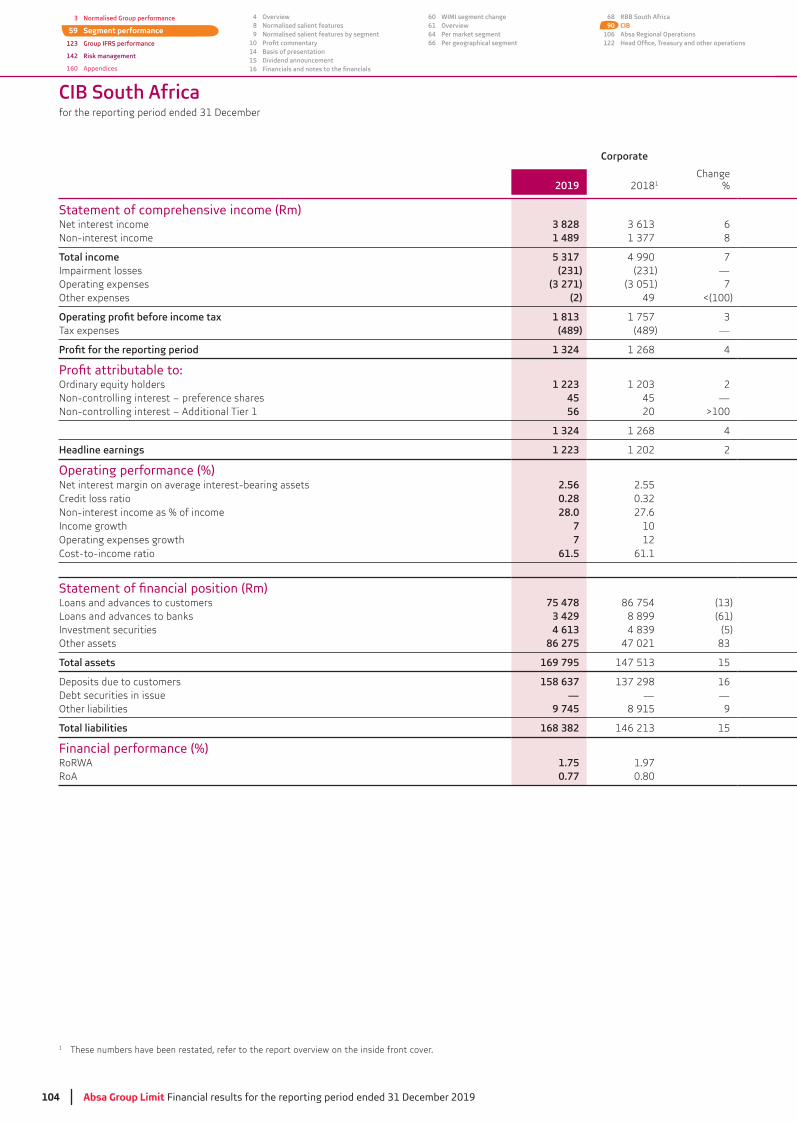
104 Absa Group Limit Financial results for the reporting period ended 31 December 2019
CIB South Africa
Corporate
2019 20181Change
%
Statement of comprehensive income (Rm)Net interest income 3 828 6Non-interest income 1 489 8
5 317 4 990 7Impairment losses (231) —Operating expenses (3 271) 7Other expenses (2) 49 <(100)
1 813 1 757Tax expenses (489) (489) —
1 324 1 268 4
Ordinary equity holders 1 223 2Non-controlling interest – preference shares 45 45 —Non-controlling interest – Additional Tier 1 56 20 >100
1 324 1 268 4
Headline earnings 1 223 1 202 2
Operating performance (%) Net interest margin on average interest-bearing assets 2.56 2.55Credit loss ratio 0.28Non-interest income as % of income 28.0 27.6Income growth 7 10Operating expenses growth 7 12Cost-to-income ratio 61.5 61.1
Loans and advances to customers 75 478 86 754Loans and advances to banks 3 429 8 899 (61)Investment securities 4 613 (5)Other assets 86 275 47 021
169 795 15
Deposits due to customers 158 637 16Debt securities in issue — — —Other liabilities 9 745 8 915 9
168 382 15
Financial performance (%)RoRWA 1.75 1.97RoA 0.77 0.80
1 These numbers have been restated, refer to the report overview on the inside front cover.
3 Normalised Group performance
59 Segment performance
123 Group IFRS performance
142 Risk management
160 Appendices
4 Overview8 Normalised salient features9 Normalised salient features by segment
1014 Basis of presentation15 Dividend announcement16
60 WIMI segment change61 Overview64 Per market segment66 Per geographical segment
68 RBB South Africa90 CIB
106 Absa Regional Operations122
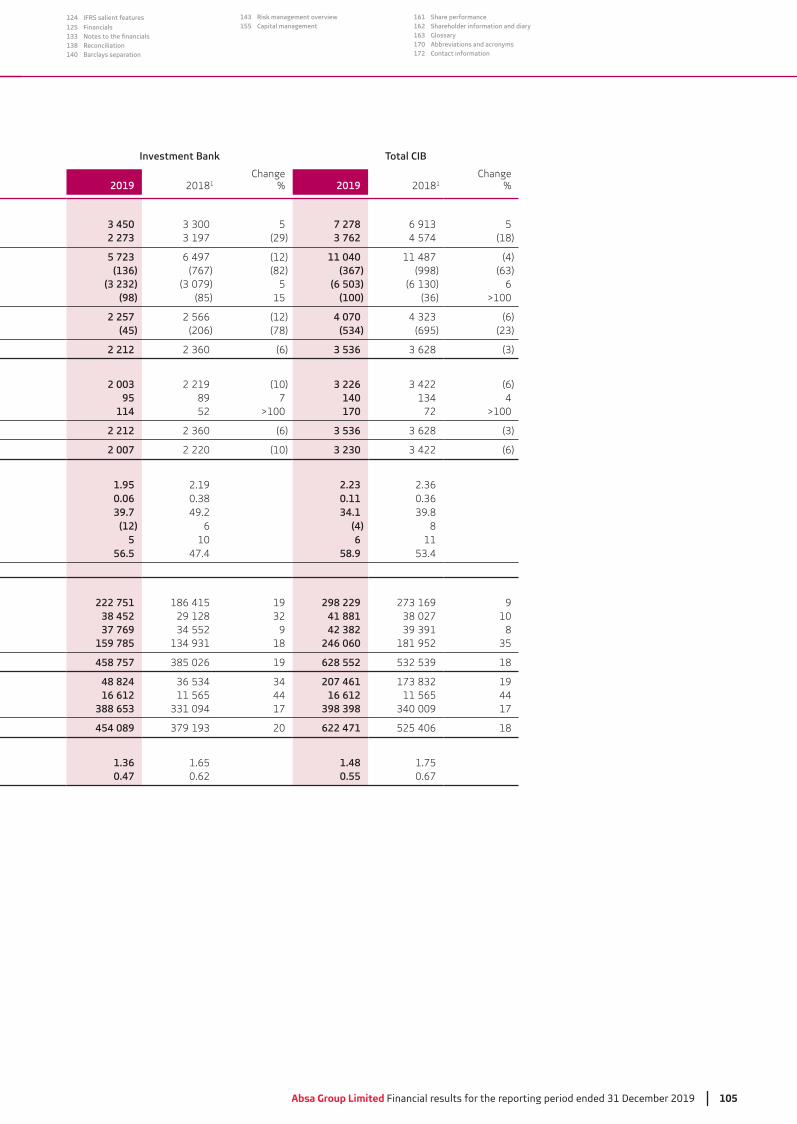
Absa Group Limited Financial results for the reporting period ended 31 December 2019 105
124 IFRS salient features
125 Financials133138 Reconciliation140 Barclays separation
143 Risk management overview155 Capital management
161 Share performance162 Shareholder information and diary163 Glossary170 Abbreviations and acronyms172 Contact information
Investment Bank
2019 20181Change
% 2019 20181Change
%
3 450 5 7 278 52 273 (29) 3 762 4 574 (18)
5 723 6 497 (12) 11 040 11 487 (4)(136) (767) (82) (367) (998)
(3 232) 5 (6 503) 6(98) (85) 15 (100) >100
2 257 2 566 (12) 4 070 (6)(45) (206) (78) (534) (695)
2 212 (6) 3 536
2 003 2 219 (10) 3 226 (6)95 89 7 140 4
114 52 >100 170 72 >100
2 212 (6) 3 536
2 007 2 220 (10) 3 230 (6)
1.95 2.19 2.230.06 0.1139.7 49.2 34.1
(12) 6 (4) 85 10 6 11
56.5 47.4 58.9
222 751 186 415 19 298 229 938 452 29 128 41 881 1037 769 9 42 382 8
159 785 18 246 060 181 952
458 757 19 628 552 18
48 824 207 461 1916 612 11 565 44 16 612 11 565 44
388 653 17 398 398 17
454 089 20 622 471 525 406 18
1.36 1.65 1.48 1.750.47 0.62 0.55 0.67
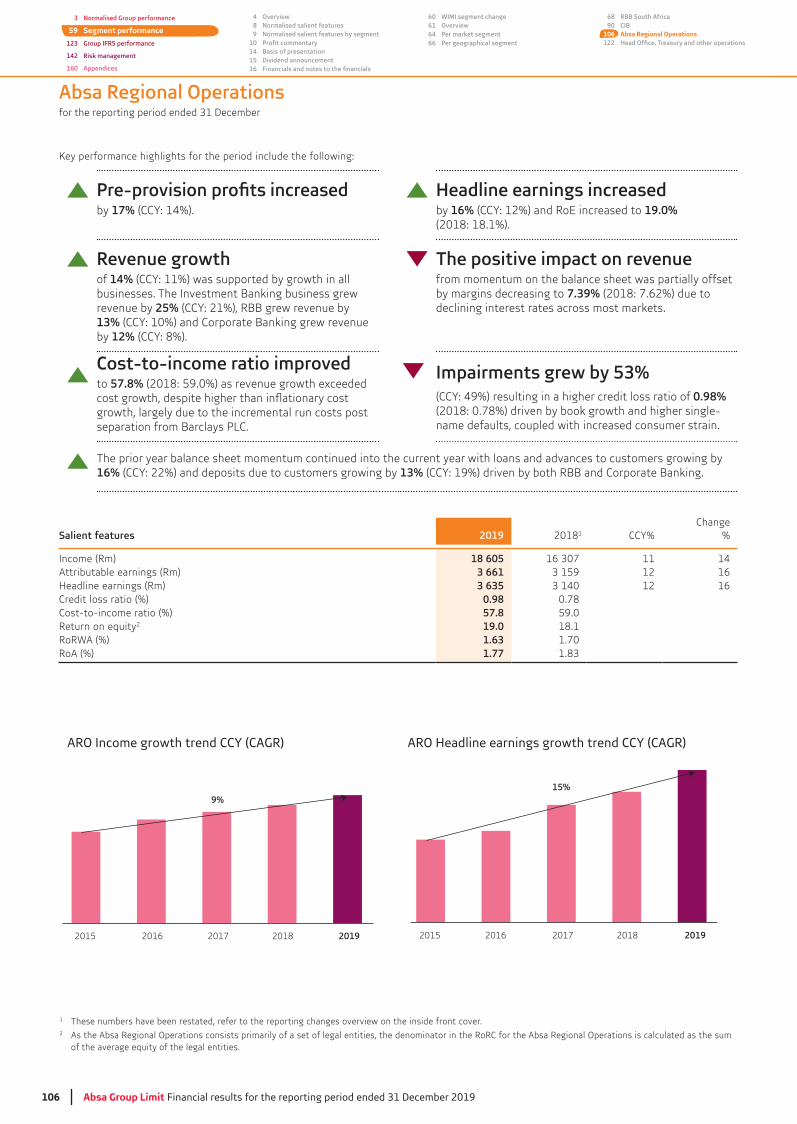
106 Absa Group Limit Financial results for the reporting period ended 31 December 2019
3 Normalised Group performance
59 Segment performance
123 Group IFRS performance
142 Risk management
160 Appendices
4 Overview8 Normalised salient features9 Normalised salient features by segment
1014 Basis of presentation15 Dividend announcement16
60 WIMI segment change61 Overview64 Per market segment66 Per geographical segment
68 RBB South Africa90 CIB
106 Absa Regional Operations122
Absa Regional Operations
by 17% (CCY: 14%).
Headline earnings increased
by 16% (CCY: 12%) and RoE increased to 19.0% (2018: 18.1%).
Revenue growth
of 14% (CCY: 11%) was supported by growth in all businesses. The Investment Banking business grew revenue by 25% (CCY: 21%), RBB grew revenue by 13% (CCY: 10%) and Corporate Banking grew revenue by 12% (CCY: 8%).
from momentum on the balance sheet was partially offset by margins decreasing to 7.39% (2018: 7.62%) due to declining interest rates across most markets.
Cost-to-income ratio improved
to 57.8% (2018: 59.0%) as revenue growth exceeded
growth, largely due to the incremental run costs post separation from Barclays .
Impairments grew by 53% (CCY: 49%) resulting in a higher credit loss ratio of 0.98% (2018: 0.78%) driven by book growth and higher single-name defaults, coupled with increased consumer strain.
The prior year balance sheet momentum continued into the current year with loans and advances to customers growing by 16% (CCY: 22%) and deposits due to customers growing by 13% (CCY: 19%) driven by both RBB and Corporate Banking.
Salient features 2019 20181 CCY%Change
%
Income (Rm) 18 605 11 14Attributable earnings (Rm) 3 661 12 16Headline earnings (Rm) 3 635 12 16Credit loss ratio (%) 0.98 0.78Cost-to-income ratio (%) 57.8 59.0Return on equity2 19.0 18.1RoRWA (%) 1.63 1.70RoA (%) 1.77
1 These numbers have been restated, refer to the reporting changes overview on the inside front cover.2 As the Absa Regional Operations consists primarily of a set of legal entities, the denominator in the RoRC for the Absa Regional Operations is calculated as the sum
of the average equity of the legal entities.
2016 2017 2018 20192015
ARO Income growth trend CCY (CAGR)
9%
2016 2017 2018 20192015
ARO Headline earnings growth trend CCY (CAGR)
15%

Absa Group Limited Financial results for the reporting period ended 31 December 2019 107
124 IFRS salient features
125 Financials133138 Reconciliation140 Barclays separation
143 Risk management overview155 Capital management
161 Share performance162 Shareholder information and diary163 Glossary170 Abbreviations and acronyms172 Contact information
This page has been left blank intentionally
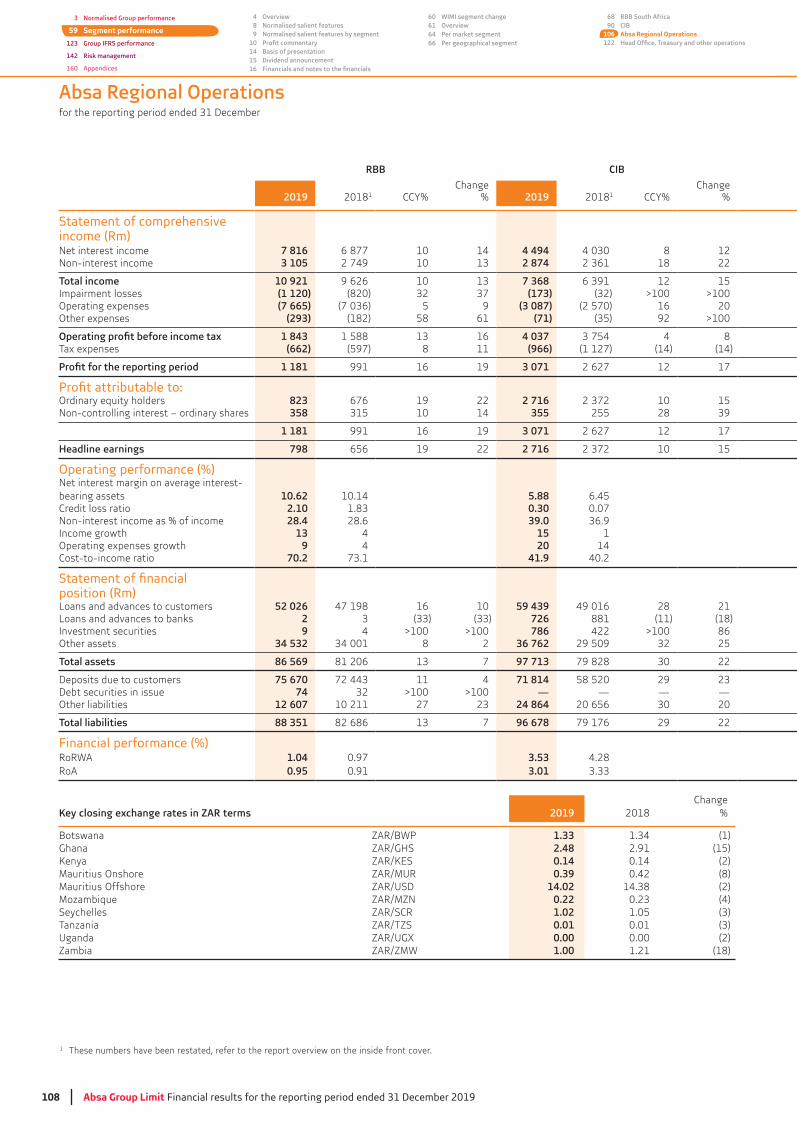
108 Absa Group Limit Financial results for the reporting period ended 31 December 2019
Absa Regional Operations
RBB CIB
2019 20181 CCY%Change
% 2019 20181 CCY%Change
%
Statement of comprehensive income (Rm)Net interest income 7 816 6 877 10 14 4 494 8 12Non-interest income 3 105 2 749 10 2 874 18 22
10 921 9 626 10 7 368 12 15Impairment losses (1 120) (820) (173) >100 >100 Operating expenses (7 665) 5 9 (3 087) (2 570) 16 20Other expenses (293) (182) 58 61 (71) 92 >100
1 843 1 588 16 4 037 4 8Tax expenses (662) (597) 8 11 (966) (1 127) (14) (14)
1 181 991 16 19 3 071 2 627 12 17
Ordinary equity holders 823 676 19 22 2 716 10 15Non-controlling interest – ordinary shares 358 10 14 355 255 28
1 181 991 16 19 3 071 2 627 12 17
Headline earnings 798 656 19 22 2 716 10 15
Operating performance (%) Net interest margin on average interest-bearing assets 10.62 10.14 5.88 6.45Credit loss ratio 2.10 0.30 0.07Non-interest income as % of income 28.4 28.6 39.0Income growth 13 4 15 1Operating expenses growth 9 4 20 14Cost-to-income ratio 70.2 41.9 40.2
position (Rm)Loans and advances to customers 52 026 47 198 16 10 59 439 49 016 28 21Loans and advances to banks 2 726 881 (11) (18)Investment securities 9 4 >100 >100 786 422 >100 86Other assets 34 532 8 2 36 762 29 509 25
86 569 81 206 7 97 713 79 828 22
Deposits due to customers 75 670 11 4 71 814 58 520 29Debt securities in issue 74 >100 >100 — — — —Other liabilities 12 607 10 211 27 24 864 20 656 20
88 351 82 686 7 96 678 79 176 29 22
Financial performance (%)RoRWA 1.04 0.97 3.53 4.28RoA 0.95 0.91 3.01
2019 2018Change
%
Botswana 1.33 (1)Ghana ZAR/GHS 2.48 2.91 (15)
0.14 0.14 (2)Mauritius Onshore ZAR/MUR 0.39 0.42 (8)Mauritius Offshore ZAR/USD 14.02 (2)Mozambique ZAR/MZN 0.22 (4)Seychelles ZAR/SCR 1.02 1.05 Tanzania ZAR/TZS 0.01 0.01 Uganda ZAR/UGX 0.00 0.00 (2)Zambia ZAR/ZMW 1.00 1.21 (18)
1 These numbers have been restated, refer to the report overview on the inside front cover.
3 Normalised Group performance
59 Segment performance
123 Group IFRS performance
142 Risk management
160 Appendices
4 Overview8 Normalised salient features9 Normalised salient features by segment
1014 Basis of presentation15 Dividend announcement16
60 WIMI segment change61 Overview64 Per market segment66 Per geographical segment
68 RBB South Africa90 CIB
106 Absa Regional Operations122

Absa Group Limited Financial results for the reporting period ended 31 December 2019 109
124 IFRS salient features
125 Financials133138 Reconciliation140 Barclays separation
143 Risk management overview155 Capital management
161 Share performance162 Shareholder information and diary163 Glossary170 Abbreviations and acronyms172 Contact information
operations in Absa Regional Operations
2019 20181 CCY%Change
% 2019 20181 CCY%Change
%
254 246 12 564 962 44 42 41 6 041 5 154 14 17
316 290 9 9 18 605 11 1480 58 26 (1 213) (794) 49(1) (19) (92) (95) (10 753) (9 625) 8 12(3) 17 <(100) <(100) (367) (200) 77 84
392 11 6 272 5 688 7 10(275) (260) 8 6 (1 903) (1 984) (5) (4)
117 86 19 4 369 18
122 111 10 3 661 12 16(5) (25) (81) (80) 708 545
117 86 19 4 369 18
121 112 8 3 635 12 16
n/a n/a 7.39 7.62n/a n/a 0.98 0.78n/a n/a 32.5n/a n/a 14 5n/a n/a 12 7n/a n/a 57.8 59.0
— — — — 111 465 96 214 22 1614 119 46 14 847 11 278 4234 880 4 (2) 35 675 6 (1)
(15 294) (15 128) (7) 1 56 000 28 16
33 705 24 9 217 987 191 917 22 14
2 904 9 8 150 388 192 781 >100 >100 2 855 >100 >100 4 777 >100 48 42 248 24
10 462 7 244 89 44 195 491 169 106 24 16
n/a n/a 1.63 1.70n/a n/a 1.77
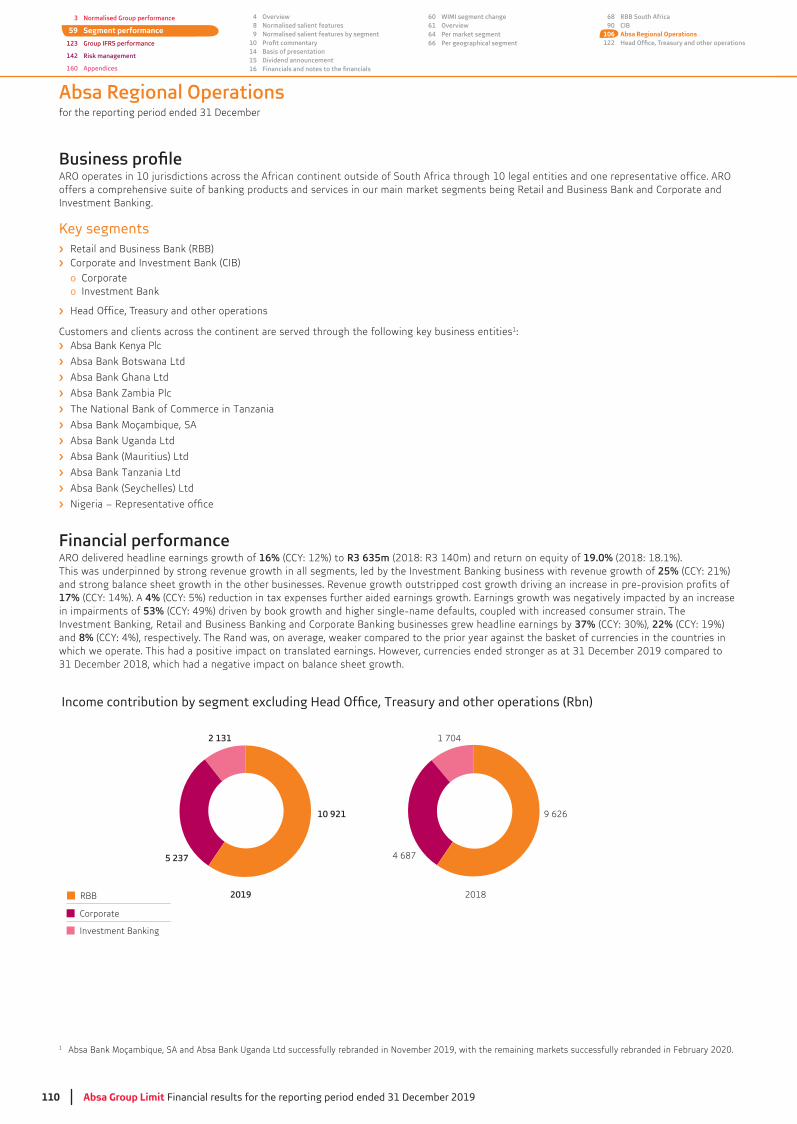
110 Absa Group Limit Financial results for the reporting period ended 31 December 2019
ARO operates in 10 jurisdictions across the African continent outside of South Africa through 10 legal entities and one representative office. ARO offers a comprehensive suite of banking products and services in our main market segments being Retail and Business Bank and Corporate and Investment Banking.
Key segments Retail and Business Bank (RBB)
Corporate and Investment Bank (CIB) o Corporate o Investment Bank
Head Office, Treasury and other operations
Customers and clients across the continent are served through the following key business entities1:
Absa Bank Botswana Ltd
Absa Bank Ghana Ltd
The National Bank of Commerce in Tanzania
Absa Bank Moçambique, SA
Absa Bank Uganda Ltd
Absa Bank (Mauritius) Ltd
Absa Bank Tanzania Ltd
Absa Bank (Seychelles) Ltd
Financial performanceARO delivered headline earnings growth of 16% (CCY: 12%) to R3 635m 19.0% (2018: 18.1%). This was underpinned by strong revenue growth in all segments, led by the Investment Banking business with revenue growth of 25% (CCY: 21%) and strong balance sheet growth in the other businesses. Revenue growth outstripped cost growth driving an increase in pre-provision profits of 17% (CCY: 14%). A 4% (CCY: 5%) reduction in tax expenses further aided earnings growth. Earnings growth was negatively impacted by an increase in impairments of 53% (CCY: 49%) driven by book growth and higher single-name defaults, coupled with increased consumer strain. The Investment Banking, Retail and Business Banking and Corporate Banking businesses grew headline earnings by 37% 22% (CCY: 19%) and 8% (CCY: 4%), respectively. The Rand was, on average, weaker compared to the prior year against the basket of currencies in the countries in
Absa Regional Operations
Income contribution by segment excluding Head Office, Treasury and other operations (Rbn)
Corporate
Investment Banking
RBB 2019
2 131
10 921
5 237
2018
1 704
9 626
4 687
1 Absa Bank Moçambique, SA and Absa Bank Uganda Ltd successfully rebranded in November 2019, with the remaining markets successfully rebranded in February 2020.
3 Normalised Group performance
59 Segment performance
123 Group IFRS performance
142 Risk management
160 Appendices
4 Overview8 Normalised salient features9 Normalised salient features by segment
1014 Basis of presentation15 Dividend announcement16
60 WIMI segment change61 Overview64 Per market segment66 Per geographical segment
68 RBB South Africa90 CIB
106 Absa Regional Operations122
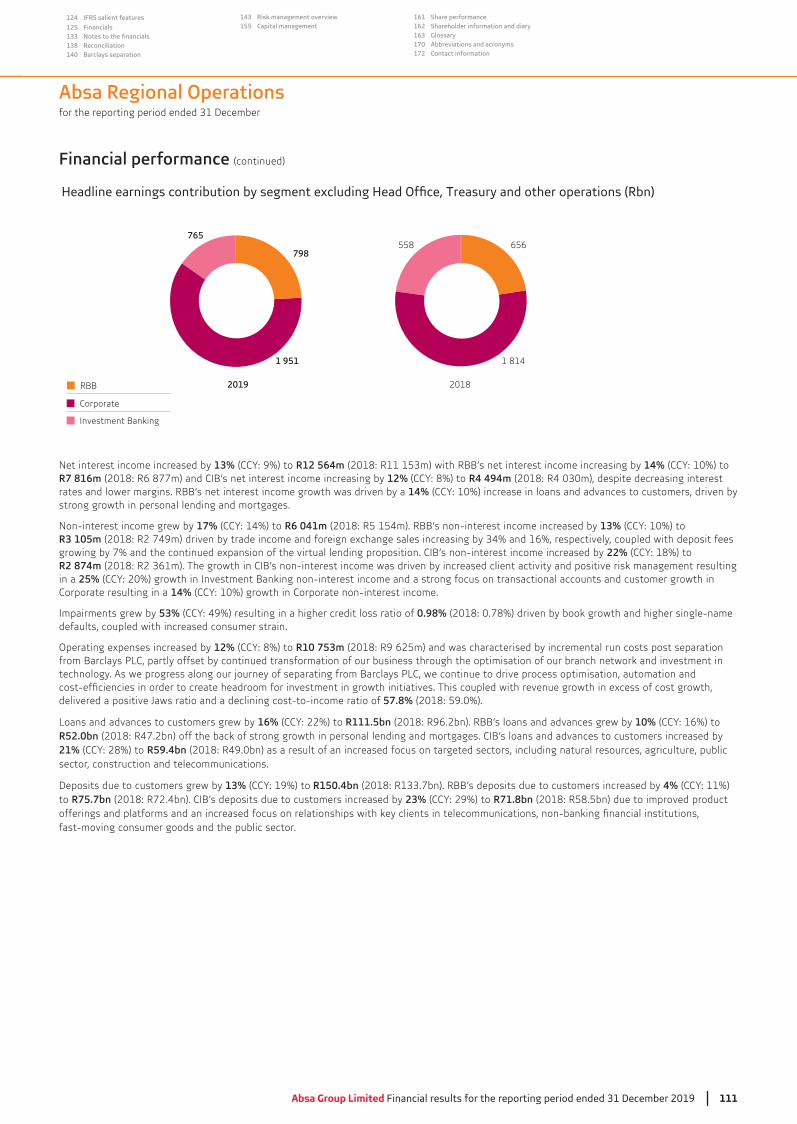
Absa Group Limited Financial results for the reporting period ended 31 December 2019 111
124 IFRS salient features
125 Financials133138 Reconciliation140 Barclays separation
143 Risk management overview155 Capital management
161 Share performance162 Shareholder information and diary163 Glossary170 Abbreviations and acronyms172 Contact information
Financial performance (continued)
Headline earnings contribution by segment excluding Head Office, Treasury and other operations (Rbn)
Corporate
Investment Banking
RBB 2018
558
1 814
656
2019
798
1 951
765
Net interest income increased by 13% (CCY: 9%) to R12 564m 14% (CCY: 10%) to R7 816m (2018: R6 877m) and CIB’s net interest income increasing by 12% (CCY: 8%) to R4 494mrates and lower margins. RBB’s net interest income growth was driven by a 14% (CCY: 10%) increase in loans and advances to customers, driven by strong growth in personal lending and mortgages.
Non-interest income grew by 17% (CCY: 14%) to R6 041m (2018: R5 154m). RBB’s non-interest income increased by 13% (CCY: 10%) to R3 105mgrowing by 7% and the continued expansion of the virtual lending proposition. CIB’s non-interest income increased by 22% (CCY: 18%) to R2 874min a 25% (CCY: 20%) growth in Investment Banking non-interest income and a strong focus on transactional accounts and customer growth in Corporate resulting in a 14% (CCY: 10%) growth in Corporate non-interest income.
Impairments grew by 53% (CCY: 49%) resulting in a higher credit loss ratio of 0.98% (2018: 0.78%) driven by book growth and higher single-name defaults, coupled with increased consumer strain.
Operating expenses increased by 12% (CCY: 8%) to R10 753m (2018: R9 625m) and was characterised by incremental run costs post separation from Barclays , partly offset by continued transformation of our business through the optimisation of our branch network and investment in technology. As we progress along our journey of separating from Barclays , we continue to drive process optimisation, automation and
57.8% (2018: 59.0%).
Loans and advances to customers grew by 16% (CCY: 22%) to R111.5bn (2018: R96.2bn). RBB’s loans and advances grew by 10% (CCY: 16%) to R52.0bn (2018: R47.2bn) off the back of strong growth in personal lending and mortgages. CIB’s loans and advances to customers increased by 21% (CCY: 28%) to R59.4bn (2018: R49.0bn) as a result of an increased focus on targeted sectors, including natural resources, agriculture, public sector, construction and telecommunications.
Deposits due to customers grew by 13% (CCY: 19%) to R150.4bn 4% (CCY: 11%) to R75.7bn (2018: R72.4bn). CIB’s deposits due to customers increased by 23% (CCY: 29%) to R71.8bn (2018: R58.5bn) due to improved product
fast-moving consumer goods and the public sector.
Absa Regional Operations
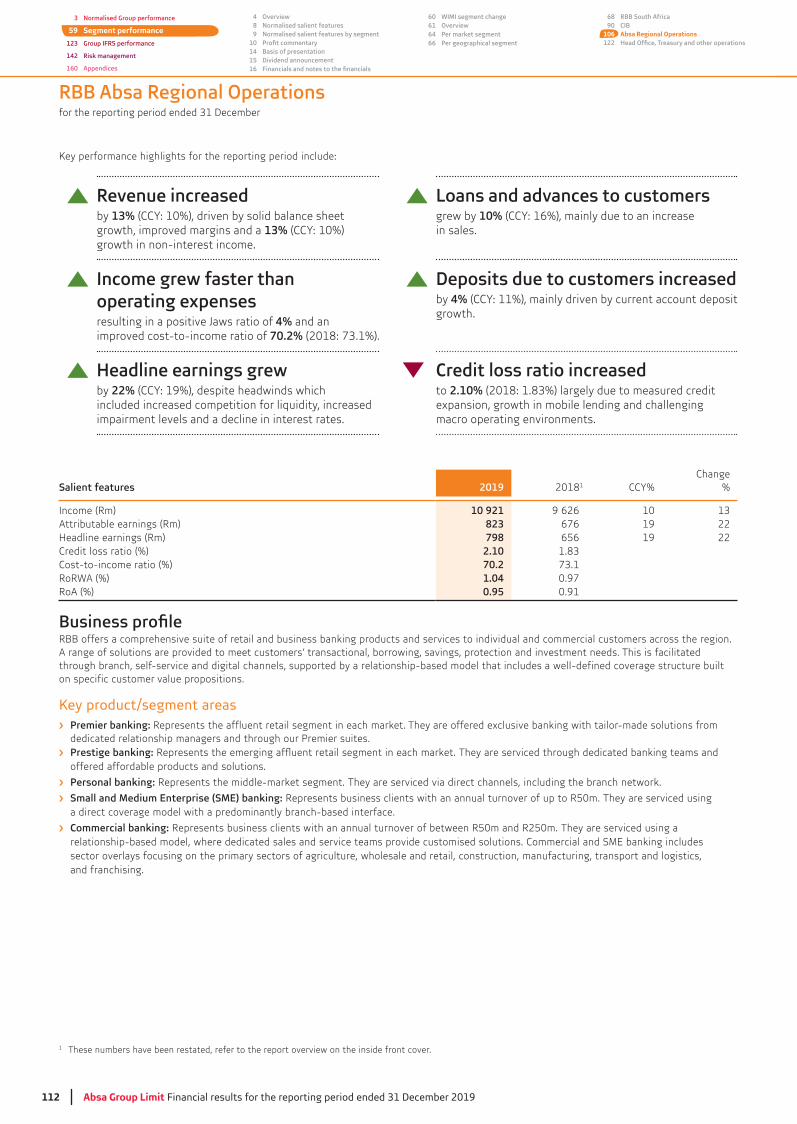
112 Absa Group Limit Financial results for the reporting period ended 31 December 2019
RBB Absa Regional Operations
Revenue increased by 13% (CCY: 10%), driven by solid balance sheet growth, improved margins and a 13% (CCY: 10%) growth in non-interest income.
Loans and advances to customers grew by 10% (CCY: 16%), mainly due to an increase in sales.
Income grew faster than
4% and an improved cost-to-income ratio of 70.2%
Deposits due to customers increased by 4% (CCY: 11%), mainly driven by current account deposit growth.
Headline earnings grew by 22% (CCY: 19%), despite headwinds which included increased competition for liquidity, increased impairment levels and a decline in interest rates.
Credit loss ratio increased to 2.10%expansion, growth in mobile lending and challenging macro operating environments.
Salient features 2019 20181 CCY%Change
%
Income (Rm) 10 921 9 626 10Attributable earnings (Rm) 823 676 19 22Headline earnings (Rm) 798 656 19 22Credit loss ratio (%) 2.10Cost-to-income ratio (%) 70.2RoRWA (%) 1.04 0.97RoA (%) 0.95 0.91
RBB offers a comprehensive suite of retail and business banking products and services to individual and commercial customers across the region. A range of solutions are provided to meet customers’ transactional, borrowing, savings, protection and investment needs. This is facilitated through branch, self-service and digital channels, supported by a relationship-based model that includes a well-defined coverage structure built on specific customer value propositions.
Key product/segment areas Premier banking: Represents the affluent retail segment in each market. They are offered exclusive banking with tailor-made solutions from
Prestige banking:offered affordable products and solutions.
Personal banking: Represents the middle-market segment. They are serviced via direct channels, including the branch network.
Small and Medium Enterprise (SME) banking: Represents business clients with an annual turnover of up to R50m. They are serviced using a direct coverage model with a predominantly branch-based interface.
Commercial banking: Represents business clients with an annual turnover of between R50m and R250m. They are serviced using a relationship-based model, where dedicated sales and service teams provide customised solutions. Commercial and SME banking includes sector overlays focusing on the primary sectors of agriculture, wholesale and retail, construction, manufacturing, transport and logistics, and franchising.
1 These numbers have been restated, refer to the report overview on the inside front cover.
3 Normalised Group performance
59 Segment performance
123 Group IFRS performance
142 Risk management
160 Appendices
4 Overview8 Normalised salient features9 Normalised salient features by segment
1014 Basis of presentation15 Dividend announcement16
60 WIMI segment change61 Overview64 Per market segment66 Per geographical segment
68 RBB South Africa90 CIB
106 Absa Regional Operations122

Absa Group Limited Financial results for the reporting period ended 31 December 2019 113
124 IFRS salient features
125 Financials133138 Reconciliation140 Barclays separation
143 Risk management overview155 Capital management
161 Share performance162 Shareholder information and diary163 Glossary170 Abbreviations and acronyms172 Contact information
RBB Absa Regional Operations
Financial performanceRBB delivered headline earnings growth of 22% (CCY: 19%) to R798m (2018: R656m). This was underpinned by strong revenue growth of 13% (CCY: 10%) to R10 921m (2018: R9 626m) which was achieved by the increase in focus on customers through the Customer Lifecycle Management framework, which helped increase the retail customer product penetration rate to 1.80 (2018: 1.66). Strong balance sheet growth, in spite of a challenging operating environment that included declining interest rates, as well as greater competition from traditional banks and payment Fintechs, contributed to the strong increase in revenue.
2016 2017 2018 20192015
RBB Income growth trend CCY (CAGR)
6%
Net interest income increased by 14% (CCY: 10%) to R7 816m (2018: R6 877m), despite a reduction in consumer deposit margins driven by falling interest rates, as well as increased competitor deposit pricing to attract liquidity, a reduction in consumer lending margins driven by aggressive
order to minimise the impact on impairments. To counter this and to take advantage of falling interest rates, measures were taken to target
Non-interest income grew by 13% (CCY: 10%) to R3 105m (2018: R2 749m), driven by trade income and foreign exchange sales which increased
Impairments increased by 37% R1 120m (2018: R820m) resulting in a credit loss ratio of 2.10%impairments, experienced mostly in consumer lending, is predominantly due to measured credit expansions that helped deliver strong production performance, growth in the mobile lending business, as well as challenging macro operating environment outlooks in some markets. Consumer non-performing loans reduced to 4.1% of loans and advances (2018: 4.5%). The increased charge in the commercial segment was driven by book growth. The focus during the year remained on improving credit and collection strategies, collection technologies and improving the level of resourcing and skills.
Operating costs increased by 9% (CCY: 5%) to R7 665mratio improved to 70.2%
Loans and advances to customers grew by 10% (CCY: 16%) to R52.0bn
Deposits due to customers grew by 4% (CCY: 11%) to R75.7bn (2018: R72.4bn) despite aggressive, competitor deposit pricing. To reduce the cost

114 Absa Group Limit Financial results for the reporting period ended 31 December 2019
RBB Absa Regional Operations
Business performance
growth.
Business achievements:
1.45 million loans were granted this year;
Launched ChatBot capability in Uganda which assisted with client engagement, as well as providing an additional channel to transact on. By enabling this capability on social media channels, such as WhatsApp, we are able to reach a wider customer base and offered more convenient banking;
money payments.
Continued growth in digital adoption by customers across a number of channels including iATM (withdrawal and deposits), Mobile Banking,
transaction values by 49%;
Reengineering, digitisation and automation of key operational processes resulted in a reduction of manual interventions, leading to cost
Looking ahead, there is further potential to extract greater value from the existing franchise. Embedding customer-centricity; delivering customer value propositions that serve business needs throughout the business lifecycle and personal needs throughout their life stages, as well as enhancing customers’ multiple-channel experience with a focus on becoming a digitally led bank remained key focus areas. The strategy focuses on:
Customer Lifecycle Management to further improve the quality of new-to-franchise customer acquisition and deepen the relationship with existing customers through enhanced digital solutions with a focus on mobile and internet banking acquisitions;
reduce service costs;
Continuing to embed and enhance the sector focus approach in Commercial and Small and Medium Enterprise Banking;
Extracting further opportunities from the Corporate customer ecosystems;
Commercialising a new digital platform aiding the trade between suppliers and buyers within the agriculture industry; and
Commercialising new business opportunities such as mobile lending and payments.
Achievements included the following:
Absa Bank was awarded Best Retail Bank
Absa Regional Operations data team was awarded the “Best Technology Initiative – Rest of the World” at the Financial Innovation awards held by The London Institute of Banking and Finance.Successful rebranding of branches, ATMs, banking platforms and applications from Barclays to the Absa brand was achieved.
3 Normalised Group performance
59 Segment performance
123 Group IFRS performance
142 Risk management
160 Appendices
4 Overview8 Normalised salient features9 Normalised salient features by segment
1014 Basis of presentation15 Dividend announcement16
60 WIMI segment change61 Overview64 Per market segment66 Per geographical segment
68 RBB South Africa90 CIB
106 Absa Regional Operations122
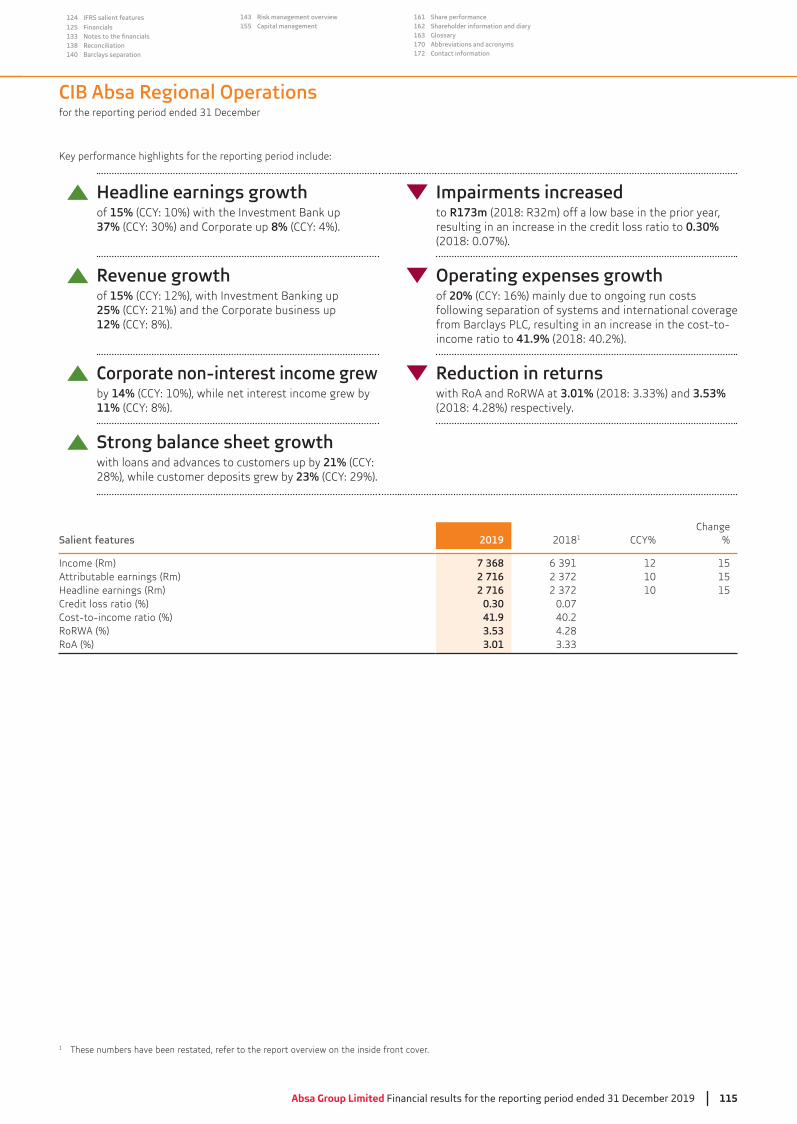
Absa Group Limited Financial results for the reporting period ended 31 December 2019 115
124 IFRS salient features
125 Financials133138 Reconciliation140 Barclays separation
143 Risk management overview155 Capital management
161 Share performance162 Shareholder information and diary163 Glossary170 Abbreviations and acronyms172 Contact information
CIB Absa Regional Operations
Headline earnings growth of 15% (CCY: 10%) with the Investment Bank up 37% 8% (CCY: 4%).
Impairments increased to R173mresulting in an increase in the credit loss ratio to 0.30% (2018: 0.07%).
Revenue growth of 15% (CCY: 12%), with Investment Banking up 25% (CCY: 21%) and the Corporate business up 12% (CCY: 8%).
of 20% (CCY: 16%) mainly due to ongoing run costs following separation of systems and international coverage from Barclays , resulting in an increase in the cost-to-income ratio to 41.9% (2018: 40.2%).
Corporate non-interest income grew by 14% (CCY: 10%), while net interest income grew by 11% (CCY: 8%).
Reduction in returns with RoA and RoRWA at 3.01% 3.53% (2018: 4.28%) respectively.
Strong balance sheet growth with loans and advances to customers up by 21% (CCY: 28%), while customer deposits grew by 23% (CCY: 29%).
Salient features 2019 20181 CCY%Change
%
Income (Rm) 7 368 12 15Attributable earnings (Rm) 2 716 10 15Headline earnings (Rm) 2 716 10 15Credit loss ratio (%) 0.30 0.07Cost-to-income ratio (%) 41.9 40.2RoRWA (%) 3.53 4.28RoA (%) 3.01
1 These numbers have been restated, refer to the report overview on the inside front cover.

116 Absa Group Limit Financial results for the reporting period ended 31 December 2019
CIB Absa Regional Operations
Corporate1
2019 20181 CCY%Change
%
Statement of comprehensive income (Rm)Net interest income 4 499 4 041 8 11Non-interest income 738 646 10 14
5 237 4 687 8 12Impairment losses (171) >100 >100 Operating expenses (2 329) (1 902) 18 22Other expenses (54) (27) 90 100
2 683 2 726 (4) (2)Tax expenses (508) (755)
2 175 1 971 6 10
Ordinary equity holders 1 951 1 814 4 8Non-controlling interest – ordinary shares 224 157
2 175 1 971 6 10
Headline earnings 1 951 1 814 4 8
Operating performance (%) Net interest margin on average interest-bearing assets 6.06Credit loss ratio 0.31 0.07Non-interest income as % of income 14.1Income growth 12Operating expenses growth 22 11Cost-to-income ratio 44.5 40.6
Loans and advances to customers 59 439 49 016 28 21Loans and advances to banks — 28 (100) (100)Investment securities 671 >100 94Other assets 19 848 17 289 19 15
79 958 66 679 26 20
Deposits due to customers 71 553 58 520 28 22Other liabilities 7 478 7 605 4 (2)
79 031 66 125 26 20
Financial performance (%)RoRWA 3.22 4.12RoA 2.63 2.99
1 These numbers have been restated, refer to the report overview on the inside front cover.
3 Normalised Group performance
59 Segment performance
123 Group IFRS performance
142 Risk management
160 Appendices
4 Overview8 Normalised salient features9 Normalised salient features by segment
1014 Basis of presentation15 Dividend announcement16
60 WIMI segment change61 Overview64 Per market segment66 Per geographical segment
68 RBB South Africa90 CIB
106 Absa Regional Operations122
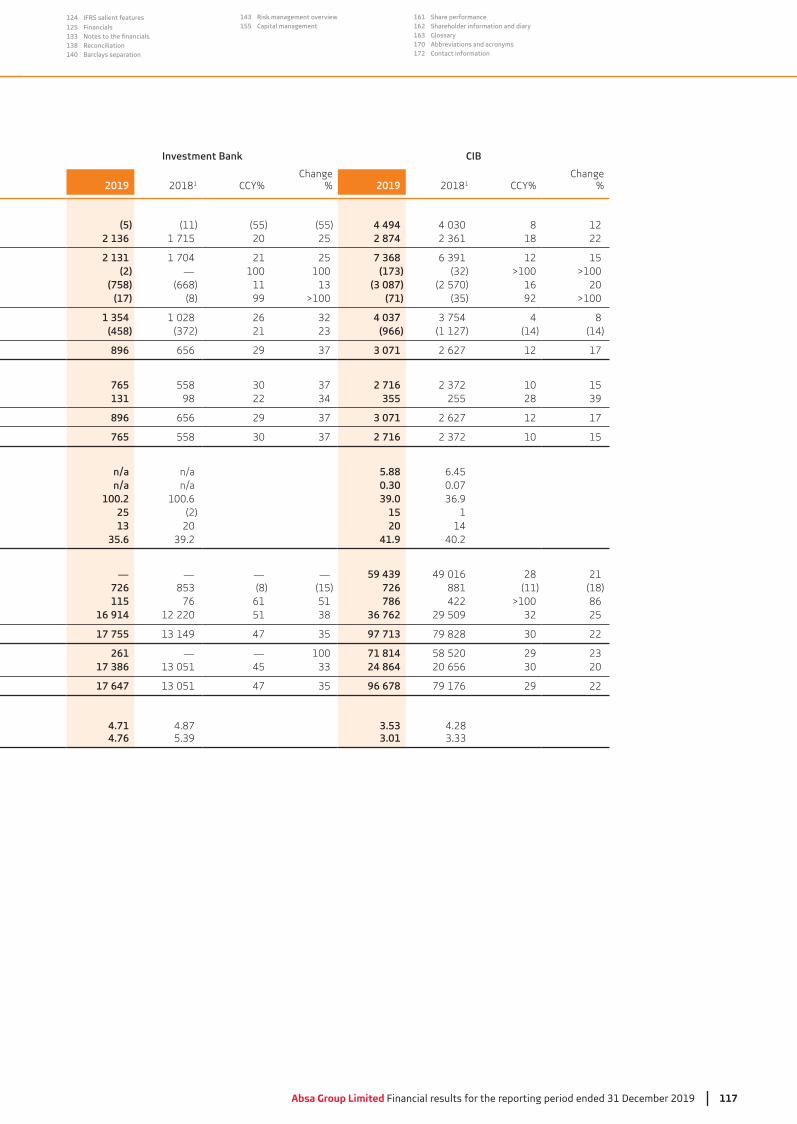
Absa Group Limited Financial results for the reporting period ended 31 December 2019 117
124 IFRS salient features
125 Financials133138 Reconciliation140 Barclays separation
143 Risk management overview155 Capital management
161 Share performance162 Shareholder information and diary163 Glossary170 Abbreviations and acronyms172 Contact information
Investment Bank CIB
2019 20181 CCY%Change
% 2019 20181 CCY%Change
%
(5) (11) (55) (55) 4 494 8 122 136 1 715 20 25 2 874 18 22
2 131 1 704 21 25 7 368 12 15(2) — 100 100 (173) >100 >100
(758) (668) 11 (3 087) (2 570) 16 20(17) (8) 99 >100 (71) 92 >100
1 354 1 028 26 4 037 4 8(458) 21 (966) (1 127) (14) (14)
896 656 29 3 071 2 627 12 17
765 558 2 716 10 15131 98 22 355 255 28
896 656 29 3 071 2 627 12 17
765 558 2 716 10 15
n/a n/a 5.88 6.45n/a n/a 0.30 0.07
100.2 100.6 39.025 (2) 15 113 20 20 14
35.6 41.9 40.2
— — — — 59 439 49 016 28 21726 (8) (15) 726 881 (11) (18)115 76 61 51 786 422 >100 86
16 914 12 220 51 36 762 29 509 25
17 755 47 97 713 79 828 22
261 — — 100 71 814 58 520 2917 386 45 24 864 20 656 20
17 647 47 96 678 79 176 29 22
4.71 4.87 3.53 4.284.76 3.01
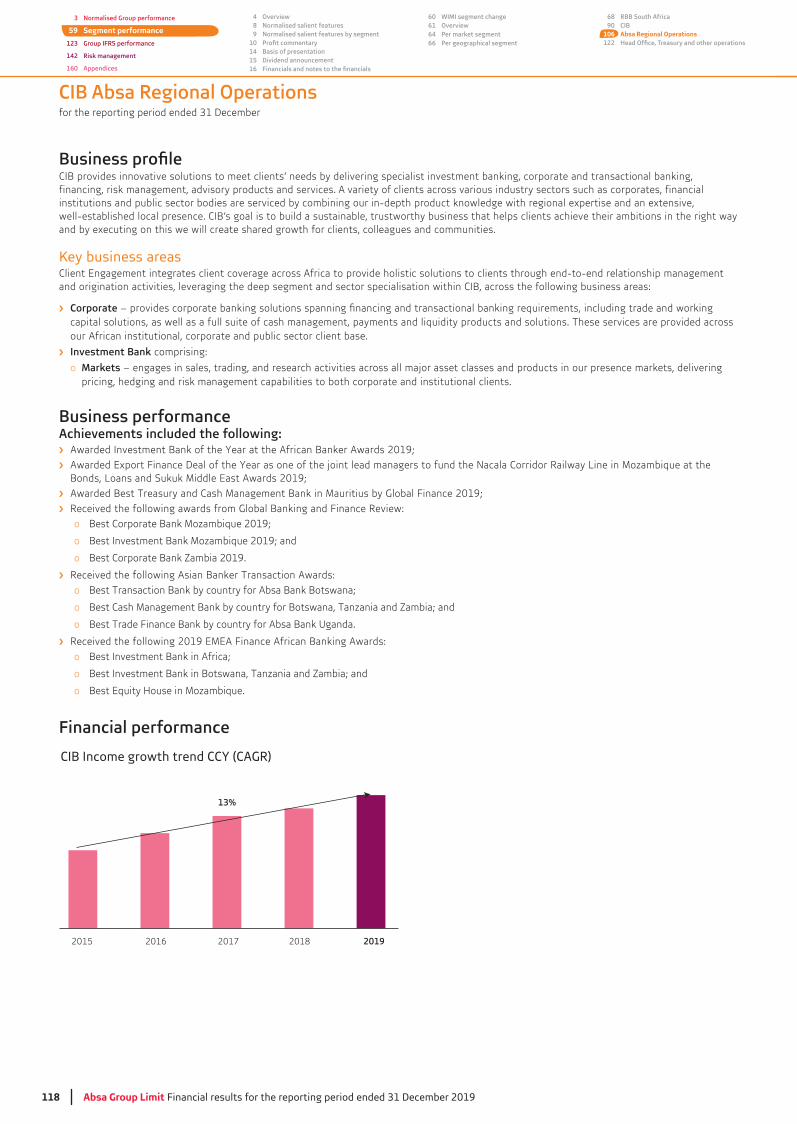
118 Absa Group Limit Financial results for the reporting period ended 31 December 2019
CIB Absa Regional Operations
CIB provides innovative solutions to meet clients’ needs by delivering specialist investment banking, corporate and transactional banking, financing, risk management, advisory products and services. A variety of clients across various industry sectors such as corporates, financial institutions and public sector bodies are serviced by combining our in-depth product knowledge with regional expertise and an extensive, well-established local presence. CIB’s goal is to build a sustainable, trustworthy business that helps clients achieve their ambitions in the right way and by executing on this we will create shared growth for clients, colleagues and communities.
Key business areasClient Engagement integrates client coverage across Africa to provide holistic solutions to clients through end-to-end relationship management and origination activities, leveraging the deep segment and sector specialisation within CIB, across the following business areas:
Corporatecapital solutions, as well as a full suite of cash management, payments and liquidity products and solutions. These services are provided across our African institutional, corporate and public sector client base.
Investment Bank comprising:
o Markets – engages in sales, trading, and research activities across all major asset classes and products in our presence markets, delivering pricing, hedging and risk management capabilities to both corporate and institutional clients.
Business performanceAchievements included the following:
Awarded Investment Bank of the Year at the African Banker Awards 2019; Awarded Export Finance Deal of the Year as one of the joint lead managers to fund the Nacala Corridor Railway Line in Mozambique at the Bonds, Loans and Sukuk Middle East Awards 2019; Awarded Best Treasury and Cash Management Bank in Mauritius by Global Finance 2019;Received the following awards from Global Banking and Finance Review:
o Best Corporate Bank Mozambique 2019;
o Best Investment Bank Mozambique 2019; and
o Best Corporate Bank Zambia 2019.
Received the following Asian Banker Transaction Awards: o Best Transaction Bank by country for Absa Bank Botswana;
o Best Cash Management Bank by country for Botswana, Tanzania and Zambia; and
o Best Trade Finance Bank by country for Absa Bank Uganda.
Received the following 2019 EMEA Finance African Banking Awards: o Best Investment Bank in Africa;
o Best Investment Bank in Botswana, Tanzania and Zambia; and
o Best Equity House in Mozambique.
Financial performance
2016 2017 2018 20192015
CIB Income growth trend CCY (CAGR)
13%
3 Normalised Group performance
59 Segment performance
123 Group IFRS performance
142 Risk management
160 Appendices
4 Overview8 Normalised salient features9 Normalised salient features by segment
1014 Basis of presentation15 Dividend announcement16
60 WIMI segment change61 Overview64 Per market segment66 Per geographical segment
68 RBB South Africa90 CIB
106 Absa Regional Operations122
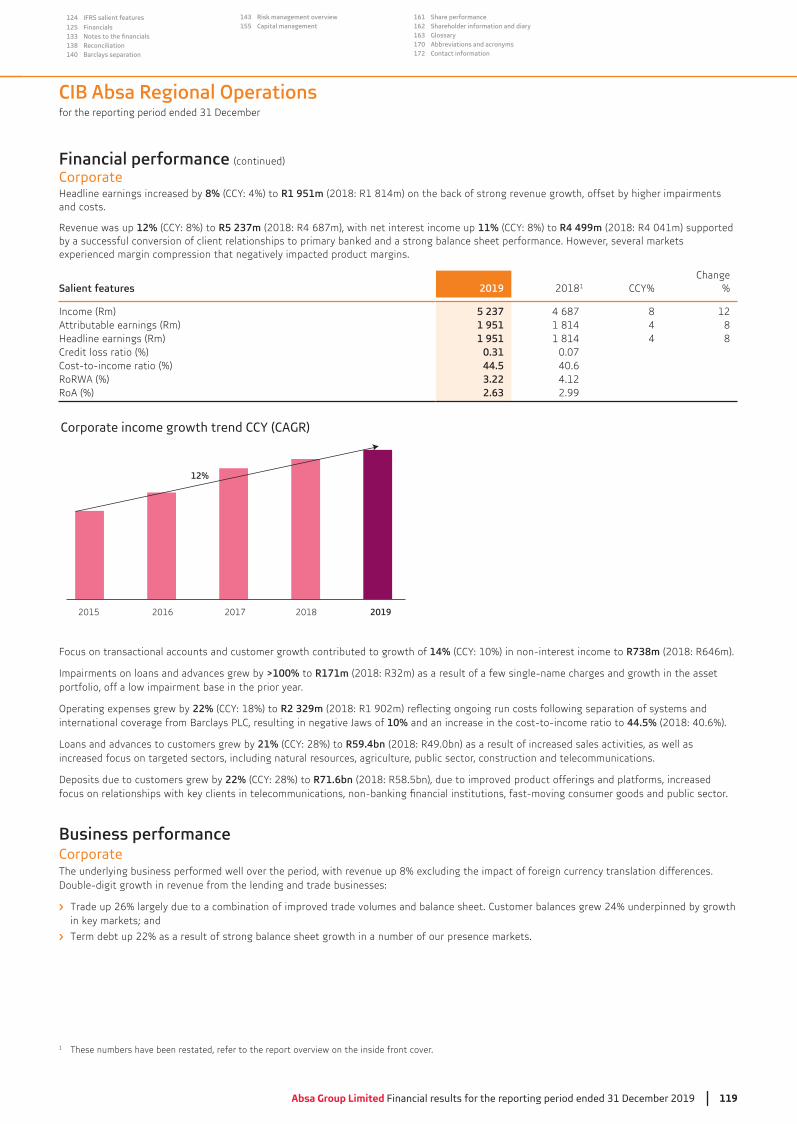
Absa Group Limited Financial results for the reporting period ended 31 December 2019 119
124 IFRS salient features
125 Financials133138 Reconciliation140 Barclays separation
143 Risk management overview155 Capital management
161 Share performance162 Shareholder information and diary163 Glossary170 Abbreviations and acronyms172 Contact information
CIB Absa Regional Operations
Financial performance (continued)
CorporateHeadline earnings increased by 8% (CCY: 4%) to R1 951m (2018: R1 814m) on the back of strong revenue growth, offset by higher impairments and costs.
Revenue was up 12% (CCY: 8%) to R5 237m (2018: R4 687m), with net interest income up 11% (CCY: 8%) to R4 499m (2018: R4 041m) supported by a successful conversion of client relationships to primary banked and a strong balance sheet performance. However, several markets experienced margin compression that negatively impacted product margins.
Salient features 2019 20181 CCY%Change
%
Income (Rm) 5 237 4 687 8 12Attributable earnings (Rm) 1 951 1 814 4 8Headline earnings (Rm) 1 951 1 814 4 8Credit loss ratio (%) 0.31 0.07Cost-to-income ratio (%) 44.5 40.6RoRWA (%) 3.22 4.12RoA (%) 2.63 2.99
2016 2017 2018 20192015
Corporate income growth trend CCY (CAGR)
12%
Focus on transactional accounts and customer growth contributed to growth of 14% (CCY: 10%) in non-interest income to R738m (2018: R646m).
Impairments on loans and advances grew by >100% to R171mportfolio, off a low impairment base in the prior year.
Operating expenses grew by 22% (CCY: 18%) to R2 329minternational coverage from Barclays 10% and an increase in the cost-to-income ratio to 44.5% (2018: 40.6%).
Loans and advances to customers grew by 21% (CCY: 28%) to R59.4bn (2018: R49.0bn) as a result of increased sales activities, as well as increased focus on targeted sectors, including natural resources, agriculture, public sector, construction and telecommunications.
Deposits due to customers grew by 22% (CCY: 28%) to R71.6bn (2018: R58.5bn), due to improved product offerings and platforms, increased
Business performanceCorporateThe underlying business performed well over the period, with revenue up 8% excluding the impact of foreign currency translation differences. Double-digit growth in revenue from the lending and trade businesses:
Trade up 26% largely due to a combination of improved trade volumes and balance sheet. Customer balances grew 24% underpinned by growth in key markets; and
Term debt up 22% as a result of strong balance sheet growth in a number of our presence markets.
1 These numbers have been restated, refer to the report overview on the inside front cover.

120 Absa Group Limit Financial results for the reporting period ended 31 December 2019
Business performance (continued)
Corporate (continued)
This was partially offset by muted growth in liability income:
Cash management unchanged, with customer deposits growth of 14% offset by margin contraction. Fee income declined due to a combination
mobile payments trust accounts balances of 20%, in line with the increasing adoption of mobile payments as a corporate transacting solution on the continent; and
Working capital down 7% mainly due to lower utilisation levels linked to competition on USD facilities.
Contributors to revenue growth included the following:
Delivery of automated capability in documentary trade across key markets enabling clients to self-initiate and track trade transactions online;
Identifying and onboarding key hires in businesses at the core of our growth strategy; and
Factors that adversely affected the business during the period included the economic slowdown affecting key European trading partners, which impacted tourism and export businesses in a number of markets, margin compression as a result of funding pressures across the continent and increased competition.
Looking ahead, we will focus on the following strategic objectives:
Delivery of new and innovative channel products
Achieving separation on time and simplifying our operating structure to better serve our clients
Roll-out of a pan-African custody and trustee business.
Financial performanceInvestment Banking
2016 2017 2018 20192015
Investment Banking income growth trend CCY (CAGR)
13%
Headline earnings grew by 37% R765m (2018: R558m) with revenue up 25% (CCY: up 21%) to R2 131m (2018: R1 704m) and operating expenses grew by 13% (CCY: 11%) to R758m (2018: R668m).
Revenue growth of 25% (CCY: 21%) resulted from increased client activity and positive risk management. This was achieved through increased focus on building our client franchise by means of improved client solutioning, rolling out more advanced infrastructure, continued build-out of a high-performing team and better collaboration with other business areas.
The 13% (CCY: 11%) increase in operating expenses was largely due to ongoing run costs following separation of systems and international coverage from Barclays 12% and a decrease in the cost-to-income ratio to 35.6%as a result of strong revenue growth.
CIB Absa Regional Operations
3 Normalised Group performance
59 Segment performance
123 Group IFRS performance
142 Risk management
160 Appendices
4 Overview8 Normalised salient features9 Normalised salient features by segment
1014 Basis of presentation15 Dividend announcement16
60 WIMI segment change61 Overview64 Per market segment66 Per geographical segment
68 RBB South Africa90 CIB
106 Absa Regional Operations122

Absa Group Limited Financial results for the reporting period ended 31 December 2019 121
124 IFRS salient features
125 Financials133138 Reconciliation140 Barclays separation
143 Risk management overview155 Capital management
161 Share performance162 Shareholder information and diary163 Glossary170 Abbreviations and acronyms172 Contact information
Financial performance (continued)
Investment Banking (continued)
Salient features 2019 20181 CCY%Change
%
Income (Rm) 2 131 1 704 21 25Attributable earnings (Rm) 765 558Headline earnings (Rm) 765 558Cost-to-income ratio (%) 35.6RoRWA (%) 4.71 4.87RoA (%) 4.76
Business performanceInvestment Banking
Daily markets income distribution (Rm)
< -3
5
-35
to <
-30
-30
to <
-25
-25
to <
-20
-20
to <
-15
-15
to <
-10
-10
to <
-5
-5 t
o <
0
0 to
< 5
5 to
< 1
0
10 t
o <
15
15 t
o <
20
20 t
o <
25
25 t
o <
30
30 t
o <
35
35 t
o <
40
40 t
o <
45
45 t
o <
50
< 5
0% of business days 2018
201960%
50%
40%
30%
20%
10%
0%
Markets ARO delivered a strong performance across the portfolio with increased sales activity on account of broad-based FX market share gains as well as harnessing of the new institutional client base, while the business also reported positive risk management revenue. Year-on-year growth was seen in eight countries, driven by:
leading to product market share gains particularly in the Business Bank segment;
Discipline and dynamism regarding margin management for Corporate clients transacting on electronic trading platforms; andEffective risk management resulting in preservation of client margins.
This was partly offset by the following factors:
Interbank funding pressures in some key markets negatively impacted ability to price derivatives;Highly competitive environment from local banks; andChanges in liquidity across the continent providing fewer revenue opportunities.
Looking ahead, we will focus on the following strategic initiatives:
Continued focus on ecommerce strategy to improve client service and experience;Enhancement of the CIB pan-Africa product and coverage model to provide integrated solutions to international clients; and
Expansion into non-presence markets to grow and diversify revenue streams and provide clients with new market opportunities.
CIB Absa Regional Operations
1 These numbers have been restated, refer to the report overview on the inside front cover.

122 Absa Group Limit Financial results for the reporting period ended 31 December 2019
Financial performance
was previously managed and reported as part of the Group’s Wealth, Investment Management and Insurance (WIMI) segment.
Investment Management offers investment management, multi-management, unit trusts and linked investments products and solutions to individual and institutional clients.
Investment Management headline earnings increased by 4% to R379mby revenue growth of 2% to R1.156bn
Investment Management – Assets under management and administration
2019Rbn
2018Rbn
Change%
Assets under management and administration 270 281 (4)
Money market 70 75 (7) Non-money market 200 206
Movement in assets under management and administration (Rbn)Assets under management declined by 4% to R270bn
Netmoneymarket
outflows
Netretail
inflows
20192018
13(4) (26)6281
270
Net institutional
outflows
Marketappreciation
3 Normalised Group performance
59 Segment performance
123 Group IFRS performance
142 Risk management
160 Appendices
4 Overview8 Normalised salient features9 Normalised salient features by segment
1014 Basis of presentation15 Dividend announcement16
60 WIMI segment change61 Overview64 Per market segment66 Per geographical segment
68 RBB South Africa90 CIB
106 Absa Regional Operations122

124 IFRS salient features
125 Financials133138140
143 Risk management overview155
161162163170172
Group IFRS performance
Consolidated IFRS salient features 124Consolidated IFRS statement of comprehensive income 125
127Consolidated IFRS statement of changes in equity 128
132
133Reconciliation of IFRS to normalised results 138Barclays separation effects 140
Absa Group Limited Financial results for the reporting period ended 31 December 2019 123
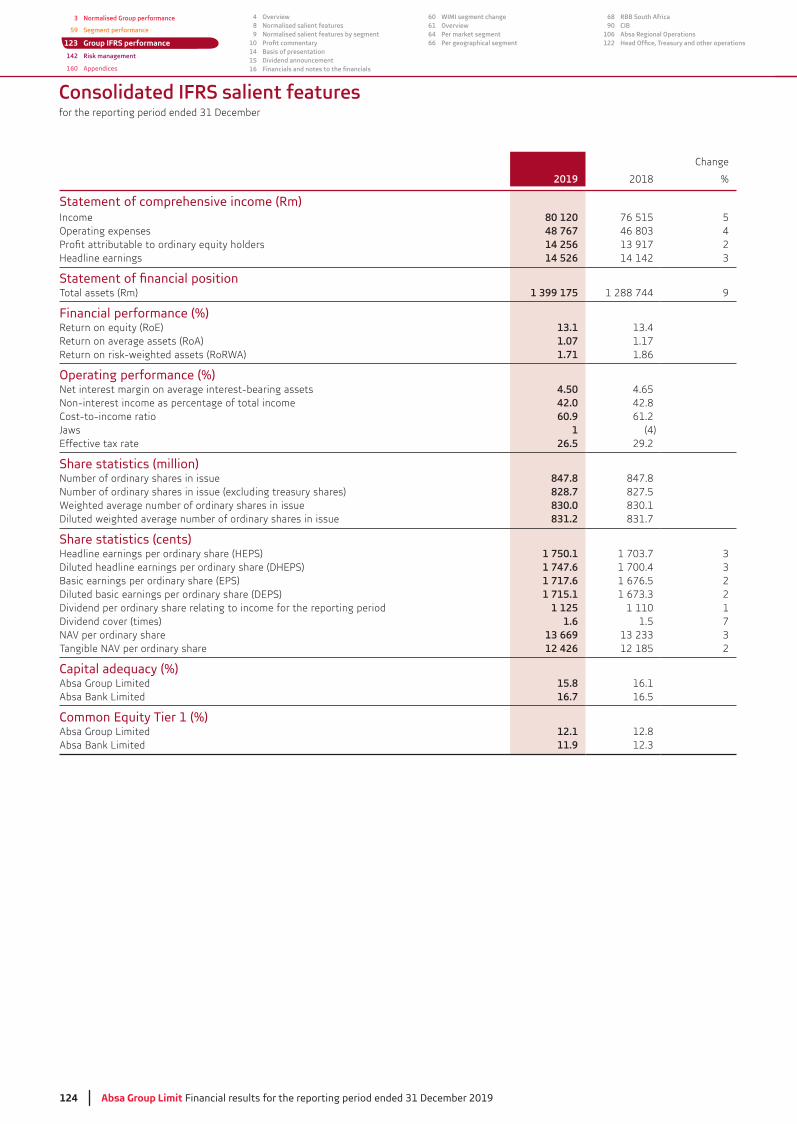
124 Absa Group Limit Financial results for the reporting period ended 31 December 2019
3 Normalised Group performance
59 Segment performance
123 Group IFRS performance
142 Risk management
160 Appendices
4 Overview8 Normalised salient features9 Normalised salient features by segment
1014 Basis of presentation15 Dividend announcement16
60 WIMI segment change61 Overview64 Per market segment66 Per geographical segment
68 RBB South Africa90 CIB
106 Absa Regional Operations122
Consolidated IFRS salient features
Change
2019 2018 %
Statement of comprehensive income (Rm)Income 80 120 76 515 5Operating expenses 48 767 4
14 256 2Headline earnings 14 526 14 142
Total assets (Rm) 1 399 175 1 288 744 9
Financial performance (%)Return on equity (RoE) 13.1Return on average assets (RoA) 1.07 1.17Return on risk-weighted assets (RoRWA) 1.71 1.86
Operating performance (%)Net interest margin on average interest-bearing assets 4.50 4.65Non-interest income as percentage of total income 42.0 42.8Cost-to-income ratio 60.9 61.2
1 (4)Effective tax rate 26.5 29.2
Share statistics (million)Number of ordinary shares in issue 847.8 847.8Number of ordinary shares in issue (excluding treasury shares) 828.7 827.5Weighted average number of ordinary shares in issue 830.0Diluted weighted average number of ordinary shares in issue 831.2
Share statistics (cents)1 750.11 747.6 1 700.41 717.6 1 676.5 21 715.1 2
Dividend per ordinary share relating to income for the reporting period 1 125 1 110 1Dividend cover (times) 1.6 1.5 7NAV per ordinary share 13 669Tangible NAV per ordinary share 12 426 12 185 2
Capital adequacy (%)Absa Group Limited 15.8 16.1Absa Bank Limited 16.7 16.5
Common Equity Tier 1 (%)Absa Group Limited 12.1 12.8Absa Bank Limited 11.9
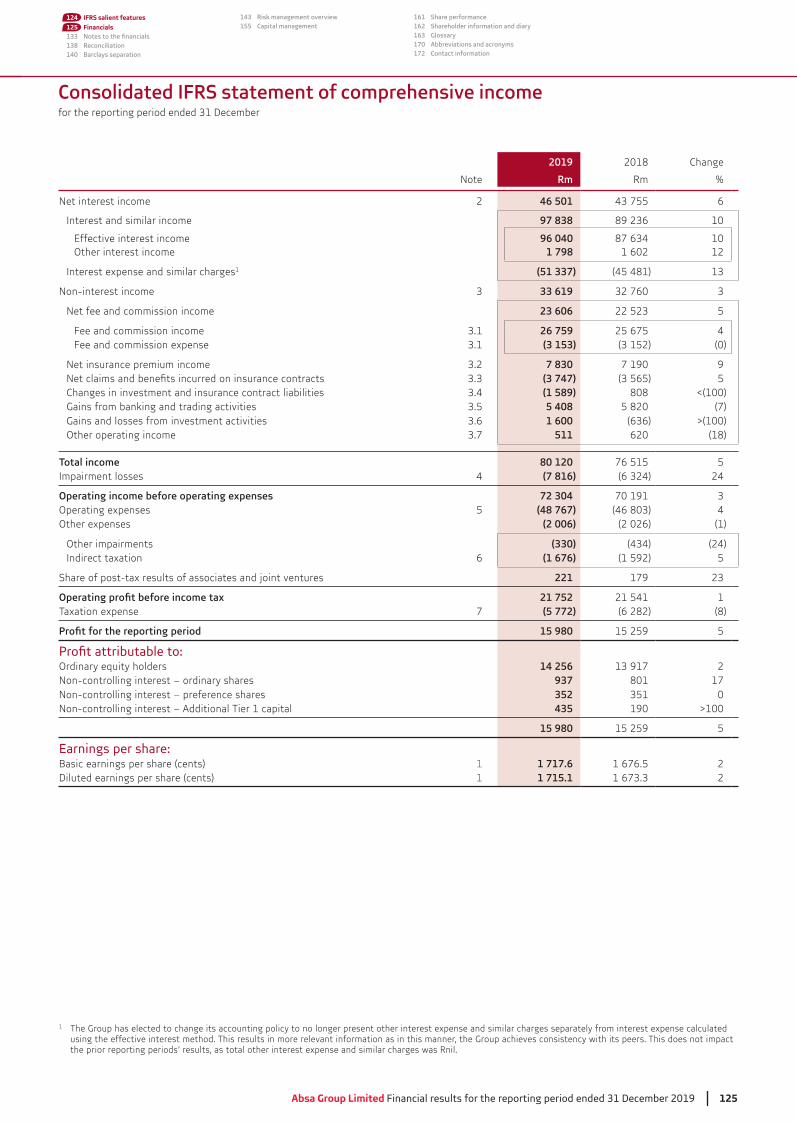
Absa Group Limited Financial results for the reporting period ended 31 December 2019 125
Consolidated IFRS statement of comprehensive income
2019 2018 Change
Note Rm Rm %
Net interest income 2 46 501 6
Interest and similar income 97 838 10
Effective interest income 96 040 10Other interest income 1 798 1 602 12
Interest expense and similar charges1 (51 337) (45 481)
Non-interest income 33 619
Net fee and commission income 23 606 5
Fee and commission income 26 759 25 675 4Fee and commission expense (3 153) (0)
Net insurance premium income 7 830 7 190 9(3 747) 5
Changes in investment and insurance contract liabilities (1 589) 808 <(100)Gains from banking and trading activities 5 408 5 820 (7)Gains and losses from investment activities 1 600 >(100)Other operating income 511 620 (18)
80 120 76 515 5Impairment losses 4 (7 816) 24
72 304 70 191Operating expenses 5 (48 767) 4Other expenses (2 006) (2 026) (1)
Other impairments (330) (24)Indirect taxation 6 (1 676) (1 592) 5
Share of post-tax results of associates and joint ventures 221 179
21 752 21 541 1Taxation expense 7 (5 772) (6 282) (8)
15 980 15 259 5
Ordinary equity holders 14 256 2Non-controlling interest – ordinary shares 937 801 17Non-controlling interest – preference shares 352 0Non-controlling interest – Additional Tier 1 capital 435 190 >100
15 980 15 259 5
Basic earnings per share (cents) 1 1 717.6 1 676.5 2Diluted earnings per share (cents) 1 1 715.1 2
1 The Group has elected to change its accounting policy to no longer present other interest expense and similar charges separately from interest expense calculated using the effective interest method. This results in more relevant information as in this manner, the Group achieves consistency with its peers. This does not impact the prior reporting periods’ results, as total other interest expense and similar charges was Rnil.
124 IFRS salient features125 Financials133138 Reconciliation140 Barclays separation
143 Risk management overview155 Capital management
161 Share performance162 Shareholder information and diary163 Glossary170 Abbreviations and acronyms172 Contact information
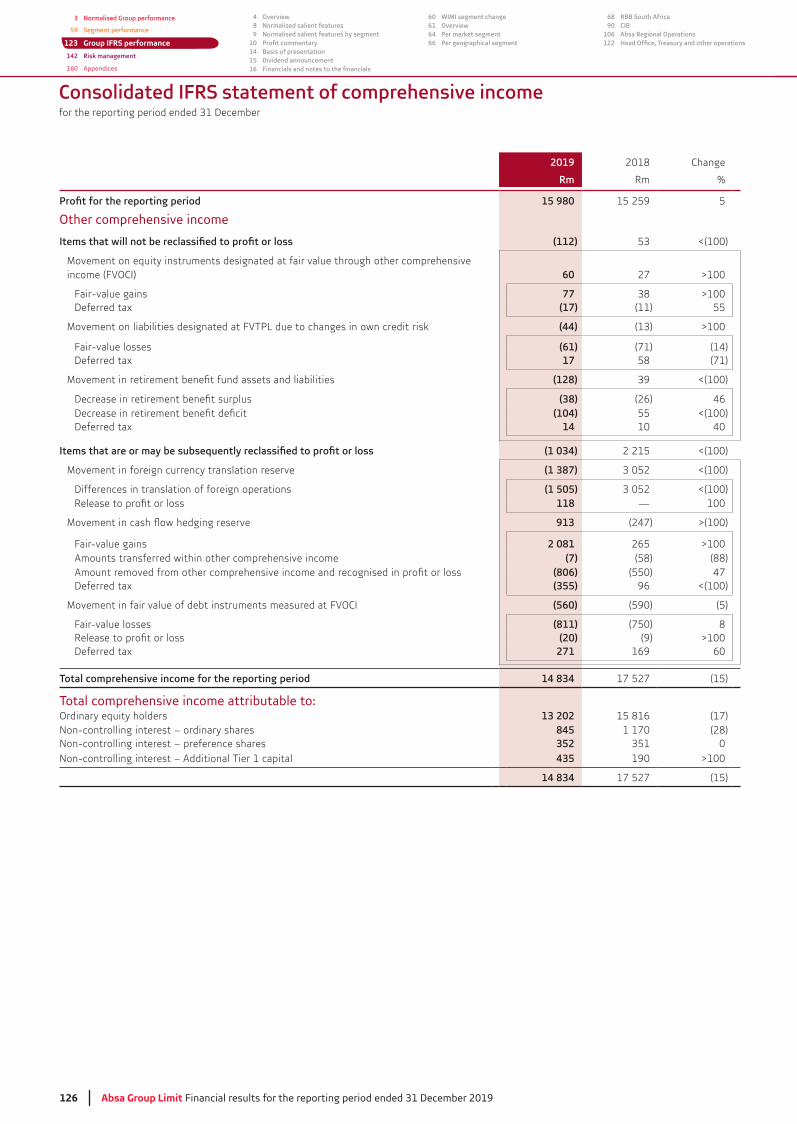
126 Absa Group Limit Financial results for the reporting period ended 31 December 2019
3 Normalised Group performance
59 Segment performance
123 Group IFRS performance
142 Risk management
160 Appendices
4 Overview8 Normalised salient features9 Normalised salient features by segment
1014 Basis of presentation15 Dividend announcement16
60 WIMI segment change61 Overview64 Per market segment66 Per geographical segment
68 RBB South Africa90 CIB
106 Absa Regional Operations122
Consolidated IFRS statement of comprehensive income
2019 2018 Change
Rm Rm %
15 980 15 259 5
Other comprehensive income
(112) <(100)
Movement on equity instruments designated at fair value through other comprehensive income (FVOCI) 60 27 >100
Fair-value gains 77 >100 Deferred tax (17) (11) 55
(44) >100
Fair-value losses (61) (71) (14)Deferred tax 17 58 (71)
(128) <(100)
(38) (26) 46(104) 55 <(100)
Deferred tax 14 10 40
(1 034) 2 215 <(100)
Movement in foreign currency translation reserve (1 387) <(100)
Differences in translation of foreign operations (1 505) <(100)118 — 100
913 (247) >(100)
Fair-value gains 2 081 265 >100 Amounts transferred within other comprehensive income (7) (58) (88)
(806) (550) 47Deferred tax (355) 96 <(100)
Movement in fair value of debt instruments measured at FVOCI (560) (590) (5)
Fair-value losses (811) (750) 8(20) (9) >100
Deferred tax 271 169 60
14 834 17 527 (15)
Ordinary equity holders 13 202 15 816 (17)Non-controlling interest – ordinary shares 845 1 170 (28)Non-controlling interest – preference shares 352 0Non-controlling interest – Additional Tier 1 capital 435 190 >100
14 834 17 527 (15)

Absa Group Limited Financial results for the reporting period ended 31 December 2019 127
124 IFRS salient features
125 Financials133138140
143 Risk management overview155
161162163170172
2019 2018 Change
Note Rm Rm %
AssetsCash, cash balances and balances with central banks 52 532 46 929 12Investment securities 116 747 (14)Loans and advances to banks 59 745 12Trading portfolio assets 158 348 128 569Hedging portfolio assets 3 358 2 411Other assets 30 343 (1)Current tax assets 1 682 819 >100 Non-current assets held for sale 3 992 >100 Loans and advances to customers 916 978 841 720 9Reinsurance assets 886 618Investments linked to investment contracts 20 042 18 481 8Investments in associates and joint ventures 1 648 26Investment properties 513 508 1
18 620 18Goodwill and intangible assets 10 300 8 672 19Deferred tax assets 3 441 0
1 399 175 1 288 744 9
LiabilitiesDeposits from banks 117 423 121 421Trading portfolio liabilities 59 224 15Hedging portfolio liabilities 1 379Other liabilities 46 355 26
4 064 4 017 1Current tax liabilities 172 (27)Non-current liabilities held for sale 112 124 (10)Deposits due to customers 826 293 12Debt securities in issue 159 794 160 971 (1)Liabilities under investment contracts 29 700 29 674 0
4 331 4 168 4Borrowed funds 21 418 20 225 6Deferred tax liabilities 227
1 270 492 9
EquityCapital and reservesAttributable to ordinary equity holders:
Share capital 11 1 657 1 655 0Share premium 11 10 428 10 205 2Retained earnings 95 386 5Other reserves 5 807 (9)
113 278 109 484Non-controlling interest – ordinary shares 4 966 5Non-controlling interest – preference shares 4 644 4 644 —Non-controlling interest – Additional Tier 1 capital 5 795 2 741 >100
128 683 121 606 6
1 399 175 1 288 744 9
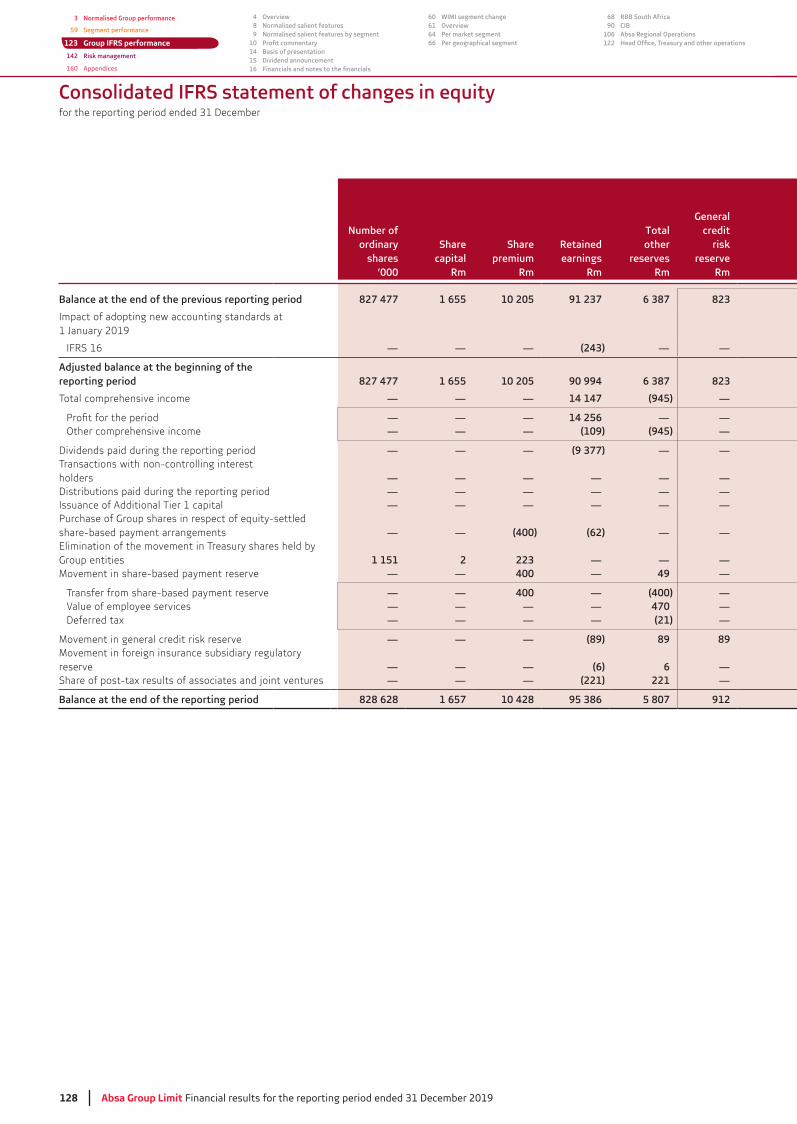
128 Absa Group Limit Financial results for the reporting period ended 31 December 2019
3 Normalised Group performance
59 Segment performance
123 Group IFRS performance
142 Risk management
160 Appendices
4 Overview8 Normalised salient features9 Normalised salient features by segment
1014 Basis of presentation15 Dividend announcement16
60 WIMI segment change61 Overview64 Per market segment66 Per geographical segment
68 RBB South Africa90 CIB
106 Absa Regional Operations122
Consolidated IFRS statement of changes in equity
Number of ordinary
shares’000
Sharecapital
Rm
Sharepremium
Rm
Retainedearnings
Rm
otherreserves
Rm
Generalcredit
riskreserve
Rm
Balance at the end of the previous reporting period 827 477 1 655 10 205 91 237 6 387 823
Impact of adopting new accounting standards at
IFRS 16 — — — (243) — —
Adjusted balance at the beginning of the reporting period 827 477 1 655 10 205 90 994 6 387 823
Total comprehensive income — — — 14 147 (945) —
— — — 14 256 — —Other comprehensive income — — — (109) (945) —
Dividends paid during the reporting period — — — (9 377) — —Transactions with non-controlling interest holders — — — — — —Distributions paid during the reporting period — — — — — —Issuance of Additional Tier 1 capital — — — — — —
share-based payment arrangements — — (400) (62) — —Elimination of the movement in Treasury shares held by Group entities 1 151 2 223 — — —Movement in share-based payment reserve — — 400 — 49 —
Transfer from share-based payment reserve — — 400 — (400) —Value of employee services — — — — 470 —Deferred tax — — — — (21) —
Movement in general credit risk reserve — — — (89) 89 89Movement in foreign insurance subsidiary regulatory reserve — — — (6) 6 —Share of post-tax results of associates and joint ventures — — — (221) 221 —
Balance at the end of the reporting period 828 628 1 657 10 428 95 386 5 807 912
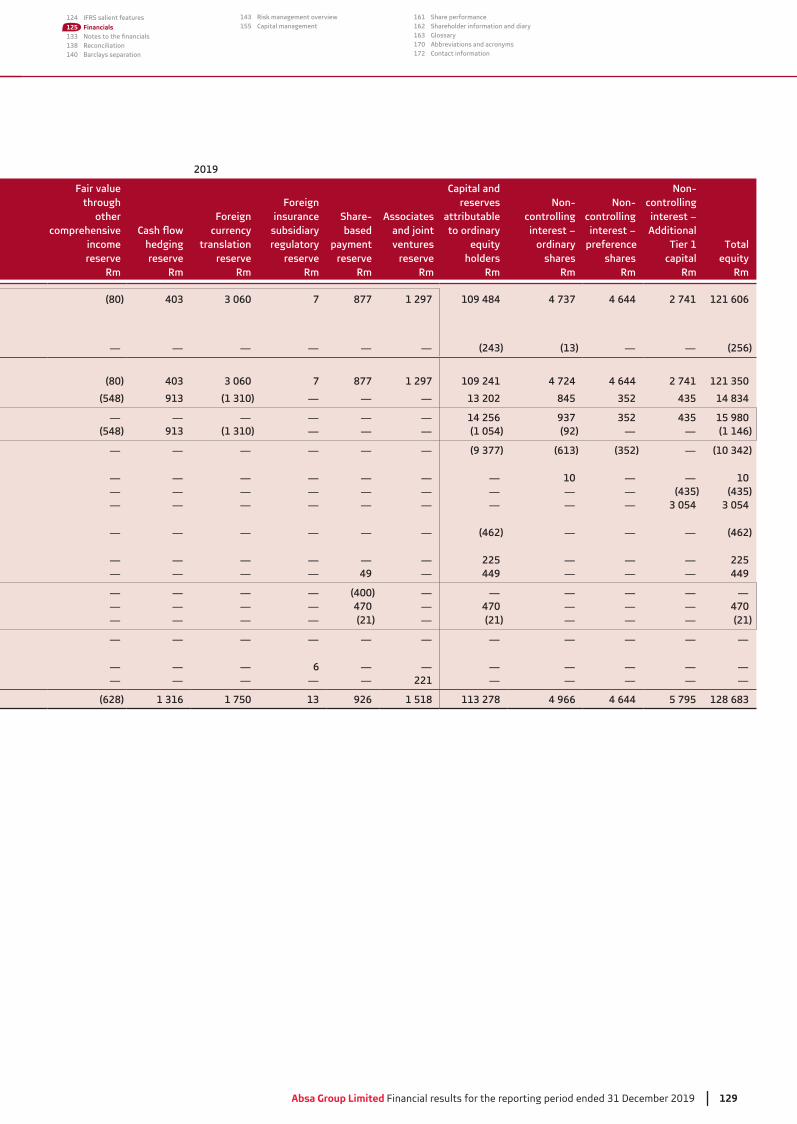
Absa Group Limited Financial results for the reporting period ended 31 December 2019 129
124 IFRS salient features
125 Financials133138140
143 Risk management overview155
161162163170172
2019
Fair value through
other comprehensive
income reserve
Rm
hedging reserve
Rm
Foreign currency
translation reserve
Rm
Foreign insurance
subsidiary regulatory
reserveRm
Share-based
payment reserve
Rm
Associatesand joint ventures
reserveRm
Capital and reserves
attributable to ordinary
equityholders
Rm
Non-controlling interest – ordinary
sharesRm
Non-controlling interest –
preference shares
Rm
Non-controlling interest – Additional
capitalRm
equityRm
(80) 403 3 060 7 877 1 297 109 484 4 737 4 644 2 741 121 606
— — — — — — (243) (13) — — (256)
(80) 403 3 060 7 877 1 297 109 241 4 724 4 644 2 741 121 350
(548) 913 (1 310) — — — 13 202 845 352 435 14 834
— — — — — — 14 256 937 352 435 15 980(548) 913 (1 310) — — — (1 054) (92) — — (1 146)
— — — — — — (9 377) (613) (352) — (10 342)
— — — — — — — 10 — — 10— — — — — — — — — (435) (435)— — — — — — — — — 3 054 3 054
— — — — — — (462) — — — (462)
— — — — — — 225 — — — 225— — — — 49 — 449 — — — 449
— — — — (400) — — — — — —— — — — 470 — 470 — — — 470— — — — (21) — (21) — — — (21)
— — — — — — — — — — —
— — — 6 — — — — — — —— — — — — 221 — — — — —
(628) 1 316 1 750 13 926 1 518 113 278 4 966 4 644 5 795 128 683
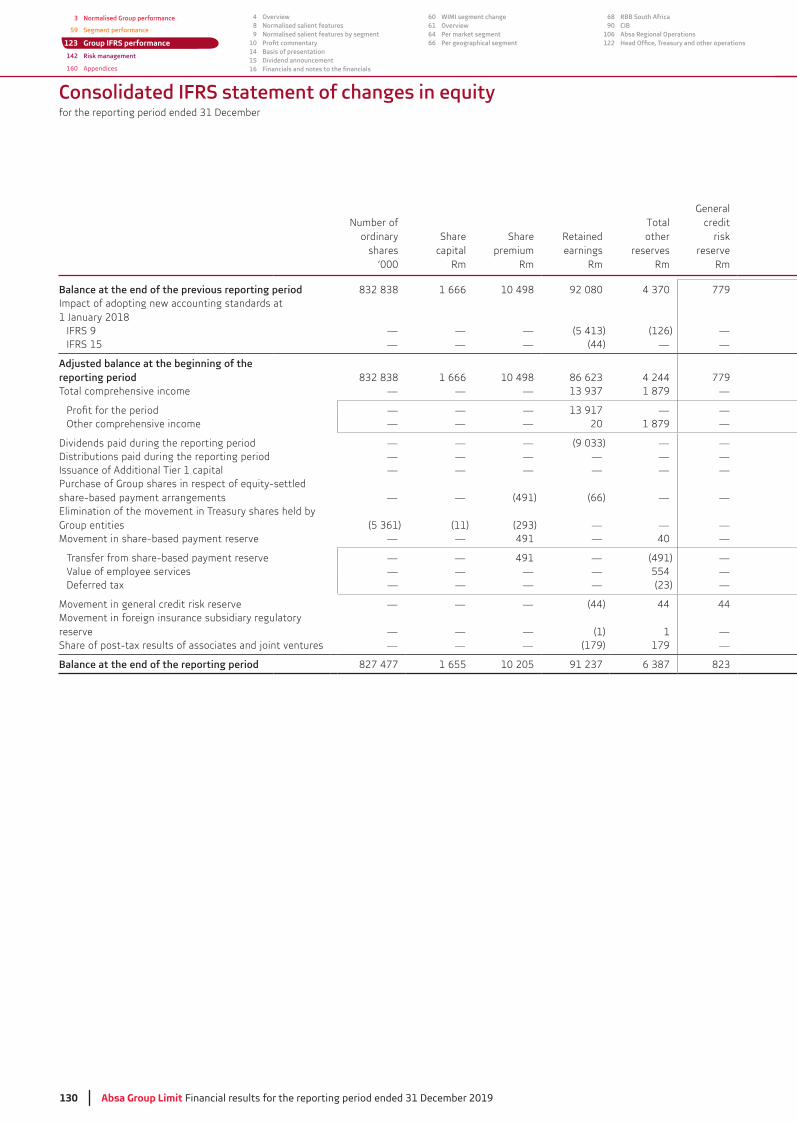
130 Absa Group Limit Financial results for the reporting period ended 31 December 2019
3 Normalised Group performance
59 Segment performance
123 Group IFRS performance
142 Risk management
160 Appendices
4 Overview8 Normalised salient features9 Normalised salient features by segment
1014 Basis of presentation15 Dividend announcement16
60 WIMI segment change61 Overview64 Per market segment66 Per geographical segment
68 RBB South Africa90 CIB
106 Absa Regional Operations122
Number of ordinary
shares’000
Sharecapital
Rm
Sharepremium
Rm
Retainedearnings
Rm
Totalother
reservesRm
Generalcredit
riskreserve
Rm
Balance at the end of the previous reporting period 1 666 10 498 92 080 779Impact of adopting new accounting standards at
IFRS 9 — — — (126) —IFRS 15 — — — (44) — —
Adjusted balance at the beginning of the reporting period 1 666 10 498 4 244 779Total comprehensive income — — — 1 879 —
— — — — —Other comprehensive income — — — 20 1 879 —
Dividends paid during the reporting period — — — — —Distributions paid during the reporting period — — — — — —Issuance of Additional Tier 1 capital — — — — — —
share-based payment arrangements — — (491) (66) — —Elimination of the movement in Treasury shares held by Group entities (11) — — —Movement in share-based payment reserve — — 491 — 40 —
Transfer from share-based payment reserve — — 491 — (491) —Value of employee services — — — — 554 —Deferred tax — — — — —
Movement in general credit risk reserve — — — (44) 44 44Movement in foreign insurance subsidiary regulatory reserve — — — (1) 1 —Share of post-tax results of associates and joint ventures — — — (179) 179 —
Balance at the end of the reporting period 827 477 1 655 10 205
Consolidated IFRS statement of changes in equity
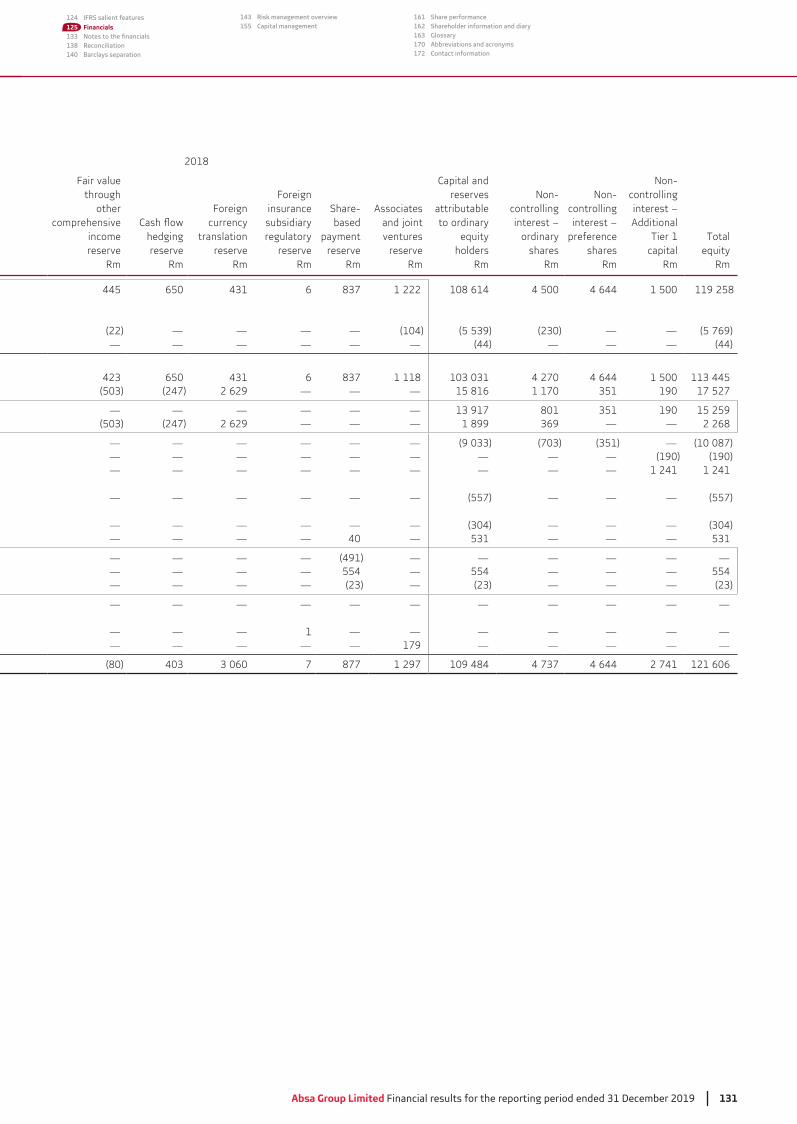
Absa Group Limited Financial results for the reporting period ended 31 December 2019 131
124 IFRS salient features
125 Financials133138140
143 Risk management overview155
161162163170172
2018
Fair value through
other comprehensive
income reserve
Rm
hedging reserve
Rm
Foreign currency
translation reserve
Rm
Foreign insurance subsidiary
regulatory reserve
Rm
Share-based
payment reserve
Rm
Associatesand joint ventures
reserveRm
Capital and reserves
attributable to ordinary
equityholders
Rm
Non-controlling interest – ordinary
sharesRm
Non-controlling interest –
preference shares
Rm
Non-controlling interest – Additional
Tier 1capital
Rm
Totalequity
Rm
445 650 6 1 222 108 614 4 500 4 644 1 500 119 258
(22) — — — — (104) — — (5 769)— — — — — — (44) — — — (44)
650 6 1 118 4 270 4 644 1 500(247) 2 629 — — — 15 816 1 170 190 17 527
— — — — — — 801 190 15 259(247) 2 629 — — — 1 899 — — 2 268
— — — — — — — (10 087)— — — — — — — — — (190) (190)— — — — — — — — — 1 241 1 241
— — — — — — (557) — — — (557)
— — — — — — — — —— — — — 40 — — — —
— — — — (491) — — — — — —— — — — 554 — 554 — — — 554— — — — — — — —
— — — — — — — — — — —
— — — 1 — — — — — — —— — — — — 179 — — — — —
(80) 7 877 1 297 109 484 4 644 2 741 121 606
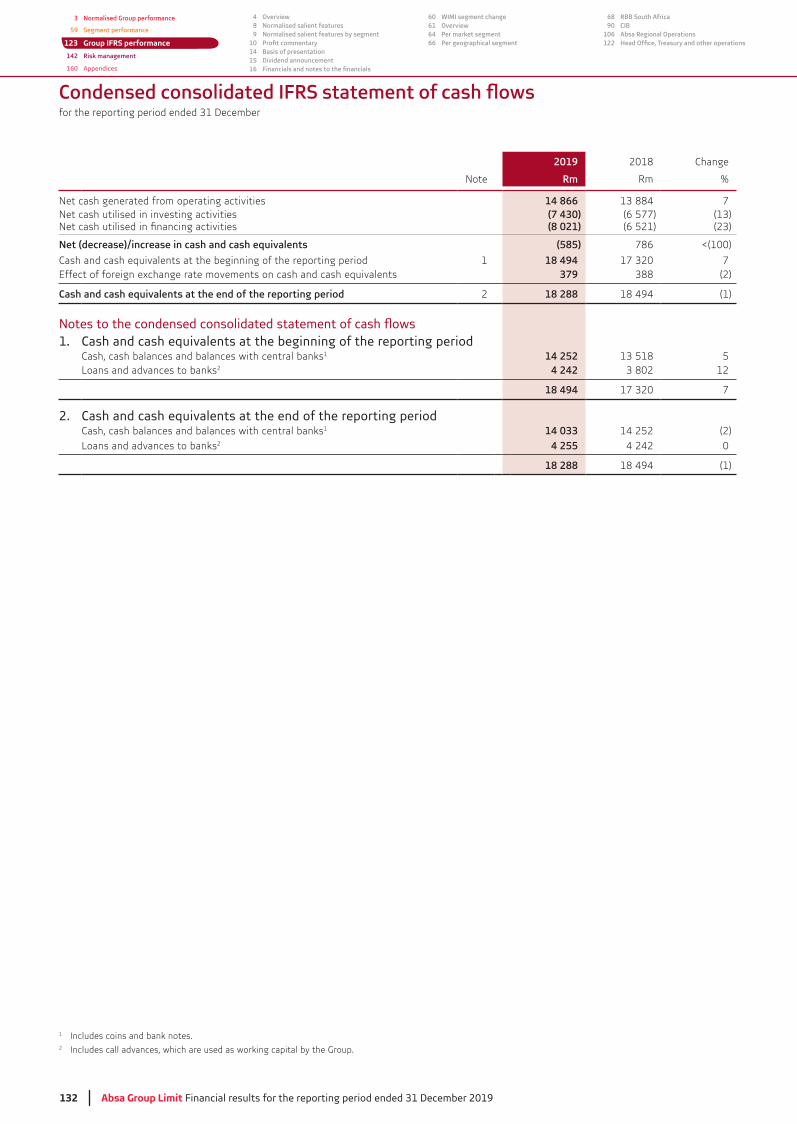
132 Absa Group Limit Financial results for the reporting period ended 31 December 2019
3 Normalised Group performance
59 Segment performance
123 Group IFRS performance
142 Risk management
160 Appendices
4 Overview8 Normalised salient features9 Normalised salient features by segment
1014 Basis of presentation15 Dividend announcement16
60 WIMI segment change61 Overview64 Per market segment66 Per geographical segment
68 RBB South Africa90 CIB
106 Absa Regional Operations122
2019 2018 Change
Note Rm Rm %
Net cash generated from operating activities 14 866 7Net cash utilised in investing activities (7 430) (6 577)
(8 021) (6 521)
Net (decrease)/increase in cash and cash equivalents (585) 786 <(100)
Cash and cash equivalents at the beginning of the reporting period 1 18 494 7Effect of foreign exchange rate movements on cash and cash equivalents 379 (2)
Cash and cash equivalents at the end of the reporting period 2 18 288 18 494 (1)
1. Cash and cash equivalents at the beginning of the reporting periodCash, cash balances and balances with central banks1 14 252 5Loans and advances to banks2 4 242 12
18 494 7
2. Cash and cash equivalents at the end of the reporting periodCash, cash balances and balances with central banks1 14 033 14 252 (2)Loans and advances to banks2 4 255 4 242 0
18 288 18 494 (1)
1 Includes coins and bank notes.2 Includes call advances, which are used as working capital by the Group.

for the reporting period ended 31 December
Absa Group Limited Financial results for the reporting period ended 31 December 2019 133
124 IFRS salient features
125 Financials133138 Reconciliation140 Barclays separation
143 Risk management overview155 Capital management
161 Share performance162 Shareholder information and diary163 Glossary170 Abbreviations and acronyms172 Contact information
1. Headline earnings and earnings per ordinary share2019 2018
Headline earningsGross
RmNetRm
GrossRm
NetRm
Netchange
%
Headline earnings is determined as follows:14 256 2
Total headline earnings adjustment 270 225 20
— — (100)(19) (15) (142) (80) (81)(27) (21) 5 2 <(100)
IAS 21 – Recycled foreign currency translation reserve 118 81 — — 100208 153 297 (48)122 88 2 1 >100
IFRS 5 – Re-measurement of non-current assets held for sale (9) (6) — — (100)IAS 40 – Change in fair value of investment properties (12) (9) (29) (69)
(1) (1) — — (100)
14 526 14 142
2019Rm
2018Rm
Changevalue/
%
Basic earnings per ordinary shareBasic earnings attributable to ordinary equity holders (Rm) 14 256 2
Weighted average number of ordinary shares in issue (million) 830.0 (0.1)
Issued shares at the beginning of the reporting period (million) 847.8 847.8 —Treasury shares held by Group entities (million) (17.8) (17.7) (0.1)
Basic earnings per ordinary share (cents) 1 717.6 1 676.5 2
Diluted basic earnings per ordinary shareBasic earnings attributable to ordinary equity holders (Rm) 14 256 2
Diluted weighted average number of ordinary shares in issue (million) 831.2 (0.5)
Weighted average number of ordinary shares in issue (million) 830.0 (0.1)Adjustments for share options issued at no value (million) 1.2 1.6 (0.4)
Diluted basic earnings per ordinary share (cents) 1 715.1 2
Headline earnings per ordinary shareHeadline earnings attributable to ordinary equity holders (Rm) 14 526 14 142
Weighted average number of ordinary shares in issue (million) 830.0 (0.1)
Headline earnings per ordinary share (cents) 1 750.1
Diluted headline earnings per ordinary shareHeadline earnings attributable to ordinary equity holders (Rm) 14 526 14 142
Diluted weighted average number of ordinary shares in issue (million) 831.2 (0.5)
Diluted headline earnings per ordinary share (cents) 1 747.6 1 700.4
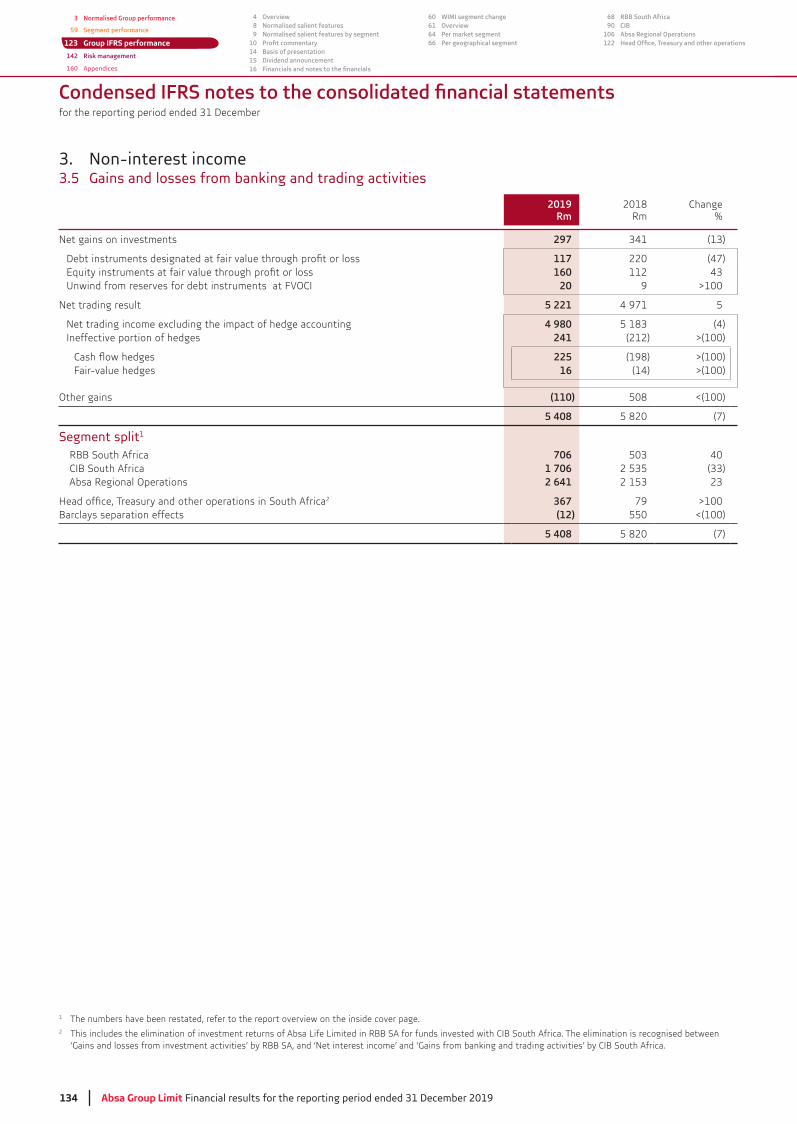
for the reporting period ended 31 December
134 Absa Group Limit Financial results for the reporting period ended 31 December 2019
3 Normalised Group performance
59 Segment performance
123 Group IFRS performance
142 Risk management
160 Appendices
4 Overview8 Normalised salient features9 Normalised salient features by segment
1014 Basis of presentation15 Dividend announcement16
60 WIMI segment change61 Overview64 Per market segment66 Per geographical segment
68 RBB South Africa90 CIB
106 Absa Regional Operations122
3. Non-interest income3.5 Gains and losses from banking and trading activities
2019Rm
2018Rm
Change%
Net gains on investments 297
117 220 (47)160 112
Unwind from reserves for debt instruments at FVOCI 20 9 >100
Net trading result 5 221 4 971 5
Net trading income excluding the impact of hedge accounting 4 980 (4)Ineffective portion of hedges 241 (212) >(100)
225 (198) >(100)Fair-value hedges 16 (14) >(100)
Other gains (110) 508 <(100)
5 408 5 820 (7)
Segment split1
RBB South Africa 706 40 CIB South Africa 1 706
Absa Regional Operations 2 641
2 367 79 >100 Barclays separation effects (12) 550 <(100)
5 408 5 820 (7)
1 The numbers have been restated, refer to the report overview on the inside cover page.2 This includes the elimination of investment returns of Absa Life Limited in RBB SA for funds invested with CIB South Africa. The elimination is recognised between
‘Gains and losses from investment activities’ by RBB SA, and ‘Net interest income’ and ‘Gains from banking and trading activities’ by CIB South Africa.
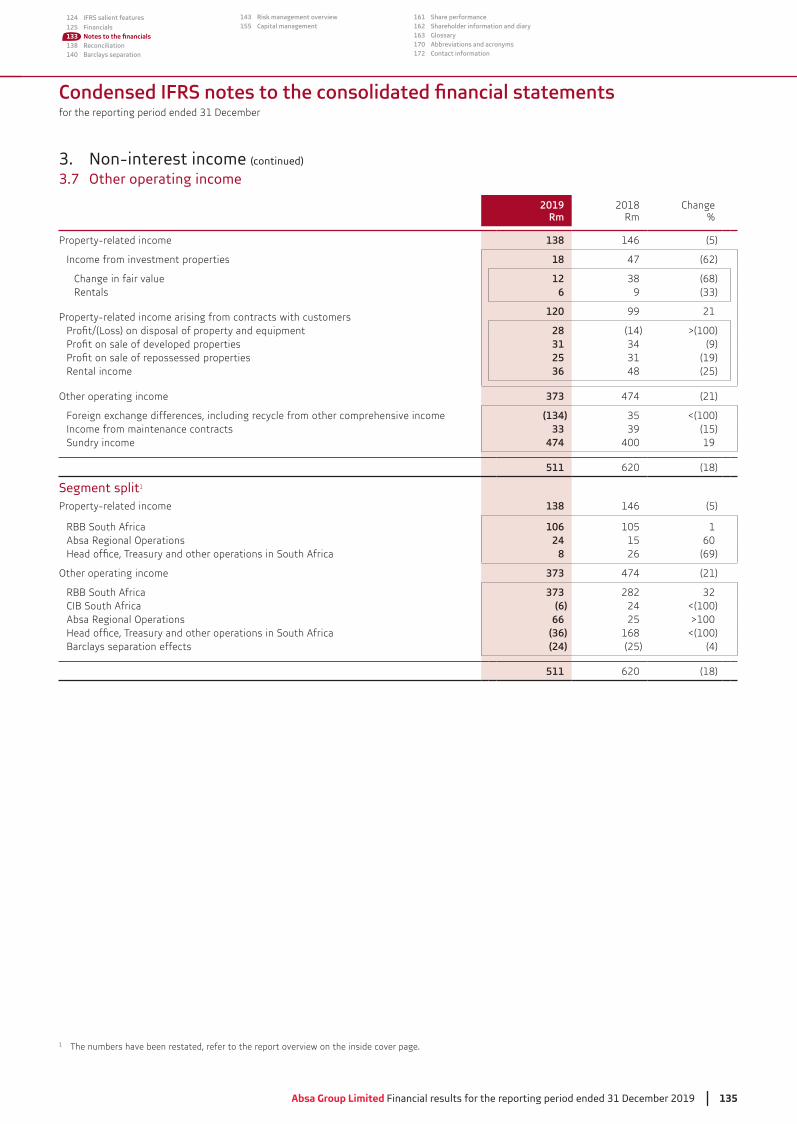
for the reporting period ended 31 December
Absa Group Limited Financial results for the reporting period ended 31 December 2019 135
124 IFRS salient features
125 Financials133138 Reconciliation140 Barclays separation
143 Risk management overview155 Capital management
161 Share performance162 Shareholder information and diary163 Glossary170 Abbreviations and acronyms172 Contact information
3. Non-interest income (continued)
3.7 Other operating income
2019Rm
2018Rm
Change%
138 146 (5)
Income from investment properties 18 47 (62)
Change in fair value 12 (68)Rentals 6 9
120 99 21
28 (14) >(100)31 (9)25 (19)
Rental income 36 48 (25)
Other operating income 373 474 (21)
Foreign exchange differences, including recycle from other comprehensive income (134) <(100)Income from maintenance contracts 33 (15)Sundry income 474 400 19
511 620 (18)
Segment split1
138 146 (5)
RBB South Africa 106 105 1Absa Regional Operations 24 15 60
8 26 (69)
Other operating income 373 474 (21)
RBB South Africa 373 282CIB South Africa (6) 24 <(100)Absa Regional Operations 66 25 >100
(36) 168 <(100)Barclays separation effects (24) (25) (4)
511 620 (18)
1 The numbers have been restated, refer to the report overview on the inside cover page.

for the reporting period ended 31 December
136 Absa Group Limit Financial results for the reporting period ended 31 December 2019
3 Normalised Group performance
59 Segment performance
123 Group IFRS performance
142 Risk management
160 Appendices
4 Overview8 Normalised salient features9 Normalised salient features by segment
1014 Basis of presentation15 Dividend announcement16
60 WIMI segment change61 Overview64 Per market segment66 Per geographical segment
68 RBB South Africa90 CIB
106 Absa Regional Operations122
5. Operating expenses2019
Rm2018
RmChange
%
Administration fees 579 469Amortisation of intangible assets 1 368 846 62Auditors’ remuneration 378 6Cash transportation 1 304 1 266Depreciation 3 638 55Equipment costs 358Information technology 3 793 15Marketing costs 1 743 1 962 (11)Operating lease expenses on properties 177 1 607 (89)Other operating costs (includes fraud losses, travel and entertainment costs) 2 887 2 779 4
344 (5)2 463 2 700 (9)1 826 1 816 1
Staff costs 26 262 24 761 6
Bonuses 2 085 2 196 (5) Deferred cash and share-based payments 671 771 Other1 1 075 984 9
21 981 8 Training costs 450 426 6
TSA direct costs 469 820Telephone and postage 1 178
48 767 4
Barclays separation effects 2 410 (24)
TSA direct costs 469 820551 880
Staff costs 566 (22)Other2 824
R2 410m24%. These costs decrease the year-on-year growth rates mainly in TSA direct costs, staff costs and professional fees.
1 Includes recruitment costs, membership fees to professional bodies, staff parking, redundancy fees, study assistance, staff relocation and refreshment costs.2 Includes marketing costs, travel and entertainment costs, information technology costs, property costs, depreciation, amortisation and auditors’ remuneration costs.
6. Indirect taxation2019
Rm2018
RmChange
%
Training levy 201 211 (5)Value-added tax net of input credits 1 475 7
1 676 1 592 5
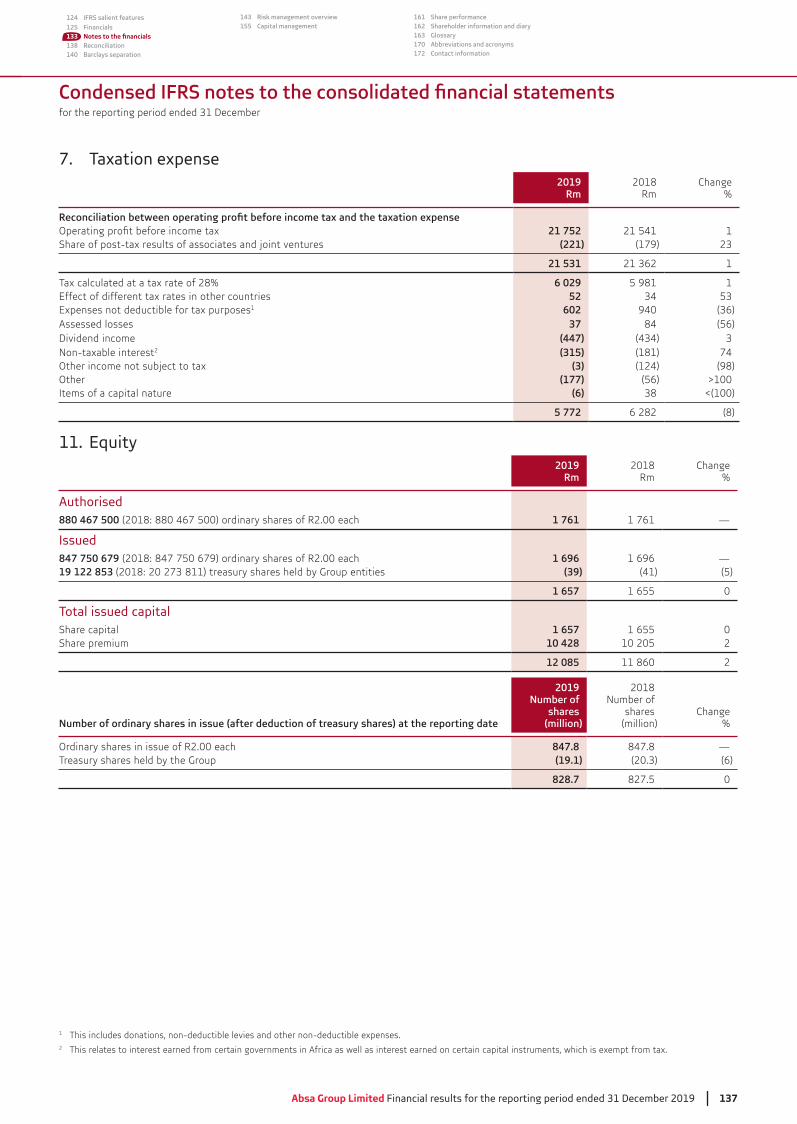
for the reporting period ended 31 December
Absa Group Limited Financial results for the reporting period ended 31 December 2019 137
124 IFRS salient features
125 Financials133138 Reconciliation140 Barclays separation
143 Risk management overview155 Capital management
161 Share performance162 Shareholder information and diary163 Glossary170 Abbreviations and acronyms172 Contact information
1 This includes donations, non-deductible levies and other non-deductible expenses.2 This relates to interest earned from certain governments in Africa as well as interest earned on certain capital instruments, which is exempt from tax.
7. Taxation expense2019
Rm2018
RmChange
%
21 752 21 541 1Share of post-tax results of associates and joint ventures (221) (179)
21 531 1
Tax calculated at a tax rate of 28% 6 029 5 981 1Effect of different tax rates in other countries 52Expenses not deductible for tax purposes1 602 940Assessed losses 37 84 (56)Dividend income (447)Non-taxable interest2 (315) (181) 74Other income not subject to tax (3) (124) (98)Other (177) (56) >100Items of a capital nature (6) <(100)
5 772 6 282 (8)
11. Equity2019
Rm2018
RmChange
%
Authorised880 467 500 (2018: 880 467 500) ordinary shares of R2.00 each 1 761 1 761 —
Issued847 750 679 (2018: 847 750 679) ordinary shares of R2.00 each 1 696 1 696 —19 122 853 (39) (41) (5)
1 657 1 655 0
Total issued capitalShare capital 1 657 1 655 0Share premium 10 428 10 205 2
12 085 11 860 2
Number of ordinary shares in issue (after deduction of treasury shares) at the reporting date
2019Number of
shares(million)
2018Number of
shares(million)
Change%
Ordinary shares in issue of R2.00 each 847.8 847.8 —Treasury shares held by the Group (19.1) (6)
828.7 827.5 0
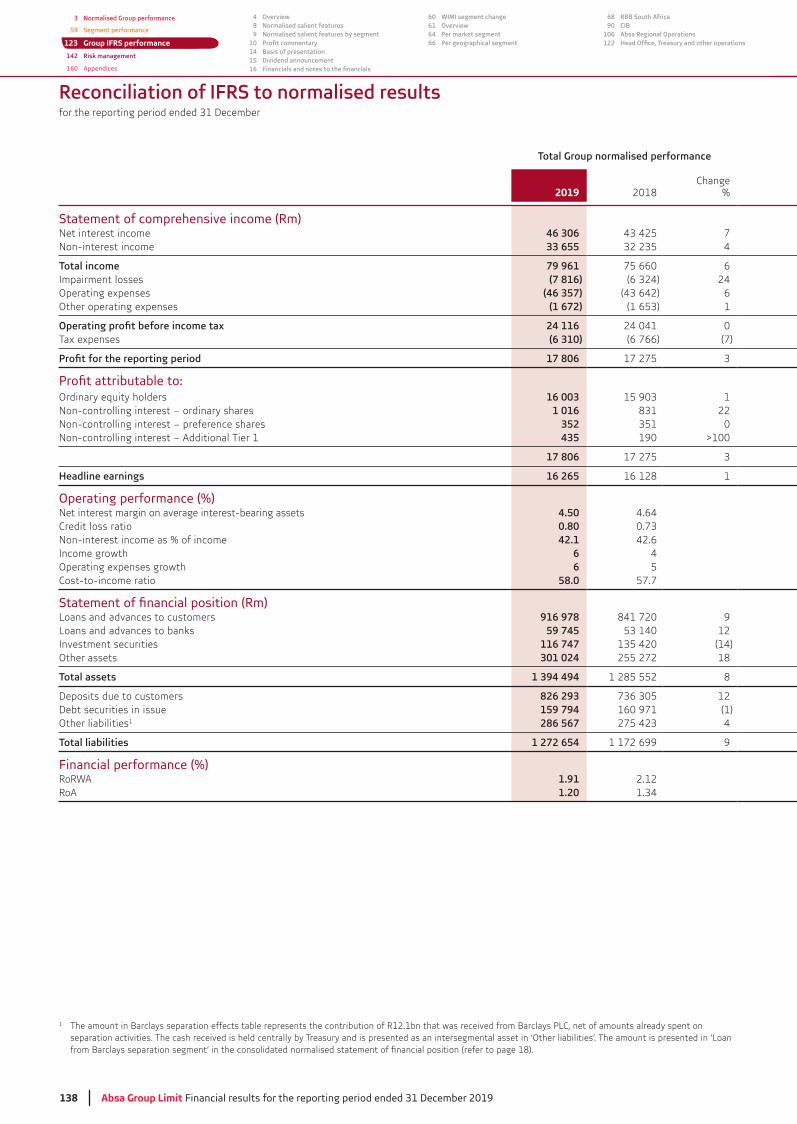
138 Absa Group Limit Financial results for the reporting period ended 31 December 2019
3 Normalised Group performance
59 Segment performance
123 Group IFRS performance
142 Risk management
160 Appendices
4 Overview8 Normalised salient features9 Normalised salient features by segment
1014 Basis of presentation15 Dividend announcement16
60 WIMI segment change61 Overview64 Per market segment66 Per geographical segment
68 RBB South Africa90 CIB
106 Absa Regional Operations122
Reconciliation of IFRS to normalised results
2019 2018Change
%
Statement of comprehensive income (Rm)Net interest income 46 306 7Non-interest income 33 655 4
79 961 75 660 6Impairment losses (7 816) 24Operating expenses (46 357) 6Other operating expenses (1 672) 1
24 116 24 041 0Tax expenses (6 310) (6 766) (7)
17 806 17 275
Ordinary equity holders 16 003 1Non-controlling interest – ordinary shares 1 016 22Non-controlling interest – preference shares 352 0Non-controlling interest – Additional Tier 1 435 190 >100
17 806 17 275
Headline earnings 16 265 16 128 1
Operating performance (%) Net interest margin on average interest-bearing assets 4.50 4.64Credit loss ratio 0.80Non-interest income as % of income 42.1 42.6Income growth 6 4Operating expenses growth 6 5Cost-to-income ratio 58.0 57.7
Loans and advances to customers 916 978 841 720 9Loans and advances to banks 59 745 12Investment securities 116 747 (14)Other assets 301 024 255 272 18
1 394 494 1 285 552 8
Deposits due to customers 826 293 12Debt securities in issue 159 794 160 971 (1)Other liabilities1 286 567 4
1 272 654 1 172 699 9
Financial performance (%)RoRWA 1.91 2.12RoA 1.20
1
separation activities. The cash received is held centrally by Treasury and is presented as an intersegmental asset in ‘Other liabilities’. The amount is presented in ‘Loan
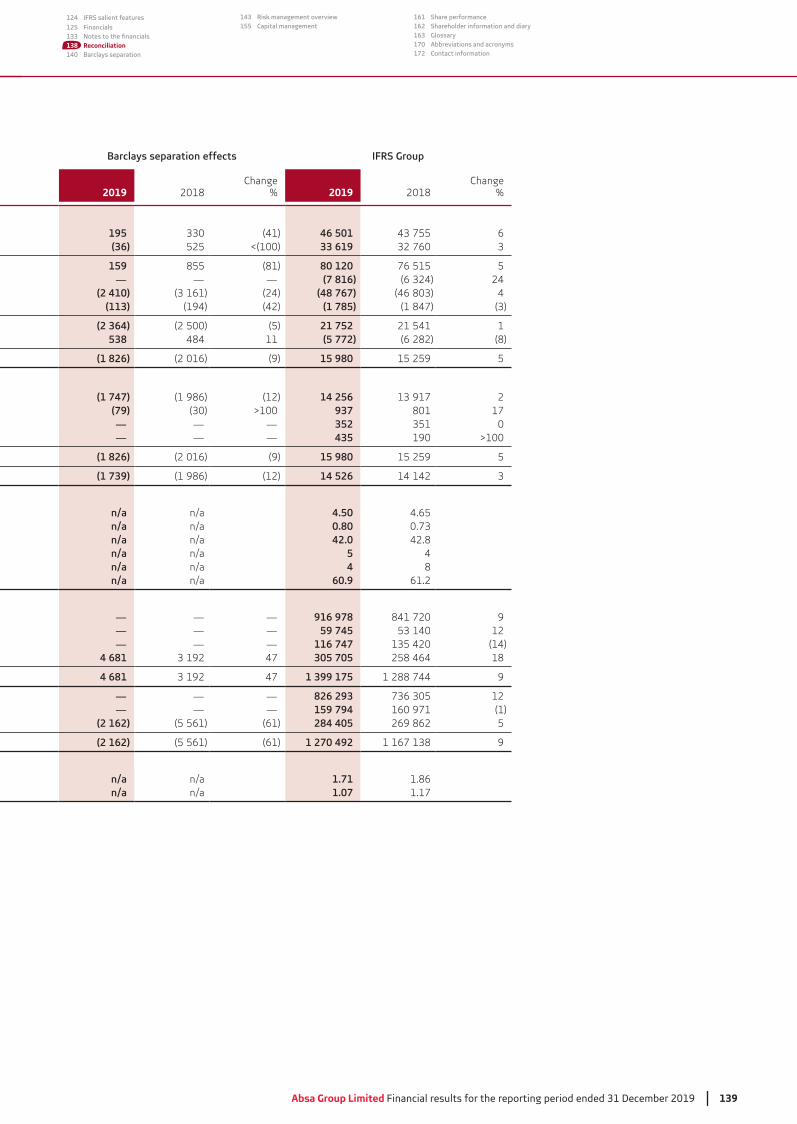
Absa Group Limited Financial results for the reporting period ended 31 December 2019 139
124 IFRS salient features
125 Financials133138 Reconciliation140 Barclays separation
143 Risk management overview155 Capital management
161 Share performance162 Shareholder information and diary163 Glossary170 Abbreviations and acronyms172 Contact information
Barclays separation effects IFRS Group
2019 2018Change
% 2019 2018Change
%
195 (41) 46 501 6(36) 525 <(100) 33 619
159 855 (81) 80 120 76 515 5— — — (7 816) 24
(2 410) (24) (48 767) 4(113) (194) (42) (1 785) (1 847)
(2 364) (2 500) (5) 21 752 21 541 1538 484 11 (5 772) (6 282) (8)
(1 826) (2 016) (9) 15 980 15 259 5
(1 747) (1 986) (12) 14 256 2(79) >100 937 801 17— — — 352 0— — — 435 190 >100
(1 826) (2 016) (9) 15 980 15 259 5
(1 739) (1 986) (12) 14 526 14 142
n/a n/a 4.50 4.65n/a n/a 0.80n/a n/a 42.0 42.8n/a n/a 5 4n/a n/a 4 8n/a n/a 60.9 61.2
— — — 916 978 841 720 9— — — 59 745 12— — — 116 747 (14)
4 681 47 305 705 258 464 18
4 681 47 1 399 175 1 288 744 9
— — — 826 293 12— — — 159 794 160 971 (1)
(2 162) (5 561) (61) 284 405 269 862 5
(2 162) (5 561) (61) 1 270 492 9
n/a n/a 1.71 1.86n/a n/a 1.07 1.17
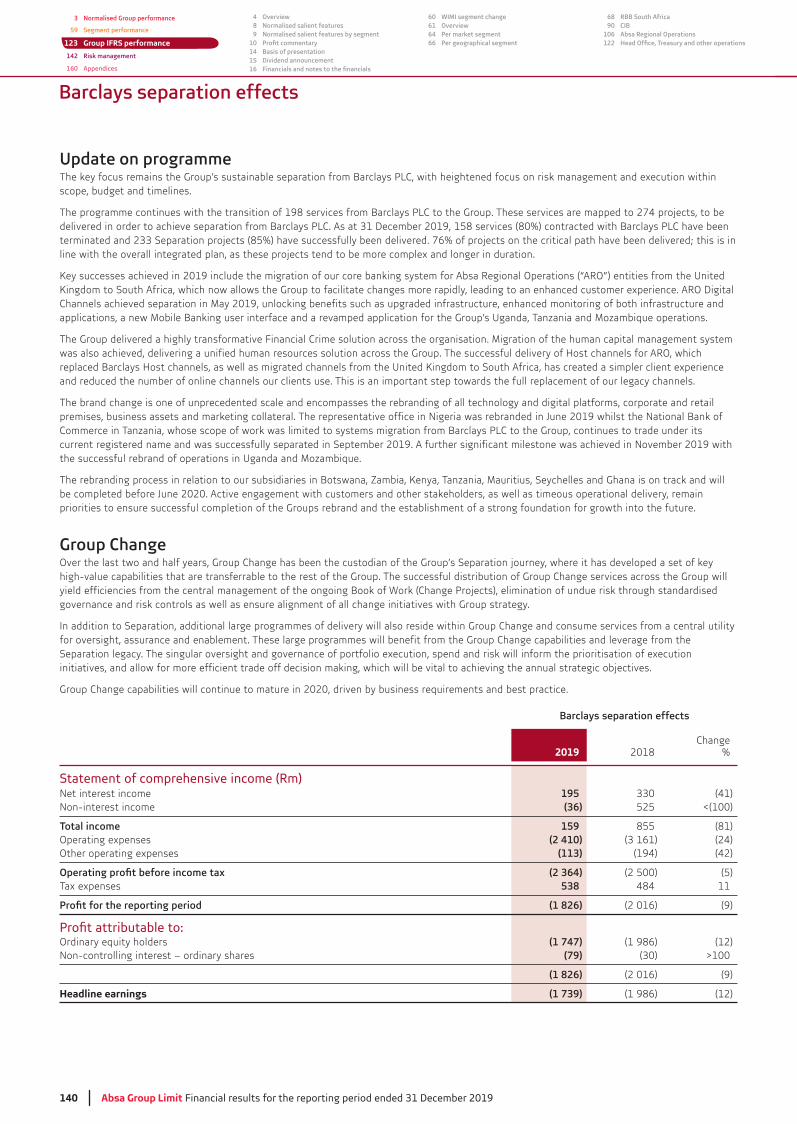
140 Absa Group Limit Financial results for the reporting period ended 31 December 2019
3 Normalised Group performance
59 Segment performance
123 Group IFRS performance
142 Risk management
160 Appendices
4 Overview8 Normalised salient features9 Normalised salient features by segment
1014 Basis of presentation15 Dividend announcement16
60 WIMI segment change61 Overview64 Per market segment66 Per geographical segment
68 RBB South Africa90 CIB
106 Absa Regional Operations122
Barclays separation effects
Update on programme
scope, budget and timelines.
line with the overall integrated plan, as these projects tend to be more complex and longer in duration.
Channels achieved separation in May 2019, unlocking benefits such as upgraded infrastructure, enhanced monitoring of both infrastructure and applications, a new Mobile Banking user interface and a revamped application for the Group’s Uganda, Tanzania and Mozambique operations.
The Group delivered a highly transformative Financial Crime solution across the organisation. Migration of the human capital management system was also achieved, delivering a unified human resources solution across the Group. The successful delivery of Host channels for ARO, which
and reduced the number of online channels our clients use. This is an important step towards the full replacement of our legacy channels.
The brand change is one of unprecedented scale and encompasses the rebranding of all technology and digital platforms, corporate and retail
current registered name and was successfully separated in September 2019. A further significant milestone was achieved in November 2019 with the successful rebrand of operations in Uganda and Mozambique.
priorities to ensure successful completion of the Groups rebrand and the establishment of a strong foundation for growth into the future.
Group ChangeOver the last two and half years, Group Change has been the custodian of the Group’s Separation journey, where it has developed a set of key high-value capabilities that are transferrable to the rest of the Group. The successful distribution of Group Change services across the Group will
governance and risk controls as well as ensure alignment of all change initiatives with Group strategy.
In addition to Separation, additional large programmes of delivery will also reside within Group Change and consume services from a central utility for oversight, assurance and enablement. These large programmes will benefit from the Group Change capabilities and leverage from the Separation legacy. The singular oversight and governance of portfolio execution, spend and risk will inform the prioritisation of execution initiatives, and allow for more efficient trade off decision making, which will be vital to achieving the annual strategic objectives.
Group Change capabilities will continue to mature in 2020, driven by business requirements and best practice.
Barclays separation effects
2019 2018Change
%
Statement of comprehensive income (Rm)Net interest income 195 (41)Non-interest income (36) 525 <(100)
159 855 (81)Operating expenses (2 410) (24)Other operating expenses (113) (194) (42)
(2 364) (2 500) (5)Tax expenses 538 484 11
(1 826) (2 016) (9)
Ordinary equity holders (1 747) (1 986) (12)Non-controlling interest – ordinary shares (79) >100
(1 826) (2 016) (9)
Headline earnings (1 739) (1 986) (12)
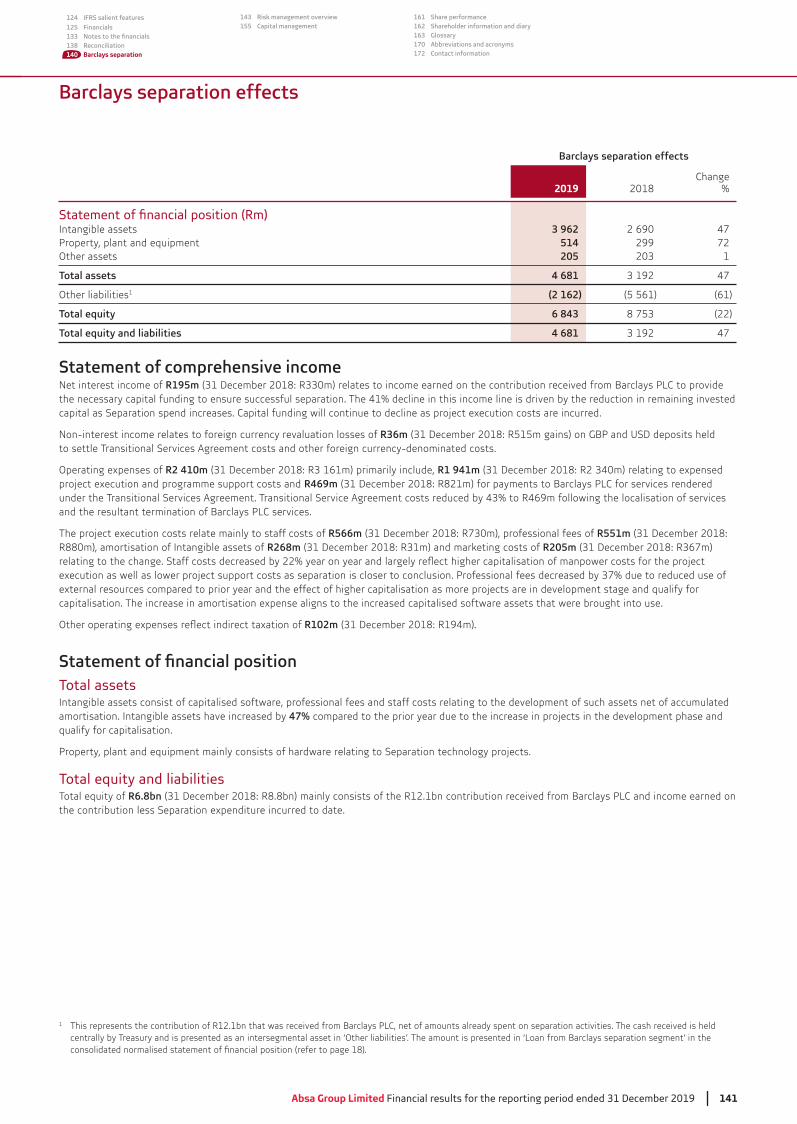
Absa Group Limited Financial results for the reporting period ended 31 December 2019 141
124 IFRS salient features
125 Financials133138 Reconciliation140 Barclays separation
143 Risk management overview155 Capital management
161 Share performance162 Shareholder information and diary163 Glossary170 Abbreviations and acronyms172 Contact information
Barclays separation effects
Barclays separation effects
2019 2018Change
%
Intangible assets 3 962 2 690 47514 299 72
Other assets 205 1
4 681 47
Other liabilities1 (2 162) (5 561) (61)
6 843 (22)
4 681 47
Statement of comprehensive incomeNet interest income of R195mthe necessary capital funding to ensure successful separation. The 41% decline in this income line is driven by the reduction in remaining invested capital as Separation spend increases. Capital funding will continue to decline as project execution costs are incurred.
Non-interest income relates to foreign currency revaluation losses of R36m to settle Transitional Services Agreement costs and other foreign currency-denominated costs.
Operating expenses of R2 410m R1 941mproject execution and programme support costs and R469m
The project execution costs relate mainly to staff costs of R566m R551mR880m), amortisation of Intangible assets of R268m R205m
external resources compared to prior year and the effect of higher capitalisation as more projects are in development stage and qualify for capitalisation. The increase in amortisation expense aligns to the increased capitalised software assets that were brought into use.
R102m
Total assetsIntangible assets consist of capitalised software, professional fees and staff costs relating to the development of such assets net of accumulated amortisation. Intangible assets have increased by 47% compared to the prior year due to the increase in projects in the development phase and qualify for capitalisation.
Total equity and liabilitiesTotal equity of R6.8bnthe contribution less Separation expenditure incurred to date.
1
centrally by Treasury and is presented as an intersegmental asset in ‘Other liabilities’. The amount is presented in ‘Loan from Barclays separation segment’ in the
Risk management overviewfor the reporting period ended 31 December 2019
142 Absa Group Limit Financial results for the reporting period ended 31 December 2019
3 Normalised Group performance
59 Segment performance
123 Group IFRS performance
142 Risk management
160 Appendices
4 Overview8 Normalised salient features9 Normalised salient features by segment
1014 Basis of presentation15 Dividend announcement16
60 WIMI segment change61 Overview64 Per market segment66 Per geographical segment
68 RBB South Africa90 CIB
106 Absa Regional Operations122
Risk management
Risk management overviewEnterprise Risk Management Framework 143
Current and emerging risks 144
Risk and capital performance 146
Credit risk 147
148
148
Liquidity risk 148
Capital risk 149
Interest rate risk in the banking book 150
Operational risk 151
Business risk 151
152
Insurance risk 152
Model risk 153
Conduct risk 153
Legal risk 154
Capital management and RWACapital adequacy 155
Overview of RWA 157
Capital supply 158
Economic capital 159
Absa Group Limited Financial results for the reporting period ended 31 December 2019 142

Risk management overviewfor the reporting period ended 31 December 2019
Absa Group Limited Financial results for the reporting period ended 31 December 2019 143
124 IFRS salient features
125 Financials133138 Reconciliation140 Barclays separation
143 Risk management overview155 Capital management
161 Share performance162 Shareholder information and diary163 Glossary170 Abbreviations and acronyms172 Contact information
Risk management overview
The Group maintains an active approach towards managing both current and emerging risks through the continued operating effectiveness of its Board approved Enterprise Risk Management Framework (ERMF). This approach is underpinned by:
A robust and aligned governance structure at Group, country and business level.
A ‘three lines of defence’ model, with clear accountability for managing, overseeing and independently assuring risks.
Comprehensive processes to evaluate, respond to, and monitor risks.
A sound architecture that sets out the appropriate risk practices, tools, techniques and organisational arrangements.
Below is a depiction of the ERMF design.
The strategy is set within the parameters of an agreed risk appetite. The risk strategy is developed alongside the Group’s strategy. The risk appetite defines the nature and amount of risk the Group is willing to take to achieve strategic objectives.
Risk strategy and appetite
The Group’s approach to managing risk is outlined in the ERMF. The following foundations underpin the ERMF:
Risk management framework
Evaluate Respond Monitor
Ensure that risk profiles remain within agreed
appetite levels, verify that controls are working
as intended, and challenge or promote re-evaluation
of the risks.
Financial Non-financial
Credit Traded Market
Treasury InsuranceBusiness
Risk operating model
The Group applies a ‘three lines of defence’ model to govern risk across all businesses and functions.
This is a structured and practical risk management approach to identify and assess the risk, determine the appropriate response, and then monitor the effectiveness of the response and the changes to the risk profile.
2nd line 3rd line1st line
1 A robust and consistent governance structure at Group, country and business level.
2 Well defined material risk categories known as principal risks.
3 A ‘three lines of defence’ model with clear accountability for managing and overseeing.
4 A comprehensive process to evaluate, respond to and monitor risks.
5 A robust risk operating model which provides clear roles and responsibilities.
Independent risk, compliance, legal and control functions who
formulate risk and control policies, and review the first line’s adherence
to these.
Internal audit function tests and reviews controls to determine that the first and second lines execute
their responsibilities effectively and consistently.
The appropriate risk response ensures that
risks are managed within risk appetite. This includes:
Operational Conduct Model
Technology (incl. cyber
and change)Legal
• risk mitigation; • risk transfer; and • ceasing certain
activities.
owners in customer facing
segments and Group functions who are
responsible for managing end-to-end risks and controls in
their businesses.
Individuals, teams and departments, including those responsible for
delivering the objective under review, identify
and assess the potential risks.
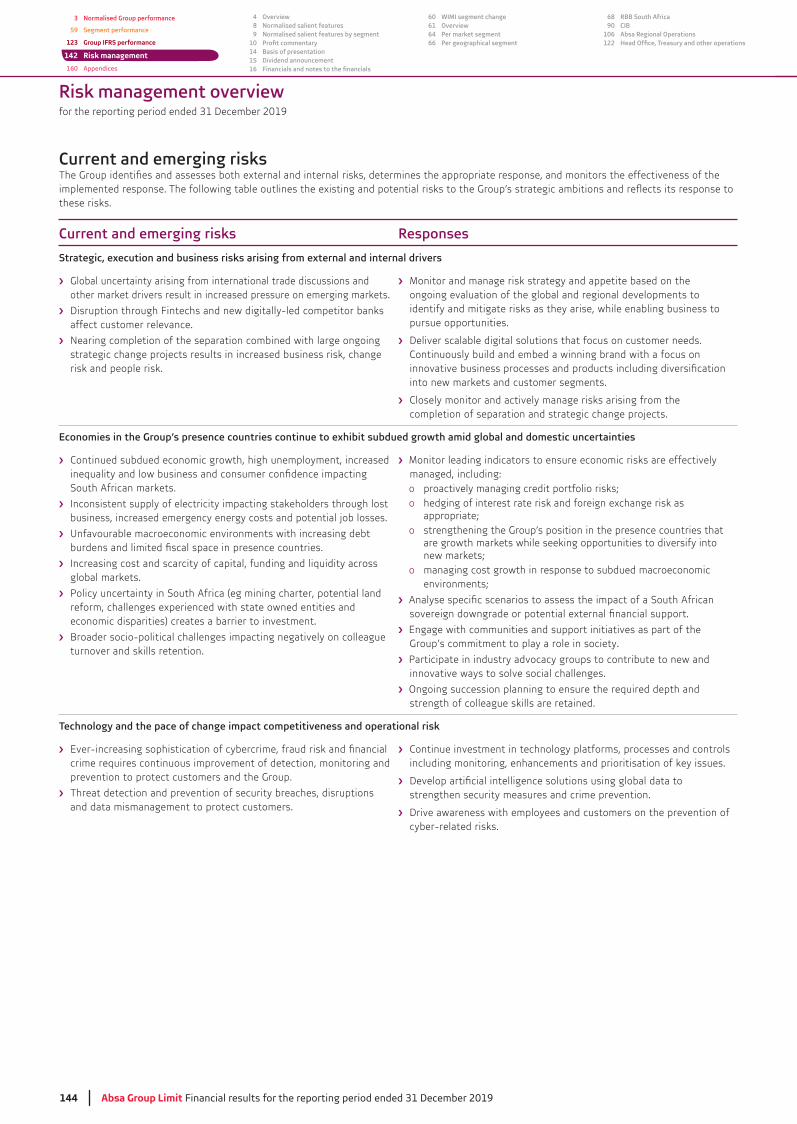
Risk management overviewfor the reporting period ended 31 December 2019
144 Absa Group Limit Financial results for the reporting period ended 31 December 2019
3 Normalised Group performance
59 Segment performance
123 Group IFRS performance
142 Risk management
160 Appendices
4 Overview8 Normalised salient features9 Normalised salient features by segment
1014 Basis of presentation15 Dividend announcement16
60 WIMI segment change61 Overview64 Per market segment66 Per geographical segment
68 RBB South Africa90 CIB
106 Absa Regional Operations122
Current and emerging risks
these risks.
Current and emerging risks Responses
Global uncertainty arising from international trade discussions and other market drivers result in increased pressure on emerging markets.
Disruption through Fintechs and new digitally-led competitor banks affect customer relevance.
Nearing completion of the separation combined with large ongoing strategic change projects results in increased business risk, change risk and people risk.
Monitor and manage risk strategy and appetite based on the ongoing evaluation of the global and regional developments to identify and mitigate risks as they arise, while enabling business to pursue opportunities.
Deliver scalable digital solutions that focus on customer needs. Continuously build and embed a winning brand with a focus on
into new markets and customer segments.
Closely monitor and actively manage risks arising from the completion of separation and strategic change projects.
Continued subdued economic growth, high unemployment, increased
South African markets.
Inconsistent supply of electricity impacting stakeholders through lost business, increased emergency energy costs and potential job losses.
Unfavourable macroeconomic environments with increasing debt
Increasing cost and scarcity of capital, funding and liquidity across global markets.
reform, challenges experienced with state owned entities and economic disparities) creates a barrier to investment.
Broader socio-political challenges impacting negatively on colleague turnover and skills retention.
Monitor leading indicators to ensure economic risks are effectively managed, including:o proactively managing credit portfolio risks;o hedging of interest rate risk and foreign exchange risk as
appropriate;o strengthening the Group’s position in the presence countries that
are growth markets while seeking opportunities to diversify into new markets;
o managing cost growth in response to subdued macroeconomic environments;
Engage with communities and support initiatives as part of the Group’s commitment to play a role in society.
innovative ways to solve social challenges.
Ongoing succession planning to ensure the required depth and strength of colleague skills are retained.
crime requires continuous improvement of detection, monitoring and prevention to protect customers and the Group.
Threat detection and prevention of security breaches, disruptions and data mismanagement to protect customers.
Continue investment in technology platforms, processes and controls including monitoring, enhancements and prioritisation of key issues.
strengthen security measures and crime prevention.
Drive awareness with employees and customers on the prevention of cyber-related risks.
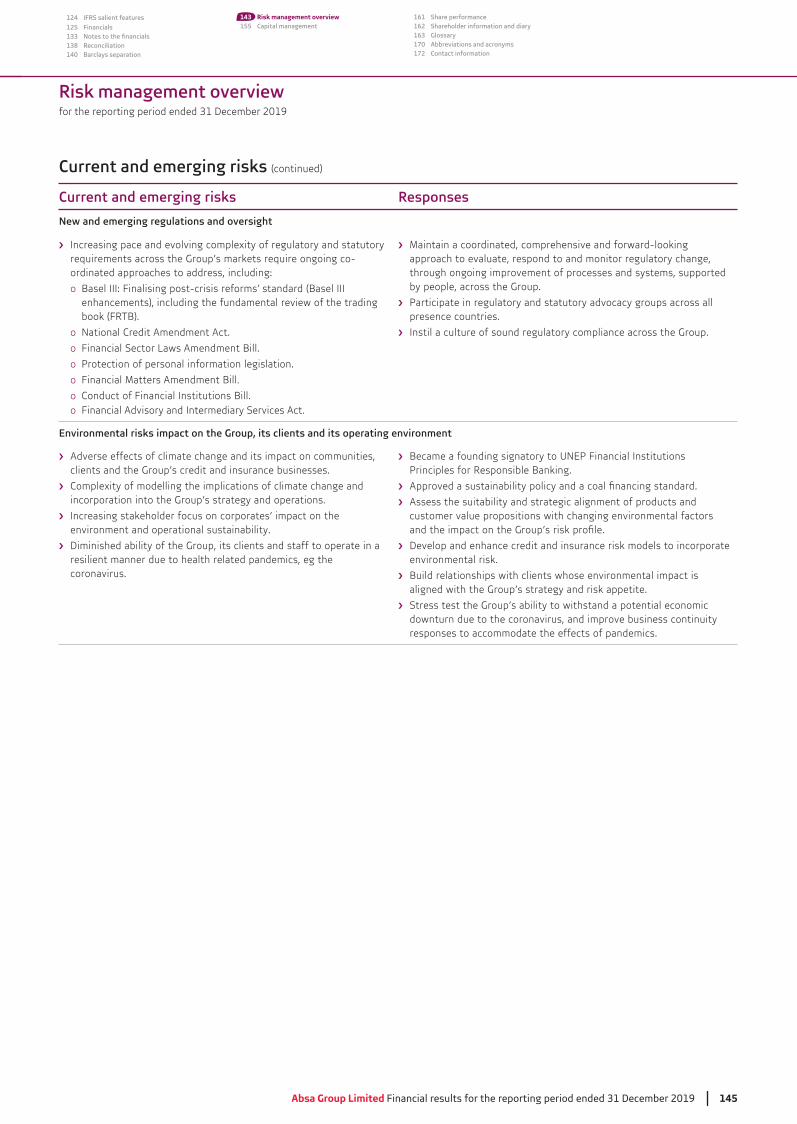
Risk management overviewfor the reporting period ended 31 December 2019
Absa Group Limited Financial results for the reporting period ended 31 December 2019 145
124 IFRS salient features
125 Financials133138 Reconciliation140 Barclays separation
143 Risk management overview155 Capital management
161 Share performance162 Shareholder information and diary163 Glossary170 Abbreviations and acronyms172 Contact information
Current and emerging risks (continued)
Current and emerging risks Responses
New and emerging regulations and oversight
Increasing pace and evolving complexity of regulatory and statutory requirements across the Group’s markets require ongoing co-ordinated approaches to address, including:
o Basel III: Finalising post-crisis reforms’ standard (Basel III enhancements), including the fundamental review of the trading book (FRTB).
o National Credit Amendment Act.
o Financial Sector Laws Amendment Bill.
o
o Financial Matters Amendment Bill.
o Conduct of Financial Institutions Bill.o Financial Advisory and Intermediary Services Act.
Maintain a coordinated, comprehensive and forward-looking approach to evaluate, respond to and monitor regulatory change, through ongoing improvement of processes and systems, supported by people, across the Group.
presence countries.
Instil a culture of sound regulatory compliance across the Group.
Adverse effects of climate change and its impact on communities, clients and the Group’s credit and insurance businesses.
Complexity of modelling the implications of climate change and incorporation into the Group’s strategy and operations.
Increasing stakeholder focus on corporates’ impact on the environment and operational sustainability.
Diminished ability of the Group, its clients and staff to operate in a resilient manner due to health related pandemics, eg the coronavirus.
Assess the suitability and strategic alignment of products and customer value propositions with changing environmental factors
Develop and enhance credit and insurance risk models to incorporate environmental risk.
Build relationships with clients whose environmental impact is aligned with the Group’s strategy and risk appetite.
Stress test the Group’s ability to withstand a potential economic downturn due to the coronavirus, and improve business continuity responses to accommodate the effects of pandemics.
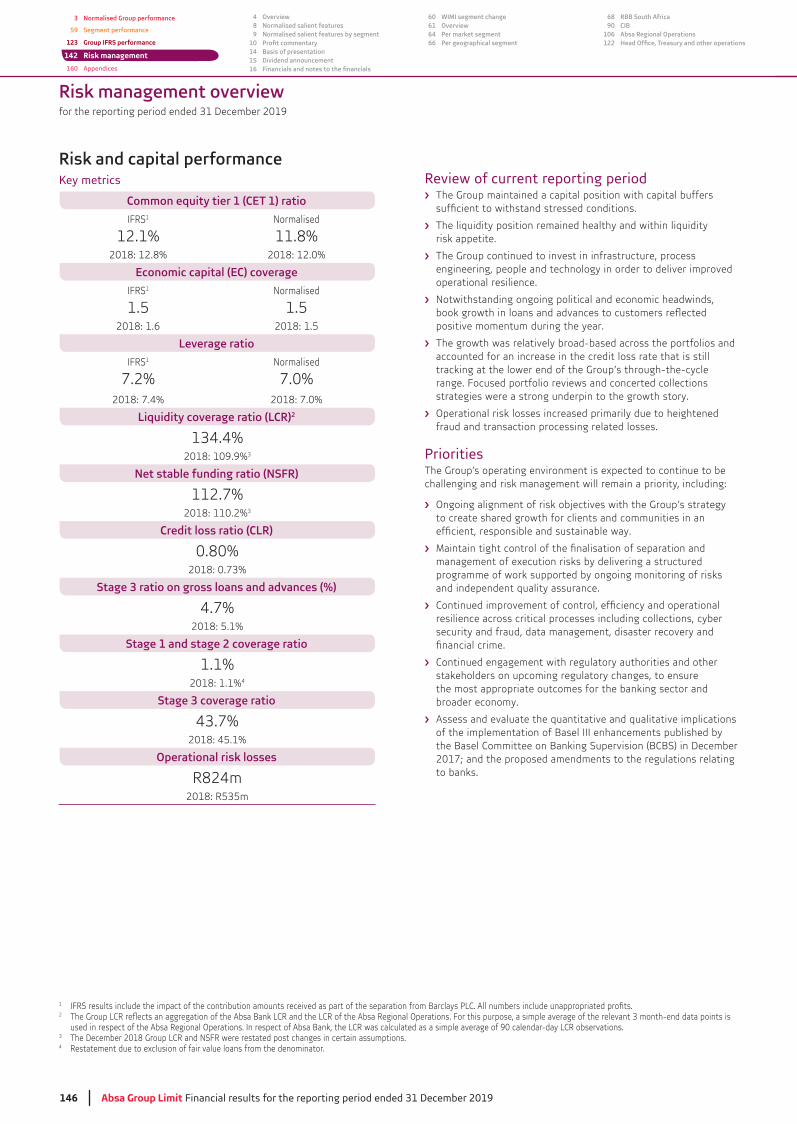
Risk management overviewfor the reporting period ended 31 December 2019
146 Absa Group Limit Financial results for the reporting period ended 31 December 2019
3 Normalised Group performance
59 Segment performance
123 Group IFRS performance
142 Risk management
160 Appendices
4 Overview8 Normalised salient features9 Normalised salient features by segment
1014 Basis of presentation15 Dividend announcement16
60 WIMI segment change61 Overview64 Per market segment66 Per geographical segment
68 RBB South Africa90 CIB
106 Absa Regional Operations122
Risk and capital performanceReview of current reporting period
The Group maintained a capital position with capital buffers
The liquidity position remained healthy and within liquidity risk appetite.
The Group continued to invest in infrastructure, process engineering, people and technology in order to deliver improved operational resilience.
Notwithstanding ongoing political and economic headwinds,
positive momentum during the year.
The growth was relatively broad-based across the portfolios and accounted for an increase in the credit loss rate that is still tracking at the lower end of the Group’s through-the-cycle range. Focused portfolio reviews and concerted collections strategies were a strong underpin to the growth story.
Operational risk losses increased primarily due to heightened fraud and transaction processing related losses.
PrioritiesThe Group’s operating environment is expected to continue to be challenging and risk management will remain a priority, including:
Ongoing alignment of risk objectives with the Group’s strategy to create shared growth for clients and communities in an
management of execution risks by delivering a structured programme of work supported by ongoing monitoring of risks and independent quality assurance.
resilience across critical processes including collections, cyber security and fraud, data management, disaster recovery and
Continued engagement with regulatory authorities and other stakeholders on upcoming regulatory changes, to ensure the most appropriate outcomes for the banking sector and broader economy.
Assess and evaluate the quantitative and qualitative implications of the implementation of Basel III enhancements published by the Basel Committee on Banking Supervision (BCBS) in December 2017; and the proposed amendments to the regulations relating to banks.
1
2
used in respect of the Absa Regional Operations. In respect of Absa Bank, the LCR was calculated as a simple average of 90 calendar-day LCR observations. The December 2018 Group LCR and NSFR were restated post changes in certain assumptions.
4 Restatement due to exclusion of fair value loans from the denominator.
Key metrics
IFRS1
12.1% Normalised
11.8%2018: 12.8% 2018: 12.0%
Economic capital (EC) coverage
IFRS1
1.5Normalised
1.52018: 1.6 2018: 1.5
Leverage ratio
IFRS1
7.2%Normalised
7.0%2018: 7.4% 2018: 7.0%
Liquidity coverage ratio (LCR)2
2018: 109.9%
Net stable funding ratio (NSFR)
112.7%2018: 110.2%
Credit loss ratio (CLR)
0.80%
Stage 3 ratio on gross loans and advances (%)
4.7%2018: 5.1%
Stage 1 and stage 2 coverage ratio
1.1%2018: 1.1%4
Stage 3 coverage ratio
2018: 45.1%
Operational risk losses
R824m
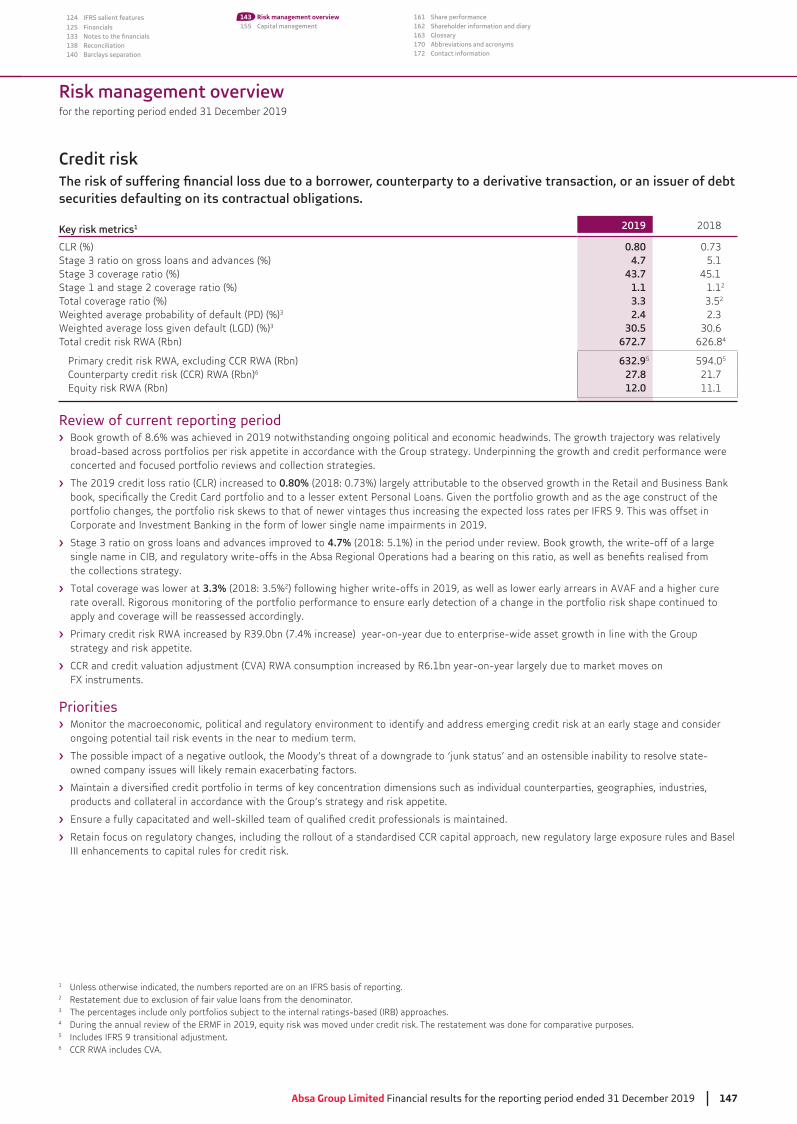
Risk management overviewfor the reporting period ended 31 December 2019
Absa Group Limited Financial results for the reporting period ended 31 December 2019 147
124 IFRS salient features
125 Financials133138 Reconciliation140 Barclays separation
143 Risk management overview155 Capital management
161 Share performance162 Shareholder information and diary163 Glossary170 Abbreviations and acronyms172 Contact information
Credit risk
securities defaulting on its contractual obligations.
Key risk metrics1 2019 2018
CLR (%) 0.804.7 5.1
43.7 45.1Stage 1 and stage 2 coverage ratio (%) 1.1 1.12
Total coverage ratio (%) 3.3 2
2.4Weighted average loss given default (LGD) (%) 30.5Total credit risk RWA (Rbn) 672.7 626.84
632.95 594.05
Counterparty credit risk (CCR) RWA (Rbn)6 27.8 21.7 Equity risk RWA (Rbn) 12.0 11.1
Review of current reporting period Book growth of 8.6% was achieved in 2019 notwithstanding ongoing political and economic headwinds. The growth trajectory was relatively broad-based across portfolios per risk appetite in accordance with the Group strategy. Underpinning the growth and credit performance were concerted and focused portfolio reviews and collection strategies.
The 2019 credit loss ratio (CLR) increased to 0.80%
portfolio changes, the portfolio risk skews to that of newer vintages thus increasing the expected loss rates per IFRS 9. This was offset in Corporate and Investment Banking in the form of lower single name impairments in 2019.
4.7% (2018: 5.1%) in the period under review. Book growth, the write-off of a large
the collections strategy.
Total coverage was lower at 3.3% 2) following higher write-offs in 2019, as well as lower early arrears in AVAF and a higher cure rate overall. Rigorous monitoring of the portfolio performance to ensure early detection of a change in the portfolio risk shape continued to apply and coverage will be reassessed accordingly.
strategy and risk appetite.
CCR and credit valuation adjustment (CVA) RWA consumption increased by R6.1bn year-on-year largely due to market moves on FX instruments.
Priorities Monitor the macroeconomic, political and regulatory environment to identify and address emerging credit risk at an early stage and consider ongoing potential tail risk events in the near to medium term.
The possible impact of a negative outlook, the Moody’s threat of a downgrade to ‘junk status’ and an ostensible inability to resolve state-owned company issues will likely remain exacerbating factors.
products and collateral in accordance with the Group’s strategy and risk appetite.
Retain focus on regulatory changes, including the rollout of a standardised CCR capital approach, new regulatory large exposure rules and Basel III enhancements to capital rules for credit risk.
1 Unless otherwise indicated, the numbers reported are on an IFRS basis of reporting.2 Restatement due to exclusion of fair value loans from the denominator. The percentages include only portfolios subject to the internal ratings-based (IRB) approaches.
4 During the annual review of the ERMF in 2019, equity risk was moved under credit risk. The restatement was done for comparative purposes.5 Includes IFRS 9 transitional adjustment.6 CCR RWA includes CVA.
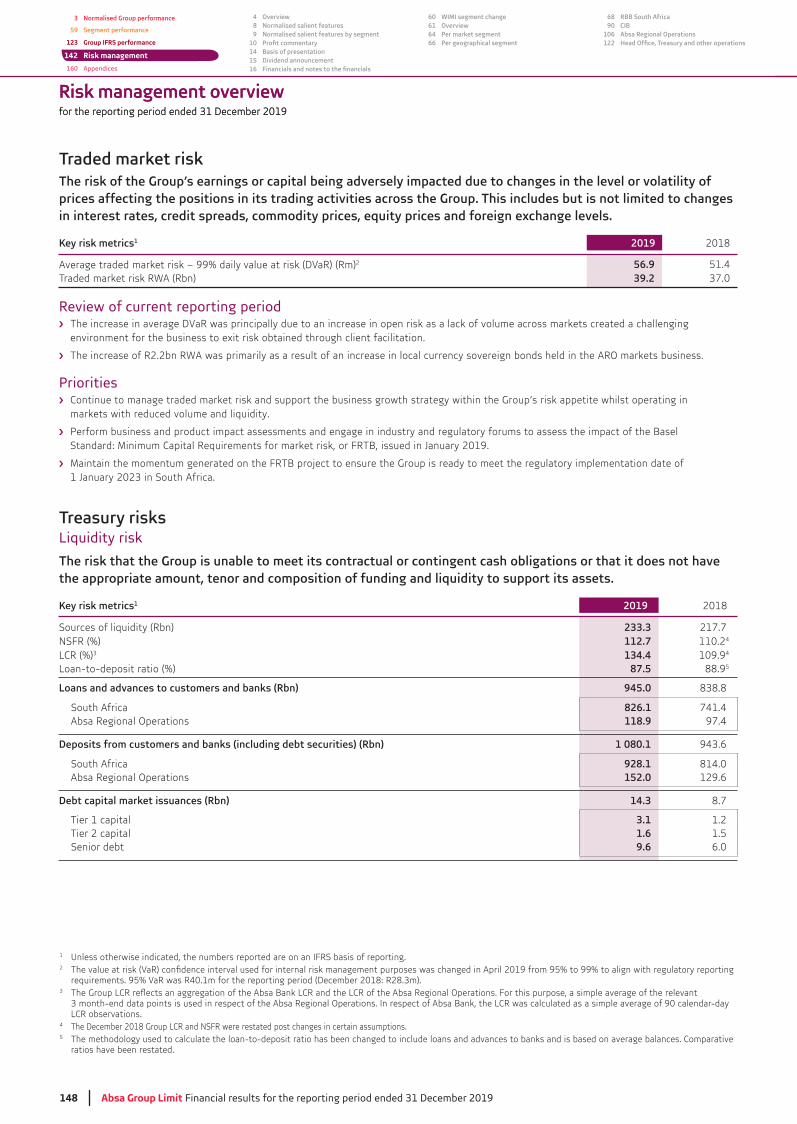
Risk management overviewfor the reporting period ended 31 December 2019
148 Absa Group Limit Financial results for the reporting period ended 31 December 2019
3 Normalised Group performance
59 Segment performance
123 Group IFRS performance
142 Risk management
160 Appendices
4 Overview8 Normalised salient features9 Normalised salient features by segment
1014 Basis of presentation15 Dividend announcement16
60 WIMI segment change61 Overview64 Per market segment66 Per geographical segment
68 RBB South Africa90 CIB
106 Absa Regional Operations122
Risk management overview
1 Unless otherwise indicated, the numbers reported are on an IFRS basis of reporting.2
LCR observations. 4 The December 2018 Group LCR and NSFR were restated post changes in certain assumptions.5 The methodology used to calculate the loan-to-deposit ratio has been changed to include loans and advances to banks and is based on average balances. Comparative
ratios have been restated.
Key risk metrics1 2019 2018
Average traded market risk – 99% daily value at risk (DVaR) (Rm)2 56.9 51.4Traded market risk RWA (Rbn) 39.2
Review of current reporting period The increase in average DVaR was principally due to an increase in open risk as a lack of volume across markets created a challenging environment for the business to exit risk obtained through client facilitation.
The increase of R2.2bn RWA was primarily as a result of an increase in local currency sovereign bonds held in the ARO markets business.
Priorities Continue to manage traded market risk and support the business growth strategy within the Group’s risk appetite whilst operating in markets with reduced volume and liquidity.
Maintain the momentum generated on the FRTB project to ensure the Group is ready to meet the regulatory implementation date of
Liquidity risk
Key risk metrics1 2019 2018
Sources of liquidity (Rbn) 233.3 217.7NSFR (%) 112.7 110.24
LCR (%) 134.4 109.94
Loan-to-deposit ratio (%) 87.5 88.95
Loans and advances to customers and banks (Rbn) 945.0
South Africa 826.1 741.4 Absa Regional Operations 118.9 97.4
Deposits from customers and banks (including debt securities) (Rbn) 1 080.1
South Africa 928.1 814.0 Absa Regional Operations 152.0 129.6
Debt capital market issuances (Rbn) 14.3 8.7
Tier 1 capital 3.1 1.2 Tier 2 capital 1.6 1.5 Senior debt 9.6 6.0

Risk management overviewfor the reporting period ended 31 December 2019
Absa Group Limited Financial results for the reporting period ended 31 December 2019 149
124 IFRS salient features
125 Financials133138 Reconciliation140 Barclays separation
143 Risk management overview155 Capital management
161 Share performance162 Shareholder information and diary163 Glossary170 Abbreviations and acronyms172 Contact information
(continued)
Liquidity risk (continued)
Review of current reporting periodLiquidity risk position:
o The liquidity risk position of the Group remained healthy, in line with risk appetite, and above the minimum regulatory requirements, with sources of liquidity of R233.3bn (December 2018: R217.7bn), amounting to 28.2% (December 2018: 29.6%) of deposits due to customers.
o appropriate processes and controls to ensure compliance with local liquidity risk appetite (LRA), regulatory limits and reporting requirements.
Long-term balance sheet structure: o Strong loan growth over 2019 was funded by faster growth in customer deposits ensuring sustainability of funding.
o Long-term funding was raised with appropriate tenor to support the growth in long-term assets, through a combination of funding instruments and capital market issuances.
o Whilst short-term liquidity premiums have exhibited some volatility, overall funding spreads declined over the course of 2019.
o There were increased issuances in the debt capital market in 2019 to support growth in longer-term assets and lengthen the contractual duration of funding.
Short-term balance sheet structure and liquidity buffers:
oexcess of the regulatory minimum requirement of 100% during 2019.
o R182.1bn (December 2018: R190.0bn) which reduced slightly given the strong LCR position.
ointernally defined stress requirements.
oSARB over three years, with effect from 1 December 2019. The bank will ensure compliance with the phase-out rules, and replace this with
o The Group has a well-diversified deposit base and concentration risk was managed within appropriate guidelines. Sources of funding were managed in order to maintain a wide diversity of depositor, product, tenor and currency.
o The Group entered into a number of facilities with international banks during 2019 to support foreign currency funding requirements. Absa entered into bilateral foreign currency loans and syndicated loans of over $900m during 2019 in order to support lending activities.
PrioritiesContinue to focus on the growth of core retail, relationship bank, corporate and public sector deposits.
requirements.
Maintain adequate liquidity buffers to ensure the Group continues to remain compliant with the LCR while managing the phase-out of the CLF by the SARB.
Continue to grow and diversify the funding base to support asset growth and other strategic initiatives while optimising funding cost and complying with the requirements of the NSFR.
Continue to work with regulatory authorities and other stakeholders on the SARB’s proposed approach to bank resolution, as outlined in the recent discussion paper published by the Financial Stability Department of the SARB entitled ‘Ending too big to fail: South Africa’s intended approach to bank resolution’.
Capital risk
normal business activities while remaining within its Board capital target ranges and above regulatory capital requirements.
Key risk metrics1 2019 2018
Total RWA (Rbn) 870.4 818.6
CET 1 capital adequacy ratio (%) 11.8 12.0
Return on average risk-weighted assets (RoRWA) (%) 1.9 2.1
EC coverage 1.5 1.5
Return on average EC (%) 18.7 19.2
Return on equity (RoE) (%) 15.8 16.8
Cost of equity (CoE) (%)4 13.75 14.00
1 Unless otherwise indicated, the numbers reported are on an IFRS basis of reporting.2
Reported on a normalised basis.4 The CoE is based on the capital asset pricing model.
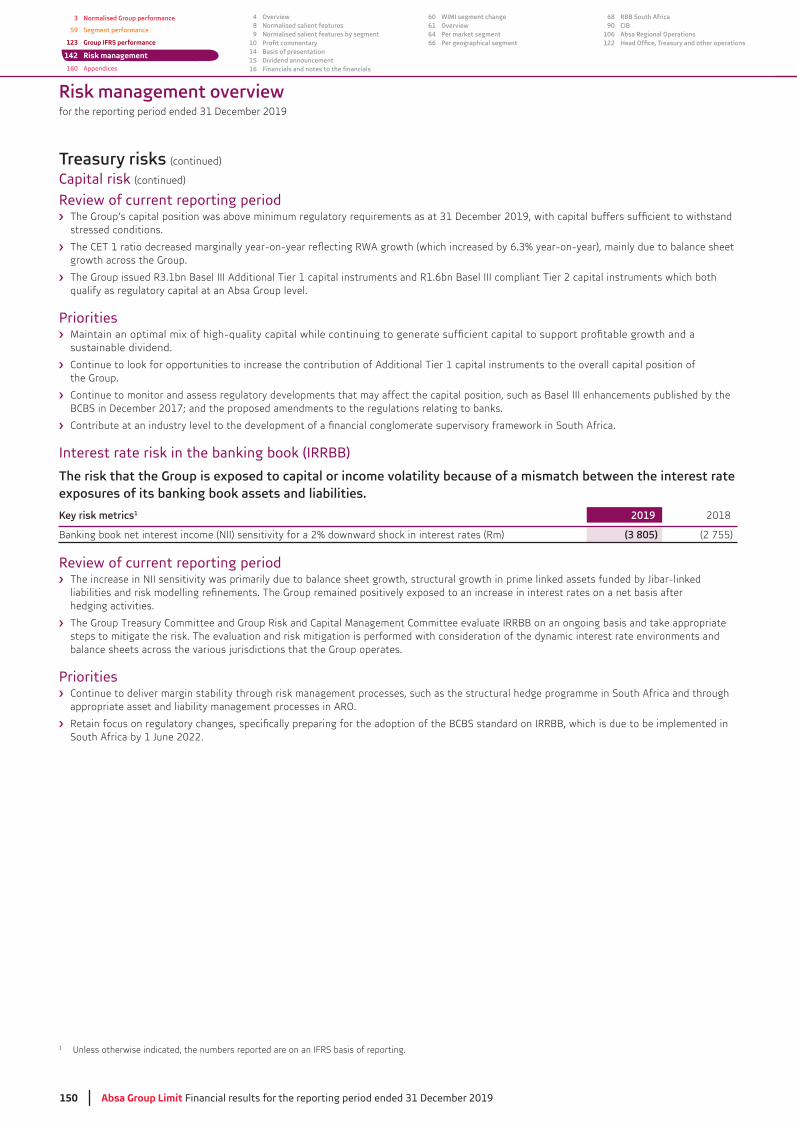
Risk management overviewfor the reporting period ended 31 December 2019
150 Absa Group Limit Financial results for the reporting period ended 31 December 2019
3 Normalised Group performance
59 Segment performance
123 Group IFRS performance
142 Risk management
160 Appendices
4 Overview8 Normalised salient features9 Normalised salient features by segment
1014 Basis of presentation15 Dividend announcement16
60 WIMI segment change61 Overview64 Per market segment66 Per geographical segment
68 RBB South Africa90 CIB
106 Absa Regional Operations122
(continued)
Capital risk (continued)
Review of current reporting period
stressed conditions.
growth across the Group.
qualify as regulatory capital at an Absa Group level.
Priorities
sustainable dividend.
Continue to look for opportunities to increase the contribution of Additional Tier 1 capital instruments to the overall capital position of the Group.
Continue to monitor and assess regulatory developments that may affect the capital position, such as Basel III enhancements published by the BCBS in December 2017; and the proposed amendments to the regulations relating to banks.
Interest rate risk in the banking book (IRRBB)
Key risk metrics1 2019 2018
Banking book net interest income (NII) sensitivity for a 2% downward shock in interest rates (Rm) (3 805) (2 755)
Review of current reporting period
hedging activities.
The Group Treasury Committee and Group Risk and Capital Management Committee evaluate IRRBB on an ongoing basis and take appropriate steps to mitigate the risk. The evaluation and risk mitigation is performed with consideration of the dynamic interest rate environments and balance sheets across the various jurisdictions that the Group operates.
PrioritiesContinue to deliver margin stability through risk management processes, such as the structural hedge programme in South Africa and through appropriate asset and liability management processes in ARO.
1 Unless otherwise indicated, the numbers reported are on an IFRS basis of reporting.

Risk management overviewfor the reporting period ended 31 December 2019
Absa Group Limited Financial results for the reporting period ended 31 December 2019 151
124 IFRS salient features
125 Financials133138 Reconciliation140 Barclays separation
143 Risk management overview155 Capital management
161 Share performance162 Shareholder information and diary163 Glossary170 Abbreviations and acronyms172 Contact information
Operational risk
Key risk metrics1 2019 2018
Total operational risk losses as a percentage of gross income (%) 1.0 0.7Total operational risk losses (Rm) 824Total operational risk RWA (Rbn) 112.3 112.7
Review of current reporting periodR824m
and transaction processing related losses.
o Improved the Group’s data management infrastructure and operating model.
o
o Revised the design of the Group’s procurement operating model and infrastructure.
PrioritiesContinue to develop infrastructure, capability and control processes over key datasets, in line with the Group’s data standards.
Continue to strengthen fraud defences through investment in people, process improvements, analytics and technologies.
Enhance the toolset used in the management of operational risk, with an emphasis on digitisation of risk management and measurement processes.
Business risk
Review of current reporting periodThe Group pursued material strategic change while undergoing separation, therefore business risk was elevated to a principal risk type under the ERMF during 2019.
execution on completion of separation during 2020.
are reported to the Board and management committees on a monthly basis.
The key choices in the Group strategy announced during 2018 were reviewed during 2019 against the backdrop of emerging trends, the macro-
however the core strategy remains relevant and unchanged.
PrioritiesEmbed a control framework for the oversight and mitigation of business risk.
Business risk is expected to remain heightened as a result of uncertainty in the macro-environment and elevated levels of change to support
The Group will continue to monitor business risk through reviews of strategy execution (including balanced scorecards) and approved risk appetite measures. Business performance will be monitored closely through a combination of leading and lagging indicators. Management will proactively manage and closely monitor monthly performances and take corrective actions in order to remain responsive to an uncertain macro-environment.
1 Unless otherwise indicated, the numbers reported are on an IFRS basis of reporting.

Risk management overviewfor the reporting period ended 31 December 2019
152 Absa Group Limit Financial results for the reporting period ended 31 December 2019
3 Normalised Group performance
59 Segment performance
123 Group IFRS performance
142 Risk management
160 Appendices
4 Overview8 Normalised salient features9 Normalised salient features by segment
1014 Basis of presentation15 Dividend announcement16
60 WIMI segment change61 Overview64 Per market segment66 Per geographical segment
68 RBB South Africa90 CIB
106 Absa Regional Operations122
Review of current reporting period
and an improvement in the meantime to recovery (MTTR).
Disaster recovery compliance has increased to 95% for high priority applications and the automation process progressed well with ongoing
reduce the impact of failures to customers.
Information and cyber security
new capabilities.
Increased visibility of the estate and the maturing of the cyber security capability has led to informed decision-making by business.
The monitoring coverage has been extended to all technical systems by leveraging strategic external relationships for early indicators, continuous monitoring and control enhancements; this provided better ways to service users, identify bad behaviour and recover from incidents.
The introduction of data loss monitoring with enhanced rules protects the businesses from sensitive data being emailed out of the
The insider trust in-house capability is fully designed and implemented, with embedment targeted for 2020. This capability continues to utilise and leverage existing technologies to detect, prevent and report on potential insider threats.
Change
The change risk control environment was embedded and matured in the separation book of work. The capabilities, structures, governance and processes successfully implemented to drive the separation programme have now been leveraged to accelerate the progress towards a mature control environment across all strategic change within the organisation. Large programmes were established in critical delivery areas.
PrioritiesFocus areas from a risk perspective for 2020 will include: Identifying, prioritising and remediation of known weaknesses in the
Group’s estate; and ongoing focus on improving stability across the estate.
Information and cyber security: The Fusion Centre project is formally under way consisting of multi-disciplinary specialist resources. Using reliable threat intelligence, state-of-the-art infrastructure, security technologies and battle-tested processes to maintain and improve enterprise resilience against adversarial, accidental, technological and environmental security incidents, the Fusion Centre is expected to
Change: all strategic initiative changes across the Group.
Insurance risk
from the allowances made in measuring policyholder liabilities and in product pricing.
Review of current reporting period
Governance and Operational Standards for Insurers (GOI) and Governance and Operational Standards for Insurance Groups (GOG).
Improvements were made for the integration of economic capital, capital targets and dividend policy.
The Own Risk and Solvency Assessment (ORSA) process was further improved, with a focus on embedment of key processes into business activities.
treating customers fairly considerations.
Data deep dives were performed to understand the quality of the actuarial data controls.
The IFRS 171 project was progressed, mainly focusing on ingesting data from all source systems into the Group’s central data repository solution, and progressing with programme design decisions.
1
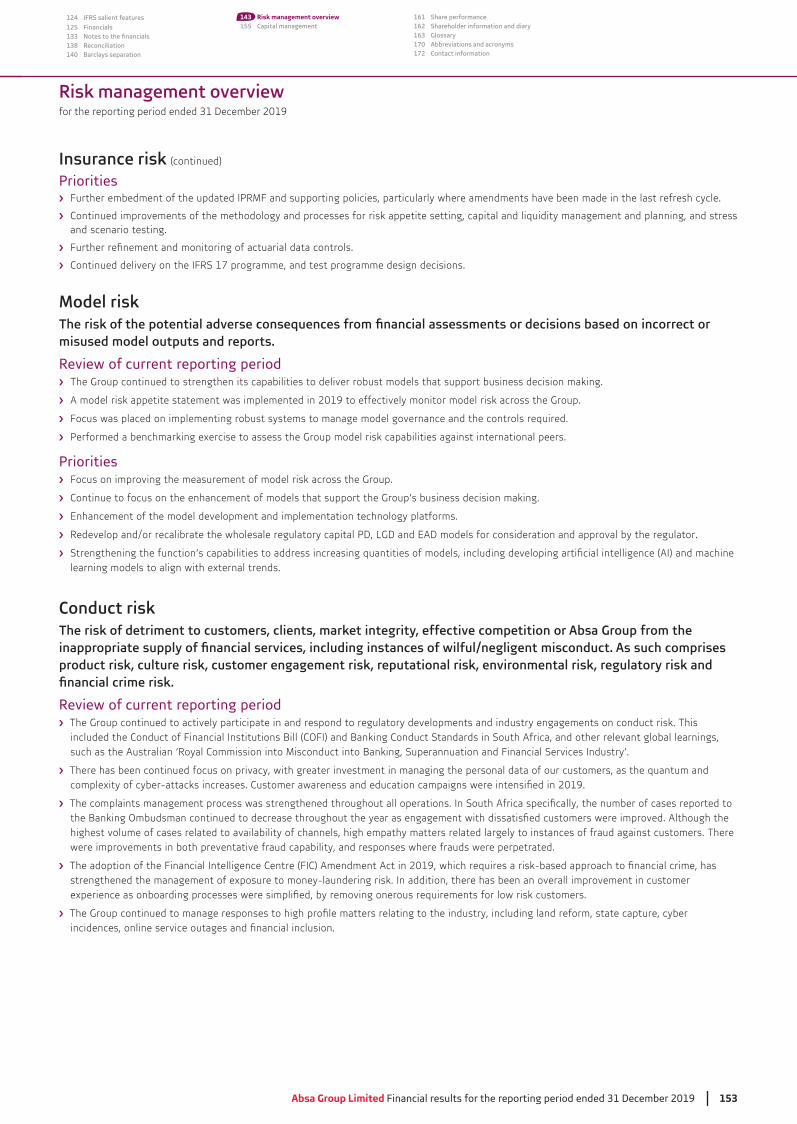
Risk management overviewfor the reporting period ended 31 December 2019
Absa Group Limited Financial results for the reporting period ended 31 December 2019 153
124 IFRS salient features
125 Financials133138 Reconciliation140 Barclays separation
143 Risk management overview155 Capital management
161 Share performance162 Shareholder information and diary163 Glossary170 Abbreviations and acronyms172 Contact information
Insurance risk (continued)
Priorities
Continued improvements of the methodology and processes for risk appetite setting, capital and liquidity management and planning, and stress and scenario testing.
Continued delivery on the IFRS 17 programme, and test programme design decisions.
Model risk
misused model outputs and reports.
Review of current reporting periodThe Group continued to strengthen its capabilities to deliver robust models that support business decision making.
A model risk appetite statement was implemented in 2019 to effectively monitor model risk across the Group.
Focus was placed on implementing robust systems to manage model governance and the controls required.
PrioritiesFocus on improving the measurement of model risk across the Group.
Continue to focus on the enhancement of models that support the Group’s business decision making.
Enhancement of the model development and implementation technology platforms.
learning models to align with external trends.
Conduct risk
Review of current reporting periodThe Group continued to actively participate in and respond to regulatory developments and industry engagements on conduct risk. This included the Conduct of Financial Institutions Bill (COFI) and Banking Conduct Standards in South Africa, and other relevant global learnings, such as the Australian ‘Royal Commission into Misconduct into Banking, Superannuation and Financial Services Industry’.
There has been continued focus on privacy, with greater investment in managing the personal data of our customers, as the quantum and
highest volume of cases related to availability of channels, high empathy matters related largely to instances of fraud against customers. There were improvements in both preventative fraud capability, and responses where frauds were perpetrated.
strengthened the management of exposure to money-laundering risk. In addition, there has been an overall improvement in customer
Risk management overviewfor the reporting period ended 31 December 2019
154 Absa Group Limit Financial results for the reporting period ended 31 December 2019
3 Normalised Group performance
59 Segment performance
123 Group IFRS performance
142 Risk management
160 Appendices
4 Overview8 Normalised salient features9 Normalised salient features by segment
1014 Basis of presentation15 Dividend announcement16
60 WIMI segment change61 Overview64 Per market segment66 Per geographical segment
68 RBB South Africa90 CIB
106 Absa Regional Operations122
Conduct risk (continued) Priorities
Roll out and embedment of the Group Code of Ethics (the Absa Way).
Responsible lending in response to the challenging macro-environment.
Driving the Group’s position on environmental risks.
Legal risk
obligations including regulatory or contractual requirements.
Review of current reporting period
Enabled and supported the Group’s preparation for its rebranding in jurisdictions outside South Africa.
without compensation.
Priorities
Strengthen improvements to assurance processes.
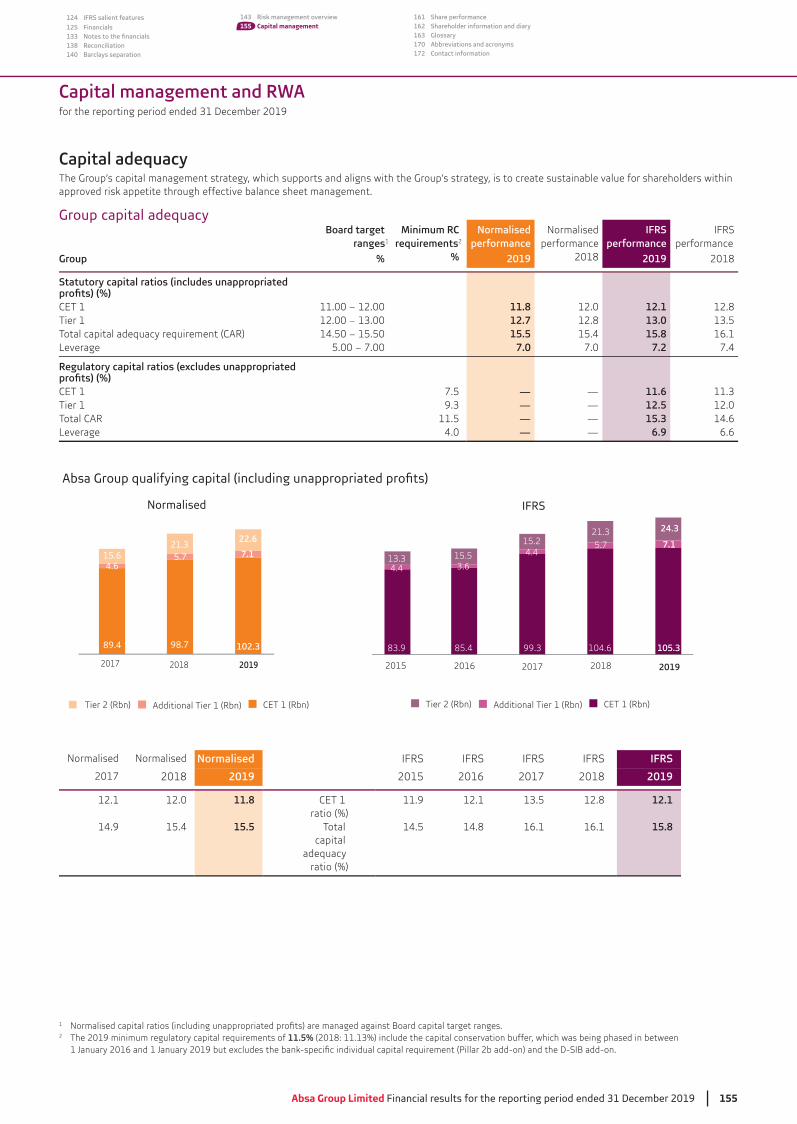
Capital management and RWAfor the reporting period ended 31 December 2019
Absa Group Limited Financial results for the reporting period ended 31 December 2019 155
124 IFRS salient features
125 Financials133138 Reconciliation140 Barclays separation
143 Risk management overview155 Capital management
161 Share performance162 Shareholder information and diary163 Glossary170 Abbreviations and acronyms172 Contact information
Capital adequacyThe Group’s capital management strategy, which supports and aligns with the Group’s strategy, is to create sustainable value for shareholders within approved risk appetite through effective balance sheet management.
Group capital adequacyBoard target Minimum RC Normalised Normalised IFRS IFRS
ranges1 requirements2 performance performance performance performance
Group % % 2019 2018 2019 2018
Statutory capital ratios (includes unappropriated
CET 1 11.00 – 12.00 11.8 12.0 12.1 12.8Tier 1 12.7 12.8 13.0Total capital adequacy requirement (CAR) 14.50 – 15.50 15.5 15.4 15.8 16.1Leverage 5.00 – 7.00 7.0 7.0 7.2 7.4
CET 1 7.5 — — 11.6Tier 1 — — 12.5 12.0Total CAR 11.5 — — 15.3 14.6Leverage 4.0 — — 6.9 6.6
4.413.3
3.615.5
83.9 85.4
4.415.2
99.3
2015
5.721.3
104.6
7.1
24.3
105.3
2016 2017 2018 2019
Tier 2 (Rbn) Additional Tier 1 (Rbn) CET 1 (Rbn)Tier 2 (Rbn) Additional Tier 1 (Rbn) CET 1 (Rbn)
20182017 2019
22.6
102.398.7
Normalised IFRS
21.35.7
89.4
15.64.6
7.1
Normalised Normalised Normalised IFRS IFRS IFRS IFRS IFRS
2017 2018 2019 2015 2016 2017 2018 2019
12.1 12.0 11.8 CET 1 ratio (%)
11.9 12.1 12.8 12.1
14.9 15.4 15.5 Total capital
adequacy ratio (%)
14.5 14.8 16.1 16.1 15.8
1
2 The 2019 minimum regulatory capital requirements of 11.5%
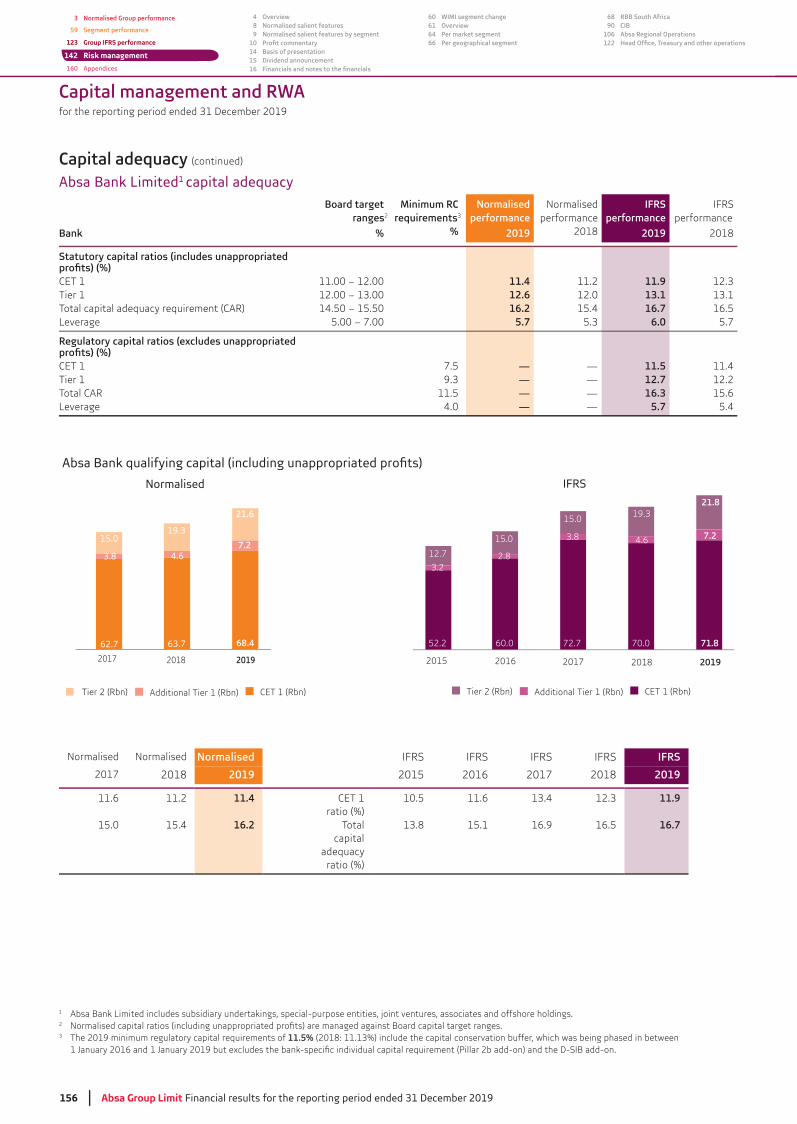
Capital management and RWAfor the reporting period ended 31 December 2019
156 Absa Group Limit Financial results for the reporting period ended 31 December 2019
3 Normalised Group performance
59 Segment performance
123 Group IFRS performance
142 Risk management
160 Appendices
4 Overview8 Normalised salient features9 Normalised salient features by segment
1014 Basis of presentation15 Dividend announcement16
60 WIMI segment change61 Overview64 Per market segment66 Per geographical segment
68 RBB South Africa90 CIB
106 Absa Regional Operations122
Capital adequacy (continued)
Absa Bank Limited1 capital adequacy
Board target Minimum RC Normalised Normalised IFRS IFRSranges2 requirements performance performance performance performance
Bank % % 2019 2018 2019 2018
Statutory capital ratios (includes unappropriated
CET 1 11.00 – 12.00 11.4 11.2 11.9Tier 1 12.6 12.0 13.1Total capital adequacy requirement (CAR) 14.50 – 15.50 16.2 15.4 16.7 16.5Leverage 5.00 – 7.00 5.7 6.0 5.7
CET 1 7.5 — — 11.5 11.4Tier 1 — — 12.7 12.2Total CAR 11.5 — — 16.3 15.6Leverage 4.0 — — 5.7 5.4
3.2
12.7 2.8
15.0
52.2 60.0
3.8
15.0
72.7
2015
4.6
19.3
70.0
7.2
21.8
71.8
2016 2017 2018 2019
Tier 2 (Rbn) Additional Tier 1 (Rbn) CET 1 (Rbn)Tier 2 (Rbn) Additional Tier 1 (Rbn) CET 1 (Rbn)
20182017 2019
21.6
68.463.7
Normalised IFRS
19.3
4.6
62.7
15.0
3.87.2
Normalised Normalised Normalised IFRS IFRS IFRS IFRS IFRS
2017 2018 2019 2015 2016 2017 2018 2019
11.6 11.2 11.4 CET 1 ratio (%)
10.5 11.6 11.9
15.0 15.4 16.2 Totalcapital
adequacy ratio (%)
15.1 16.9 16.5 16.7
1 Absa Bank Limited includes subsidiary undertakings, special-purpose entities, joint ventures, associates and offshore holdings. 2
The 2019 minimum regulatory capital requirements of 11.5%
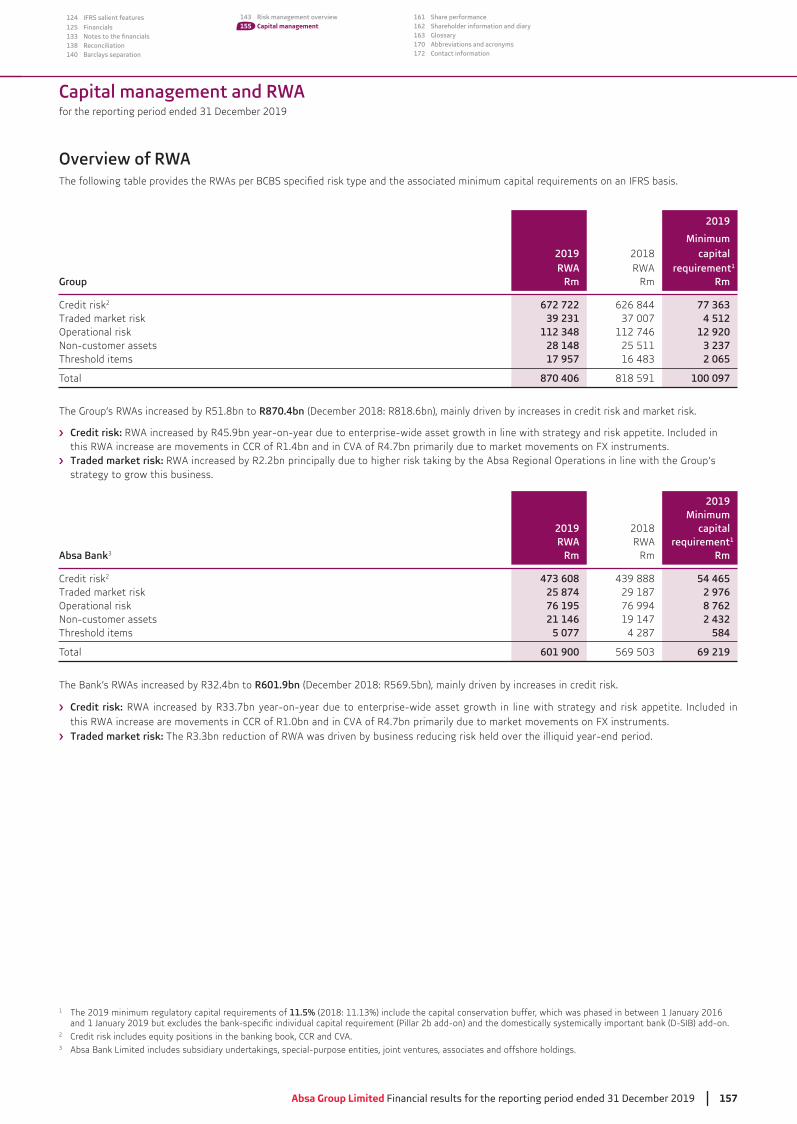
Capital management and RWAfor the reporting period ended 31 December 2019
Absa Group Limited Financial results for the reporting period ended 31 December 2019 157
124 IFRS salient features
125 Financials133138 Reconciliation140 Barclays separation
143 Risk management overview155 Capital management
161 Share performance162 Shareholder information and diary163 Glossary170 Abbreviations and acronyms172 Contact information
Overview of RWA
1 The 2019 minimum regulatory capital requirements of 11.5%
2 Credit risk includes equity positions in the banking book, CCR and CVA.
Absa Bank Limited includes subsidiary undertakings, special-purpose entities, joint ventures, associates and offshore holdings.
2019
Minimum2019 2018 capitalRWA RWA requirement1
Group Rm Rm Rm
Credit risk2 672 722 626 844 77 363 Traded market risk 39 231 4 512Operational risk 112 348 112 746 12 920Non-customer assets 28 148 25 511 3 237Threshold items 17 957 2 065
Total 870 406 818 591 100 097
The Group’s RWAs increased by R51.8bn to R870.4bn (December 2018: R818.6bn), mainly driven by increases in credit risk and market risk.
Credit risk: RWA increased by R45.9bn year-on-year due to enterprise-wide asset growth in line with strategy and risk appetite. Included in this RWA increase are movements in CCR of R1.4bn and in CVA of R4.7bn primarily due to market movements on FX instruments.
RWA increased by R2.2bn principally due to higher risk taking by the Absa Regional Operations in line with the Group’s strategy to grow this business.
2019Minimum
2019 2018 capitalRWA RWA requirement1
Absa Bank Rm Rm Rm
Credit risk2 473 608 54 465Traded market risk 25 874 29 187 2 976Operational risk 76 195 76 994 8 762Non-customer assets 21 146 19 147 2 432Threshold items 5 077 4 287 584
Total 601 900 69 219
R601.9bn (December 2018: R569.5bn), mainly driven by increases in credit risk.
Credit risk: this RWA increase are movements in CCR of R1.0bn and in CVA of R4.7bn primarily due to market movements on FX instruments.
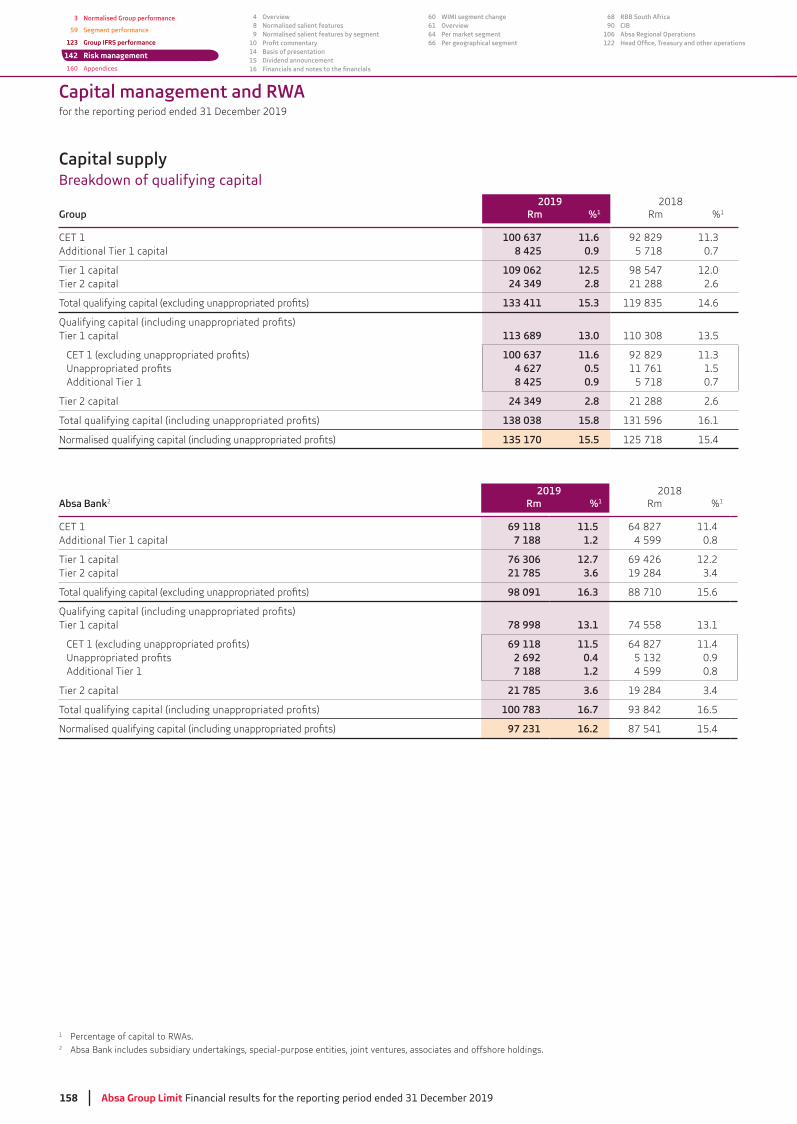
Capital management and RWAfor the reporting period ended 31 December 2019
158 Absa Group Limit Financial results for the reporting period ended 31 December 2019
3 Normalised Group performance
59 Segment performance
123 Group IFRS performance
142 Risk management
160 Appendices
4 Overview8 Normalised salient features9 Normalised salient features by segment
1014 Basis of presentation15 Dividend announcement16
60 WIMI segment change61 Overview64 Per market segment66 Per geographical segment
68 RBB South Africa90 CIB
106 Absa Regional Operations122
Capital supplyBreakdown of qualifying capital
2019 2018Group Rm %1 Rm %1
CET 1 100 637 11.6 92 829Additional Tier 1 capital 8 425 0.9 5 718 0.7
Tier 1 capital 109 062 12.5 98 547 12.0 Tier 2 capital 24 349 2.8 21 288 2.6
133 411 15.3 14.6
Tier 1 capital 113 689 13.0
100 637 11.6 92 8294 627 0.5 11 761 1.5
Additional Tier 1 8 425 0.9 5 718 0.7
Tier 2 capital 24 349 2.8 21 288 2.6
138 038 15.8 16.1
135 170 15.5 125 718 15.4
2019 2018Absa Bank2 Rm %1 Rm %1
CET 1 69 118 11.5 64 827 11.4 Additional Tier 1 capital 7 188 1.2 4 599 0.8
Tier 1 capital 76 306 12.7 69 426 12.2 Tier 2 capital 21 785 3.6 19 284
98 091 16.3 88 710 15.6
Tier 1 capital 78 998 13.1 74 558
69 118 11.5 64 827 11.4 2 692 0.4 0.9
Additional Tier 1 7 188 1.2 4 599 0.8
Tier 2 capital 21 785 3.6 19 284
100 783 16.7 16.5
97 231 16.2 87 541 15.4
1
2 Absa Bank includes subsidiary undertakings, special-purpose entities, joint ventures, associates and offshore holdings.
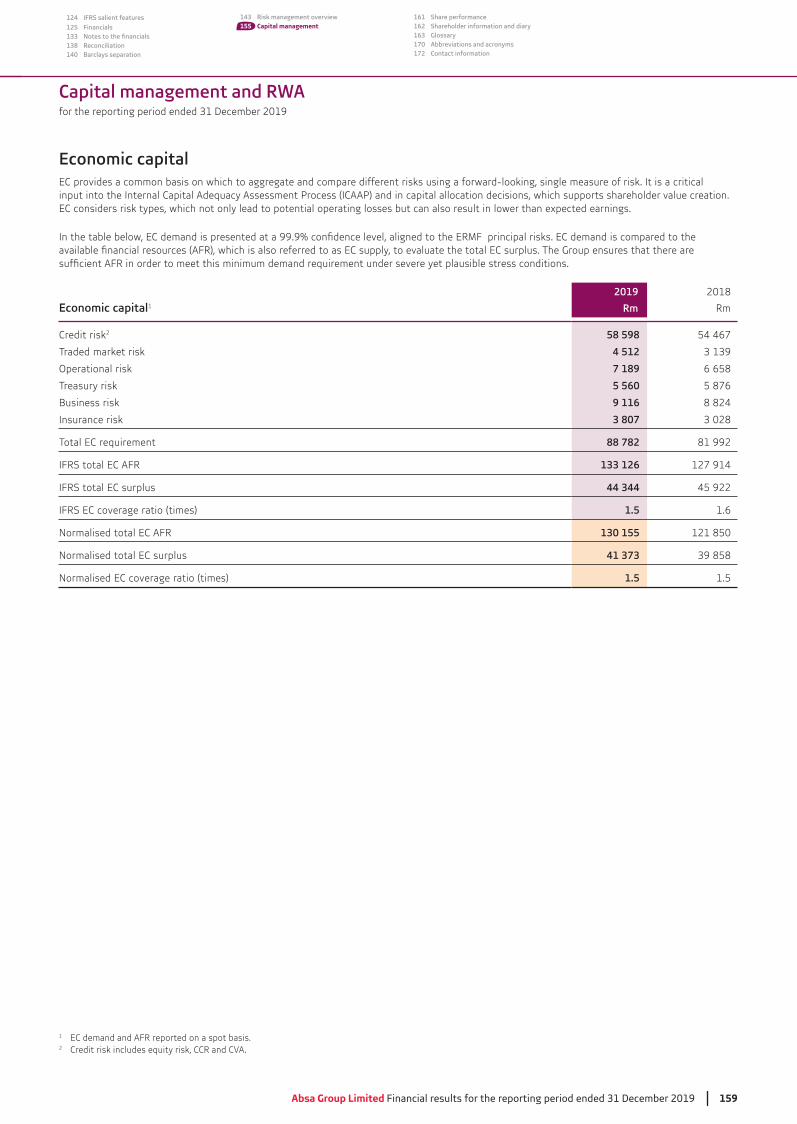
Capital management and RWAfor the reporting period ended 31 December 2019
Absa Group Limited Financial results for the reporting period ended 31 December 2019 159
124 IFRS salient features
125 Financials133138 Reconciliation140 Barclays separation
143 Risk management overview155 Capital management
161 Share performance162 Shareholder information and diary163 Glossary170 Abbreviations and acronyms172 Contact information
1 EC demand and AFR reported on a spot basis.2 Credit risk includes equity risk, CCR and CVA.
Economic capitalEC provides a common basis on which to aggregate and compare different risks using a forward-looking, single measure of risk. It is a critical
EC considers risk types, which not only lead to potential operating losses but can also result in lower than expected earnings.
2019 2018
Economic capital1 Rm Rm
Credit risk2 58 598 54 467
Traded market risk 4 512
Operational risk 7 189 6 658
Treasury risk 5 560 5 876
Business risk 9 116 8 824
Insurance risk 3 807
Total EC requirement 88 782 81 992
IFRS total EC AFR 133 126 127 914
IFRS total EC surplus 44 344 45 922
IFRS EC coverage ratio (times) 1.5 1.6
Normalised total EC AFR 130 155 121 850
Normalised total EC surplus 41 373
Normalised EC coverage ratio (times) 1.5 1.5

Glossary
3 Normalised Group performance
59 Segment performance
123 Group IFRS performance
142 Risk management
160 Appendices
4 Overview8 Normalised salient features9 Normalised salient features by segment
1014 Basis of presentation15 Dividend announcement16
60 WIMI segment change61 Overview64 Per market segment66 Per geographical segment
68 RBB South Africa90 CIB
106 Absa Regional Operations122
Appendices
Share performance 161Shareholder information and diary 162Glossary 163Abbreviations and acronyms 170Contact information 172
160 Absa Group Limit Financial results for the reporting period ended 31 December 2019
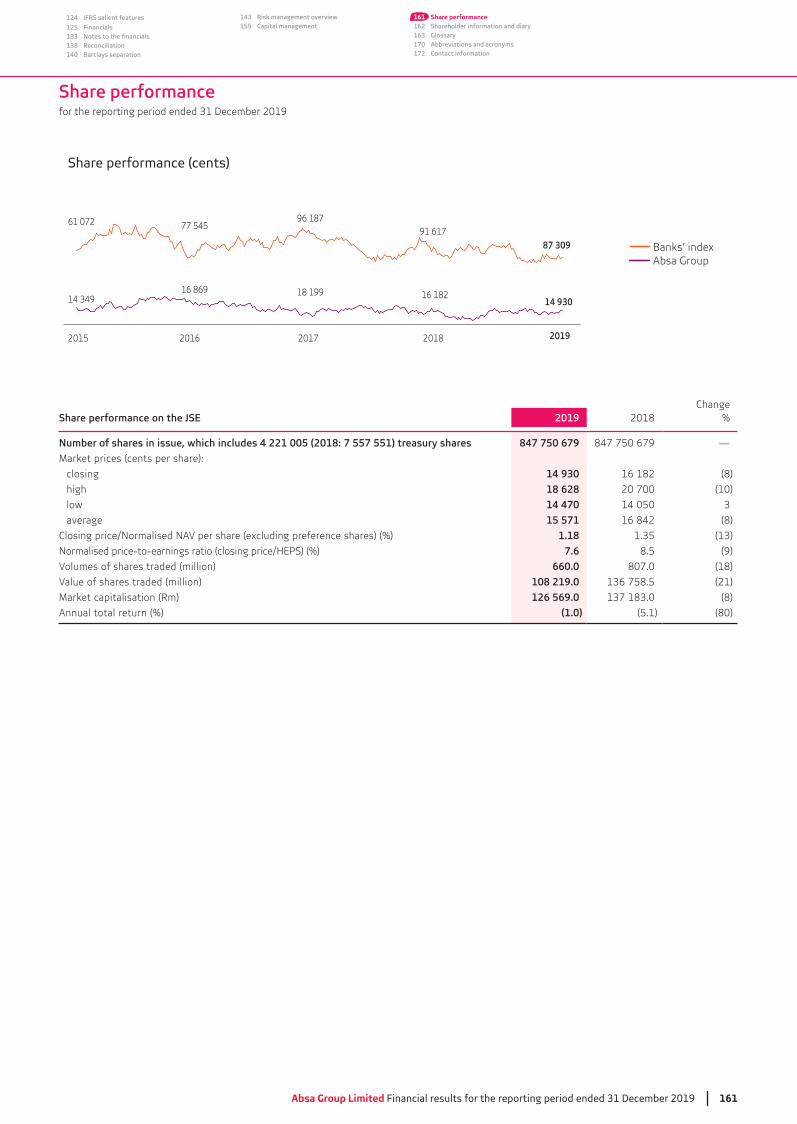
Absa Group Limited Financial results for the reporting period ended 31 December 2019 161
124 IFRS salient features
125 Financials133138 Reconciliation140 Barclays separation
143 Risk management overview155 Capital management
161 Share performance162 Shareholder information and diary163 Glossary170 Abbreviations and acronyms172 Contact information
Share performance
14 349
61 072
2015 2016 2017 2018
16 869
77 54596 187
18 199
91 617
16 182
2019
Share performance (cents)
Banks’ indexAbsa Group
87 309
14 930
ChangeShare performance on the JSE 2019 2018 %
847 750 679 847 750 679 —
Market prices (cents per share):
closing 14 930 16 182 (8)
high 18 628 20 700 (10)
low 14 470 14 050
average 15 571 16 842 (8)
Closing price/Normalised NAV per share (excluding preference shares) (%) 1.187.6 8.5 (9)
Volumes of shares traded (million) 660.0 807.0 (18)
Value of shares traded (million) 108 219.0 (21)
Market capitalisation (Rm) 126 569.0 (8)
Annual total return (%) (1.0) (5.1) (80)
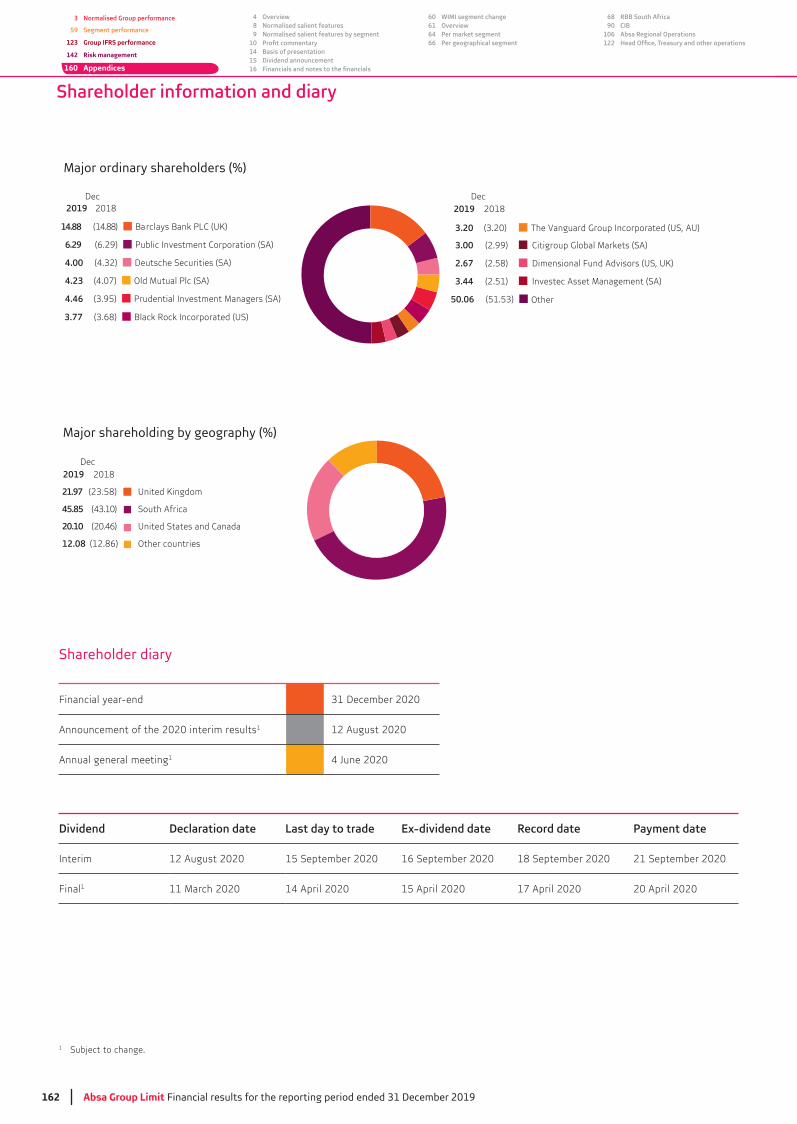
162 Absa Group Limit Financial results for the reporting period ended 31 December 2019
3 Normalised Group performance
59 Segment performance
123 Group IFRS performance
142 Risk management
160 Appendices
4 Overview8 Normalised salient features9 Normalised salient features by segment
1014 Basis of presentation15 Dividend announcement16
60 WIMI segment change61 Overview64 Per market segment66 Per geographical segment
68 RBB South Africa90 CIB
106 Absa Regional Operations122
Major shareholding by geography (%)
21.97 (23.58) � United Kingdom
45.85 (43.10) South Africa
20.10 (20.46) United States and Canada
12.08 (12.86) Other countries
2019Dec
2018
Shareholder information and diary
1 Subject to change.
Dividend Declaration date Last day to trade Record date Payment date
Interim 12 August 2020 15 September 2020 16 September 2020 18 September 2020 21 September 2020
Final1 11 March 2020 14 April 2020 15 April 2020 17 April 2020 20 April 2020
Shareholder diary
Major ordinary shareholders (%)
3.00 (2.99) Citigroup Global Markets (SA)
2.67 (2.58) Dimensional Fund Advisors (US, UK)
3.44 (2.51) Investec Asset Management (SA)
14.88 (14.88) Barclays Bank PLC (UK)
6.29 (6.29) Public Investment Corporation (SA)
4.00 (4.32) Deutsche Securities (SA)
4.23 (4.07) Old Mutual Plc (SA)
4.46 (3.95) Prudential Investment Managers (SA)
3.20 (3.20)
The Vanguard Group Incorporated (US, AU)
3.77 (3.68) Black Rock Incorporated (US)
50.06 (51.53) Other
2019 2019Dec
2018 2018Dec
Financial year-end
Announcement of the 2020 interim results1 12 August 2020
Annual general meeting1

Absa Group Limited Financial results for the reporting period ended 31 December 2019 163
124 IFRS salient features
125 Financials133138 Reconciliation140 Barclays separation
143 Risk management overview155 Capital management
161 Share performance162 Shareholder information and diary163 Glossary170 Abbreviations and acronyms172 Contact information
Glossary
Amounts written off
prospect of further recovery does not exist. Write-offs will occur when, and to the extent that, the debt is considered irrecoverable. A write-off
conclusion of insolvency proceedings or other formal recovery actions, making it possible to quantify the extent of the advance that is beyond a realistic prospect of recovery. Assets are only written off once all necessary procedures have been completed and the amount of loss has been determined. Recoveries of amounts previously written off, are reversed and accordingly decrease the amount of the reported impairment charge in the statement of comprehensive income.
Methods available to banks to calculate their regulatory capital requirements, based on their own risk estimates. These include the foundation internal ratings-based (FIRB) and advanced internal ratings-based (AIRB) approaches for credit risk, the advanced measurement approach (AMA) for operational risk and the internal models approach (IMA) for market risk.
Average interest-bearing assetsAverage interest-bearing assets consist of all accounts that are not impaired and thus attract interest within the asset categories of cash, cash balances and balances with central banks, loans and advances to banks and customers and investment securities (including cash and short-term assets, money market assets and capital market assets).
Average loans to deposits and debt securities ratioLoans and advances to customers and loans and advances to banks as a percentage of deposits due to customers, deposits to banks and debt securities in issue (calculated on daily weighted averages).
Balance sheet.
BankAbsa Bank Limited, together with its subsidiary undertakings, special-purpose entities, joint ventures, associates and offshore holdings. It is also referred to as ‘the Bank’ or ‘Absa Bank’ in this report.
Banking average assetsBanking average assets consist of all average assets related to the banking activities of the Group. Banking average assets exclude ‘Other assets’,
tax assets’, and includes ‘Trading portfolio liabilities’.
Banking book annual earnings at riskA measure of the sensitivity of net interest income over a one-year horizon due to a change in the level of interest rates. Calculated as the difference between the estimated income using the current yield curve, and the lowest estimated income following an increase or decrease in interest rates. As per regulatory requirement, a 200 bps downward shock is applied.
Banking income yieldIncome as a proportion of banking average assets.
Banking interest yieldNet interest income after credit losses, as a proportion of banking average assets.
Banking non-interest yieldNon-interest income as a proportion of banking average assets.
Banks ActThis means the Banks Act, No 94 of 1990 and its accompanying regulations relating to banks published in the Government Gazetteon 12 December 2012.
Barclays
The Basel Capital Accord of the Bank for International Settlements is an improved capital adequacy framework aimed at closely aligning banks’ capital requirements with improved modern risk management practices and sophisticated risk assessment capabilities. It further ensures the risk sensitivity of the minimum capital requirements by including supervisory reviews and market discipline through enhanced disclosure.

Glossary
164 Absa Group Limit Financial results for the reporting period ended 31 December 2019
3 Normalised Group performance
59 Segment performance
123 Group IFRS performance
142 Risk management
160 Appendices
4 Overview8 Normalised salient features9 Normalised salient features by segment
1014 Basis of presentation15 Dividend announcement16
60 WIMI segment change61 Overview64 Per market segment66 Per geographical segment
68 RBB South Africa90 CIB
106 Absa Regional Operations122
Borrowed fundsSubordinated callable notes qualifying as long-term Tier 2 capital in terms of section 1 of the Banks Act, No 94 of 1990.
Capital adequacy ratioThe capital adequacy of South African banks is measured in terms of the requirements of the SARB. The ratio is calculated by the aggregate amount of qualifying capital and reserve funds dividend by RWA. The base minimum South African total capital adequacy ratio for banks is 10% of RWA. Non-South African banks in the Group have similar capital adequacy methodology requirements.
Common Equity Tier 1 capital consists of the sum of the following elements:
equivalent for non-joint stock companies);Stock surplus (share premium) resulting from the issue of instruments including CET 1;Retained earnings;Accumulated other comprehensive income and other disclosed reserves;Common shares issued by consolidated subsidiaries of Absa Bank Limited and held by third parties (i.e., non-controlling interest) that meet the criteria for inclusion in CET 1; andRegulatory adjustments applied in the calculation of CET 1.
Additional Tier 1 capital consists of the sum of the following elements:
Instruments issued by Absa Bank Limited that meet the criteria for inclusion in Additional Tier 1 capital (and are not included in CET 1);Stock surplus (share premium) resulting from the issue of instruments included in Additional Tier 1 capital;Instrument issued by consolidated subsidiaries of Absa Bank Limited and held by third parties that meet the criteria for inclusion in Additional Tier 1 capital and are not included in Common Equity Tier 1. See section 4 for the relevant criteria; andRegulatory adjustments applied in the calculation of Additional Tier 1 capital.
Common Equity Tier 1 excludes any preference shares or non-controlling interests when determining the calculation.
Tier 2 capital consists of the sum of the following elements:
Instruments issued by Absa Bank Limited that meet the criteria for inclusion in Tier 2 capital (and are not included in Tier 1 capital); Stock surplus (share premium) resulting from the issue of instruments included in Tier 2 capital;Instruments issued by consolidated subsidiaries of Absa Bank Limited and held by third parties that meet the criteria for inclusion in Tier 2 capital and are not included in Tier 1 capital;Certain loan loss provisions such as general provisions/general loan-loss reserve; and Regulatory adjustments applied in the calculation of Tier 2 capital.
A component of regulatory capital, comprising qualifying subordinated loan capital, related minority interests, allowable collective impairment allowances and unrealised gains arising on the fair valuation of equity instruments held as available-for-sale. Tier 2 capital also includes reserves arising from the revaluation of properties.
Claims ratio
Combined ratioInsurance losses and expenses incurred as a percentage of net insurance premiums income.
Conduct riskConduct risk is the detriment caused to the Group’s customers and clients, counterparties or Absa Bank Limited as a result of inappropriate execution of the business activities.

Glossary
Absa Group Limited Financial results for the reporting period ended 31 December 2019 165
124 IFRS salient features
125 Financials133138 Reconciliation140 Barclays separation
143 Risk management overview155 Capital management
161 Share performance162 Shareholder information and diary163 Glossary170 Abbreviations and acronyms172 Contact information
Constant currency
regions market segment disclosed on pages 108 and 109 are derived by translating the Statement of comprehensive income and Statement of
The current reporting period’s results are translated at the current reporting period’s average rates for the Statement of comprehensive income,
The percentage change based on constant currency has been presented to provide information on the impact of foreign currency movements on
previous and current reporting periods’ results at the exchange rate as at the prior reporting date and comparing the two outcomes.
position and/or the results of its operations. The directors are responsible for the preparation of the constant currency information.
‘Operating expenses’ as a percentage of income. Income consists of net interest income and non-interest income, net of reinsurance, unearned
Cost of equityAn estimate of the return that the market demands in exchange for the risk of ownership of equity.
Cost-to-income ratio‘Operating expenses’ as a percentage of income. Income consists of net interest income and non-interest income.
Coverage ratioImpairment losses on loans and advances as a proportion of gross loans and advances.
Credit loss ratioImpairment losses on loans and advances for the reporting period, divided by total average advances (calculated on a daily weighted average basis).
Debt securities in issue
Diluted headline earnings per shareHeadline earnings for the reporting period that is attributable to ordinary equity holders, as a proportion of the weighted average number of ordinary shares in issue adjusted for the effect of all potential dilutive ordinary shares.
Distribution forceNumber of active advisers.
Dividend coverHeadline earnings per share divided by dividend per share.
Dividend per ordinary share relating to income for the reporting period
under consideration, expressed as cents per share.
Special dividend per ordinary share is a payment made by the Group that is considered separate from the typical recurring dividend cycle, expressed as cents per share.
Earnings per shareBasic earnings per share
average number of ordinary shares in issue during the reporting period.
Diluted basic earnings per share
shares in issue during the reporting period, both adjusted for the effects of all potential dilutive ordinary shares, assuming they had been in issue for the reporting period.

Glossary
166 Absa Group Limit Financial results for the reporting period ended 31 December 2019
3 Normalised Group performance
59 Segment performance
123 Group IFRS performance
142 Risk management
160 Appendices
4 Overview8 Normalised salient features9 Normalised salient features by segment
1014 Basis of presentation15 Dividend announcement16
60 WIMI segment change61 Overview64 Per market segment66 Per geographical segment
68 RBB South Africa90 CIB
106 Absa Regional Operations122
Economic capitalEconomic capital is an estimate of the maximum downward deviation from expectation in shareholder value, measured on an economic basis over
the risks which is exposed.
Embedded value
required capital) arising from covered business in force at the valuation date, together with the adjusted net worth of the covered business. Covered business is taken to be all long-term insurance business written under the Group’s licence.
The free surplus is the excess of assets over the sum of liabilities and required capital, with assets at market value and liabilities on the statutory valuation method, adjusted to add back inadmissible assets. The required capital is taken to be two times the statutory capital adequacy requirement, in line with the results of internal capital models and the Group’s dividend policy.
Differences resulting from the translation of a given number of units of one currency into another currency at different exchange rates.
ECL allowance as a proportion of gross loans and advances to customers and banks.
Financial Markets Act
markets, market infrastructure and securities services in South Africa. It focuses primarily on the licensing and regulation of exchanges, central securities depositories, clearing houses, trade repositories and market infrastructure. The Act also strengthens measures already in place aimed at prohibiting insider trading and other market abuses.
Foreign currency translationForeign currency accounts of the Group’s subsidiaries translated to reporting currency, with the foreign adjusted currency translation included in a foreign currency translation reserve as equity capital.
Gains and losses from banking and trading activitiesBanking and trading portfolios include:
realised gains and losses on financial instruments held at amortised cost, held-to-maturity or available-for-sale;realised gains and losses on the disposal of associates, joint ventures and subsidiaries within the banking portfolios;realised and unrealised gains and losses on financial instruments designated at fair value through profit or loss; andinterest, dividends and fair value movements on certain financial instruments held-for-trading or designated at fair value through profit or loss.
Gains and losses from investment activitiesInsurance and strategic investment portfolios including:
realised gains and losses on financial instruments held at amortised cost, held-to-maturity or available-for-sale;realised gains and losses on the disposal of associates, joint ventures and subsidiaries;realised and unrealised gains and losses on financial instruments designated at fair value through profit or loss; andinterest, dividends and fair value movements on certain financial instruments held for trading or designated at fair value through profit or loss.
Loans advanced to customers and banks, as well as off-balance sheet exposures.
GroupAbsa Group Limited, together with its subsidiary undertakings, special-purpose entities, joint ventures, associates and offshore holdings. It is also referred to as ‘the Group’ or ‘Absa Group’ in this report.

Glossary
Absa Group Limited Financial results for the reporting period ended 31 December 2019 167
Headline earnings
income relating to any change (realised or unrealised) in the carrying amount of an asset/liability that arose after the initial recognition of such asset or liability) as well as non-controlling interest of preference shares or ordinary shares, where relevant.
Headline earnings per share
change in the carrying amount of an asset or liability that arose after the initial recognition of such asset or liability.
Diluted headline earnings per shareDiluted headline earnings per share is calculated by adjusting both the headline earnings and the weighted average number of ordinary shares outstanding for the effects of all potential dilutive ordinary shares, assuming they had been in issue for the reporting period.
Income statementThe term Income statement is used in the same context as the Statement of comprehensive income.
Indirect taxes are the taxes that are levied on transitions rather than on persons (whether individuals or corporate). These taxes include unclaimed value-added taxes, stamp duties on deposits and Regional Services Council levies.
JawsA measure used to demonstrate the extent to which the Group’s income from operations growth rate exceeds operating expenses growth rate. Income from operations consists of net interest income and non-interest income.
LeverageAverage assets as a proportion of average equity.
Life new business marginEmbedded value of new business attained in the Life Insurance key business area of WIMI, as a proportion of the discounted value of the associated future premiums.
Loans-to-deposits and debt securities ratioLoans and advances to customers as a percentage of deposits due to customers and debt securities in issue.
Long-term funding ratioFunding with a term in excess of six months.
Market capitalisationThe Group’s closing share price, times the number of shares in issue at the reporting date.
Merchant incomeIncome generated from the provision of point-of-sale facilities to the Group’s merchant network customers. This income includes both rental income for the supply of point-of-sale units as well as transactional income for the transactions processed on the supplied terminals.
Net asset value per share
non-cumulative, non-redeemable preference shares issued.
Net incomeNet income consists of net interest income and non-interest income, net of impairment losses on loans and advances.
Net insurance premium incomeThe amount of insurance premiums received or receivable from policyholders less reinsurance paid or payable related to reinsurance contracts.
Net interest incomeThe amount of interest received or receivable on assets net of interest paid or payable on liabilities.
Net interest margin on average interest-bearing assetsNet interest income for the reporting period, divided by average interest-bearing assets (calculated on a daily weighted average basis), expressed as a percentage of average interest-bearing assets.
124 IFRS salient features
125 Financials133138 Reconciliation140 Barclays separation
143 Risk management overview155 Capital management
161 Share performance162 Shareholder information and diary163 Glossary170 Abbreviations and acronyms172 Contact information
Glossary
168 Absa Group Limit Financial results for the reporting period ended 31 December 2019
3 Normalised Group performance
59 Segment performance
123 Group IFRS performance
142 Risk management
160 Appendices
4 Overview8 Normalised salient features9 Normalised salient features by segment
1014 Basis of presentation15 Dividend announcement16
60 WIMI segment change61 Overview64 Per market segment66 Per geographical segment
68 RBB South Africa90 CIB
106 Absa Regional Operations122
Net present value unwind on non-performing book
comprehensive income as interest received on impaired assets.
Net trading result
revaluation to market value, as well as CIB’s hedge ineffectiveness. This includes the interest income and interest expense from these instruments and related funding cost. It also includes similar activities from the African operations.
Non-interest incomeNon-interest income consists of the following Statement of comprehensive income line items: ‘net fee and commission income’, ‘net insurance
from banking and trading activities’, ‘gains and losses from investment activities as well as other operating income’.
Non-interest income as a percentage of incomeNon-interest income as a percentage of income from operations. Income consists of net interest income and non-interest income.
Total income less operating expenses.
Price-to-earnings ratioThe closing price of ordinary shares, divided by headline earnings per ordinary share for the reporting period.
The probability that a debtor will default within a one-year time horizon.
The capital that the Group holds, determined in accordance with the requirements of the Banks Act and regulations relating to banks.
Return on average assetsAnnualised headline earnings as a proportion of total average assets.
Return on average equityAnnualised headline earnings as a proportion of average equity.
Return on average regulatory capital
Return on average risk-weighted assetsAnnualised headline earnings as a proportion of average risk-weighted assets.
Income consists of net interest income and non-interest income.
Calculated by assigning a degree of risk, expressed as a percentage (risk weight) to an exposure, in accordance with the applicable standardised or internal ratings-based approaches rules. RWA are determined by applying the:
AIRB approach for wholesale and retail credit; AMA for operational risk;Internal ratings-based market-based simple risk-weight approach for equity investment risk in the banking book; andStandardised approach for all African entities (both credit and operational risk).

Glossary
Absa Group Limited Financial results for the reporting period ended 31 December 2019 169
Solvency marginThe amount by which assets, at fair value, exceed liabilities and other comparable commitments.
Stage 1Assets comprise exposures that are performing in line with expectations at origination. Financial assets that are not purchased or originated with
Stage 2
credit risk management practices.
Stage 3
of default.
Stage 3 loans ratio on gross loans and advances
Total equity attributable to ordinary equity holders less goodwill and intangible assets, divided by the number of shares in issue. The tangible net
Underwriting marginNet insurance premium income remaining after net insurance claims and administrative expenses have been deducted.
A technique that measures the loss that could occur on risk positions as a result of adverse movements in market risk factors (e.g. rates, prices,
Weighted average number of sharesThe number of shares in issue at the beginning of the reporting period increased by shares issued during the reporting period, weighted on a time basis for the period during which they participated in the income, less treasury shares held by entities, weighted on a time basis for the period during which the entities held these shares.
124 IFRS salient features
125 Financials133138 Reconciliation140 Barclays separation
143 Risk management overview155 Capital management
161 Share performance162 Shareholder information and diary163 Glossary170 Abbreviations and acronyms172 Contact information
170 Absa Group Limit Financial results for the reporting period ended 31 December 2019
3 Normalised Group performance
59 Segment performance
123 Group IFRS performance
142 Risk management
160 Appendices
4 Overview8 Normalised salient features9 Normalised salient features by segment
1014 Basis of presentation15 Dividend announcement16
60 WIMI segment change61 Overview64 Per market segment66 Per geographical segment
68 RBB South Africa90 CIB
106 Absa Regional Operations122
Abbreviations and acronyms
AAEaR annual earnings at risk
AFR
AFS
AGL Absa Group Limited
AIRB advanced internal ratings-based approach
AMA advanced measurement approach
ATC Africa Treasury Committee
ATM automated teller machine
BBasel Basel Capital Accord
BERC Group Executive Risk Committee
BBBEE broad-based black economic empowerment
BIA Basic Indicator Approach
Bps basis points
BU business unit
CCAR capital adequacy requirement
CAGR compound annual growth rate
CCF credit conversion factor
central counterparty
CCR counterparty credit risk
CEM current exposure method
CET 1 Common Equity Tier 1
contingency funding plan
CIB Corporate and Investment Bank
CLF committed liquidity facility
CLGD country loss given default
CMRA conduct material risk assessments
CoRC Concentration Risk Committee
CR credit risk
CRC Control Review Committee
CRCC Country Risk and Control Review Committee
CRM credit risk mitigation
CRRC Conduct and Reputational Risk Committee
CSA(s) collateral support annexure(s)
CVA credit valuation adjustment
DDGS Deposit Guarantee Scheme
D-SIBs domestic-systemically important banks
DVaR daily value at risk
EEAD exposure at default
EC economic capital
ECA economic capital adequacy
Edcon Edcon Store Card portfolio
EL expected loss
ERMF Enterprise Risk Management framework
EVE economic value of equity
EWIs early warning indicators
FFRTB Fundamental Review of the Trading Book
FX Forex
GGAC Group Actuarial Committee
GACC Group Audit and Compliance Committee
GCC Group Credit Committee
GCCO
GCE Group Chief Executive
GCRO
GMRA Global Master Repurchase Agreement
GMRC Group Market Risk Committee
GMSLA Global Master Securities Lending
GRCMC Group Risk and Capital Management Committee
Group Absa Group Limited
GWWR general wrong way risk
Hhigh-quality liquid assets
HR high risk
IIAA internal assessment approach
IAS International Accounting Standard(s)
IAS 28 IAS 28 Investments in Associates
Measurement
internal capital adequacy assessment process
ICMA International Capital Market Association
IFRS International Financial Reporting Standard(s)
IFRS 9 Financial Instruments
IFRS 11
IMA internal models approach
IMM interest models method
IRB interest ratings-based
IRRBB interest rate risk in the banking book
ISDA International Swaps and Derivatives Association
ISLA International Securities Lending Association
IT information technology
IVC Independent Valuation Committee
J
Kkey control indicator
key indicator
key performance indicator
key risk indicator

Absa Group Limited Financial results for the reporting period ended 31 December 2019 171
124 IFRS salient features
125 Financials133138 Reconciliation140 Barclays separation
143 Risk management overview155 Capital management
161 Share performance162 Shareholder information and diary163 Glossary170 Abbreviations and acronyms172 Contact information
Abbreviations and acronyms
MMC Group Model Committee
MR market risk
NNCWO no-credit-worse-off
NII net interest income
non-performing loan(s)
NSFR net stable funding ratio
OOR&CC Operational Risk and Control Committee
ORMF Operational Risk Management Framework
ORSA Own Risk and Solvency Assessment
ORX operational risk data exchange
OTC over-the-counter
RRBA ratings-based approach
RBB Retail and Business Banking
RC regulatory capital
RDARR risk data aggregation and risk reporting
RoE return on average equity
RoRWA return on average risk-weighted assets
recovery and resolution plan
RSU Risk Sanctioning Unit
RW risk-weight
RWA risk-weighted assets
RWR right way risk
SSA standardised approach
SA-CCR standardised approach for counterparty credit risk
SAM Solvency Assessment and Management
SARB South African Reserve Bank
SEC securitisations
SFA supervisory formula approach
SL specialised lending
SME small and medium-sized enterprises
SSFA
sVAR stressed value at risk
SWWR
TLAC total loss absorbing capacity
TRC Trading Risk Committee
TSA the standard approach
TTC through-the-cycle
VVAF Vehicle and Asset Finance
VaR value at risk
WWIMI Wealth, Investment Management and Insurance
WL watch list
172 Absa Group Limit Financial results for the reporting period ended 31 December 2019
3 Normalised Group performance
59 Segment performance
123 Group IFRS performance
142 Risk management
160 Appendices
4 Overview8 Normalised salient features9 Normalised salient features by segment
1014 Basis of presentation15 Dividend announcement16
60 WIMI segment change61 Overview64 Per market segment66 Per geographical segment
68 RBB South Africa90 CIB
106 Absa Regional Operations122
Contact information
Absa Group LimitedIncorporated in the Republic of South Africa
ISIN: ZAE000255915
7th Floor, Absa Towers West
www.absa.africa
Head Investor Relations QueriesAlan Hartdegen
Group Company SecretaryNadine Drutman
Head of Financial Control
Sponsors
computershare.com/za/
Lead independent sponsor
Auditors Joint sponsor
Absa Bank Limited (Corporate and Investment Bank)
Ernst & Young Inc.
ey.com/ZA/en/Home

www.absa.africa
Copyright © 2022 FDOKUMEN