thai union group public company limited consolidated and ...
115
THAI UNION GROUP PUBLIC COMPANY LIMITED CONSOLIDATED AND SEPARATE FINANCIAL STATEMENTS 31 DECEMBER 2019
-
Upload
khangminh22 -
Category
Documents
-
view
0 -
download
0
Transcript of thai union group public company limited consolidated and ...
THAI UNION GROUP PUBLIC COMPANY LIMITED CONSOLIDATED AND SEPARATE FINANCIAL STATEMENTS 31 DECEMBER 2019
Independent Auditor’s Report
To the shareholders and the Board of Directors of Thai Union Group Public Company Limited My opinion
In my opinion, the consolidated financial statements of Thai Union Group Public Company Limited (the Company) and its subsidiaries (the Group) and the separate financial statements of the Company present fairly, in all material respects, the consolidated and separate financial position of the Group and of the Company as at 31 December 2019, and its consolidated and separate financial performance and its consolidated and separate cash flows for the year then ended in accordance with Thai Financial Reporting Standards (TFRSs).
What I have audited
The consolidated financial statements and the separate financial statements comprise:
• the consolidated and separate statements of financial position as at 31 December 2019; • the consolidated and separate statements of income for the year then ended; • the consolidated and separate statements of comprehensive income for the year then ended; • the consolidated and separate statements of changes in equity for the year then ended; • the consolidated and separate statements of cash flows for the year then ended; and • the notes to the consolidated and separate financial statements, which include a summary of significant
accounting policies.
Basis for opinion
I conducted my audit in accordance with Thai Standards on Auditing (TSAs). My responsibilities under those standards are further described in the Auditor’s responsibilities for the audit of the consolidated and separate financial statements section of my report. I am independent of the Group and the Company in accordance with the Federation of Accounting Professions under the Royal Patronage of his Majesty the King’s Code of Ethics for Professional Accountants together with the ethical requirements that are relevant to my audit of the consolidated and separate financial statements, and I have fulfilled my other ethical responsibilities in accordance with these requirements. I believe that the audit evidence I have obtained is sufficient and appropriate to provide a basis for my opinion.
Key audit matters
Key audit matters are those matters that, in my professional judgment, were of most significance in my audit of the consolidated and separate financial statements of the current period. These matters were addressed in the context of my audit of the consolidated and separate financial statements as a whole, and in forming my opinion thereon, and I do not provide a separate opinion on these matters.
Key audit matter How my audit addressed the key audit matter
Assessment of the impairment of goodwill and intangible assets with an indefinite useful life
As at 31 December 2019, the Group had goodwill of Baht 12,387 million and intangible assets with an indefinite useful life of Baht 12,391 million in the consolidated statement of financial position, representing approximately 8.73% and 8.73% of total assets, as detailed in Note 20 and Note 18, respectively. Under Thai Financial Reporting Standards, the Group is required to test the amount of goodwill and these intangible assets with an indefinite useful life for impairment annually as well as when there’s an event that causes potential impairment. This testing includes identifying the Group’s cash generating units (CGUs) that relate to goodwill and these intangible assets with an indefinite useful life. Following impairment testing by the management, the Group didn’t recognise any impairment loss on these assets. I focussed on this area because of the significant balance of goodwill and intangible assets with an indefinite useful life to the consolidated financial statements and the complexity of the assessment process of the recoverable amount. In addition, it is because the significant judgments and assumptions involved are affected by unexpected future market or economic conditions. The Group assessed its recoverable amount based on the value-in-use of goodwill and these intangible assets with an indefinite useful life by using the discounted cash flow model. This requires management to make assumptions or judgments such as revenue growth rates and discount rates applied to cash flow projections.
My audit procedures included:
• assessing if the management’s identification of the Group’s CGUs relating to goodwill and intangible assets with an indefinite useful life were appropriate
• challenging management on the reliability of key estimations and evaluating if the assumptions and methodologies used by the Group in assessing the value-in-use were appropriate. In particular, I focussed on testing the assumptions related to the forecasted revenue growth, the applicable pre-tax discount rate using the weighted average cost of capital, the royalty rate and other data used in management’s impairment analysis. I did these by comparing them to external and historical data such as external market growth expectations
• assessing the cash flow projections, mainly for key CGUs. This included assessing the historical accuracy of management’s estimates by comparing them with actual results to see whether the variances would affect the current year estimation and evaluating future business plans by assessing the current and future markets if they’re consistent with the current business plan, and
• analysing CGU value assumption sensitivity and evaluating whether a possible change in assumptions could cause the recoverable amount to be less than its carrying amount.
Based on my procedures, I considered that management’s key assumptions used in impairment testing were within a reasonable range. I also assessed that the disclosures were adequate.
Key audit matter How my audit addressed the key audit matter
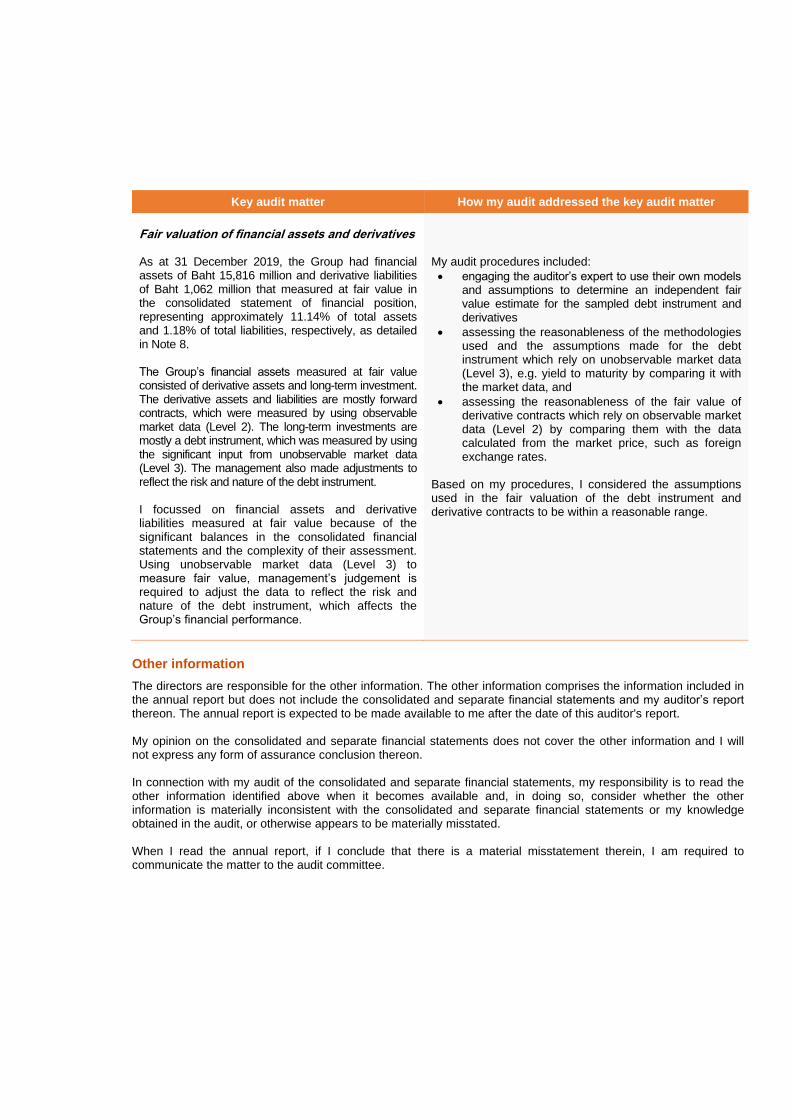
Fair valuation of financial assets and derivatives
As at 31 December 2019, the Group had financial assets of Baht 15,816 million and derivative liabilities of Baht 1,062 million that measured at fair value in the consolidated statement of financial position, representing approximately 11.14% of total assets and 1.18% of total liabilities, respectively, as detailed in Note 8. The Group’s financial assets measured at fair value consisted of derivative assets and long-term investment. The derivative assets and liabilities are mostly forward contracts, which were measured by using observable market data (Level 2). The long-term investments are mostly a debt instrument, which was measured by using the significant input from unobservable market data (Level 3). The management also made adjustments to reflect the risk and nature of the debt instrument. I focussed on financial assets and derivative liabilities measured at fair value because of the significant balances in the consolidated financial statements and the complexity of their assessment. Using unobservable market data (Level 3) to measure fair value, management’s judgement is required to adjust the data to reflect the risk and nature of the debt instrument, which affects the Group’s financial performance.
My audit procedures included:
• engaging the auditor’s expert to use their own models and assumptions to determine an independent fair value estimate for the sampled debt instrument and derivatives
• assessing the reasonableness of the methodologies used and the assumptions made for the debt instrument which rely on unobservable market data (Level 3), e.g. yield to maturity by comparing it with the market data, and
• assessing the reasonableness of the fair value of derivative contracts which rely on observable market data (Level 2) by comparing them with the data calculated from the market price, such as foreign exchange rates.
Based on my procedures, I considered the assumptions used in the fair valuation of the debt instrument and derivative contracts to be within a reasonable range.
Other information
The directors are responsible for the other information. The other information comprises the information included in the annual report but does not include the consolidated and separate financial statements and my auditor’s report thereon. The annual report is expected to be made available to me after the date of this auditor's report. My opinion on the consolidated and separate financial statements does not cover the other information and I will not express any form of assurance conclusion thereon. In connection with my audit of the consolidated and separate financial statements, my responsibility is to read the other information identified above when it becomes available and, in doing so, consider whether the other information is materially inconsistent with the consolidated and separate financial statements or my knowledge obtained in the audit, or otherwise appears to be materially misstated. When I read the annual report, if I conclude that there is a material misstatement therein, I am required to communicate the matter to the audit committee.
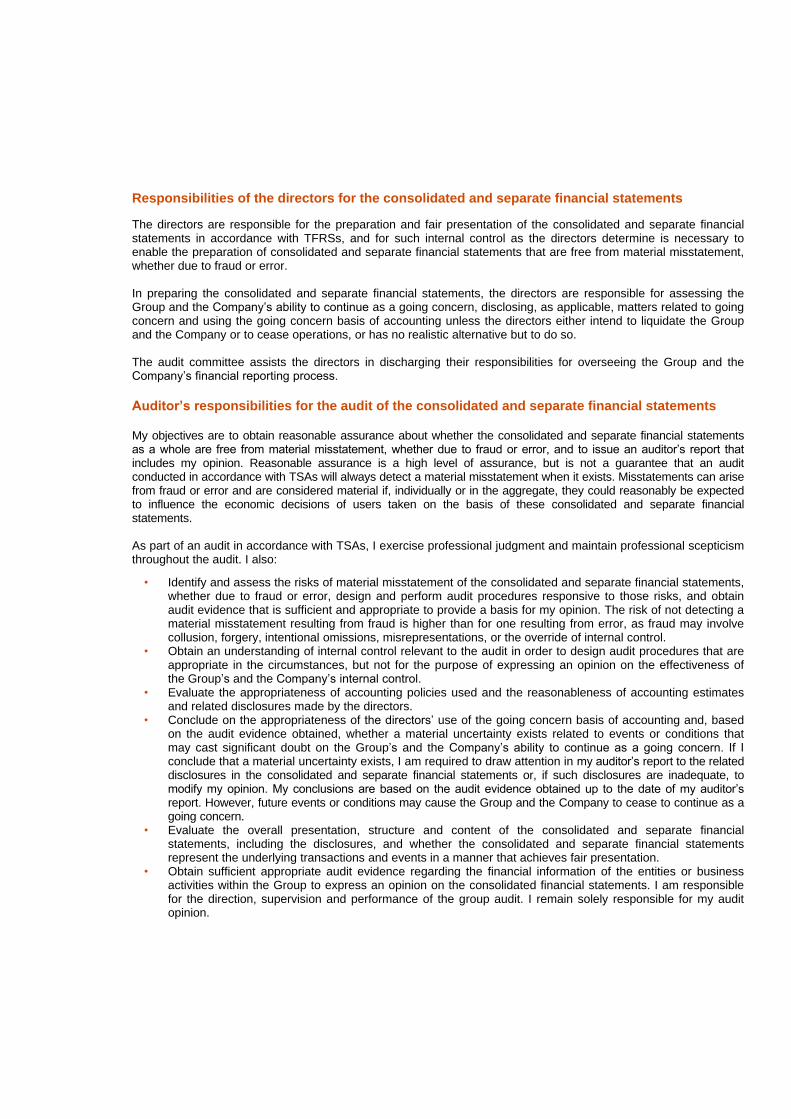
Responsibilities of the directors for the consolidated and separate financial statements
The directors are responsible for the preparation and fair presentation of the consolidated and separate financial statements in accordance with TFRSs, and for such internal control as the directors determine is necessary to enable the preparation of consolidated and separate financial statements that are free from material misstatement, whether due to fraud or error. In preparing the consolidated and separate financial statements, the directors are responsible for assessing the Group and the Company’s ability to continue as a going concern, disclosing, as applicable, matters related to going concern and using the going concern basis of accounting unless the directors either intend to liquidate the Group and the Company or to cease operations, or has no realistic alternative but to do so. The audit committee assists the directors in discharging their responsibilities for overseeing the Group and the Company’s financial reporting process.
Auditor’s responsibilities for the audit of the consolidated and separate financial statements My objectives are to obtain reasonable assurance about whether the consolidated and separate financial statements as a whole are free from material misstatement, whether due to fraud or error, and to issue an auditor’s report that includes my opinion. Reasonable assurance is a high level of assurance, but is not a guarantee that an audit conducted in accordance with TSAs will always detect a material misstatement when it exists. Misstatements can arise from fraud or error and are considered material if, individually or in the aggregate, they could reasonably be expected to influence the economic decisions of users taken on the basis of these consolidated and separate financial statements. As part of an audit in accordance with TSAs, I exercise professional judgment and maintain professional scepticism throughout the audit. I also:
• Identify and assess the risks of material misstatement of the consolidated and separate financial statements, whether due to fraud or error, design and perform audit procedures responsive to those risks, and obtain audit evidence that is sufficient and appropriate to provide a basis for my opinion. The risk of not detecting a material misstatement resulting from fraud is higher than for one resulting from error, as fraud may involve collusion, forgery, intentional omissions, misrepresentations, or the override of internal control.
• Obtain an understanding of internal control relevant to the audit in order to design audit procedures that are appropriate in the circumstances, but not for the purpose of expressing an opinion on the effectiveness of the Group’s and the Company’s internal control.
• Evaluate the appropriateness of accounting policies used and the reasonableness of accounting estimates and related disclosures made by the directors.
• Conclude on the appropriateness of the directors’ use of the going concern basis of accounting and, based on the audit evidence obtained, whether a material uncertainty exists related to events or conditions that may cast significant doubt on the Group’s and the Company’s ability to continue as a going concern. If I conclude that a material uncertainty exists, I am required to draw attention in my auditor’s report to the related disclosures in the consolidated and separate financial statements or, if such disclosures are inadequate, to modify my opinion. My conclusions are based on the audit evidence obtained up to the date of my auditor’s report. However, future events or conditions may cause the Group and the Company to cease to continue as a going concern.
• Evaluate the overall presentation, structure and content of the consolidated and separate financial statements, including the disclosures, and whether the consolidated and separate financial statements represent the underlying transactions and events in a manner that achieves fair presentation.
• Obtain sufficient appropriate audit evidence regarding the financial information of the entities or business activities within the Group to express an opinion on the consolidated financial statements. I am responsible for the direction, supervision and performance of the group audit. I remain solely responsible for my audit opinion.
I communicate with the audit committee regarding, among other matters, the planned scope and timing of the audit and significant audit findings, including any significant deficiencies in internal control that I identify during my audit. I also provide the audit committee with a statement that I have complied with relevant ethical requirements regarding independence, and to communicate with them all relationships and other matters that may reasonably be thought to bear on my independence, and where applicable, related safeguards. From the matters communicated with the audit committee, I determine those matters that were of most significance in the audit of the consolidated and separate financial statements of the current period and are therefore the key audit matters. I describe these matters in my auditor’s report unless law or regulation precludes public disclosure about the matter or when, in extremely rare circumstances, I determine that a matter should not be communicated in my report because the adverse consequences of doing so would reasonably be expected to outweigh the public interest benefits of such communication. PricewaterhouseCoopers ABAS Ltd. Pongthavee Ratanakoses Certified Public Accountant (Thailand) No. 7795 Bangkok 17 February 2020
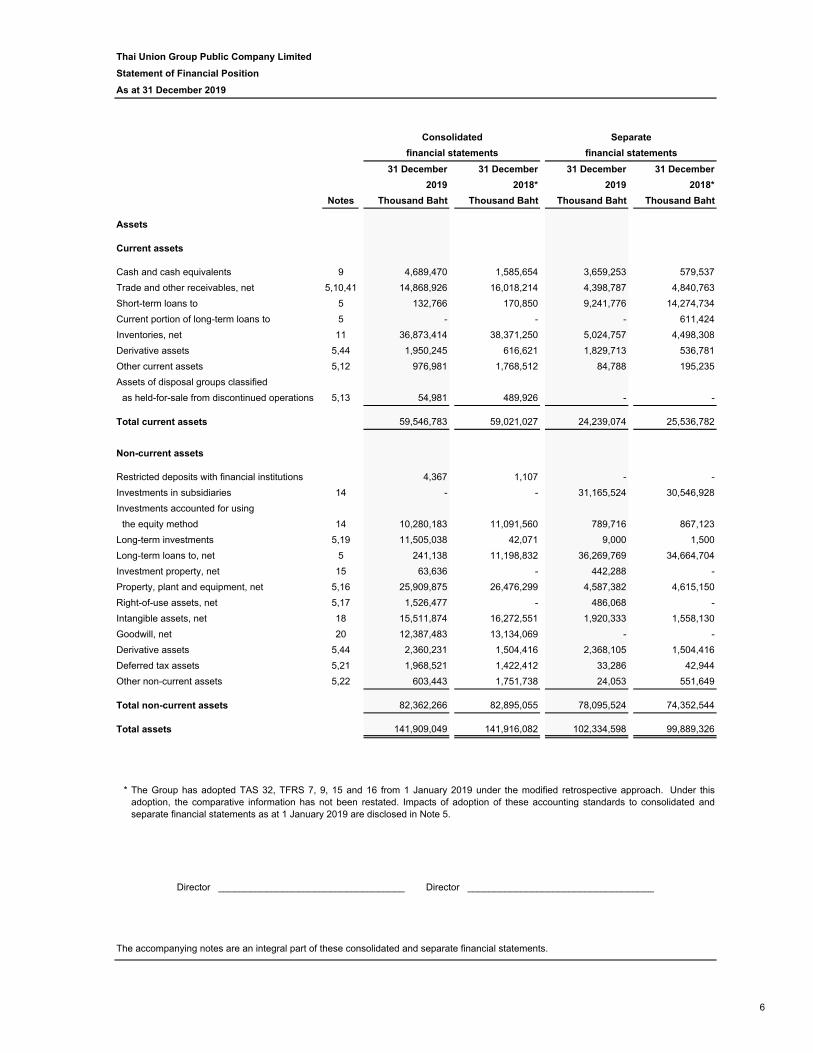
Thai Union Group Public Company Limited
Statement of Financial Position
As at 31 December 2019
31 December 31 December 31 December 31 December
2019 2018* 2019 2018*
Notes Thousand Baht Thousand Baht Thousand Baht Thousand Baht
Assets
Current assets
Cash and cash equivalents 9 4,689,470 1,585,654 3,659,253 579,537
Trade and other receivables, net 5,10,41 14,868,926 16,018,214 4,398,787 4,840,763
Short-term loans to 5 132,766 170,850 9,241,776 14,274,734
Current portion of long-term loans to 5 - - - 611,424
Inventories, net 11 36,873,414 38,371,250 5,024,757 4,498,308
Derivative assets 5,44 1,950,245 616,621 1,829,713 536,781
Other current assets 5,12 976,981 1,768,512 84,788 195,235
Assets of disposal groups classified
as held-for-sale from discontinued operations 5,13 54,981 489,926 - -
Total current assets 59,546,783 59,021,027 24,239,074 25,536,782
Non-current assets
Restricted deposits with financial institutions 4,367 1,107 - -
Investments in subsidiaries 14 - - 31,165,524 30,546,928
Investments accounted for using
the equity method 14 10,280,183 11,091,560 789,716 867,123
Long-term investments 5,19 11,505,038 42,071 9,000 1,500
Long-term loans to, net 5 241,138 11,198,832 36,269,769 34,664,704
Investment property, net 15 63,636 - 442,288 -
Property, plant and equipment, net 5,16 25,909,875 26,476,299 4,587,382 4,615,150
Right-of-use assets, net 5,17 1,526,477 - 486,068 -
Intangible assets, net 18 15,511,874 16,272,551 1,920,333 1,558,130
Goodwill, net 20 12,387,483 13,134,069 - -
Derivative assets 5,44 2,360,231 1,504,416 2,368,105 1,504,416
Deferred tax assets 5,21 1,968,521 1,422,412 33,286 42,944
Other non-current assets 5,22 603,443 1,751,738 24,053 551,649
Total non-current assets 82,362,266 82,895,055 78,095,524 74,352,544
Total assets 141,909,049 141,916,082 102,334,598 99,889,326
*
The accompanying notes are an integral part of these consolidated and separate financial statements.
The Group has adopted TAS 32, TFRS 7, 9, 15 and 16 from 1 January 2019 under the modified retrospective approach. Under thisadoption, the comparative information has not been restated. Impacts of adoption of these accounting standards to consolidated andseparate financial statements as at 1 January 2019 are disclosed in Note 5.
Consolidated Separate
financial statements financial statements
Director ___________________________________ Director ___________________________________
6
Thai Union Group Public Company Limited
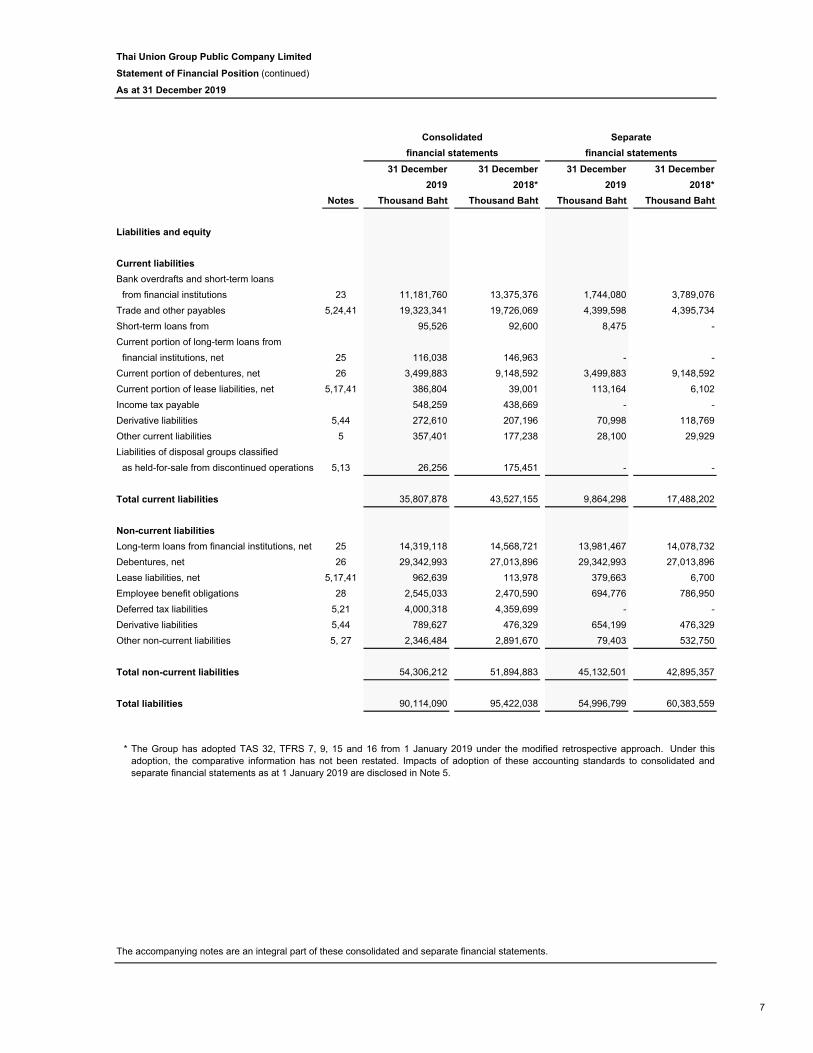
Statement of Financial Position (continued)
As at 31 December 2019
31 December 31 December 31 December 31 December
2019 2018* 2019 2018*
Notes Thousand Baht Thousand Baht Thousand Baht Thousand Baht
Liabilities and equity
Current liabilities
Bank overdrafts and short-term loans
from financial institutions 23 11,181,760 13,375,376 1,744,080 3,789,076
Trade and other payables 5,24,41 19,323,341 19,726,069 4,399,598 4,395,734
Short-term loans from 95,526 92,600 8,475 -
Current portion of long-term loans from
financial institutions, net 25 116,038 146,963 - -
Current portion of debentures, net 26 3,499,883 9,148,592 3,499,883 9,148,592
Current portion of lease liabilities, net 5,17,41 386,804 39,001 113,164 6,102
Income tax payable 548,259 438,669 - -
Derivative liabilities 5,44 272,610 207,196 70,998 118,769
Other current liabilities 5 357,401 177,238 28,100 29,929
Liabilities of disposal groups classified
as held-for-sale from discontinued operations 5,13 26,256 175,451 - -
Total current liabilities 35,807,878 43,527,155 9,864,298 17,488,202
Non-current liabilities
Long-term loans from financial institutions, net 25 14,319,118 14,568,721 13,981,467 14,078,732
Debentures, net 26 29,342,993 27,013,896 29,342,993 27,013,896
Lease liabilities, net 5,17,41 962,639 113,978 379,663 6,700
Employee benefit obligations 28 2,545,033 2,470,590 694,776 786,950
Deferred tax liabilities 5,21 4,000,318 4,359,699 - -
Derivative liabilities 5,44 789,627 476,329 654,199 476,329
Other non-current liabilities 5, 27 2,346,484 2,891,670 79,403 532,750
Total non-current liabilities 54,306,212 51,894,883 45,132,501 42,895,357
Total liabilities 90,114,090 95,422,038 54,996,799 60,383,559
*
financial statements
The accompanying notes are an integral part of these consolidated and separate financial statements.
The Group has adopted TAS 32, TFRS 7, 9, 15 and 16 from 1 January 2019 under the modified retrospective approach. Under thisadoption, the comparative information has not been restated. Impacts of adoption of these accounting standards to consolidated andseparate financial statements as at 1 January 2019 are disclosed in Note 5.
Consolidated Separate
financial statements
7
Thai Union Group Public Company Limited
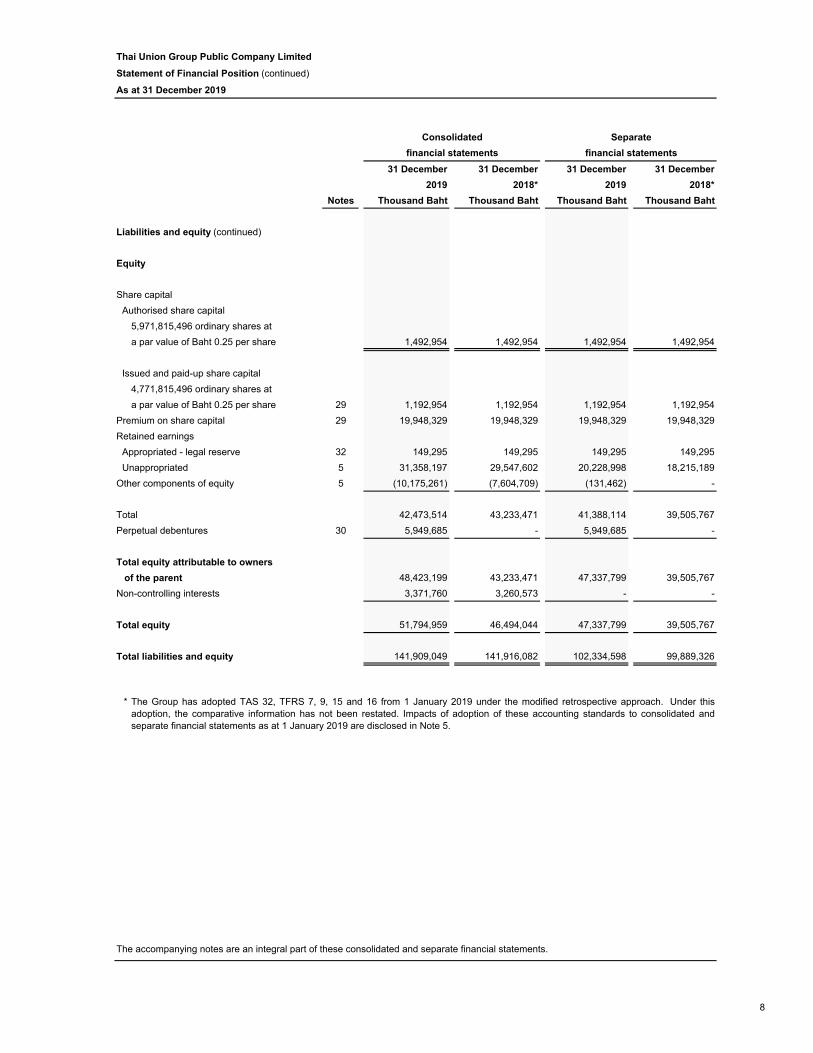
Statement of Financial Position (continued)
As at 31 December 2019
31 December 31 December 31 December 31 December
2019 2018* 2019 2018*
Notes Thousand Baht Thousand Baht Thousand Baht Thousand Baht
Liabilities and equity (continued)
Equity
Share capital
Authorised share capital
5,971,815,496 ordinary shares at
a par value of Baht 0.25 per share 1,492,954 1,492,954 1,492,954 1,492,954
Issued and paid-up share capital
4,771,815,496 ordinary shares at
a par value of Baht 0.25 per share 29 1,192,954 1,192,954 1,192,954 1,192,954
Premium on share capital 29 19,948,329 19,948,329 19,948,329 19,948,329
Retained earnings
Appropriated - legal reserve 32 149,295 149,295 149,295 149,295
Unappropriated 5 31,358,197 29,547,602 20,228,998 18,215,189
Other components of equity 5 (10,175,261) (7,604,709) (131,462) -
Total 42,473,514 43,233,471 41,388,114 39,505,767
Perpetual debentures 30 5,949,685 - 5,949,685 -
Total equity attributable to owners
of the parent 48,423,199 43,233,471 47,337,799 39,505,767
Non-controlling interests 3,371,760 3,260,573 - -
Total equity 51,794,959 46,494,044 47,337,799 39,505,767
Total liabilities and equity 141,909,049 141,916,082 102,334,598 99,889,326
*
The accompanying notes are an integral part of these consolidated and separate financial statements.
The Group has adopted TAS 32, TFRS 7, 9, 15 and 16 from 1 January 2019 under the modified retrospective approach. Under thisadoption, the comparative information has not been restated. Impacts of adoption of these accounting standards to consolidated andseparate financial statements as at 1 January 2019 are disclosed in Note 5.
financial statementsfinancial statements
Consolidated Separate
8
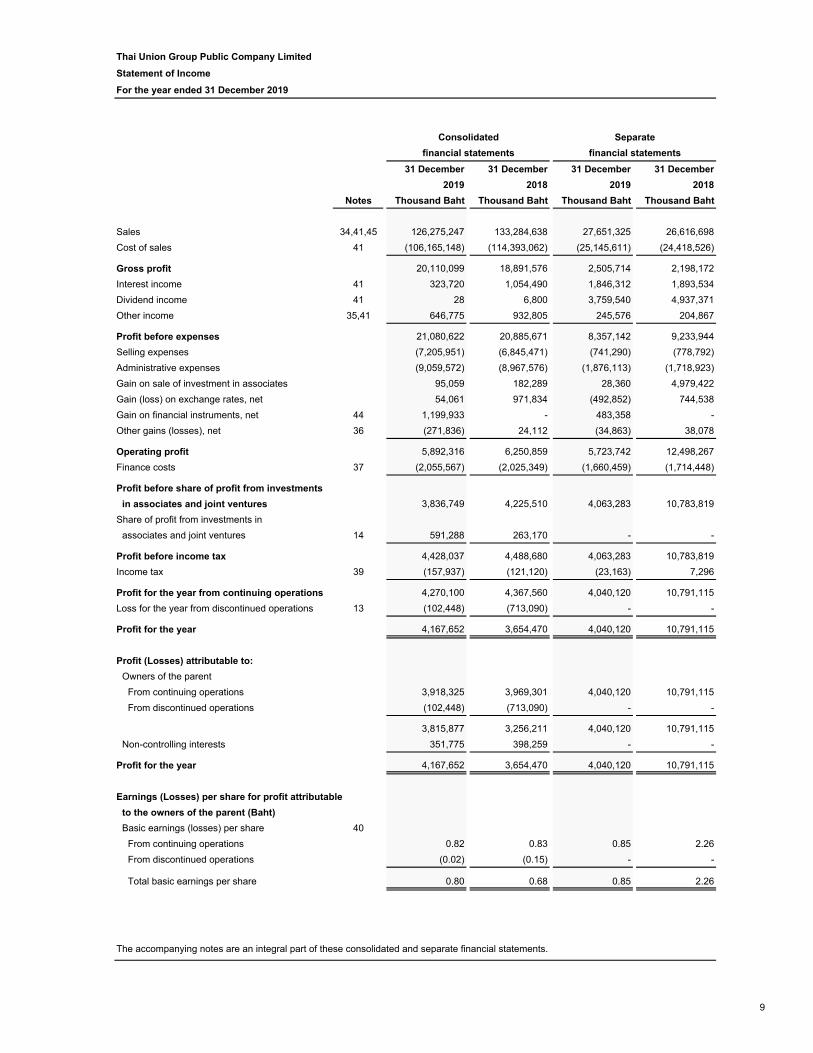
Thai Union Group Public Company Limited
Statement of Income
For the year ended 31 December 2019
31 December 31 December 31 December 31 December
2019 2018 2019 2018
Notes Thousand Baht Thousand Baht Thousand Baht Thousand Baht
Sales 34,41,45 126,275,247 133,284,638 27,651,325 26,616,698
Cost of sales 41 (106,165,148) (114,393,062) (25,145,611) (24,418,526)
Gross profit 20,110,099 18,891,576 2,505,714 2,198,172
Interest income 41 323,720 1,054,490 1,846,312 1,893,534
Dividend income 41 28 6,800 3,759,540 4,937,371
Other income 35,41 646,775 932,805 245,576 204,867
Profit before expenses 21,080,622 20,885,671 8,357,142 9,233,944
Selling expenses (7,205,951) (6,845,471) (741,290) (778,792)
Administrative expenses (9,059,572) (8,967,576) (1,876,113) (1,718,923)
Gain on sale of investment in associates 95,059 182,289 28,360 4,979,422
Gain (loss) on exchange rates, net 54,061 971,834 (492,852) 744,538
Gain on financial instruments, net 44 1,199,933 - 483,358 -
Other gains (losses), net 36 (271,836) 24,112 (34,863) 38,078
Operating profit 5,892,316 6,250,859 5,723,742 12,498,267
Finance costs 37 (2,055,567) (2,025,349) (1,660,459) (1,714,448)
Profit before share of profit from investments
in associates and joint ventures 3,836,749 4,225,510 4,063,283 10,783,819
Share of profit from investments in
associates and joint ventures 14 591,288 263,170 - -
Profit before income tax 4,428,037 4,488,680 4,063,283 10,783,819
Income tax 39 (157,937) (121,120) (23,163) 7,296
Profit for the year from continuing operations 4,270,100 4,367,560 4,040,120 10,791,115
Loss for the year from discontinued operations 13 (102,448) (713,090) - -
Profit for the year 4,167,652 3,654,470 4,040,120 10,791,115
Profit (Losses) attributable to:
Owners of the parent
From continuing operations 3,918,325 3,969,301 4,040,120 10,791,115
From discontinued operations (102,448) (713,090) - -
3,815,877 3,256,211 4,040,120 10,791,115
Non-controlling interests 351,775 398,259 - -
Profit for the year 4,167,652 3,654,470 4,040,120 10,791,115
Earnings (Losses) per share for profit attributable
to the owners of the parent (Baht)
Basic earnings (losses) per share 40
From continuing operations 0.82 0.83 0.85 2.26
From discontinued operations (0.02) (0.15) - -
Total basic earnings per share 0.80 0.68 0.85 2.26
Consolidated Separate
financial statements financial statements
The accompanying notes are an integral part of these consolidated and separate financial statements.
9
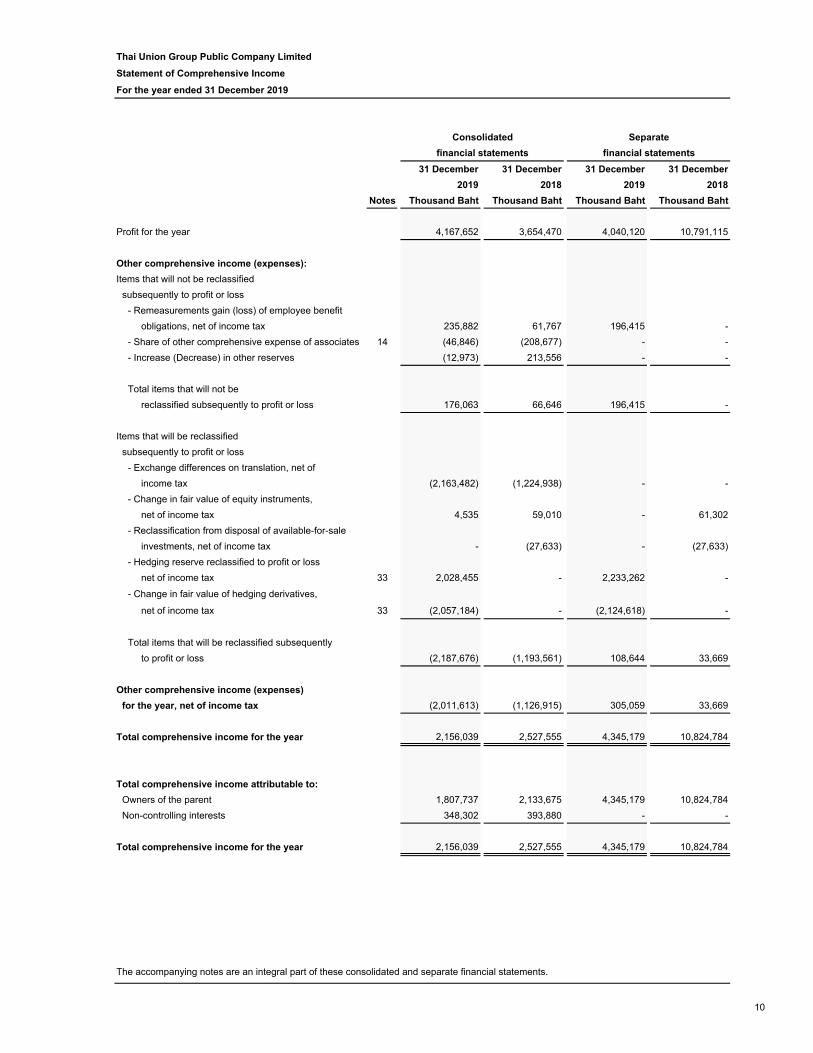
Thai Union Group Public Company Limited
Statement of Comprehensive Income
For the year ended 31 December 2019
31 December 31 December 31 December 31 December
2019 2018 2019 2018
Notes Thousand Baht Thousand Baht Thousand Baht Thousand Baht
Profit for the year 4,167,652 3,654,470 4,040,120 10,791,115
Other comprehensive income (expenses):
Items that will not be reclassified
subsequently to profit or loss
- Remeasurements gain (loss) of employee benefit
obligations, net of income tax 235,882 61,767 196,415 -
- Share of other comprehensive expense of associates 14 (46,846) (208,677) - -
- Increase (Decrease) in other reserves (12,973) 213,556 - -
Total items that will not be
reclassified subsequently to profit or loss 176,063 66,646 196,415 -
Items that will be reclassified
subsequently to profit or loss
- Exchange differences on translation, net of
income tax (2,163,482) (1,224,938) - -
- Change in fair value of equity instruments,
net of income tax 4,535 59,010 - 61,302
- Reclassification from disposal of available-for-sale
investments, net of income tax - (27,633) - (27,633)
- Hedging reserve reclassified to profit or loss
net of income tax 33 2,028,455 - 2,233,262 -
- Change in fair value of hedging derivatives,
net of income tax 33 (2,057,184) - (2,124,618) -
Total items that will be reclassified subsequently
to profit or loss (2,187,676) (1,193,561) 108,644 33,669
Other comprehensive income (expenses)
for the year, net of income tax (2,011,613) (1,126,915) 305,059 33,669
Total comprehensive income for the year 2,156,039 2,527,555 4,345,179 10,824,784
Total comprehensive income attributable to:
Owners of the parent 1,807,737 2,133,675 4,345,179 10,824,784
Non-controlling interests 348,302 393,880 - -
Total comprehensive income for the year 2,156,039 2,527,555 4,345,179 10,824,784
Consolidated Separate
financial statements financial statements
The accompanying notes are an integral part of these consolidated and separate financial statements.
10
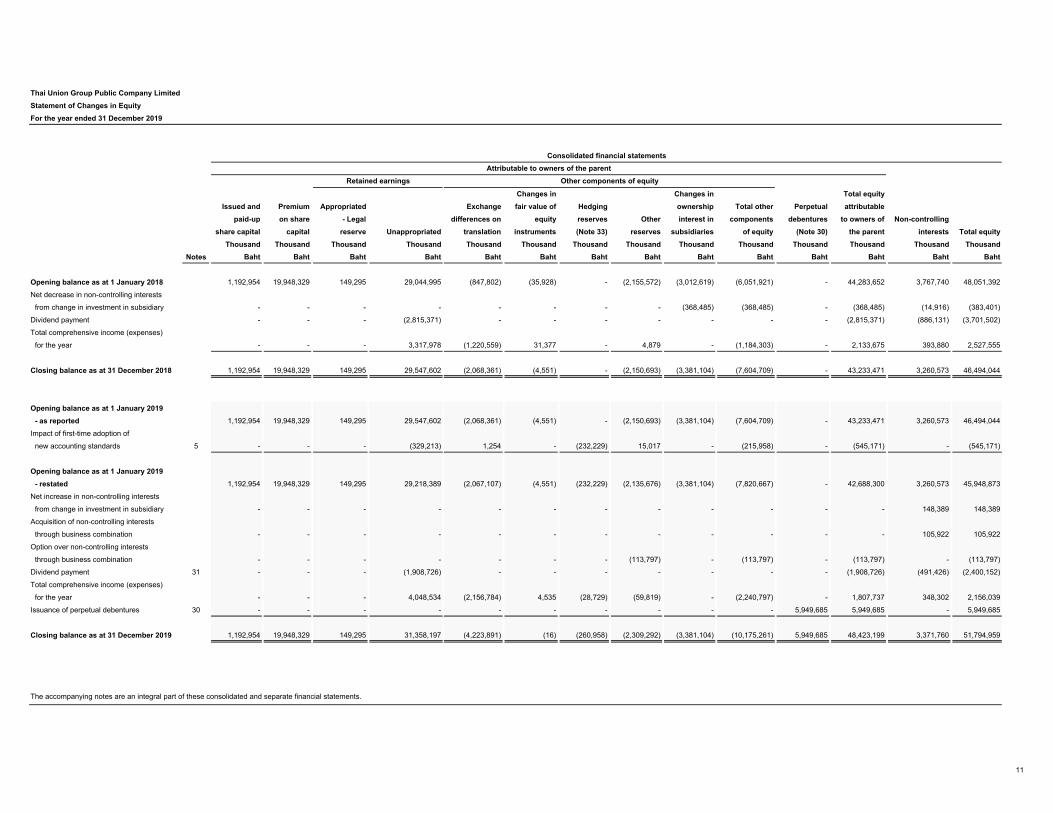
Thai Union Group Public Company Limited
Statement of Changes in Equity
For the year ended 31 December 2019
Changes in Changes in Total equity
Issued and Premium Appropriated Exchange fair value of Hedging ownership Total other Perpetual attributable
paid-up on share - Legal differences on equity reserves Other interest in components debentures to owners of Non-controlling
share capital capital reserve Unappropriated translation instruments (Note 33) reserves subsidiaries of equity (Note 30) the parent interests Total equity
Thousand Thousand Thousand Thousand Thousand Thousand Thousand Thousand Thousand Thousand Thousand Thousand Thousand Thousand
Notes Baht Baht Baht Baht Baht Baht Baht Baht Baht Baht Baht Baht Baht Baht
Opening balance as at 1 January 2018 1,192,954 19,948,329 149,295 29,044,995 (847,802) (35,928) - (2,155,572) (3,012,619) (6,051,921) - 44,283,652 3,767,740 48,051,392
Net decrease in non-controlling interests
from change in investment in subsidiary - - - - - - - - (368,485) (368,485) - (368,485) (14,916) (383,401)
Dividend payment - - - (2,815,371) - - - - - - - (2,815,371) (886,131) (3,701,502)
Total comprehensive income (expenses)
for the year - - - 3,317,978 (1,220,559) 31,377 - 4,879 - (1,184,303) - 2,133,675 393,880 2,527,555
Closing balance as at 31 December 2018 1,192,954 19,948,329 149,295 29,547,602 (2,068,361) (4,551) - (2,150,693) (3,381,104) (7,604,709) - 43,233,471 3,260,573 46,494,044
Opening balance as at 1 January 2019
- as reported 1,192,954 19,948,329 149,295 29,547,602 (2,068,361) (4,551) - (2,150,693) (3,381,104) (7,604,709) - 43,233,471 3,260,573 46,494,044
Impact of first-time adoption of
new accounting standards 5 - - - (329,213) 1,254 - (232,229) 15,017 - (215,958) - (545,171) - (545,171)
Opening balance as at 1 January 2019
- restated 1,192,954 19,948,329 149,295 29,218,389 (2,067,107) (4,551) (232,229) (2,135,676) (3,381,104) (7,820,667) - 42,688,300 3,260,573 45,948,873
Net increase in non-controlling interests
from change in investment in subsidiary - - - - - - - - - - - - 148,389 148,389
Acquisition of non-controlling interests
through business combination - - - - - - - - - - - - 105,922 105,922
Option over non-controlling interests
through business combination - - - - - - - (113,797) - (113,797) - (113,797) - (113,797)
Dividend payment 31 - - - (1,908,726) - - - - - - - (1,908,726) (491,426) (2,400,152)
Total comprehensive income (expenses)
for the year - - - 4,048,534 (2,156,784) 4,535 (28,729) (59,819) - (2,240,797) - 1,807,737 348,302 2,156,039
Issuance of perpetual debentures 30 - - - - - - - - - - 5,949,685 5,949,685 - 5,949,685
Closing balance as at 31 December 2019 1,192,954 19,948,329 149,295 31,358,197 (4,223,891) (16) (260,958) (2,309,292) (3,381,104) (10,175,261) 5,949,685 48,423,199 3,371,760 51,794,959
The accompanying notes are an integral part of these consolidated and separate financial statements.
Consolidated financial statements
Attributable to owners of the parent
Retained earnings Other components of equity
11

Thai Union Group Public Company Limited
Statement of Changes in Equity
For the year ended 31 December 2019
Issued and Premium Changes in Total other Perpetual
paid-up on share Appropriated fair value of Hedging reserves components debentures Total
share capital capital - Legal reserve Unappropriated equity instruments (Note 33) of equity (Note 30) equity
Notes Thousand Baht Thousand Baht Thousand Baht Thousand Baht Thousand Baht Thousand Baht Thousand Baht Thousand Baht Thousand Baht
Opening balance as at 1 January 2018 1,192,954 19,948,329 149,295 10,239,445 (33,669) - (33,669) - 31,496,354
Dividend payment - - - (2,815,371) - - - - (2,815,371)
Total comprehensive income for the year - - - 10,791,115 33,669 - 33,669 - 10,824,784
Closing balance as at 31 December 2018 1,192,954 19,948,329 149,295 18,215,189 - - - - 39,505,767
Opening balance as at 1 January 2019
- as reported 1,192,954 19,948,329 149,295 18,215,189 - - - - 39,505,767
Impact of first-time adoption of
new accounting standards 5 - - - (314,000) - (240,106) (240,106) - (554,106)
Opening balance as at 1 January 2019
- restated 1,192,954 19,948,329 149,295 17,901,189 - (240,106) (240,106) - 38,951,661
Dividend payment 31 - - - (1,908,726) - - - - (1,908,726)
Total comprehensive income for the year - - - 4,236,535 - 108,644 108,644 - 4,345,179
Issuance of perpetual debentures 30 - - - - - - - 5,949,685 5,949,685
Closing balance as at 31 December 2019 1,192,954 19,948,329 149,295 20,228,998 - (131,462) (131,462) 5,949,685 47,337,799
The accompanying notes are an integral part of these consolidated and separate financial statements.
Retained earnings
Separate financial statements
Other components of equity
12
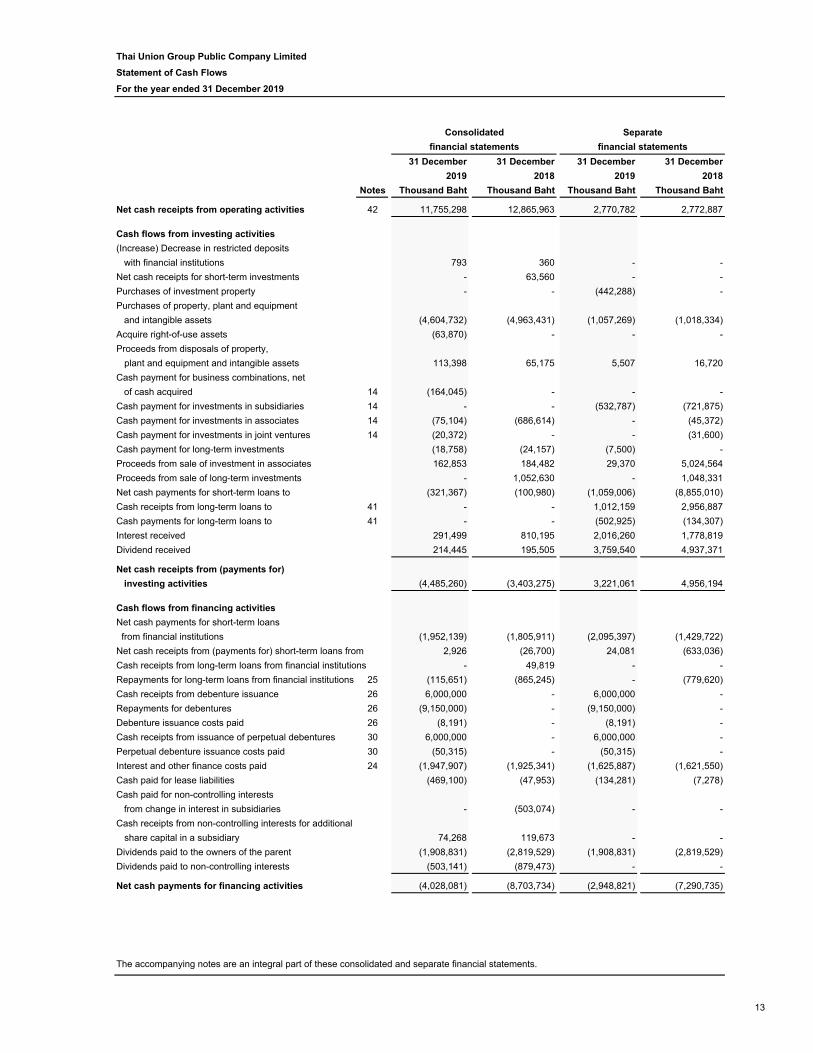
Thai Union Group Public Company Limited
Statement of Cash Flows
For the year ended 31 December 2019
31 December 31 December 31 December 31 December
2019 2018 2019 2018
Notes Thousand Baht Thousand Baht Thousand Baht Thousand Baht
Net cash receipts from operating activities 42 11,755,298 12,865,963 2,770,782 2,772,887
Cash flows from investing activities
(Increase) Decrease in restricted deposits
with financial institutions 793 360 - -
Net cash receipts for short-term investments - 63,560 - -
Purchases of investment property - - (442,288) -
Purchases of property, plant and equipment
and intangible assets (4,604,732) (4,963,431) (1,057,269) (1,018,334)
Acquire right-of-use assets (63,870) - - -
Proceeds from disposals of property,
plant and equipment and intangible assets 113,398 65,175 5,507 16,720
Cash payment for business combinations, net
of cash acquired 14 (164,045) - - -
Cash payment for investments in subsidiaries 14 - - (532,787) (721,875)
Cash payment for investments in associates 14 (75,104) (686,614) - (45,372)
Cash payment for investments in joint ventures 14 (20,372) - - (31,600)
Cash payment for long-term investments (18,758) (24,157) (7,500) -
Proceeds from sale of investment in associates 162,853 184,482 29,370 5,024,564
Proceeds from sale of long-term investments - 1,052,630 - 1,048,331
Net cash payments for short-term loans to (321,367) (100,980) (1,059,006) (8,855,010)
Cash receipts from long-term loans to 41 - - 1,012,159 2,956,887
Cash payments for long-term loans to 41 - - (502,925) (134,307)
Interest received 291,499 810,195 2,016,260 1,778,819
Dividend received 214,445 195,505 3,759,540 4,937,371
Net cash receipts from (payments for)
investing activities (4,485,260) (3,403,275) 3,221,061 4,956,194
Cash flows from financing activities
Net cash payments for short-term loans
from financial institutions (1,952,139) (1,805,911) (2,095,397) (1,429,722)
Net cash receipts from (payments for) short-term loans from 2,926 (26,700) 24,081 (633,036)
Cash receipts from long-term loans from financial institutions - 49,819 - -
Repayments for long-term loans from financial institutions 25 (115,651) (865,245) - (779,620)
Cash receipts from debenture issuance 26 6,000,000 - 6,000,000 -
Repayments for debentures 26 (9,150,000) - (9,150,000) -
Debenture issuance costs paid 26 (8,191) - (8,191) -
Cash receipts from issuance of perpetual debentures 30 6,000,000 - 6,000,000 -
Perpetual debenture issuance costs paid 30 (50,315) - (50,315) -
Interest and other finance costs paid 24 (1,947,907) (1,925,341) (1,625,887) (1,621,550)
Cash paid for lease liabilities (469,100) (47,953) (134,281) (7,278)
Cash paid for non-controlling interests
from change in interest in subsidiaries - (503,074) - -
Cash receipts from non-controlling interests for additional
share capital in a subsidiary 74,268 119,673 - -
Dividends paid to the owners of the parent (1,908,831) (2,819,529) (1,908,831) (2,819,529)
Dividends paid to non-controlling interests (503,141) (879,473) - -
Net cash payments for financing activities (4,028,081) (8,703,734) (2,948,821) (7,290,735)
Consolidated Separate
financial statements financial statements
The accompanying notes are an integral part of these consolidated and separate financial statements.
13
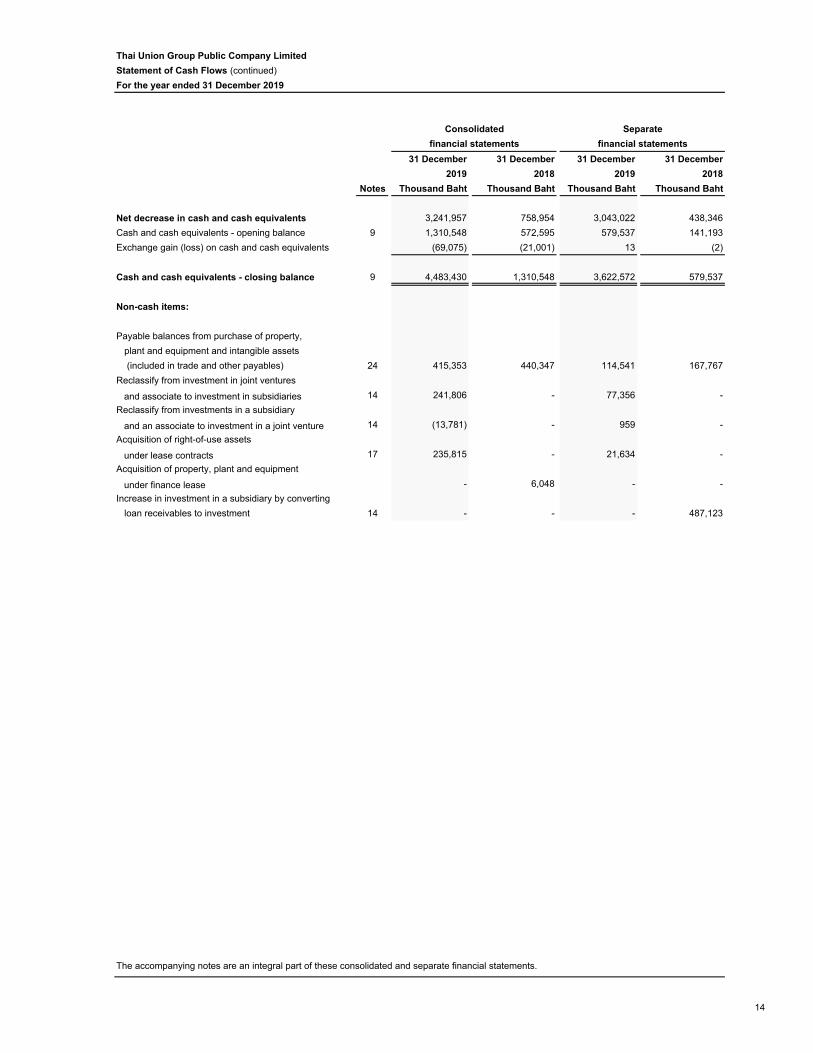
Thai Union Group Public Company Limited
Statement of Cash Flows (continued)
For the year ended 31 December 2019
31 December 31 December 31 December 31 December
2019 2018 2019 2018
Notes Thousand Baht Thousand Baht Thousand Baht Thousand Baht
Net decrease in cash and cash equivalents 3,241,957 758,954 3,043,022 438,346
Cash and cash equivalents - opening balance 9 1,310,548 572,595 579,537 141,193
Exchange gain (loss) on cash and cash equivalents (69,075) (21,001) 13 (2)
Cash and cash equivalents - closing balance 9 4,483,430 1,310,548 3,622,572 579,537
Non-cash items:
Payable balances from purchase of property,
plant and equipment and intangible assets
(included in trade and other payables) 24 415,353 440,347 114,541 167,767
Reclassify from investment in joint ventures
and associate to investment in subsidiaries 14 241,806 - 77,356 -
Reclassify from investments in a subsidiary
and an associate to investment in a joint venture 14 (13,781) - 959 -
Acquisition of right-of-use assets
under lease contracts 17 235,815 - 21,634 -
Acquisition of property, plant and equipment
under finance lease - 6,048 - -
Increase in investment in a subsidiary by converting
loan receivables to investment 14 - - - 487,123
The accompanying notes are an integral part of these consolidated and separate financial statements.
Consolidated Separate
financial statements financial statements
14
Thai Union Group Public Company Limited Notes to the Consolidated and Separate Financial Statements For the year ended 31 December 2019
15
1 General information
Thai Union Group Public Company Limited (the “Company”) is a public limited company, which is listed on the Stock Exchange of Thailand, and is incorporated and domiciled in Thailand. The current address of the Company’s registered office is at 72/1 Moo 7, Sethakit 1 Road, Tambon Tarsrai, Amphur Muang, Samutsakorn. The Company has 15 branches in Bangkok and Samutsakorn. For reporting purposes, the Company and its subsidiaries are referred to as “the Group”. The Company operates its business in Thailand and its subsidiaries conduct business in Thailand and overseas countries. The principal activities of the Company and the subsidiaries in Thailand are the manufactures and sales of frozen, chilled and canned seafood. Local subsidiaries are also engaged in the packaging, printing and pet food businesses. The principal operations of the overseas subsidiaries consist of the following businesses. The subsidiaries in America are the manufacturers and distributors of lobster and other seafood products, and the importer of shrimp and other frozen seafood products for sales to restaurant chains, retailers and wholesalers. The subsidiaries in Europe are the manufacturers and distributors of ambient and chilled seafood products to countries in Europe, America and Australia under their trademarks. The subsidiaries in Asia are the manufacturer and distributor of seafood in Vietnam and China. These consolidated and separate financial statements were authorised for issuance by the Board of Directors on 17 February 2020.
2 Accounting policies
The principal accounting policies applied in the preparation of these consolidated and separate financial statements are set out below: 2.1 Basis of preparation
The consolidated and separate financial statements have been prepared in accordance with Thai Financial Reporting Standards (“TFRS”) and the financial reporting requirements issued under the Securities and Exchange Act. The consolidated and separate financial statements have been prepared under the historical cost convention except the measurement of available-for-sale investments and derivatives as explained in the relevant accounting policies. The preparation of financial statements in conformity with TFRS requires management to use certain critical accounting estimates and to exercise its judgement in applying the Group’s accounting policies. The areas involving a higher degree of judgement or complexity, or areas that are more likely to be materially adjusted due to changes in estimates and assumptions are disclosed in Note 6. An English version of the consolidated and separate financial statements have been prepared from the statutory financial statements that are in the Thai language. In the event of a conflict or a difference in interpretation between the two languages, the Thai language statutory financial statements shall prevail.
Thai Union Group Public Company Limited Notes to the Consolidated and Separate Financial Statements For the year ended 31 December 2019
16
2.2 New and amended financial reporting standards
2.2.1 The Group has applied the following standard and amendments for the first-time for their annual reporting commencing 1 January 2019
a) Thai Financial Reporting Standard no.15 (TFRS 15), Revenue from contracts with customers The standard provides principle and approach of revenue recognition under five-step process. The underlying principle is that the Group will recognise revenue to depict the transfer of goods or services to customers at an amount that the entity expects to be entitled to in exchange for those goods or services. It replaces the principles of transferring the significant risks and rewards of ownership of the goods or services to the buyer in accordance with TAS 18, Revenue and TAS 11, Construction contracts and relevant TFRIC. The Group has adopted the new TFRS 15, Revenue from contracts with customers from 1 January 2019 (initial application date) by applying the modified retrospective approach and the comparative figures have not been restated. The Group did not apply practical expedient relates to completed contracts and contract modification as allowed by TFRS 15. The reclassifications and the adjustments arising from the changes in accounting policies are therefore recognised in the statement of financial position as at 1 January 2019. However, the adoption of TFRS 15 did not result in significant impact to the consolidated and separate financial statements as at 31 December 2018 and 1 January 2019.
b) Thai Financial Reporting Standard no.2 (TFRS 2) (revised 2018), Share-based payment The amendments made to TFRS 2 clarify: - the measurement basis for cash-settled share-based payments; and - the accounting for modifications that change an award from cash-settled to equity-settled. They also introduce an exception to the classification principles in TFRS 2. Where an employer is obliged to withhold an amount for the employee’s tax obligation associated with a share-based payment and pay that amount to the tax authority, the whole amount will be treated as if it is equity-settled. Previously the tax portion was accounted for as cash settled.
c) Thai Accounting Standard no.28 (TAS 28) (revised 2018), Investments in associates and joint ventures The amendment clarifies that the election by venture capital organisations, mutual funds, unit trust and similar entities to measure investments in associates or joint ventures at fair value through profit or loss should be made separately for each associate or joint venture at initial recognition.
d) Thai Accounting Standard no.40 (TAS 40) (revised 2018), Investment property The amendments clarify that transfers to, or from, investment property can only be made if there has been a change in use that is supported by evidence. A change in use occurs when the property meets, or ceases to meet, the definition of investment property. A change in intention alone is not sufficient to support a transfer.
e) Thai Financial Reporting Interpretation no.22 (TFRIC 22), Foreign currency transactions and advance consideration TFRIC 22 clarifies how to determine the date of transaction for the exchange rate to be used on initial recognition of a related asset, expense or income where an entity pays or receives consideration in advance for foreign currency-denominated contracts.
Thai Union Group Public Company Limited Notes to the Consolidated and Separate Financial Statements For the year ended 31 December 2019
17
f) Thai Financial Reporting Standard no.1 (TFRS 1), First-time adoption of Thai Financial Reporting Standards
TFRS 1 addresses the treatment when the Group adopts, for the first time, Thai Financial Reporting Standards (TFRSs) as a basis for preparing its financial statements. TFRS 1 grants specific optional exemptions and mandatory exceptions from TFRSs’ general requirements. It also requires certain disclosures explaining how the transition from previous GAAP to TFRSs affects the Group’s financial position, financial performance and cash flows.
g) Financial instruments The new financial standards relate to financial instruments are: TAS 32 Financial instruments: Presentation TFRS 7 Financial instruments: Disclosures TFRS 9 Financial instruments TFRIC 16 Hedges of a Net Investment in a Foreign Operation TFRIC 19 Extinguishing Financial Liabilities with Equity Instruments These new standards address the classification, measurement, derecognition of financial assets and financial liabilities, impairment of financial assets, hedge accounting, and presentation and disclosure of financial instruments. On 1 January 2019, the Group has early adopted the financial reporting standards in its financial statements by applying modified retrospective approach. The impact from the first-time adoption has been disclosed in Note 5.
h) Thai Financial Reporting Standards no.16 (TFRS 16), Leases Where the Group is a lessee, TFRS 16, Leases will result in almost all leases being recognised on the statement of financial position as the distinction between operating and finance leases is removed. A right-of-use asset and a lease liability will be recognised, with exception on short-term and low-value leases. On 1 January 2019, the Group has early adopted TFRS 16 in its financial statements by applying modified retrospective approach. The impact from the first-time adoption has been disclosed in Note 5.
2.2.2 New and amended financial reporting standards that are effective for accounting period beginning on or after 1 January 2020 TAS 12 Income tax TAS 19 Employee benefits TAS 23 Borrowing cost TAS 28 Investments in associates and joint ventures TFRS 3 Business combinations TFRS 9 Financial instruments TFRS 11 Joint arrangements TFRIC 23 Uncertainty over income tax treatments Amendment to TAS 12, Income tax clarified that the income tax consequences of dividends of financial instruments classified as equity should be recognised according to where the past transactions or events that generated distributable profits were recognised.
Thai Union Group Public Company Limited Notes to the Consolidated and Separate Financial Statements For the year ended 31 December 2019
18
Amendment to TAS 19, Employee benefits (plan amendment, curtailment or settlement) clarified accounting for defined benefit amendments, curtailments and settlements that the updated assumptions on the date of change are applied to determine current service cost and net interest for the remainder of the reporting period after the plan amendment, curtailment or settlement. Amendment to TAS 23, Borrowing costs clarified that if a specific borrowing remains outstanding after the related qualifying asset is ready for its intended use or sale, it becomes part of general borrowings. Amendment to TAS 28, Investments in associates and joint ventures (long-term interests in associates and joint ventures) clarified the accounting for long-term interests in an associate or joint venture, which is in substance form part of the net investment in the associate or joint venture, but to which equity accounting is not applied. Entities must account for such interests under TFRS 9, Financial instruments before applying the loss allocation and impairment requirement in TAS 28, Investments in associates and joint ventures. Amendment to TFRS 3, Business combinations clarified that obtaining control of a business that is a joint operation is a business combination achieved in stages. The previously held interest is therefore re-measured. Amendment to TFRS 9, Financial instruments (prepayment features with negative compensation) enabling entities to measure certain prepayable financial assets with negative compensation at amortised cost instead of fair value through profit or loss. These assets include some loan and debt securities. To qualify for amortised cost measurement, the negative compensation must be ‘reasonable compensation for early termination of the contract’ and the asset must be held within a ‘held to collect’ business model. Amendment to TFRS 11, Joint arrangements clarified that the party obtaining joint control of a business that is a joint operation should not remeasure its previously held interest in the joint operation. TFRIC 23, Uncertainty over income tax treatments explained how to recognise and measure deferred and current income tax assets and liabilities where there is uncertainty over a tax treatment. In particular, it discusses: - that the Group should assume a tax authority will examine the uncertain tax treatments and have full
knowledge of all related information, i.e. that detection risk should be ignored. - that the Group should reflect the effect of the uncertainty in its income tax accounting when it is not
probable that the tax authorities will accept the treatment. - that the judgements and estimates made must be reassessed whenever circumstances have
changed or there is new information that affects the judgements.
The Group’s management is currently assessing the impact of initial adoption of these standards.
Thai Union Group Public Company Limited Notes to the Consolidated and Separate Financial Statements For the year ended 31 December 2019
19
2.3 Principles of consolidation and equity accounting
2.3.1 Subsidiaries
Subsidiaries are all entities over which the Group has control. The Group controls an entity when the Group is exposed to, or has rights to, variable returns from its involvement with the entity and has the ability to affect those returns though its power over the entity. Subsidiaries are consolidated from the date on which control is transferred to the Group until the date that control ceases. In the separate financial statements, investments in subsidiaries are accounted for using cost method. A list of the Group’s subsidiaries has been disclosed in Note 14.
2.3.2 Associates Associates are all entities over which the Group has significant influence but not control or joint control. Investments in associates are accounted for using the equity method of accounting. In the separate financial statements, investments in associates are accounted for using cost method. A list of the Group’s principal associates has been disclosed in Note 14.
2.3.3 Joint arrangements Investments in joint arrangements are classified as either joint operations or joint ventures depending on the contractual rights and obligations of each investor, rather than the legal structure of the joint arrangements. Joint operations A joint operation is a joint arrangement whereby the Group has rights to the assets, and obligations for the liabilities relating to the arrangement. The Group recognises its direct right to the assets, liabilities, revenues and expenses of joint operations and its share of any jointly held or incurred assets, liabilities, revenues and expenses. These have been incorporated in the Group’s financial statements line items. Joint ventures A joint venture is a joint arrangement whereby the Group has rights to the net assets of the arrangement. Interests in joint ventures are accounted for using the equity method. In the separate financial statements, investments in joint ventures are accounted for using cost method. A list of the Group’s joint ventures has been disclosed in Note 14.
2.3.4 Equity method The investment is initially recognised at cost which is consideration paid and directly attributable costs. The Group’s subsequently shares of its associates and joint ventures’ profits or losses and other comprehensive income in the profit or loss and other comprehensive income, respectively. The subsequent cumulative movements are adjusted against the carrying amount of the investment. When the Group’s share of losses in associates and joint ventures equals or exceeds its interest in the associates and joint ventures, the Group does not recognise further losses, unless it has incurred obligations or made payments on behalf of the associates and joint ventures.
Thai Union Group Public Company Limited Notes to the Consolidated and Separate Financial Statements For the year ended 31 December 2019
20
2.3.5 Changes in ownership interests
The Group treats transactions with non-controlling interests that do not result in a loss of control as transactions with equity owners of the Group. A difference between the amount of the adjustment to non-controlling interests to reflect their relative interest in the subsidiary and any consideration paid or received is recognised within equity. If the ownership interest in associates and joint ventures is reduced but significant influence and joint control is retained, only a proportionate share of the amounts previously recognised in other comprehensive income is reclassified to profit or loss where appropriate. Profit or loss from reduce of the ownership interest in associates and joint ventures is recognise in profit or loss. When the Group losses control, joint control or significant influence over investments, any retained interest in the investment is remeasured to its fair value, with the change in carrying amount recognised in profit or loss. The fair value becomes the initial carrying amount of the retained interest which is reclassified to investment in an associate, or a joint venture or a financial asset accordingly.
2.3.6 Intercompany transactions on consolidation Intra-group transactions, balances and unrealised gains on transactions are eliminated. Unrealised gains on transactions between the Group and its associates and joint ventures are eliminated to the extent of the Group’s interest in the associates and joint ventures. Unrealised losses are also eliminated in the same manner unless the transaction provides evidence of an impairment of the asset transferred.
2.4 Business combination The Group applies acquisition method to account for business combinations with an exception on business combination under common control. The consideration transferred for the acquisition of a subsidiary comprises - fair value of the assets transferred, - liabilities incurred to the former owners of the acquire, and - equity interests issued by the Group. Identifiable assets and liabilities acquired, and contingent liabilities assumed in a business combination are measured initially at their fair values at the acquisition date. On an acquisition-by-acquisition basis, the Group initially recognises any non-controlling interest in the acquiree either at fair value or at the non-controlling interest’s proportionate share of the acquiree’s net assets. The excess of the consideration transferred, the amount of any non-controlling interest recognised and the acquisition-date fair value of any previous equity interest in the acquiree (for business combination achieved in stages) over the fair value of the identifiable net assets acquired is recorded as goodwill. In the case of a bargain purchase, the difference is recognised directly in profit or loss. Acquisition-related cost are recognised as expenses in the consolidated financial statements, while they are recognised as cost of investment in the separate financial statements. Step-up acquisition If the business combination is achieved in stages, the acquisition date carrying value of the acquirer’s previously held equity interest in the acquiree is re-measured to fair value at the acquisition date; any gains or losses arising from such re-measured are recognised in profit or loss. Contingent consideration paid/received Any contingent consideration to be transferred by the Group is recognised at fair value at the acquisition date. Subsequent changes to the fair value of the contingent consideration that is an asset or liability is recognised in profit or loss. Contingent consideration that is classified as equity is not re-measured.
Thai Union Group Public Company Limited Notes to the Consolidated and Separate Financial Statements For the year ended 31 December 2019
21
2.5 Foreign currency translation
2.5.1 Functional and presentation currency
The financial statements are presented in Thai Baht, which is the Company’s and the Group’s functional and presentation currency.
2.5.2 Transactions and balances Foreign currency transactions are translated into the functional currency using the exchange rates prevailing at the dates of the transactions or the date of revaluation where items are re-measured. Foreign exchange gains and losses resulting from foreign currency transactions of monetary assets and liabilities are recognised in the profit or loss. Any exchange component of gains and losses on a non-monetary item that recognised in profit or loss, or other comprehensive income is recognised following the recognition of a gain or loss on the non-monetary item.
2.5.3 Group companies The operational results and financial position of the Group’s entities (none of which has the currency of a hyper-inflationary economy) that have a different functional currency from the Group’s presentation currency are translated into the presentation currency as follows. - Assets and liabilities are translated at the closing rate at the date of respective statement of financial
position; - Income and expenses for each statement of income and statement of comprehensive income are
translated at average exchange rates; and - All resulting exchange differences are recognised in other comprehensive income. Goodwill and fair value adjustments arising on the acquisition of a foreign operation are treated as assets and liabilities of the foreign operation and translated at the closing rate.
2.6 Cash and cash equivalents In the statement of cash flows, cash and cash equivalents includes cash on hand, deposits held at call with financial institutions, short-term highly liquid investments with maturities of three months or less from acquisition date and bank overdrafts. In the statement of financial position, bank overdrafts are shown in current liabilities.
2.7 Trade receivables Trade receivables are amounts due from customers for goods sold or service performed in the ordinary course of business. Trade receivables are recognised initially at the amount of consideration that is unconditional unless they contain significant financing components, when they are recognised at its present value. The Group applies the TFRS 9 simplified approach to measuring expected credit losses which uses a simplified approach, which requires expected lifetime losses to be recognised from initial recognition of the receivables. To measure the expected credit losses, trade receivables have been grouped based on the days past due. The expected loss rates are based on the payment profiles and the corresponding historical credit losses which are adjusted to reflect the current and forward-looking information on macroeconomic factors affecting the ability of the customers to settle the receivables. The Group has identified the GDP, the unemployment rate and the consumer price index of the countries in which it sells its goods and services to be the most relevant factors, and accordingly adjusts the historical loss rates based on expected changes in these factors. The impairment losses are recognised in profit or loss within administrative expenses.
Thai Union Group Public Company Limited Notes to the Consolidated and Separate Financial Statements For the year ended 31 December 2019
22
2.8 Inventories
Inventories are stated at the lower of cost and net realisable value. Cost is determined by the weighted average method. The cost of purchase comprises both the purchase price and costs directly attributable to the acquisition of the inventory, such as import duties and transportation charges, less all attributable discounts, rebates and other similar items. The cost of finished goods and work in progress comprises raw materials, direct labour costs, other direct costs and related production overheads based on normal operating capacity. It excludes borrowing costs. Net realisable value is the estimate of the selling price in the ordinary course of business, less applicable variable selling expenses. Allowance is made, where necessary, for slow-moving, obsolete and defective inventories.
2.9 Financial assets and financial liabilities Classification and measurement of financial assets The classification of financial assets depends on the entity’s business model for managing the financial assets and the contractual terms of the cash flows. The Group classifies its debt instruments in the following categories:
- those to be measured subsequently at fair value (either through other comprehensive income or through profit or loss); and
- those to be measured at amortised cost. The Group reclassifies debt instruments when and only when its business model for managing those assets changes. The equity instruments held must be irrevocably classified to two measurement categories; i) at fair value through profit or loss (FVPL), or ii) at fair value through other comprehensive income (FVOCI) without recycling to profit or loss. At initial recognition, the Group measures a financial asset at its fair value plus or minus, in the case of a financial asset not at FVPL, transaction costs that are directly attributable to the acquisition of the financial asset. Transaction costs of financial assets carried at FVPL are expensed in profit or loss. Financial assets with embedded derivatives are considered in their entirety when determining whether their cash flows are solely payment of principal and interest. Subsequent measurement of debt instruments depends on the Group’s business model for managing the asset and the cash flow characteristics of the financial assets. There are three measurement categories into which the Group classifies its debt instruments:
- Amortised cost: A financial asset will be measured at amortised cost when the financial asset is held within a business model whose objective is to hold financial assets in order to collect contractual cash flows. In addition, the contractual terms of the financial asset give rise on specified dates to cash flows that are solely payments of principal and interest on the principal amount outstanding. Interest income from these financial assets is included in financial income using the effective interest rate method. Any gain or loss arising on derecognition is recognised directly in profit or loss and presented in other gains/(losses) together with foreign exchange gains and losses. Impairment losses are presented in profit or loss.
- FVOCI: A financial assets will be measured at FVOCI when it is held within a business model whose objective is achieved by both collecting contractual cash flows and selling financial assets. In addition, the contractual terms of the financial asset give rise on specified dates to cash flows that are solely payments of principal and interest on the principal amount outstanding. Movements in the carrying amount are taken through other comprehensive income, except for the recognition of impairment gains or losses, interest income and related foreign exchange gains and losses which are recognised in profit or loss. When the financial asset is derecognised, the cumulative gain or loss previously recognised in other comprehensive income is reclassified from equity to profit or loss and recognised on other gains/(losses). Interest income from these financial assets is included in finance income using the effective interest rate method. Foreign exchange gains and losses are presented in other gains/(losses) and impairment expenses are presented as separate line item in the statement of comprehensive income.
- FVPL: Assets that do not meet the criteria for amortised cost or FVOCI are measured at FVPL. A gain or loss on a debt investment that is subsequently measured at FVPL is recognised in profit or loss and presented net within other gains/(losses) in the period in which it arises.
Thai Union Group Public Company Limited Notes to the Consolidated and Separate Financial Statements For the year ended 31 December 2019
23
Dividends from such investments continue to be recognised in profit or loss when the Group’s right to receive payments is established. Changes in the fair value of financial assets at FVPL are recognised in other gains/(losses) in the statement of income as applicable. Impairment losses (and reversal of impairment losses) on equity investments measured at FVOCI are not reported separately from other changes in fair value. Classification and measurement of financial liabilities and equity Financial instruments issued by the Group must be classified as financial liabilities or equity securities by considering contractual obligations.
- Where the Group has an unconditional contractual obligation to deliver cash or another financial asset to another entity, it is considered a financial liability unless there is a predetermined or possible settlement for a fixed amount of cash in exchange of a fixed number of the Group’s own equity instruments.
- Where the Group has no contractual obligation or has an unconditional right to avoid delivering cash or another financial asset in settlement of the obligation, it is considered an equity instrument.
At initial recognition, the Group measures financial liabilities at fair value. The Group reclassifies all financial liabilities as subsequently measured at amortised cost, except for derivatives. Recognition and derecognition The Group shall recognise a financial asset or a financial liability in its statement of financial position when, and only when, the Group becomes party to the contractual provisions of the instrument. Regular way purchases and sales of financial assets are recognised on trade-date, the date on which the Group commits to purchase or sell the asset. Financial assets are derecognised when the rights to receive cash flows from the financial assets have expired or have been transferred and the Group has transferred substantially all the risks and rewards of ownership of the financial assets. Impairment The Group assesses on a forward-looking basis the expected credit loss associated with its debt instruments carried at amortised cost and FVOCI. The impairment methodology applied depends on whether there has been a significant increase in credit risk. The Group applies general approach for credit-impaired consideration.
2.10 Non-current assets (or disposal groups) held-for-sale Non-current assets (or disposal groups) are classified as assets held-for-sale when their carrying amount will be recovered principally through a sale transaction and a sale is considered highly probable. They are measured at the lower of the carrying amount and fair value less cost to sell. An impairment loss is recognised to write down of the asset (or disposal group) to fair value less costs to sell. A gain is recognised for any subsequent increase in fair value less costs to sell of the asset (or disposal group), but not in excess of any cumulative impairment loss previously recognised. Non-current assets (including those that are part of a disposal group) are not depreciated or amortised. A discontinued operation is a component of the Group that i) has been disposed of or is classified as held for sale, and ii) that represents a separate major line of business or geographical area of operations, is part of a single co-ordinated plan to dispose of such a line of business or area of operations, or is a subsidiary acquired exclusively with a view to resale. The results of discontinued operations are presented separately in the statement of profit or loss.
2.11 Investment property Investment property is measured initially at cost, including directly attributable costs and borrowing costs. Subsequently, they are carried at cost less accumulated depreciation and impairment. Land is not depreciated.
Thai Union Group Public Company Limited Notes to the Consolidated and Separate Financial Statements For the year ended 31 December 2019
24
2.12 Property, plant and equipment
All other property, plant and equipment are stated at historical cost less accumulated depreciation and impairment losses. Historical costs include expenditure that is directly attributable to the acquisition of the items. Subsequent costs are included in the asset’s carrying amount, only when it is probable that future economic benefits associated with the item will flow to the Group and the cost of the item can be measured reliably. The carrying amount of the replaced part is derecognised. All other repairs and maintenance are charged to profit or loss when incurred. Land is not depreciated. Depreciation on other assets is calculated using the straight-line method to allocate their costs to their residual values over their estimated useful lives, as follows: Land improvements 5 - 40 years Buildings and building improvements 5 - 40 years Machinery and factory equipment 3 - 20 years Furniture, fixtures and office equipment 3 - 20 years Vehicles 3 - 20 years The assets’ residual values and useful lives are reviewed, and adjusted if appropriate, at the end of each reporting period. Gains or losses on disposals are determined by comparing the proceeds with the carrying amount and are recognised in profit or loss.
2.13 Goodwill Goodwill is tested for impairment annually, or more frequently if events or changes in circumstances indicate that it might be impaired and is carried at cost less accumulated impairment losses. For the purpose of impairment testing, goodwill is allocated to cash-generating units. The units or groups of units are identified at the lowest level at which goodwill is monitored for internal management purposes, being the operating segments.
2.14 Intangible assets Research and development Research expenditure is recognised as an expense as incurred. Costs incurred on development projects (relating to the design and testing of new or improved products) are recognised as intangible assets when it is probable that the project will be a success considering its commercial and technological feasibility, and only if the cost can be measured reliably. Other development expenditure is recognised as an expense as incurred. Development costs previously recognised as an expense are not recognised as an asset in a subsequent period. Development costs that have been capitalised are amortised from the commencement of the commercial production of the product on a straight-line basis over the period of its expected benefit, not exceeding 10 years.

Thai Union Group Public Company Limited Notes to the Consolidated and Separate Financial Statements For the year ended 31 December 2019
25
Trademarks and licences
Separately acquired trademarks and licences are initially recorded at historical cost. Trademarks and licences acquired in business combinations are initially recognised at fair value at the acquisition date. Trademarks and licenses with an indefinite useful life are carried at cost less allowance for impairment. Trademarks and licenses with a finite useful life are carried at cost less accumulated amortisation and allowance for impairment. The trademarks presented in these financial statements have indefinite useful lives and are tested annually for impairment. The licenses have definite useful lives and are amortised using the straight-line method to allocate the cost of licences over their estimated useful lives of 2 - 16 years. Acquired computer software licences are capitalised on the basis of the costs incurred to acquire and bring to use the specific software. These costs are amortised over their estimated useful lives of 2 - 10 years. Contractual customer and distributor relationships Contractual customer and distributor relationships acquired in a business combination are initially recognised at fair value at the acquisition date. The contractual customer and distributor relationships have a finite useful life and are carried at cost less accumulated amortisation and allowance for impairment. Amortisation is calculated using the straight-line method over the expected lives of 5 - 20 years.
Computer software Costs associated with maintaining computer software programmes are recognised as an expense as incurred. Development costs that are directly attributable to the design and testing of identifiable and unique software products controlled by the Group are recognised as intangible assets when the following criteria are met:
• it is technically feasible to complete the software product so that it will be available for use;
• management intends to complete the software product and use or sell it;
• there is an ability to use or sell the software product;
• it can be demonstrated how the software product will generate probable future economic benefits;
• adequate technical, financial and other resources to complete the development and to use or sell the software product are available; and
• the expenditure attributable to the software product during its development can be reliably measured. Directly attributable costs that are capitalised as part of the software product include employee costs of software development team and an appropriate portion of relevant overheads. Other development expenditures that do not meet these criteria are recognised as an expense as incurred. Development costs previously recognised as an expense are not recognised as an asset in a subsequent period. Computer software development costs recognised as assets are amortised over their estimated useful lives of 3 - 10 years.
2.15 Impairment of assets Assets that have an indefinite useful life are tested annually for impairment, or more frequently if events or changes in circumstances indicate that it might be impaired. Assets that are subject to amortisation are reviewed for impairment whenever there is an indication of impairment. An impairment loss is recognised for the amount by which the carrying amount of the assets exceeds its recoverable amount. The recoverable amount is the higher of an asset’s fair value less costs of disposal and value in use. Where the reasons for previously recognised impairments no longer exist, the impairment losses on the assets concerned other than goodwill is reversed.
Thai Union Group Public Company Limited Notes to the Consolidated and Separate Financial Statements For the year ended 31 December 2019
26
2.16 Leases
Leases - where the Group is the lessee
At inception of a contract, the Group assesses whether the contract is, or contains, a lease. A contract is, or contains, a lease if the contract conveys the right to control the use of an identified asset for a period of time in exchange for consideration.
The Group recognises a right-of-use (ROU) asset and a lease liability at the lease commencement date. The ROU asset is initially measured at cost, which comprises the initial amount of the lease liability adjusted for any lease payments made at or before the commencement date, initial direct costs and estimated costs to dismantle and remove the underlying asset or to restore the underlying asset or the site on which it is located, less any incentive received.
The lease liability is initially measured at the present value of the lease payments that are not paid at the commencement date, discounted using the interest rate implicit in the lease, if the rate can be readily determined. If that rate cannot be readily determined, the Group uses the Group’s incremental borrowing rate.
Lease payments included in the measurement of the lease liability are as follows:
• fixed payments including in-substance fixed payments;
• variable lease payments that depend on an index or a rate, initially measured using the index or rate as at the commencement date;
• amounts expected to be payable under a residual value guarantee;
• the exercise price, under a purchase option that the Group is reasonably certain to exercise, lease payments in an optional renewal period; and
• payments of penalties for early termination of a lease if the Group is reasonably certain to terminate early.
To apply a cost model, the Group measures the ROU asset at cost, less accumulated depreciation and accumulated impairment loss and adjusted for any remeasurement of the lease liability. The ROU asset is subsequently depreciated using the straight-line method from the commencement date to the earlier of the end of the useful life of the ROU asset or the end of the lease term. However, if the lease transfers ownership of the underlying asset to the Group by the end of the lease term or if the cost of the ROU asset reflects that the Group will exercise a purchase option, the Group depreciates the ROU asset from the commencement date to the end of the useful life of the underlying asset. The useful life of the ROU asset is determined on the same basis as those of property, plant and equipment.
The lease liability is re-measured when there is a change in future lease payments arising from the following items:
• a change in an index or a rate used to determine those payments
• a change in the Group’s estimate of the amount expected to be payable under a residual value guarantee
• the Group changes its assessment of whether it will exercise a purchase, extension or termination option.
When the lease liability is re-measured to reflect changes to the lease payments, the Group recognises the amount of the remeasurement of the lease liability as an adjustment to the ROU asset. However, if the carrying amount of the ROU asset is reduced to zero and there is a further reduction in the measurement of the lease liability, the Group recognises any remaining amount of the remeasurement in profit or loss.
Short-term leases and leases of low-value assets
The Group has elected not to recognise ROU assets and lease liabilities for short-term leases that have a lease term of 12 months or less and leases of low-value assets. The Group recognises the lease payments associated with these leases as an expense on a straight-line basis over the lease term.
Leases - where the Group is the lessor
The Group determines at lease inception whether each lease is a finance lease or an operating lease. To classify each lease, the Group makes an overall assessment of whether the lease transfer substantially all of the risks and rewards incidental to ownership of the underlying asset. If this is the case, then the lease is a finance lease; if not, then it is an operating lease.
When assets are leased out under a finance lease, the present value of the lease payments is recognised as a receivable. The difference between the gross receivable and the present value of the receivable is recognised as unearned finance income. Lease income is recognised over the term of the lease using the net investment method, which reflects a constant periodic rate of return. Initial direct costs are included in initial measurement of the finance lease receivable and reduce the amount of income recognised over the lease term.
Assets leased out under operating leases are included in property, plant and equipment in the statement of financial position. They are depreciated over their expected useful lives on a basis consistent with other similar property, plant and equipment owned by the Group. Rental income (net of any incentives given to lessees) is recognised on a straight-line basis over the lease term.
Thai Union Group Public Company Limited Notes to the Consolidated and Separate Financial Statements For the year ended 31 December 2019
27
2.17 Borrowings and debentures
Borrowings and debentures are recognised initially at the fair value, net of attributable transaction costs incurred. Borrowings and debentures are subsequently stated at amortised cost. Fees paid on the establishment of loan facilities are recognised as transaction costs of the loan to the extent that it is probable that some or all of the facility will be drawn down. In this case, the fee is deferred until the draw-down occurs. To the extent that there is no evidence that it is probable that some or all of the facility will be drawn down, the fee is capitalised as a pre-payment for liquidity services and amortised over the period of the facility to which it relates. Borrowings and debentures are classified as current liabilities unless the Group has an unconditional right to defer settlement of the liability for at least 12 months after the reporting date. Borrowings and debentures are derecognised from the statement of financial position when the obligation specified in the contract is discharged, cancelled, or expired. The difference between the carrying amount of a financial liability that has been extinguished or transferred to another party and the consideration paid, including any non-cash assets transferred or liabilities assumed, is recognised in profit or loss as finance costs.
2.18 Borrowings costs General and specific borrowing costs directly attributable to the acquisition, construction or production of qualifying assets are added to the cost of those assets less investment income earned from those specific borrowings. The capitalisation of borrowing costs is ceased when substantially all the activities necessary to prepare the qualifying asset for its intended use or sale are complete. Other borrowing costs are expensed in the period in which they are incurred.
2.19 Current and deferred income taxes The tax expense for the period comprises current and deferred tax. Tax is recognised in profit or loss, except to the extent that it relates to items recognised in other comprehensive income or directly in equity. Current income tax The current income tax charge is calculated on the basis of the tax laws enacted or substantively enacted at the end of reporting period in the countries where the Company and its subsidiaries operate and generate taxable income. Management periodically evaluates positions taken in tax returns with respect to situations in which applicable tax regulation is subject to interpretation. It establishes provisions where appropriate on the basis of amounts expected to be paid to the tax authorities. Deferred income tax Deferred income tax is recognised on temporary differences arising from differences between the tax base of assets and liabilities and their carrying amounts in the financial statements. However, the deferred income tax is not recognised for temporary differences arise from:
- initial recognition of an asset or liability in a transaction other than a business combination that affects neither accounting nor taxable profit or loss is not recognised
- investments in subsidiaries, associates and joint arrangements where the timing of the reversal of the temporary difference is controlled by the Group and it is probable that the temporary difference will not reverse in the foreseeable future.
Deferred income tax is measured using tax rates of the period in which temporary difference is expected to be reversed, based on tax rates and laws that have been enacted or substantially enacted by the end of the reporting period. Deferred tax assets are recognised only to the extent that it is probable that future taxable profit will be available against which the temporary differences can be utilised. Deferred tax assets and liabilities are offset when there is a legally enforceable right to offset current tax assets and liabilities and when the deferred tax balances relate to the same taxation authority. Current tax assets and tax liabilities are offset where the entity has a legally enforceable right to offset and intends either to settle on a net basis, or to realise the asset and settle the liability simultaneously.
Thai Union Group Public Company Limited Notes to the Consolidated and Separate Financial Statements For the year ended 31 December 2019
28
2.20 Employee benefits
Short-term employee benefits Liabilities for short-term employee benefits such as wages, salaries and bonuses that are expected to be settled wholly within 12 months after the end of the period are recognised in respect of employees’ service up to the end of the reporting period. They are measured at the amount expected to be paid. Defined contribution plan A defined contribution plan or provident fund is a post-retirement plan under which the Group pays fixed contributions into a separate entity. The Group has no further payment obligations once the contributions have been paid. The contributions are recognised as employee benefit expense when they are due. Defined benefit plan Amount of retirement benefits is defined by the agreed benefits the employees will receive after the completion of employment. It usually depends on factors such as age, years of service and an employee’s latest compensation at retirement. The defined benefit obligation is calculated annually by an independent actuary using the projected unit credit method. The present value of the defined benefit obligation is determined by discounted the estimated future cash outflows using the market yield of government bonds that matches the terms and currency of the expected cash outflows. Remeasurement gains and losses are charged or credited to other comprehensive income in the period in which they arise. They are included in retained earnings in the statements of changes in equity. Past-service costs are recognised immediately in profit or loss. Other long-term benefits The Group operates other long-term benefit schemes for employees who complete the service years according to the policy. These obligations are measured similar to defined benefit plans except remeasurement gains and losses that are charged to profit or loss. Termination benefits The Group recognises termination benefits at the earlier of (a) when the Group can no longer withdraw the offer of those benefits; and (b) when the entity recognises costs for the related restructuring. Benefits due more than 12 months are discounted to their present value.
2.21 Provisions Provisions are recognised when the Group has a present legal or constructive obligation as a result of past events; it is probable that an outflow of resources will be required to settle the obligation; and the amount has been reliably estimated. Provisions are measured at the present value of the expenditures expected to be required to settle the obligation. The increase in the provision due to passage of time is recognised as interest expense.
Thai Union Group Public Company Limited Notes to the Consolidated and Separate Financial Statements For the year ended 31 December 2019
29
2.22 Share Capital
Ordinary shares with discretionary dividends are classified as equity. Incremental costs directly attributable to the issue of new shares are shown in equity as a deduction, net of tax, from the proceeds.
2.23 Revenue recognition The Group recognises revenue in the period when control of goods or services transferred to customers in an amount that reflect the net consideration the Group expects to receive. Depending on the terms of the underlying contract, the Group generally meets the above requirements when it either ships or delivers finished goods and control of the goods transfers to the customer. At contact inception, the Group assesses the goods promised in the contract to identify the performance obligations. Each performance obligation is a promise to transfer to the customer a good or service that is distinct. The transaction price will need to be allocated to the distinct performance obligations based on the relative standalone selling price of the goods and other performance obligations to ensure that revenue is recognised at the appropriate time and for the correct amount. The Group recognises revenue when it satisfies a performance obligation by transferring a promised goods or services to a customer, which is when the customer obtains control of those goods, or services. The amount of revenue recognised is the amount allocated to the satisfied performance obligation. A performance obligation may be satisfied at a point in time, typically for promises to transfer goods to a customer, or over time, typically for promises to transfer services to a customer. Interest income is recognised on an accrual basis, using the effective interest method. Revenue arising from royalties is recognised at the later of: (1) when the subsequent sale or usage occurs; and (2) the satisfaction or partial satisfaction of the performance obligation to which some or all of the sales-or-usage-based royalty has been allocated. Dividend income is recognised when the right to receive payment is established.
2.24 Dividend distribution Dividend distribution to the Company’s shareholders is recognised as a liability in the consolidated and separate financial statements in the period in which the dividends are approved by the Company’s shareholders, and the interim dividends are approved by the Board of Directors.
2.25 Derivatives and hedging activities Derivatives are initially recognised at fair value on the date a derivative contract is entered into and are subsequently remeasured to their fair value at the end of each reporting period. The accounting for subsequent changes in fair value depends on whether the derivative is designated as a hedging instrument in hedge accounting, and if so, the nature of the item being hedged. The Group designates certain derivatives as either:
• hedges of the fair value of recognised assets or liabilities or unrecognised firm commitments (fair value hedges); or
• hedges of a particular risk associated with the cash flows of recognised assets and liabilities and highly probable forecast transactions (cash flow hedges).
At inception of the hedge relationship, the Group documents the economic relationship between hedging instruments and hedged items including whether changes in the cash flows of the hedging instruments are expected to offset changes in the cash flows of hedged items. The Group documents its risk management objective and strategy for undertaking its hedge transactions. The full fair value of a hedging derivative is classified as a non-current asset or liability when the remaining maturity of the hedged item is more than 12 months; it is classified as a current asset or liability when the remaining maturity of the hedged item is less than 12 months. Derivatives that is not applied hedge accounting is classified as an asset or liability when the remaining maturity of the hedged item is more than 12 months; it is classified as a current asset or liability when the remaining maturity of the hedged item is less than 12 months. The effective portion of changes in the fair value of derivatives that are designated and qualify as cash flow hedges is recognised in the cash flow hedge reserve within equity. The gain or loss relating to the ineffective portion is recognised immediately in profit or loss, within other gains (losses).
Thai Union Group Public Company Limited Notes to the Consolidated and Separate Financial Statements For the year ended 31 December 2019
30
When forward contracts are used to hedge forecast transactions, the Group generally designates only the change in fair value of the forward contract related to the spot component as the hedging instrument. Gains or losses relating to the effective portion of the change in the spot component of the forward contracts are recognised in the cash flow hedge reserve within equity. The change in the forward element of the contract that relates to the hedged item (‘aligned forward element’) is recognised within other comprehensive income in the costs of hedging reserve within equity. In some cases, the Group may designate the full change in fair value of the forward contract (including forward points) as the hedging instrument. In such cases, the gains or losses relating to the effective portion of the change in fair value of the entire forward contract are recognised in the cash flow hedge reserve within equity. Amounts accumulated in equity are reclassified in the periods when the hedged item affects profit or loss. When a hedging instrument expires, or is sold or terminated, or when a hedge no longer meets the criteria for hedge accounting, any cumulative deferred gain or loss and deferred costs of hedging in equity at that time remains in equity until the forecast transaction occurs. When the forecast transaction is no longer expected to occur, the cumulative gain or loss and deferred costs of hedging that were reported in equity are immediately reclassified to profit or loss. Certain derivative instruments do not qualify for hedge accounting. Changes in the fair value of any derivative instrument that does not qualify for hedge accounting are recognised immediately in profit or loss and are included in other gains (losses).
3 Financial risk management
3.1 Financial risk factors
The Group exposes to a variety of financial risk: market risk (including currency risk and interest rate risk), credit risk and liquidity risk. The Group’s overall risk management programme focuses on the unpredictability of financial markets and seeks to minimise potential adverse effects on the Group’s financial performance. The Group uses derivative financial instruments to hedge certain exposures. Financial risk management is carried out by the Group Treasury Committee. The Group’s policy includes areas such as foreign exchange risk, interest rate risk, credit risk and liquidity risk. The framework parameters are approved by the Board of Directors and uses as the key communication and control tools for Treasury team globally.
3.1.1 Foreign exchange risk The Group operates internationally and is exposed to foreign currency risk arises mainly from trading transactions and borrowings that are denominated in foreign currencies. The Group seeks to reduce this risk by entering into forward exchange contracts when it considers appropriate. The Group uses forward contracts, transacted with the financial institutions, to hedge their exposure to foreign currency risk in connection with measurement currency. The balances of financial assets and liabilities denominated in foreign currencies of the Group and the Company are summarised in Note 44.
3.1.2 Interest rate risk The Group’s income and operating cash flows are substantially independent of changes in market interest rates. The Group is exposed to interest rate risk relates primarily to its deposits at financial institutions, long-term loans to related parties, short-term borrowings, long-term borrowings and debentures. Most of the Group’s financial assets and liabilities bear floating interest rates or fixed interest rates which are close to the market rate, including the Group’s had entered into interest rate swap agreements. The Group sometimes borrows at variable rates and uses interest rate swaps to hedge future interest payments, which has the economic effect of converting borrowings from floating rates to fixed rates. The interest rate swaps allow the Group to raise long-term borrowings at floating rates and swap them into fixed rates that are lower than those available if the Group borrowed at fixed rates directly. Under the interest rate swaps, the Group agrees with the other parties to exchange, at specified intervals, the difference between fixed contract rates and floating rate interest amounts calculated by reference to the agreed notional principal amounts. Any differential to be paid or received on an interest rate swap agreement is recognised as a component of interest revenue or expense over the period of the agreement.
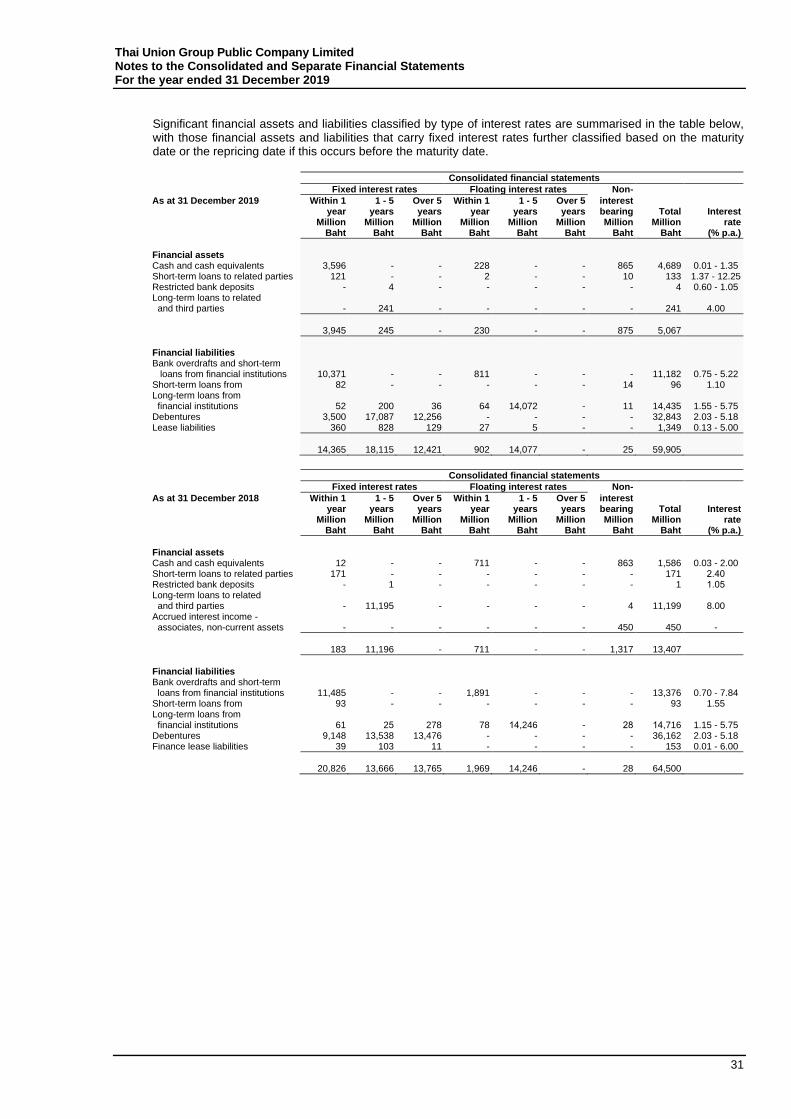
Thai Union Group Public Company Limited Notes to the Consolidated and Separate Financial Statements For the year ended 31 December 2019
31
Significant financial assets and liabilities classified by type of interest rates are summarised in the table below, with those financial assets and liabilities that carry fixed interest rates further classified based on the maturity date or the repricing date if this occurs before the maturity date.
Consolidated financial statements
Fixed interest rates Floating interest rates Non-
As at 31 December 2019 Within 1 year
Million Baht
1 - 5 years
Million Baht
Over 5 years
Million Baht
Within 1 year
Million Baht
1 - 5 years
Million Baht
Over 5 years
Million Baht
interest bearing Million
Baht
Total Million
Baht
Interest rate
(% p.a.)
Financial assets Cash and cash equivalents 3,596 - - 228 - - 865 4,689 0.01 - 1.35 Short-term loans to related parties 121 - - 2 - - 10 133 1.37 - 12.25 Restricted bank deposits - 4 - - - - - 4 0.60 - 1.05 Long-term loans to related and third parties - 241 - - - - - 241 4.00
3,945 245 - 230 - - 875 5,067
Financial liabilities Bank overdrafts and short-term loans from financial institutions 10,371 - - 811 - - - 11,182 0.75 - 5.22 Short-term loans from 82 - - - - - 14 96 1.10 Long-term loans from financial institutions 52 200 36 64 14,072 - 11 14,435 1.55 - 5.75 Debentures 3,500 17,087 12,256 - - - - 32,843 2.03 - 5.18 Lease liabilities 360 828 129 27 5 - - 1,349 0.13 - 5.00
14,365 18,115 12,421 902 14,077 - 25 59,905
Consolidated financial statements
Fixed interest rates Floating interest rates Non-
As at 31 December 2018 Within 1 year
Million Baht
1 - 5 years
Million Baht
Over 5 years
Million Baht
Within 1 year
Million Baht
1 - 5 years
Million Baht
Over 5 years
Million Baht
interest bearing Million
Baht
Total Million
Baht
Interest rate
(% p.a.)
Financial assets Cash and cash equivalents 12 - - 711 - - 863 1,586 0.03 - 2.00 Short-term loans to related parties 171 - - - - - - 171 2.40 Restricted bank deposits - 1 - - - - - 1 1.05 Long-term loans to related and third parties - 11,195 - - - - 4 11,199 8.00 Accrued interest income - associates, non-current assets - - - - - - 450 450 -
183 11,196 - 711 - - 1,317 13,407
Financial liabilities Bank overdrafts and short-term loans from financial institutions 11,485 - - 1,891 - - - 13,376 0.70 - 7.84 Short-term loans from 93 - - - - - - 93 1.55 Long-term loans from financial institutions 61 25 278 78 14,246 - 28 14,716 1.15 - 5.75 Debentures 9,148 13,538 13,476 - - - - 36,162 2.03 - 5.18 Finance lease liabilities 39 103 11 - - - - 153 0.01 - 6.00
20,826 13,666 13,765 1,969 14,246 - 28 64,500
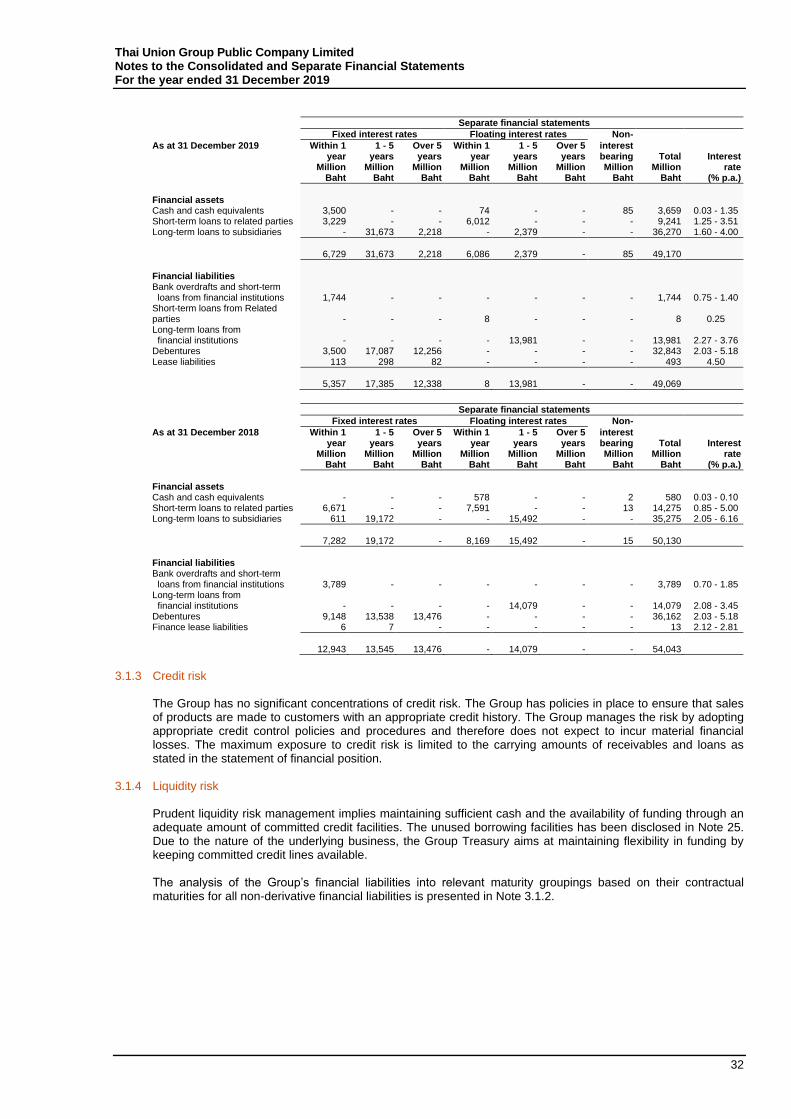
Thai Union Group Public Company Limited Notes to the Consolidated and Separate Financial Statements For the year ended 31 December 2019
32
Separate financial statements
Fixed interest rates Floating interest rates Non-
As at 31 December 2019 Within 1 year
Million Baht
1 - 5 years
Million Baht
Over 5 years
Million Baht
Within 1 year
Million Baht
1 - 5 years
Million Baht
Over 5 years
Million Baht
interest bearing Million
Baht
Total Million
Baht
Interest rate
(% p.a.)
Financial assets Cash and cash equivalents 3,500 - - 74 - - 85 3,659 0.03 - 1.35 Short-term loans to related parties 3,229 - - 6,012 - - - 9,241 1.25 - 3.51 Long-term loans to subsidiaries - 31,673 2,218 - 2,379 - - 36,270 1.60 - 4.00
6,729 31,673 2,218 6,086 2,379 - 85 49,170
Financial liabilities Bank overdrafts and short-term loans from financial institutions 1,744 - - - - - - 1,744 0.75 - 1.40 Short-term loans from Related parties - - - 8 - - - 8 0.25 Long-term loans from financial institutions - - - - 13,981 - - 13,981 2.27 - 3.76 Debentures 3,500 17,087 12,256 - - - - 32,843 2.03 - 5.18 Lease liabilities 113 298 82 - - - - 493 4.50
5,357 17,385 12,338 8 13,981 - - 49,069
Separate financial statements
Fixed interest rates Floating interest rates Non-
As at 31 December 2018 Within 1 year
Million Baht
1 - 5 years
Million Baht
Over 5 years
Million Baht
Within 1 year
Million Baht
1 - 5 years
Million Baht
Over 5 years
Million Baht
interest bearing Million
Baht
Total Million
Baht
Interest rate
(% p.a.)
Financial assets Cash and cash equivalents - - - 578 - - 2 580 0.03 - 0.10 Short-term loans to related parties 6,671 - - 7,591 - - 13 14,275 0.85 - 5.00 Long-term loans to subsidiaries 611 19,172 - - 15,492 - - 35,275 2.05 - 6.16
7,282 19,172 - 8,169 15,492 - 15 50,130
Financial liabilities Bank overdrafts and short-term loans from financial institutions 3,789 - - - - - - 3,789 0.70 - 1.85 Long-term loans from financial institutions - - - - 14,079 - - 14,079 2.08 - 3.45 Debentures 9,148 13,538 13,476 - - - - 36,162 2.03 - 5.18 Finance lease liabilities 6 7 - - - - - 13 2.12 - 2.81
12,943 13,545 13,476 - 14,079 - - 54,043
3.1.3 Credit risk
The Group has no significant concentrations of credit risk. The Group has policies in place to ensure that sales of products are made to customers with an appropriate credit history. The Group manages the risk by adopting appropriate credit control policies and procedures and therefore does not expect to incur material financial losses. The maximum exposure to credit risk is limited to the carrying amounts of receivables and loans as stated in the statement of financial position.
3.1.4 Liquidity risk Prudent liquidity risk management implies maintaining sufficient cash and the availability of funding through an adequate amount of committed credit facilities. The unused borrowing facilities has been disclosed in Note 25. Due to the nature of the underlying business, the Group Treasury aims at maintaining flexibility in funding by keeping committed credit lines available. The analysis of the Group’s financial liabilities into relevant maturity groupings based on their contractual maturities for all non-derivative financial liabilities is presented in Note 3.1.2.
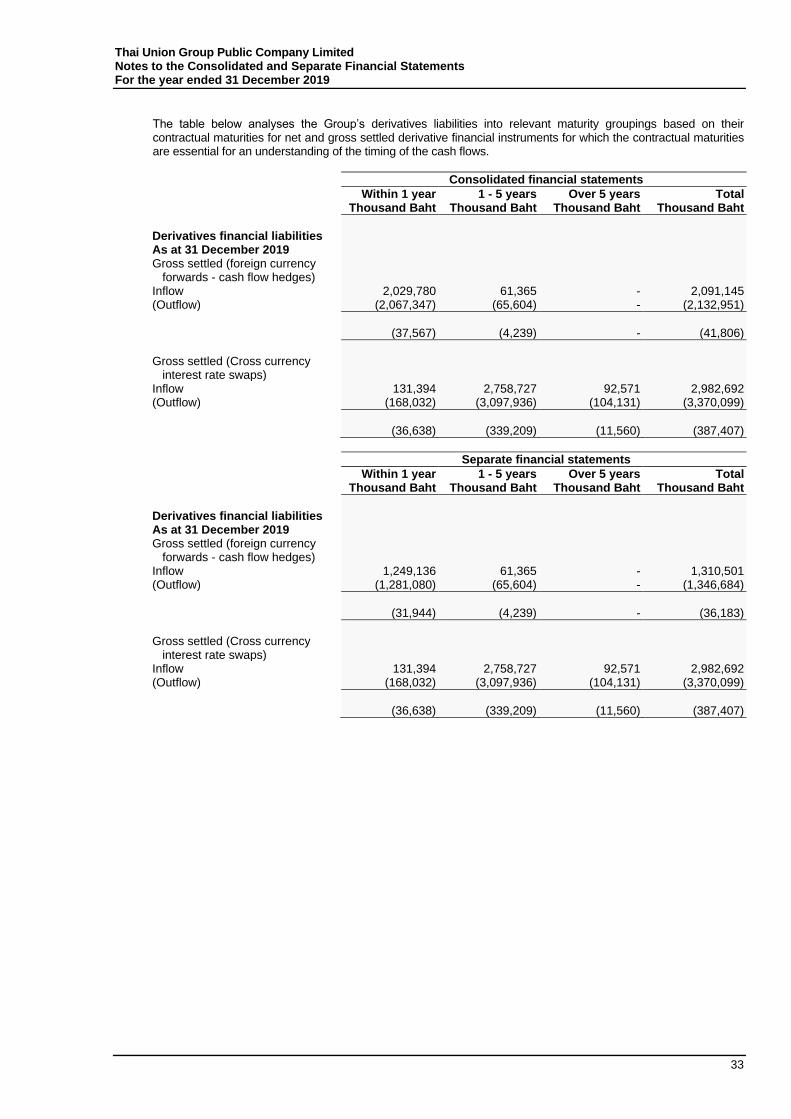
Thai Union Group Public Company Limited Notes to the Consolidated and Separate Financial Statements For the year ended 31 December 2019
33
The table below analyses the Group’s derivatives liabilities into relevant maturity groupings based on their contractual maturities for net and gross settled derivative financial instruments for which the contractual maturities are essential for an understanding of the timing of the cash flows.
Consolidated financial statements
Within 1 year Thousand Baht
1 - 5 years Thousand Baht
Over 5 years Thousand Baht
Total Thousand Baht
Derivatives financial liabilities As at 31 December 2019 Gross settled (foreign currency forwards - cash flow hedges) Inflow 2,029,780 61,365 - 2,091,145 (Outflow) (2,067,347) (65,604) - (2,132,951)
(37,567) (4,239) - (41,806)
Gross settled (Cross currency interest rate swaps)
Inflow 131,394 2,758,727 92,571 2,982,692 (Outflow) (168,032) (3,097,936) (104,131) (3,370,099)
(36,638) (339,209) (11,560) (387,407)
Separate financial statements
Within 1 year Thousand Baht
1 - 5 years Thousand Baht
Over 5 years Thousand Baht
Total Thousand Baht
Derivatives financial liabilities As at 31 December 2019 Gross settled (foreign currency forwards - cash flow hedges) Inflow 1,249,136 61,365 - 1,310,501 (Outflow) (1,281,080) (65,604) - (1,346,684)
(31,944) (4,239) - (36,183)
Gross settled (Cross currency interest rate swaps)
Inflow 131,394 2,758,727 92,571 2,982,692 (Outflow) (168,032) (3,097,936) (104,131) (3,370,099)
(36,638) (339,209) (11,560) (387,407)
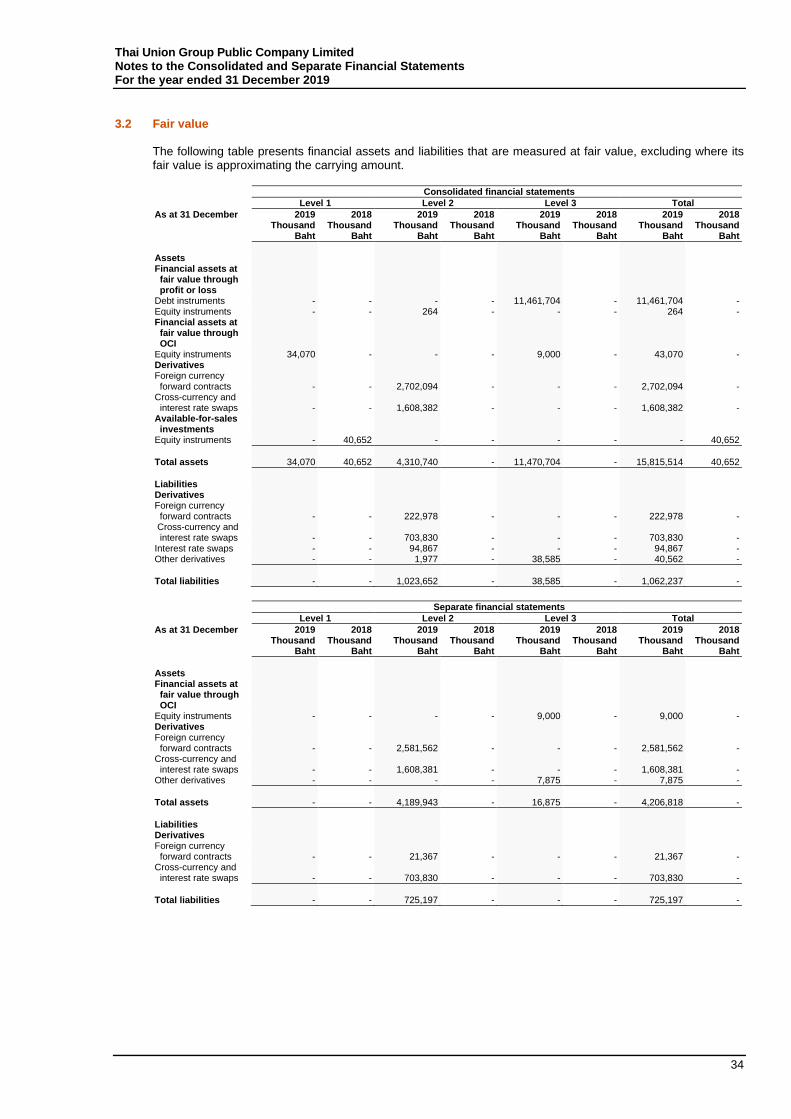
Thai Union Group Public Company Limited Notes to the Consolidated and Separate Financial Statements For the year ended 31 December 2019
34
3.2 Fair value
The following table presents financial assets and liabilities that are measured at fair value, excluding where its fair value is approximating the carrying amount.
Consolidated financial statements
Level 1 Level 2 Level 3 Total
As at 31 December
2019 Thousand
Baht
2018 Thousand
Baht
2019 Thousand
Baht
2018 Thousand
Baht
2019 Thousand
Baht
2018 Thousand
Baht
2019 Thousand
Baht
2018 Thousand
Baht
Assets Financial assets at fair value through profit or loss Debt instruments - - - - 11,461,704 - 11,461,704 - Equity instruments - - 264 - - - 264 - Financial assets at fair value through OCI Equity instruments 34,070 - - - 9,000 - 43,070 - Derivatives Foreign currency forward contracts - - 2,702,094 - - - 2,702,094 - Cross-currency and interest rate swaps - - 1,608,382 - - - 1,608,382 - Available-for-sales investments Equity instruments - 40,652 - - - - - 40,652
Total assets 34,070 40,652 4,310,740 - 11,470,704 - 15,815,514 40,652
Liabilities Derivatives Foreign currency forward contracts - -
222,978 - - - 222,978 -
Cross-currency and interest rate swaps - -
703,830 - - -
703,830 -
Interest rate swaps - - 94,867 - - - 94,867 - Other derivatives - - 1,977 - 38,585 - 40,562 -
Total liabilities - - 1,023,652 - 38,585 - 1,062,237 -
Separate financial statements
Level 1 Level 2 Level 3 Total
As at 31 December
2019 Thousand
Baht
2018 Thousand
Baht
2019 Thousand
Baht
2018 Thousand
Baht
2019 Thousand
Baht
2018 Thousand
Baht
2019 Thousand
Baht
2018 Thousand
Baht
Assets Financial assets at fair value through OCI Equity instruments - - - - 9,000 - 9,000 - Derivatives Foreign currency forward contracts - - 2,581,562 - - - 2,581,562 - Cross-currency and interest rate swaps - - 1,608,381 - - - 1,608,381 - Other derivatives - - - - 7,875 - 7,875 -
Total assets - - 4,189,943 - 16,875 - 4,206,818 -
Liabilities Derivatives Foreign currency forward contracts - - 21,367 - - - 21,367 - Cross-currency and interest rate swaps - - 703,830 - - - 703,830 -
Total liabilities - - 725,197 - - - 725,197 -

Thai Union Group Public Company Limited Notes to the Consolidated and Separate Financial Statements For the year ended 31 December 2019
35
The fair value of financial instruments traded in active market is based on quoted market prices at the statement of financial position date. A market is regarded as active if quoted prices are readily and regularly available from an exchange, dealer, broker, industry group, pricing service, or regulatory agency, and those prices represent actual and regularly occurring market transactions on an arm’s length basis. The quoted market price used for financial assets held by the group is the current bid price. These instruments are included in Level 1. The fair value of financial instruments that are not traded in an active market (Over the counter) is determined by using valuation techniques. These valuation techniques maximise the use of observable market data where it is available and rely as little as possible on the Group's specific estimates. If all significant inputs required to fair value an instrument are observable, the instrument is included in level 2. The Group utilises valuation techniques used to measure fair value level 3 which are option-pricing models, the present value of future cash flows based on the forward exchange rates at the reporting date and the discounted cash flow analysis. The significant inputs are from both observable market data and unobservable market data, for example, share prices, credit spread and share volatility. There was no transfer between such levels during the year. The following table summarises the quantitative information about the significant unobservable inputs used in level 3 fair value measurement.
Fair value as at 31 December
2019 2018 Inputs
Description Thousand
Baht Thousand
Baht Unobservable
inputs Valuation technique 2019 2018
Relationship of unobservable inputs to fair value
Other long-term investments
11,461,704 - Risk-adjusted discount rate
Discounted cash flow
8.42% - - 1% increase in risk-adjusted discount rate would result in a decrease in fair value by Baht 250.16 million.
- 1% decrease in risk-adjusted discount rate would result in an increase in fair value by Baht 256.81 million.
The Group set up a working team that performs the valuations required for financial reporting purposes, including level 3 fair values. They also involve a valuation specialist supporting valuation of financial assets and liabilities. This team reports directly to the CFO and the Board of Directors. The main level 3 inputs used by the Group are derived and evaluated as follows:
- Discount rates for financial assets and financial liabilities are determined using a Capital Asset Pricing Model (CAPM) to calculate a pre-tax rate that reflects current market assessments of the time value of money and the risk specific to the asset.
- Risk adjustments specific to the counterparties.
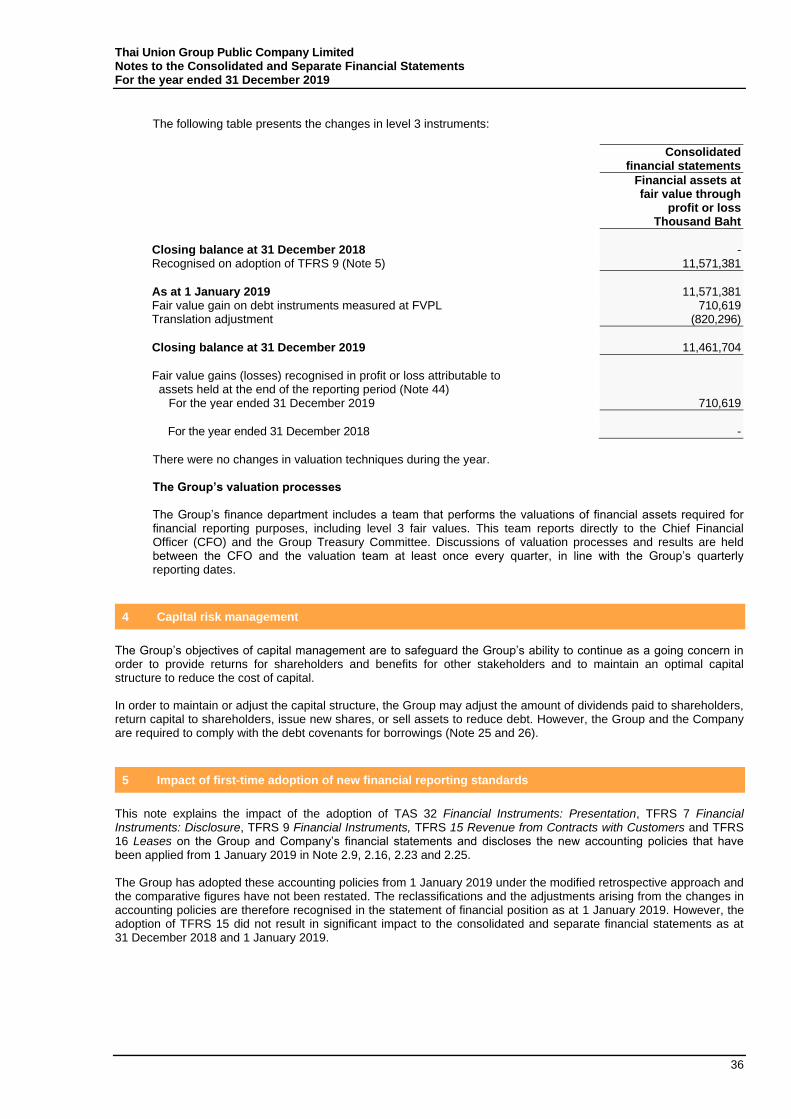
Thai Union Group Public Company Limited Notes to the Consolidated and Separate Financial Statements For the year ended 31 December 2019
36
The following table presents the changes in level 3 instruments:
Consolidated
financial statements
Financial assets at fair value through
profit or loss Thousand Baht
Closing balance at 31 December 2018 - Recognised on adoption of TFRS 9 (Note 5) 11,571,381
As at 1 January 2019 11,571,381 Fair value gain on debt instruments measured at FVPL 710,619 Translation adjustment (820,296)
Closing balance at 31 December 2019 11,461,704
Fair value gains (losses) recognised in profit or loss attributable to assets held at the end of the reporting period (Note 44) For the year ended 31 December 2019 710,619
For the year ended 31 December 2018 -
There were no changes in valuation techniques during the year. The Group’s valuation processes The Group’s finance department includes a team that performs the valuations of financial assets required for financial reporting purposes, including level 3 fair values. This team reports directly to the Chief Financial Officer (CFO) and the Group Treasury Committee. Discussions of valuation processes and results are held between the CFO and the valuation team at least once every quarter, in line with the Group’s quarterly reporting dates.
4 Capital risk management
The Group’s objectives of capital management are to safeguard the Group’s ability to continue as a going concern in order to provide returns for shareholders and benefits for other stakeholders and to maintain an optimal capital structure to reduce the cost of capital. In order to maintain or adjust the capital structure, the Group may adjust the amount of dividends paid to shareholders, return capital to shareholders, issue new shares, or sell assets to reduce debt. However, the Group and the Company are required to comply with the debt covenants for borrowings (Note 25 and 26).
5 Impact of first-time adoption of new financial reporting standards
This note explains the impact of the adoption of TAS 32 Financial Instruments: Presentation, TFRS 7 Financial Instruments: Disclosure, TFRS 9 Financial Instruments, TFRS 15 Revenue from Contracts with Customers and TFRS 16 Leases on the Group and Company’s financial statements and discloses the new accounting policies that have been applied from 1 January 2019 in Note 2.9, 2.16, 2.23 and 2.25. The Group has adopted these accounting policies from 1 January 2019 under the modified retrospective approach and the comparative figures have not been restated. The reclassifications and the adjustments arising from the changes in accounting policies are therefore recognised in the statement of financial position as at 1 January 2019. However, the adoption of TFRS 15 did not result in significant impact to the consolidated and separate financial statements as at 31 December 2018 and 1 January 2019.
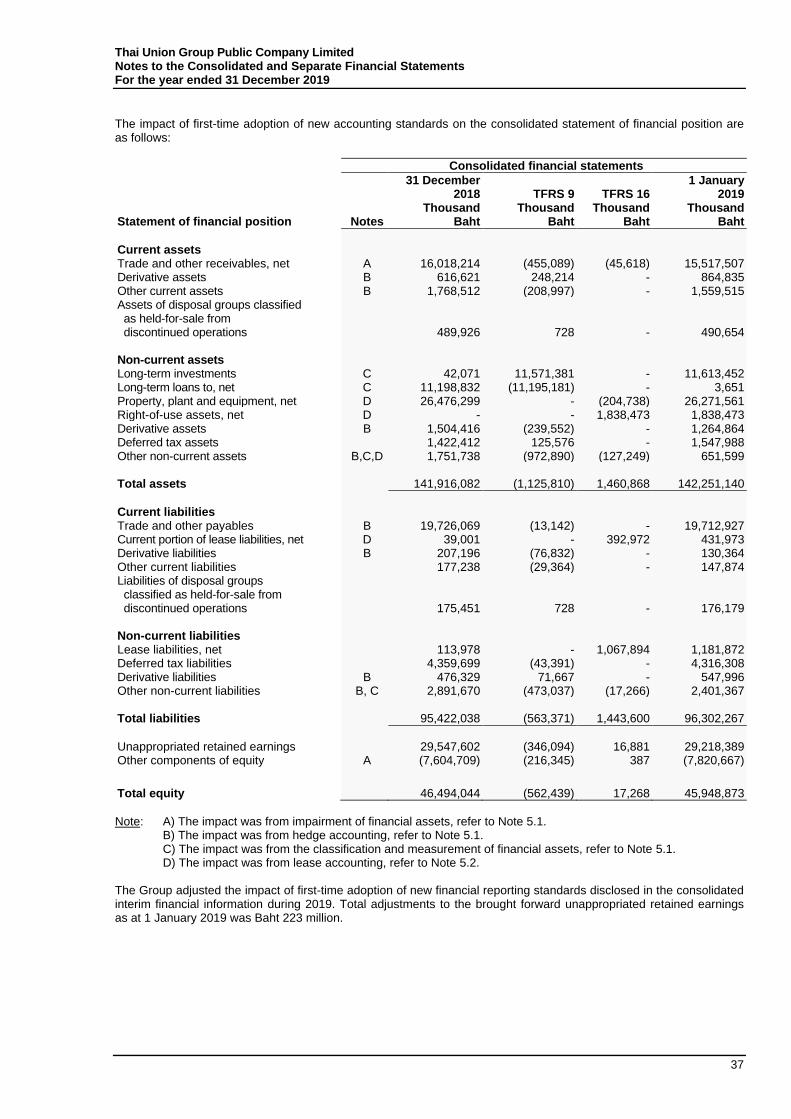
Thai Union Group Public Company Limited Notes to the Consolidated and Separate Financial Statements For the year ended 31 December 2019
37
The impact of first-time adoption of new accounting standards on the consolidated statement of financial position are as follows:
Consolidated financial statements
31 December
2018 TFRS 9 TFRS 16 1 January
2019
Statement of financial position Notes Thousand
Baht Thousand
Baht Thousand
Baht Thousand
Baht
Current assets Trade and other receivables, net A 16,018,214 (455,089) (45,618) 15,517,507 Derivative assets B 616,621 248,214 - 864,835 Other current assets B 1,768,512 (208,997) - 1,559,515 Assets of disposal groups classified as held-for-sale from discontinued operations
489,926 728 - 490,654 Non-current assets Long-term investments C 42,071 11,571,381 - 11,613,452 Long-term loans to, net C 11,198,832 (11,195,181) - 3,651 Property, plant and equipment, net D 26,476,299 - (204,738) 26,271,561 Right-of-use assets, net D - - 1,838,473 1,838,473 Derivative assets B 1,504,416 (239,552) - 1,264,864 Deferred tax assets 1,422,412 125,576 - 1,547,988 Other non-current assets B,C,D 1,751,738 (972,890) (127,249) 651,599 Total assets 141,916,082 (1,125,810) 1,460,868 142,251,140
Current liabilities Trade and other payables B 19,726,069 (13,142) - 19,712,927 Current portion of lease liabilities, net D 39,001 - 392,972 431,973 Derivative liabilities B 207,196 (76,832) - 130,364 Other current liabilities 177,238 (29,364) - 147,874 Liabilities of disposal groups classified as held-for-sale from discontinued operations
175,451 728 - 176,179 Non-current liabilities Lease liabilities, net 113,978 - 1,067,894 1,181,872 Deferred tax liabilities 4,359,699 (43,391) - 4,316,308 Derivative liabilities B 476,329 71,667 - 547,996 Other non-current liabilities B, C 2,891,670 (473,037) (17,266) 2,401,367 Total liabilities 95,422,038 (563,371) 1,443,600 96,302,267
Unappropriated retained earnings 29,547,602 (346,094) 16,881 29,218,389 Other components of equity A (7,604,709) (216,345) 387 (7,820,667)
Total equity 46,494,044 (562,439) 17,268 45,948,873
Note: A) The impact was from impairment of financial assets, refer to Note 5.1. B) The impact was from hedge accounting, refer to Note 5.1. C) The impact was from the classification and measurement of financial assets, refer to Note 5.1. D) The impact was from lease accounting, refer to Note 5.2. The Group adjusted the impact of first-time adoption of new financial reporting standards disclosed in the consolidated interim financial information during 2019. Total adjustments to the brought forward unappropriated retained earnings as at 1 January 2019 was Baht 223 million.
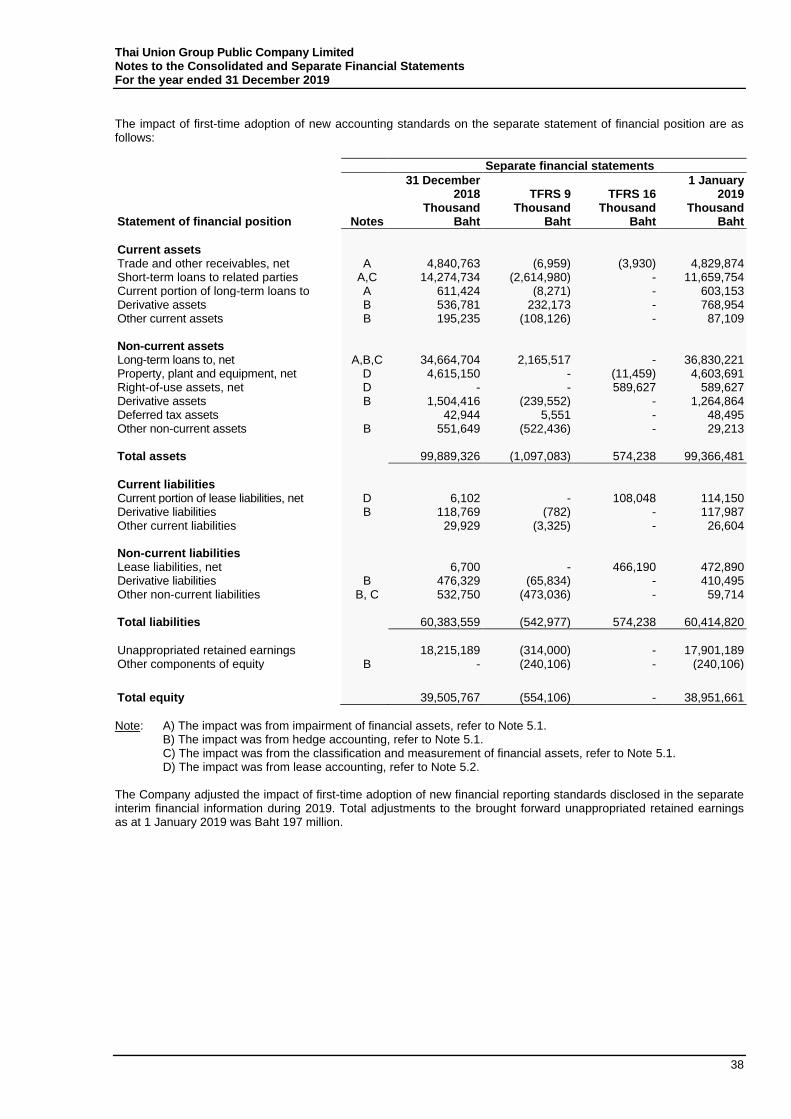
Thai Union Group Public Company Limited Notes to the Consolidated and Separate Financial Statements For the year ended 31 December 2019
38
The impact of first-time adoption of new accounting standards on the separate statement of financial position are as follows:
Separate financial statements
31 December
2018 TFRS 9 TFRS 16 1 January
2019
Statement of financial position Notes Thousand
Baht Thousand
Baht Thousand
Baht Thousand
Baht
Current assets Trade and other receivables, net A 4,840,763 (6,959) (3,930) 4,829,874 Short-term loans to related parties A,C 14,274,734 (2,614,980) - 11,659,754 Current portion of long-term loans to A 611,424 (8,271) - 603,153 Derivative assets B 536,781 232,173 - 768,954 Other current assets B 195,235 (108,126) - 87,109 Non-current assets Long-term loans to, net A,B,C 34,664,704 2,165,517 - 36,830,221 Property, plant and equipment, net D 4,615,150 - (11,459) 4,603,691 Right-of-use assets, net D - - 589,627 589,627 Derivative assets B 1,504,416 (239,552) - 1,264,864 Deferred tax assets 42,944 5,551 - 48,495 Other non-current assets B 551,649 (522,436) - 29,213 Total assets 99,889,326 (1,097,083) 574,238 99,366,481
Current liabilities Current portion of lease liabilities, net D 6,102 - 108,048 114,150 Derivative liabilities B 118,769 (782) - 117,987 Other current liabilities 29,929 (3,325) - 26,604 Non-current liabilities Lease liabilities, net 6,700 - 466,190 472,890 Derivative liabilities B 476,329 (65,834) - 410,495 Other non-current liabilities B, C 532,750 (473,036) - 59,714 Total liabilities 60,383,559 (542,977) 574,238 60,414,820
Unappropriated retained earnings 18,215,189 (314,000) - 17,901,189 Other components of equity B - (240,106) - (240,106)
Total equity
39,505,767 (554,106) - 38,951,661
Note: A) The impact was from impairment of financial assets, refer to Note 5.1. B) The impact was from hedge accounting, refer to Note 5.1. C) The impact was from the classification and measurement of financial assets, refer to Note 5.1. D) The impact was from lease accounting, refer to Note 5.2. The Company adjusted the impact of first-time adoption of new financial reporting standards disclosed in the separate interim financial information during 2019. Total adjustments to the brought forward unappropriated retained earnings as at 1 January 2019 was Baht 197 million.
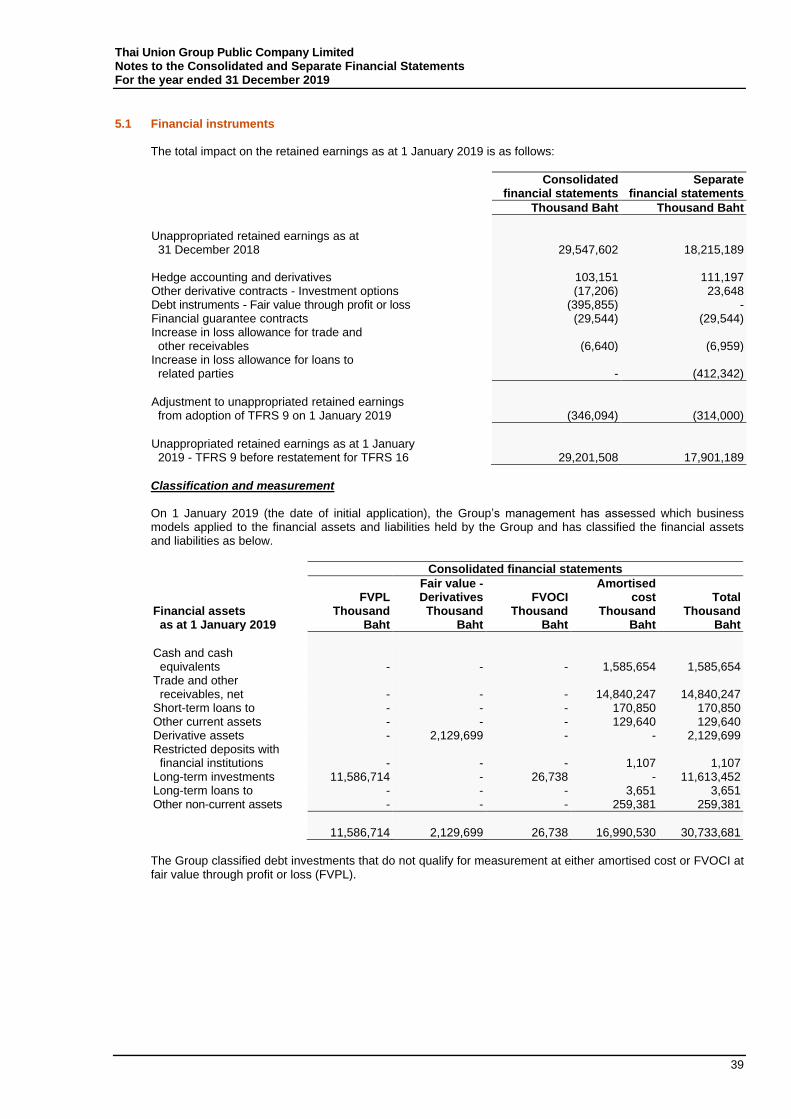
Thai Union Group Public Company Limited Notes to the Consolidated and Separate Financial Statements For the year ended 31 December 2019
39
5.1 Financial instruments
The total impact on the retained earnings as at 1 January 2019 is as follows:
Consolidated
financial statements Separate
financial statements
Thousand Baht Thousand Baht
Unappropriated retained earnings as at 31 December 2018 29,547,602 18,215,189 Hedge accounting and derivatives 103,151 111,197 Other derivative contracts - Investment options (17,206) 23,648 Debt instruments - Fair value through profit or loss (395,855) - Financial guarantee contracts (29,544) (29,544) Increase in loss allowance for trade and other receivables (6,640) (6,959) Increase in loss allowance for loans to related parties - (412,342)
Adjustment to unappropriated retained earnings from adoption of TFRS 9 on 1 January 2019 (346,094) (314,000)
Unappropriated retained earnings as at 1 January 2019 - TFRS 9 before restatement for TFRS 16 29,201,508 17,901,189
Classification and measurement On 1 January 2019 (the date of initial application), the Group’s management has assessed which business models applied to the financial assets and liabilities held by the Group and has classified the financial assets and liabilities as below.
Consolidated financial statements
FVPL Fair value - Derivatives FVOCI
Amortised cost Total
Financial assets as at 1 January 2019
Thousand Baht
Thousand Baht
Thousand Baht
Thousand Baht
Thousand Baht
Cash and cash equivalents -
- - 1,585,654 1,585,654
Trade and other receivables, net -
- - 14,840,247 14,840,247
Short-term loans to - - - 170,850 170,850 Other current assets - - - 129,640 129,640 Derivative assets - 2,129,699 - - 2,129,699 Restricted deposits with financial institutions -
- - 1,107 1,107
Long-term investments 11,586,714 - 26,738 - 11,613,452 Long-term loans to - - - 3,651 3,651 Other non-current assets - - - 259,381 259,381
11,586,714 2,129,699 26,738 16,990,530 30,733,681
The Group classified debt investments that do not qualify for measurement at either amortised cost or FVOCI at fair value through profit or loss (FVPL).
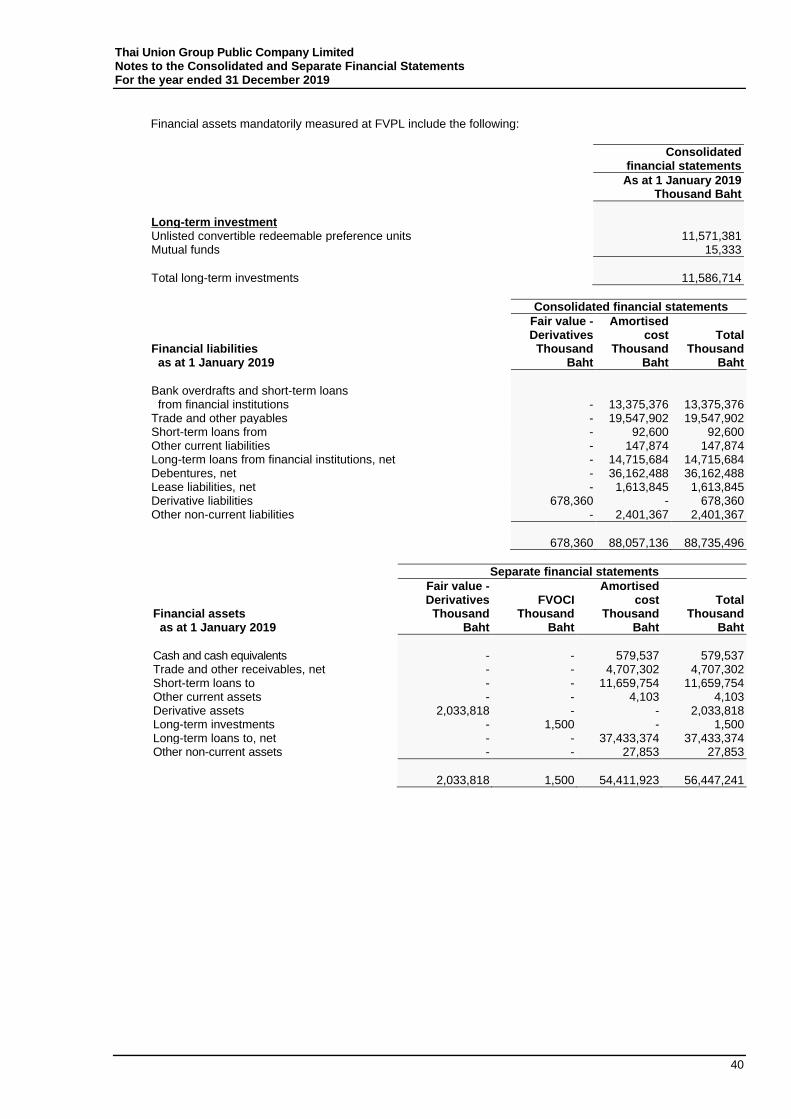
Thai Union Group Public Company Limited Notes to the Consolidated and Separate Financial Statements For the year ended 31 December 2019
40
Financial assets mandatorily measured at FVPL include the following:
Consolidated
financial statements
As at 1 January 2019 Thousand Baht
Long-term investment Unlisted convertible redeemable preference units 11,571,381 Mutual funds 15,333
Total long-term investments 11,586,714
Consolidated financial statements
Fair value - Derivatives
Amortised cost Total
Financial liabilities as at 1 January 2019
Thousand Baht
Thousand Baht
Thousand Baht
Bank overdrafts and short-term loans from financial institutions
- 13,375,376 13,375,376
Trade and other payables - 19,547,902 19,547,902 Short-term loans from - 92,600 92,600 Other current liabilities - 147,874 147,874 Long-term loans from financial institutions, net - 14,715,684 14,715,684 Debentures, net - 36,162,488 36,162,488 Lease liabilities, net - 1,613,845 1,613,845 Derivative liabilities 678,360 - 678,360 Other non-current liabilities - 2,401,367 2,401,367
678,360 88,057,136 88,735,496
Separate financial statements
Fair value - Derivatives FVOCI
Amortised cost Total
Financial assets as at 1 January 2019
Thousand Baht
Thousand Baht
Thousand Baht
Thousand Baht
Cash and cash equivalents - - 579,537 579,537 Trade and other receivables, net - - 4,707,302 4,707,302 Short-term loans to - - 11,659,754 11,659,754 Other current assets - - 4,103 4,103 Derivative assets 2,033,818 - - 2,033,818 Long-term investments - 1,500 - 1,500 Long-term loans to, net - - 37,433,374 37,433,374 Other non-current assets - - 27,853 27,853
2,033,818 1,500 54,411,923 56,447,241
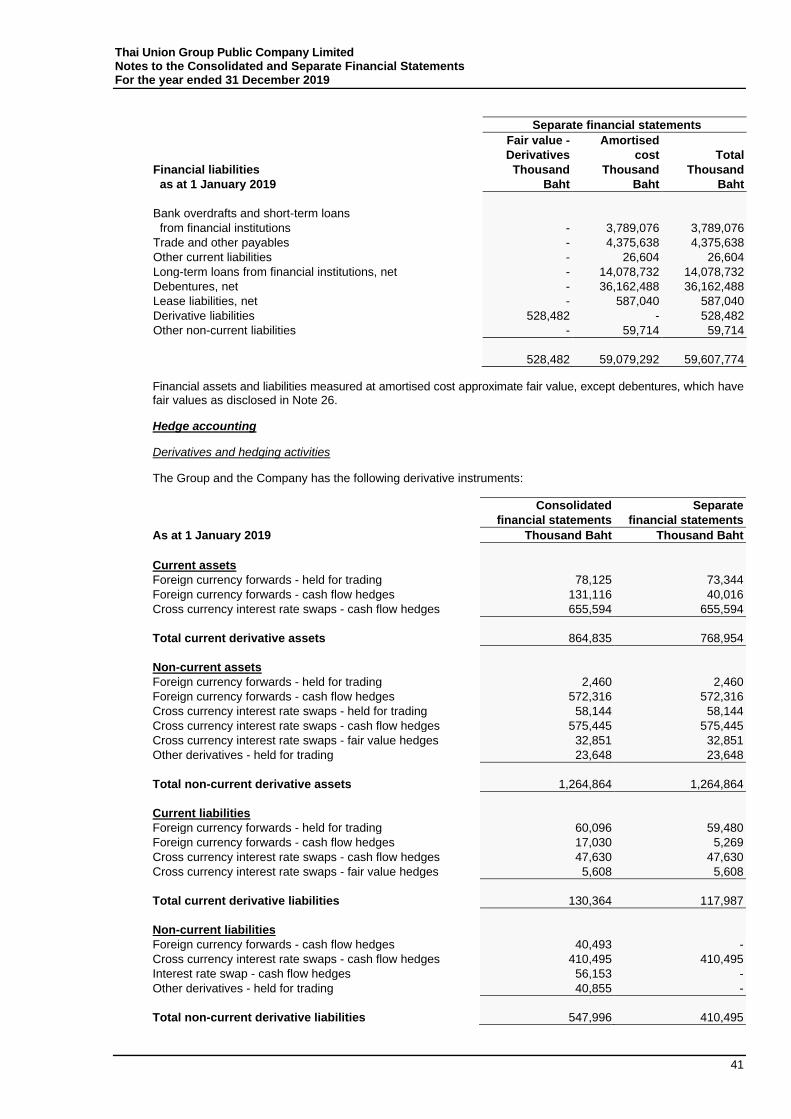
Thai Union Group Public Company Limited Notes to the Consolidated and Separate Financial Statements For the year ended 31 December 2019
41
Separate financial statements
Fair value -
Derivatives
Amortised
cost Total
Financial liabilities
as at 1 January 2019
Thousand
Baht
Thousand
Baht
Thousand
Baht
Bank overdrafts and short-term loans
from financial institutions
- 3,789,076 3,789,076
Trade and other payables - 4,375,638 4,375,638
Other current liabilities - 26,604 26,604
Long-term loans from financial institutions, net - 14,078,732 14,078,732
Debentures, net - 36,162,488 36,162,488
Lease liabilities, net - 587,040 587,040
Derivative liabilities 528,482 - 528,482
Other non-current liabilities - 59,714 59,714
528,482 59,079,292 59,607,774
Financial assets and liabilities measured at amortised cost approximate fair value, except debentures, which have fair values as disclosed in Note 26.
Hedge accounting
Derivatives and hedging activities
The Group and the Company has the following derivative instruments:
Consolidated
financial statements
Separate
financial statements
As at 1 January 2019 Thousand Baht Thousand Baht
Current assets
Foreign currency forwards - held for trading 78,125 73,344
Foreign currency forwards - cash flow hedges 131,116 40,016
Cross currency interest rate swaps - cash flow hedges 655,594 655,594
Total current derivative assets 864,835 768,954
Non-current assets
Foreign currency forwards - held for trading 2,460 2,460
Foreign currency forwards - cash flow hedges 572,316 572,316
Cross currency interest rate swaps - held for trading 58,144 58,144
Cross currency interest rate swaps - cash flow hedges 575,445 575,445
Cross currency interest rate swaps - fair value hedges 32,851 32,851
Other derivatives - held for trading 23,648 23,648
Total non-current derivative assets 1,264,864 1,264,864
Current liabilities
Foreign currency forwards - held for trading 60,096 59,480
Foreign currency forwards - cash flow hedges 17,030 5,269
Cross currency interest rate swaps - cash flow hedges 47,630 47,630
Cross currency interest rate swaps - fair value hedges 5,608 5,608
Total current derivative liabilities 130,364 117,987
Non-current liabilities
Foreign currency forwards - cash flow hedges 40,493 -
Cross currency interest rate swaps - cash flow hedges 410,495 410,495
Interest rate swap - cash flow hedges 56,153 -
Other derivatives - held for trading 40,855 -
Total non-current derivative liabilities 547,996 410,495
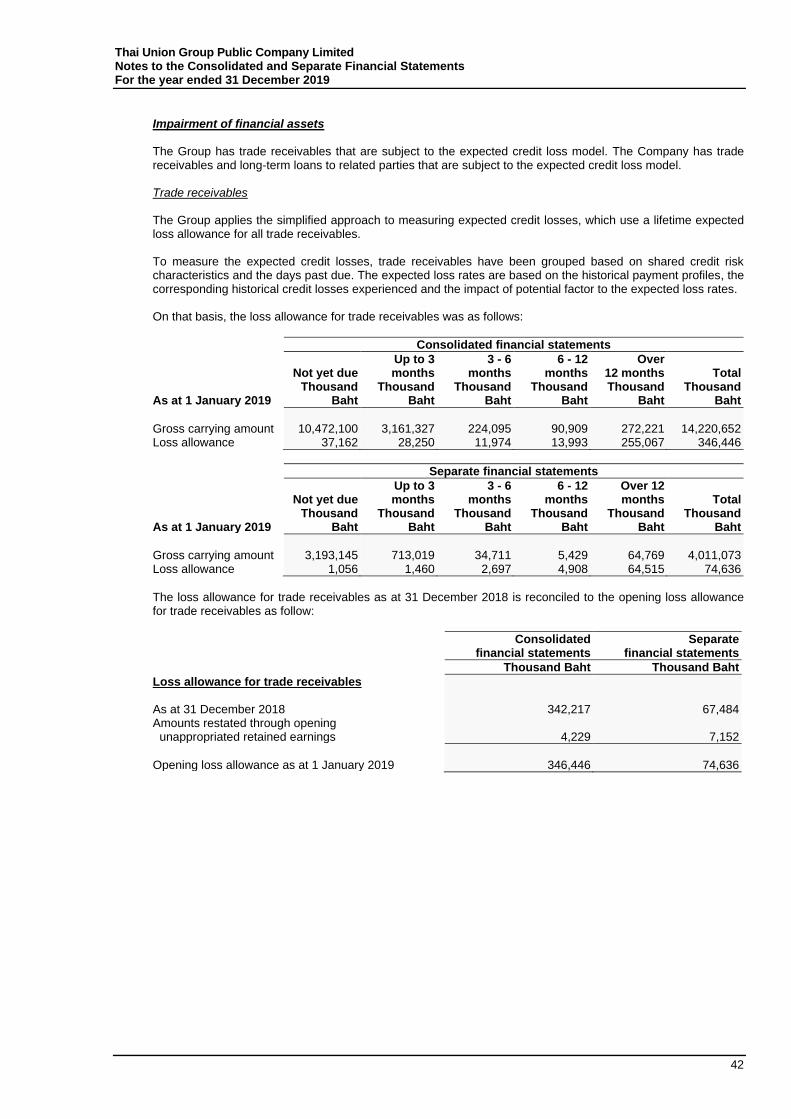
Thai Union Group Public Company Limited Notes to the Consolidated and Separate Financial Statements For the year ended 31 December 2019
42
Impairment of financial assets The Group has trade receivables that are subject to the expected credit loss model. The Company has trade receivables and long-term loans to related parties that are subject to the expected credit loss model. Trade receivables The Group applies the simplified approach to measuring expected credit losses, which use a lifetime expected loss allowance for all trade receivables. To measure the expected credit losses, trade receivables have been grouped based on shared credit risk characteristics and the days past due. The expected loss rates are based on the historical payment profiles, the corresponding historical credit losses experienced and the impact of potential factor to the expected loss rates. On that basis, the loss allowance for trade receivables was as follows:
Consolidated financial statements
As at 1 January 2019
Not yet due Thousand
Baht
Up to 3 months
Thousand Baht
3 - 6 months
Thousand Baht
6 - 12 months
Thousand Baht
Over 12 months Thousand
Baht
Total Thousand
Baht
Gross carrying amount 10,472,100 3,161,327 224,095 90,909 272,221 14,220,652 Loss allowance 37,162 28,250 11,974 13,993 255,067 346,446
Separate financial statements
As at 1 January 2019
Not yet due Thousand
Baht
Up to 3 months
Thousand Baht
3 - 6 months
Thousand Baht
6 - 12 months
Thousand Baht
Over 12 months
Thousand Baht
Total Thousand
Baht
Gross carrying amount 3,193,145 713,019 34,711 5,429 64,769 4,011,073 Loss allowance 1,056 1,460 2,697 4,908 64,515 74,636
The loss allowance for trade receivables as at 31 December 2018 is reconciled to the opening loss allowance for trade receivables as follow:
Consolidated
financial statements Separate
financial statements
Thousand Baht Thousand Baht
Loss allowance for trade receivables As at 31 December 2018 342,217 67,484 Amounts restated through opening unappropriated retained earnings 4,229 7,152
Opening loss allowance as at 1 January 2019 346,446 74,636
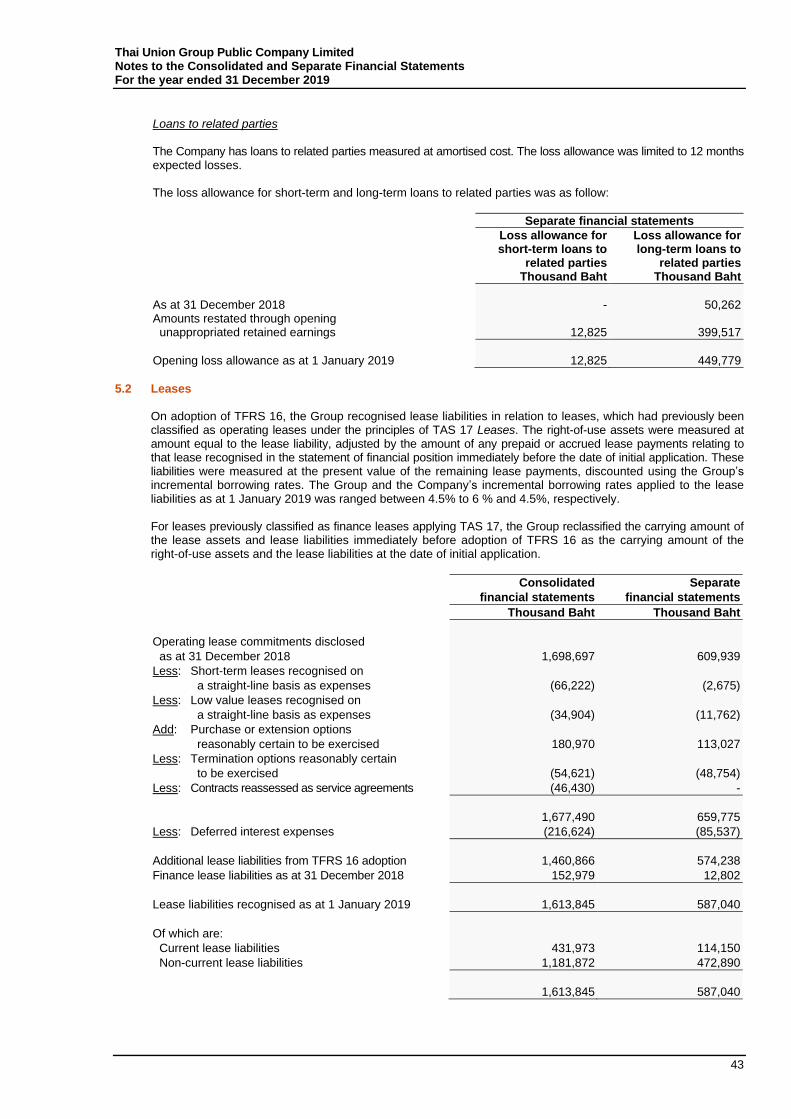
Thai Union Group Public Company Limited Notes to the Consolidated and Separate Financial Statements For the year ended 31 December 2019
43
Loans to related parties The Company has loans to related parties measured at amortised cost. The loss allowance was limited to 12 months expected losses. The loss allowance for short-term and long-term loans to related parties was as follow:
Separate financial statements
Loss allowance for short-term loans to
related parties
Loss allowance for long-term loans to
related parties Thousand Baht Thousand Baht
As at 31 December 2018 - 50,262 Amounts restated through opening unappropriated retained earnings 12,825 399,517
Opening loss allowance as at 1 January 2019 12,825 449,779
5.2 Leases
On adoption of TFRS 16, the Group recognised lease liabilities in relation to leases, which had previously been classified as operating leases under the principles of TAS 17 Leases. The right-of-use assets were measured at amount equal to the lease liability, adjusted by the amount of any prepaid or accrued lease payments relating to that lease recognised in the statement of financial position immediately before the date of initial application. These liabilities were measured at the present value of the remaining lease payments, discounted using the Group’s incremental borrowing rates. The Group and the Company’s incremental borrowing rates applied to the lease liabilities as at 1 January 2019 was ranged between 4.5% to 6 % and 4.5%, respectively. For leases previously classified as finance leases applying TAS 17, the Group reclassified the carrying amount of the lease assets and lease liabilities immediately before adoption of TFRS 16 as the carrying amount of the right-of-use assets and the lease liabilities at the date of initial application.
Consolidated
financial statements
Separate
financial statements
Thousand Baht Thousand Baht
Operating lease commitments disclosed
as at 31 December 2018 1,698,697 609,939
Less: Short-term leases recognised on
a straight-line basis as expenses (66,222) (2,675)
Less: Low value leases recognised on
a straight-line basis as expenses (34,904) (11,762)
Add: Purchase or extension options
reasonably certain to be exercised 180,970
113,027
Less: Termination options reasonably certain
to be exercised (54,621) (48,754)
Less: Contracts reassessed as service agreements (46,430) -
1,677,490 659,775
Less: Deferred interest expenses (216,624) (85,537)
Additional lease liabilities from TFRS 16 adoption 1,460,866 574,238
Finance lease liabilities as at 31 December 2018 152,979 12,802
Lease liabilities recognised as at 1 January 2019 1,613,845 587,040
Of which are:
Current lease liabilities 431,973 114,150
Non-current lease liabilities 1,181,872 472,890
1,613,845 587,040
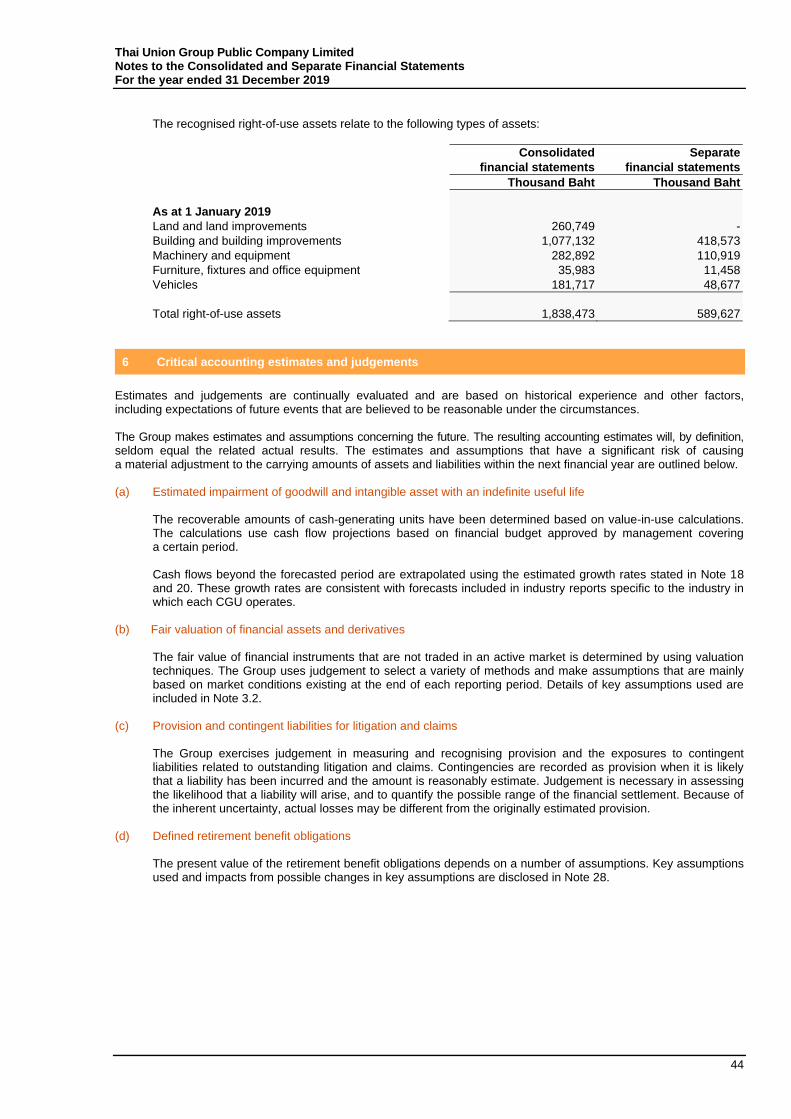
Thai Union Group Public Company Limited Notes to the Consolidated and Separate Financial Statements For the year ended 31 December 2019
44
The recognised right-of-use assets relate to the following types of assets:
Consolidated
financial statements
Separate
financial statements
Thousand Baht Thousand Baht
As at 1 January 2019
Land and land improvements 260,749 -
Building and building improvements 1,077,132 418,573
Machinery and equipment 282,892 110,919
Furniture, fixtures and office equipment 35,983 11,458
Vehicles 181,717 48,677
Total right-of-use assets 1,838,473 589,627
6 Critical accounting estimates and judgements
Estimates and judgements are continually evaluated and are based on historical experience and other factors, including expectations of future events that are believed to be reasonable under the circumstances. The Group makes estimates and assumptions concerning the future. The resulting accounting estimates will, by definition, seldom equal the related actual results. The estimates and assumptions that have a significant risk of causing a material adjustment to the carrying amounts of assets and liabilities within the next financial year are outlined below. (a) Estimated impairment of goodwill and intangible asset with an indefinite useful life
The recoverable amounts of cash-generating units have been determined based on value-in-use calculations. The calculations use cash flow projections based on financial budget approved by management covering a certain period. Cash flows beyond the forecasted period are extrapolated using the estimated growth rates stated in Note 18 and 20. These growth rates are consistent with forecasts included in industry reports specific to the industry in which each CGU operates.
(b) Fair valuation of financial assets and derivatives The fair value of financial instruments that are not traded in an active market is determined by using valuation techniques. The Group uses judgement to select a variety of methods and make assumptions that are mainly based on market conditions existing at the end of each reporting period. Details of key assumptions used are included in Note 3.2.
(c) Provision and contingent liabilities for litigation and claims
The Group exercises judgement in measuring and recognising provision and the exposures to contingent liabilities related to outstanding litigation and claims. Contingencies are recorded as provision when it is likely that a liability has been incurred and the amount is reasonably estimate. Judgement is necessary in assessing the likelihood that a liability will arise, and to quantify the possible range of the financial settlement. Because of the inherent uncertainty, actual losses may be different from the originally estimated provision.
(d) Defined retirement benefit obligations
The present value of the retirement benefit obligations depends on a number of assumptions. Key assumptions used and impacts from possible changes in key assumptions are disclosed in Note 28.

Thai Union Group Public Company Limited Notes to the Consolidated and Separate Financial Statements For the year ended 31 December 2019
45
7 Segment and revenue information
The Global Leadership Team (“GLT”) is the Group’s chief operating decision maker. Management has determined the operating segments based on the information reviewed by the GLT for the purposes of allocating resources and assessing performance. For management purposes, the Group organises business units based on its products and services and has three reportable segments as follows:
• Ambient seafood
• Frozen and chilled seafood and related businesses
• Pet food, value-added and other businesses The chief operating decision maker monitors the operating results of the business units separately for the purpose of making decisions about resource allocation and assessing performance. The Group measures segment performance based on gross profit, which is a consistent basis with that used to measure gross profit in the financial statements. Transactions between operating segments are recorded in a manner similar to transactions with third parties. These transactions are eliminated for the consolidated financial statements. The following tables present revenue and gross profit information regarding the Group’s operating segments.
Consolidated financial statements
Frozen and chilled Pet food, seafood value-added Total Ambient and related and other reportable seafood businesses businesses segments Eliminations Total For the year ended Thousand Thousand Thousand Thousand Thousand Thousand 31 December 2019 Baht Baht Baht Baht Baht Baht
Total revenue 74,428,084 60,501,232 24,514,866 159,444,182 (33,168,935) 126,275,247
Less: Inter-segment (19,207,134) (8,077,269) (5,884,532) (33,168,935) 33,168,935 -
Revenue from external customers 55,220,950 52,423,963 18,630,334 126,275,247 - 126,275,247
Results
Segment gross profit 10,807,834 5,390,790 4,022,629 20,221,253 (111,154) 20,110,099
Selling and administrative expenses (16,265,523)
Operating profit (not including other income) 3,844,576 Finance costs (2,055,567) Share of profits from investments in associates and joint ventures 591,288 Gain on exchange rates, net 54,061 Others 1,993,679
Profit before income tax 4,428,037 Income tax (157,937)
Profit for the year from continuing operations 4,270,100
Loss for the year from discontinued operations - (105,257) 2,809 - - (102,448)
Profit for the year 4,167,652
Timing of revenue recognition
At a point in time 55,220,950 52,423,963 18,630,334 126,275,247 - 126,275,247
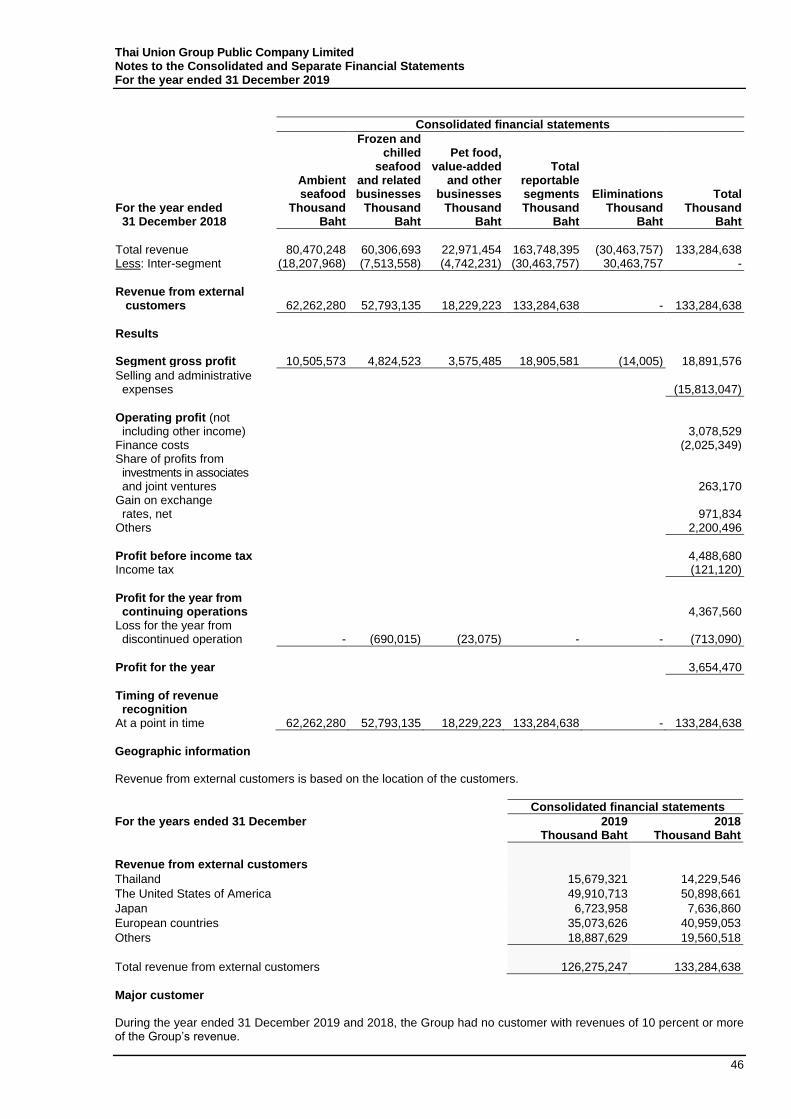
Thai Union Group Public Company Limited Notes to the Consolidated and Separate Financial Statements For the year ended 31 December 2019
46
Consolidated financial statements
Frozen and chilled Pet food, seafood value-added Total Ambient and related and other reportable seafood businesses businesses segments Eliminations Total For the year ended Thousand Thousand Thousand Thousand Thousand Thousand 31 December 2018 Baht Baht Baht Baht Baht Baht
Total revenue 80,470,248 60,306,693 22,971,454 163,748,395 (30,463,757) 133,284,638 Less: Inter-segment (18,207,968) (7,513,558) (4,742,231) (30,463,757) 30,463,757 -
Revenue from external customers 62,262,280 52,793,135 18,229,223 133,284,638 - 133,284,638
Results Segment gross profit 10,505,573 4,824,523 3,575,485 18,905,581 (14,005) 18,891,576
Selling and administrative expenses (15,813,047)
Operating profit (not including other income) 3,078,529 Finance costs (2,025,349) Share of profits from investments in associates and joint ventures 263,170 Gain on exchange rates, net 971,834 Others 2,200,496
Profit before income tax 4,488,680 Income tax (121,120)
Profit for the year from continuing operations 4,367,560 Loss for the year from discontinued operation - (690,015) (23,075) - - (713,090)
Profit for the year 3,654,470
Timing of revenue recognition At a point in time 62,262,280 52,793,135 18,229,223 133,284,638 - 133,284,638
Geographic information Revenue from external customers is based on the location of the customers.
Consolidated financial statements
For the years ended 31 December 2019 2018 Thousand Baht Thousand Baht
Revenue from external customers
Thailand 15,679,321 14,229,546
The United States of America 49,910,713 50,898,661
Japan 6,723,958 7,636,860
European countries 35,073,626 40,959,053
Others 18,887,629 19,560,518
Total revenue from external customers 126,275,247 133,284,638
Major customer During the year ended 31 December 2019 and 2018, the Group had no customer with revenues of 10 percent or more of the Group’s revenue.
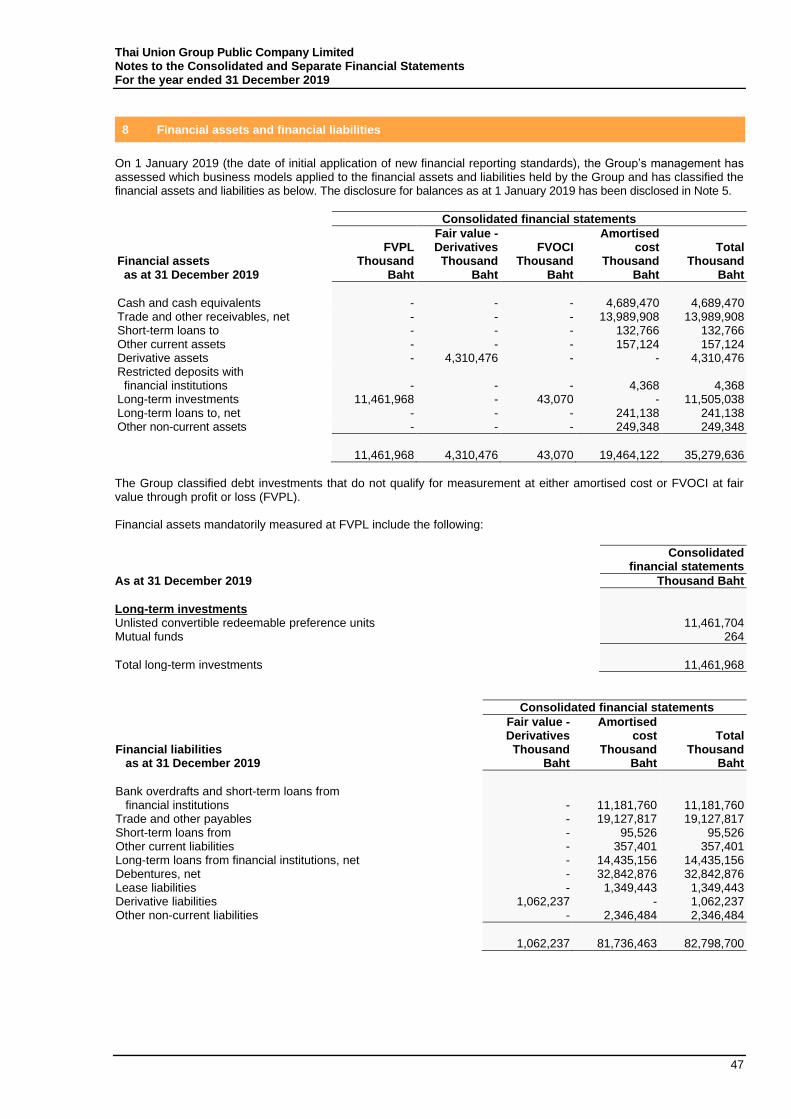
Thai Union Group Public Company Limited Notes to the Consolidated and Separate Financial Statements For the year ended 31 December 2019
47
8 Financial assets and financial liabilities
On 1 January 2019 (the date of initial application of new financial reporting standards), the Group’s management has assessed which business models applied to the financial assets and liabilities held by the Group and has classified the financial assets and liabilities as below. The disclosure for balances as at 1 January 2019 has been disclosed in Note 5.
Consolidated financial statements
FVPL Fair value - Derivatives FVOCI
Amortised cost Total
Financial assets as at 31 December 2019
Thousand Baht
Thousand Baht
Thousand Baht
Thousand Baht
Thousand Baht
Cash and cash equivalents - - - 4,689,470 4,689,470 Trade and other receivables, net - - - 13,989,908 13,989,908 Short-term loans to - - - 132,766 132,766 Other current assets - - - 157,124 157,124 Derivative assets - 4,310,476 - - 4,310,476 Restricted deposits with financial institutions - - - 4,368 4,368 Long-term investments 11,461,968 - 43,070 - 11,505,038 Long-term loans to, net - - - 241,138 241,138 Other non-current assets - - - 249,348 249,348
11,461,968 4,310,476 43,070 19,464,122 35,279,636
The Group classified debt investments that do not qualify for measurement at either amortised cost or FVOCI at fair value through profit or loss (FVPL). Financial assets mandatorily measured at FVPL include the following:
Consolidated
financial statements
As at 31 December 2019 Thousand Baht
Long-term investments Unlisted convertible redeemable preference units 11,461,704 Mutual funds 264
Total long-term investments 11,461,968
Consolidated financial statements
Fair value - Derivatives
Amortised cost Total
Financial liabilities as at 31 December 2019
Thousand Baht
Thousand Baht
Thousand Baht
Bank overdrafts and short-term loans from financial institutions - 11,181,760 11,181,760 Trade and other payables - 19,127,817 19,127,817 Short-term loans from - 95,526 95,526 Other current liabilities - 357,401 357,401 Long-term loans from financial institutions, net - 14,435,156 14,435,156 Debentures, net - 32,842,876 32,842,876 Lease liabilities - 1,349,443 1,349,443 Derivative liabilities 1,062,237 - 1,062,237 Other non-current liabilities - 2,346,484 2,346,484
1,062,237 81,736,463 82,798,700
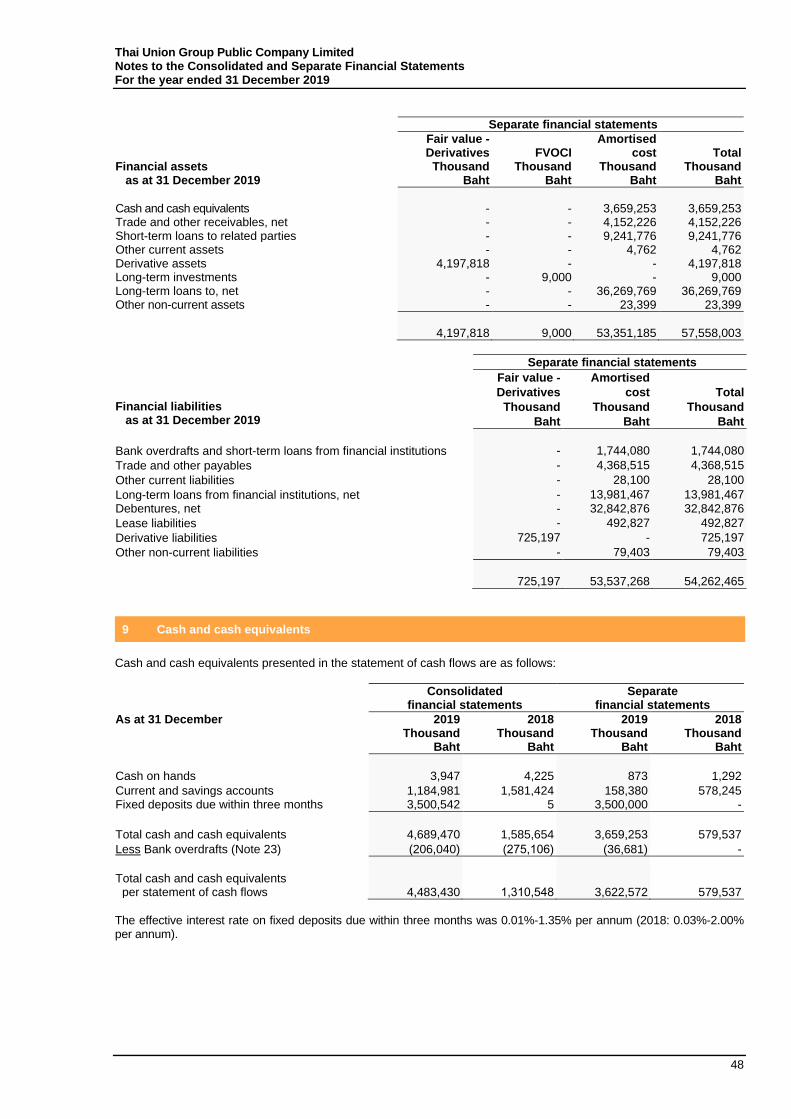
Thai Union Group Public Company Limited Notes to the Consolidated and Separate Financial Statements For the year ended 31 December 2019
48
Separate financial statements
Fair value - Derivatives FVOCI
Amortised cost Total
Financial assets as at 31 December 2019
Thousand Baht
Thousand Baht
Thousand Baht
Thousand Baht
Cash and cash equivalents - - 3,659,253 3,659,253 Trade and other receivables, net - - 4,152,226 4,152,226 Short-term loans to related parties - - 9,241,776 9,241,776 Other current assets - - 4,762 4,762 Derivative assets 4,197,818 - - 4,197,818 Long-term investments - 9,000 - 9,000 Long-term loans to, net - - 36,269,769 36,269,769 Other non-current assets - - 23,399 23,399
4,197,818 9,000 53,351,185 57,558,003
Separate financial statements
Fair value -
Derivatives
Amortised
cost Total
Financial liabilities as at 31 December 2019
Thousand
Baht
Thousand
Baht
Thousand
Baht
Bank overdrafts and short-term loans from financial institutions - 1,744,080 1,744,080
Trade and other payables - 4,368,515 4,368,515
Other current liabilities - 28,100 28,100
Long-term loans from financial institutions, net - 13,981,467 13,981,467
Debentures, net - 32,842,876 32,842,876
Lease liabilities - 492,827 492,827
Derivative liabilities 725,197 - 725,197
Other non-current liabilities - 79,403 79,403
725,197 53,537,268 54,262,465
9 Cash and cash equivalents
Cash and cash equivalents presented in the statement of cash flows are as follows:
Consolidated financial statements
Separate financial statements
As at 31 December 2019 2018 2019 2018 Thousand Thousand Thousand Thousand Baht Baht Baht Baht
Cash on hands 3,947 4,225 873 1,292
Current and savings accounts 1,184,981 1,581,424 158,380 578,245 Fixed deposits due within three months 3,500,542 5 3,500,000 -
Total cash and cash equivalents 4,689,470 1,585,654 3,659,253 579,537
Less Bank overdrafts (Note 23) (206,040) (275,106) (36,681) -
Total cash and cash equivalents per statement of cash flows 4,483,430 1,310,548 3,622,572 579,537
The effective interest rate on fixed deposits due within three months was 0.01%-1.35% per annum (2018: 0.03%-2.00% per annum).
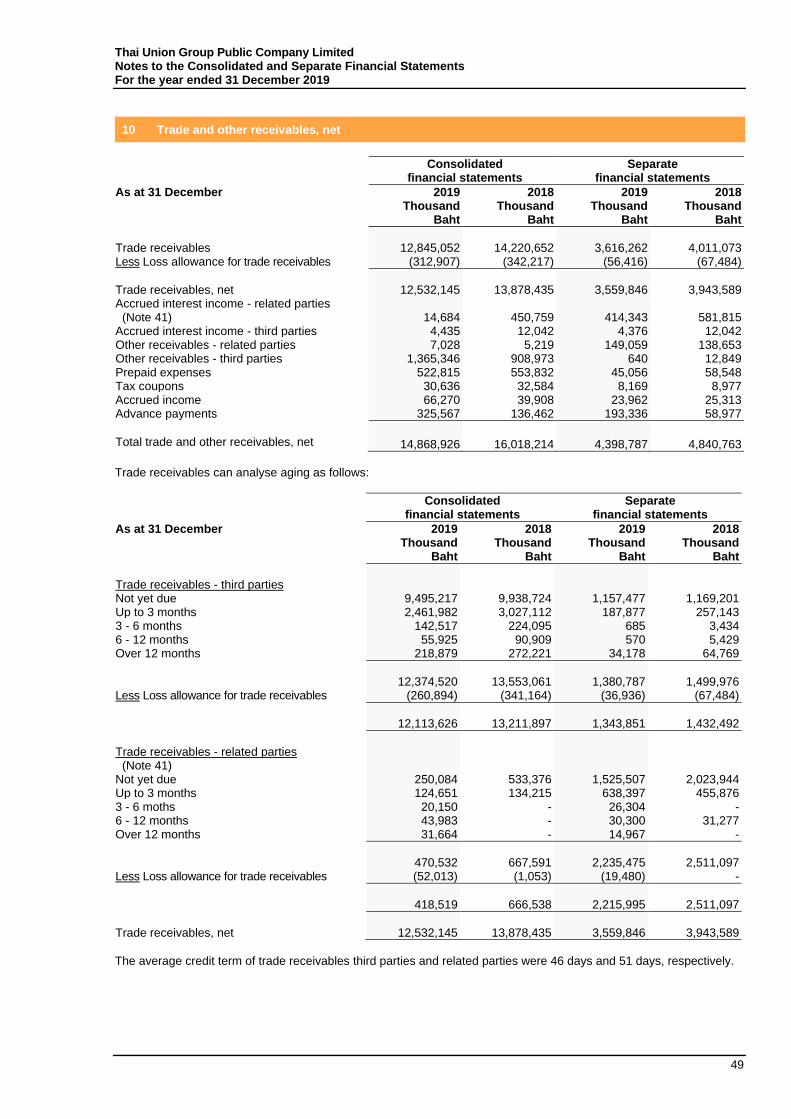
Thai Union Group Public Company Limited Notes to the Consolidated and Separate Financial Statements For the year ended 31 December 2019
49
10 Trade and other receivables, net
Consolidated financial statements
Separate financial statements
As at 31 December 2019 2018 2019 2018 Thousand Thousand Thousand Thousand Baht Baht Baht Baht
Trade receivables 12,845,052 14,220,652 3,616,262 4,011,073 Less Loss allowance for trade receivables (312,907) (342,217) (56,416) (67,484)
Trade receivables, net 12,532,145 13,878,435 3,559,846 3,943,589 Accrued interest income - related parties (Note 41) 14,684 450,759 414,343 581,815 Accrued interest income - third parties 4,435 12,042 4,376 12,042 Other receivables - related parties 7,028 5,219 149,059 138,653 Other receivables - third parties 1,365,346 908,973 640 12,849 Prepaid expenses 522,815 553,832 45,056 58,548 Tax coupons 30,636 32,584 8,169 8,977 Accrued income 66,270 39,908 23,962 25,313 Advance payments 325,567 136,462 193,336 58,977
Total trade and other receivables, net 14,868,926 16,018,214 4,398,787 4,840,763
Trade receivables can analyse aging as follows:
Consolidated financial statements
Separate financial statements
As at 31 December 2019 2018 2019 2018 Thousand Thousand Thousand Thousand Baht Baht Baht Baht
Trade receivables - third parties Not yet due 9,495,217 9,938,724 1,157,477 1,169,201 Up to 3 months 2,461,982 3,027,112 187,877 257,143 3 - 6 months 142,517 224,095 685 3,434 6 - 12 months 55,925 90,909 570 5,429 Over 12 months 218,879 272,221 34,178 64,769
12,374,520 13,553,061 1,380,787 1,499,976 Less Loss allowance for trade receivables (260,894) (341,164) (36,936) (67,484)
12,113,626 13,211,897 1,343,851 1,432,492
Trade receivables - related parties (Note 41) Not yet due 250,084 533,376 1,525,507 2,023,944 Up to 3 months 124,651 134,215 638,397 455,876 3 - 6 moths 20,150 - 26,304 - 6 - 12 months 43,983 - 30,300 31,277 Over 12 months 31,664 - 14,967 -
470,532 667,591 2,235,475 2,511,097 Less Loss allowance for trade receivables (52,013) (1,053) (19,480) -
418,519 666,538 2,215,995 2,511,097
Trade receivables, net 12,532,145 13,878,435 3,559,846 3,943,589
The average credit term of trade receivables third parties and related parties were 46 days and 51 days, respectively.
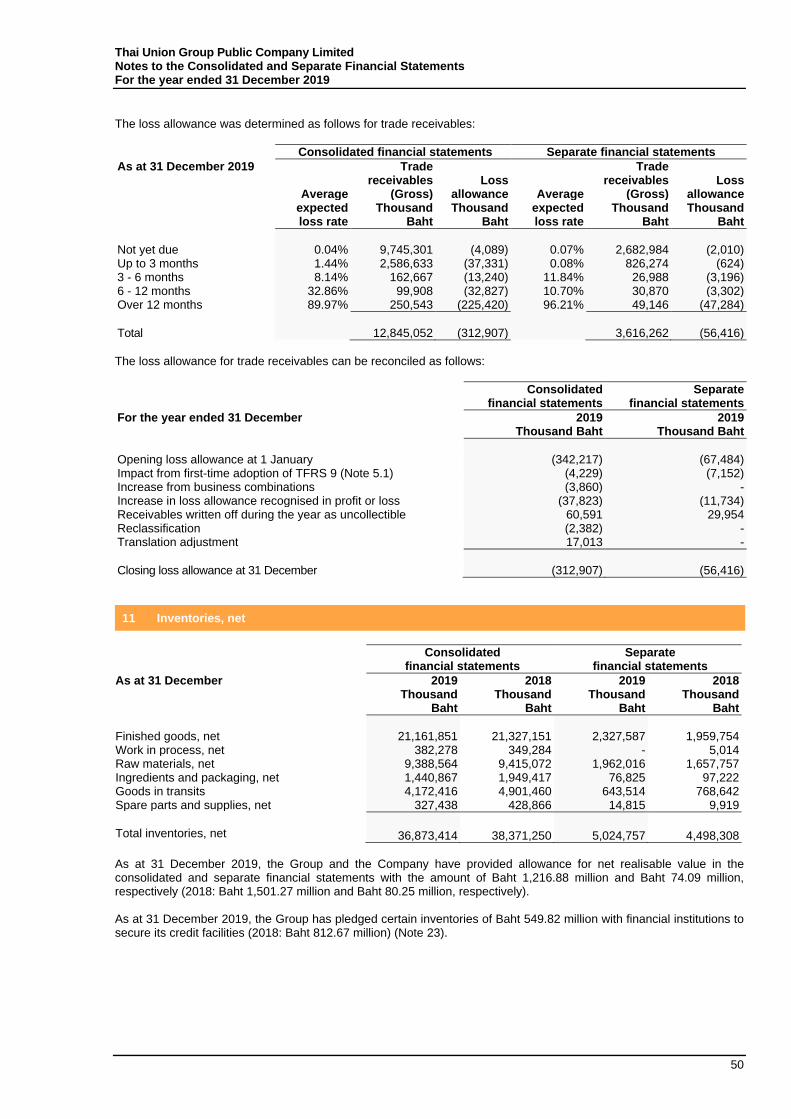
Thai Union Group Public Company Limited Notes to the Consolidated and Separate Financial Statements For the year ended 31 December 2019
50
The loss allowance was determined as follows for trade receivables:
Consolidated financial statements Separate financial statements
As at 31 December 2019
Average
Trade receivables
(Gross) Loss
allowance Average
Trade receivables
(Gross) Loss
allowance expected
loss rate Thousand
Baht Thousand
Baht expected loss rate
Thousand Baht
Thousand Baht
Not yet due 0.04% 9,745,301 (4,089) 0.07% 2,682,984 (2,010) Up to 3 months 1.44% 2,586,633 (37,331) 0.08% 826,274 (624) 3 - 6 months 8.14% 162,667 (13,240) 11.84% 26,988 (3,196) 6 - 12 months 32.86% 99,908 (32,827) 10.70% 30,870 (3,302) Over 12 months 89.97% 250,543 (225,420) 96.21% 49,146 (47,284)
Total 12,845,052 (312,907) 3,616,262 (56,416)
The loss allowance for trade receivables can be reconciled as follows:
Consolidated financial statements
Separate financial statements
For the year ended 31 December 2019 2019 Thousand Baht Thousand Baht
Opening loss allowance at 1 January (342,217) (67,484) Impact from first-time adoption of TFRS 9 (Note 5.1) (4,229) (7,152) Increase from business combinations (3,860) - Increase in loss allowance recognised in profit or loss (37,823) (11,734) Receivables written off during the year as uncollectible 60,591 29,954 Reclassification (2,382) - Translation adjustment 17,013 -
Closing loss allowance at 31 December (312,907) (56,416)
11 Inventories, net
Consolidated financial statements
Separate financial statements
As at 31 December 2019 2018 2019 2018 Thousand Thousand Thousand Thousand Baht Baht Baht Baht
Finished goods, net 21,161,851 21,327,151 2,327,587 1,959,754 Work in process, net 382,278 349,284 - 5,014 Raw materials, net 9,388,564 9,415,072 1,962,016 1,657,757 Ingredients and packaging, net 1,440,867 1,949,417 76,825 97,222 Goods in transits 4,172,416 4,901,460 643,514 768,642 Spare parts and supplies, net 327,438 428,866 14,815 9,919
Total inventories, net 36,873,414 38,371,250 5,024,757 4,498,308
As at 31 December 2019, the Group and the Company have provided allowance for net realisable value in the consolidated and separate financial statements with the amount of Baht 1,216.88 million and Baht 74.09 million, respectively (2018: Baht 1,501.27 million and Baht 80.25 million, respectively). As at 31 December 2019, the Group has pledged certain inventories of Baht 549.82 million with financial institutions to secure its credit facilities (2018: Baht 812.67 million) (Note 23).
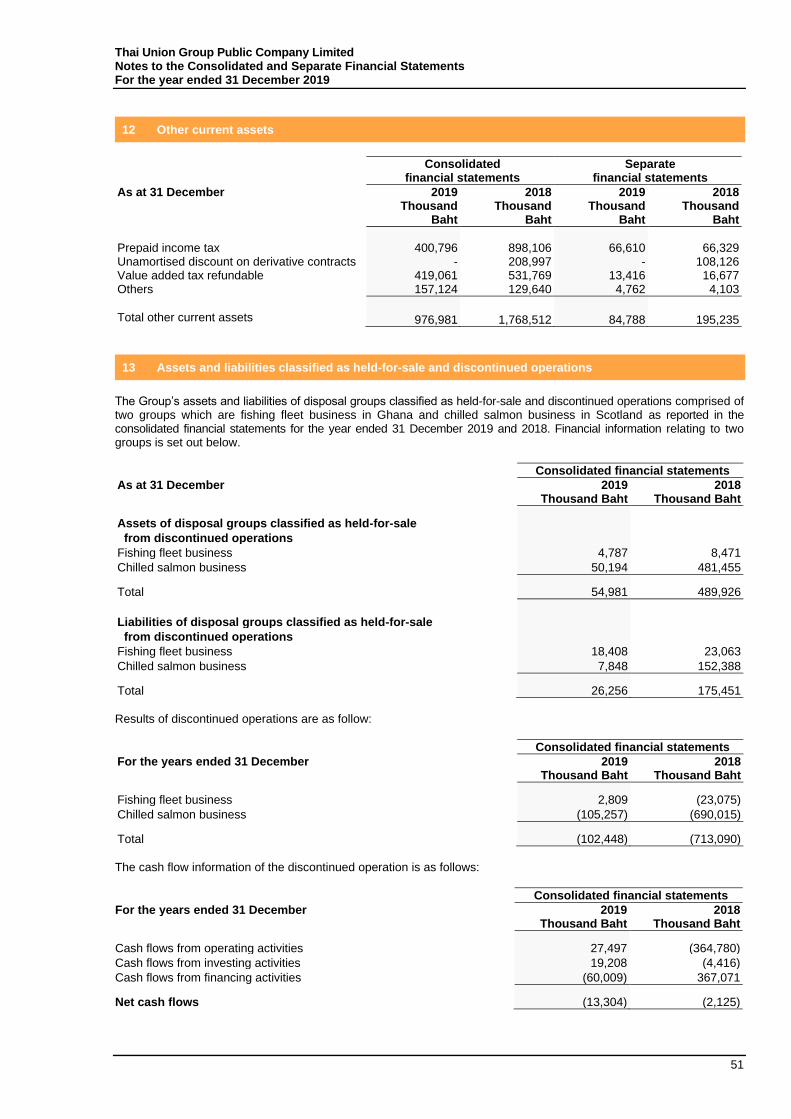
Thai Union Group Public Company Limited Notes to the Consolidated and Separate Financial Statements For the year ended 31 December 2019
51
12 Other current assets
Consolidated financial statements
Separate financial statements
As at 31 December 2019 2018 2019 2018 Thousand Thousand Thousand Thousand Baht Baht Baht Baht
Prepaid income tax 400,796 898,106 66,610 66,329 Unamortised discount on derivative contracts - 208,997 - 108,126 Value added tax refundable 419,061 531,769 13,416 16,677 Others 157,124 129,640 4,762 4,103
Total other current assets 976,981 1,768,512 84,788 195,235
13 Assets and liabilities classified as held-for-sale and discontinued operations
The Group’s assets and liabilities of disposal groups classified as held-for-sale and discontinued operations comprised of two groups which are fishing fleet business in Ghana and chilled salmon business in Scotland as reported in the consolidated financial statements for the year ended 31 December 2019 and 2018. Financial information relating to two groups is set out below.
Consolidated financial statements
As at 31 December 2019 2018 Thousand Baht Thousand Baht
Assets of disposal groups classified as held-for-sale
from discontinued operations
Fishing fleet business 4,787 8,471
Chilled salmon business 50,194 481,455
Total 54,981 489,926
Liabilities of disposal groups classified as held-for-sale
from discontinued operations
Fishing fleet business 18,408 23,063
Chilled salmon business 7,848 152,388
Total 26,256 175,451
Results of discontinued operations are as follow:
Consolidated financial statements
For the years ended 31 December 2019 2018 Thousand Baht Thousand Baht
Fishing fleet business 2,809 (23,075)
Chilled salmon business (105,257) (690,015)
Total (102,448) (713,090)
The cash flow information of the discontinued operation is as follows:
Consolidated financial statements
For the years ended 31 December 2019 2018 Thousand Baht Thousand Baht
Cash flows from operating activities 27,497 (364,780)
Cash flows from investing activities 19,208 (4,416)
Cash flows from financing activities (60,009) 367,071
Net cash flows (13,304) (2,125)
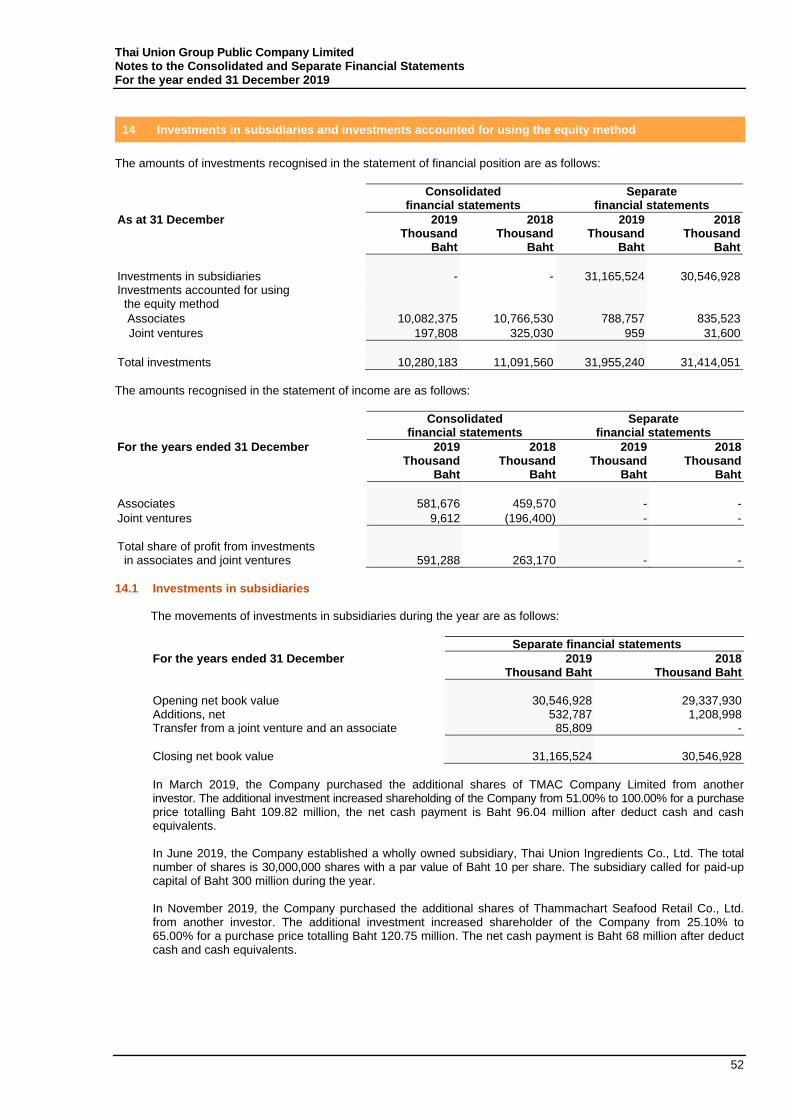
Thai Union Group Public Company Limited Notes to the Consolidated and Separate Financial Statements For the year ended 31 December 2019
52
14 Investments in subsidiaries and investments accounted for using the equity method
The amounts of investments recognised in the statement of financial position are as follows:
Consolidated financial statements
Separate financial statements
As at 31 December 2019 2018 2019 2018 Thousand Thousand Thousand Thousand Baht Baht Baht Baht
Investments in subsidiaries - - 31,165,524 30,546,928 Investments accounted for using the equity method
Associates 10,082,375 10,766,530 788,757 835,523
Joint ventures 197,808 325,030 959 31,600
Total investments 10,280,183 11,091,560 31,955,240 31,414,051
The amounts recognised in the statement of income are as follows:
Consolidated financial statements
Separate financial statements
For the years ended 31 December 2019 2018 2019 2018 Thousand Thousand Thousand Thousand Baht Baht Baht Baht
Associates 581,676 459,570 - -
Joint ventures 9,612 (196,400) - -
Total share of profit from investments in associates and joint ventures 591,288 263,170 - -
14.1 Investments in subsidiaries
The movements of investments in subsidiaries during the year are as follows:
Separate financial statements
For the years ended 31 December 2019 2018 Thousand Baht Thousand Baht
Opening net book value 30,546,928 29,337,930 Additions, net 532,787 1,208,998 Transfer from a joint venture and an associate 85,809 -
Closing net book value 31,165,524 30,546,928
In March 2019, the Company purchased the additional shares of TMAC Company Limited from another investor. The additional investment increased shareholding of the Company from 51.00% to 100.00% for a purchase price totalling Baht 109.82 million, the net cash payment is Baht 96.04 million after deduct cash and cash equivalents. In June 2019, the Company established a wholly owned subsidiary, Thai Union Ingredients Co., Ltd. The total number of shares is 30,000,000 shares with a par value of Baht 10 per share. The subsidiary called for paid-up capital of Baht 300 million during the year. In November 2019, the Company purchased the additional shares of Thammachart Seafood Retail Co., Ltd. from another investor. The additional investment increased shareholder of the Company from 25.10% to 65.00% for a purchase price totalling Baht 120.75 million. The net cash payment is Baht 68 million after deduct cash and cash equivalents.

Thai Union Group Public Company Limited Notes to the Consolidated and Separate Financial Statements For the year ended 31 December 2019
53
Details of investments in subsidiaries are as follows:
Proportion of shares directly held by
Proportion of shares held by
Dividend received
Registered share capital the Company non-controlling interests Cost method during the year
Company’s name Nature of business Country of
incorporation
31 December 2019
Million
31 December 2018
Million
31 December 2019
%
31 December 2018
%
31 December 2019
%
31 December 2018
%
31 December 2019
Thousand Baht
31 December 2018
Thousand Baht
31 December 2019
Thousand Baht
31 December 2018
Thousand Baht
Thai Union Manufacturing Co., Ltd. (TUM)
Manufacturer and exporter of canned tuna and pet food
Thailand Baht 300 Baht 300 99.66 99.66 0.34 0.34 2,648,407 2,648,407 1,943,359 1,076,322
Songkla Canning Plc. Manufacturer and exporter of canned seafood
Thailand Baht 360 Baht 360 99.55 99.55 0.45 0.45 2,006,664 2,006,664 824,301 2,867,134
Thai Union Seafood Co., Ltd. Manufacturer and exporter of frozen shrimp
Thailand Baht 300 Baht 300 51.00 51.00 49.00 49.00 189,316 189,316 45,900 79,560
EHS Training and Services Co., Ltd.
Providing training and management services
Thailand Baht 70 Baht 70 100.00 100.00 - - 699 699 - -
Thai Union Feedmill Plc. (TFM) Manufacturer and distributor of animal feeds
Thailand Baht 820 Baht 820 66.90 66.90 33.10 33.10 960,951 960,951 672,035 617,355
Thai Union Graphic Co., Ltd. Printing manufacturer Thailand Baht 40 Baht 40 98.00 98.00 2.00 2.00 96,019 96,019 - - Thai Union North America, Inc. (TUNA)
Holding company USA USD 343.5 USD 343.5 100.00 100.00 - - 11,741,316 11,741,316 - -
Thai Union Investment Holding Co., Ltd. (TUIH)
Holding company Mauritius EUR 0.5 EUR 0.5 100.00 100.00 - - 20,046 20,046 - -
Pakfood Plc. Manufacturer and distributor of frozen foods & aquatic animal
Thailand Baht 330 Baht 330 99.74 99.74 0.26 0.26 2,111,932 2,111,932 131,650 197,474
Seafood International One FZCO Distributor of food products
United Arab Emirates
- AED 0.1 - 60.00 - 40.00 - 575 - -
Thai Union China Co., Ltd. Distributor of food products
China USD 8 USD 8 100.00 100.00 - - 274,146 274,146 - -
Thai Union Online Shop Co., Ltd. E-Commerce Thailand Baht 1 Baht 1 100.00 100.00 - - 1,000 1,000 - - Thai Union EU Seafood 1 S.A. (TUES1)
Holding company Luxembourg EUR 212 EUR 212 100.00 100.00 - - 10,495,231 10,495,231 -
-
Thai Union Asia Investment Holding Limited (TUAIH)
Holding company Hong Kong USD 0.02 USD 0.02 100.00 100.00 - - 626
626
-
-
TMAC Company Limited (TMAC) Distributor of shrimp feed and investment in breeding farms and shrimp farming
Thailand Baht 1,130 - 100.00 - - - 142,075 - - -
Thai Union Ingredients Co., Ltd Distributor of ingredients product
Thailand Baht 300 - 100.00 - - - 300,000 - - -
Thammachart Seafood Retail Co., Ltd. (TSR)
Importer of seafood and seafood restaurant outlets
Thailand Baht 6 - 65.00 - 35.00 - 177,096 - - -
Total 31,165,524 30,546,928 3,617,245 4,837,845
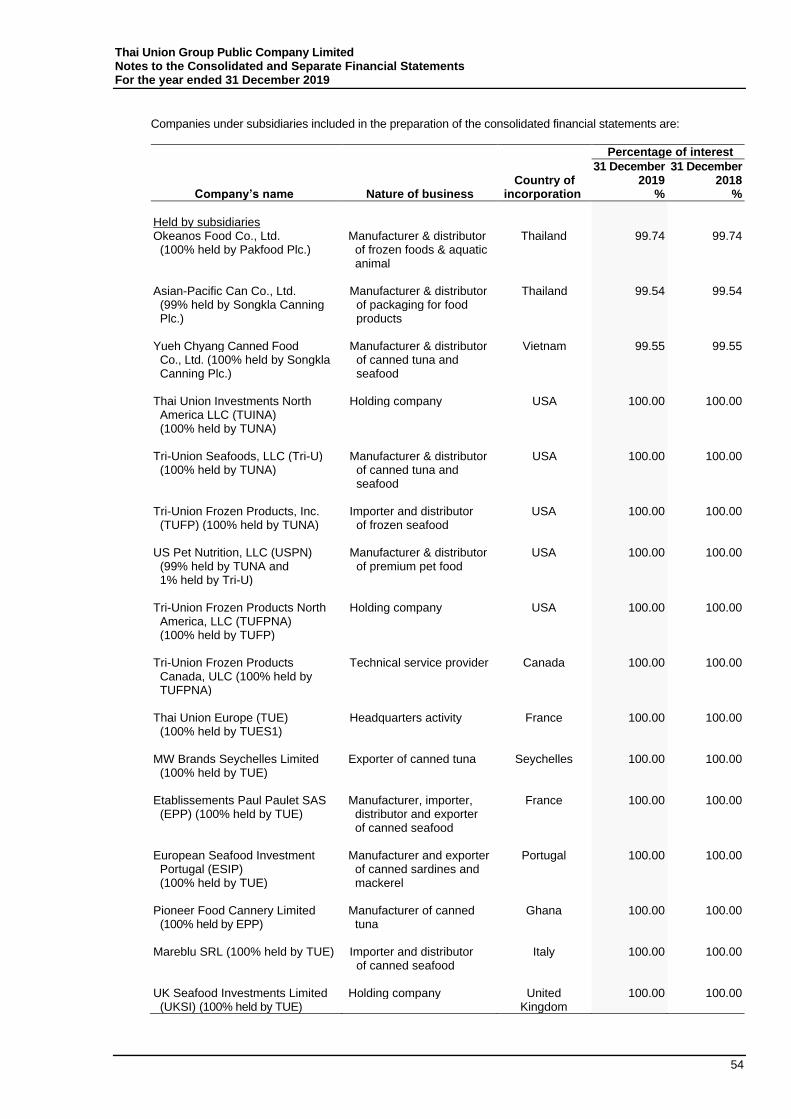
Thai Union Group Public Company Limited Notes to the Consolidated and Separate Financial Statements For the year ended 31 December 2019
54
Companies under subsidiaries included in the preparation of the consolidated financial statements are:
Percentage of interest
Country of
31 December 2019
31 December 2018
Company’s name Nature of business incorporation % %
Held by subsidiaries Okeanos Food Co., Ltd. Manufacturer & distributor Thailand 99.74 99.74 (100% held by Pakfood Plc.) of frozen foods & aquatic animal Asian-Pacific Can Co., Ltd. Manufacturer & distributor Thailand 99.54 99.54 (99% held by Songkla Canning of packaging for food Plc.) products Yueh Chyang Canned Food Manufacturer & distributor Vietnam 99.55 99.55 Co., Ltd. (100% held by Songkla of canned tuna and Canning Plc.) seafood Thai Union Investments North Holding company USA 100.00 100.00 America LLC (TUINA) (100% held by TUNA) Tri-Union Seafoods, LLC (Tri-U) Manufacturer & distributor USA 100.00 100.00 (100% held by TUNA) of canned tuna and seafood Tri-Union Frozen Products, Inc. Importer and distributor USA 100.00 100.00 (TUFP) (100% held by TUNA) of frozen seafood US Pet Nutrition, LLC (USPN) Manufacturer & distributor USA 100.00 100.00 (99% held by TUNA and of premium pet food 1% held by Tri-U) Tri-Union Frozen Products North America, LLC (TUFPNA) (100% held by TUFP)
Holding company USA 100.00 100.00
Tri-Union Frozen Products Canada, ULC (100% held by TUFPNA)
Technical service provider Canada 100.00 100.00
Thai Union Europe (TUE) (100% held by TUES1)
Headquarters activity France 100.00 100.00
MW Brands Seychelles Limited (100% held by TUE)
Exporter of canned tuna Seychelles 100.00 100.00
Etablissements Paul Paulet SAS (EPP) (100% held by TUE)
Manufacturer, importer, distributor and exporter of canned seafood
France 100.00 100.00
European Seafood Investment Portugal (ESIP) (100% held by TUE)
Manufacturer and exporter of canned sardines and mackerel
Portugal 100.00 100.00
Pioneer Food Cannery Limited Manufacturer of canned Ghana 100.00 100.00 (100% held by EPP) tuna Mareblu SRL (100% held by TUE) Importer and distributor
of canned seafood Italy 100.00 100.00
UK Seafood Investments Limited Holding company United 100.00 100.00 (UKSI) (100% held by TUE) Kingdom
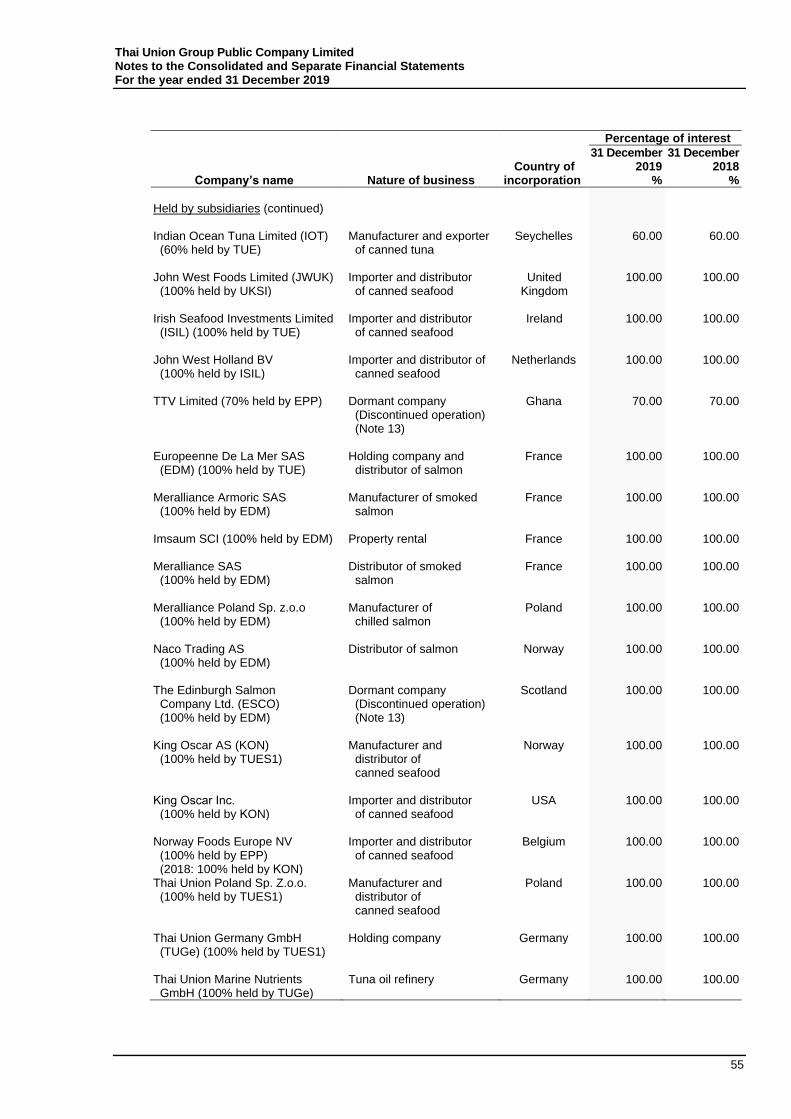
Thai Union Group Public Company Limited Notes to the Consolidated and Separate Financial Statements For the year ended 31 December 2019
55
Percentage of interest
Country of
31 December 2019
31 December 2018
Company’s name Nature of business incorporation % %
Held by subsidiaries (continued) Indian Ocean Tuna Limited (IOT) Manufacturer and exporter Seychelles 60.00 60.00 (60% held by TUE) of canned tuna John West Foods Limited (JWUK) (100% held by UKSI)
Importer and distributor of canned seafood
United Kingdom
100.00 100.00
Irish Seafood Investments Limited (ISIL) (100% held by TUE)
Importer and distributor of canned seafood
Ireland 100.00 100.00
John West Holland BV (100% held by ISIL)
Importer and distributor of canned seafood
Netherlands 100.00 100.00
TTV Limited (70% held by EPP) Dormant company
(Discontinued operation) (Note 13)
Ghana 70.00 70.00
Europeenne De La Mer SAS (EDM) (100% held by TUE)
Holding company and distributor of salmon
France 100.00 100.00
Meralliance Armoric SAS (100% held by EDM)
Manufacturer of smoked salmon
France 100.00 100.00
Imsaum SCI (100% held by EDM) Property rental France 100.00 100.00 Meralliance SAS (100% held by EDM)
Distributor of smoked salmon
France 100.00 100.00
Meralliance Poland Sp. z.o.o Manufacturer of Poland 100.00 100.00 (100% held by EDM) chilled salmon Naco Trading AS (100% held by EDM)
Distributor of salmon Norway 100.00 100.00
The Edinburgh Salmon Company Ltd. (ESCO) (100% held by EDM)
Dormant company (Discontinued operation) (Note 13)
Scotland 100.00 100.00
King Oscar AS (KON) Manufacturer and Norway 100.00 100.00 (100% held by TUES1) distributor of
canned seafood
King Oscar Inc. Importer and distributor USA 100.00 100.00 (100% held by KON) of canned seafood Norway Foods Europe NV Importer and distributor Belgium 100.00 100.00 (100% held by EPP) of canned seafood (2018: 100% held by KON) Thai Union Poland Sp. Z.o.o. Manufacturer and Poland 100.00 100.00 (100% held by TUES1) distributor of
canned seafood
Thai Union Germany GmbH Holding company Germany 100.00 100.00 (TUGe) (100% held by TUES1) Thai Union Marine Nutrients Tuna oil refinery Germany 100.00 100.00 GmbH (100% held by TUGe)
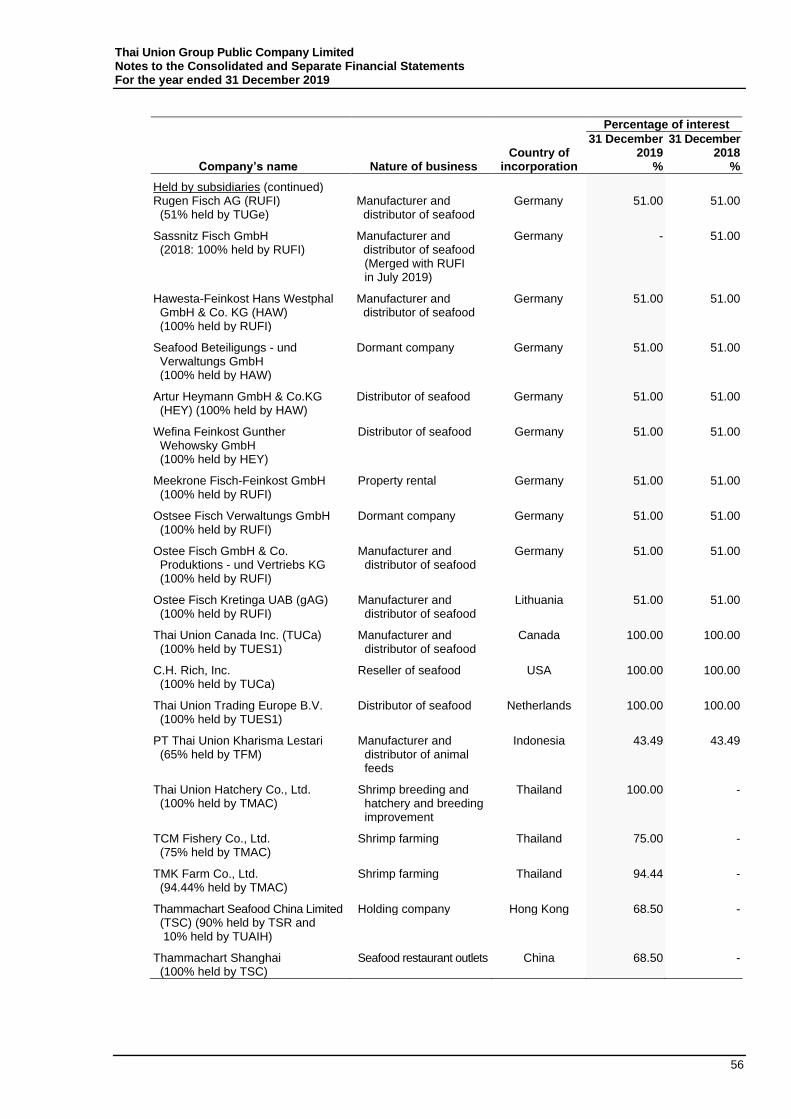
Thai Union Group Public Company Limited Notes to the Consolidated and Separate Financial Statements For the year ended 31 December 2019
56
Percentage of interest
Country of
31 December 2019
31 December 2018
Company’s name Nature of business incorporation % %
Held by subsidiaries (continued) Rugen Fisch AG (RUFI) Manufacturer and Germany 51.00 51.00 (51% held by TUGe) distributor of seafood
Sassnitz Fisch GmbH Manufacturer and Germany - 51.00 (2018: 100% held by RUFI) distributor of seafood
(Merged with RUFI in July 2019)
Hawesta-Feinkost Hans Westphal GmbH & Co. KG (HAW)
Manufacturer and distributor of seafood
Germany 51.00 51.00
(100% held by RUFI)
Seafood Beteiligungs - und Verwaltungs GmbH (100% held by HAW)
Dormant company Germany 51.00 51.00
Artur Heymann GmbH & Co.KG (HEY) (100% held by HAW)
Distributor of seafood Germany 51.00 51.00
Wefina Feinkost Gunther Wehowsky GmbH (100% held by HEY)
Distributor of seafood Germany 51.00 51.00
Meekrone Fisch-Feinkost GmbH (100% held by RUFI)
Property rental Germany 51.00 51.00
Ostsee Fisch Verwaltungs GmbH (100% held by RUFI)
Dormant company Germany 51.00 51.00
Ostee Fisch GmbH & Co. Produktions - und Vertriebs KG (100% held by RUFI)
Manufacturer and distributor of seafood
Germany 51.00 51.00
Ostee Fisch Kretinga UAB (gAG) (100% held by RUFI)
Manufacturer and distributor of seafood
Lithuania 51.00 51.00
Thai Union Canada Inc. (TUCa) (100% held by TUES1)
Manufacturer and distributor of seafood
Canada 100.00 100.00
C.H. Rich, Inc. (100% held by TUCa)
Reseller of seafood USA 100.00 100.00
Thai Union Trading Europe B.V. (100% held by TUES1)
Distributor of seafood Netherlands 100.00 100.00
PT Thai Union Kharisma Lestari (65% held by TFM)
Manufacturer and distributor of animal feeds
Indonesia 43.49 43.49
Thai Union Hatchery Co., Ltd. Shrimp breeding and Thailand 100.00 - (100% held by TMAC) hatchery and breeding
improvement
TCM Fishery Co., Ltd. Shrimp farming Thailand 75.00 - (75% held by TMAC)
TMK Farm Co., Ltd. Shrimp farming Thailand 94.44 - (94.44% held by TMAC)
Thammachart Seafood China Limited Holding company Hong Kong 68.50 - (TSC) (90% held by TSR and 10% held by TUAIH)
Thammachart Shanghai Seafood restaurant outlets China 68.50 - (100% held by TSC)
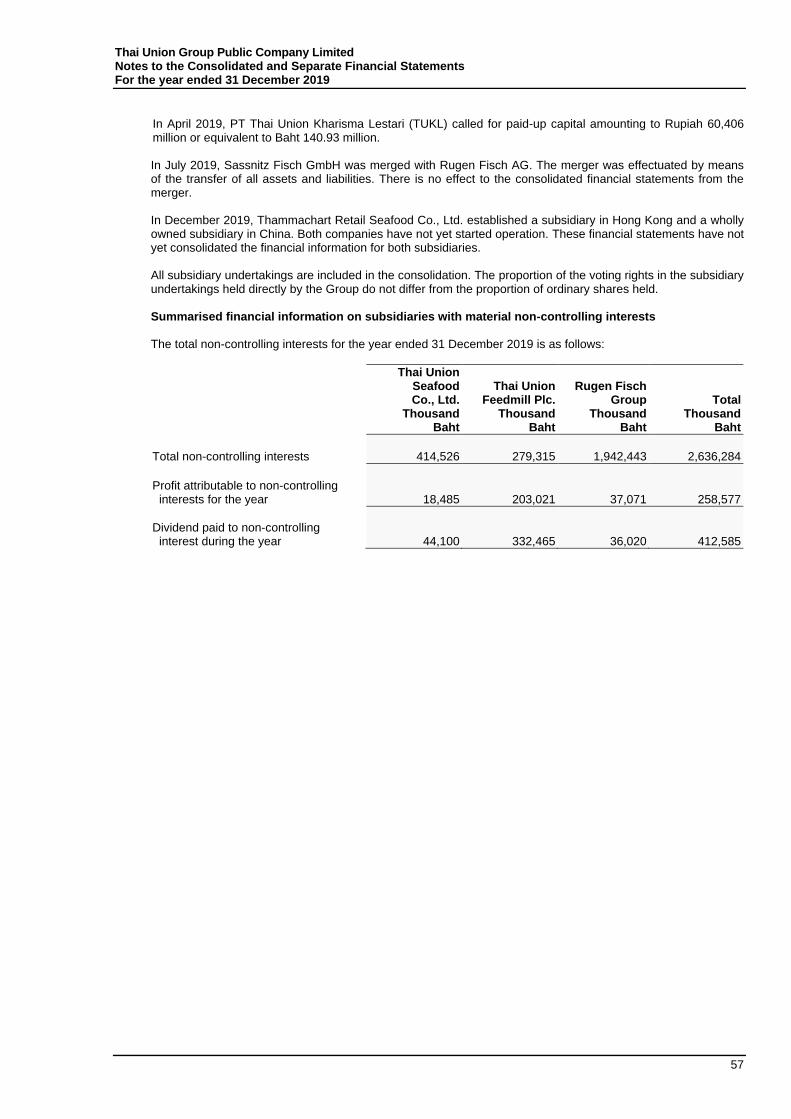
Thai Union Group Public Company Limited Notes to the Consolidated and Separate Financial Statements For the year ended 31 December 2019
57
In April 2019, PT Thai Union Kharisma Lestari (TUKL) called for paid-up capital amounting to Rupiah 60,406 million or equivalent to Baht 140.93 million. In July 2019, Sassnitz Fisch GmbH was merged with Rugen Fisch AG. The merger was effectuated by means of the transfer of all assets and liabilities. There is no effect to the consolidated financial statements from the merger. In December 2019, Thammachart Retail Seafood Co., Ltd. established a subsidiary in Hong Kong and a wholly owned subsidiary in China. Both companies have not yet started operation. These financial statements have not yet consolidated the financial information for both subsidiaries. All subsidiary undertakings are included in the consolidation. The proportion of the voting rights in the subsidiary undertakings held directly by the Group do not differ from the proportion of ordinary shares held. Summarised financial information on subsidiaries with material non-controlling interests The total non-controlling interests for the year ended 31 December 2019 is as follows:
Thai Union Seafood Co., Ltd.
Thai Union Feedmill Plc.
Rugen Fisch Group Total
Thousand Thousand Thousand Thousand Baht Baht Baht Baht
Total non-controlling interests 414,526 279,315 1,942,443 2,636,284
Profit attributable to non-controlling interests for the year 18,485 203,021 37,071 258,577
Dividend paid to non-controlling interest during the year 44,100 332,465 36,020 412,585
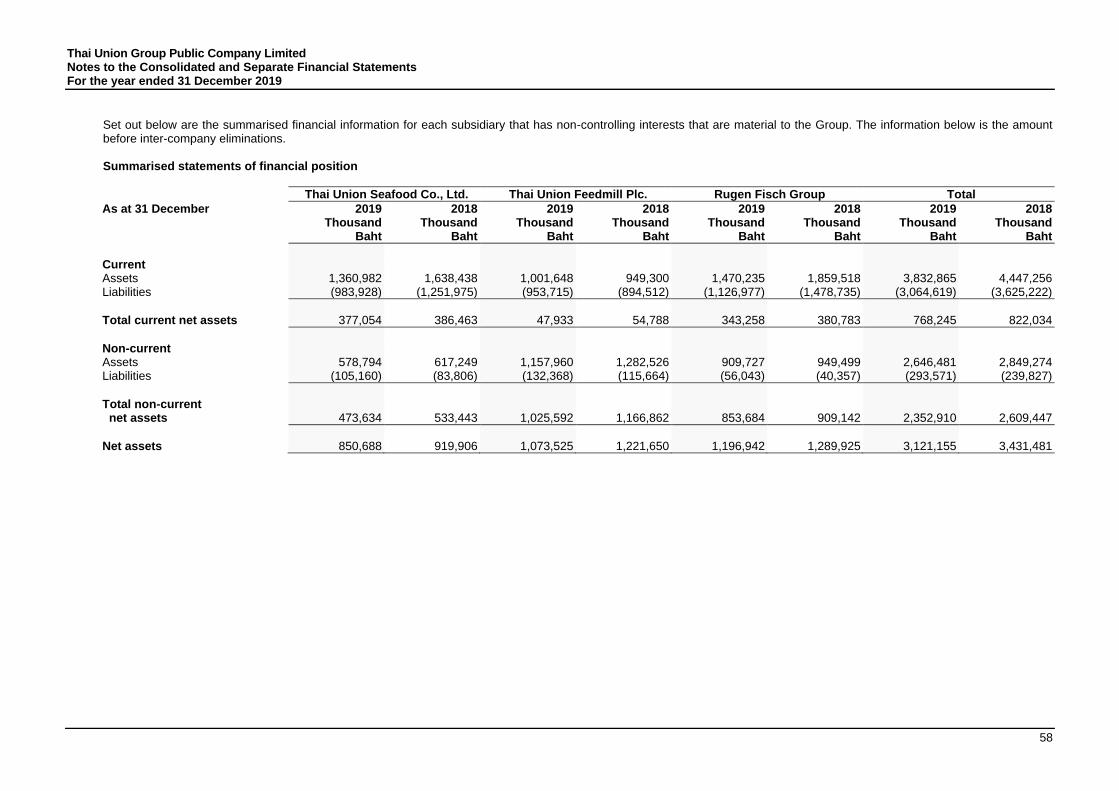
Thai Union Group Public Company Limited Notes to the Consolidated and Separate Financial Statements For the year ended 31 December 2019
58
Set out below are the summarised financial information for each subsidiary that has non-controlling interests that are material to the Group. The information below is the amount before inter-company eliminations. Summarised statements of financial position
Thai Union Seafood Co., Ltd. Thai Union Feedmill Plc. Rugen Fisch Group Total
As at 31 December 2019 2018 2019 2018 2019 2018 2019 2018 Thousand Thousand Thousand Thousand Thousand Thousand Thousand Thousand Baht Baht Baht Baht Baht Baht Baht Baht
Current Assets 1,360,982 1,638,438 1,001,648 949,300 1,470,235 1,859,518 3,832,865 4,447,256 Liabilities (983,928) (1,251,975) (953,715) (894,512) (1,126,977) (1,478,735) (3,064,619) (3,625,222)
Total current net assets 377,054 386,463 47,933 54,788 343,258 380,783 768,245 822,034
Non-current Assets 578,794 617,249 1,157,960 1,282,526 909,727 949,499 2,646,481 2,849,274 Liabilities (105,160) (83,806) (132,368) (115,664) (56,043) (40,357) (293,571) (239,827)
Total non-current net assets 473,634 533,443 1,025,592 1,166,862 853,684 909,142 2,352,910 2,609,447
Net assets 850,688 919,906 1,073,525 1,221,650 1,196,942 1,289,925 3,121,155 3,431,481
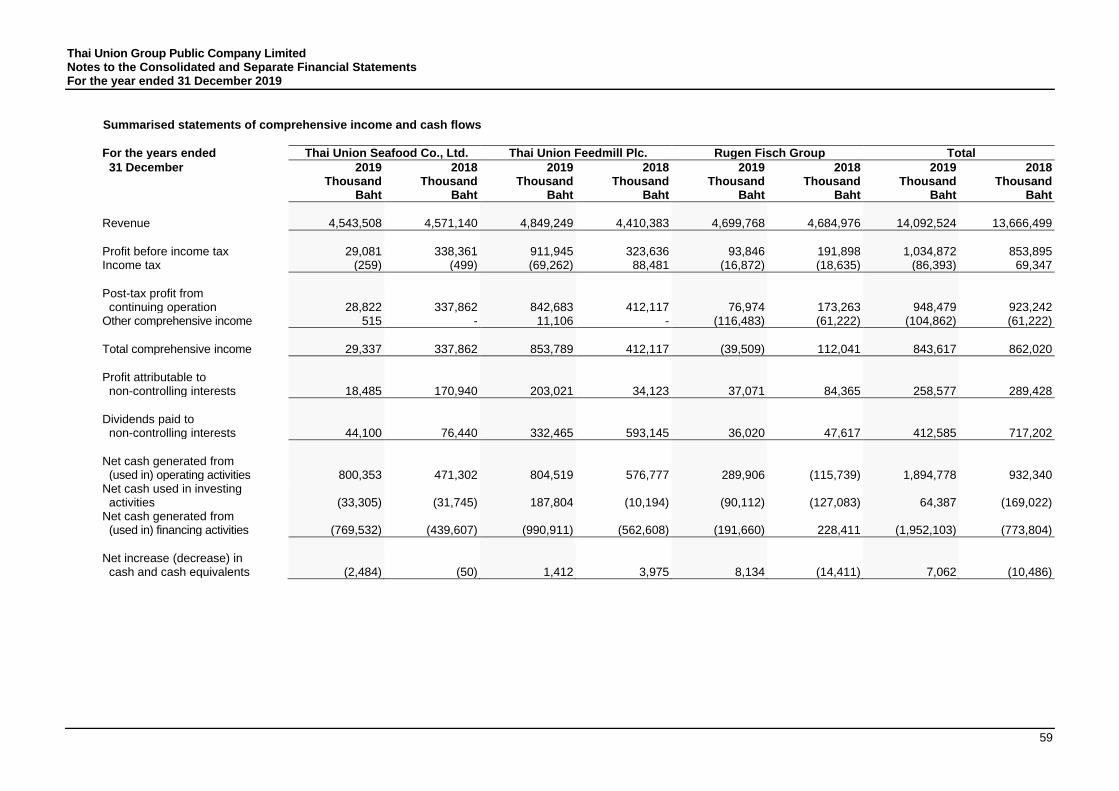
Thai Union Group Public Company Limited Notes to the Consolidated and Separate Financial Statements For the year ended 31 December 2019
59
Summarised statements of comprehensive income and cash flows
For the years ended Thai Union Seafood Co., Ltd. Thai Union Feedmill Plc. Rugen Fisch Group Total
31 December 2019 2018 2019 2018 2019 2018 2019 2018 Thousand Thousand Thousand Thousand Thousand Thousand Thousand Thousand Baht Baht Baht Baht Baht Baht Baht Baht
Revenue 4,543,508 4,571,140 4,849,249 4,410,383 4,699,768 4,684,976 14,092,524 13,666,499
Profit before income tax 29,081 338,361 911,945 323,636 93,846 191,898 1,034,872 853,895 Income tax (259) (499) (69,262) 88,481 (16,872) (18,635) (86,393) 69,347
Post-tax profit from continuing operation 28,822 337,862 842,683 412,117 76,974 173,263 948,479 923,242 Other comprehensive income 515 - 11,106 - (116,483) (61,222) (104,862) (61,222)
Total comprehensive income 29,337 337,862 853,789 412,117 (39,509) 112,041 843,617 862,020
Profit attributable to non-controlling interests 18,485 170,940 203,021 34,123 37,071 84,365 258,577 289,428
Dividends paid to non-controlling interests 44,100 76,440 332,465 593,145 36,020 47,617 412,585 717,202
Net cash generated from (used in) operating activities 800,353 471,302 804,519 576,777 289,906 (115,739) 1,894,778 932,340 Net cash used in investing activities (33,305) (31,745) 187,804 (10,194) (90,112) (127,083) 64,387 (169,022) Net cash generated from (used in) financing activities (769,532) (439,607) (990,911) (562,608) (191,660) 228,411 (1,952,103) (773,804)
Net increase (decrease) in cash and cash equivalents (2,484) (50) 1,412 3,975 8,134 (14,411) 7,062 (10,486)
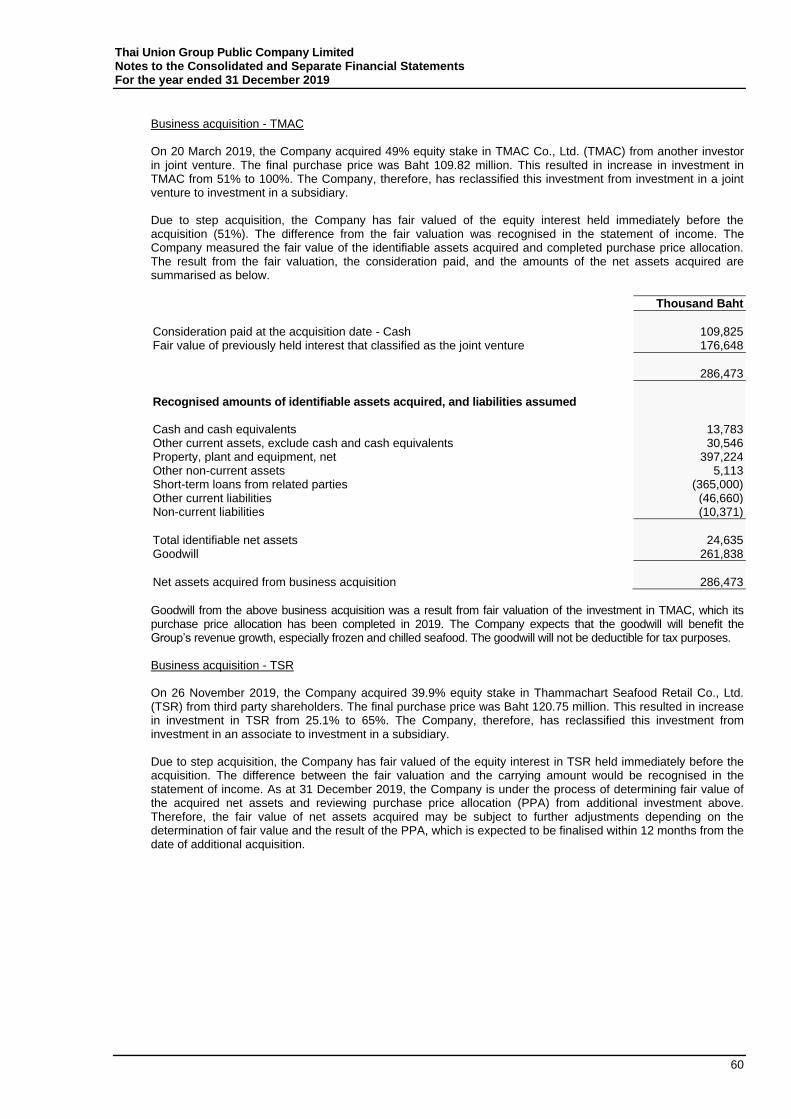
Thai Union Group Public Company Limited Notes to the Consolidated and Separate Financial Statements For the year ended 31 December 2019
60
Business acquisition - TMAC On 20 March 2019, the Company acquired 49% equity stake in TMAC Co., Ltd. (TMAC) from another investor in joint venture. The final purchase price was Baht 109.82 million. This resulted in increase in investment in TMAC from 51% to 100%. The Company, therefore, has reclassified this investment from investment in a joint venture to investment in a subsidiary. Due to step acquisition, the Company has fair valued of the equity interest held immediately before the acquisition (51%). The difference from the fair valuation was recognised in the statement of income. The Company measured the fair value of the identifiable assets acquired and completed purchase price allocation. The result from the fair valuation, the consideration paid, and the amounts of the net assets acquired are summarised as below.
Thousand Baht
Consideration paid at the acquisition date - Cash 109,825 Fair value of previously held interest that classified as the joint venture 176,648
286,473
Recognised amounts of identifiable assets acquired, and liabilities assumed Cash and cash equivalents 13,783 Other current assets, exclude cash and cash equivalents 30,546 Property, plant and equipment, net 397,224 Other non-current assets 5,113 Short-term loans from related parties (365,000) Other current liabilities (46,660) Non-current liabilities (10,371)
Total identifiable net assets 24,635 Goodwill 261,838
Net assets acquired from business acquisition 286,473
Goodwill from the above business acquisition was a result from fair valuation of the investment in TMAC, which its purchase price allocation has been completed in 2019. The Company expects that the goodwill will benefit the Group’s revenue growth, especially frozen and chilled seafood. The goodwill will not be deductible for tax purposes. Business acquisition - TSR On 26 November 2019, the Company acquired 39.9% equity stake in Thammachart Seafood Retail Co., Ltd. (TSR) from third party shareholders. The final purchase price was Baht 120.75 million. This resulted in increase in investment in TSR from 25.1% to 65%. The Company, therefore, has reclassified this investment from investment in an associate to investment in a subsidiary. Due to step acquisition, the Company has fair valued of the equity interest in TSR held immediately before the acquisition. The difference between the fair valuation and the carrying amount would be recognised in the statement of income. As at 31 December 2019, the Company is under the process of determining fair value of the acquired net assets and reviewing purchase price allocation (PPA) from additional investment above. Therefore, the fair value of net assets acquired may be subject to further adjustments depending on the determination of fair value and the result of the PPA, which is expected to be finalised within 12 months from the date of additional acquisition.

Thai Union Group Public Company Limited Notes to the Consolidated and Separate Financial Statements For the year ended 31 December 2019
61
Thousand Baht
Carrying amount of an investment in TSR under equity method at the acquisition date 49,406 Gain from the fair valuation of the equity interest in TSRat the acquisition date 15,752
Fair value of previously held interest that classified as the associate 65,158 Consideration paid at the acquisition date - Cash 120,751
185,909
Provisional recognised amounts of identifiable assets acquired, and liabilities assumed Cash and cash equivalents 52,748 Other current assets, exclude cash and cash equivalents 108,835 Property, plant and equipment, net 25,240 Other non-current assets 8,960 Other current liabilities (120,240) Non-current liabilities (6,649)
Total identifiable net assets 68,894
Equity of the Company (65%) 44,781 Goodwill 141,128
Net assets acquired from business acquisition 185,909
Had all subsidiaries acquired in this year been consolidated from 1 January 2019, the consolidated statement of income would have shown revenue of Baht 988 million and net loss for the year of Baht 133 million.
14.2 Investments in associates The movements of investments in associates during the year are as follows:
Consolidated financial statements
Separate financial statements
For the years ended 31 December 2019 Thousand
Baht
2018 Thousand
Baht
2019 Thousand
Baht
2018 Thousand
Baht
Opening net book value 10,766,530 10,336,972 835,523 835,293 Additions 75,104 686,614 - 45,372 Disposals, net (52,884) (2,193) (1,010) (45,142) Share of profit 581,676 459,570 - - Share other comprehensive expenses (46,846) (208,677) - - Reclassification 6,584 20,351 - - Gain on fair value adjustment from - step acquisition 15,752 - - -
Transfer to investments in joint ventures and subsidiaries (65,158)
- (45,756) -
Dividends received (214,417) (188,705) - - Dividends distribution tax (11,865) (19,513) - - Impairment of investment in an associate (172,910) - - - Translation adjustment (799,191) (317,889) - -
Closing net book value 10,082,375 10,766,530 788,757 835,523
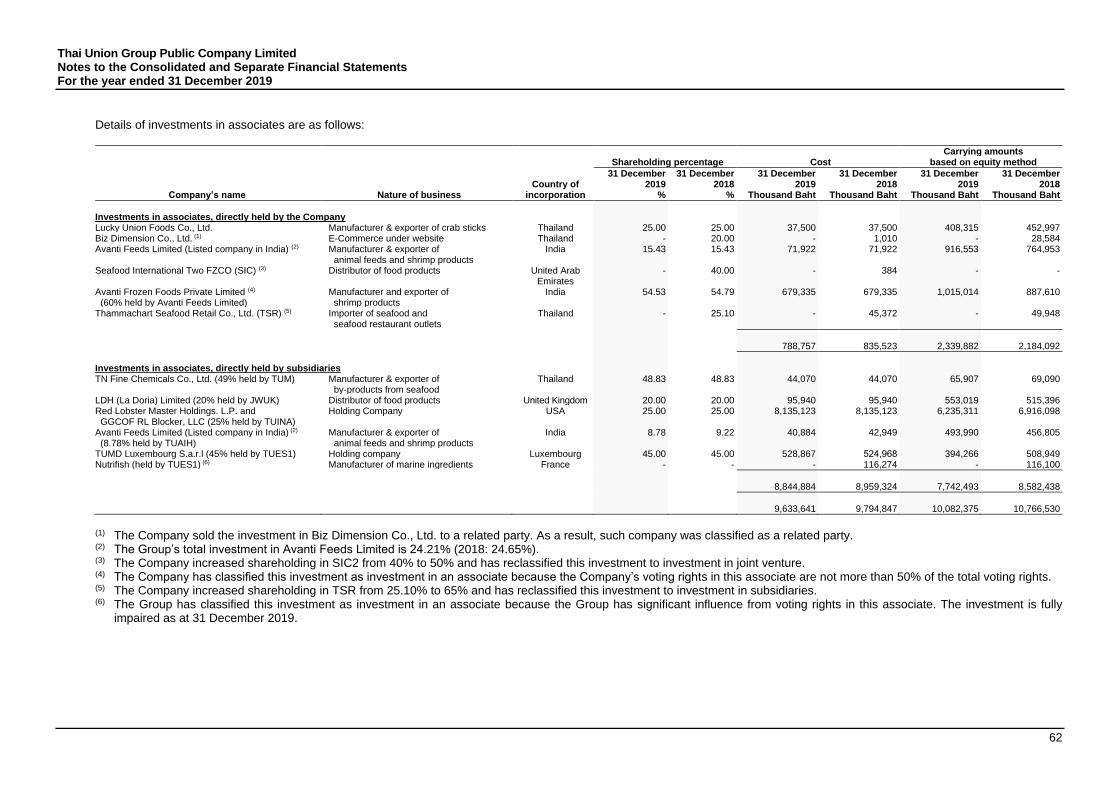
Thai Union Group Public Company Limited Notes to the Consolidated and Separate Financial Statements For the year ended 31 December 2019
62
Details of investments in associates are as follows:
Carrying amounts Shareholding percentage Cost based on equity method
Company’s name
Nature of business
Country of
incorporation
31 December 2019
%
31 December 2018
%
31 December 2019
Thousand Baht
31 December 2018
Thousand Baht
31 December 2019
Thousand Baht
31 December 2018
Thousand Baht
Investments in associates, directly held by the Company Lucky Union Foods Co., Ltd. Manufacturer & exporter of crab sticks Thailand 25.00 25.00 37,500 37,500 408,315 452,997 Biz Dimension Co., Ltd. (1) E-Commerce under website Thailand - 20.00 - 1,010 - 28,584 Avanti Feeds Limited (Listed company in India) (2) Manufacturer & exporter of India 15.43 15.43 71,922 71,922 916,553 764,953 animal feeds and shrimp products Seafood International Two FZCO (SIC) (3)
Distributor of food products United Arab Emirates
- 40.00 - 384 - -
Avanti Frozen Foods Private Limited (4) (60% held by Avanti Feeds Limited)
Manufacturer and exporter of shrimp products
India 54.53 54.79 679,335 679,335 1,015,014 887,610
Thammachart Seafood Retail Co., Ltd. (TSR) (5)
Importer of seafood and seafood restaurant outlets
Thailand - 25.10 -
45,372
- 49,948
788,757 835,523 2,339,882 2,184,092
Investments in associates, directly held by subsidiaries TN Fine Chemicals Co., Ltd. (49% held by TUM) Manufacturer & exporter of Thailand 48.83 48.83 44,070 44,070 65,907 69,090 by-products from seafood LDH (La Doria) Limited (20% held by JWUK) Distributor of food products United Kingdom 20.00 20.00 95,940 95,940 553,019 515,396 Red Lobster Master Holdings. L.P. and GGCOF RL Blocker, LLC (25% held by TUINA)
Holding Company USA 25.00 25.00 8,135,123 8,135,123 6,235,311 6,916,098
Avanti Feeds Limited (Listed company in India) (2) Manufacturer & exporter of India 8.78 9.22 40,884 42,949 493,990 456,805 (8.78% held by TUAIH) animal feeds and shrimp products TUMD Luxembourg S.a.r.l (45% held by TUES1) Holding company Luxembourg 45.00 45.00 528,867 524,968 394,266 508,949 Nutrifish (held by TUES1) (6) Manufacturer of marine ingredients France - - - 116,274 - 116,100
8,844,884 8,959,324 7,742,493 8,582,438
9,633,641 9,794,847 10,082,375 10,766,530
(1) The Company sold the investment in Biz Dimension Co., Ltd. to a related party. As a result, such company was classified as a related party. (2) The Group’s total investment in Avanti Feeds Limited is 24.21% (2018: 24.65%). (3) The Company increased shareholding in SIC2 from 40% to 50% and has reclassified this investment to investment in joint venture. (4) The Company has classified this investment as investment in an associate because the Company’s voting rights in this associate are not more than 50% of the total voting rights. (5) The Company increased shareholding in TSR from 25.10% to 65% and has reclassified this investment to investment in subsidiaries. (6) The Group has classified this investment as investment in an associate because the Group has significant influence from voting rights in this associate. The investment is fully
impaired as at 31 December 2019.
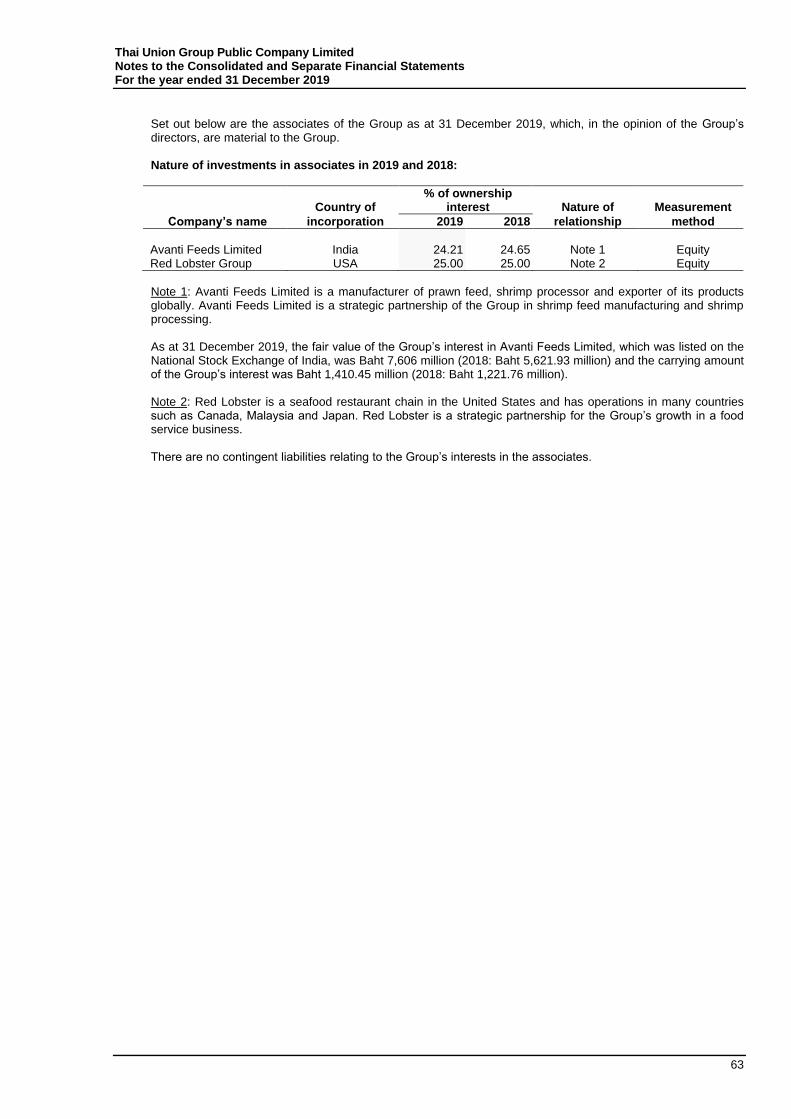
Thai Union Group Public Company Limited Notes to the Consolidated and Separate Financial Statements For the year ended 31 December 2019
63
Set out below are the associates of the Group as at 31 December 2019, which, in the opinion of the Group’s directors, are material to the Group. Nature of investments in associates in 2019 and 2018:
% of ownership Country of interest Nature of Measurement
Company’s name incorporation 2019 2018 relationship method
Avanti Feeds Limited India 24.21 24.65 Note 1 Equity Red Lobster Group USA 25.00 25.00 Note 2 Equity
Note 1: Avanti Feeds Limited is a manufacturer of prawn feed, shrimp processor and exporter of its products globally. Avanti Feeds Limited is a strategic partnership of the Group in shrimp feed manufacturing and shrimp processing. As at 31 December 2019, the fair value of the Group’s interest in Avanti Feeds Limited, which was listed on the National Stock Exchange of India, was Baht 7,606 million (2018: Baht 5,621.93 million) and the carrying amount of the Group’s interest was Baht 1,410.45 million (2018: Baht 1,221.76 million). Note 2: Red Lobster is a seafood restaurant chain in the United States and has operations in many countries such as Canada, Malaysia and Japan. Red Lobster is a strategic partnership for the Group’s growth in a food service business. There are no contingent liabilities relating to the Group’s interests in the associates.
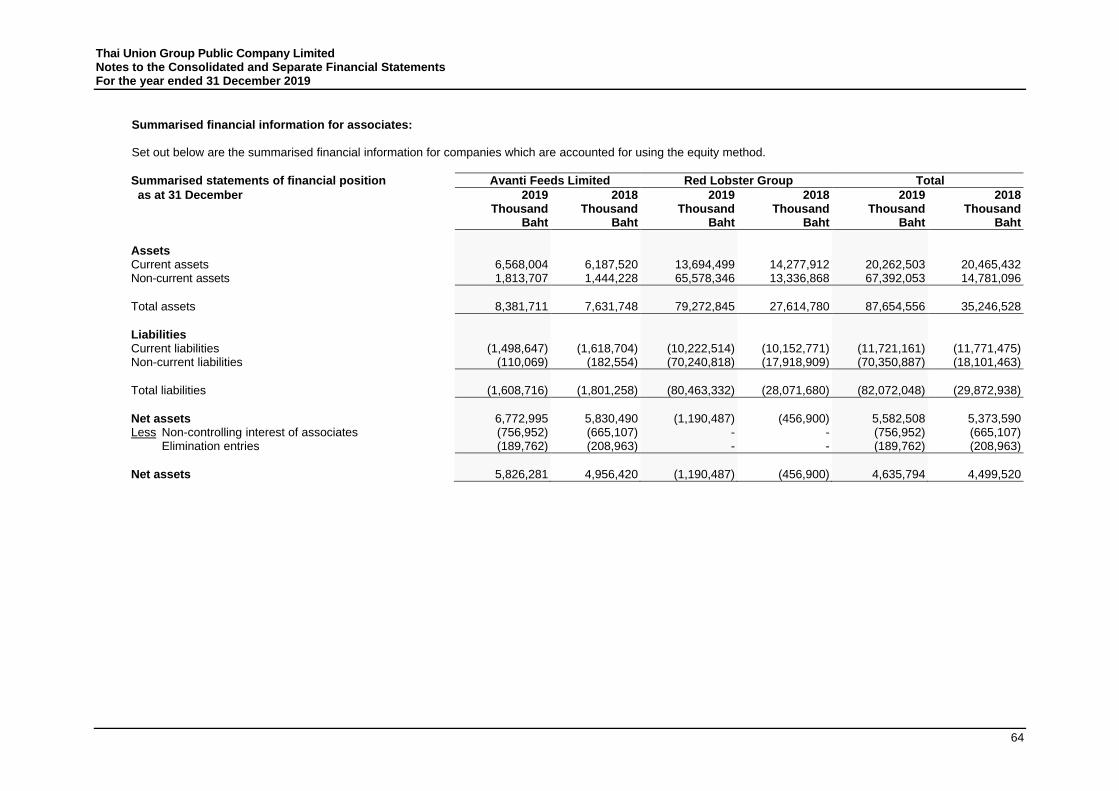
Thai Union Group Public Company Limited Notes to the Consolidated and Separate Financial Statements For the year ended 31 December 2019
64
Summarised financial information for associates: Set out below are the summarised financial information for companies which are accounted for using the equity method.
Summarised statements of financial position Avanti Feeds Limited Red Lobster Group Total
as at 31 December 2019 2018 2019 2018 2019 2018 Thousand Thousand Thousand Thousand Thousand Thousand Baht Baht Baht Baht Baht Baht
Assets Current assets 6,568,004 6,187,520 13,694,499 14,277,912 20,262,503 20,465,432 Non-current assets 1,813,707 1,444,228 65,578,346 13,336,868 67,392,053 14,781,096
Total assets 8,381,711 7,631,748 79,272,845 27,614,780 87,654,556 35,246,528
Liabilities Current liabilities (1,498,647) (1,618,704) (10,222,514) (10,152,771) (11,721,161) (11,771,475) Non-current liabilities (110,069) (182,554) (70,240,818) (17,918,909) (70,350,887) (18,101,463)
Total liabilities (1,608,716) (1,801,258) (80,463,332) (28,071,680) (82,072,048) (29,872,938)
Net assets 6,772,995 5,830,490 (1,190,487) (456,900) 5,582,508 5,373,590 Less Non-controlling interest of associates (756,952) (665,107) - - (756,952) (665,107) Elimination entries (189,762) (208,963) - - (189,762) (208,963)
Net assets 5,826,281 4,956,420 (1,190,487) (456,900) 4,635,794 4,499,520
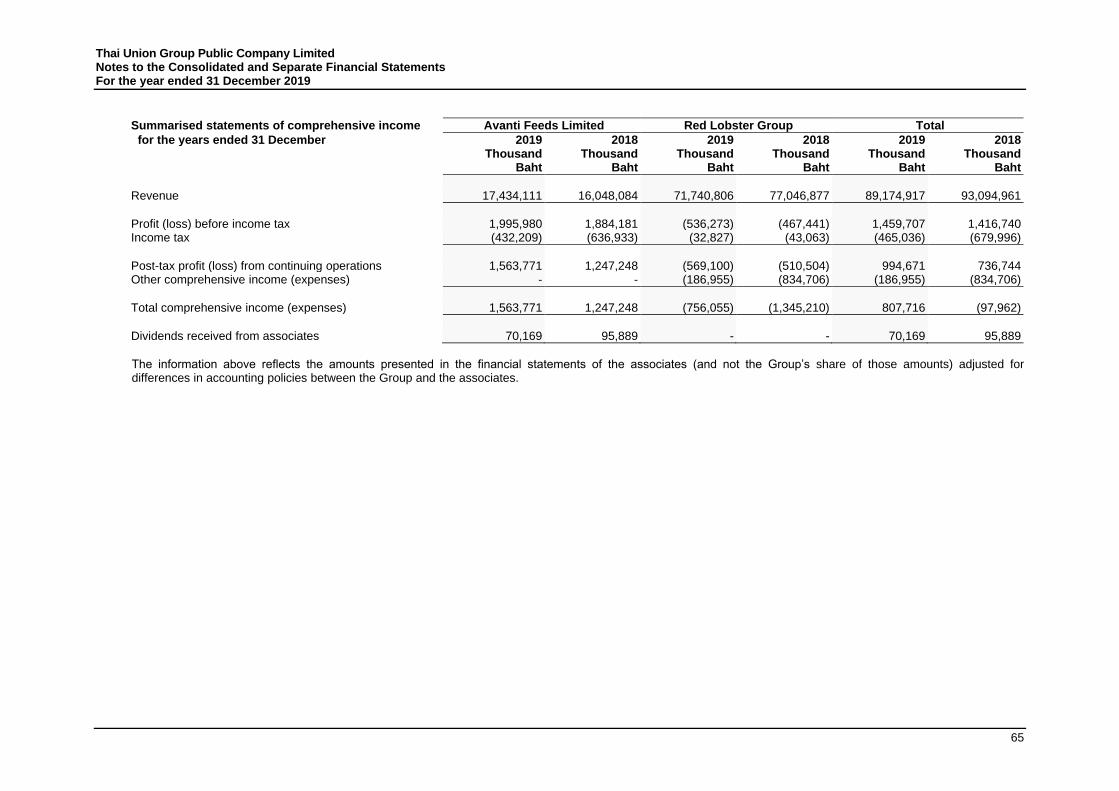
Thai Union Group Public Company Limited Notes to the Consolidated and Separate Financial Statements For the year ended 31 December 2019
65
Summarised statements of comprehensive income Avanti Feeds Limited Red Lobster Group Total
for the years ended 31 December 2019 2018 2019 2018 2019 2018 Thousand Thousand Thousand Thousand Thousand Thousand Baht Baht Baht Baht Baht Baht
Revenue 17,434,111 16,048,084 71,740,806 77,046,877 89,174,917 93,094,961
Profit (loss) before income tax 1,995,980 1,884,181 (536,273) (467,441) 1,459,707 1,416,740 Income tax (432,209) (636,933) (32,827) (43,063) (465,036) (679,996)
Post-tax profit (loss) from continuing operations 1,563,771 1,247,248 (569,100) (510,504) 994,671 736,744 Other comprehensive income (expenses) - - (186,955) (834,706) (186,955) (834,706)
Total comprehensive income (expenses) 1,563,771 1,247,248 (756,055) (1,345,210) 807,716 (97,962)
Dividends received from associates 70,169 95,889 - - 70,169 95,889
The information above reflects the amounts presented in the financial statements of the associates (and not the Group’s share of those amounts) adjusted for differences in accounting policies between the Group and the associates.

Thai Union Group Public Company Limited Notes to the Consolidated and Separate Financial Statements For the year ended 31 December 2019
66
Reconciliation of summarised financial information Reconciliation of the summarised financial information presented to the carrying amount of its interest in associates:
Avanti Feeds Limited Red Lobster Group Total
For the years ended 31 December 2019 2018 2019 2018 2019 2018 Thousand Thousand Thousand Thousand Thousand Thousand Baht Baht Baht Baht Baht Baht
Opening net assets as at 1 January 4,956,420 4,739,323 (456,900) 865,317 4,499,520 5,604,640 Disposal during the year (23,491) (2,193) - - (23,491) (2,193) Profit (loss) for the year 1,563,771 1,247,248 (569,100) (510,504) 994,671 736,744 Other comprehensive expenses for the year - - (186,955) (834,706) (186,955) (834,706) Dividends (289,837) (468,165) - - (289,837) (468,165) Exchange differences on transaction (380,582) (559,793) 22,468 22,993 (358,114) (536,800)
Closing net assets as at 31 December 5,826,281 4,956,420 (1,190,487) (456,900) 4,635,794 4,499,520
Shareholding percentage 24.21% 24.65% 25.00% 25.00%
Interest in associates 1,410,543 1,221,758 (297,622) (114,225) 1,112,921 1,107,533 Goodwill - - 6,532,933 7,030,323 6,532,933 7,030,323
Carrying value 1,410,543 1,221,758 6,235,311 6,916,098 7,645,854 8,137,856
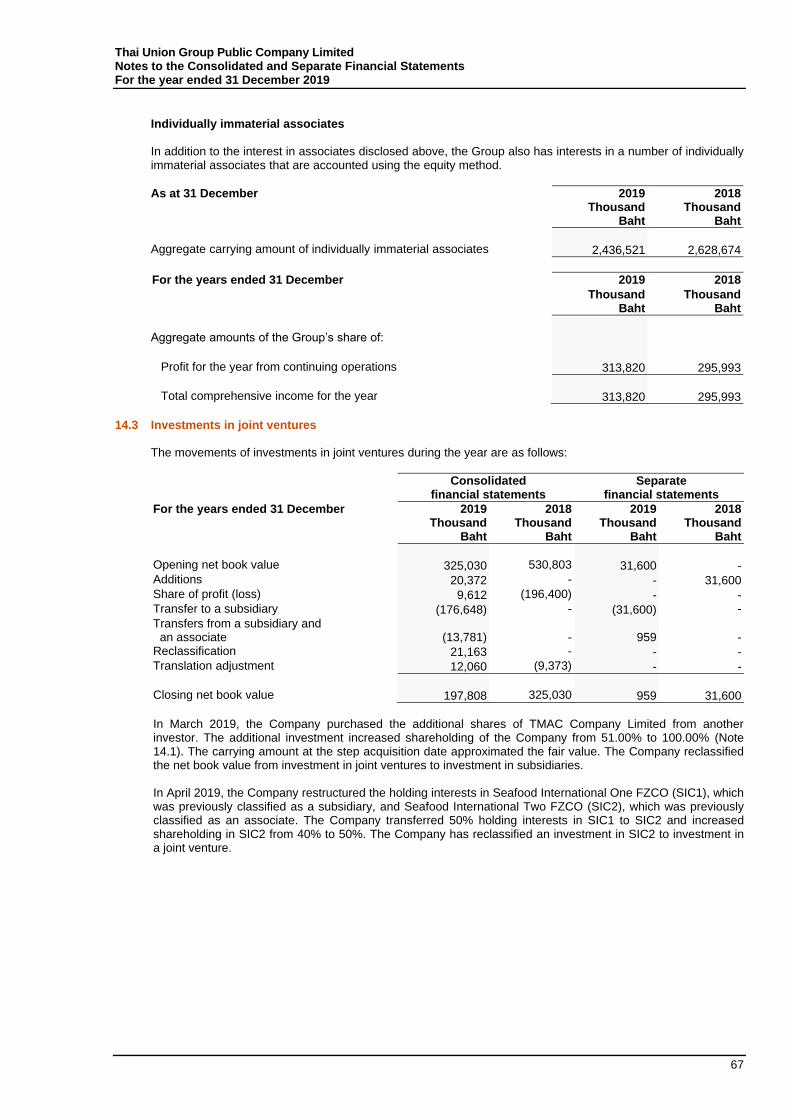
Thai Union Group Public Company Limited Notes to the Consolidated and Separate Financial Statements For the year ended 31 December 2019
67
Individually immaterial associates In addition to the interest in associates disclosed above, the Group also has interests in a number of individually immaterial associates that are accounted using the equity method.
As at 31 December 2019 Thousand
Baht
2018 Thousand
Baht
Aggregate carrying amount of individually immaterial associates 2,436,521 2,628,674
For the years ended 31 December 2019 2018
Thousand Baht
Thousand Baht
Aggregate amounts of the Group’s share of: Profit for the year from continuing operations 313,820 295,993
Total comprehensive income for the year 313,820 295,993
14.3 Investments in joint ventures
The movements of investments in joint ventures during the year are as follows:
Consolidated financial statements
Separate financial statements
For the years ended 31 December 2019 Thousand
Baht
2018 Thousand
Baht
2019 Thousand
Baht
2018 Thousand
Baht
Opening net book value 325,030 530,803 31,600 - Additions 20,372 - - 31,600 Share of profit (loss) 9,612 (196,400) - - Transfer to a subsidiary (176,648) - (31,600) -
Transfers from a subsidiary and an associate (13,781)
- 959
-
Reclassification 21,163 - - - Translation adjustment 12,060 (9,373) - -
Closing net book value 197,808 325,030 959 31,600
In March 2019, the Company purchased the additional shares of TMAC Company Limited from another investor. The additional investment increased shareholding of the Company from 51.00% to 100.00% (Note 14.1). The carrying amount at the step acquisition date approximated the fair value. The Company reclassified the net book value from investment in joint ventures to investment in subsidiaries. In April 2019, the Company restructured the holding interests in Seafood International One FZCO (SIC1), which was previously classified as a subsidiary, and Seafood International Two FZCO (SIC2), which was previously classified as an associate. The Company transferred 50% holding interests in SIC1 to SIC2 and increased shareholding in SIC2 from 40% to 50%. The Company has reclassified an investment in SIC2 to investment in a joint venture.
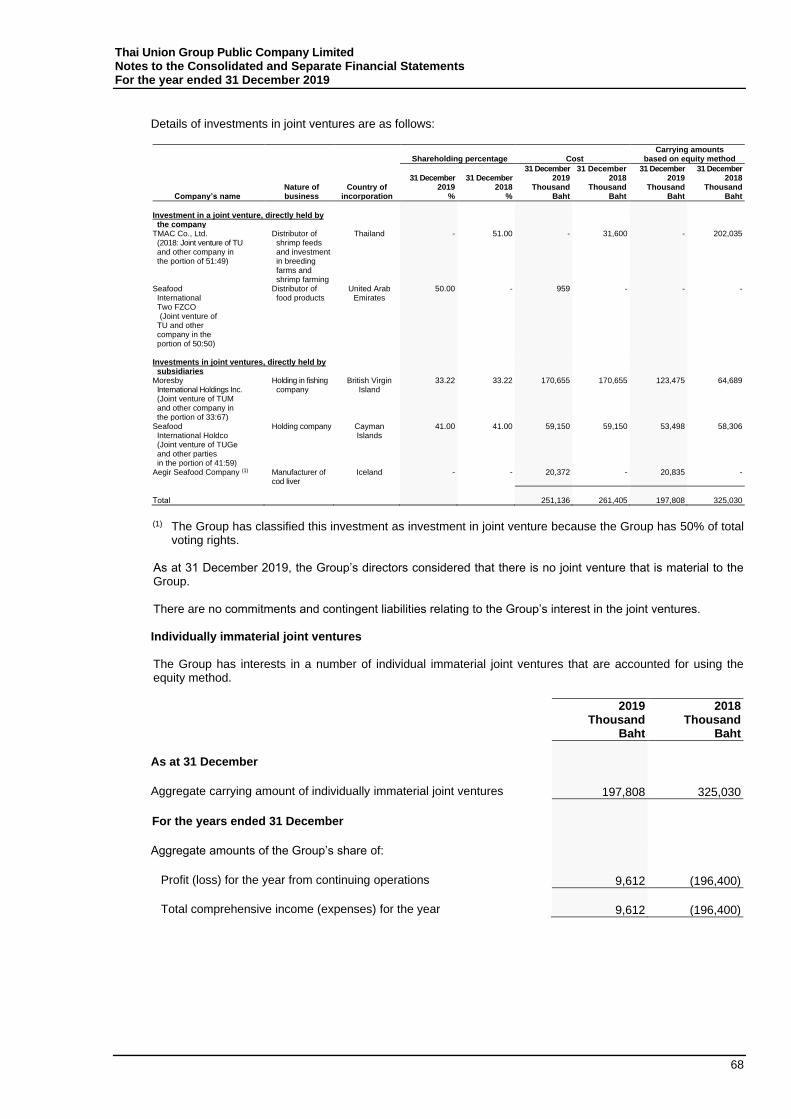
Thai Union Group Public Company Limited Notes to the Consolidated and Separate Financial Statements For the year ended 31 December 2019
68
Details of investments in joint ventures are as follows:
Shareholding percentage Cost Carrying amounts
based on equity method
Company’s name
Nature of business
Country of
incorporation
31 December 2019
%
31 December 2018
%
31 December 2019
Thousand Baht
31 December 2018
Thousand Baht
31 December 2019
Thousand Baht
31 December 2018
Thousand Baht
Investment in a joint venture, directly held by the company
TMAC Co., Ltd. (2018: Joint venture of TU and other company in the portion of 51:49)
Distributor of shrimp feeds and investment in breeding farms and shrimp farming
Thailand - 51.00 - 31,600 - 202,035
Seafood International Two FZCO
(Joint venture of TU and other company in the portion of 50:50)
Distributor of food products
United Arab Emirates
50.00 - 959 - - -
Investments in joint ventures, directly held by subsidiaries
Moresby International Holdings Inc. (Joint venture of TUM and other company in the portion of 33:67)
Holding in fishing company
British Virgin Island
33.22 33.22 170,655 170,655 123,475 64,689
Seafood International Holdco (Joint venture of TUGe and other parties in the portion of 41:59)
Holding company Cayman Islands
41.00 41.00 59,150
59,150
53,498 58,306
Aegir Seafood Company (1) Manufacturer of cod liver
Iceland - - 20,372 - 20,835 -
Total 251,136 261,405 197,808 325,030
(1) The Group has classified this investment as investment in joint venture because the Group has 50% of total
voting rights. As at 31 December 2019, the Group’s directors considered that there is no joint venture that is material to the Group. There are no commitments and contingent liabilities relating to the Group’s interest in the joint ventures. Individually immaterial joint ventures The Group has interests in a number of individual immaterial joint ventures that are accounted for using the equity method.
2019 Thousand
Baht
2018 Thousand
Baht
As at 31 December Aggregate carrying amount of individually immaterial joint ventures 197,808 325,030
For the years ended 31 December Aggregate amounts of the Group’s share of: Profit (loss) for the year from continuing operations 9,612 (196,400)
Total comprehensive income (expenses) for the year 9,612 (196,400)
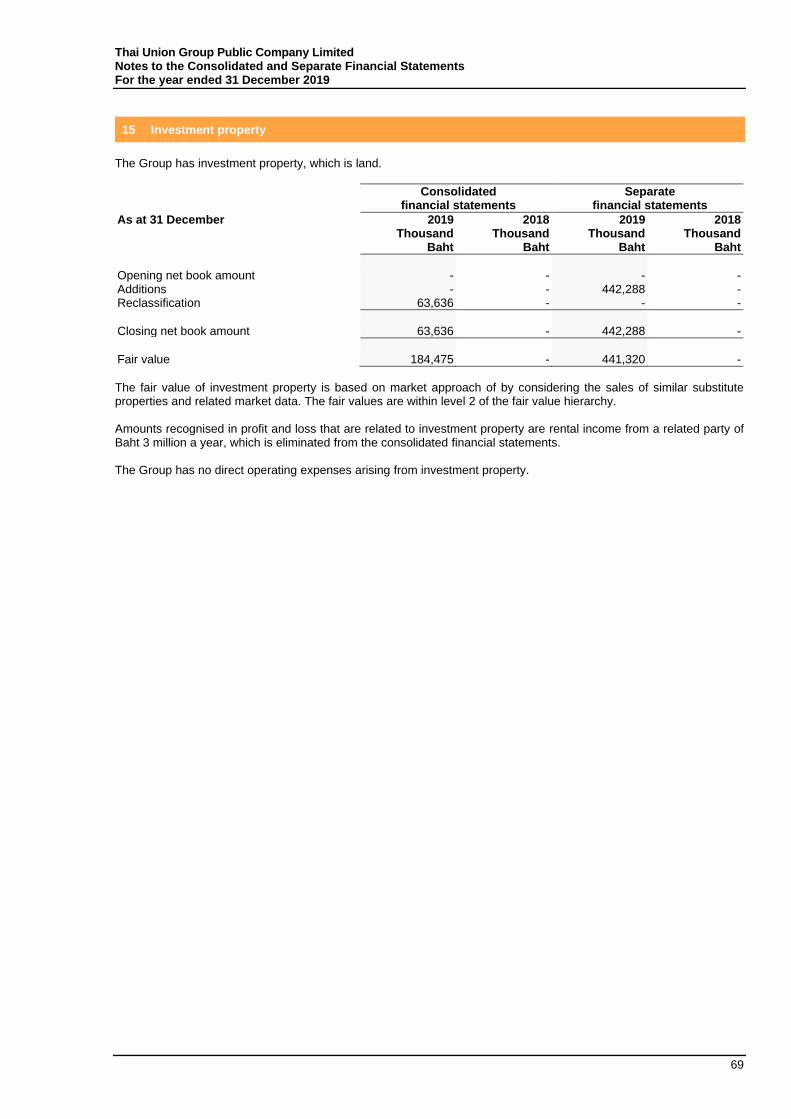
Thai Union Group Public Company Limited Notes to the Consolidated and Separate Financial Statements For the year ended 31 December 2019
69
15 Investment property
The Group has investment property, which is land.
Consolidated financial statements
Separate financial statements
As at 31 December 2019 2018 2019 2018 Thousand Thousand Thousand Thousand Baht Baht Baht Baht
Opening net book amount - - - - Additions - - 442,288 - Reclassification 63,636 - - -
Closing net book amount 63,636 - 442,288 -
Fair value 184,475 - 441,320 -
The fair value of investment property is based on market approach of by considering the sales of similar substitute properties and related market data. The fair values are within level 2 of the fair value hierarchy. Amounts recognised in profit and loss that are related to investment property are rental income from a related party of Baht 3 million a year, which is eliminated from the consolidated financial statements. The Group has no direct operating expenses arising from investment property.
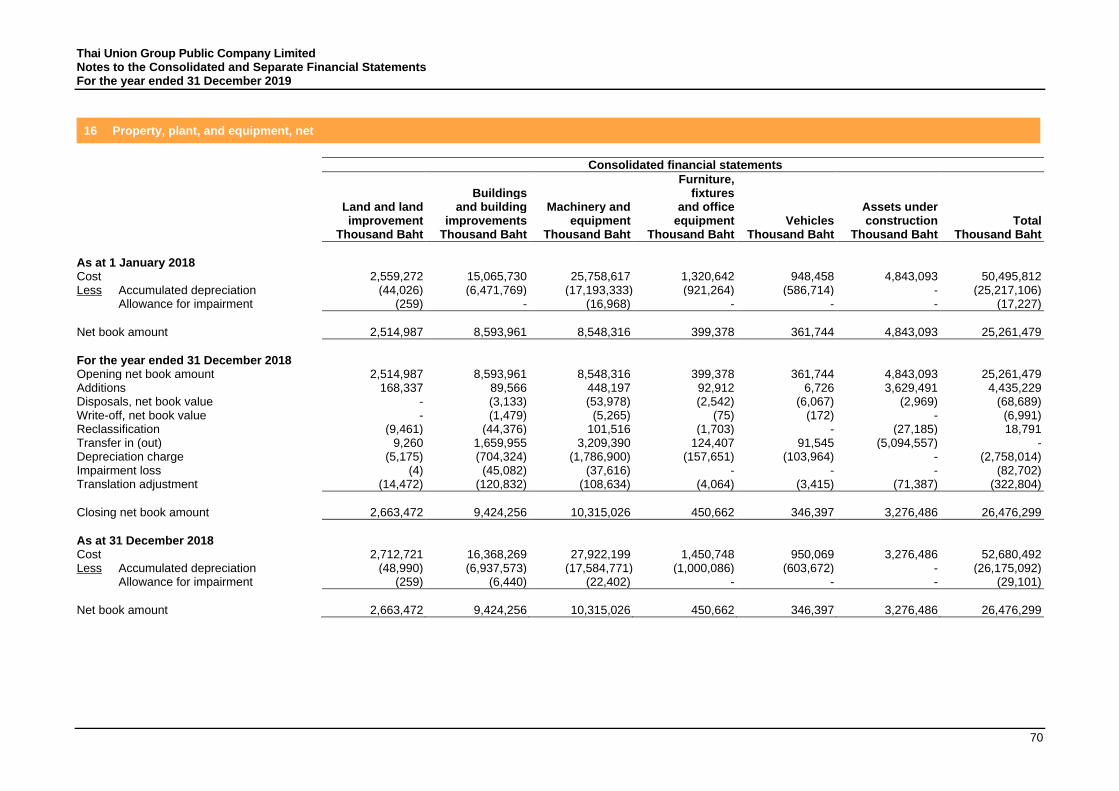
Thai Union Group Public Company Limited Notes to the Consolidated and Separate Financial Statements For the year ended 31 December 2019
70
16 Property, plant, and equipment, net
Consolidated financial statements
Furniture, Buildings fixtures Land and land and building Machinery and and office Assets under improvement improvements equipment equipment Vehicles construction Total Thousand Baht Thousand Baht Thousand Baht Thousand Baht Thousand Baht Thousand Baht Thousand Baht
As at 1 January 2018 Cost 2,559,272 15,065,730 25,758,617 1,320,642 948,458 4,843,093 50,495,812 Less Accumulated depreciation (44,026) (6,471,769) (17,193,333) (921,264) (586,714) - (25,217,106) Allowance for impairment (259) - (16,968) - - - (17,227)
Net book amount 2,514,987 8,593,961 8,548,316 399,378 361,744 4,843,093 25,261,479
For the year ended 31 December 2018 Opening net book amount 2,514,987 8,593,961 8,548,316 399,378 361,744 4,843,093 25,261,479 Additions 168,337 89,566 448,197 92,912 6,726 3,629,491 4,435,229 Disposals, net book value - (3,133) (53,978) (2,542) (6,067) (2,969) (68,689) Write-off, net book value - (1,479) (5,265) (75) (172) - (6,991) Reclassification (9,461) (44,376) 101,516 (1,703) - (27,185) 18,791 Transfer in (out) 9,260 1,659,955 3,209,390 124,407 91,545 (5,094,557) - Depreciation charge (5,175) (704,324) (1,786,900) (157,651) (103,964) - (2,758,014) Impairment loss (4) (45,082) (37,616) - - - (82,702) Translation adjustment (14,472) (120,832) (108,634) (4,064) (3,415) (71,387) (322,804)
Closing net book amount 2,663,472 9,424,256 10,315,026 450,662 346,397 3,276,486 26,476,299
As at 31 December 2018 Cost 2,712,721 16,368,269 27,922,199 1,450,748 950,069 3,276,486 52,680,492 Less Accumulated depreciation (48,990) (6,937,573) (17,584,771) (1,000,086) (603,672) - (26,175,092) Allowance for impairment (259) (6,440) (22,402) - - - (29,101)
Net book amount 2,663,472 9,424,256 10,315,026 450,662 346,397 3,276,486 26,476,299
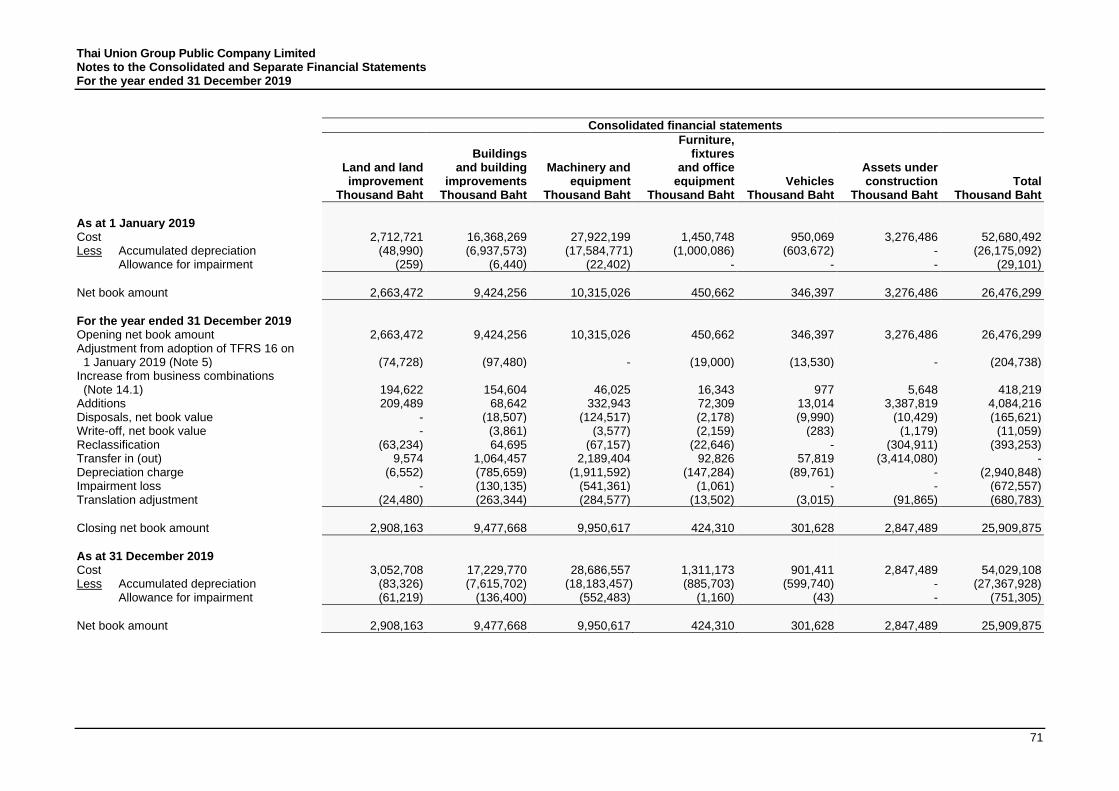
Thai Union Group Public Company Limited Notes to the Consolidated and Separate Financial Statements For the year ended 31 December 2019
71
Consolidated financial statements
Furniture, Buildings fixtures Land and land and building Machinery and and office Assets under improvement improvements equipment equipment Vehicles construction Total Thousand Baht Thousand Baht Thousand Baht Thousand Baht Thousand Baht Thousand Baht Thousand Baht
As at 1 January 2019 Cost 2,712,721 16,368,269 27,922,199 1,450,748 950,069 3,276,486 52,680,492 Less Accumulated depreciation (48,990) (6,937,573) (17,584,771) (1,000,086) (603,672) - (26,175,092) Allowance for impairment (259) (6,440) (22,402) - - - (29,101)
Net book amount 2,663,472 9,424,256 10,315,026 450,662 346,397 3,276,486 26,476,299
For the year ended 31 December 2019 Opening net book amount 2,663,472 9,424,256 10,315,026 450,662 346,397 3,276,486 26,476,299 Adjustment from adoption of TFRS 16 on 1 January 2019 (Note 5) (74,728) (97,480) - (19,000) (13,530) - (204,738) Increase from business combinations (Note 14.1) 194,622 154,604 46,025 16,343 977 5,648 418,219 Additions 209,489 68,642 332,943 72,309 13,014 3,387,819 4,084,216 Disposals, net book value - (18,507) (124,517) (2,178) (9,990) (10,429) (165,621) Write-off, net book value - (3,861) (3,577) (2,159) (283) (1,179) (11,059) Reclassification (63,234) 64,695 (67,157) (22,646) - (304,911) (393,253) Transfer in (out) 9,574 1,064,457 2,189,404 92,826 57,819 (3,414,080) - Depreciation charge (6,552) (785,659) (1,911,592) (147,284) (89,761) - (2,940,848) Impairment loss - (130,135) (541,361) (1,061) - - (672,557) Translation adjustment (24,480) (263,344) (284,577) (13,502) (3,015) (91,865) (680,783)
Closing net book amount 2,908,163 9,477,668 9,950,617 424,310 301,628 2,847,489 25,909,875
As at 31 December 2019 Cost 3,052,708 17,229,770 28,686,557 1,311,173 901,411 2,847,489 54,029,108 Less Accumulated depreciation (83,326) (7,615,702) (18,183,457) (885,703) (599,740) - (27,367,928) Allowance for impairment (61,219) (136,400) (552,483) (1,160) (43) - (751,305)
Net book amount 2,908,163 9,477,668 9,950,617 424,310 301,628 2,847,489 25,909,875
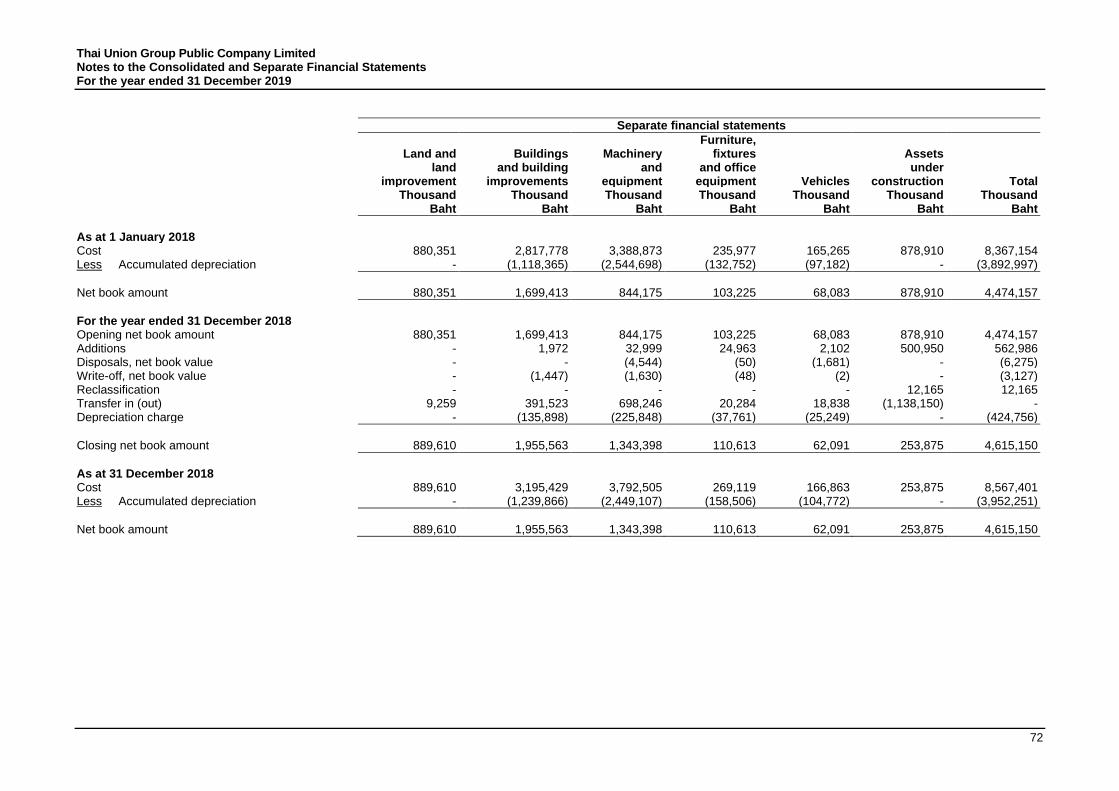
Thai Union Group Public Company Limited Notes to the Consolidated and Separate Financial Statements For the year ended 31 December 2019
72
Separate financial statements
Furniture, Land and Buildings Machinery fixtures Assets land and building and and office under improvement improvements equipment equipment Vehicles construction Total Thousand
Baht Thousand
Baht Thousand
Baht Thousand
Baht Thousand
Baht Thousand
Baht Thousand
Baht
As at 1 January 2018 Cost 880,351 2,817,778 3,388,873 235,977 165,265 878,910 8,367,154 Less Accumulated depreciation - (1,118,365) (2,544,698) (132,752) (97,182) - (3,892,997)
Net book amount 880,351 1,699,413 844,175 103,225 68,083 878,910 4,474,157
For the year ended 31 December 2018 Opening net book amount 880,351 1,699,413 844,175 103,225 68,083 878,910 4,474,157 Additions - 1,972 32,999 24,963 2,102 500,950 562,986 Disposals, net book value - - (4,544) (50) (1,681) - (6,275) Write-off, net book value - (1,447) (1,630) (48) (2) - (3,127) Reclassification - - - - - 12,165 12,165 Transfer in (out) 9,259 391,523 698,246 20,284 18,838 (1,138,150) - Depreciation charge - (135,898) (225,848) (37,761) (25,249) - (424,756)
Closing net book amount 889,610 1,955,563 1,343,398 110,613 62,091 253,875 4,615,150
As at 31 December 2018 Cost 889,610 3,195,429 3,792,505 269,119 166,863 253,875 8,567,401 Less Accumulated depreciation - (1,239,866) (2,449,107) (158,506) (104,772) - (3,952,251)
Net book amount 889,610 1,955,563 1,343,398 110,613 62,091 253,875 4,615,150
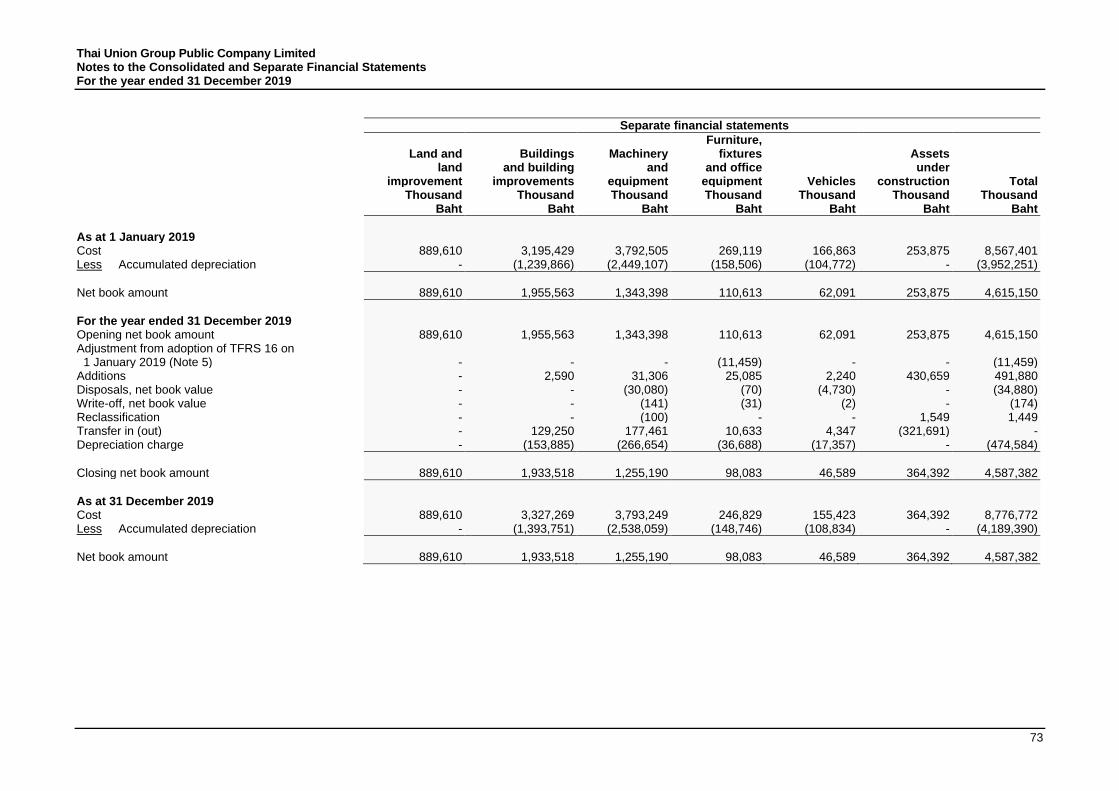
Thai Union Group Public Company Limited Notes to the Consolidated and Separate Financial Statements For the year ended 31 December 2019
73
Separate financial statements
Furniture, Land and Buildings Machinery fixtures Assets land and building and and office under improvement improvements equipment equipment Vehicles construction Total Thousand
Baht Thousand
Baht Thousand
Baht Thousand
Baht Thousand
Baht Thousand
Baht Thousand
Baht
As at 1 January 2019 Cost 889,610 3,195,429 3,792,505 269,119 166,863 253,875 8,567,401 Less Accumulated depreciation - (1,239,866) (2,449,107) (158,506) (104,772) - (3,952,251)
Net book amount 889,610 1,955,563 1,343,398 110,613 62,091 253,875 4,615,150
For the year ended 31 December 2019 Opening net book amount 889,610 1,955,563 1,343,398 110,613 62,091 253,875 4,615,150 Adjustment from adoption of TFRS 16 on 1 January 2019 (Note 5) - - - (11,459) - - (11,459) Additions - 2,590 31,306 25,085 2,240 430,659 491,880 Disposals, net book value - - (30,080) (70) (4,730) - (34,880) Write-off, net book value - - (141) (31) (2) - (174) Reclassification - - (100) - - 1,549 1,449 Transfer in (out) - 129,250 177,461 10,633 4,347 (321,691) - Depreciation charge - (153,885) (266,654) (36,688) (17,357) - (474,584)
Closing net book amount 889,610 1,933,518 1,255,190 98,083 46,589 364,392 4,587,382
As at 31 December 2019 Cost 889,610 3,327,269 3,793,249 246,829 155,423 364,392 8,776,772 Less Accumulated depreciation - (1,393,751) (2,538,059) (148,746) (108,834) - (4,189,390)
Net book amount 889,610 1,933,518 1,255,190 98,083 46,589 364,392 4,587,382
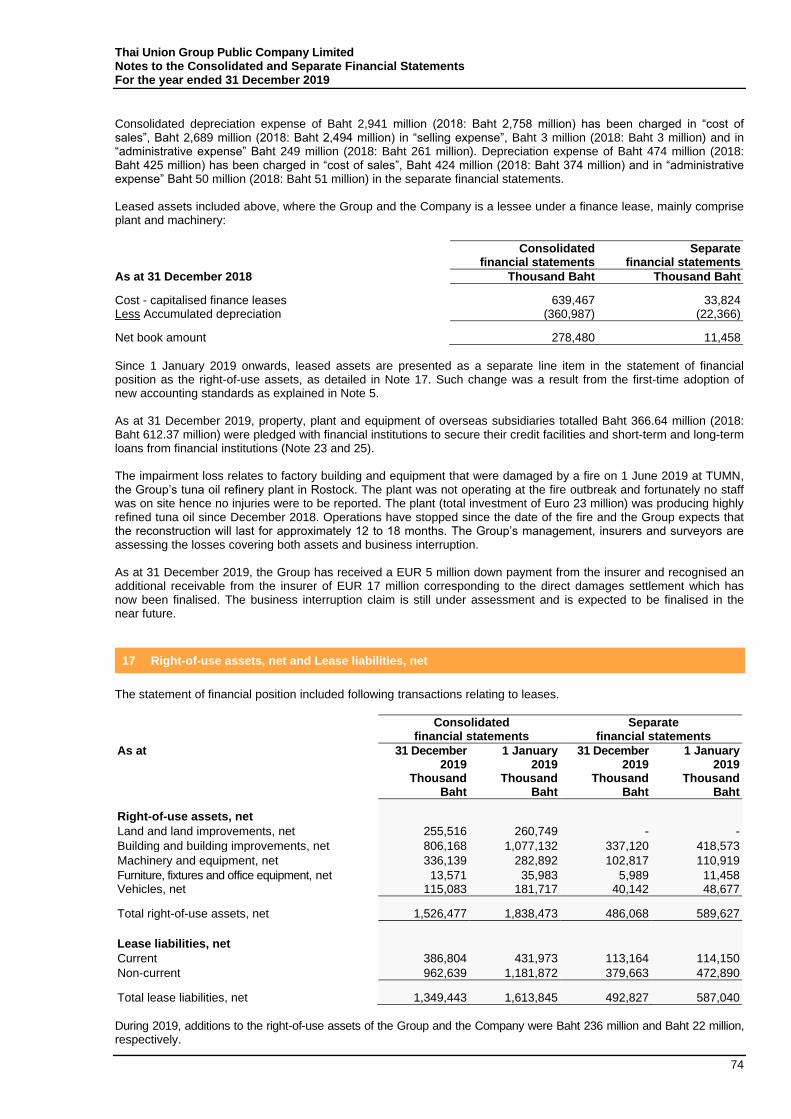
Thai Union Group Public Company Limited Notes to the Consolidated and Separate Financial Statements For the year ended 31 December 2019
74
Consolidated depreciation expense of Baht 2,941 million (2018: Baht 2,758 million) has been charged in “cost of sales”, Baht 2,689 million (2018: Baht 2,494 million) in “selling expense”, Baht 3 million (2018: Baht 3 million) and in “administrative expense” Baht 249 million (2018: Baht 261 million). Depreciation expense of Baht 474 million (2018: Baht 425 million) has been charged in “cost of sales”, Baht 424 million (2018: Baht 374 million) and in “administrative expense” Baht 50 million (2018: Baht 51 million) in the separate financial statements. Leased assets included above, where the Group and the Company is a lessee under a finance lease, mainly comprise plant and machinery:
Consolidated financial statements
Separate financial statements
As at 31 December 2018 Thousand Baht Thousand Baht
Cost - capitalised finance leases 639,467 33,824 Less Accumulated depreciation (360,987) (22,366)
Net book amount 278,480 11,458
Since 1 January 2019 onwards, leased assets are presented as a separate line item in the statement of financial position as the right-of-use assets, as detailed in Note 17. Such change was a result from the first-time adoption of new accounting standards as explained in Note 5. As at 31 December 2019, property, plant and equipment of overseas subsidiaries totalled Baht 366.64 million (2018: Baht 612.37 million) were pledged with financial institutions to secure their credit facilities and short-term and long-term loans from financial institutions (Note 23 and 25). The impairment loss relates to factory building and equipment that were damaged by a fire on 1 June 2019 at TUMN, the Group’s tuna oil refinery plant in Rostock. The plant was not operating at the fire outbreak and fortunately no staff was on site hence no injuries were to be reported. The plant (total investment of Euro 23 million) was producing highly refined tuna oil since December 2018. Operations have stopped since the date of the fire and the Group expects that the reconstruction will last for approximately 12 to 18 months. The Group’s management, insurers and surveyors are assessing the losses covering both assets and business interruption. As at 31 December 2019, the Group has received a EUR 5 million down payment from the insurer and recognised an additional receivable from the insurer of EUR 17 million corresponding to the direct damages settlement which has now been finalised. The business interruption claim is still under assessment and is expected to be finalised in the near future.
17 Right-of-use assets, net and Lease liabilities, net
The statement of financial position included following transactions relating to leases.
Consolidated financial statements
Separate financial statements
As at 31 December 2019
1 January 2019
31 December 2019
1 January 2019
Thousand Thousand Thousand Thousand Baht Baht Baht Baht
Right-of-use assets, net
Land and land improvements, net 255,516 260,749 - -
Building and building improvements, net 806,168 1,077,132 337,120 418,573
Machinery and equipment, net 336,139 282,892 102,817 110,919
Furniture, fixtures and office equipment, net 13,571 35,983 5,989 11,458 Vehicles, net 115,083 181,717 40,142 48,677
Total right-of-use assets, net 1,526,477 1,838,473 486,068 589,627
Lease liabilities, net
Current 386,804 431,973 113,164 114,150
Non-current 962,639 1,181,872 379,663 472,890
Total lease liabilities, net 1,349,443 1,613,845 492,827 587,040
During 2019, additions to the right-of-use assets of the Group and the Company were Baht 236 million and Baht 22 million, respectively.
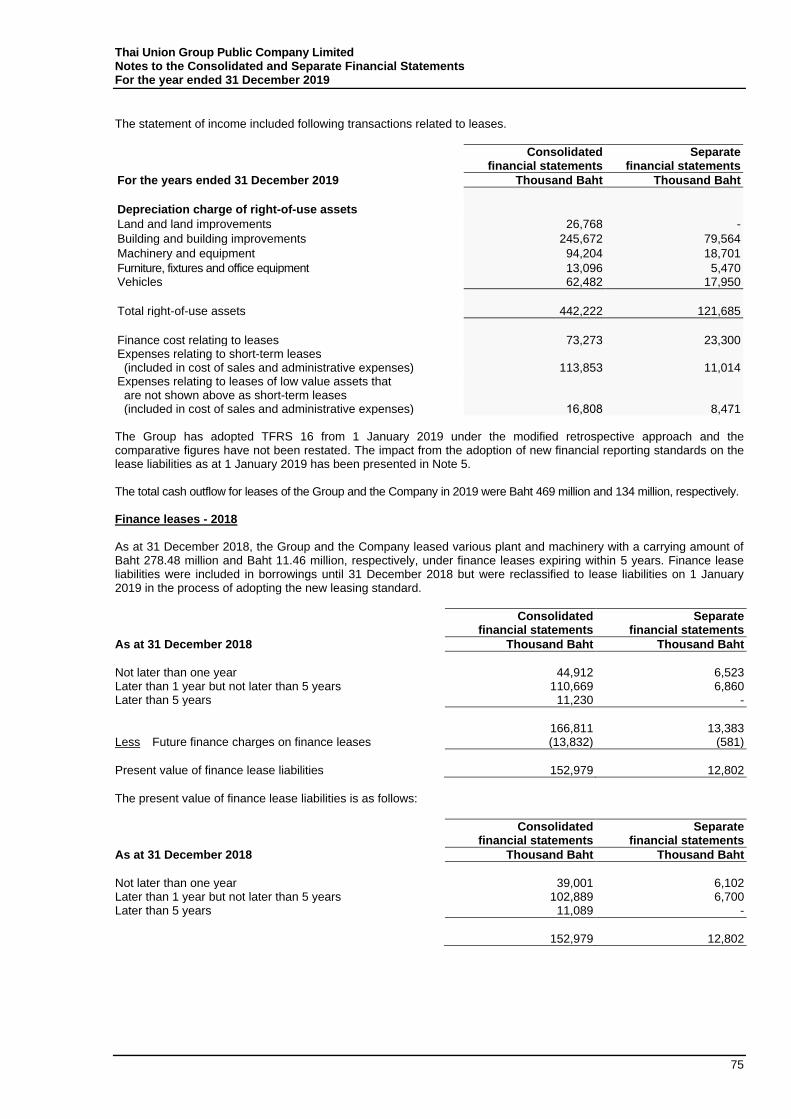
Thai Union Group Public Company Limited Notes to the Consolidated and Separate Financial Statements For the year ended 31 December 2019
75
The statement of income included following transactions related to leases.
Consolidated financial statements
Separate financial statements
For the years ended 31 December 2019 Thousand Baht Thousand Baht
Depreciation charge of right-of-use assets
Land and land improvements 26,768 -
Building and building improvements 245,672 79,564
Machinery and equipment 94,204 18,701
Furniture, fixtures and office equipment 13,096 5,470 Vehicles 62,482 17,950
Total right-of-use assets 442,222 121,685
Finance cost relating to leases 73,273 23,300 Expenses relating to short-term leases (included in cost of sales and administrative expenses) 113,853 11,014 Expenses relating to leases of low value assets that are not shown above as short-term leases (included in cost of sales and administrative expenses) 16,808 8,471 The Group has adopted TFRS 16 from 1 January 2019 under the modified retrospective approach and the comparative figures have not been restated. The impact from the adoption of new financial reporting standards on the lease liabilities as at 1 January 2019 has been presented in Note 5. The total cash outflow for leases of the Group and the Company in 2019 were Baht 469 million and 134 million, respectively. Finance leases - 2018 As at 31 December 2018, the Group and the Company leased various plant and machinery with a carrying amount of Baht 278.48 million and Baht 11.46 million, respectively, under finance leases expiring within 5 years. Finance lease liabilities were included in borrowings until 31 December 2018 but were reclassified to lease liabilities on 1 January 2019 in the process of adopting the new leasing standard.
Consolidated financial statements
Separate financial statements
As at 31 December 2018 Thousand Baht Thousand Baht
Not later than one year 44,912 6,523 Later than 1 year but not later than 5 years 110,669 6,860 Later than 5 years 11,230 -
166,811 13,383 Less Future finance charges on finance leases (13,832) (581)
Present value of finance lease liabilities 152,979 12,802
The present value of finance lease liabilities is as follows:
Consolidated financial statements
Separate financial statements
As at 31 December 2018 Thousand Baht Thousand Baht
Not later than one year 39,001 6,102 Later than 1 year but not later than 5 years 102,889 6,700 Later than 5 years 11,089 -
152,979 12,802
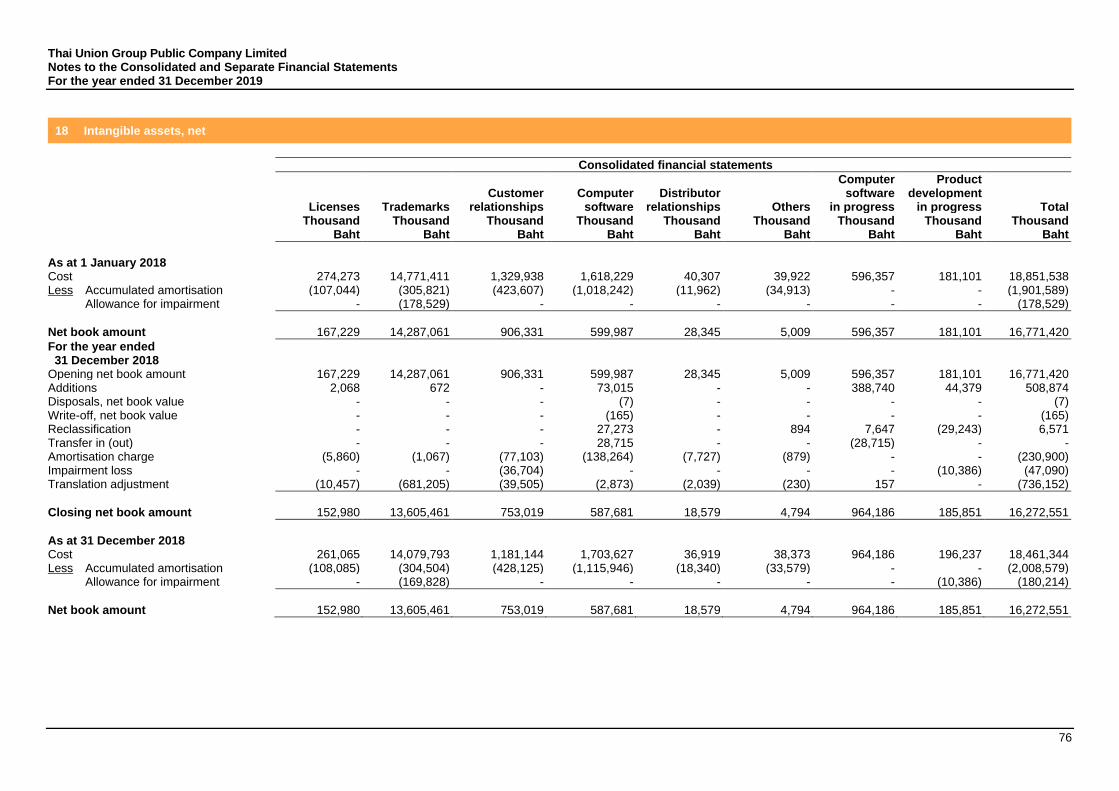
Thai Union Group Public Company Limited Notes to the Consolidated and Separate Financial Statements For the year ended 31 December 2019
76
18 Intangible assets, net
Consolidated financial statements
Customer
Computer
Distributor
Computer software
Product development
Licenses Trademarks relationships software relationships Others in progress in progress Total Thousand
Baht Thousand
Baht Thousand
Baht Thousand
Baht Thousand
Baht Thousand
Baht Thousand
Baht Thousand
Baht Thousand
Baht
As at 1 January 2018 Cost 274,273 14,771,411 1,329,938 1,618,229 40,307 39,922 596,357 181,101 18,851,538 Less Accumulated amortisation (107,044) (305,821) (423,607) (1,018,242) (11,962) (34,913) - - (1,901,589) Allowance for impairment - (178,529) - - - - - - (178,529)
Net book amount 167,229 14,287,061 906,331 599,987 28,345 5,009 596,357 181,101 16,771,420
For the year ended 31 December 2018 Opening net book amount 167,229 14,287,061 906,331 599,987 28,345 5,009 596,357 181,101 16,771,420 Additions 2,068 672 - 73,015 - - 388,740 44,379 508,874 Disposals, net book value - - - (7) - - - - (7) Write-off, net book value - - - (165) - - - - (165) Reclassification - - - 27,273 - 894 7,647 (29,243) 6,571 Transfer in (out) - - - 28,715 - - (28,715) - - Amortisation charge (5,860) (1,067) (77,103) (138,264) (7,727) (879) - - (230,900) Impairment loss - - (36,704) - - - - (10,386) (47,090) Translation adjustment (10,457) (681,205) (39,505) (2,873) (2,039) (230) 157 - (736,152)
Closing net book amount 152,980 13,605,461 753,019 587,681 18,579 4,794 964,186 185,851 16,272,551
As at 31 December 2018 Cost 261,065 14,079,793 1,181,144 1,703,627 36,919 38,373 964,186 196,237 18,461,344 Less Accumulated amortisation (108,085) (304,504) (428,125) (1,115,946) (18,340) (33,579) - - (2,008,579) Allowance for impairment - (169,828) - - - - - (10,386) (180,214)
Net book amount 152,980 13,605,461 753,019 587,681 18,579 4,794 964,186 185,851 16,272,551
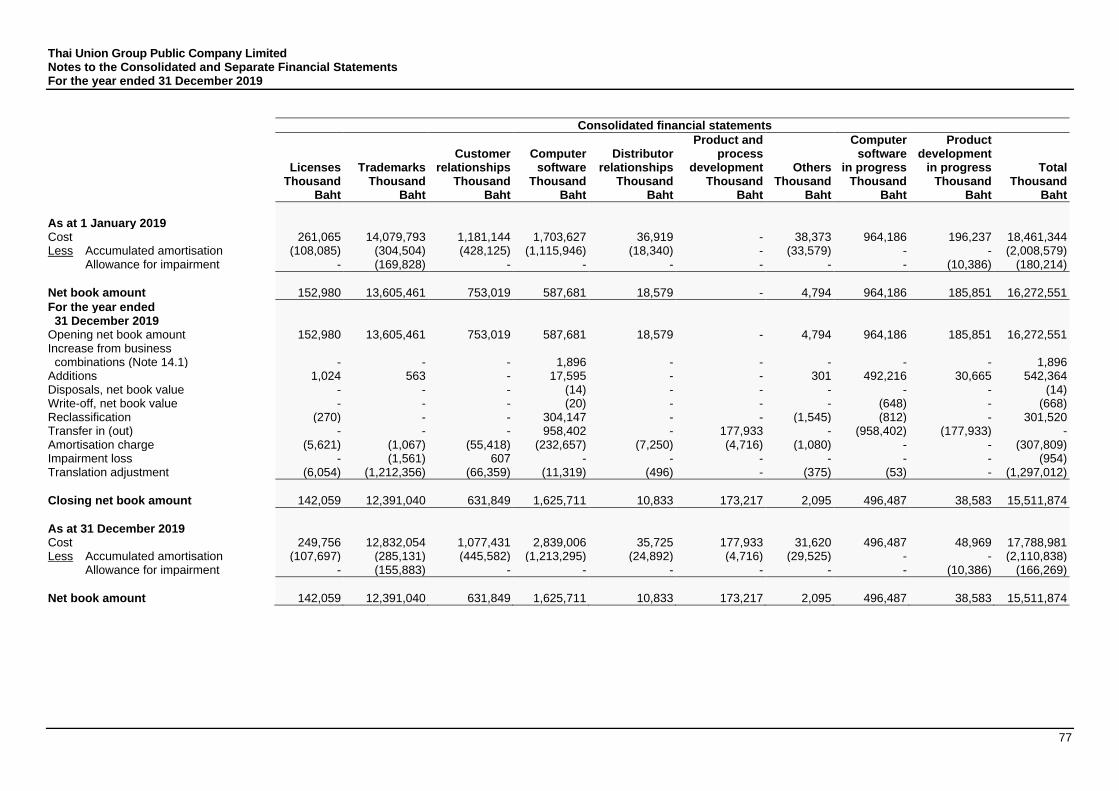
Thai Union Group Public Company Limited Notes to the Consolidated and Separate Financial Statements For the year ended 31 December 2019
77
Consolidated financial statements
Customer
Computer
Distributor
Product and process
Computer software
Product development
Licenses Trademarks relationships software relationships development Others in progress in progress Total Thousand
Baht Thousand
Baht Thousand
Baht Thousand
Baht Thousand
Baht Thousand
Baht Thousand
Baht Thousand
Baht Thousand
Baht Thousand
Baht
As at 1 January 2019 Cost 261,065 14,079,793 1,181,144 1,703,627 36,919 - 38,373 964,186 196,237 18,461,344 Less Accumulated amortisation (108,085) (304,504) (428,125) (1,115,946) (18,340) - (33,579) - - (2,008,579) Allowance for impairment - (169,828) - - - - - - (10,386) (180,214)
Net book amount 152,980 13,605,461 753,019 587,681 18,579 - 4,794 964,186 185,851 16,272,551
For the year ended 31 December 2019 Opening net book amount 152,980 13,605,461 753,019 587,681 18,579 - 4,794 964,186 185,851 16,272,551 Increase from business combinations (Note 14.1) - - - 1,896 -
- - - - 1,896
Additions 1,024 563 - 17,595 - - 301 492,216 30,665 542,364 Disposals, net book value - - - (14) - - - - - (14) Write-off, net book value - - - (20) - - - (648) - (668) Reclassification (270) - - 304,147 - - (1,545) (812) - 301,520 Transfer in (out) - - - 958,402 - 177,933 - (958,402) (177,933) - Amortisation charge (5,621) (1,067) (55,418) (232,657) (7,250) (4,716) (1,080) - - (307,809) Impairment loss - (1,561) 607 - - - - - - (954) Translation adjustment (6,054) (1,212,356) (66,359) (11,319) (496) - (375) (53) - (1,297,012)
Closing net book amount 142,059 12,391,040 631,849 1,625,711 10,833 173,217 2,095 496,487 38,583 15,511,874
As at 31 December 2019 Cost 249,756 12,832,054 1,077,431 2,839,006 35,725 177,933 31,620 496,487 48,969 17,788,981 Less Accumulated amortisation (107,697) (285,131) (445,582) (1,213,295) (24,892) (4,716) (29,525) - - (2,110,838) Allowance for impairment - (155,883) - - - - - - (10,386) (166,269)
Net book amount 142,059 12,391,040 631,849 1,625,711 10,833 173,217 2,095 496,487 38,583 15,511,874
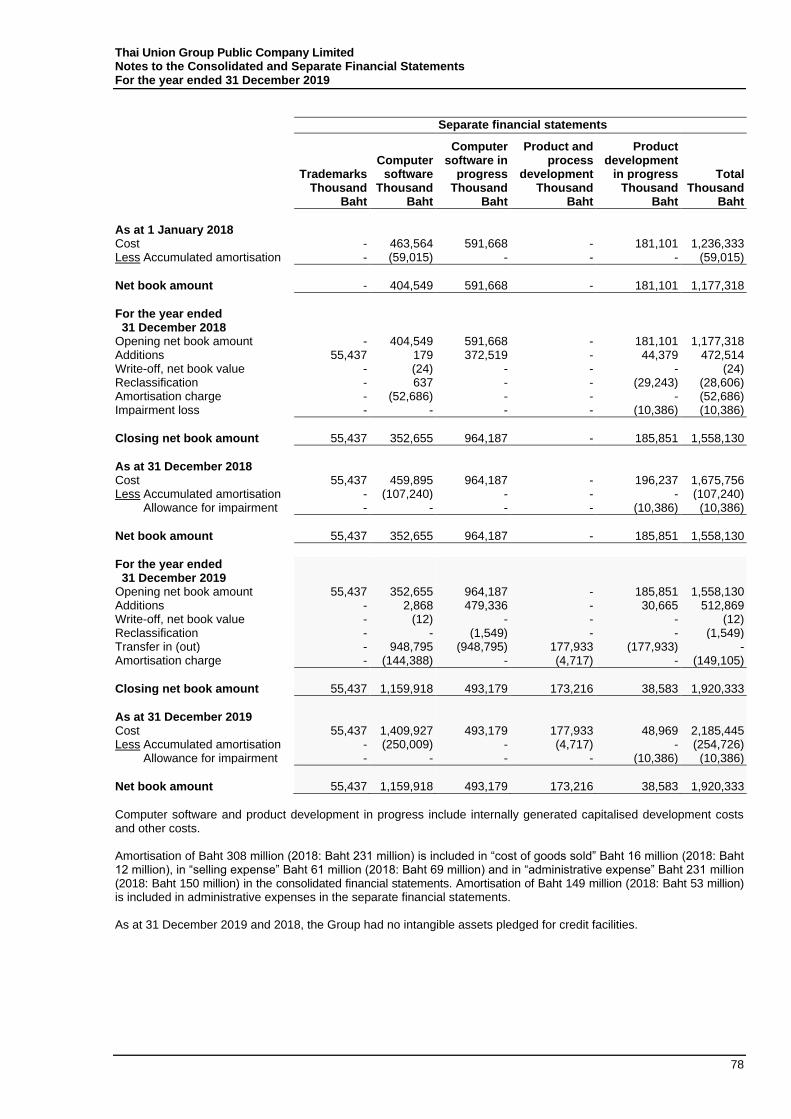
Thai Union Group Public Company Limited Notes to the Consolidated and Separate Financial Statements For the year ended 31 December 2019
78
Separate financial statements
Trademarks Computer
software
Computer software in
progress
Product and process
development
Product development
in progress Total Thousand
Baht Thousand
Baht Thousand
Baht Thousand
Baht Thousand
Baht Thousand
Baht
As at 1 January 2018 Cost - 463,564 591,668 - 181,101 1,236,333 Less Accumulated amortisation - (59,015) - - - (59,015)
Net book amount - 404,549 591,668 - 181,101 1,177,318
For the year ended 31 December 2018
Opening net book amount - 404,549 591,668 - 181,101 1,177,318 Additions 55,437 179 372,519 - 44,379 472,514 Write-off, net book value - (24) - - - (24) Reclassification - 637 - - (29,243) (28,606) Amortisation charge - (52,686) - - - (52,686) Impairment loss - - - - (10,386) (10,386)
Closing net book amount 55,437 352,655 964,187 - 185,851 1,558,130
As at 31 December 2018 Cost 55,437 459,895 964,187 - 196,237 1,675,756 Less Accumulated amortisation - (107,240) - - - (107,240) Allowance for impairment - - - - (10,386) (10,386)
Net book amount 55,437 352,655 964,187 - 185,851 1,558,130
For the year ended 31 December 2019
Opening net book amount 55,437 352,655 964,187 - 185,851 1,558,130 Additions - 2,868 479,336 - 30,665 512,869 Write-off, net book value - (12) - - - (12) Reclassification - - (1,549) - - (1,549) Transfer in (out) - 948,795 (948,795) 177,933 (177,933) - Amortisation charge - (144,388) - (4,717) - (149,105)
Closing net book amount 55,437 1,159,918 493,179 173,216 38,583 1,920,333
As at 31 December 2019 Cost 55,437 1,409,927 493,179 177,933 48,969 2,185,445 Less Accumulated amortisation - (250,009) - (4,717) - (254,726) Allowance for impairment - - - - (10,386) (10,386)
Net book amount 55,437 1,159,918 493,179 173,216 38,583 1,920,333
Computer software and product development in progress include internally generated capitalised development costs and other costs. Amortisation of Baht 308 million (2018: Baht 231 million) is included in “cost of goods sold” Baht 16 million (2018: Baht 12 million), in “selling expense” Baht 61 million (2018: Baht 69 million) and in “administrative expense” Baht 231 million (2018: Baht 150 million) in the consolidated financial statements. Amortisation of Baht 149 million (2018: Baht 53 million) is included in administrative expenses in the separate financial statements. As at 31 December 2019 and 2018, the Group had no intangible assets pledged for credit facilities.
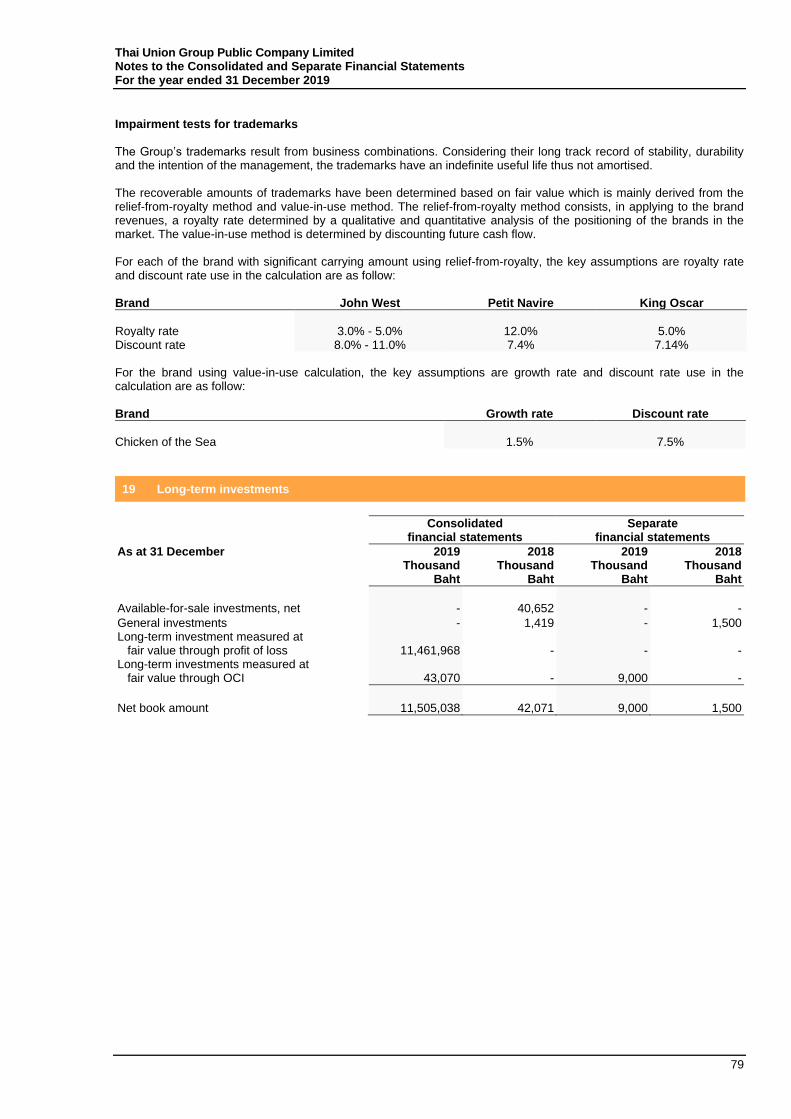
Thai Union Group Public Company Limited Notes to the Consolidated and Separate Financial Statements For the year ended 31 December 2019
79
Impairment tests for trademarks The Group’s trademarks result from business combinations. Considering their long track record of stability, durability and the intention of the management, the trademarks have an indefinite useful life thus not amortised. The recoverable amounts of trademarks have been determined based on fair value which is mainly derived from the relief-from-royalty method and value-in-use method. The relief-from-royalty method consists, in applying to the brand revenues, a royalty rate determined by a qualitative and quantitative analysis of the positioning of the brands in the market. The value-in-use method is determined by discounting future cash flow. For each of the brand with significant carrying amount using relief-from-royalty, the key assumptions are royalty rate and discount rate use in the calculation are as follow: Brand John West Petit Navire King Oscar
Royalty rate 3.0% - 5.0% 12.0% 5.0% Discount rate 8.0% - 11.0% 7.4% 7.14% For the brand using value-in-use calculation, the key assumptions are growth rate and discount rate use in the calculation are as follow: Brand Growth rate Discount rate
Chicken of the Sea 1.5% 7.5%
19 Long-term investments
Consolidated financial statements
Separate financial statements
As at 31 December 2019 2018 2019 2018 Thousand Thousand Thousand Thousand Baht Baht Baht Baht
Available-for-sale investments, net - 40,652 - -
General investments - 1,419 - 1,500 Long-term investment measured at fair value through profit of loss 11,461,968 - - - Long-term investments measured at fair value through OCI 43,070 - 9,000 -
Net book amount 11,505,038 42,071 9,000 1,500
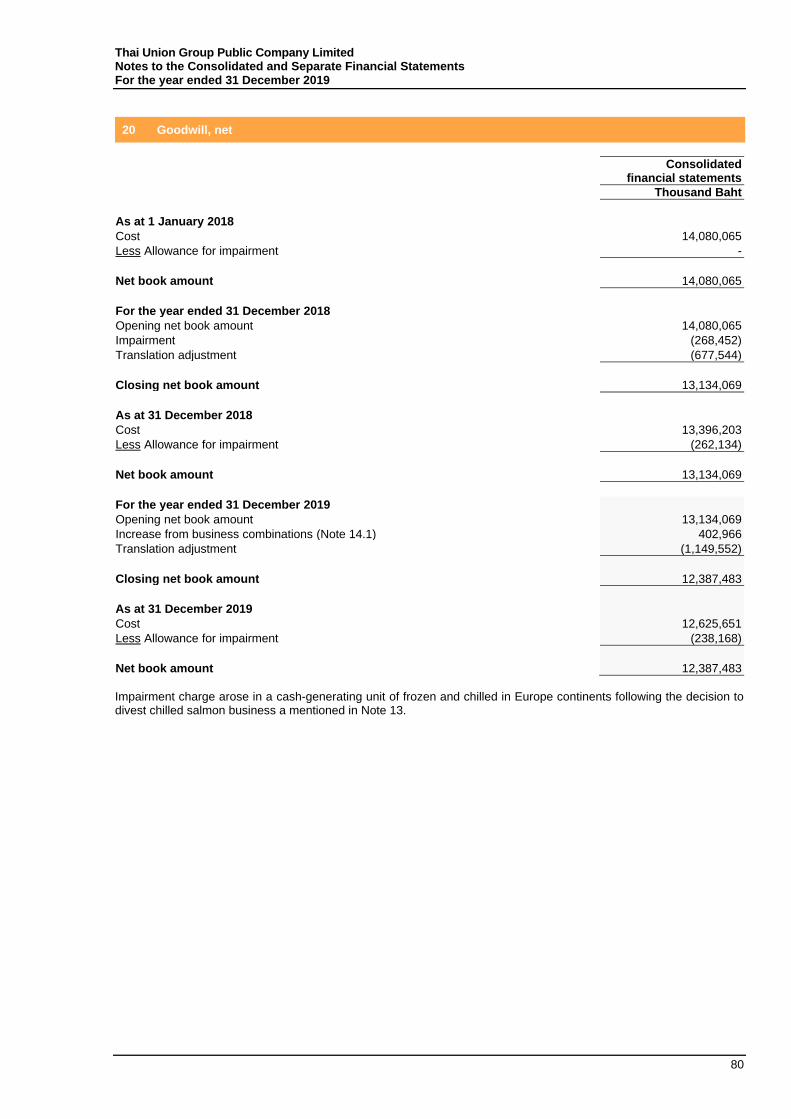
Thai Union Group Public Company Limited Notes to the Consolidated and Separate Financial Statements For the year ended 31 December 2019
80
20 Goodwill, net
Consolidated financial statements
Thousand Baht
As at 1 January 2018
Cost 14,080,065
Less Allowance for impairment -
Net book amount 14,080,065
For the year ended 31 December 2018
Opening net book amount 14,080,065
Impairment (268,452)
Translation adjustment (677,544)
Closing net book amount 13,134,069
As at 31 December 2018
Cost 13,396,203
Less Allowance for impairment (262,134)
Net book amount 13,134,069
For the year ended 31 December 2019
Opening net book amount 13,134,069
Increase from business combinations (Note 14.1) 402,966
Translation adjustment (1,149,552)
Closing net book amount 12,387,483
As at 31 December 2019
Cost 12,625,651
Less Allowance for impairment (238,168)
Net book amount 12,387,483
Impairment charge arose in a cash-generating unit of frozen and chilled in Europe continents following the decision to divest chilled salmon business a mentioned in Note 13.
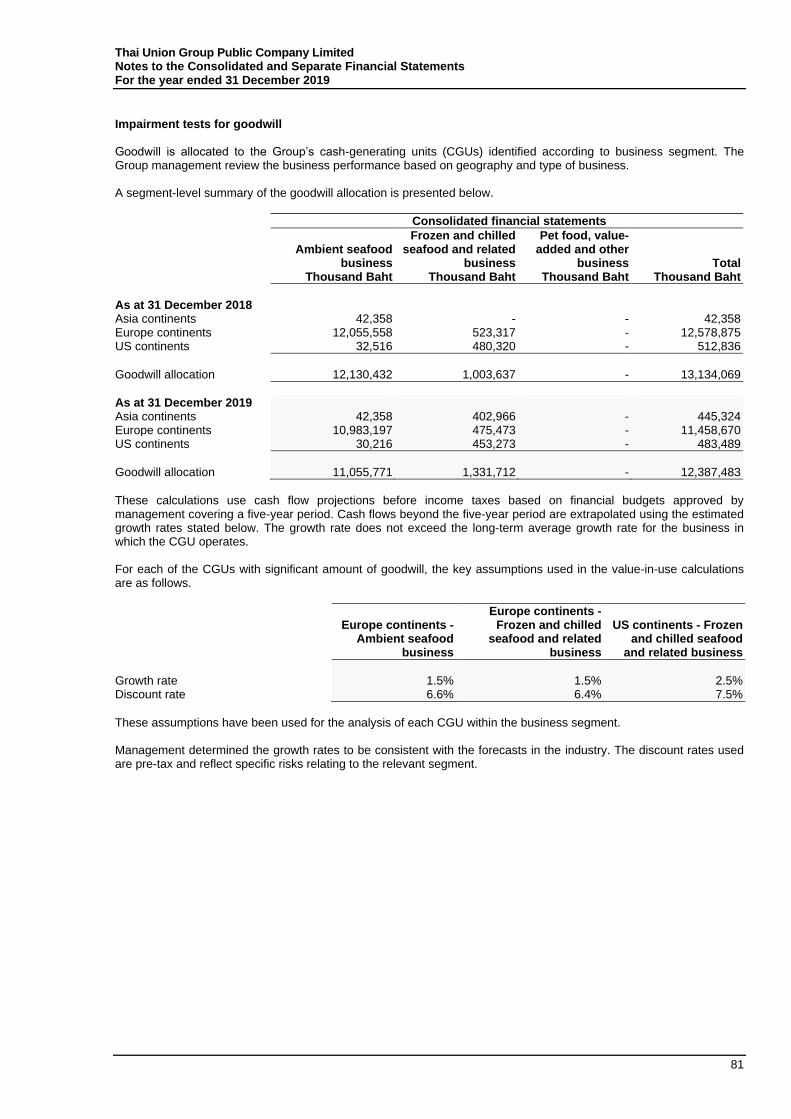
Thai Union Group Public Company Limited Notes to the Consolidated and Separate Financial Statements For the year ended 31 December 2019
81
Impairment tests for goodwill Goodwill is allocated to the Group’s cash-generating units (CGUs) identified according to business segment. The Group management review the business performance based on geography and type of business. A segment-level summary of the goodwill allocation is presented below.
Consolidated financial statements
Ambient seafood
business
Frozen and chilled seafood and related
business
Pet food, value-added and other
business Total Thousand Baht Thousand Baht Thousand Baht Thousand Baht
As at 31 December 2018 Asia continents 42,358 - - 42,358 Europe continents 12,055,558 523,317 - 12,578,875 US continents 32,516 480,320 - 512,836
Goodwill allocation 12,130,432 1,003,637 - 13,134,069
As at 31 December 2019 Asia continents 42,358 402,966 - 445,324 Europe continents 10,983,197 475,473 - 11,458,670 US continents 30,216 453,273 - 483,489
Goodwill allocation 11,055,771 1,331,712 - 12,387,483
These calculations use cash flow projections before income taxes based on financial budgets approved by management covering a five-year period. Cash flows beyond the five-year period are extrapolated using the estimated growth rates stated below. The growth rate does not exceed the long-term average growth rate for the business in which the CGU operates. For each of the CGUs with significant amount of goodwill, the key assumptions used in the value-in-use calculations are as follows.
Europe continents - Ambient seafood
business
Europe continents - Frozen and chilled
seafood and related business
US continents - Frozen and chilled seafood
and related business
Growth rate 1.5% 1.5% 2.5% Discount rate 6.6% 6.4% 7.5%
These assumptions have been used for the analysis of each CGU within the business segment. Management determined the growth rates to be consistent with the forecasts in the industry. The discount rates used are pre-tax and reflect specific risks relating to the relevant segment.
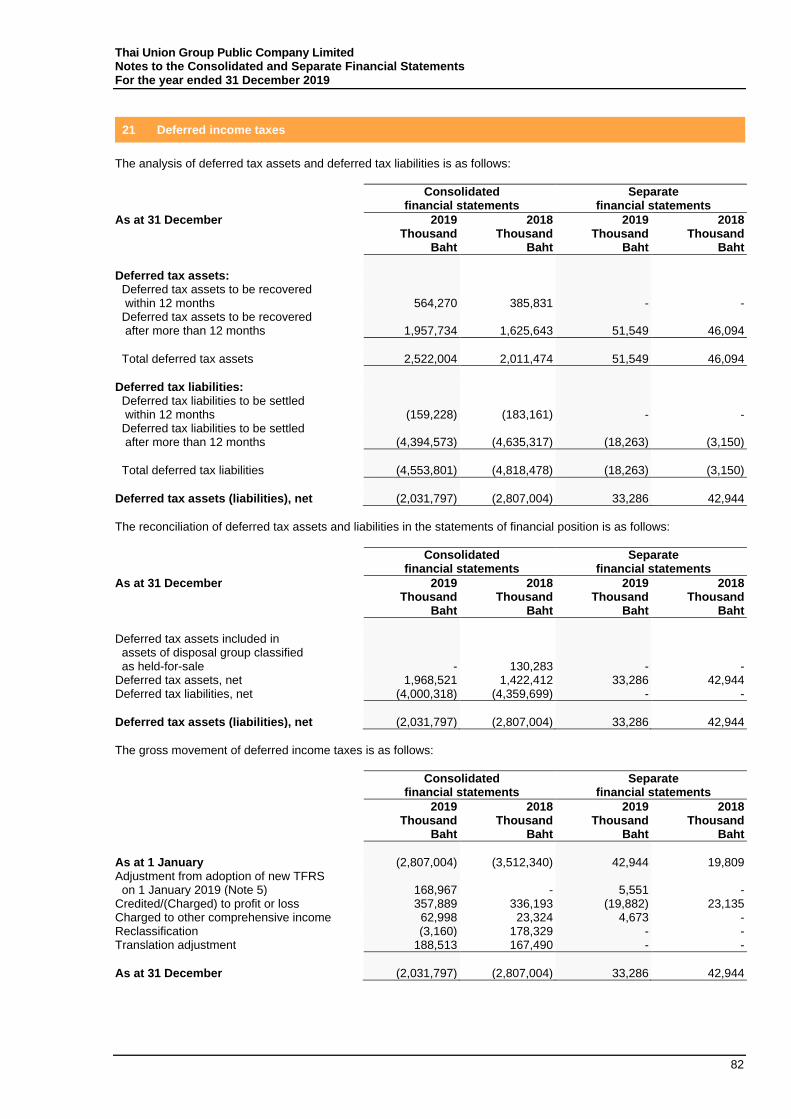
Thai Union Group Public Company Limited Notes to the Consolidated and Separate Financial Statements For the year ended 31 December 2019
82
21 Deferred income taxes
The analysis of deferred tax assets and deferred tax liabilities is as follows:
Consolidated financial statements
Separate financial statements
As at 31 December 2019 2018 2019 2018 Thousand Thousand Thousand Thousand Baht Baht Baht Baht
Deferred tax assets: Deferred tax assets to be recovered within 12 months 564,270 385,831 - - Deferred tax assets to be recovered after more than 12 months 1,957,734 1,625,643 51,549 46,094
Total deferred tax assets 2,522,004 2,011,474 51,549 46,094
Deferred tax liabilities: Deferred tax liabilities to be settled within 12 months (159,228) (183,161) - - Deferred tax liabilities to be settled after more than 12 months (4,394,573) (4,635,317) (18,263) (3,150)
Total deferred tax liabilities (4,553,801) (4,818,478) (18,263) (3,150)
Deferred tax assets (liabilities), net (2,031,797) (2,807,004) 33,286 42,944
The reconciliation of deferred tax assets and liabilities in the statements of financial position is as follows:
Consolidated financial statements
Separate financial statements
As at 31 December 2019 2018 2019 2018 Thousand Thousand Thousand Thousand Baht Baht Baht Baht
Deferred tax assets included in assets of disposal group classified as held-for-sale - 130,283 - - Deferred tax assets, net 1,968,521 1,422,412 33,286 42,944 Deferred tax liabilities, net (4,000,318) (4,359,699) - -
Deferred tax assets (liabilities), net (2,031,797) (2,807,004) 33,286 42,944
The gross movement of deferred income taxes is as follows:
Consolidated financial statements
Separate financial statements
2019 2018 2019 2018 Thousand Thousand Thousand Thousand Baht Baht Baht Baht
As at 1 January (2,807,004) (3,512,340) 42,944 19,809 Adjustment from adoption of new TFRS on 1 January 2019 (Note 5) 168,967 - 5,551 - Credited/(Charged) to profit or loss 357,889 336,193 (19,882) 23,135 Charged to other comprehensive income 62,998 23,324 4,673 - Reclassification (3,160) 178,329 - - Translation adjustment 188,513 167,490 - -
As at 31 December (2,031,797) (2,807,004) 33,286 42,944
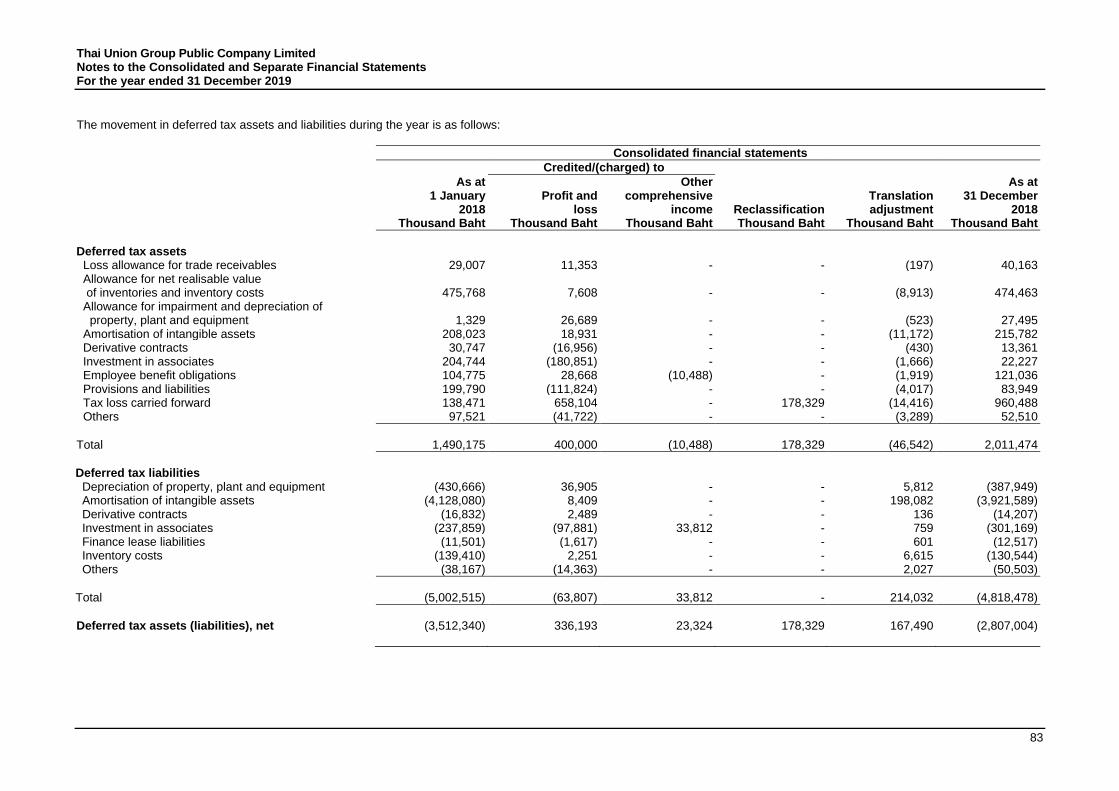
Thai Union Group Public Company Limited Notes to the Consolidated and Separate Financial Statements For the year ended 31 December 2019
83
The movement in deferred tax assets and liabilities during the year is as follows:
Consolidated financial statements
Credited/(charged) to As at
1 January Profit and Other
comprehensive
Translation
As at 31 December
2018 loss income Reclassification adjustment 2018 Thousand Baht Thousand Baht Thousand Baht Thousand Baht Thousand Baht Thousand Baht
Deferred tax assets Loss allowance for trade receivables 29,007 11,353 - - (197) 40,163 Allowance for net realisable value of inventories and inventory costs 475,768 7,608 -
-
(8,913) 474,463
Allowance for impairment and depreciation of property, plant and equipment 1,329 26,689 - -
(523) 27,495
Amortisation of intangible assets 208,023 18,931 - - (11,172) 215,782 Derivative contracts 30,747 (16,956) - - (430) 13,361 Investment in associates 204,744 (180,851) - - (1,666) 22,227 Employee benefit obligations 104,775 28,668 (10,488) - (1,919) 121,036 Provisions and liabilities 199,790 (111,824) - - (4,017) 83,949 Tax loss carried forward 138,471 658,104 - 178,329 (14,416) 960,488 Others 97,521 (41,722) - - (3,289) 52,510
Total 1,490,175 400,000 (10,488) 178,329 (46,542) 2,011,474
Deferred tax liabilities Depreciation of property, plant and equipment (430,666) 36,905 - - 5,812 (387,949) Amortisation of intangible assets (4,128,080) 8,409 - - 198,082 (3,921,589) Derivative contracts (16,832) 2,489 - - 136 (14,207) Investment in associates (237,859) (97,881) 33,812 - 759 (301,169) Finance lease liabilities (11,501) (1,617) - - 601 (12,517) Inventory costs (139,410) 2,251 - - 6,615 (130,544) Others (38,167) (14,363) - - 2,027 (50,503)
Total (5,002,515) (63,807) 33,812 - 214,032 (4,818,478)
Deferred tax assets (liabilities), net (3,512,340) 336,193 23,324 178,329 167,490 (2,807,004)
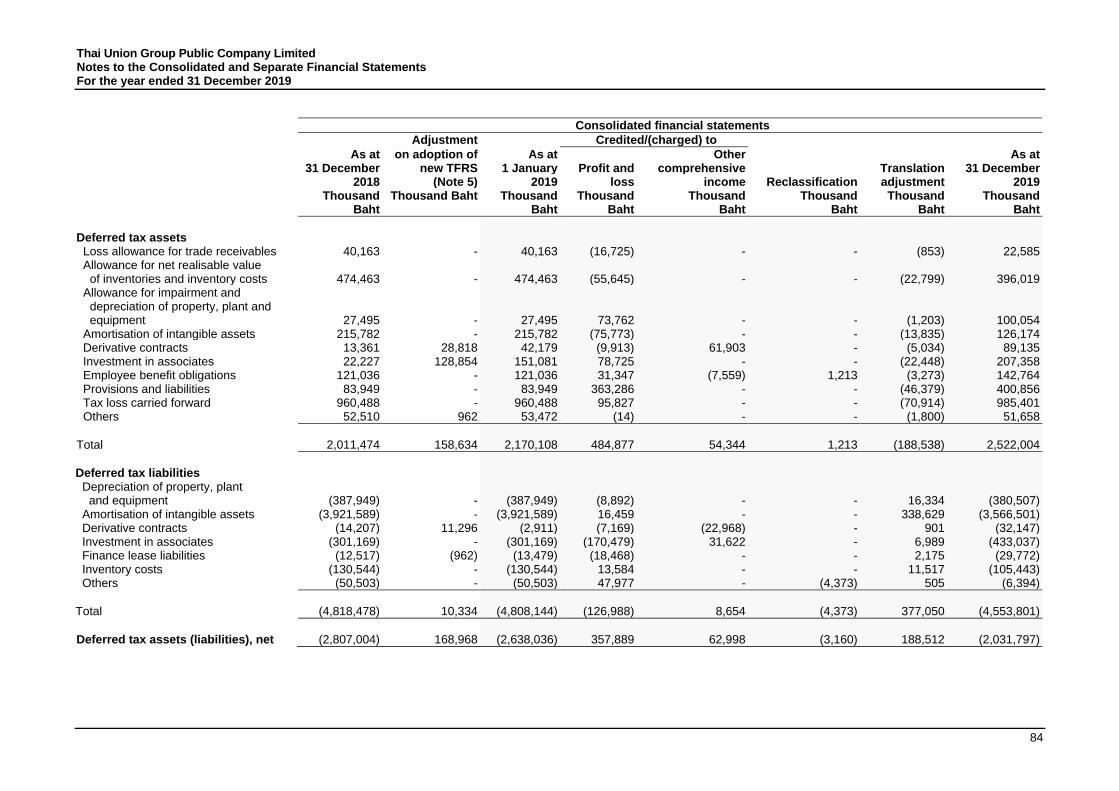
Thai Union Group Public Company Limited Notes to the Consolidated and Separate Financial Statements For the year ended 31 December 2019
84
Consolidated financial statements
Adjustment Credited/(charged) to As at
31 December on adoption of
new TFRS As at
1 January Profit and Other
comprehensive
Translation
As at 31 December
2018 (Note 5) 2019 loss income Reclassification adjustment 2019 Thousand
Baht Thousand Baht Thousand
Baht Thousand
Baht Thousand
Baht Thousand
Baht Thousand
Baht Thousand
Baht
Deferred tax assets Loss allowance for trade receivables 40,163 - 40,163 (16,725) - - (853) 22,585 Allowance for net realisable value of inventories and inventory costs 474,463
- 474,463 (55,645) -
-
(22,799) 396,019
Allowance for impairment and depreciation of property, plant and equipment 27,495
- 27,495 73,762 - -
(1,203) 100,054 Amortisation of intangible assets 215,782 - 215,782 (75,773) - - (13,835) 126,174 Derivative contracts 13,361 28,818 42,179 (9,913) 61,903 - (5,034) 89,135 Investment in associates 22,227 128,854 151,081 78,725 - - (22,448) 207,358 Employee benefit obligations 121,036 - 121,036 31,347 (7,559) 1,213 (3,273) 142,764 Provisions and liabilities 83,949 - 83,949 363,286 - - (46,379) 400,856 Tax loss carried forward 960,488 - 960,488 95,827 - - (70,914) 985,401 Others 52,510 962 53,472 (14) - - (1,800) 51,658
Total 2,011,474 158,634 2,170,108 484,877 54,344 1,213 (188,538) 2,522,004
Deferred tax liabilities Depreciation of property, plant and equipment (387,949)
- (387,949) (8,892) - - 16,334 (380,507)
Amortisation of intangible assets (3,921,589) - (3,921,589) 16,459 - - 338,629 (3,566,501) Derivative contracts (14,207) 11,296 (2,911) (7,169) (22,968) - 901 (32,147) Investment in associates (301,169) - (301,169) (170,479) 31,622 - 6,989 (433,037) Finance lease liabilities (12,517) (962) (13,479) (18,468) - - 2,175 (29,772) Inventory costs (130,544) - (130,544) 13,584 - - 11,517 (105,443) Others (50,503) - (50,503) 47,977 - (4,373) 505 (6,394)
Total (4,818,478) 10,334 (4,808,144) (126,988) 8,654 (4,373) 377,050 (4,553,801)
Deferred tax assets (liabilities), net (2,807,004) 168,968 (2,638,036) 357,889 62,998 (3,160) 188,512 (2,031,797)
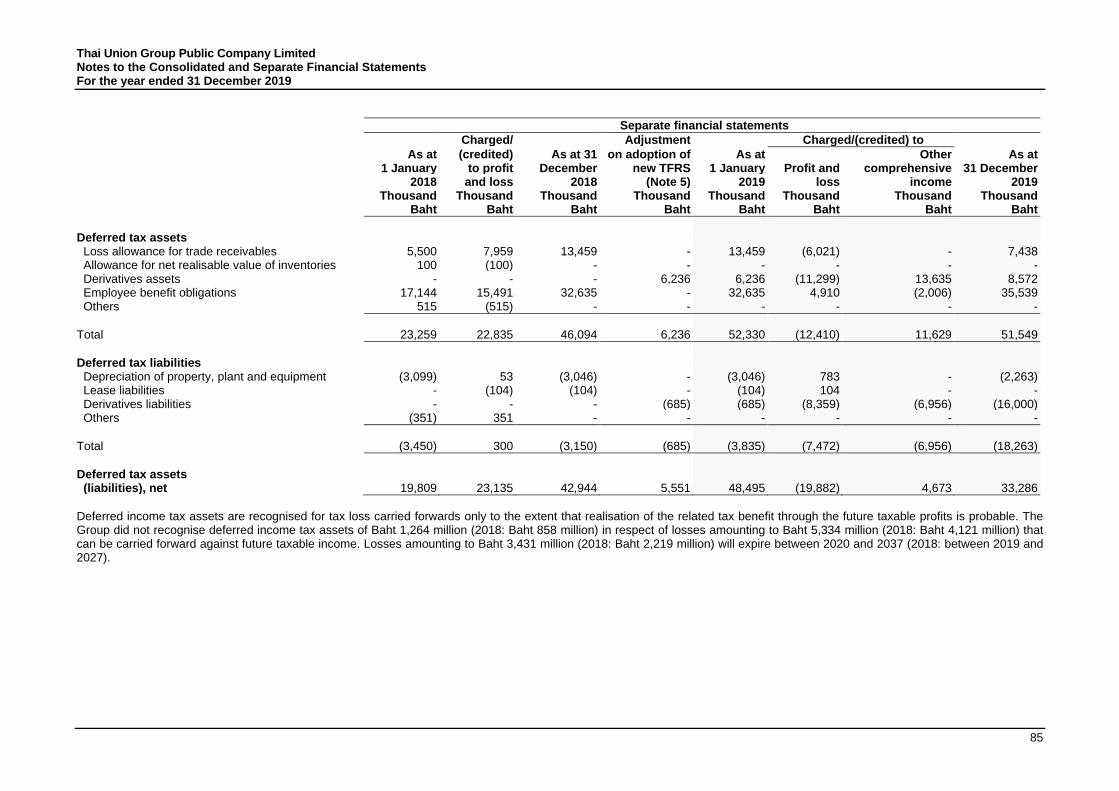
Thai Union Group Public Company Limited Notes to the Consolidated and Separate Financial Statements For the year ended 31 December 2019
85
Separate financial statements
Charged/ Adjustment Charged/(credited) to
As at 1 January
(credited) to profit
As at 31 December
on adoption of new TFRS
As at 1 January Profit and
Other comprehensive
As at 31 December
2018 and loss 2018 (Note 5) 2019 loss income 2019 Thousand Thousand Thousand Thousand Thousand Thousand Thousand Thousand Baht Baht Baht Baht Baht Baht Baht Baht
Deferred tax assets Loss allowance for trade receivables 5,500 7,959 13,459 - 13,459 (6,021) - 7,438 Allowance for net realisable value of inventories 100 (100) - - - - - - Derivatives assets - - - 6,236 6,236 (11,299) 13,635 8,572 Employee benefit obligations 17,144 15,491 32,635 - 32,635 4,910 (2,006) 35,539 Others 515 (515) - - - - - -
Total 23,259 22,835 46,094 6,236 52,330 (12,410) 11,629 51,549
Deferred tax liabilities Depreciation of property, plant and equipment (3,099) 53 (3,046) - (3,046) 783 - (2,263) Lease liabilities - (104) (104) - (104) 104 - - Derivatives liabilities - - - (685) (685) (8,359) (6,956) (16,000) Others (351) 351 - - - - - -
Total (3,450) 300 (3,150) (685) (3,835) (7,472) (6,956) (18,263)
Deferred tax assets (liabilities), net 19,809 23,135 42,944
5,551
48,495 (19,882) 4,673 33,286
Deferred income tax assets are recognised for tax loss carried forwards only to the extent that realisation of the related tax benefit through the future taxable profits is probable. The Group did not recognise deferred income tax assets of Baht 1,264 million (2018: Baht 858 million) in respect of losses amounting to Baht 5,334 million (2018: Baht 4,121 million) that can be carried forward against future taxable income. Losses amounting to Baht 3,431 million (2018: Baht 2,219 million) will expire between 2020 and 2037 (2018: between 2019 and 2027).
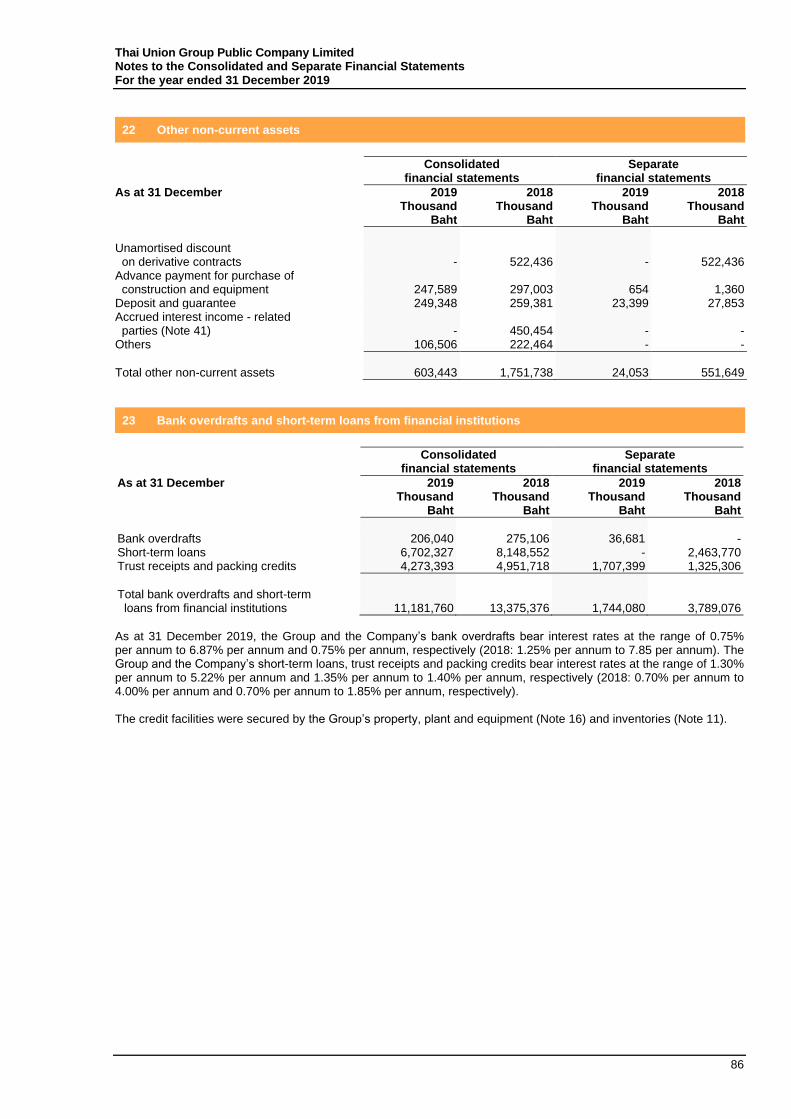
Thai Union Group Public Company Limited Notes to the Consolidated and Separate Financial Statements For the year ended 31 December 2019
86
22 Other non-current assets
Consolidated financial statements
Separate financial statements
As at 31 December 2019 2018 2019 2018 Thousand Thousand Thousand Thousand Baht Baht Baht Baht
Unamortised discount on derivative contracts - 522,436 - 522,436 Advance payment for purchase of construction and equipment 247,589 297,003 654 1,360 Deposit and guarantee 249,348 259,381 23,399 27,853 Accrued interest income - related parties (Note 41) - 450,454 - - Others 106,506 222,464 - -
Total other non-current assets 603,443 1,751,738 24,053 551,649
23 Bank overdrafts and short-term loans from financial institutions
Consolidated financial statements
Separate financial statements
As at 31 December 2019 2018 2019 2018 Thousand Thousand Thousand Thousand Baht Baht Baht Baht
Bank overdrafts 206,040 275,106 36,681 - Short-term loans 6,702,327 8,148,552 - 2,463,770 Trust receipts and packing credits 4,273,393 4,951,718 1,707,399 1,325,306
Total bank overdrafts and short-term loans from financial institutions 11,181,760 13,375,376 1,744,080 3,789,076
As at 31 December 2019, the Group and the Company’s bank overdrafts bear interest rates at the range of 0.75% per annum to 6.87% per annum and 0.75% per annum, respectively (2018: 1.25% per annum to 7.85 per annum). The Group and the Company’s short-term loans, trust receipts and packing credits bear interest rates at the range of 1.30% per annum to 5.22% per annum and 1.35% per annum to 1.40% per annum, respectively (2018: 0.70% per annum to 4.00% per annum and 0.70% per annum to 1.85% per annum, respectively). The credit facilities were secured by the Group’s property, plant and equipment (Note 16) and inventories (Note 11).
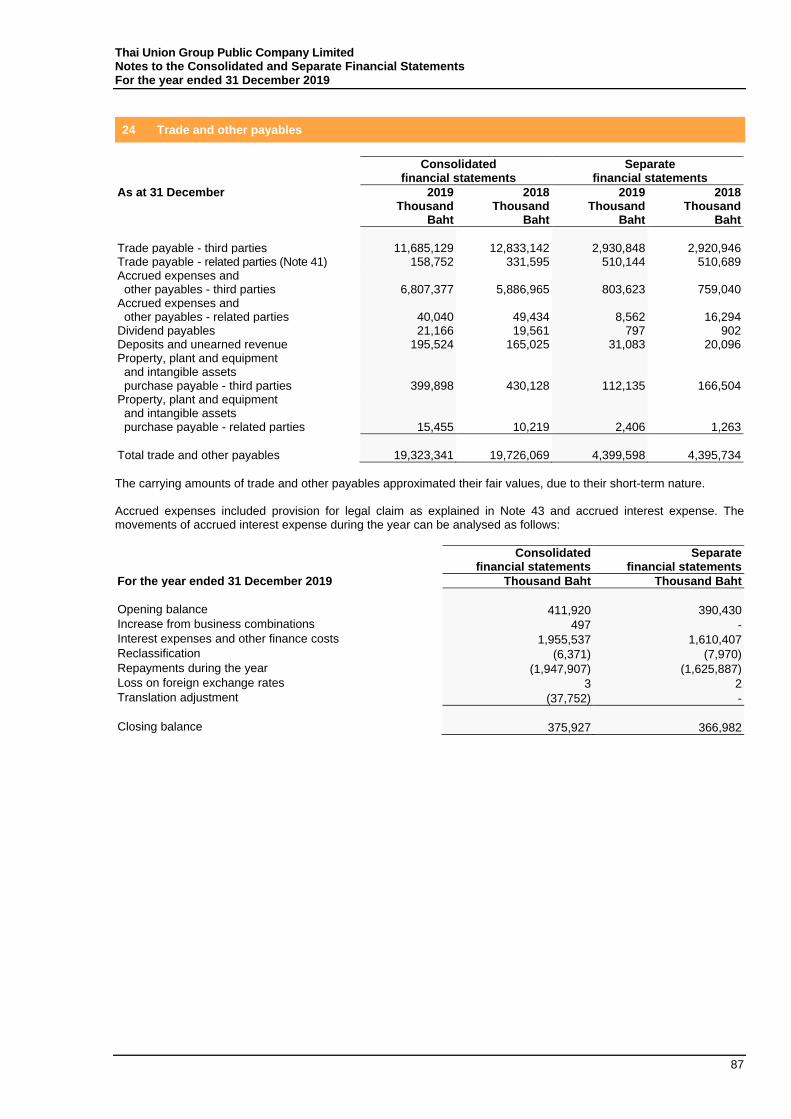
Thai Union Group Public Company Limited Notes to the Consolidated and Separate Financial Statements For the year ended 31 December 2019
87
24 Trade and other payables
Consolidated financial statements
Separate financial statements
As at 31 December 2019 2018 2019 2018 Thousand Thousand Thousand Thousand Baht Baht Baht Baht
Trade payable - third parties 11,685,129 12,833,142 2,930,848 2,920,946 Trade payable - related parties (Note 41) 158,752 331,595 510,144 510,689 Accrued expenses and other payables - third parties 6,807,377 5,886,965 803,623 759,040 Accrued expenses and other payables - related parties 40,040 49,434 8,562 16,294 Dividend payables 21,166 19,561 797 902 Deposits and unearned revenue 195,524 165,025 31,083 20,096 Property, plant and equipment and intangible assets purchase payable - third parties
399,898
430,128
112,135
166,504 Property, plant and equipment and intangible assets purchase payable - related parties
15,455
10,219
2,406
1,263
Total trade and other payables 19,323,341 19,726,069 4,399,598 4,395,734
The carrying amounts of trade and other payables approximated their fair values, due to their short-term nature. Accrued expenses included provision for legal claim as explained in Note 43 and accrued interest expense. The movements of accrued interest expense during the year can be analysed as follows:
Consolidated financial statements
Separate financial statements
For the year ended 31 December 2019 Thousand Baht Thousand Baht
Opening balance 411,920 390,430 Increase from business combinations 497 - Interest expenses and other finance costs 1,955,537 1,610,407 Reclassification (6,371) (7,970) Repayments during the year (1,947,907) (1,625,887) Loss on foreign exchange rates 3 2 Translation adjustment (37,752) -
Closing balance 375,927 366,982
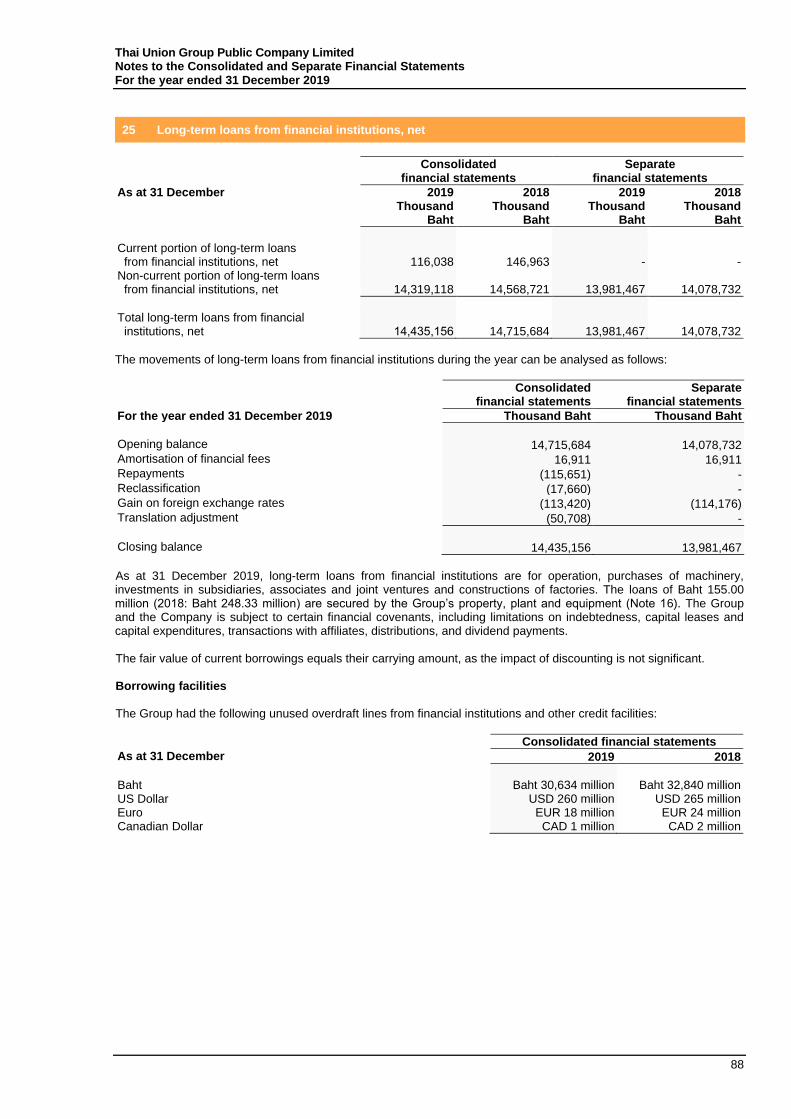
Thai Union Group Public Company Limited Notes to the Consolidated and Separate Financial Statements For the year ended 31 December 2019
88
25 Long-term loans from financial institutions, net
Consolidated financial statements
Separate financial statements
As at 31 December 2019 2018 2019 2018 Thousand Thousand Thousand Thousand Baht Baht Baht Baht
Current portion of long-term loans from financial institutions, net 116,038 146,963 - - Non-current portion of long-term loans from financial institutions, net 14,319,118 14,568,721 13,981,467 14,078,732
Total long-term loans from financial institutions, net 14,435,156 14,715,684 13,981,467 14,078,732
The movements of long-term loans from financial institutions during the year can be analysed as follows:
Consolidated financial statements
Separate financial statements
For the year ended 31 December 2019 Thousand Baht Thousand Baht
Opening balance 14,715,684 14,078,732 Amortisation of financial fees 16,911 16,911 Repayments (115,651) - Reclassification (17,660) - Gain on foreign exchange rates (113,420) (114,176) Translation adjustment (50,708) -
Closing balance 14,435,156 13,981,467
As at 31 December 2019, long-term loans from financial institutions are for operation, purchases of machinery, investments in subsidiaries, associates and joint ventures and constructions of factories. The loans of Baht 155.00 million (2018: Baht 248.33 million) are secured by the Group’s property, plant and equipment (Note 16). The Group and the Company is subject to certain financial covenants, including limitations on indebtedness, capital leases and capital expenditures, transactions with affiliates, distributions, and dividend payments. The fair value of current borrowings equals their carrying amount, as the impact of discounting is not significant. Borrowing facilities The Group had the following unused overdraft lines from financial institutions and other credit facilities:
Consolidated financial statements
As at 31 December 2019 2018
Baht Baht 30,634 million Baht 32,840 million US Dollar USD 260 million USD 265 million Euro EUR 18 million EUR 24 million Canadian Dollar CAD 1 million CAD 2 million
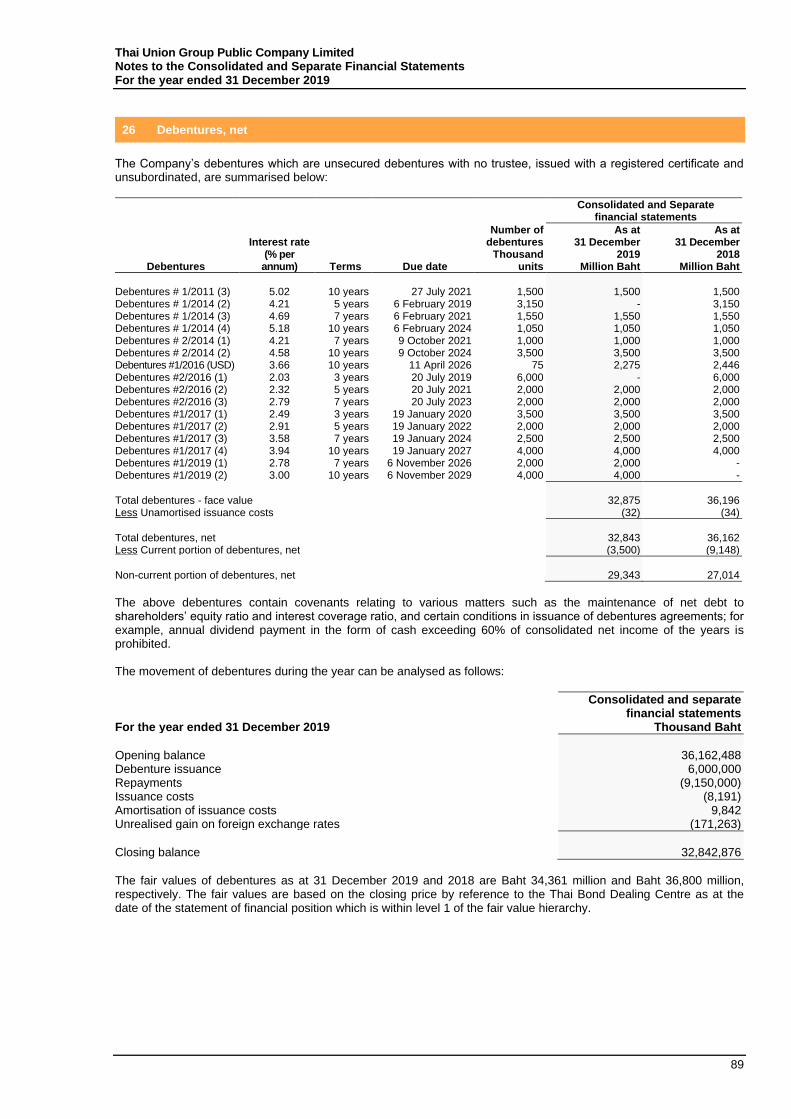
Thai Union Group Public Company Limited Notes to the Consolidated and Separate Financial Statements For the year ended 31 December 2019
89
26 Debentures, net
The Company’s debentures which are unsecured debentures with no trustee, issued with a registered certificate and unsubordinated, are summarised below:
Consolidated and Separate financial statements
Debentures
Interest rate (% per
annum) Terms Due date
Number of debentures
Thousand units
As at 31 December
2019 Million Baht
As at 31 December
2018 Million Baht
Debentures # 1/2011 (3) 5.02 10 years 27 July 2021 1,500 1,500 1,500 Debentures # 1/2014 (2) 4.21 5 years 6 February 2019 3,150 - 3,150 Debentures # 1/2014 (3) 4.69 7 years 6 February 2021 1,550 1,550 1,550 Debentures # 1/2014 (4) 5.18 10 years 6 February 2024 1,050 1,050 1,050 Debentures # 2/2014 (1) 4.21 7 years 9 October 2021 1,000 1,000 1,000 Debentures # 2/2014 (2) 4.58 10 years 9 October 2024 3,500 3,500 3,500 Debentures #1/2016 (USD) 3.66 10 years 11 April 2026 75 2,275 2,446 Debentures #2/2016 (1) 2.03 3 years 20 July 2019 6,000 - 6,000 Debentures #2/2016 (2) 2.32 5 years 20 July 2021 2,000 2,000 2,000 Debentures #2/2016 (3) 2.79 7 years 20 July 2023 2,000 2,000 2,000 Debentures #1/2017 (1) 2.49 3 years 19 January 2020 3,500 3,500 3,500 Debentures #1/2017 (2) 2.91 5 years 19 January 2022 2,000 2,000 2,000 Debentures #1/2017 (3) 3.58 7 years 19 January 2024 2,500 2,500 2,500 Debentures #1/2017 (4) 3.94 10 years 19 January 2027 4,000 4,000 4,000 Debentures #1/2019 (1) 2.78 7 years 6 November 2026 2,000 2,000 - Debentures #1/2019 (2) 3.00 10 years 6 November 2029 4,000 4,000 -
Total debentures - face value 32,875 36,196 Less Unamortised issuance costs (32) (34)
Total debentures, net 32,843 36,162 Less Current portion of debentures, net (3,500) (9,148)
Non-current portion of debentures, net 29,343 27,014
The above debentures contain covenants relating to various matters such as the maintenance of net debt to shareholders’ equity ratio and interest coverage ratio, and certain conditions in issuance of debentures agreements; for example, annual dividend payment in the form of cash exceeding 60% of consolidated net income of the years is prohibited. The movement of debentures during the year can be analysed as follows:
Consolidated and separate financial statements
For the year ended 31 December 2019 Thousand Baht
Opening balance 36,162,488 Debenture issuance 6,000,000 Repayments (9,150,000) Issuance costs (8,191) Amortisation of issuance costs 9,842 Unrealised gain on foreign exchange rates (171,263)
Closing balance 32,842,876
The fair values of debentures as at 31 December 2019 and 2018 are Baht 34,361 million and Baht 36,800 million, respectively. The fair values are based on the closing price by reference to the Thai Bond Dealing Centre as at the date of the statement of financial position which is within level 1 of the fair value hierarchy.
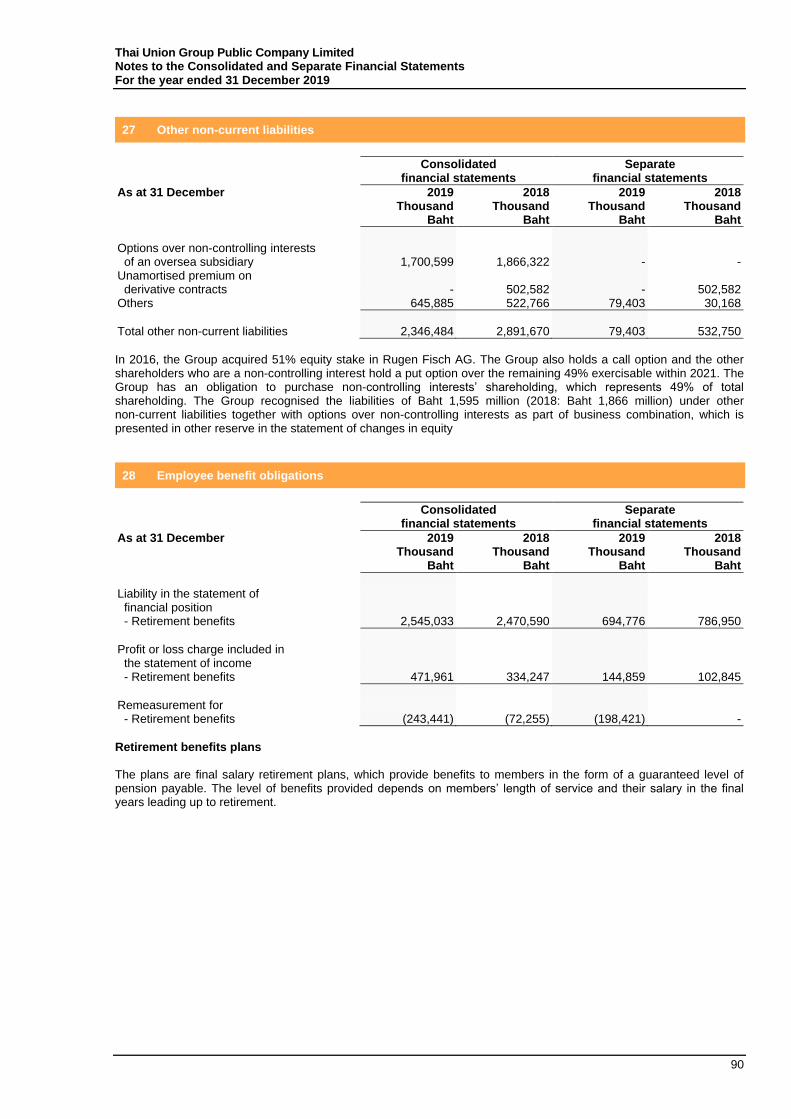
Thai Union Group Public Company Limited Notes to the Consolidated and Separate Financial Statements For the year ended 31 December 2019
90
27 Other non-current liabilities
Consolidated financial statements
Separate financial statements
As at 31 December 2019 2018 2019 2018 Thousand Thousand Thousand Thousand Baht Baht Baht Baht
Options over non-controlling interests of an oversea subsidiary 1,700,599 1,866,322 - - Unamortised premium on derivative contracts - 502,582 - 502,582 Others 645,885 522,766 79,403 30,168
Total other non-current liabilities 2,346,484 2,891,670 79,403 532,750
In 2016, the Group acquired 51% equity stake in Rugen Fisch AG. The Group also holds a call option and the other shareholders who are a non-controlling interest hold a put option over the remaining 49% exercisable within 2021. The Group has an obligation to purchase non-controlling interests’ shareholding, which represents 49% of total shareholding. The Group recognised the liabilities of Baht 1,595 million (2018: Baht 1,866 million) under other non-current liabilities together with options over non-controlling interests as part of business combination, which is presented in other reserve in the statement of changes in equity
28 Employee benefit obligations
Consolidated financial statements
Separate financial statements
As at 31 December 2019 2018 2019 2018 Thousand Thousand Thousand Thousand Baht Baht Baht Baht
Liability in the statement of financial position - Retirement benefits 2,545,033 2,470,590 694,776 786,950
Profit or loss charge included in the statement of income - Retirement benefits 471,961 334,247 144,859 102,845
Remeasurement for - Retirement benefits (243,441) (72,255) (198,421) -
Retirement benefits plans The plans are final salary retirement plans, which provide benefits to members in the form of a guaranteed level of pension payable. The level of benefits provided depends on members’ length of service and their salary in the final years leading up to retirement.
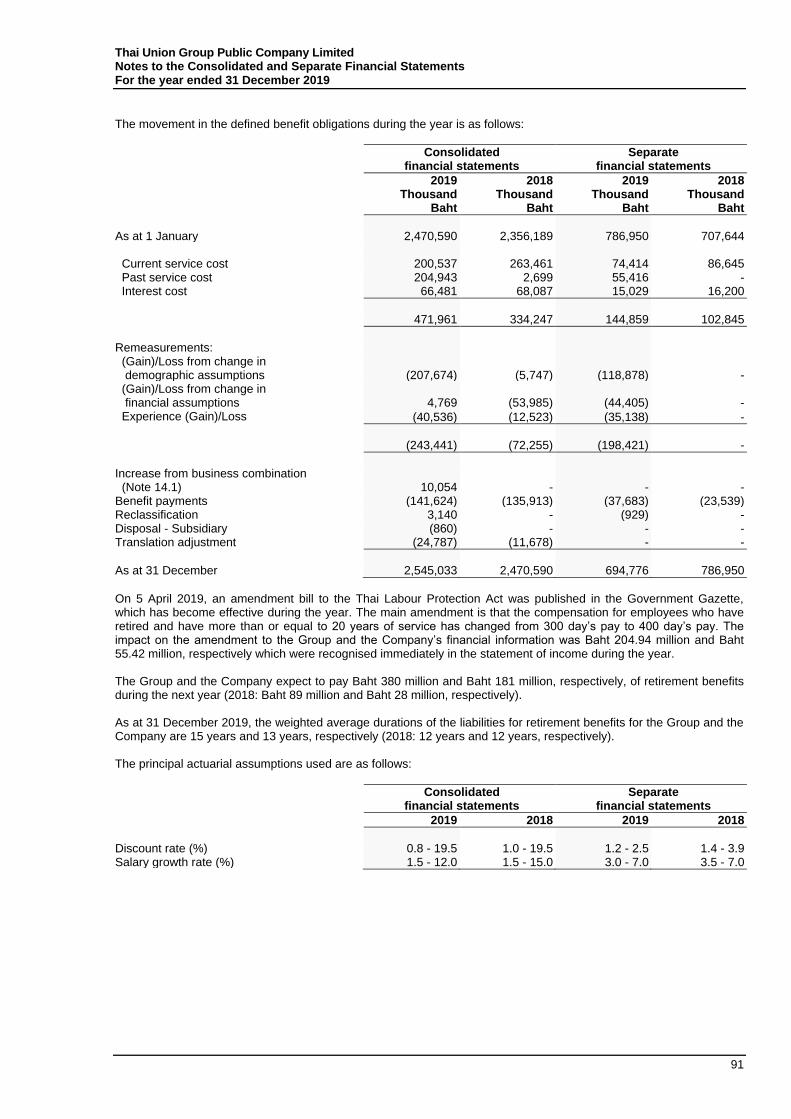
Thai Union Group Public Company Limited Notes to the Consolidated and Separate Financial Statements For the year ended 31 December 2019
91
The movement in the defined benefit obligations during the year is as follows:
Consolidated financial statements
Separate financial statements
2019 2018 2019 2018 Thousand Thousand Thousand Thousand Baht Baht Baht Baht
As at 1 January 2,470,590 2,356,189 786,950 707,644 Current service cost 200,537 263,461 74,414 86,645 Past service cost 204,943 2,699 55,416 - Interest cost 66,481 68,087 15,029 16,200
471,961 334,247 144,859 102,845
Remeasurements: (Gain)/Loss from change in demographic assumptions (207,674) (5,747) (118,878) - (Gain)/Loss from change in financial assumptions 4,769 (53,985) (44,405) - Experience (Gain)/Loss (40,536) (12,523) (35,138) -
(243,441) (72,255) (198,421) -
Increase from business combination (Note 14.1) 10,054 - - - Benefit payments (141,624) (135,913) (37,683) (23,539) Reclassification 3,140 - (929) - Disposal - Subsidiary (860) - - - Translation adjustment (24,787) (11,678) - -
As at 31 December 2,545,033 2,470,590 694,776 786,950
On 5 April 2019, an amendment bill to the Thai Labour Protection Act was published in the Government Gazette, which has become effective during the year. The main amendment is that the compensation for employees who have retired and have more than or equal to 20 years of service has changed from 300 day’s pay to 400 day’s pay. The impact on the amendment to the Group and the Company’s financial information was Baht 204.94 million and Baht 55.42 million, respectively which were recognised immediately in the statement of income during the year. The Group and the Company expect to pay Baht 380 million and Baht 181 million, respectively, of retirement benefits during the next year (2018: Baht 89 million and Baht 28 million, respectively). As at 31 December 2019, the weighted average durations of the liabilities for retirement benefits for the Group and the Company are 15 years and 13 years, respectively (2018: 12 years and 12 years, respectively). The principal actuarial assumptions used are as follows:
Consolidated financial statements
Separate financial statements
2019 2018 2019 2018
Discount rate (%) 0.8 - 19.5 1.0 - 19.5 1.2 - 2.5 1.4 - 3.9 Salary growth rate (%) 1.5 - 12.0 1.5 - 15.0 3.0 - 7.0 3.5 - 7.0
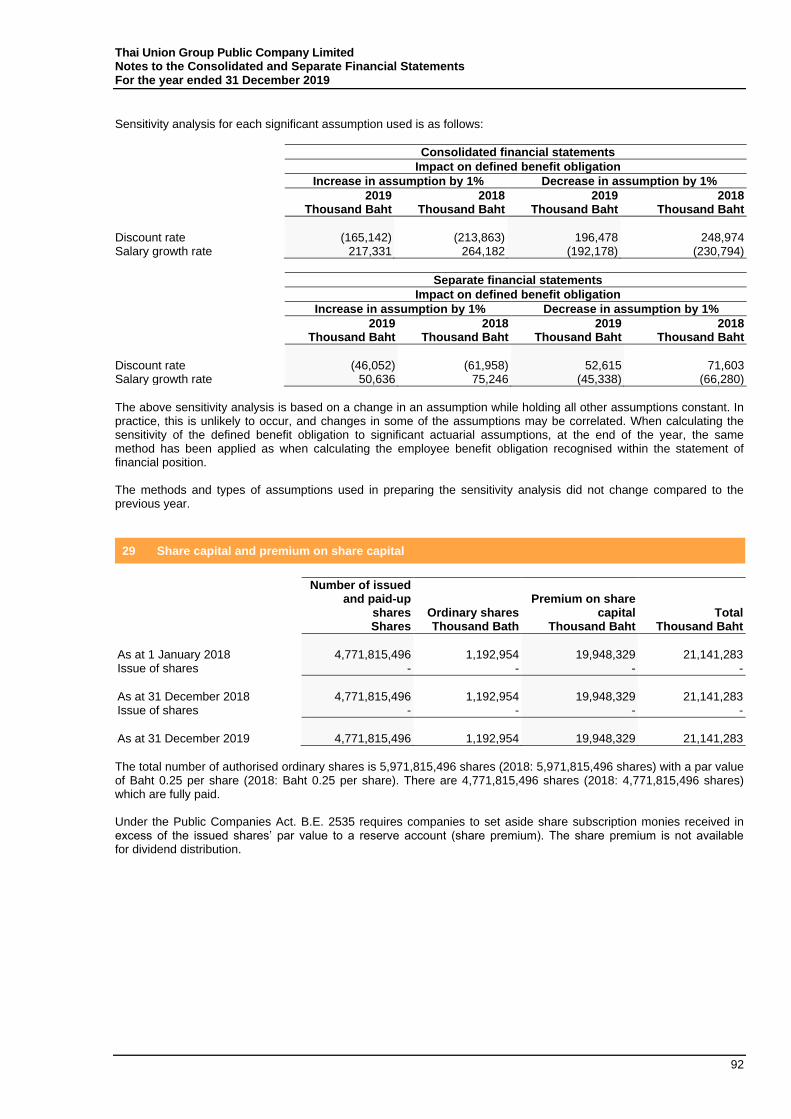
Thai Union Group Public Company Limited Notes to the Consolidated and Separate Financial Statements For the year ended 31 December 2019
92
Sensitivity analysis for each significant assumption used is as follows:
Consolidated financial statements
Impact on defined benefit obligation
Increase in assumption by 1% Decrease in assumption by 1%
2019 Thousand Baht
2018 Thousand Baht
2019 Thousand Baht
2018 Thousand Baht
Discount rate (165,142) (213,863) 196,478 248,974 Salary growth rate 217,331 264,182 (192,178) (230,794)
Separate financial statements
Impact on defined benefit obligation
Increase in assumption by 1% Decrease in assumption by 1%
2019 Thousand Baht
2018 Thousand Baht
2019 Thousand Baht
2018 Thousand Baht
Discount rate (46,052) (61,958) 52,615 71,603 Salary growth rate 50,636 75,246 (45,338) (66,280)
The above sensitivity analysis is based on a change in an assumption while holding all other assumptions constant. In practice, this is unlikely to occur, and changes in some of the assumptions may be correlated. When calculating the sensitivity of the defined benefit obligation to significant actuarial assumptions, at the end of the year, the same method has been applied as when calculating the employee benefit obligation recognised within the statement of financial position. The methods and types of assumptions used in preparing the sensitivity analysis did not change compared to the previous year.
29 Share capital and premium on share capital
Number of issued and paid-up
shares Shares
Ordinary shares Thousand Bath
Premium on share capital
Thousand Baht Total
Thousand Baht
As at 1 January 2018 4,771,815,496 1,192,954 19,948,329 21,141,283 Issue of shares - - - -
As at 31 December 2018 4,771,815,496 1,192,954 19,948,329 21,141,283 Issue of shares - - - -
As at 31 December 2019 4,771,815,496 1,192,954 19,948,329 21,141,283
The total number of authorised ordinary shares is 5,971,815,496 shares (2018: 5,971,815,496 shares) with a par value of Baht 0.25 per share (2018: Baht 0.25 per share). There are 4,771,815,496 shares (2018: 4,771,815,496 shares) which are fully paid. Under the Public Companies Act. B.E. 2535 requires companies to set aside share subscription monies received in excess of the issued shares’ par value to a reserve account (share premium). The share premium is not available for dividend distribution.
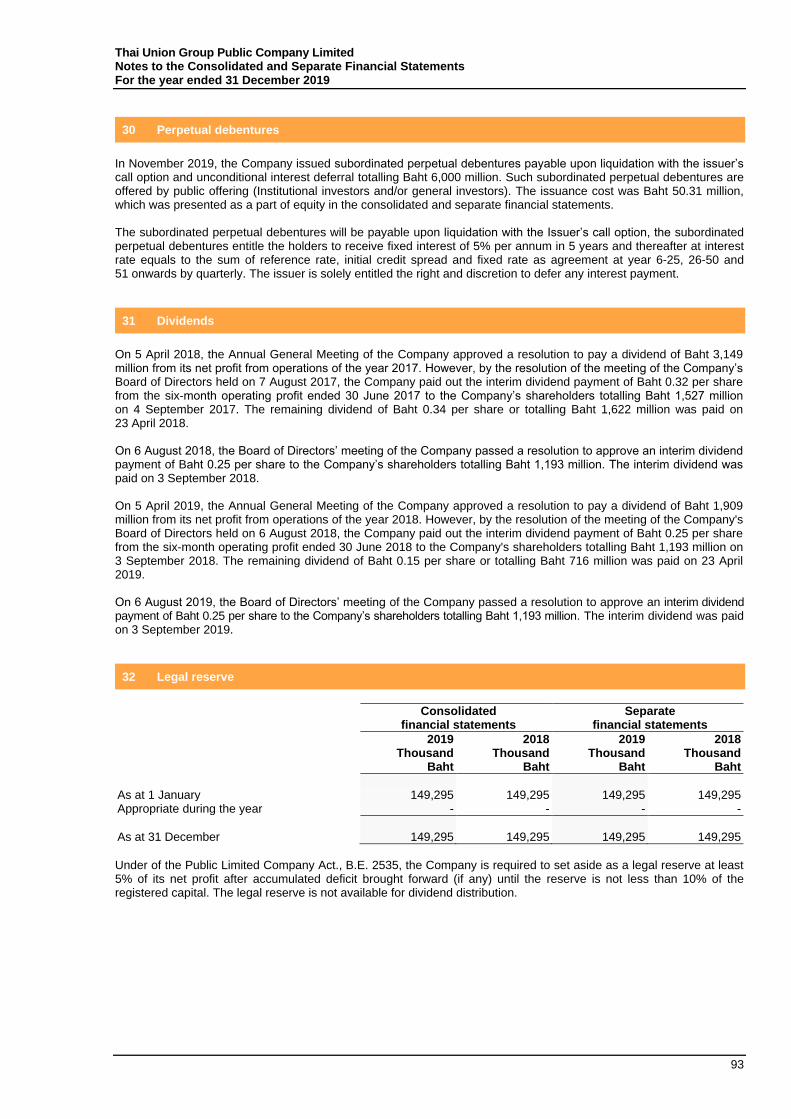
Thai Union Group Public Company Limited Notes to the Consolidated and Separate Financial Statements For the year ended 31 December 2019
93
30 Perpetual debentures
In November 2019, the Company issued subordinated perpetual debentures payable upon liquidation with the issuer’s call option and unconditional interest deferral totalling Baht 6,000 million. Such subordinated perpetual debentures are offered by public offering (Institutional investors and/or general investors). The issuance cost was Baht 50.31 million, which was presented as a part of equity in the consolidated and separate financial statements. The subordinated perpetual debentures will be payable upon liquidation with the Issuer’s call option, the subordinated perpetual debentures entitle the holders to receive fixed interest of 5% per annum in 5 years and thereafter at interest rate equals to the sum of reference rate, initial credit spread and fixed rate as agreement at year 6-25, 26-50 and 51 onwards by quarterly. The issuer is solely entitled the right and discretion to defer any interest payment.
31 Dividends
On 5 April 2018, the Annual General Meeting of the Company approved a resolution to pay a dividend of Baht 3,149 million from its net profit from operations of the year 2017. However, by the resolution of the meeting of the Company’s Board of Directors held on 7 August 2017, the Company paid out the interim dividend payment of Baht 0.32 per share from the six-month operating profit ended 30 June 2017 to the Company’s shareholders totalling Baht 1,527 million on 4 September 2017. The remaining dividend of Baht 0.34 per share or totalling Baht 1,622 million was paid on 23 April 2018. On 6 August 2018, the Board of Directors’ meeting of the Company passed a resolution to approve an interim dividend payment of Baht 0.25 per share to the Company’s shareholders totalling Baht 1,193 million. The interim dividend was paid on 3 September 2018. On 5 April 2019, the Annual General Meeting of the Company approved a resolution to pay a dividend of Baht 1,909 million from its net profit from operations of the year 2018. However, by the resolution of the meeting of the Company's Board of Directors held on 6 August 2018, the Company paid out the interim dividend payment of Baht 0.25 per share from the six-month operating profit ended 30 June 2018 to the Company's shareholders totalling Baht 1,193 million on 3 September 2018. The remaining dividend of Baht 0.15 per share or totalling Baht 716 million was paid on 23 April 2019. On 6 August 2019, the Board of Directors’ meeting of the Company passed a resolution to approve an interim dividend payment of Baht 0.25 per share to the Company’s shareholders totalling Baht 1,193 million. The interim dividend was paid on 3 September 2019.
32 Legal reserve
Consolidated financial statements
Separate financial statements
2019 2018 2019 2018 Thousand Thousand Thousand Thousand Baht Baht Baht Baht
As at 1 January 149,295 149,295 149,295 149,295 Appropriate during the year - - - -
As at 31 December 149,295 149,295 149,295 149,295
Under of the Public Limited Company Act., B.E. 2535, the Company is required to set aside as a legal reserve at least 5% of its net profit after accumulated deficit brought forward (if any) until the reserve is not less than 10% of the registered capital. The legal reserve is not available for dividend distribution.
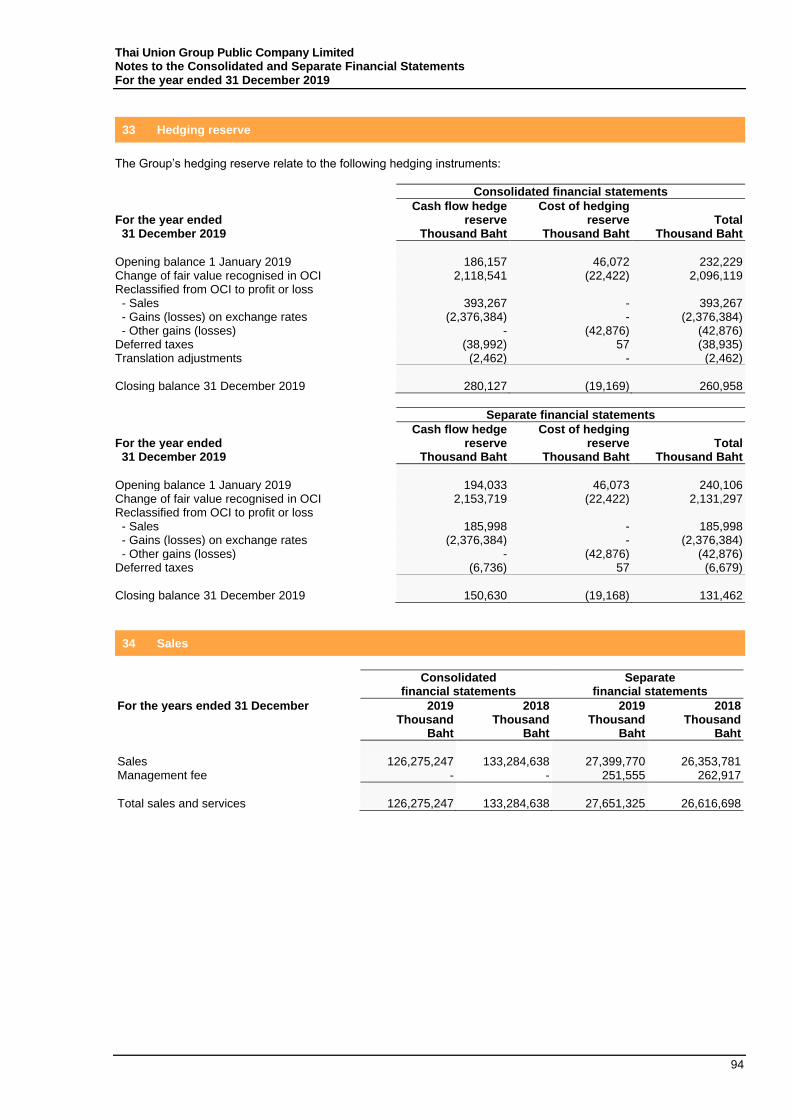
Thai Union Group Public Company Limited Notes to the Consolidated and Separate Financial Statements For the year ended 31 December 2019
94
33 Hedging reserve
The Group’s hedging reserve relate to the following hedging instruments:
Consolidated financial statements
For the year ended Cash flow hedge
reserve Cost of hedging
reserve Total 31 December 2019 Thousand Baht Thousand Baht Thousand Baht
Opening balance 1 January 2019 186,157 46,072 232,229 Change of fair value recognised in OCI 2,118,541 (22,422) 2,096,119 Reclassified from OCI to profit or loss - Sales 393,267 - 393,267 - Gains (losses) on exchange rates (2,376,384) - (2,376,384) - Other gains (losses) - (42,876) (42,876) Deferred taxes (38,992) 57 (38,935) Translation adjustments (2,462) - (2,462)
Closing balance 31 December 2019 280,127 (19,169) 260,958
Separate financial statements
For the year ended Cash flow hedge
reserve Cost of hedging
reserve Total 31 December 2019 Thousand Baht Thousand Baht Thousand Baht
Opening balance 1 January 2019 194,033 46,073 240,106 Change of fair value recognised in OCI 2,153,719 (22,422) 2,131,297 Reclassified from OCI to profit or loss - Sales 185,998 - 185,998 - Gains (losses) on exchange rates (2,376,384) - (2,376,384) - Other gains (losses) - (42,876) (42,876) Deferred taxes (6,736) 57 (6,679)
Closing balance 31 December 2019 150,630 (19,168) 131,462
34 Sales
Consolidated financial statements
Separate financial statements
For the years ended 31 December 2019 2018 2019 2018 Thousand Thousand Thousand Thousand Baht Baht Baht Baht
Sales 126,275,247 133,284,638 27,399,770 26,353,781 Management fee - - 251,555 262,917
Total sales and services 126,275,247 133,284,638 27,651,325 26,616,698
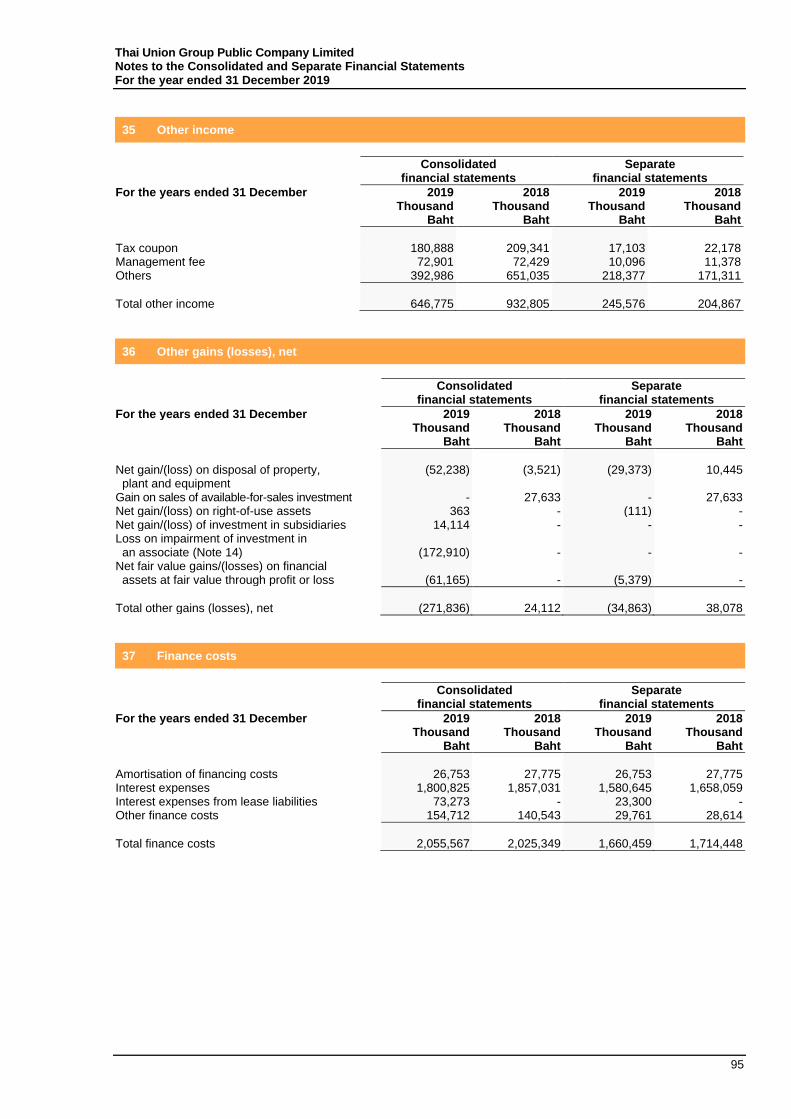
Thai Union Group Public Company Limited Notes to the Consolidated and Separate Financial Statements For the year ended 31 December 2019
95
35 Other income
Consolidated financial statements
Separate financial statements
For the years ended 31 December 2019 2018 2019 2018 Thousand Thousand Thousand Thousand Baht Baht Baht Baht
Tax coupon 180,888 209,341 17,103 22,178 Management fee 72,901 72,429 10,096 11,378 Others 392,986 651,035 218,377 171,311
Total other income 646,775 932,805 245,576 204,867
36 Other gains (losses), net
Consolidated financial statements
Separate financial statements
For the years ended 31 December 2019 2018 2019 2018 Thousand Thousand Thousand Thousand Baht Baht Baht Baht
Net gain/(loss) on disposal of property, plant and equipment
(52,238) (3,521) (29,373) 10,445
Gain on sales of available-for-sales investment - 27,633 - 27,633 Net gain/(loss) on right-of-use assets 363 - (111) - Net gain/(loss) of investment in subsidiaries 14,114 - - - Loss on impairment of investment in an associate (Note 14)
(172,910)
-
-
-
Net fair value gains/(losses) on financial assets at fair value through profit or loss (61,165) - (5,379) -
Total other gains (losses), net (271,836) 24,112 (34,863) 38,078
37 Finance costs
Consolidated financial statements
Separate financial statements
For the years ended 31 December 2019 2018 2019 2018 Thousand Thousand Thousand Thousand Baht Baht Baht Baht
Amortisation of financing costs 26,753 27,775 26,753 27,775 Interest expenses 1,800,825 1,857,031 1,580,645 1,658,059 Interest expenses from lease liabilities 73,273 - 23,300 - Other finance costs 154,712 140,543 29,761 28,614
Total finance costs 2,055,567 2,025,349 1,660,459 1,714,448
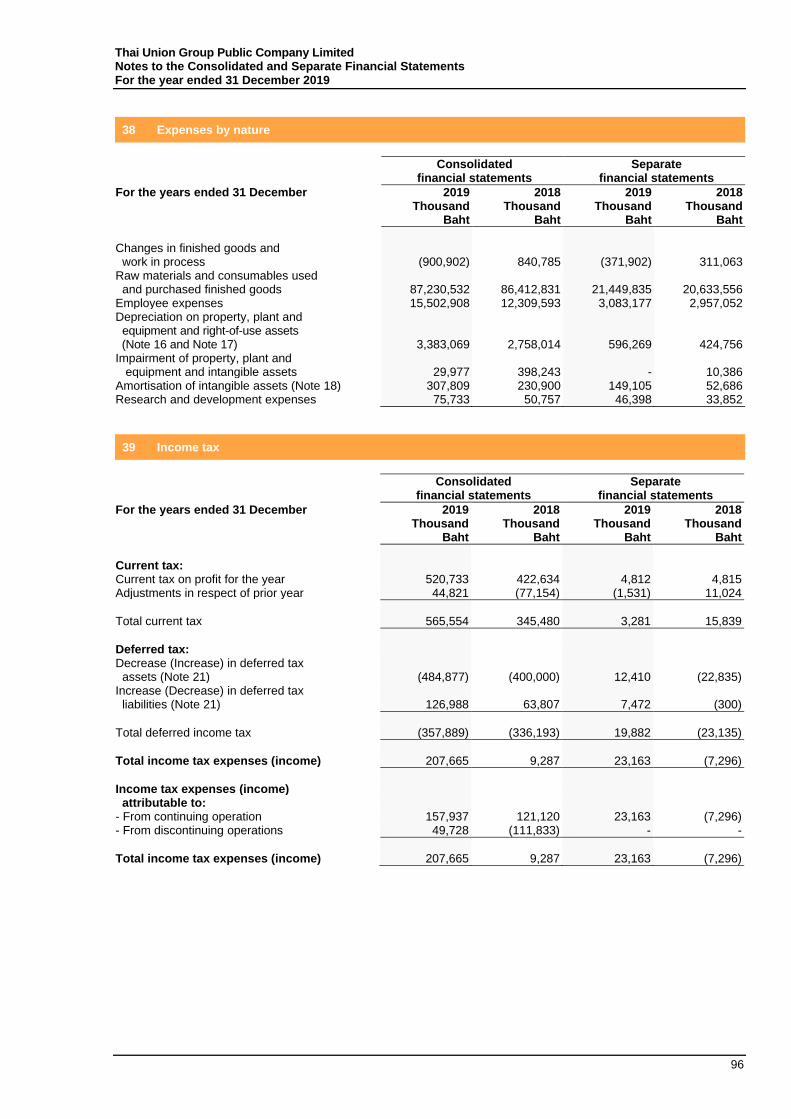
Thai Union Group Public Company Limited Notes to the Consolidated and Separate Financial Statements For the year ended 31 December 2019
96
38 Expenses by nature
Consolidated financial statements
Separate financial statements
For the years ended 31 December 2019 2018 2019 2018 Thousand Thousand Thousand Thousand Baht Baht Baht Baht
Changes in finished goods and work in process (900,902) 840,785 (371,902) 311,063 Raw materials and consumables used and purchased finished goods 87,230,532 86,412,831 21,449,835 20,633,556 Employee expenses 15,502,908 12,309,593 3,083,177 2,957,052 Depreciation on property, plant and equipment and right-of-use assets (Note 16 and Note 17) 3,383,069 2,758,014 596,269 424,756 Impairment of property, plant and equipment and intangible assets 29,977 398,243 - 10,386 Amortisation of intangible assets (Note 18) 307,809 230,900 149,105 52,686 Research and development expenses 75,733 50,757 46,398 33,852
39 Income tax
Consolidated financial statements
Separate financial statements
For the years ended 31 December 2019 2018 2019 2018 Thousand Thousand Thousand Thousand Baht Baht Baht Baht
Current tax: Current tax on profit for the year 520,733 422,634 4,812 4,815 Adjustments in respect of prior year 44,821 (77,154) (1,531) 11,024
Total current tax 565,554 345,480 3,281 15,839
Deferred tax: Decrease (Increase) in deferred tax assets (Note 21) (484,877) (400,000) 12,410 (22,835) Increase (Decrease) in deferred tax liabilities (Note 21) 126,988 63,807 7,472 (300)
Total deferred income tax (357,889) (336,193) 19,882 (23,135)
Total income tax expenses (income) 207,665 9,287 23,163 (7,296)
Income tax expenses (income) attributable to: - From continuing operation 157,937 121,120 23,163 (7,296) - From discontinuing operations 49,728 (111,833) - -
Total income tax expenses (income) 207,665 9,287 23,163 (7,296)

Thai Union Group Public Company Limited Notes to the Consolidated and Separate Financial Statements For the year ended 31 December 2019
97
The taxes on the Group and the Company’s profits before tax differ from the theoretical amounts that would arise using the basic tax rates of the Group and the Company as follows:
Consolidated financial statements
Separate financial statements
For the years ended 31 December 2019 2018 2019 2018 Thousand Thousand Thousand Thousand Baht Baht Baht Baht
Profit before tax from continuing operations 4,428,037
4,488,680 4,063,283
10,783,819
Loss before tax from discontinued operation (55,441) (824,923) - -
Total profit before tax 4,372,596 3,663,757 4,063,283 10,783,819
Tax calculated at tax rates of 10 - 34% (2018: 10 - 34%) 787,192 757,691 812,657 2,156,764 Tax effect of: Income not subject to tax (1,021,757) (1,091,521) (984,001) (2,333,453) Additional expenses deductible for tax purpose (119,957) (392,539) (3,425) (12,189) Expenses not deductible for tax purpose 148,300 178,478 26,408 7,528 Utilisation of previously unrecognised tax losses (38,586) (25,864) - - Recognition of deferred tax assets from previously unrecognised tax losses and temporary differences (56,930) (222,211) - - Tax losses and temporary differences for which no deferred tax asset was recognised 380,052 919,170 147,109 186,268 Adjustments in respect of prior year 44,821 (77,154) (1,531) 11,024 Impact on change in tax rate 54,026 (58,689) - - Others 30,504 21,926 25,946 (23,238)
Total income tax expenses (income) 207,665 9,287 23,163 (7,296)
The Group’s weighted average applicable tax rate was 4.75% (2018: 0.25%). The change in average tax rate of the Group is due to the change in corporate income tax regulation of foreign subsidiaries resulting reassessing of the higher utilization of tax losses and temporary differences. The Company’s weighted average applicable tax rate was 0.57% (2018: -0.07%).
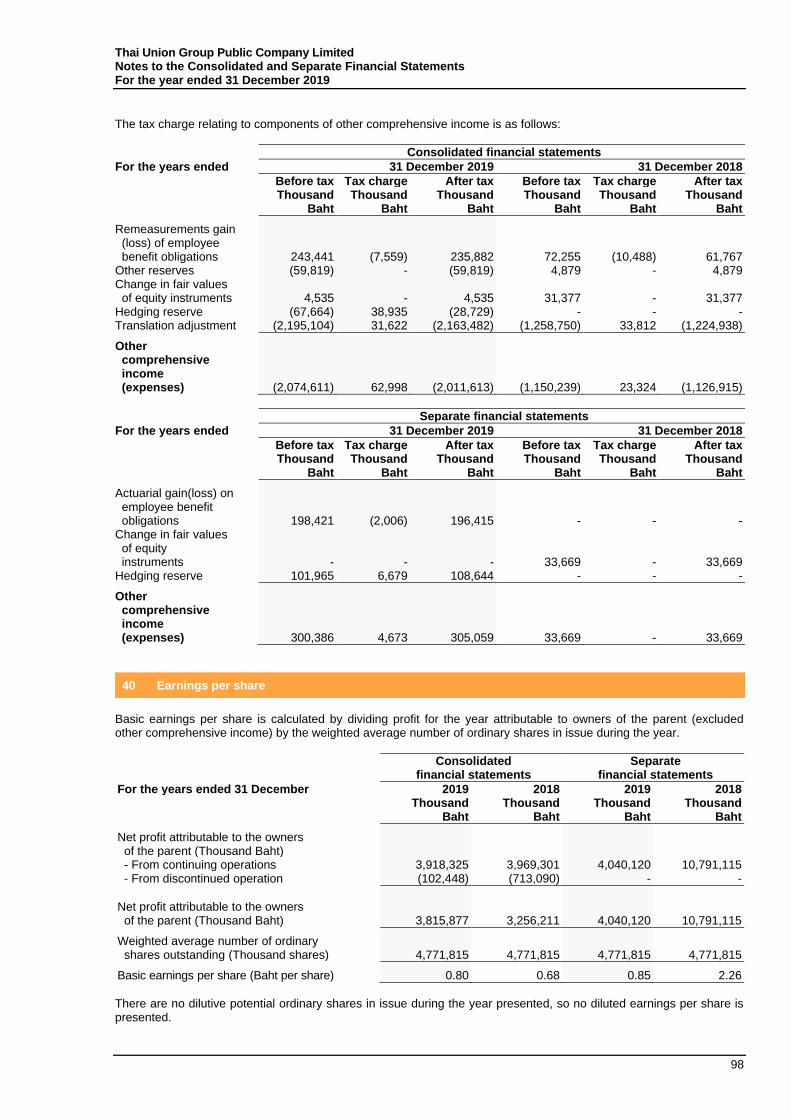
Thai Union Group Public Company Limited Notes to the Consolidated and Separate Financial Statements For the year ended 31 December 2019
98
The tax charge relating to components of other comprehensive income is as follows:
Consolidated financial statements
For the years ended 31 December 2019 31 December 2018
Before tax Tax charge After tax Before tax Tax charge After tax Thousand Thousand Thousand Thousand Thousand Thousand Baht Baht Baht Baht Baht Baht
Remeasurements gain (loss) of employee benefit obligations 243,441 (7,559) 235,882 72,255 (10,488) 61,767 Other reserves (59,819) - (59,819) 4,879 - 4,879 Change in fair values of equity instruments 4,535 - 4,535 31,377 - 31,377 Hedging reserve (67,664) 38,935 (28,729) - - - Translation adjustment (2,195,104) 31,622 (2,163,482) (1,258,750) 33,812 (1,224,938)
Other comprehensive income (expenses) (2,074,611) 62,998 (2,011,613) (1,150,239) 23,324 (1,126,915)
Separate financial statements
For the years ended 31 December 2019 31 December 2018
Before tax Tax charge After tax Before tax Tax charge After tax Thousand Thousand Thousand Thousand Thousand Thousand Baht Baht Baht Baht Baht Baht
Actuarial gain(loss) on employee benefit obligations 198,421 (2,006) 196,415 - - - Change in fair values of equity instruments - - - 33,669 - 33,669 Hedging reserve 101,965 6,679 108,644 - - -
Other comprehensive income (expenses) 300,386 4,673 305,059 33,669 - 33,669
40 Earnings per share
Basic earnings per share is calculated by dividing profit for the year attributable to owners of the parent (excluded other comprehensive income) by the weighted average number of ordinary shares in issue during the year.
Consolidated financial statements
Separate financial statements
For the years ended 31 December 2019 2018 2019 2018 Thousand Thousand Thousand Thousand Baht Baht Baht Baht
Net profit attributable to the owners of the parent (Thousand Baht) - From continuing operations 3,918,325 3,969,301 4,040,120 10,791,115 - From discontinued operation (102,448) (713,090) - -
Net profit attributable to the owners of the parent (Thousand Baht) 3,815,877 3,256,211 4,040,120 10,791,115
Weighted average number of ordinary shares outstanding (Thousand shares) 4,771,815 4,771,815 4,771,815 4,771,815
Basic earnings per share (Baht per share) 0.80 0.68 0.85 2.26
There are no dilutive potential ordinary shares in issue during the year presented, so no diluted earnings per share is presented.
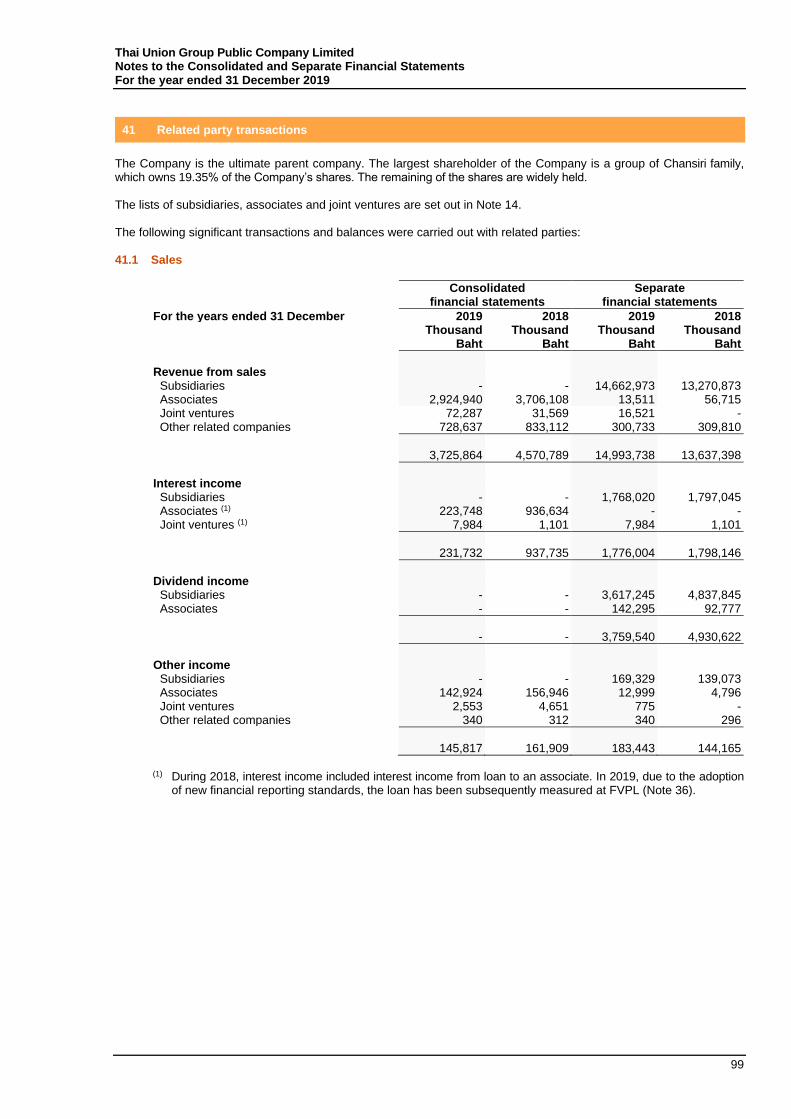
Thai Union Group Public Company Limited Notes to the Consolidated and Separate Financial Statements For the year ended 31 December 2019
99
41 Related party transactions
The Company is the ultimate parent company. The largest shareholder of the Company is a group of Chansiri family, which owns 19.35% of the Company’s shares. The remaining of the shares are widely held. The lists of subsidiaries, associates and joint ventures are set out in Note 14. The following significant transactions and balances were carried out with related parties: 41.1 Sales
Consolidated financial statements
Separate financial statements
For the years ended 31 December 2019 2018 2019 2018 Thousand Thousand Thousand Thousand Baht Baht Baht Baht
Revenue from sales Subsidiaries - - 14,662,973 13,270,873 Associates 2,924,940 3,706,108 13,511 56,715 Joint ventures 72,287 31,569 16,521 - Other related companies 728,637 833,112 300,733 309,810
3,725,864 4,570,789 14,993,738 13,637,398
Interest income Subsidiaries - - 1,768,020 1,797,045 Associates (1) 223,748 936,634 - - Joint ventures (1) 7,984 1,101 7,984 1,101
231,732 937,735 1,776,004 1,798,146
Dividend income Subsidiaries - - 3,617,245 4,837,845 Associates - - 142,295 92,777
- - 3,759,540 4,930,622
Other income Subsidiaries - - 169,329 139,073 Associates 142,924 156,946 12,999 4,796 Joint ventures 2,553 4,651 775 - Other related companies 340 312 340 296
145,817 161,909 183,443 144,165
(1) During 2018, interest income included interest income from loan to an associate. In 2019, due to the adoption
of new financial reporting standards, the loan has been subsequently measured at FVPL (Note 36).

Thai Union Group Public Company Limited Notes to the Consolidated and Separate Financial Statements For the year ended 31 December 2019
100
41.2 Purchases of goods and services, fixed assets and intangible assets
Consolidated financial statements
Separate financial statements
For the years ended 31 December 2019 2018 2019 2018 Thousand Thousand Thousand Thousand Baht Baht Baht Baht
Purchases of goods and services Subsidiaries - - 1,941,695 1,640,086 Associates 1,311,209 824,215 24,639 8,521 Joint ventures 12,820 70,303 3,116 26,445 Other related companies 1,218,935 1,550,586 83,268 130,428
2,542,964 2,445,104 2,052,718 1,805,480
Purchases of fixed assets and intangible assets
Subsidiaries - - 458,626 56,086 Associates - 4,102 - 4,102 Other related companies 119,877 136,051 12,426 20,891
119,877 140,153 471,052 81,079
41.3 Outstanding balances arising from sales and purchases of goods and services and fixed assets
Consolidated financial statements
Separate financial statements
As at 31 December 2019 2018 2019 2018 Thousand Thousand Thousand Thousand Baht Baht Baht Baht
Trade receivables - related parties, net Subsidiaries - - 2,169,717 2,458,327 Associates 312,726 618,530 3,597 39,976 Joint ventures 64,034 1,212 32,845 - Other related companies 41,759 46,796 9,836 12,794
418,519 666,538 2,215,995 2,511,097
Accrued interest income - related parties Subsidiaries - - 411,830 581,510 Associates (1) 12,171 900,908 - - Joint ventures 2,513 305 2,513 305
14,684 901,213 414,343 581,815
Trade payables - related parties Subsidiaries - - 506,312 501,459 Associates 106,060 269,292 277 182 Joint ventures 228 9,326 228 7,984 Other related companies 52,464 52,977 3,327 1,064
158,752 331,595 510,144 510,689
(1) As at 31 December 2018, accrued interest income due from an associate in the consolidated financial
statements includes non-current portion presented as other non-current assets of Baht 450.45 million.
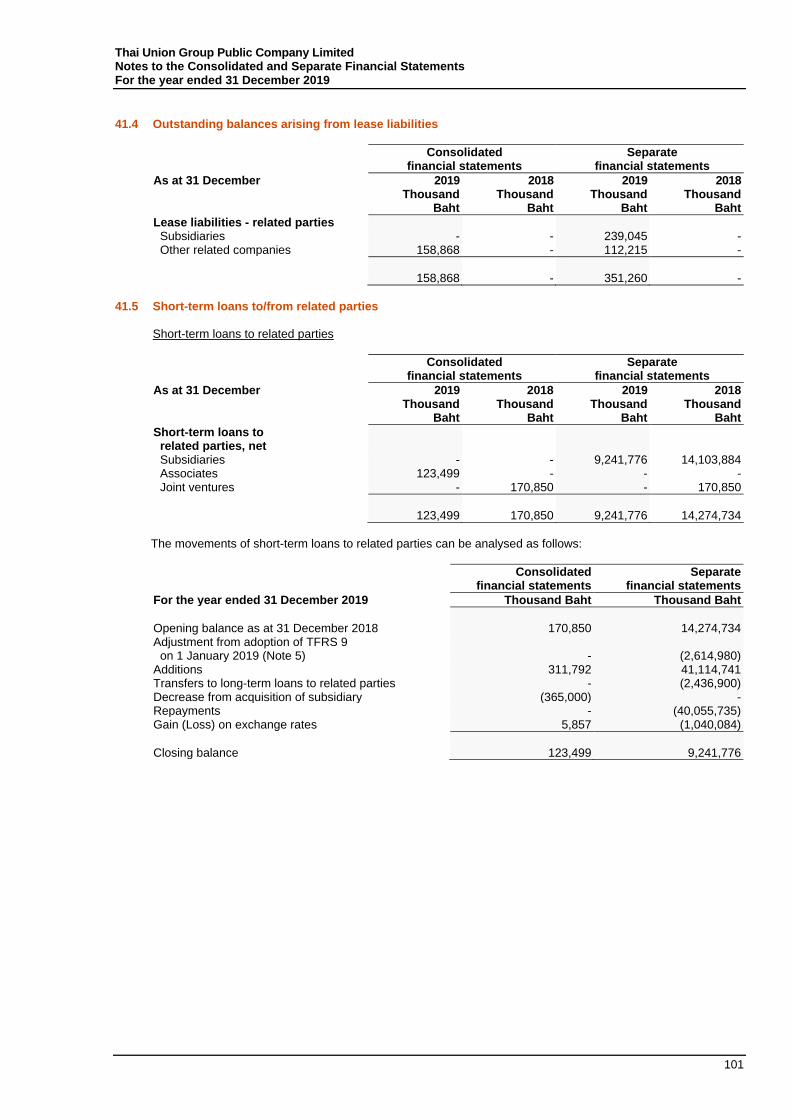
Thai Union Group Public Company Limited Notes to the Consolidated and Separate Financial Statements For the year ended 31 December 2019
101
41.4 Outstanding balances arising from lease liabilities
Consolidated financial statements
Separate financial statements
As at 31 December 2019 2018 2019 2018 Thousand Thousand Thousand Thousand Baht Baht Baht Baht
Lease liabilities - related parties Subsidiaries - - 239,045 - Other related companies 158,868 - 112,215 -
158,868 - 351,260 -
41.5 Short-term loans to/from related parties
Short-term loans to related parties
Consolidated financial statements
Separate financial statements
As at 31 December 2019 2018 2019 2018 Thousand Thousand Thousand Thousand Baht Baht Baht Baht
Short-term loans to related parties, net Subsidiaries - - 9,241,776 14,103,884 Associates 123,499 - - - Joint ventures - 170,850 - 170,850
123,499 170,850 9,241,776 14,274,734
The movements of short-term loans to related parties can be analysed as follows:
Consolidated financial statements
Separate financial statements
For the year ended 31 December 2019 Thousand Baht Thousand Baht
Opening balance as at 31 December 2018 170,850 14,274,734 Adjustment from adoption of TFRS 9 on 1 January 2019 (Note 5) - (2,614,980) Additions 311,792 41,114,741 Transfers to long-term loans to related parties - (2,436,900) Decrease from acquisition of subsidiary (365,000) - Repayments - (40,055,735) Gain (Loss) on exchange rates 5,857 (1,040,084)
Closing balance 123,499 9,241,776
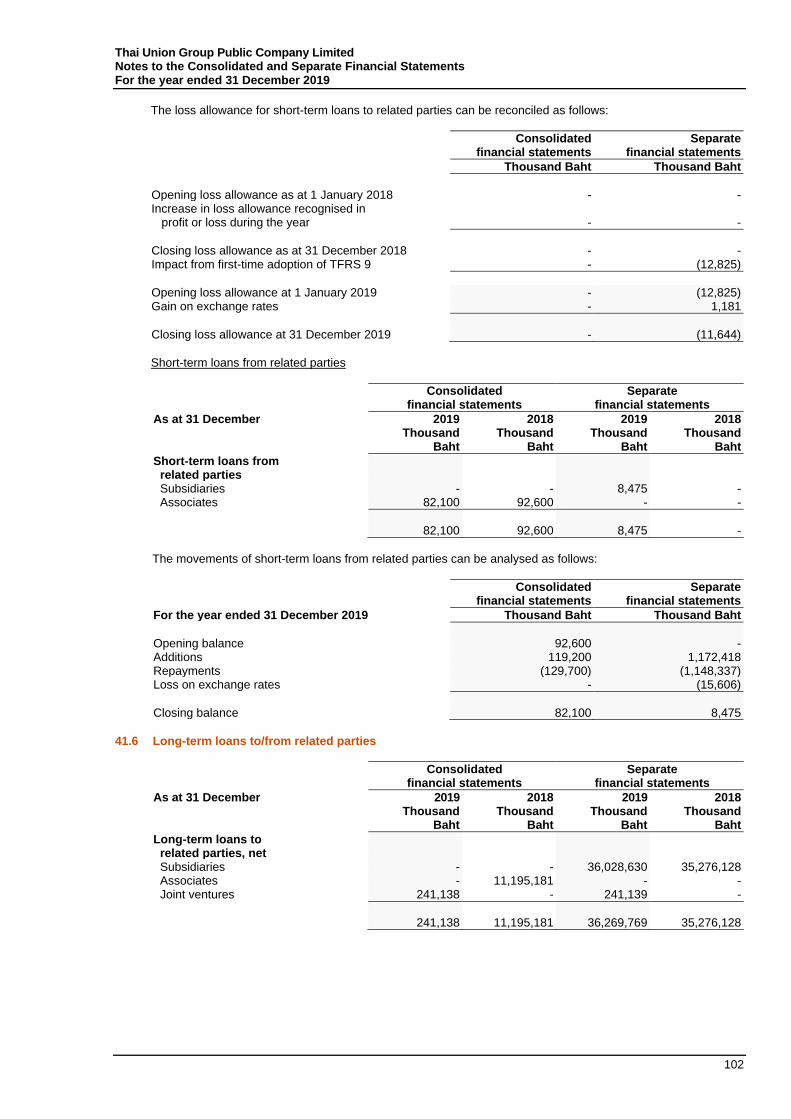
Thai Union Group Public Company Limited Notes to the Consolidated and Separate Financial Statements For the year ended 31 December 2019
102
The loss allowance for short-term loans to related parties can be reconciled as follows:
Consolidated financial statements
Separate financial statements
Thousand Baht Thousand Baht
Opening loss allowance as at 1 January 2018 - - Increase in loss allowance recognised in profit or loss during the year - -
Closing loss allowance as at 31 December 2018 - - Impact from first-time adoption of TFRS 9 - (12,825)
Opening loss allowance at 1 January 2019 - (12,825) Gain on exchange rates - 1,181
Closing loss allowance at 31 December 2019 - (11,644)
Short-term loans from related parties
Consolidated financial statements
Separate financial statements
As at 31 December 2019 2018 2019 2018 Thousand Thousand Thousand Thousand Baht Baht Baht Baht
Short-term loans from related parties Subsidiaries - - 8,475 - Associates 82,100 92,600 - -
82,100 92,600 8,475 -
The movements of short-term loans from related parties can be analysed as follows:
Consolidated financial statements
Separate financial statements
For the year ended 31 December 2019 Thousand Baht Thousand Baht
Opening balance 92,600 - Additions 119,200 1,172,418 Repayments (129,700) (1,148,337) Loss on exchange rates - (15,606)
Closing balance 82,100 8,475
41.6 Long-term loans to/from related parties
Consolidated financial statements
Separate financial statements
As at 31 December 2019 2018 2019 2018 Thousand Thousand Thousand Thousand Baht Baht Baht Baht
Long-term loans to related parties, net Subsidiaries - - 36,028,630 35,276,128 Associates - 11,195,181 - - Joint ventures 241,138 - 241,139 -
241,138 11,195,181 36,269,769 35,276,128
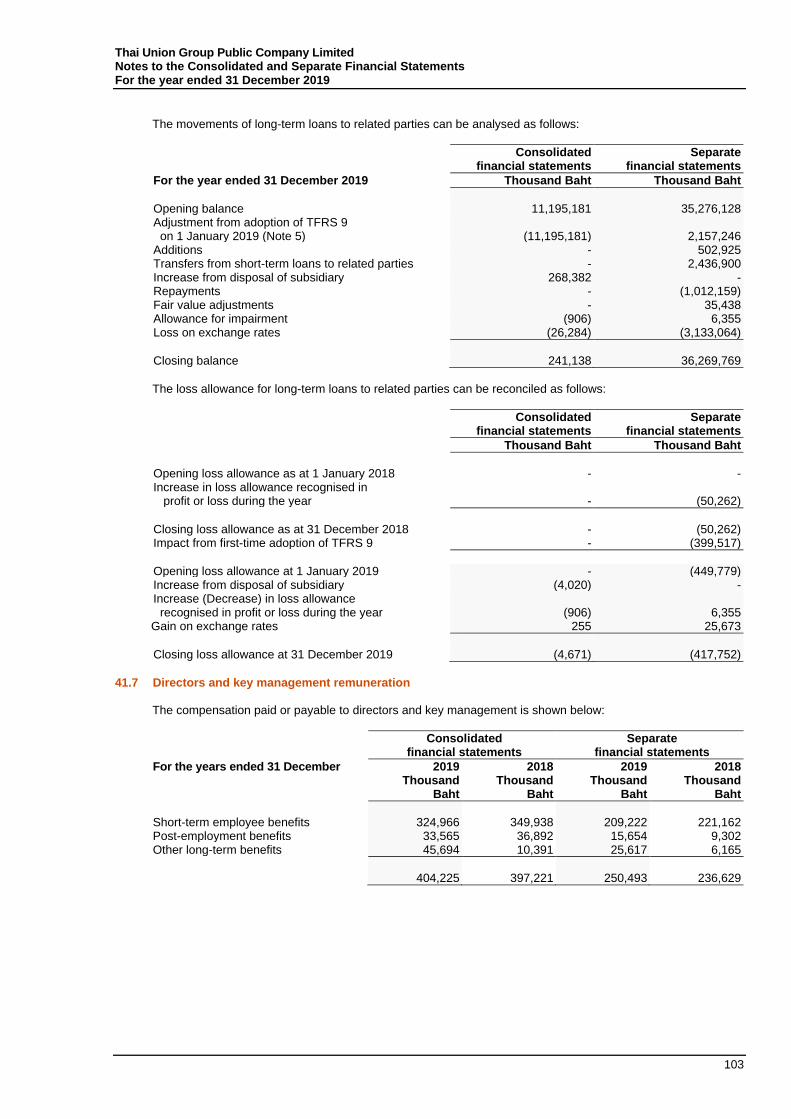
Thai Union Group Public Company Limited Notes to the Consolidated and Separate Financial Statements For the year ended 31 December 2019
103
The movements of long-term loans to related parties can be analysed as follows:
Consolidated financial statements
Separate financial statements
For the year ended 31 December 2019 Thousand Baht Thousand Baht
Opening balance 11,195,181 35,276,128 Adjustment from adoption of TFRS 9 on 1 January 2019 (Note 5) (11,195,181) 2,157,246 Additions - 502,925 Transfers from short-term loans to related parties - 2,436,900 Increase from disposal of subsidiary 268,382 - Repayments - (1,012,159) Fair value adjustments - 35,438 Allowance for impairment (906) 6,355 Loss on exchange rates (26,284) (3,133,064)
Closing balance 241,138 36,269,769
The loss allowance for long-term loans to related parties can be reconciled as follows:
Consolidated financial statements
Separate financial statements
Thousand Baht Thousand Baht
Opening loss allowance as at 1 January 2018 - - Increase in loss allowance recognised in profit or loss during the year - (50,262)
Closing loss allowance as at 31 December 2018 - (50,262) Impact from first-time adoption of TFRS 9 - (399,517)
Opening loss allowance at 1 January 2019 - (449,779) Increase from disposal of subsidiary (4,020) - Increase (Decrease) in loss allowance recognised in profit or loss during the year (906) 6,355 Gain on exchange rates 255 25,673
Closing loss allowance at 31 December 2019 (4,671) (417,752)
41.7 Directors and key management remuneration
The compensation paid or payable to directors and key management is shown below:
Consolidated financial statements
Separate financial statements
For the years ended 31 December 2019 2018 2019 2018 Thousand Thousand Thousand Thousand Baht Baht Baht Baht
Short-term employee benefits 324,966 349,938 209,222 221,162 Post-employment benefits 33,565 36,892 15,654 9,302 Other long-term benefits 45,694 10,391 25,617 6,165
404,225 397,221 250,493 236,629
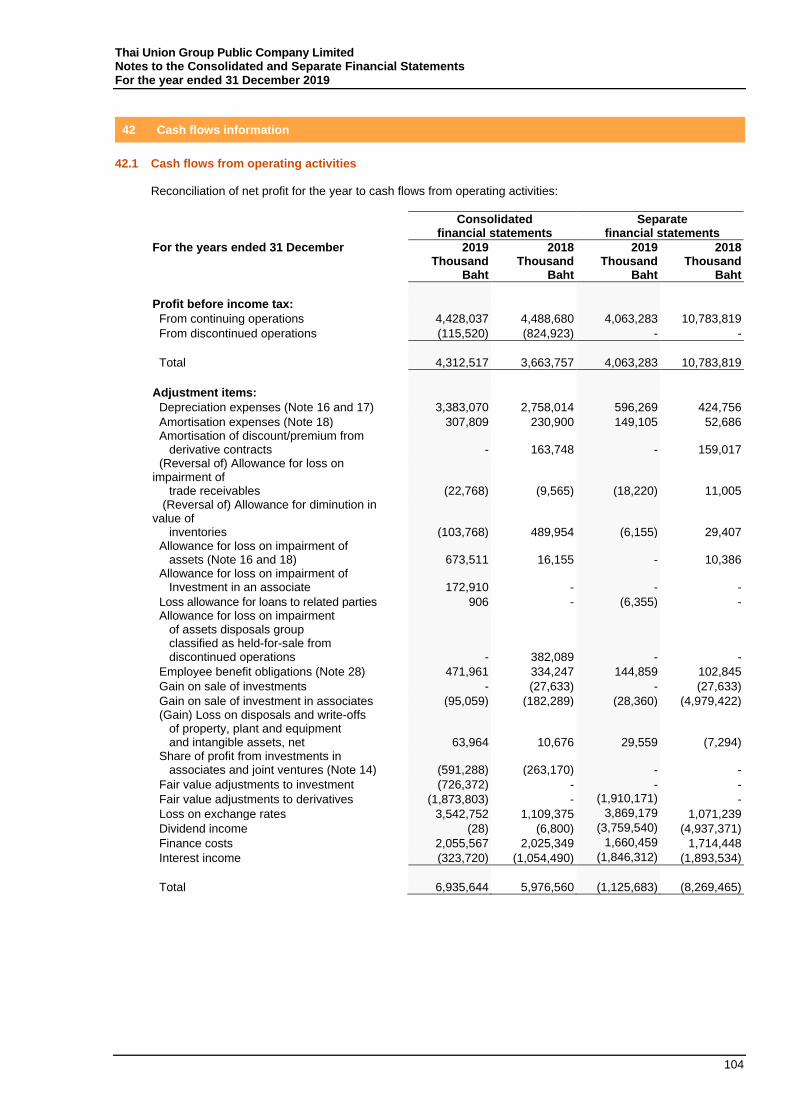
Thai Union Group Public Company Limited Notes to the Consolidated and Separate Financial Statements For the year ended 31 December 2019
104
42 Cash flows information
42.1 Cash flows from operating activities
Reconciliation of net profit for the year to cash flows from operating activities:
Consolidated financial statements
Separate financial statements
For the years ended 31 December 2019 2018 2019 2018 Thousand Thousand Thousand Thousand Baht Baht Baht Baht
Profit before income tax:
From continuing operations 4,428,037 4,488,680 4,063,283 10,783,819
From discontinued operations (115,520) (824,923) - -
Total 4,312,517 3,663,757 4,063,283 10,783,819
Adjustment items:
Depreciation expenses (Note 16 and 17) 3,383,070 2,758,014 596,269 424,756
Amortisation expenses (Note 18) 307,809 230,900 149,105 52,686 Amortisation of discount/premium from derivative contracts - 163,748 - 159,017 (Reversal of) Allowance for loss on impairment of trade receivables (22,768) (9,565) (18,220) 11,005 (Reversal of) Allowance for diminution in value of inventories (103,768) 489,954 (6,155) 29,407 Allowance for loss on impairment of assets (Note 16 and 18) 673,511 16,155 - 10,386 Allowance for loss on impairment of Investment in an associate 172,910 - - -
Loss allowance for loans to related parties 906 - (6,355) - Allowance for loss on impairment of assets disposals group classified as held-for-sale from discontinued operations - 382,089 - -
Employee benefit obligations (Note 28) 471,961 334,247 144,859 102,845
Gain on sale of investments - (27,633) - (27,633)
Gain on sale of investment in associates (95,059) (182,289) (28,360) (4,979,422) (Gain) Loss on disposals and write-offs of property, plant and equipment and intangible assets, net 63,964 10,676 29,559 (7,294) Share of profit from investments in associates and joint ventures (Note 14) (591,288) (263,170) - -
Fair value adjustments to investment (726,372) - - -
Fair value adjustments to derivatives (1,873,803) - (1,910,171) -
Loss on exchange rates 3,542,752 1,109,375 3,869,179 1,071,239
Dividend income (28) (6,800) (3,759,540) (4,937,371)
Finance costs 2,055,567 2,025,349 1,660,459 1,714,448
Interest income (323,720) (1,054,490) (1,846,312) (1,893,534)
Total 6,935,644 5,976,560 (1,125,683) (8,269,465)

Thai Union Group Public Company Limited Notes to the Consolidated and Separate Financial Statements For the year ended 31 December 2019
105
Consolidated
financial statements Separate
financial statements
For the year ended 31 December 2019 2018 2019 2018 Thousand Thousand Thousand Thousand Baht Baht Baht Baht
Changes in operating assets and liabilities: (Increase) Decrease in trade and other receivables 231,296 (423,193)
293,957 (643,913)
(Increase) Decrease in inventories (128,210) 3,351,501 (520,294) 879,497 (Increase) Decrease in other current assets 60,065 (53,807)
2,603 5,412
(Increase) Decrease in other non-current assets 7,650 144,409
4,454 7,532
Increase (Decrease) in trade and other payables 570,818 556,293
72,522 59,142
Increase (Decrease) in other current liabilities 92,623 145,565
1,496 (856)
Increase (Decrease) in other non-current liabilities (242,253) 74,036
19,691 (14,820)
Cash paid for employee benefit obligations (141,624) (135,913)
(37,685) (23,539)
Total 450,365 3,658,891 (163,256) 268,455
Profit before income tax 4,312,517 3,663,757 4,063,283 10,783,819
Adjustment items 6,935,644 5,976,560 (1,125,683) (8,269,465)
Changes in operating assets and liabilities 450,365 3,658,891 (163,256) 268,455
Cash flows receipts from operations 11,698,526 13,299,208 2,774,344 2,782,809
- Income tax received (paid) 56,772 (433,245) (3,562) (9,922)
Net cash receipts from operating activities 11,755,298 12,865,963 2,770,782 2,772,887
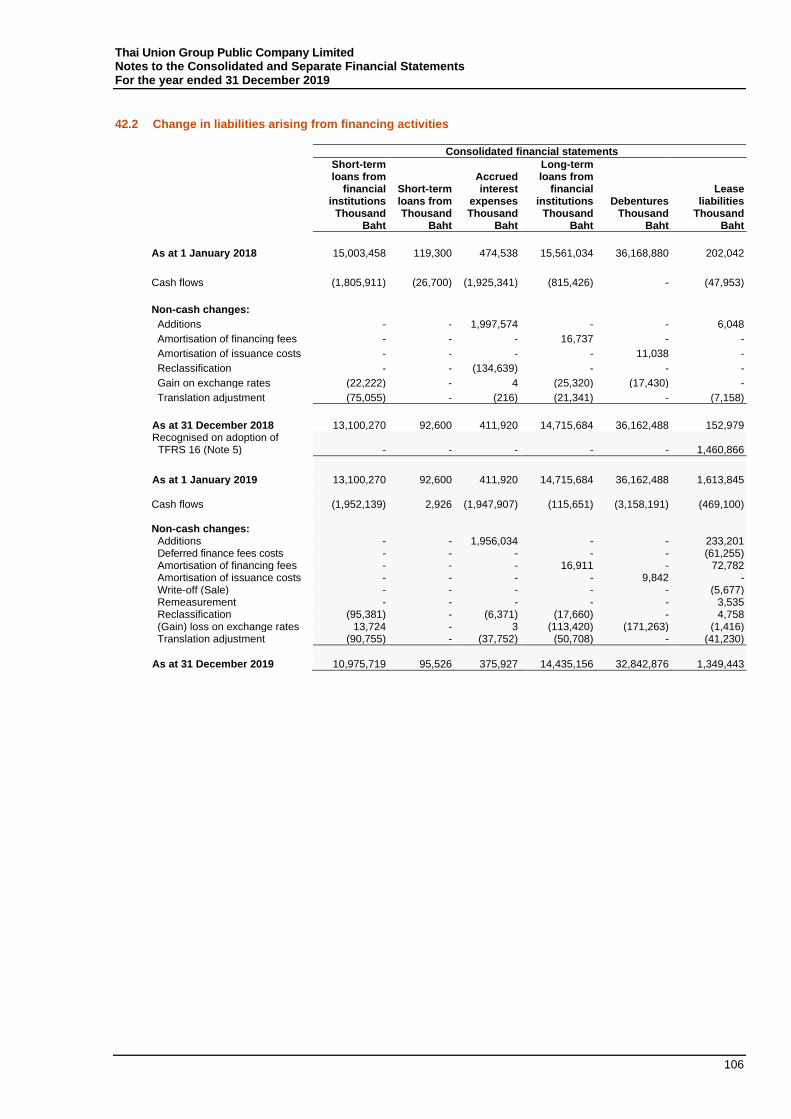
Thai Union Group Public Company Limited Notes to the Consolidated and Separate Financial Statements For the year ended 31 December 2019
106
42.2 Change in liabilities arising from financing activities
Consolidated financial statements
Short-term loans from
financial institutions
Short-term loans from
Accrued interest
expenses
Long-term loans from
financial institutions Debentures
Lease liabilities
Thousand Thousand Thousand Thousand Thousand Thousand Baht Baht Baht Baht Baht Baht
As at 1 January 2018 15,003,458 119,300 474,538 15,561,034 36,168,880 202,042
Cash flows (1,805,911) (26,700) (1,925,341) (815,426) - (47,953)
Non-cash changes:
Additions - - 1,997,574 - - 6,048
Amortisation of financing fees - - - 16,737 - -
Amortisation of issuance costs - - - - 11,038 -
Reclassification - - (134,639) - - -
Gain on exchange rates (22,222) - 4 (25,320) (17,430) -
Translation adjustment (75,055) - (216) (21,341) - (7,158)
As at 31 December 2018 13,100,270 92,600 411,920 14,715,684 36,162,488 152,979 Recognised on adoption of TFRS 16 (Note 5) - -
- - - 1,460,866
As at 1 January 2019 13,100,270 92,600 411,920 14,715,684 36,162,488 1,613,845 Cash flows (1,952,139) 2,926 (1,947,907) (115,651) (3,158,191) (469,100) Non-cash changes: Additions - - 1,956,034 - - 233,201 Deferred finance fees costs - - - - - (61,255) Amortisation of financing fees - - - 16,911 - 72,782 Amortisation of issuance costs - - - - 9,842 - Write-off (Sale) - - - - - (5,677) Remeasurement - - - - - 3,535 Reclassification (95,381) - (6,371) (17,660) - 4,758 (Gain) loss on exchange rates 13,724 - 3 (113,420) (171,263) (1,416) Translation adjustment (90,755) - (37,752) (50,708) - (41,230)
As at 31 December 2019 10,975,719 95,526 375,927 14,435,156 32,842,876 1,349,443
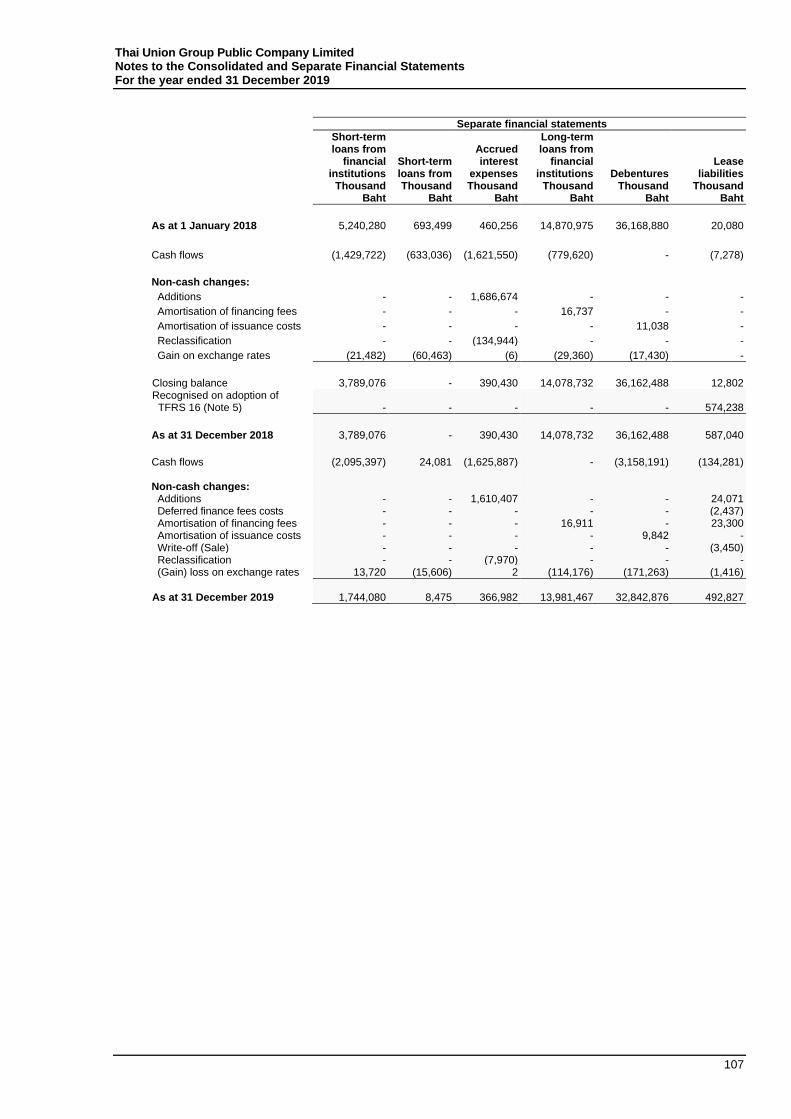
Thai Union Group Public Company Limited Notes to the Consolidated and Separate Financial Statements For the year ended 31 December 2019
107
Separate financial statements
Short-term loans from
financial institutions
Short-term loans from
Accrued interest
expenses
Long-term loans from
financial institutions Debentures
Lease liabilities
Thousand Thousand Thousand Thousand Thousand Thousand Baht Baht Baht Baht Baht Baht
As at 1 January 2018 5,240,280 693,499 460,256 14,870,975 36,168,880 20,080
Cash flows (1,429,722) (633,036) (1,621,550) (779,620) - (7,278)
Non-cash changes:
Additions - - 1,686,674 - - -
Amortisation of financing fees - - - 16,737 - -
Amortisation of issuance costs - - - - 11,038 -
Reclassification - - (134,944) - - -
Gain on exchange rates (21,482) (60,463) (6) (29,360) (17,430) -
Closing balance 3,789,076 - 390,430 14,078,732 36,162,488 12,802 Recognised on adoption of TFRS 16 (Note 5) - -
- - - 574,238
As at 31 December 2018 3,789,076 - 390,430 14,078,732 36,162,488 587,040
Cash flows (2,095,397) 24,081 (1,625,887) - (3,158,191) (134,281) Non-cash changes: Additions - - 1,610,407 - - 24,071 Deferred finance fees costs - - - - - (2,437) Amortisation of financing fees - - - 16,911 - 23,300 Amortisation of issuance costs - - - - 9,842 - Write-off (Sale) - - - - - (3,450) Reclassification - - (7,970) - - - (Gain) loss on exchange rates 13,720 (15,606) 2 (114,176) (171,263) (1,416)
As at 31 December 2019 1,744,080 8,475 366,982 13,981,467 32,842,876 492,827
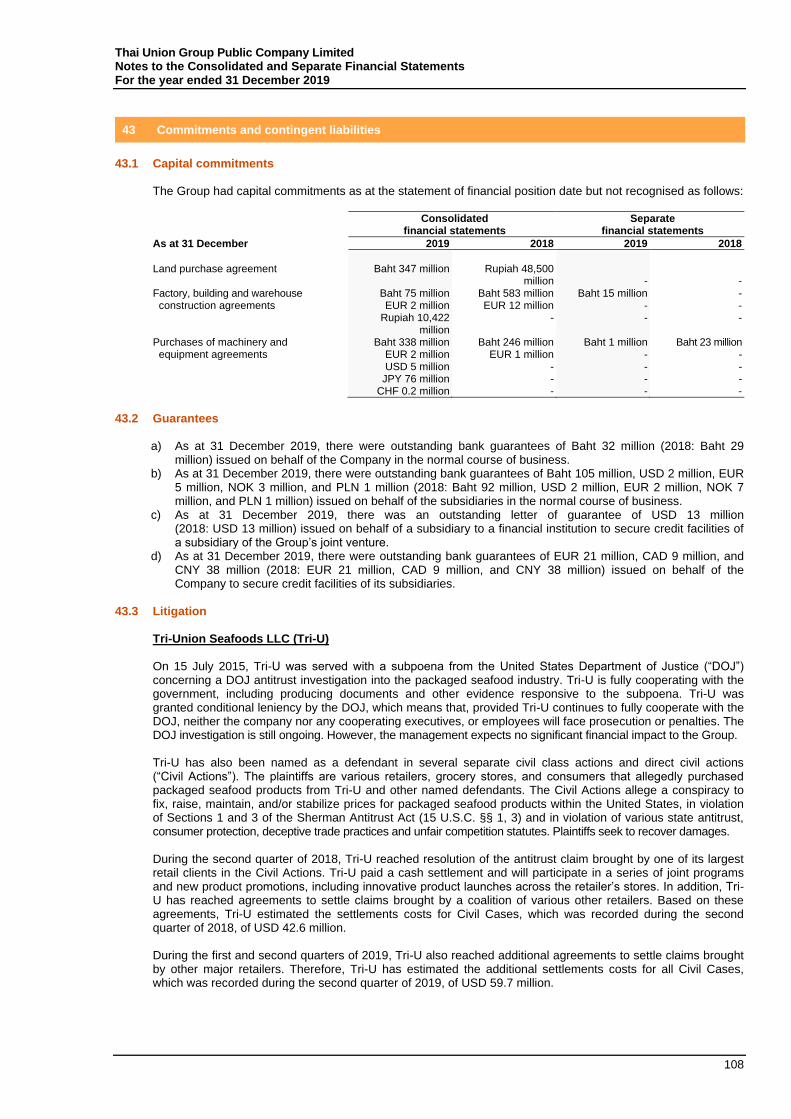
Thai Union Group Public Company Limited Notes to the Consolidated and Separate Financial Statements For the year ended 31 December 2019
108
43 Commitments and contingent liabilities
43.1 Capital commitments
The Group had capital commitments as at the statement of financial position date but not recognised as follows:
Consolidated financial statements
Separate financial statements
As at 31 December 2019 2018 2019 2018
Land purchase agreement Baht 347 million
Rupiah 48,500
million -
- Factory, building and warehouse construction agreements
Baht 75 million EUR 2 million
Rupiah 10,422 million
Baht 583 million EUR 12 million
-
Baht 15 million - -
- - -
Purchases of machinery and equipment agreements
Baht 338 million EUR 2 million USD 5 million
JPY 76 million CHF 0.2 million
Baht 246 million EUR 1 million
- - -
Baht 1 million - - - -
Baht 23 million - - - -
43.2 Guarantees
a) As at 31 December 2019, there were outstanding bank guarantees of Baht 32 million (2018: Baht 29 million) issued on behalf of the Company in the normal course of business.
b) As at 31 December 2019, there were outstanding bank guarantees of Baht 105 million, USD 2 million, EUR 5 million, NOK 3 million, and PLN 1 million (2018: Baht 92 million, USD 2 million, EUR 2 million, NOK 7 million, and PLN 1 million) issued on behalf of the subsidiaries in the normal course of business.
c) As at 31 December 2019, there was an outstanding letter of guarantee of USD 13 million (2018: USD 13 million) issued on behalf of a subsidiary to a financial institution to secure credit facilities of a subsidiary of the Group’s joint venture.
d) As at 31 December 2019, there were outstanding bank guarantees of EUR 21 million, CAD 9 million, and CNY 38 million (2018: EUR 21 million, CAD 9 million, and CNY 38 million) issued on behalf of the Company to secure credit facilities of its subsidiaries.
43.3 Litigation
Tri-Union Seafoods LLC (Tri-U) On 15 July 2015, Tri-U was served with a subpoena from the United States Department of Justice (“DOJ”) concerning a DOJ antitrust investigation into the packaged seafood industry. Tri-U is fully cooperating with the government, including producing documents and other evidence responsive to the subpoena. Tri-U was granted conditional leniency by the DOJ, which means that, provided Tri-U continues to fully cooperate with the DOJ, neither the company nor any cooperating executives, or employees will face prosecution or penalties. The DOJ investigation is still ongoing. However, the management expects no significant financial impact to the Group. Tri-U has also been named as a defendant in several separate civil class actions and direct civil actions (“Civil Actions”). The plaintiffs are various retailers, grocery stores, and consumers that allegedly purchased packaged seafood products from Tri-U and other named defendants. The Civil Actions allege a conspiracy to fix, raise, maintain, and/or stabilize prices for packaged seafood products within the United States, in violation of Sections 1 and 3 of the Sherman Antitrust Act (15 U.S.C. §§ 1, 3) and in violation of various state antitrust, consumer protection, deceptive trade practices and unfair competition statutes. Plaintiffs seek to recover damages. During the second quarter of 2018, Tri-U reached resolution of the antitrust claim brought by one of its largest retail clients in the Civil Actions. Tri-U paid a cash settlement and will participate in a series of joint programs and new product promotions, including innovative product launches across the retailer’s stores. In addition, Tri-U has reached agreements to settle claims brought by a coalition of various other retailers. Based on these agreements, Tri-U estimated the settlements costs for Civil Cases, which was recorded during the second quarter of 2018, of USD 42.6 million. During the first and second quarters of 2019, Tri-U also reached additional agreements to settle claims brought by other major retailers. Therefore, Tri-U has estimated the additional settlements costs for all Civil Cases, which was recorded during the second quarter of 2019, of USD 59.7 million.
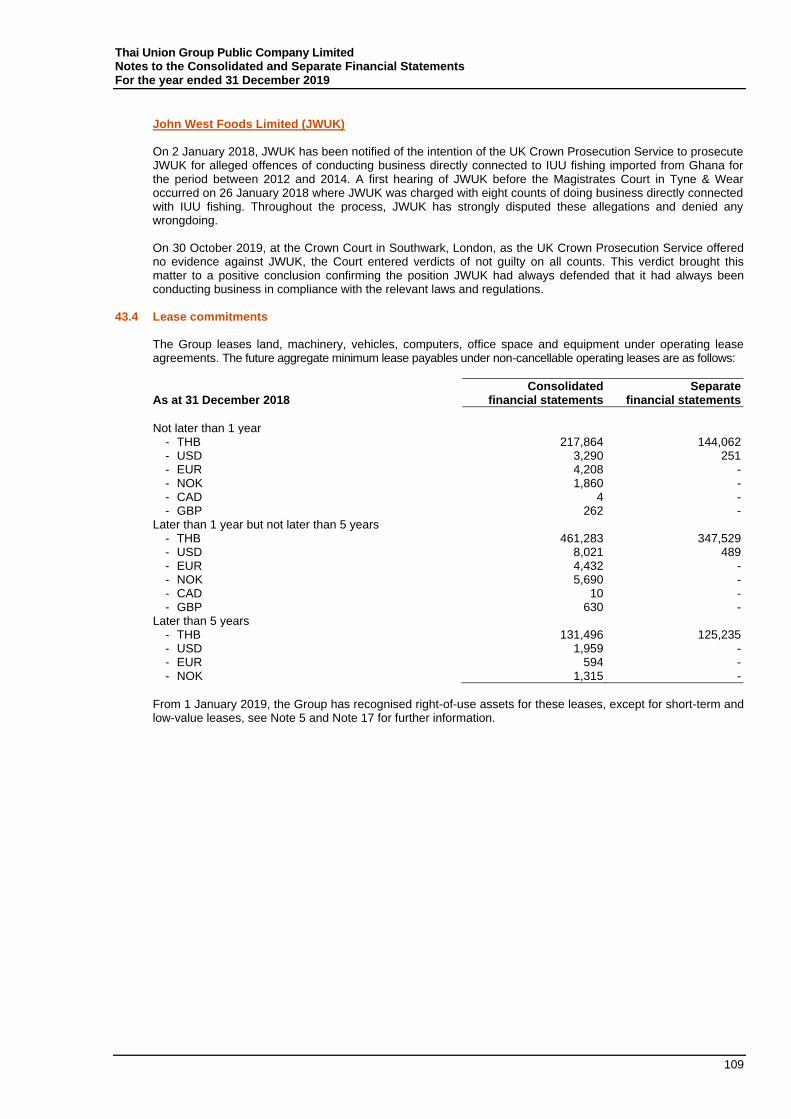
Thai Union Group Public Company Limited Notes to the Consolidated and Separate Financial Statements For the year ended 31 December 2019
109
John West Foods Limited (JWUK) On 2 January 2018, JWUK has been notified of the intention of the UK Crown Prosecution Service to prosecute JWUK for alleged offences of conducting business directly connected to IUU fishing imported from Ghana for the period between 2012 and 2014. A first hearing of JWUK before the Magistrates Court in Tyne & Wear occurred on 26 January 2018 where JWUK was charged with eight counts of doing business directly connected with IUU fishing. Throughout the process, JWUK has strongly disputed these allegations and denied any wrongdoing. On 30 October 2019, at the Crown Court in Southwark, London, as the UK Crown Prosecution Service offered no evidence against JWUK, the Court entered verdicts of not guilty on all counts. This verdict brought this matter to a positive conclusion confirming the position JWUK had always defended that it had always been conducting business in compliance with the relevant laws and regulations.
43.4 Lease commitments
The Group leases land, machinery, vehicles, computers, office space and equipment under operating lease agreements. The future aggregate minimum lease payables under non-cancellable operating leases are as follows:
As at 31 December 2018 Consolidated
financial statements Separate
financial statements
Not later than 1 year
- THB 217,864 144,062 - USD 3,290 251 - EUR 4,208 - - NOK 1,860 - - CAD 4 - - GBP 262 -
Later than 1 year but not later than 5 years - THB 461,283 347,529 - USD 8,021 489 - EUR 4,432 - - NOK 5,690 - - CAD 10 - - GBP 630 -
Later than 5 years - THB 131,496 125,235 - USD 1,959 - - EUR 594 - - NOK 1,315 -
From 1 January 2019, the Group has recognised right-of-use assets for these leases, except for short-term and low-value leases, see Note 5 and Note 17 for further information.
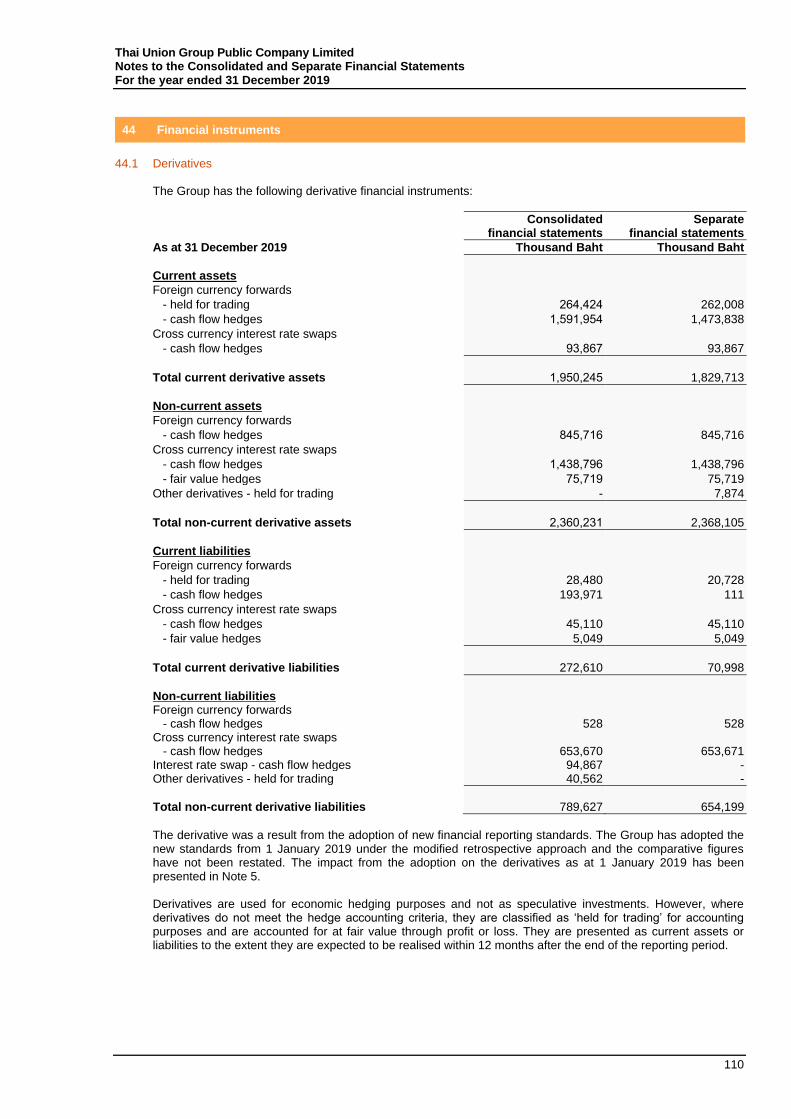
Thai Union Group Public Company Limited Notes to the Consolidated and Separate Financial Statements For the year ended 31 December 2019
110
44 Financial instruments
44.1 Derivatives
The Group has the following derivative financial instruments:
Consolidated financial statements
Separate financial statements
As at 31 December 2019 Thousand Baht Thousand Baht
Current assets
Foreign currency forwards
- held for trading 264,424 262,008
- cash flow hedges 1,591,954 1,473,838
Cross currency interest rate swaps
- cash flow hedges 93,867 93,867
Total current derivative assets 1,950,245 1,829,713
Non-current assets
Foreign currency forwards
- cash flow hedges 845,716 845,716
Cross currency interest rate swaps
- cash flow hedges 1,438,796 1,438,796
- fair value hedges 75,719 75,719
Other derivatives - held for trading - 7,874
Total non-current derivative assets 2,360,231 2,368,105
Current liabilities
Foreign currency forwards
- held for trading 28,480 20,728
- cash flow hedges 193,971 111
Cross currency interest rate swaps
- cash flow hedges 45,110 45,110
- fair value hedges 5,049 5,049
Total current derivative liabilities 272,610 70,998
Non-current liabilities Foreign currency forwards - cash flow hedges 528 528 Cross currency interest rate swaps - cash flow hedges 653,670 653,671 Interest rate swap - cash flow hedges 94,867 - Other derivatives - held for trading 40,562 -
Total non-current derivative liabilities 789,627 654,199
The derivative was a result from the adoption of new financial reporting standards. The Group has adopted the new standards from 1 January 2019 under the modified retrospective approach and the comparative figures have not been restated. The impact from the adoption on the derivatives as at 1 January 2019 has been presented in Note 5. Derivatives are used for economic hedging purposes and not as speculative investments. However, where derivatives do not meet the hedge accounting criteria, they are classified as ‘held for trading’ for accounting purposes and are accounted for at fair value through profit or loss. They are presented as current assets or liabilities to the extent they are expected to be realised within 12 months after the end of the reporting period.
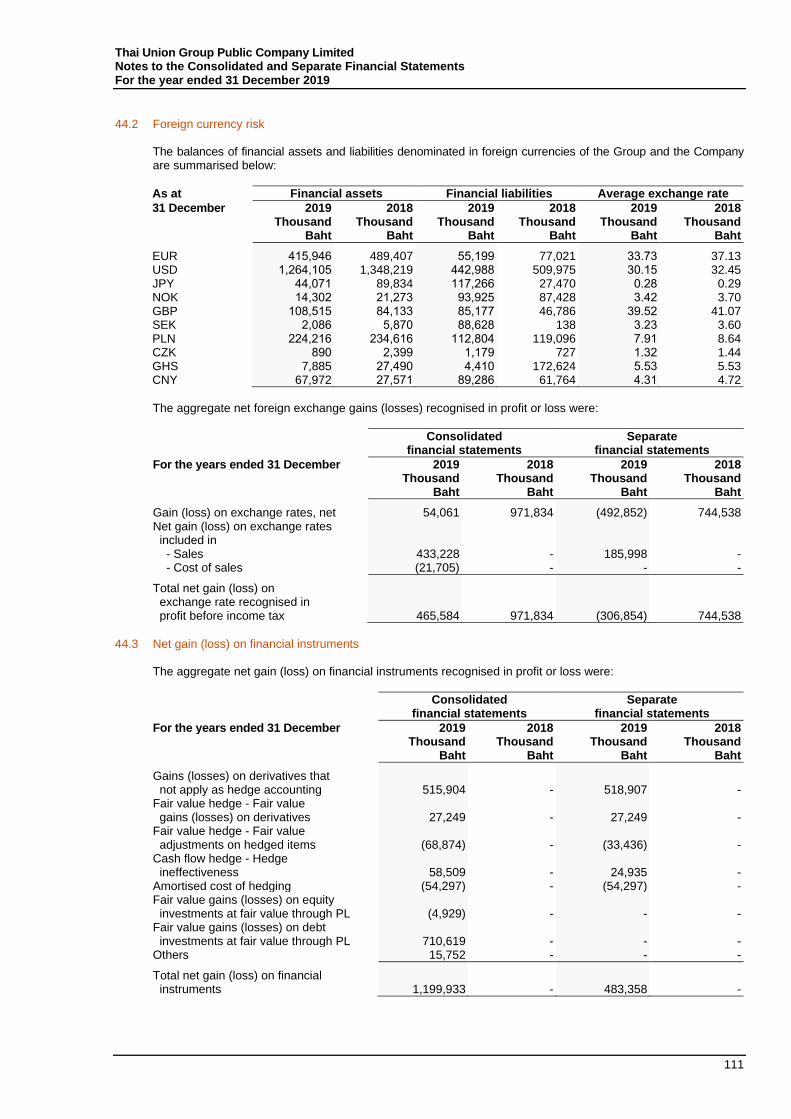
Thai Union Group Public Company Limited Notes to the Consolidated and Separate Financial Statements For the year ended 31 December 2019
111
44.2 Foreign currency risk
The balances of financial assets and liabilities denominated in foreign currencies of the Group and the Company are summarised below:
As at Financial assets Financial liabilities Average exchange rate
31 December 2019 2018 2019 2018 2019 2018 Thousand
Baht Thousand
Baht Thousand
Baht Thousand
Baht Thousand
Baht Thousand
Baht
EUR 415,946 489,407 55,199 77,021 33.73 37.13 USD 1,264,105 1,348,219 442,988 509,975 30.15 32.45 JPY 44,071 89,834 117,266 27,470 0.28 0.29 NOK 14,302 21,273 93,925 87,428 3.42 3.70 GBP 108,515 84,133 85,177 46,786 39.52 41.07 SEK 2,086 5,870 88,628 138 3.23 3.60 PLN 224,216 234,616 112,804 119,096 7.91 8.64 CZK 890 2,399 1,179 727 1.32 1.44 GHS 7,885 27,490 4,410 172,624 5.53 5.53 CNY 67,972 27,571 89,286 61,764 4.31 4.72
The aggregate net foreign exchange gains (losses) recognised in profit or loss were:
Consolidated financial statements
Separate financial statements
For the years ended 31 December 2019 2018 2019 2018 Thousand Thousand Thousand Thousand Baht Baht Baht Baht
Gain (loss) on exchange rates, net 54,061 971,834 (492,852) 744,538 Net gain (loss) on exchange rates included in - Sales 433,228 - 185,998 - - Cost of sales (21,705) - - -
Total net gain (loss) on exchange rate recognised in profit before income tax 465,584 971,834 (306,854) 744,538
44.3 Net gain (loss) on financial instruments
The aggregate net gain (loss) on financial instruments recognised in profit or loss were:
Consolidated financial statements
Separate financial statements
For the years ended 31 December 2019 2018 2019 2018 Thousand Thousand Thousand Thousand Baht Baht Baht Baht
Gains (losses) on derivatives that not apply as hedge accounting 515,904 - 518,907 - Fair value hedge - Fair value gains (losses) on derivatives 27,249 - 27,249 - Fair value hedge - Fair value adjustments on hedged items (68,874) - (33,436) - Cash flow hedge - Hedge ineffectiveness 58,509 - 24,935 - Amortised cost of hedging (54,297) - (54,297) - Fair value gains (losses) on equity investments at fair value through PL (4,929) - - - Fair value gains (losses) on debt investments at fair value through PL 710,619 - - - Others 15,752 - - -
Total net gain (loss) on financial instruments 1,199,933 - 483,358 -
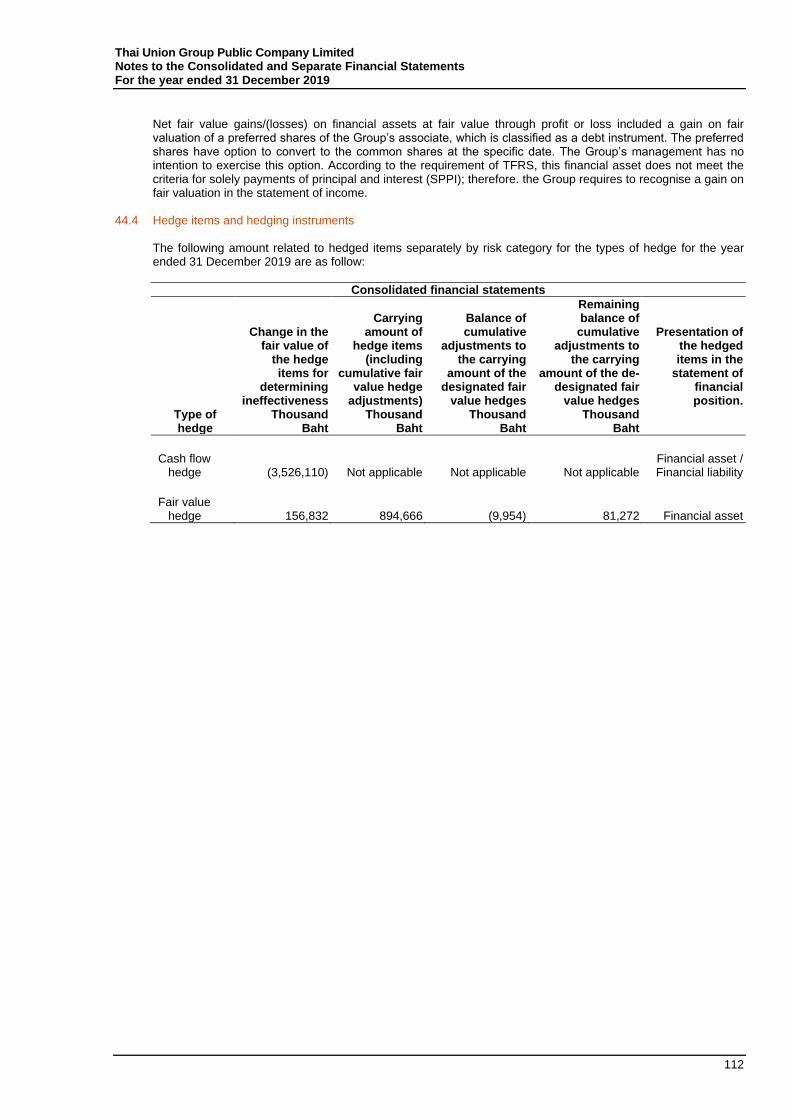
Thai Union Group Public Company Limited Notes to the Consolidated and Separate Financial Statements For the year ended 31 December 2019
112
Net fair value gains/(losses) on financial assets at fair value through profit or loss included a gain on fair valuation of a preferred shares of the Group’s associate, which is classified as a debt instrument. The preferred shares have option to convert to the common shares at the specific date. The Group’s management has no intention to exercise this option. According to the requirement of TFRS, this financial asset does not meet the criteria for solely payments of principal and interest (SPPI); therefore. the Group requires to recognise a gain on fair valuation in the statement of income.
44.4 Hedge items and hedging instruments The following amount related to hedged items separately by risk category for the types of hedge for the year ended 31 December 2019 are as follow:
Consolidated financial statements
Change in the fair value of
the hedge items for
determining ineffectiveness
Carrying amount of
hedge items (including
cumulative fair value hedge
adjustments)
Balance of cumulative
adjustments to the carrying
amount of the designated fair
value hedges
Remaining balance of
cumulative adjustments to
the carrying amount of the de-
designated fair value hedges
Presentation of the hedged items in the
statement of financial position.
Type of hedge
Thousand Baht
Thousand Baht
Thousand Baht
Thousand Baht
Cash flow hedge (3,526,110) Not applicable Not applicable Not applicable
Financial asset / Financial liability
Fair value hedge 156,832 894,666 (9,954)
81,272 Financial asset
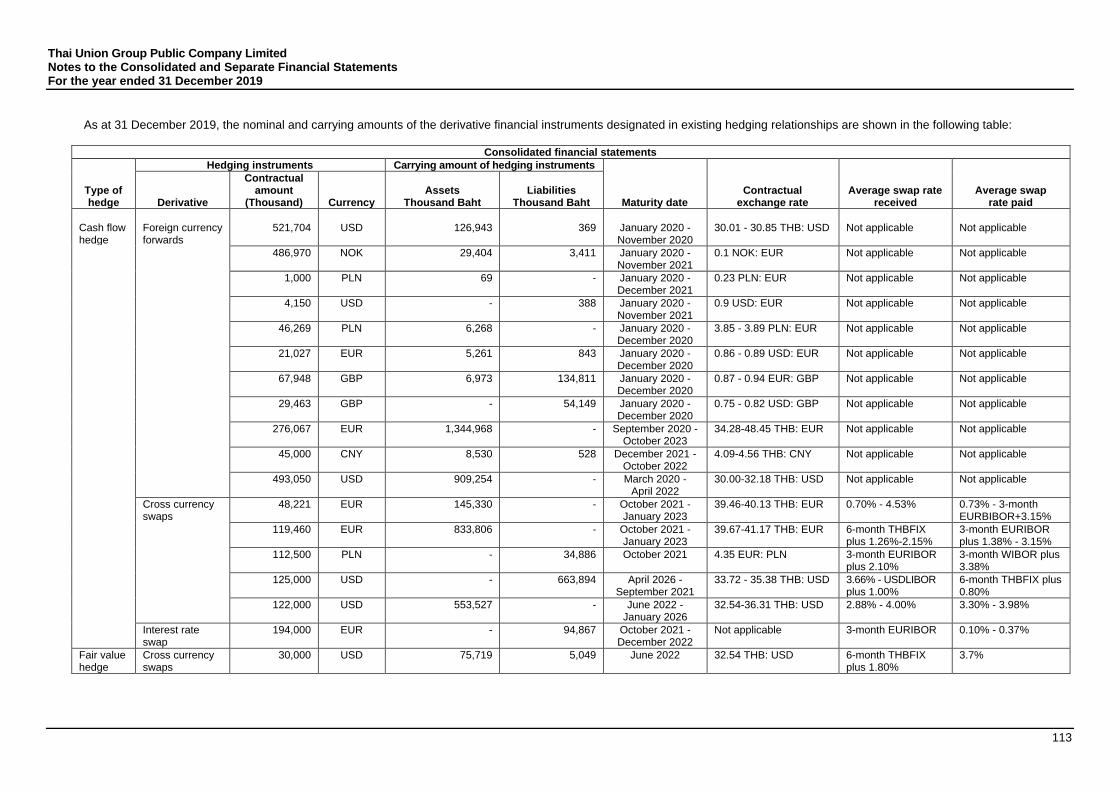
Thai Union Group Public Company Limited Notes to the Consolidated and Separate Financial Statements For the year ended 31 December 2019
113
As at 31 December 2019, the nominal and carrying amounts of the derivative financial instruments designated in existing hedging relationships are shown in the following table:
Consolidated financial statements
Type of hedge
Hedging instruments Carrying amount of hedging instruments
Maturity date Contractual
exchange rate Average swap rate
received Average swap
rate paid Derivative
Contractual amount
(Thousand) Currency Assets
Thousand Baht Liabilities
Thousand Baht
Cash flow hedge
Foreign currency forwards
521,704
USD
126,943
369
January 2020 - November 2020
30.01 - 30.85 THB: USD
Not applicable
Not applicable
486,970 NOK 29,404 3,411 January 2020 - November 2021
0.1 NOK: EUR Not applicable Not applicable
1,000 PLN 69 - January 2020 - December 2021
0.23 PLN: EUR Not applicable Not applicable
4,150 USD - 388 January 2020 - November 2021
0.9 USD: EUR Not applicable Not applicable
46,269 PLN 6,268 - January 2020 - December 2020
3.85 - 3.89 PLN: EUR Not applicable Not applicable
21,027 EUR 5,261 843 January 2020 - December 2020
0.86 - 0.89 USD: EUR Not applicable Not applicable
67,948 GBP 6,973 134,811 January 2020 - December 2020
0.87 - 0.94 EUR: GBP Not applicable Not applicable
29,463 GBP - 54,149 January 2020 - December 2020
0.75 - 0.82 USD: GBP Not applicable Not applicable
276,067 EUR 1,344,968 - September 2020 - October 2023
34.28-48.45 THB: EUR Not applicable Not applicable
45,000 CNY 8,530 528 December 2021 - October 2022
4.09-4.56 THB: CNY Not applicable Not applicable
493,050 USD 909,254 - March 2020 - April 2022
30.00-32.18 THB: USD Not applicable Not applicable
Cross currency swaps
48,221 EUR 145,330 - October 2021 - January 2023
39.46-40.13 THB: EUR 0.70% - 4.53% 0.73% - 3-month EURBIBOR+3.15%
119,460 EUR 833,806 - October 2021 - January 2023
39.67-41.17 THB: EUR 6-month THBFIX plus 1.26%-2.15%
3-month EURIBOR plus 1.38% - 3.15%
112,500 PLN - 34,886 October 2021 4.35 EUR: PLN 3-month EURIBOR plus 2.10%
3-month WIBOR plus 3.38%
125,000 USD - 663,894 April 2026 - September 2021
33.72 - 35.38 THB: USD 3.66% - USDLIBOR plus 1.00%
6-month THBFIX plus 0.80%
122,000 USD 553,527 - June 2022 - January 2026
32.54-36.31 THB: USD 2.88% - 4.00% 3.30% - 3.98%
Interest rate swap
194,000 EUR - 94,867 October 2021 - December 2022
Not applicable 3-month EURIBOR 0.10% - 0.37%
Fair value hedge
Cross currency swaps
30,000 USD 75,719 5,049 June 2022 32.54 THB: USD 6-month THBFIX plus 1.80%
3.7%
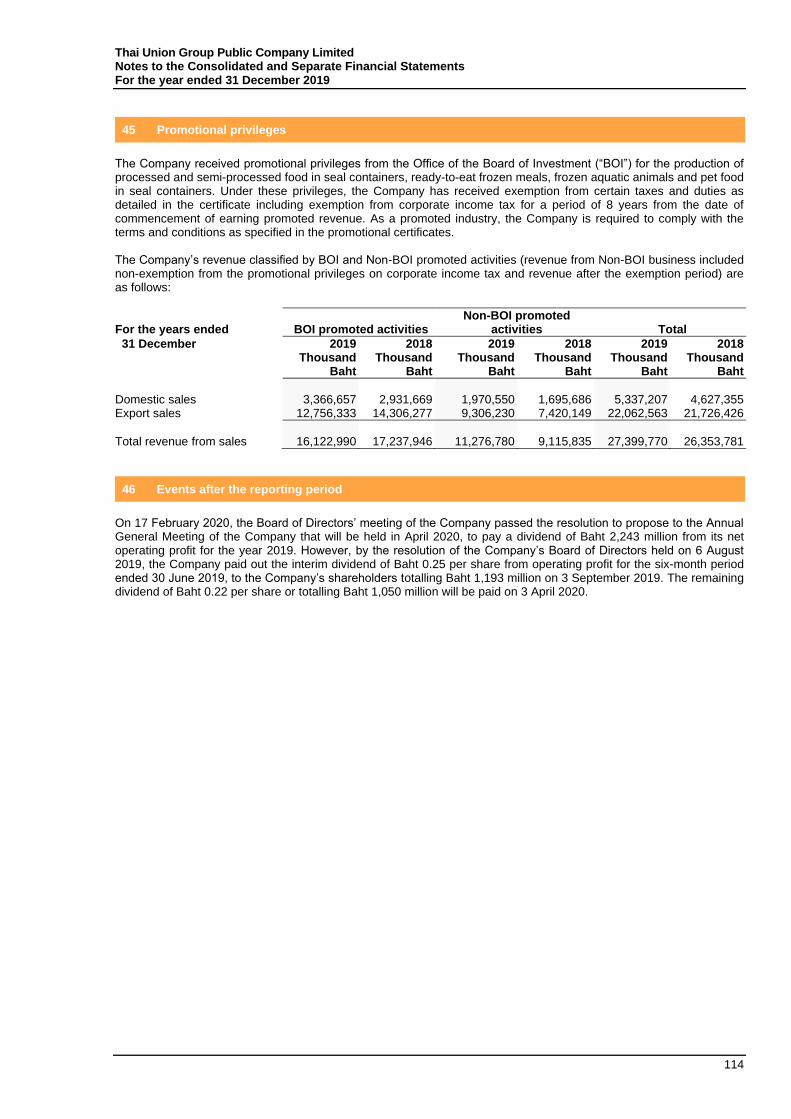
Thai Union Group Public Company Limited Notes to the Consolidated and Separate Financial Statements For the year ended 31 December 2019
114
45 Promotional privileges
The Company received promotional privileges from the Office of the Board of Investment (“BOI”) for the production of processed and semi-processed food in seal containers, ready-to-eat frozen meals, frozen aquatic animals and pet food in seal containers. Under these privileges, the Company has received exemption from certain taxes and duties as detailed in the certificate including exemption from corporate income tax for a period of 8 years from the date of commencement of earning promoted revenue. As a promoted industry, the Company is required to comply with the terms and conditions as specified in the promotional certificates. The Company’s revenue classified by BOI and Non-BOI promoted activities (revenue from Non-BOI business included non-exemption from the promotional privileges on corporate income tax and revenue after the exemption period) are as follows:
For the years ended BOI promoted activities Non-BOI promoted
activities Total
31 December
2019 Thousand
Baht
2018 Thousand
Baht
2019 Thousand
Baht
2018 Thousand
Baht
2019 Thousand
Baht
2018 Thousand
Baht
Domestic sales 3,366,657 2,931,669 1,970,550 1,695,686 5,337,207 4,627,355 Export sales 12,756,333 14,306,277 9,306,230 7,420,149 22,062,563 21,726,426
Total revenue from sales 16,122,990 17,237,946 11,276,780 9,115,835 27,399,770 26,353,781
46 Events after the reporting period
On 17 February 2020, the Board of Directors’ meeting of the Company passed the resolution to propose to the Annual General Meeting of the Company that will be held in April 2020, to pay a dividend of Baht 2,243 million from its net operating profit for the year 2019. However, by the resolution of the Company’s Board of Directors held on 6 August 2019, the Company paid out the interim dividend of Baht 0.25 per share from operating profit for the six-month period ended 30 June 2019, to the Company’s shareholders totalling Baht 1,193 million on 3 September 2019. The remaining dividend of Baht 0.22 per share or totalling Baht 1,050 million will be paid on 3 April 2020.