Edizione Srl consolidated 2014 ENG
147
2014 ANNUAL REPORT
-
Upload
khangminh22 -
Category
Documents
-
view
4 -
download
0
Transcript of Edizione Srl consolidated 2014 ENG

www.edizione.it
2014 AN
NU
AL R
EP
OR
T
2014 ANNUAL REPORT


ANNUAL REPORT AT DECEMBER 31, 2014

II
Russia - Moscow

III
TEXTILES & CLOTHING

IV
Spain - Barcelona

V
Italy - Milan

VI
USA - Charlotte International Airport

VII
FOOD & BEVERAGE

VIII
Italy - Milano: Bistrot Stazione Centrale

IX
Italy - Villoresi Est

X
Italy - A1 motorway

XI
INFRASTRUCTURES & SERVICES FOR MOBILITY

XII
Italy - Rome Fiumicino Airport

XIII
Brazil - Triangulo do Sol motorway

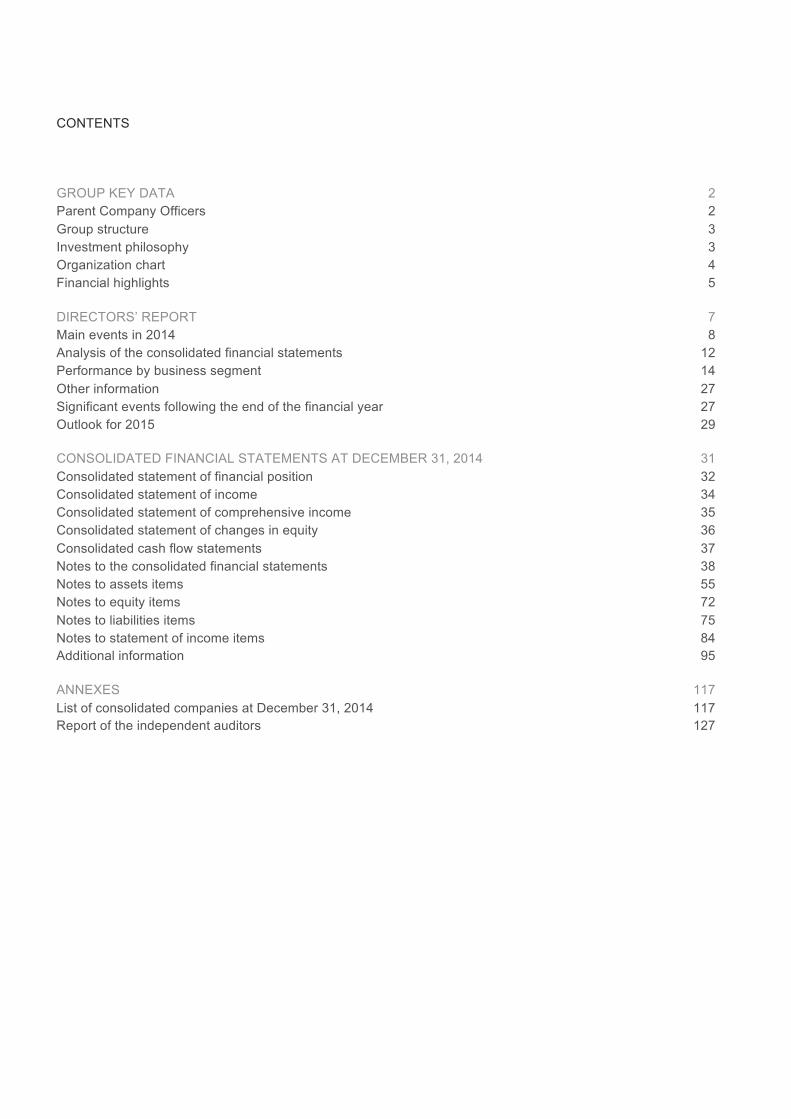
CONTENTS
GROUP KEY DATA 2 Parent Company Officers 2 Group structure 3 Investment philosophy 3 Organization chart 4 Financial highlights 5
DIRECTORS’ REPORT 7 Main events in 2014 8 Analysis of the consolidated financial statements 12 Performance by business segment 14 Other information 27 Significant events following the end of the financial year 27 Outlook for 2015 29
CONSOLIDATED FINANCIAL STATEMENTS AT DECEMBER 31, 2014 31 Consolidated statement of financial position 32 Consolidated statement of income 34 Consolidated statement of comprehensive income 35 Consolidated statement of changes in equity 36 Consolidated cash flow statements 37 Notes to the consolidated financial statements 38 Notes to assets items 55 Notes to equity items 72 Notes to liabilities items 75 Notes to statement of income items 84 Additional information 95
ANNEXES 117 List of consolidated companies at December 31, 2014 117 Report of the independent auditors 127

2 GROUP KEY DATA
GROUP KEY DATA
PARENT COMPANY OFFICERS BOARD OF DIRECTORS Gilberto Benetton CHAIRMAN Carlo Benetton DEPUTY CHAIRMAN Gianni Mion Giuliana Benetton DIRECTORS Luciano Benetton Alessandro Benetton Christian Benetton Sabrina Benetton Franca Bertagnin Benetton Fabio Cerchiai Giovanni Costa GENERAL MANAGER Carlo Bertazzo BOARD OF STATUTORY AUDITORS Angelo Casò CHAIRMAN Giovanni Pietro Cunial AUDITORS Aldo Laghi Alberto Giussani ALTERNATE AUDITORS Maria Martellini INDEPENDENT AUDITORS KPMG S.p.A.

GROUP KEY DATA 3
GROUP STRUCTURE At December 31, 2014 Edizione S.r.l., a company under the full control of the Benetton family, held equity investments mainly in the following segments: Textiles & clothing, Food & beverage, Travel retail, Infrastructures & services for mobility and Real estate & agriculture.
INVESTMENT PHILOSOPHY Edizione is an active investor that combines an entrepreneurial approach with solid financial discipline, putting finance at its companies’ service in order to improve their competitive position and returns. Edizione aims to develop its investments over the long term and to help its holdings expand by strengthening their presence in their respective sectors. This goal can also be pursued through acquisitions, which leverage global relationships built over the years. Edizione maintains an ongoing dialogue with the managers of its holdings, while fully respecting their autonomy.

4 GROUP KEY DATA
ORGANIZATION CHART The Group structure at December 31, 2014 was as follows:
The demerger of the Benetton group took effect on January 1, 2015, and in February 2015 Edizione sold its entire interest in Club Méditerranée.
Edizione(S.r.l.
100%BenettonGroup-S.p.A. (1)
100%Maccarese 95%
Cia-De-Tierras (3)
100%Edizione-Property
100%Schema34 50.10%
Autogrill
0.94%Assicurazioni-Generali
2.00%Il-Sole-24-Ore
2.16%Mediobanca
2.24%CaltagironeEditrice
4.60% (4)
Pirelli
2.22%ClubMéditerranée
32.71%Eurostazioni 40%
Grandi-Stazioni
95.90%Aeroporti-di-Roma
100%Autostradeper-l’Italia
66.40%Sintonia (2) 45.56%
Atlantia
Textiles&-clothing
Food-&beverage
Infrastructuresand-servicesfor-mobility
Real-estateand-agriculture
Other
(1)$Schematrentanove S.p.A.$ from December$ $1,$2014(2)$The$ other$shareholders$ are:$GIC$ – Government$ of$Singapore$ Investment$Corporation$ 17.68%,$
Goldman$ Sachs$Infrastructure$Partners$9.98%$and$Mediobanca S.p.A.$5.94%.(3)$The$ remaining$ 5%$stake$is$held$directly$by$Edizione S.r.l.(4)$Of$which$1.57%$held$ by$Edizione S.r.l.$and$3.03%$held$by$Schematrentaquattro$ S.p.A.
Listed$companies
Travel-retail
50.10%World-Duty-Free-Group

GROUP KEY DATA 5
FINANCIAL HIGHLIGHTS The Group’s results in 2014 and 2013, stated according to the International Financial Reporting Standards (IAS/IFRS) and audited by KPMG S.p.A., are summarized below. Further to the binding agreements signed on March 28, 2015 for the sale to Dufry A.G. of Schematrentaquattro S.p.A.'s entire 50.1% interest in World Duty Free S.p.A., in accordance with IFRS 5, the contribution of the World Duty Free group to both years' consolidated income statements is recognized under "Profit/(loss) from discontinued operations" rather than on the individual lines reserved for continuing operations. In the consolidated statement of financial position, as required by IFRS 5, the balances at December 31, 2014 of the World Duty Free group's assets and liabilities are shown under "Net assets held for sale," while at December 31, 2013 they are listed on the individual lines. The same accounting treatment applies to the Atlantia group's investments in TowerCo S.p.A. (sold in May 2014) and in the companies involved in the Ecomouv' project (due to early termination of the contract with the French government). Further details are provided in the notes to the financial statements. (Millions of Euro) 2014 2013 (*)
Revenues 10,900 10,177
Ebitda (**) 3,624 3,202
Operating result 2,004 1,769
Net income, Group 136 139
Net working capital (923) (854)
Net assets held for sale 605 19
Intangible assets, property, plant and equipment 24,828 26,241
Non-current financial assets 924 922
Other non-current assets/(liabilities), net (1,716) (1,270)
Total non-current assets 24,036 25,893
Net capital employed 23,718 25,058
Shareholders’ equity, Group 5,040 4,906
Non-controlling interests 7,045 6,887
Total shareholders’ equity 12,085 11,793
Net financial indebtedness 11,633 13,265
Cash flow (***) 2,327 2,207
Net income, Group/Shareholders' equity (ROE) 2.7% 2.8%
Operating result/Capital employed (ROI) 8.4% 7.1%
(*) Some 2013 figures have been restated to reflect the completed accounting of Gemina S.p.A.'s absorption by Atlantia S.p.A. and the recognition in accordance with IFRS 5 of the discontinued operations of the Atlantia and World Duty Free groups.
(**) Operating result plus depreciation, amortization, impairment and provisions. (***) Net income before minority interests plus depreciation, amortization, impairment and provisions.
To fully appreciate the Group’s results and financial situation, the variety of its business segments must be considered, as described in detail on the following pages.

6 GROUP KEY DATA

DIRECTORS’ REPORT 7
DIRECTORS’ REPORT

8 DIRECTORS’ REPORT
Dear Shareholders, The Group's share of net income in 2014 comes to Euro 136 million, with little change on the previous year (Euro 139 million). Although macroeconomic conditions in Europe remained weak, the Group's international scope and diversified business segments allowed it to gain ground in both revenues (+7.1%) and Ebitda (+13.2%). At December 31, 2014, consolidated shareholders' equity stood at Euro 12,084 million (Euro 11,793 million the previous year) and net financial indebtedness at Euro 11,633 million, an improvement of Euro 1,632 million since the previous year (Euro 13,265 million), including Euro 1,027 million due to the different accounting method used for the World Duty Free group.
MAIN EVENTS IN 2014 The main events are described briefly below:
TEXTILE & CLOTHING In 2014 the Benetton group started to implement the refocusing program approved toward the end of the previous year. This is a preparatory step for Benetton's comprehensive turnaround plan, formalized in 2014 and reflected in the three-year business plan for 2015-2017. The key features of the turnaround plan are as follows: ! a narrower group perimeter allowing the concentration of financial and managerial resources; ! the consequent reorganization of the corporate structure according to a functional model; ! a shift in the business model from sell-in to sell-out, with implications for commercial and logistical
processes; ! local country support by way of directly operated units with differentiated strategies (reinforcement,
profitability or growth) by geographical area and country, depending on specific opportunities and market conditions;
! better control of stores network, both directly and indirectly operated, by strengthening the retail structure and gradually introducing franchising arrangements with partners;
! repositioning of the Benetton brand and confirmation of Sisley's positioning, accompanied by better product quality (intrinsic and fit) and a gradual improvement in price realization;
! an approach to sourcing and product development involving greater leverage on suppliers and shorter wait times, along with a more streamlined supplier pool, which will benefit scale effects and therefore costs and supply chain control;
! streamlining of the centralized units.
At the end of this process, the group will be more concentrated, simpler, and more responsive, with a greater focus on the end consumer. The measures taken in 2014, whose income statement reflects both the impact of those measures and the cost of preparatory steps or actions net yet completed, should therefore be seen in light of the long-term turnaround plan described. In the context of the three-year refocusing program, the Benetton group has implemented a complex reorganization process mainly aimed at segmenting the group into three branches, corresponding to three distinct and independent business sectors: commercial, manufacturing and real estate. Through a series of extraordinary corporate actions, the Benetton group that referred to Benetton Group S.p.A. (now Schematrentanove S.p.A.) has been demerged with effect from January 1, 2015 into a commercial group (focused on the core business of brands, merchandise, marketing, sales and retail) headed by Benetton Group S.r.l., a manufacturing group (weaving, knitting, spinning, dyeing and sewing, with industrial platforms in the Mediterranean region) headed by Olimpias Group S.r.l., and a real estate group headed by Schematrentanove S.p.A.

DIRECTORS’ REPORT 9
FOOD & BEVERAGE 2014 was characterized by sustained growth in passenger traffic in airports and a recovery in motorway traffic in all the main geographical regions in which the group operates. Passenger traffic in airports was up 5.1% worldwide. Growth was significant in Europe (up 5.3%) and North America (up 3.3%) and particularly sustained in airports in the Middle East (up 9.4%) and Asia (up 5.9%). The motorway channel in Italy showed faint signs of recovery, with traffic up 0.9%, due in part to falling fuel prices in the last quarter. Motorway traffic in the United States grew 0.5%. In this scenario Autogrill continued with its business development strategy, strengthening both its commercial operations, especially in the airport channel, in markets where the group is already active, like the United States, the UK, Germany and Scandinavian countries, and exploiting important opportunities to expand in emerging and faster growing economies like Vietnam, Indonesia, Turkey and United Arab Emirates. In parallel, given the persistent weakness of the Italian market, Autogrill concentrated on redefining its operating perimeter through selective renewals in the motorway channel. Thanks to these actions and the enhanced flexibility of its business model, Autogrill was able to manage and limit the impact of the crisis and is ready to take advantage of any growth opportunities that might arise. HMSHost’s sales (North America and International) in 2014, net of the change in perimeter due to the transfer of the US Retail Division to World Duty Free, increased 4.7%. The Ebitda margin rose from 11% to 11,2%. In Italy, given the persistent weakness of the domestic market, Autogrill concentrated on redefining its operating perimeter through selective renewals in the motorway channel, maintaining its operations in service areas with greater potential (21 service areas were renewed out of a total of 39 up for tender). As a consequence, the motorway channel in Italy registered a 2.9% decrease on 2013 (+0.4% on a like-for-like basis). Net of non-recurring items, the Ebitda margin rose from 5.6% to 6.1%. Sales in Other European countries rose 4.3% overall, with the Ebitda margin coming in at 6.6% against 6.8% in the previous year. Capital expenditure in 2014 amounted to Euro 196.4 million (Euro 162.6 million in 2013); about 60% of which in North America and International. The airport channel continues to be key to the future growth of the Autogrill group; large investments were made and new formulas of catering were developed to meet the needs - ever changing and increasingly sophisticated - of travelers.
INFRASTRUCTURES & SERVICES FOR MOBILITY Despite the continuing weakness of the European economy, traffic on the Group’s Italian motorway showed positive signs of stabilizing in 2014 with both light and heavy vehicles rising 1%. 2014 witnessed completion of the last of the 41 tunnels forming part of the Variante di Valico project, which in terms of size and complexity rivals other major European infrastructure projects, like the San Gotthard and Channel tunnels. At the same time, construction of the third lane of the Senigallia-Ancona North and Ancona North-Ancona South sections of the motorway, which runs down Italy’s Adriatic coast, proceeded, marking the final 35-km stretch of motorway to be widened as part of the upgrade of 155 km of the A14. In preparation for Expo 2015, work on widening the Milan-Lainate section of the A8 Milan-Lakes motorway to five lanes also began. Major works with a value of more than Euro 9 billion have been completed thus far, out of a total of over Euro 15 billion envisaged in the Group’s concession agreements. The overseas motorway networks posted strong growth in traffic (up 3.9%) in 2014, despite the slower growth in Brazil linked to the downturn of the country’s economy. The contribution of the South American operators to the

10 DIRECTORS’ REPORT
Group’s results was, however, adversely affected by the weakening of the respective domestic currencies. Investment in upgrading the network increased: in Chile, the operator, Costanera Norte, continued with a series of investments amounting to approximately Euro 325 million focused on eliminating the principal bottlenecks on the motorway that crosses the country’s capital city. Airport traffic in 2014 was well ahead of the previous year at both Fiumicino and Ciampino, due above all to growth in the international segment and the fact that new carriers have chosen Fiumicino as the base from which to service new routes. Aeroporti di Roma launched the new “Quality Plan” in order to achieve excellence in service and to monitor customer satisfaction. According to the independent firm Airports Council International, the quality of the service offered passengers at Fiumicino airport now exceeds Madrid, Frankfurt and Paris. Investments made to update and enhance Fiumicino airport accelerated significantly in 2014 in order to make it more comfortable and able to accommodate the growing volume of traffic. The rescue of Alitalia, thanks to its partnership with Etihad and the company’s recapitalization (in which Atlantia participated), will give further impetus to the development of Fiumicino airport, to international tourism and to the country’s economy as a whole. The integration with Aeroporti di Roma in December 2013 laid the foundation for new opportunities to grow and diversify in both Italy, as well as other rapidly developing countries. The Atlantia Group aims to build a global player in the management of motorway and airport infrastructure by leveraging on the following development tools: ! Strengthening of infrastructure - improve the safety and quality of the service provided by completing
investments in strengthening the motorway and airport infrastructures managed and ensure that they meet traffic demands, including through requalification projects and operational optimization.
! International development - reinforce the international presence by participating in projects in countries with high potential for growth (i.e. Brazil, Chile, India), through vehicle companies open to partnerships with premiere local and international investors.
! Technological innovation - enhance proprietary operational and technological know-how in order to provide innovative solutions relating to tolling systems, traffic control, urban access, monitoring and customer assistance.
HOLDING COMPANIES
The Parent company ! In March 2014, Edizione completed the sale of its remaining 1.07% interest in RCS MediaGroup S.p.A. The
shares were sold in the open market at an average price of Euro 1.60 each, for a total intake of Euro 7.25 million.
! On February 10, 2014 the City of Venice issued an exceptional building permit for the expansion, change of use and renovation of the property complex "Fondaco dei Tedeschi." Work began on March 1, 2014 and should conclude by January 2016.
Sintonia S.p.A. ! On March 20, 2014 Sintonia took out a Euro 400 million credit line from a pool of six banks, with a
decreasing balance and a final maturity of June 15, 2015. Use of the new credit line and of the company's cash reserves allowed the early repayment of bank debt due in 2014.
! In October 2014 Sintonia exercised its right to sell to Atlantia all of the 58,877,856 Contingent Value Rights assigned following the merger, finalized in 2013, of Gemina S.p.A. in and with Atlantia S.p.A. at an exercise price of Euro 0.0732.
! On December 18, 2014 Sintonia's shareholders announced that they would no longer participate in the shareholders' agreement of June 21, 2012. Under the terms of that agreement, Sintonia S.p.A. is therefore

DIRECTORS’ REPORT 11
undergoing a partial demerger; when completed, a share of Sintonia's assets and liabilities will be assigned to three beneficiary companies wholly owned by the Sintonia shareholders other than Edizione. In particular, each of the beneficiary companies will receive a portion of Sintonia's interest in Atlantia S.p.A., currently 45.56%. After the demerger, Edizione will be Sintonia's sole shareholder. The interest in Atlantia will be split as follows once the demerger takes effect: ! share owned by the beneficiary of Mediobanca S.p.A.: 2.71%; ! share owned by the beneficiary of Sinatra S.à r.l.: 4.55%; ! share owned by the beneficiary of Pacific Mezz InvestCo S.à r.l.: 8.05%; ! share remaining with Sintonia S.p.A.: 30.25%.
The demerger should take effect by the end of June 2015. If it is not completed by then, the shareholders' agreement will be extended until the demerger takes effect, but in any case not beyond September 21, 2015.

12 DIRECTORS’ REPORT
ANALYSIS OF THE CONSOLIDATED FINANCIAL STATEMENTS The Group's key results for 2014 and 2013 are shown below. They do not include the individual income statement items of the World Duty Free group and the discontinued operations and held-for-sale assets of the Atlantia group (TowerCo and Ecomouv'), which are recognized under "Profit from assets held for sale and discontinued operations."
(Millions of Euro) 2014 % 2013 %
Revenues 10,900 100 10,177 100
Materials and subcontracted work (2,933) (26.9) (2,909) (28.6)
Payroll costs (2,380) (21.8) (2,274) (22.3)
Other costs and general expenses, net (1,964) (18.0) (1,792) (17.6)
Ebitda (**) 3,624 33.2 3,202 31.5
Depreciation, amortization, impairments and provisions (1,620) (14.9) (1,434) (14.1)
Operating result (Ebit) 2,004 18.4 1,768 17.4
Net financial income/(charges) (782) (7.2) (841) (8.3)
Income/(losses) from equity investments 6 0.1 220 2.2 Income/(charges) from currency hedges and exchange differences (24) (0.2) 6 0.1
Income before taxes and non-controlling interests 1,204 11.0 1,153 11.3
Income taxes (603) (5.5) (494) (4.9)
Profit/(loss) from continuing operations 601 5.5 659 6.5
Profit/(loss) from assets held for sale and discontinued operations 106 1.0 114 1.1
Non-controlling interests (571) (5.2) (634) (6.2)
Net income, Group 136 1.2 139 1.4 (*) Some 2013 figures have been restated to reflect the completed accounting of Gemina S.p.A.'s absorption by Atlantia S.p.A. and the
recognition in accordance with IFRS 5 of the discontinued operations of the Atlantia and World Duty Free groups. (**) Operating result plus depreciation, amortization, impairment and provisions.
Consolidated revenues increased by Euro 723 million (+7.1%) thanks to the Infrastructures & services for mobility segment, which enjoyed the full-year consolidation of Aeroporti di Roma. Revenues are broken down below by business segment (net of intercompany sales): (Millions of Euro) 2014 % 2013 %
Travel food & beverage 4,461 40.9 4,546 44.7
Infrastructures & services for mobility 4,763 43.7 3,986 39.2
Textiles and clothing 1,633 15.0 1,602 15.7
Others 43 0.4 43 0.4
Total 10,900 100 10,177 100

DIRECTORS’ REPORT 13
The following table shows revenues by geographical area: (Millions of Euro) 2014 % 2013 %
Italy 6,459 59.3 5,756 56.6
Rest of Europe 1,661 15.2 1,575 15.4
Americas 2,416 22.2 2,513 24.7
Rest of the world 364 3.3 333 3.3
Total 10,900 100 10,177 100 Aeroporti di Roma's contribution is also evident geographically, with revenues in Italy up by Euro 701 million. Ebitda and Ebit grew by Euro 421 million and Euro 234 million, respectively, due mainly to the full-year contribution of Atlantia's airport business. See below for a detailed description of performance by the Group's three main business segments. Net financial income/(charges) came to Euro 781 million for the year, a decrease of Euro 60 million with respect to 2013. Income/(losses) from equity investments showed a positive balance of Euro 6 million. The Euro 220 million reported for 2013 reflects the remeasurement at fair value of the investment in Gemina S.p.A., which has become a controlling interest as a result of the merger with Atlantia. Income taxes increased by Euro 109 million due to the rise in taxable income of the Atlantia group. Despite the growth of Income before taxes, the larger tax bill brought the Profit from continuing operations to Euro 601 million, a decrease of 8.8% on the previous year. The Profit/(loss) from discontinued operations came to Euro 106 million: Euro 64 million for the Atlantia group (TowerCo and Ecomouv') and Euro 42 million for the World Duty Free group (Euro 102 million in 2013). The Group's share of net income amounts to Euro 136 million, essentially in line with the previous year's Euro 139 million.

14 DIRECTORS’ REPORT
Financial situation The Group’s main financial figures at December 31, 2014 and 2013, duly restated, are as follows:
(Millions of Euro) 12.31.2014 % 12.31.2013 %
Net working capital:
- inventories 611 2.6 744 3.0
- receivables, accrued income and prepaid expenses 2,291 9.7 2,330 9.3
- payables, accrued expenses and prepaid income (3,825) (16.1) (3,928) (15.7)
Net working capital (923) (3.8) (854) (3.4)
Net assets held for sale 605 2.6 19 0.1
Non-current assets:
- intangible assets 6,786 28.6 7,941 31.7
- concession rights, net 16,029 67.6 16,056 64.1
- property, plant and equipment 2,013 8.5 2,244 9.0
- non-current financial assets 924 3.9 922 3.7
- other non-current assets/(liabilities), net (1,716) (7.2) (1,270) (5.1)
Non-current assets 24,036 101.3 25,893 103.3
Net capital employed 23,718 100 25,058 100
- Shareholders’ equity, Group 5,040 21.2 4,906 19.6
- Non-controlling interests 7,045 29.7 6,887 27.5
Total shareholders’ equity 12,085 51.0 11,793 47.1
Net financial indebtedness 11,633 49.0 13,265 52.9
Sources of funding 23,718 100 25,058 100
(*) Some 2013 figures have been restated to reflect the completed accounting of Gemina S.p.A.'s absorption by Atlantia S.p.A.
Figures for the two years are not directly comparable because the balances at December 31, 2014 no longer include the assets and liabilities of World Duty Free, which are included under "Net assets held for sale." Net financial indebtedness improved by Euro 1,632 million on the previous year (Euro 13,265 million), including Euro 1,027 million due to the different accounting method used for the World Duty Free group. Net financial indebtedness, including the fair value measurement of hedging instruments, is broken down below: (Millions of Euro) 12.31.2014 12.31.2013
Edizione S.r.l. 36 (35)
Schematrentaquattro S.p.A. (157) (84)
Benetton group (137) (286)
Autogrill group (693) (673)
World Duty Free group - (1,027)
Other companies (12) (13)
Total Retail businesses (963) (2,118)
Sintonia S.p.A. (142) (378)
Atlantia group (10,528) (10,769)
Total Infrastructure businesses (10,670) (11,147)
Net financial indebtedness (11,633) (13,265)

DIRECTORS’ REPORT 15
PERFORMANCE BY BUSINESS SEGMENT The performance of the main group companies is discussed below by business segment. The 2014 and 2013 results for the Benetton, Autogrill and Atlantia groups are stated in accordance with the International Financial Reporting Standards (IAS/IFRS) in effect as of the reporting date. The results of the other companies, discussed hereafter, have been drawn from the financial statements prepared according to local GAAP.

16 DIRECTORS’ REPORT
TEXTILE & CLOTHING
Benetton Group S.p.A. (Schematrentanove S.p.A. from December 1, 2014 - controlling interest at 12.31.2014: 100%) Economic and financial highlights for 2014 and 2013 refer to the group in its pre-demerger configuration: (Millions of Euro) 2014 % 2013 %
Revenues 1,637 100 1,602 100
Cost of sales (934) (57.1) (948) (59.2)
Gross operating profit 703 42.9 654 40.8
Sales and general expenses (635) (38.8) (613) (38.3)
Capital gains on disposal of fixed assets 81 4.9 205 12.8
Provisions for risks and charges (84) (5.1) (150) (9.4)
Depreciation and amortization (68) (4.2) (85) (5.3)
Impairments (27) (1.6) (162) (10.1)
Operating result (30) (1.8) (151) (9.4)
Net financial charges (1) (0.1) (29) (1.8)
Net foreign currency hedging gains/(losses) and exchange differ-ences (35) (2.1) 2 0.1
Income before taxes and non-controlling interests (67) (4.0) (172) (10.7)
Income taxes (22) (1.3) (25) (1.6)
Non-controlling interests 2 0.1 2 0.1
Net income, group (91) (5.6) (199) (12.4)
12.31.2014 12.31.2013
Cash flow from operating activities 23 94
Investments for the year, gross 57 87
Capital employed 1,338 1,573
Shareholders’ equity 1,201 1,287
Net financial indebtedness 137 286
Net financial indebtedness/Ebitda (*) 1.73 2.60
(*) Ebitda = operating result net of depreciation, amortization, and impairment of property, plant and equipment and intangible assets.
Revenues The group earned net revenues of Euro 1,637 million, compared with Euro 1,602 million in 2013 (+2.2% at current exchange rates and +3.4% at constant exchange rates) reflecting: ! fewer deliveries of the Spring/Summer 2014 collection at the end of 2013, which were completed timewise
in the first few months of 2014; ! the higher proportion of revenues from direct-channel sales than in 2013, due to streamlining of the retail
network and the consequent acquisition of some stores previously operated by indirect partners; ! fewer trade discounts given to indirect-channel customers; ! the decline in sell-in revenues from third-party retailers, partly because of the reorganization taking place in
the retail network; ! the negative impact of certain exchange rate trends.

DIRECTORS’ REPORT 17
Revenues by geographical area are as follows: (Millions of Euro) 2014 % 2013 % Change
Italy 620 37.9 617 38.5 3
Rest of Europe 623 38.1 596 37.2 27
Asia 320 19.5 308 19.2 12
Americas 59 3.6 65 4.1 (6)
Rest of the world 15 0.9 16 1.0 (1)
Total 1,637 100 1,602 100 35
Operating margins The gross operating profit came to Euro 703 million or 42.9% of revenues, compared with 40.8% the previous year. The operating result was a negative Euro 30 million (negative Euro 151 million in 2013), resulting from: ! provisions of Euro 84 million, including Euro 80 million for doubtful accounts; ! capital gains of Euro 89 million on the sale of a property in Paris; ! reorganization provisions and charges of Euro 47 million; ! impairment of property, plant, and equipment and intangible assets totalling Euro 27 million, including in
light of the three-year plan for 2015-2017.
Net financial charges came to Euro 1 million, down from Euro 29 million the previous year. The balance was affected by a capital gain of Euro 19 million on the sale of the group's 2% interest in Bruno Cucinelli S.p.A. Net foreign currency hedging losses and exchange differences primarily reflect the translation of financial liabilities in currencies other than the Euro and exchange differences arising on the redemption of capital by a US subsidiary. The group's share of net income in 2014 was a loss of Euro 91 million, compared with a loss of Euro 199 million in 2013.
Operating cash flow and investments Cash flow from operating activities was penalized in 2014 by the change in working capital (Euro 33 million). Gross investments in 2014 amounted to Euro 57 million.
Net financial indebtedness At the end of 2014 the Benetton group had net financial indebtedness of Euro 137 million, down from Euro 286 million at December 31, 2013, a decrease of Euro 149 million due especially to the exceptional cash flow from the sale of a building in Paris and the improved net balance of differentials relating to hedges of future purchases and sales in foreign currency.

18 DIRECTORS’ REPORT
FOOD & BEVERAGE
Autogrill S.p.A. (controlling interest at 12.31.2014: 50.10%) Key figures for the Autogrill group in 2014 and 2013 are shown below. As a result of the demerger of Autogrill S.p.A. to World Duty Free S.p.A. with effect from October 1, 2013, the net result of the Travel retail & duty-free business for the first nine months of the year is shown on a single line of the consolidated income statement (Profit/(loss) from discontinued operations); therefore, the 2013 Profit from continuing operations also refers to the Food & beverage segment only. (Millions of Euro) 2014 % 2013 %
Revenues 3,930 100 3,985 100
Fuel sales 531 13.5 561 14.1
Other operating income 109 2.8 128 3.2
Total revenues and income 4,570 116.3 4,674 117.3
Cost of raw materials and goods (1,814) (46.1) (1,874) (47.0)
Rents, concessions and royalties (669) (17.0) (677) (17.0)
Payroll costs (1,296) (33.0) (1,318) (33.1)
Other operating costs (475) (12.1) (490) (12.3)
Ebitda 316 8.0 314 7.9
Depreciation and amortization (187) (4.8) (210) (5.3)
Impairment losses on property, plant and equipment and intangible assets (10) (0.3) (16) (0.4)
Ebit 118 3.0 88 2.2
Net financial expenses and impairment losses on financial assets (41) (1.1) (53) (1.3)
Income before taxes and non-controlling interests 77 2.0 35 0.9
Income taxes (40) (1.0) (27) (0.7)
Profit/(loss) from continuing operations 37 0.9 8 0.2
Profit/(loss) from discontinued operations (demerger) - - 91 2.3
Non-controlling interests 12 0.3 12 0.3
Net income, group 25 0.6 88 2.2
12.31.2014 12.31.2013
Cash flow from operating activities 224 148
Investments, net 196 163
Capital employed 1,184 1,118
Shareholders’ equity 491 445
Net financial indebtedness 693 673
Net financial indebtedness/Ebitda 2.19 2.14

DIRECTORS’ REPORT 19
Revenues The Autogrill group earned revenues of Euro 3,930 million for the year. The decrease of 1.4% with respect to the previous year (-0.9% at constant exchange rates) concerns the US retail business, which was sold in September 2013. Adjusting for that effect, sales increased by 1.1% for the year (+1.6% at constant exchange rates). Sales by channel were as follows: (Millions of Euro) 2014 % 2013 % Change
Airports 1,967 50.0 1,891 47.4 76
Motorways 1,622 41.3 1,630 40.9 (8)
Retail US - - 99 2.5 (99)
Other 341 8.7 365 9.2 (24)
Total 3,930 100 3,985 100 (55) The positive trend in passenger traffic sustained performance in the airport channel, where revenues were up by 4% (+4.8% at constant exchange rates) thanks to a strong showing in North America, with a greater number of transactions and a higher average purchase per customer. Also contributing to this channel's performance were Schiphol airport in the Netherlands, the new operations in the UK, and the group's debut at Helsinki airport. Revenues in the motorway channel were unchanged: -0.5% at current exchange rates or -0.2% at constant exchange rates. Sales are broken down below by geographical area: (Millions of Euro) 2014 % 2013 % Change
Italy 1,092 27.8 1,154 29.0 (62)
Rest of Europe 712 18.1 681 17.1 31
North America and Pacific 2,126 54.1 2,149 53.9 (23)
Total 3,930 100 3,985 100 (55) Revenues in Italy came to Euro 1,092 million, compared with Euro 1,154 million the previous year (-5.4%), due mainly to the partial renewal of expiring motorway concessions and the closure of various unprofitable locations on high streets and at shopping centers and trade fairs. In the rest of Europe, revenues increased by 4.3% (+4.6% at current exchange rates) from Euro 681 million to Euro 712 million, thanks to strong performances in Belgium, Spain and France.

20 DIRECTORS’ REPORT
Operating margins At Euro 316 million, Ebitda increased by 0.7% (+1.2% at constant exchange rates) and amounted to 8% of revenues (substantially unchanged since the previous year). Excluding the impact: ! on both 2014 and 2013 of some non-recurring items (including reorganization costs of Euro 11.8 million in
2014); and ! on 2013 of the change in the scope of consolidation due to the sale of the US retail business,
Ebitda would have risen by 5.4% (+5.9% at constant exchange rates), thanks in part to the improved profitability of the areas managed by HMSHost. Ebit came to Euro 119 million, up from Euro 88 million the previous year, due to a decrease in amortization and depreciation (reflecting lower investments in 2013) and impairment losses. The group's share of net income was a positive Euro 25 million in 2014, compared with Euro 88 million the previous year, which included the contribution of the Travel retail business until the demerger of World Duty Free.
Investments Net investments in 2014, mostly geared toward the airport channel, came to Euro 196 million (Euro 163 million in 2013) and concerned the airports of Fort Lauderdale, Washington Dulles, Las Vegas, Toronto, Amsterdam, Helsinki, Bali, and Rome Fiumicino, as well as rest areas on the Pennsylvania Turnpike in the motorway channel.
Net financial indebtedness Net financial indebtedness increased from Euro 673 million at December 31, 2013 to Euro 693 million, due primarily to translation differences on debt denominated in US dollars.
Performance of Autogrill shares in 2014 The performance of Autogrill shares in 2014 was as follows, for a gain of 2%:

DIRECTORS’ REPORT 21
INFRASTRUCTURES & SERVICES FOR MOBILITY
Sintonia S.p.A. (controlling interest at 12.31.2014: 66.40%) Equity investments in the business of infrastructure & services for mobility are held by the subsidiary Sintonia S.p.A. At December 31, 2014 Sintonia held 45.56% of Atlantia S.p.A., which in turn owns 100% of Autostrade per l’Italia S.p.A. - parent of toll road concession holders operating about 3,000 km of motorway in Italy and another 2,000 km abroad - and 95.90% of Aeroporti di Roma S.p.A. This latter operates the largest Italian airport (seventh largest in Europe) for number of passengers; its plan for Fiumicino airport is currently Europe's most important infrastructure development project in terms of capacity. The results of Sintonia S.p.A. in 2014 and 2013 are summarized below: (Millions of Euro) 2014 2013
Dividends and other income from equity investments 280.7 257.7
Other revenues and income - 0.1
Gains/(losses) from disposal of financial instruments 4.3 -
Operating expenses (1.6) (2.1)
Depreciation, amortization and impairments (0.8) (0.7)
Net financial charges (27.9) (34.6)
Impairment of financial assets (0.1) (0.2)
Non-recurring income/(charges) (1.2) -
Income taxes - 0.1
Net income 253.4 220.4
12.31.2014 12.31.2013
Shareholders’ equity 3,727 3,524
Net financial indebtedness 142 358 Dividends refer to Atlantia and consist of Euro 147.1 million as the balance due on the 2013 dividend approved by Atlantia shareholders in April 2014, and Euro 133.6 million as the advance on the dividend for 2014, approved by Atlantia's board of directors in October. Net financial indebtedness at the end of the year stood at Euro 142 million, down from Euro 358 million at the end of 2013.

22 DIRECTORS’ REPORT
Atlantia S.p.A. (total interest held by Sintonia S.p.A. at 12.31.2014: 45.56%) The consolidated figures for the Atlantia group are not directly comparable with the previous year's due to the following changes in the scope of consolidation: ! the Aeroporti di Roma group (formerly the Gemina group) has been consolidated since December 1, 2013;
it therefore contributed to the Atlantia group's results for one month in 2013 and 12 months in 2014; ! the investment in TowerCo was sold in May 2014, contributing to Atlantia's results for the first quarter of that
year only.
Consolidated economic and financial highlights in 2014 and 2013 are as follows:
(Millions of Euro) 2014 (**) % 2013 (*)(**) %
Toll revenues 3,678 72.4 3,540 83.9
Aviation revenues 520 10.2 34 0.8
Other revenues 885 17.4 647 15.3
Total revenues 5,083 100 4,221 100
Ebitda 3,169 62.3 2,585 61.2
Ebit 1,933 38.0 1,821 43.1
Net financial charges (671) (13.2) (697) (16.5)
Income taxes (553) (10.9) (415) (9.8)
Profit/(loss) from continuing operations 709 13.9 709 16.8
Profit from discontinued operations 64 1.3 12 0.3
Non-controlling interests (33) (0.6) (84) (2.0)
Net income, group 740 14.6 637 15.1
12.31.2014 12.31.2013
Operating cash flow (FFO) 2,079 1,663
Investments 1,100 1,247
Capital employed 18,791 18,979
Shareholders’ equity 8,263 8,210
Net financial indebtedness 10,528 10,769
Net financial indebtedness/Ebitda 3.32 4.17 (*) Figures for 2013 have been restated to reflect the completed accounting of the Gemina S.p.A. absorption. (**) In accordance with IFRS 5, amounts pertaining to TowerCo and Écomouv' (and its subsidiaries) are shown under Profit from discontinued operations, due to their completed or imminent disposal.
Revenues Atlantia group revenues in 2014 came to Euro 5,083 million, an increase of 20% for the year. On a like-for-like basis and at constant exchange rates, total revenues increased by Euro 218 million (+5%). Toll revenues amounted to Euro 3,678 million and increased by Euro 138 million (+4%) with respect to 2013. Excluding unfavourable exchange differences (Euro 50 million), toll revenues rose by Euro 188 million, due primarily to: ! toll increases for Italian motorway concessions (+4.43% for Autostrade per l’Italia) effective as of January 1,
2014, which boosted toll revenues by Euro 115 million; ! an increase in traffic on the Italian network (+1%), which had a positive impact of some Euro 28 million; ! higher toll revenues for overseas operators (+ Euro 43 million), explained by an increase in both traffic and
tolls in 2014.
DIRECTORS’ REPORT 23
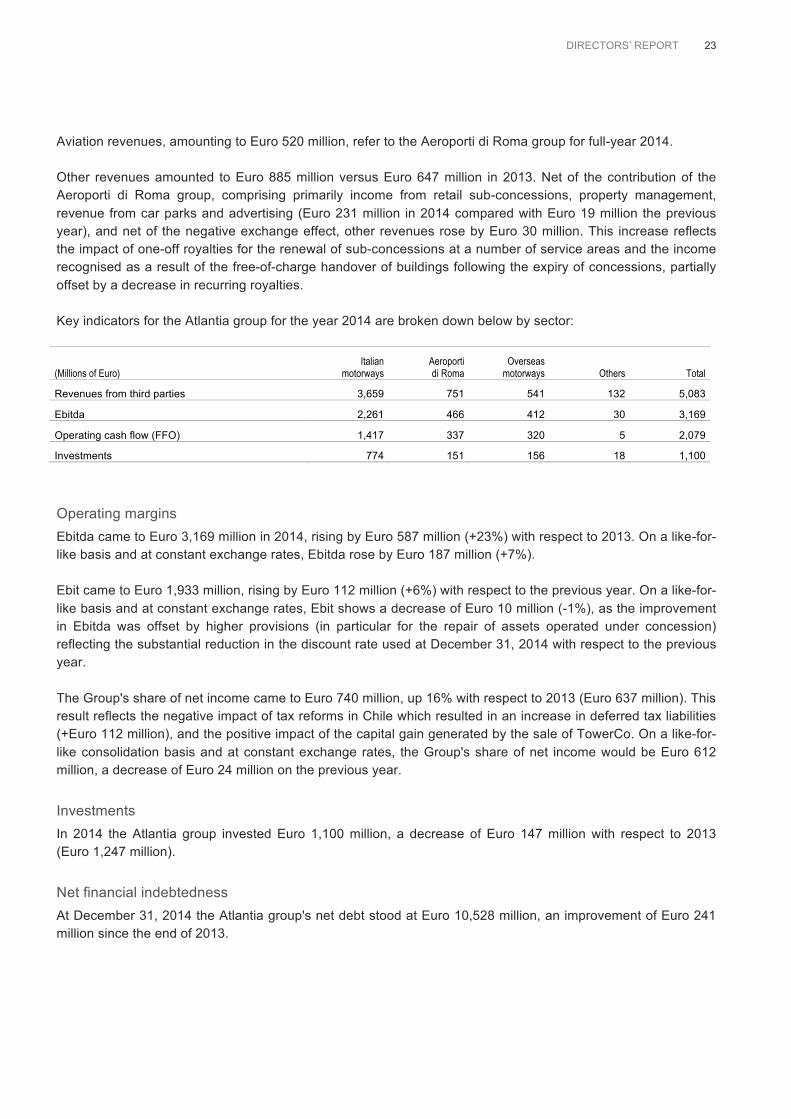
Aviation revenues, amounting to Euro 520 million, refer to the Aeroporti di Roma group for full-year 2014. Other revenues amounted to Euro 885 million versus Euro 647 million in 2013. Net of the contribution of the Aeroporti di Roma group, comprising primarily income from retail sub-concessions, property management, revenue from car parks and advertising (Euro 231 million in 2014 compared with Euro 19 million the previous year), and net of the negative exchange effect, other revenues rose by Euro 30 million. This increase reflects the impact of one-off royalties for the renewal of sub-concessions at a number of service areas and the income recognised as a result of the free-of-charge handover of buildings following the expiry of concessions, partially offset by a decrease in recurring royalties. Key indicators for the Atlantia group for the year 2014 are broken down below by sector:
(Millions of Euro) Italian
motorways Aeroporti di Roma
Overseas motorways Others Total
Revenues from third parties 3,659 751 541 132 5,083
Ebitda 2,261 466 412 30 3,169
Operating cash flow (FFO) 1,417 337 320 5 2,079
Investments 774 151 156 18 1,100
Operating margins Ebitda came to Euro 3,169 million in 2014, rising by Euro 587 million (+23%) with respect to 2013. On a like-for-like basis and at constant exchange rates, Ebitda rose by Euro 187 million (+7%). Ebit came to Euro 1,933 million, rising by Euro 112 million (+6%) with respect to the previous year. On a like-for-like basis and at constant exchange rates, Ebit shows a decrease of Euro 10 million (-1%), as the improvement in Ebitda was offset by higher provisions (in particular for the repair of assets operated under concession) reflecting the substantial reduction in the discount rate used at December 31, 2014 with respect to the previous year. The Group's share of net income came to Euro 740 million, up 16% with respect to 2013 (Euro 637 million). This result reflects the negative impact of tax reforms in Chile which resulted in an increase in deferred tax liabilities (+Euro 112 million), and the positive impact of the capital gain generated by the sale of TowerCo. On a like-for-like consolidation basis and at constant exchange rates, the Group's share of net income would be Euro 612 million, a decrease of Euro 24 million on the previous year.
Investments In 2014 the Atlantia group invested Euro 1,100 million, a decrease of Euro 147 million with respect to 2013 (Euro 1,247 million).
Net financial indebtedness At December 31, 2014 the Atlantia group's net debt stood at Euro 10,528 million, an improvement of Euro 241 million since the end of 2013.

24 DIRECTORS’ REPORT
Performance of Atlantia shares in 2014 The performance of Atlantia shares in 2014 is represented below, for a gain of 18%:

DIRECTORS’ REPORT 25
THE PARENT COMPANY
Edizione S.r.l. Below are the economic and financial highlights of 2014 and 2013: (Millions of Euro) 2014 2013
Dividends and other income from equity investments 131.5 89.3
Other revenues and income 9.9 10.0
Capital gains on disposal of equity investments, net of capital losses - 88.1
Operating expenses (15.9) (15.3)
Depreciation and amortization (4.7) (9.4)
Net financial charges (9.3) (41.7)
Impairment of non-current financial assets, net of reversal 455.9 0.3
Other non-recurring income/(charges), net - (0.1)
Income taxes (0.3) (0.1)
Net income 567.1 121.1
12.31.2014 12.31.2013
Non-current financial asset 2,885 2,437
Property, plant and equipment and other assets, net 175 161
Capital employed 3,060 2,598
Shareholders’ equity 3,088 2,564
Net financial indebtedness (28) 34
Sources of funding 3,060 2,598 Dividends and other income from equity investments increased by Euro 42.2 million with respect to the previous year's Euro 89.3 million. This is explained almost entirely by dividends from the subsidiary Schematrentaquattro S.p.A. Other revenues and income amount to Euro 9.9 million, including Euro 8.5 million from property rentals. The remaining amount refers mostly to services rendered to Group companies. Operating expenses showed a slight increase, from Euro 15.3 million in 2013 to Euro 15.9 million. Net financial charges, at Euro 9.3 million (Euro 41.7 million in 2013) include non-recurring charges of Euro 8.8 million for the early termination of some interest rate hedging agreements due to reimbursement of the corresponding debt. Impairment of non-current financial assets, net of reversal pertains to: ! an impairment reversal of Euro 400 million for Schematrentaquattro S.p.A., due to the restoration of the
carrying amounts of its subsidiaries Autogrill S.p.A. and World Duty Free S.p.A.; ! impairment reversals of Euro 21.9 million and Euro 34 million, respectively, for Assicurazioni Generali S.p.A.
shares and Mediobanca shares which were written up to official stock market prices as of December 2014.

26 DIRECTORS’ REPORT
Non-current financial assets at the end of 2014 amounted to Euro 2,885 million, an increase of Euro 448 million due to the reversal of impairment losses on various equity investments. During 2014, the interest in RCS MediaGroup S.p.A. was sold for Euro 7.3 million. The year closed with a net cash position of Euro 28 million, an improvement of Euro 62 million since the end of 2013, when there was a net debt of Euro 34 million.

DIRECTORS’ REPORT 27
OTHER INFORMATION At the reporting date, the Parent Company did not hold own quotas and its subsidiaries did not own shares or quotas of the Parent or their respective controlling companies, either directly or through trust companies or intermediaries, nor had the Parent Company or its subsidiaries ever purchased or sold any such shares or quotas.
SIGNIFICANT EVENTS FOLLOWING THE END OF THE FINANCIAL YEAR
TEXTILES & CLOTHING ! The partial demerger of Schematrentanove S.p.A. (formerly Benetton Group S.p.A.) to two beneficiary
companies directly controlled by the sole shareholder Edizione S.r.l. came into effect on January 1, 2015. Under this transaction: ! the 100% interest in Benetton Group S.r.l., focused on the core business (brands, merchandise,
marketing, sales and retail), was assigned to Schematrentasette S.r.l.; ! the 100% interest in Olimpias Group S.r.l., in charge of manufacturing activities with industrial
platforms in the Mediterranean region (weaving, knitting, spinning, dyeing and sewing), was assigned to Schematrentotto S.r.l.
! As a result of the demerger, Schematrentanove S.p.A. now has equity investments in the real estate sector only.
TRAVEL FOOD & BEVERAGE ! On February 28, 2015 Autogrill S.p.A. transferred to the World Duty Free group the travel retail activities
operated by HMSHost at the Atlanta and Oakland airports and at the Empire State Building. The transfer completes HMSHost Corp.'s sale of its travel retail operations at US airports to the World Duty Free group, as announced to the market on September 6, 2013. The price agreed for the remaining operations was Usd 19 million.
! On March 12, 2015 Autogrill S.p.A. contracted a new loan of Euro 600 million. This is comprised of an amortizing term loan of Euro 200 million and a revolving credit facility of Euro 400 million, both maturing in March 2020. It will be used for the early reimbursement of the revolving credit facilities maturing in July 2016 and to finance the group's operations.
! On April 1, 2015 the Autogrill group, through HMSHost International, entered the Chinese market by signing two agreements for the opening of 10 outlets at international Beijing and Sanya airports by the end of 2015. The Beijing outlets will be operated as a joint venture with Huazhuo1, a leading local provider of food & beverage services at airports. The six locations will generate estimated revenues of Euro 44 million over the six years of the contract. At Sanya, one of China's top tourist destinations, the group has entered a partnership with Cosmos2 - a Chinese operator with lengthy experience in food & beverage and retail - for the opening of four locations: two to be managed directly by Autogrill and two sub-concessions. From these airport operations the company expects to gross Euro 6 million from 2015 to 2020.
! On April 21, 2015 the Autogrill group, through HMSHost, announced a stronger airport presence in North America by way of four new contracts for the operation of forty outlets at Houston and Montreal airports. Together, these should generate revenues of around Usd 790 million over the lives of the contracts.

28 DIRECTORS’ REPORT
INFRASTRUCTURE & SERVICES FOR MOBILITY ! On January 30, 2015, Atlantia completed a voluntary cash tender offer for all the asset-backed securities
named "Gbp 215,000,000 5.441% Class A4 Notes due 2023" (Euro 346.9 million at the exchange rate on the purchase date) issued by Romulus Finance S.r.l. Atlantia has accepted all the securities for which the offer was validly accepted, totaling Gbp 214,725,000, or 99.87% of the securities in issue.
! On February 13, 2015 Atlantia S.p.A. announced a tender offer with the aim of partially repurchasing some notes issued by Atlantia and guaranteed by Autostrade per l’Italia, to be settled in cash for a predetermined maximum amount. The total outlay for this transaction was Euro 1,102,245,344.
! On February 19, 2015, Autostrade per l’Italia’s Board of Directors voted to authorize the issue, by December 31, 2015, of one or more new non-convertible bonds with a total value of up to Euro 1.5 billion. The bonds are to be listed on one or more regulated markets and offered for sale to retail investors in Italy.
! On February 25, 2015 Autostrade per l’Italia, which then owned 24.98% of Società Autostrada Tirrenica p.A. (SAT), signed agreements with SAT's shareholders to acquire a further 74.95% stake in the company, thus raising its total interest to 99.93%. The cost of the transaction is approximately Euro 84 million.
! On March 10, 2015, Atlantia S.p.A. announced that it had sold 9,741,513 treasury shares (representing 1.18% of the share capital) for Euro 227.9 million. The sale took place through an accelerated book building procedure reserved to institutional investors and closed at a selling price of Euro 23.40 per share.
HOLDING COMPANIES
The Parent Company ! On February 20, 2015 Edizione sold its 2.2% interest and convertible OCEANE bonds of Club
Méditerranée, participating in the takeover bid launched on January 22, 2015 by Gaillon Invest II. The proceeds came to Euro 20.2 million, for a capital gain of Euro 12.3 million with respect to the carrying amount.
! On March 28, 2015, following a competitive bidding procedure, Edizione and its subsidiary Schematrentaquattro S.p.A. signed binding agreements with Dufry A.G. for Dufry's purchase of Schematrentaquattro's entire 50.1% interest in World Duty Free S.p.A. The selling price of Euro 10.25 per World Duty Free share will bring in Euro 1.3 billion for Schematrentaquattro. The sale of the 50.1% interest in World Duty Free is subject to permission from the antitrust authorities and approval of a capital increase to partially finance the acquisition (as already approved by Dufry's shareholders on April 29, 2015). The sale is expected to close by the end of the third quarter of 2015.
! On April 10, 2015 Edizione signed a binding agreement with China National Tire & Rubber Co. (CNRC) for the sale of Edizione's 1.574% interest in Pirelli and Schematrentaquattro's 3.034% interest in Pirelli, currently held to service a bond loan convertible into Pirelli shares. The agreed price is Euro 15 per share ex-dividend 2014, the same price at which CNRC will launch a mandatory tender offer on the ordinary shares of Pirelli & C. S.p.A. after completing its acquisition of the Pirelli shares held by Camfin. The sale of the Pirelli shares is conditional on whether Camfin has actually sold its Pirelli shares to CNRC. Edizione may decide to postpone the sale to CNRC of its direct interest in Pirelli and to participate in the tender offer instead. It also has the right to cancel the agreement in the event of one or more competing tender offers on ordinary Pirelli shares, unless CNRC announces an increase in its tender price to match or exceed the latest competing offer.

DIRECTORS’ REPORT 29
Schematrentaquattro S.p.A. ! As of May 25, 2015 Schematrentaquattro S.p.A. has received requests to convert bonds into ordinary Pirelli
shares. Therefore, its overall interest in Pirelli has gone from 3.034% to 1.819% and the nominal value of the convertible bond loan has decreased from Euro 200 million to Euro 119.9 million.
Sintonia S.p.A. ! On March 25, 2015 and April 8, 2015, respectively, the Board of Directors and the Annual General Meeting
of Sintonia approved the partial, non-proportional demerger plan for Sintonia, upon whose outcome Edizione will own 100% of Sintonia which will in turn own 30.25% of Atlantia S.p.A. The demerger should take effect by June 21, 2015, when the shareholders' agreement is due to expire.
OUTLOOK FOR 2015
TEXTILES & CLOTHING The economies in the countries of greatest importance to Benetton Group S.r.l. show no signs of particular improvement. It is likely, therefore, that revenues will decline somewhat in 2015. The company's reorganization will be completed during the year, including the filling of new professional positions with up-to-date skill sets, to better meet the challenges of an ever more complex and competitive market. Regarding Olimpias Group S.r.l., in 2015 the integration plan will be implemented along with various reorganization projects at the foreign investee companies, in order to optimize available resources and work on supply chain planning and management. These organizational and logistical efforts will continue in 2016 and 2017, with the goal of transforming Olimpias from a business based primarily on the production of yarns and woven fabrics into a strongly integrated company that can also manufacture clothing of any category and type.
FOOD & BEVERAGE In the first 18 weeks of 2015 the Autogrill group enjoyed sales growth of 0.3% at constant exchange rates (+11.3% at current exchange rates) with respect to the same period last year. It expects to gross Euro 4,300-4,400 million for the year, compared with Euro 3,930 million in 2014. The different exchange rate accounts for about Euro 335 million in higher sales. Ebitda is projected at Euro 370-380 million and approximately 8.6% of revenues. In 2014 the Autogrill group earned Ebitda of Euro 316.2 million (8% of sales). The different exchange rate accounts for roughly Euro 37 million in higher Ebitda. Investments for the Autogrill group are expected to reach Euro 240 million, up from Euro 196.4 million in 2014, with the different exchange rate accounting for around Euro 14 million in higher investments.
INFRASTRUCTURE & SERVICES FOR MOBILITY Despite the continuing weakness of the European economy, traffic trends on the group’s Italian motorway network in recent months have shown positive signs of stabilizing, while the motorways operated by its overseas subsidiaries have enjoyed overall traffic growth, with the exception of Brazil as a result of the local economy. The contributions of the group’s overseas motorway operators are subject to exchange rate fluctuations. On the basis of operating forecasts by airlines, passenger traffic for Aeroporti di Roma is expected to be on the rise. The above trends in the countries and businesses of interest to the Atlantia group suggest an overall improvement in consolidated operating results.

30 DIRECTORS’ REPORT
HOLDING COMPANIES
Edizione S.r.l. On the basis of resolutions taken by Edizione's subsidiaries and associates, dividends are expected to increase in 2015, while operating costs are likely to remain stable. The year will also benefit from the capital gains produced by the sale of Club Med shares and bonds and Pirelli & C. shares.
Schematrentaquattro S.p.A. The sale to Dufry A.G. of the company's 50.1% stake in World Duty Free S.p.A. will bring in approximately Euro 1.3 billion, for a capital gain of around Euro 420 million.

CONSOLIDATED FINANCIAL STATEMENTS AT DECEMBER 31, 2014 31
CONSOLIDATED FINANCIAL STATEMENTS
AT DECEMBER 31, 2014

32 CONSOLIDATED FINANCIAL STATEMENTS AT DECEMBER 31, 2014
CONSOLIDATED FINANCIAL STATEMENTS
CONSOLIDATED STATEMENT OF FINANCIAL POSITION ASSETS (Thousands of Euro) 12.31.2014 12.31.2013 Note
Non-current assets
Property, plant and equipment 1
Land and buildings 786,651 948,717
Investment property 114,462 59,245
Plant, machinery and equipment 381,180 501,276
Furniture, furnishings and electronic equipment 81,897 92,864
Assets to be relinquished 83,057 92,641
Leasehold improvements 358,309 339,173
Other tangible assets 47,052 51,439
Assets under construction and advances 160,470 158,213
Total property, plant and equipment 2,013,078 2,243,568
Intangible assets 2
Goodwill and other intangible assets of indefinite useful life 6,188,058 6,758,259
Intangible assets deriving from concession rights 20,311,687 20,217,858
Intangible assets of finite useful life 597,379 1,182,808
Total intangible assets 27,097,124 28,158,925
Other non-current assets
Equity investments in subsidiaries 390 591 3
Equity investments in associates and joint ventures 138,043 146,197 4
Equity investments in other companies 722,742 712,921 5
Investment securities 25,355 25,523 6
Other non-current financial assets 1,760,472 2,358,223 7
Other non-current receivables 101,949 375,907 8
Deferred tax assets 2,036,626 2,064,449 9
Total other non-current assets 4,785,577 5,683,811
Total non-current assets 33,895,779 36,086,304
Current assets
Inventories 610,878 744,393 10
Trade receivables 1,680,068 1,709,013 11
Tax receivables 77,899 142,115 12
Other current receivables 524,224 465,479 13
Other current financial assets 1,036,532 851,806 14
Other investments 18,275 57,795 15
Cash and cash equivalents 2,273,326 5,186,456 16
Total current assets 6,221,202 9,157,057
Assets held for sale 2,570,330 18,677 17
TOTAL ASSETS 42,687,311 45,262,038

CONSOLIDATED FINANCIAL STATEMENTS AT DECEMBER 31, 2014 33
SHAREHOLDERS’ EQUITY AND LIABILITIES (Thousands of Euro) 12.31.2014 12.31.2013 Note Shareholders’ equity Shareholders’ equity attributable to the Parent Company Share capital 1,500,000 1,500,000 18 Fair value and hedging reserve 221,564 194,522 19 Other reserves and retained earnings 3,242,732 3,303,998 20 Translation reserve (60,507) (231,558) 21 Net income for the year 136,059 138,684 Total 5,039,848 4,905,646 Equity attributable to non-controlling interests 7,044,578 6,887,329 22 Total shareholders’ equity 12,084,426 11,792,975 Liabilities Non-current liabilities Bonds 10,938,735 10,747,228 23 Medium and long-term loans 3,470,668 5,532,590 24 Other non-current liabilities 125,722 152,558 25 Lease financing 15,109 22,472 26 Other non-current financial liabilities 527,527 522,784 27 Provisions for employee benefits 339,172 320,295 28 Deferred tax liabilities 2,015,119 2,029,874 29 Other non-current provisions and liabilities 1,330,232 1,185,793 30 Provisions for construction services required by contract 3,783,956 3,728,446 31 Total non-current liabilities 22,546,240 24,242,040 Current liabilities Trade payables 2,152,326 2,394,991 32 Other payables, accrued expenses and deferred income 972,610 969,673 33 Current income tax liabilities 72,883 77,410 34 Other current provisions and liabilities 627,424 485,721 30 Current portion of provisions for construction services required by contract 499,119 433,590 31 Current portion of bonds 162,887 2,483,266 23 Current portion of medium and long-term loans 637,947 1,566,790 24 Current portion of lease financing 3,517 3,788 26 Other current financial liabilities 387,044 630,538 35 Bank loans and overdraft 586,611 181,256 36 Total current liabilities 6,102,368 9,227,023 Liabilities held for sale 1,954,276 - 17 Total liabilities 30,602,884 33,469,063 TOTAL SHAREHOLDERS’ EQUITY AND LIABILITIES 42,687,310 45,262,038
34 CONSOLIDATED FINANCIAL STATEMENTS AT DECEMBER 31, 2014
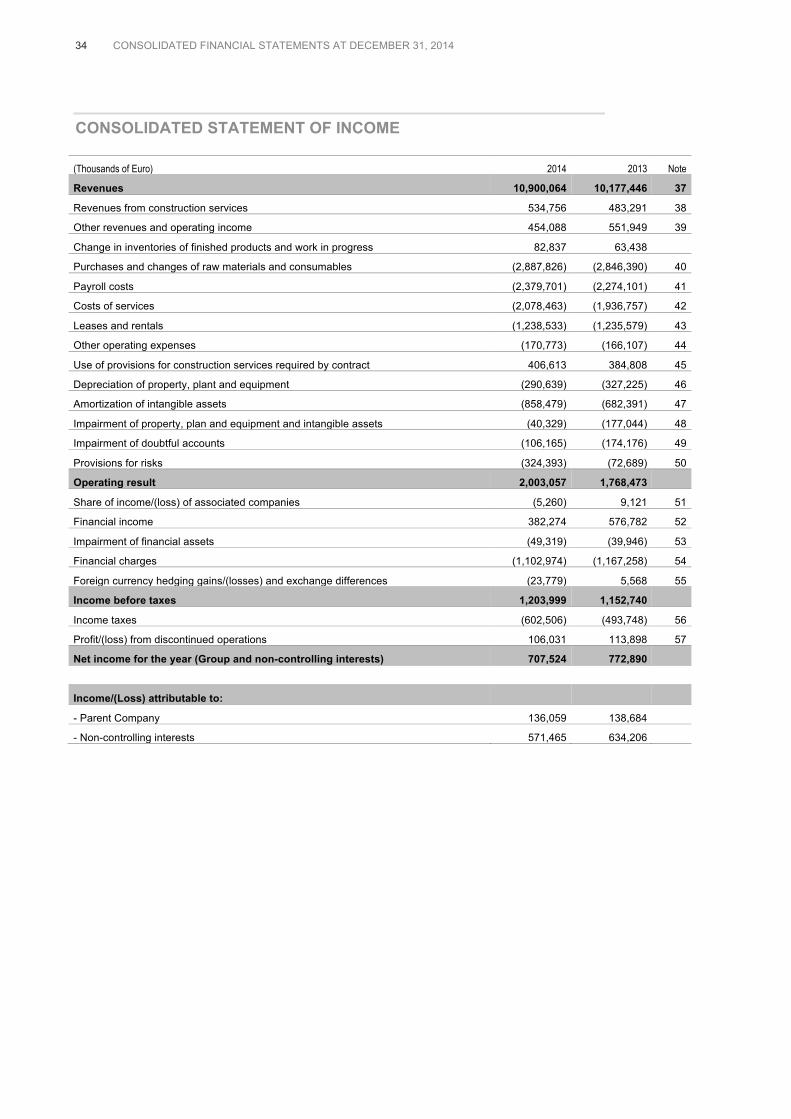
CONSOLIDATED STATEMENT OF INCOME (Thousands of Euro) 2014 2013 Note
Revenues 10,900,064 10,177,446 37
Revenues from construction services 534,756 483,291 38
Other revenues and operating income 454,088 551,949 39
Change in inventories of finished products and work in progress 82,837 63,438
Purchases and changes of raw materials and consumables (2,887,826) (2,846,390) 40
Payroll costs (2,379,701) (2,274,101) 41
Costs of services (2,078,463) (1,936,757) 42
Leases and rentals (1,238,533) (1,235,579) 43
Other operating expenses (170,773) (166,107) 44
Use of provisions for construction services required by contract 406,613 384,808 45
Depreciation of property, plant and equipment (290,639) (327,225) 46
Amortization of intangible assets (858,479) (682,391) 47
Impairment of property, plan and equipment and intangible assets (40,329) (177,044) 48
Impairment of doubtful accounts (106,165) (174,176) 49
Provisions for risks (324,393) (72,689) 50
Operating result 2,003,057 1,768,473
Share of income/(loss) of associated companies (5,260) 9,121 51
Financial income 382,274 576,782 52
Impairment of financial assets (49,319) (39,946) 53
Financial charges (1,102,974) (1,167,258) 54
Foreign currency hedging gains/(losses) and exchange differences (23,779) 5,568 55
Income before taxes 1,203,999 1,152,740
Income taxes (602,506) (493,748) 56
Profit/(loss) from discontinued operations 106,031 113,898 57
Net income for the year (Group and non-controlling interests) 707,524 772,890
Income/(Loss) attributable to:
- Parent Company 136,059 138,684
- Non-controlling interests 571,465 634,206
CONSOLIDATED FINANCIAL STATEMENTS AT DECEMBER 31, 2014 35
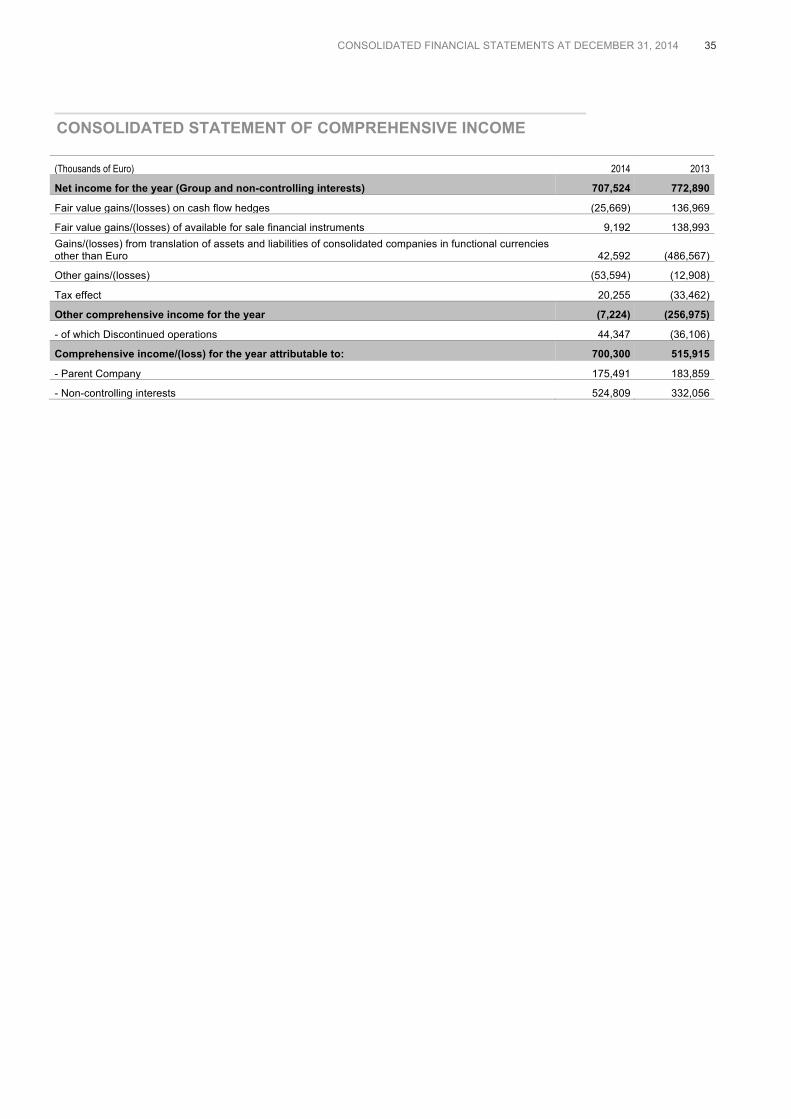
CONSOLIDATED STATEMENT OF COMPREHENSIVE INCOME (Thousands of Euro) 2014 2013
Net income for the year (Group and non-controlling interests) 707,524 772,890
Fair value gains/(losses) on cash flow hedges (25,669) 136,969
Fair value gains/(losses) of available for sale financial instruments 9,192 138,993 Gains/(losses) from translation of assets and liabilities of consolidated companies in functional currencies other than Euro 42,592 (486,567)
Other gains/(losses) (53,594) (12,908)
Tax effect 20,255 (33,462)
Other comprehensive income for the year (7,224) (256,975)
- of which Discontinued operations 44,347 (36,106)
Comprehensive income/(loss) for the year attributable to: 700,300 515,915
- Parent Company 175,491 183,859
- Non-controlling interests 524,809 332,056

36 CONSOLIDATED FINANCIAL STATEMENTS AT DECEMBER 31, 2014
CONSOLIDATED STATEMENT OF CHANGES IN EQUITY
CONSO
LIDAT
ED STA
TEMEN
T OF CH
ANGES IN
EQUITY
(Tho
usan
ds o
f Eur
o)Sh
are
cap
ital
Fair
value
and
he
dging
rese
rve
Othe
r res
erve
s an
d re
taine
d ea
rning
sTr
ansla
tion
rese
rve
Net in
com
e/(lo
ss) f
or
the y
ear
Equit
y att
ributa
ble to
the
Pare
nt Co
mpa
nyEq
uity
attrib
utable
to n
on-
contr
olling
inter
ests
Total
Bala
nce
at 1
2.31
.201
21,
500,
000
(1,3
66)
2,70
4,88
8(8
6,78
9)26
2,74
64,
379,
479
4,94
4,96
09,
324,
439
Carr
y fo
rwar
d of
201
2 in
com
e26
2,74
6(2
62,7
46)
- -
Divi
dend
s di
strib
uted
(42,
800)
(42,
800)
(329
,851
)(3
72,6
51)
Capi
tal in
crea
ses/
(rei
mbu
rsem
ents
)-
14,6
94
14,6
94
Tran
sact
ions
with
non
-con
trollin
g in
tere
sts
264,
348
264,
348
180,
228
444,
576
Chan
ge in
sco
pe o
f con
solid
atio
n11
7,12
311
7,12
3 1,
738,
500
1,85
5,62
3 O
ther
mov
emen
ts3,
637
3,63
7 6,
742
10,3
79
Com
preh
ensi
ve in
com
e fo
r the
yea
r19
5,88
8(5
,944
)(1
44,7
69)
138,
684
183,
859
332,
056
515,
915
Bala
nce
at 1
2.31
.201
31,
500,
000
194,
522
3,30
3,99
8(2
31,5
58)
138,
684
4,90
5,64
66,
887,
329
11,7
92,9
75Ca
rry
forw
ard
of 2
013
inco
me
138,
684
(138
,684
)-
Divi
dend
s di
strib
uted
(42,
800)
(42,
800)
(380
,654
)(4
23,4
54)
Capi
tal in
crea
ses/
(rei
mbu
rsem
ents
)-
5,87
5 5,
875
Tran
sact
ions
with
non
-con
trollin
g in
tere
sts
329
329
2,76
7 3,
096
Chan
ge in
sco
pe o
f con
solid
atio
n33
33
1,14
1 1,
174
Oth
er m
ovem
ents
1,15
11,
151
3,31
1 4,
462
Com
preh
ensi
ve in
com
e fo
r the
yea
r27
,042
(19,
979)
32,3
6813
6,05
917
5,49
1 52
4,80
9 70
0,30
0
Bala
nce
at 1
2.31
.201
41,
500,
000
221,
564
3,38
1,41
6(1
99,1
90)
136,
059
5,03
9,84
97,
044,
578
12,0
84,4
27
Note
s18
1920
2122

CONSOLIDATED FINANCIAL STATEMENTS AT DECEMBER 31, 2014 37
CONSOLIDATED CASH FLOW STATEMENTS (Thousands of Euro) 2014 2013 Operating activities Net income for the year (Group and non-controlling interests) 707,524 773,780 Income taxes 602,506 521,587 Income before taxes 1,310,030 1,295,367 Adjustments: - depreciation and amortization 1,149,118 1,102,934 - (capital gains)/capital losses/impairment of intangible assets and property, plant and equipment (44,048) (29,712) - net provisions charged to statement of income 421,641 239,813 - share of (income)/losses of associates 5,260 (11,162) - dividends from associated companies 1,011 1,947 - (capital gains)/capital losses/impairment of other equity investments 44,538 (201,451) - net financial (income)/charges 739,658 883,480 Cash flow from operating activities before changes in working capital 3,627,208 3,281,216 Cash flow provided/(used) by changes in working capital (85,435) (108,353) Cash flow provided/(used) by changes in non-current assets and liabilities (59,610) (318,349) Payment of taxes (499,638) (402,097) Payment of employee termination indemnities (23,672) (18,408) Net interest received/(paid) (809,871) (800,826) Cash flow provided/(used) by operating activities 2,148,982 1,633,183 Investing activities Operating investments (1,201,637) (1,240,564) Operating divestments 133,562 342,619 Purchase of equity investments (32,645) (48,816) Purchase of consolidated companies (2,036) (177,995) Cash contributed by newly consolidated companies - 208,147 Disposal of equity investments 94,808 381,078 Operations in non-current financial assets 168 973 Cash flow provided/(used) by investing activities (1,007,780) (534,558) Financing activities Change in shareholders' equity (944) 222,212 New medium and long-term loans 650,434 4,866,655 Repayment of medium and long-term loans (4,644,327) (3,548,716) Net changes in other sources of finance 386,956 (265,912) Dividend payments and distribution of capital reserves (423,454) (372,651) Cash flow provided/(used) by financing activities (4,031,335) 901,588 Increase/(decrease) in cash and cash equivalents (2,890,133) 2,000,213 Cash and cash equivalents at the beginning of the period 5,121,491 3,163,362 Translation differences and other movements 5,823 (42,084) Cash and cash equivalents at the beginning of the period of activities recognized as discontinued opera-tions (10,857) - Cash and cash equivalents at the end of the period 2,226,324 5,121,491 Cash and cash equivalents at the beginning of the period 5,121,491 3,163,362 Cash and cash equivalents 5,186,456 3,222,475 Bank overdrafts (64,965) (59,113) Cash and cash equivalents at the end of the period 2,226,324 5,121,491 Cash and cash equivalents 2,273,326 5,186,456 Bank overdrafts (47,002) (64,965)

38 CONSOLIDATED FINANCIAL STATEMENTS AT DECEMBER 31, 2014
NOTES TO THE CONSOLIDATED FINANCIAL STATEMENTS
GROUP ACTIVITIES Set up in 1981, Edizione S.r.l. at December 31, 2014 held controlling and non-controlling interests in companies in the following business segments: ! Textiles & clothing; ! Food & beverage; ! Travel retail; ! Infrastructures & services for mobility.
These are headed up respectively by Schematrentanove S.p.A. (formerly Benetton Group S.p.A.), Autogrill S.p.A., World Duty Free S.p.A. and by the holding company Sintonia S.p.A., which in turn holds interests in Atlantia S.p.A. Atlantia controls the operating companies Autostrade per l’Italia S.p.A. and Aeroporti di Roma S.p.A. The Group also manages real estate and agricultural operations, other than those directly held by the companies listed above.
FORM AND CONTENT OF THE CONSOLIDATED FINANCIAL STATEMENTS The scope of consolidation includes subsidiaries for which the Group, pursuant to IFRS 10, is exposed to or has rights to variable returns and is able to affect those returns through power over these investees. The scope of consolidation also includes joint arrangements, pursuant to IFRS 11 (joint ventures and joint operations), and associate companies over which the Group has a significant influence in accordance with IAS 28. A list of the companies included in the scope of consolidation is annexed to these notes. More in detail, Edizione Group’s consolidated financial statements include the financial statements at December 31, 2014 of Edizione S.r.l. and all the Italian and foreign companies over which the Parent Company has direct or indirect control or a dominating influence. The financial statements used for the consolidation are those approved or pending approval by the shareholders of the various companies or, in the case of companies which close their fiscal year on a date other than December 31, 2014, the interim statements prepared as of the Group reporting date. HMSHost Corporation (formerly Autogrill Group Inc.) and its subsidiaries, as well as World Duty Free Group North America, LLC and its subsidiaries, close their fiscal year on the Friday closest to December 31 and divide it into 13 four-week periods, which in turn are grouped into three 12-week quarters and a final 16-week quarter. Consequently, the accounts used for the financial statements refer to the period from January 4, 2014 - January 2, 2015, while the previous year’s accounts covered the period from December 29, 2012 - January 3, 2014. The financial statements of subsidiaries have been duly reclassified for consistency with the policies adopted by the Parent Company. Some have also been adjusted for consistency with the accounting principles and the policies adopted by the Group. The results of subsidiaries acquired or sold during the year are included in the consolidated statement of income as from the effective date of acquisition or until the effective date of disposal, with slight timing adjustments where these dates do not coincide with monthly reporting dates.
CONSOLIDATED FINANCIAL STATEMENTS AT DECEMBER 31, 2014 39
Economic results for 2014 are not perfectly comparable with 2013 results, due to the following relevant factors: ! the consolidation of Aeroporti di Roma group by the Atlantia group as of December, 1 2013 (the date the
merger of Atlantia S.p.A. with and into Gemina S.p.A. became effective); Aeroporti di Roma contributed, therefore, to the consolidated results for 12 months in 2014 versus one month in 2013;
! the disposal in May 2014 of 100% of the investment in TowerCo by the Atlantia group. In accordance with IFRS 5 the contribution of TowerCo to the Group’s consolidated results was reclassified for both periods in a single line of the income statement “Profit/(loss) from discontinued operations”.
In accordance with IFRS 5 the following were reclassified in a single line of the income statement “Proft/(loss) from assets held for sale and discontinued operations” for 2013 and 2014 and in a single line of the statement of financial position for 2014 “Assets held for sale”: - the Atlantia group companies involved in the Ecomouv’ project as a result of the early temrination of the contract entered into with the French government; - companies of the World Duty Free group following stipulation of the agreements to dispose of this group. These financial statements have been prepared on a going concern basis, matching costs and revenues to the accounting periods to which they pertain and applying the historical cost principle to all items except those that in accordance with IFRS are measured at fair value, as specified in the individual accounting policies. The reporting currency is the Euro and all amounts have been rounded to thousands of Euro, unless otherwise specified. The consolidated financial statements are comprised of the statement of financial position, statement of income, statement of comprehensive income, statement of changes in shareholders' equity, cash flow statement and these notes. The statement of financial position follows the format whereby assets and liabilities are split into current and non-current, while in the statement of income, costs are grouped by nature. The cash flow statement has been prepared using the indirect method. The 2013 financial statements were restated as a result of both the reclassifications referred to above linked to IFRS 5 application, as well as the following: ! Fair value adjustments recognized upon completion of the measurement of the Aeroporti di Roma group’s
assets and liabilities as discussed in note 62 Business combinations; ! The reclassification of items in the statement of financial position in order to provide a more accurate
representation.

40 CONSOLIDATED FINANCIAL STATEMENTS AT DECEMBER 31, 2014
CONSOLIDATION CRITERIA The consolidation criteria adopted for the preparation of the consolidated financial statements are as follows: a. the financial statements of subsidiaries are consolidated on a line-by-line basis, with elimination of the
carrying value of the shareholdings held by the Parent Company and other consolidated companies against the relative shareholders’ equity;
b. when a company is consolidated for the first time, any positive difference emerging from the elimination of its carrying value on the basis indicated in a. above is allocated, where applicable, to the assets and liabilities of the subsidiary. Any excess of the cost of acquisition over the net assets is recorded as Goodwill and other intangible assets of indefinite useful life. Negative differences are recognized in the statement of income as income, following the fair value review of acquired assets and liabilities. Purchases of non-controlling interests in subsidiaries are recognized as transactions on net equity and, consequently, the difference between the acquisition cost and the relevant net equity portions is directly recognized under net equity;
c. intercompany receivables and payables, costs and revenues, and all significant transactions between consolidated companies, including the intragroup payment of dividends, are eliminated. Unrealized intercompany profits and gains and losses arising from transactions between Group companies are also eliminated;
d. non-controlling interests in shareholders’ equity and in the income or loss of consolidated companies are shown separately under shareholders’ equity and in the consolidated statement of income. Non-controlling interests are determined on the basis of the percentage of ownership of the fair value of assets and liabilities recognized as of the original acquisition date and of changes in net equity after that date;
e. the financial statements of foreign subsidiaries with a functional currency other than the Euro are translated using period-end exchange rates for assets and liabilities, and average exchange rates for the period for income statement items. Differences arising from the translation into Euro of foreign currency financial statements are reported in comprehensive income for the year and accumulated in an equity reserve.
Below are the exchange rates used to translate the financial statements of the main subsidiaries with a functional currency other than the Euro:
Currency
Exchange rate on
12.31.2014
Average exchange rate in
2014
Euro/Usd 1.214 1.329
Euro/Pln 4.273 4.184
Euro/Clp 737.297 759.933
Euro/Ars 10.276 10.772
Euro/Brl 3.221 3.121
Euro/Inr 76.719 84.041
Euro/Czk 27.735 27.536
Euro/Gbp 0.779 0.806
Euro/Jpy 145.230 140.306
Euro/Hkd 9.417 10.303
Euro/Rub 72.337 50.952
Euro/Krw 1,324.800 1,398.140
Euro/Cad 1.406 1.466
Euro/Chf 1.202 1.215

CONSOLIDATED FINANCIAL STATEMENTS AT DECEMBER 31, 2014 41
ACCOUNTING STANDARDS AND POLICIES
International Accounting Standards For preparation of the consolidated financial statements, in accordance with EU Regulation 1606 of July 19, 2002, since January 1, 2005 the Group has used the International Accounting Standards and the International Financial Reporting Standards (IAS/IFRS) published by the International Accounting Standards Board (IASB) and approved by the European Union and the interpretations issued thereby (IFRIC and SIC). IFRS means International Financial Reporting Standards including International Accounting Standards (IAS), supplemented by the interpretations issued by the International Financial Reporting Interpretations Committee (IFRIC), previously called the Standing Interpretations Committee (SIC). The 2014 consolidated financial statements were prepared in accordance with such standards and interpretations.
Application of IFRS Below are the accounting standards, amendments and interpretations issued by the IASB and endorsed by the European Union for mandatory adoption in financial statements for years beginning on January 1, 2014:
Description
Adopte by theEU, in force at the balance
sheet date Mandatory
adoption date
IFRS 10 - Consolidated Financial Statements YES January 1, 2014
IFRS 11 - Joint arrangements YES January 1, 2014
IFRS 12 - Disclosure of interests in other entities YES January 1, 2014
IAS 28 - Investments in associates and joint ventures YES January 1, 2014
Amendments to IFRS 10 Consolidated financial statements, IFRS 12 Disclosure of in-terests in other entities and IAS 27 Separate financial statements YES January 1, 2014
Amendments to IAS 39 Financial Instruments: novation of derivatives and continuation of hedge accounting YES January 1, 2014
Amendments to IAS 36 Impairment of assets: recoverable amount disclosure for non-financial assets YES January 1, 2014
Amendments to IAS 32 Financial instruments: offsetting financial assets and financial liabilities YES January 1, 2014
Amendments to IFRS 10 Consolidated financial statements, IFRS11 joint arrangements and IFRS 12 Disclosure of interests in other entities YES January 1, 2014
IFRS 10 - Consolidated financial statements IFRS 10 substitutes SIC-12 - Consolidation: special purpose companies (vehicle companies) and parts of IAS 27 - Consolidated and separate financial statements (which was renamed IAS 27 - Separate financial statements which outlines how to account for equity investments in separate financial statements). The new standard takes the place of existing standards and defines a new control model to be applied to all businesses, including structured entities. The standard also provides guidelines for determining if control exists in the instances this might be difficult to ascertain.
IFRS 11 - Joint arrangements IFRS 11 substitutes IAS 31 - Interests in joint ventures and SIC-13 - Jointly controlled entities: transfer of non-monetary assets to a jointly controlled entity. The agreement is classified based on the rights and obligations stemming from the agreement rather than the legal structure.

42 CONSOLIDATED FINANCIAL STATEMENTS AT DECEMBER 31, 2014
IFRS 12 - Disclosure of interests in other entities IFRS 12 is the new and complete standard relating to the disclosure requirements for subsidiaries, associates and joint arrangements, as well as special purpose companies and other unconsolidated vehicles.
IAS 28 (2011) - Investments in associates and joint ventures The changes made to the standard reflect the new IFRS 11 and make it mandatory to account for investments in joint ventures using the equity method.
Investment entities (amendments to IFRS 10, IFRS 12 and IAS 27 (2011)) This document introduces amendments to the following standards: ! IFRS 10 - Consolidated financial statements: as a result of the amendments made to IFRS 10, investment
entity subsidiaries must be consolidated by the parent or IFRS 3 Business combinations should be applied when control is obtained, with certain exceptions, and the investment entity parent must account for the investment entity at fair value in the income statement of the separate and consolidated financial statements, if prepared;
! IFRS 12 - Disclosure of interests in other entities: IFRS 12 was amended to include specific disclosure requirements for investment entities with regard, in particular, to the valuations and significant assumptions made when verifying if the investment entity qualifies as such or not and when an entity becomes or ceases to be considered an investment entity;
! IAS 27 (2011) - Separate financial statements: makes it mandatory for investment entities to recognize the fair value of investments in subsidiaries in the income statement if these equity investments cannot be accounted for on a line-by-line basis as per the IFRS 10 amendments referred to above. The option to value in the separate financial statements any investments in subsidiaries at cost or in accordance with IAS 39 is unchanged for the investment entities linked to other subsidiaries that continue to be accounted for on a line-by-line basis in the consolidated financial statements.
IAS 39 - Financial instruments: recognition and measurement (amendments) On June 27, 2013 IASB issued a few minor amendments relating to IAS 39 entitled “Novation of derivatives and continuation of hedge accounting”. Based on the amendments hedge accounting may be used to measure a hedging instrument even when novation arises and the original counterparty is substituted as a consequence of laws and regulations in order to guarantee that obligations are fulfilled, as long as certain conditions are satisfied. The same amendment will be included in IFRS 9 - Financial instruments. These amendments must be applied retroactively as of January 1, 2014.
IAS 36 - Recoverable amount disclosures for non-financial assets (amendments) On May 29, 2013, IASB issued an amendment to IAS 36, which governs the disclosures to be made about the recoverable amount of impaired assets based on the fair value less disposal costs. These amendments must be applied retroactively as of January 1, 2014. Early application is allowed for the periods in which the entity has already applied IFRS 13.
IAS 32 - Financial instruments: presentation (amendments) On December 16, 2011, IASB issued a few amendments to IAS 32 in order to clarify the application of the criteria used to offset financial assets and liabilities. The amendments must be applied retroactively as of January 1, 2014.
Transition guidelines (Amendments to IFRS 10, IFRS 11 and IFRS 12) Based on these amendments retroactive application in general is limited only to the comparison period immediately prior to the first application period. In the event the entity decides voluntarily to present other comparison periods, these may be presented without having to be adjusted to reflect the retroactive impact of

CONSOLIDATED FINANCIAL STATEMENTS AT DECEMBER 31, 2014 43
IFRS 10 and IFRS 11. Specific dispositions relating to the first application of IFRS 10, IFRS 11 and IFRS 12 area also provided. These standards did not had a material impact on the Group’s consolidated financial statements. Below are the accounting standards, amendments and interpretations issued by the IASB and endorsed by the European Union for mandatory adoption in financial statements for years beginning on January 1, 2013:
Description
Adopted by theEU, in force at the balance
sheet date Mandatory
adoption date
Defined benefit plans: Employee Contributions (amendments to IAS 19) YES July 1, 2014
Annual Improvements to IFRS (cycle 2010-2012) YES July 1, 2014
Annual Improvements to IFRS (cycle 2011-2013) YES July 1, 2014
IFRIC 21 - Levies YES January 1, 2014
Below are the accounting standards, amendments and interpretations issued by the IASB and not yet endorsed by the European Union, which may in the future be applied in the Group’s consolidated financial statements:
Description
Adopted by the EU, in force at the balance
sheet date Mandatory
adoption date
IFRS 9 - Financial Instruments NO January 1, 2018
IFRS 14 - Regulatory deferral accounts NO January 1, 2016
IFRS 15 - Revenue from contracts with customers NO January 1, 2017
Amendments to IFRS 10, IFRS 12 and IAS 28: Investment Entities: applying the con-solidation exception NO January 1, 2016
Amendments to IAS 1: Disclosure Initiative NO January 1, 2016
Annual Improvements to IFRSs 2012-2014 Cycle NO January 1, 2016
Amendments to IFRS 10 and IAS 28: Sale or Contribution of Assets between an Inves-tor and its Associate or Joint Venture NO January 1, 2016
Amendments to IAS 27: Equity Method in Separate Financial Statements NO January 1, 2016
Amendments to IAS 16 and IAS 41: Bearer Plants NO January 1, 2016
Amendments to IAS 16 and IAS 38: Clarification of Acceptable Methods of Depreciation and Amortisation NO January 1, 2016
Amendments to IFRS 11: Accounting for Acquisitions of Interests in Joint Operations NO January 1, 2016
With regard to the standards and newly issued interpretations, as well as the revision or amendments to existing standards, the Group is evaluating the impact of future application.
Accounting policies The financial statements have been prepared on a historical cost basis, with the exception of the valuation of certain financial instruments. The more important accounting policies adopted by the Group for valuing the contents of its financial statements are detailed below.
Business combinations The Group accounts for all business combinations by applying the purchase method. The cost of each combination is determined as the aggregate of the fair values, at the date of exchange, of assets given, liabilities incurred or assumed, and equity instruments issued by the acquirer in exchange for control of the acquiree. The costs relating to the acquisition are recognized in the statement of income in the period in which

44 CONSOLIDATED FINANCIAL STATEMENTS AT DECEMBER 31, 2014
the costs are incurred and the services received; the sole exception is for the cost of issuing debt securities or equities. The acquiree’s identifiable assets, liabilities and contingent liabilities that can be recognized under IFRS 3 (2008) - Business Combinations are posted at their fair value on the date of acquisition. Goodwill is determined as the amount by which the aggregate of the consideration transferred in a business combination, the amount of any non-controlling interests in the acquiree and the acquisition-date fair value of any previously-held equity interest in the acquiree exceeds the net of the acquisition-date amounts of the identifiable assets acquired and the liabilities assumed. If the acquisition-date amounts of the identifiable assets acquired and liabilities assumed exceed the aggregate of the consideration transferred, the amount of any non-controlling interests in the acquiree and the acquisition-date fair value of any previously-held equity interest in the acquiree, this excess is immediately recognized in the statement of income as a gain on a bargain purchase. In case of a business combination achieved in stages, the interest previously held in the acquiree is remeasured at its acquisition-date fair value and any resulting gain or loss is recognized in the statement of income. The acquirer can measure non-controlling interests at the acquisition date either at fair value or in proportion to their share in the acquiree’s recognized identifiable net assets. The choice of measurement method is made for each business combination. On acquiring control, further acquisitions/disposals of non-controlling interests that do not result in a loss of control are accounted for as equity transactions. This means that any differences between the change in equity attributable to non- controlling interests and the cash and cash equivalents exchanged are recognized directly as movements in equity attributable to owners of the parent. The sale of shares to non-controlling interests, resulting in the Group’s loss of control over an entity, produces gains or losses that are recognized in the statement of income. The purchase of shares from non-controlling interests, resulting in the acquisition of control, produces goodwill which is calculated as described above. On first-time adoption of IFRS, the Group decided not to apply IFRS 3 retroactively to the acquisitions made prior to the date of transition to IFRS (January 1, 2004). Consequently, goodwill arising on acquisitions made prior to that date has been maintained at the value determined under Italian GAAP, subject to measurement and recognition of any impairment losses.
Property, plant and equipment These are recorded at purchase or production cost, including the price paid to buy the asset (net of discounts and rebates) and any costs directly attributable to the purchase and commissioning of the asset, including financial charges incurred during the asset’s construction. The cost of a commercial property purchased is the purchase price or equivalent of the price in cash, including all other directly attributable expenses such as legal costs, registration taxes and other transaction costs. The cost of internally produced assets is the cost at the date of completion of work. For the transition to International Accounting Standards, property revaluations carried out in accordance with specific monetary revaluation laws have been maintained only if they meet the requirements of IFRS 1. The cost of assets to be relinquished (whether free of charge or in exchange for payment of the residual carrying value of the asset by a new concession holder) includes the cost allowed by IAS 37 which is reasonably estimated and expected to be borne on expiry of the relevant contract to bring the asset to the contractually agreed state of conservation, assuming that maintenance will continue to be carried out properly and in a timely manner. Investment property, consisting of real estate held for rental and/or appreciation rather than for use in the production or supply of goods and services, is recorded at cost on the same basis as other property, plant and equipment and is depreciated over its useful life.

CONSOLIDATED FINANCIAL STATEMENTS AT DECEMBER 31, 2014 45
Costs incurred to enhance and maintain an asset that produce a material and tangible increase in its productivity or safety or extend its useful life are capitalized and increase the carrying amount of the asset. Routine maintenance costs are taken directly to the income statement. The value of property, plant and equipment is depreciated on a straight-line basis over its useful life. The components of an asset with their own material value and with a useful life different from that of the asset to which they belong are considered separately for the purposes of depreciation. Depreciation is calculated on the useful life of each individual component, which is modified if any maintenance work or replacements during the year have substantially increased its useful life. In the event of replacement, new components are capitalized to the extent that they satisfy the criteria for recognition as an asset, and the carrying value of the replaced component is eliminated from the statement of financial position. The residual value and useful life of an asset is reviewed at least at every financial year-end; if, regardless of depreciation already recorded, an impairment loss occurs according to the rules of IAS 36, the asset is correspondingly written down in value. If in future years the reasons for the write-down no longer apply, its value is restored. The depreciation rates applied in 2014 are within the ranges shown below by category of asset:
2014
Commercial and industrial buildings and investment property 2% - 33.3%
Plant and machinery 5% - 33.3%
Industrial and commercial equipment 4.4% - 40%
Furniture, furnishing, electronic equipment and store furniture 10% - 25%
Vehicles 20% - 25%
Other assets 3% - 50% Land is not depreciated. Leasehold improvement costs are depreciated over the shorter of the period during which the improvement may be used and the residual duration of the lease contract. Assets to be relinquished are depreciated on a straight-line basis over the shorter of the asset’s useful life and the length of the depreciation plan, which is based on the life of the concession. Assets acquired under finance leases are recognized at fair value as of the contract effective date less ancillary charges and any expenses for replacing another party in the lease, or, if lower, at the present value of the minimum payments due under the contract. The amount due to the lessor is stated under Lease financing in the balance sheet. Lease payments are divided into principal and interest, assuming a constant interest rate on the residual liability. Financial charges are recognized in the statement of income. Leased goods are depreciated on the same basis as similar assets. In the case of sale and leaseback transactions resulting in a finance lease, any gain resulting from the sale is deferred and released to income over the term of the lease. Leases for which the lessor substantially maintains all of the risks and rewards incidental to ownership are classified as operating leases. The costs of operating leases are expensed to income on a straight-line basis over the length of the leasing agreement. Benefits received or to be received, and those given or to be given, as incentives for taking out operating leases are also recognized on a straight-line basis over the term of the lease. Property, plant and equipment is derecognized on sale or if the facts and circumstances giving rise to the future expected benefits cease to exist. Any gains or losses (determined as the difference between the disposal proceeds, less costs to sell, and/or the carrying amount of the asset) are recognized in the statement of income for the year in which the asset is sold.

46 CONSOLIDATED FINANCIAL STATEMENTS AT DECEMBER 31, 2014
Intangible assets Intangible assets are measured initially at cost, normally defined as their purchase price, inclusive of any ancillary charges and less any trade discounts and rebates; also included is any directly attributable expenditure on preparing the asset for its intended use, until the asset is capable of operating. The cost of an internally generated intangible asset includes only those expenses which can be directly attributed or allocated to it as from the date on which it satisfies the criteria for recognition as an asset. Research costs are charged to the statement of income in the period in which they are incurred. Goodwill is recognized initially in intangible assets, as the excess of the purchase cost over the fair value of the net assets of the company acquired. As required by IAS 38, at the time of recognition, any intangible assets that have been generated internally by the acquired entity are eliminated from goodwill. Items which meet the definition of “assets acquired as part of a business combination transaction” are only recognized separately if their fair value can be measured reliably. At the acquisition date, goodwill is allocated to each cash generating unit or group of units expected to benefit from the synergies achieved with the business combination. The cost of concession rights may include one or more of the following: a. the fair value of construction services and/or improvements made by the grantor (measured as explained in
the note on the accounting policy on construction contracts and services work in progress) less any grants, the amount that shall be paid by the replacement operator on termination of the concession (the so-called "takeover rights") and/or the minimum guaranteed by the grantor. Such cost will be recovered through the tolls paid by users of the infrastructure. Specifically, the following are identified:
1. rights obtained as consideration for specific obligations to provide construction services for the expansion and modernization of the infrastructure and for which the operator does not receive additional economic benefits. These rights are initially recognized at the present fair value of the construction services to be provided in future (excluding any financial expenses to be incurred by the operator during the construction period), less any grants, with a contra entry of an equal amount in “provisions for construction services required by contract”; in addition to the impact of amortization, the initial value of the rights changes over time as a result of periodic reassessment of the present fair value of the part of the construction services still to be rendered at the end of the reporting period;
2. rights accrued in return for construction services rendered for which the operator receives additional economic benefits, represented by specific tariff increases and/or extensions of the infrastructure expected to result in significant increases in the number of users;
3. rights accruing from construction work carried out and paid for by service area operators, handed over free of charge to the company;
b. rights obtained from third parties, if costs have been incurred to acquire concessions from the grantor from third parties (the latter relating to the acquisition of companies that hold a concession).
After initial recognition, intangible assets are carried at cost, less accumulated amortization and any accumulated impairment losses calculated in accordance with IAS 36. Intangible assets are amortized unless they have indefinite useful lives. Goodwill is not amortized, but is submitted to an impairment test annually to identify any reductions in value, or more often whenever there is evidence of impairment (see Impairment losses of non-financial assets, below). Amortization is charged systematically over the intangible asset’s useful life, which reflects the period it is expected to benefit. The residual value at the end of the useful life is assumed to be zero, unless there is a commitment by third parties to buy the asset at the end of its useful life or there is an active market for the asset. Management reviews the estimated useful lives of intangible assets at every financial year end. Normally, brands are amortized over 5 to 25 years, while patents, contractual rights and concession rights are amortized over the life of the right. Deferred charges are amortized over the residual duration of the lease
CONSOLIDATED FINANCIAL STATEMENTS AT DECEMBER 31, 2014 47
contract, with the exception of fonds de commerce, which are amortized over 20 years. Software and software licenses are amortized over a period from three to six years. Development costs are amortized over three to six years.
Impairment losses of non-financial assets The carrying amounts of the Group’s property, plant and equipment and intangible assets are submitted for impairment testing whenever there are obvious internal or external signs indicating that the asset or group of assets (defined as cash generating units, or CGUs) may be impaired. In the case of goodwill, other intangible assets of indefinite useful life and intangible assets not in use, the impairment test must be carried out at least annually, and in any case whenever there are signs of possible impairment. The impairment test is carried out by comparing the carrying amount of the asset or CGU with its recoverable value, defined as the higher of fair value (net of any costs to sell) and value in use. Value in use is determined by calculating the present value of future net cash flows expected to be generated by the asset or CGU. In determining value in use, the estimated future cash flows are discounted to their present value using a rate that reflects current market assessments of the time value of money and the risks specific to the asset. If the carrying amount is higher than the recoverable amount, the asset or CGU is written down by the difference and the impairment loss is charged to the statement of income. The conditions and methods applied by the Group for reversing impairment losses, excluding in any case those relating to goodwill that may not be reversed, are as set out in IAS 36. Under no circumstances may the carrying value of an asset be restored to a value higher than the net book value it would have had if the impairment loss had not occurred. Restoration of value is taken immediately to the statement of income.
Equity investments Investments in subsidiaries that are not consolidated on a line-by-line basis, because they are not yet operative or are in liquidation as of the balance sheet date, are measured at fair value, unless this cannot be determined, in which case they are carried at cost. The difference between the cost and the net equity of investments at the time they were acquired is allocated on the basis described in paragraph b. of the consolidation criteria. Fair value changes are recorded in the statement of comprehensive income and in an equity reserve, unless they express a permanent loss, in which case they are charged to the statement of income. Joint ventures are carried on an equity or proportional basis. In the latter case, the Group’s share of the joint venture’s assets, liabilities, costs and revenues is incorporated line by line with the equivalent items in the consolidated financial statements. Unrealized gains and losses on transactions between a Group company and a joint venture are eliminated in proportion to the Group’s percentage interest in the joint venture, unless the unrealized losses are evidence of an impairment loss of the transferred asset. Investments in associates are valued using the equity method, recognizing the Group’s share of statement of income in the income statement, except for the effects of other changes in the associate’s shareholders’ equity, which are recognized directly in the statement of comprehensive income. The difference between the cost and the net equity of investments at the time they were acquired is allocated on the basis described in paragraph b. of the consolidation principles. The value of investments in associates can be adjusted for impairment losses, with a contra entry in the statement of income. Equity investments in other companies, classified as available-for-sale financial assets as defined by IAS 39, are carried at fair value. Fair value changes are recorded in an equity reserve, unless they express a permanent loss, in which case they are charged to the statement of income. If fair value cannot be reliably determined, the investments are recognized at cost less any impairment. Impairment losses cannot be reversed.

48 CONSOLIDATED FINANCIAL STATEMENTS AT DECEMBER 31, 2014
Held for sale investments or those acquired as a temporary investment are recognized at the lower of their carrying amount and fair value, less any costs to sell. Provisions are made to cover the risk that the losses of an investee company could exceed the carrying amount of the investment, to the extent that the shareholder is required to comply with actual or constructive obligations to cover such losses.
Financial assets All financial assets are measured initially at cost, which corresponds to the consideration paid including transaction costs (e.g. consulting fees, duty stamps, and fees imposed by the regulatory authorities). The classification of financial assets determines their subsequent valuation, as follows: ! financial assets held for trading: these are recorded at fair value, and associated gains and losses are
recognized in the statement of income; ! held to maturity investments, loans receivable and other financial receivables: these are recorded at
amortized cost; gains and losses associated with this type of asset are recognized in the statement of income when the investment is removed from the balance sheet on maturity or if it becomes impaired;
! available for sale financial assets: these are recorded at fair value, and gains and losses deriving from subsequent measurement are recognized in shareholders’ equity. If the fair value of these assets cannot be determined reliably, they are measured at cost, as adjusted for any impairment.
If it is no longer appropriate to classify an investment as “held to maturity” following a change of intent or ability to hold it until maturity, it must be reclassified as “available for sale” and re-measured at fair value. The difference between its carrying amount and fair value remains in shareholders’ equity until the financial asset is sold or otherwise transferred, in which case it is booked to the statement of income. All financial assets are recognized on the date of negotiation, i.e. the date on which the Group undertakes to buy or sell the asset. A financial asset is removed from the balance sheet only if all risks and rewards associated with the asset are effectively transferred together with it or, should the transfer of risks and rewards not occur, if the Group no longer has control over the asset.
Inventories Inventories are valued at the lower of purchase or manufacturing cost, generally determined on a weighted average cost or FIFO basis, and their market or net realizable value. Manufacturing cost includes raw materials and all attributable direct and indirect production-related expenses. The calculation of estimated realizable value includes any manufacturing costs still to be incurred and direct selling expenses. Obsolete and slow-moving inventories are written down to their useful or net realizable value.
Construction contracts and services work in progress Construction contracts are accounted for on the basis of the contract revenue and costs that can be reliably estimated with reference to the stage of completion of the contract, in accordance with the percentage of completion method, as determined by a survey of the works carried out. Contract revenue is allocated to the individual reporting periods in proportion to the stage of contract completion. Any positive or negative difference between contract revenue and any advance payments received is recognized in assets or liabilities, taking account of any impairment of the value of the completed work, in order to reflect the risks linked to the inability to recover the value of work performed on behalf of customers. In addition to contract payments, contract revenue includes variations in contract work, price reviews and claims to the extent that they can be measured reliably. Expected losses are fully recognized immediately regardless of the stage of contract completion. Construction services provided to the grantor relating to Group company concession arrangements are specifically recognized in the income statement in accordance with the stage of completion method. Specifically,

CONSOLIDATED FINANCIAL STATEMENTS AT DECEMBER 31, 2014 49
construction and/or upgrade service revenue represents the consideration for the services provided and is measured at fair value, calculated on the basis of the total costs incurred. These primarily consist of the costs of materials and external services, the cost of employment benefits payable to employees used to provide the services, attributable financial expenses (the latter only in the case of construction and/or upgrade services for which the operator receives additional economic benefits), and any profit on services rendered within the Group (as this represents the market value of these services).
Trade receivables Receivables are initially recognized at fair value and are subsequently stated at amortized cost, using the effective interest rate method, net of provisions for doubtful accounts. The amount of the provisions is based on the present value of expected future cash flows which take account of expected collection times, estimated realizable value, any guarantees provided, and the expected costs of recovering the amounts due. Impairment losses are reversed in future periods if the circumstances that resulted in the loss no longer exist. In this case, the reversal is accounted for in the income statement and may not in any event exceed the amortized cost of the receivable had no previous impairment losses been recognized. Receivables factored without recourse, for which all risks and rewards are substantially transferred to the assignee, are derecognized from the financial statements at their nominal value. Commissions paid to factoring companies for their services are included in service costs.
Accruals and deferrals These are recorded to match costs and revenues within the accounting periods to which they relate.
Cash and cash equivalents These include cash, current accounts at banks and post offices, demand deposits, and other short-term financial investments that are highly liquid, easily convertible to cash, and subject to insignificant risk of change in value. They are stated at face value.
Provisions for contingent liabilities The Group makes provisions only when a present obligation exists for a future outflow of economic resources as a result of a past event, and when it is probable that this outflow will be required to settle the obligation and a reliable estimate can be made of the same. The amount provided is the best estimate of the expenditure required to settle the present obligation completely, discounted to present value using a suitable pre-tax rate. When cash flows are discounted, the increase in the provision over time is recorded as a financial charge. Any provisions for restructuring costs are recognized when the Group has drawn up a detailed restructuring plan and has announced it to the parties concerned. In the case of onerous contracts where the unavoidable costs of meeting the contractual obligations exceed the economic benefits expected to be received under the contract, the present obligation is recognized and measured as a provision. In accordance with the contract obligations reflected in the financial plans annexed to concession arrangements, the Atlantia group’s Provisions for repair and maintenance obligations show the amount provided at the balance sheet date to cover future maintenance obligations that ensure the necessary functionality and safety of motorway infrastructure. These provisions are calculated on the basis of the usage and wear and tear of motorway infrastructures, taking account, if material, of the time value of money. The Provision for construction services required by contract relates to contractual obligations, specifically in connection with the upgrading of motorway infrastructure, for which the Group obtains no additional economic benefits. Such costs are treated as consideration for concession arrangements and are initially recognized at the present value of the fair value of construction services to be rendered in the future (ignoring any financial costs) less any grants received. They are accounted for as a contra item of concession rights without additional benefits. The present value of the residual liability to be rendered in the future, for the construction services still to be rendered to date, is therefore periodically reassessed, and changes to the measurement of the liabilities (such as, for example, changes to the estimated cash outflows necessary to extinguish the obligation, a change
50 CONSOLIDATED FINANCIAL STATEMENTS AT DECEMBER 31, 2014
in the discount rate and/or a change in the construction period) are recognized as a matching increase or reduction in the corresponding intangible asset.
Trade payables Payables are initially recorded at cost, which corresponds to fair value, net of directly attributable transaction costs. They are subsequently recognized at amortized cost, using the original effective interest rate method. The implicit interest component included in medium/long-term payables is recorded separately using an appropriate market rate.
Financial liabilities Financial liabilities are divided into three categories: ! liabilities acquired with the intention of making a profit from short-term price fluctuations or that are part of a
portfolio held for short-term profit. These are recorded at fair value, with the related gains and losses recognized in the statement of income;
! other liabilities (bank overdrafts, loans, bonds), which are initially recorded at fair value, on the basis of the amounts received net of transaction costs, and are subsequently stated at amortized cost using the effective interest rate method;
! convertible bonds, which are financial instruments comprised of a liability component and an equity component. The fair value of the liability component is estimated as of the issue date using the going market interest rate for similar, non-convertible bonds. The difference between the net amount raised by the issue and the fair value assigned to the liability component, which represents the implicit option to convert the bonds into shares of Group companies, is posted to shareholders’ equity under other reserves.
Foreign currency transactions and net investments in foreign operations Transactions in foreign currencies are recorded using the exchange rates in effect on the transaction dates. Exchange gains or losses realized during the period are recognized in the statement of income. At the balance sheet date, the Group companies have adjusted receivables and payables in foreign currency using exchange rates ruling at period-end, recognizing all resulting gains and losses in the statement of income. Exchange differences arising on a monetary item forming part of a net investment in a foreign operation are initially recognized in a separate component of equity and reversed to income at the time of recognizing the gains or losses on the investment’s disposal.
Derivative financial instruments and hedging transactions The Group uses derivative financial instruments only with the intent of managing and hedging its exposure to the risk of fluctuations in exchange rates of currencies other than the Euro and in interest rates. As established by IFRS, derivative financial instruments qualify as hedging instruments only when at the inception of the hedge there is formal designation and documentation of the hedging relationship and of the risk management objective and strategy for undertaking the hedge. In addition, the Group checks at the inception of the hedge and throughout its duration that the hedging instrument used in the relationship is highly effective in offsetting changes in the fair value of cash flows attributable to the hedged risk. After initial recognition, derivative financial instruments are reported at their fair value. The method of accounting for gains and losses relating to such instruments depends on the type and sustainability of the hedge. The objective of hedging transactions is to offset the impact on statement of income of exposures relating to hedged items. Fair value hedges for specific assets and liabilities are recorded in assets and liabilities; the hedging instrument and the underlying item are measured at fair value, and the respective changes in value (which generally offset each other) are recognized to the statement of income. Cash flow hedges are recorded in assets and liabilities; the hedging instrument is measured at fair value and the effective portion of changes in value is recognized directly in the statement of comprehensive income and accumulated in an equity reserve, which is released to income in the financial periods in which the cash flows of the underlying item occur. The ineffective portion of the changes in value is recognized in the statement of income. If a hedged transaction is no longer thought probable, the unrealized gains or losses, recognized

CONSOLIDATED FINANCIAL STATEMENTS AT DECEMBER 31, 2014 51
through comprehensive income and accumulated in an equity reserve, are immediately recognized in the statement of income. The shareholders’ equity of foreign subsidiaries may be subject to hedging, in order to protect investments in foreign companies from fluctuations in exchange rates (foreign exchange translation risk). Exchange differences resulting from these capital hedging transactions are debited or credited directly to the statement of comprehensive income and accumulated in equity as an adjustment to the translation differences reserve, and are reversed to income at the time of disposal or settlement. Derivative instruments for managing financial risks, which do not meet the formal requirements to qualify for IFRS hedge accounting, are recorded under financial assets/liabilities with changes in value reported through the statement of income.
Share-based payments The cost of services provided by directors and/or employees remunerated through share-based incentive plans is based on the fair value of the rights at the grant date. This value is booked to the statement of income on a straight-line basis over the vesting period and is offset by an entry to a shareholders’ equity reserve; the amount booked is based on an estimate of the stock options which will effectively vest for staff so entitled, taking into account the conditions of use that are not based on the market value of the shares. The cost of any services provided by employees and/or directors and remunerated through share-based payments, but settled in cash, is measured at the fair value of the liability recorded in the Provisions for employee benefits. Fair value is remeasured at the end of each reporting period until such time as the liability is settled, with any changes recognized in the income statement.
Government grants Government capital grants are recognized at fair value when their amount can be reliably determined and it is reasonably certain that the conditions required for their receipt will be satisfied. Grants for investments in motorway infrastructure are recognized as construction services revenue in accordance with the accounting policy on Construction contracts and services work in progress. Operating grants are recognized to the statement of income in the same year as the costs to which they relate. Capital grants related to assets received to fund development projects or activities are accounted for in liabilities, and are subsequently recognized in operating income in the statement of income, in line with depreciation of the assets to which they refer. Any grants received to fund investments in property, plant and equipment are accounted for as a reduction in the carrying value of the asset to which they refer and result in a reduction in depreciation.
Employee benefits All employee benefits are recognized and disclosed on an accruals basis. According to local conditions and practice in the countries in which the Group operates, there are defined-benefit and defined-contribution plans. Post-employment benefit plans are formalized and non-formalized agreements whereby the entity provides post-employment benefits to one or more employees. Defined-contribution plans are post-employment benefit plans whereby the entity pays predetermined contributions to a separate entity (a fund) and have or will have no legal or construed obligation to pay additional contributions if the fund does not have sufficient assets to pay obligations towards employee. The amount accrued at year end is projected forward to estimate the amount payable on termination of employment and is then discounted using the projected unit credit method, to account for the time that will elapse before actual payment occurs. Due to changes in the system of Italian employee termination indemnities (Trattamento di fine rapporto or TFR) brought about by Law no. 296 of December 27, 2006 and by the decrees and regulations issued in early 2007 (the “Social security reform”), the Group has adopted the following accounting rules: ! TFR accrued at December 31, 2006 is treated as a defined-benefit plan in accordance with IAS 19. The
benefits promised to employees in the form of TFR, which are paid upon termination of service, are recognized in the period when the right matures;

52 CONSOLIDATED FINANCIAL STATEMENTS AT DECEMBER 31, 2014
! TFR accrued from January 1, 2007 is treated as a defined-contribution plan, so contributions accrued during the period are fully recognized as costs and shown as a liability under employee termination indemnities and other employee benefit provisions.
Gains or losses from changes in actuarial assumptions are recognized in the statement of comprehensive income.
Assets and liabilities held for sale and discontinued operations Where the carrying amount of assets or of assets and associated liabilities (disposal groups) is material and is to be recovered primarily through sale rather than through continued use, these items are presented separately in the balance sheet. They are classified, as appropriate, under Assets held for sale or Liabilities held for sale and the amounts cannot be offset. Immediately prior to being classified as held for sale, they are recognized under the specific IFRS applicable to each asset and liability, and subsequently accounted for at the lower of the carrying amount and estimated fair value less costs to sell. Any impairment losses are recognized immediately in the statement of income. Regarding their classification in the statement of income, discontinued operations or operations held for sale are those that have either been sold or are classified as held for sale and that satisfy one of the following requirements: ! they represent a major line of business or geographical area of operation; ! they are part of a single coordinated plan to dispose of a major line of business or geographical area of
operation; ! they are subsidiaries acquired exclusively for the purpose of resale.
Gains and losses resulting from these operations, net of the tax effects, are recognized in a specific item in the consolidated statement of income, together with comparative amounts.
Revenues Revenues are recognized to the extent that their fair value can be reliably measured and it is likely that the economic benefits will flow to the company. Depending on the type of transaction, revenue is recognized on the basis of the following specific criteria: ! toll revenues are recognized in the period in which they are earned on the basis of motorway usage. Due
partially to the fact that the Group’s network interconnects with other networks, and that it is consequently necessary to allocate revenues among the various concessionaires, a portion of toll revenues relating to the last part of the year are determined on the basis of reasonable estimates;
! revenues from the sale of goods, net of any returns and discounts, are recognized when the company transfers the main risks and rewards associated with ownership of the goods to the buyer and when collection of the relevant receivables is reasonably certain;
! revenues from rendering of services are recorded with reference to the stage of completion of the transaction as of the balance sheet date. Revenues are recorded in the financial period in which the service is provided, based on the percentage of completion method. If revenues from the services cannot be estimated reliably, they are only recognized to the extent that the relative costs are recoverable. This method appropriately discloses the services provided and the economic results achieved during the period;
! revenues in the form of rental income or royalties is recognized on an accruals basis, considering the terms and conditions of contract.
Revenues from sales by directly operated stores are recognized when the customer pays for the merchandise. The Group’s policy regarding returns by customers is quite restrictive, allowing these only in very specific circumstances (e.g. defective goods or late shipment). At the end of each year the Group considers past trends to estimate the overall amount of returns expected in the following year relating to sales in the year just ended. This amount is then deducted from revenues reported in that year.

CONSOLIDATED FINANCIAL STATEMENTS AT DECEMBER 31, 2014 53
Financial income and charges Interest income and expense are recorded on a time-proportion basis, using the effective interest method.
Dividends Dividends from third parties are recorded when the shareholders’ right to receive payment is established, following a resolution by the shareholders of the investee company.
Expense recognition Expenses are recorded on an accruals basis. Recoveries of costs borne on behalf of others are recognized as a deduction from the related cost.
Income and costs relating to leasing contracts Income and costs from operating lease contracts are recognized on a straight-line basis over the duration of the contract.
Income taxes Income taxes are calculated by each consolidated company on the basis of a reasonable estimate of taxable income, in accordance with applicable local regulations and taking account of any tax credits due. In fiscal year 2007, the Parent Company and certain Italian subsidiaries adopted the National Consolidated Taxation System. Per Articles 117 to 129 of the Tax Code, this system involves the calculation of a single overall income for the purposes of corporate income tax (IRES), by adding the incomes and/or losses of the Parent Company and participating subsidiaries. The Parent Company then pays the tax due or carries forward/receives a refund for any credit. The Parent Company also carries forward any consolidated loss. The relationships arising from participation in the group tax election are governed by specific rules, approved and signed by all participating companies, which provide for full recognition of the amount calculated on the fiscal losses or profits transferred at current corporate tax rates. Payables for IRAP (regional business tax), due directly to the national tax authorities, are shown under current tax liabilities net of advances paid. Deferred taxes are recorded on temporary differences between balance sheet values and the corresponding values recognized for tax purposes, on consolidation adjustments, and in relation to the fiscal deferral or deductibility of revenues and costs. Deferred tax assets are recorded for all temporary differences to the extent it is probable that taxable income will be available against which the deductible temporary difference can be recovered. The same principle is applied to the recognition of deferred tax assets on the carry forward of unused tax losses. The carrying value of deferred tax assets is reviewed at every balance sheet date and, if necessary, reduced to the extent that it is no longer probable that sufficient taxable income will be available to recover all or part of the asset. Deferred tax liabilities, save for specific exceptions, are always recognized. Deferred tax assets and liabilities are not recognized if the temporary differences arise from initial recognition of goodwill (different from business combination transactions) or of other assets or liabilities in transactions that have no influence either on accounting profit or on taxable income. Deferred tax assets and liabilities are calculated using tax rates which are expected to apply in the period when the asset is realized or the liability settled, using the tax rates and tax regulations which are in force at the balance sheet date. It is possible to offset deferred tax assets and liabilities only if there is a legal right to offset the current tax balances, if the deferred balances refer to taxes levied by the same tax authority, and if the Group intends to settle current tax balances on a net basis. Tax assets and liabilities for current taxes are only offset if there is a legally enforceable right to set off the recognized amounts and if it is intended to settle or pay on a net basis or to realize the asset and settle the liability simultaneously.

54 CONSOLIDATED FINANCIAL STATEMENTS AT DECEMBER 31, 2014
Cash flow statement In compliance with IAS 7, the cash flow statement, prepared using the indirect method, reports the Group’s ability to generate cash and cash equivalents. Cash equivalents comprise short-term highly liquid financial investments that are readily convertible to a known amount of cash and are subject to an insignificant risk of changes in value. Therefore, an investment normally qualifies as a cash equivalent only when it has a short maturity, that is when the original maturity is shorter than three months. Bank overdrafts qualify as borrowings, unless they are payable on demand and form an integral part of an enterprise’s cash and cash equivalents management, in which case they are classified as a component of cash and cash equivalents. Cash and cash equivalents included in the cash flow statement comprise the balance sheet amounts for this item at the reporting date. Cash flows in foreign currencies are translated at the average exchange rate for the period. Income and expenses relating to interest, dividends received and income taxes are included in cash flow from operating activities. In the Group’s layout, the following are reported separately: ! operating cash flow: cash flow from operating activities originates mostly from revenue-generating activities
and is presented by the Group using the indirect method; this method adjusts net statement of income for the effects of items which did not result in cash outflows or generate liquidity (i.e. non-cash transactions);
! investing cash flow: investing activities are reported separately, in part because they are indicative of investments/ divestments aimed at the future generation of revenues and positive cash flows;
! financing cash flow: financing activities consist of the cash flows which determine a change in the size and composition of shareholders’ equity and loans granted.
Use of estimates The preparation of the financial statements and notes in accordance with IFRS requires management to make estimates and assumptions that affect the carrying values of assets and liabilities and the disclosure of contingent assets and liabilities as of the reporting date. Final results may be different from the estimates. The Group has used estimates for valuing, in particular, assets subject to impairment testing and provisions for doubtful accounts, inventory obsolescence, depreciation and amortization, employee benefits, deferred taxes, restructuring, and for measuring the fair value of financial assets and liabilities. Estimates and assumptions are reviewed periodically and any changes are reflected immediately in the statement of income.

CONSOLIDATED FINANCIAL STATEMENTS AT DECEMBER 31, 2014 55
COMMENTS ON ASSET ITEMS (All figures in thousands of Euro) Comments on the items making up the consolidated statement of financial position at December 31, 2014 are presented below. The balances at December 31, 2014 for the World Duty Free group and the companies in the Atlantia group involved in the Ecomouv’ project have been reclassified to Assets/liabilities held for sale (Note 17). Changes in the scope of consolidation essentially concerned the Atlantia group's deconsolidation of TowerCo S.p.A.
NON-CURRENT ASSETS
1 Property, plant and equipment
The gross value, accumulated depreciation and impairment, and net book value of the Group’s property, plant and equipment are detailed below:
12.31.2014 12.31.2013
(Thousands of Euro) Gross
Accumulated depreciation and
impairment Net Gross
Accumulated depreciation and
impairment Net
Land and buildings 1,195,372 (408,721) 786,651 1,372,288 (423,571) 948,717
Investment property 145,056 (30,594) 114,462 93,449 (34,204) 59,245
Plant, machinery and equipment 1,710,634 (1,329,454) 381,180 1,975,858 (1,474,582) 501,276
Furniture, furnishings and electronic equipment 471,351 (389,454) 81,897 504,789 (411,925) 92,864
Assets to be relinquished 392,147 (309,090) 83,057 450,963 (358,322) 92,641
Leasehold improvements 1,166,353 (808,044) 358,309 1,124,333 (785,160) 339,173
Other tangible assets 153,529 (106,477) 47,052 156,900 (105,461) 51,439
Assets under construc-tion and advances 160,470 - 160,470 158,213 - 158,213
Total 5,394,912 (3,381,834) 2,013,078 5,836,793 (3,593,225) 2,243,568

56 CONSOLIDATED FINANCIAL STATEMENTS AT DECEMBER 31, 2014
The following table reports movements in 2014 and in 2013 in property, plant and equipment, stated net of accumulated depreciation. These movements include the assets held for sale of the Atlantia group and the World Duty Free group, as their reclassification to Asets/liabilities held for sale concerns only the balances at December 31, 2014.
(Thousands of Euro) Land and buildings
Investment property
Property, plant, machin-
ery and equipment
Furniture, furnishings
and eletronic equipment
Asset to be relinqui-
shed Leasehold
improvements Other tangible
assets
Assets under construction
and advances Total Balance at 01.01.2013 1,101,508 53,748 499,714 119,425 112,530 370,362 78,308 202,801 2,538,396
Additions 27,921 40 91,480 44,588 14,225 19,332 10,888 152,070 360,544
Disposals (70,729) - (5,665) (8,048) - (12,960) (18,107) (1,635) (117,144)
Depreciation (26,778) (1,852) (151,769) (40,006) (34,710) (90,752) (13,750) - (359,617)
Impairments (47,959) - (5,427) (22,776) (6,458) (14,293) - (40) (96,953)
Impairment reversals - - - - - - - - -
Changes in scope of consolidation - - 4,020 (37) - 3,237 1,942 2,996 12,158
Translation differences (63,532) (467) (8,493) (1,960) - (11,398) (5,464) (11,233) (102,547)
Other movements 28,286 7,776 77,416 1,678 7,054 75,645 (2,378) (186,746) 8,731 Balance at 12.31.2013 948,717 59,245 501,276 92,864 92,641 339,173 51,439 158,213 2,243,568
Additions 6,716 12 86,608 37,174 8,399 24,515 14,856 204,063 382,343
Disposals (49,102) - (2,895) (998) (40) (1,093) (1,762) (6,813) (62,703)
Depreciation (25,614) (2,018) (159,483) (31,578) (22,223) (79,683) (12,730) - (333,329)
Impairments (1,909) (556) (4,787) (10,499) (4,304) (6,816) (2,824) (9) (31,704)
Impairment reversals - - - 17 - - - - 17 Changes in scope of consolidation (76) - (17,437) (154) - 570 (83) (2,367) (19,547)
Reclassifica-tion to discountinued operations (4,183) (5,636) (120,162) (6,000) - (12,619) (2,360) (30,644) (181,604)
Translation differences (25,486) (28) 14,166 336 - 30,595 (1,730) 9,166 27,019
Other movements (62,412) 63,443 83,894 735 8,584 63,667 2,246 (171,139) (10,982)
Balance at 12.31.2014 786,651 114,462 381,180 81,897 83,057 358,309 47,052 160,470 2,013,078 Investments in property, plant and equipment in 2014 amounted to Euro 382,343: Euro 184,015 by the Autogrill group, Euro 78,906 by the World Duty Free group, Euro 57,008 by the Atlantia group, Euro 47,471 by the Schematrentanove group and Euro 12,160 by the Parent Company. Most investments by the Autogrill group concerned the airport channel in North America and at Helsinki, Amsterdam, Bali, and Rome Fiumicino airports, as well as rest stops on the Pennsylvania Turnpike. Investments by the World Duty Free group refer to the expansion of airport shops in Spain and at Helsinki and Heathrow airports. The Schematrentanove group invested in the modernization and refurbishment of stores with a view to developing and supporting the retail network in Italy and Spain.

CONSOLIDATED FINANCIAL STATEMENTS AT DECEMBER 31, 2014 57
Disposals during the year amounted to Euro 62,703, of which Euro 48,522 pertains to the Schematrentanove group, mostly for the sale of a property in Paris. Impairment losses, totaling Euro 31,704 for the year, were recognized in the year and are explained for Euro 17,195 by the losses recognized by Schematrentanove group with respect to some commercial properties written down to their recoverable amount. The remainder is attributable chiefly to the Autogrill group (Euro 10,134) and the Atlantia group (Euro 2,820). Translation differences, positive for Euro 27,019, mostly concern the Autogrill group (positive for Euro 51,503) and the Schematrentanove group (negative for Euro 24,346). Assets to be relinquished are tangible assets that will revert to the grantor upon expiry of the concession or sub-concession, either free of charge or against payment of their residual carrying value by the new concession holder. They are all held by the Autogrill group.
Leasehold improvements refer to the renovation of non-proprietary stores and the expenses incurred to build or improve properties and businesses run under leasing or concession agreements. The items in the following table include the contractual value of property, plant and equipment held under finance leases: (Thousands of Euro) 12.31.2014 12.31.2013
Land and buildings 8,399 17,766
Plant, machinery and equipment 2,685 849
Assets to be relinquished 5,108 12,788
Leasehold improvements 519 59
Other assets 3,539 1,918
Accumulated depreciation (10,165) (23,692)
Total 10,085 9,688 The long-term portion of the residual amount of lease repayments at December 31, 2014 is recognized as Lease financing under non-current liabilities (Euro 15,109); the short-term portion is reported as Current portion of lease financing (Euro 3,517). See Note 26 for details. The fair value of investment property is greater than the stated balance sheet value. As at 31 December 2014, the property, plant and equipment and eventual receivables resulting from the sale of these assets attributable to Aeroporti di Roma S.p.A. and ADR Mobility are subject to special liens (in the form of collateral), in relation to a bonds issue made by the Aeroporti di Roma group. In addition, some properties owned by the Schematrentanove group have been identified as "Relevant Proper-ties", serving as security against the new credit agreement entered into by Schematrentanove S.p.A.; if such properties are sold, 60% of the proceeds must be used to repay the loan.

58 CONSOLIDATED FINANCIAL STATEMENTS AT DECEMBER 31, 2014
2 Intangible assets
Movements in the principal intangible asset items in 2014 and the previous year were as shown in the table below. As specified for property, plant and equipment, these movements include the assets held for sale of the Atlantia group and the World Duty Free group, as their reclassification to Assets/liabilities held for sale concerns only the balances at December 31, 2014.
(Thousands of Euro)
Goodwill and other intangible assets
of indefinite useful life
Intangible assets deriving from
concession rights Patent rights
Concessions, licenses,
trademarks and similar rights
Deferred charges
Other intangible assets Total
Balance at 01.01.2013 6,828,385 16,655,953 5,135 677,420 131,045 76,025 24,373,963
Additions 7,653 - 602 14,389 11,135 30,537 64,316 Additions due to execution of construction services - 422,587 - - - - 422,587 Changes due to update of concession plans - (316,482) - - - - (316,482)
Disposals (1,722) (10,602) (2) - (5,388) (436) (18,150)
Depreciation - (612,131) (1,362) (82,055) (15,814) (31,955) (743,317)
Impairments (40,595) - - (2,459) (37,451) (155) (80,660) Changes in scope of consol-idation - 4,685,564 710 14,456 - 407,664 5,108,394
Translation differences (35,463) (572,415) (408) (13,609) (534) (690) (623,119)
Other movements 1 (34,616) 18 6,494 (141) (363) (28,607)
Balance at 12.31.2013 6,758,259 20,217,858 4,693 614,636 82,852 480,627 28,158,925
Additions - 2,595 512 32,846 1,111 44,719 81,783 Additions due to execution of construction services - 424,369 - - - - 424,369 Changes due to update of concession plans - 457,757 - - - - 457,757
Disposals - (5,294) - (205) (1,281) (213) (6,993)
Depreciation - (760,131) (1,780) (86,224) (8,848) (67,624) (924,607)
Impairments - - (369) (155) (9,691) (65) (10,280)
Impairment reversals - 12,018 - - 83 - 12,101 Changes in scope of consolidation - - (25) (7) - (152) (184) Reclassification of assets held for sale (667,493) - (6) (520,791) - (6,871) (1,195,161)
Translation differences 97,341 (26,075) 226 28,595 161 1,370 101,618
Other movements (49) (11,410) 13 1,544 (95) 7,793 (2,204)
The balance of Goodwill and other intangible assets of indefinite useful life consists essentially of goodwill pertaining to the Atlantia group (Euro 5,381,980) and the Autogrill group (Euro 758,495). Goodwill and other intangible assets of indefinite useful life are subject to impairment testing once a year. There were no impairment losses in 2014. For the previous year, impairment of Euro 40,595 refers entirely to goodwill on the business combinations carried out by the Schematrentanove group. Translation differences pertain to the Autogrill group for Euro 55,307 and the World Duty Free group for Euro 42,002.

CONSOLIDATED FINANCIAL STATEMENTS AT DECEMBER 31, 2014 59
Concession rights pertain solely to the Atlantia group and are broken down as follows: (Thousands of Euro) 12.31.2014 12.31.2013
Acquired concession rights 6,543,078 6,780,858 Concession rights deriving from construction services for which no additional economic benefits are received 8,824,429 8,727,507 Concession rights deriving from construction services for which additional economic benefits are received 4,868,704 4,665,625
Concession rights deriving from construction services carried on by service area operators 75,476 43,868
Total 20,311,687 20,217,858 Acquired concession rights are recognized against the cash outlays incurred to obtain concessions from the grantor or from third parties; in particular, they refer to the fair value of the concession rights recognized following the acquisitions of Aeroporti di Roma and the motorway operators in Chile and Brazil. Rights relating to construction services for which no additional economic benefits are received have accrued against construction service commitments by operators in the Atlantia group. Rights deriving from construction services for which additional economic benefits are received (specific tariff increases and/or significant increases in the number of expected users due to infrastructure expansion) also pertain to the Atlantia group. Rights deriving from construction services provided by suboperators are recognized against investments carried out by service area operators that are handed over free of charge to the Atlantia group. The principal changes in this item are an increase of Euro 424,369 in the amount of investments carried out in 2014 relating to construction and/or upgrade services for which additional economic benefits are received; an increase of Euro 457,757, with a balancing entry in Provisions for construction services required by contract (Note 31), due to the revised estimate of the present value of construction services to be rendered in the future for works without additional economic benefits; and amortization of Euro 760,131. In 2014 the reversal of impairment losses on concession rights pertains to the Atlantia group's motorway operator in Poland. Translation differences are attributable to the negative impact of the depreciation of the Chilean peso and Brazilian real. Concessions, licenses, trademarks and similar rights at December 31, 2014 refer to the Autogrill group for Euro 43,796; the remainder consists primarily of licenses and trademarks owned by the Atlantia group and the trademarks pertain to the Schematrentanove group. At December 31, 2013 this item included the intangible assets of the World Duty Free group, namely contractual rights (Euro 397,272) and the World Duty Free tradename (Euro 90,241). Deferred charges consist of key money for the acquisition of retail operations by the Schematrentanove group, which is amortized over the term of the related lease contracts. Impairment losses with respect to key money came to Euro 9,691. Other intangible assets include Euro 368,149 for the commercial contractual relationships quantified during the fair value measurement of the assets and liabilities acquired with the Aeroporti di Roma group in 2013. See Note 62 (Business combinations) for further details. Other intangible assets also include the cost of purchasing and developing software, of which Euro 22,057 pertains to the Schematrentanove group, Euro 9,183 to the Autogrill group and Euro 9,581 to the Atlantia group. In addition, this item includes assets under construction and advances (Euro 29,717).

60 CONSOLIDATED FINANCIAL STATEMENTS AT DECEMBER 31, 2014
Impairment testing According to the rules of IAS 36, the Group has: ! checked for any indication that its property, plant and equipment or intangible assets of finite useful life might
be impaired; ! compared the recoverable amount of its intangible assets of indefinite useful life and of its intangible assets
not yet available for use with their corresponding carrying amounts; such a comparison was carried out irrespective of the occurrence of events indicating that the carrying amount of such assets might be impaired.
The forward planning scenario used by the Schematrentanove group for the performance of impairment tests was the new business plan for 2015-2017, which complements the 2014-2016 refocusing program approved by the company's board of directors in 2013. As it was in the previous year, the Schematrentanove group was divided into three macro areas, which were tested specifically in view of the strategic development envisaged for each of them by the plan. The three macro areas and the corresponding impairment losses are described below: a. commercial segment: impairment concerned:
! stores (managed directly and by partners). Each store is classified in one of two categories: "discontinuing stores" due for closure or sale to third-party customers and "continuing stores" that will remain in operation for at least the next three years. Each is treated as a separate CGU, for which the net present value of future cash flows (value in use) is calculated. If value in use is lower than the carrying amount of the CGU, its assets are considered impaired. Most of the impairment losses concern furniture and fittings, deferred charges and leasehold improvements, primarily in Italy, France and Germany. In the event of indications of possible impairment of fonds de commerce, their recoverable amount is determined by expert appraisal;
! goodwill generated by business combinations for which the cash flows of the acquired operations are not sufficient to cover the value of their fixed assets.
Assets in the commercial segment were also tested for impairment at an aggregate corporate level, in order to test those amounts not directly attributable to individual store CGUs: this test has not revealed any additional impairment losses.
b. real estate segment: each country in which commercial properties are located is treated as a CGU. Impairment is determined by comparing the net carrying amount with the recoverable amount of the assets corresponding to the CGU. Recoverable amount was taken as the higher of market value, determined by appraisals and (when not available) on the basis of rent and market yields, and value in use, determined on the basis of rent contracted within the group and market returns. Testing showed no impairment;
c. manufacturing segment: the fixed assets at manufacturing centers in Italy and abroad (Tunisia, Croatia, Romania, Serbia and Hungary) used to produce apparel and fabrics were identified as a single CGU. Net cash flows were estimated for the CGU as a whole, but discounted considering the specific rates of the country where each center is located. Testing showed no impairment.
Impairment losses likewise concerned some assets of the Autogrill group. Except for goodwill, impairment testing is performed on the individual contract or store considering future cash flows (without incorporating any assumed efficiency gains), discounted at the average cost of capital, which reflects the cost of money and the specific business risk attributable to each country. When testing goodwill for impairment, the CGUs are identified on the basis of business segment, following a geographical/operational logic, consistently with the minimum level at which goodwill is monitored for internal management purposes. The recoverability of the goodwill allocated to each CGU is verified by estimating its value in use, defined as the present value of estimated cash flows based on the 2015 budget and forecasts for 2016-2019, discounted at a rate differentiated by geographical area and reflecting the risks specific to the individual CGU on the measurement date.

CONSOLIDATED FINANCIAL STATEMENTS AT DECEMBER 31, 2014 61
On the basis of the assumptions made, for 2014 the goodwill allocated to each CGU was found to be fully recoverable. In the Atlantia group, each concession holding company is treated as a separate CGU. The subsidiaries that do not hold motorway concessions are also identified as individual CGUs. The recoverability of goodwill and concession rights was assessed using the long-term plans drawn up by each company, which report traffic, investment, cost and revenue projections for the full term of the concession contract, on the basis of the financial plans annexed to the concession agreements signed with the grantor. During the year, impairment losses were reversed on concession rights held by a Polish motorway operator. Almost all goodwill is allocated to a single concession holder (Autostrade per l’Italia S.p.A.); impairment testing confirms that it is fully recoverable. Regarding the World Duty Free group, management tests for possible impairment as follows: i) the recoverable amount is calculated for each CGU, although in the case of buildings, plant and machinery, where possible, it is calculated for each asset; ii) the recoverable amount is the higher of fair value less disposal costs and value in use. Given the group's organizational structure and operations, CGUs essentially coincide with geographical areas. In determining value in use, the estimated future cash flows are discounted to their present value using a post-tax rate that reflects current market assessments of the time value of money and the risks specific to the asset. The discount rate was set in consideration of the capital assets pricing model, which is based, as far as possible, on indicators and variables that can be observed from the market. Future cash flows have been estimated at December 31, 2014 on the basis of the 2015 budget and forecasts for 2016-2019. Every year management draws up a five-year plan, by market and by business area, for each CGU. The discount rate (WACC) used to determine the present value of projected cash flows depends on the cost of money and the specific country risk of the business. The nominal growth rate (g rate) of projected cash flows not stated expressly in financial plans ranges from 1% to 3%. The specific forecast period does not exceed five years, with the exception of the CGUs of the Atlantia group, for which projections are based on business and financial plans developed for the full term of the concession period.

62 CONSOLIDATED FINANCIAL STATEMENTS AT DECEMBER 31, 2014
The results of impairment testing in 2014 are summarized in the following table which reports, by business segment and type of asset, the impairment losses recognized for the year:
(Thousands of Euro) Textiles & clothing Food & beverage Tavel retail
Infrastructures & services for
mobility Total
Property, plant and equipment
Buildings 1,071 837 556 - 2,464
Plant, machinery and equipment 922 2,861 688 13 4,484 Furniture, furnishings and electronic equipment 10,385 - 311 - 10,696
Leasehold improvements 4,736 2,080 - - 6,816
Other 81 4,356 - 2,807 7,244
Total property, plant and equipment 17,195 10,134 1,555 2,820 31,704
Intangible assets
Intangible assets of indefinite useful life - - - - -
Intangible assets of finite useful life 10,239 - - 41 10,280
Total intangible assets 10,239 - - 41 10,280
Total 27,434 10,134 1,555 2,861 41,984
3 Equity investments in subsidiaries
This item is made up of non-significant subsidiaries that are not included in the consolidation.
4 Equity investments in associates and joint-ventures
The main investments in associated companies and joint ventures are as follows: 12.31.2014 12.31.2013
(Thousands of Euro) % held Carrying value % held Carrying value
Eurostazioni S.p.A. 32.71% 49,220 32.71% 49,220
Società Autostrada Tirrenica p.A. 24.98% 28,268 24.98% 28,268
Rodovias do Tietê S.A. 50.00% 30,443 50.00% 33,898
Pune-Solapur Expressway Private Ltd. 50.00% 11,192 50.00% 10,146
Società Infrastrutture Toscane S.p.A. 46.59% 5,622 46.60% 5,794
Other investments - 13,298 - 18,871
Total 138,043 146,197 The change in the value of the investment in Rodovias do Tietê concerns capital contributions for Euro 4 million and the negative effect of its measurement using the equity method for Euro 8 million. The change in value of the other equity investments is due to their measurement using the equity method.
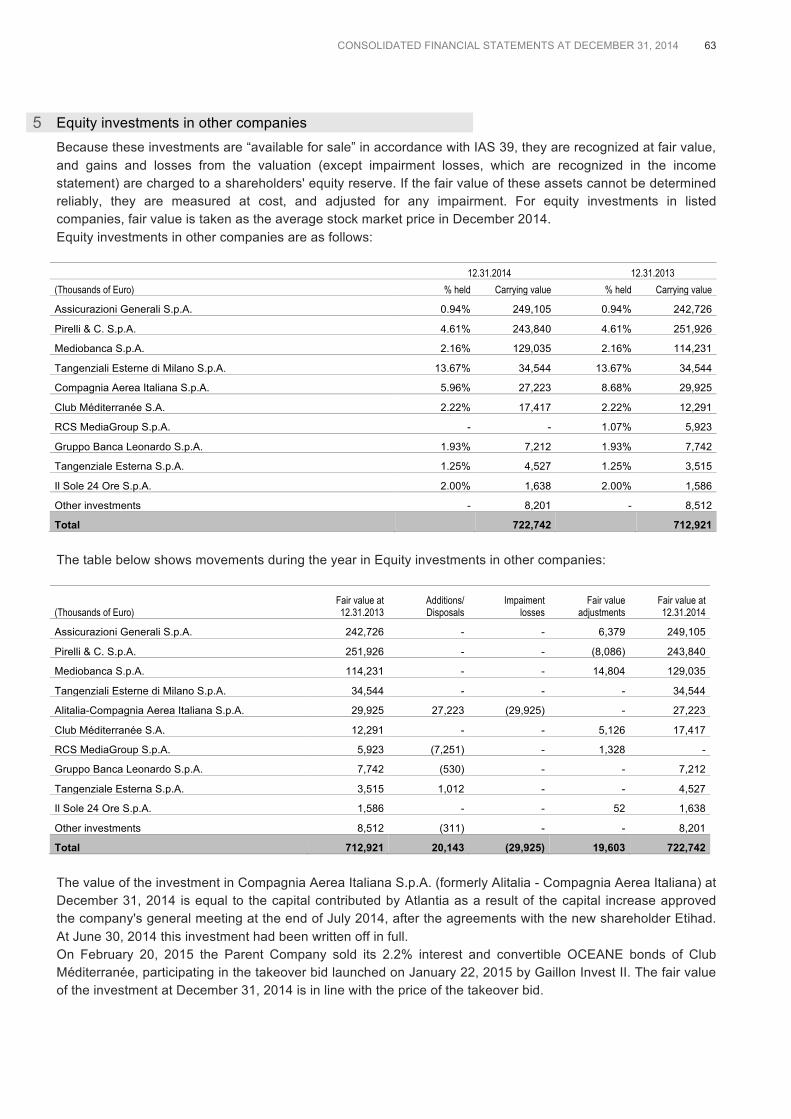
CONSOLIDATED FINANCIAL STATEMENTS AT DECEMBER 31, 2014 63
5 Equity investments in other companies
Because these investments are “available for sale” in accordance with IAS 39, they are recognized at fair value, and gains and losses from the valuation (except impairment losses, which are recognized in the income statement) are charged to a shareholders' equity reserve. If the fair value of these assets cannot be determined reliably, they are measured at cost, and adjusted for any impairment. For equity investments in listed companies, fair value is taken as the average stock market price in December 2014. Equity investments in other companies are as follows: 12.31.2014 12.31.2013 (Thousands of Euro) % held Carrying value % held Carrying value
Assicurazioni Generali S.p.A. 0.94% 249,105 0.94% 242,726
Pirelli & C. S.p.A. 4.61% 243,840 4.61% 251,926
Mediobanca S.p.A. 2.16% 129,035 2.16% 114,231
Tangenziali Esterne di Milano S.p.A. 13.67% 34,544 13.67% 34,544
Compagnia Aerea Italiana S.p.A. 5.96% 27,223 8.68% 29,925
Club Méditerranée S.A. 2.22% 17,417 2.22% 12,291
RCS MediaGroup S.p.A. - - 1.07% 5,923
Gruppo Banca Leonardo S.p.A. 1.93% 7,212 1.93% 7,742
Tangenziale Esterna S.p.A. 1.25% 4,527 1.25% 3,515
Il Sole 24 Ore S.p.A. 2.00% 1,638 2.00% 1,586
Other investments - 8,201 - 8,512
Total 722,742 712,921 The table below shows movements during the year in Equity investments in other companies:
(Thousands of Euro) Fair value at 12.31.2013
Additions/ Disposals
Impaiment losses
Fair value adjustments
Fair value at 12.31.2014
Assicurazioni Generali S.p.A. 242,726 - - 6,379 249,105
Pirelli & C. S.p.A. 251,926 - - (8,086) 243,840
Mediobanca S.p.A. 114,231 - - 14,804 129,035
Tangenziali Esterne di Milano S.p.A. 34,544 - - - 34,544
Alitalia-Compagnia Aerea Italiana S.p.A. 29,925 27,223 (29,925) - 27,223
Club Méditerranée S.A. 12,291 - - 5,126 17,417
RCS MediaGroup S.p.A. 5,923 (7,251) - 1,328 -
Gruppo Banca Leonardo S.p.A. 7,742 (530) - - 7,212
Tangenziale Esterna S.p.A. 3,515 1,012 - - 4,527
Il Sole 24 Ore S.p.A. 1,586 - - 52 1,638
Other investments 8,512 (311) - - 8,201
Total 712,921 20,143 (29,925) 19,603 722,742 The value of the investment in Compagnia Aerea Italiana S.p.A. (formerly Alitalia - Compagnia Aerea Italiana) at December 31, 2014 is equal to the capital contributed by Atlantia as a result of the capital increase approved the company's general meeting at the end of July 2014, after the agreements with the new shareholder Etihad. At June 30, 2014 this investment had been written off in full. On February 20, 2015 the Parent Company sold its 2.2% interest and convertible OCEANE bonds of Club Méditerranée, participating in the takeover bid launched on January 22, 2015 by Gaillon Invest II. The fair value of the investment at December 31, 2014 is in line with the price of the takeover bid.

64 CONSOLIDATED FINANCIAL STATEMENTS AT DECEMBER 31, 2014
In March 2014, the Parent Company completed the sale of its remaining 1.07% interest in RCS MediaGroup S.p.A. The shares were sold in the open market at an average price of Euro 1.60 each, for a intake of Euro 7.3 million and a capital loss of Euro 24.4 million, already recognized as an impairment loss on this investment in the 2013 financial statements.
6 Investment securities
The balance refers to investments in closed-end funds, held by the subsidiary Schemaquattordici S.p.A. for Euro 2,487 and by the Parent Company for Euro 19,693. These funds are measured at fair value at December 31, 2014. The Parent Company also owns 107,456 convertible Club Méditerranée bonds that were sold to Gaillon Invest II in February 2015. The fair value of those bonds at December 31, 2014 is in line with Gaillon's takeover bid.
7 Other non-current financial assets
The balance at the end of 2014 includes the following: (Thousands of Euro) 12.31.2014 12.31.2013
Non-current portion of financial assets deriving from concession rights 704,347 1,296,694
Convertible term deposits 291,189 332,745
Financial assets deriving from government grants related to construction services 215,023 247,481
Financial receivables from associates 448,106 347,566
Deposit to AENA - 22,230
Financial receivables from grantors 56,042 50,133
Other financial receivables and assets 45,765 61,374
Total 1,760,472 2,358,223 The Non-current portion of financial assets deriving from concession rights refers to the Atlantia group and includes: ! the present value of the minimum tolls guaranteed by the grantor of the concessions held by certain of the
group's Chilean motorways operators in accordance with the concession agreements (Euro 609,851); ! the financial assets attributable to the investments of the Chilean motorway operator Costanera Norte (Euro
94,496).
The change in this item with respect to the previous year is due essentially to the decrease in financial rights associated with the satellite-based tolling system for heavy vehicles in France (Écomouv' project), which were worth Euro 652,051 at the end of 2013. After the early termination of this project and under subsequent agreements with the French government, a portion of the financial assets deriving from concession rights (Euro 390,790) was offset by a matching portion of Écomouv’s medium/long-term borrowings, following their transfer to the French government, while the remaining portion was reclassified to Assets held for sale, Note 17. Convertible term deposits consist of the loans disbursed by banks for the construction of new infrastructure; they will be released and made available to the Atlantia group based on percentage of completion of these works. The change since 2013 reflects a reduction in the cash collateral guaranteeing Aeroporti di Roma’s bank borrowings and the bonds issued by Romulus Finance following voluntary early repayment, during the year, of these debts. Financial assets deriving from government grants related to construction services consist of amounts receivable from concession grantors, or other public entities, for grants accrued on the Atlantia group's construction of motorway infrastructure during the year.

CONSOLIDATED FINANCIAL STATEMENTS AT DECEMBER 31, 2014 65
Financial receivables from associates refer to the amount due to the subsidiary Atlantia Bertin Concessões from Infra Bertin Empreendimentos (the company in charge of constructing and managing the ring road southeast of São Paulo) to finance its investment plan. Of the change, Euro 52,754 refers to new loans and Euro 46,883 to capitalized interest. At December 31, 2013, the heading Deposit to AENA referred to the amortized cost of the security deposit paid by the World Duty Free group in February 2013 to the Spanish concession grantor, after winning a contract in December 2012 for duty-free and duty-paid shops and for the management until 2020 of airport retail operations at 26 airports in Spain. In accordance with the contracts signed with AENA, in February 2013 World Duty Free had also paid Euro 278 million plus VAT as an advance on the fees that would fall due over the life of the concession. The non-current portion of the present value of these amounts (Euro 252,632) was recognized under Other non-current receivables (Note 8), while the current portion (Euro 18,921) was listed under Other current receivables (Note 13). Financial receivables from concession grantors refer wholly to the non-current receivable due to Vespucio Sur, a member of the Atlantia group, by the concession grantor to compensate for lost toll revenue as a result of the concession's delayed start with respect to the date established in the contract. At December 31, 2014, Other financial receivables and assets include Euro 32,690 due from third parties and Euro 13,075 in Accrued income and prepaid expenses. At the end of 2013 they included convertible bonds issued by Alitalia (Euro 14,177), which in 2014 were written off in full, and the fair value of cash flow hedges and fair value hedges (Euro 11,735). Other non-current financial assets are broken down below by maturity (Thousands of Euro) 12.31.2014 12.31.2013
From 1 to 5 years 779,865 1,379,848
Beyond 5 years 980,607 978,375
Total 1,760,472 2,358,223
8 Other non-current receivables
This item, with a balance of Euro 101,949, pertains mostly to: ! the Schematrentanove group for trade receivables (Euro 28,512), security deposits (Euro 24,703), VAT
receivables (Euro 2,575) and amounts due for the sale of non-current assets (Euro 1,228); ! the Autogrill group for concession fees paid in advance (Euro 12,113) and security deposits (Euro 7,862); ! the Atlantia group for receivables from concession grantors (Euro 5,772) and security deposits (Euro 5,131).
At December 31, 2013 the balance included the receivables of the World Duty Free group (Euro 264,241), essentially comprised of leasing and concession fees paid in advance to the operators of the airports served by the group, of which Euro 252,632 to AENA, as commented upon at Note 8.

66 CONSOLIDATED FINANCIAL STATEMENTS AT DECEMBER 31, 2014
This item also includes public benefit contributions advanced by the Parent Company to the City of Venice, which deposited the sum (originally Euro 6 million) in an escrow account. Under the terms of the agreement, the Parent Company may ask for full and immediate reimbursement of the contribution, plus interest, if certain conditions are not satisfied. In 2014 the partial release of funds to the City of Venice was authorized in the amount of Euro 3 million.
9 Deferred tax assets
The nature and composition of net deferred tax assets are broken down below: (Thousands of Euro) 12.31.2014 12.31.2013
Tax effect on deductible intercompany goodwill 666,281 776,325
Tax effect on the adoption of IFRIC 12 519,690 540,415
Tax effect on provisions and costs relating to future periods for fiscal purposes 693,147 569,462
Tax effect on different basis for amortization, depreciation and impairment 192,559 208,566
Benefit on carried forward tax losses 156,889 189,800
Tax effect on intercompany profits elimination 4,520 8,950
Other deferred tax assets 435,139 310,435
Total deferred tax assets 2,668,225 2,603,953
Total offsettable deferred tax liabilities (631,599) (539,504)
Total deferred tax assets, net 2,036,626 2,064,449 For the sake of clarity, the following paragraphs describe separately the nature of tax assets generated by the Atlantia, Schematrentanove and Autogrill groups.
Atlantia group The balance of Euro 1,817,627 at December 31, 2014 is comprised mainly of residual deferred tax assets (Euro 666,281) arising from the transfer of motorway assets to Autostrade per l’Italia and that company's recognition of deductible goodwill, as well as deferred tax assets of Euro 519,690 originating from Autostrade per l’Italia's adoption of IFRIC 12, to be released throughout the life of the concession.
Schematrentanove group The balance of this item (Euro 163,318) is comprised mainly of deferred tax assets recognized on the different basis for the amortization and depreciation of fixed assets, measured according to the estimated future recoverability of the tax benefits, and of taxes recognized on costs, provisions and revenues deductible in future accounting periods. The potential tax benefit from the carried forward tax losses of group companies (Euro 281 million at December 31, 2014) has been adjusted to nearly zero because, at the present date, they are unlikely to be fully recovered.
Autogrill group The deferred tax assets of the Autogrill group (Euro 35,883) refer to: ! the French Food & beverage units for Euro 6,833 (Euro 11,845 at December 31, 2013), in connection chiefly
with the different amortization and depreciation periods for tax purposes; ! the Belgian companies for Euro 6,544 (Euro 5,059 at December 31, 2013), in relation to tax losses carried
forward.
At December 31, 2014, tax losses for which deferred tax assets have not been recognized amount to Euro 120,333. The corresponding unrecognized tax benefit comes to Euro 35,088.

CONSOLIDATED FINANCIAL STATEMENTS AT DECEMBER 31, 2014 67
CURRENT ASSETS
10 Inventories
Inventories are broken down below: (Thousands of Euro) 12.31.2014 12.31.2013
Raw materials, other materials and consumables 240,520 384,750
Work in progress and semi-manufactured products 37,817 43,973
Finished goods 312,425 286,700
Construction contracts in progress 20,090 26,754
Advances 26 2,216
Total 610,878 744,393 Inventories are stated net of the write-down provision of Euro 53,645 (Euro 52,060 at December 31, 2013), of which Euro 45,114 pertains to the Schematrentanove group. At the end of 2013, inventories included Euro 154,411 for the World Duty Free group.
11 Trade receivables
At December 31, 2014, trade receivables, net of the provision for doubtful accounts, were as follows: (Thousands of Euro) 12.31.2014 12.31.2013
Trade receivables 2,081,812 2,128,320
Provision for doubtful accounts (401,744) (419,307)
Total 1,680,068 1,709,013 Trade receivables include the contribution of the Schematrentanove group, Euro 424,867 (Euro 484,911 at December 31, 2013), and the Atlantia group, Euro 1,240,403 (Euro 1,201,505 at the close of 2013). With respect to the previous year, the Schematrentanove group reports a decrease in trade receivables due to lower indirect channel sales of the Spring/Summer and Fall/Winter 2014 collections, in conjunction with the net increase in the provision for doubtful accounts. The change in trade receivables for the Atlantia group is due essentially to a decrease of Euro 41,295 in the provision for doubtful accounts, including the use of Euro 27,684 by the subsidiary Aeroporti di Roma as a result of settlements agreed with customers. Movements in the provision for doubtful accounts are summarized below:
(Thousands of Euro) 01.01.2014 Additions Uses
Releases to statement of
income Reclassification
per IFRS 5
Other movements and translation
differences 12.31.2014 Provision for doubtful accounts 419,307 94,002 (56,430) (2,403) (2,115) (50,617) 401,744
At the end of the year, there were no receivables factored without recourse.

68 CONSOLIDATED FINANCIAL STATEMENTS AT DECEMBER 31, 2014
12 Tax receivables
This item includes: ! income tax credits of Euro 16,084 (Euro 52,956 at December 31, 2013); the reduction is due to the
deconsolidation of the World Duty Free group, which contributed Euro 13,019 at the end of 2013, and a decrease in credits for the Atlantia group;
! tax refunds due in the amount of Euro 61,815 (Euro 89,159 at December 31, 2013), in particular for the deduction of a portion of IRAP (regional tax) from IRES (corporate tax). Of the change since the previous year, Euro 12 million reflects a tax refund received by an Italian subsidiary.
13 Other current receivables, accrued income and prepayments
Other current receivables are detailed in the table below: (Thousands of Euro) 12.31.2014 12.31.2013
Other receivables
Advances paid to suppliers 141,042 105,734
Vat credits 70,357 91,531
Receivables due from motorway end-users and insurance companies for damages 33,325 34,801
Advances to employees and agents 6,044 7,453
Receivables due from social security institutions 5,799 4,898
Receivables from grantors 26,075 10,184
Other receivables 167,396 89,407
Total 450,038 344,008
Accrued income and prepaid expenses
Concession and leasing fees paid in advance 23,040 45,061
Rents and leases 13,063 13,305
Other accrued income and prepaid expenses 38,083 63,105
Total accrued icome and prepaid expenses 74,186 121,471
Total other receivables, accrued income and prepaid expenses 524,224 465,479 Advances paid to suppliers concern the Autogrill group for Euro 66,749, comprised of promotional contributions and bonuses awaiting settlement as well as amounts paid in advance for services; the Atlantia group for Euro 63,244, consisting of advances paid to awarders of contracts in the motorway and airport channels; and the Schematrentanove group for Euro 11,352. The decrease in VAT credits is attributable to the Atlantia group for about Euro 16 million. Receivables due from motorway end-users and insurance companies for damages refer to the reimbursement of damages caused to motorways. Other receivables were contributed mainly by: ! the Autogrill group (Euro 48,380, compared with Euro 31,722 at December 31, 2013) for amounts due from
sub-concession holders, advances to concession grantors for investments made on their behalf or on behalf of sub-concessionaires, and receivables from credit card companies;
! the Schematrentanove group for Euro 37,616 (Euro 19,105 the previous year), including other tax receivables, insurance receivables, and short-term security deposits. This item also includes Euro 11 million that a French subsidiary will receive in 2015 in connection with the sale of a property in Paris, and Euro 7.5

CONSOLIDATED FINANCIAL STATEMENTS AT DECEMBER 31, 2014 69
million due from the Serbian government in the form of a grant for investments planned by the Schematrentanove group at the manufacturing complex in Niš, Serbia. The portion of the grant, to be channeled to the Schematrentanove group's cooperating partners was deferred and recognized in current liabilities;
! the Atlantia group (for nearly all of the remaining balance), whose balance is Euro 67 million higher this year due essentially to advances paid to some suppliers, on the basis of a settlement agreement, and regarding contract reserves accounted for in connection with work on the upgrade of the section of the A1 Milan-Naples motorway that crosses the Apennines. These advances will be subject to final approval following a possible transaction or civil proceedings as a result of the technical investigation in progress.
This item is shown net of provisions for doubtful accounts (Euro 35,061), of which Euro 30,930 pertains to the Atlantia group. The provision relates chiefly to amounts pertained to Stalexport Autostrady by its associates, which are currently insolvent, and whose loans from the local authorities have therefore been repaid by the Polish company in its capacity as guarantor. Other accrued income and prepaid expenses refers to maintenance fees, insurance policies, advertising and sponsorship costs. At December 31, 2013 this item included Euro 28,207 as the current portion of the lease and concession fees paid in advance by the World Duty Free group to the operators of the airports served by the group (including Euro 18,921 to AENA, see Note 8).
14 Other current financial assets
This item is summarized as follows: (Thousands of Euro) 12.31.2014 12.31.2013
Current financial assets deriving from concession rights 428,933 413,067
Convertible term deposits 250,018 191,739
Financial assets deriving from government grants related to construction services 79,847 18,951
Financial receivables from Group companies 116,667 123,910
Financial receivables from third parties 56,189 52,116
Derivatives: fair value hedges 16,250 4,239
Derivatives: cash flow hedges 30,888 8,456
Accrued income on derivative transactions 48,455 21,681
Other financial accrued income and prepaid expenses 9,285 17,647
Total 1,036,532 851,806 Current financial assets deriving from concession rights, Convertible term deposits, and Financial assets deriving from government grants related to construction services consist of the current portion of the Atlantia group assets discussed in Note 8, Other non-current financial assets. Current financial assets deriving from concession rights consist mostly of the takeover rights of Autostrade Meridionali S.p.A. (Euro 401,716), due by the motorway operators that will take over the concession when it expires to compensate for investments carried out during the final years of the concession that have not yet depreciated. This heading also includes the current portion of the present value of the minimum guaranteed revenues that various Chilean motorway concession holders in the Atlantia group will receive from the grantor in accordance with the concession agreements (Euro 27,217).
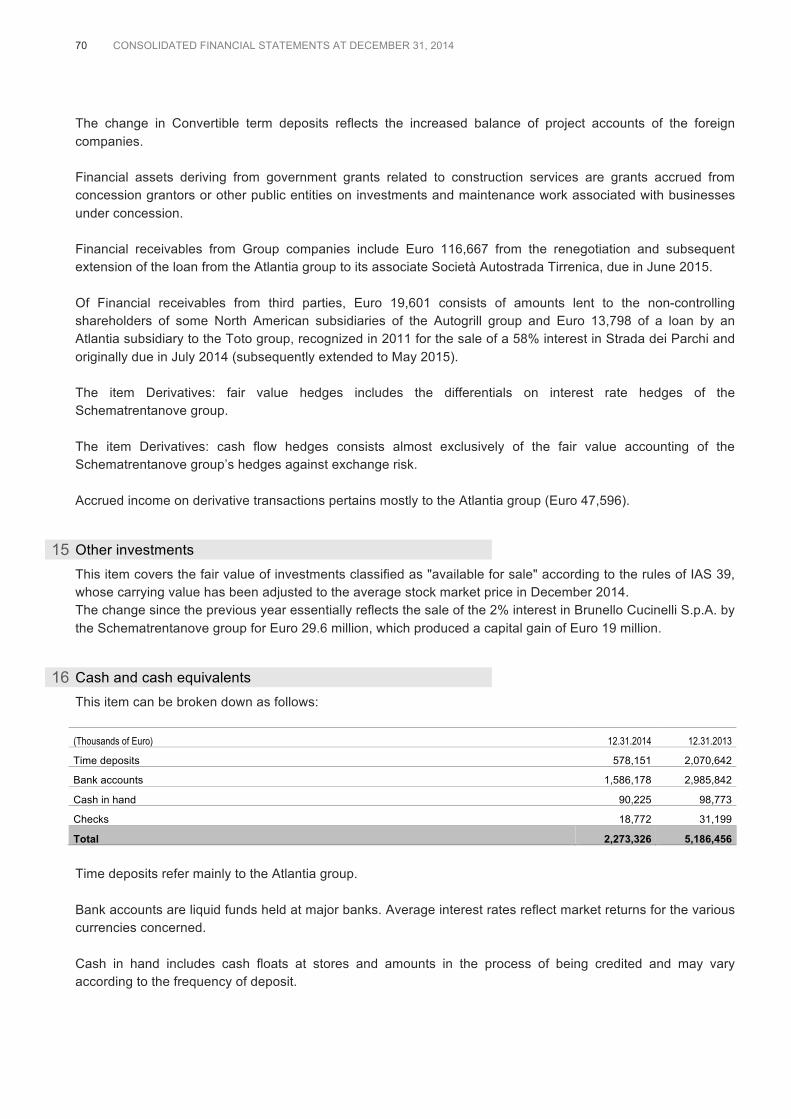
70 CONSOLIDATED FINANCIAL STATEMENTS AT DECEMBER 31, 2014
The change in Convertible term deposits reflects the increased balance of project accounts of the foreign companies. Financial assets deriving from government grants related to construction services are grants accrued from concession grantors or other public entities on investments and maintenance work associated with businesses under concession. Financial receivables from Group companies include Euro 116,667 from the renegotiation and subsequent extension of the loan from the Atlantia group to its associate Società Autostrada Tirrenica, due in June 2015. Of Financial receivables from third parties, Euro 19,601 consists of amounts lent to the non-controlling shareholders of some North American subsidiaries of the Autogrill group and Euro 13,798 of a loan by an Atlantia subsidiary to the Toto group, recognized in 2011 for the sale of a 58% interest in Strada dei Parchi and originally due in July 2014 (subsequently extended to May 2015). The item Derivatives: fair value hedges includes the differentials on interest rate hedges of the Schematrentanove group. The item Derivatives: cash flow hedges consists almost exclusively of the fair value accounting of the Schematrentanove group’s hedges against exchange risk. Accrued income on derivative transactions pertains mostly to the Atlantia group (Euro 47,596).
15 Other investments
This item covers the fair value of investments classified as "available for sale" according to the rules of IAS 39, whose carrying value has been adjusted to the average stock market price in December 2014. The change since the previous year essentially reflects the sale of the 2% interest in Brunello Cucinelli S.p.A. by the Schematrentanove group for Euro 29.6 million, which produced a capital gain of Euro 19 million.
16 Cash and cash equivalents
This item can be broken down as follows: (Thousands of Euro) 12.31.2014 12.31.2013
Time deposits 578,151 2,070,642
Bank accounts 1,586,178 2,985,842
Cash in hand 90,225 98,773
Checks 18,772 31,199
Total 2,273,326 5,186,456 Time deposits refer mainly to the Atlantia group. Bank accounts are liquid funds held at major banks. Average interest rates reflect market returns for the various currencies concerned. Cash in hand includes cash floats at stores and amounts in the process of being credited and may vary according to the frequency of deposit.

CONSOLIDATED FINANCIAL STATEMENTS AT DECEMBER 31, 2014 71
Checks reflect receipts from customers in the last few days of the year. Of the overall change in this item, Euro 2.5 billion relates to the redemption of bond loans by the Atlantia group.
17 Assets and liabilities held for sale
At December 31, 2014 and 2013 this item was made up as follows:
(Thousands of Euro) Atlantia group
(Ecomouv') World Duty Free
group Other assets 12.31.2014
Assets held for sale
Property, plant and equipment 1,570 1,375,194 5,544 1,382,308
Equity investments 16,510 - - 16,510
Financial assets 297,532 103,752 - 401,284
Deferred tax assets 2,829 11,025 - 13,854
Trading assets 157,616 233,377 - 390,993
Other assets 63,297 302,084 - 365,381
Total assets held for sale 539,354 2,025,432 5,544 2,570,330
(Thousands of Euro) Atlantia group
(Ecomouv') World Duty Free
group Other assets 12.31.2014
Liabilities held for sale
Financial liabilities 287,046 1,037,901 - 1,324,947
Trading liabilities 71,833 289,429 - 361,262
Other liabilities 64,362 203,705 - 268,067
Total liabilities held for sale 423,241 1,531,035 - 1,954,276 At the end of 2013 the balance consisted mainly of the Atlantia group's non-controlling interest in Lusoponte (Euro 12,239) and the receivables due from that company (Euro 1,643). It also included the residual 2% interest in Strada dei Parchi (Euro 4,271), subject to a put and call option with the Toto group, in accordance with the sale agreements signed in 2011. The following table shows the net total cash flows of discontinued operations, detailed for Atlantia group and World Duty Free group. (Thousands of Euro) xxxxxxxxxxxxxxx2014 xxxxxxxxxxxxxxxxx2013
Atlantia group World Duty Free
group Atlantia group World Duty Free
group Cash flow provided/(used) by operating activities (203,113) 163,111 34,810 (96,052) Cash flow provided/(used) by investing activities 429,308 (63,034) (283,046) (151,738) Cash flow provided/(used) by financing activities (210,592) (76,974) 266,639 253,319

72 CONSOLIDATED FINANCIAL STATEMENTS AT DECEMBER 31, 2014
COMMENTS ON SHAREHOLDERS' EQUITY ITEMS (All figures in thousands of Euro) The statements of financial position of the World Duty Free group at December 31, 2014 and of the Atlantia group companies connected to the Ecomouv’ Project weres reclassified under Assets/liabilities held for sale, Note 17. The changes in the scope in consolidation relate primarily to the Atlantia group’s deconsolidation of TowerCo S.p.A.
SHAREHOLDERS' EQUITY
Shareholders' equity attributable to the Parent Company On June 19, 2014, the annual general meeting of Edizione S.r.l. approved a dividend totalling Euro 42.8 million, paid during the course of the year.
18 Share capital
At December 31, 2014 the share capital of Edizione S.r.l. amounted to Euro 1,500 million, fully subscribed and paid in and divided into quotas.
19 Fair value and hedging reserve
This item reflects the changes arising from the fair value recognition of "available for sale" financial assets shown under current and non-current assets, as well as the changes in the effective hedging component of cash flow hedges.
20 Other reserves and retained earnings
Amounting to Euro 3,242,732 at the close of the year (Euro 3,303,998 at December 31, 2013), this item includes: ! Euro 15,448 for the Parent Company's legal reserve; ! Euro 1,005,566 for the Parent Company's other reserves; ! Euro 2,221,718 representing the shareholders' equity of consolidated companies in excess of their carrying
value, together with other consolidation entries.
21 Translation reserve
This reserve shows the effects of consolidating companies with financial statements in currencies other than the Euro using the line-by-line and proportional methods.
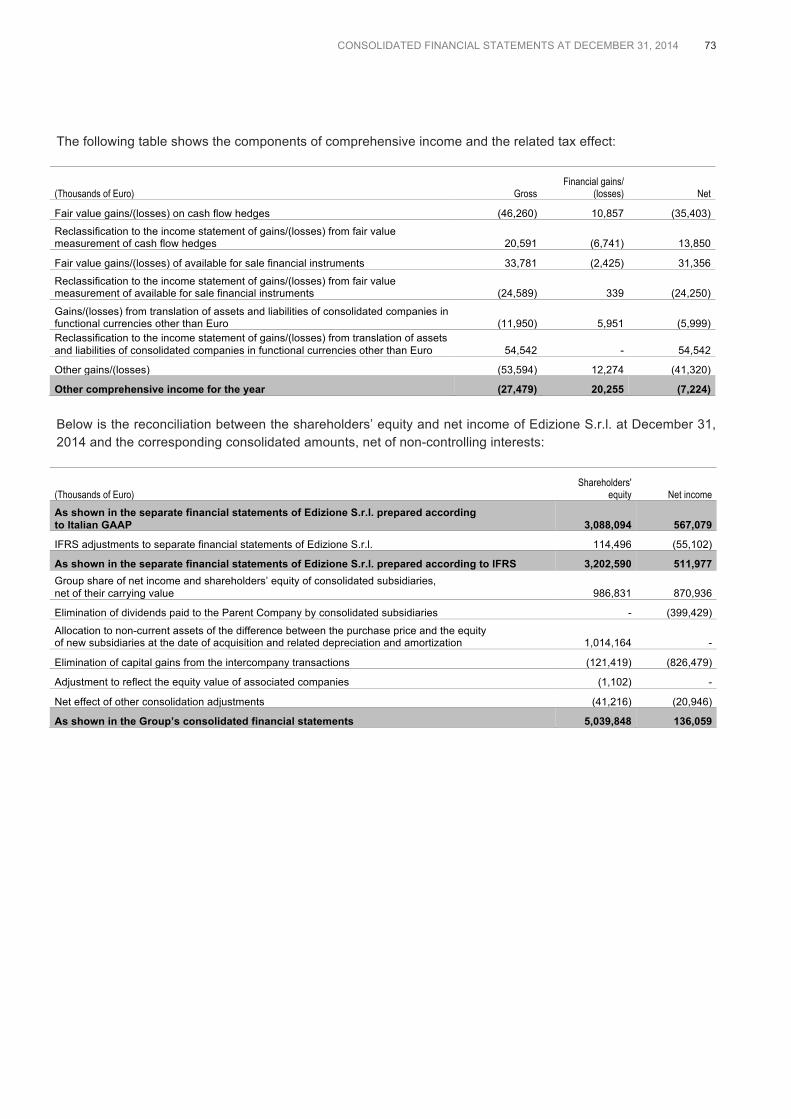
CONSOLIDATED FINANCIAL STATEMENTS AT DECEMBER 31, 2014 73
The following table shows the components of comprehensive income and the related tax effect:
(Thousands of Euro) Gross Financial gains/
(losses) Net
Fair value gains/(losses) on cash flow hedges (46,260) 10,857 (35,403)
Reclassification to the income statement of gains/(losses) from fair value measurement of cash flow hedges 20,591 (6,741) 13,850
Fair value gains/(losses) of available for sale financial instruments 33,781 (2,425) 31,356
Reclassification to the income statement of gains/(losses) from fair value measurement of available for sale financial instruments (24,589) 339 (24,250)
Gains/(losses) from translation of assets and liabilities of consolidated companies in functional currencies other than Euro (11,950) 5,951 (5,999) Reclassification to the income statement of gains/(losses) from translation of assets and liabilities of consolidated companies in functional currencies other than Euro 54,542 - 54,542
Other gains/(losses) (53,594) 12,274 (41,320)
Other comprehensive income for the year (27,479) 20,255 (7,224) Below is the reconciliation between the shareholders’ equity and net income of Edizione S.r.l. at December 31, 2014 and the corresponding consolidated amounts, net of non-controlling interests:
(Thousands of Euro) Shareholders'
equity Net income As shown in the separate financial statements of Edizione S.r.l. prepared according to Italian GAAP 3,088,094 567,079
IFRS adjustments to separate financial statements of Edizione S.r.l. 114,496 (55,102)
As shown in the separate financial statements of Edizione S.r.l. prepared according to IFRS 3,202,590 511,977 Group share of net income and shareholders’ equity of consolidated subsidiaries, net of their carrying value 986,831 870,936
Elimination of dividends paid to the Parent Company by consolidated subsidiaries - (399,429)
Allocation to non-current assets of the difference between the purchase price and the equity of new subsidiaries at the date of acquisition and related depreciation and amortization 1,014,164 -
Elimination of capital gains from the intercompany transactions (121,419) (826,479)
Adjustment to reflect the equity value of associated companies (1,102) -
Net effect of other consolidation adjustments (41,216) (20,946)
As shown in the Group’s consolidated financial statements 5,039,848 136,059

74 CONSOLIDATED FINANCIAL STATEMENTS AT DECEMBER 31, 2014
22 Non-controlling interests
At December 31, 2014 and 2013, non-controlling interests in the net equity of consolidated companies were as follows: (Thousands of Euro) 12.31.2014 12.31.2013
Atlantia group 5,246,915 5,209,874
Sintonia S.p.A. 1,297,997 1,219,514
Autogrill group 260,091 235,373
World Duty Free group 246,617 213,221
Schamtrentanove group 19,531 17,491
Schemaquattordici S.p.A. 1,243 3,196
Other companies and consolidation adjustments (27,816) (11,340)
Total 7,044,578 6,887,329 The increase in non-controlling interests in net equity is due to the improved results of non-wholly-owned subsidiaries.

CONSOLIDATED FINANCIAL STATEMENTS AT DECEMBER 31, 2014 75
COMMENTS ON LIABILITY ITEMS (All figures in thousands of Euro)
NON-CURRENT LIABILITIES
23 Bonds
Bonds amount to Euro 10,938,735 for the non-current portion (Euro 10,747,228 at December 31, 2013) and Euro 162,887 for the current portion (Euro 2,483,266 at December 31, 2013). Bonds are broken down below by group and by current and non-current share:
12.31.2014 12.31.2013
Current portion Non-current
portion Current portion Non-current
portion
Atlantia group 162,887 10,330,706 2,483,266 10,191,219
Autogrill group - 415,800 - 367,706
Schematrentaquattro S.p.A. - 192,229 - 188,303
Total 162,887 10,938,735 2,483,266 10,747,228 For the Atlantia group, most of the change in the current portion reflects the repayments made in the year relating to a bond loan of Atlantia for a nominal amount of Euro 2,094,200 and tranches A2 and A3 (Euro 375,000) of the "Romulus" bonds issued by Aeroporti di Roma.
24 Medium and long-term loans
This item consists of loans from credit institutions and payables to other lenders. The following table shows the current and non-current portions for each group:
12.31.2014 12.31.2013
Current portion Non-current
portion Current portion Non-current
portion
Atlantia group 406,808 3,134,406 682,341 3,758,474
Autogrill group - 330,842 - 362,561
World Duty Free group - - 50,000 982,519
Schematrentanove group 221,070 2,681 54,606 320,569
Edizione S.r.l. - - 597 103,492
Sintonia S.p.A. - - 770,005 -
Other companies 10,069 2,739 9,241 4,975
Total 637,947 3,470,668 1,566,790 5,532,590 Medium and long-term loans from credit institutions amount to Euro 3,412,152 for the non-current portion (Euro 5,388,726 at December 31, 2013) and Euro 574,619 for the current portion (Euro 1,558,676 the previous year). Excluding the loans of the World Duty Free group (Euro 983 million), recognized under Liabilities held for sale (Note 17), the non-current portion decreased in 2014 due essentially to the reclassification to the current portion of some loans held by the Atlantia group (Euro 545 million) and the Schematrentanove group (Euro 220 million) and to the prepayment of credit lines by the Parent Company (Euro 110 million) and the Schematrentanove group (Euro 99 million).

76 CONSOLIDATED FINANCIAL STATEMENTS AT DECEMBER 31, 2014
The non-current portion of medium and long-term loans from credit institutions is broken down below by maturity: Year 12.31.2014
2016 525,672
2017 229,048
2018 194,067
2019 202,820
2020 and beyond 2,260,545
Total 3,412,152 Loans from other lenders amount to Euro 58,516 for the non-current portion (Euro 143,864 at December 31, 2013) and Euro 63,328 for the current portion (Euro 8,114 the previous year).
25 Other non-current liabilities
This item can be broken down as follows: (Thousands of Euro) 12.31.2014 12.31.2013
Long-term deferred income 63,674 61,119
Payables to social security institutions 11,175 9,173
Payables to personnel 12,055 12,560
Payables to concession grantors 24,640 31,025
Other payables to third parties 14,178 38,681
Total 125,722 152,558 Long-term deferred income concerns investments to be carried out for contractual obligations (Euro 23,012) and other non-commercial deferred income (Euro 40,662) of the Atlantia group. Payables to social security institutions essentially refer to the Autogrill group and consist of the liability for defined contribution plans. Payables to personnel principally concern the Autogrill and Atlantia groups, reflecting the non-current portion of amounts due under long-term incentive plans. Other payables to third parties include security deposits received by the Schematrentanove group (Euro 6,245). At December 31, 2013, this heading also included the value attributed to the put options held by non-controlling investors of Schematrentanove group subsidiaries, now reclassified to current liabilities.
26 Lease financing
The Group has acquired properties, machinery, and other assets using lease financing. Payables to leasing companies are guaranteed to the lessor by virtue of rights on the leased assets.
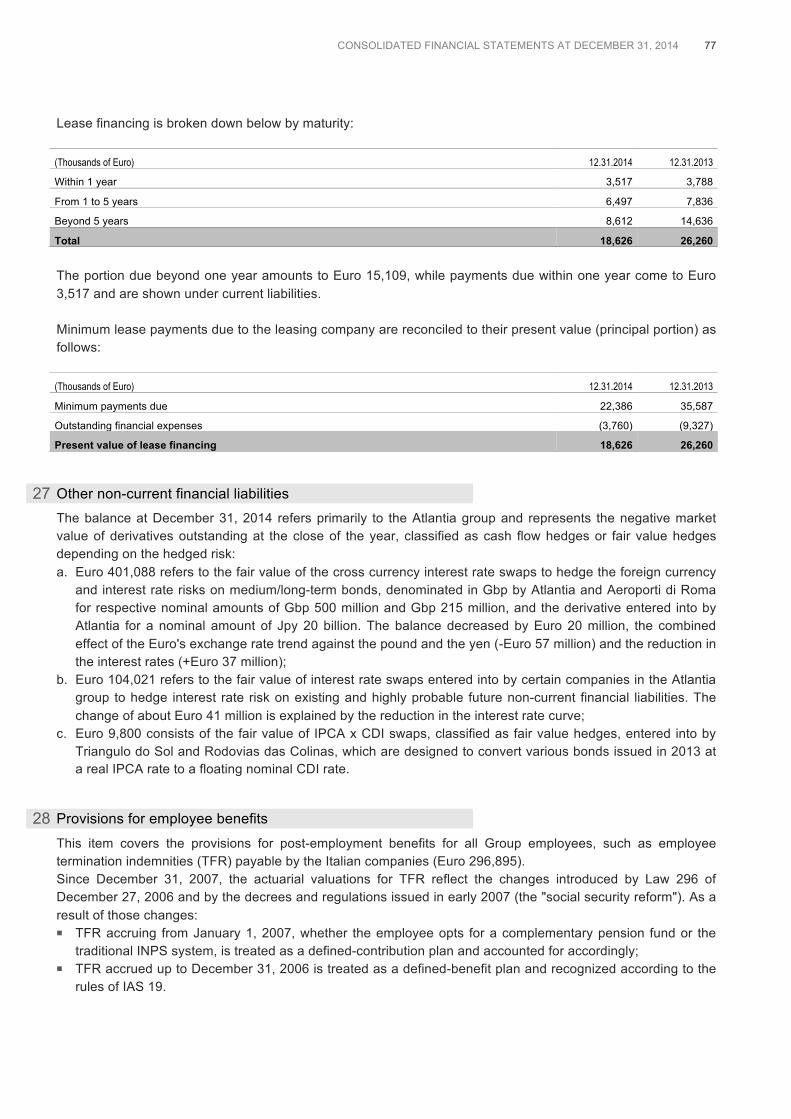
CONSOLIDATED FINANCIAL STATEMENTS AT DECEMBER 31, 2014 77
Lease financing is broken down below by maturity: (Thousands of Euro) 12.31.2014 12.31.2013
Within 1 year 3,517 3,788
From 1 to 5 years 6,497 7,836
Beyond 5 years 8,612 14,636
Total 18,626 26,260 The portion due beyond one year amounts to Euro 15,109, while payments due within one year come to Euro 3,517 and are shown under current liabilities. Minimum lease payments due to the leasing company are reconciled to their present value (principal portion) as follows: (Thousands of Euro) 12.31.2014 12.31.2013
Minimum payments due 22,386 35,587
Outstanding financial expenses (3,760) (9,327)
Present value of lease financing 18,626 26,260
27 Other non-current financial liabilities
The balance at December 31, 2014 refers primarily to the Atlantia group and represents the negative market value of derivatives outstanding at the close of the year, classified as cash flow hedges or fair value hedges depending on the hedged risk: a. Euro 401,088 refers to the fair value of the cross currency interest rate swaps to hedge the foreign currency
and interest rate risks on medium/long-term bonds, denominated in Gbp by Atlantia and Aeroporti di Roma for respective nominal amounts of Gbp 500 million and Gbp 215 million, and the derivative entered into by Atlantia for a nominal amount of Jpy 20 billion. The balance decreased by Euro 20 million, the combined effect of the Euro's exchange rate trend against the pound and the yen (-Euro 57 million) and the reduction in the interest rates (+Euro 37 million);
b. Euro 104,021 refers to the fair value of interest rate swaps entered into by certain companies in the Atlantia group to hedge interest rate risk on existing and highly probable future non-current financial liabilities. The change of about Euro 41 million is explained by the reduction in the interest rate curve;
c. Euro 9,800 consists of the fair value of IPCA x CDI swaps, classified as fair value hedges, entered into by Triangulo do Sol and Rodovias das Colinas, which are designed to convert various bonds issued in 2013 at a real IPCA rate to a floating nominal CDI rate.
28 Provisions for employee benefits
This item covers the provisions for post-employment benefits for all Group employees, such as employee termination indemnities (TFR) payable by the Italian companies (Euro 296,895). Since December 31, 2007, the actuarial valuations for TFR reflect the changes introduced by Law 296 of December 27, 2006 and by the decrees and regulations issued in early 2007 (the "social security reform"). As a result of those changes: ! TFR accruing from January 1, 2007, whether the employee opts for a complementary pension fund or the
traditional INPS system, is treated as a defined-contribution plan and accounted for accordingly; ! TFR accrued up to December 31, 2006 is treated as a defined-benefit plan and recognized according to the
rules of IAS 19.

78 CONSOLIDATED FINANCIAL STATEMENTS AT DECEMBER 31, 2014
Movements during the year in the present value of post-employment benefit obligations were as follows: (Thousands of Euro)
Present value of obligation at 01.01.2014 320,295
Service cost 10,316
Financial expenses/(income) 7,712
Actuarial losses/(gains) 29,980
Contributions paid by the Group and by employees (6,510)
Indemnities paid (23,672)
Translation differences 2,946
Change in scope of consolidation (21,810)
Other movements 19,915
Present value of obligation at 12.31.2014 339,172 Of the total, Euro 189,701 refers to termination indemnities (TFR) for the Italian companies in the Atlantia group. The Autogrill group accounts for Euro 101,836, with Euro 66,046 pertaining to termination indemnities of Italian companies. The amount for the Schematrentanove group is Euro 43,878, including Euro 37,884 in TFR for Italian personnel. Certain companies in the Autogrill group also recognize the fair value of financial assets held to service defined benefit plans, consisting of equity instruments, bonds, real estate, other securities and debt instruments issued by third parties. These plan assets, shown net of the amount of the obligation, at December 31, 2014 amounted to Euro 77,263. The table below summarizes the main financial and actuarial assumptions used to calculate post-employment benefits:
12.31.2014
Discounting rate 0.2% - 2.4%
Inflation rate 1.5% - 2%
Expected rate of salary increases 0.8% - 2.5%
The wide range for some of the above assumptions is explained by differences in the countries where the Group operates.
29 Deferred tax liabilities
This item refers chiefly to the Atlantia group (Euro 1,971,818) and the Autogrill group (Euro 37,418) and covers deferred tax liabilities that cannot be offset by deferred tax assets. They consist mainly of temporary differences arising from acquisitions by Group companies. At December 31, 2013 the balance included Euro 63,939 for the World Duty Free group.

CONSOLIDATED FINANCIAL STATEMENTS AT DECEMBER 31, 2014 79
30 Other non-current provisions and liabilities
The table below summarizes movements during the year:
For a better understanding of the changes in these provisions, details of their overall composition, including the current portion, are provided below. At December 31, 2014, Provisions for risk totalled Euro 180,698. The Atlantia group contributed Euro 137,491 to this item (current portion: Euro 78,477), representing the estimated charges to be incurred in connection with pending litigation, including those with contractors regarding contract reserves. Euro 34,387 pertains to the Autogrill group (current portion: Euro 9,120) and is detailed as follows: ! a self-insurance provision (Euro 27,842) to cover the excess on third-party liability provided for in insurance
plans; ! provisions for legal disputes (Euro 3,977) involving the Autogrill group, which take account of the opinions of
its legal advisors.
The Schematrentanove group's contribution of Euro 7,229 (current portion: Euro 5,811) relates to provisions made for legal disputes. The Provision for sales agent indemnities reflects the estimated liability for the termination of contracts held by Schematrentanove group sales representatives in the cases envisaged by law. The Provision for other expenses, totalling Euro 85,730, pertains to the Autogrill group for Euro 11,102 (current portion: Euro 2,756), the Schematrentanove group for Euro 58,361 (current portion: Euro 37,300) and the Atlantia group for Euro 16,265 (current portion: Euro 4,561). The balance at December 31, 2014 for the Autogrill group includes: ! a provision for the refurbishment of third party assets (Euro 6,117), representing estimated liabilities for
ensuring that leased assets are returned in the contractually agreed condition; ! provisions for onerous contracts (Euro 2,101), relating to loss-making contracts for commercial units whose
earnings are not sufficient to cover the amount of the lease; ! a tax risk provision (Euro 2,884), referring mostly to disputes over the US subsidiaries’ direct and indirect
taxation.
The amount for the Schematrentanove group includes a provision of Euro 3,806 concerning a residual tax dispute over the deductability of certain costs for commissions paid to agents resident in low-tax jurisdictions in 2003, as well as a probable dispute with the Tunisian authorities over the method of taxing certain financial income received by the subsidiary. It also includes provisions for the reorganization plan and estimated costs for the closure of some directly operated stores.
(Thousands of Euro) Prov isions for riskProv ision for sales
agent indemnitiesProv ision for other
ex penses
Prov isions for repair and replacement of
motorw ay infrastructure assets
Prov isions for refurbishment of
airport infrastructureTotal non-current
portion Prov isions for riskProv ision for other
ex penses
Prov isions for the repair and
replacement of motorw ay
infrastructure assets
Prov isions for the refurbishment of
airport infrastructureTotal current
portion
Balance at 01.01.2014 89,268 19,407 37,012 859,722 180,384 1,185,793 98,388 26,594 253,609 107,130 485,721
Provisions 2,109 1,203 18,513 575,225 105,158 702,208 37,354 38,747 - - 76,101
Uses (10,084) (4,507) (1,902) - - (16,493) (19,861) (3,221) - - (23,082)Released to statement of income (2,288) (90) (2,961) - - (5,339) (8,400) (2,877) (359,029) (85,927) (456,233)Reclassif ication to discontinued operations (IFRS5)
(755) - (10,644) - - (11,399) (2,231) (17,591) - - (19,822)Other movements and translation differences 9,040 (304) 1,094 (405,633) (128,735) (524,538) (11,842) 2,966 435,301 138,314 564,739 Balance at 12.31.2014 87,290 15,709 41,112 1,029,314 156,807 1,330,232 93,408 44,618 329,881 159,517 627,424
Non-current portion Current portion

80 CONSOLIDATED FINANCIAL STATEMENTS AT DECEMBER 31, 2014
Provisions for the repair and replacement of motorway infrastructure assets (Euro 1,359,195) refer entirely to the Atlantia group and cover the estimated cost of repairing or replacing assets held under concession in accordance with the concession arrangements between the group's motorway operators and the grantors of those concessions. The Provisions for the refurbishment of airport infrastructure (Euro 316,324) concerns companies in the Aeroporti di Roma group and covers the present value of estimated future expenses for extraordinary maintenance, repairs and replacements in accordance with the terms and conditions of the Aeroporti di Roma concession arrangement.
31 Provisions for construction services required by contract
These provisions represent the present value of the motorway infrastructure construction/upgrading services that some operators in the Atlantia group, in particular Autostrade per l’Italia, have to provide and for which they will not receive additional economic benefits in terms of specific tariff increases and/or a substantial rise in expected traffic. An allocation is made yearly to reflect the change in present value of the investment commitments and the financial and planning effects of revised timing estimates; the provisions are reduced in proportion to the work without additional benefits actually completed during the year, net of grants receivable. The table below presents balances at the beginning and end of 2014 and movements during the year, broken down by current/non-current portion. The increase in these provisions is essentially the combined effect of: a. the revised estimate of the present value of construction services to be rendered in the future (increase of
Euro 457,757), with a corresponding increase in the recognized value of concession rights. This change reflects the reduction in the current and prospective interest rates used to discount provisions at the end of 2014;
b. the provision for the time value of money (Euro 72,108), recognized in 2014 as a contra-entry to financial discounting expenses in the consolidated income statement;
c. utilizations for investments in works without additional economic benefits carried out during the year (Euro 406,613, net of Euro 34,582 in contributions).
(Thousands of Euro)Balance at
01.01.2014 Non-current Current
Changes due to rev ised present
v alue obligationsFinancial
prov isionsReduction for
completed w orks
Grants accrued on completed
w orksTranslation differences
Balance at 12.31.2014 Current Non-current
Provisions for construction services required by contract 4,162,036 3,728,446 433,590 457,757 72,108 (441,195) 34,582 (2,213) 4,283,075 3,783,956 499,119

CONSOLIDATED FINANCIAL STATEMENTS AT DECEMBER 31, 2014 81
CURRENT LIABILITIES
32 Trade payables
These represent the Group’s liabilities for the purchase of goods and services, including the Atlantia group's tolls in the process of settlement (Euro 93,331) and payables to operators of interconnecting motorways (Euro 525,344). At December 31, 2013 the balance included Euro 235,495 for the World Duty Free group.
33 Other payables, accrued expenses and deferred income
This item is summarized as follows: (Thousands of Euro) 12.31.2014 12.31.2013
Other payables
Payables to personnel 178,125 173,477
Other tax payables 127,447 115,954
Payables for the purchase of fixed assets 96,816 91,228
Payables to social security institutions 98,426 99,961
Payables to grantors 99,826 90,308
Guarantee deposits from users who pay by direct debit 56,121 59,312
Payable to expropriated companies 43,608 37,742
VAT payables 40,490 57,396
Amounts payable to public entities 17,268 27,899
Payables for long-term incentive plans 24,763 25,935
Other payables to third parties 111,951 94,242
Total other payables 894,841 873,454
Accrued expenses and deferred income
Leases and rentals 18,484 15,931
Other 59,285 80,288
Total accrued expenses and deferred income 77,769 96,219
Total other payables, accrued expenses and deferred income 972,610 969,673 Payables to personnel concern amounts accrued and not paid at December 31, 2014. The change in Other tax payables refers to the subsidiary Aeroporti di Roma and derives from the new tax established by the Region of Lazio (IRESA) that carriers have to pay to airport handling companies, which turn them over periodically to the region. Payables for the purchase of fixed assets refer to the retail network, manufacturing division and information technology of the Schematrentanove group (Euro 14,473) and to amounts payable in connection with investments by the Autogrill group (Euro 82,481). Payables to social security institutions consist of contributions due from Group companies and employees.

82 CONSOLIDATED FINANCIAL STATEMENTS AT DECEMBER 31, 2014
Payables to grantors, Payables to expropriated companies, Guarantee deposits from users who pay by direct debt, and Payables to public entities are due by companies in the Atlantia group. Payables to public entities decreased due to Aeroporti di Roma's payment of the fees due for 2013 and 2014 for the fire fighting service. Other payables to third parties include amounts due to directors and statutory auditors, amounts due to insurance companies, and the liability representing the valuation of put options held by minority shareholders of Schematrentanove group subsidiaries. Accrued expenses and deferred income refer mainly to insurance premiums, lease installments and utilities pertaining to the subsequent year and include Euro 12,217 in deferred income relating to the grant received from the Serbian government for the construction by the Schematrentanove group of the new manufacturing complex in Niš, Serbia. At December 31, 2013 this item included Euro 88,945 for the World Duty Free group.
34 Current income tax liabilities
Current income tax liabilities represent the amount payable by the Group for current year income tax, stated net of taxes paid in advance, tax credits and withholding taxes.
35 Other current financial liabilities
Details are as follows: (Thousands of Euro) 12.31.2014 12.31.2013
Financial accrued expenses and deferred income 359,471 382,656
Derivatives: cash flow hedges 6,071 44,752
Derivatives: fair value hedges 6,829 23,007
Financial payables to Group companies 112 13,635
Financial payables due to other companies 14,561 166,488
Total 387,044 630,538 Financial accrued expenses and deferred income are made up mostly of accrued expenses and deferred income on bonds and loans (Euro 316,757) and of accrued expenses on derivative transactions (Euro 42,713). Derivatives: cash flow hedges refer to the fair value recognition of derivatives involved in interest rate and exchange rate hedging transactions. The change is due to the termination of hedging contracts by the subsidiary Sintonia S.p.A. and the Parent Company, whose fair values at December 31, 2013 were Euro 31,344 and Euro 8,883, respectively. Derivatives: fair value hedges represent the differentials on forward exchange contracts arising from the fair value measurement of hedges outstanding at December 31, 2014 in relation to exchange rate risk. The closing balance refers almost entirely to the Schematrentanove group (Euro 4,752). At December 31, 2013, Financial payables to Group companies included a negative current account balance of Euro 13,508 with Società Autostrada Tirrenica p.A., an associate of the Atlantia group.
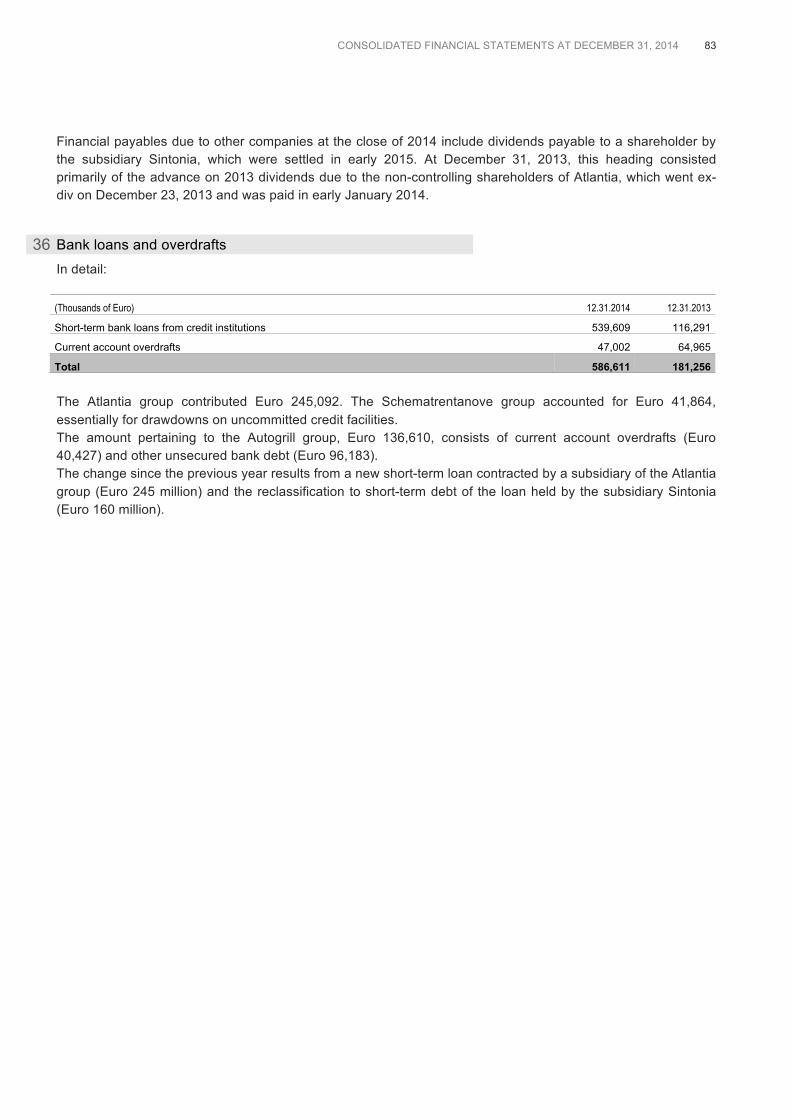
CONSOLIDATED FINANCIAL STATEMENTS AT DECEMBER 31, 2014 83
Financial payables due to other companies at the close of 2014 include dividends payable to a shareholder by the subsidiary Sintonia, which were settled in early 2015. At December 31, 2013, this heading consisted primarily of the advance on 2013 dividends due to the non-controlling shareholders of Atlantia, which went ex-div on December 23, 2013 and was paid in early January 2014.
36 Bank loans and overdrafts
In detail: (Thousands of Euro) 12.31.2014 12.31.2013
Short-term bank loans from credit institutions 539,609 116,291
Current account overdrafts 47,002 64,965
Total 586,611 181,256 The Atlantia group contributed Euro 245,092. The Schematrentanove group accounted for Euro 41,864, essentially for drawdowns on uncommitted credit facilities. The amount pertaining to the Autogrill group, Euro 136,610, consists of current account overdrafts (Euro 40,427) and other unsecured bank debt (Euro 96,183). The change since the previous year results from a new short-term loan contracted by a subsidiary of the Atlantia group (Euro 245 million) and the reclassification to short-term debt of the loan held by the subsidiary Sintonia (Euro 160 million).

84 CONSOLIDATED FINANCIAL STATEMENTS AT DECEMBER 31, 2014
COMMENTS ON INCOME STATEMENT ITEMS (All figures in thousands of Euro) In accordance with IFRS 5 the contribution of the Atlantia group companies connected to the Ecomouv’ Project, of TowerCo and the World Duty Free group was recognized in a single line of the income statement, Profit/(loss) from assets held for sale and discontinued operations, Note 57, in both 2014 and the comparison period.
37 Revenues
Revenues are broken down by type as follows: (Thousands of Euro) 2014 2013
Net sales 6,123,555 6,189,329
Tolls 3,677,628 3,539,300
Aviation revenues 519,979 34,236
Royalties 256,513 190,463
Other revenues 322,389 224,118
Total 10,900,064 10,177,446 Most of the change in Net sales concerned the Autogrill group (decrease of Euro 84 million) and the Schematrentanove group (increase of Euro 35 million). In 2013, the revenues of the Autogrill group included sales for the first nine months by the US Retail segment, which was sold in September 2013 to the World Duty Free group. This segment's contribution to consolidated results has been recognized for both years under Profit/(loss) from discontinued operations (see Note 57). Tolls amounted to Euro 3,678 million and rose by Euro 138 million on 2013. Excluding the negative impact of exchange rates (Euro 50 million), toll revenues grew by Euro 188 million due essentially to the application of annual toll increases from January 1, 2014 for the Italian concession holders (Euro 115 million), a 1% increase in traffic on Italian motorways (Euro 28 million), and higher toll revenues for the Group's foreign concession holders (Euro 43 million). Aviation revenues include the full-year contribution of the Aeroporti di Roma group companies (December only in 2013). Most Royalties pertain to the Atlantia group and include fees paid by the sub-concession holders that operate motorway and airport service areas. The increase on the previous year reflects the full-year contribution of the Aeroporti di Roma group. Other revenues consist of the Telepass and Viacard income of the Atlantia group (Euro 127,466), sundry airport management revenues, and income from various services such as subcontracting and the development of advertising campaigns. For this item as well, the increase relates to the fact that the Aeroporti di Roma group was consolidated for 12 months in 2014 and one month the previous year.

CONSOLIDATED FINANCIAL STATEMENTS AT DECEMBER 31, 2014 85
Revenues by business segment are shown below: (Thousands of Euro) 2014 2013
Food & beverage 4,461,423 4,545,919
Infrastructures & services for mobility 4,762,407 3,986,234
Textiles & clothing 1,632,900 1,601,865
Other sectors 43,334 43,428
Total 10,900,064 10,177,446 The following table shows revenues by geographical area: (Thousands of Euro) 2014 2013
Italy 6,459,314 5,755,795
Rest of Europe 1,660,477 1,575,519
Americas 2,416,190 2,513,307
Rest of the world 364,083 332,825
Total 10,900,064 10,177,446 See the Directors' Report for further information.
38 Revenues from construction services
In detail: (Thousands of Euro) 2014 2013 Concession rights accruing from construction services for which additional economic benefits are received 446,269 422,607
Government grants for services for which additional economic benefits are not received 34,582 22,548
Revenue from investment in financial assets deriving from concession rights 49,651 38,136
Services provided by sub-operators 4,254 -
Total 534,756 483,291 This item presents the value of construction services for which additional economic benefits are received, provided during the year by Atlantia group companies. In keeping with IFRIC 12, the Atlantia group recognizes as revenues from construction services the consideration due for services rendered, which it measures at fair value based on total costs incurred, comprised of operating costs and financial charges. In particular, there was a significant difference in the contribution of the Aeroporti di Roma group: Euro 70,887 in 2014 and Euro 2,290 the previous year. In 2014 the Atlantia group performed additional construction services for which no additional economic benefits are received, amounting to Euro 406,613, for which the group made use of a portion of the Provisions for construction services required by contract (Note 31). For this kind of activity, in accordance with IFRIC 12, Atlantia recognizes as Revenues from construction services only the government grants accrued on these works (Euro 34,582), while the amount of investments realized, net of those grants, is recognized in Note 45 (Use of provisions for construction services required by contract) and comes to Euro 441,195.

86 CONSOLIDATED FINANCIAL STATEMENTS AT DECEMBER 31, 2014
39 Other revenues and operating income
This item is detailed in the following table: (Thousands of Euro) 2014 2013
Capital gains on disposal of fixed assets 87,764 216,959
Rents 74,776 81,916
Promotional contributions by suppliers 47,609 51,527
Reimbursement of costs by third parties 52,438 52,094
Commisions on premium product sales 23,417 24,484
Release of provisions 19,022 10,950
Affiliation fees 2,661 2,662
Impairment reversals 12,118 -
Other operating income 134,283 111,357
Total 454,088 551,949 Capital gains on disposal of non-current assets pertain to the Schematrentanove group for Euro 83,368, mostly for the sale of a property in Paris. In 2013 these amounted to Euro 213,573 for the Schematrentanove group, for the sale of two commercial properties in Rome and Tokyo. Rents refer mainly to income from commercial premises used for the sale of Benetton label products (Euro 61,575), leasing instalments for companies in the Autogrill group (Euro 7,867), and the leasing of properties classified as investment property (Euro 2,384). Reimbursement of costs by third parties includes Euro 44,975 for the Atlantia group and refers to refunds and indemnities received. Impairment reversals concern the concession rights of the Atlantia group. The heading Other operating income covers the sublease of parts of commercial units, contingent income, operating grants and miscellaneous income.
40 Purchases of raw materials and consumables
The change in this item (Euro 41,436) pertains to the Atlantia group for Euro 112,138, due to an increase in the cost of materials for construction work carried out mostly in Brazil and Italy. The decrease for the Autogrill group (Euro 60,740) reflects the downturn in sales revenues. The decrease for the Schematrentanove group amounts to Euro 16,328.

CONSOLIDATED FINANCIAL STATEMENTS AT DECEMBER 31, 2014 87
41 Payroll costs
This item is broken down as follows: (Thousands of Euro) 2014 2013
Wages and salaries 1,777,300 1,716,399
Social security charges 431,020 410,709
Directors’ emoluments 16,468 14,362
Provision for employee termination indemnities and similar 10,105 2,735
Other payroll costs 144,808 129,896
Total 2,379,701 2,274,101 Other payroll costs concern the Autogrill group for Euro 106,518, in connection with long-term incentives, health insurance and other benefits, and the Atlantia group for Euro 33,943, and include bonuses, leaving incentives and the cost of seconded personnel. The following table shows the average number of employees by business segment in terms of equivalent full-time employees: FTE 2014 2013
Food & beverage 40,128 41,646
Infrastructures & services for mobility 13,661 11,428
Textiles & clothing 9,429 9,114
Other sectors 529 537
Total 63,747 62,725
42 Costs of services
Details are as follows: (Thousands of Euro) 2014 2013
Construction and similar 638,689 617,814
Maintenance costs 284,873 190,035
Utilities 159,568 166,783
Subcontracted work 127,554 126,200
Consultants’ fees (Tax & Legal) 106,649 113,686
Transport and distribution 101,711 109,452
Cleaning and disinfestation 72,633 61,041
Advertising and promotion 72,003 65,354
Sales commissions 68,715 75,136
Banking services 45,688 45,008
Professional and technical services 37,561 40,429
Insurance 35,132 32,116
Travel expenses and accommodation 33,460 35,340
Telephone and postal charges 31,495 32,977
Surveillance 23,961 19,613
Statutory auditors’ emoluments 2,313 2,568
Capitalized cost of services 236,458 203,205
Total 2,078,463 1,936,757

88 CONSOLIDATED FINANCIAL STATEMENTS AT DECEMBER 31, 2014
The items Construction and similar and Professional and technical services pertain to the Atlantia group and include construction and professional services relating to motorway infrastructure. The increase in Maintenance costs is related to heavier works on motorways. Costs for Subcontracted work pertain to the Schematrentanove group and basically reflect the stabilization of sales volumes. Other services include miscellaneous items such as public relations, graphics and design consulting, personnel recruitment and training, temporary work, money transportation and health inspections.
43 Leases and rentals
This item was stable, moving from Euro 1,235,579 in 2013 to Euro 1,238,533. It consists primarily of concession fees paid by the Autogrill group to third parties and by the Atlantia group to the grantors.
44 Other operating expenses
In detail: (Thousands of Euro) 2014 2013
Indirect taxes and duties 60,327 56,051
Donations 32,938 31,027
Dammages, compensation and penalties 18,426 27,419
Capital losses from disposal of fixed assets 3,387 8,917
Differences in cash deposits 1,689 1,584
Other expenses 54,006 41,109
Total 170,773 166,107 Indirect taxes and duties refer to the Autogrill group for Euro 20,823, the Atlantia group for Euro 20,089 and the Schematrentanove group for Euro 16,028. Donations concern the Atlantia group for Euro 30,943, for the upgrading of infrastructures operated by other entities located near the motorways. Other expenses include indemnities paid to third parties, contingent losses and other miscellaneous operating costs.
45 Use of provisions for construction services required by contract
The use of provisions for construction services required by contract in relation to works for which no additional economic benefits are received equals the value of the relative construction services provided during year. It is recognized as an indirect adjustment of the costs, classified by nature, incurred in 2014 for the construction services provided by operators of the Atlantia group. The amount is shown net of Euro 34,582 in grants accrued on construction services for which no additional economic benefits are received, as mentioned in Note 42 (Revenues from construction services).

CONSOLIDATED FINANCIAL STATEMENTS AT DECEMBER 31, 2014 89
46 Depreciation of property, plant and equipment
As follows: (Thousands of Euro) 2014 2013
Depreciation of buildings 25,033 26,265
Depreciation of investment property 1,642 1,480
Depreciation of plant, machinery and equipment 122,766 123,338
Depreciation of furniture, furnishings and electronic equipment 30,371 38,646
Depreciation of assets to be relinquished 22,223 34,710
Depreciation of leasehold improvements 76,151 89,302
Depreciation of other tangible assets 12,453 13,484
Total 290,639 327,225
47 Amortization of intangible assets
In detail: (Thousands of Euro) 2014 2013
Amortization of intangible assets deriving from concession rights 760,131 614,038
Amortization of industrial patents and intellectual property rights 1,780 1,356
Amortization of concessions, licenses, trademarks and similar rights 21,692 19,950
Amortization of deferred rights 8,848 15,814
Amortization of other intangible assets 66,028 31,233
Total 858,479 682,391 The increase in the Amortization of intangible assets deriving from concession rights is explained by the full-year amortization of the values allocated to concession rights and commercial contractual relationships (included under other intangible assets) by the Atlantia group as a result of the business combination with the Aeroporti di Roma group (amortized for the month of December only in 2013).
48 Impairment of property, plant and equipment and intangible assets
Amounting to Euro 40,329, this item is made up of Euro 10,197 in impairment of intangible assets and Euro 30,132 in impairment of property, plant and equipment. Details can be found in the impairment testing section of Note 2.
49 Impairment of doubtful accounts
This item, totalling Euro 106,165, pertains to trade receivables for Euro 93,591 and to other receivables for Euro 12,574. Impairment losses on trade receivables were charged mainly by the Schematrentanove group (Euro 79,503), while those on other receivables were charged by the Atlantia group and refer to the trade receivables of the subsidiary Electronic Transaction Consultants in the amount of Euro 6,539. Movements in the provision for doubtful accounts are shown in Note 11 (Trade receivables).

90 CONSOLIDATED FINANCIAL STATEMENTS AT DECEMBER 31, 2014
50 Provisions for risks
These include provisions for general risks (Euro 37,496), provisions for sales agent indemnities (Euro 1,203), and other provisions (Euro 50,267) made in 2014. They also include the net provision for the repair of assets operated under concession, pertaining to the motorway operators of the Atlantia group (Euro 216,196), and the net provision for the renewal of airport infrastructure of the Aeroporti di Roma group (Euro 19,231). The increase on the previous year results from discounting the provision for the repair of assets operated under concession and the provision for the renewal of airport infrastructure of the Atlantia group, because the lower discount rate used at December 31, 2014 with respect to the previous year increased the value of those provisions and therefore required the recognition of additional allocations.
51 Share of income/(loss) of associated companies
This item primarily represents the positive impact of the valuation on an equity basis of some associates of the Autogrill group (Euro 2,977) and the negative impact with respect to some associates of the Atlantia group (Euro 9,169). It also includes the dividends received from the associated company Eurostazioni S.p.A. (Euro 1,011). For further information, see Note 4 (Equity investments in associates and joint ventures).
52 Financial income
This item comprises: (Thousands of Euro) 2014 2013
Gain on the restatement of equity investments at fair value - 237,751
Interest income from banks 53,926 91,473
Financial income from discounting 56,359 63,316
Financial income on derivatives 79,992 67,817
Financial income accounted for as an increase in financial assets 48,582 37,911
Dividends from other companies 16,619 10,313
Capital gains from disposal of equity investments 18,958 3,546
Income from measurement of financial instruments at amortized cost 9,871 9,491
Interest income from Group companies 7,528 5,305
Interest income from non-current securities 6,937 2,966
Financial income relating to agreements with the Bertin group 50,067 -
Other financial income 33,435 46,893
Total 382,274 576,782 For 2013, Income from restatement of investments at fair value refers to the previously held interest in the former associate Gemina S.p.A., whose fair value was remeasured when the Atlantia group acquired control on December 1, 2013.
Interest income from banks pertains mostly to the Atlantia group and reflects a decrease in cash and cash equivalents due to the redemption of some bond loans at maturity.
Financial income from discounting refers to the Atlantia group's discounting of concession rights and financial assets deriving from government grants.

CONSOLIDATED FINANCIAL STATEMENTS AT DECEMBER 31, 2014 91
Financial income on derivatives concerns the interest rate hedging transactions of the Atlantia group for Euro 73,017 and the exchange rate hedging transactions of the Schematrentanove group for Euro 6,010. Financial income accounted for as an increase in financial assets refers to the Atlantia group and relates chiefly to the sum lent to Infra Bertin Empreendimentos (the company in charge of constructing and managing the ring road southeast of São Paulo) to finance the investment plan, as discussed in Note 8. Dividends from other companies were collected in 2014 from Pirelli & C. S.p.A. (Euro 7 million), Assicurazioni Generali S.p.A. (Euro 6.6 million) and Mediobanca S.p.A. (Euro 2.8 million). Capital gains from disposal of investments refers entirely to Schematrentanove's sale of its interest in Brunello Cucinelli. Financial income from non-current securities consists mainly of investment fund distributions received by the subsidiary Schemaquattordici S.p.A. and the Parent Company. Interest income from Group companies has accrued on the loan granted to the associate Società Autostrada Tirrenica. Financial income linked to agreements with the Bertin group concerns a price adjustment paid by the Atlantia group to the Bertin group for the acquisition of the Brazilian motorway operators Triangulo do Sol, Rodovias da Colinas and Rodovias do Tietê, as a function of their actual toll revenues for the three-year period 2012-2014. The total earn-out comes to Euro 54,473, including Euro 4,406 recognized as a foreign exchange difference. Other financial income includes interest income on non-financial receivables, mostly in the form of legally prescribed interest on past-due trade receivables.
53 Impairment of financial assets
This item refers essentially to impairment losses on equity investments classified under IAS 39 as "available for sale," as mentioned in Note 5 (Equity investments in other companies). For 2014, impairment losses concern the interest in Alitalia-Compagnia Aerea Italiana S.p.A. (Euro 29.9 million) and the Alitalia convertible bond loan (Euro 14.2 million), both held by the Atlantia group, as well as writedowns charged by the subsidiary Schemaquattordici. For 2013, they concern the interests in RCS MediaGroup S.p.A. (Euro 24.4 million) and Alitalia-Compagnia Aerea Italiana S.p.A. (Euro 13.7 million).

92 CONSOLIDATED FINANCIAL STATEMENTS AT DECEMBER 31, 2014
54 Financial charges
As follows: (Thousands of Euro) 2014 2013
Interest on bonds 597,542 603,780
Interest on bank loans 170,593 233,773
Financial charges from derivatives 156,663 185,816
Financial charges from discounting 119,781 100,302
Financial charges accounted as an increase of financial liabilities 21,548 11,576
Write-downs for overdue interest on current payables 13,543 10,920
Interest on loans from third parties 149 588
Bank expenses and commissions 12,837 18,114
Other financial charges 10,318 2,389
Total 1,102,974 1,167,258 Interest on bonds pertains to the bond issues of the Atlantia group and the Autogrill group. Interest on bank loans also includes the effect of measuring loans at amortized cost (Euro 5,013). Financial charges from derivatives essentially relate to interest rate hedges (Euro 152,041, of which Euro 115,812 pertains to the Atlantia group). Of the change since the previous year, Euro 17,697 consists of a non-recurring charge for the early termination of some hedging contracts by the Parent Company, for a notional amount of Euro 225 million. Financial charges from discounting reflect the impact of discounting the provisions for construction services required by contract, the provisions for the repair of assets operated under concession, and the renewal provision for airport infrastructure of the Atlantia group. The change with respect to 2013 results essentially from the trend in the interest rate curve.
55 Foreign currency hedging gains/(losses) and exchange differences
This item states the balance of foreign exchange gains and losses over the year and the result of currency hedges, attributable mainly to the Schematrentanove and Atlantia groups.
56 Income taxes
The balance includes current and deferred taxes, as detailed below: (Thousands of Euro) 2014 2013
Current taxes 546,992 415,465
Deferred taxes 55,514 78,283
Total 602,506 493,748

CONSOLIDATED FINANCIAL STATEMENTS AT DECEMBER 31, 2014 93
The Group's tax charge for the year breaks down as follows: (Thousands of Euro) 2014 2013
Atlantia group 552,594 414,555
Autogrill group 37,862 27,844
Schematrentanove group 22,326 24,727
Other Group companies and consolidation adjustments (10,276) 26,622
Total 602,506 493,748 For the Atlantia group, the higher tax charge reflects the change in tax rates under the reform approved by the Chilean Parliament in September 2014, which involves a gradual increase in the rates applicable to business income. Deferred taxes relating to the Chilean companies have been remeasured accordingly. The impact recognized by the Atlantia group comes to roughly Euro 112 million. Current taxes are allocated below by group: (Thousands of Euro) 2014 2013
Atlantia group 460,893 342,611
Autogrill group 42,303 29,340
Schematrentanove group 42,942 18,804
Other Group companies and consolidation adjustments 854 24,710
Total 546,992 415,465 The higher tax charge for 2014 derives from the greater taxable income of Group companies. Deferred taxes can be broken down as follows (Thousands of Euro) 2014 2013
Atlantia group 91,701 71,944
Autogrill group (3,424) (1,496)
Schematrentanove group (20,616) 5,923
Other Group companies and consolidation adjustments (12,147) 1,912
Total 55,514 78,283 For the Atlantia group, the remeasurement of deferred taxes as a result of the Chilean tax reform was offset by an increase in deferred tax assets due to the larger provision for the repair of motorway infrastructure.

94 CONSOLIDATED FINANCIAL STATEMENTS AT DECEMBER 31, 2014
57 Profit/(loss) from discontinued operations
The following table breaks down the Profit from discontinued operations in 2014 and the previous year:
(Thousands of Euro)
Atlantia group (TowerCo and
Ecomouv') World Duty Free
group 2014
Operating revenues 214,636 2,439,607 2,654,243
Operating expenses (178,159) (2,309,666) (2,487,825)
Financial income 12,891 22,142 35,033
Financial charges (50,953) (55,095) (106,048)
Fiscal charges (6,953) (55,492) (62,445)
Net contribution to profit of discontinued operations (8,538) 41,496 32,958
After tax capital gain/(loss) on disposal of discontinued operations 69,718 - 69,718
Other income/(charges) relating to discontinued operations 3,355 - 3,355
Profit/(loss) of discontinued operations 64,535 41,496 106,031
(Thousands of Euro)
Atlantia group (TowerCo and
Ecomouv') World Duty Free
group 2013
Operating revenues 578,615 2,105,576 2,684,191
Operating expenses (542,883) (1,942,014) (2,484,897)
Financial income 24,823 12,842 37,665
Financial charges (43,130) (45,060) (88,190)
Fiscal charges (6,347) (20,469) (26,816)
Net contribution to profit of discontinued operations 11,078 110,875 121,953
After tax capital gain/(loss) on disposal of discontinued operations - - -
Other income/(charges) relating to discontinued operations 899 (8,954) (8,055)
Profit/(loss) of discontinued operations 11,977 101,921 113,898 In 2013 it also included a small amount for dividends received from the Portuguese company Lusoponte (Atlantia group).

CONSOLIDATED FINANCIAL STATEMENTS AT DECEMBER 31, 2014 95
ADDITIONAL INFORMATION
58 Consolidated Net Financial Position
The items making up net financial indebtedness are as follows: (Millions of Euro) 12.31.2014 12.31.2013
Cash and cash equivalents 2,322 5,186
Current financial assets from concessions 429 413
Current term deposits 250 196
Other current financial assets 368 267
Current financial assets, total 1,047 876
Non-current financial assets from concession rights 704 1,297
Non-current term deposits 291 337
Other non-current financial assets 770 729
Non-current financial assets, total 1,766 2,363
Payables to banks (587) (181)
Current portion of medium/long-term loans (638) (1,567)
Current portion of bond issues (163) (2,483)
Altre passività finanziarie correnti (429) (634)
Other current financial liabilities (1,816) (4,866)
Long-term loans (3,471) (5,533)
Bond issues (10,939) (10,747)
Other non-current financial liabilities (543) (545)
Non-current financial liabilities, total (14,952) (16,825)
Net financial indebtedness (11,633) (13,265)
59 Financial risk management
Introduction The holding companies (Edizione, Sintonia and Schematrentaquattro) and the main sub-groups of the Edizione Group, such as Schematrentanove, Autogrill and Atlantia, have always paid close attention to the identification, assessment and coverage of financial risks associated with their businesses, and in particular to: ! market risk, mainly currency risk, commodity risk and interest rate risk; ! liquidity risk, with a special focus on the availability of funds and access to the credit market and financial
instruments; ! credit risk, in relation to both commercial and financial transactions.
Given the varied nature of the Group’s businesses and the different exposure of its companies to financial risks, there is no centralized unit for risk management and hedging transactions. Each sub-group, consistently with its own aims, strategies and risks, has established general principles and guidelines for the management of financial risks. For a clearer view of financial risks and their management within the Group, the following analysis is provided by sub-group.

96 CONSOLIDATED FINANCIAL STATEMENTS AT DECEMBER 31, 2014
Regarding the fair value hierarchy for the classification of assets and liabilities measured at fair value or for which fair value is disclosed herein, the prevailing level is 2 for derivatives and 1 for listed securities. There are no assets or liabilities at level 3 of the fair value hierarchy.
MARKET RISK
Currency risk, interest rate risk, commodity risk and financial asset risk The Group is exposed to various financial market risks, such as currency fluctuations, as it operates in an international context where transactions are conducted in different currencies and at different interest rates. It is also exposed to market risks in terms of the price of commodities used in running its business and the trading price of certain financial assets. The Group’s exposure to currency risk stems from the geographical distribution of its industrial activities with respect to the geographical distribution of the markets where it sells its products, and from the borrowing of funds in foreign currency. Exposure to interest rate risk derives from the need to finance operating activities, both industrial and financial, and to invest liquid funds. A change in market interest rates may have an adverse or a positive impact on the Group’s performance, by influencing the cost of borrowing and the return on investments. The Group’s exposure to commodity risk concerns the possibility of price fluctuations for some of the raw materials employed.
Edizione S.r.l.
Interest rate risk The management of interest rate risk, according to a prudent approach in line with best practices, has the following objectives: i. to stabilize the cost of financial indebtedness; and ii. to improve the predictability of future financial outlays in relation to that debt.
To achieve those objectives, Edizione uses Interest Rate Swaps classified as cash flow hedges. The fair value of these instruments is based on expected discounted cash flows, using the market yield curve at the measurement date. Derivative financial instruments were tested for effectiveness, which has to range from 80% to 125%. If the effectiveness of a hedge is 100% or greater, changes in fair value are recognized in full in a Hedging reserve under shareholders’ equity. If effectiveness is less than 100%, or if the derivative does not pass the test, the ineffective portion of the hedge or the entire fair value is recognized in the statement of income. In the event of overhedging, the notional amount in excess is measured at fair value with a contra-entry in statement of income. The Hedging reserve includes the fair value of effective hedge derivatives outstanding on that date, net of the component already accrued. In February 2014 derivative contracts were closed early for a notional amount of Euro 125 million result of reduced net financial indebtedness with third parties. Therefore, at December 31, 2014 Edizione had no outstanding derivative contracts.

CONSOLIDATED FINANCIAL STATEMENTS AT DECEMBER 31, 2014 97
Price risk Edizione is exposed to the risk of changes in the market price of its financial assets, particularly with respect to its medium and long-term investments in listed companies that are classified as equity investments “available for sale” on the basis of IAS 39.
Sensitivity analysis of price risk Concerning the sensitivity analysis of price risk in investments “available for sale”, we have assumed a 500 bps shock in the price of the shares. Based on the analyses, the outcome is that a change of ±5% in the stock market price at December 31, 2014 would have affected shareholders’ equity by ± Euro 23,278 (± Euro 23,383 in 2013).
Sintonia S.p.A.
Interest rate risk The management of interest rate risk, according to a prudent approach in line with best practices, has the following objectives: i. to stabilize the cost of financial indebtedness; and ii. to improve the predictability of future financial outlays in relation to that debt.
To achieve those objectives, Sintonia S.p.A. uses Interest Rate Swaps classified as cash flow hedges. The fair value of these instruments is based on expected discounted cash flows, using the market yield curve at the measurement date. Derivative financial instruments were tested for effectiveness, which has to range from 80% to 125%. If the effectiveness of a hedge is 100% or greater, changes in fair value are recognized in a hedging reserve under shareholders' equity. If effectiveness is less than 100%, or if the derivative does not pass the test, the ineffective portion of the hedge or the entire fair value is recognized in the statement of income. In the event of overhedging, the notional amount in excess is measured at fair value with a contra-entry in statement of income. The Hedging reserve includes the fair value of effective hedge derivatives outstanding on that date, net of the component already accrued. At December 31, 2014 Sintonia had no outstanding derivative contracts.
Schematrentaquattro S.p.A.
Interest rate risk Schematrentaquattro S.p.A. is not exposed to the risk of changes in interest rate as its entire indebtedness is at fixed rate.
Price risk Schematrentaquattro S.p.A. is exposed to the risk of changes in the market price of its financial assets, particularly with respect to its medium and long-term investments in listed companies that are classified as equity investments “available for sale” on the basis of IAS 39. There are no financial instruments falling within level 3 of the fair value hierarchy, and in 2014 no transfers took place between the various levels.
Sensitivity analysis of price risk The sensitivity analysis shows the theoretical impact on the statement of income and shareholders’ equity of interest rate changes and movements in the stock market price of financial assets held by Schematrentaquattro.

98 CONSOLIDATED FINANCIAL STATEMENTS AT DECEMBER 31, 2014
Concerning the risk of share price movements in investments “available for sale”, we have assumed a 500 bps shock in the price of the shares. Based on the analyses, the outcome is that a change of ±5% in the stock market price at December 31, 2014 would have affected shareholders’ equity by ± Euro 8,028 (± Euro 8,295 in 2013).
Schematrentanove group
Interest rate risk Under its financial policy, the Schematrentanove group can use derivative financial instruments to hedge or reduce its exposure to interest rate risk. There are no interest rate hedges in place at December 31, 2014. Almost all of the interest-bearing debt consists of floating-rate loans and/or deposits and so their fair value is close to the value recognized in the statement of financial position. At December 31, 2014 the potential pre-tax impact on the statement of income of a hypothetical 10% increase in interest rates, applied to the Group's average interest-bearing debtor or creditor positions, would increase financial expenses by approximately Euro 2 million. A similar change but of opposite sign would occur if rates were to fall by 10%.
Currency risk It is the Schematrentanove group's policy to manage currency risk through derivative financial instruments such as currency forwards, currency swaps, currency spot transactions and currency options to reduce or hedge the exposure to such risk. According to the type of risk, the maximum duration of hedging transactions may vary from a minimum of two years to a maximum of five years. The financial policy does not allow the undertaking of any transactions for the purposes of realizing gains from exchange rate fluctuations, or any transactions in currencies to which there is not an underlying exposure or transactions in currencies designed to increase the underlying exposure. Financial instruments are designated as part of a hedging relationship at the inception of the hedge. At December 31, 2014 the fair value of hedging instruments on currency risk is negative for Euro 39,667 (negative for Euro 16,696 at December 31, 2013).
Sensitivity analysis of currency risk At December 31, 2014 the potential pre-tax impact on the statement of income of a hypothetical 10% increase in exchange rates against the Euro, assuming that all other variables remain equal is immaterial (below Euro 1 million). The potential pre-tax impact on the statement of income of a hypothetical 10% decrease in exchange rates would be a negative Euro 1 million. The potential pre-tax impact on Shareholders’ equity would be negative for Euro 55 million or positive for Euro 74 million, respectively.
Commodity risk The Schematrentanove group is exposed to fluctuations in commodity prices, particularly wool and cotton, which can adversely affect its margins. The risk exposure is represented by the quantity of commodities purchased (direct) or present in purchased products (yarns, fabrics, finished products). The Schematrentanove group’s financial policy allows it to use derivative financial instruments to hedge or reduce its exposure to commodity risk. Commodity risk continued to be hedged in 2013 through the purchase of call options on cotton.

CONSOLIDATED FINANCIAL STATEMENTS AT DECEMBER 31, 2014 99
Call options on cotton were purchased during 2014, with a fair value at December 31, 2014 of approximately Euro 1 thousand.
Gruppo Autogrill
Interest rate risk The aim of interest rate risk management is to control financial expense and its volatility. This entails, through a mix of fixed- and floating-rate liabilities, the predetermination of a portion of financial expense out to a time horizon in keeping with the structure of debt, which in turn must be in line with capital structure and future cash flows. Where it is not possible to obtain the desired risk profile in the capital markets or through banks, it is achieved by using derivatives of amounts and maturities in line with those of the liabilities to which they refer. The derivatives used are mainly interest rate swaps (IRS). Hedging instruments are allocated to companies with significant exposure to interest rate risk where there are borrowings paying a floating rate (thus exposing the Group to higher finance costs if interest rates rise) or a fixed rate (which means that lower interest rates do not bring about a reduction in financial expense). At 31 December 2014, the ratio of fixed-rate debt to net debt (i.e., net of financial assets, which are generally floating-rate) was 64%. The percentage of fixed-rate debt is higher when considering debt denominated in US dollars (84%) as opposed to debt in Euros (38%). Gross debt denominated in US Dollars amounted to Usd 621 million at the end of the year, including Usd 504.8 million in bond issues. Part of the interest rate risk is hedged by fixed-to-floating interest rate swaps for Usd 100 million, classified as fair value hedges. Part of the interest rate risk is hedged by fixed-to-floating interest rate swaps for USD 100 million, classified as fair value hedges, the fair value of which was positive from some Euro 365 at December 31, 2014 (Euro 7,677 at December 31, 2013). When applying the policy described above, interest rate risk management instruments were accounted for as cash flow hedges in Autogrill group companies' financial statements where they were subject to this risk, and thus recognized as financial assets or liabilities with a balancing entry in specific comprehensive income. In the year ended December 31, 2014 a fair value change of Euro +5,048 was recognized in respect of derivatives found to be effective and the fair value reached a negative Euro 3,888 (Euro 8,972 at December 31, 2013). A hypothetical unfavorable change of 1% in the interest rates applicable to assets and liabilities and to interest rate hedges outstanding at December 31, 2014 would increase net financial expense by Euro 2,811 thousand.
Currency risk The Autogrill group operates in some countries with functional currencies other than the Euro. In these countries, the procurement policy dictates that raw material purchases and other operating expense be conducted in the same currencies, thereby minimizing currency risk. Such a risk remains with respect to intraGroup loans, when granted to subsidiaries that use non-Euro currencies. Under these circumstances, the objective of currency risk management is to neutralize some of this risk in respect of payables and receivables in foreign currency arising from lending transactions in currencies other than the Euro. Hedging instruments are allocated to companies with significant exposure to currency risk in terms of translation risk (i.e., the risk attending conversion into Euros in the parent company's or its subsidiaries' accounts of equity investments denominated in foreign currency) or financial assets or liabilities in a currency other than the reporting currency. These transactions are recognized at fair value under financial assets or liabilities. Fluctuations in the fair value of hedges of foreign currency financial assets or liabilities are taken to profit or loss, as is the corresponding change in the amount of the hedged assets and liabilities. The fair value of these instruments reached a positive Euro 416 at December 31, 2014 (versus a negative Euro 14 at December 31, 2013).

100 CONSOLIDATED FINANCIAL STATEMENTS AT DECEMBER 31, 2014
For instruments hedging translation risk that are therefore designated as hedges of net investments, the effective component of fair value is recognized in comprehensive income. The fair value of these instruments reached a negative Euro 685 at December 31, 2014 (versus a negative Euro 299 at December 31, 2013). With respect to the Usd, Cad, and Chf, a 10% appreciation or depreciation of the Euro would have had a negative impact of Euro 32,315 and a positive impact of Euro 39,495, respectively, on equity and a negative impact of Euro 5,563 and a positive impact of Euro 6,799, respectively, on profit.
Atlantia group
Interest rate risk Interest rate risk is linked to uncertainty regarding the performance of interest rates, and takes two forms: a. cash flow risk: linked to financial assets and liabilities with cash flows indexed to a market interest rate. In
order to reduce floating rate debt, the Group has entered into interest rate swaps (IRS), classified as cash flow hedges. The hedging instruments and the underlying financial liabilities have matching terms to maturity and notional amounts. Following tests of effectiveness, changes in fair value are recognised in comprehensive income. Interest income or expense deriving from the hedged instruments is recognised simultaneously in profit or loss;
b. fair value risk: the risk of losses deriving from an unexpected change in the value fixed rate financial assets and liabilities following an unfavourable shift in the market yield curve. As at 31 December 2014 the Group reports transactions classifiable as fair value hedges in accordance with IAS 39, regarding the previously mentioned new IPCA Linked Swaps entered into by the Brazilian companies, Triangulo do Sol and Colinas, with the aim of converting the real IPCA rate bonds issued in 2013 to a floating CDI rate. Changes in the fair value of these instruments are recognised in profit or loss and are offset by matching changes in the fair value of the underlying liabilities.
As a result of cash flow hedges, 89% of interest bearing debt is fixed rate. A hypothetical unfavorable change of 0.10% in interest rates would have had a negative impact on the income statement at December 31, 2014 of Euro 2,211 and on the comprehensive income statement of Euro 10,416, net of the tax effects.
Currency risk The Group's prime objective of currency risk is to minimise transaction exposure through the assumption of liabilities in currencies other than the presentation currency. Cross currency swaps (CCIRS) with notional amounts and maturities matching those of the underlying financial liabilities have been entered into specifically to eliminate the currency risk to which the sterling-denominated bonds issued by Atlantia and Aeroporti di Roma, and the yen-denominated bonds issued by Atlantia are exposed. These swaps also qualify as cash flow hedges and tests have shown that they are fully effective. 20% of the Group’s debt is denominated in currencies other than the Euro. Taking account of foreign exchange hedges and the proportion of debt denominated in the local currency of the country in which the relevant Group company operates (around 12%), the Group is effectively not exposed to currency risk on translation. The fair value of currency hedges reached a negative Euro 527,041, Euro 9,900 of which relating to fair value hedges (Euro 490,403 at December 31, 2013). A hypothetical unfavorable change of 10% in exchange rates would have had a negative impact on the income statement of Euro 12,269 and on the comprehensive income statement of Euro 248,240 as a result of the change in the net profit of the group’s foreign subsidiaries and the change in the translation reserve.

CONSOLIDATED FINANCIAL STATEMENTS AT DECEMBER 31, 2014 101
LIQUIDITY RISK Liquidity risk can arise through the inability to access, at economically viable conditions, the financial resources needed to guarantee the Group’s ability to operate and to honour its liabilities. The two main factors that determine the Group’s liquidity situation are the resources generated or used by operating and investment activities; and the terms of expiration and renewal of debt or financial investments in conjunction with market conditions.
Edizione S.r.l. Given its cash flows and its non-revocable lines of credit, Edizione believes that it has access to funds whose amounts and maturities are in line with its investment plans. At December 31, 2014 Edizione had demand deposits totalling Euro 31.7 million and committed credit lines still available in the amount of Euro 375 million. The tables below show financial liabilities outstanding at December 31, 2014 by maturity: (Thousands of Euro)
Non-derivative financial liabilities Total contractual
amount Within 1 year 1-5 years Beyond 5 years
Term Loan MB, ISP, UCI (Euro 375 million) - - - -
Bank accounts and intercompany accounts (4,625) (4,625) - -
Total (4,625) (4,625) - - The tables below show financial liabilities outstanding at December 31, 2013 by maturity: (Thousands of Euro)
Non-derivative financial liabilities Total contractual
amount Within 1 year 1-5 years Beyond 5 years
Term Loan MB, ISP, UCI (Euro 375 milioni) (118,883) (2,807) (116,076) -
Bank accounts and intercompany accounts (3,350) (3,350) - -
Total (122,233) (6,157) (116,076) -
(Thousands of Euro)
Derivative financial liabilities Total contractual
amount Within 1 year 1-5 years Beyond 5 years
Interest rate derivatives (8,923) (4,563) (4,359) -
Total (8,923) (4,563) (4,359) -

102 CONSOLIDATED FINANCIAL STATEMENTS AT DECEMBER 31, 2014
Sintonia S.p.A. Liquidity risk is the risk that cash resources may be insufficient to fund the payment of liabilities as they fall due. Given its cash flow and its non-revocable lines of credit, Sintonia S.p.A. believes that it has access to funds whose amounts and maturities are in line with its investment plans. At December 31, 2014 Sintonia had demand deposits totalling Euro 27 million. The tables below show financial liabilities outstanding at December 31, 2014 by maturity: (Thousands of Euro)
Non-derivative financial liabilities Total contrac-
tual amount Within 1 year 1-5 years Beyond 5
years Pool credit facility (Euro 400 million) (160,614) (160,614) - - Total (160,614) (160,614) - - The tables below show financial liabilities outstanding at December 31, 2013 by maturity: (Thousands of Euro)
Non-derivative financial liabilities Total contrac-
tual amount Within 1 year 1-5 years Beyond 5
years RBS credit facility (Euro 1,200 million) (774,415) (774,415) - - Total (774,415) (774,415) - -
(Thousands of Euro)
Derivative financial liabilities Total contrac-
tual amount Within 1 year 1-5 years Beyond 5
years Interest rate derivatives (32,004) (32,004) - - Total (32,004) (32,004) - -
Schematrentaquattro S.p.A. Schematrentaquattro S.p.A. believes that it is not exposed to liquidity risk since its only outstanding liability can be fully satisfied at maturity in the form of equity securities held.
Gruppo Schematrentanove Liquidity risk can arise through the inability to access, at economically viable conditions, the financial resources needed to guarantee the Group’s ability to operate. The two main factors influencing the Group’s liquidity position are the resources generated or used by operating and investing activities, and the maturity and renewal profiles of debt or liquidity profile of financial investments. Liquidity requirements are monitored by the Parent Company’s head office functions in order to guarantee effective access to financial resources and/or adequate investment of liquidity. Credit facility management used to be coordinated by the Parent Company; with effect from December 1, 2014 this function is being performed by Benetton Group S.r.l. applying efficient standards to satisfy Group company needs. At December 31, 2014 all of the "committed" credit facilities refer to the Parent Company, at which date the Group had Euro 270 million in unutilized "committed" credit facilities (drawable from January 8, 2015) and Euro 365 million in unutilized "uncommitted" credit facilities. Management feels that currently available funds and credit facilities, apart from those which will be generated by operating and financing activities, will allow the Group to satisfy its requirements as far as investment, working capital management, and debt repayment at natural maturity are concerned.
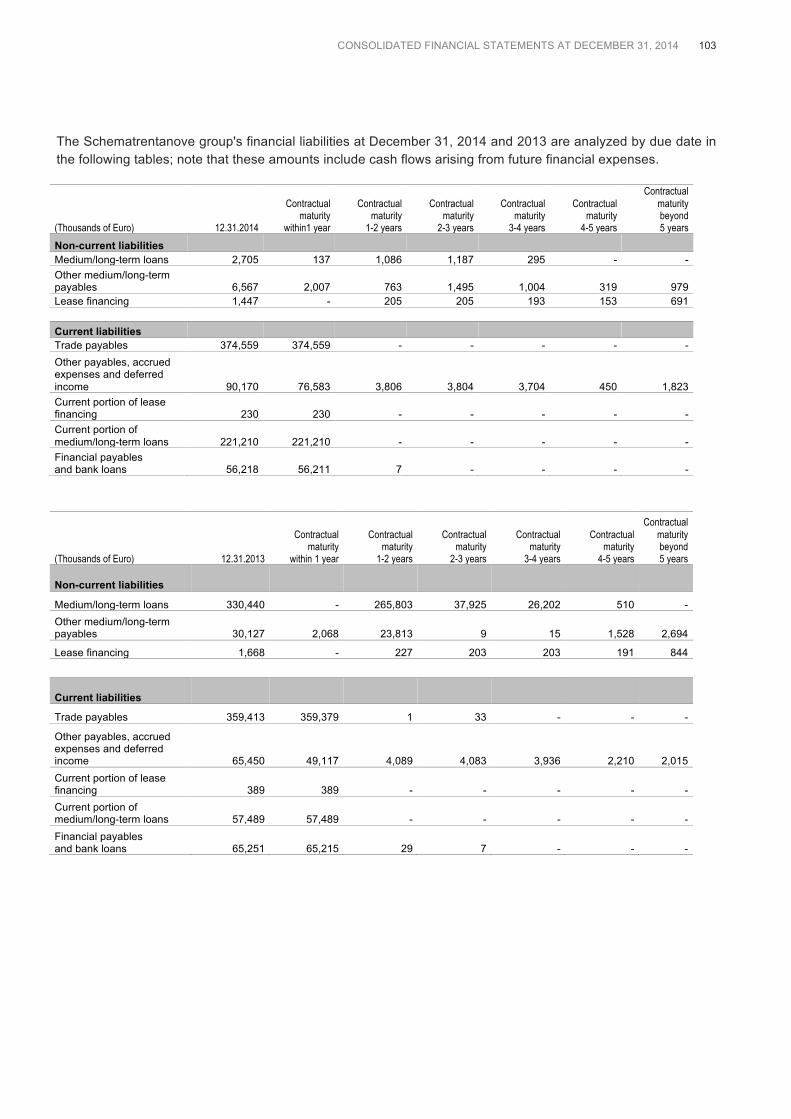
CONSOLIDATED FINANCIAL STATEMENTS AT DECEMBER 31, 2014 103
The Schematrentanove group's financial liabilities at December 31, 2014 and 2013 are analyzed by due date in the following tables; note that these amounts include cash flows arising from future financial expenses.
(Thousands of Euro) 12.31.2014
Contractual maturity
within1 year
Contractual maturity
1-2 years
Contractual maturity
2-3 years
Contractual maturity
3-4 years
Contractual maturity
4-5 years
Contractual maturity beyond 5 years
Non-current liabilities Medium/long-term loans 2,705 137 1,086 1,187 295 - - Other medium/long-term payables 6,567 2,007 763 1,495 1,004 319 979 Lease financing 1,447 - 205 205 193 153 691 Current liabilities Trade payables 374,559 374,559 - - - - - Other payables, accrued expenses and deferred income 90,170 76,583 3,806 3,804 3,704 450 1,823 Current portion of lease financing 230 230 - - - - - Current portion of medium/long-term loans 221,210 221,210 - - - - - Financial payables and bank loans 56,218 56,211 7 - - - -
(Thousands of Euro) 12.31.2013
Contractual maturity
within 1 year
Contractual maturity
1-2 years
Contractual maturity
2-3 years
Contractual maturity
3-4 years
Contractual maturity
4-5 years
Contractual maturity beyond 5 years
Non-current liabilities
Medium/long-term loans 330,440 - 265,803 37,925 26,202 510 - Other medium/long-term payables 30,127 2,068 23,813 9 15 1,528 2,694
Lease financing 1,668 - 227 203 203 191 844
Current liabilities
Trade payables 359,413 359,379 1 33 - - -
Other payables, accrued expenses and deferred income 65,450 49,117 4,089 4,083 3,936 2,210 2,015 Current portion of lease financing 389 389 - - - - - Current portion of medium/long-term loans 57,489 57,489 - - - - - Financial payables and bank loans 65,251 65,215 29 7 - - -

104 CONSOLIDATED FINANCIAL STATEMENTS AT DECEMBER 31, 2014
Autogrill group Liquidity risk arises when it proves difficult to meet the obligations relating to financial liabilities. The Group manages liquidity by ensuring that to the extent possible, it always has sufficient funds to meet its obligations on time, without incurring excessive charges or risking damage to its reputation. The elements that make up the Group's liquidity are the resources generated or used in operating and investing activities, the characteristics of its debt, the liquidity of its financial investments, and financial market conditions. Exposure and maturity data at December 31, 2014 were as follows: 12.31.2014 (Thousands of Euro) Contractual cash flows
Non-derivative financial liabilities Carrying amount Total 1-3 months 3-6 months
6 months-1 year 1-2 years 2-5 years Over 5 years
Current accounts overdrafts 40,427 40,427 40,427 - - - - - Unsecured bank loans 429,464 429,464 96,183 - - 333,281 - - Lease payments due to others 6,296 6,296 207 161 329 861 810 3,929 Other financial liabilities 289 289 - - - - - 289 Bonds 418,006 418,006 - - - - 129,358 288,649 Trade payables 406,698 406,698 399,061 7,390 223 13 10 - Due to suppliers for investments 82,481 82,481 80,475 2,000 - - 6 - Total 1,383,662 1,383,662 1,383,662 9,551 552 334,155 130,184 292,867 12.31.2014 (Thousands of Euro) Contractual cash flows
Derivative financial liabilities Carrying amount Total 1-3 months 3-6 months
6 months-1 year 1-2 years 2-5 years Over 5 years
Forward foreign exchange derivatives 1,043 1,043 1,043 - - - - - Interest Rate Swap 4,321 4,321 - 3,888 - - - 433 Total 5,364 5,364 1,043 3,888 - - - 433

CONSOLIDATED FINANCIAL STATEMENTS AT DECEMBER 31, 2014 105
Exposure and maturity data at December 31, 2013 were as follows: 12.31.2013 (Thousands of Euro) Contractual cash flows
Non-derivative financial liabilities Carrying amount Total 1-3 months 3-6 months
6 months- 1 year 1-2 years 2-5 years Over 5 years
Current accounts overdrafts 41,937 41,937 41,937 - - - - -
Unsecured bank loans 443,360 443,360 76,819 - - - 366,541 - Lease payments due to others 11,042 11,042 255 247 391 1,700 558 7,892
Other financial liabilities 283 283 - - - - - 283
Bonds 369,911 369,911 - - - - 116,122 253,789
Trade payables 396,204 396,204 388,609 664 6,557 227 144 4 Due to suppliers for investments 56,402 56,402 55,154 1,242 - - 6 -
Total 1,319,139 1,319,139 562,774 2,153 6,948 1,927 483,371 261,968
12.31.2013 (Thousands of Euro) Contractual cash flows
Derivative financial liabilities Carrying amount Total 1-3 months 3-6 months
6 months- 1 year 1-2 years 2-5 years Over 5 years
Forward foreign exchange derivatives 336 336 336 - - - - - Interest Rate Swap 8,972 8,972 1,197 - - 7,775 - - Total 9,308 1,533 1,533 - - 7,775 - - With regard to exposure to trade payables, there is no significant concentration of suppliers, of which the largest 10 account for 26.11% of the total and the leading supplier (Autostrade per l'Italia S.p.A., moreover, an Edizione Group company) for 7.97%. The bond regulations call for compliance with certain financial ratios, calculated solely with respect to the companies headed up by HMSHost Corporation. They are not guaranteed by Autogrill S.p.A. There are also limits on the distribution of dividends by HMSHost Corporation to the parent, Autogrill S.p.A., if the leverage ratio of the HMSHost subGroup exceeds a certain amount. The loan contracts and bonds outstanding at December 31, 2014 require the satisfaction of certain financial ratios, specifically, the leverage ratio (net debt/Ebitda) and interest coverage ratio (Ebitda/net financial expense). These are measured with different criteria and for different groupings of companies depending on the loan and the beneficiary. In particular, Autogrill S.p.A. has outstanding loans for which the above ratios are calculated on figures pertaining to the Autogrill Group as a whole. The weighted average term of bank loans and bonds at December 31, 2014, including unutilized credit lines, is approximately three years and four months (four years and two months at the end of 2013).
Atlantia group Liquidity risk relates to the risk that cash resources may be insufficient to fund the payment of liabilities as they fall due. The Group believes that its ability to generate cash, the ample diversification of its sources of funding and the availability of committed and uncommitted lines of credit provides access to sufficient sources of finance to meet its projected financial needs.
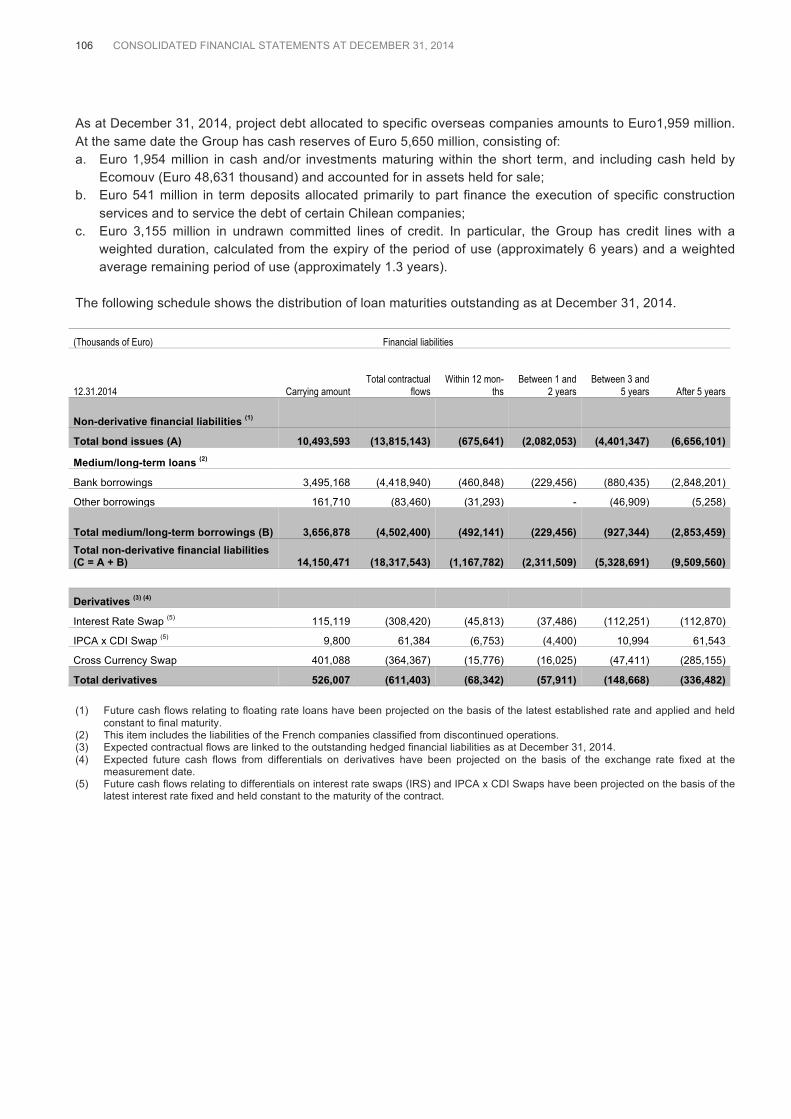
106 CONSOLIDATED FINANCIAL STATEMENTS AT DECEMBER 31, 2014
As at December 31, 2014, project debt allocated to specific overseas companies amounts to Euro1,959 million. At the same date the Group has cash reserves of Euro 5,650 million, consisting of: a. Euro 1,954 million in cash and/or investments maturing within the short term, and including cash held by
Ecomouv (Euro 48,631 thousand) and accounted for in assets held for sale; b. Euro 541 million in term deposits allocated primarily to part finance the execution of specific construction
services and to service the debt of certain Chilean companies; c. Euro 3,155 million in undrawn committed lines of credit. In particular, the Group has credit lines with a
weighted duration, calculated from the expiry of the period of use (approximately 6 years) and a weighted average remaining period of use (approximately 1.3 years).
The following schedule shows the distribution of loan maturities outstanding as at December 31, 2014. (Thousands of Euro) Financial liabilities
12.31.2014 Carrying amount Total contractual
flows Within 12 mon-
ths Between 1 and
2 years Between 3 and
5 years After 5 years
Non-derivative financial liabilities (1)
Total bond issues (A) 10,493,593 (13,815,143) (675,641) (2,082,053) (4,401,347) (6,656,101)
Medium/long-term loans (2)
Bank borrowings 3,495,168 (4,418,940) (460,848) (229,456) (880,435) (2,848,201)
Other borrowings 161,710 (83,460) (31,293) - (46,909) (5,258)
Total medium/long-term borrowings (B) 3,656,878 (4,502,400) (492,141) (229,456) (927,344) (2,853,459) Total non-derivative financial liabilities (C = A + B) 14,150,471 (18,317,543) (1,167,782) (2,311,509) (5,328,691) (9,509,560)
Derivatives (3) (4)
Interest Rate Swap (5) 115,119 (308,420) (45,813) (37,486) (112,251) (112,870)
IPCA x CDI Swap (5) 9,800 61,384 (6,753) (4,400) 10,994 61,543
Cross Currency Swap 401,088 (364,367) (15,776) (16,025) (47,411) (285,155)
Total derivatives 526,007 (611,403) (68,342) (57,911) (148,668) (336,482) (1) Future cash flows relating to floating rate loans have been projected on the basis of the latest established rate and applied and held
constant to final maturity. (2) This item includes the liabilities of the French companies classified from discontinued operations. (3) Expected contractual flows are linked to the outstanding hedged financial liabilities as at December 31, 2014. (4) Expected future cash flows from differentials on derivatives have been projected on the basis of the exchange rate fixed at the
measurement date. (5) Future cash flows relating to differentials on interest rate swaps (IRS) and IPCA x CDI Swaps have been projected on the basis of the
latest interest rate fixed and held constant to the maturity of the contract.

CONSOLIDATED FINANCIAL STATEMENTS AT DECEMBER 31, 2014 107
The following schedule shows the distribution of loan maturities outstanding as at December 31, 2013. (Thousands of Euro) Financial liabilities
12.31.2013 Carrying amount Total contractual
flows Within 12 mon-
ths Between 1 and
2 years Between 3 and
5 years After 5 years
Non-derivative financial liabilities (1)
Total bond issues (A) 12,674,485 (16,373,635) (3,088,467) (639,628) (4,958,370) (7,687,170)
Bank borrowings 4,292,416 (5,426,822) (758,680) (449,130) (990,870) (3,228,142)
Other borrowings 121,769 (105,786) (38,935) (9,518) (10,191) (47,142)
Total medium/long-term borrowings (B) 4,414,185 (5,532,608) (797,615) (458,648) (1,001,061) (3,275,284) Total non-derivative financial liabilities (C = A + B) 17,088,670 (21,906,243) (3,886,082) (1,098,276) (5,959,431) (10,962,454)
Derivatives (2) (3)
Interest Rate Swap (4) (58,157) (237,072) (35,859) (26,266) (62,867) (112,080)
IPCA x CDI Swap (4) (11,299) (27,742) (10,110) (7,460) 7,780 (17,952)
Cross Currency Swap (421,017) (446,972) (25,695) (25,575) (77,032) (318,670)
Total derivatives (490,473) (711,786) (71,664) (59,301) (132,119) (448,702) (1) Future cash flows relating to floating rate loans have been projected on the basis of the latest established rate and applied and held
constant to final maturity. (2) Expected contractual flows are linked to the outstanding hedged financial liabilities as at December 31, 2013. (3) Expected future cash flows from differentials on derivatives have been projected on the basis of the exchange rate fixed at the
measurement date. (4) Future cash flows relating to differentials on interest rate swaps (IRS) and IPCA x CDI Swaps have been projected on the basis of the
latest interest rate fixed and held constant to the maturity of the contract.
CREDIT RISK Credit risk is the risk of incurring losses due to the failure to collect receivables due for both normal commercial transactions and financial investments. It includes the direct risk of the counterparty's insolvency or decrease in creditworthiness, as well as credit concentration risk. The carrying value of the financial assets is the group’s maximum exposure to credit risk, in addition to the face value of guarantees given for the borrowings or commitments of third parties.
Schematrentanove group The Schematrentanove group has different concentrations of credit risk depending on the nature of the activities which have generated the receivables. Sales to retail channel customers are settled in cash or using credit cards and other debit cards. Individually significant positions can be subject to individual write-down if they are objectively considered to be partially or totally unrecoverable. The amount of the write-down takes into account a forecast of recoverable cash flows and their relevant collection date, as well as the fair value of warranties. Collective provisions are made for receivables which are not subject to individual write-down, taking into account bad debt history and statistical data. Financial credit risk lies in the counterpart’s or the issuer’s inability to settle its financial obligations. The Group uses financial instruments to invest liquidity and hedge financial risks. These instruments must have a minimum long-term issuer and/or counterparty rating of S&P's A- (or equivalent) and/or a minimum short-term issuer and/or counterparty rating of S&P's A-2 (or equivalent) and must be issued or subscribed by issuers or counterparties based in (or under the jurisdiction of) countries which have approved plans in support of their banking systems. For the purpose of reducing risk concentration, the Group may not invest more than 10% of its liquidity (except for bank deposits with a term of under two weeks) with any one issuer or counterparty, with a ceiling of Euro 20

108 CONSOLIDATED FINANCIAL STATEMENTS AT DECEMBER 31, 2014
million per issuer and/or counterparty with a rating lower than AA (or A in the case of sovereign issuers). The maximum concentration per counterparty when hedging financial risks is 20% of the total value of hedges in place. Available-for-sale assets (in level one of the IFRS 7 fair value hierarchy) and cash and cash equivalents are stated at their fair value; furthermore, at December 31, 2014 the Group does not have any positions with sovereign debtors carrying significant repayment risks.
Autogrill group Exposure to credit risk depends on the specific characteristics of each customer. The Group's business model, centered on the relationship with the end consumer, means that trade receivables and thus the relative degree of risk is of limited significance in relation to total financial assets, since most sales are paid for in cash. In most cases, the Group's trade receivables stem from catering service agreements and commercial affiliations. Other receivables consist mainly of amounts due from Inland Revenue and other government agencies, fees paid in advance, and advances for services or commercial investments made on behalf of concession grantors, for which the degree of credit risk is low. Financial assets are recognized net of impairment losses calculated on the basis of the counterparty's risk of default. Impairment is determined according to local procedures, which may require impairment of individual positions, if material, where there is evidence of an objective condition of uncollectability of part or all of the amount due, or collective impairment calculated on the basis of historical and statistical data. There is no significant concentration of credit risk: the top 10 customers account for 19.2% of total trade receivables, and the largest customer (Tamoil Italia S.p.A.) for 2.71%.
Atlantia group The Group manages credit risk essentially through recourse to counterparties with high credit ratings, with no significant credit risk concentrations as required by Financial Policy. Credit risk deriving from outstanding derivative financial instruments can also be considered marginal in that the counterparties involved are major financial institutions. There are no margin agreements providing for the exchange of cash collateral if a certain fair value threshold is exceeded. Provisions for impairment losses on individually material items, on the other hand, are established when there is objective evidence that the Group will not be able to collect all or any of the amount due. The amount of the provisions takes account of estimated future cash flows and the date of collection, any future recovery costs and expenses, and the value of any security and guarantee deposits received from customers. General provisions, based on the available historical and statistical data, are established for items for which specific provisions have not been made.

CONSOLIDATED FINANCIAL STATEMENTS AT DECEMBER 31, 2014 109
60 Related party transactions
The following table shows income and costs for the year and balance sheet figures at December 31, 2014 as a result of related party transactions. Related party transactions are conducted at arm's length and with the utmost transparency.
(Thousands of Euro) Receivables Payables Operating
costs Revenues Other opera-
ting income Interest income
Interest charges
Non-consolidated subsidiaries 540 132 2,735 244 37 - -
Associated companies 134,720 11,158 15,186 - 2,102 8,206 -
Total 135,260 11,290 17,921 244 37 8,206 - The amounts shown for Associated companies and joint ventures include Euro 110,000 in financial receivables and Euro 13,508 in financial payables with Società Autostrada Tirrenica S.p.A., as discussed in Note 16 (Other non-current financial assets) and Note 39 (Other current financial liabilities).
61 Non-controlling interests in subsidiaries
The consolidated companies with material non-controlling interests for the purposes of IFRS 12 disclosures are as follows: ! Atlantia S.p.A. and its subsidiaries; ! Autogrill S.p.A. and its subsidiaries; ! Sintonia S.p.A.
The figures in the following table thus refer to those companies and their subsidiaries and have been taken, unless otherwise specified, from their consolidated financial statements.
Atlantia group Autogrill group
(Millions of Euro) 2014 2013 2014 2013
Revenues 5,083 4,244 4,570 4,674
Income (loss) for the year 773 721 37 90
Income (loss) for the year, minority interests (33) (84) 12 12
Non-current assets 29,114 29,625 1,780 1,678
Current assets 5,063 6,788 552 527
Non-current liabilities 21,271 21,454 949 948
Current liabilities 4,643 6,750 892 812
Net assets 8,263 8,209 491 445
Net assets, minority interests 1,744 1,728 32 31
Cash flow from operating activities 1,823 1,502 224 32
Cash flow from investing activities (716) (1,114) (173) (26)
Cash flow from financing activities (3,551) 1,255 (44) 41
Translation impact on cash and cash equivalent 3 (36) 7 (14)
Increase / (Decrease) of cash and cash equivalents (2,441) 1,607 13 33
Dividends paid to minority interests (9) (8) (21) (17) The main data relating to Sintonia S.p.A., held 66.44% of the Parent Company, are reported in the Directors’ Report.

110 CONSOLIDATED FINANCIAL STATEMENTS AT DECEMBER 31, 2014
62 Business combinations
Main business combinations occurring in 2014 are detailed below.
Merger of Gemina S.p.A. with and into Atlantia S.p.A. Identification and measurement of the fair value of the assets and liabilities of Gemina S.p.A. and its subsidiaries, of which Atlantia acquired control on December 1, 2013 following the merger of Gemina with and into Atlantia, was completed in the first half of 2014. The table below shows the carrying amounts of the assets acquired and liabilities assumed, in addition to the final fair values identified, which do not differ significantly from those provisionally allocated and presented as at December 31, 2013.
(Millions of Euro) Carrying amount
Fair value adjustment and allocation of transaction costs Fair value
Net assets acquired:
Property, plant and equipment 8.8 8.8
Intangible assets 1,991.8 3,108.2 5,100.0
Other non-current assets and liabilities 2.8 2.8
Trading and other current assets 260.7 260.7
Cash and cash equivalents 208.1 208.1
Other current financial assets 28.3 28.3
Non-current financial liabilities (1,020.2) (36.9) (1,057.1)
Current financial liabilities (19.5) (19.5)
Deferred tax assets 138.4 (1,150.6) (1,012.2)
Provisions (364.9) (364.9)
Trading and other current liabilities (321.4) (321.4)
Total net assets acquired 912.9 1,920.7 2,833.6
Minority interest 119.5
Total net assets acquired by Atlantia group 2,714.1
Cost of aquisition 2,714.1
Capital increase (no. 163.9 million ordinary shares) 2,702.1
Contingent value rights 12.0
Completion of the measurement process has resulted in a net fair value adjustment to the net assets acquired of Euro 1,920.7 million, reflecting recognition of the following: a) an increase in the value of the concession held by Aeroporti di Roma, estimated at Euro 2,700.6 million; b) the value of the commercial contractual relations to which Aeroporti di Roma is party, estimated at Euro
407.6 million; c) the fair value adjustment of certain Aeroporti di Roma’s financial liabilities, resulting in an estimated increase
in value of Euro 36.9 million; d) an adjustment to deferred taxation, resulting in recognition of net deferred tax liabilities of Euro 1,150.6
million.
With regard to the purchase consideration, the fair value of the 163,956,398 ordinary shares issued by Atlantia and exchanged for the shares held by Gemina’s shareholders was determined on the basis of the closing price of the Atlantia’s shares on the Mercato Telematico Azionario managed by Borsa Italiana S.p.A. on November 29, 2013 (the last trading day before the effective date of the merger), being Euro 16.48. The Contingent Value Rights were measured on the basis of the unit price of each put option embedded in the Rights to be purchased by Atlantia, resulting in a total of Euro 12 million. In the Exercise Period for the options, between December 3, 2013 and October 3, 2014, Put Options amounting to 160,698,634 Contingent Value Rights were exercised out

CONSOLIDATED FINANCIAL STATEMENTS AT DECEMBER 31, 2014 111
of a total of 163,956,286 Contingent Value Rights issued, equivalent to 98% of the total Contingent Value Rights issued. The Contingent Value Rights acquired by Atlantia were subsequently cancelled. As required by IFRS 3, the above final amounts have been recognised retrospectively from December 1, 2013, resulting in the restatement and remeasurement of amounts previously reported in the statement of financial position and the income statement as at and for the year ended December 31, 2013, including amortisation of the intangible assets acquired, as described above.
63 Significant events following the end of the financial year
Schematrentanove group ! The partial demerger of Schematrentanove S.p.A. (formerly Benetton Group S.p.A.) to two beneficiary
companies directly controlled by the sole shareholder Edizione S.r.l. came into effect on January 1, 2015. Under this transaction: " the 100% interest in Benetton Group S.r.l., focused on the core business (brands, merchandise,
marketing, sales and retail), was assigned to Schematrentasette S.r.l.; " the 100% interest in Olimpias Group S.r.l., in charge of manufacturing activities with industrial platforms
in the Mediterranean region (weaving, knitting, spinning, dyeing and sewing), was assigned to Schematrentotto S.r.l.
As a result of the demerger, Schematrentanove S.p.A. now has equity investments in the real estate sector only.
Autogrill group ! On February 28, 2015 Autogrill S.p.A. transferred to the World Duty Free group the travel retail activities
operated by HMSHost at the Atlanta and Oakland airports and at the Empire State Building. The transfer completes HMSHost Corp.'s sale of its travel retail operations at US airports to the World Duty Free group, as announced to the market on September 6, 2013. The price agreed for the remaining operations was Usd 19 million.
! On March 12, 2015 Autogrill S.p.A. contracted a new loan of Euro 600 million. This is comprised of an amortizing term loan of Euro 200 million and a revolving credit facility of Euro 400 million, both maturing in March 2020. It will be used for the early reimbursement of the revolving credit facilities maturing in July 2016 and to finance the group's operations.
! On April 1, 2015 the Autogrill group, through HMSHost International, entered the Chinese market by signing two agreements for the opening of 10 outlets at international Beijing and Sanya airports by the end of 2015. The Beijing outlets will be operated as a joint venture with Huazhuo, a leading local provider of food & beverage services at airports. The 6 locations will generate estimated revenues of Euro 44 million over the six years of the contract. At Sanya, one of China's top tourist destinations, the group has entered a partnership with Cosmos - a Chinese operator with lengthy experience in food & beverage and retail - for the opening of 4 locations: 2 to be managed directly by Autogrill and 2 sub-concessions. From these airport operations the company expects to gross Euro 6 million from 2015 to 2020.
! On April 21, 2015 the Autogrill group, through HMSHost, announced a stronger airport presence in North America by way of 4 new contracts for the operation of 40 outlets at Houston and Montreal airports. Together, these should generate revenues of around Usd 790 million over the lives of the contracts.
Atlantia group ! On January 30, 2015, Atlantia completed a voluntary cash tender offer for all the asset-backed securities
named "Gbp 215,000,000 5.441% Class A4 Notes due 2023" (Euro 346.9 million at the exchange rate on the purchase date) issued by Romulus Finance S.r.l. Atlantia has accepted all the securities for which the offer was validly accepted, totaling Gbp 214,725,000, or 99.87% of the securities in issue.

112 CONSOLIDATED FINANCIAL STATEMENTS AT DECEMBER 31, 2014
! On February 13, 2015 Atlantia S.p.A. announced a tender offer with the aim of partially repurchasing some notes issued by Atlantia and guaranteed by Autostrade per l’Italia, to be settled in cash for a predetermined maximum amount. The total outlay for this transaction was Euro 1,102,245,344.
! On February 19, 2015, Autostrade per l’Italia’s Board of Directors voted to authorize the issue, by December 31, 2015, of one or more new non-convertible bonds with a total value of up to Euro 1.5 billion. The bonds are to be listed on one or more regulated markets and offered for sale to retail investors in Italy.
! On February 25, 2015 Autostrade per l’Italia, which then owned 24.98% of Società Autostrada Tirrenica p.A. (SAT), signed agreements with SAT's shareholders to acquire a further 74.95% stake in the company, thus raising its total interest to 99.93%. The cost of the transaction is approximately Euro 84 million.
! On March 10, 2015, Atlantia S.p.A. announced that it had sold 9,741,513 treasury shares (representing 1.18% of the share capital) for Euro 227.9 million. The sale took place through an accelerated book building procedure reserved to institutional investors and closed at a selling price of Euro 23.40 per share.
The Parent Company ! On February 20, 2015 Edizione sold its 2.2% interest and convertible OCEANE bonds of Club
Méditerranée, participating in the takeover bid launched on January 22, 2015 by Gaillon Invest II. The proceeds came to Euro 20.2 million, for a capital gain of Euro 12.3 million with respect to the carrying amount.
! On March 28, 2015, following a competitive bidding procedure, Edizione and its subsidiary Schematrentaquattro S.p.A. signed binding agreements with Dufry A.G. for Dufry's purchase of Schematrentaquattro's entire 50.1% interest in World Duty Free S.p.A. The selling price of Euro 10.25 per World Duty Free share will bring in Euro 1.3 billion for Schematrentaquattro. The sale of the 50.1% interest in World Duty Free is subject to permission from the antitrust authorities and approval of a capital increase to partially finance the acquisition (as already approved by Dufry's shareholders on April 29, 2015). The sale is expected to close by the end of the third quarter of 2015.
! On April 10, 2015 Edizione signed a binding agreement with China National Tire & Rubber Co. (CNRC) for the sale of Edizione's 1.574% interest in Pirelli and Schematrentaquattro's 3.034% interest in Pirelli, currently held to service a bond loan convertible into Pirelli shares. The agreed price is Euro 15 per share ex-dividend 2014, the same price at which CNRC will launch a mandatory tender offer on the ordinary shares of Pirelli & C. S.p.A. after completing its acquisition of the Pirelli shares held by Camfin. The sale of the Pirelli shares is conditional on whether Camfin has actually sold its Pirelli shares to CNRC. Edizione may decide to postpone the sale to CNRC of its direct interest in Pirelli and to participate in the tender offer instead. It also has the right to cancel the agreement in the event of one or more competing tender offers on ordinary Pirelli shares, unless CNRC announces an increase in its tender price to match or exceed the latest competing offer.
Schematrentaquattro S.p.A. ! As of May 25, 2015 Schematrentaquattro S.p.A. has received requests to convert bonds into ordinary Pirelli
shares. Therefore, its overall interest in Pirelli has gone from 3.034% to 1.819% and the nominal value of the convertible bond loan has decreased from Euro 200 million to Euro 119.9 million.
Sintonia S.p.A. ! On March 25, 2015 and April 8, 2015, respectively, the Board of Directors and the Annual General Meeting
of Sintonia approved the partial, non-proportional demerger plan for Sintonia, upon whose outcome Edizione will own 100% of Sintonia which will in turn own 30.25% of Atlantia S.p.A. The demerger should take effect by June 21, 2015, when the shareholders' agreement is due to expire.
64 Atypical and/or unusual transactions
As required by the Consob Communication DEM/6064293 dated July 28, 2006, the Group companies have not undertaken any atypical and/or unusual transactions, meaning those whose significance/materiality, nature of

CONSOLIDATED FINANCIAL STATEMENTS AT DECEMBER 31, 2014 113
the counterparties, purpose, method of determining the transfer price, or timing might give rise to doubts as to the fairness or completeness of the information contained in the financial statements, conflicts of interest, the safekeeping of assets and the interests of non-controlling shareholders.
65 Guarantees given, commitments and other contingent liabilities
(Thousands of Euro) 12.31.2014 12.31.2013
Unsecured guarantees given
Sureties and guarantees 760,326 920,558
Commitments
Purchase commitments 19,529 8,763
Sale commitments 4,432 4,821
Total 784,287 934,142 Guarantees are made up as follows: ! guarantees given to third parties by the Parent Company in the amount of Euro 260,000, consisting of the
security provided on behalf of the subsidiary Schematrentaquattro S.p.A. for the Euro 200 million bond loan convertible into shares of Pirelli & C. S.p.A.;
! guarantees given to third parties by the Schematrentanove group for Euro 80,376, mainly referring to a commitment with the Italian tax authorities to guarantee VAT credits offset between the Italian companies;
! guarantees given by the Autogrill group in the amount of Euro 264,509 in the form of performance bonds and other personal guarantees issued in favour of grantors and business counterparties;
! guarantees given to third parties by the Atlantia group, including the following of particular importance:
a. the guarantee issued in favour of Strada dei Parchi's creditor banks and on this company's behalf, to cover the interest rate risk on cash flow hedging derivatives. The value of the guarantee is determined based on the fair value of these derivatives, for a maximum amount guaranteed of Euro 40,000, corresponding to the amount at December 31, 2014. This guarantee, renewed in February 2015 for an additional 12 months, is enforceable only if Strada dei Parchi's concession is terminated; Atlantia holds a counter guarantee from Toto Holding, which has committed to take over from Atlantia by November 30, 2015;
b. bank guarantees on behalf of Tangenziale di Napoli (Euro 29,756) in favour of the Ministry of Infrastructure and Transport, as provided for in the commitments assumed in the agreement;
c. the counter guarantees issued by Atlantia on behalf of its subsidiary Electronic Transaction Consultants, in favour of insurance companies that have issued performance bonds totalling Euro 85,376, to guarantee free flow tolling projects in course.
Purchase commitments chiefly relate to payments to be made to investment funds held by the Parent Company (Euro 17,227) and preliminary agreements for the purchase of commercial properties by the Autogrill group (Euro 2,272). Sale commitments consist of the value of sale-or-return products held at the premises of Autogrill group companies (Euro 4,432). Also at December 31, 2014 the shares of certain of the Atlantia group’s overseas motorway operators have been pledged to providers of project financing to those companies, as have shares in Pune-Solapur Expressways, Lusoponte and Bologna & Fiera Parking. Tranche A4 of the bonds issued by the vehicle Romulus Finance (a subsidiary of Aeroporti di Roma) is fully secured by a series of collateral guarantees, cash collaterals and shares, which will remain in effect until the
114 CONSOLIDATED FINANCIAL STATEMENTS AT DECEMBER 31, 2014
bonds mature. Note also that on January 27, 2015, Atlantia successfully completed a voluntary tender offer on tranche A4. At the end of the year, the future payments due by the Group for rents and operational leases which cannot be terminated were as follows: (Thousands of Euro) 12.31.2014 12.31.2013
Within 1 year 494,402 1,008,627
From 1 to 5 years 1,471,930 3,947,598
Beyond 5 years 1,051,602 2,747,786
Total 3,017,934 7,704,011
66 Other commitments and rights
Benetton Korea Inc. is a Korean company, of which 50% is owned by Benetton Japan Co., Ltd., 15% by Mr. Chang Sue Kim (a natural person) and 35% by F & F Co., Ltd. (a Korean company controlled by Mr. Chang Sue Kim). The shareholder agreement gives Benetton a call option and the Korean shareholders a put option over the latter's equity interests. These options can be exercised upon expiry of the partnership agreement in 2015. Benetton can also exercise its call option if specific contract "termination" events should occur, primarily involving breach of contract. The option exercise price is calculated using a formula based on shareholders' equity at the option exercise date and a perpetuity calculated on the basis of average net income in the previous two years. Upward or downward adjustments are made to the option exercise price, depending on the circumstances. The estimated cost of the put option granted to the shareholders has been recognized in the group's liabilities.
67 Contingent liabilities
Schematrentanove group The Group has not recognized any provisions against an estimated amount of around Euro 66.7 million in liabilities associated with unsettled litigation, insofar as it considers that the risk of a related financial outlay is only "possible", in compliance with IAS 37. Contingent liabilities for the subsidiary Bencom S.r.l. include the tax disputes (IRES/IRAP) for tax years 2004 to 2008 concerning the claimed disallowance of certain costs for commissions paid to agents resident in low-tax jurisdictions, already extensively described in previous financial statements
Atlantia group On March 6, 2014, Varese Provincial Authority filed a legal challenge before Lazio Regional Administrative Court against the Ministry of Infrastructure and Transport, the Ministry of the Economy and Finance, ANAS and Autostrade per l’Italia, requesting cancellation, subject to suspensive relief, (i) of the decree of December 31, 2013 issued by the Ministry of Infrastructure and Transport, in agreement with the Ministry of the Economy and Finance, approving the toll increase for 2014, regarding, in particular, tolls on the A8 and A9 motorways, and (ii) the arrangement under which Autostrade per l’Italia was permitted to operate the toll stations on the above motorways, collecting a toll that is not based on the effective distance travelled by road users. Varese Provincial Authority also requested an injunction suspending implementation of the above decree and thus the toll increase. This request for injunctive relief was turned down by the Regional Administrative Court on April 17, 2014. A date for the hearing to discuss the challenge has yet to be fixed.

CONSOLIDATED FINANCIAL STATEMENTS AT DECEMBER 31, 2014 115
Autostrade per l’Italia is party to disputes involving two holders of food service concessions, My Chef and Chef Express, who have, since 2012, alleged that Autostrade per l’Italia has breached the terms of contracts relating to a number of service areas, requesting the payment of damages. Autostrade per l’Italia S.p.A. has been served two further writs by Chef Express in 2014. Consequently, there are to date a total of eight claims pending before the Civil Court of Rome regarding the same number of service areas. Negotiations are underway with a view to concluding two settlements with both My Chef and Chef Express in order resolve the above disputes. In particular, on February 24, 2015, Chef Express sent Autostrade per l’Italia a proposal for a binding settlement. On July 28, 2013, there was an accident involving a coach travelling along the Naples-bound carriageway of the A16 Naples-Canosa motorway. 40 people were killed as a result of the accident, which occurred at km 32+700 on the Acqualonga viaduct. In response to this event, the Public Prosecutor’s Office in Avellino has begun a criminal investigation of, among others, three managers (the current Director of the section of motorway and his two predecessors) and two employees of Autostrade per l’Italia, who are being investigated for multiple manslaughter and negligence. Moreover, the Autorità di Vigilanza sui Contratti Pubblici (the Authority for the Control of Public Contracts, now known as the Autorità Nazionale Anticorruzione, Italy’s National Anti-Corruption Authority) launched an investigation of Autostrade per l’Italia regarding maintenance, carried out over the years, of the section of the A16 Naples-Canosa motorway including the above Acqualonga viaduct. On completing its investigation, the National Anti-Corruption Authority published resolution 30 of December 22, 2014, registered on January 22, 2015, stating that it had found clear evidence of irregularities in the work carried out in 2012 in order to upgrade the safety barriers on the Naples-Canosa section, which should also have included, according to the Authority, the Acqualonga viaduct. Based on the opinion of its own technical units, Autostrade per l’Italia responded to the Authority on February 24, 2015, contesting the conclusions contained in the above resolution. Any further action to be taken is currently under consideration. On May 23, 2014, the Public Prosecutor’s Office in Florence issued an order requiring Autostrade per l’Italia to hand over certain documentation, following receipt, on May 14, 2015, of a report from Traffic Police investigators in Florence noting the state of disrepair of the New Jersey barriers on the section of motorway between Barberino and Roncobilaccio. The report alleges negligence on the part of unknown persons, as defined by art. 355, paragraph 2.3 of the penal code (breach of public supply contracts concerning “goods or works designed to protect against danger or accidents to the public”). Preliminary investigations are still in progress, given that the Public Prosecutor’s Office has yet to take a final decision. Since June 20, 2012, the Polish Antitrust Authority has been conducting an Explanatory Proceeding to investigate Stalexport Autostrada Maloposka. The proceeding aims to investigate the company’s “abuse of its dominant position" with regard to the tolls charged to road users when carrying out construction and extraordinary maintenance work, given that Stalexport Autostrada Maloposka is held to operate as a "monopoly". Should the Authority rule that there has been an "abuse of its dominant position", the proceeding could result in a fine. In July 2011 Aeroporti di Roma was served with a writ by Swiss International Airlines Ltd. (“Swiss”), claiming the repayment of Euro 1.8 million due to a material error made in the initial quantification, equal to the excess amount paid by Swiss from 2002 to 2009 for take-off and landing fees. Aeroporti di Roma had applied the fees applicable to destinations outside the EU to flights to and from the Swiss Confederation, rather than those for EU flights. In August 2011, Aeroporti di Roma was served with another writ regarding a similar claim by Swiss, amounting to Euro 3.5 million (including interest) in passenger boarding fees. At the hearing of February 20, 2015, at the joint request of the parties, the judge ordered a further adjournment, to allow negotiations to take place, until July 10, 2015.

116 CONSOLIDATED FINANCIAL STATEMENTS AT DECEMBER 31, 2014
On April 7, 2014, Aeroporti di Roma was served with a writ by EasyJet Switzerland SA, claiming the repayment of Euro 1 million, plus interest, equal to the excess amount paid, according to the airline, between 2009 and 2013 (based on the fees applicable to destinations outside the EU) for take-off and landing fees and passenger boarding fees. At the initial hearing on October 23, 2014, the investigating judge set a deadline for the submission of further evidence and scheduled the next hearing for October 7, 2015. The Municipality of Fiumicino notified Aeroporti di Roma of two notices of assessment, contesting the company’s failure to declare and pay municipal property tax (ICI) for 2001 and 2002, in relation to the Hilton Rome Airport hotel. Believing that it had valid grounds for claiming that it was not liable to the tax, the company challenged the notices before the Provincial Tax Commission of Rome. On October 7, 2013, the Municipality of Fiumicino notified Aeroporti di Roma of five notices of assessment, contesting the company’s failure to pay municipal property tax (ICI) in relation to the Hilton Rome Airport hotel for the years from 2007 to 2011, and the failure to pay the tax for other buildings for the years from 2007 to 2009 alone. For these too, the company proceeded to challenge the notices of assessment before the Provincial Tax Commission. Since June 2014, Aeroporti di Roma has been notified of 92 challenges brought by 40 airlines before the Provincial Tax Commission of Rome and of six challenges brought before Lazio Regional Administrative Court (without requests for injunctions) by Alitalia CAI, AirOne, Alitalia Cityliner and CAI First, contesting the letters sent by Aeroporti di Roma requesting payment of IRESA for the period January - September 2014. Aeroporti di Roma is obliged to collect the tax under its Agreement with Lazio Regional Authority, following the entry into effect of Regional Law 2 of 29 April 2013. A date for the hearings has yet to be set.
Edizione S.r.l. Following a tax audit that took place in 2013, in April 2014 the Italian tax authorities served two assessments for 2010, concerning corporate income tax and VAT. On the basis of sound reasoning, backed by the company's legal advisors, the assessments are considered to be entirely without merit. In October 2014 an appeal was therefore filed with the Provincial Tax Commission of Treviso.
68 Fees paid to the external auditors
The following table presents the fees paid to the Parent Company’s external auditors (KPMG S.p.A.) and its network for all services provided to companies in Edizione Group in 2014. (Thousands of Euro) 2014
Type of service:
Auditing 2,268
Attestation services 997
Other services 1,119
Total 4,384

CONSOLIDATED FINANCIAL STATEMENTS AT DECEMBER 31, 2014 117
ANNEXES
LIST OF COMPANIES CONSOLIDATED AT DECEMBER 31, 2014
Company name Registered office Currency Share capital Percentage
held
Companies consolidated on a line-by-line basis
Parent Company and holding companies
Edizione S.r.l. Italy Euro 1,500,000,000
Schemaquattordici S.p.A. Italy Euro 1,067,494 58.99%
Sintonia S.p.A. Italy Euro 1,400,614 66.40%
Schematrentaquattro S.p.A. Italy Euro 100,000,000 100.00%
Schematrentasette S.r.l. Italy Euro 100,000 100.00%
Schematrentotto S.r.l. Italy Euro 100,000 100.00%
Food & beverage
Autogrill S.p.A. Italy Euro 68,688,000 50.10%
Ac Restaurants & Hotels Beheer NV Belgium Euro 3,250,000 100.00%
Anton Airfood Inc. USA Usd 1,000 100.00%
Anton Airfood Jfk Inc. USA Usd - 100.00%
Anton Airfood of Cincinnati Inc. USA Usd - 100.00%
Anton Airfood of Minnesota Inc. USA Usd - 100.00%
Anton Airfood of Newark Inc. USA Usd - 100.00%
Anton Airfood of Seattle Inc. USA Usd - 100.00%
Anton Airfood of Texas Inc. USA Usd - 100.00%
Anton Airfood of Tulsa Inc. USA Usd - 100.00%
Autogrill Aéroports Sas France Euro 2,207,344 100.00%
Autogrill Austria AG Austria Euro 7,500,000 100.00%
Autogrill Belux NV Belgium Euro 10,000,000 100.00%
Autogrill Catering UK Ltd United Kingdom Gbp 217,063 100.00%
Autogrill Commercial Catering France S.àr.l. (in liquidation) France Euro 361,088 100.00%
Autogrill Coté France Sas France Euro 31,579,526 100.00%
Autogrill Czech Sro Czech Republic Czk 154,463,000 100.00%
Autogrill Deutschland GmbH Germany Euro 205,000 100.00%
Autogrill Doo Slovenia Euro 1,342,670 100.00%
Autogrill FFH Autoroutes S.àr.l. France Euro 375,000 100.00%
Autogrill FFH Centres Villes S.àr.l. France Euro 375,000 100.00%
Autogrill Gares Métropoles S.àr.l. France Euro 4,500,000 100.00%
Autogrill Hellas Epe Greece Euro 3,696,330 100.00%
Autogrill Iberia Slu Spain Euro 7,000,000 100.00%
Autogrill Nederland BV The Netherlands Euro 41,371,500 100.00%
Autogrill Nederland Hotel Amsterdam BV The Netherlands Euro 150,000 100.00%
Autogrill Nederland Hotels BV The Netherlands Euro 1,500,000 100.00%
Autogrill Polska Sp Zoo Poland Pln 14,050,000 100.00%
Autogrill Restauration Carrousel Sas France Euro 2,337,000 100.00%
Autogrill Restauration Services Sas France Euro 15,394,500 100.00%
118 CONSOLIDATED FINANCIAL STATEMENTS AT DECEMBER 31, 2014
Company name Registered office Currency Share capital Percentage
held
Autogrill Russia Llc Russia Rub 10,000 100.00%
Autogrill Schweiz AG Switzerland Chf 23,183,000 100.00%
Autogrill VSB F&B Company Ltd Vietnam Euro 5,000,000 70.00%
Carestel Nord S.àr.l. (in liquidation) France Euro 76,225 99.80%
Fresno AAI Inc. USA Usd - 100.00%
HK Travel Centres GP Inc. Canada Cad - 51.00%
HK Travel Centres Lp Canada Cad - 51.00%
HMSHost Family Restaurants Inc. USA Usd 2,000 100.00%
HMSHost Finland Oy Finland Euro 2,500 100.00%
HMSHost Hospitality Services Bharath Pte Ltd India Inr 500,000 100.00%
HMSHost Motorways Inc. Canada Cad - 100.00%
HMSHost New Zealand Ltd New Zealand Nzd 1,520,048 100.00%
HMSHost (Shanghai) Catering Management Co Ltd China Rmb 7,140,000 100.00%
HMSHost Shanghai Enterprise Management Consulting Co Ltd China Cny - 100.00%
HMSHost Yiyeecek ve Icecek Hizmetleri As Turkey Trl 50,000 100.00%
HMS - Airport Terminal Services Inc. USA Usd 1,000 100.00%
HMSHost Egypt Caterig & Services Ltd Egypt Egp 1,000,000 60.00%
HMSHost Corporation USA Usd - 100.00%
HMSHost International Inc. USA Usd - 100.00%
HMSHost Ireland Ltd Ireland Euro 13,600,000 100.00%
HMSHost Services India Private Ltd India Inr 668,441,680 100.00%
HMSHost Singapore Pte Ltd Singapore Sgd 8,470,896 100.00%
HMSHost Sweden Ab Sweden Sek 2,500,000 100.00%
HMSHost Tollroads Inc. USA Usd - 100.00%
HMSHost Usa Inc. USA Usd - 100.00%
HMSHost Usa Llc USA Usd - 100.00%
Holding de Participations Autogrill Sas France Euro 84,581,920 100.00%
Horeca Exploitatie Maatschappij Schiphol BV The Netherlands Euro 45,400 100.00%
Host (Malaysia) Sdn Bhd Malaysia Myr - 100.00%
Host International (Poland) Spzoo (in liquidation) Poland Usd - 100.00%
Host International Inc. USA Usd - 100.00%
Host International of Canada Ltd Canada Cad 75,351,237 100.00%
Host International of Maryland Inc. USA Usd 1,000 100.00%
HMSHost International BV The Netherlands Euro 18,090 100.00%
Host Services Inc. USA Usd - 100.00%
Host Services of New York Inc. USA Usd 1,000 100.00%
Host Services Pty Ltd Australia Aud 6,252,872 100.00%
Islip AAI Inc. USA Usd - 100.00%
Marriott Airport Concessions Pty Ltd Australia Aud 3,910,102 100.00%
Michigan Host Inc. USA Usd 1,000 100.00%
NAG BV Russia Euro 100 60.00%
Nuova Sidap S.r.l. Italy Euro 100,000 100.00%
Palm Springs AAI Inc. USA Usd - 100.00%
Restair Uk Ltd (in liquidation) United Kingdom Gbp 1 100.00%

CONSOLIDATED FINANCIAL STATEMENTS AT DECEMBER 31, 2014 119
Company name Registered office Currency Share capital Percentage
held
Restoroute de la Gruyère SA Switzerland Chf 1,500,000 54.33%
Shenzen Host Catering Company Ltd (in liquidation) China Usd - 100.00%
SMSI Travel Centres Inc. Canada Cad 10,800,100 100.00%
Société Berrichonne de Restauration Sas (Soberest) France Euro 288,000 50.01%
Societé de Géstion Pétrolière Autogrill S.àr.l. (SGPA) France Euro 8,000 100.00%
Société de Restauration de Bourgogne SA (Sorebo) France Euro 144,000 50.00%
Société de Restauration de Troyes-Champagne SA (Srtc) France Euro 1,440,000 70.00%
Société Porte de Champagne SA (Spc) France Euro 153,600 53.44%
Volcarest SaS France Euro 1,050,144 50.00%
PT Autogrill Taurus Gemilang Indonesia Euro 1,000,000 49.00%
Host International Inc. of Kansas USA Usd 1,000 100.00%
HMSHost Nederland B.V. The Netherlands Euro 100 100.00%
Host Bush Lubbock Airport Joint Venture USA Usd - 90.00%
Host-Chelsea Joint Venture #1 USA Usd - 65.00%
Host-Tinsley Joint Venture USA Usd - 84.00%
Host/ Howell - Mickens Joint Venture USA Usd - 65.00%
Airside C F&B Joint Venture USA Usd - 70.00%
Bay Area Restaurant Group USA Usd - 49.00%
HMS - D/FW Joint Venture Airport USA Usd - 65.00%
HMS - Dallas Fort Worth Airport Joint Venture II USA Usd - 75.00%
HMSHost Coffee Partners Joint Venture USA Usd - 50.01%
Host - Prose Joint Venture II USA Usd - 51.00%
Host - Prose Joint Venture III USA Usd - 51.00%
Host & Garrett Joint Venture USA Usd - 75.00%
Host CTI Denver Airport Joint Venture USA Usd - 90.00%
Host D&D STL FB Llc USA Usd - 75.00%
Host PJJD Jacksonville Joint Venture USA Usd - 51.00%
Host Shellis Atlanta Joint Venture USA Usd - 70.00%
Host/Java Star Services Joint Venture USA Usd - 50.01%
Host/Diversified Joint Venture USA Usd 63 90.00%
Host/Forum Joint Venture USA Usd - 70.00%
Host/JQRDU Joint Venture USA Usd - 75.00%
Host/JV Ventures McCarran Joint Venture USA Usd - 60.00%
Host/LJA Joint Venture USA Usd - 85.00%
Host/Tarra Enterprises Joint Venture USA Usd - 75.00%
Host-Chelsea Joint Venture #3 USA Usd - 63.80%
Host-Chelsea Joint Venture #4 USA Usd - 63.00%
Host-Taco Joy Joint Venture USA Usd - 60.00%
HSTA JV USA Usd - 60.00%
Islip Airport Joint Venture USA Usd - 50.00%
Seattle Restaurant Associates USA Usd - 70.00%
Southwest Florida Airport Joint Venture USA Usd - 78.00%
Tinsley/Host - Tampa Joint Venture Company USA Usd - 49.00%
HMS/Blue Ginger Joint Venture USA Usd - 55.00%

120 CONSOLIDATED FINANCIAL STATEMENTS AT DECEMBER 31, 2014
Company name Registered office Currency Share capital Percentage
held
HMSHost Family Restaurants Llc Canada Cad - 100.00%
HMSHost Motorways, Inc. Canada Cad - 100.00%
Host/DFW AF, Llc USA Usd - 50.01%
Host Adevco Joint Venture USA Usd - 70.00%
Host Solai MDW FB, Llc USA Usd - 67.00%
Host MCA TEI FLL FB, Llc USA Usd - 76.00%
Host CTI DEN F&B STA, Llc USA Usd - 80.00%
HOST MCA SRQ FB, Llc USA Usd - 90.00%
HHL Cole's LAX F&B Llc USA Usd - 80.00%
Host-CTI DEN F&B II Llc USA Usd - 80.00%
Host FDY ORF F&B Llc USA Usd - 90.00%
Host Fox PHX F&B Llc USA Usd - 75.00%
Host GRL LIH F&B Llc USA Usd - 85.00%
Host H8 Terminal E F&B Llc USA Usd - 60.00%
Host Havana LAX F&B Llc USA Usd 90.00%
Host Havana LAX TBIT FB, Llc USA Usd - 70.00%
Host Howell Terminal A F&B Llc USA Usd - 65.00%
Host JQE RDU Prime Llc USA Usd - 85.00%
Host Lee JAX FB Llc USA Usd - 70.00%
Host LGO PHX F&B Llc USA Usd - 80.00%
Host TCC BHM F&B Llc USA Usd - 70.00%
Host WAB SAN FB Llc USA Usd - 95.00%
Host-CMS SAN F&B Llc USA Usd - 65.00%
Host CMS LAX TBIT F&B Llc USA Usd - 70.00%
Host-Love Field Partners I Llc USA Usd - 51.00%
LTL ATL JV Llc USA Usd - 70.00%
Host ATL Chefs JV 3 Llc USA Usd - 95.00%
Host ATL Chefs JV 5 Llc USA Usd - 85.00%
Host Honolulu Joint Venture Company USA Usd - 90.00%
Host of Kahului Joint Venture Company USA Usd - 90.00%
Host Houston 8 IAH Terminal B Llc USA Usd - 60.00%
Host-TFC-RSL Llc USA Usd - 65.00%
Host-True Flavors SAT Terminal A Fb USA Usd - 65.00%
Host of Hartford Ltd USA Usd - 75.00%
Host MGV DCA FB Llc USA Usd - 80.00%
Host MGV IAD FB Llc USA Usd - 65.00%
WDFG TAG ATL Retail Llc USA Usd - 86.00%
Host ECI ORD FB Llc USA Usd - 51.00%
Host Aranza Howell DFB B&E FB Llc USA Usd - 55.00%
Miami Airport FB Partners Joint Venture USA Usd - 70.00%
Host Kilmer Service Centres, Inc. Canada Cad 100 100.00%
Host-DMV DTW FB Llc (in liquidation) USA Usd - 79.00%
Travel retail
World Duty Free S.p.A. Italy Euro 63,720,000 50.10%
World Duty Free Group Sau Spain Euro 1,800,000 100.00%
CONSOLIDATED FINANCIAL STATEMENTS AT DECEMBER 31, 2014 121
Company name Registered office Currency Share capital Percentage
held
Airport Retail Pvt Limited India Inr 601,472,800 100.00%
Airside E JV n.a. Usd - 50.00%
Aldeasa Atlanta JV USA Usd - 76.00%
Aldeasa Atlanta Llc USA Usd 1,672,000 100.00%
Aldeasa Cabo Verde, S.A. Cabo Verde Cve 6,000,000 100.00%
Aldeasa Chile, Ltda. Chile Usd 2,516,819 100.00%
Aldeasa Curaçao NV Dutch Antilles Usd 500,000 100.00%
Aldeasa Duty Free Comercio e Importación de Productos Ltda Brazil Brl 1,560,000 100.00%
Aldeasa Italia S.r.l. Italy Euro 10,000 100.00%
Aldeasa Jamaica, Ltd. Jamaica Usd 280,000 100.00%
Aldeasa Jordan Airports Duty Free Shops Jordan Usd 705,218 100.00%
Aldeasa México SA de Cv Mexico Pxm 60,962,541 100.00%
Alpha Airports Retail Holdings Pvt Limited India Inr - 100.00%
Alpha ASD Ltd United Kingdom Gbp 20,000 100.00%
Alpha Retail Ireland Ltd Ireland Euro 1 100.00%
Alpha-Kreol (India) Pvt Ltd India Inr 100,000 50.00%
Alpha Keys Orlando Retail Associates, Llp USA Usd 100,000 85.00%
WDFG Holdings UK Pension Trustees Ltd (formerly Autogrill Hold-ings UK Pension Trustees Ltd) United Kingdom Gbp 100 100.00%
WDFG GB Limited United Kingdom Gbp 1,000 100.00%
Cancouver Uno, Slu Spain Euro 3,010 100.00%
Houston 8-WDFG JV n.a. Usd - 60.00%
WDFG Miami Airport Retail Partners JV n.a. Usd - 70.00%
Autogrill Lanka Ltd Sri Lanka Slr 30,000,000 99.95%
Phoenix-WDFG JV USA Usd - 70.00%
Prestadora de Servicios en Aeropuertos SA de Cv Mexico Pxm 50,000 100.00% Sociedad de Distribución Comercial Aeroportuaria de Canarias, Sl Spain Euro 667,110 60.00%
WDFG Adevco JV n.a. Usd - 70.00%
WDFG Bush Lubbock Airport JV n.a. Usd - 90.00%
WDFG Canada Inc. Canada Cad 1,000 100.00%
WDFG Germany GmbH Germany Euro 250,000 100.00%
WDFG Helsinki OY Finland Euro 2,500 100.00%
WDFG Italia S.r.l. (in liquidation) Italy Euro 10,000 100.00%
WDFG Jersey Limited United Kingdom Gbp 4,100 100.00%
WDFG JV Holdings Llc USA Usd - 100.00%
WDFG North America Llc USA Usd 72,047,935 100.00%
WDFG PROSE JV II n.a. Usd - 70.00%
WDFG UK Holdings Limited United Kingdom Gbp 12,484,397 100.00%
WDFG UK Limited United Kingdom Gbp 360,000 100.00%
WDFG US Inc. USA Usd 165,842,137 100.00%
WDFG Vancouver Lp Canada Cad 9,500,000 100.00%
WDFG-Chelsea JV 1 n.a. Usd - 65.00%
WDFG-DFW AF Llc USA Usd - 50.01%
WDFG-Diversified JV n.a. Usd - 90.00%
WDFG-DMV DTW Retail Llc USA Usd - 79.00%
122 CONSOLIDATED FINANCIAL STATEMENTS AT DECEMBER 31, 2014
Company name Registered office Currency Share capital Percentage
held
WDFG-ELN MSP Terminal 2 Retail Llc USA Usd - 90.00%
WDFG-Houston 8 San Antonio JV USA Usd - 63.00%
WDFG-Houston 8 Terminal E, Llc USA Usd - 60.00%
WDFG-Howell Mickens JV III n.a. Usd - 51.00%
WDFG-Howell Mickens Terminal A Retail I JV USA Usd - 65.00%
WDFG-Howell-Mickens JV n.a. Usd - 65.00%
WDFG-Howell-Mickens, Terminal A Retail II, Llc USA Usd - 65.00%
WDFG-Java Star JV n.a. Usd - 50.01%
WDFG-Love Field Partners II, Llc USA Usd - 51.00%
WDFG-Love Field Partners III, Llc USA Usd - 51.00%
WDFG-Solai MDW Retail, Llc USA Usd - 67.00%
WDFG-SPI DEN Retail Llc USA Usd - 75.00%
WDFG-Tinsley JV n.a. Usd - 84.00%
World Duty Free Group Espana, SA Spain Euro 10,772,462 99.93%
World Duty Free US Inc. USA Usd 1,400,000 100.00%
WDFG France Snc France Euro 5,000 100.00%
WDFG Detroit&Partners Llc USA Usd - 80.00%
WDFG-Stellar TPA 1 Llc USA Usd - 70.00%
WDFG CA Llc USA Usd - 65.00%
Alpha Airports Group (Channel Islands) Ltd United Kingdom Gbp 21 100.00%
Audioguiarte Sl Spain Euro 251,000 100.00%
Palacios y Museos Slu Spain Euro 160,000 100.00%
Panalboa SA Panama Pab 150,000 80.00%
Textiles & clothing
Aerre S.r.l. (in liquidation) Italy Euro 15,000 60.00%
Ben Mode AG Switzerland Chf 500,000 100.00%
Benetton 2 Retail Comércio de Produtos Texteis SA Portugal Euro 500,000 100.00%
Benetton Agency Ireland Ltd Ireland Euro 260,000 100.00%
Benetton Asia Pacific Ltd Hong Kong Hkd 41,400,000 100.00%
Benetton Canada Inc. Canada Cad 13,600,000 100.00%
Benetton Comercio de Produtos Texteis do Brasil Ltda Brazil Brl 20,000,000 100.00%
Benetton Commerciale Tunisie S.àr.l. Tunisia Tnd 2,429,000 100.00%
Benetton de Commerce International Tunisie S.àr.l. Tunisia Tnd 150,000 100.00%
Benetton Denmark Aps Denmark Dkk 125,000 100.00%
Benetton France Commercial Sas France Euro 10,000,000 100.00%
Benetton France S.àr.l. France Euro 99,495,712 100.00%
Benetton Giyim Sanayi ve Ticaret As Turkey Try 31,193,348 100.00%
Schematrentanove S.p.A. (formerly Benetton Group S.p.A.) Italy Euro 237,482,716 100.00%
Benetton Group S.r.l. Italy Euro 200,000,000 100.00%
Benetton Hellas Agency of Clothing Single Partner Epe Greece Euro 50,010 100.00%
Benetton India Pvt Ltd India Inr 2,900,000,000 100.00%
Benetton Industrielle Tunisie S.àr.l. Tunisia Tnd 2,000,000 100.00%
Benetton International Kish Pjsc Iran Irr 100,000,000 100.00%
Benetton International SA Luxembourg Euro 133,538,470 100.00%

CONSOLIDATED FINANCIAL STATEMENTS AT DECEMBER 31, 2014 123
Company name Registered office Currency Share capital Percentage
held
Benetton Istanbul Real Estate Emlak Yatirim ve Insaat Ticaret Ltd Turkey Try 34,325,000 100.00%
Benetton Japan Co Ltd Japan Jpy 400,000,000 100.00%
Benetton Korea Inc. South Korea krw 2,500,000,000 50.00%
Benetton Latvia Llc Lettony Lvl 630,000 100.00%
Benetton Manufacturing Tunisia S.àr.l. Tunisia Tnd 700,000 100.00%
Benetton Mexicana SA de Cv Mexico Mxn 357,000,405 100.00%
Benetton Nekretnine Doo - Benetton Real Estate Ltd Bosnia and Herzegovina Bam 20,000 100.00%
Benetton Pars Pjsc Iran Irr 50,000,000 100.00%
Benetton Real Estate Austria GmbH Austria Euro 2,500,000 100.00%
Benetton Real Estate Belgique SA Belgium Euro 14,500,000 100.00%
Benetton Real Estate International SA Luxembourg Euro 116,600,000 100.00%
Benetton Real Estate Kazakhstan Llp Kazakhstan Kzt 62,920,000 100.00%
Benetton Realty France SA France Euro 15,002,250 100.00%
Benetton Realty Portugal Imobiliaria SA Portugal Euro 100,000 100.00%
Benetton Realty Spain Sl Spain Euro 10,180,300 100.00%
Benetton Realty Sukhbaatar Llc Mongolia Mnt 115,000,000 100.00%
Benetton Retail (1988) Ltd (in liquidation) United Kingdom Gbp 61,000,000 100.00%
Benetton Retail Deutschland GmbH Germany Euro 2,000,000 100.00%
Benetton Retail Italy S.r.l. Italy Euro 5,100,000 100.00%
Benetton Retail Poland Sp Zoo Poland Pln 8,300,000 100.00%
Benetton Retail Spain SL Spain Euro 10,180,300 100.00%
Benetton Russia Ooo Russia Rub 223,518,999 100.00%
Benetton Serbia Doo Serbia Rsd 1,138,444,166 100.00%
Benetton Services SA de Cv Mexico Mxn 50,000 100.00%
Benetton Services II SA de Cv Mexico Mxn 50,000 100.00%
Benetton Tekstil Doo Croatia Hrk 155,750,000 100.00%
Benetton Trading Taiwan Ltd Taiwan Twd 115,000,000 100.00%
Benetton Trading Hungary Kft (in liquidation) Hungary Huf 50,000,000 100.00%
Benetton Trading Usa Inc. USA Usd 219,147,833 100.00%
Benetton Hungary Kft Hungary Euro 89,190 100.00%
Benetton Usa Corp USA Usd 219,654,000 100.00%
Fabrica S.p.A. Italy Euro 4,128,000 100.00%
Filatura di Vittorio Veneto S.r.l. Italy Euro 110,288 50.00%
Hotel Union Llc Kosovo Euro 3,200,000 100.00%
Kaliningrad Real Estate Ooo Russia Rub 10,000 100.00%
Kazan Real Estate Ooo Russia Rub 12,010,000 100.00%
Milano Report S.r.l. Italy Euro 1,000,000 100.00%
New Ben GmbH Germany Euro 5,000,000 100.00%
Olimpias Group S.r.l. Italy Euro 50,000,000 100.00%
Olimpias Knitting Serbia Doo Serbia Euro 10,000 60.00%
Olimpias Retail RS Doo Serbia Euro 10,000 100.00%
Olimpias Tunisia S.àr.l. Tunisia Tnd 100,000 100.00%
Ponzano Children S.r.l. Italy Euro 110,000 100.00%
Progetto Uno S.r.l. Italy Euro 20,000 100.00%
Property Russia Ooo Russia Rub 10,000 100.00%

124 CONSOLIDATED FINANCIAL STATEMENTS AT DECEMBER 31, 2014
Company name Registered office Currency Share capital Percentage
held
Real Estate Russia Ooo Russia Rub 120,010,000 100.00%
Real Estate Ukraine Llc Ukraine Usd 7,921 100.00%
Real Estate Management Ooo Russia Rub 250,000,000 100.00%
Sc Anton Industries S.r.l. Rumania Ron 1,162,460 60.00%
Sc Benrom S.r.l. Rumania Ron 1,416,880 100.00%
Shanghai Benetton Trading Company Ltd China Usd 37,821,056 100.00%
United Colors Communication SA Switzerland Chf 1,000,000 100.00%
Villa Minelli Società agricola a r.l. Italy Euro 110,000 100.00%
Infrastructures and services for mobility
Atlantia S.p.A. Italy Euro 825,783,990 45.56%
Atlantia Bertin Concessoes SA Brazil Brl 773,739,894 50.00%
AD Moving S.p.A. Italy Euro 1,000,000 100.00%
Autostrade Concessoes e Partecipaçoes Brasil Ltda Brazil Brl 729,590,863 100.00%
Autostrade dell'Atlantico S.r.l. Italy Euro 1,000,000 100.00%
Autostrade Holding do Sur SA Chile Clp 51,496,805,692 100.00%
Autostrade Indian Infrastructure Development Pvt Ltd India Inr 500,000 100.00%
Autostrade Meridionali S.p.A. Italy Euro 9,056,250 58.98%
Autostrade per l'Italia S.p.A. Italy Euro 622,027,000 100.00%
Autostrade Portugal - Concessoes de Infraestructuras SA Portugal Euro 30,000,000 100.00%
Autostrade Tech S.p.A. Italy Euro 1,120,000 100.00%
Concessionaria da Rodovia MG 050 SA Brazil Brl 53,976,022 50.00%
Dannii Holding GmbH Austria Euro 10,000 100.00%
Electronic Transactions Consultants Co USA Usd 20,000 64,46%
Ecomouv' D&B Sas France Euro 500,000 75.00%
Ecomouv' Sas France Euro 30,000,000 70.00%
EsseDiEsse Società di Servizi S.p.A. Italy Euro 500,000 100.00%
Giove Clear S.r.l. Italy Euro 10,000 100.00%
Grupo Costanera SA Chile Clp 465,298,430,418 50.01%
Infoblu S.p.A. Italy Euro 5,160,000 75.00%
Infra Bertin Partecipaçoes SA Brazil Brl 738,652,989 50.00%
Mizard S.r.l. Italy Euro 10,000 100.00%
Pavimental Polska Sp Zoo Poland Pln 3,000,000 98.58%
Pavimental S.p.A. Italy Euro 10,116,452 98.58%
Raccordo Autostradale Valle d'Aosta S.p.A. Italy Euro 343,805,000 24.46%
Rodovias das Colinas SA Brazil Brl 226,145,401 50.00%
Sociedad Concesionaria AMB SA Chile Clp 5,875,178,700 50.01%
Sociedad Concesionaria Autopista Nororiente SA Chile Clp 22,738,904,654 50.01%
Sociedad Concesionaria Autopista Nueva Vespucio Sur SA Chile Clp 166,967,672,229 50.01%
Sociedad Concesionaria Vespucio Sur SA Chile Clp 52,967,792,704 50.01%
Sociedad Concesionaria de los Lagos SA Chile Clp 53,602,284,061 100.00%
Sociedad Concesionaria Costanera Norte SA Chile Clp 58,859,765,519 50.01%
Sociedad Concesionaria Litoral Central SA Chile Clp 18,368,224,675 50.01%
Sociedad Gestion Vial SA Chile Clp 397,237,788 50.01%
Sociedad Operacion y Logistica de Infraestructuras SA Chile Clp 11,736,819 50.01%
Società Italiana per Azioni per il Traforo del Monte Bianco Italy Euro 198,749,200 51.00%

CONSOLIDATED FINANCIAL STATEMENTS AT DECEMBER 31, 2014 125
Company name Registered office Currency Share capital Percentage
held
Spea Ingegneria Europea S.p.A. Italy Euro 5,160,000 98.90%
Spea do Brasil Projectos e Infraestrutura Ldta Brazil Brl 1,000,000 98.90%
Stalexport Autoroute S.àr.l. Luxembourg Euro 56,149,500 61.20%
Stalexport Autostrada Malopolska SA Poland Pln 66,753,000 61.20%
Stalexport Autostrady SA Poland Pln 185,446,517 61.20%
Tangenziale di Napoli S.p.A. Italy Euro 108,077,490 100.00%
Tech Solutions Integrators Sas France Euro 2,000,000 100.00%
Telepass S.p.A. Italy Euro 26,000,000 100.00%
Telepass France Sas France Euro 1,000,000 100.00%
Triangulo do sol Auto-Estradas SA Brazil Brl 71,000,000 50.00%
Triangulo do Sol Partecipaçoes SA Brazil Brl 1,122,539,010 50.00%
VIA4 SA Poland Pln 500,000 33.66%
Aeroporti di Roma S.p.A. Italy Euro 62,224,743 95.92%
ADR Engineering S.p.A. Italy Euro 774,690 100.00%
ADR Tel S.p.A. Italy Euro 600,000 95.92%
ADR Advertising S.p.A. Italy Euro 1,000,000 95.92%
ADR Sviluppo S.r.l. Italy Euro 100,000 95.92%
ADR Assistance S.r.l. Italy Euro 6,000,000 95.92%
ADR Mobility S.r.l. Italy Euro 1,500,000 95.92%
ADR Security S.r.l. Italy Euro 400,000 95.92%
Airport Cleaning S.r.l. Italy Euro 1,500,000 95.92%
Fiumicino Energia S.r.l. Italy Euro 741,795 87.14%
Leonardo Energia - Società Consortile a r.l. Italy Euro 10,000 88.02%
Romulus Finance S.r.l. Italy Euro 10,000
Other companies
Edizione Property S.p.A. Italy Euro 8,780,500 100.00%
Edizione Alberghi S.r.l. Italy Euro 5,000,000 100.00%
Edizione Realty Czech Sro Czech Republic Czk 100,000,000 100.00%
Realty Capri S.r.l. Italy Euro 100,000 100.00%
Maccarese società agricola p.A. Italy Euro 34,485,805 100.00%
Cia de Tierras Sud Argentino SA Argentina Ars 253,000,000 100.00%
San Giorgio S.r.l. Italy Euro 100,000 100.00%
Allevamento San Giorgio S.r.l. Italy Euro 50,000 100.00%
Verde Sport S.p.A. Italy Euro 8,000,000 100.00%
Asolo Golf Club S.r.l. Italy Euro 100,000 100.00%
Associates valued on an equity basis
Caresquick NV Belgium Euro 3,300,000 50.00%
Dewina Host Sdn Bhd Malaysia Myr 250,000 49.00%
HKSC Developments Lp (Projecto) Canada Cad - 49.00%
HKSC Opco Lp (Opco) Canada Cad - 49.00%
Autogrill Middle East Llc Abu Dhabi Aed 100,000 49.00%
Autostrade for Russia GmbH Austria Euro 60,000 25.50%
A&T Road Construction Management and Operation Pvt Ltd India Inr 100,000 50.00%
Concesionaria Rodovias do Tieté SA Brazil Brl 248,578,476 50.00%
Pune Solapur Expressways Pvt Ltd India Inr 100,000,000 50.00%

126 CONSOLIDATED FINANCIAL STATEMENTS AT DECEMBER 31, 2014
Company name Registered office Currency Share capital Percentage
held Arcea Lazio S.p.A. (in liquidation) Italy Euro 1,983,469 34.00%
Bologna & Fiera Parking S.p.A. Italy Euro 9,000,000 32.50%
Biuro Centrum Sp Zoo Poland Pln 80,000 40.63%
GEIE del Traforo del Monte Bianco Italy Euro 2,000,000 50.00%
Pedemontana Veneta S.p.A. (in liquidation) Italy Euro 6,000,000 29.77%
Società Infrastrutture Toscane S.p.A. Italy Euro 30,000,000 46.60%
Società Autostrada Tirrenica Italy Euro 24,460,800 24.98%
Subsidiaries and associates carried on at cost or fair value
Eurostazioni S.p.A. Italy Euro 155,200,000 32.71%
Pavimental Est Ao (in liquidation) Russia Rub 4,200,000 100.00%
Petrostal SA (in liquidation) Poland Pln 2,050,500 100.00%
Domino S.r.l. Italy Euro 10,000 100.00%
Gemina Fiduciary Services SA Luxembourg Euro 150,000 99.99%
Immobiliare Italy S.r.l. (formerly Olimpias Retail S.r.l.) Italy Euro 20,000 100.00%
Anton Industries Macedonia Llc (non operating) Republic of Macedonia
Euro 10,000 60.00%
Benetton Beograd Doo Serbia Euro 500 100.00%
Benetton Real Estate Azerbaijan Llc Azerbaijan Usd 130,000 100.00%
Bensec Scarl Italy Euro 110,000 78.00%
CONSOLIDATED FINANCIAL STATEMENTS AT DECEMBER 31, 2014 127
REPORT OF THE INDEPENDENT AUDITORS

128 CONSOLIDATED FINANCIAL STATEMENTS AT DECEMBER 31, 2014

129

130
CONTACTS Edizione S.r.l. Calmaggiore, 23 31100 Treviso - Italy Tel. +39 0422 5995 Fax +39 0422 412176 [email protected] www.edizione.it Fiscal code, VAT and Treviso Companies’ Register number 00778570267 REA CCIAA Treviso 148942 Share capital Euro 1,500,000,000.00 fully paid-in Translation from the Italian original which remains the definitive version

BILANCIO CONSOLIDATO 2014
BILA
NC
IO C
ON
SO
LIDA
TO
2014
www.edizione.it