Sino-Ocean Group Holding Limited (3377.HK)
31
2020 ANNUAL RESULTS Sino-Ocean Group Holding Limited (3377.HK) March 2021
-
Upload
khangminh22 -
Category
Documents
-
view
1 -
download
0
Transcript of Sino-Ocean Group Holding Limited (3377.HK)

2020 ANNUAL RESULTS
Sino-Ocean Group Holding Limited (3377.HK)
March 2021

BUSINESS
REVIEW

Contracted sales: Total sales RMB131.04 bn, a slight YoY growth.
GFA sold: 7.06 mn sqm, up 11% YoY.
ASP: RMB18,600/sqm, a drop of 9% YoY, mainly attributable to regional distribution and product structure.
Cash proceeds: RMB88.8 bn, up 13% YoY, a record high; cash collection rate* reached 93%.
3.52 3.009.00 8.03 8.21
10.08 9.04 9.12
16.03 16.11 16.10
22.8
167 143459 440 454 523 483 493
692894 892
1,423
21,100 21,00019,600
18,300 18,10019,300 18,700 18,500
23,200
18,000 18,000 16,000
Jan Feb Mar Apr May Jun Jul Aug Sep Oct Nov Dec
Contracted sales (RMB bn) GFA sold ('000 sqm) ASP (RMB/sqm)
Monthly contracted sales in 2020 Cash collection
( RMB bn)
68.078.6
88.8
87% 89%93%
2018 2019 2020
Cash proceeds Cash collection rate
*Cash collection rate = cash proceeds/ attributable sales
Contracted sales

Contracted sales (cont.)
Beijing Region30%
Bohai Rim Region
19%
Eastern Region
15%
Central Region
11%
Western Region7%
Southern Region
18%
Distribution (by amount)
Sales distribution: By regions, sales focused on 6 major core regions, of which Beijing Region 30%, Bohai
Rim Region 19%, Eastern Region 15%, Southern Region 18%, Central and Western Region 18%; by city tiers,
T1&2 cities reached 94%, of which T1 35%, T2 59%.
Sales highlights: various projects in core cities topped sales chart, such as Oriental World View (Wuhan), Xixi
Mansion (Hangzhou), Ocean Palace (Shenzhen) and Sino-Ocean Royal Landscape (Xi'an), etc.
Sales highlights
Oriental World View (Wuhan)
No. 1 in Wuhan by sales amount
Xixi Mansion (Hangzhou)
No. 3 by regional sales amount
Sino-Ocean Royal Landscape (Xi'an)
No. 2 by regional sales amount
Ocean Palace (Shenzhen)
100% sell-through ratio
By region By city tier*
Tier 135%
Tier 259%
Tier 3 & 46%
Note: According to CBN2020 city classification standard
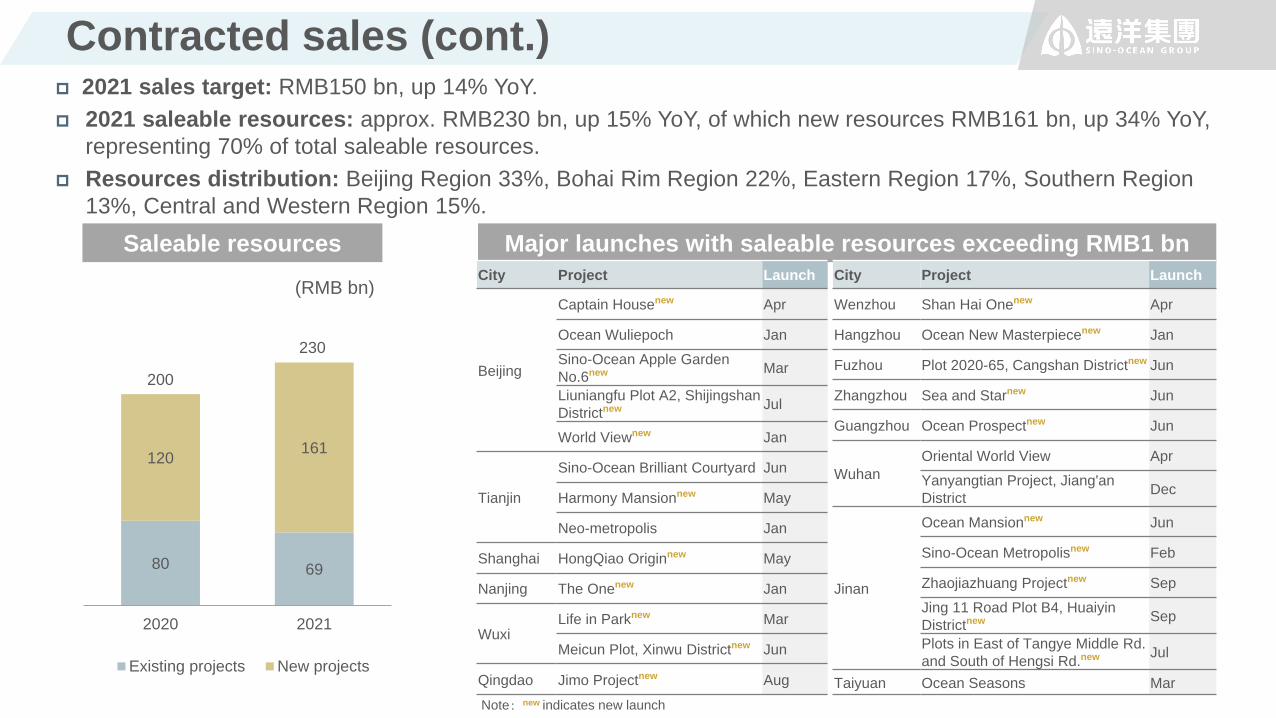
Contracted sales (cont.) 2021 sales target: RMB150 bn, up 14% YoY.
2021 saleable resources: approx. RMB230 bn, up 15% YoY, of which new resources RMB161 bn, up 34% YoY,
representing 70% of total saleable resources.
Resources distribution: Beijing Region 33%, Bohai Rim Region 22%, Eastern Region 17%, Southern Region
13%, Central and Western Region 15%.
Saleable resources
80 69
120161
2020 2021
Existing projects New projects
230
(RMB bn)
200
Major launches with saleable resources exceeding RMB1 bn
City Project Launch
Beijing
Captain Housenew Apr
Ocean Wuliepoch Jan
Sino-Ocean Apple Garden
No.6new Mar
Liuniangfu Plot A2, Shijingshan
Districtnew Jul
World Viewnew Jan
Tianjin
Sino-Ocean Brilliant Courtyard Jun
Harmony Mansionnew May
Neo-metropolis Jan
Shanghai HongQiao Originnew May
Nanjing The Onenew Jan
WuxiLife in Parknew Mar
Meicun Plot, Xinwu Districtnew Jun
Qingdao Jimo Projectnew Aug
City Project Launch
Wenzhou Shan Hai Onenew Apr
Hangzhou Ocean New Masterpiecenew Jan
Fuzhou Plot 2020-65, Cangshan Districtnew Jun
Zhangzhou Sea and Starnew Jun
Guangzhou Ocean Prospectnew Jun
Wuhan
Oriental World View Apr
Yanyangtian Project, Jiang'an
District Dec
Jinan
Ocean Mansionnew Jun
Sino-Ocean Metropolisnew Feb
Zhaojiazhuang Projectnew Sep
Jing 11 Road Plot B4, Huaiyin
Districtnew Sep
Plots in East of Tangye Middle Rd.
and South of Hengsi Rd.new Jul
Taiyuan Ocean Seasons Mar
Note:new indicates new launch
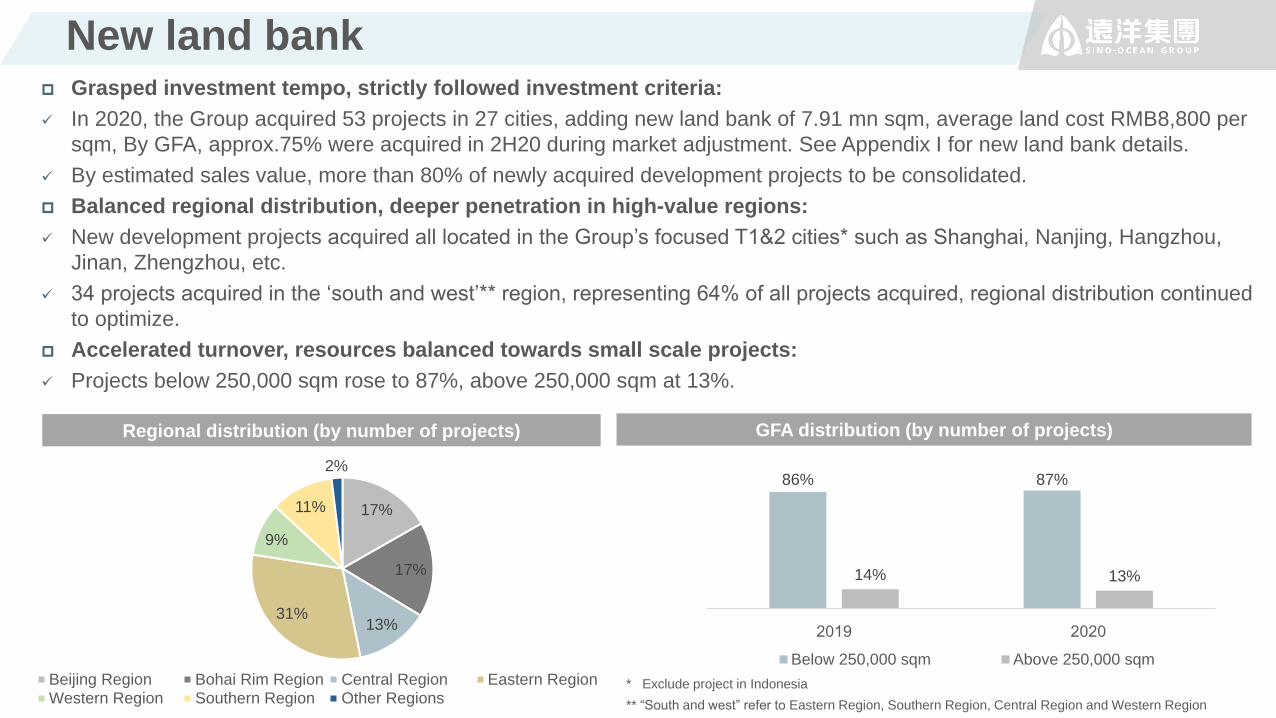
New land bank Grasped investment tempo, strictly followed investment criteria:
In 2020, the Group acquired 53 projects in 27 cities, adding new land bank of 7.91 mn sqm, average land cost RMB8,800 per
sqm, By GFA, approx.75% were acquired in 2H20 during market adjustment. See Appendix I for new land bank details.
By estimated sales value, more than 80% of newly acquired development projects to be consolidated.
Balanced regional distribution, deeper penetration in high-value regions:
New development projects acquired all located in the Group’s focused T1&2 cities* such as Shanghai, Nanjing, Hangzhou,
Jinan, Zhengzhou, etc.
34 projects acquired in the ‘south and west’** region, representing 64% of all projects acquired, regional distribution continued
to optimize.
Accelerated turnover, resources balanced towards small scale projects:
Projects below 250,000 sqm rose to 87%, above 250,000 sqm at 13%.
* Exclude project in Indonesia
GFA distribution (by number of projects)
** “South and west” refer to Eastern Region, Southern Region, Central Region and Western Region
Regional distribution (by number of projects)
17%
17%
13%31%
9%
11%
2%
Beijing Region Bohai Rim Region Central Region Eastern Region
Western Region Southern Region Other Regions
86% 87%
14% 13%
2019 2020
Below 250,000 sqm Above 250,000 sqm
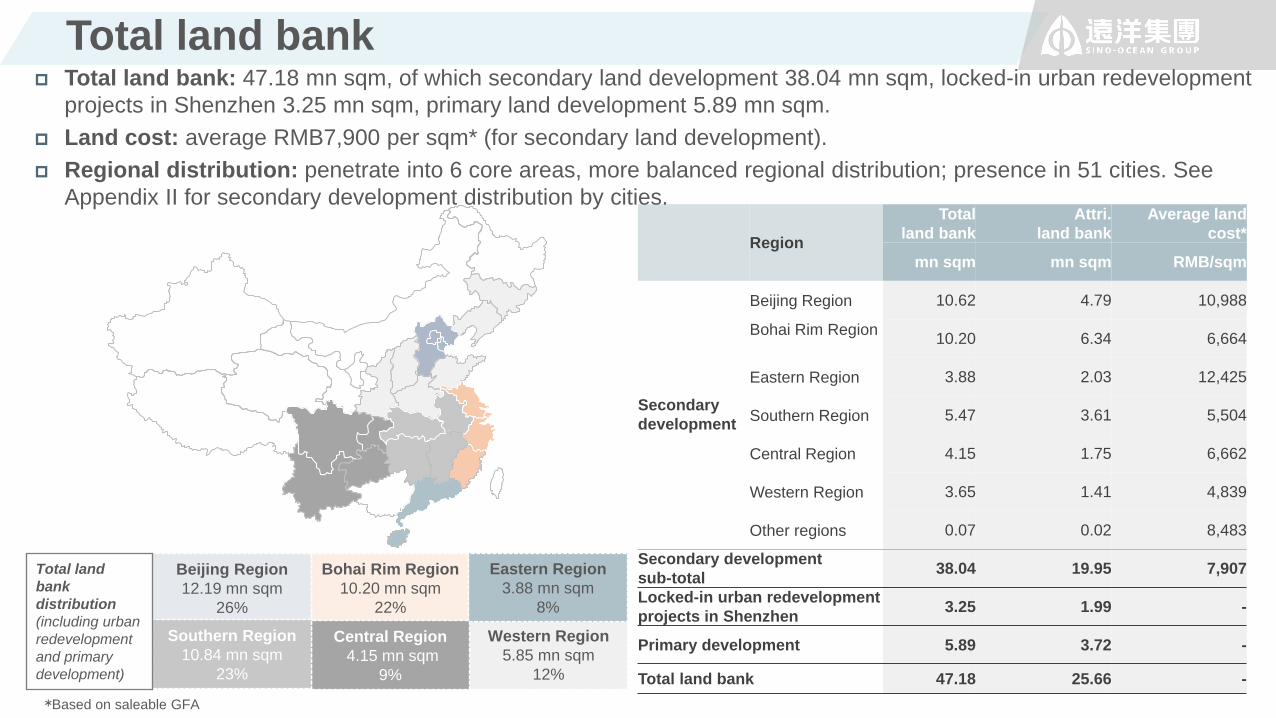
Total land bank
7*Based on saleable GFA
Western Region
5.85 mn sqm
12%
Beijing Region
12.19 mn sqm
26%
Bohai Rim Region
10.20 mn sqm
22%
Eastern Region
3.88 mn sqm
8%
Central Region
4.15 mn sqm
9%
Southern Region
10.84 mn sqm
23%
Total land
bank
distribution
(including urban
redevelopment
and primary
development)
Region
Total
land bank
Attri.
land bank
Average land
cost*
mn sqm mn sqm RMB/sqm
Secondary
development
Beijing Region 10.62 4.79 10,988
Bohai Rim Region10.20 6.34 6,664
Eastern Region 3.88 2.03 12,425
Southern Region 5.47 3.61 5,504
Central Region 4.15 1.75 6,662
Western Region 3.65 1.41 4,839
Other regions 0.07 0.02 8,483
Secondary development
sub-total38.04 19.95 7,907
Locked-in urban redevelopment
projects in Shenzhen3.25 1.99 -
Primary development 5.89 3.72 -
Total land bank 47.18 25.66 -
Total land bank: 47.18 mn sqm, of which secondary land development 38.04 mn sqm, locked-in urban redevelopment
projects in Shenzhen 3.25 mn sqm, primary land development 5.89 mn sqm.
Land cost: average RMB7,900 per sqm* (for secondary land development).
Regional distribution: penetrate into 6 core areas, more balanced regional distribution; presence in 51 cities. See
Appendix II for secondary development distribution by cities.

88
Project reserve: 4.32 mn sqm, of which 6 projects are acquired, with land bank of 1.07 mn sqm; another 5 projects
are locked in, with GFA of 3.25 mn sqm. In 1H20 newly locked in Pingxi Project in Longgang District, with GFA of
97,000 sqm.
Launch schedule: 4 projects in sale for 2020, including 2 brand new projects of Ocean Palace and Ocean Seafront
Towers, generating sales of RMB11.9 bn, nearly 100% sell-through ratio; Lishan Project, De’ai and Pingxi Project are
estimated to be launched in 2022.
De’ai Project Shanxia Project Sino-Ocean Dream Land
Ocean Express
Dapeng Project
Nanyuan Village Project
Ocean Palace
远洋滨海大厦
Lishan Project
Honghualing Project
Acquired Project
Locked-in Project
Pingxi Project
Ocean Seafront Towers
Project Status Location TypeAttri.
interest
GFA
‘000 sqm
Launch
schedule
Sino-Ocean Dream Land AcquiredLonggang
DistrictUrban complex 100% 10 In sale
Ocean Express AcquiredLonggang
DistrictUrban complex 85% 145 In sale
Ocean Seafront Towers AcquiredNanshan
DistrictUrban complex 60% 77 In sale
Ocean Palace AcquiredNanshan
DistrictResidential 63% 148 In sale
Lishan Project AcquiredNanshan
DistrictResidential 60% 156 2022
De’ai Industrial Park AcquiredLonghua
DistrictUrban complex 80% 533 2022
Land bank Subtotal 1,069
Pingxi Projectnew Locked-inLonggang
DistrictResidential 100% 97 2022
Shanxia Project Locked-inLonggang
District
Urban
complex55% 941 2023
Honghualing Industrial
District ProjectLocked-in
Nanshan
District
Urban
complex51% 838 2024
Dapeng Project Locked-inDapeng New
DistrictResidential 65% 230 2024
Nanyuan Village Project Locked-inNanshan
District
Urban
complex70% 1,147 2026
Locked-in Subtotal 3,253
Total 4,322
Total land bank (cont.)-urban redevelopment projects in Shenzhen
FINANCIAL
REVIEW
Result analysis
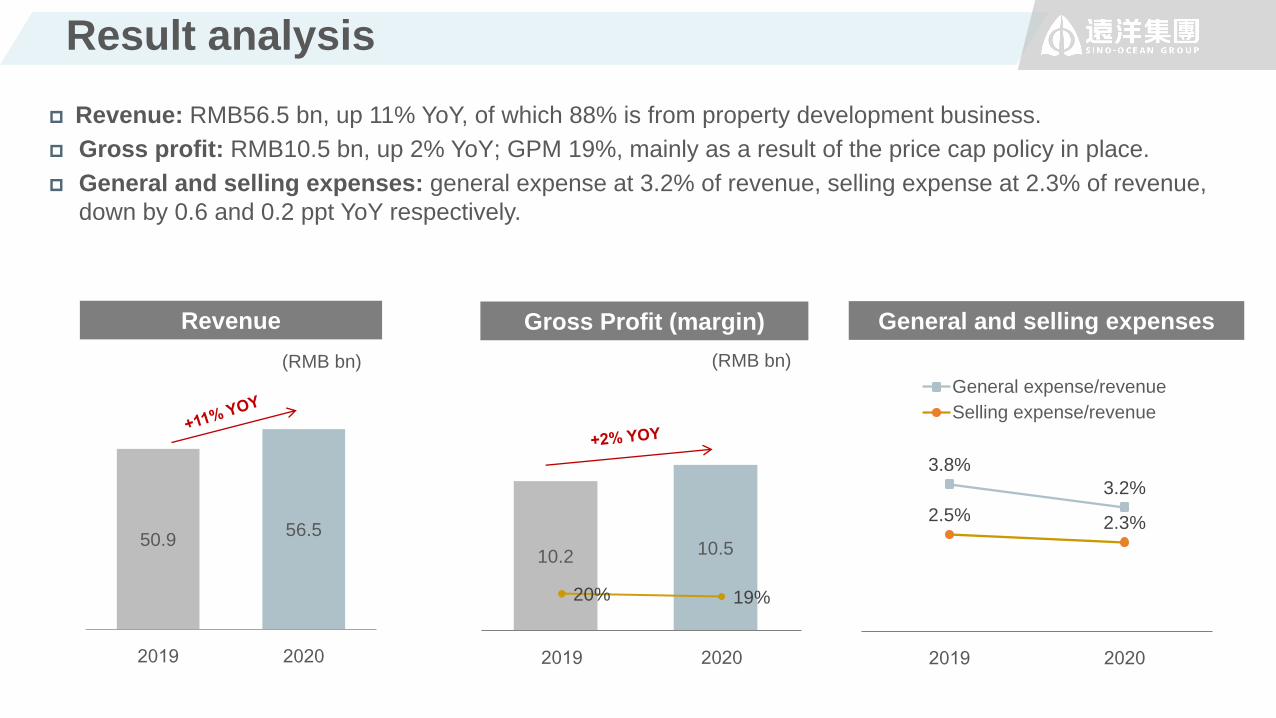
Revenue: RMB56.5 bn, up 11% YoY, of which 88% is from property development business.
Gross profit: RMB10.5 bn, up 2% YoY; GPM 19%, mainly as a result of the price cap policy in place.
General and selling expenses: general expense at 3.2% of revenue, selling expense at 2.3% of revenue,
down by 0.6 and 0.2 ppt YoY respectively.
3.8%
3.2%
2.5% 2.3%
2019 2020
General expense/revenue
Selling expense/revenue
Revenue
(RMB bn)
Gross Profit (margin)
(RMB bn)
General and selling expenses
10.2 10.5
20% 19%
0.0%
20.0%
40.0%
60.0%
80.0%
100.0%
80
85
90
95
100
105
110
2019 2020
50.956.5
2019 2020

Result analysis (cont.)
Net profit: RMB2.87 bn, up by
8% YoY, as a result of
tightened SG&A and finance
expenses control and lower
tax expenses.
Core net profit: RMB2.23 bn,
up by 7% YoY.
Dividend: RMB0.131/share,
dividend payout ratio at 35% of
net profit. Dividend yield of 9%
based on 23 Mar closing price.
(RMB mn) 2020 2019 YoY Change
Revenue 56,511 50,926 11%
Gross Profit 10,457 10,222 2%
Other income 2,394 2,771
SG&A and finance expenses -5,220 -5,583
Fair value gains -156 373
Other gains 1,335 699
Losses and gains of JCEs 1,241 1,935
Profit before tax 10,050 10,416 -4%
LAT and income tax -5,367 -6,250
Profit for the year 4,683 4,166 12%
Non-controlling interests -1,817 -1,510
Profit attributable to owners
of the company2,866 2,656 8%
Basic EPS (RMB cents) 37.6 34.9
All ‘green’ for the three red lines policy
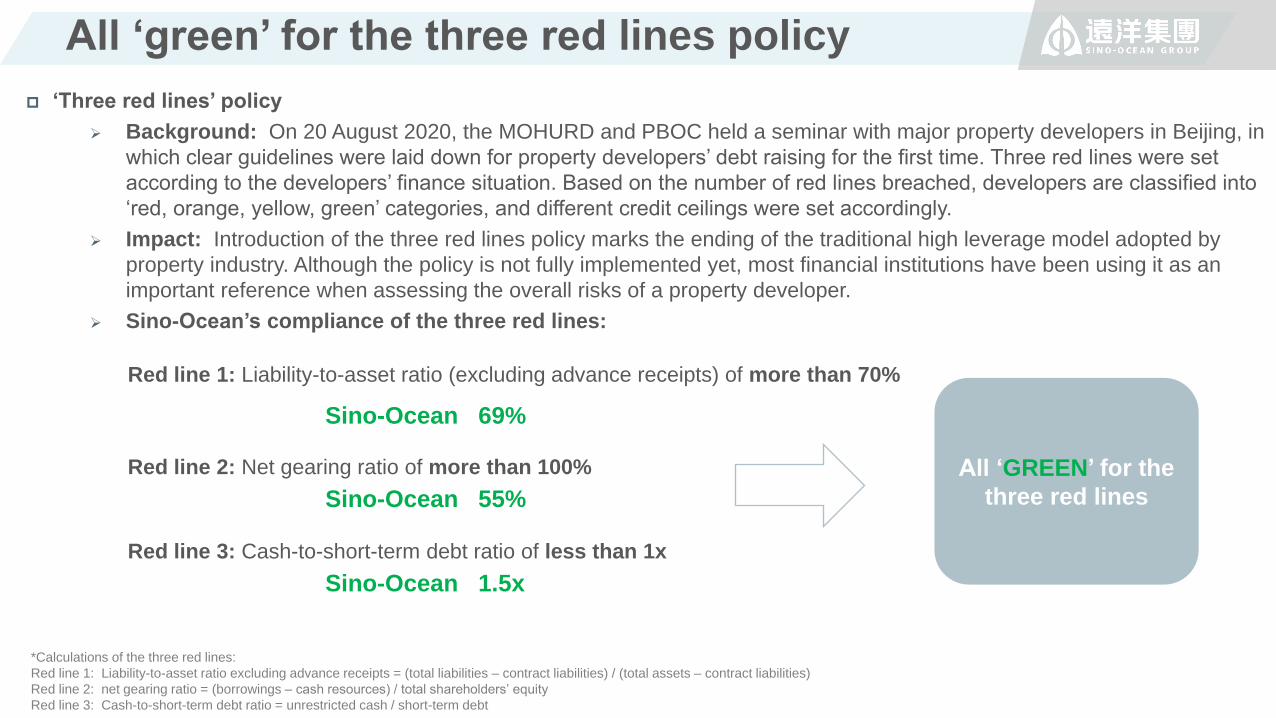
Red line 2: Net gearing ratio of more than 100%
Sino-Ocean 55%
‘Three red lines’ policy
Background: On 20 August 2020, the MOHURD and PBOC held a seminar with major property developers in Beijing, in
which clear guidelines were laid down for property developers’ debt raising for the first time. Three red lines were set
according to the developers’ finance situation. Based on the number of red lines breached, developers are classified into
‘red, orange, yellow, green’ categories, and different credit ceilings were set accordingly.
Impact: Introduction of the three red lines policy marks the ending of the traditional high leverage model adopted by
property industry. Although the policy is not fully implemented yet, most financial institutions have been using it as an
important reference when assessing the overall risks of a property developer.
Sino-Ocean’s compliance of the three red lines:
Red line 1: Liability-to-asset ratio (excluding advance receipts) of more than 70%
Sino-Ocean 69%
Red line 3: Cash-to-short-term debt ratio of less than 1x
Sino-Ocean 1.5x
All ‘GREEN’ for the
three red lines
*Calculations of the three red lines:
Red line 1: Liability-to-asset ratio excluding advance receipts = (total liabilities – contract liabilities) / (total assets – contract liabilities)
Red line 2: net gearing ratio = (borrowings – cash resources) / total shareholders’ equity
Red line 3: Cash-to-short-term debt ratio = unrestricted cash / short-term debt
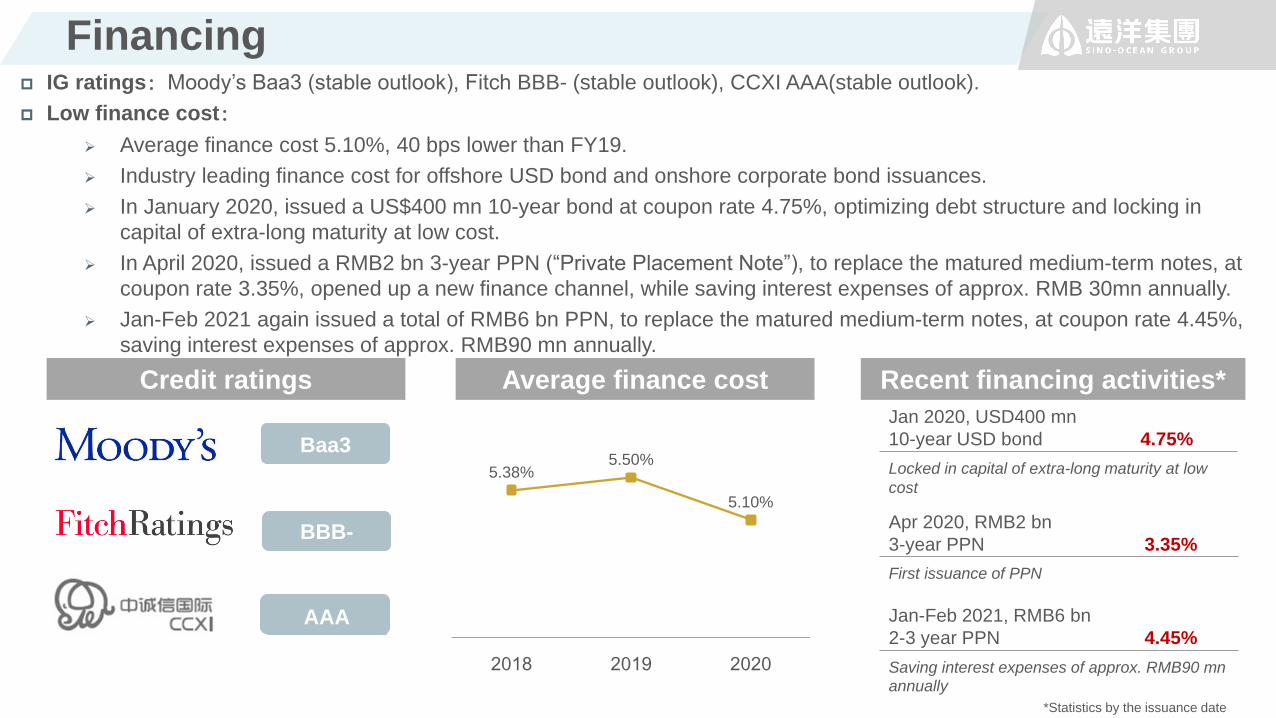
Financing IG ratings:Moody’s Baa3 (stable outlook), Fitch BBB- (stable outlook), CCXI AAA(stable outlook).
Low finance cost:
Average finance cost 5.10%, 40 bps lower than FY19.
Industry leading finance cost for offshore USD bond and onshore corporate bond issuances.
In January 2020, issued a US$400 mn 10-year bond at coupon rate 4.75%, optimizing debt structure and locking in
capital of extra-long maturity at low cost.
In April 2020, issued a RMB2 bn 3-year PPN (“Private Placement Note”), to replace the matured medium-term notes, at
coupon rate 3.35%, opened up a new finance channel, while saving interest expenses of approx. RMB 30mn annually.
Jan-Feb 2021 again issued a total of RMB6 bn PPN, to replace the matured medium-term notes, at coupon rate 4.45%,
saving interest expenses of approx. RMB90 mn annually.
Average finance costCredit ratings
Baa3
AAA
Recent financing activities*
Jan 2020, USD400 mn
10-year USD bond 4.75%
Locked in capital of extra-long maturity at low
cost
Apr 2020, RMB2 bn
3-year PPN 3.35%
First issuance of PPN
Baa3
BBB-
Jan-Feb 2021, RMB6 bn
2-3 year PPN 4.45%
Saving interest expenses of approx. RMB90 mnannually
*Statistics by the issuance date
5.38%5.50%
5.10%
2018 2019 2020
Financing (cont.)
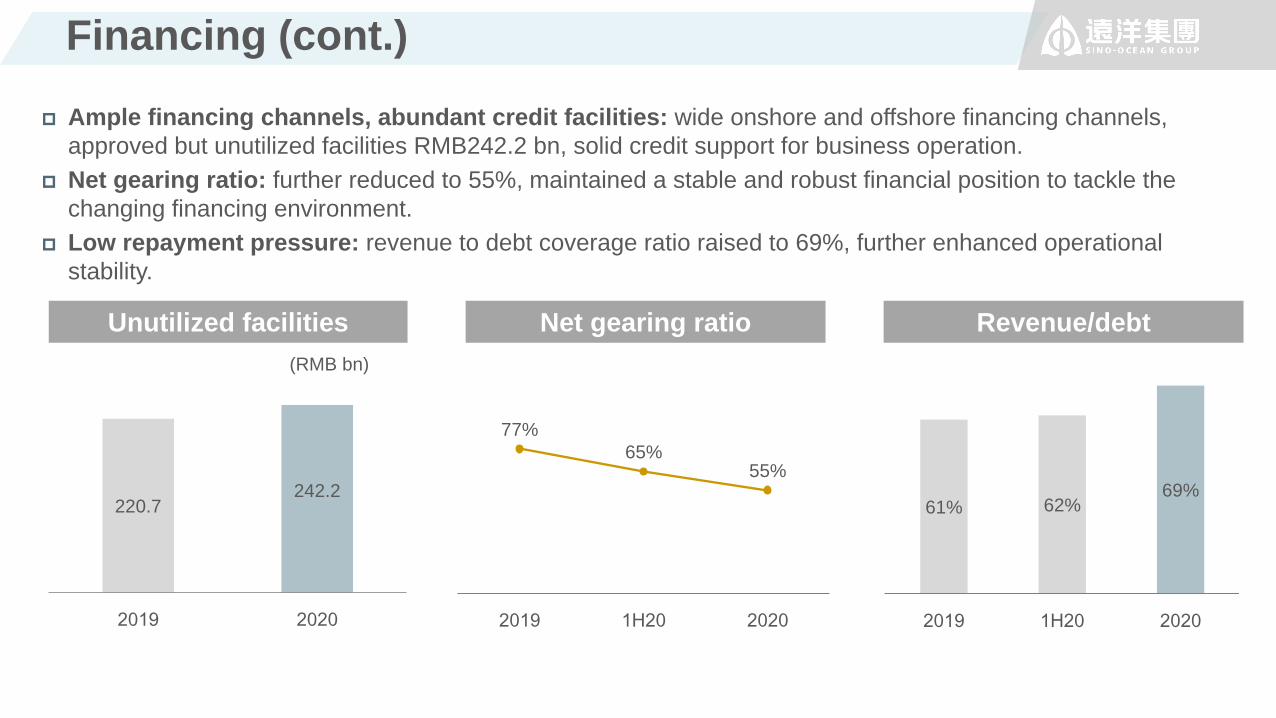
Ample financing channels, abundant credit facilities: wide onshore and offshore financing channels,
approved but unutilized facilities RMB242.2 bn, solid credit support for business operation.
Net gearing ratio: further reduced to 55%, maintained a stable and robust financial position to tackle the
changing financing environment.
Low repayment pressure: revenue to debt coverage ratio raised to 69%, further enhanced operational
stability.
220.7242.2
2019 2020
Unutilized facilities Revenue/debtNet gearing ratio
61% 62%69%
2019 1H20 2020
(RMB bn)
77%
65%55%
2019 1H20 2020
Financing (cont.)
Debt due date distribution Issuance quota acquired Debt structure
USD bond27%
Corporate bond/PPN
23%
Project loan14%
Medium-term note
10%
Club and bilateral
loan20%
ABS/CMBN6%
29%
19%
36%
16%
<1 year 1-2 years 2-5 years >5 years
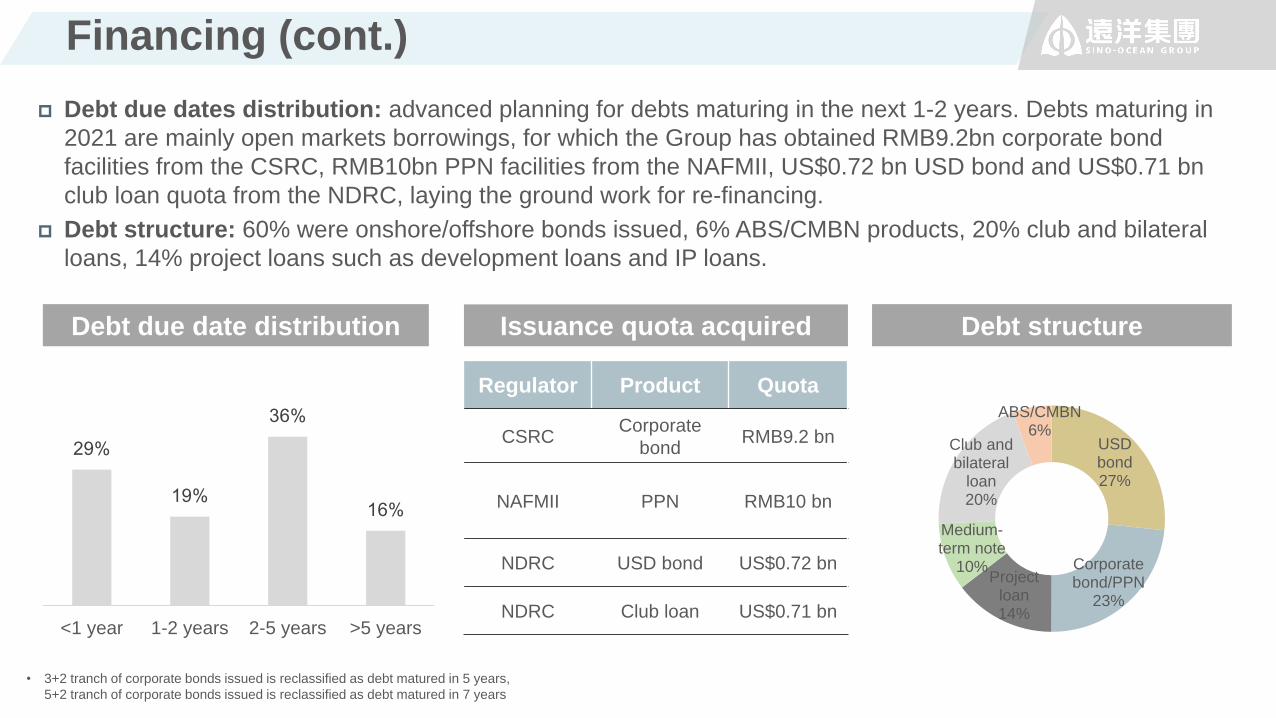
Debt due dates distribution: advanced planning for debts maturing in the next 1-2 years. Debts maturing in
2021 are mainly open markets borrowings, for which the Group has obtained RMB9.2bn corporate bond
facilities from the CSRC, RMB10bn PPN facilities from the NAFMII, US$0.72 bn USD bond and US$0.71 bn
club loan quota from the NDRC, laying the ground work for re-financing.
Debt structure: 60% were onshore/offshore bonds issued, 6% ABS/CMBN products, 20% club and bilateral
loans, 14% project loans such as development loans and IP loans.
Regulator Product Quota
CSRCCorporate
bondRMB9.2 bn
NAFMII PPN RMB10 bn
NDRC USD bond US$0.72 bn
NDRC Club loan US$0.71 bn
• 3+2 tranch of corporate bonds issued is reclassified as debt matured in 5 years,
5+2 tranch of corporate bonds issued is reclassified as debt matured in 7 years

INVESTMENT
PROPERTY
Investment properties
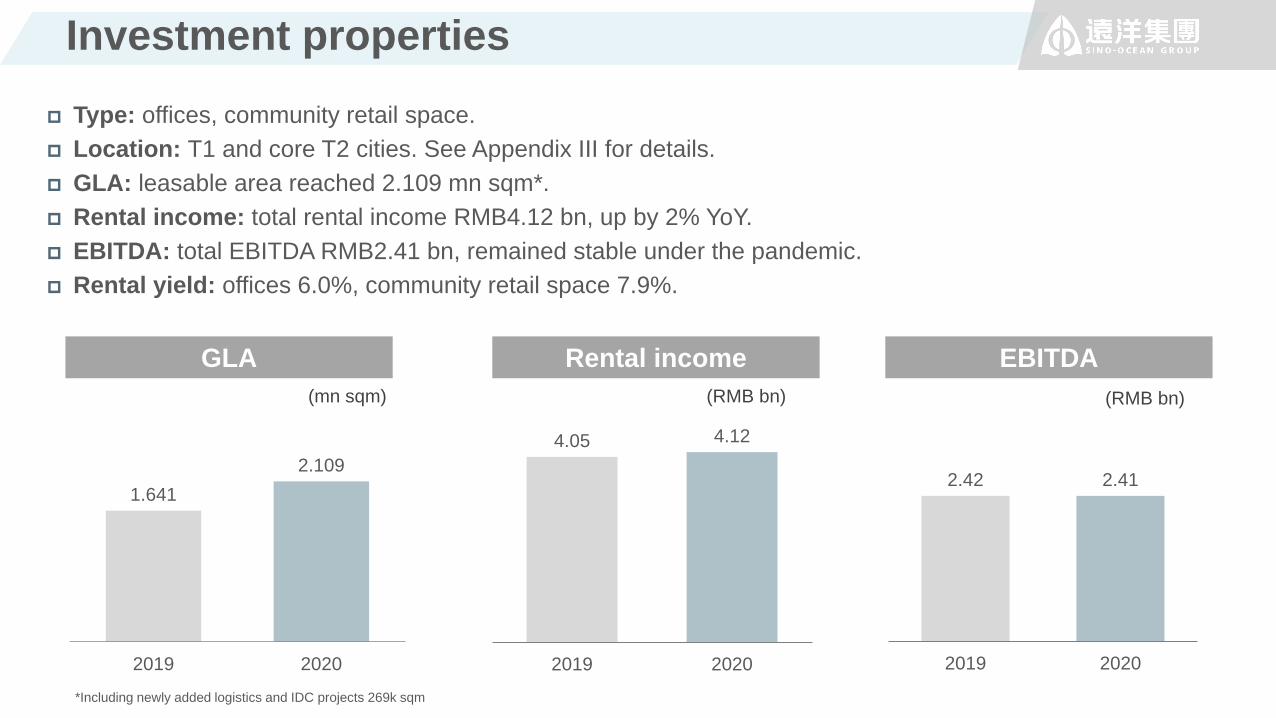
Type: offices, community retail space.
Location: T1 and core T2 cities. See Appendix III for details.
GLA: leasable area reached 2.109 mn sqm*.
Rental income: total rental income RMB4.12 bn, up by 2% YoY.
EBITDA: total EBITDA RMB2.41 bn, remained stable under the pandemic.
Rental yield: offices 6.0%, community retail space 7.9%.
Rental income
(RMB bn)
EBITDA
(RMB bn)(mn sqm)
GLA
1.641
2.109
2019 2020
4.05 4.12
2019 2020
2.42 2.41
2019 2020
*Including newly added logistics and IDC projects 269k sqm
Investment properties (in operation)
Retail spaceOffice
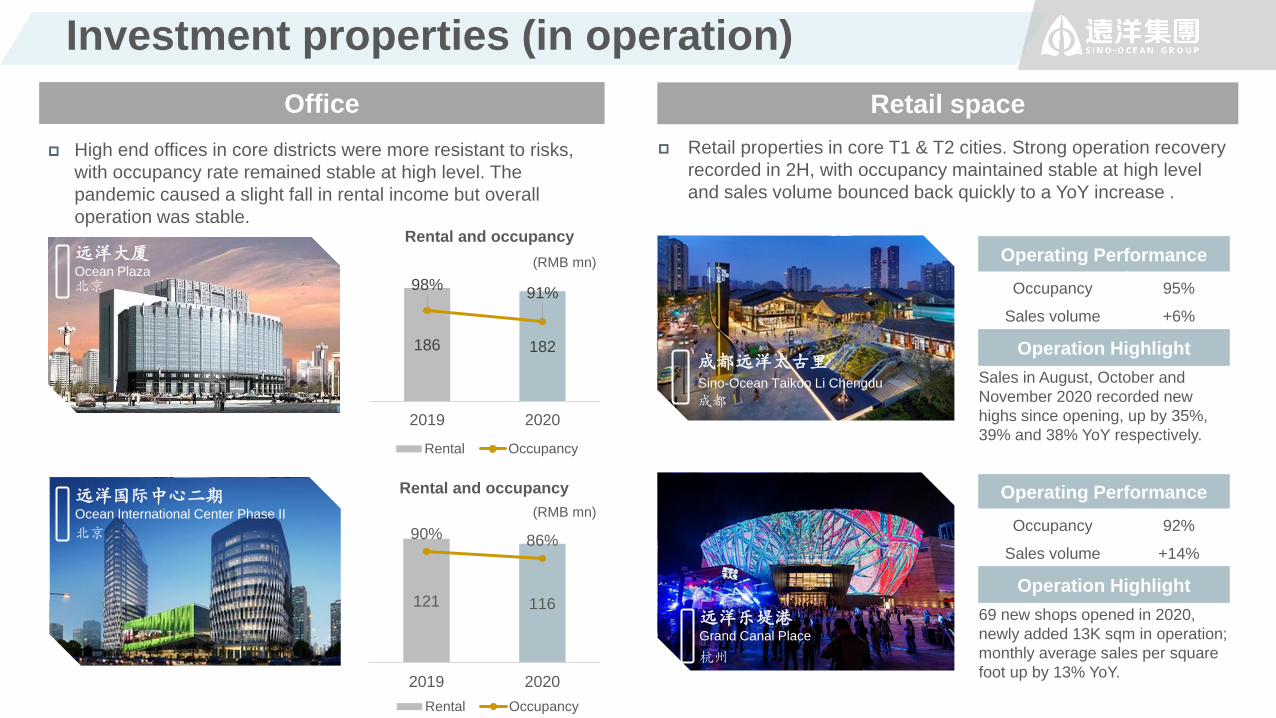
High end offices in core districts were more resistant to risks,
with occupancy rate remained stable at high level. The
pandemic caused a slight fall in rental income but overall
operation was stable.
Retail properties in core T1 & T2 cities. Strong operation recovery
recorded in 2H, with occupancy maintained stable at high level
and sales volume bounced back quickly to a YoY increase .
Rental and occupancy
Rental and occupancy
北京
远洋大厦Ocean Plaza
北京
远洋国际中心二期Ocean International Center Phase II
成都
成都远洋太古里Sino-Ocean Taikoo Li Chengdu
杭州
远洋乐堤港Grand Canal Place
(RMB mn)
186 182
98%91%
2019 2020
Rental Occupancy
(RMB mn) Operating Performance
Occupancy 95%
Sales volume +6%
Operation Highlight
Sales in August, October and
November 2020 recorded new
highs since opening, up by 35%,
39% and 38% YoY respectively.
Operating Performance
Occupancy 92%
Sales volume +14%
Operation Highlight
69 new shops opened in 2020,
newly added 13K sqm in operation;
monthly average sales per square
foot up by 13% YoY.
121 116
90% 86%
2019 2020
Rental Occupancy
Investment properties (under construction)
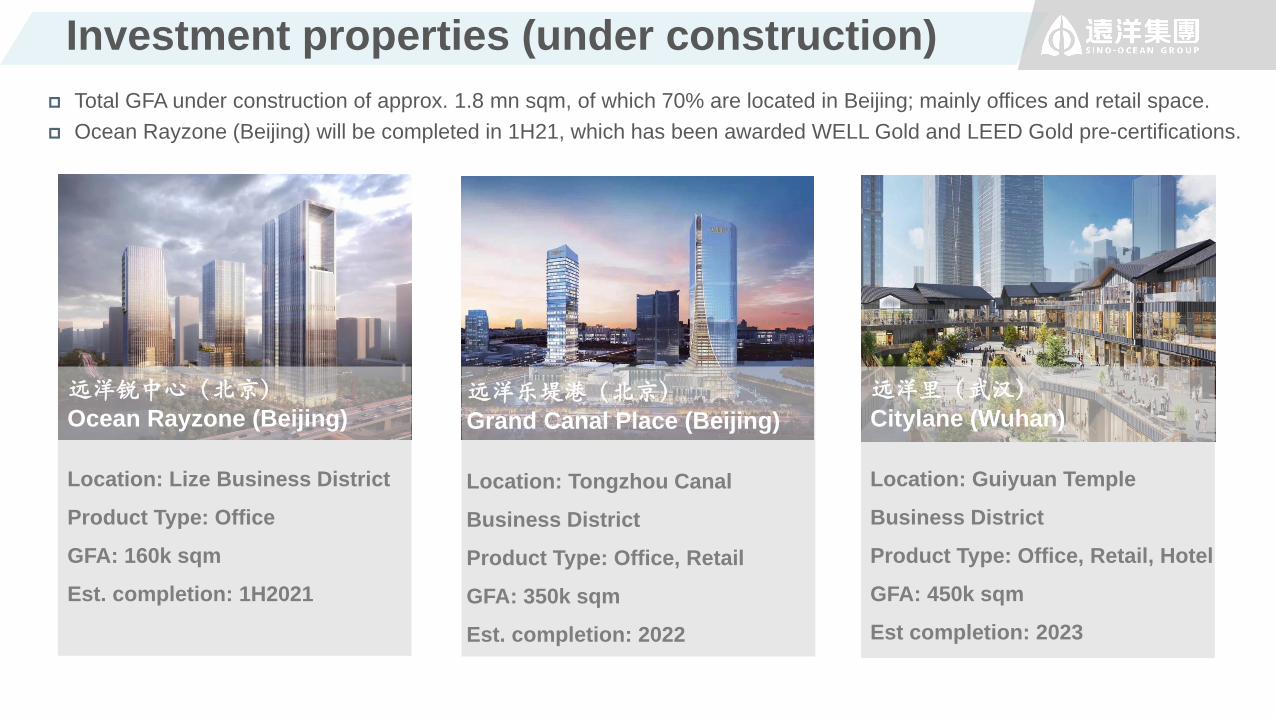
远洋锐中心(北京)
Ocean Rayzone (Beijing)
Location: Lize Business District
Product Type: Office
GFA: 160k sqm
Est. completion: 1H2021
Total GFA under construction of approx. 1.8 mn sqm, of which 70% are located in Beijing; mainly offices and retail space.
Ocean Rayzone (Beijing) will be completed in 1H21, which has been awarded WELL Gold and LEED Gold pre-certifications.
远洋里(武汉)
Citylane (Wuhan)
Location: Guiyuan Temple
Business District
Product Type: Office, Retail, Hotel
GFA: 450k sqm
Est completion: 2023
远洋乐堤港(北京)
Grand Canal Place (Beijing)
Location: Tongzhou Canal
Business District
Product Type: Office, Retail
GFA: 350k sqm
Est. completion: 2022

Investment properties (under construction) (cont.)
Construction of CBD Plot Z6 (Beijing) commenced in Oct 2020. Construction of INDIGO II (Beijing) commenced in 2H20,
the third joint-venture project with Swire Properties after INDIGO (Beijing) and Sino-Ocean Taikoo Li (Chengdu).
As pipeline projects gradually complete and commence operation, rental income will maintain a steady growth.
艳阳天(武汉)Yanyangtian Project (Wuhan)
Location: Inner ring core
districts in Jiang'an District
Product Type: Office, Retail
GFA: 110k sqm
Est. completion: 2023
Z6项目(北京)CBD Plot Z6 (Beijing)
Location: CBD
Product Type: Office
GFA: 170k sqm
Est. completion: 2025
颐堤港二期(北京)INDIGO II (Beijing)
Location: Jiuxianqiao Business
District
Product Type: Office, Retail, Hotel
GFA: 590k sqm
Est. completion: 2025

PROPERTY
MANAGEMENT

Property management
↑35%
↑20%
Outstanding capability in
high-end commercial properties
33%
17.6
27%
31%
↑ 36%
↑4ppts
↑ 25%
↑1.4ppts
↑ 11%
↑10.6x 80%↑ 44%
↑2.9ppts
Sino-Ocean Service (6677.HK) was successfully listed on the Main Board of HKEX
on 17 December 2020, aiming to be a leading comprehensive property manager
with commercial edge.
Performance highlights in 2020:
Business scale: parent company’s business grew steadily, actively developed
business from third parties.
Specialized in commercial properties: both volume and fees of existing
premises rose, potential operating services injection.
Profitability: increased continually, exploring the value of VAS.
Continued to develop business with the property portfolios of parent company Sino-
Ocean Group, and its shareholders China Life and Dajia Insurance Group, laying a
solid foundation for rapid growth.
Reserved GFA
25.63 mn sqm
Contracted GFA
71.08 mn sqm
Third-party projects as %
of contracted GFA
Management fee
(RMB/ month/ sqm)
As % of total revenue
2017-2020 Contracted GFA
CAGR
Gross profit RMB510 mn
GPM 25%
Net profit RMB260 mn
NPM 12.7%
Revenue
RMB2.02 bn
Third-party bidding
9.1 mn sqm
As % of non-residential
properties revenue
Core net profit RMB250mn
Core NPM 12.4%
Rapid business expansion Consistently rising profitability

SHAREHOLDERS’
SUPPORT

On 24 Feb 2021, China Life and Sino-Ocean Group signed a strategic
cooperation agreement, to further strengthen capital ties and promote
comprehensive cooperation in areas such as financial products, insurance,
investment property, property management and senior living, etc.
Capital support: China Life commits to maintain the single largest
shareholder position
Financial products: priority in subscription of financial products issued by
Sino-Ocean, support in credit ratings, etc.
IP: joint development of IP projects; Sino-Ocean could provide
commissioned construction services for China Life’s projects, etc.
Property management: Sino-Ocean could provide property management
services and VAS to China Life’s existing and future projects, etc.
Senior living: equity cooperation and joint investment, explore the
combination of social insurance and community senior living services, etc.
China Life
Dajia Insurance Group
Sino-Ocean Service provides property management services to Dajia Insurance Group including its headquarters in Beijing and residential projects in Wenzhou.
Shareholder cooperation continues to intensify

APPENDIX
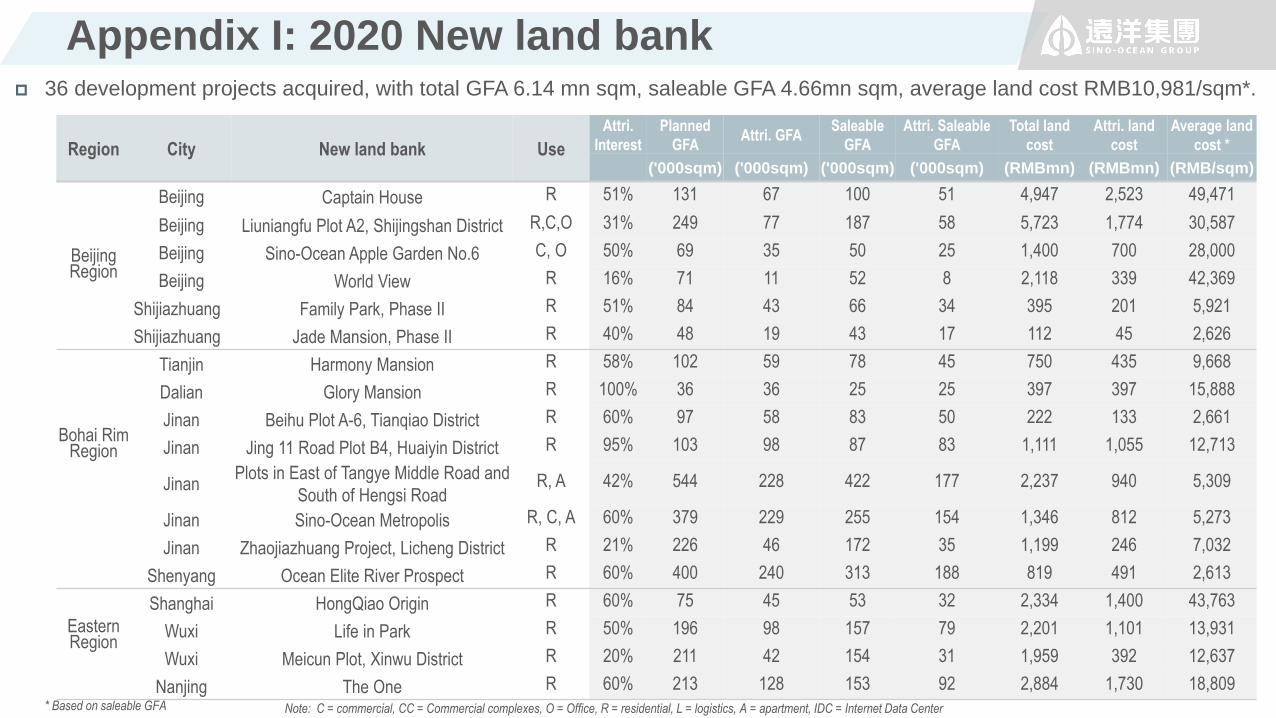
Appendix I: 2020 New land bank
Region City New land bank Use
Attri.
Interest
Planned
GFAAttri. GFA
Saleable
GFA
Attri. Saleable
GFA
Total land
cost
Attri. land
cost
Average land
cost *
('000sqm) ('000sqm) ('000sqm) ('000sqm) (RMBmn) (RMBmn) (RMB/sqm)
Beijing Region
Beijing Captain House R 51% 131 67 100 51 4,947 2,523 49,471
Beijing Liuniangfu Plot A2, Shijingshan District R,C,O 31% 249 77 187 58 5,723 1,774 30,587
Beijing Sino-Ocean Apple Garden No.6 C, O 50% 69 35 50 25 1,400 700 28,000
Beijing World View R 16% 71 11 52 8 2,118 339 42,369
Shijiazhuang Family Park, Phase II R 51% 84 43 66 34 395 201 5,921
Shijiazhuang Jade Mansion, Phase II R 40% 48 19 43 17 112 45 2,626
Bohai Rim Region
Tianjin Harmony Mansion R 58% 102 59 78 45 750 435 9,668
Dalian Glory Mansion R 100% 36 36 25 25 397 397 15,888
Jinan Beihu Plot A-6, Tianqiao District R 60% 97 58 83 50 222 133 2,661
Jinan Jing 11 Road Plot B4, Huaiyin District R 95% 103 98 87 83 1,111 1,055 12,713
JinanPlots in East of Tangye Middle Road and
South of Hengsi RoadR, A 42% 544 228 422 177 2,237 940 5,309
Jinan Sino-Ocean Metropolis R, C, A 60% 379 229 255 154 1,346 812 5,273
Jinan Zhaojiazhuang Project, Licheng District R 21% 226 46 172 35 1,199 246 7,032
Shenyang Ocean Elite River Prospect R 60% 400 240 313 188 819 491 2,613
Eastern Region
Shanghai HongQiao Origin R 60% 75 45 53 32 2,334 1,400 43,763
Wuxi Life in Park R 50% 196 98 157 79 2,201 1,101 13,931
Wuxi Meicun Plot, Xinwu District R 20% 211 42 154 31 1,959 392 12,637
Nanjing The One R 60% 213 128 153 92 2,884 1,730 18,809
36 development projects acquired, with total GFA 6.14 mn sqm, saleable GFA 4.66mn sqm, average land cost RMB10,981/sqm*.
* Based on saleable GFA Note: C = commercial, CC = Commercial complexes, O = Office, R = residential, L = logistics, A = apartment, IDC = Internet Data Center

Appendix I: 2020 New land bank (cont.)
Region City New land bank Use
Attri.
Interest
Planned
GFAAttri. GFA
Saleable
GFA
Attri. Saleable
GFA
Total land
cost
Attri. land
cost
Average land
cost *
('000sqm) ('000sqm) ('000sqm) ('000sqm) (RMBmn) (RMBmn) (RMB/sqm)
Eastern Region
Hangzhou Ocean New Masterpiece R 51% 44 22 33 17 930 474 27,888
Hangzhou Xixi Mansion R 100% 395 395 285 285 4,900 4,900 17,193
Wenzhou Harbor Heart R 85% 87 74 66 56 877 743 13,263
Wenzhou Shan Hai One R 100% 123 123 100 100 1,119 1,119 11,186
Yangzhou Sino-Ocean Grand Canal Milestone R 100% 63 63 47 47 397 397 8,445
Southern Region
Guangzhou Ocean Prospect R 100% 133 133 96 96 1,093 1,093 11,380
Fuzhou East Bay Upgrade R 34% 51 17 42 14 313 105 7,495
Fuzhou Plot 2020-65, Cangshan District R 51% 128 65 97 49 1,561 796 16,243
Jiangmen Cloud Mansion R 51% 176 90 133 68 737 376 5,528
Jiangmen Top Mansion R 100% 131 131 101 101 610 610 6,036
Zhangzhou Sea and Star R 51% 266 136 210 107 1,439 734 6,857
Central Region
Zhengzhou Fontaine Polaris R 25% 176 43 141 35 293 72 2,052
Zhengzhou Grand Apartment A 28% 172 49 133 38 220 62 1,634
Zhengzhou Ocean Landscape Courtyard R 55% 204 112 150 83 145 80 958
Zhengzhou Rong Fu R 18% 156 28 101 18 130 23 1,287
Changsha Special Mansion R 25% 482 118 384 94 548 134 1,429Western Region Chongqing Tanzikou Plot, Jiulongpo District R 34% 52 18 37 13 365 124 9,548Other
Region Jarkata Alam Sutera Project R 28% 66 18 57 16 108 30 1,884
Total 6,139 3,194 4,663 2,421 47,936 26,585 10,981
* Based on saleable GFA Note: C = commercial, CC = Commercial complexes, O = Office, R = residential, L = logistics, A = apartment, IDC = Internet Data Center

Appendix I: 2020 New land bank (cont.)
Region City New land bank Use
Attri.
Interest
Planned
GFAAttri. GFA Total land cost Attri. land cost
Average land
cost **
('000sqm) ('000sqm) (RMBmn) (RMBmn) (RMB/sqm)
Eastern RegionShanghai H88 Yuehong Plaza O, C 24% 62 15 2,002 488 32,512
Suzhou Wangting Logistics Project L 49% 66 32 335 164 5,130
Total 128 47 2,337 652 13,869
1 investment project acquired, with total GFA 570k sqm, average land cost RMB20,306/sqm.
Note: C = commercial, CC = Commercial complexes, O = Office, R = residential, L = logistics, A = apartment, IDC = Internet Data Center* * Based on total GFA
Region City New land bank Use
Attri.
Interest
Planned
GFAAttri. GFA Total land cost Attri. land cost
Average land
cost **
('000sqm) ('000sqm) (RMBmn) (RMBmn) (RMB/sqm)
Beijing Region Beijing INDIGO II CC 65% 565 366 11,471 7,432 20,306
Total 565 366 11,471 7,432 20,306
2 mature projects acquired, with total GFA 128k sqm, average land cost RMB13,869/sqm.
14 logistics and IDC projects acquired, with total GFA 1.08 mn sqm, average land cost RMB722/sqm.
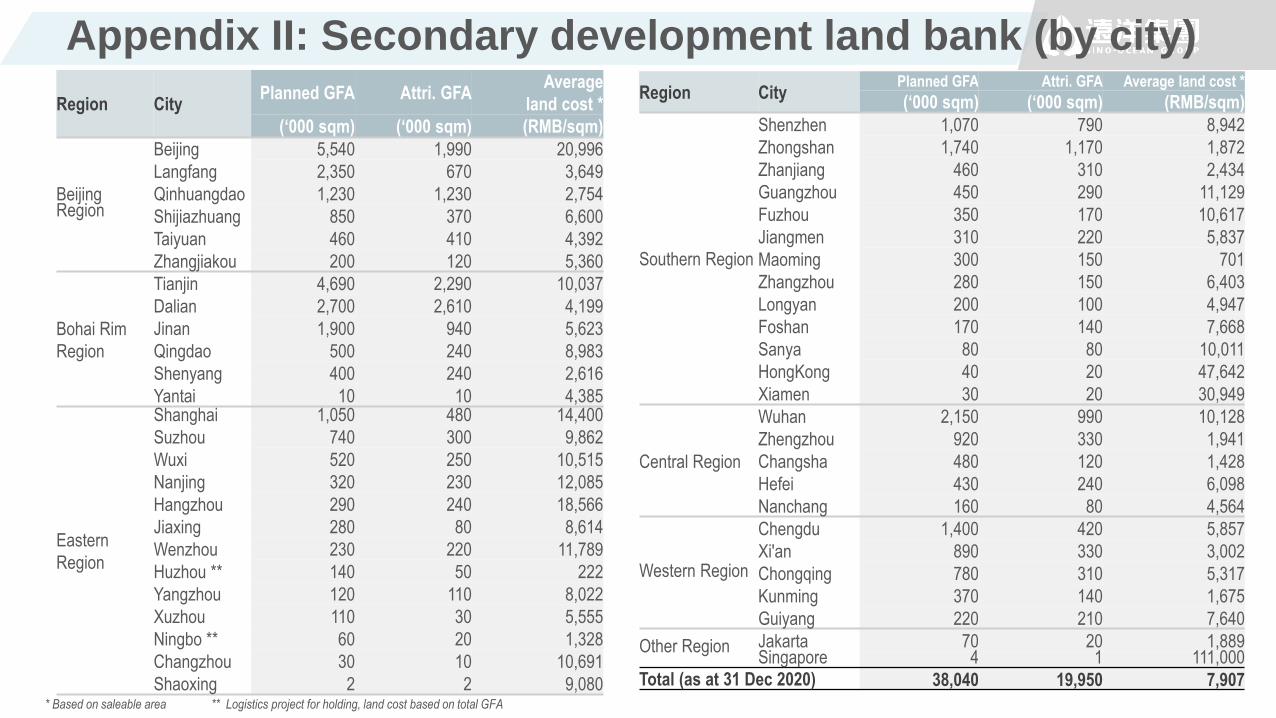
Region CityPlanned GFA Attri. GFA
Average
land cost *
(‘000 sqm) (‘000 sqm) (RMB/sqm)
Beijing Region
Beijing 5,540 1,990 20,996
Langfang 2,350 670 3,649
Qinhuangdao 1,230 1,230 2,754
Shijiazhuang 850 370 6,600
Taiyuan 460 410 4,392
Zhangjiakou 200 120 5,360
Bohai Rim
Region
Tianjin 4,690 2,290 10,037
Dalian 2,700 2,610 4,199
Jinan 1,900 940 5,623
Qingdao 500 240 8,983
Shenyang 400 240 2,616
Yantai 10 10 4,385
Eastern
Region
Shanghai 1,050 480 14,400
Suzhou 740 300 9,862
Wuxi 520 250 10,515
Nanjing 320 230 12,085
Hangzhou 290 240 18,566
Jiaxing 280 80 8,614
Wenzhou 230 220 11,789
Huzhou ** 140 50 222
Yangzhou 120 110 8,022
Xuzhou 110 30 5,555
Ningbo ** 60 20 1,328
Changzhou 30 10 10,691
Shaoxing 2 2 9,080
Region CityPlanned GFA Attri. GFA Average land cost *
(‘000 sqm) (‘000 sqm) (RMB/sqm)
Southern Region
Shenzhen 1,070 790 8,942
Zhongshan 1,740 1,170 1,872
Zhanjiang 460 310 2,434
Guangzhou 450 290 11,129
Fuzhou 350 170 10,617
Jiangmen 310 220 5,837
Maoming 300 150 701
Zhangzhou 280 150 6,403
Longyan 200 100 4,947
Foshan 170 140 7,668
Sanya 80 80 10,011
HongKong 40 20 47,642
Xiamen 30 20 30,949
Central Region
Wuhan 2,150 990 10,128
Zhengzhou 920 330 1,941
Changsha 480 120 1,428
Hefei 430 240 6,098
Nanchang 160 80 4,564
Western Region
Chengdu 1,400 420 5,857
Xi'an 890 330 3,002
Chongqing 780 310 5,317
Kunming 370 140 1,675
Guiyang 220 210 7,640
Other Region Jakarta 70 20 1,889Singapore 4 1 111,000
Total (as at 31 Dec 2020) 38,040 19,950 7,907
Appendix II: Secondary development land bank (by city)
* Based on saleable area ** Logistics project for holding, land cost based on total GFA
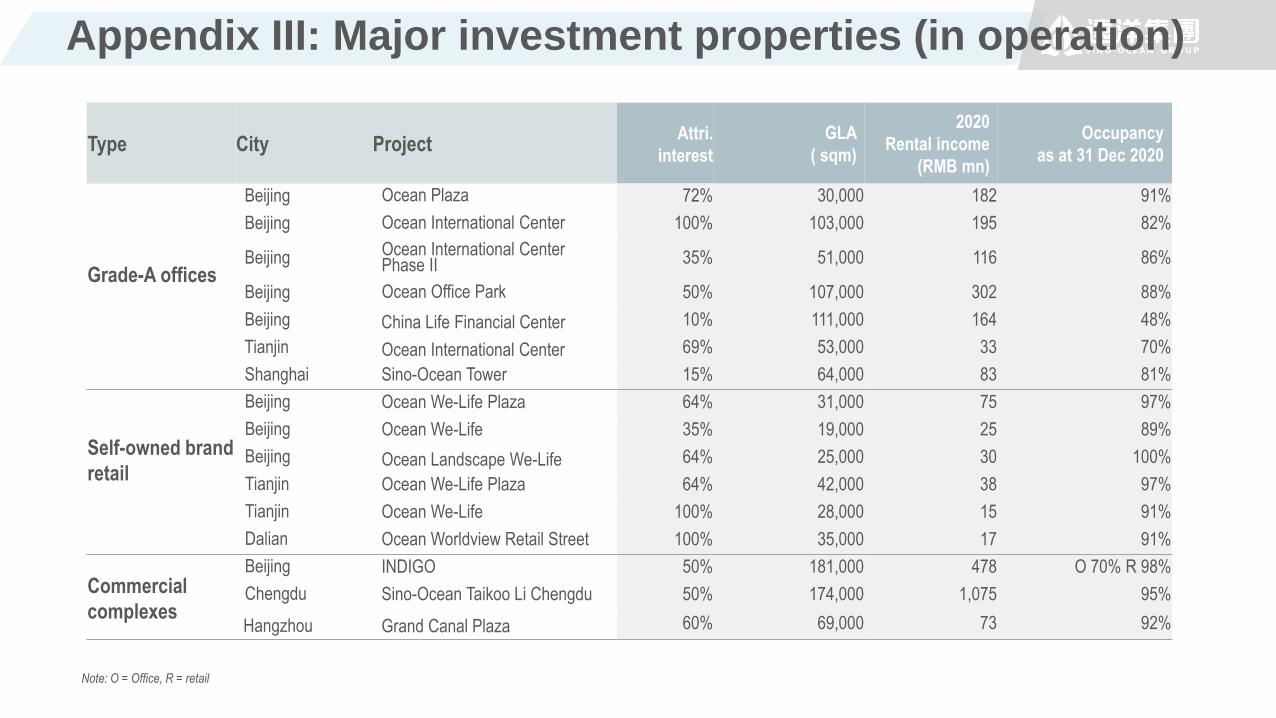
Type City ProjectAttri.
interest
GLA
( sqm)
2020
Rental income
(RMB mn)
Occupancy
as at 31 Dec 2020
Grade-A offices
Beijing Ocean Plaza 72% 30,000 182 91%
Beijing Ocean International Center 100% 103,000 195 82%
Beijing Ocean International Center Phase II 35% 51,000 116 86%
Beijing Ocean Office Park 50% 107,000 302 88%
Beijing China Life Financial Center 10% 111,000 164 48%
Tianjin Ocean International Center 69% 53,000 33 70%
Shanghai Sino-Ocean Tower 15% 64,000 83 81%
Self-owned brand
retail
Beijing Ocean We-Life Plaza 64% 31,000 75 97%
Beijing Ocean We-Life 35% 19,000 25 89%
Beijing Ocean Landscape We-Life 64% 25,000 30 100%
Tianjin Ocean We-Life Plaza 64% 42,000 38 97%
Tianjin Ocean We-Life 100% 28,000 15 91%
Dalian Ocean Worldview Retail Street 100% 35,000 17 91%
Commercial
complexes
Beijing INDIGO 50% 181,000 478 O 70% R 98%
Chengdu Sino-Ocean Taikoo Li Chengdu 50% 174,000 1,075 95%
Hangzhou Grand Canal Plaza 60% 69,000 73 92%
Note: O = Office, R = retail
Appendix III: Major investment properties (in operation)

These materials have been prepared by Sino-Ocean Group Holding Limited (the “Company”) solely for
informational use during its presentation to prospective and existing investors for introduction of the
Company and to provide an update on the business performance and development of the Company. These
material may not be taken away, reproduced, redistributed or passed on, directly or indirectly, to any other
person (whether within or outside your organization/firm) or published, in whole or in part, for any purpose.
By attending this presentation, you are agreeing to be bound by the foregoing restrictions.
The information contained in these materials has not been independently verified. No representation or
warranty express or implied is made as to, and no reliance should be placed on, the fairness, accuracy,
completeness or correctness of the information or opinions contained herein. It is not the intention to
provide, and you may not rely on these materials as providing, a complete or comprehensive analysis of the
Company’s financial or trading position or prospects. The information contained in these materials should be
considered in the context of the circumstances prevailing at the time and is subject to change without notice
and has not been, and will not be, updated to reflect material developments which may occur after the date
of the presentation. None of the Company nor any of its respective directors, officers, employees, affiliates,
advisors or representatives shall have any liability whatsoever (in negligence or otherwise) for any loss or
damage howsoever arising from any use of these materials or their contents or otherwise arising in
connection with these materials.
Certain statements contained in these materials constitute “forward-looking statements”. Such forward-
looking statements involve risks, uncertainties and other factors that may cause the actual results,
performance or achievements of the Company to be materially different from those expressed by, or implied
by the forward-looking statements in these materials. There can be no assurance that the results and events
contemplated by the forward-looking statements contained in these materials will in fact occur.
This document does not constitute an offer or invitation to purchase or subscribe for any securities of the
Company or any holding company or any of its subsidiaries or an inducement to enter into any investment
activity. No part of these materials, or the fact of its distribution or use, shall form the basis of or be relied
upon in connection with any contract, commitment or investment decision in relation thereto.
DISCLAIMER