Listed Investment Companies (LICs)
89
baillieu.com.au Baillieu Limited ABN 74 006 519 393 Please read the disclaimer at the end of this report 1 Sector Report March 2019 performance review and update Top picks: Our top picks refer to preferred exposures within each sector based on numerous quantitative and qualitative factors. They should not be treated as official stock recommendations but merely as a guide to where we would apportion funds at this point in time. The table on page 3 provides an update of the overall sector, as at 30 April 2019, with our estimated current net tangible assets (NTAs) derived from our model portfolios for the LICs. Traditional LICs: On average, traditional LICs performed broadly in line (on both a TSR and NTA growth basis) with a flat All Ordinaries Accumulation Index (XAOAI) during March. Post trading ex-dividend, we believe trading levels for the traditional sector appear attractive, with all traditional LICs estimated to be currently trading below respective one-year discount averages (see page 3). Our current top picks include Diversified United Investment (DUI) and AFIC (AFI), trading at estimated 9.6% and 4.1% discounts to NTA respectively. That said, we believe all traditional LICs currently offer value when compared to average historical trading levels. Large capitalisation: WAM Leaders (WLE) and Ophir High Conviction Fund (OPH) are our top picks, trading at estimated 10.8% and 1.1% discounts to NTA respectively. We believe a potential near-term catalyst for WLE could be the allocation of funds from other WAMI LICs (primarily WAM and WAX) which trade at ~20% premiums to NTA, driven in part by their above market fully franked yields. Whilst we believe WAM and WAX should still command a premium to NTA rating, we are cognisant of any potential franking rebate changes and the impact to these premiums. WLE has progressively increased its annualised dividend since inception (currently yielding 4.7%). Elsewhere, post a strong rally since listing (up 20.0% since 18-Dec-18), OPH has drifted to a 1.1% discount to NTA, which we believe is an attractive entry point. Small/Micro capitalisation: WAM Microcap (WMI) and Acorn Capital (ACQ) are our current top picks, trading at estimated 2.1% and 13.5% discounts to NTA respectively. We believe the recent WMI share price weakness has been driven by 1) lower performance; and 2) an unwind of WMI’s significant premium trading level. We believe this premium unwind has now created an attractive entry point for investors, noting WMI’s one-year historical premium to NTA is 6.0%. Elsewhere, we believe ACQ’s unlisted exposure (32%) provides access to an asset class not overly accessible to retail investors, noting that unlisted investments to reach liquidity events has been a key performance driver. International: MFF Capital Investments (MFF) is our top US pick. Despite being a top performing LIC (on both a TSR and NTA basis) over a number of periods, MFF is currently trading at an estimated 6.9% discount to NTA. On a regional basis, PM Capital (PGF) and Templeton Global Growth (TGG) are our top picks for exposure to a broad range of global securities and an overweight Europe exposure respectively. PGF and TGG are currently trading at estimated discounts to NTA of 13.1% and 15.0% respectively. Specialist: Hearts and Minds (HM1) is our top pick. We recently included HM1 to our coverage universe post its listing in Nov-18. HM1 holds a concentrated portfolio of the highest conviction picks from some of Australia’s leading fund managers (many of whom are not readily accessible to retail investors). HM1 has outperformed the XAOAI since inception (5.2%) and we believe the 3.4% discount to NTA is an attractive entry point. Analyst Piers Flanagan + 613 9282 8127 [email protected] Disclosure The author owns no shares in any of the mentioned companies. Baillieu Research 1 May 2019 Listed Investment Companies (LICs)
-
Upload
khangminh22 -
Category
Documents
-
view
3 -
download
0
Transcript of Listed Investment Companies (LICs)

Baillieu Research 1 May 2019
baillieu.com.au Baillieu Limited ABN 74 006 519 393 Please read the disclaimer at the end of this report 1
Sector Report
March 2019 performance review and update Top picks: Our top picks refer to preferred exposures within each sector based on numerous quantitative and qualitative factors. They should not be treated as official stock recommendations but merely as a guide to where we would apportion funds at this point in time. The table on page 3 provides an update of the overall sector, as at 30 April 2019, with our estimated current net tangible assets (NTAs) derived from our model portfolios for the LICs.
Traditional LICs: On average, traditional LICs performed broadly in line (on both a TSR and NTA growth basis) with a flat All Ordinaries Accumulation Index (XAOAI) during March. Post trading ex-dividend, we believe trading levels for the traditional sector appear attractive, with all traditional LICs estimated to be currently trading below respective one-year discount averages (see page 3). Our current top picks include Diversified United Investment (DUI) and AFIC (AFI), trading at estimated 9.6% and 4.1% discounts to NTA respectively. That said, we believe all traditional LICs currently offer value when compared to average historical trading levels.
Large capitalisation: WAM Leaders (WLE) and Ophir High Conviction Fund (OPH) are our top picks, trading at estimated 10.8% and 1.1% discounts to NTA respectively. We believe a potential near-term catalyst for WLE could be the allocation of funds from other WAMI LICs (primarily WAM and WAX) which trade at ~20% premiums to NTA, driven in part by their above market fully franked yields. Whilst we believe WAM and WAX should still command a premium to NTA rating, we are cognisant of any potential franking rebate changes and the impact to these premiums. WLE has progressively increased its annualised dividend since inception (currently yielding 4.7%). Elsewhere, post a strong rally since listing (up 20.0% since 18-Dec-18), OPH has drifted to a 1.1% discount to NTA, which we believe is an attractive entry point.
Small/Micro capitalisation: WAM Microcap (WMI) and Acorn Capital (ACQ) are our current top picks, trading at estimated 2.1% and 13.5% discounts to NTA respectively. We believe the recent WMI share price weakness has been driven by 1) lower performance; and 2) an unwind of WMI’s significant premium trading level. We believe this premium unwind has now created an attractive entry point for investors, noting WMI’s one-year historical premium to NTA is 6.0%. Elsewhere, we believe ACQ’s unlisted exposure (32%) provides access to an asset class not overly accessible to retail investors, noting that unlisted investments to reach liquidity events has been a key performance driver.
International: MFF Capital Investments (MFF) is our top US pick. Despite being a top performing LIC (on both a TSR and NTA basis) over a number of periods, MFF is currently trading at an estimated 6.9% discount to NTA. On a regional basis, PM Capital (PGF) and Templeton Global Growth (TGG) are our top picks for exposure to a broad range of global securities and an overweight Europe exposure respectively. PGF and TGG are currently trading at estimated discounts to NTA of 13.1% and 15.0% respectively.
Specialist: Hearts and Minds (HM1) is our top pick. We recently included HM1 to our coverage universe post its listing in Nov-18. HM1 holds a concentrated portfolio of the highest conviction picks from some of Australia’s leading fund managers (many of whom are not readily accessible to retail investors). HM1 has outperformed the XAOAI since inception (5.2%) and we believe the 3.4% discount to NTA is an attractive entry point.
Analyst
Piers Flanagan + 613 9282 8127 [email protected]
Disclosure
The author owns no shares in any of the mentioned companies.
Baillieu Research 1 May 2019
ListedInvestmentCompanies(LICs)

Baillieu Research 1 May 2019
baillieu.com.au Baillieu Limited ABN 74 006 519 393 Please read the disclaimer at the end of this report 2
Contents
Updated Sector Snapshot 3 Hearts and Minds (HM1) 38 URB Investments (URB) 67
Performance table (Dec-18) 10 Lowell Resources Fund (LRT) 39 VGI Partners Global (VG1) 68
Acorn Capital (ACQ) 11 L1 Long Short Fund (LSF) 40 WAM Active (WAA) 69
Australian Foundation Inv. Co. (AFI) 12 Lion Selection (LSX) 41 WAM Capital (WAM) 70
Australian Leaders Fund (ALF) 13 Monash Absolute Investment (MA1) 42 WAM Research (WAX) 71
Argo Global Listed Infrastructure (ALI) 14 MFF Capital Investments (MFF) 43 WAM Global (WGB) 72
AMCIL (AMH) 15 Magellan Global Trust (MGG) 44 Whitefield (WHF) 73
Antipodes Global Inv. Co. (APL) 16 Mirrabooka Corporation (MIR) 45 Westoz (WIC) 74
Argo Investments (ARG) 17 Milton Corporation (MLT) 46 WAM Leaders (WLE) 75
Australian United Inv. Co. (AUI) 18 NAOS Ex-50 Opp. Co. Ltd (NAC) 47 WAM Microcap (WMI) 76
Bluesky Alternative Access Fund (BAF) 19 NAOS Emerging Opportunities (NCC) 48 8IP Emerging Companies (8EC) 77
BKI Investment Company (BKI) 20 NGE Capital (NGE) 49
Barrack St Investments (BST) 21 NAOS Small Opportunities (NSC) 50
Bailador Technology Investments (BTI) 22 Ophir High Conviction (OPH) 51
Clime Capital (CAM) 23 Ozgrowth Ltd (OZG) 52
CBG Capital (CBG) 24 PM Capital Asian Opportunities (PAF) 53 Historical Prem/Disc Trading Levels 78
Cadence Capital (CDM) 25 Platinum Asia Investments (PAI) 54 Historical Prem/Disc Trading Levels 79
Concentrated Leaders Fund (CLF) 26 PM Capital Global Opportunities (PGF) 55 Historical Prem/Disc Trading Levels 80
Contango Income Generator (CIE) 27 Perpetual Equity Investment (PIC) 56 Historical Prem/Disc Trading Levels 81
Carlton Investments (CIN) 28 Pengana International Equities (PIA) 57 Historical Prem/Disc Trading Levels 82
Djerriwarrh Investments (DJW) 29 Platinum Capital (PMC) 58 Historical Prem/Disc Trading Levels 83
Diversified United Investments (DUI) 30 Plato Income Maximiser (PL8) 59 Premium/Discount to Pre-tax NTA 84
Ellerston Asian Investments (EAI) 31 QV Equities (QVE) 60 Premium/Discount to Post-tax NTA 84
Ellerston Global Investments (EGI) 32 Ryder Capital (RYD) 61 Total Shareholder Return – 12 mths 85
Forager Australian Shares Fund (FOR) 33 Spheria Emerging Companies (SEC) 62 TSR compound annual growth – 3 yrs 85
Future Generation Global Inv. (FGG) 34 Sandon Capital Investments (SNC) 63 TSR compound annual growth – 5 yrs 86
Future Generation Investment (FGX) 35 Tribeca Global Natural Resources (TGF) 64 NTA growth – 1 yr 87
Glennon Small Companies (GC1) 36 Templeton Global Growth (TGG) 65 NTA compund annual growth – 3 yrs 87
Global Value Fund (GVF) 37 Thorney Opportunities (TOP) 66 NTA compound annual growth – 5 yrs 88

Baillieu Research 1 May 2019
baillieu.com.au Baillieu Limited ABN 74 006 519 393 Please read the disclaimer at the end of this report 3
Updated Sector Snapshot
Figures as at: 30 April 2019
Traditional LICs CodeShare Price
Market Cap. ($m)
Trailing Dividend
(cents)
Dividend Yield
Grossed Up Yield
TSR since Aprl 1
Current Est.NTA
Current Estimated Disc/Prem
Mar NTA
Mar Disc/Prem
1 Yr Ave Disc/Prem
3 Yr AveDisc/Prem
MER
Australian Foundat. AFI 5.94 7128.9 32.0 5.4% 7.7% -0.2% 6.20 -4.2% 6.03 -1.3% 1.7% 1.1% 0.14%Argo Investments ARG 7.80 5576.5 32.0 4.1% 5.9% 2.2% 8.13 -4.1% 7.93 -3.8% -0.2% 0.5% 0.17%Australian United In AUI 8.49 1055.5 36.0 4.2% 6.1% 1.1% 9.33 -9.0% 9.13 -8.0% -5.2% -5.2% 0.10%BKI Investment Ltd BKI 1.51 1099.7 8.8 5.9% 8.4% 0.3% 1.62 -6.9% 1.58 -5.1% -2.7% 0.6% 0.15%Djerriwarrh DJW 3.12 694.8 20.0 6.4% 9.2% -3.4% 3.21 -2.8% 3.13 3.2% 4.7% 12.1% 0.46%Diversified United DUI 4.13 871.3 15.5 3.8% 5.4% 1.2% 4.57 -9.6% 4.47 -8.7% -6.2% -6.2% 0.13%Milton Corporation MLT 4.46 2983.6 21.7 4.9% 7.0% 0.3% 4.76 -6.2% 4.68 -4.5% -2.5% -1.5% 0.12%
Large Capitalisation CodeShare Price
Market Cap. ($m)
Trailing Dividend
(cents)
Dividend Yield
Grossed Up Yield
TSR since Aprl 1
Current Est.NTA
Current Estimated Disc/Prem
Mar NTA
Mar Disc/Prem
1 Yr Ave Disc/Prem
3 Yr AveDisc/Prem
MER
Australian Leaders ALF 0.90 223.7 4.0 4.4% 6.3% -0.6% n.a n.a 1.15 -21.3% -16.1% -4.5% 1.00%Concentrated Leaders CLF 1.29 76.6 6.0 4.7% 6.6% 1.0% n.a n.a 1.36 -5.1% -6.0% -7.6% 0.75%AMCIL Limited AMH 0.85 233.4 7.8 9.1% 13.0% 1.2% 0.95 -10.7% 0.92 -8.7% -5.9% -3.0% 0.65%Clime Capital CAM 0.88 80.3 5.0 5.7% 8.2% 1.4% n.a n.a 0.92 -4.9% -5.6% -8.2% 0.83%CBG Capital CBC 1.00 26.2 3.1 3.1% 4.4% 3.1% n.a n.a 1.03 -5.8% -9.5% -10.5% 1.00%Cadence Capital CDM 0.85 270.6 4.0 4.7% 6.8% -3.9% 0.96 -12.1% 0.95 -4.3% 0.7% 5.8% 1.00%Contango Inc Gen Ltd CIE 0.79 81.8 6.5 8.3% 11.8% 1.9% 0.96 -17.8% 0.92 -16.6% -8.4% -6.3% 0.95%Carlton Investments CIN 30.45 806.2 125.0 4.1% 5.9% 0.8% 36.40 -16.3% 36.43 -17.1% -12.4% -12.3% 0.09%Future Gen Ltd FGX 1.17 463.7 4.6 3.9% 5.6% -1.4% n.a n.a 1.20 1.0% 1.6% -1.1% 0.00%L1 Long Short Fnd Ltd LSF 1.55 1030.5 3.0 1.9% 2.8% 5.4% 1.69 -8.5% 1.61 -8.6% -1.4% na 1.25%Mirrabooka Invest. MIR 2.38 381.9 22.0 9.2% 13.2% -2.5% 2.38 0.1% 2.29 6.6% 8.4% 13.3% 0.65%Ophir High Conviction OPH 2.58 516.0 0.0 na na 1.2% 2.61 -1.1% 2.46 3.7% 3.1% na 1.23%Perpetual Equity Ltd PIC 1.02 350.0 6.4 6.3% 9.0% -0.4% 1.09 -7.1% 1.10 -4.1% -0.6% -4.5% 1.00%Plato Income Max. PL8 1.09 322.2 6.0 5.5% 7.9% 5.3% n.a n.a 1.08 -4.1% -3.2% -0.3% 0.80%Qv Equities Limited QVE 1.04 287.4 5.3 5.1% 7.3% 0.0% 1.17 -11.3% 1.13 -8.0% -4.5% 1.6% 0.90%WAM Capital Limited WAM 2.03 1456.7 15.5 7.6% 10.9% -5.7% n.a n.a 1.86 20.0% 20.7% 20.1% 1.00%WAM Leaders Limited WLE 1.10 858.4 5.2 4.7% 6.7% 0.1% 1.23 -10.8% 1.20 -6.6% -2.9% -2.0% 1.00%Whitefield Ltd WHF 4.59 421.6 18.8 4.1% 5.8% 3.4% 5.07 -9.5% 4.92 -9.8% -7.7% -8.1% 0.25%
Small Capitalisation CodeShare Price
Market Cap. ($m)
Trailing Dividend
(cents)
Dividend Yield
Grossed Up Yield
TSR since Aprl 1
Current Est.NTA
Current Estimated Disc/Prem
Mar NTA
Mar Disc/Prem
1 Yr Ave Disc/Prem
3 Yr AveDisc/Prem
MER
Acorn Cap Inv Fund ACQ 1.09 57.6 6.2 5.7% 6.7% 0.0% 1.26 -13.5% 1.23 -11.4% -10.6% -12.6% 0.95%Barrack St Invest BST 0.96 17.6 3.5 3.6% 4.3% 1.6% 1.30 -26.1% 1.23 -23.2% -20.2% -17.5% 1.00%Naos Small Cap Opp NSC 0.61 102.2 5.5 9.1% 10.7% -3.2% n.a n.a 0.76 -17.8% -12.7% -10.0% 1.25%Forager Aust. Shares FOR 1.26 143.4 14.9 11.8% 11.8% -9.0% 1.36 -7.4% 1.40 -1.1% 6.8% 9.4% 1.00%Glennon SML Co Ltd GC1 0.88 42.0 4.0 4.6% 5.4% 3.6% n.a n.a 0.96 -12.0% -11.8% -9.5% 1.00%Naos Emerg Opp NCC 1.02 61.1 7.3 7.1% 10.2% -5.6% n.a n.a 1.06 1.9% -0.2% -0.9% 1.25%NGE Capital NGE 0.68 25.3 0.0 n.a n.a -11.7% n.a n.a 0.81 -4.6% -17.4% -22.3% 1.90%Ozgrowth Limited OZG 0.16 57.0 0.5 3.1% 4.5% 0.0% 0.20 -19.2% 0.20 -18.4% -19.3% -19.6% 1.00%Ryder Capital RYD 1.25 74.9 3.0 2.4% 3.4% 0.0% n.a n.a 1.41 -9.1% -16.6% -9.5% 1.25%Spheria Emerging Co SEC 1.77 117.4 6.0 3.4% 4.8% 2.6% 2.10 -15.8% 2.03 -14.9% -9.1% -7.7% 1.00%WAM Research Ltd WAX 1.30 248.2 9.6 7.4% 10.5% -5.8% n.a n.a 1.17 21.9% 24.5% 22.4% 1.00%Westoz Inv Ltd WIC 1.04 137.9 6.0 5.8% 8.3% 1.5% 1.17 -11.2% 1.15 -11.6% -9.1% -11.6% 1.00%WAM Microcap Ltd WMI 1.20 168.3 6.3 5.2% 7.5% -1.4% n.a n.a 1.26 -2.1% 6.0% 7.2% 1.00%8Ip Emerg Co Ltd 8EC 0.73 29.9 4.5 6.2% 8.8% 7.4% n.a n.a 0.88 -22.4% -16.2% -13.7% 1.25%
International CodeShare Price
Market Cap. ($m)
Trailing Dividend
(cents)
Dividend Yield
Grossed Up Yield
TSR since Aprl 1
Current Est.NTA
Current Estimated Disc/Prem
Mar NTA
Mar Disc/Prem
1 Yr Ave Disc/Prem
3 Yr AveDisc/Prem
MER
Argo Global Ltd ALI 2.16 305.7 5.0 2.3% 2.3% -0.5% 2.43 -11.1% 2.42 -10.3% -14.9% -12.5% 1.25%Antipodes Global APL 1.00 551.6 7.0 7.0% 7.0% 1.0% 1.13 -11.7% 1.10 -10.0% -6.6% -2.5% 1.10%Ellerston Asian EAI 0.98 143.6 2.0 2.1% 2.1% 2.1% 1.14 -14.1% 1.11 -13.8% -6.4% -9.7% 0.75%Ellerston Global Inv EGI 0.95 104.6 3.0 3.2% 4.5% 2.2% n.a n.a 1.07 -13.1% -8.5% -10.4% 0.75%Future Glb Invest Co FGG 1.40 548.5 1.0 0.7% 1.0% 2.2% n.a n.a 1.34 2.0% 1.4% -0.9% 0.00%Global Value Fnd Ltd GVF 1.01 148.7 6.3 6.3% 9.0% -2.4% 1.10 -8.7% 1.04 -0.8% -1.4% -0.1% 1.50%Pengana International PIA 1.06 267.2 7.0 6.6% 9.5% -2.8% 1.21 -12.9% 1.22 -8.4% -6.6% -6.0% 1.50%MFF Capital Invest. MFF 2.99 1619.3 4.5 1.5% 2.2% 6.6% 3.21 -6.9% 3.02 -6.5% -6.3% -9.5% 1.25%Magellan Global Trust MGG 1.79 2213.4 6.0 3.4% 4.8% 6.2% 1.80 -0.5% 1.72 -2.2% -1.4% -0.5% 1.35%Pm Capital Asian Ops PAF 1.02 57.7 4.0 3.9% 5.6% 2.5% 1.11 -8.4% 1.06 -7.0% 0.7% -3.7% 1.00%Platinum Asia Ltd PAI 1.13 409.2 8.0 7.1% 10.1% 7.6% 1.12 1.0% 1.10 -4.2% 4.8% -0.3% 1.10%Pm Capital Fund PGF 1.17 411.9 3.6 3.1% 4.4% 3.1% 1.35 -13.1% 1.27 -10.5% -6.6% -8.4% 1.00%Platinum Capital Ltd PMC 1.63 468.9 12.0 7.4% 10.5% 0.3% 1.62 0.1% 1.56 4.0% 12.4% 7.9% 1.10%Templeton Global TGG 1.26 273.5 10.0 8.0% 11.4% 0.0% 1.48 -15.0% 1.43 -12.5% -9.1% -9.8% 1.20%WAM Global WGB 1.92 405.2 0.0 n.a n.a -1.3% n.a n.a 2.23 -12.9% -4.5% na 1.25%VGI Partners Global VG1 2.44 679.8 0.0 n.a n.a 1.7% 2.35 3.9% 2.28 5.3% 5.4% 4.9% 1.50%
Specialist CodeShare Price
Market Cap. ($m)
Trailing Dividend
(cents)
Dividend Yield
Grossed Up Yield
TSR since Aprl 1
Current Est.NTA
Current Estimated Disc/Prem
Mar NTA
Mar Disc/Prem
1 Yr Ave Disc/Prem
3 Yr AveDisc/Prem
MER
Blue Sky Alt Access BAF 0.79 160.4 5.0 6.3% 9.0% -7.6% 1.10 -28.4% 1.10 -22.5% -21.8% -4.7% 1.20%Bailador Tech Inv BTI 0.88 105.8 0.0 n.a n.a 10.0% 1.17 -24.8% 1.17 -31.6% -29.3% -18.9% 1.75%Hearts and Minds HM1 2.83 566.0 0.0 n.a n.a -1.0% 2.93 -3.4% 2.80 2.1% 1.2% na 0.00%Lowell Resource Fund LRT 4.50 12.5 0.0 n.a n.a 0.0% 5.71 -21.1% 5.64 -20.2% -12.7% -11.8% 2.16%Lion Selection Grp LSX 0.35 51.8 0.0 n.a n.a -2.8% n.a n.a 0.44 -19.3% -8.7% -6.0% 1.50%Monash Absolute MA1 0.81 35.7 1.0 n.a n.a 3.2% n.a n.a 0.97 -19.9% -16.0% -10.4% 1.50%NAOS ex-50 Opport. NAC 0.86 45.2 5.2 6.0% 8.6% 2.4% n.a n.a 1.02 -17.6% -12.5% -7.6% 1.75%Sandon Capital Ltd SNC 0.89 43.1 7.0 7.9% 11.2% 1.1% n.a n.a 0.95 -7.4% -5.8% -4.5% 1.25%Tribeca Glb Resources TGF 2.36 148.7 0.0 0.0% 0.0% 4.4% n.a n.a 2.47 -8.3% na na 1.50%Thorney Opp Ltd TOP 0.64 130.3 1.6 2.4% 3.5% 0.0% n.a n.a 0.79 -18.9% -15.4% -10.3% 0.75%URB Investments URB 0.93 67.9 2.8 3.0% 4.2% 1.1% n.a n.a 1.13 -19.0% -11.8% na 0.50%WAM Active Limited WAA 0.99 45.5 5.8 5.9% 8.4% -3.4% n.a n.a 1.05 0.3% 2.4% 4.0% 1.00%Source: Company releases Bloomberg Baillieu estimates
Listed Investment Companies Coverage by SectorBAILLIEU - EQUITY RESEARCH

Baillieu Research 1 May 2019
baillieu.com.au Baillieu Limited ABN 74 006 519 393 Please read the disclaimer at the end of this report 4
LIC Basics What is a LIC?
• A LIC has characteristics of both managed funds and stock exchange-listed companies.
• Essentially a LIC is a company that invests in other companies, with the purpose of giving its shareholders exposure to a variety of shares via its investment portfolio.
• LICs may also invest in cash or fixed income instruments, although in many cases this will form only a relatively small proportion of their investment portfolio.
• Income from LICs takes the form of semi-annual dividend payments that are linked to the profitability of the portfolio. Capital gains can arise where the investor sells the shares in the LIC for more than they originally bought them for.
Benefits of investing in LICs Diversification
• Investment in just one LIC can potentially give an investor exposure to more than 100 different companies in a range of industries.
• This therefore reduces the risk to capital losses as losses connected to one company may be offset by gains by others in the portfolio.
• A LIC is a cost-effective method of achieving such a degree of diversification.
LICs are managed by investment professionals
• Each LIC is managed by full-time investment professionals whose goal it is to optimise returns on the investment portfolio for shareholders within strictly enforced risk parameters.
• In this respect, LICs are passive investments. Once the shares in the LIC have been purchased, the investor leaves investment decisions to the managers of the LIC.
• Some LICs have operated for more than 50 years while others, although only recently listed, are operated and managed by investment firms that have built strong reputations over many years.
Transparent investment philosophy
• All LICs are transparent as to how they invest their funds. Investors can choose the relevant LIC based on their own investment goals and risk preferences.
• Some LICs focus on specific geographic areas (such as Australia or overseas), may invest in a range of industries or focus on just one (such as resources), or are geared towards providing investors with annual income streams or longer-term capital gains (or a combination of both).
• In this document, we briefly describe each of the 51 selected LICs as well as list the main investments of each and their recent performance.
Ease of investment
• Investing in a LIC is done in exactly the same manner as any other company on the ASX, by placing an order with your stockbroker to buy shares in it.
• Exiting the investment is just as straightforward: the investor sells the shares on-market during trading hours through their stockbroker.
• The majority of LICs are highly ‘liquid’, meaning that there are a relatively large number of willing buyers and sellers on the ASX ready to allow the investor to enter or exit the investment at any time they want and without having to buy in at a premium or sell at a discount to “market price”.

Baillieu Research 1 May 2019
baillieu.com.au Baillieu Limited ABN 74 006 519 393 Please read the disclaimer at the end of this report 5
Costs involved in investing in a LIC Entry costs
• Investing in the ASX via a LIC is highly cost-effective relative to other methods of investing in a ‘portfolio’ of investments.
• The initial cost comes in the form of brokerage paid to acquire the shares. Investing in a LIC allows the investor to effectively buy shares in more than 50 companies (depending on the LIC), but only pay brokerage to invest in one (the LIC). A LIC is therefore an efficient method of diversification.
• The entry costs to LIC investments are generally lower than retail managed funds, which utilise a “front-end load” charge that can be up to 4% of the market value of the units in the fund at the date of purchase.
Ongoing costs
• There are two types of fees that the manager of the LIC charges during the investment period: management fees and performance fees.
• The LIC uses management fees to cover costs incurred in running the portfolio. These fees are taken out of the profits of the LIC, which are a function of the performance of the investment portfolio of the company (including dividends paid and capital gains/losses on shares that are sold). They are paid regardless of the profitability of the investment portfolio.
• These fees range from 0.0%-1.75% of assets per year. This is much lower than average fees charged for retail managed funds, which are approximately 1.5-3.0%. The effect of this cost-saving on a longer-term investment, where returns compound over a number of years, can be quite substantial. One reason for this lower cost is that LICs do not incur back-office or distribution costs, reducing their cost of operation. The fees (calculated as a “management expense ratio” or MER) of our selected LICs are shown in the graph below.
• Unlike management fees, performance fees are paid only if the LIC’s investment portfolio outperforms a predetermined benchmark and is linked to the size of this outperformance. Not all LICs charge performance fees.
• These fees provide an incentive for the manager of the fund to optimise returns for shareholders of the LIC. They are generally paid not just if the fund is profitable, but when it is more profitable than the market as a whole. Unlike management fees, they will generally not deteriorate low returns or worsen investment losses.
• Performance fees for our selected LICs are shown in the table overleaf. The benchmark index is the S&P/ASX All Ordinaries Accumulation Index unless otherwise stated below.
Disclaimer: LIC performance measurements reflect performance after all operating expenses and taxation. Using index benchmarks often understates performance as the indices used are before all operating expenses and tax. Total Shareholder Returns are often negatively impacted by capital events such as options, DRPs, Share Purchase Plans and placements. Dividend yields contained within are historical and are not an indication of future dividend payments.
NTA Performance calculation methodology **NTA performance is calculated on pre-tax NTA basis which refers to net tangible assets after tax paid but before tax on unrealised gains as well as cash dividends paid during the relevant period. *TSR performance figures from Bloomberg and calculated with re-invested dividends. *Active return refers to TSR relative to that of the comparative index.
Investing in the ASX via a LIC is highly cost-effective relative to other methods of investing in a “portfolio” of investments

Baillieu Research 1 May 2019
baillieu.com.au Baillieu Limited ABN 74 006 519 393 Please read the disclaimer at the end of this report 6
LIC Performance fees
Source: Company reports, Baillieu
ACQ 20% of outperformance of S&P/ASX Small Ords Acc Index
AFI None
ALF 20% above All Ordinaries Accumulation Index
ALI None
ALR None
AMH None
APL 15% of net return in excess of MSCI World Index ($AUD)
ARG None
AUI None
BKI None
BST 20% of annual outperformance over 8.0%
BTI On sale, a fee of 17.5% of the increase in value, subject to a compound 8% hurdle
CDM 20% of returns above index or of portfolio return
CIE None
CIN None
DJW None
DUI None
EAI 15% of outperformance in excess of the MSCI AC Asia Ex Japan Index ($AUD)
EGI 15% of outperformance in excess of MSCI World Index (Local)
FGG None
FGX None
FOR 10% of the net return in excess of 8% p.a. benchmark
GC1 20% of outperformance over the Small Ordinaries Accumulation Index
GVF 15% of outperformance in excess of a hurdle return being 4% above the 1 year swap rate
HHV 15% above MSCI World Index
LSX 15% of outperformance above benchmark
MA1 20% of outperformance over the RBA cash rate, inclusive of a high watermark
MFF 10% if returns exceed MSCI World Index and 10-year bond rate
MIR None
MLT None
NCC 15% of performance in excess of Small Ordinaries Accumulation Index
OZG 20% where performance exceeds 7% over 12 month period
PAF 15% of performance in excess of MSCI Asia (ex Japan) Index (AUD)
PAI 15% of performance in excess of MSCI Asia (ex Japan) Index (AUD)
PGF 15% of performance in excess of MSCI World Index (AUD)
PIC None
PMC 15% of performance in excess of MSCI World Index (AUD)
QVE None
SNC 20% of outperformance over the Benchmark Reference Rate (BBSW)
TGG None
TOP Greater of zero and 20% of the increase in asset value in each financial year
WAA 20% of portfolio growth over a high watermark
WHF None
WAM & WAX20% of returns above All Ordinaries Accumulation Index if index increased, or where the 20% of the index decreased over the period, 20% of positive portfolio perf (0% if negative)
WIC 20% where performance exceeds 10% over 12 month period
WLE 20% outperformance over the S&P/ASX200 Accumulation Index
8EC 20% of outperformance over the RBA cash rate plus 2%
CLF 20% of outperformance over the ASX200 Accum. Index
CAM 20% of absolute dollar outperformance of All Ordinaries Accumulation Index (post base fee deduction).
CBC 20% of outperformance of S&P/ASX 200 Accumulation Index, subject to a high watermark.
LSF 20% of the portfolio's performance over each 6 month period subject to a high watermark
OPH 20.5% p.a. of the fund's outperformance fo the ASX Mid-Small Index over a 6 month period
PL8 na
WDE 15% of net return in excess of S&P/ASX 300 Accumulation Index
NSC None
RYD 20% of portfolio outperformance above the RBA cash rate plus 4.5% per annum
SEC20% of outperformance of the S&P/ASX Small Ordinaries Index over each 6 month period subject to a high water mark. No performance fees to be paid in first 4 calendar years from listing date (ie. By 31 December 2021) or until all Offer Costs have been recouped (whichever is earlier)
WMI20% of the portfolio's outperformance of the S&P/ASX Small Ordinaries Index or the portfolio's absolute performance when the benchmark return is negative
PIA15% of outperformance of the MSCI World Total Return Index, Net Dividends Reinvested in A$, subject to a high water mark.
MGG
10% (inclusive of the estimated net effect of GST less RITC and other recoveries available to the Trust) of theTrust's excess return above the higher of the MSCI Wold Net Total Return Index (AUD) and the yield of 10-year Australian Government Bonds over each 6 month period. Performance fees are accrued daily in the NAV.
WGB20% of outperformance of the MSCI World Indext Net (AUD) subject to recoupment of prior underperformance.
VG1 15% of the portfoliio's performance over each 6 month period subject to a high water mark.
BAF 17.5% (plus GST) of outperformance over a hurdle rate of 8.0%
HM1 na
LRT17.9375% (inclusive of the estimated net effect of GST less RITC and other recoveries available to the Fund) of the change in NAV (incl distributions) exceeds the.
NAC 20% of outperformance over the RBA cash rate plus 250bp
URB 15% of the outperformance above a 12 month NTA return of 8.0%
TGF 20% of the portfolio's performance over each 6 month period subject to a high watermark

Baillieu Research 1 May 2019
baillieu.com.au Baillieu Limited ABN 74 006 519 393 Please read the disclaimer at the end of this report 7
Exit costs
• Exit costs from LICs are generally limited to the brokerage paid on selling the shares. This is unlike retail managed funds, which can generally be exited at no charge.
• Exiting a LIC investment can have tax consequences.
What income do investors receive from a LIC?
• Annual investor income from a “buy-and-hold” investment strategy in a LIC takes the form of dividends, just like other share investments.
• However, because LICs utilise a company structure, payment of dividends is at the discretion of the management of the LIC. In other words, just because the investment portfolio of the LIC has made a profit in a given year, it does not mean that all, or even any, of that profit will be paid to shareholders in that year. This is unlike managers of retail managed funds, which are required to pay out the income to unitholders in the particular tax year that it is earned. Generally, LICs will pay out a high proportion of earnings as dividends.
• Most of our selected LICs focus on blue chip stocks and pay out a high proportion of earnings as a dividend. Accordingly, they have healthy dividend yields (as shown in the following graph).
Fig.1: Dividend yield for selected LICs
Source: Iress, Bloomberg, Baillieu
AM
HG
VF
MIR
NSC
CD
MC
IE TGG
SNC
PAI
PMC
APL WA
MN
CC
WA
X8E
CPI
AD
JW NA
CEG
IBK
IW
ICBA
FPL
8C
AM
AC
QW
AA
AFI QV
EW
MI
GC
1C
LFW
LEA
LFM
LTA
UI
WH
FA
RGC
INPA
FD
UI
FGX
BST
MG
GSE
CC
BCPG
FPI
CO
ZGU
RBTO
PRY
DA
LIEA
ILS
FM
A1
MFF
FGG
0%
1%
2%
3%
4%
5%
6%
7%
8%
9%
10%

Baillieu Research 1 May 2019
baillieu.com.au Baillieu Limited ABN 74 006 519 393 Please read the disclaimer at the end of this report 8
Taxation issues
• The returns of the LIC are generally taxed at the company tax rate of 30%. Accordingly, when dividends are paid to shareholders of the LIC, they attach franking credits. These are a tax benefit for shareholders, as they receive a “credit” for the company tax already paid on the LIC income when the shareholder’s ordinary income is assessed.
• Capital gains are managed by the manager of the LIC. Where the dividend paid to a shareholder of a LIC contains income derived from a capital gain of the LIC, it will be treated as a capital gain, not ordinary income, in the hands of the shareholder. Under current tax rules, only 50% of this amount is taxable for many investors.
• This tax treatment contrasts with that of unlisted retail managed funds, where investors incur an annual tax liability on interest and capital gains that the fund earns each year.

Baillieu Research 1 May 2019
baillieu.com.au Baillieu Limited ABN 74 006 519 393 Please read the disclaimer at the end of this report 9
LICs versus managed funds
• LICs are listed on the stock exchange so entry and exit costs are limited to brokerage. This means that diversification is achieved at little cost. LICs also offer a tax-effective structure, whereby dividends are fully franked and assessed as a capital gain in the hands of the shareholder. Therefore, only 50% of this amount is taxable for many investors. Contrast this with managed funds where investors incur an annual tax liability on the interest and capital gains that the funds earn each year.
• The fee structures of LICs are also favourable in comparison with managed funds. Our selected LICs have management expense ratios ranging from 0.12% to 1.5%, whereas managed funds often charge at least 1.5%. The difference in fees can have a substantial effect on long-term investments. For example, from an initial investment of $50,000 invested at identical returns for a decade, the LIC investment could be worth up to $6,000 more than the managed fund.
LICs versus exchange traded funds (ETFs)
• LICs and ETFs both have low management fees and efficient tax structures compared with managed funds. However, ETFs have an open-ended structure, where units on offer can increase or decrease based on supply and demand, and trade at or close to their net asset value. ETFs are generally passive investment products and hence do not aim to outperform the market in the same way many of the LICs do.
• ETFs are required to distribute any surplus income to security holders, whereas LICs have the ability to conserve surplus income and take advantage of market opportunities as they see fit. This added flexibility is beneficial to the shareholder.
• Despite speculation that LICs will face increased competition from ETFs, we feel that for the majority of our clients LICs provide a superior investment vehicle with the added possibility of returns above that of the underlying asset.
Our selected LICs have management expense ratios ranging from 0.0%-1.75%, whereas managed funds often charge at least 1.5%

Baillieu Research 1 May 2019
baillieu.com.au Baillieu Limited ABN 74 006 519 393 Please read the disclaimer at the end of this report 10
Fig. 2: LIC Performance Table (Mar 2019)
Code CompanyNTA
performance TSR
PerformanceAvg.
Prem/DiscNTA
performance TSR
PerformanceAvg.
Prem/DiscNTA
performance TSR
PerformanceAvg.
Prem/DiscAFI Australian Foundat. 8.9% 3.7% 1.7% 8.5% 7.1% 1.1% 4.7% 4.1% 2.2%ARG Argo Investments 8.7% 1.4% -0.2% 8.9% 5.7% 0.5% 5.3% 5.0% 2.2%AUI Australian United In 11.6% 5.9% -5.2% 11.4% 10.9% -5.2% 5.3% 5.7% -4.6%BKI BKI Investment Ltd 8.3% 0.5% -2.7% 6.4% 2.3% 0.6% 3.8% 3.4% 0.8%DJW Djerriwarrh 6.7% 4.6% 4.7% 8.0% -2.2% 12.1% 2.8% -1.0% 18.6%DUI Diversified United 10.1% 6.3% -6.2% 14.1% 12.5% -6.2% 7.9% 7.4% -5.8%MLT Milton Corporation 9.7% 3.6% -2.5% 8.0% 6.6% -1.5% 5.4% 5.4% 0.0%
CodeNTA
Performance TSR
PerformanceAvg.
Prem/DiscNTA
Performance TSR
PerformanceAvg.
Prem/DiscNTA
Performance TSR
PerformanceAvg.
Prem/DiscALF Australian Leaders -1.7% -9.4% -16.1% -1.0% -10.4% -4.5% 0.0% -6.4% 0.3%CLF Concentrated Leaders 14.5% 9.3% -6.0% 10.7% 13.0% -7.6% 6.4% 4.6% -6.5%AMH AMCIL Limited 6.1% 2.2% -5.9% 5.9% 3.4% -3.0% 4.5% 3.5% -2.5%CAM Clime Capital 5.4% 10.4% -5.6% 6.7% 10.0% -8.2% 1.6% 2.8% -8.2%CBC CBG Capital Limited 5.5% 19.9% -9.5% 4.6% 8.1% -7.8% na na naCDM Cadence Capital -15.1% -26.6% 0.7% 2.2% -8.4% 5.8% 0.3% -3.3% 5.7%CIE Contango Inc Gen Ltd 0.5% -12.7% -8.4% 4.9% -0.4% -6.3% na na naCIN Carlton Investments 2.5% -2.4% -12.4% 3.6% 1.8% -12.3% 7.5% 6.9% -11.6%FGX Future Gen Ltd 1.5% 6.4% 1.6% 4.8% 5.9% -1.1% na na naLSF L1 Long Short Fund -17.9% -26.1% -1.4% na na na na na naMIR Mirrabooka Invest. 3.7% 3.2% 8.4% 6.6% 4.1% 13.3% 6.6% 3.8% 13.1%OPH Ophir High Cf 7.6% 15.9% 3.1% 13.8% na na na na naPIC Perpetual Equity Ltd 3.6% -1.6% -0.6% 6.6% 8.8% -4.5% na na naPL8 Plato Inc Max Ltd. 10.8% 12.6% -3.2% na na na na na naQVE Qv Equities Limited 1.1% -6.7% -4.5% 5.7% 5.1% 1.6% na na naWAM WAM Capital Limited 0.3% -4.7% 20.7% 8.3% 6.1% 20.1% 8.5% 8.6% 15.6%WLE WAM Leaders Limited 7.6% 1.8% -2.9% na na na na na naWHF Whitefield Ltd 6.2% 0.7% -7.7% 6.3% 5.3% -8.1% 5.7% 5.1% -7.4%
CodeNTA
Performance TSR
PerformanceAvg.
Prem/DiscNTA
Performance TSR
PerformanceAvg.
Prem/DiscNTA
Performance TSR
PerformanceAvg.
Prem/DiscACQ Acorn Cap Inv Fund -1.4% 1.7% -10.6% 9.7% 14.6% -12.6% na na naBST Barrack St Invest 16.4% 13.9% -20.2% 5.3% 3.2% -17.5% na na naNSC Naos Smlcap Com Ltd -14.2% -22.5% -12.7% -4.5% -6.7% -10.0% -2.2% -3.1% -9.8%FOR Forager Aust Shs Fnd -12.0% -22.7% 6.8% na na na na na naGC1 Glennon SML Co Ltd -10.7% -7.5% -11.8% 1.2% -1.4% -9.5% na na naNCC Naos Emerg Opp -12.9% -13.3% -0.2% 4.1% 9.5% -0.9% 3.1% 6.6% -4.7%NGE NGE Capital Limited 31.9% 73.0% -17.4% na na na na na naOZG Ozgrowth Limited -13.0% -3.1% -19.3% 8.1% 10.4% -19.6% -0.3% 0.3% -16.8%RYD Ryder Capital Ltd -4.8% 7.4% -16.6% 13.5% na -9.5% na na naSEC Spheria Emerging Co 2.6% -8.7% -9.1% na na na na na naWAX WAM Research Ltd 1.1% -2.6% 24.5% 7.2% 8.6% 22.4% 8.7% 10.3% 16.2%WIC Westoz Inv Ltd -2.5% -3.9% -9.1% 12.1% 16.4% -11.6% 1.5% 3.0% -10.3%WMI WAM Microcap Limited 3.1% -13.0% 6.0% na na na na na na8EC 8Ip Emerg Co Ltd -16.2% -20.9% -16.2% -0.6% -6.2% -13.7% na na na
1 Year 3 Year (annualised) 5 Year (annualised)
CodeNTA
Performance TSR
PerformanceAvg.
Prem/DiscNTA
Performance TSR
PerformanceAvg.
Prem/DiscNTA
Performance TSR
PerformanceAvg.
Prem/DiscALI Argo Global Ltd 21.1% 32.5% -14.9% 9.8% 8.8% -12.5% na na naAPL Antipodes Global Inv -2.8% -12.7% -6.6% na na na na na naEAI Ellerston Asian -4.7% -10.6% -6.4% 8.1% 7.7% -9.7% na na naEGI Ellerston Global Inv -4.9% -9.7% -8.5% 2.4% 2.2% -10.4% na na naFGG Future Glb Invest Co 6.2% 12.2% 1.4% 10.5% 8.0% na na na naGVF Global Value Fnd Ltd 1.8% 1.3% -1.4% 5.2% 7.6% -0.1% na na naPIA Pengana Int Equ Ltd 3.4% 3.3% -6.6% 1.7% 4.1% -6.0% 6.3% 7.7% -8.2%MFF MFF Capital Inv Ltd 19.5% 26.8% -6.3% 20.0% 15.3% -9.5% 18.2% 15.0% -7.1%MGG Magellan Glob Trust 16.5% 16.6% -1.4% na na na na na naPAF Pm Capital Asian Ops -10.1% -22.2% 0.7% 3.7% 8.3% -3.7% na na naPAI Platinum Asia Ltd -2.6% -12.0% 4.8% 10.8% 8.3% -0.3% na na naPGF Pm Capital Fund -2.9% -3.0% -6.6% 11.1% 12.3% -8.4% na na naPMC Platinum Capital Ltd -4.9% -12.7% 12.4% 8.3% 4.6% 7.9% 5.0% 3.6% 9.1%TGG Templeton Global 0.5% -2.0% -9.1% 9.5% 8.6% -9.8% 5.6% 3.7% -8.6%TGF Tribeca Global -1.2% -10.3% -1.5% na na na na na naVG1 Vgi Partners Global 10.1% 15.4% 5.4% na na na na na na
WGB WAM Global Limited 1.2% -11.8% -4.5% na na na na na na
1 Year 3 Year (annualised) 5 Year (annualised)
CodeNTA
Performance TSR
PerformanceAvg.
Prem/DiscNTA
Performance TSR
PerformanceAvg.
Prem/DiscNTA
Performance TSR
PerformanceAvg.
Prem/DiscBAF Blue Sky Alt Access 1.9% 9.2% -21.8% 5.8% 0.0% -4.7% na na naBTI Bailador Tech Inv 9.3% -5.3% -29.3% 0.3% -7.3% -18.9% na na naHM1 Hearts and Minds 14.4% 12.6% 1.2% na na na na na naLRT Lowell Res Fund -31.6% -47.1% -12.7% na na na na na naLSX Lion Selection Grp 33.3% 6.0% -8.7% 12.4% 15.6% -6.0% -6.6% -6.6% -18.2%MA1 Monash Absolute 0.2% -2.6% -16.0% 0.3% -7.6% na na na naNAC Naos Ex-50 -3.5% -10.0% -12.5% -0.2% 0.2% -7.6% na na naSNC Sandon Capital Ltd 2.5% -3.5% -5.8% 7.2% 8.0% -4.5% 5.2% 4.0% -4.6%TOP Thorney Opp Ltd -0.5% -2.9% -15.4% 12.8% 8.6% -10.3% 12.2% 4.4% -8.6%URB URB Investments Ltd 10.4% -1.5% -11.8% na na na na na naWAA WAM Active Limited 1.4% -2.7% 2.4% 6.8% 4.1% 4.0% 6.1% 0.5% 4.5%Source: Bloomberg, Baillieu
1 Year 3 Year (annualised) 5 Year (annualised)
1 Year 3 Year (annualised) 5 Year (annualised)
1 Year 3 Year (annualised) 5 Year (annualised)

Baillieu Research 1 May 2019
baillieu.com.au Baillieu Limited ABN 74 006 519 393 Please read the disclaimer at the end of this report 11
Acorn Capital (ACQ) www.acorncapital.com.au
• Acorn Capital was founded in 1998 and is one of the largest specialist microcap investor in the Australian market. ACQ commenced trading on the ASX in May 2014.
• Utilising a sector neutral investment style, ACQ invests in ASX listed companies outside the top 250 by market capitalisation and unlisted opportunities if they are evaluated to be more attractive than listed opportunities.
• At Jun-18 ACQ had a dividend reverse which equates to approximately 5 years over dividend coverage (assuming 7.0cps on current capital structure).
• The total shareholder return for the year ending 31 March 2019 was 1.7% with pre-tax net asset backing decreasing 1.4%. The active return (TSR) was -4.1%.
Fig.3: ACQ overview
Source: IRESS, Bloomberg, Baillieu, Company reports. Figures as at 31 March 2019. Active returns refers to the TSR and NTA
growth relative to that of the comparative index (see chart below).
Fig.4: ACQ TSR vs ASX Small Ords Accum. Index
Source: Bloomberg, Baillieu
ACQ Snapshot Top Holdings %Price (31 March 2019) $1.09 TELIX PHARAMACEUTICALS 6.3%Share price range (12 months) $1.04- $1.3 MOULA MONEY PTY LTD (UL) 5.7%Shares on issue (Mn) 52.9 CALIX LTD 5.6%Market capitalisation ($Mn) $58 REDHILL EDUCATION LTD 3.3%Pre-tax asset backing* $1.23 CARBON REVOLUTION PTY LTD (UL) 2.9%Post-tax asset backing* $1.20 LIFESTYLE PANEL (UL) 2.9%Premium/(Discount) to pre-tax NTA -11.4% SHINE CORPORATION LTD 2.8%Premium/(Discount) to post-tax NTA -9.1% REDBUBBLE LTD 2.8%Dividend yield 5.7% ZIP CO LTD 2.5%Dividend per share (cents) 6.2 INNOVATIVE ASSET SOLUTIONS (UL) 2.4%Franking 100%Management expense ratio 0.95%
Total Shareholder Return 1 Year 3 Year 5 Year NTA Performance 1 Year 3 Year 5 YearACQ 1.7% 14.6% 3.9% NTA growth -1.4% 9.7% naActive return -4.1% 3.2% -4.1% Active return -7.2% -1.7% na
-10
0
10
20
Mar-18 May-18 Jul-18 Sep-18 Nov-18 Jan-19 Mar-19ASX Small Ords Accum. Index ACQ

Baillieu Research 1 May 2019
baillieu.com.au Baillieu Limited ABN 74 006 519 393 Please read the disclaimer at the end of this report 12
Australian Foundation Investment Company (AFI) www.afi.com.au
• AFI was formed in 1928 and is Australia’s oldest and largest listed investment company.
• AFI is a long-term, low-risk investor in major companies on both the ASX and New Zealand Stock Exchange.
• Key sector exposures include Banks (21.0%), Materials (18.1%), Industrials (14.9%), Other Financials (10.1%), Healthcare (10.1 %), and Consumer Staples (5.0%).
• The total shareholder return for the year ending 31 March 2019 was 3.7% with pre-tax net asset backing increasing 8.9%. The active return (TSR) was -7.5%.
Fig.5: AFI overview
Source: IRESS, Bloomberg, Baillieu, Company reports. Figures as at 31 March 2019. Active returns refers to the TSR and NTA
growth relative to that of the comparative index (see chart below).
Fig.6: AFI TSR vs All Ords Accum. Index
Source: Bloomberg, Baillieu
AFI Snapshot Top Holdings %Price (31 March 2019) $5.95 COMMONWEALTH BANK OF AUSTRAL 8.2%Share price range (12 months) $5.74- $6.31 BHP GROUP LTD 7.5%Shares on issue (Mn) 1200.1 WESTPAC BANKING CORP 5.8%Market capitalisation ($Mn) $7,141 CSL LTD 5.4%Pre-tax asset backing* $6.03 TRANSURBAN GROUP 4.3%Post-tax asset backing* $5.19 NATIONAL AUSTRALIA BANK LTD 4.2%Premium/(Discount) to pre-tax NTA -1.3% WESFARMERS LTD 3.4%Premium/(Discount) to post-tax NTA 14.6% MACQUARIE GROUP LTD 3.3%Dividend yield 5.4% AUST AND NZ BANKING GROUP 3.2%Dividend per share (cents) 32.0 AMCOR LIMITED 2.8%Franking 100%Management expense ratio 0.13%
Total Shareholder Return 1 Year 3 Year 5 Year NTA Performance 1 Year 3 Year 5 YearAFI 3.7% 7.1% 4.1% NTA growth 8.9% 8.5% 4.7%Active return -7.5% -4.2% -3.4% Active return -2.3% -2.7% -2.8%
-4
-2
0
2
4
6
8
10
12
14
Mar-18 May-18 Jul-18 Sep-18 Nov-18 Jan-19 Mar-19All Ords Accum. Index AFI

Baillieu Research 1 May 2019
baillieu.com.au Baillieu Limited ABN 74 006 519 393 Please read the disclaimer at the end of this report 13
Australian Leaders Fund (ALF) www.wfunds.com.au
• Australian Leaders Fund invests in leading Australian companies, focusing on the top 200, with strong business fundamentals on attractive terms. In addition, ALF short sells companies that it feels are fundamentally challenged.
• ALF’s investment objective is to deliver superior returns over the medium term within acceptable risk parameters while preserving the company’s capital.
• The net equity exposure of the portfolio is currently -10.3%.
• The total shareholder return for the year ending 31 March 2019 was -9.4% with pre-tax net asset backing decreasing 1.7%. The active return (TSR) was -20.6%.
Fig.7: ALF overview
Source: IRESS, Bloomberg, Baillieu, Company reports. Figures as at 31 March 2019. Active returns refers to the TSR and NTA
growth relative to that of the comparative index (see chart below).
Fig.8: ALF TSR vs All Ords Accum. Index
Source: Bloomberg, Baillieu
ALF Snapshot Top Holdings %Price (31 March 2019) $0.91 naShare price range (12 months) $0.9- $1.11Shares on issue (Mn) 248.6Market capitalisation ($Mn) $225Pre-tax asset backing* $1.15Post-tax asset backing* $1.15Premium/(Discount) to pre-tax NTA -21.3%Premium/(Discount) to post-tax NTA -21.3%Dividend yield 4.4%Dividend per share (cents) 4.0Franking 100%Management expense ratio 1.00%
Total Shareholder Return 1 Year 3 Year 5 Year NTA Performance 1 Year 3 Year 5 YearALF -9.4% -10.4% -6.4% NTA growth -1.7% -1.0% 0.0%Active return -20.6% -21.7% -13.8% Active return -12.9% -12.3% -7.5%
-15
-10
-5
0
5
10
15
Mar-18 May-18 Jul-18 Sep-18 Nov-18 Jan-19 Mar-19All Ords Accum. Index ALF
Baillieu Research 1 May 2019
baillieu.com.au Baillieu Limited ABN 74 006 519 393 Please read the disclaimer at the end of this report 14
Argo Global Listed Infrastructure (ALI) www.argoinfrastructure.com.au
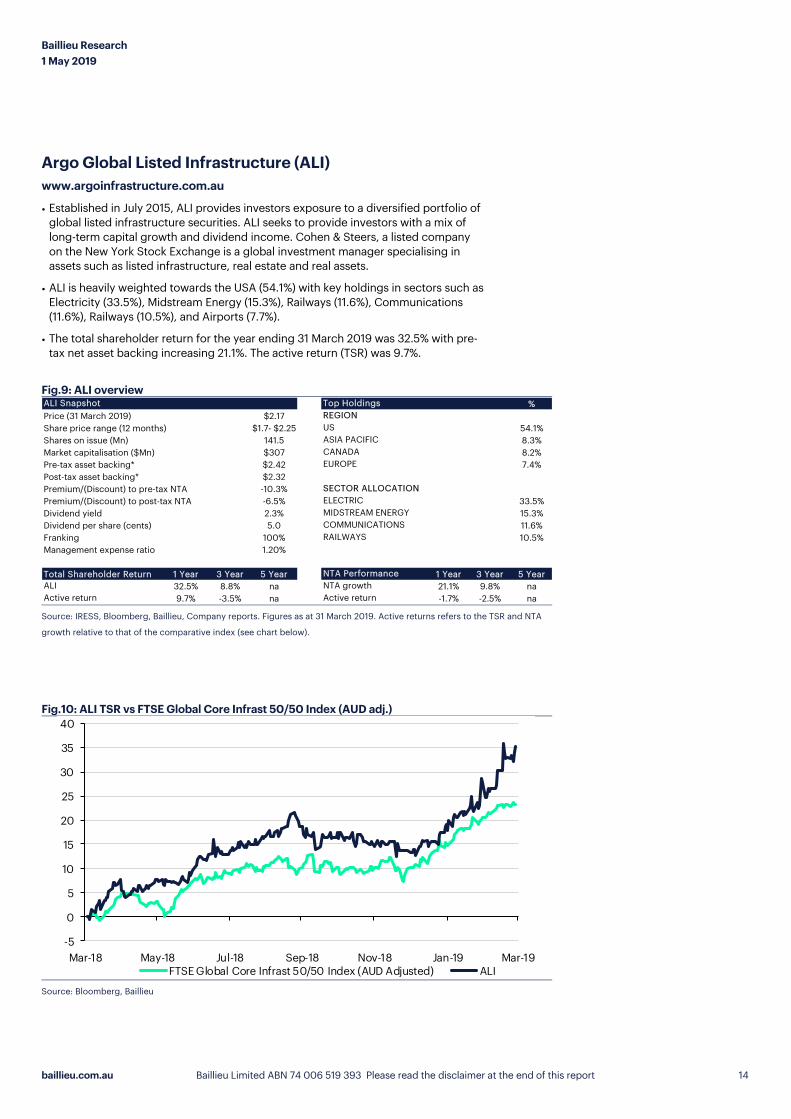
• Established in July 2015, ALI provides investors exposure to a diversified portfolio of global listed infrastructure securities. ALI seeks to provide investors with a mix of long-term capital growth and dividend income. Cohen & Steers, a listed company on the New York Stock Exchange is a global investment manager specialising in assets such as listed infrastructure, real estate and real assets.
• ALI is heavily weighted towards the USA (54.1%) with key holdings in sectors such as Electricity (33.5%), Midstream Energy (15.3%), Railways (11.6%), Communications (11.6%), Railways (10.5%), and Airports (7.7%).
• The total shareholder return for the year ending 31 March 2019 was 32.5% with pre-tax net asset backing increasing 21.1%. The active return (TSR) was 9.7%.
Fig.9: ALI overview
Source: IRESS, Bloomberg, Baillieu, Company reports. Figures as at 31 March 2019. Active returns refers to the TSR and NTA
growth relative to that of the comparative index (see chart below).
Fig.10: ALI TSR vs FTSE Global Core Infrast 50/50 Index (AUD adj.)
Source: Bloomberg, Baillieu
ALI Snapshot Top Holdings %Price (31 March 2019) $2.17 REGIONShare price range (12 months) $1.7- $2.25 US 54.1%Shares on issue (Mn) 141.5 ASIA PACIFIC 8.3%Market capitalisation ($Mn) $307 CANADA 8.2%Pre-tax asset backing* $2.42 EUROPE 7.4%Post-tax asset backing* $2.32Premium/(Discount) to pre-tax NTA -10.3% SECTOR ALLOCATIONPremium/(Discount) to post-tax NTA -6.5% ELECTRIC 33.5%Dividend yield 2.3% MIDSTREAM ENERGY 15.3%Dividend per share (cents) 5.0 COMMUNICATIONS 11.6%Franking 100% RAILWAYS 10.5%Management expense ratio 1.20%
Total Shareholder Return 1 Year 3 Year 5 Year NTA Performance 1 Year 3 Year 5 YearALI 32.5% 8.8% na NTA growth 21.1% 9.8% naActive return 9.7% -3.5% na Active return -1.7% -2.5% na
-5
0
5
10
15
20
25
30
35
40
Mar-18 May-18 Jul-18 Sep-18 Nov-18 Jan-19 Mar-19FTSE Global Core Infrast 50/50 Index (AUD Adjusted) ALI

Baillieu Research 1 May 2019
baillieu.com.au Baillieu Limited ABN 74 006 519 393 Please read the disclaimer at the end of this report 15
AMCIL (AMH) www.amcil.com.au
• AMCIL was formed in 1996 with an initial focus on the media and telecommunications sectors.
• The limited scope of attractive investments within these sectors resulted in a change of strategy, and AMCIL now has a diversified portfolio of 30 to 40 of Australia’s largest companies.
• Key sector exposures include Industrials (22.8%), Materials (12.6%), Banks (12.4%), Other Financials (10.8%), Healthcare (9.5%), and Information Technology (7.9%).
• The total shareholder return for the year ending 31 March 2019 was 2.2% with pre-tax net asset backing increasing 6.1%. The active return (TSR) was -9.9%
Fig.11: AMH overview
Source: IRESS, Bloomberg, Baillieu, Company reports. Figures as at 31 March 2019. Active returns refers to the TSR and NTA
growth relative to that of the comparative index (see chart below).
Fig.12: AMH TSR vs ASX200 Accum. Index
Source: Bloomberg, Baillieu
AMH Snapshot Top Holdings %Price (31 March 2019) $0.84 CSL LTD 6.0%Share price range (12 months) $0.82- $0.96 BHP GROUP LTD 5.9%Shares on issue (Mn) 274.6 MAINFREIGHT LTD 4.9%Market capitalisation ($Mn) $231 NATIONAL AUSTRALIA BANK LTD 4.6%Pre-tax asset backing* $0.92 WESTPAC BANKING CORP 4.2%Post-tax asset backing* $0.86 MACQUARIE GROUP LTD 4.2%Premium/(Discount) to pre-tax NTA -8.7% COMMONWEALTH BANK OF AUSTRAL 3.9%Premium/(Discount) to post-tax NTA -2.3% TRANSURBAN GROUP 3.6%Dividend yield 9.2% JAMES HARDIE INDUSTRIES-CDI 3.3%Dividend per share (cents) 7.8 OIL SEARCH LTD 3.1%Franking 100%Management expense ratio 0.67%
Total Shareholder Return 1 Year 3 Year 5 Year NTA Performance 1 Year 3 Year 5 YearAMH 2.2% 3.4% 3.5% NTA growth 6.1% 5.9% 4.5%Active return -9.9% -8.0% -3.9% Active return -5.9% -5.6% -2.9%
-4
-2
0
2
4
6
8
10
12
14
16
Mar-18 May-18 Jul-18 Sep-18 Nov-18 Jan-19 Mar-19ASX200 Accum. Index AMH

Baillieu Research 1 May 2019
baillieu.com.au Baillieu Limited ABN 74 006 519 393 Please read the disclaimer at the end of this report 16
Antipodes Global Investment Company (APL) www.antipodespartners.com
• Antipodes Global Investment Company (APL) is a recently incorporated LIC (October 2016) having raised over $300m via an IPO.
• The Company has a dual investment objective to provide capital growth and income and achieve returns in excess of the benchmark, over a full investment cycle (typically 3-5 years). All underlying options have now expired (15-Oct-18)
• Key underlying regional and sector allocations include Asia (31.8%), Western Europe (19.2%) and Banks, Hardware, Internet at 9.0%, 8.4% and 8.0% respectively.
• The total shareholder return for the year ending 31 March 2019 was -12.7% with pre-tax net asset backing decreasing 2.8%. The active return (TSR) was -26.0%.
Fig.13: APL overview
Source: IRESS, Bloomberg, Baillieu, Company reports. Figures as at 31 March 2019. Active returns refers to the TSR and NTA
growth relative to that of the comparative index (see chart below).
Fig.14: APL TSR vs MSCI World Index (AUD adj.)
Source: Bloomberg, Baillieu
APL Snapshot Top Holdings %Price (31 March 2019) $0.99 PING AN INSURANCE 3.1%Share price range (12 months) $0.97- $1.23 CISCO SYSTEMS 2.9%Shares on issue (Mn) 551.6 QUALCOMM 2.9%Market capitalisation ($Mn) $546 MICROSOFT CORPORATION 2.7%Pre-tax asset backing* $1.10 FACEBOOK 2.6%Post-tax asset backing* $1.11 KB FINANCIAL 2.4%Premium/(Discount) to pre-tax NTA -10.0% ING GROEP 2.4%Premium/(Discount) to post-tax NTA -10.6% GENERAL ELECTRIC 2.4%Dividend yield 7.1% SIEMENS 2.3%Dividend per share (cents) 7.0 ELECTRICITE DE FRANCE 2.3%Franking 100%Management expense ratio 1.10%
Total Shareholder Return 1 Year 3 Year 5 Year NTA Performance 1 Year 3 Year 5 YearAPL -12.7% na na NTA growth -2.8% 0.0% naActive return -26.0% na na Active return -16.0% -14.2% na
-20
-15
-10
-5
0
5
10
15
20
Mar-18 May-18 Jul-18 Sep-18 Nov-18 Jan-19 Mar-19MSCI World Index (AUD adjusted) APL

Baillieu Research 1 May 2019
baillieu.com.au Baillieu Limited ABN 74 006 519 393 Please read the disclaimer at the end of this report 17
Argo Investments (ARG) www.argoinvestments.com.au
• Argo was formed in 1946 and is based in Adelaide, South Australia.
• It is the second-largest LIC by market capitalisation.
• Argo’s portfolio contains investments in about 100 companies, with many of Australia’s major enterprises represented.
• When compared to our large cap LICs, ARG has the lowest big four bank weighting at 16.6% of the portfolio (XAO ~20%).
• The total shareholder return for the year ending 31 March 2019 was 1.4% with pre-tax net asset backing increasing 8.7%. The active return (TSR) was -9.8%.
Fig.15: ARG overview
Source: IRESS, Bloomberg, Baillieu, Company reports. Figures as at 31 March 2019. Active returns refers to the TSR and NTA
growth relative to that of the comparative index (see chart below).
Fig.16: ARG TSR vs All Ords Accum. Index
Source: Bloomberg, Baillieu
ARG Snapshot Top Holdings %Price (31 March 2019) $7.63 MACQUARIE GROUP LTD 5.6%Share price range (12 months) $7.47- $8.34 WESTPAC BANKING CORP 5.4%Shares on issue (Mn) 714.9 BHP GROUP LTD 5.3%Market capitalisation ($Mn) $5,455 AUST AND NZ BANKING GROUP 4.4%Pre-tax asset backing* $7.93 COMMONWEALTH BANK OF AUSTRAL 4.0%Post-tax asset backing* $7.01 RIO TINTO LTD 3.8%Premium/(Discount) to pre-tax NTA -3.8% CSL LTD 3.8%Premium/(Discount) to post-tax NTA 8.8% WESFARMERS LTD 3.1%Dividend yield 4.2% NATIONAL AUSTRALIA BANK LTD 2.8%Dividend per share (cents) 32.0 TELSTRA CORP LTD 2.7%Franking 100%Management expense ratio 0.15%
Total Shareholder Return 1 Year 3 Year 5 Year NTA Performance 1 Year 3 Year 5 YearARG 1.4% 5.7% 5.0% NTA growth 8.7% 8.9% 5.3%Active return -9.8% -5.5% -2.5% Active return -2.6% -2.4% -2.1%
-4
-2
0
2
4
6
8
10
12
14
Mar-18 May-18 Jul-18 Sep-18 Nov-18 Jan-19 Mar-19All Ords Accum. Index ARG

Baillieu Research 1 May 2019
baillieu.com.au Baillieu Limited ABN 74 006 519 393 Please read the disclaimer at the end of this report 18
Australian United Investment Company (AUI) www.aui.com.au
• AUI was founded in 1953 by the late Sir Ian Potter and The Ian Potter Foundation.
• AUI utilises a “traditional” investment philosophy, focusing on risk reduction by investing in a range of large and mid-cap companies on the ASX.
• Investments are chosen on their individual merits, with no pre-determined policy that any particular proportions of the capital will be invested in particular investment sectors.
• The total shareholder return for the year ending 31 March 2019 was 5.9% with pre-tax net asset backing increasing 11.6%. The active return (TSR) was -5.3%.
Fig.17: AUI overview
Source: IRESS, Bloomberg, Baillieu, Company reports. Figures as at 31 March 2019. Active returns refers to the TSR and NTA
growth relative to that of the comparative index (see chart below).
Fig.18: AUI TSR vs All Ords Accum. Index
Source: Bloomberg, Baillieu
AUI Snapshot Top Holdings %Price (31 March 2019) $8.40 COMMONWEALTH BANK OF AUSTRAL 7.4%Share price range (12 months) $7.78- $9.09 AUST AND NZ BANKING GROUP 6.3%Shares on issue (Mn) 124.3 CSL LTD 6.2%Market capitalisation ($Mn) $1,044 WESTPAC BANKING CORP 6.2%Pre-tax asset backing* $9.13 RIO TINTO LTD 5.9%Post-tax asset backing* $7.86 TRANSURBAN GROUP 5.8%Premium/(Discount) to pre-tax NTA -8.0% BHP GROUP LTD 5.7%Premium/(Discount) to post-tax NTA 6.9% WOODSIDE PETROLEUM LTD 5.0%Dividend yield 4.3% DIVERSIFIED UNITED INVESTMNT 4.7%Dividend per share (cents) 36.0 NATIONAL AUSTRALIA BANK LTD 4.0%Franking 100%Management expense ratio 0.10%
Total Shareholder Return 1 Year 3 Year 5 Year NTA Performance 1 Year 3 Year 5 YearAUI 5.9% 10.9% 5.7% NTA growth 11.6% 11.4% 5.3%Active return -5.3% -0.4% -1.8% Active return 0.4% 0.1% -2.2%
-6
-4
-2
0
2
4
6
8
10
12
14
Mar-18 May-18 Jul-18 Sep-18 Nov-18 Jan-19 Mar-19All Ords Accum. Index AUI

Baillieu Research 1 May 2019
baillieu.com.au Baillieu Limited ABN 74 006 519 393 Please read the disclaimer at the end of this report 19
Blue Sky Alternative Access Fund (BAF) www.blueskyfunds.com.au
• BAF listed on the ASX in December 2014.
• Following a short report on Blue Sky Asset Management (and subsequent BLA’S downgrade), BLA and BAF have decreased by 93.1% and 23.1% respectively since 26 March 2018. On 18-Oct-18, BLA and BAF proposed to transition the investment management mandate to Pinnacle (PNI). Since this time BAF has received another investment management proposal (from WAM) individual offers for assets.
• BAF has de-rated from a mid-single digit premium to NTA to an estimated 23.0% discount to NTA.
• The total shareholder return for the year ending 31 March 2019 was 9.2% with pre-tax net asset backing increasing 1.9%. The active return (TSR) was -2.0%
Fig.19: BAF overview
Source: IRESS, Bloomberg, Baillieu, Company reports. Figures as at 31 March 2019. Active returns refers to the TSR and NTA
growth relative to that of the comparative index (see chart below).
Fig.20: BAF TSR vs All Ords Accum. Index
Source: Bloomberg, Baillieu
BAF Snapshot Top Holdings %Price (31 March 2019) $0.86 ASSET ALLOCATIONShare price range (12 months) $0.69- $0.95 REAL ASSETS 37.7%Shares on issue (Mn) 203.0 PRIVATE EQUITY AND VC 26.5%Market capitalisation ($Mn) $174 REAL ESTATE 22.0%Pre-tax asset backing* $1.11 CASH 13.8%Post-tax asset backing* $1.09Premium/(Discount) to pre-tax NTA -23.0%Premium/(Discount) to post-tax NTA -21.3%Dividend yield 5.8%Dividend per share (cents) 5.0Franking 100%Management expense ratio 1.20%
Total Shareholder Return 1 Year 3 Year 5 Year NTA Performance 1 Year 3 Year 5 YearBAF 9.2% 0.0% na NTA growth 1.9% 5.8% naActive return -2.0% -11.3% na Active return -9.3% -5.4% na
-20
-15
-10
-5
0
5
10
15
20
Mar-18 May-18 Jul-18 Sep-18 Nov-18 Jan-19 Mar-19All Ords Accum. Index BAF

Baillieu Research 1 May 2019
baillieu.com.au Baillieu Limited ABN 74 006 519 393 Please read the disclaimer at the end of this report 20
BKI Investment Company (BKI) www.bkilimited.com.au
• BKI was listed on the ASX in December 2003 with an objective to provide investors with sound dividend yields and long-term capital growth.
• BKI invests in a diversified portfolio of Australian shares, trusts and interest-bearing securities, focusing on securities that are paying an increasing dividend stream.
• Average portfolio turnover for the FY18 was ~8.5%
• The total shareholder return for the year ending 31 March 2019 was 0.5% with pre-tax net asset backing increasing 8.3%. The active return (TSR) was -10.7%.
Fig.21: BKI overview
Source: IRESS, Bloomberg, Baillieu, Company reports. Figures as at 31 March 2019. Active returns refers to the TSR and NTA
growth relative to that of the comparative index (see chart below).
Fig.22: BKI TSR vs All Ords Accum. Index
Source: Bloomberg, Baillieu
BKI Snapshot Top Holdings %Price (31 March 2019) $1.50 COMMONWEALTH BANK OF AUSTRAL 6.1%Share price range (12 months) $1.44- $1.62 NATIONAL AUSTRALIA BANK LTD 6.1%Shares on issue (Mn) 730.7 WESTPAC BANKING CORP 5.2%Market capitalisation ($Mn) $1,096 BHP GROUP LTD 4.5%Pre-tax asset backing* $1.58 APA GROUP 4.2%Post-tax asset backing* $1.50 TRANSURBAN GROUP 4.2%Premium/(Discount) to pre-tax NTA -5.1% NEW HOPE CORP LTD 3.9%Premium/(Discount) to post-tax NTA 0.0% WOOLWORTHS GROUP LTD 3.8%Dividend yield 5.9% MACQUARIE GROUP LTD 3.7%Dividend per share (cents) 8.8 AUST AND NZ BANKING GROUP 3.5%Franking 100%Management expense ratio 0.14%
Total Shareholder Return 1 Year 3 Year 5 Year NTA Performance 1 Year 3 Year 5 YearBKI 0.5% 2.3% 3.4% NTA growth 8.3% 6.4% 3.8%Active return -10.7% -9.0% -4.1% Active return -2.9% -4.9% -3.7%
-6
-4
-2
0
2
4
6
8
10
12
14
Mar-18 May-18 Jul-18 Sep-18 Nov-18 Jan-19 Mar-19All Ords Accum. Index BKI

Baillieu Research 1 May 2019
baillieu.com.au Baillieu Limited ABN 74 006 519 393 Please read the disclaimer at the end of this report 21
Barrack St Investments (BST) www.barrackst.com
• Barrack St Investments (BST) is managed by EC Pohl Asset Management and was listed on the ASX in August 2014.
• BST invests in companies outside of the S&P/ASX 50 Index, providing investors access to a high conviction, small/micro-cap bias portfolio.
• The portfolio is constructed using a research driven, bottom-up investment philosophy.
• Total shareholder return for the year ending 31 March 2019 was 13.9% with pre-tax net asset backing increasing 16.4%. The active return (TSR) was 2.6%.
Fig.23: BST overview
Source: IRESS, Bloomberg, Baillieu, Company reports. Figures as at 31 March 2019. Active returns refers to the TSR and NTA
growth relative to that of the comparative index (see chart below).
Fig.24: BST TSR vs All Ords Accum. Index
Source: Bloomberg, Baillieu
BST Snapshot Top Holdings %Price (31 March 2019) $0.95 SEEK LTD 8.3%Share price range (12 months) $0.87- $1.06 PENDAL GROUP LTD 7.9%Shares on issue (Mn) 18.3 AFTERPAY TOUCH GROUP LTD 6.6%Market capitalisation ($Mn) $17 CORPORATE TRAVEL MANAGEMENT 6.1%Pre-tax asset backing* $1.23 DOMINO'S PIZZA ENTERPRISES L 6.0%Post-tax asset backing* $1.19Premium/(Discount) to pre-tax NTA -23.2%Premium/(Discount) to post-tax NTA -20.9%Dividend yield 3.7%Dividend per share (cents) 3.5Franking 100%Management expense ratio 1.20%
Total Shareholder Return 1 Year 3 Year 5 Year NTA Performance 1 Year 3 Year 5 YearBST 13.9% 3.2% na NTA growth 16.4% 5.3% naActive return 2.6% -8.1% na Active return 5.1% -5.9% na
-5
0
5
10
15
20
25
30
Mar-18 May-18 Jul-18 Sep-18 Nov-18 Jan-19 Mar-19All Ords Accum. Index BST

Baillieu Research 1 May 2019
baillieu.com.au Baillieu Limited ABN 74 006 519 393 Please read the disclaimer at the end of this report 22
Bailador Technology Investments (BTI) www.bailador.com.au
• Bailador Technology Investments listed on the ASX in November 2014. BTI invests in private companies within the information technology sector.
• BTI invests in companies that are in the expansion stage and typically display the following characteristics: several million dollars of revenue, established customer base, proven technology and management. On of BTI’s top holdings Straker Translations (STG) recently listed on the ASX (19-Oct-18).
• Currently, BTI holds 10 unlisted investments through a variety of different ownership structures to help mitigate downside risk (such as convertible notes, preference shares).
• Total shareholder return for the year ending 31 March 2019 was -5.3% with pre-tax net asset backing increasing 9.3%. The active return (TSR) was -16.6%.
Fig.25: BTI overview
Source: IRESS, Bloomberg, Baillieu, Company reports. Figures as at 31 March 2019. Active returns refers to the TSR and NTA
growth relative to that of the comparative index (see chart below).
Fig.26: BTI TSR vs All Ords Accum. Index
Source: Bloomberg, Baillieu
BTI Snapshot Top Holdings %Price (31 March 2019) $0.80 SITEMINDER 40.2%Share price range (12 months) $0.74- $0.92 INSTACLUSTR 10.3%Shares on issue (Mn) 120.2 STACKLA 8.5%Market capitalisation ($Mn) $96 LENDI 7.7%Pre-tax asset backing* $1.17 SMI 6.8%Post-tax asset backing* $1.11 DOCSCORP 6.8%Premium/(Discount) to pre-tax NTA -31.6% STRAKER TRANSLATIONS (STG) 6.8%Premium/(Discount) to post-tax NTA -27.9% VIOSTREAM 5.1%Dividend yield 0.0% REZDY 4.3%Dividend per share (cents) 0.0 BROSA 1.7%Franking 100%Management expense ratio 1.75%
Total Shareholder Return 1 Year 3 Year 5 Year NTA Performance 1 Year 3 Year 5 YearBTI -5.3% -7.3% na NTA growth 9.3% 0.3% naActive return -16.6% -18.6% na Active return -1.9% -11.0% na
-15
-10
-5
0
5
10
15
Mar-18 May-18 Jul-18 Sep-18 Nov-18 Jan-19 Mar-19All Ords Accum. Index BTI

Baillieu Research 1 May 2019
baillieu.com.au Baillieu Limited ABN 74 006 519 393 Please read the disclaimer at the end of this report 23
Clime Capital (CAM) www.climecapital.com.au
• About: Clime Capital was incorporated and listed in February 2004, providing investors access to a long term value orientated investment portfolio.
• The company has three key financial objectives 1) preserve and protect the capital of the company; 2) achieve long-term growth of capital and dividends without taking excessive or unnecessary risks to achieve that growth; and 3) deliver investors a secure income stream in the form of fully-franked dividends.
• CAM pays quarterly dividend distributions and since FY10 CAM has consistently paid an above 4.0% fully franked cash dividend yield. CAM is currently yielding 5.6% fully franked.
• The total shareholder return for the year ending 31 March 2019 was 10.4% with pre-tax net asset backing increasing 5.4%. The active return (TSR) was -0.9%.
Fig.27: CAM overview
Source: IRESS, Bloomberg, Baillieu, Company reports. Figures as at 31 March 2019. Active returns refers to the TSR and NTA
growth relative to that of the comparative index (see chart below).
Fig.28: CAM TSR vs All Ords Accum. Index
Source: Bloomberg, Baillieu
CAM Snapshot Top Holdings %Price (31 March 2019) $0.88 AMCOR LIMITED 4.7%Share price range (12 months) $0.82- $0.97 WESFARMERS LTD 4.2%Shares on issue (Mn) 91.6 NATIONAL AUSTRALIA BANK LTD 3.5%Market capitalisation ($Mn) $80 WEBJET LTD 3.4%Pre-tax asset backing* $0.92 CREDIT CORP GROUP LTD 3.3%Post-tax asset backing* $0.90 AUD CASH 9.7%Premium/(Discount) to pre-tax NTA -4.9% USD CASH 2.3%Premium/(Discount) to post-tax NTA -2.8%Dividend yield 5.7%Dividend per share (cents) 5.0Franking 100%Management expense ratio 0.83%
Total Shareholder Return 1 Year 3 Year 5 Year NTA Performance 1 Year 3 Year 5 YearCAM 10.4% 10.0% 2.8% NTA growth 5.4% 6.7% 1.6%Active return -0.9% -1.2% -4.7% Active return -5.8% -4.6% -5.8%
-5
0
5
10
15
20
Mar-18 May-18 Jul-18 Sep-18 Nov-18 Jan-19 Mar-19All Ords Accum. Index CAM

Baillieu Research 1 May 2019
baillieu.com.au Baillieu Limited ABN 74 006 519 393 Please read the disclaimer at the end of this report 24
CBG Capital (CBC) www.cbgcapital.com.au
• CBG Asset Management is an active, boutique Australian equities investment manager founded in 2002 by Ronni Chalmers. CBG was recently acquired by Clime Investment Management (CIW), an ASX listed fund manager with ~$834m of FUM.
• Investment decisions are driven by fundamental bottom-up stock analysis, overlayed with macro and industry level considerations. Idea generation is derived from initial qualitative and quantitative screening of CBC’s investment universe and the continuous monitoring of stocks within each industry sector.
• CBC current weighted to Large Cap equities (32.3%) with Mid and Small cap weighting 26.8% and 19.0% respectively.
• The total shareholder return for the year ending 31 March 2019 was 19.9% with pre-tax net asset backing increasing 5.5%. The active return (TSR) was 8.7%.
Fig.29: CBC overview
Source: IRESS, Bloomberg, Baillieu, Company reports. Figures as at 31 March 2019. Active returns refers to the TSR and NTA
growth relative to that of the comparative index (see chart below).
Fig.30: CBC TSR vs All Ords Accum. Index
Source: Bloomberg, Baillieu
CBC Snapshot Top Holdings %Price (31 March 2019) $0.97 BHP GROUP LTD 6.3%Share price range (12 months) $0.83- $1.04 NATIONAL AUSTRALIA BANK LTD 4.8%Shares on issue (Mn) 26.2 BRAVURA SOLUTIONS LTD 4.7%Market capitalisation ($Mn) $25 AFTERPAY TOUCH GROUP LTD 4.2%Pre-tax asset backing* $1.03 RIO TINTO LTD 3.8%Post-tax asset backing* $1.01 OTHER 56.4%Premium/(Discount) to pre-tax NTA -5.8% CASH 19.8%Premium/(Discount) to post-tax NTA -4.0%Dividend yield 3.2%Dividend per share (cents) 3.1Franking 100%Management expense ratio 1.00%
Total Shareholder Return 1 Year 3 Year 5 Year NTA Performance 1 Year 3 Year 5 YearCBC 19.9% 8.1% na NTA growth 5.5% 4.6% naActive return 8.7% -3.2% na Active return -5.8% -6.7% na
-5
0
5
10
15
20
25
Mar-18 May-18 Jul-18 Sep-18 Nov-18 Jan-19 Mar-19All Ords Accum. Index CBC

Baillieu Research 1 May 2019
baillieu.com.au Baillieu Limited ABN 74 006 519 393 Please read the disclaimer at the end of this report 25
Cadence Capital (CDM)
www.cadencecapital.com.au
• Cadence Capital is an actively managed investment company with a portfolio of Australian and international securities.
• Although it focuses on a fundamental bottom-up approach to portfolio management, it also uses technical analysis over the short term to supplement returns.
• The manager targets 20 to 40 core investments with direct international exposure. Current net exposure is 80.4% with CDM holding 19.6% of the portfolio in cash.
• The total shareholder return for the year ending 31 March 2019 was -26.6% with pre-tax net asset backing decreasing 15.1%. The active return (TSR) was -37.8%.
Fig.31: CDM overview
Source: IRESS, Bloomberg, Baillieu, Company reports. Figures as at 31 March 2019. Active returns refers to the TSR and NTA
growth relative to that of the comparative index (see chart below).
Fig.32: CDM TSR vs All Ords Accum. Index
Source: Bloomberg, Baillieu
CDM Snapshot Top Holdings %Price (31 March 2019) $0.91 ARQ GROUP LTD 11.9%Share price range (12 months) $0.83- $1.34 MACQUARIE GROUP LTD 5.4%Shares on issue (Mn) 320.3 MONEY3 CORP LTD 4.8%Market capitalisation ($Mn) $291 NONI B LTD 4.5%Pre-tax asset backing* $0.95 SANTOS LTD 4.1%Post-tax asset backing* $1.09 SEVEN GROUP HOLDINGS LTD 3.2%Premium/(Discount) to pre-tax NTA -4.3% ARISTOCRAT LEISURE LTD 2.6%Premium/(Discount) to post-tax NTA -16.4% SHINE CORPORATE LTD 2.5%Dividend yield 8.8% BINGO INDUSTRIES LTD 2.3%Dividend per share (cents) 8.0 WORLEYPARSONS LTD 2.3%Franking 100%Management expense ratio 1.00%
Total Shareholder Return 1 Year 3 Year 5 Year NTA Performance 1 Year 3 Year 5 YearCDM -26.6% -8.4% -3.3% NTA growth -15.1% 2.2% 0.3%Active return -37.8% -19.7% -10.7% Active return -26.3% -9.0% -7.2%
-35
-30
-25
-20
-15
-10
-5
0
5
10
15
Mar-18 May-18 Jul-18 Sep-18 Nov-18 Jan-19 Mar-19All Ords Accum. Index CDM

Baillieu Research 1 May 2019
baillieu.com.au Baillieu Limited ABN 74 006 519 393 Please read the disclaimer at the end of this report 26
Concentrated Leaders Fund (CLF) www.clfund.com.au • Following a resolution to internalise the management of CLF, CLF ended its
agreement with Aberdeen Asset Management, a global asset manager.
• CLF invests in companies within the S&P/ ASX 200 index and aims to provide investors with regular income and long-term capital growth.
• Top sector weightings currently include Financials (18.7%), Industrials (14.8%), Consumer Discretionary (10.5%), Materials (9.8%), and Healthcare (8.3%).
• The total shareholder return for the year ending 31 March 2019 was 9.3% with pre-tax net asset backing increasing 14.5%. The active return (TSR) was -2.8%.
Fig.33: CLF overview
Source: IRESS, Bloomberg, Baillieu, Company reports. Figures as at 31 March 2019. Active returns refers to the TSR and NTA
growth relative to that of the comparative index (see chart below).
Fig.34: CLF TSR vs ASX200 Accum. Index
Source: Bloomberg, Baillieu
CLF Snapshot Top Holdings %Price (31 March 2019) $1.29 CSL LTD naShare price range (12 months) $1.15- $1.33 MACQUARIE GROUP LTDShares on issue (Mn) 59.4 COMMONWEALTH BANK OF AUSTRALMarket capitalisation ($Mn) $77 BHP GROUP LTDPre-tax asset backing* $1.36 AUST AND NZ BANKING GROUPPost-tax asset backing* $1.29 TRANSURBAN GROUPPremium/(Discount) to pre-tax NTA -5.1% AMCOR LIMITEDPremium/(Discount) to post-tax NTA 0.0% ATLAS ARTERIADividend yield 4.7% APA GROUPDividend per share (cents) 6.0 TABCORP HOLDINGS LTDFranking 100%Management expense ratio 0.75%
Total Shareholder Return 1 Year 3 Year 5 Year NTA Performance 1 Year 3 Year 5 YearCLF 9.3% 13.0% 4.6% NTA growth 14.5% 10.7% 6.4%Active return -2.8% 1.6% -2.8% Active return 2.5% -0.7% -1.0%
-4
-2
0
2
4
6
8
10
12
14
16
Mar-18 May-18 Jul-18 Sep-18 Nov-18 Jan-19 Mar-19ASX200 Accum. Index CLF

Baillieu Research 1 May 2019
baillieu.com.au Baillieu Limited ABN 74 006 519 393 Please read the disclaimer at the end of this report 27
Contango Income Generator Limited (CIE) www.contango.com.au
• Managed by Contango Asset Management, CIE provides investors access to a portfolio of companies predominately within the S&P/ASX 300 Index, excluding those securities of the largest 30 entities. The objective of CIE is to deliver a sustainable income stream and modest capital growth to its shareholders over time.
• The dividend policy of CIE is to pay annual dividends of no less than 6.5% of the company’s net tangible assets. CIE will typically hold between 30-40 securities where the manager identifies sustainable dividend growth, lower than market risk profile, low earnings volatility and balance sheet strength characteristics.
• The total shareholder return for the year ending 31 March 2019 was -12.7% with pre-tax net asset backing increasing 0.5%. The active return (TSR) was -23.9%.
Fig.35: CIE overview
Source: IRESS, Bloomberg, Baillieu, Company reports. Figures as at 31 March 2019. Active returns refers to the TSR and NTA
growth relative to that of the comparative index (see chart below).
Fig.36: CIE TSR vs All Ords Accum. Index
Source: Bloomberg, Baillieu
CIE Snapshot Top Holdings %Price (31 March 2019) $0.77 TABCORP HOLDINGS LTD 4.7%Share price range (12 months) $0.73- $0.99 BANK OF QUEENSLAND LTD 4.6%Shares on issue (Mn) 104.2 BENDIGO AND ADELAIDE BANK 4.4%Market capitalisation ($Mn) $80 STOCKLAND 3.2%Pre-tax asset backing* $0.92 GPT GROUP 2.9%Post-tax asset backing* $0.91 ASX LTD 2.8%Premium/(Discount) to pre-tax NTA -16.6% SPARK INFRASTRUCTURE GROUP 2.8%Premium/(Discount) to post-tax NTA -14.9% UNIBAIL-RODAMCO-WESTFIEL/CDI 2.8%Dividend yield 8.4% STAR ENTERTAINMENT GRP LTD/T 2.8%Dividend per share (cents) 6.5 DULUXGROUP LTD 2.7%Franking 100%Management expense ratio 0.95%
Total Shareholder Return 1 Year 3 Year 5 Year NTA Performance 1 Year 3 Year 5 YearCIE -12.7% -0.4% na NTA growth 0.5% 4.9% naActive return -23.9% -11.6% na Active return -10.7% -6.4% na
-25
-20
-15
-10
-5
0
5
10
15
Mar-18 May-18 Jul-18 Sep-18 Nov-18 Jan-19 Mar-19All Ords Accum. Index CIE

Baillieu Research 1 May 2019
baillieu.com.au Baillieu Limited ABN 74 006 519 393 Please read the disclaimer at the end of this report 28
Carlton Investments (CIN) www.carltoninvestments.com.au
• Carlton Investments’ strategy is to invest in established listed blue-chip stocks that provide high levels of sustainable income through fully franked dividends.
• Investments are held for the long term and not for trading purposes.
• Carlton is primarily exposed to the banking, tourism and leisure sectors.
• The total shareholder return for the year ending 31 March 2019 was -2.4% with pre-tax net asset backing increasing 2.5%. The active return (TSR) was -14.4%.
Fig.37: CIN overview
Source: IRESS, Bloomberg, Baillieu, Company reports. Figures as at 31 March 2019. Active returns refers to the TSR and NTA
growth relative to that of the comparative index (see chart below).
Fig.38: CIN TSR vs ASX200 Accum index
Source: Bloomberg, Baillieu
CIN Snapshot Top Holdings %Price (31 March 2019) $30.20 EVENT HOSPITALITY AND ENTERT 43.6%Share price range (12 months) $29.7- $35.02 NATIONAL AUSTRALIA BANK LTD 5.8%Shares on issue (Mn) 26.5 WESTPAC BANKING CORP 4.8%Market capitalisation ($Mn) $800 COMMONWEALTH BANK OF AUSTRAL 4.2%Pre-tax asset backing* $36.43 AGL ENERGY LTD 3.7%Post-tax asset backing* $30.33 BHP GROUP LTD 3.4%Premium/(Discount) to pre-tax NTA -17.1% AUST AND NZ BANKING GROUP 2.7%Premium/(Discount) to post-tax NTA -0.4% WESFARMERS LTD 2.2%Dividend yield 4.1% PERPETUAL LTD 1.7%Dividend per share (cents) 125.0 TELSTRA CORP LTD 1.5%Franking 100%Management expense ratio 0.09%
Total Shareholder Return 1 Year 3 Year 5 Year NTA Performance 1 Year 3 Year 5 YearCIN -2.4% 1.8% 6.9% NTA growth 2.5% 3.6% 7.5%Active return -14.4% -9.6% -0.5% Active return -9.5% -7.8% 0.1%
-10
-5
0
5
10
15
Mar-18 May-18 Jul-18 Sep-18 Nov-18 Jan-19 Mar-19ASX200 Accum. Index CIN

Baillieu Research 1 May 2019
baillieu.com.au Baillieu Limited ABN 74 006 519 393 Please read the disclaimer at the end of this report 29
Djerriwarrh Investments (DJW) www.djerri.com.au
• Djerriwarrh Investments has been in operation since 1989 and was listed on the ASX in 1995.
• Its investment portfolio focuses on stocks with low price-earnings ratios in the ASX top 50.
• It also has a trading portfolio that is used for short-term trading purposes. DJW currently has options outstanding against 20 of its top 20 holdings.
• The total shareholder return for the year ending 31 March 2019 was 4.6% with pre-tax net asset backing increasing 6.7%. The active return (TSR) was -6.6%.
Fig.39: DJW overview
Source: IRESS, Bloomberg, Baillieu, Company reports. Figures as at 31 March 2019. Active returns refers to the TSR and NTA
growth relative to that of the comparative index (see chart below).
Fig.40: DJW TSR vs All Ords Accum. Index
Source: Bloomberg, Baillieu
DJW Snapshot Top Holdings %Price (31 March 2019) $3.23 COMMONWEALTH BANK OF AUSTRAL 8.4%Share price range (12 months) $3.11- $3.59 WESTPAC BANKING CORP 7.3%Shares on issue (Mn) 222.7 BHP GROUP LTD 7.1%Market capitalisation ($Mn) $719 NATIONAL AUSTRALIA BANK LTD 5.6%Pre-tax asset backing* $3.13 AUST AND NZ BANKING GROUP 5.0%Post-tax asset backing* $3.15 CSL LTD 3.9%Premium/(Discount) to pre-tax NTA 3.2% MACQUARIE GROUP LTD 3.8%Premium/(Discount) to post-tax NTA 2.5% WOOLWORTHS GROUP LTD 3.4%Dividend yield 6.2% SYDNEY AIRPORT 2.7%Dividend per share (cents) 20.0 TRANSURBAN GROUP 2.6%Franking 100%Management expense ratio 0.41%
Total Shareholder Return 1 Year 3 Year 5 Year NTA Performance 1 Year 3 Year 5 YearDJW 4.6% -2.2% -1.0% NTA growth 6.7% 8.0% 2.8%Active return -6.6% -13.4% -8.5% Active return -4.5% -3.2% -4.7%
-4
-2
0
2
4
6
8
10
12
14
Mar-18 May-18 Jul-18 Sep-18 Nov-18 Jan-19 Mar-19All Ords Accum. Index DJW

Baillieu Research 1 May 2019
baillieu.com.au Baillieu Limited ABN 74 006 519 393 Please read the disclaimer at the end of this report 30
Diversified United Investments (DUI) www.dui.com.au
• Diversified United Investments was founded in 1991 by Australia United Investments, Barclay Investments (a Myer family investment company), the late Sir Ian Potter and The Ian Potter Foundation.
• It invests predominantly in Australian equities, however it also invests in global ETFs, property trusts and fixed income securities.
• DUI has a target range for international equities of 10-20% (primarily through global ETF’s). Current international exposure represents 16.0% of the portfolio.
• The total shareholder return for the year ending 31 March 2019 was 6.3% with pre-tax net asset backing increasing 10.1%. The active return (TSR) was -4.9%.
Fig.41: DUI overview
Source: IRESS, Bloomberg, Baillieu, Company reports. Figures as at 31 March 2019. Active returns refers to the TSR and NTA
growth relative to that of the comparative index (see chart below).
Fig.42: DUI TSR vs All Ords Accum. Index
Source: Bloomberg, Baillieu
DUI Snapshot Top Holdings %Price (31 March 2019) $4.08 CSL LTD 10.6%Share price range (12 months) $3.73- $4.45 TRANSURBAN GROUP 7.0%Shares on issue (Mn) 211.0 COMMONWEALTH BANK OF AUSTRAL 6.8%Market capitalisation ($Mn) $861 WESTPAC BANKING CORP 5.7%Pre-tax asset backing* $4.47 AUST AND NZ BANKING GROUP 5.0%Post-tax asset backing* $3.80 BHP GROUP LTD 4.4%Premium/(Discount) to pre-tax NTA -8.7% RIO TINTO LTD 4.4%Premium/(Discount) to post-tax NTA 7.4% WOODSIDE PETROLEUM LTD 3.7%Dividend yield 3.8% WASHINGTON H. SOUL PATTINSON 2.8%Dividend per share (cents) 15.5 NATIONAL AUSTRALIA BANK LTD 2.7%Franking 100%Management expense ratio 0.13%
Total Shareholder Return 1 Year 3 Year 5 Year NTA Performance 1 Year 3 Year 5 YearDUI 6.3% 12.5% 7.4% NTA growth 10.1% 14.1% 7.9%Active return -4.9% 1.2% -0.1% Active return -1.1% 2.8% 0.4%
-4
-2
0
2
4
6
8
10
12
14
16
Mar-18 May-18 Jul-18 Sep-18 Nov-18 Jan-19 Mar-19All Ords Accum. Index DUI

Baillieu Research 1 May 2019
baillieu.com.au Baillieu Limited ABN 74 006 519 393 Please read the disclaimer at the end of this report 31
Ellerston Asian Investment Limited (EAI) www.ellerstoncapital.com
• Incorporated in August 2015, EAI is managed by Ellerston Capital, a specialist funds manager founded in 2004 with over $5.0 billion in funds under management.
• EAI will provide investors with exposure to a portfolio of high growth equity securities in the Asian region. EAI will invest in the 10 core countries that constitute the MSCI AC Asia Ex Japan Index. EAI has identified four key investment themes: 1) Asian consumption; 2) Structural reforms in India; 3) Disruptive technologies; and 4) Capital market liberalisation in China.
• Key underlying regional exposure for EAI is China/Hong Kong (56.3%) and ASEAN (12.3%) with Financials (40.8%) and Consumer (17.8%) top sector exposures.
• Total shareholder return for the year ending 31 March 2019 was -10.6% with pre-tax net asset backing decreasing 4.7%. The active return (TSR) was -13.5%.
Fig.43: EAI overview
Source: IRESS, Bloomberg, Baillieu, Company reports. Figures as at 31 March 2019. Active returns refers to the TSR and NTA
growth relative to that of the comparative index (see chart below).
Fig.44: EAI TSR vs MSCI Asia ex Japan (AUD adj.)
Source: Bloomberg, Baillieu
EAI Snapshot Top Holdings %Price (31 March 2019) $0.96 ALIBABA GROUP HOLDING 7.4%Share price range (12 months) $0.91- $1.13 PING AN INSURANCE 7.3%Shares on issue (Mn) 147.3 TENCENT HOLDINGS 7.1%Market capitalisation ($Mn) $141 HONG KONG EXCHANGES & CLEARING 6.6%Pre-tax asset backing* $1.11 TSMC 5.1%Post-tax asset backing* $1.10 CHINA MERCHANTS BANK 4.1%Premium/(Discount) to pre-tax NTA -13.8% DBS GROUP HOLDINGS 4.0%Premium/(Discount) to post-tax NTA -13.2% CHINA CONSTRUCTION BANK 3.9%Dividend yield 2.1% BAIDU 3.9%Dividend per share (cents) 2.0 OCBC BANK 3.6%Franking 100%Management expense ratio 0.75%
Total Shareholder Return 1 Year 3 Year 5 Year NTA Performance 1 Year 3 Year 5 YearEAI -10.6% 7.7% na NTA growth -4.7% 8.1% naActive return -13.5% -7.4% na Active return -7.6% -6.9% na
-16
-14
-12
-10
-8
-6
-4
-2
0
2
4
6
Mar-18 May-18 Jul-18 Sep-18 Nov-18 Jan-19 Mar-19MSCI Asia ex Japan (AUD adjusted) EAI

Baillieu Research 1 May 2019
baillieu.com.au Baillieu Limited ABN 74 006 519 393 Please read the disclaimer at the end of this report 32
Ellerston Global Investments (EGI) www.ellerstoncapital.com
• Founded in 2004 as a subsidiary of CPH (the Packer family holding company), Ellerston Capital is a specialist fund manager offering investors a range of managed equity based strategies. EGI commenced trading in October 2014.
• Ellerston’s investment strategy will consist of a high conviction global equity securities portfolio, holding up to 25 securities. EGI will take a contrarian view, seeking securities that are fundamentally mispriced with a long-term investment timeframe.
• EGI initially screens companies for events such as spin offs, management change, post IPO’s and fallen angels. Key regional and sector exposures include the USA (52.5%) and UK (10.9%) with key sectors I.T. (23.4%), Communication Services (18.4%), and Industrials (13.0%).
• Total shareholder return for the year ending 31 March 2019 was -9.7% with pre-tax net asset backing decreasing 4.9%. The active return (TSR) was -22.9%.
Fig.45: EGI overview
Source: IRESS, Bloomberg, Baillieu, Company reports. Figures as at 31 March 2019. Active returns refers to the TSR and NTA
growth relative to that of the comparative index (see chart below).
Fig.46: EGI TSR vs MSCI World Index (AUD adj.)
Source: Bloomberg, Baillieu
EGI Snapshot Top Holdings %Price (31 March 2019) $0.93 CELLNEX TELECOM SA 6.2%Share price range (12 months) $0.91- $1.11 PREMIER INC 5.5%Shares on issue (Mn) 110.1 ENTERTAINMENT ONE 5.5%Market capitalisation ($Mn) $102 INTERXION HOLDING N.V. 5.0%Pre-tax asset backing* $1.07 ZAYO GROUP HOLDINGS 3.8%Post-tax asset backing* $1.07 GRAPHIC PACKAGING HOLDING CO. 3.6%Premium/(Discount) to pre-tax NTA -13.1% KEYSIGHT TECHNOLOGIES 3.4%Premium/(Discount) to post-tax NTA -12.9% WILLSCOT CORPORATION 3.3%Dividend yield 5.9% JC DECAUX SA 3.0%Dividend per share (cents) 5.5 TKH GROUP N.V. CERT 3.0%Franking 100%Management expense ratio 0.75%
Total Shareholder Return 1 Year 3 Year 5 Year NTA Performance 1 Year 3 Year 5 YearEGI -9.7% 2.2% na NTA growth -4.9% 2.4% naActive return -22.9% -12.0% na Active return -18.2% -11.8% na
-15
-10
-5
0
5
10
15
20
Mar-18 May-18 Jul-18 Sep-18 Nov-18 Jan-19 Mar-19MSCI World Index (AUD adjusted) EGI

Baillieu Research 1 May 2019
baillieu.com.au Baillieu Limited ABN 74 006 519 393 Please read the disclaimer at the end of this report 33
Forager Australian Shares Fund (FOR) www.foragerfunds.com
• The Forager Australian Shares Fund was initially incorporated in October 2009 as an unlisted unit trust before being converted to a closed end vehicle in December 2016.
• FOR utilises a fundamental bottom up investment approach, focusing on business which the assessed intrinsic value of the underlying business is substantially higher than the security price. FOR holds a relatively small number of securities, generally between 15 and 25.
• FOR will publish a daily NTA update which provides greater visibility of the underlying fund performance. FOR is currently trading at an estimated 8.1% discount to NTA.
• Total shareholder return for the year ending 31 March 2019 was -22.7% with pre-tax net asset backing decreasing 12.0%. The active return (TSR) was -28.5%.
Fig.47: FOR overview
Source: IRESS, Bloomberg, Baillieu, Company reports. Figures as at 31 March 2019. Active returns refers to the TSR and NTA
growth relative to that of the comparative index (see chart below).
Fig.48: FOR TSR vs ASX Small Ords Accum. Index
Source: Bloomberg, Baillieu
FOR Snapshot Top HoldingPrice (31 March 2019) $1.39 ENERO GROUP LTD 10.5%Share price range (12 months) $1.25- $2.12 MACMAHON HOLDINGS LTD 9.0%Shares on issue (Mn) 113.8 ISELECT LTD 8.1%Market capitalisation ($Mn) $158 THORN GROUP LTD 5.3%Pre-tax asset backing* $1.40 MMA OFFSHORE LTD 5.0%Post-tax asset backing* $0.00Premium/(Discount) to pre-tax NTA -1.1%Premium/(Discount) to post-tax NTA -Dividend yield 10.8%Dividend per share (cents) 14.9Franking 100%Management expense ratio 1.00%
Total Shareholder Return 1 Year 3 Year 5 Year NTA Performance 1 Year 3 Year 5 YearFOR -22.7% na na NTA growth -12.0% na naActive return -28.5% na na Active return -17.8% na na
-30
-25
-20
-15
-10
-5
0
5
10
15
Mar-18 May-18 Jul-18 Sep-18 Nov-18 Jan-19 Mar-19ASX Small Ords Accum. Index FOR
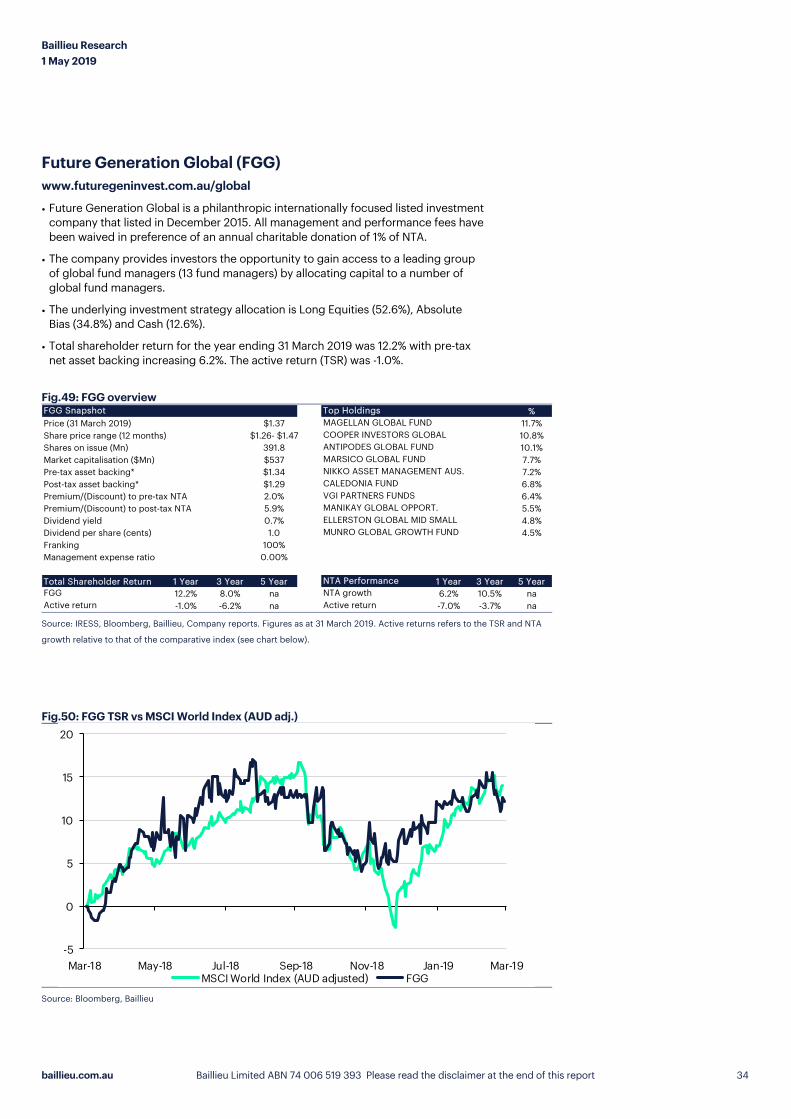
Baillieu Research 1 May 2019
baillieu.com.au Baillieu Limited ABN 74 006 519 393 Please read the disclaimer at the end of this report 34
Future Generation Global (FGG) www.futuregeninvest.com.au/global
• Future Generation Global is a philanthropic internationally focused listed investment company that listed in December 2015. All management and performance fees have been waived in preference of an annual charitable donation of 1% of NTA.
• The company provides investors the opportunity to gain access to a leading group of global fund managers (13 fund managers) by allocating capital to a number of global fund managers.
• The underlying investment strategy allocation is Long Equities (52.6%), Absolute Bias (34.8%) and Cash (12.6%).
• Total shareholder return for the year ending 31 March 2019 was 12.2% with pre-tax net asset backing increasing 6.2%. The active return (TSR) was -1.0%.
Fig.49: FGG overview
Source: IRESS, Bloomberg, Baillieu, Company reports. Figures as at 31 March 2019. Active returns refers to the TSR and NTA
growth relative to that of the comparative index (see chart below).
Fig.50: FGG TSR vs MSCI World Index (AUD adj.)
Source: Bloomberg, Baillieu
FGG Snapshot Top Holdings %Price (31 March 2019) $1.37 MAGELLAN GLOBAL FUND 11.7%Share price range (12 months) $1.26- $1.47 COOPER INVESTORS GLOBAL 10.8%Shares on issue (Mn) 391.8 ANTIPODES GLOBAL FUND 10.1%Market capitalisation ($Mn) $537 MARSICO GLOBAL FUND 7.7%Pre-tax asset backing* $1.34 NIKKO ASSET MANAGEMENT AUS. 7.2%Post-tax asset backing* $1.29 CALEDONIA FUND 6.8%Premium/(Discount) to pre-tax NTA 2.0% VGI PARTNERS FUNDS 6.4%Premium/(Discount) to post-tax NTA 5.9% MANIKAY GLOBAL OPPORT. 5.5%Dividend yield 0.7% ELLERSTON GLOBAL MID SMALL 4.8%Dividend per share (cents) 1.0 MUNRO GLOBAL GROWTH FUND 4.5%Franking 100%Management expense ratio 0.00%
Total Shareholder Return 1 Year 3 Year 5 Year NTA Performance 1 Year 3 Year 5 YearFGG 12.2% 8.0% na NTA growth 6.2% 10.5% naActive return -1.0% -6.2% na Active return -7.0% -3.7% na
-5
0
5
10
15
20
Mar-18 May-18 Jul-18 Sep-18 Nov-18 Jan-19 Mar-19MSCI World Index (AUD adjusted) FGG

Baillieu Research 1 May 2019
baillieu.com.au Baillieu Limited ABN 74 006 519 393 Please read the disclaimer at the end of this report 35
Future Generation Investment Fund (FGX) www.futuregeninvest.com.au
• Future Generation Investment Fund is a small/mid-cap LIC that is managed by a number of prominent investment managers who have waived their usual management and performance fees so that funds can be donated to nominated charities.
• Investment objectives: 1) Provide a stream of fully franked dividends; 2) achieve capital growth and; 3) preserve shareholder capital.
• The underlying investment strategy allocation is Long Equities (43.7%), Absolute Bias (33.6%), Market Neutral (12.8%), and cash (9.9%).
• Total shareholder return for the year ending 31 March 2019 was 6.4% with pre-tax net asset backing increasing 1.5%. The active return (TSR) was -4.9%.
Fig.51: FGX overview
Source: IRESS, Bloomberg, Baillieu, Company reports. Figures as at 31 March 2019. Active returns refers to the TSR and NTA
growth relative to that of the comparative index (see chart below).
Fig.52: FGX TSR vs All Ords Accum. Index
Source: Bloomberg, Baillieu
FGX Snapshot Top Holdings %Price (31 March 2019) $1.21 BENNELONG AUS. EQUITIES FUND 11.0%Share price range (12 months) $1.14- $1.36 REGAL AUS. LONG SHORT EQ. FD. 10.1%Shares on issue (Mn) 396.3 TRIBECA APLHA PLUS FUND 6.6%Market capitalisation ($Mn) $480 PARADICE MID CAP FUND - B CLASS 6.0%Pre-tax asset backing* $1.20 ELEY GRIFFITHS SML CO. FUND 5.7%Post-tax asset backing* $1.19 WILSON ASSET MGMT EQ FUND 5.7%Premium/(Discount) to pre-tax NTA 1.0% COOPER INV. AUS. EQUITIES FUND 5.2%Premium/(Discount) to post-tax NTA 1.7% PARADICE AUST. EQUITIES FUND 4.9%Dividend yield 3.7% SANDON ACTIVIST FUND 4.3%Dividend per share (cents) 4.5 WATERMARK FUNDS MGMT 4.3%Franking 100%Management expense ratio 0.00%
Total Shareholder Return 1 Year 3 Year 5 Year NTA Performance 1 Year 3 Year 5 YearFGX 6.4% 5.9% na NTA growth 1.5% 4.8% naActive return -4.9% -5.3% na Active return -9.7% -6.4% na
-5
0
5
10
15
20
Mar-18 May-18 Jul-18 Sep-18 Nov-18 Jan-19 Mar-19All Ords Accum. Index FGX

Baillieu Research 1 May 2019
baillieu.com.au Baillieu Limited ABN 74 006 519 393 Please read the disclaimer at the end of this report 36
Glennon Small Companies Limited (GC1) www.glennon.com.au
• Listed in August 2015, GC1 invests in a small and micro-cap segment of the market. The underlying portfolio will hold between 20-60 securities, predominately found outside the S&P/ASX100.
• The investment strategy of the manager is to focus on companies that operate in industries with high barriers to entry, have superior management and are viewed to be undervalued.
• GC1 adopts a long only investment style and does not use leverage; the portfolio may include securities from companies that are expected to list within 12 months.
• The total shareholder return for the year ending 31 March 2019 was -7.5% with pre-tax net asset backing decreasing 10.7%. The active return (TSR) was -13.3%.
Fig.53: GC1 overview
Source: IRESS, Bloomberg, Baillieu, Company reports. Figures as at 31 March 2019. Active returns refers to the TSR and NTA
growth relative to that of the comparative index (see chart below).
Fig.54: GC1 TSR vs ASX Small Ords Accum. Index
Source: Bloomberg, Baillieu
GC1 Snapshot Top Holding %Price (31 March 2019) $0.85 CML GROUP LTD naShare price range (12 months) $0.78- $1.17 NRW HOLDINGS LTDShares on issue (Mn) 48.0 NEARMAP LTDMarket capitalisation ($Mn) $41 SHINE CORPORATE LTDPre-tax asset backing* $0.96 TECHNOLOGY ONE LTDPost-tax asset backing* $0.95Premium/(Discount) to pre-tax NTA -12.0%Premium/(Discount) to post-tax NTA -11.1%Dividend yield 4.7%Dividend per share (cents) 4.0Franking 100%Management expense ratio 1.00%
Total Shareholder Return 1 Year 3 Year 5 Year NTA Performance 1 Year 3 Year 5 YearGC1 -7.5% -1.4% na NTA growth -10.7% 1.2% naActive return -13.3% -12.8% na Active return -16.5% -10.2% na
-20
-15
-10
-5
0
5
10
15
20
25
Mar-18 May-18 Jul-18 Sep-18 Nov-18 Jan-19 Mar-19ASX Small Ords Accum. Index GC1

Baillieu Research 1 May 2019
baillieu.com.au Baillieu Limited ABN 74 006 519 393 Please read the disclaimer at the end of this report 37
Global Value Fund (GVF) www.globalvaluefund.com.au
• Global Value Fund invests in a global portfolio of closed-end funds purchased at a discount to its underlying asset value, giving investors an alternate source of market outperformance compared to more common stock selection strategies.
• GVF implements an extensive risk management profile, including investing in a range of underlying asset classes (i.e. Fixed Interest, Private Equity).
• One of GVF’s top five funds are currently in the process of liquidating assets and returning funds back to shareholders.
• The total shareholder return for the year ending 31 March 2019 was 1.3% with pre-tax net asset backing increasing 1.8%. The active return (TSR) was -11.9%.
Fig.55: GVF overview
Source: IRESS, Bloomberg, Baillieu, Company reports. Figures as at 31 March 2019. Active returns refers to the TSR and NTA
growth relative to that of the comparative index (see chart below).
Fig.56: GVF TSR vs MSCI World Index (AUD adj.)
Source: Bloomberg, Baillieu
GVF Snapshot Top Holdings %Price (31 March 2019) $1.03 UNDISCLOSED 7.2%Share price range (12 months) $0.98- $1.12 PERSHING SQUARE HOLDINGS 6.8%Shares on issue (Mn) 148.0 CARADOR INCOME FUND 6.7%Market capitalisation ($Mn) $152 BLUE SKY ALTERNATIVE ACCESS FUND 5.7%Pre-tax asset backing* $1.04 VPC SPECIALTY LENDING INV. 5.3%Post-tax asset backing* $1.04Premium/(Discount) to pre-tax NTA -0.8% UNDERLYING ASSET CLASSPremium/(Discount) to post-tax NTA -0.8% LISTED EQUITY 33.0%Dividend yield 9.2% LISTED DEBT 30.0%Dividend per share (cents) 9.5 LISTED PRIVATE EQUITY 15.0%Franking 50% LISTED HEDGE FUND 7.0%Management expense ratio 1.50%
Total Shareholder Return 1 Year 3 Year 5 Year NTA Performance 1 Year 3 Year 5 YearGVF 1.3% 7.6% na NTA growth 1.8% 5.2% naActive return -11.9% -6.6% na Active return -11.4% -9.0% na
-5
0
5
10
15
20
Mar-18 May-18 Jul-18 Sep-18 Nov-18 Jan-19 Mar-19MSCI World Index (AUD adjusted) GVF

Baillieu Research 1 May 2019
baillieu.com.au Baillieu Limited ABN 74 006 519 393 Please read the disclaimer at the end of this report 38
Hearts and Minds (HM1) www.heartsandmindsinvestments.com.au
• HM1 is a recently incorporated LIC (Nov-18), following a $500m raise. HM1 has a combined objective of providing a concentrated portfolio of the highest conviction ideas whilst also supporting Australian medical research institutes.
• HM1 will hold a concentrated portfolio of long positions (approximately 25 Australian and international listed securities).
• 40% of the portfolio is allocated to the annual recommendations (both domestic and international) of the fund managers who present at the annual Sohn Hearts and Minds Investment Leaders Conference. The remaining 60% of the portfolio will be based on the highest conviction quarterly recommendations of five leading fund managers.
• The five current managers include Caledonia, Cooper Investments, Magellan Asset Management, Paradice Investment Management and Regal Funds Management.
• The total shareholder return since inception (Nov-18) is 12.6%, with pre-tax net asset backing increasing 14.4%. The active return (TSR) is 3.1%.
Fig.57: HM1 overview
Source: IRESS, Bloomberg, Baillieu, Company reports. Figures since inception (14-Nov-18). Active returns refers to the TSR and
NTA growth relative to that of the comparative index (see chart below).
Fig.58: HM1 TSR vs ASX 200 Accum. Index
Source: Bloomberg, Baillieu
HM1 Snapshot Top Holdings %Price (31 March 2019) $2.86 Business domicileShare price range (12 months) $2.35- $2.97 United States 46.0%Shares on issue (Mn) 200.0 Australia 26.0%Market capitalisation ($Mn) $572 China 7.0%Pre-tax asset backing* $2.80 Brazil 5.0%Post-tax asset backing* $2.71Premium/(Discount) to pre-tax NTA 2.1% Top Sector AllocationPremium/(Discount) to post-tax NTA 5.5% Cons Discretionary 25.0%Dividend yield 0.0% Communications 20.0%Dividend per share (cents) 0.0 Industrials 16.0%Franking 100% Technology 14.0%Management expense ratio 0.00% Financials 9.0%
Total Shareholder Return 1 Year* 3 Year 5 Year NTA Performance 1 Year* 3 Year 5 YearHM1 12.6% na na NTA growth 14.4% na naActive return 3.1% na na Active return 4.9% na na
-10
-5
0
5
10
15
20
Nov-18 Nov-18 Dec-18 Dec-18 Jan-19 Jan-19 Feb-19 Feb-19 Mar-19 Mar-19S&P/ASX TR 200 INDEX HM1

Baillieu Research 1 May 2019
baillieu.com.au Baillieu Limited ABN 74 006 519 393 Please read the disclaimer at the end of this report 39
Lowell Resources Fund (LRT) www.lrfm.com.au
• LRT is a recently incorporated Listed Investment Trust (LIT) that invests in the junior mining and energy sectors in Australia and the around the world. The fund listed on the ASX in March 2018 following a $5m raise.
• The manager employs a top-down investment strategy in conjunction with a bottom up stock selection process to achieve performance.
• Over time, the portfolio will represent a range of commodities including gold, iron ore, coal, oil, gas, uranium, rare earths and strategic minerals, copper and other base metals.
• The total shareholder return for the year ending 31 March 2019 was -47.1% with pre-tax net asset backing decreasing 31.6%. The active return (TSR) was -45.7%.
Fig.59: LRT overview
Source: IRESS, Bloomberg, Baillieu, Company reports. Figures as at 31 March 2019. Active returns refers to the TSR and NTA
growth relative to that of the comparative index (see chart below).
Fig.60: LRT TSR vs ASX Small Resources Accum. Index
Source: Bloomberg, Baillieu
LRT Snapshot Top Holdings %Price (31 March 2019) $4.50 GOLD ROAD RESOURCES LTD 11.0%Share price range (12 months) $4.42- $8.3 ADRIATIC METALS PLC-CDI 8.0%Shares on issue (Mn) 2.8 TINKA RESOURCES LTD 5.0%Market capitalisation ($Mn) $13 RAMELIUS RESOURCES LTD 5.0%Pre-tax asset backing* $5.64 REAL ENERGY CORP LTD 4.0%Post-tax asset backing* - MUSGRAVE MINERALS LTD 4.0%Premium/(Discount) to pre-tax NTA -20.2% CASH 2.0%Premium/(Discount) to post-tax NTA -Dividend yield 0.0%Dividend per share (cents) 0.0Franking 100%Management expense ratio 2.16%
Total Shareholder Return 1 Year 3 Year 5 Year NTA Performance 1 Year 3 Year 5 YearLRT -47.1% na na NTA growth -31.6% na naActive return -45.7% na na Active return -30.3% na na
-50
-40
-30
-20
-10
0
10
20
Mar-18 May-18 Jul-18 Sep-18 Nov-18 Jan-19 Mar-19
ASX Small Cap Resources Accum. Index LRT

Baillieu Research 1 May 2019
baillieu.com.au Baillieu Limited ABN 74 006 519 393 Please read the disclaimer at the end of this report 40
L1 Long Short Fund (LSF) www.l1longshort.com
• LSF listed in April-18 following a $1.3bn raising. LSF has dual investment objectives to: 1) seek to deliver strong, positive, risk-adjusted returns over the long term (being a period of more than five years); and 2) preserve capital.
• LSF will utilise a fundamental, bottom-up research process to seek and identify mispriced securities with the potential to provide attractive risk adjusted returns. The manager may take short positions in companies it considers to be overvalued, or of low quality and/or over-geared.
• The total shareholder return since inception is 26.1%, with pre-tax net asset backing decreasing 17.9%. The active return (TSR) is -35.1%.
Fig.61: LSF overview
Source: IRESS, Bloomberg, Baillieu, Company reports. Figures since inception (April-18). Active returns refers to the TSR and
NTA growth relative to that of the comparative index (see chart below).
Fig.62: LSF TSR vs ASX 300 Accum. Index
Source: Bloomberg, Baillieu
LSF Snapshot Top Holdings %Price (31 March 2019) $1.47 naShare price range (12 months) $1.27- $2.09Shares on issue (Mn) 664.8Market capitalisation ($Mn) $977Pre-tax asset backing* $1.61Post-tax asset backing* $1.73Premium/(Discount) to pre-tax NTA -8.8%Premium/(Discount) to post-tax NTA -15.0%Dividend yield 2.0%Dividend per share (cents) 3.0Franking 100%Management expense ratio 1.25%
Total Shareholder Return 1 Year* 3 Year 5 Year NTA Performance 1 Year* 3 Year 5 YearLSF -26.1% na na NTA growth -17.9% na naActive return -35.1% na na Active return -26.9% na na
-40
-30
-20
-10
0
10
20
Apr-18 May-18 Jun-18 Jul-18 Aug-18 Sep-18 Oct-18 Nov-18 Dec-18 Jan-19 Feb-19 Mar-19S&P/ASX TR 300 INDEX LSF

Baillieu Research 1 May 2019
baillieu.com.au Baillieu Limited ABN 74 006 519 393 Please read the disclaimer at the end of this report 41
Lion Selection Group (LSX) www.lsg.com.au
• LSX Lion Selection (LSX) is a specialist mining LIC with a focus on early stage mining projects. LSX was established and listed on the ASX in 1997.
• LSX gives investors exposure to the high risk, high growth stage of mining investment. It focuses on early stage gold and base metals activities. LSX also provides early stage funding to assist companies along the development curve.
• The total shareholder return for the year ending 31 March 2019 was 6.0% with pre-tax net asset backing increasing 33.9%. The active return (TSR) was 7.3%.
Fig.63: LSX overview
Source: IRESS, Bloomberg, Baillieu, Company reports. Figures as at 31 March 2019. Active returns refers to the TSR and NTA
growth relative to that of the comparative index (see chart below).
Fig.64: LSX TSR vs ASX Small Resources Index
Source: Bloomberg, Baillieu
LSX Snapshot Top Holdings %Price (31 March 2019) $0.36 PANI JV (33.3% INTEREST) 58.6%Share price range (12 months) $0.26- $0.4 NUSANTARA RESOURCES 12.0%Shares on issue (Mn) 150.1 ROXGOLD 6.6%Market capitalisation ($Mn) $53 EGAN STREET RESOURCES 8.2%Pre-tax asset backing* $0.44 ERDENE RESOURCES 2.7%Post-tax asset backing* - TORO GOLD 2.5%Premium/(Discount) to pre-tax NTA -19.3% OTHER 4.8%Premium/(Discount) to post-tax NTA -Dividend yield 0.0%Dividend per share (cents) 0.0Franking 100%Management expense ratio 1.50%
Total Shareholder Return 1 Year 3 Year 5 Year NTA Performance 1 Year 3 Year 5 YearLSX 6.0% 15.6% -6.6% NTA growth 33.3% 12.4% -6.6%Active return 7.3% -5.3% -11.8% Active return 34.7% -8.5% -11.8%
-30
-25
-20
-15
-10
-5
0
5
10
15
20
Mar-18 May-18 Jul-18 Sep-18 Nov-18 Jan-19 Mar-19ASX Small Resources Index LSX

Baillieu Research 1 May 2019
baillieu.com.au Baillieu Limited ABN 74 006 519 393 Please read the disclaimer at the end of this report 42
Monash Absolute Investment (MA1) www.monashinvestors.com
• Monash Absolute Investment (MA1) was incorporated in April 2016 and is managed by Monash Investors.
• MA1 seeks to achieve a targeted positive return over a full investment cycle (5 to 7 years) as well as avoiding negative returns each financial year.
• MA1 will provide investors access to a portfolio (small cap bias) comprised of long and short positions. MA1 employs an investment approach which is high conviction, benchmark unaware, security size agnostic and investment style agnostic.
• The total shareholder return for the year ending 31 March 2019 was -2.6% with pre-tax net asset backing increasing 0.2%. The active return (TSR) was -13.8%.
Fig.65: MA1 overview
Source: IRESS, Bloomberg, Baillieu, Company reports. Figures as at 31 March 2019. Active returns refers to the TSR and NTA
growth relative to that of the comparative index (see chart below).
Fig.66: MA1 TSR vs All Ords Accum. Index
Source: Bloomberg, Baillieu
MA1 Snapshot Top Holdings %Price (31 March 2019) $0.78 naShare price range (12 months) $0.7- $0.91Shares on issue (Mn) 44.3Market capitalisation ($Mn) $35Pre-tax asset backing* $0.97Post-tax asset backing* $0.99Premium/(Discount) to pre-tax NTA -19.9%Premium/(Discount) to post-tax NTA -21.6%Dividend yield 1.3%Dividend per share (cents) 1.0Franking 100%Management expense ratio 1.00%
Total Shareholder Return 1 Year 3 Year 5 Year NTA Performance 1 Year 3 Year 5 YearMA1 -2.6% -7.6% na NTA growth 0.2% 0.3% naActive return -13.8% -18.9% na Active return -11.1% -11.0% na
-15
-10
-5
0
5
10
15
20
Mar-18 May-18 Jul-18 Sep-18 Nov-18 Jan-19 Mar-19All Ords Accum. Index MA1

Baillieu Research 1 May 2019
baillieu.com.au Baillieu Limited ABN 74 006 519 393 Please read the disclaimer at the end of this report 43
MFF Capital Investments (MFF) www.magellangroup.com.au/mff/
• The MFF Capital Investments was listed on the ASX in December 2006.
• The fund is focused on North American companies; more than 90% of its portfolio consists of US domiciled corporations that are leaders in emerging markets as well as developed markets.
• MFF has been one of the top performing LICs from our coverage universe over 1, 3 and 5 years.
• The total shareholder return for the year ending 31 March 2019 was 26.8% with pre-tax net asset backing increasing 19.5%. The active return (TSR) was 13.6%.
Fig.67: MFF overview
Source: IRESS, Bloomberg, Baillieu, Company reports. Figures as at 31 March 2019. Active returns refers to the TSR and NTA
growth relative to that of the comparative index (see chart below).
Fig.68: MFF TSR vs MSCI World Index (AUD adj.)
Source: Bloomberg, Baillieu
MFF Snapshot Top Holdings %Price (31 March 2019) $2.82 VISA INC-CLASS A SHARES 15.4%Share price range (12 months) $2.32- $3 MASTERCARD INC - A 14.5%Shares on issue (Mn) 541.6 HOME DEPOT INC 9.9%Market capitalisation ($Mn) $1,527 BANK OF AMERICA CORP 8.4%Pre-tax asset backing* $3.02 JPMORGAN CHASE & CO 6.4%Post-tax asset backing* $2.52 ALPHABET INC-CL A 6.4%Premium/(Discount) to pre-tax NTA -6.5% LOWE'S COS INC 4.4%Premium/(Discount) to post-tax NTA 12.1% S&P GLOBAL 4.1%Dividend yield 1.1% HCA HEALTHCARE INC 4.0%Dividend per share (cents) 3.0 WELLS FARGO & CO 3.8%Franking 100%Management expense ratio 1.25%
Total Shareholder Return 1 Year 3 Year 5 Year NTA Performance 1 Year 3 Year 5 YearMFF 26.8% 15.3% 15.0% NTA growth 19.5% 20.0% 18.2%Active return 13.6% 1.2% 1.8% Active return 6.3% 5.8% 5.0%
-5
0
5
10
15
20
25
30
35
40
Mar-18 May-18 Jul-18 Sep-18 Nov-18 Jan-19 Mar-19MSCI World Index (AUD adjusted) MFF

Baillieu Research 1 May 2019
baillieu.com.au Baillieu Limited ABN 74 006 519 393 Please read the disclaimer at the end of this report 44
Magellan Global Trust (MGG) www.magellangroup.com.au
• Magellan Global Trust is a recently incorporated LIT following a $1.5bn raise in October 2017. The investment strategy mirrors the core investment principles of Magellan Financial Group’s (MFG) global equities strategy. MFG currently manages more than $79.4bn.
• MGG seeks to achieve attractive risk-adjusted returns over the medium to long term, whilst reducing risk of permanent capital loss. MGG has a target cash distribution yield of 4% pa.
• Top regional and sector exposures include US (46%), Western Europe (12%), and Emerging Markets (15%) and I.T. (20%) and Internet/Ecommerce (15%).
• The total shareholder return for the year ending 31 March 2019 was 16.6% with pre-tax net asset backing increasing 16.5%. The active return (TSR) was 3.3%.
Fig.69: MGG overview
Source: IRESS, Bloomberg, Baillieu, Company reports. Figures as at 31 March 2019. Active returns refers to the TSR and NTA
growth relative to that of the comparative index (see chart below).
Fig.70: MGG TSR vs MSCI World Index (AUD adj.)
Source: Bloomberg, Baillieu
MGG Snapshot Top Holdings %Price (31 March 2019) $1.69 ALPHABET INC-CL A 7.7%Share price range (12 months) $1.49- $1.8 FACEBOOK INC-CLASS A 7.1%Shares on issue (Mn) 1236.5 MICROSOFT CORP 7.1%Market capitalisation ($Mn) $2,084 STARBUCKS CORP 6.2%Pre-tax asset backing* $1.72 APPLE INC 6.1%Post-tax asset backing* - VISA INC-CLASS A SHARES 5.5%Premium/(Discount) to pre-tax NTA -2.2% HCA HEALTHCARE INC 5.2%Premium/(Discount) to post-tax NTA - MASTERCARD INC - A 4.8%Dividend yield 3.6% ORACLE CORP 4.4%Dividend per share (cents) 6.0 YUM! BRANDS INC 3.8%Franking 100%Management expense ratio 1.35%
Total Shareholder Return 1 Year 3 Year 5 Year NTA Performance 1 Year 3 Year 5 YearMGG 16.6% na na NTA growth 16.5% na naActive return 3.3% na na Active return 3.3% na na
-5
0
5
10
15
20
25
Mar-18 May-18 Jul-18 Sep-18 Nov-18 Jan-19 Mar-19MSCI World Index (AUD adjusted) MGG

Baillieu Research 1 May 2019
baillieu.com.au Baillieu Limited ABN 74 006 519 393 Please read the disclaimer at the end of this report 45
Mirrabooka Investments (MIR) www.mirra.com.au
• Mirrabooka Investments’ objective is to provide medium to long-term gains by investing in small/mid-sized companies in Australia and New Zealand. It was established in 1999 and listed in 2001.
• Mirrabooka provides investors with an opportunity to focus on investing outside blue chip companies.
• Mirrabooka currently writes options against 6 of its top 20 holdings.
• As at 31 March 2019, MIR was trading at an estimated 6.6% premium to NTA, this compares to its one and three-year historical average of 8.4% and 13.3% respectively.
• The total shareholder return for the year ending 31 March 2019 was 3.2% with pre-tax net asset backing increasing 3.7%. The active return (TSR) was -0.8%.
Fig.71: MIR overview
Source: IRESS, Bloomberg, Baillieu, Company reports. Figures as at 31 March 2019. Active returns refers to the TSR and NTA
growth relative to that of the comparative index (see chart below).
Fig.72: MIR TSR vs ASX Midcap Accum. Index
Source: Bloomberg, Baillieu
MIR Snapshot Top Holdings %Price (31 March 2019) $2.44 MAINFREIGHT LTD 5.0%Share price range (12 months) $2.29- $2.7 QUBE HOLDINGS LTD 3.6%Shares on issue (Mn) 160.5 LIFESTYLE COMMUNITIES LTD 3.3%Market capitalisation ($Mn) $392 ALUMINA LTD 3.2%Pre-tax asset backing* $2.29 BREVILLE GROUP LTD 3.0%Post-tax asset backing* $2.07 JAMES HARDIE INDUSTRIES-CDI 2.9%Premium/(Discount) to pre-tax NTA 6.6% IRESS LTD 2.9%Premium/(Discount) to post-tax NTA 17.9% EQT HOLDINGS LTD 2.8%Dividend yield 9.0% ARB CORP LTD 2.7%Dividend per share (cents) 22.0 SEEK LTD 2.7%Franking 100%Management expense ratio 0.67%
Total Shareholder Return 1 Year 3 Year 5 Year NTA Performance 1 Year 3 Year 5 YearMIR 3.2% 4.1% 3.8% NTA growth 3.7% 6.6% 6.6%Active return -0.8% -8.3% -8.3% Active return -0.3% -5.7% -5.5%
-10
-5
0
5
10
15
Mar-18 May-18 Jul-18 Sep-18 Nov-18 Jan-19 Mar-19ASX Midcap Accum. Index MIR

Baillieu Research 1 May 2019
baillieu.com.au Baillieu Limited ABN 74 006 519 393 Please read the disclaimer at the end of this report 46
Milton Corporation (MLT) www.milton.com.au
• Milton Corporation was formed in 1938 and listed in 1958. Its objective is to invest in a diversified portfolio that provides an increasing income stream over time.
• Milton is not a speculative investor and does not sell assets to increase profits for shareholders. It maintains a relatively heavy focus on banking with 26.6% of total assets invested in the sector.
• The total shareholder return for the year ending 31 March 2019 was 3.6% with pre-tax net asset backing increasing 9.7%. The active return (TSR) was -7.7%.
Fig.73: MLT overview
Source: IRESS, Bloomberg, Baillieu, Company reports. Figures as at 31 March 2019. Active returns refers to the TSR and NTA
growth relative to that of the comparative index (see chart below).
Fig.74: MLT TSR vs All Ords Accum. Index
Source: Bloomberg, Baillieu
MLT Snapshot Top Holdings %Price (31 March 2019) $4.47 WESTPAC BANKING CORP 8.7%Share price range (12 months) $4.22- $4.8 WASHINGTON H. SOUL PATTINSON 7.7%Shares on issue (Mn) 669.0 COMMONWEALTH BANK OF AUSTRAL 7.1%Market capitalisation ($Mn) $2,990 BHP GROUP LTD 5.0%Pre-tax asset backing* $4.68 NATIONAL AUSTRALIA BANK LTD 3.9%Post-tax asset backing* $4.13 CSL LTD 3.7%Premium/(Discount) to pre-tax NTA -4.5% WESFARMERS LTD 3.2%Premium/(Discount) to post-tax NTA 8.2% AUST AND NZ BANKING GROUP 2.9%Dividend yield 4.3% WOOLWORTHS GROUP LTD 2.8%Dividend per share (cents) 19.2 MACQUARIE GROUP LTD 2.7%Franking 100%Management expense ratio 0.12%
Total Shareholder Return 1 Year 3 Year 5 Year NTA Performance 1 Year 3 Year 5 YearMLT 3.6% 6.6% 5.4% NTA growth 9.7% 8.0% 5.4%Active return -7.7% -4.6% -2.1% Active return -1.5% -3.3% -2.1%
-6
-4
-2
0
2
4
6
8
10
12
14
Mar-18 May-18 Jul-18 Sep-18 Nov-18 Jan-19 Mar-19All Ords Accum. Index MLT

Baillieu Research 1 May 2019
baillieu.com.au Baillieu Limited ABN 74 006 519 393 Please read the disclaimer at the end of this report 47
NAOS Ex-50 Opportunities Company Ltd (NAC) www.naos.com.au
• Established in 2005, Naos Asset Management is an Australian boutique fund manager with three listed investment companies.
• NAC is a fundamental bottom up absolute return long/short fund holding a concentrated portfolio of small and mid-cap securities (market capitalisation typically between $400m - $1bn).
• Whilst NAC does not disclose top holdings due to its high portfolio concentration (11 long and 1 short position at 31 March 2019).
• The total shareholder return for the year ending 31 March 2019 was -10.0% with pre-tax net asset backing decreasing 3.5%. The active return (TSR) was -21.2%.
Fig.75: NAC overview
Source: IRESS, Bloomberg, Baillieu, Company reports. Figures as at 31 March 2019. Active returns refers to the TSR and NTA
growth relative to that of the comparative index (see chart below).
Fig.76: NAC TSR vs All Ords Accum. Index
Source: Bloomberg, Baillieu
NAC Snapshot Top Holdings %Price (31 March 2019) $0.84 SERVICE STREAM LTD naShare price range (12 months) $0.83- $1.04 BSA LTDShares on issue (Mn) 52.5 MNF GROUP LTDMarket capitalisation ($Mn) $44 PEOPLE INFRASTRUCTURE LTDPre-tax asset backing* $1.03Post-tax asset backing* $1.02Premium/(Discount) to pre-tax NTA -18.4%Premium/(Discount) to post-tax NTA -17.6%Dividend yield 6.2%Dividend per share (cents) 5.2Franking 100%Management expense ratio 1.75% **top contributors to performance since inception**
Total Shareholder Return 1 Year 3 Year 5 Year NTA Performance 1 Year 3 Year 5 YearNAC -10.0% 0.2% na NTA growth -3.5% -0.2% naActive return -21.2% -11.1% na Active return -14.8% -11.5% na
-15
-10
-5
0
5
10
15
Mar-18 May-18 Jul-18 Sep-18 Nov-18 Jan-19 Mar-19All Ords Accum. Index NAC

Baillieu Research 1 May 2019
baillieu.com.au Baillieu Limited ABN 74 006 519 393 Please read the disclaimer at the end of this report 48
NAOS Emerging Opportunities Fund (NCC) www.naos.com.au
• Established in 2005, Naos Asset Management is an Australian boutique fund manager with three listed investment companies.
• NCC provides investors with a highly concentrated ASX ex-100 portfolio that seeks to achieve a minimum of 4.0% yield on investments.
• Whilst NCC does not disclose top holdings due to its high portfolio concentration (9 long holding at 31 March 2019).
• The total shareholder return for the year ending 31 March 2019 was -13.3% with pre-tax net asset backing decreasing 12.9%. The active return (TSR) was -19.1%.
Fig.77: NCC overview
Source: IRESS, Bloomberg, Baillieu, Company reports. Figures as at 31 March 2019. Active returns refers to the TSR and NTA
growth relative to that of the comparative index (see chart below).
Fig.78: NCC TSR vs All Ords Accum. Index
Source: Bloomberg, Baillieu
NCC Snapshot Top Holdings %Price (31 March 2019) $1.08 BSA LTD naShare price range (12 months) $1- $1.38 CALLIDEN GROUP PTY LTDShares on issue (Mn) 59.9 CAPITOL HEALTH LTDMarket capitalisation ($Mn) $65 CONSOLIDATED OPERATIONS GROUPre-tax asset backing* $1.06 CML GROUP LTDPost-tax asset backing* $1.08Premium/(Discount) to pre-tax NTA 1.9%Premium/(Discount) to post-tax NTA 0.0%Dividend yield 6.7%Dividend per share (cents) 7.3Franking 100%Management expense ratio 1.25% **top contributors to performance since inception**
Total Shareholder Return 1 Year 3 Year 5 Year NTA Performance 1 Year 3 Year 5 YearNCC -13.3% 9.5% 6.6% NTA growth -12.9% 4.1% 3.1%Active return -19.1% -1.9% -1.4% Active return -18.7% -7.3% -4.9%
-25
-20
-15
-10
-5
0
5
10
15
Mar-18 May-18 Jul-18 Sep-18 Nov-18 Jan-19 Mar-19ASX Small Ords Accum. Index NCC

Baillieu Research 1 May 2019
baillieu.com.au Baillieu Limited ABN 74 006 519 393 Please read the disclaimer at the end of this report 49
NGE Capital (NGE) www. ngecapital.com.au
• About: NGE was launched as a LIC in October 2016, following a vote by shareholders for a change of structure and activities. NGE is managed by Kentgrove Capital, a boutique investment manager in Melbourne.
• NGE’s investment mandate is intended to be as broad as permitted under ASX Listing Rules. As such, NGE expects that it will focus its investments on equity securities in listed or unlisted entities but is permitted to invest in other asset classes such as hybrids/bonds/convertible notes/currencies.
• NGE holds a high conviction portfolio of securities, derived from bottom-up fundamental research focusing on the fundamentals of the company rather than market trends.
• The total shareholder return for the year ending 31 March 2019 was 73.0% with pre-tax net asset backing increasing 31.9%. The active return (TSR) was 67.3%.
Fig.79: NGE overview
Source: IRESS, Bloomberg, Baillieu, Company reports. Figures as at 31 March 2019. Active returns refers to the TSR and NTA
growth relative to that of the comparative index (see chart below).
Fig.80: NGE TSR vs All Ords Accum. Index
Source: Bloomberg, Baillieu
NGE Snapshot Top Holdings %Price (31 March 2019) $0.77 UNITED COMPANY RUSAL (HKE) 23.7%Share price range (12 months) $0.57- $0.8 KAROON ENERGY 17.4%Shares on issue (Mn) 37.2 YELLOW CAKE PLC 14.5%Market capitalisation ($Mn) $29 POWERWRAP (UL) 13.9%Pre-tax asset backing* $0.81 EUREKA GROUP 7.8%Post-tax asset backing* $0.85 HORIZON OIL 7.7%Premium/(Discount) to pre-tax NTA -4.6% BASE RESOURCES 7.5%Premium/(Discount) to post-tax NTA -9.3% WARRIOR MET COAL 6.7%Dividend yield 0.0%Dividend per share (cents) 0.0Franking 100%Management expense ratio 1.90%
Total Shareholder Return 1 Year 3 Year 5 Year NTA Performance 1 Year 3 Year 5 YearNGE 73.0% 20.5% 24.3% NTA growth 31.9% na naActive return 67.3% 9.1% 16.3% Active return 26.1% na na
-10
0
10
20
30
40
50
60
70
80
90
Mar-18 May-18 Jul-18 Sep-18 Nov-18 Jan-19 Mar-19All Ords Accum. Index NGE

Baillieu Research 1 May 2019
baillieu.com.au Baillieu Limited ABN 74 006 519 393 Please read the disclaimer at the end of this report 50
NAOS Small Cap Opportunities Company (NSC) www.naos.com.au/
• In November 2017, NAOS Asset Management acquired the investment management agreement of NSC (previously Contango Microcap). NAOS currently manage two other LICs – NCC and NAC.
• NAOS has evolved the underlying investment strategy and portfolio. Management will seek undervalued industrial companies with a market cap between $100m - $1bn. NSC will hold a concentrated (long only) portfolio of 10-15 securities.
• NSC aims to deliver shareholders with a sustainable growing stream of dividend franked to the maximum extent possible over the long term.
• At 31 March 2019, NSC held 10 securities and 2.1% of the portfolio in cash.
• The total shareholder return for the year ending 31 March 2019 was -22.5% with pre-tax net asset backing decreasing 14.2%. The active return (TSR) was –28.3%.
Fig.81: NSC overview
Source: IRESS, Bloomberg, Baillieu, Company reports. Figures as at 31 March 2019. Active returns refers to the TSR and NTA
growth relative to that of the comparative index (see chart below).
Fig.82: NSC TSR vs ASX Small Ords Accum. Index
Source: Bloomberg, Baillieu
NSC Snapshot Top Holdings %Price (31 March 2019) $0.63 OVER THE WIRE HOLDINGS LTD naShare price range (12 months) $0.6- $0.89 ENERO GROUP LTDShares on issue (Mn) 169.0 SERVICE STREAM LTDMarket capitalisation ($Mn) $106 360 CAPITAL TOTAL RETURN FUNPre-tax asset backing* $0.76 360 CAPITAL GROUP LTDPost-tax asset backing* $0.78Premium/(Discount) to pre-tax NTA -17.8%Premium/(Discount) to post-tax NTA -19.9%Dividend yield 8.8%Dividend per share (cents) 5.5Franking 100%Management expense ratio 1.15% **top contributors to performance since inception**
Total Shareholder Return 1 Year 3 Year 5 Year NTA Performance 1 Year 3 Year 5 YearNSC -22.5% -6.7% -3.1% NTA growth -14.2% -4.5% -2.2%Active return -28.3% -18.1% -11.0% Active return -20.0% -15.9% -10.2%
-25
-20
-15
-10
-5
0
5
10
15
Mar-18 May-18 Jul-18 Sep-18 Nov-18 Jan-19 Mar-19ASX Small Ords Accum. Index NSC

Baillieu Research 1 May 2019
baillieu.com.au Baillieu Limited ABN 74 006 519 393 Please read the disclaimer at the end of this report 51
Ophir High Conviction (OPH) www.ophiram.com.au/ophir-high-conviction-fund
• OPH listed in Dec-18 as a LIT, via the conversion (no capital raised) of the three previous classes of units into a single ordinary class that will list on the ASX. Established in 2012, Ophir is a specialist small and midcap equities investment manager with ~$960m of funds under management. OPH is one of two strategies run by the manager.
• Although recently listed, OPH has a strong track record of outperformance (20.5% annualised returns since inception - Aug-15).
• Management employ a fundamental, bottom up strategy seeking companies that: 1) operate IN or about to enter periods of structural growth; 2) are generating cash or have a clear pathway to cash generation; 2) have a high quality management team and are under-researched/appreciated or not well understood by the market.
• The total return NTA for the year ending 31 March 2019 was 7.6%, the active return was 3.0%.
Fig.83: OPH overview
Source: IRESS, Bloomberg, Baillieu, Company reports. Figures since inception (Dec-18). Active returns refers to the TSR and
NTA growth relative to that of the comparative index (see chart below).
Fig.84: OPH Performance vs ASX Mid-Small Index
Source: Bloomberg, Baillieu
OPH Snapshot Top Holdings %Price (31 March 2019) $2.55 A2 MILK CO LTDShare price range (12 months) - AFTERPAY TOUCH GROUP LTDShares on issue (Mn) 200.0 CLEANAWAY WASTE MANAGEMENT LMarket capitalisation ($Mn) $510.0 NEXTDC LTDPre-tax asset backing* $2.46 RELIANCE WORLDWIDE CORP LTDPost-tax asset backing* -Premium/(Discount) to pre-tax NTA 3.7%Premium/(Discount) to post-tax NTA -Dividend yield -Dividend per share (cents) -Franking -Management expense ratio 1.23%
Total Shareholder Return 1 Year* 3 Year Inception NTA Performance** 1 Year 3 Year InceptionOPH 18.6% - - NTA growth 7.6% 13.8% 20.5%Active return 9.8% - - Active return 3.0% 1.9% 9.1%*Since listing (19-Dec-18)**Historical returns of the unlisted High Conviction Fund
-10
-5
0
5
10
15
20
25
Dec-18 Jan-19 Jan-19 Jan-19 Feb-19 Feb-19 Mar-19 Mar-19S&P/ASX Mid Small OPH

Baillieu Research 1 May 2019
baillieu.com.au Baillieu Limited ABN 74 006 519 393 Please read the disclaimer at the end of this report 52
Ozgrowth Limited (OZG) www.ozgrowth.com.au
• OZG is a listed investment company that focuses on investing in the Australian equity market. The portfolio of assets is managed by Westoz Funds Management Pty Ltd, a wholly owned subsidiary of Euroz Limited.
• The Company invests in small to mid-sized companies, generally listed on the Australian Securities Exchange and with some connection to Western Australia.
• The total shareholder return for the year ending 31 March 2019 was -3.1% with pre-tax net asset backing decreasing 13.0%. The active return (TSR) was -14.4%.
Fig.85: OZG overview
Source: IRESS, Bloomberg, Baillieu, Company reports. Figures as at 31 March 2019. Active returns refers to the TSR and NTA
growth relative to that of the comparative index (see chart below).
Fig.86: OZG TSR vs All Ords Accum. Index
Source: Bloomberg, Baillieu
OZG Snapshot Top Holdings %Price (31 March 2019) $0.16 CEDAR WOODS PROPERTIES LTD 11.0%Share price range (12 months) $0.16- $0.2 EMERALD RESOURCES NL 7.0%Shares on issue (Mn) 356.1 AUSTRALIS OIL & GAS LTD 7.0%Market capitalisation ($Mn) $57 AUSDRILL LTD 7.0%Pre-tax asset backing* $0.20 MACMAHON HOLDINGS LTD 6.0%Post-tax asset backing* $0.20 FINBAR GROUP LTD 4.0%Premium/(Discount) to pre-tax NTA -18.4% WEST AFRICAN RESOURCES LTD 4.0%Premium/(Discount) to post-tax NTA -20.8% SRG GLOBAL LTD 4.0%Dividend yield 3.1% EQUATORIAL RESOURCES LTD 4.0%Dividend per share (cents) 0.5 ZENITH ENERGY LTD/AU 3.0%Franking 100%Management expense ratio 1.00%
Total Shareholder Return 1 Year 3 Year 5 Year NTA Performance 1 Year 3 Year 5 YearOZG -3.1% 10.4% 0.3% NTA growth -13.0% 8.1% -0.3%Active return -14.4% -0.9% -7.2% Active return -24.2% -3.2% -7.7%
-10
-5
0
5
10
15
20
Mar-18 May-18 Jul-18 Sep-18 Nov-18 Jan-19 Mar-19All Ords Accum. Index OZG

Baillieu Research 1 May 2019
baillieu.com.au Baillieu Limited ABN 74 006 519 393 Please read the disclaimer at the end of this report 53
PM Capital Asian Opportunities Fund (PAF) www.pmcapital.com.au
• PM Capital Asian Opportunities Fund began trading on the ASX on 21 May 2014.
• PAF provide long-term capital growth by investing in a portfolio of predominantly undervalued listed Asian equities and other investment securities in the Asian Region (ex-Japan).
• Greater China (45.0%) and South-East Asia (22.3%) are the highest regionals exposures within the portfolio with Financials (17.8%) and Gaming (15.4%) the highest sector allocations.
• The total shareholder return for the year ending 31 March 2019 was -22.2% with pre-tax net asset backing decreasing 10.1%. The active return (TSR) was -25.0%.
Fig.87: PAF overview
Source: IRESS, Bloomberg, Baillieu, Company reports. Figures as at 31 March 2019. Active returns refers to the TSR and NTA
growth relative to that of the comparative index (see chart below).
Fig.88: PAF TSR vs MSCI Asia Ex Japan (AUD adj.)
Source: Bloomberg, Baillieu
PAF Snapshot Top HoldingsPrice (31 March 2019) $0.99 HEINEKEN MALAYSIA naShare price range (12 months) $0.98- $1.31 DALI FOOD GROUPShares on issue (Mn) 56.9 DBS GROUPMarket capitalisation ($Mn) $56 MGM CHINA HOLDINGSPre-tax asset backing* $1.06 BAIDUPost-tax asset backing* $1.02 TURQUOISE HILL RESOURCESPremium/(Discount) to pre-tax NTA -7.0% SINOPEC KANTONSPremium/(Discount) to post-tax NTA -3.3%Dividend yield 4.0%Dividend per share (cents) 4.0Franking 100%Management expense ratio 1.00% **current stock example**
Total Shareholder Return 1 Year 3 Year 5 Year NTA Performance 1 Year 3 Year 5 YearPAF -22.2% 8.3% na NTA growth -10.1% 3.7% naActive return -25.0% -6.8% na Active return -13.0% -11.4% na
-30
-25
-20
-15
-10
-5
0
5
Mar-18 May-18 Jul-18 Sep-18 Nov-18 Jan-19 Mar-19MSCI Asia Ex Japan (AUD Adjusted) PAF

Baillieu Research 1 May 2019
baillieu.com.au Baillieu Limited ABN 74 006 519 393 Please read the disclaimer at the end of this report 54
Platinum Asia Investments Limited (PAI) www.platinum.com.au
• Platinum Asia Investments (PAI) is managed by the ASX listed, Platinum Asset Management (PTM) with ~$25.8 billion of funds under management as at 31 March 2019. PAI invests in the Asian region (ex-Japan), seeking to provide investors with capital growth over the long term.
• PAI is recently incorporated, listing in December 2015 however Platinum Asset Management has been investing in the Asian region (ex-Japan) since 2004 through its Platinum Asia Fund which currently manages ~$4.5 billion of funds.
• Key regional exposures include Greater China (35.2%) and India (12.7%).
• The total shareholder return for the year ending 31 March 2019 was -12.0% with pre-tax net asset backing decreasing 2.6%. The active return (TSR) was -14.8%.
Fig.89: PAI overview
Source: IRESS, Bloomberg, Baillieu, Company reports. Figures as at 31 March 2019. Active returns refers to the TSR and NTA
growth relative to that of the comparative index (see chart below).
Fig.90: PAI TSR vs MSCI Asia Ex Japan (AUD adj.)
Source: Bloomberg, Baillieu
PAI Snapshot Top Holdings %Price (31 March 2019) $1.05 ALIBABA GROUP 4.8%Share price range (12 months) $1.01- $1.32 PING AN INSURANCE GROUP 3.8%Shares on issue (Mn) 362.1 TENCENT HOLDINGS 3.8%Market capitalisation ($Mn) $380 TAIWAN SEMICONDUCTOR MANUFAC. 3.8%Pre-tax asset backing* $1.10 SAMSUNG ELECTRONICS 3.6%Post-tax asset backing* $1.08 AIA GROUP 3.5%Premium/(Discount) to pre-tax NTA -4.2% AXIS BANK 2.7%Premium/(Discount) to post-tax NTA -2.8% KASIKORNBANK PLC 2.7%Dividend yield 7.6% 58.COM 2.6%Dividend per share (cents) 8.0 HK EXCHANGES & CLEARING 2.6%Franking 100%Management expense ratio 1.10%
Total Shareholder Return 1 Year 3 Year 5 Year NTA Performance 1 Year 3 Year 5 YearPAI -12.0% 8.3% na NTA growth -2.6% 10.8% naActive return -14.8% -6.8% na Active return -5.5% -4.3% na
-20
-15
-10
-5
0
5
Mar-18 May-18 Jul-18 Sep-18 Nov-18 Jan-19 Mar-19MSCI Asia Ex Japan (AUD adjusted) PAI

Baillieu Research 1 May 2019
baillieu.com.au Baillieu Limited ABN 74 006 519 393 Please read the disclaimer at the end of this report 55
PM Capital Global Opportunities Fund (PGF)
www.pmcapital.com.au
• Managed by PM Capital, PGF began trading on the ASX on 11 December 2013.
• Current Investment themes include: 1) Global Domestic Banking; 2) Post GFC Housing Recovery (US/Europe); 3) Alternative Investment Managers.; and 4) Service Monopolies.
• Key underlying regional exposure is North America (38.8%), Europe (27.2%) and International (17.7%) with currency exposure of the portfolio weighted towards to the USD at 61.2%.
• The total shareholder return for the year ending 31 March 2019 was -3.0% with pre-tax net asset backing decreasing 2.9%. The active return (TSR) was -16.2%.
Fig.91: PGF overview
Source: IRESS, Bloomberg, Baillieu, Company reports. Figures as at 31 March 2019. Active returns refers to the TSR and NTA
growth relative to that of the comparative index (see chart below).
Fig.92: PGF TSR vs MSCI World Index (AUD adj.)
Source: Bloomberg, Baillieu
PGF Snapshot Top Holdings %Price (31 March 2019) $1.14 HOWARD HUGHES naShare price range (12 months) $1.06- $1.35 CAIRN HOMESShares on issue (Mn) 352.0 BANK OF AMERICAMarket capitalisation ($Mn) $400 ALPHABETPre-tax asset backing* $1.27 MGM CHINA HOLDINGSPost-tax asset backing* $1.19 KKR & COPremium/(Discount) to pre-tax NTA -10.5%Premium/(Discount) to post-tax NTA -4.3%Dividend yield 3.2%Dividend per share (cents) 3.6Franking 100%Management expense ratio 1.00% **current stock examples**
Total Shareholder Return 1 Year 3 Year 5 Year NTA Performance 1 Year 3 Year 5 YearPGF -3.0% 12.3% na NTA growth -2.9% 11.1% 6.9%Active return -16.2% -1.9% na Active return -16.1% -3.1% na
-15
-10
-5
0
5
10
15
20
Mar-18 May-18 Jul-18 Sep-18 Nov-18 Jan-19 Mar-19MSCI World Index (AUD adjusted) PGF

Baillieu Research 1 May 2019
baillieu.com.au Baillieu Limited ABN 74 006 519 393 Please read the disclaimer at the end of this report 56
Perpetual Equity Investment Company (PIC) www.perpetualequity.com.au
• Perpetual Equity Investment Company listed on 18 December 2014 and is managed by Perpetual. Perpetual currently has ~$27.7 billion of funds under management.
• PIC follows a bottom-up investment approach, focusing on mid-caps with a concentrated exposure of 20–40 securities. Additionally, a global allocation is included, up to 25% of the portfolio. Currently PIC has 2.0% exposure allocated to international securities. At 31-Mar, PIC held 18.8% of the portfolio in cash.
• The total shareholder return for the year ending 31 March 2019 was -1.6% with pre-tax net asset backing increasing 3.6%. The active return (TSR) was -13.3%.
Fig.93: PIC overview
Source: IRESS, Bloomberg, Baillieu, Company reports. Figures as at 31 March 2019. Active returns refers to the TSR and NTA
growth relative to that of the comparative index (see chart below).
Fig.94: PIC TSR vs ASX300 Accum. Index
Source: Bloomberg, Baillieu
PIC Snapshot Top Holdings %Price (31 March 2019) $1.05 COMMONWEALTH BANK OF AUSTRAL 10.0%Share price range (12 months) $0.98- $1.23 WESTPAC BANKING CORP 7.8%Shares on issue (Mn) 344.8 SUNCORP GROUP LTD 6.5%Market capitalisation ($Mn) $362 WOOLWORTHS GROUP LTD 5.8%Pre-tax asset backing* $1.10 TELSTRA CORP LTD 4.6%Post-tax asset backing* $1.10Premium/(Discount) to pre-tax NTA -4.1% GLOBAL TOP HOLDINGSPremium/(Discount) to post-tax NTA -4.2% TAKEDA PHARMACUTICAL CO. 1.5%Dividend yield 3.1% ING GROEP NV 0.5%Dividend per share (cents) 3.3Franking 100%Management expense ratio 1.00%
Total Shareholder Return 1 Year 3 Year 5 Year NTA Performance 1 Year 3 Year 5 YearPIC -1.6% 8.8% na NTA growth 3.6% 6.6% naActive return -13.3% -2.6% na Active return -8.2% -4.8% na
-6
-4
-2
0
2
4
6
8
10
12
14
16
Mar-18 May-18 Jul-18 Sep-18 Nov-18 Jan-19 Mar-19ASX300 Accum. Index PIC

Baillieu Research 1 May 2019
baillieu.com.au Baillieu Limited ABN 74 006 519 393 Please read the disclaimer at the end of this report 57
Pengana International Equities (PIA) www.pengana.com
• PIA is managed by Pengana Capital (PCG), a listed fund manager with ~$3.0bn of funds under management.
• PIA’s objective is to deliver long term consistent shareholder returns that consistently pay dividends whilst reducing volatility and the risk of losing capital.
• Post the investment mandate change in 2017, the underlying PIA portfolio now replicates the strategy and process of Pengana’s International Equity Fund (PIEF). Top regional exposure including the USA (41.4%) and Europe ex-UK (27.5%). Key sector exposures include Financials (15.0%), Consumer Disc. (14.3%) and Comm. Services (13.2%).
• The total shareholder return for the year ending 31 March 2019 was 3.3% with pre-tax net asset backing increasing 3.4%. The active return (TSR) was -9.9%.
Fig.95: PIA overview
Source: IRESS, Bloomberg, Baillieu, Company reports. Figures as at 31 March 2019. Active returns refers to the TSR and NTA
growth relative to that of the comparative index (see chart below).
Fig.96: PIA TSR vs MSCI World Index (AUD adj.)
Source: Bloomberg, Baillieu
PIA Snapshot Top Holdings %Price (31 March 2019) $1.12 ALPHABET naShare price range (12 months) $1.01- $1.21 ASML HOLDINGShares on issue (Mn) 253.3 BHARTI INFRATELMarket capitalisation ($Mn) $284 CIGNA CORPPre-tax asset backing* $1.22 CME GROUPPost-tax asset backing* $1.21 DEUTSCHE BOERSEPremium/(Discount) to pre-tax NTA -8.4% HEINEKENPremium/(Discount) to post-tax NTA -7.5% MICROSOFTDividend yield 6.3% NUTRIENDividend per share (cents) 7.0 WORLDPAYFranking 100%Management expense ratio 1.50% **listed in alphabetical order**
Total Shareholder Return 1 Year 3 Year 5 Year NTA Performance 1 Year 3 Year 5 YearPIA 3.3% 4.1% 7.7% NTA growth 3.4% 1.7% 6.3%Active return -9.9% -10.1% -5.5% Active return -9.8% -12.4% -7.0%
-10
-5
0
5
10
15
20
Mar-18 May-18 Jul-18 Sep-18 Nov-18 Jan-19 Mar-19MSCI World Index (AUD adjusted) PIA

Baillieu Research 1 May 2019
baillieu.com.au Baillieu Limited ABN 74 006 519 393 Please read the disclaimer at the end of this report 58
Platinum Capital (PMC) www.platinum.com.au
• Platinum Capital listed on the ASX in 1994 and is managed by Platinum Asset Management.
• Its strategy is to invest in international equities, predominantly from Europe and Asia. The portfolio is currently overweight net China (14.6%) with other key regions including Europe (18.2%) and Japan (8.9%). PMC is underweight the US with net exposure of only 9.5%.
• Platinum is an active manager and also derives revenue from trading activities.
• The total shareholder return for the year ending 31 March 2019 was -12.7% with pre-tax net asset backing decreasing 4.9%. The active return (TSR) was -26.0%.
Fig.97: PMC overview
Source: IRESS, Bloomberg, Baillieu, Company reports. Figures as at 31 March 2019. Active returns refers to the TSR and NTA
growth relative to that of the comparative index (see chart below).
Fig.98: PMC TSR vs MSCI World Index (AUD adj.)
Source: Bloomberg, Baillieu
PMC Snapshot Top Holdings %Price (31 March 2019) $1.62 PING AN INSURANCE GROUP 4.1%Share price range (12 months) $1.52- $2.12 SAMSUNG ELECTRONICS CO 3.4%Shares on issue (Mn) 288.6 GLENCORE PLC 3.1%Market capitalisation ($Mn) $467 ALPHABET INC 3.0%Pre-tax asset backing* $1.56 FACEBOOK INC 2.7%Post-tax asset backing* $1.51 CHINA OVERSEAS LAND & INV 2.6%Premium/(Discount) to pre-tax NTA 4.0% JIANGSU YANGHE BREWERY 2.3%Premium/(Discount) to post-tax NTA 7.3% PICC PROPERTY AND CASUALTY 2.2%Dividend yield 7.4% TENCENT HOLDINGS 2.0%Dividend per share (cents) 12.0 TECHNIPFMC PLC 2.0%Franking 100%Management expense ratio 1.10%
Total Shareholder Return 1 Year 3 Year 5 Year NTA Performance 1 Year 3 Year 5 YearPMC -12.7% 4.6% 3.6% NTA growth -4.9% 8.3% 5.0%Active return -26.0% -9.6% -9.6% Active return -18.1% -5.8% -8.3%
-20
-15
-10
-5
0
5
10
15
20
Mar-18 May-18 Jul-18 Sep-18 Nov-18 Jan-19 Mar-19MSCI World Index (AUD adjusted) PMC

Baillieu Research 1 May 2019
baillieu.com.au Baillieu Limited ABN 74 006 519 393 Please read the disclaimer at the end of this report 59
Plato Income Maximiser (PL8)
www.plato.com.au/lic-overview/
• PL8 is a recently incorporated LIC raising ~$320m in May 2017. Plato is a boutique fund manager specialising in Australian and global equities with ~$4.9bn of FUM.
• The fund is specifically managed for investors who can utilise franking credits, such as zero tax and low tax paying investors including pension phase superannuation, SMSFs and charities and will seek to pay out monthly fully franked dividends.
• The PL8 strategy seeks to maximise the amount of dividends it receives by rotating the portfolio depending on upcoming ex-dividend dates. PL8 announced its first fully franked dividend five months post listing.
• The total shareholder for the year ending 31 March 2019 was 12.6% with pre-tax net asset backing increasing 10.8%. The active return (TSR) is 0.5%.
Fig.99: PL8 overview
Source: IRESS, Bloomberg, Baillieu, Company reports. Figures as at 31 March 2019. Active returns refers to the TSR and NTA
growth relative to that of the comparative index (see chart below).
Fig.100: PL8 TSR vs ASX200 Accum. Index
Source: Bloomberg, Baillieu
PL8 Snapshot Top Holdings %Price (31 March 2019) $1.04 AUST AND NZ BANKING GROUP naShare price range (12 months) $0.95- $1.08 BHP GROUP LTDShares on issue (Mn) 296.9 COMMONWEALTH BANK OF AUSTRALMarket capitalisation ($Mn) $307 CSL LTDPre-tax asset backing* $1.07 MACQUARIE GROUP LTDPost-tax asset backing* $1.10 NATIONAL AUSTRALIA BANK LTDPremium/(Discount) to pre-tax NTA -3.4% RIO TINTO LTDPremium/(Discount) to post-tax NTA -5.6% WESFARMERS LTDDividend yield 5.8% WESTPAC BANKING CORPDividend per share (cents) 6.0 WOOLWORTHS GROUP LTDFranking 100%Management expense ratio 0.80% **listed in alphabetical order**
Total Shareholder Return 1 Year 3 Year 5 Year NTA Performance 1 Year 3 Year 5 YearPL8 12.6% na na NTA growth 10.8% na naActive return 0.5% na na Active return -1.3% na na
-4
-2
0
2
4
6
8
10
12
14
16
Mar-18 May-18 Jul-18 Sep-18 Nov-18 Jan-19 Mar-19ASX200 Accum. Index PL8

Baillieu Research 1 May 2019
baillieu.com.au Baillieu Limited ABN 74 006 519 393 Please read the disclaimer at the end of this report 60
QV Equities (QVE) www.qvequities.com
• QV Equities Limited is a listed investment company, managed by Investors Mutual Limited (IML). It first listed on the ASX in August 2014.
• Its investment objective is to achieve long term value through capital growth and income by investing in a diversified portfolio of ASX listed entities outside the S&P/ASX 20 Index.
• As of QVE’s most recent portfolio update, the company was holding 17.9% cash.
• The total shareholder for the year ending 31 March 2019 was -6.7% with pre-tax net asset backing increasing 1.1%. The active return (TSR) was -15.2%
Fig.101: QVE overview
Source: IRESS, Bloomberg, Baillieu, Company reports. Figures as at 31 March 2019. Active returns refers to the TSR and NTA
growth relative to that of the comparative index (see chart below).
Fig.102: QVE TSR vs ASX300 Ex-20 Accum. Index
Source: Bloomberg, Baillieu
QVE Snapshot Top Holdings %Price (31 March 2019) $1.04 CROWN RESORTS LTD 4.4%Share price range (12 months) $1.02- $1.22 AMCOR LIMITED 4.2%Shares on issue (Mn) 276.3 CALTEX AUSTRALIA LTD 3.9%Market capitalisation ($Mn) $287 SPARK INFRASTRUCTURE GROUP 3.8%Pre-tax asset backing* $1.13 SONIC HEALTHCARE LTD 3.8%Post-tax asset backing* $1.11 AURIZON HOLDINGS LTD 3.6%Premium/(Discount) to pre-tax NTA -8.0% STEADFAST GROUP LTD 3.6%Premium/(Discount) to post-tax NTA -6.3% PACT GROUP HOLDINGS LTD 3.1%Dividend yield 5.1% ORICA LTD 3.1%Dividend per share (cents) 5.3 GWA GROUP LTD 3.0%Franking 100%Management expense ratio 0.95%
Total Shareholder Return 1 Year 3 Year 5 Year NTA Performance 1 Year 3 Year 5 YearQVE -6.7% 5.1% na NTA growth 1.1% 5.7% naActive return -15.2% -7.0% na Active return -7.4% -6.4% na
-8
-6
-4
-2
0
2
4
6
8
10
12
14
Mar-18 May-18 Jul-18 Sep-18 Nov-18 Jan-19 Mar-19ASX300 Ex20 Accum Index QVE

Baillieu Research 1 May 2019
baillieu.com.au Baillieu Limited ABN 74 006 519 393 Please read the disclaimer at the end of this report 61
Ryder Capital (RYD) www.rydercapital.com.au/
• The manager, established in 2008, is an active, value manager that follows a fundamental bottom-up investment process. RYD provides exposure to a concentrated portfolio of listed and unlisted micro and small cap securities.
• RYD’s investment process utilises seven key components (as per its prospectus) which are constantly being reviewed and refined. The seven key components are: 1) Discount to intrinsic value; 2) Quality of earnings; 3) Balance sheet strength; 4) Quality of business; 5) Quality of management; 6) Clear and observable business plan; and 7) Identifiable value catalyst.
• The Company may hold up to 50% of the portfolio in cash at any given time. Up to 20% of the portfolio may be invested in unlisted securities, on the condition that these securities are proposed to be listed within 12 months.
• The total shareholder for the year ending 31 March 2019 was 7.4% with pre-tax net asset backing decreasing 4.8%. The active return (TSR) was -3.8%
Fig.103: RYD overview
Source: IRESS, Bloomberg, Baillieu, Company reports. Figures as at 31 March 2019. Active returns refers to the TSR and NTA
growth relative to that of the comparative index (see chart below).
Fig.104: RYD TSR vs All Ords Accum. Index
Source: Bloomberg, Baillieu
RYD Snapshot Top Holdings %Price (31 March 2019) $1.28 UPDATER INCShare price range (12 months) $1.15- $1.32 CODAN LTDShares on issue (Mn) 59.9 NEXTDCMarket capitalisation ($Mn) $77 SRG GLOBALPre-tax asset backing* $1.41 CUMULATIVE WEIGHTING 32.7%Post-tax asset backing* $1.33Premium/(Discount) to pre-tax NTA -9.1%Premium/(Discount) to post-tax NTA -3.7%Dividend yield 2.3%Dividend per share (cents) 3.0Franking 100%Management expense ratio 1.25%
Total Shareholder Return 1 Year 3 Year 5 Year NTA Performance 1 Year 3 Year 5 YearRYD 7.4% na na NTA growth -4.8% 13.5% naActive return -3.8% na na Active return -16.1% 2.3% na
-4
-2
0
2
4
6
8
10
12
14
Mar-18 May-18 Jul-18 Sep-18 Nov-18 Jan-19 Mar-19All Ords Accum. Index RYD

Baillieu Research 1 May 2019
baillieu.com.au Baillieu Limited ABN 74 006 519 393 Please read the disclaimer at the end of this report 62
Spheria Emerging Companies (SEC) www.spheria.com.au
• Spheria is managed by Spheria Asset Management; a fundamental bottom up investment manager specialising in small and microcap companies. SEC is recently incorporated LIC following a ~$132m raise in November 2017.
• SEC has a dual investment objective to outperform the benchmark over each full investment cycle (three to five years), and provide capital growth and income (over the investment cycle).
• A significant portion of SEC’s portfolio is investment in companies with a market capitalisation of $1bn+.
• The total shareholder for the year ending 31 March 2019 was -8.7% with pre-tax net asset backing increasing 2.6%. The active return (TSR) was -14.5%.
Fig.105: SEC overview
Source: IRESS, Bloomberg, Baillieu, Company reports. Figures as at 31 March 2019. Active returns refers to the TSR and NTA
growth relative to that of the comparative index (see chart below).
Fig.106: SEC TSR vs ASX Small Ords Accum. Index
Source: Bloomberg, Baillieu
SEC Snapshot Top Holdings %Price (31 March 2019) $1.73 NAVITAS LTD 6.5%Share price range (12 months) $1.65- $1.99 FLETCHER BUILDING LTD 5.0%Shares on issue (Mn) 66.3 BEGA CHEESE LTD 4.8%Market capitalisation ($Mn) $114 CLASS LTD 4.7%Pre-tax asset backing* $2.03 TECHNOLOGY ONE LTD 4.7%Post-tax asset backing* $2.07Premium/(Discount) to pre-tax NTA -14.9%Premium/(Discount) to post-tax NTA -16.6%Dividend yield 3.5%Dividend per share (cents) 6.0Franking 100%Management expense ratio 1.00%
Total Shareholder Return 1 Year 3 Year 5 Year NTA Performance 1 Year 3 Year 5 YearSEC -8.7% na na NTA growth 2.6% na naActive return -14.5% na na Active return -3.2% na na
-20
-15
-10
-5
0
5
10
15
Mar-18 May-18 Jul-18 Sep-18 Nov-18 Jan-19 Mar-19ASX Small Ords Accum. Index SEC

Baillieu Research 1 May 2019
baillieu.com.au Baillieu Limited ABN 74 006 519 393 Please read the disclaimer at the end of this report 63
Sandon Capital Investments (SNC) www.sandoncapital.com.au
• Sandon Capital is an activist investment firm established in December 2008. Activism seeks to unlock value in listed companies through a proactive approach to corporate governance. Activism investing is independent of the company board but works closely with substantial shareholders.
• SNC seeks to provide investors capital growth over the medium to long term as well as the regular payment of semi-annual fully franked dividends.
• SNC recently proposed a merger with Monash Absolute (MA1).
• The total shareholder return for the year ending 31 March 2019 was -3.5% with pre-tax net asset backing increasing 2.5%. The active return (TSR) was -14.8%.
Fig.107: SNC overview
Source: IRESS, Bloomberg, Baillieu, Company reports. Figures as at 31 March 2019. Active returns refers to the TSR and NTA
growth relative to that of the comparative index (see chart below).
Fig.108: SNC TSR vs All Ords Accum. Index
Source: Bloomberg, Baillieu
SNC Snapshot Top HoldingsPrice (31 March 2019) $0.88 LISTED EQUITIES 97.0%Share price range (12 months) $0.8- $1.06 CASH 3.0%Shares on issue (Mn) 48.4 NUMBER OF INVESTMENTS 34Market capitalisation ($Mn) $43Pre-tax asset backing* $0.95Post-tax asset backing* $0.93Premium/(Discount) to pre-tax NTA -7.4%Premium/(Discount) to post-tax NTA -5.9%Dividend yield 8.0%Dividend per share (cents) 7.0Franking 100%Management expense ratio 1.25%
Total Shareholder Return 1 Year 3 Year 5 Year NTA Performance 1 Year 3 Year 5 YearSNC -3.5% 8.0% 4.0% NTA growth 2.5% 7.2% 5.2%Active return -14.8% -3.3% -3.5% Active return -8.8% -4.1% -2.3%
-15
-10
-5
0
5
10
15
Mar-18 May-18 Jul-18 Sep-18 Nov-18 Jan-19 Mar-19
All Ords Accum. Index SNC

Baillieu Research 1 May 2019
baillieu.com.au Baillieu Limited ABN 74 006 519 393 Please read the disclaimer at the end of this report 64
Tribeca Global Natural Resources (TGF) www.tribecaip.com/global-natural-resources
• The manager, Tribeca Investment Partners, is a specialist small and mid-cap equities investment manager. TGF listed in Oct-18 following a $158m raise.
• TGF seeks to actively deliver superior risk-adjusted returns to investors through a combination of long and short, credit and commodity positions in the highly volatile natural resources sector. TGF invests across the end-to-end value chain within the resources sector. The manager employs a high conviction, bottom-up research approach coupled with specialist commodities knowledge to take advantage of valuation mispricing and relative value of the natural resources market. TGF seeks to maintain detailed coverage of ~300 companies across the eight natural resources industry segments.
• The total shareholder return since inception (Oct-18) is -10.3%, with pre-tax net asset backing decreasing 1.2%. The active return (TSR) is -8.7%.
Fig.109: TGF overview
Source: IRESS, Bloomberg, Baillieu, Company reports. Figures since inception (Oct-18). Active returns refers to the TSR and
NTA growth relative to that of the comparative index (see chart below).
Fig.110: TGF TSR vs All Ords Accum. Index
Source: Bloomberg, Baillieu
TGF Snapshot Top Holdings %Price (31 March 2019) $2.26 TECK RESOURCES-B naShare price range (12 months) $2.22- $2.63 FREEPORT-MCMORANShares on issue (Mn) 63.0 WORLEYPARSONSMarket capitalisation ($Mn) $142 GLENCORE PLCPre-tax asset backing* $2.47 RIO TINTO LTDPost-tax asset backing* $2.46 A. M. CASTLE & CPremium/(Discount) to pre-tax NTA -8.3% CORNERSTONE CAPPremium/(Discount) to post-tax NTA -8.2% OZ MINERALS LTDDividend yield 0.0% EURONAV NVDividend per share (cents) 0.0 GASLOG LTDFranking 100%Management expense ratio 1.50%
Total Shareholder Return 1 Year* 3 Year 5 Year NTA Performance 1 Year* 3 Year 5 YearTGF -10.3% na na NTA growth -1.2% na naActive return -8.7% na na Active return 0.4% na na
-20
-15
-10
-5
0
5
Oct-18 Nov-18 Dec-18 Jan-19 Feb-19 Mar-19
MSCI ACWI Commodity Prod TGF

Baillieu Research 1 May 2019
baillieu.com.au Baillieu Limited ABN 74 006 519 393 Please read the disclaimer at the end of this report 65
Templeton Global Growth Fund (TGG) www.tggf.com.au
• The Templeton Global Growth Fund was listed on the ASX in 1987 by Franklin Templeton Investment Group, an American investment group with more than 50 years’ experience.
• Templeton’s investment approach is to seek out fundamentally undervalued securities with a focus on long-term growth.
• Its portfolio gives Australian investors access to a diversified portfolio of international securities.
• TGG is overweight European exposure (41.0%) whilst underweight North America (32.0%) when compared MSCI All Country World Index. Key underlying portfolio holdings included Financials (23.8%), Healthcare (15.4%) and Energy (13.2%)
• The total shareholder return for the year ending 31 March 2019 was -2.0% with pre-tax net asset backing increasing 0.5%. The active return (TSR) was -15.3%.
Fig.111: TGG overview
Source: IRESS, Bloomberg, Baillieu, Company reports. Figures as at 31 March 2019. Active returns refers to the TSR and NTA
growth relative to that of the comparative index (see chart below).
Fig.112: TGG TSR vs MSCI World Index (AUD adj)
Source: Bloomberg, Baillieu
TGG Snapshot Top Holdings %Price (31 March 2019) $1.26 BP PLC naShare price range (12 months) $1.22- $1.5 ORACLE CORPShares on issue (Mn) 217.9 ROYAL DUTCH SHELLMarket capitalisation ($Mn) $273 SANOFIPre-tax asset backing* $1.43 SAMSUNG ELECTRONICSPost-tax asset backing* $1.41 SIEMENS AGPremium/(Discount) to pre-tax NTA -12.5% CITIGROUP INCPremium/(Discount) to post-tax NTA -10.7% VEOLIA ENVIRONMENTDividend yield 8.0% ALLERGAN PLCDividend per share (cents) 10.0 SINGAPORE TELECOMMUNICATIONSFranking 100%Management expense ratio 1.00%
Total Shareholder Return 1 Year 3 Year 5 Year NTA Performance 1 Year 3 Year 5 YearTGG -2.0% 8.6% 3.7% NTA growth 0.5% 9.5% 5.6%Active return -15.3% -5.6% -9.6% Active return -12.8% -4.7% -7.7%
-5
0
5
10
15
20
Mar-18 May-18 Jul-18 Sep-18 Nov-18 Jan-19 Mar-19MSCI World Index (AUD adjusted) TGG

Baillieu Research 1 May 2019
baillieu.com.au Baillieu Limited ABN 74 006 519 393 Please read the disclaimer at the end of this report 66
Thorney Opportunities (TOP) www.thorneyopportunities.com.au
• Thorney Opportunities (TOP) evolved from Thorney Investment Group, a private investment company via a backdoor listing with cashbox Wentworth Holdings.
• TOP invests in a number of asset classes including securities (listed and unlisted) derivatives, unit trusts, joint ventures, debt instruments and cash.
• The total shareholder return for the year ending 31 March 2019 was -2.9% with pre-tax net asset backing decreasing 0.5%. The active return (TSR) was -14.2%.
Fig.113: TOP overview
Source: IRESS, Bloomberg, Baillieu, Company reports. Figures as at 31 March 2019. Active returns refers to the TSR and NTA
growth relative to that of the comparative index (see chart below).
Fig.114: TOP TSR vs All Ords Accum. Index
Source: Bloomberg, Baillieu
TOP Snapshot Top Holdings %Price (31 March 2019) $0.64 naShare price range (12 months) $0.6- $0.75Shares on issue (Mn) 203.6Market capitalisation ($Mn) $130Pre-tax asset backing* $0.79Post-tax asset backing* $0.75Premium/(Discount) to pre-tax NTA -18.9%Premium/(Discount) to post-tax NTA -14.8%Dividend yield 2.4%Dividend per share (cents) 1.6Franking 100%Management expense ratio 0.75%
Total Shareholder Return 1 Year 3 Year 5 Year NTA Performance 1 Year 3 Year 5 YearTOP -2.9% 8.6% 4.4% NTA growth -0.5% 12.8% 12.2%Active return -14.2% -2.7% -3.1% Active return -11.8% 1.5% 4.7%
-15
-10
-5
0
5
10
15
Mar-18 May-18 Jul-18 Sep-18 Nov-18 Jan-19 Mar-19All Ords Accum. Index TOP

Baillieu Research 1 May 2019
baillieu.com.au Baillieu Limited ABN 74 006 519 393 Please read the disclaimer at the end of this report 67
URB Investments (URB) http://www.urbinvest.com.au
• Managed by Contact Asset Management, URB Investments (URB) is a newly created LIC, listing in April 2017.
• URB seeks to capture long-term value through a combination of capital and income growth by investing in a diversified portfolio of equity assets and direct property assets with exposure to urban renewal and regeneration.
• The company has identified an urbanised equities universe of 89 stocks that are beneficiaries of urban renewal and regeneration. The manager will have the ability to rotate the portfolio allocation between equities, direct property and cash.
• The total shareholder return for the year ending 31 March 2019 was -1.5% with pre-tax net asset backing increasing 10.4%. The active return (TSR) was -12.8%.
Fig.115: URB overview
Source: IRESS, Bloomberg, Baillieu, Company reports. Figures as at 31 March 2019. Active returns refers to the TSR and NTA
growth relative to that of the comparative index (see chart below).
Fig.116: URB TSR vs ASX300 Accum Index
Source: Bloomberg, Baillieu
URB Snapshot Top Holdings %Price (31 March 2019) $0.92 PRESTONS PROPERTY 9.4%Share price range (12 months) $0.87- $1.01 KINGSGROVE PROPERTY 8.7%Shares on issue (Mn) 73.4 TRANSURBAN GROUP 7.2%Market capitalisation ($Mn) $67 SYDNEY AIRPORT 6.0%Pre-tax asset backing* $1.11 HOMEHQ - ARTAMON 3.6%Post-tax asset backing* $1.11 HARVEY NORMAN HOLDINGS LTD 2.7%Premium/(Discount) to pre-tax NTA -17.6% REGIS RESOURCES LTD 2.6%Premium/(Discount) to post-tax NTA -17.6% 360 CAPITAL GROUP LTD 2.4%Dividend yield 3.0% LENDLEASE GROUP 2.3%Dividend per share (cents) 2.8 MIRVAC GROUP 2.0%Franking 100%Management expense ratio 0.50%
Total Shareholder Return 1 Year 3 Year 5 Year NTA Performance 1 Year 3 Year 5 YearURB -1.5% na na NTA growth 10.4% na naActive return -12.8% na na Active return -0.8% na na
-8
-6
-4
-2
0
2
4
6
8
10
Mar-18 May-18 Jul-18 Sep-18 Nov-18 Jan-19 Mar-19ASX300 Accum. Index URB

Baillieu Research 1 May 2019
baillieu.com.au Baillieu Limited ABN 74 006 519 393 Please read the disclaimer at the end of this report 68
VGI Partners Global Investments (VG1) www.vgipartners.com
• VG1 is managed by VGI Partners; a high conviction global equity manager, managing over $2.0bn of FUM (as at 30 June 2018) for high net worth clients. VG1 is recently incorporated post a ~$550m raise in December 2017.
• VG1 holds a concentrated portfolio of global securities which the manager extensively analyses from a fundamental bottom up perspective. VG1 can also opportunistically short sell low quality businesses that are considered to be structurally challenged, poorly managed or materially overvalued.
• Typically, VG1’s top five positions will constitute 40%-50% of the portfolio’s NAV (currently 39%). Historically, net equity exposure has been >60% (currently 42%).
• The total shareholder return for the year ending 31 March 2019 was 15.4% with pre-tax net asset backing increasing 10.1%. The active return (TSR) was 2.1%.
Fig.117: VG1 overview
Source: IRESS, Bloomberg, Baillieu, Company reports. Figures as at 31 March 2019. Active returns refers to the TSR and NTA
growth relative to that of the comparative index (see chart below).
Fig.118: VG1 TSR vs MSCI World Index (AUD adj.)
Source: Bloomberg, Baillieu
VG1 Snapshot Top Holdings %Price (31 March 2019) $2.40 CME GROUP INC 11.0%Share price range (12 months) $2.12- $2.59 AMAZON.COM INC 9.0%Shares on issue (Mn) 278.6 COLGATE-PALMOLIVE CO 9.0%Market capitalisation ($Mn) $669 MASTERCARD INC - A 7.0%Pre-tax asset backing* $2.28 LINDE PLC 6.0%Post-tax asset backing* $2.20Premium/(Discount) to pre-tax NTA 5.3%Premium/(Discount) to post-tax NTA 9.1%Dividend yield 0.0%Dividend per share (cents) 0.0Franking 100%Management expense ratio 1.50%
Total Shareholder Return 1 Year 3 Year 5 Year NTA Performance 1 Year 3 Year 5 YearVG1 15.4% na na NTA growth 10.1% na naActive return 2.1% na na Active return -3.1% na na
-5
0
5
10
15
20
25
30
Mar-18 May-18 Jul-18 Sep-18 Nov-18 Jan-19 Mar-19MSCI World Index (AUD adjusted) VG1

Baillieu Research 1 May 2019
baillieu.com.au Baillieu Limited ABN 74 006 519 393 Please read the disclaimer at the end of this report 69
WAM Active (WAA) https://wilsonassetmanagement.com.au/
• Incorporated in 2008, WAM Active is managed by Wilson Asset Management International Pty Ltd.
• WAA seeks to provide positive returns in all market conditions and aims to achieve this through exposure to an active trading style portfolio.
• WAA will not incorporate a single investment strategy; rather it aims to utilise short term catalysts such as corporate transactions and takeovers, IPO’s, placements and arbitrage opportunities such as LIC discount arbitrage.
• The total shareholder return for the year ending 31 March 2019 was -2.7% with pre-tax net asset backing increasing 1.4%. The active return (TSR) was -13.9%.
Fig.119: WAA overview
Source: IRESS, Bloomberg, Baillieu, Company reports. Figures as at 31 March 2019. Active returns refers to the TSR and NTA
growth relative to that of the comparative index (see chart below).
Fig.120: WAA TSR vs All Ords Accum. Index
Source: Bloomberg, Baillieu
WAA Snapshot Top HoldingsPrice (31 March 2019) $1.05 AFTERPAY TOUCH G MACQUARIE GROUPShare price range (12 months) $0.95- $1.17 ALTIUM LTD MACQUARIE MEDIAShares on issue (Mn) 46.0 APPEN LTD MCMILLAN SHAKESPMarket capitalisation ($Mn) $48 AUSDRILL LTD NINE ENTERTAINMEPre-tax asset backing* $1.05 CALTEX AUST LTD PENGANA INTERNATPost-tax asset backing* $1.05 CIMIC GROUP LTD PLATINUM ASSETPremium/(Discount) to pre-tax NTA 0.3% COLLINS FOODS LT SEVEN GROUP HOLDPremium/(Discount) to post-tax NTA 0.3% CORPORATE TRAVEL STEADFAST GROUPDividend yield 5.4% IDP EDUCATION LT TEMPLETON GLOBALDividend per share (cents) 5.7 IRESS LTD WORLEYPARSONSFranking 100%Management expense ratio 1.00% **listed in alphabetical order**
Total Shareholder Return 1 Year 3 Year 5 Year NTA Performance 1 Year 3 Year 5 YearWAA -2.7% 4.1% 0.5% NTA growth 1.4% 6.8% 6.1%Active return -13.9% -7.2% -7.0% Active return -9.8% -4.5% -1.4%
-15
-10
-5
0
5
10
15
Mar-18 May-18 Jul-18 Sep-18 Nov-18 Jan-19 Mar-19All Ords Accum. Index WAA

Baillieu Research 1 May 2019
baillieu.com.au Baillieu Limited ABN 74 006 519 393 Please read the disclaimer at the end of this report 70
WAM Capital (WAM) https://wilsonassetmanagement.com.au/
• WAM Capital concentrates primarily on small to medium industrial companies with an objective to deliver a rising stream of fully franked dividends, to provide capital growth and preserve capital. WAM utilises a research driven investment strategy, focusing on fundamental analysis as well as a market driven approach, seeking short-term mispricing opportunities.
• WAM also provides exposure to relative value arbitrage and market mispricing opportunities. WAM is managed by Wilson Asset Management (International) Pty Ltd.
• The total shareholder return for the year ending 31 March 2019 was -4.7% with pre-tax net asset backing increasing 0.3%. The active return (TSR) was -16.0%.
Fig.121: WAM overview
Source: IRESS, Bloomberg, Baillieu, Company reports. Figures as at 31 March 2019. Active returns refers to the TSR and NTA
growth relative to that of the comparative index (see chart below).
Fig.122: WAM TSR vs All Ords Accum. Index
Source: Bloomberg, Baillieu
WAM Snapshot Top HoldingsPrice (31 March 2019) $2.23 AFTERPAY TOUCH G MONADELPHOUS GRPShare price range (12 months) $1.92- $2.52 ALS LTD MYER HOLDINGSShares on issue (Mn) 713.6 AUSTAL LTD PENGANA INTERNATMarket capitalisation ($Mn) $1,591 BRAVURA SOLUTION PSC INSURANCE GRPre-tax asset backing* $1.86 CLEANAWAY WASTE SEVEN GROUP HOLDPost-tax asset backing* $1.88 COLLINS FOODS LT STEADFAST GROUPPremium/(Discount) to pre-tax NTA 20.0% CORPORATE TRAVEL TEMPLETON GLOBALPremium/(Discount) to post-tax NTA 18.6% G8 EDUCATION LTD A2 MILK CO LTDDividend yield 7.0% INVOCARE LTD VIVA ENERGY GROUDividend per share (cents) 15.5 MACQUARIE GROUP VOCUS GROUP LTDFranking 100%Management expense ratio 1.00% **listed in alphabetical order**
Total Shareholder Return 1 Year 3 Year 5 Year NTA Performance 1 Year 3 Year 5 YearWAM -4.7% 6.1% 8.6% NTA growth 0.3% 8.3% 8.5%Active return -16.0% -5.2% 1.2% Active return -10.9% -3.0% 1.0%
-15
-10
-5
0
5
10
15
Mar-18 May-18 Jul-18 Sep-18 Nov-18 Jan-19 Mar-19All Ords Accum. Index WAM

Baillieu Research 1 May 2019
baillieu.com.au Baillieu Limited ABN 74 006 519 393 Please read the disclaimer at the end of this report 71
WAM Research (WAX) https://wilsonassetmanagement.com.au/
• WAM Research (WAX) aims to invest in undervalued small and medium industrial growth companies listed on the ASX. WAX is also managed by Wilson Asset Management (International) Pty Ltd.
• The investment objective is to provide a growing stream of fully franked dividends and to achieve a high real rate of return, comprising both income and capital growth within risk parameters acceptable to the Directors, utilising a fundamental research investment strategy.
• The total shareholder return for the year ending 31 March 2019 was -2.6% with pre-tax net asset backing increasing 1.1%. The active return was -13.8%.
Fig.123: WAX overview
Source: IRESS, Bloomberg, Baillieu, Company reports. Figures as at 31 March 2019. Active returns refers to the TSR and NTA
growth relative to that of the comparative index (see chart below).
Fig.124: WAX TSR vs All Ords Accum. Index
Source: Bloomberg, Baillieu
WAX Snapshot Top HoldingsPrice (31 March 2019) $1.43 ALS LTD INVOCARE LTDShare price range (12 months) $1.21- $1.71 AMA GROUP LTD LINK ADMINISTRATShares on issue (Mn) 190.9 ARISTOCRAT LEISU MONADELPHOUS GRPMarket capitalisation ($Mn) $273 AUSTAL LTD MYER HOLDINGSPre-tax asset backing* $1.17 BRAVURA SOLUTION NONI B LTDPost-tax asset backing* $1.16 CITY CHIC COLLEC PSC INSURANCE GRPremium/(Discount) to pre-tax NTA 21.9% CLEANAWAY WASTE A2 MILK CO LTDPremium/(Discount) to post-tax NTA 23.3% CREDIT CORP GRP VIVA ENERGY GROUDividend yield 6.6% G8 EDUCATION LTD VOCUS GROUP LTDDividend per share (cents) 9.5 INFOMEDIA LTD XERO LTDFranking 100%Management expense ratio 1.00% **listed in alphabetical order**
Total Shareholder Return 1 Year 3 Year 5 Year NTA Performance 1 Year 3 Year 5 YearWAX -2.6% 8.6% 10.3% NTA growth 1.1% 7.2% 8.7%Active return -13.8% -2.7% 2.8% Active return -10.1% -4.1% 1.2%
-15
-10
-5
0
5
10
15
Mar-18 May-18 Jul-18 Sep-18 Nov-18 Jan-19 Mar-19All Ords Accum. Index WAX

Baillieu Research 1 May 2019
baillieu.com.au Baillieu Limited ABN 74 006 519 393 Please read the disclaimer at the end of this report 72
WAM Global (WGB) www.wilsonassetmanagement.com.au/
• WGB is a recently incorporated LIC, listing in Jun-18 following a $465m raise. WGB is the most recent LIC from Wilson Asset Management International’s (WAMI) stable and the group’s first international LIC.
• WGB will employ the typically WAMI investment style (as employed by other WAMI LICs). This process incorporates a two-pronged approach consisting of a research and market driven strategy. When fully invested, WGB is expected to hold between 40-80 securities. Average position sizes can range between 1-5% of the portfolio, and a single position will be reviewed if it obtains a position weighting >20% of the portfolio. WGB has no geographic and sector allocation limits, and currency hedging is permitted (although typically the portfolio will not be hedged).
• The total shareholder return since inception is -11.8%, with pre-tax net asset backing increasing 1.2%. The active return (TSR) is -18.0%.
Fig.125: WGB overview
Source: IRESS, Bloomberg, Baillieu, Company reports. Figures as at 31 March 2019. Active returns refers to the TSR and NTA
growth relative to that of the comparative index (see chart below).
Fig.126: WGB TSR vs All Ords Accum. Index
Source: Bloomberg, Baillieu
WGB Snapshot Top Holdings %Price (31 March 2019) $1.94 ALPHABET INC-C HARRIS CORPShare price range (12 months) $1.85- $2.21 AMERICAN EXPRESS HCA HEALTHCARE IShares on issue (Mn) 211.6 BANDAI NAMCO HOL LOGITECH INTER-RMarket capitalisation ($Mn) $411 BOOKING HOLDINGS NORFOLK SOUTHERNPre-tax asset backing* $2.23 CDW CORP/DE RECKITT BENCKISEPost-tax asset backing* $2.18 CME GROUP INC SS&C TECHNOLOGIEPremium/(Discount) to pre-tax NTA -12.9% DANONE THERMO FISHERPremium/(Discount) to post-tax NTA -10.9% DEUTSCHE BOERSE UNITED TECH CORPDividend yield 0.0% DIAGEO PLC VIVENDIDividend per share (cents) 0.0 ENTERTAINMENT ON WASTE MANAGEMENTFranking 100%Management expense ratio 1.25%
Total Shareholder Return 1 Year* 3 Year 5 Year NTA Performance 1 Year* 3 Year 5 YearWGB -11.8% na na NTA growth 1.2% na naActive return -18.0% na na Active return -5.0% na na
-20
-15
-10
-5
0
5
10
Jun-18 Jul-18 Aug-18 Sep-18 Oct-18 Nov-18 Dec-18 Jan-19 Feb-19 Mar-19MSCI WORLD WGB

Baillieu Research 1 May 2019
baillieu.com.au Baillieu Limited ABN 74 006 519 393 Please read the disclaimer at the end of this report 73
Whitefield (WHF) www.whitefield.com.au
• Formed in 1923, Whitefield is one of Australia’s oldest listed investment companies.
• It provides investors with a diversified exposure to the industrial segment (i.e. no resource companies) of the market with the aim of generating long-term returns.
• Top sector exposures currently include Commercial Banks and Financials (38.8%), Healthcare (10.9%), Industrials (10.1%), Real Estate (9.1%), Cons Discretionary (8.2%) and Cons Staples (7.5%).
• The total shareholder return for the year ending 31 March 2019 was 0.7% with pre-tax net asset backing increasing 6.2%. The active return (TSR) was -7.7%.
Fig.127: WHF overview
Source: IRESS, Bloomberg, Baillieu, Company reports. Figures as at 31 March 2019. Active returns refers to the TSR and NTA
growth relative to that of the comparative index (see chart below).
Fig.128: WHF TSR vs ASX300 Industrial Accum. Index
Source: Bloomberg, Baillieu
WHF Snapshot Top Holdings %Price (31 March 2019) $4.44 COMMONWEALTH BANK OF AUSTRAL 8.9%Share price range (12 months) $4.1- $4.79 CSL LTD 6.7%Shares on issue (Mn) 91.8 WESTPAC BANKING CORP 6.2%Market capitalisation ($Mn) $408 AUST AND NZ BANKING GROUP 5.8%Pre-tax asset backing* $4.92 NATIONAL AUSTRALIA BANK LTD 5.3%Post-tax asset backing* $4.57 WESFARMERS LTD 3.2%Premium/(Discount) to pre-tax NTA -9.8% MACQUARIE GROUP LTD 3.1%Premium/(Discount) to post-tax NTA -2.8% WOOLWORTHS GROUP LTD 3.1%Dividend yield 4.2% TELSTRA CORP LTD 2.6%Dividend per share (cents) 18.8 TRANSURBAN GROUP 2.6%Franking 100%Management expense ratio 0.25%
Total Shareholder Return 1 Year 3 Year 5 Year NTA Performance 1 Year 3 Year 5 YearWHF 0.7% 5.3% 5.1% NTA growth 6.2% 6.3% 5.7%Active return -7.7% -2.9% -2.3% Active return -2.2% -2.0% -1.7%
-10
-5
0
5
10
15
Mar-18 May-18 Jul-18 Sep-18 Nov-18 Jan-19 Mar-19ASX300 Industrials Accum Index WHF

Baillieu Research 1 May 2019
baillieu.com.au Baillieu Limited ABN 74 006 519 393 Please read the disclaimer at the end of this report 74
Westoz Investment Company (WIC) www.westozfunds.com.au
• Westoz Funds, established in 2005, initially focused on investments in Western Australian based companies outside the ASX100. Recently, WIC has invested in companies outside of Western Australian, within the industrial sector.
• The company has stated a policy to pay out a minimum of 50% of realised after tax profits to shareholders by way of dividends.
• The total shareholder return for the year ending 31 March 2019 was -3.9% with pre-tax net asset backing decreasing 2.5%. The active return (TSR) was -15.1%.
Fig.129: WIC overview
Source: IRESS, Bloomberg, Baillieu, Company reports. Figures as at 31 March 2019. Active returns refers to the TSR and NTA
growth relative to that of the comparative index (see chart below).
Fig.130: WIC TSR vs All Ords Accum. Index
Source: Bloomberg, Baillieu
WIC Snapshot Top Holdings %Price (31 March 2019) $1.02 CEDAR WOODS PROPERTIES LTD 9.0%Share price range (12 months) $0.99- $1.21 AUSTRALIS OIL & GAS LTD 7.0%Shares on issue (Mn) 133.2 AUSDRILL LTD 7.0%Market capitalisation ($Mn) $136 FINBAR GROUP LTD 7.0%Pre-tax asset backing* $1.15 MACMAHON HOLDINGS LTD 6.0%Post-tax asset backing* $1.17 COOPER ENERGY LTD 4.0%Premium/(Discount) to pre-tax NTA -11.6% WESTERN AREAS LTD 4.0%Premium/(Discount) to post-tax NTA -12.7% WEST AFRICAN RESOURCES LTD 4.0%Dividend yield 5.9% SOUTHERN CROSS ELECTRICAL 3.0%Dividend per share (cents) 6.0 ORECORP LTD 3.0%Franking 100%Management expense ratio 1.00%
Total Shareholder Return 1 Year 3 Year 5 Year NTA Performance 1 Year 3 Year 5 YearWIC -3.9% 16.4% 3.0% NTA growth -2.5% 12.1% 1.5%Active return -15.1% 5.1% -4.5% Active return -13.7% 0.9% -6.0%
-10
-5
0
5
10
15
Mar-18 May-18 Jul-18 Sep-18 Nov-18 Jan-19 Mar-19All Ords Accum. Index WIC

Baillieu Research 1 May 2019
baillieu.com.au Baillieu Limited ABN 74 006 519 393 Please read the disclaimer at the end of this report 75
WAM Leaders (WLE) https://wilsonassetmanagement.com.au/
• Incorporated in May 2016, WAM Leaders is managed by Wilson Asset Management International (WAMI) Pty Ltd. WAMI also manages WAM, WAX, WMI, WAA and CYA within the LIC space.
• WLE seeks to deliver a stream of fully franked dividends, provide capital growth over the medium-to-long term and preserve capital. The portfolio will predominately comprise of large cap companies within the S&P/ASX 200 Index.
• WLE employs a two-tiered investment process including research driven investing (fundamental bottom up approach) and a market driven approach which seeks to take advantage of short-term relative arbitrages and mispricing opportunities.
• The total shareholder return for the year ending 31 March 2019 was 1.8% with pre-tax net asset backing increasing 7.6%. The active return (TSR) was -10.3%.
Fig.131: WLE overview
Source: IRESS, Bloomberg, Baillieu, Company reports. Figures as at 31 March 2019. Active returns refers to the TSR and NTA
growth relative to that of the comparative index (see chart below).
Fig.132: WLE TSR vs ASX200 Accum. Index
Source: Bloomberg, Baillieu
WLE Snapshot Top HoldingsPrice (31 March 2019) $1.12 AMCOR LTD OZ MINERALS LTDShare price range (12 months) $1.02- $1.25 ARISTOCRAT LEISU RIO TINTO LTDShares on issue (Mn) 782.8 BHP GROUP LTD SOUTH32 LTDMarket capitalisation ($Mn) $877 COMMONW BK AUSTR SUNCORP GROUP LTPre-tax asset backing* $1.20 COMPUTERSHARE LT TELSTRA CORPPost-tax asset backing* $1.19 CSL LTD STAR ENTERTAINMEPremium/(Discount) to pre-tax NTA -6.6% FORTESCUE METALS TREASURY WINE ESPremium/(Discount) to post-tax NTA -5.9% MACQUARIE GROUP WESTPAC BANKINGDividend yield 4.5% NATL AUST BANK WOODSIDE PETRODividend per share (cents) 5.0 NEWCREST MINING WOOLWORTHS GROUPFranking 100%Management expense ratio 1.00% **listed in alphabetical order**
Total Shareholder Return 1 Year 3 Year 5 Year NTA Performance 1 Year 3 Year 5 YearWLE 1.8% na na NTA growth 7.6% na naActive return -10.3% na na Active return -4.5% na na
-10
-5
0
5
10
15
Mar-18 May-18 Jul-18 Sep-18 Nov-18 Jan-19 Mar-19ASX200 Accum. Index WLE

Baillieu Research 1 May 2019
baillieu.com.au Baillieu Limited ABN 74 006 519 393 Please read the disclaimer at the end of this report 76
WAM Microcap (WMI) wilsonassetmanagement.com.au/
• WMI (the company) listed in Jun-16 following a $151m raise (max raise). WMI (at the time) was WAMI’s fourth LIC, but the first specialised LIC focusing on listed ASX companies with a market capitalisation of less than $300m at the time of purchase.
• WMI seeks to provide investors exposure to undervalued growth companies identified using WAMI’s research and market driven investment process. When fully invested, the portfolio is expected to comprise between 20-60 securities, with average position weighting typically between 1-5% (a single position will be reviewed if it obtains a weight greater than 20%). There are no investment limits on industry sector or geography allocations. Short selling is permitted, however it will not exceed 50% of the value of the portfolio without prior board approval.
• The total shareholder return for the year ending 31 March 2019 was -13.0%, with pre-tax net asset backing increasing 3.1%. The active return (TSR) was -24.2%.
Fig.133: WMI overview
Source: IRESS, Bloomberg, Baillieu, Company reports. Figures as at 31 March 2019. Active returns refers to the TSR and NTA
growth relative to that of the comparative index (see chart below).
Fig.134: WMI TSR vs ASX200 Accum. Index
Source: Bloomberg, Baillieu
WMI Snapshot Top Holdings %Price (31 March 2019) $1.24 A2B AUSTRALIA LT PEOPLE INFRASTRUShare price range (12 months) $1.19- $1.51 AUSTRALIAN VINTA PSC INSURANCE GRShares on issue (Mn) 140.5 CITY CHIC COLLEC PWR HOLDINGS LTDMarket capitalisation ($Mn) $174 GENERATION DEVEL QANTM INTELLECTUPre-tax asset backing* $1.26 INFOMEDIA LTD RURALCO HOLDINGSPost-tax asset backing* $1.24 JOHNS LYNG GROUP RHIPE LTDPremium/(Discount) to pre-tax NTA -2.1% MACQUARIE MEDIA SPICERS LTDPremium/(Discount) to post-tax NTA -0.5% NONI B LTD THINK CHILDCAREDividend yield 4.9% PACIFIC ENERGY 360 CAPITAL TOTADividend per share (cents) 6.0 PROPEL FUNERAL P VILLAGE ROADSHOWFranking 100%Management expense ratio 1.00%
Total Shareholder Return 1 Year 3 Year 5 Year NTA Performance 1 Year 3 Year 5 YearWMI -13.0% na na NTA growth 3.1% na naActive return -24.2% na na Active return -8.1% na na
-15
-10
-5
0
5
10
15
Mar-18 May-18 Jul-18 Sep-18 Nov-18 Jan-19 Mar-19ASX ACCUM ALL ORDIN IDX WMI

Baillieu Research 1 May 2019
baillieu.com.au Baillieu Limited ABN 74 006 519 393 Please read the disclaimer at the end of this report 77
8IP Emerging Companies (8EC) www.8ip.asia
• Listing in December 2015, 8EC is managed by Eight Investment Partner. 8EC provides investors access to a concentrated benchmark unaware portfolio (typically between 20 – 30 securities) focusing predominately on securities within the $20m - $500m market cap range.
• 8EC seeks to exploit inefficiencies within the market arising from a number of factors such as lack of broker research and behavioural factors (i.e. over/under reactions to new information). 8EC utilises a three tier conviction scorecard (“A”-“AAA”) to determine portfolio construction.
• The total shareholder return for the year ending 31 March 2019 was -20.9% with pre-tax net asset backing decreasing 16.2%. The active return (TSR) was 12.5%.
Fig.135: 8EC overview
Source: IRESS, Bloomberg, Baillieu, Company reports. Figures as at 31 March 2019. Active returns refers to the TSR and NTA
growth relative to that of the comparative index (see chart below).
Fig.136: 8EC TSR vs ASX Emerging Companies Index
Source: Bloomberg, Baillieu
8EC Snapshot Top Holdings %Price (31 March 2019) $0.68 MEGAPORT LTD 5.4%Share price range (12 months) $0.66- $0.96 GAGE ROADS BREWING CO 4.6%Shares on issue (Mn) 41.0 CITADEL GROUP LTD/THE 4.4%Market capitalisation ($Mn) $28 COOPER ENERGY LTD 3.7%Pre-tax asset backing* $0.88 OVER THE WIRE HOLDINGS LTD 3.6%Post-tax asset backing* $0.89Premium/(Discount) to pre-tax NTA -22.4%Premium/(Discount) to post-tax NTA -23.6%Dividend yield 6.6%Dividend per share (cents) 4.5Franking 100%Management expense ratio 1.25%
Total Shareholder Return 1 Year 3 Year 5 Year NTA Performance 1 Year 3 Year 5 Year8EC -20.9% -6.2% na NTA growth -16.2% -0.6% naActive return -12.5% -14.2% na Active return -7.8% -8.6% na
-30
-25
-20
-15
-10
-5
0
5
10
Mar-18 May-18 Jul-18 Sep-18 Nov-18 Jan-19 Mar-19ASX Emerging Companies Index 8EC

Baillieu Research 1 May 2019
baillieu.com.au Baillieu Limited ABN 74 006 519 393 Please read the disclaimer at the end of this report 78
Appendix – Historical Premium/Discounts for Selected LICs Fig.137: AFI Fig.138: ARG
Source: Bloomberg, IRESS, Baillieu Source: Bloomberg, IRESS, Baillieu
Fig.139: AUI Fig.140: MLT
Source: Bloomberg, IRESS, Baillieu Source: Bloomberg, IRESS, Baillieu
Fig.141: BKI Fig.142: DJW
Source: Bloomberg, IRESS, Baillieu Source: Bloomberg, IRESS, Baillieu
-10%
-5%
0%
5%
10%
15%
0.0
1.0
2.0
3.0
4.0
5.0
6.0
7.0
Premium/Discount NTA Share Price
-15%
-10%
-5%
0%
5%
10%
15%
20%
0.01.02.03.04.05.06.07.08.09.0
Premium/Discount NTA Share Price
-14%-12%-10%-8%-6%-4%-2%0%2%4%6%
0.0
2.0
4.0
6.0
8.0
10.0
12.0
Premium/Discount NTA Share Price
-20%
-15%
-10%
-5%
0%
5%
10%
2.0
2.5
3.0
3.5
4.0
4.5
5.0
5.5
6.0
Premium/Discount NTA Share Price
-20%
-15%
-10%
-5%
0%
5%
10%
15%
0.00.20.40.60.81.01.21.41.61.82.0
Premium/Discount NTA Share Price
-10%
0%
10%
20%
30%
40%
50%
60%
0.0
1.0
2.0
3.0
4.0
5.0
6.0
Premium/Discount NTA Share Price

Baillieu Research 1 May 2019
baillieu.com.au Baillieu Limited ABN 74 006 519 393 Please read the disclaimer at the end of this report 79
Fig.143: DUI
Source: Bloomberg, IRESS, Baillieu
Fig.144: AMH Fig.145: ALF
Source: Bloomberg, IRESS, Baillieu Source: Bloomberg, IRESS, Baillieu
Fig.146: CLF Fig.147: CDM
Source: Bloomberg, IRESS, Baillieu Source: Bloomberg, IRESS, Baillieu
-25%
-20%
-15%
-10%
-5%
0%
5%
0.00.51.01.52.02.53.03.54.04.55.0
Discount/Premium NTA Share Price
-20%
-15%
-10%
-5%
0%
5%
10%
0.0
0.2
0.4
0.6
0.8
1.0
1.2
Premium/Discount NTA Share Price
-40%
-30%
-20%
-10%
0%
10%
20%
30%
0.00.20.40.60.81.01.21.41.61.82.0
Premium/Discount NTA Share Price
-30%-25%-20%-15%-10%-5%0%5%10%15%20%
0.00.20.40.60.81.01.21.41.61.8
Premium/Discount NTA Share Price
-60%-50%-40%-30%-20%-10%0%10%20%30%
0.00.20.40.60.81.01.21.41.61.8
Premium/Discount NTA Share Price

Baillieu Research 1 May 2019
baillieu.com.au Baillieu Limited ABN 74 006 519 393 Please read the disclaimer at the end of this report 80
Fig.148: CIN Fig.149: NSC
Source: Bloomberg, IRESS, Baillieu Source: Bloomberg, IRESS, Baillieu
Fig.150: MIR Fig.151: OZG
Source: Bloomberg, IRESS, Baillieu Source: Bloomberg, IRESS, Baillieu
Fig.152: WHF Fig.153: WAM
Source: Bloomberg, IRESS, Baillieu Source: Bloomberg, IRESS, Baillieu
-30%
-25%
-20%
-15%
-10%
-5%
0%
0.05.0
10.015.020.025.030.035.040.045.0
Premium/Discount NTA Share Price
-50%
-40%
-30%
-20%
-10%
0%
0.00.20.40.60.81.01.21.41.61.82.0
Premium/Discount NTA Share Price
-15%-10%-5%0%5%10%15%20%25%30%
0.0
0.5
1.0
1.5
2.0
2.5
3.0
3.5
Premium/Discount NTA Share Price
-45%-40%-35%-30%-25%-20%-15%-10%-5%0%5%
0.0
0.1
0.1
0.2
0.2
0.3
0.3
Premium/Discount NTA Share Price
-16%
-14%
-12%
-10%
-8%
-6%
-4%
-2%
0%
0.0
1.0
2.0
3.0
4.0
5.0
6.0
Premium/Discount NTA Share Price
-40%
-30%
-20%
-10%
0%
10%
20%
30%
40%
0.0
0.5
1.0
1.5
2.0
2.5
3.0
Premium/Discount NTA Share Price

Baillieu Research 1 May 2019
baillieu.com.au Baillieu Limited ABN 74 006 519 393 Please read the disclaimer at the end of this report 81
Fig.154: WAX Fig.149: WMK
Source: Bloomberg, IRESS, Baillieu Source: Bloomberg, IRESS, Baillieu
Fig.155: PIA Fig.156: MFF
Source: Bloomberg, IRESS, Baillieu Source: Bloomberg, IRESS, Baillieu
Fig.157: PMC Fig.158: TGG
Source: Bloomberg, IRESS, Baillieu Source: Bloomberg, IRESS, Baillieu
-40%
-30%
-20%
-10%
0%
10%
20%
30%
40%
0.00.20.40.60.81.01.21.41.61.8
Premium/Discount NTA Share Price
-30%
-20%
-10%
0%
10%
0.5
0.7
0.9
1.1
1.3
1.5
1.7
Premium/Discount NTA Share Price
-30%
-20%
-10%
0%
10%
20%
0.0
0.5
1.0
1.5
2.0
2.5
3.0
3.5
Premium/Discount NTA Share Price
-20%
-10%
0%
10%
20%
30%
0.0
0.5
1.0
1.5
2.0
2.5
Premium/Discount NTA Share Price
-30%
-25%
-20%
-15%
-10%
-5%
0%
5%
0.5
0.7
0.9
1.1
1.3
1.5
1.7
Premium/Discount NTA Share Price

Baillieu Research 1 May 2019
baillieu.com.au Baillieu Limited ABN 74 006 519 393 Please read the disclaimer at the end of this report 82
Fig.159: ACQ Fig.160: QVE
Source: Bloomberg, IRESS, Baillieu Source: Bloomberg, IRESS, Baillieu
Fig.161: PAF Fig.162: PGF
Source: Bloomberg, IRESS, Baillieu Source: Bloomberg, IRESS, Baillieu
Fig.163: FGX Fig.164: GVF
Source: Bloomberg, IRESS, Baillieu Source: Bloomberg, IRESS, Baillieu
-25%
-20%
-15%
-10%
-5%
0%
0.0
0.2
0.4
0.6
0.8
1.0
1.2
1.4
1.6
Mar-15 Mar-16 Mar-17 Mar-18 Mar-19
Premium/Discount NTA Share Price
-10%
-5%
0%
5%
10%
15%
20%
0.0
0.2
0.4
0.6
0.8
1.0
1.2
1.4
1.6
Mar-15 Mar-16 Mar-17 Mar-18 Mar-19
Premium/Discount NTA Share Price
-20%
-15%
-10%
-5%
0%
5%
10%
15%
0.0
0.2
0.4
0.6
0.8
1.0
1.2
1.4
1.6
Mar-15 Mar-16 Mar-17 Mar-18 Mar-19
Premium/Discount NTA Share Price
-18%
-16%
-14%
-12%
-10%
-8%
-6%
-4%
-2%
0%
0.0
0.2
0.4
0.6
0.8
1.0
1.2
1.4
1.6
Mar-15 Mar-16 Mar-17 Mar-18 Mar-19
Premium/Discount NTA Share Price
-8%-6%-4%-2%0%2%4%6%8%10%
0.0
0.2
0.4
0.6
0.8
1.0
1.2
1.4
1.6
Premium/Discount NTA Share Price
-20%
-15%
-10%
-5%
0%
5%
10%
0.0
0.2
0.4
0.6
0.8
1.0
1.2
1.4
Mar-15 Mar-16 Mar-17 Mar-18 Mar-19
Premium/Discount NTA Share Price

Baillieu Research 1 May 2019
baillieu.com.au Baillieu Limited ABN 74 006 519 393 Please read the disclaimer at the end of this report 83
Fig.165: NCC Fig.166: EGI
Source: Bloomberg, IRESS, Baillieu Source: Bloomberg, IRESS, Baillieu
Fig.167: BTI Fig.168: BAF
Source: Bloomberg, IRESS, Baillieu Source: Bloomberg, IRESS, Baillieu
-20%
-15%
-10%
-5%
0%
5%
10%
15%
20%
0.0
0.2
0.4
0.6
0.8
1.0
1.2
1.4
1.6
Mar-14 Mar-15 Mar-16 Mar-17 Mar-18 Mar-19
Premium/Discount NTA Share Price
-18%
-16%
-14%
-12%
-10%
-8%
-6%
-4%
-2%
0%
0.0
0.2
0.4
0.6
0.8
1.0
1.2
1.4
Mar-16 Dec-16 Sep-17 Jun-18 Mar-19
Premium/Discount NTA Share Price
-40%
-30%
-20%
-10%
0%
10%
20%
0.0
0.2
0.4
0.6
0.8
1.0
1.2
1.4
Mar-16 Sep-16 Mar-17 Sep-17 Mar-18 Sep-18 Mar-19
Premium/Discount NTA Share Price
-35%-30%-25%-20%-15%-10%-5%0%5%10%15%
0.0
0.2
0.4
0.6
0.8
1.0
1.2
1.4
Mar-16 Dec-16 Sep-17 Jun-18 Mar-19
Premium/Discount NTA Share Price

Baillieu Research 1 May 2019
baillieu.com.au Baillieu Limited ABN 74 006 519 393 Please read the disclaimer at the end of this report 84
Pre & post tax discount/premium to NTA Fig.169: Premium/(Discount) to Pre-tax NTA
Source: Bloomberg, Iress, Baillieu
Fig.170: Premium/(Discount) to Post-tax NTA
Source: Bloomberg, Iress, Baillieu
WA
XW
AM
MIR
VG
1PM
CD
JWH
M1
FGG
NC
CFG
XW
AA
GV
FFO
RA
FIW
MK
WM
IM
GG
PL8
ARG PI
CPA
IC
DM
MLT
NG
EC
AM BK
IC
LFC
BC MFF
WLE
PAF
SNC
QV
EA
UI
TGF
PIA
AM
HD
UI
LSF
RYD
WH
FA
PL ALI
PGF
AC
QW
ICG
C1
TGG
WG
BEG
IEA
ISE
CC
IEC
INU
RBN
SCO
ZGN
AC
TOP
LSX
MA
1LR
TA
LF8E
CBA
FBS
TBT
I
-40%
-30%
-20%
-10%
0%
10%
20%
30%
WA
XW
AM
MIR
AFI
MFF
VG
1A
RGM
LTD
UI
PMC
AU
IFG
GH
M1
DJW
FGX
WA
AC
LFBK
IN
CC
CIN
WM
IG
VF
AM
HC
AM
PAI
WH
FPA
FRY
DC
BC PIC
PGF
PL8
WLE
SNC
QV
EA
LIPI
ATG
FA
CQ
NG
EA
PLTG
GW
GB
GC
1W
IC EGI
EAI
TOP
CIE
LSF
CD
MSE
CU
RBN
AC
NSC
OZG BS
TA
LFBA
FM
A1
8EC
BTI
-40%
-30%
-20%
-10%
0%
10%
20%
30%

Baillieu Research 1 May 2019
baillieu.com.au Baillieu Limited ABN 74 006 519 393 Please read the disclaimer at the end of this report 85
1, 3 and 5 year total shareholder return & NTA growth
Fig.171: TSR compound annual growth rate - % over 12 months
Source: Bloomberg, Iress, Baillieu
Fig.172: TSR compound annual growth rate - % over 3 years
Source: Bloomberg, Iress, Baillieu
-40%
-20%
0%
20%
40%
60%
80%
NG
EA
LIM
FFC
BCM
GG
MG
GO
PH VG
1BS
TH
M1
PL8
FGG
CA
MC
LFBA
FRY
DFG
XD
UI
LSX
AU
ID
JW AFI
MLT PIA
MIR
AM
HW
LEA
CQ
ARG GV
FW
HF
BKI
UR
BPI
CTG
GC
INW
AX
MA
1W
AA
TOP
PGF
OZG
SNC
WIC
WA
M BTI
QV
EG
C1
SEC
ALF EG
IN
AC
TGF
EAI
WG
BPA
IC
IEPM
CA
PLW
MI
NC
C8E
CPA
FN
SCFO
RLS
FC
DM
0
0.05
0.1
0.15
0.2
0.25

Baillieu Research 1 May 2019
baillieu.com.au Baillieu Limited ABN 74 006 519 393 Please read the disclaimer at the end of this report 86
Fig.173: TSR compound annual growth rate – % over 5 years
Source: Bloomberg, Iress, Baillieu
-0.1
-0.05
0
0.05
0.1
0.15
0.2
0.25
0.3

Baillieu Research 1 May 2019
baillieu.com.au Baillieu Limited ABN 74 006 519 393 Please read the disclaimer at the end of this report 87
Fig.174: CAGR NTA performance – % return over 12 months
Source: Bloomberg, Iress, Baillieu
Fig.175: CAGR NTA performance – % return over 3 years
Source: Bloomberg, Iress, Baillieu
-40%
-30%
-20%
-10%
0%
10%
20%
30%
40%
LSX
NG
EA
LIM
FFM
GG
BST
CLF
HM
1A
UI
PL8
UR
BV
G1
DU
IM
LT BTI
AFI
ARG BK
IO
PHW
LED
JWFG
GW
HF
AM
HC
BCC
AM
MIR
PIC
PIA
WM
ISE
CC
INSN
CC
IEBA
FG
VF
FGX
WA
AW
GB
WA
XQ
VE
TGG
WA
MM
A1
TOP
TGF
AC
QA
LFW
IC PAI
APL
PGF
NA
CEA
IRY
DPM
CEG
IPA
FG
C1
FOR
NC
CO
ZGN
SCC
DM
8EC
LSF
LRT
XA
OA
I
-10%
-5%
0%
5%
10%
15%
20%
25%
MFF DU
IO
PH RYD
TOP
LSX
WIC AU
IPG
FPA
IC
LFFG
GA
LIA
CQ
TGG
ARG A
FIPM
CW
AM EA
IO
ZGD
JW MLT
SNC
WA
XW
AA
CA
MM
IR PIC
BKI
WH
FA
MH
BAF
QV
EBS
TG
VF
CIE
FGX
CBC
NC
CPA
FC
IN EGI
CD
MPI
AG
C1
MA
1BT
IA
PLN
AC
8EC
ALF
NSC
XA
OA
I

Baillieu Research 1 May 2019
baillieu.com.au Baillieu Limited ABN 74 006 519 393 Please read the disclaimer at the end of this report 88
Fig.176: CAGR NTA performance – % return over 5 years
Source: Bloomberg, Iress, Baillieu
All chart data to 31 March 2019
-10%
-5%
0%
5%
10%
15%
20%

Baillieu Research 1 May 2019
baillieu.com.au Baillieu Limited ABN 74 006 519 393 Please read the disclaimer at the end of this report 89
This document has been prepared and issued by:
Baillieu Limited
ABN 74 006 519 393
Australian Financial Service Licence No. 245421
Participant of ASX Group Participant of NSX Ltd
Analysts’ stock ratings are defined as follows:
Buy: The stock’s total return is expected to increase by at least 10-15 percent from the current share price over the next 12 months.
Hold: The stock’s total return is expected to trade within a range of ±10-15 percent from the current share price over the next 12 months.
Sell: The stock’s total return is expected to decrease by at least 10-15 percent from the current share price over the next 12 months.
Disclosure of potential interest and disclaimer:
Baillieu Limited (Baillieu ) and/or its associates may receive commissions, calculated at normal client rates, from transactions involving securities of the companies mentioned herein and may hold interests in securities of the companies mentioned herein from time to time. Your adviser will earn a commission of up to 55% of any brokerage resulting from any transactions you may undertake as a result of this advice.
When we provide advice to you, it is based on the information you have provided to us about your personal circumstances, financial objectives and needs. If you wish to rely on our advice, it is important that you inform us of any changes to your personal investment needs, objectives and financial circumstances.
If you do not provide us with the relevant information (including updated information) regarding your investment needs, objectives and financial circumstances, our advice may be based on inaccurate information, and you will need to consider whether the advice is suitable to you given your personal investment needs, objectives and financial circumstances. Please do not hesitate to contact our offices if you need to update your information held with us. Please be assured that we keep your information strictly confidential.
No representation, warranty or undertaking is given or made in relation to the accuracy of information contained in this advice, such advice being based solely on public information which has not been verified by Baillieu Limited.
Save for any statutory liability that cannot be excluded, Baillieu Limited and its employees and agents shall not be liable (whether in negligence or otherwise) for any error or inaccuracy in, or omission from, this advice or any resulting loss suffered by the recipient or any other person.
Past performance should not be taken as an indication or guarantee of future performance, and no representation or warranty, express or implied, is made regarding future performance. Information, opinions and estimates contained in this report reflect a judgment at its original date of publication and are subject to change without notice. The price, value of and income from any of the securities or financial instruments mentioned in this report can fall as well as rise. The value of securities and financial instruments is subject to exchange rate fluctuation that may have a positive or adverse effect on the price or income of such securities or financial instruments.
Baillieu Limited assumes no obligation to update this advice or correct any inaccuracy which may become apparent after it is given.
Baillieu Limited ABN 74 006 519 393 Australian Financial Service Licence No. 245421 Participant of ASX Group Participant of NSX Limited www.baillieu.com.au Melbourne (Head Office) Address Level 26, 360 Collins Street Melbourne, VIC 3000 Australia Postal PO Box 48, Collins Street West Melbourne, VIC 8007 Australia Phone +61 3 9602 9222 Facsimile +61 3 9602 2350 Email [email protected] Adelaide Office Address Ground Floor, 226 Greenhill Road, Eastwood SA 5063 Postal PO Box 171 Fullarton SA 5063 Phone +61 8 7074 8400 Facsimile +61 8 8362 3942 Email [email protected] Bendigo Office Address Level 1, 10-16 Forest Street Bendigo, VIC 3550 Postal PO Box 84 Bendigo, VIC 3552 Phone +61 3 4433 3400 Facsimile +61 3 4433 3430 Email [email protected] Geelong Office Address 16 Aberdeen Street Geelong West Vic 3218 Postal PO Box 364 Geelong Vic 3220 Australia Phone +61 3 5229 4637 Facsimile +61 3 4229 4142 Email [email protected] Gold Coast Office Address Suite 202 Level 2, Eastside Building 6 Waterfront Place, Robina QLD 4226 Phone +61 7 5628 2670 Facsimile +61 7 5677 0258 Email [email protected] Newcastle Office Address Level 1, 120 Darby Street Cooks Hill, NSW 2300 Australia Postal PO Box 111 The Junction, NSW 2291 Australia Phone +61 2 4037 3500 Facsimile +61 2 4037 3511 Email [email protected] Perth Office Address Level 9, 216 St Georges Terrace Perth WA 6000 Australia Postal PO Box 7662, Cloisters Square Perth, WA 6850 Australia Phone +61 8 6141 9450 Facsimile +61 8 6141 9499 Email [email protected] Sydney Office Address Level 40, 259 George Street Sydney, NSW 2000 Australia Postal PO Box R1797 Royal Exchange, NSW 1225 Australia Phone +61 2 9250 8900 Facsimile +61 2 9247 4092 Email [email protected]