accident compensation corporation - listed equity holdings at ...
Upload
independentCategory
view
0download
0
Research Journal of Finance and Accounting www.iiste.org
ISSN 2222-1697 (Paper) ISSN 2222-2847 (Online)
Vol.5, No.1, 2014
42
Corporate Governance and Capital Structure Decisions of UK
Listed Real Estate Companies
Precious Angelo Brenni
Post Office Box AF2699, Adenta-Accra, Ghana
Email of author: [email protected]
Abstract
This paper examines how the capital structure decisions of UK listed real estate companies are influenced by
some key corporate governance indicators. Using panel data methodology, it is documented that real estate
companies with larger board sizes and greater CEO remunerations employ less leverage. There is also weak
evidence showing a negative relationship between the proportion of outside directors and the level of leverage
used. Additionally, there is evidence to show that there is generally no difference between REITs and Non-
REITs regarding their respective leverage levels. This indicates that UK REITs may be highly geared contrary to
expectations of lower debt levels. Overall, the results are relevant as they demonstrate that corporate governance
impacts crucial corporate policy decisions such as those relating to capital structure even for such a unique
industry as real estate.
Keywords: Corporate Governance, Capital Structure, Real Estate Companies, UK
1. Introduction
The concept of corporate governance largely stems from Jensen and Meckling (1976) who posit that the
separation of ownership and control functions in firms results in conflicts of interest (agency costs) between
shareholders and managers. The usage of leverage has been highlighted in the empirical literature as a way of
alleviating these agency costs. For instance, more leverage decreases equity financing which in turn reduces the
scope of the shareholder-manager conflict (Jensen and Meckling, 1976); increases the risk of bankruptcy thereby
encouraging managers to reduce benefits whilst being more efficient (Grossman and Hart, 1982) and curbs the
managerial free cash flow problem due to the regular interest payments on debt (Jensen, 1986).
In terms of leverage maturity however, short-term debt reduces the amount of ‘free cash’ available to managers
and acts as an effective control tool of their behavior (see for instance Stulz, 2000; Datta et al., 2005) whereas
long-term debt acts against empire building by managers (Hart and Moore, 1995). Managerial self-interest is
often brought to the fore in both leverage and leverage maturity decisions owing to the fact that these decisions
are at their discretion (Harford et al., 2008). For instance, managers with lower stock ownership incentives have
a preference for long-term debt (Datta et al., 2005) whilst entrenched managers finance with long-term debt as a
way of avoiding liquidation (Benmelech, 2006).
In line with the above, this study investigates how certain corporate governance indicators influence leverage
choices. Specifically, the individual relationships between board size, board independence, CEO duality, CEO
tenure, CEO remuneration and leverage decisions of 26 UK listed real estate companies are examined over a 10-
year (2000-2009) period. In direct contrast to listed companies from other sectors, on which many studies have
been undertaken, listed real estate companies make an interesting corporate governance research field owing to
their unique governance structure (see for instance Feng et al., 2005). This ‘uniqueness’ is due in part to the
distinctiveness of the real estate asset class and the special regulatory requirements that go with listed real estate
vehicles such as REITs (see for instance Sagalyn, 1996).
The problem to investigate is whether corporate governance indeed has an impact on leverage choices as
traditionally, real estate companies are highly geared with huge investments in landed property serving as
collateral for debt financing. There is a variation for Real Estate Investment Trusts (REITs) however, who
ideally should have no incentive to issue debt. The introduction of the UK REIT regime on 1 January 2007 has
culminated in the assumption of REIT status by some UK listed property companies with the benefit of assuming
a tax-exempt status upon distributing 90% of their pre-tax income as investor dividends. This feature, according
to Feng et al. (2007), annuls two key benefits of debt: the loss of tax-deductibility benefits of interest payments
and impact on alleviating the agency costs of free cash flow. This should imply lower leverage levels for REITs
but contrarily, Feng et al. (2007) report that over 50% of REIT financing at Initial Public Offerings (IPO) is debt,
rising to more than 65% in 10 years. Also, ownership and asset restrictions discourage hostile takeovers and
create incentives for poor managerial decision-making, increasing the need for board monitoring (Feng et al.,
2005). With such high levels of leverage for real estate firms in general and considerable room for managerial
‘misbehaviour’, it is expedient to examine the role corporate boards play in making crucial decisions such as
those pertaining to leverage.
This paper contributes to the extant literature in the following ways: Firstly, it involves the hand-collection of a

Research Journal of Finance and Accounting www.iiste.org
ISSN 2222-1697 (Paper) ISSN 2222-2847 (Online)
Vol.5, No.1, 2014
43
new corporate governance database for UK real estate companies, which serves as a valuable input for further
studies within this field. Secondly, to the best of our knowledge, this study is the first of this kind to be carried
out on the UK listed property market. Finally, this study provides empirical backing for agency theory by
showing that a relationship exists between corporate governance and leverage decisions even for a unique
industry such as real estate.
The remainder of this paper is organised as follows: Section 2 reviews the subject matter literature and states the
hypotheses. In Section 3, the methodology for the study is discussed. Section 4 reports results of the data
analysis whilst Section 5 concludes the study.
2. Literature Review and Hypotheses
Following the corporate scandals of recent times such as those at Enron, WorldCom and Adelphia, corporate
governance has become a major area of concern for firms in a bid to chiefly regulate board activities so as to
improve upon the governance quality of firms. Boyd(1996) details the classic corporate governance structure for
UK listed companies showing a chain of accountability between and amongst the board of directors,
shareholders, CEO, management and the auditor. The importance of corporate boards notwithstanding, the
empirical literature reveals mixed results with respect to the influence of certain board characteristics on leverage
choices:
By relating board size to leverage, Berger et al. (1997) argue that a larger board size leads to strong pressure in
the board room to pursue lower leverage as a way of enhancing firm performance hence an inverse relationship
between the two. Contrarily, Abor (2007) finds a positive relationship arguing that large board sizes lead to
conflicts in decision-making which weaken corporate governance and lead to the pursuit of high leverage.
Board independence measures the proportion of external directors on a firm’s board. Pfeffer (1973) and Pfeffer
and Salancik (1978) illustrate that external directors help a firm to guard against the external environment,
uncertainties and enhance its fund raising abilities. In this regard, Berger et al. (1997) and Abor (2007) find a
positive relationship between the percentage of non-executive directors on a board and leverage. On the contrary,
Wen et al. (2002) and Kyereboah-Coleman and Biekpe (2006), for short-term debt, report a negative relationship.
CEO tenure refers to the number of years the CEO serves in that position. Berger et al. (1997) reveal an inverse
relationship between CEO tenure and leverage (market value). They opine that entrenched CEOs pursue lower
leverage to reduce the performance pressures associated with high debt usage. Ghosh et al. (2010) also show that
CEOs of REITs with long tenure of office, have a preference for less leverage to minimize their personal risk
associated with bankruptcy and the loss of prestige. Wen et al. (2002) similarly report an inverse relationship.
Managers with good fixed compensation have a tendency to pursue lower leverage as way of avoiding the
financial risk of debt so as to maintain their jobs and attractive compensation (Harris and Raviv, 1988; Stulz,
1988). Friend and Hasbrouck (1988) and Friend and Lang (1988) similarly report a negative relationship
between fixed compensation and leverage whereas Jensen and Meckling (1976), Leland and Pyle (1977) and
Berger et al. (1997) discover a positive relationship.
CEO duality indicates a situation where the CEO is also the board chairperson. CEO duality “signals the absence
of decision management and decision control…” (Fama and Jensen, 1983, p. 314). Fama and Jensen (1983) state
that individual decision agents can be engaged in managing (initiation and implementation) some decisions and
controlling (ratification and monitoring) others, but no individual agent must exercise exclusive management and
control rights over the same decisions. Abor (2007) also reports a positive relationship between CEO duality and
leverage whereas Fosberg (2004) and Kyereboah-Coleman and Biekpe (2006), for short-term debt, point to a
negative relationship.
By constructing a board index to reflect the strength of corporate boards, Harford et al. (2008) report that strong
boards (better governance quality), particularly director power, are positively related to leverage and negatively
related to long-term debt. La Porta et al. (2000) show via the ‘substitution hypothesis’ that weaker governance is
associated with more leverage due to a greater need for firms to establish a reputation for not taking over
shareholder wealth. Using the G-index developed by Gompers et al. (2003), Litov (2005) finds that firms with
the weakest shareholder rights use more leverage and have a higher propensity to engage in conglomerating
mergers.
Hypotheses
It is argued that a large board size leads to strong pressure in the board room to pursue lower leverage as a way
of enhancing firm performance (Berger et al., 1997; Wen et al., 2002). In line with this reasoning, it is proposed
that:
H1: Board size is negatively related to leverage.
Pfeffer (1973) and Pfeffer and Salancik (1978), from the resource dependence perspective, illustrate that external
directors help a firm to guard against the external environment, uncertainties and also enhance its fund raising

Research Journal of Finance and Accounting www.iiste.org
ISSN 2222-1697 (Paper) ISSN 2222-2847 (Online)
Vol.5, No.1, 2014
44
abilities, whilst improving upon its status. This suggests a direct relationship between the proportion of non-
executive directors and leverage hence:
H2: Board independence is positively related to leverage.
As an effective decision control measure, Fama and Jensen (1983) state that individual decision agents can be
engaged in managing (initiation and implementation) some decisions and controlling (ratification and monitoring)
others, but no individual agent must exercise exclusive management and control rights over the same decisions.
In line with this, a two-tier board structure (where CEO is not chairperson) may translate into prudent decision-
making including restricting debt to below risk levels therefore:
H3: A two-tier board structure (CEO duality) is negatively related to leverage.
Entrenched CEOs tend to pursue lower leverage to reduce the performance pressures associated with high debt
usage and to minimize bankruptcy risk (Berger et al., 1997; Ghosh et al., 2010). This leads to the hypothesis that:
H4: CEO tenure is negatively related to leverage.
Harris and Raviv (1988) and Stulz (1988) posit that managers with good fixed compensations tend to pursue
lower leverage as way of avoiding the financial risk of debt so as to maintain their jobs and attractive
compensation. In line with their reasoning, a proposal is made that:
H5: CEO remuneration is negatively related to leverage.
3. Methodology
Data & Variables
Corporate governance data on a sample of 26 real estate companies (14 REITs and 12 Non-REITs) listed on the
London Stock Exchange (LSE) for the period 2000-2009 is collected, for which an unbalanced panel of 231
observations is realized. With the UK REIT regime being introduced only in 2007, the 14 sampled REITs are
treated as Non-REITs in the years preceding their assumption of REIT status.
Data on the corporate governance characteristics (independent variables) namely board size, number of non-
executive directors, CEO tenure, CEO remuneration, and CEO duality are hand-collected from the annual reports
of the companies in question. However, company financials such as fixed assets, total assets, leverage ratios,
annual depreciation, operating profit and capital expenditure (CAPEX) are extracted from Bloomberg.
Leverage, which is the dependent variable, is given by the ratio of total debt to total assets (TD/TA). However,
for robustness, three other leverage ratios are used: total debt to total capital, long-term debt to total capital, and
EBIT to interest expense (see Rajan and Zingales, 1995). To help address model specification issues, some major
determinants of capital structure are employed as control variables. These are firm size, asset tangibility,
profitability, volatility, growth opportunities, and non-debt tax shield.
Model Specification
The results of a Hausman specification test conducted indicate that a Random Effects Model represents the data
best (Appendix IV). The model is expressed as follows:
TD/TA it = α + β1BSizeit + β2BIndpit + β3CEODualit + β4LnCEOTenuit + β5LnCEORemuit + β6Tangit + β7Sizeit
+ β8Profit + β9Voltit + β10NDTaxShldit + β11Grthit + zit
where TD/TA is the ratio of total debt to total assets; α represents the common mean value; BSize is the board
size (measured by the number of directors on the board); BIndp is board independence (given by the percentage
of non-executive directors on the board); CEODual is CEO duality (a dummy variable which takes on a value of
1 if the CEO is not the board chairperson and 0 otherwise). LnCEOTenu represents the natural logarithm of CEO
tenure (the number of years the CEO serves in that capacity) and LnCEORemu stands for the natural logarithm
of CEO remuneration (comprising CEO salary, bonus and allowances but excluding pension benefits). The six
control variables representing leverage determinants are defined as follows: Tang represents asset tangibility
(given by the ratio of fixed assets to total assets); Size is firm size (measured as the natural logarithm of total
assets); Prof is for profitability (defined as the ratio of operating profit to total assets); Volt measures volatility
(given as the standard deviation of percentage changes in operating profit); NDTaxshld stands for non-debt tax
shield (captured by the ratio of depreciation expense to total assets) and Grth is for growth opportunities (given
as CAPEX over total assets). The composite error term is represented by zit., comprising the firm-specific (ui)
and combined cross-section and time-series (εit) error components (i.e. zit. = ui +ε it ).
4. Results of Data Analysis
Descriptive Statistics
Summary statistics of the dependent and independent variables are presented in Table 1. Board size (bsize)
ranges from a high of 16 to a low of 3, with a mean number of approximately 9. Figure 1 shows that the board
size distribution is nearly symmetrical. The minimum and maximum number of non-executive directors (nedirs)
on the board is 1 and 9 respectively.

Research Journal of Finance and Accounting www.iiste.org
ISSN 2222-1697 (Paper) ISSN 2222-2847 (Online)
Vol.5, No.1, 2014
45
Figure 1. Histogram of Board Size
On average, the number of non-executive directors is nearly 5. This is strongly in line with the Cadbury
Committee report of 1992 which advocates a minimum number of 3 non-executive directors on a firm’s board.
The proportion of outside directors on the board is a maximum of 86% and a minimum of 20%. An average of
about 52% however indicates a marginally higher proportion of outside directors on most boards. The longest
CEO duration in office is 33 years and the shortest is a year. The mean CEO tenure in office is 10 years. The
highest paid CEO receives £3,260,000 whereas the lowest paid receives £10,625. The average CEO
remuneration is £623,113. CEO duality, which measures whether a CEO also doubles as the board chairperson,
indicates that only about 8% of CEOs also serve as board chairpersons. This shows that most boards have a two-
tier structure. Again this largely represents compliance with the Cadbury Committee report of 1992 which
recommends that the CEO and chairperson roles be separately performed.
About 17% of the observations are for firms with the REIT status. The fixed asset to total asset ratio is quite high
on the average, approximately 75.79%. This lends credence to the assertion that real estate companies have a
high proportion of fixed assets. Firm size, given by the natural logarithm of total assets, posts 6.83, 3.40, and
9.85 as the approximate mean, minimum, and maximum values respectively. Profitability is not so impressive
with some firms reporting negative results, the lowest being -24.02%. The maximum (mean) profitability
reported is 10.52% (3.59%). Volatility takes on an average value of about 0.70 whereas the non-debt tax shield
shows little variability with a high of 2.69% and a low of 0%, indicating the disregard for depreciation expense
by some of the firms. Growth opportunities are minimal, with a mean of 7.45%. However, a maximum of
60.95% and a minimum of 7.60% are also reported.
15.0010.005.00
BoardSize
50
40
30
20
10
0
Frequency
Mean =8.6061
Std. Dev. =2.32674
N =231
Research Journal of Finance and Accounting www.iiste.org
ISSN 2222-1697 (Paper) ISSN 2222-2847 (Online)
Vol.5, No.1, 2014
46
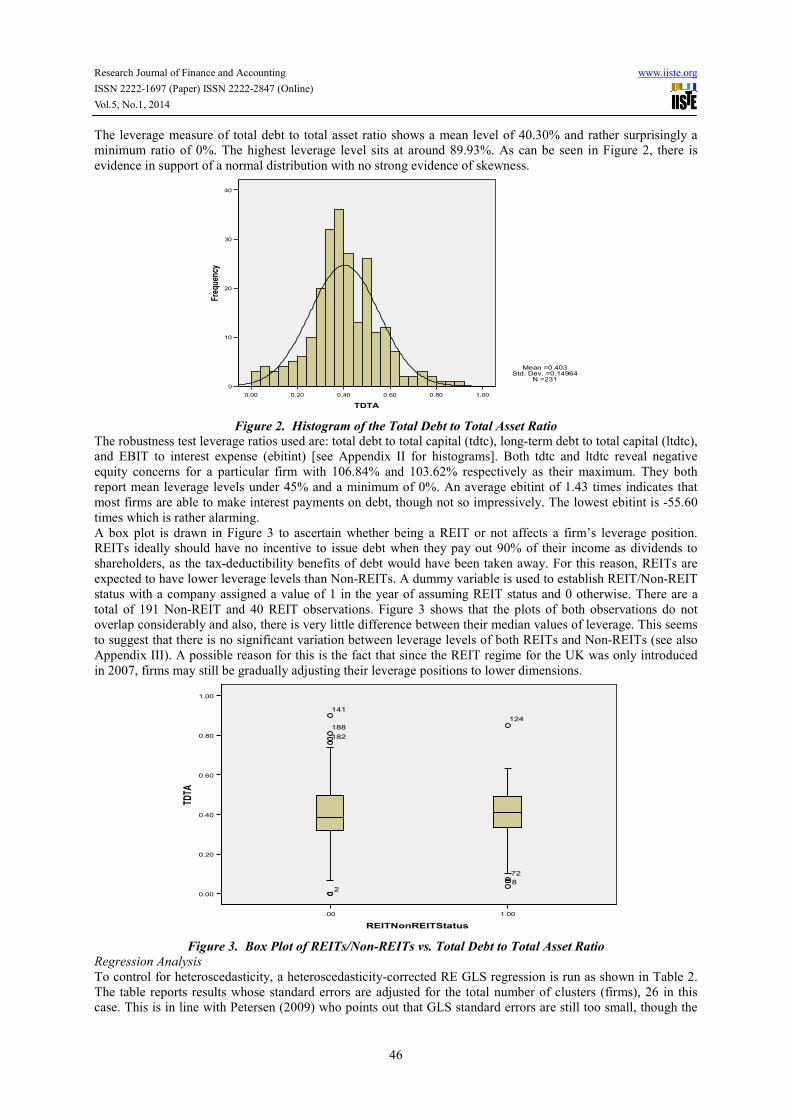
The leverage measure of total debt to total asset ratio shows a mean level of 40.30% and rather surprisingly a
minimum ratio of 0%. The highest leverage level sits at around 89.93%. As can be seen in Figure 2, there is
evidence in support of a normal distribution with no strong evidence of skewness.
Figure 2. Histogram of the Total Debt to Total Asset Ratio
The robustness test leverage ratios used are: total debt to total capital (tdtc), long-term debt to total capital (ltdtc),
and EBIT to interest expense (ebitint) [see Appendix II for histograms]. Both tdtc and ltdtc reveal negative
equity concerns for a particular firm with 106.84% and 103.62% respectively as their maximum. They both
report mean leverage levels under 45% and a minimum of 0%. An average ebitint of 1.43 times indicates that
most firms are able to make interest payments on debt, though not so impressively. The lowest ebitint is -55.60
times which is rather alarming.
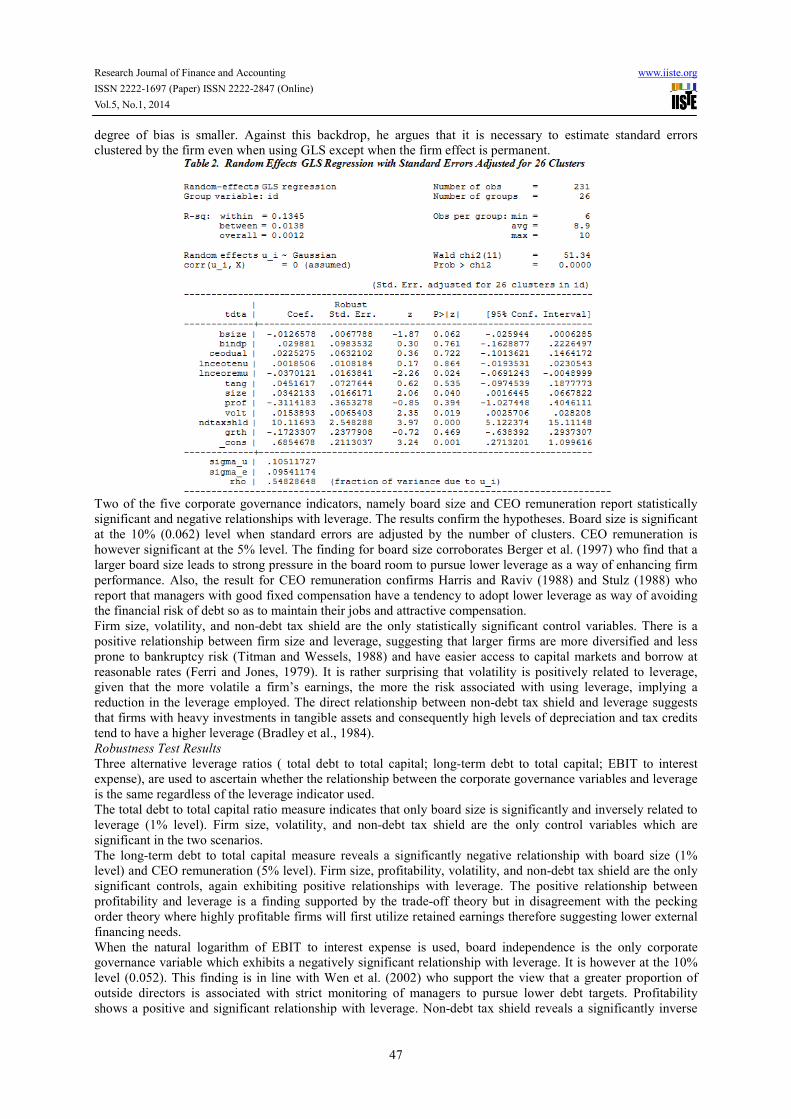
A box plot is drawn in Figure 3 to ascertain whether being a REIT or not affects a firm’s leverage position.
REITs ideally should have no incentive to issue debt when they pay out 90% of their income as dividends to
shareholders, as the tax-deductibility benefits of debt would have been taken away. For this reason, REITs are
expected to have lower leverage levels than Non-REITs. A dummy variable is used to establish REIT/Non-REIT
status with a company assigned a value of 1 in the year of assuming REIT status and 0 otherwise. There are a
total of 191 Non-REIT and 40 REIT observations. Figure 3 shows that the plots of both observations do not
overlap considerably and also, there is very little difference between their median values of leverage. This seems
to suggest that there is no significant variation between leverage levels of both REITs and Non-REITs (see also
Appendix III). A possible reason for this is the fact that since the REIT regime for the UK was only introduced
in 2007, firms may still be gradually adjusting their leverage positions to lower dimensions.
Figure 3. Box Plot of REITs/Non-REITs vs. Total Debt to Total Asset Ratio
Regression Analysis
To control for heteroscedasticity, a heteroscedasticity-corrected RE GLS regression is run as shown in Table 2.
The table reports results whose standard errors are adjusted for the total number of clusters (firms), 26 in this
case. This is in line with Petersen (2009) who points out that GLS standard errors are still too small, though the
1.000.800.600.400.200.00
TDTA
40
30
20
10
0
Frequency
Mean =0.403
Std. Dev. =0.14964
N =231
1.00.00
REITNonREITStatus
1.00
0.80
0.60
0.40
0.20
0.00
TDTA
124
72
8
141
188
182
2
Research Journal of Finance and Accounting www.iiste.org
ISSN 2222-1697 (Paper) ISSN 2222-2847 (Online)
Vol.5, No.1, 2014
47
degree of bias is smaller. Against this backdrop, he argues that it is necessary to estimate standard errors
clustered by the firm even when using GLS except when the firm effect is permanent.
Two of the five corporate governance indicators, namely board size and CEO remuneration report statistically
significant and negative relationships with leverage. The results confirm the hypotheses. Board size is significant
at the 10% (0.062) level when standard errors are adjusted by the number of clusters. CEO remuneration is
however significant at the 5% level. The finding for board size corroborates Berger et al. (1997) who find that a
larger board size leads to strong pressure in the board room to pursue lower leverage as a way of enhancing firm
performance. Also, the result for CEO remuneration confirms Harris and Raviv (1988) and Stulz (1988) who
report that managers with good fixed compensation have a tendency to adopt lower leverage as way of avoiding
the financial risk of debt so as to maintain their jobs and attractive compensation.
Firm size, volatility, and non-debt tax shield are the only statistically significant control variables. There is a
positive relationship between firm size and leverage, suggesting that larger firms are more diversified and less
prone to bankruptcy risk (Titman and Wessels, 1988) and have easier access to capital markets and borrow at
reasonable rates (Ferri and Jones, 1979). It is rather surprising that volatility is positively related to leverage,
given that the more volatile a firm’s earnings, the more the risk associated with using leverage, implying a
reduction in the leverage employed. The direct relationship between non-debt tax shield and leverage suggests
that firms with heavy investments in tangible assets and consequently high levels of depreciation and tax credits
tend to have a higher leverage (Bradley et al., 1984).
Robustness Test Results
Three alternative leverage ratios ( total debt to total capital; long-term debt to total capital; EBIT to interest
expense), are used to ascertain whether the relationship between the corporate governance variables and leverage
is the same regardless of the leverage indicator used.
The total debt to total capital ratio measure indicates that only board size is significantly and inversely related to
leverage (1% level). Firm size, volatility, and non-debt tax shield are the only control variables which are
significant in the two scenarios.
The long-term debt to total capital measure reveals a significantly negative relationship with board size (1%
level) and CEO remuneration (5% level). Firm size, profitability, volatility, and non-debt tax shield are the only
significant controls, again exhibiting positive relationships with leverage. The positive relationship between
profitability and leverage is a finding supported by the trade-off theory but in disagreement with the pecking
order theory where highly profitable firms will first utilize retained earnings therefore suggesting lower external
financing needs.
When the natural logarithm of EBIT to interest expense is used, board independence is the only corporate
governance variable which exhibits a negatively significant relationship with leverage. It is however at the 10%
level (0.052). This finding is in line with Wen et al. (2002) who support the view that a greater proportion of
outside directors is associated with strict monitoring of managers to pursue lower debt targets. Profitability
shows a positive and significant relationship with leverage. Non-debt tax shield reveals a significantly inverse

Research Journal of Finance and Accounting www.iiste.org
ISSN 2222-1697 (Paper) ISSN 2222-2847 (Online)
Vol.5, No.1, 2014
48
relationship with leverage, a result supported by DeAngelo and Masulis (1980) who argue that tax deductions for
depreciation and investment tax credits are substitutes for the interest tax shield benefits of debt financing.
5. Conclusion
This paper examines the relationship between key corporate governance indicators and capital structure
(leverage) decisions of UK listed real estate companies. The hypotheses show that board size, a two-tier board
structure (CEO duality), CEO tenure and CEO remuneration are all negatively correlated with leverage whereas
the proportion of non-executive directors (board independence) is positively related to leverage.
Employing the total debt to total asset ratio as the leverage measure of choice, it is discovered that board size and
CEO remuneration have a significantly negative relationship with leverage. These results are consistent with
Berger et al. (1997) who discover that larger boards are associated with enormous pressure in the board room to
pursue lower leverage targets as a performance enhancement measure and with Harris and Raviv (1988) and
Stulz (1988) who show that CEOs that enjoy good remuneration have a tendency to use lower leverage as way of
avoiding the financial risk of debt and also as a way of maintaining their jobs and attractive compensation.
Three alternative leverage ratios: total debt to total capital, long-term debt to total capital, and the natural
logarithm of EBIT to interest expense are used to check robustness of results. Using the total debt to total capital
ratio, only board size posts a significant relationship with leverage, and a negative one at that. For the long-term
debt to total capital ratio, board size and CEO remuneration both exhibit a significant and inverse relationship
with the leverage. However, the natural log of EBIT to interest measure yields a significantly positive
relationship with board independence.
Also, the research surprisingly reveals that there is no marked difference between leverage levels for both REITs
and Non-REITs. This is more pronounced when the total debt to total capital and long-term debt to total capital
ratio measures of leverage are employed (see Appendix V). This finding possibly suggests that since the UK
REIT regime is in its ‘infancy’ compared to more established REIT markets like the US and Australia and as
such, it may take some more time for the leverage levels to be adjusted downwards to reflect the REIT feature
and associated benefits.
Overall, this study highlights board size and CEO remuneration as key corporate governance variables that
influence leverage decisions of UK listed real estate companies. This paper also makes a notable contribution to
the empirical literature by hand-collecting a new corporate governance database for UK real estate companies.
This could serve as a valuable input for devising a corporate governance index for the UK listed real estate
industry.
References
Abor, J. (2007). Corporate Governance and Financing Decisions of Ghanaian Listed Firms, Corporate
Governance, Vol. 7(1), pp. 83-92.
Benmelech, E. (2006). Managerial Entrenchment and Debt Maturity: Theory and Evidence, Harvard University
Working Paper.
Berger, P.G., Ofek, E. and Yermack, D.L. (1997). Managerial Entrenchment and Capital Structure Decisions,
Journal of Finance, Vol. 52(4), pp. 1411-1438.
Boyd, C. (1996). Ethics and Corporate Governance: The Issues Raised by the Cadbury Report in the United
Kingdom, Journal of Business Ethics, Vol. 15(2), pp. 167-182.
Bradley, M., Jarrell, G.A. and Kim, E.H. (1984). On the Existence of an Optimal Capital Structure: Theory and
Evidence, Journal of Finance, Vol. 39(3), pp. 857-878.
Cadbury Report (1992). The Financial Aspects of Corporate Governance, Gee and Co. Ltd., London.
Datta, S., Iskandar-Datta, M. and Raman, K. (2005). Managerial Stock Ownership and the Maturity Structure of
Corporate Debt, Journal of Finance, Vol. 60(5), pp. 2333-2350.
DeAngelo, H. and Masulis, R. (1980). Optimal Capital Structure under Corporate and Personal Taxation,
Journal of Financial Economics, Vol. 8(1), pp. 3-29.
Fama, E. and Jensen, M. (1983). Separation of Ownership and Control, Journal of Law and Economics, Vol.
26(2), pp. 301-325.
Feng, Z., Ghosh, C. and Sirmans, C.F. (2005). How Important is the Board of Directors to REIT Performance?,
Journal of Real Estate Portfolio Management, Vol. 11(3), pp. 281-293.
Feng, Z., Ghosh, C. and Sirmans, C.F. (2007). On the Capital Structure of Real Estate Investment Trusts(REITs),
Journal of Real Estate Finance and Economics, Vol.34(1), pp. 81-105.
Ferri, M. and Jones, W. (1979). Determinants of Financial Structure: A New Methodological Approach, Journal
of Finance, Vol. 34(3), pp. 631-644.
Fosberg, R.H. (2004). Agency Problems and Debt Financing: Leadership Structure Effects, Corporate
Governance, Vol. 4(1), pp. 31-38.

Research Journal of Finance and Accounting www.iiste.org
ISSN 2222-1697 (Paper) ISSN 2222-2847 (Online)
Vol.5, No.1, 2014
49
Frank, M.Z. and Goyal, V.K. (2003). Testing the Pecking Order Theory of Capital Structure, Journal of
Financial Economics, Vol. 67(2), pp. 217–248.
Friend, I. and Hasbrouck, J. (1988). Determinants of Capital Structure, Research in Finance, Vol. 7(1), pp. 1-19.
Friend, I. and Lang, L.H.P. (1988). An Empirical Test of the Impact of Managerial Self-Interest on Corporate
Capital Structure, Journal of Finance, Vol. 43(2), pp. 271-281.
Ghosh, C., Giambona, E., Harding, J.P. and Sirmans, C.F. (2010). How Entrenchment, Incentives and
Governance Influence REIT Capital Structure, Journal of Real Estate Finance and Economics, Available online
at Springerlink.com.
Gompers, P., Ishii, J. and Metrick, A. (2003). Corporate Governance and Equity Prices, Quarterly Journal of
Economics, Vol. 118(1), pp. 107-155.
Harford, J., Li, K. and Zhao, X. (2008). Corporate Boards and the Leverage and Debt Maturity Choices,
International Journal of Corporate Governance, Vol. 1(1), pp. 3-27.
Harris, M. and Raviv, A. (1988). Corporate Control Contests and Capital Structure, Journal of Financial
Economics, Vol. 20, pp. 55-86.
Hart, O. and Moore, J. (1995). Debt and Seniority: An Analysis of Hard Claims in Constraining
Management, American Economic Review, Vol. 85(3), pp. 567-585.
Hausman, J. (1978). Specification Tests in Econometrics, Econometrica, Vol. 46(6), pp. 1251-1271.
Jensen, M. C. and Meckling, W. H. (1976). Theory of the Firm: Managerial Behavior, Agency Costs, and
Capital Structures, Journal of Financial Economics, Vol.3(4), pp. 305–360.
Jensen, M. C. (1986). Agency Costs of Free Cash Flow, Corporate Finance, and Takeovers, American Economic
Review, Vol. 76(2), pp. 323–339.
Kyereboah-Coleman, A. and Biekpe, N. (2006). Corporate Governance and Financing Choices of Firms: A Panel
Data Analysis. South African Journal of Economics, Vol. 74(4), pp. 670-681.
La Porta, R., Lopez-de-Silanes, F., Shleifer, A. and Vishny, R. (2000). Agency Problems and Dividend Policy
around the World, Journal of Finance, Vol. 55(1), pp. 1-33.
Leland, H. and Pyle, D. (1977). Information Asymmetries, Financial Structure, and Financial Intermediation,
Journal of Finance, Vol. 32(2), pp. 371–387.
Litov, L.P. (2005). Corporate Governance and Financing Policy: New Evidence, Working Paper, New York
University.
Metrick, A. and Ishii, J. (2002). Firm-Level Corporate Governance, Paper presented at the Global Corporate
Governance Forum Research Network Meeting, 5 April, pp. 1-8.
Petersen, M.A. (2009). Estimating Standard Errors in Finance Panel Data Sets: Comparing Approaches, Review
of Financial Studies, Vol. 22(1), pp. 435-480.
Pfeffer, J. (1973). Size, Composition and Function of Corporate Boards of Directors: The Organisation-
Environment Linkage, Administrative Science Quarterly, Vol. 18(3), pp. 349-364.
Pfeffer, J. and Salancik, G.R. (1978). The External Control of Organizations: A Resource-Dependence
Perspective, Harper & Row, New York, NY.
Rajan, R.G. and Zingales, L. (1995). What do we Know about Capital Structure? Some Evidence from
International Data, Journal of Finance, Vol. 50(5), pp. 1421-1460.
Sagalyn, L.B. (1996). Conflicts of Interest in the Structure of REITS, Real Estate Finance, Vol. 13(2), pp. 34-51.
Shleifer, A. and Vishny, R.W. (1997). A Survey of Corporate Governance, The Journal of Finance, Vol. 52(2),
pp.737-783.
Stulz, R. (1988). Managerial Control of Voting Rights: Financing Policies and the Market for Corporate Control,
Journal of Financial Economics, Vol. 20, pp. 25-54.
Titman, S. and Wessels, R. (1988). The Determinants of Capital Structure Choice, Journal of Finance, Vol.
43(1), pp. 1-19.
Wen, Y., Rwegasira, K. and Bilderbeek, J. (2002). Corporate Governance and Capital Structure Decisions of
Chinese Listed Firms, Corporate Governance: An International Review, Vol. 10(2), pp. 75-83.

Research Journal of Finance and Accounting www.iiste.org
ISSN 2222-1697 (Paper) ISSN 2222-2847 (Online)
Vol.5, No.1, 2014
50
Appendix
I: Average Figures of Hand-Collected Corporate Governance Characteristics Company Years Board Size Non-Executive
Directors
CEO Tenure
(yrs.)
CEO
Remuneration
( £ )
CEO Duality
(1 if CEO is
board chair, 0
otherwise)
Big Yellow 2001 - 2009 8 3 7 242,664 1
British Land 2000 - 2009 11 5 17 1,138,385 0 (2000-2004)
1 (2005-2009)
Derwent London 2000 - 2008 10 4 20 771,667 1
Great Portland 2000 - 2009 9 5 4.5 646,400 1
Hammerson 2003 - 2009 11 6 7 622,571 1
Liberty
International
2000 - 2009 14 8 12.5 611,194 1
Land Securities 2000 - 2009 11 6 4 874,500 1
Mucklow 2003 - 2009 6 3 4.3 235,857 1
Primary Health 2002 - 2009 7 5 9.4 14,464 1
Shaftesbury 2002 - 2009 8 4 19.5 652,375 1
SEGRO 2000 - 2009 11 7 4.3 674,800 1
Workspace 2000 - 2009 8 4 5.5 396,790 1
McKay Securities 2001 - 2009 8 5 12.3 290,192 1
Warner Estate 2003 - 2009 7 4 13 409,714 0
Daejan Holdings 2003 - 2009 3 1 30 579,143 0
Minerva 2000 - 2009 6 3 4.9 638,700 1
Quintain Estates 2002 - 2009 10 5 13.5 913,875 1
Helical Bar 2000 - 2009 8 4 18.5 1,745,100 1
CLS Holdings 2000 - 2009 8 5 2.8 431,200 1
St. Modwen Prop. 2000 - 2009 9 6 11.5 585,000 1
Grainger 2001 - 2009 9 6 9.2 645,556 1
Development Sec. 2000 - 2009 8 5 10.5 603,500 1
Unite Group 2001 - 2009 7 4 9 541,826 1
Capital & Regional 2000 - 2009 11 5 4.6 511,000 1
London &
Associated Prop.
2000 - 2008 7 3 8 490,000 1
Safeland 2004 - 2009 6 2 18.5 495,667 1
II: Histograms of Alternative Leverage Measures
Total Debt to Total Capital Ratio
1.201.000.800.600.400.200.00
TDTC
50
40
30
20
10
0
Frequency
Mean =0.4469
Std. Dev. =0.16413
N =231

Research Journal of Finance and Accounting www.iiste.org
ISSN 2222-1697 (Paper) ISSN 2222-2847 (Online)
Vol.5, No.1, 2014
51
Long-term Debt to Total Capital Ratio
EBIT to Interest Expense Ratio
III: Box Plots of REITs/Non-REITs vs. Other Leverage Measures
REIT/Non-REIT Status vs. Total Debt REIT/Non-REIT vs. Long-term Debt
to Total Capital Ratio to Total Capital Ratio
1.201.000.800.600.400.200.00
LTDTC
40
30
20
10
0
Frequency
Mean =0.4087
Std. Dev. =0.16198
N =231
2.500.00-2.50-5.00
EBITINTLn
80
60
40
20
0
Frequency
Mean =0.3809
Std. Dev. =0.8412
N =216
1.00.00
REITNonREITStatus
1.20
1.00
0.80
0.60
0.40
0.20
0.00
TDTC
141
124
72
188
182
130
2
1.00.00
REITNonREITStatus
1.20
1.00
0.80
0.60
0.40
0.20
0.00
LTDTC
141
188
185
2

Research Journal of Finance and Accounting www.iiste.org
ISSN 2222-1697 (Paper) ISSN 2222-2847 (Online)
Vol.5, No.1, 2014
52
REIT/Non-REIT Status vs. Natural Logarithm of EBIT to Interest Ratio
1.00.00
REITNonREITStatus
4.00
2.00
0.00
-2.00
-4.00
EBITINTLn
72
73
117
200
146
216
10
115
231
136

Research Journal of Finance and Accounting www.iiste.org
ISSN 2222-1697 (Paper) ISSN 2222-2847 (Online)
Vol.5, No.1, 2014
53

Research Journal of Finance and Accounting www.iiste.org
ISSN 2222-1697 (Paper) ISSN 2222-2847 (Online)
Vol.5, No.1, 2014
54
Copyright © 2022 FDOKUMEN