The Value Relevance of R&D Voluntary Disclosure: Evidence from Listed Companies in France
38
1 R&D narrative disclosure, corporate governance and market value: Evidence from France Mehdi Nekhili a , Khaled Hussainey b , Walid Cheffi c , Hubert Tchakoute-Tchuigoua d a Université de Reims Champagne-Ardenne, France [email protected] b Plymouth University, UK [email protected] c United Arab Emirates University [email protected] d KEDGE Management School, France [email protected] ABSTRACT We investigate the impact of R&D narrative disclosure on market value of equity for a sample of French companies during the period 2000–2004. Using 3SLS estimation on a panel data of 98 French firms, we find, ceteris paribus, positive (but insignificant) association between R&D voluntary disclosure and the market value of equity. Both R&D intensity and R&D capitalization lead French firms to disclose more R&D narrative information. However, they impact differently the relationship between R&D-related disclosure and market value. Indeed, a positive and significant association is found when we control for R&D capitalization. In contrast, when controlling for R&D intensity, we find a negative association. We also find that equity-based compensation and audit committee independence are the most important drivers for R&D narrative disclosure. JEL Classifications: M41 G3 Keywords: Research and development Voluntary disclosure Market value Corporate governance
Transcript of The Value Relevance of R&D Voluntary Disclosure: Evidence from Listed Companies in France

1
R&D narrative disclosure, corporate governance and market value: Evidence from France
Mehdi Nekhili a, Khaled Hussainey b, Walid Cheffi c, Hubert Tchakoute-Tchuigoua d a Université de Reims Champagne-Ardenne, France [email protected] b Plymouth University, UK [email protected] c United Arab Emirates University [email protected] d KEDGE Management School, France [email protected]
ABSTRACT
We investigate the impact of R&D narrative disclosure on market value of equity for a sample
of French companies during the period 2000–2004. Using 3SLS estimation on a panel data of
98 French firms, we find, ceteris paribus, positive (but insignificant) association between
R&D voluntary disclosure and the market value of equity. Both R&D intensity and R&D
capitalization lead French firms to disclose more R&D narrative information. However, they
impact differently the relationship between R&D-related disclosure and market value. Indeed,
a positive and significant association is found when we control for R&D capitalization. In
contrast, when controlling for R&D intensity, we find a negative association. We also find
that equity-based compensation and audit committee independence are the most important
drivers for R&D narrative disclosure.
JEL Classifications:
M41
G3
Keywords:
Research and development
Voluntary disclosure
Market value
Corporate governance

2
1. Introduction
In a recent article, Merkley (2014) argues that the R&D setting offers a unique research
area to examine the importance of narrative disclosure to external stakeholders, who need to
evaluate the levels of risk and information asymmetry associated with R&D investments. To
date, little effort has been undertaken to examine the determinants and economic
consequences of R&D narrative disclosure. This paper studies the R&D narrative disclosure
of French listed firms for the years 2000 through to 2004. In France, the disclosure of
consolidated financial statements pursuant to IFRS started in December 2004. Thus the
financial reporting for year ends in the calendar year 2004 represents one of the few periods
that had only voluntary disclosure. It is for this reason that our study uses data for a period
ends on 2004 as this represents a rare opportunity to examine R&D disclosures in a purely
voluntary environment.
The principal research question we consider is whether, controlling for R&D intensity
and R&D capitalization, the willingness of firms to voluntarily disclose R&D information in
their narrative sections of annual reports influences the market value of the French listed
companies? We also ask whether the quality of corporate governance system affects the R&D
narrative disclosure practice. We expect to see a positive association between R&D narrative
disclosure and firms’ market value. We also expect to see that better governed firms disclose
more R&D narrative information in their annual reports.
It is argued that R&D activities are considered to be a source of agency problems
between insiders (managers) and outsiders (stakeholders) (Cheng, 2004). Hence, voluntary
narrative disclosure may provide an important mechanism that reduces information
asymmetry and agency conflicts between insiders and outsiders (Jensen & Meckling, 1976;
Patelli & Prencipe, 2007). A rich information environment and low information asymmetry
lead to desirable economic consequences; one of these is the improvement in firm value

3
(Healy & Palepu, 1993). However, competitive disadvantage affects firms’ incentives to
disclose information voluntarily on their R&D activities (Healy & Palepu, 1993). The
proprietary cost of R&D disclosure is higher in that it may benefit competitors (Verrecchia,
1983; Dye, 1985; Jones, 2007).
Whilst there are an increasing number of relevant studies dealing with R&D disclosure
(Entwistle, 1999; Ding et al., 2004; Jones, 2007; Zéghal et al., 2007), to the best of our
knowledge, only Nekhili et al (2012) examine the impact of R&D voluntary disclosure on
market value of firms. At least two potential reasons could lead us to conclude that there is a
positive association between R&D narrative disclosure and the market value of equity. First,
previous empirical studies show a positive relationship between increasing R&D expenditure
and firm value (see, e.g., Chan et al., 1990; Chauvin & Hirschey, 1993; Healy & Palepu,
1993; Chan et al., 2001; Hall & Oriani, 2006). Second, prior research finds a positive
association between voluntary information and firm value (see, e.g., Haggard et al., 2008;
Hassan et al., 2009; Cheung et al., 2010; Jiao, 2011). On the basis of these studies, we expect
that R&D narrative disclosure positively influences the market value of companies. In
addition, prior research shows that R&D voluntary disclosure varies dramatically across
companies and countries. For example, Ding et al. (2004) compare the practices of R&D
disclosure in France and Canada. They find divergent practices between firms in the two
countries, which they attribute to the capital market and cultural differences. Another
explanation may be that disparity in terms of corporate governance practices affects the R&D
disclosure practice. Our perusal of the literature indicates that, although many studies
document a relationship between corporate governance and voluntary disclosure (Ho &
Wong, 2001; Eng & Mak, 2003; Wang & Hussainey, 2013; Samaha et al., 2014), little
research (Lim et al., 2007; Zéghal, 2007; Abdelbadie & Elshandidy, 2013) has examined
specifically the link between corporate governance and R&D voluntary disclosure. In

4
addition, little research (Merkley, 2014) has examined the impact of R&D disclosure on
current earnings performance.Within this context, the second goal of this study is to
empirically assess the impact of R&D voluntary disclosure on market value of firms.
The most relevant paper to ours is Nekhili et al. (2012). The authors examine the
relationship between ownership structure, R&D disclosure and firm value. They find evidence
that voluntary R&D disclosure improves the market value of equity. They also find that firms
with family and domestic institutional ownership are more likely to withhold R&D
information, whilst foreign investors positively influence the level of R&D disclosure. We
complement Nekhili et al. (2012) by considering several corporate governance attributes
(board size, board independence, CEO duality, equity-based management compensation, and
audit committee independence). Using a sample of 98 French firms over the period 2000-
2004, we hand-collect 32 items from annual reports to develop an R&D voluntary disclosure
index. The robustness of our empirical specification was confirmed by a number of diagnostic
tests. Using 3SLS estimation, our results provide some interesting insights. We find that R&D
voluntary disclosure does not boost ceteris paribus firm market value. However, both R&D
intensity and R&D capitalization lead French firms to disclose more R&D narrative
information but impact differently the relationship between R&D-related disclosure and
market value. Indeed, when controlling for R&D intensity, an increase in the R&D voluntary
disclosure index is significantly associated with a lower market value. Otherwise, investors
pay more attention and react positively to R&D disclosure in the case when managers choose
to capitalize R&D expenditures. R&D capitalization leads to greater managerial discretion
and investors appreciate the disclosure efforts by managers in this particular situation. Finally,
we find that equity-based compensation and audit committee independence are the most
important governance mechanisms that drive firms to disclose R&D narrative information.
5
The rest of this paper is organized as follows. The next section reviews relevant literature
and develops the research hypotheses. Section 3 describes the data and the research
methodology. Section 4 presents and discusses our main findings. Section 5 concludes.
2. Literature Review and hypotheses development
2.1. R&D Voluntary Disclosure and Firm Market Value
In France, the regulation of financial disclosure is primarily based on the accounting
legislation established by the ‘Code of Commerce’ and the ‘General Accounting Plan’. This
legislation specifies the rules for the preparation and disclosure of financial information by
companies. However, firms can resort to many communication channels to disclose
information about their performance and activities. These include quarterly/annual reports,
announcements concerning profits, meetings with financial analysts, press interviews and
statements, letters to shareholders, and corporations’ websites. In terms of disclosure and
publication, only legislation is binding. In France, the disclosure of consolidated financial
statements pursuant to IFRS started in December 2004. Prior to January 1st, 2005,
international standards and recommendations on R&D were not mandatory and were
considered to be within the scope of voluntary disclosure.
It is important to note that some companies limit their disclosure to mandatory
information, whilst others opt for transparency and the dissemination of additional
information. The disclosure of information is necessary when the asymmetry of information is
very high (Dye, 1985; Healy & Palepu, 2001; Verrecchia, 2001). High R&D-intensive firms
often operate in rapidly changing environments, with customer demands that make their
future returns relatively uncertain. Thus, investors have difficulty in valuing high-R&D
activities firms correctly, and incur higher trading costs, leading to a decrease in the firm’s
stock liquidity, and to higher financing costs (Aboody & Lev, 2000; Boone & Raman, 2001).
6
Traditional mandatory disclosure fails to capture value-relevant information (Healy & Palepu,
1993; Hussainey & Walker, 2009). Compared to mandatory disclosure, voluntary disclosure
has many advantages. Literature shows that firms disclosing more information should have a
lower cost of capital than those disclosing more information (Botosan, 1997; Botosan &
Plumlee, 2002; Francis et al., 2008). Therefore, managers may choose to disclose more
information about their R&D activities voluntarily, in order to convey the firm’s true value to
outsiders (Gelb, 2002; Jones, 2007; Nekhili et al., 2012; Merkley, 2014).
Voluntary disclosure by R&D firms may nonetheless have some disadvantages. Indeed,
any voluntary disclosure regarding R&D projects increases proprietary costs (Verrecchia,
1983; Dye, 1985; Jones, 2007). Besides using disclosure as a mechanism to reduce
information asymmetry, managers may find themselves facing a dilemma: whether to disclose
to inform investors, at the risk of providing strategic information to competitors. As a
consequence, managers should pay more attention to controlling the information to be
disclosed, and the timing of its disclosure. Studying R&D disclosure, Entwistle (1999)
provides evidence of a trade-off between the costs of disclosing proprietary information and
the advantages of having a more accurate share price. The author undertakes a series of
interviews of firm CEOs about the ‘effective’ management of R&D disclosure, including
concerns about revealing proprietary information and/or bad news about R&D projects. He
finds that firms fear disclosing strategic information that may be adversely used by
competitors. These firms are sometimes forced to disclose bad news, notably to manage the
market’s expectations and to maintain their credibility with outside stakeholders.
Nekhili et al. (2012) test the association between ownership structure, R&D disclosure
and firm value for a sample of French companies. They provide evidence that voluntary R&D
disclosure has positive economic consequences as it improves the market value of equity.
They also provide evidence that French firms with family and domestic institutional

7
ownership withhold R&D information, whilst firms with foreign investors are more likely to
disclose more R&D disclosure. In a recent paper, Merkley (2014) provides evidence that the
quantity of R&D narrative disclosure is negatively associated with current earnings
performance in US firms.
Based on the above discussion, it is clear that the relationship between R&D disclosure
and firm market value in under-researched. Prior research shows that R&D expenditures
could lead to a higher market value (Chan et al., 2001; Hall & Oriani, 2006). Therefore, we
expect, based on agency and signaling theories, that higher levels of R&D disclosure are more
likely to have a positive impact on firm value. However, the magnitude of both asymmetry
information and R&D investments uncertainty might affect investors’ ability in estimating
firm value accurately. Investor, in this case, will not be able to incorporate the economic
advantages expected from R&D into the stock prices (Nagar et al., 2003). Thus, we expect no
association between R&D narrative disclosure and firm value. Empirical research is mixed.
Although Jones (2007) finds a negative association between firm value and R&D disclosure;
Lim et al. (2007) and Nekhili et al. (2012) find a positive association. Based on the above
discussion and agency and signaling theories, we formulate our first research hypothesis as
follows:
H1. There is a positive relationship between the level of R&D voluntary disclosure and firm
market value.
2.2. Governance Mechanisms and R&D Voluntary Disclosure
Eng & Mak (2003) find a positive relationship between corporate governance and
voluntary disclosure. So, we believe that a good quality corporate governance system should
be able to motivate companies to disclose more R&D information and hence to reduce
information asymmetry between managers and owners. In our study, we use a set of
mechanisms that are more likely to influence voluntary R&D disclosure decisions, which in

8
turn affect firm value. These mechanisms are board size, board independence, CEO duality,
Equity-based management compensation and audit committee independence.
2.2.1. Board size
John and Senbet (1998) find a positive association between board's monitoring capacity
and board size. Regarding voluntary disclosure, Singh et al. (2004) find that experienced large
boards are more able than small boards to make consistent corporate disclosure decisions.
Samaha et al. (2012) argue that firms with larger boards have greater corporate internet
reporting comprehensiveness. Hussainey and AlNajar (2011), Elshandidy et al. (2013) and
Samaha et al. (2014) highlight the positive link between the board size and the level of
voluntary disclosures. In a recent paper, Abdelbadie & Elshandidy (2013) provide evidence
that large board-sized firms, with more reliance on the R&D activities are motivated to
disseminate incremental information on their undertaken R&D investments. Therefore, the
second hypothesis is stated as follows:
H2. There is a positive association between board size and the level of voluntary R&D-related
disclosure.
2.2.2. Board Independence
Extant studies generally highlight the advantages of appointing outside directors as a
corporate governance mechanism. They support the hypothesis that outside directors are more
independent, and better able than insiders to monitor managers. Indeed, their presence is
usually related to changes in the corporate disclosure strategy. Recent researches have pointed
out that the more independent directors there are on a board, the more information the firm
discloses to outside investors (Chen & Jaggi, 2000; Eng & Mak, 2003; Leung & Howitz,
2004; Cheng & Courtenay, 2006; Lim et al., 2007; Patelli & Prencipe, 2007, Elshandidy et al.
2013). However, the question here is whether independent directors ensure better disclosure
about firms’ R&D activities. Using a sample of 181 Australian companies, Lim et al. (2007)

9
find that independent boards provide more voluntary disclosure of strategic information. This
includes five items related to R&D: company policy on R&D, forecast of R&D expenses,
number of employees in the R&D department, discussion about future R&D activities and
new product development. However, Abdelbadie & Elshandidy (2013) did not find an
association between board independence and R&D disclosure. The above reasoning leads us
to formulate our third hypothesis as follows:
H3. There is a positive relationship between board independence and the level of R&D
voluntary disclosure.
2.2.3. CEO Duality
If the board chairman plays a dual role, it is expected that the chairman-CEO will manage
the information flow to serve his/her own interests. Therefore, the level of voluntary
disclosure is expected to be relatively low. Existing empirical evidence appears to support the
conclusion that there is a negative association between CEO duality and voluntary disclosure
(Eng & Mac, 2003; Gul & Leung, 2004; Xiao & Yuan, 2007; Hussainey & AlNajar, 2011;
Elshandidy et al., 2013). In the Canadian context, Zéghal et al. (2007) analyze the
determinants of the R&D voluntary disclosure of 150 firms, and find that the separation of the
CEO and chairman functions is the most important decision, because it leads to higher levels
of voluntary R&D-related disclosure. Samaha et al. (2014) document the presence of a
negative association between CEO duality and voluntary disclosure for OECD high income
countries. Abdelbadie & Elshandidy (2013) did not find an association between CEO duality
and R&D disclosure. Following these arguments, we formulate our fourth hypothesis as
follows:
H4. There is a negative relationship between CEO duality and the level of R&D voluntary
disclosure.

10
2.2.4. Equity-based management compensation
When well designed, the CEO compensation package plays an important role as an
incentive mechanism. The allocation of stock options seems to be much more influenced by
the nature of both in-place assets and growth opportunities, than by the firm’s overall
financial performance. Studying 371 U.S. companies ranked by degree of R&D intensity,
Kole (1997) finds that innovative companies with high R&D allocate more remuneration in
the form of shares. Indeed, the author notes that a 1% increase in the ratio of R&D intensity
increases by 0.8% the probability that the company will put in place an incentive-based
compensation plan. Similarly, 77% of low R&D spending companies offer equity-based
compensation, against nearly 95% of those that invest heavily in R&D. Hence, R&D spending
contributes significantly to raising executive stock option compensation. Cheng (2004)
confirmed such a conclusion, after surveying 157 industrial companies that invested
significantly in R&D over the period 1984-1991. Cheng (2004) also finds that R&D spending
contributes significantly to an increase in executive stock option compensation. He concludes
that the indexation of CEO compensation to R&D expenditures reduces the managerial
incentives to focus only on short-term accounting earnings. This is supposed to help solve the
underinvestment problem.
Regarding the literature on voluntary disclosure and equity-based remuneration, we refer
mainly to Healy & Palepu (2003) and Nagar et al. (2003), who observe that stock-based
compensation plans, such as stock options grants and stock appreciation rights, provide
managers with incentives to disclose information voluntarily. These authors note that
managers, as inside traders, have to disclose information in response to the requirements of
insider trading rules. In addition, managers, as existing shareholders, tend to provide
additional disclosure, which avoids outside investors discounting stock prices. Hence, the
extent of firm disclosure is positively related to the proportion of CEO compensation affected
11
by stock prices. To the best of our knowledge, no specific studies deal with the relationship
between managerial compensation and R&D voluntary disclosure. One exception is the paper
by Lim et al. (2007), who provide evidence that equity-based management compensation is
positively associated with the voluntary disclosure of strategic information, including R&D
information. However, we note that they do not provide specific explanations for this finding.
Based on these arguments, we formulate our fifth hypothesis as follows:
H5. There is a positive relationship between equity-based management compensation and
R&D voluntary disclosure.
2.2.5. Audit Committee independence
The audit committee plays an important role in ensuring the quality of a company’s
financial information (Collier, 1993). This committee is charged with the oversight of
financial reporting and disclosure. It may also be responsible for evaluating the effectiveness
of financial control procedures and risk management activities. Ho & Wong (2001) suggest
that the presence of an active and independent audit committee is positively related to the
extent of voluntary disclosure. Pandit et al. (2006) examine audit committees’ reports over
2003-2004 for a sample of 100 randomly selected companies listed on the NYSE. They find
that some audit committees go beyond the regulatory requirements, in order to provide more
voluntary disclosure, although many others continue to provide only the minimum
information required in their reports. Samaha et al. (2014) use the meta-analysis approach to
empirically review a sample of 64 studies. They conclude that that the presence and the
independence of the audit committee play an important role in enhancing the level of
voluntary disclosure.
Nevertheless, it is interesting to note that the French approach to audit committees is
more flexible than that in the US. In France, the requirement for firms to establish an audit
committee is recent. The 8th European Directive, as amended in July 2009, requires the

12
presence of an audit committee composed of two or more members, of whom at least one
member must be independent and qualified in accounting. Before this date, an audit
committee was not mandatory. The ‘New Economic Regulations (NER)’ Act of May 15th,
2001, defined the audit committee as an advisory body of the board, leaving to companies the
choice to develop it according to their own needs1.
To the best of our knowledge, this is the first study to examine the relationship between
the characteristics of the audit committee (i.e. independence) and R&D voluntary disclosure.
Audit committee can be seen as a monitoring tool that enhances financial disclosure and
reduces agency costs, on the one hand, while R&D activities may generate asymmetric
information between managers and shareholders, on the other hand. Hence, it is relevant to
test the association between the independence of the audit committee and R&D voluntary
disclosure. Therefore, we formulate our sixth hypothesis as follows:
H6. There is a positive relationship between the independence of the audit committee and the
level of R&D voluntary disclosure.
3. Research Design
This section starts with the sample selection criteria; the justification of the chosen
variables; the definitions and measurements of both dependent and independent variables and
finally the econometric model used.
3.1. Sample
We use a sample of French listed companies belonging to the SBF 250 Index, over a five
year period from 2000 to 20042. This period precedes the adoption by the European Union of
the IAS and IFRS standards, the implementation of which became mandatory on January 1st,
1 For more details on the evolution of corporate governance regulation in France, see Jeanjean & Stolowy (2009). 2 The SBF 250 Index is a capitalization-weighted index of the 250 most highly capitalized and most liquid French stocks traded on the Paris Bourse. Our sample includes companies that existed on December 2004 and excludes those which existed at any prior year during our study period but which for some reason were deleted. However, since our objective is not to evaluate issues relating to trading but rather to examine the relationship between R&D narrative information and market value, this should not be problematic.

13
2005. Prior to that date, the lack of uniform accounting principles meant that the provision of
any information on R&D spending was voluntary. We begin our sample in 2000 because of
the lack of corporate governance data in earlier periods3. Given the initial population of 250
firms, we remove financial and real estate companies (33 companies), those that do not
mention R&D in the audited components of their financial statements (111 companies) and
those with missing corporate governance and/or financial data (8 companies). Hence, the final
sample consists of 98 companies covered over a 5-year period, a total of 490 observations.
Corporate governance variables and voluntary disclosure information were hand-collected
from firm’s annual reports, published on the AMF’s and companies’ websites. Financial data
and R&D intensity information were gathered from the Worldscope database.
3.2. Dependent Variable: Market-To-Book Ratio
This research focuses on the association of R&D voluntary disclosure with firm's market
value. In the light of the considerable debate about whether voluntary disclosure should be a
mechanism intended to meet investors’ information demands, our objective is to study the
extent to which R&D voluntary disclosure can reduce the information asymmetry generated
by R&D activities, given the associated high proprietary cost. Many studies provide evidence
that voluntary disclosure reduces the information asymmetry component of the cost of capital
(Botosan, 1997; Botosan & Plumlee, 2002). Given the costs associated with R&D-related
information, only information that affects positively the firm’s market value will be disclosed
by managers (Verrecchia, 1983). Since proprietary costs are a function of growth
opportunities, we consider that the market-to-book ratio is a suitable measure for capturing
these two elements. Following recent studies on voluntary disclosure (Hassan et al., 2009),
3 The MEDEF (the French employers association) recommended in January 2000 that CEOs reveal the composition of their compensation packages. Before this date, very little was known on French executive compensation.

14
market-to-book ratio (MTB) is computed as the end of period price per share multiplied by
the number of shares outstanding, to book value of equity.
3.3. Endogenous Variable: R&D Voluntary Disclosure
We adopt the same R&D disclosure index as in Nekhili et al. (2012). This score is based
on information contained in annual reports. The level of disclosure is the sum of the scores
achieved in five different categories of information. R&D-related disclosures include (i)
current and future information on spending, (ii) inputs, (iii) outputs, (iv) accounting and
budgeting, and (v) strategy. We use the R&D disclosure score (R&D_DISC), which compiles
a list of 32 items that are useful for valuing R&D activities (5 items for current and future
information about R&D spending; 7 items for R&D inputs; 6 items for R&D outputs; 8 items
for R&D accounting and budgeting; and 6 items for R&D strategy). The appendix shows the
complete list of items. We preserve items as dichotomous and all information to be equally
important, although their information content may be very different. Further, Lim et al. (2007)
consider that weighting may not reflect the preferences of the annual report users. Similarly,
Meek et al. (1995) argue that companies that disclose substantial information generally
disclose fewer but important items. Thus, companies are scored in the same way, regardless
of whether the items are weighted or not. We define the dependent variable (R&D_DISC) by
ratio between the assigned total score and the potential maximum score (i.e., equals 32).
3.4. Control Variables
The control variables are proxies for other factors that are likely to impact the extent of
R&D voluntary disclosure. These variables are R&D intensity, R&D accounting, ownership
structure, audit quality, leverage, return on assets, and firm size.
R&D Intensity (R&D): As mentioned above, mandatory information on R&D is inadequate in
the French context. To reduce information asymmetry, the users of annual reports will require

15
information about R&D activities. Literature documents a positive correlation between R&D
intensity and R&D disclosure (Lang & Lundholm, 1993; Entwistle, 1999; Percy, 2000; Ding
et al., 2004; Nekhili et al., 2012; Merkley, 2014). Following prior research, we measure the
intensity of R&D by annual R&D expenditures, deflated by total sales.
R&D Accounting (R&D_ACC): Under certain conditions, the French law gives companies the
choice of capitalizing the R&D costs or not. R&D can be capitalized only if it is considered as
an investment project, in which one can evaluate the project’s technical feasibility, cost-
effectiveness, and cost of capital. Otherwise, it is considered as an expense in the period in
which it is recorded. This dual mode of treatment of R&D costs is consistent with the US
GAAP (the cost of R&D is treated as an expense), and with the International Financial
Reporting Standards (IFRS), which requires the capitalization of profitable R&D projects.
Zhao (2002) and Oswald & Zarowin (2007) study the influence of R&D accounting on the
market value. They show that R&D capitalization has a positive effect on firm market value.
These findings support the idea that R&D capitalization provides incentives for companies to
reveal more information about depreciation, future profitability, and the amounts of these
investments. Cazavan-Jeny & Jeanjean (2006) explore the appropriateness of R&D
accounting treatment in the French context and find a negative impact of R&D capitalization
on stock prices. They explain this result by arguing that R&D capitalization leads to a
situation with more managerial discretion. Tsoligkas & Tsalavoutas, (2011) find a positive
association between the capitalised portion of R&D and market values for a sample of UK
companies. They find, however, a negative association between the expensed portion of R&D
and market values for large companies. This indicates that the impact of R&D on firm value
is still an empirical issue that is worth investigating.
Ownership structure: Five features of ownership structure are considered in our study:
minority ownership (MIN_OWN), family ownership (FAM_OWN), managerial ownership

16
(MAN_OWN), domestic institutional ownership (DOMINS_OWN) and, finally, foreign
institutional ownership (FORINS_OWN). In respect of the French context, Nekhili et al.
(2012) document that foreign institutional investors are more likely to influence positively the
level of R&D-related disclosure whilst family and domestic institutional investors act as
insiders and are more prone to retain R&D information. However, Abdelbadie & Elshandidy
(2013) find no association between ownership structure and R&D disclosure. Based on these
mixed results, the relationship between ownership structure and R&D disclosure is an
empirical issue that still requires investigation. Consequently, the paper adds ownership
structure to the analysis as a control variable.
Audit quality (BIG): For Aboody & Lev (2000), the ‘Big Five’ auditors have both the tools to
assess the viability of R&D spending, and sufficient expertise to do so. ‘Big’ auditors devote
more resources to staff training and to the development of industry expertise than other audit
firms. Also, given their important size, big auditors are more likely to invest in information
technology, in order to detect performance management deficiencies. Nor et al. (2010) find
evidence that audit quality represented by Big 4 audit firms play an important role in
promoting R&D disclosure. In France, at least two (joint) auditors are required by law, for
listed companies. To the best of our knowledge, no empirical studies have as yet addressed
the relationship between joint audit and the level of voluntary disclosure of non-financial (or
financial) information. Following the previous studies (Eng & Mak, 2003; Leung & Horwitz,
2004), we consider that a joint audit with two ‘Big’ auditors is more efficient than a joint
audit with only one ‘Big’ auditor, because it encourages firms to disclose more information in
their annual reports. To take into account the auditor-pair choices under France’s joint audit
requirement4, we use a trichotomous variable coded ‘one’ if only one of the two statutory
4 Since 1966, French regulations have obliged companies with consolidated accounts to be audited by at least two auditing firms.

17
auditors is a Big 5/4 accounting firm, ‘two’ if both statutory auditors are a Big 4/5, and ‘zero’
if company is audited by two non-Big auditors. 5
Leverage (LEVERAGE): Since Botosan (1997), many empirical studies have used leverage as
a determinant of the extent of voluntary corporate disclosure. Highly indebted firms are more
likely to disclose more information, to minimize legal risk (Watts & Zimmerman, 1990). Debt
may be a source of agency problems between shareholders and creditors, or between
managers and shareholders (Jensen & Meckling, 1976). Both shareholders and creditors may
be able to reduce the agency costs of debt, by ensuring more voluntary information disclosure.
Firms with high debt levels are expected to incur higher monitoring costs, and they can reduce
these costs by disclosing more information in their annual reports. The positive association
between financial leverage and voluntary disclosure has been established by Zéghal et al.
(2007) and Ahmed & Courtis (1999). Regarding R&D information, White et al. (2010), Kang
& Gray (2011) and Abdelbadie & Elshandidy (2013) reported a negative relationship between
firm leverage and voluntary disclosure. Based on these mixed results, the relationship
between leverage and R&D disclosure is an empirical issue that still requires investigation.
Consequently, the paper adds leverage to the analysis as a control variable.
Return on Assets (ROA): The Return on assets (ROA) is used as a proxy for firm profitability.
Meek et al (1995) argue that well-performing companies have incentives to disclose more
accounting information when they plan to raise additional capital on the financial market. In
fact, highly profitable firms may have incentives to pursue an active disclosure policy, in
order to communicate their quality (Rafournier, 1995). Ahmed & Courtis (1999) provide a
meta-analysis of 12 studies, and find a positive association between voluntary disclosure
levels and firm profitability, as proxied by return on assets. However, Ho & Wong (2001) and
5 Until 2002, the Big 4 were the Big 5 audit companies. After the Enron Scandal, Andersen was involved in the fraudulent accounting and auditing and filed for bankruptcy. Ever since, the number of the big audit companies down to four (PricewaterhouseCoopers, KPMG, Ernst & Young and Deloitte).

18
Eng & Mak (2003) do not find any significant relationship between ROA and the level of
voluntary disclosures. Regarding R&D information, Lim et al. (2007) provide evidence that
profitability has an impact on historical financial information, but it does not impact the
disclosure of strategic information related to R&D activities.
Firm Size (SIZE): The size of a company is commonly used as an indicator of its political
visibility. Large companies are more sensitive to political costs than smaller ones.
Consequently, Watts & Zimmerman (1990) argue that large companies are more likely to
disclose more information to avoid political pressure. Compared with small firms, large
companies disclose more information voluntarily because of their ability to cover the cost of
disclosure and the greater demand for information by different stakeholders (Hossain et al.,
2005). In addition, Skinner (1995) states that, from a legal point of view, larger firms disclose
more information, because the amount of damages in the case of litigation is higher in large-
sized firms. An extensive number of research papers find a positive association between firm
size and voluntary disclosure (see for example Ho & Wong, 2001; Eng & Mak, 2003; Gul &
Leung, 2004; Hossain et al., 2005; Lim et al., 2007; Xiao & Yuan, 2007). In addition, Jones
(2007) and Abdelbadie & Elshandidy (2013) find a positive association between firm size and
R&D disclosure. Following the above-cited researches, we proxy for firm size using the
natural logarithm of total assets.
Industry (INDUSTRY): Lev & Zarowin (1999) find that change in R&D intensity bears
significant additional information and that it is necessary to control for industry effect in R&D
accounting research because industrial R&D is industry specific by nature (Lev & Sougiannis,
1996).
3.5. Model
The objective of our work is to study the relationship between the level of R&D
voluntary disclosure and firm market value. Furthermore, the governance features and the

19
others selected variables can act directly on firm market value (MTB) or indirectly through
their impact on R&D disclosure. To this end, we built a simultaneous equation model into
which R&D voluntary disclosure is a strategic choice that depends on corporate governance
mechanisms, ownership structure and others firms’ characteristics. In this situation, ordinary
least squares method (OLS) produces biased and inconsistent estimates, since it does not
tackle the endogeneity problem. We choose to apply the method of three stages least squares
(3SLS). Unlike the method of two stages least squares (2SLS), this method takes into account
the dependence between the error terms. We perform the Hausman (1978) specification test to
determine which estimation method is most appropriate.
The design of the 3SLS estimation requires the specification of at least two equations that
are interconnected through several variables in equations. The first equation regresses the
R&D narrative disclosure index on corporate governance and a selected control variable. As
governance mechanisms, we include board size (BOARD_SIZE), board independence
(BOARD_IND), CEO/board chairman duality (DUAL), equity-based managerial
compensation (STK_OPT), presence of audit committee (AUDCOM), audit committee
independence (AUDCOM_IND). As control variables, we include some ownership structure
related variables such family ownership (FAM_OWN), managerial ownership (MAN_OWN),
domestic institutional ownership (DOMINS_OWN) and foreign institutional ownership
(FORINS_OWN). As other control variables, we also include R&D intensity (R&D), R&D
accounting (R&D_ACC), audit quality (BIG), leverage (LEVERAGE), return on assets (ROA),
and firm size (FIRM_SIZE). In the first stage, all independent variables and control variables
are included. In the second stage, we regress market-to-book ratio on R&D narrative
disclosure (R&D_DISC), independent variables and the same panel of control variables.
Hence, our system of simultaneous equations is as follows: 6
6 The application of the simultaneous equations model requires compliance with two conditions (verified in our case): one so-called order condition and another called rank condition.

20
First stage:
R&D_DISCit = β0 + β1 BOARD_SIZEit + β2 BOARD_INDit + β3 DUALit + β4 STK_OPTit + β5
AUDCOMit + β6 AUDCOM_INDit + β7 MIN_OWNit + β8 FAM_OWNit + β9 MAN_OWNit + β10
DOMINS_OWNit + β11 FORINS_OWNit + β12 BIGit + β13 LEVERAGEit + β14 R&Dit + β15
R&D_ACCit + β16 ROAit + β17 FIRM_SIZEit + β18 INDUSTRY + β19 YEAR + ε2it
Second stage:
MTBit = α0 + α1 R&D_DISCit + α2 BOARD_SIZEit + α3 BOARD_INDit + α4 DUALit + α5
STK_OPTit + α6 AUDCOMit + α7 AUDCOM_INDit + α8 MIN_OWNit + α9 FAM_OWNit + +
α10 MAN_OWNit + α11 DOMINS_OWNit + α12 FORINS_OWNit + α13 BIGit + α14
LEVERAGEit + α15 ROAit + α16 FIRM_SIZEit + α17 INDUSTRY + α18 YEAR + ε1it
Where:
MTB = market value of common shares divided by book value of ordinary shareholders’
equity.
R&D_DISC = total disclosure score divided by the potential maximum score out of 33 items.
BOARD_SIZE = natural logarithm of the number of directors on board
BOARD_IND = ratio of independent directors to total directors on the board.
DUAL = binary variable coded one if the company’s CEO is also the chairman of the board
and zero otherwise.
STK_OPT = dummy variable coded one if the firm offers equity-based compensation for the
CEO and zero otherwise.
AUDCOM = dummy variable coded one if the firm has an audit committee and zero
otherwise.
AUDCOM_IND = ratio of independent directors to total directors on the audit committee.
MIN_OWN = proportion of shares owned by minority shareholders.
FAM_OWN = binary variable equals one if some shares are owned by family members, 0
otherwise.
MAN_OWN = proportion of shares owned by managers.
DOMINS_OWN = cumulative proportion of shares above 5% owned by French institutional
investors.
FORINS_OWN = cumulative proportion of shares above 5% owned by foreign institutional
investors.

21
BIG: trichotomous variable coded two if each of the two statutory auditors is a Big 4/5
accounting firm, one if only one of the two statutory auditors is a Big 5/4, and zero otherwise.
LEVERAGE = total liabilities to total assets ratio.
R&D = ratio of R&D expenditures to total sales.
R&D_ACC = binary variable coded one if R&D is capitalized, and zero otherwise.
ROA = return on assets measured as ratio of EBIT (earnings before interest and taxes) to total
assets.
FIRM_SIZE = natural logarithm of total assets.
INDUSTRY = Binary variable that takes the value 1 if the company belongs to the sector in
question and 0 otherwise. The industry classification is based on Industry Classification
Benchmark (ICB).
4. Results
4.1. Descriptive Statistics
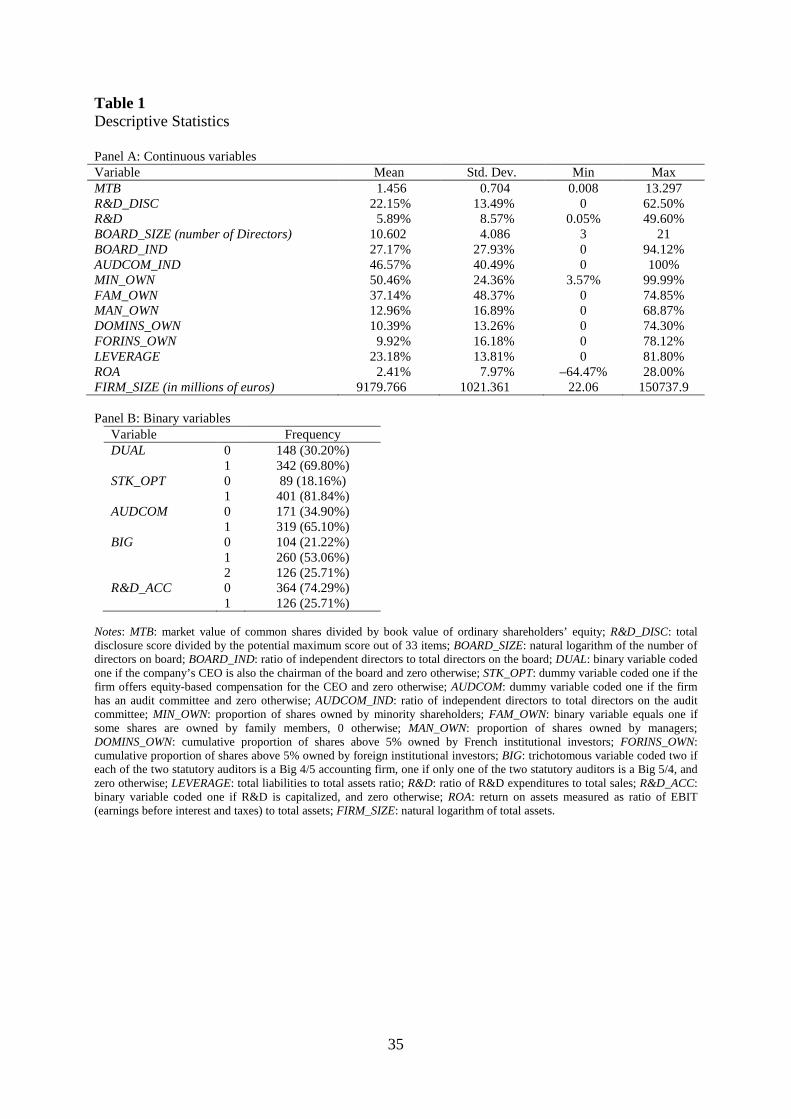
Table 1 shows the descriptive statistics. The average market-to-book variable (MTB) is
1.456, with a minimum value of 0.008 and a maximum value of 13.297. The mean R&D
narrative disclosure index (R&D_DISC) is 22.15%. This index ranged from zero to 62.50%.
The mean ratio of R&D intensity (R&D) is 5.89%, ranging from 0.05% to 49.60%. The
number of directors on board (BOARD_SIZE) ranges from 3 to 21 with a mean of 11
members. The mean ratios of board and audit committee independence (BOARD_IND and
AUDCOM_IND) are 27.17% and 46.57%, respectively, with a minimum of zero for both
variables, and a maximum of 94.12% and 100%, respectively. Minority ownership
(MIN_OWN) varies from 3.57% to 99.99%, with a mean of 50.46%. The mean percentage of
family ownership (FAM_OWN) and managerial ownership (MAN_OWN) of the sample firms
are equal to 37.14% and 12.79%, respectively. The mean ratios of domestic (DOM_OWN)
and foreign institutional ownership (FORINS_OWN) are 10.39% and 9.92%, respectively.
LEVERAGE ranges from zero to 81.80%, with a mean of 23.18%. The ROA ratio ranges from

22
–64.47% to 28.00%, with a mean of 2.41%. Finally, that the table shows that the size (total
assets) of the sampled firms varies from 22.06 to 150737.9 million euro.
Panel B of Table 1 shows that 69.80% of our sample firms have CEO duality (DUAL),
and that 81.84% use equity-based management compensation (STK_OPT). Sampling firms
have an audit committee (AUDCOM) in 65.10% of cases, are audited by one “Big four”
auditor (BIG) in 53.06% of cases, and by two “Big four” auditors in 25.71% of cases. Finally,
we note that only 25.71% of our sample firms capitalize their R&D activities (R&D_ACC).
---------------------------------------------
Insert Table 1 about here
---------------------------------------------
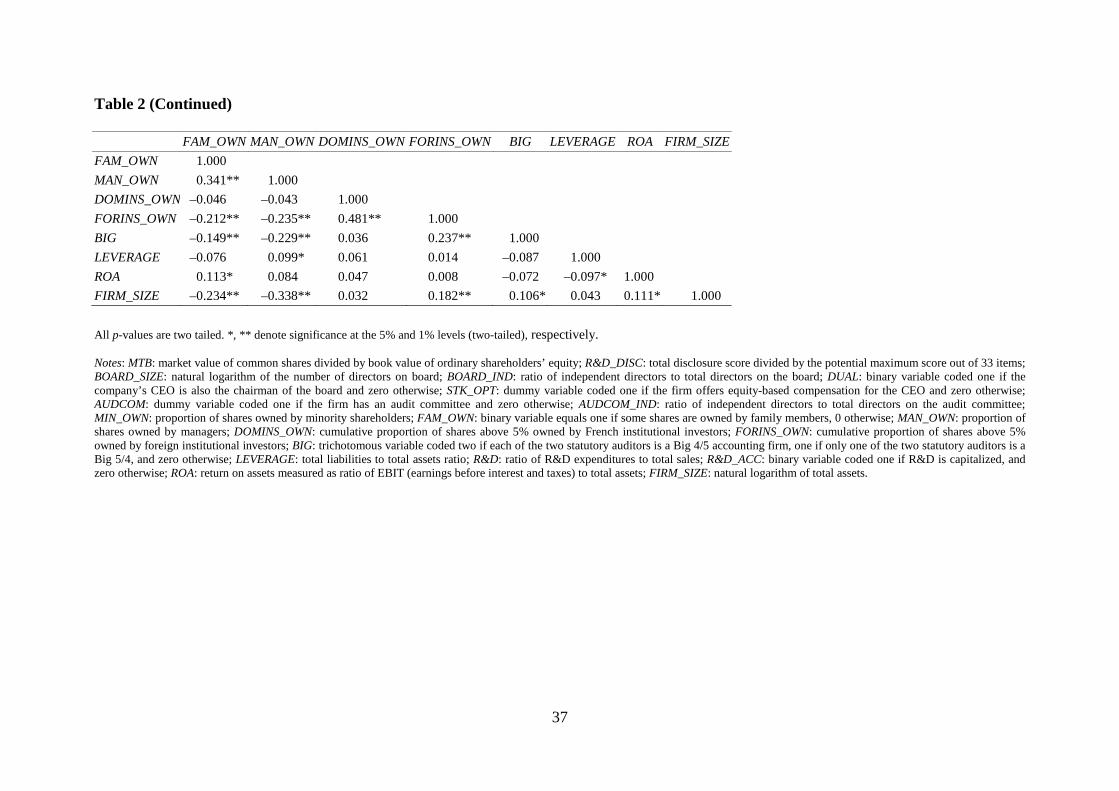
Table 2 shows the pairwise correlation matrix for all variables. The matrix indicates a high
and significant correlation (0.8359) between the presence of an audit committee and its
independence. When they exist, most audit committees are independent. Therefore, we do not
include the presence of the audit committee, to avoid correlation problems among the
explanatory variables. The VIF values were also computed in Table 2, to check the existence
of this problem. They range between 1.16 and 4.47. The multicollinearity problem is
problematic since the variance inflation factors exceed 10 (Neter et al., 1983). Thus the
statistical properties of the variables computed in this study are not substantially biased by the
effects of a possible collinearity problem, and the results of the regression analysis can be
interpreted with a greater degree of confidence.
---------------------------------------------
Insert Table 2 about here
--------------------------------------------
4.2. Regression results
To test our hypotheses, we carry out three different models for our system of
simultaneous equations. In Model 1, we only focus on R&D disclosure. In Model 2, we use

23
the same variables in Model 1 and we control for the impact of R&D intensity on the firm
value. In Model 3, we introduce R&D accounting in the second stage of the estimating system
instead of R&D intensity. This allows us to know whether the market reaction to the R&D
narrative disclosure depends on the R&D intensity and its accounting treatment. We then
perform the Hausman test to determine which, between 2SLS and 3SLS, the most appropriate
estimation method is. We find that the method for estimating the system of simultaneous
equations matters and the Hausman test indicates that the 3SLS estimates are better specified.
The results in Table 3 show that the sign of the R&D narrative disclosure impact on market-
to-book value changes considerably from the model 1 to the model 3.
In fact, when we focus only on R&D disclosure, the estimated coefficient associated with
R&D_DISC is positive (3.170) but insignificant. Our expectation, based on agency and
signaling theories, that higher levels of R&D narrative disclosure are more likely to have a
positive impact on firm value is not met and our hypothesis H1 is then not supported. In line
with Nekhili et al. (2012), we find that both R&D intensity (R&D) and R&D capitalization
(R&D_ACC) lead French firms to disclose more R&D-related information. Nonetheless,
when introduced consecutively in the second stage of the estimating system (Models 2 and 3,
respectively), R&D intensity (R&D) and R&D capitalization (R&D_ACC) impact differently
the relationship between R&D narrative disclosure (R&D_DISC) and market value (MTB).
The results of Model 2, into which we control for R&D intensity, indicate that the
coefficient associated with R&D disclosure becomes negative (–4.444) and significant at 5%
level. The fact that the coefficient R&D intensity is positive (6.662) and significant at 1%
level indicates that R&D intensity plays a more role in explaining market value than the
disclosure of details about R&D programs. Furthermore, the difference obtained in the
coefficient associated with R&D_DISC between Model 1 and Model 2 suggests that an
increase in the R&D voluntary disclosure index is associated with a lower market value when

24
considering R&D intensity simultaneously. This result supports the inherent proprietary costs
of R&D disclosure (Verrecchia, 1983; Dye, 1985; Jones, 2007). Most likely, investors are
more reluctant to the disclosure of strategic information in more R&D intensive firms fearing
that R&D narrative disclosure benefits potential competitors (Botosan & Stanford, 2005).
The results of Model 3, into which we control for R&D accounting, shed light on another
aspect related to the voluntary R&D disclosure. Indeed, the coefficient associated with
R&D_DISC is strongly positive (14.263) and significant at 1% level. The estimated
coefficient associated with R&D accounting is negative (–1.431) and significant at 1% level.
This is in line with the result of Cazavan-Jeny & Jeanjean (2006) and Nekhili et al. (2012) in
the French context arguing that R&D capitalization leads to more managerial discretion. In
this particular situation, investors seem to pay, from an agency and signaling perspectives,
more attention to the voluntary disclosure of narrative R&D-related information. To the
extent that R&D capitalization treatment leads to a managerial discretionary problem,
investors use voluntary disclosure as a major platform to scrutinize the activities of the top
management (Jensen & Meckling, 1976), leading to a positive relationship between R&D
narrative disclosure and firm market value.
------------------------------------------------
Insert Table 3 about here
------------------------------------------------
Table 3 indicates the absence of significant impacts of both board size (BOARD_SIZE)
and board independence (BOARD_IND) on R&D narrative disclosure. Therefore, H2 and H3
are rejected. No significance is also shown for the impact of CEO duality (DUAL) on R&D
voluntary disclosure (R&D_DISC) and H4 is rejected. Our result is consistent with those of
Ho & Wong (2001) and Cheng & Courtenay (2006), who conclude that CEO duality is not
related to the level of voluntary disclosure, in both the Hong Kong and Singaporean contexts.

25
In addition, the coefficient related to the impact of equity-based remuneration (STK_OPT)
is, as expected, positive and significant at 1% level. This result remains stable even if we
introduce R&D intensity (R&D) or R&D capitalization (R&D_ACC) in the second stage of
our system. Henceforth, French firms use equity-based management remuneration to ensure
better communication on R&D activities. This finding confirm hypothesis H5, and is also
consistent with Lim et al. (2007), which shows a positive association between equity-based
managerial compensation and strategic information disclosure in the Australian context.
In respect of our sixth hypothesis, we find evidence that the independence of the audit
committee (AUDCOM_IND) is positively related to the extent of R&D voluntary disclosure
(R&D_DISC). The impact is significant at the 1% level. Our result is consistent with Ho &
Wong (2001) and Samaha et al. (2014) and tends to support an active role for the independent
audit committee in disclosing information to the market. Before July 2009, the date of
implementation of the 8th European Directive, the French approach to the audit committee
was more flexible than the US Sarbanes-Oxley Act, and defined it as a mere advisory body on
the board. This gave companies the choice to develop its functioning according to their needs.
Given the importance of this committee, not only its existence, but also its independence and
expertise that ought to be more regulated.
Finally, for control variables, our results are in line with Nekhili et al. (2012) regarding
the relationship between ownership structure and R&D voluntary disclosure. Indeed, we find
a negative and positive impact of family and foreign institutional ownership on R&D-related
disclosure, respectively. These impacts are both significant at 1% level. Unexpectedly, and in
contrast to the political and legal approaches of Watts & Zimmerman (1990) and Skinner
(1995), we find a negative relationship between firm size and voluntary disclosure of R&D
activities. Otherwise, no significance is shown for others control variables.

26
5. Conclusion
This paper has investigated the impact of R&D voluntary disclosure on the market value
of the firm. This was motivated by the observation that several empirical studies demonstrate
a positive relationship between a firm’s market value and increasing R&D expenditure (Chan
et al., 2001; Hall & Oriani, 2006), and a positive association between voluntary information
and market value (Haggard et al., 2008; Hassan et al., 2009). Managers, aware of the need to
provide regular information to various external partners, must often deal with the nature and
level of the information they disclose. Regarding R&D information, a disclosure decision is
problematic, because of the inherent proprietary costs, and the risk that such strategic
information may benefit competitors. To deal with endogeneity problem, we built a
simultaneous equation model in which R&D narrative disclosure is a strategic choice that
depends on corporate governance mechanisms, ownership structure and others firms’
characteristics. In order to apprehend R&D-related disclosures to shareholders, we built an
index of narrative disclosure on R&D. The index is equal to the actual score obtained for the
categories of information on R&D activities, divided by its theoretical score in relation to all
categories of information on these investments.
In respect of the French context, Nekhili et al. (2012) test the association between
ownership structure, R&D disclosure and firm value and provide evidence that voluntary
R&D disclosure improves the market value of equity. We complement Nekhili et al. (2012)
by considering several corporate governance attributes (board size, board independence, CEO
duality, equity-based management compensation, and audit committee independence). On the
basis of 98 French firms rolled over the period 2000-2004, our results show that better R&D
narrative disclosure cannot, ceteris paribus, raise firms’ market value. However, when we
consider R&D intensity, disclosing voluntary R&D-related information is significantly
associated with a lower market value. It is worthwhile noticing, consistent with Lang &

27
Lundholm (1993), Entwistle (1999) and Merkley (2014), that the R&D intensity is associated
positively and significantly at 1% level with the R&D disclosures. However, R&D intensity
reduces the relevance of the R&D narrative disclosure. Otherwise, the French market seems to
pay more attention to the details disclosed about R&D investments when the R&D
capitalization choice is made leading to a more managerial discretion. These findings shed
light on the association between corporate governance and the extent of R&D disclosure. In
particular, these findings generate a need for reflection, and support an active role for the
auditing committee in disclosing more information to the market.
Whilst this research has relevant implications for investors and governance experts, it
could be further extended by using the rate of returns in addition to market value. The main
distinction between value relevance studies examining price levels, and those examining
returns, is that the former deal with assessing the association with firm value, whereas the
latter are interested in assessing what is reflected in changes in value over a slot of time
(Barth et al., 2001). After studying the effect of R&D voluntary disclosure on the market
value of firms, it will be interesting to turn to examining stock returns. This will contribute to
moving forward from the study of the impact of R&D disclosure on firm's market value
toward a comprehensive investigation of the value relevance of such a disclosure.
Another research avenue could be to focus on the accounting harmonization process in
France, following the adoption of IAS/IFRS standards, and in particular its impact in terms of
R&D disclosure, under the IAS 38. Generally accepted accounting principles (GAAP)
mandate that R&D expenditures, and the majority of intangible assets, should be immediately
expensed in the income statement, even though they often benefit the firm over long periods.
Thus, the adoption of IAS/IFRS in January 2005 would have affected investors’ perceptions
of the usefulness of financial reports. In this context, studies on whether French firms disclose

28
more or better information on their R&D activities, and whether investors evaluate both R&D
intensity and R&D disclosure differently, will provide additional useful insights.
References
Abdelbadie, R., & Elshandidy, T. (2013). Determinants of voluntary disclosure on R&D
expenditures: Evidence from the UK R&D intensive industries. British Accounting and
Finance Annual (BAFA) Conference.
Aboody, D., & Lev, B. (2000). Information asymmetry, R&D, and insider gains. Journal of
Finance, 55(6), 2747–2766.
Ahmed, K., & Courtis, J. K. (1999). Associations between corporate characteristics and
disclosure levels in annual reports: a meta-analysis. British Accounting Review, 31(1), 35–
61.
Barth, M. E., Beaver, W. H., & Landsman, W. R. (2001). The Relevance of the value-
relevance literature for financial accounting standard setting: Another view. Journal of
Accounting & Economics, 31(1&3), 7–104.
Boone, J. P., & Raman, K. K. (2001). Off-balance sheet R&D assets and market liquidity.
Journal of Accounting and Public Policy, 20(2), 97–128.
Botosan, C. A. (1997). Disclosure level and the cost of equity capital. The Accounting
Review, 72(3), 323–350.
Botosan, C. A., & Plumlee, M. A. (2002). A Re-examination of disclosure level and expected
cost of capital. Journal of Accounting Research, 40(1), 21–40.
Botosan, C. A., & Stanford, M. (2005). Managers' motives to withhold segment disclosures
and the effect of SFAS No.131 on analysts' information environment. Accounting Review,
80(3), 751–772.
Cazavan-Jeny, A., & Jeanjean, T. (2006).The negative impact of R&D capitalization: A value
relevance approach. European Accounting Review, 15(1), 37–61.
Chan, L., Lakonishok, J., & Sougiannis, T. (2001). The stock market valuation of research &
development expenditures. Journal of Finance, 56(6), 2431–2456.
Chan, S., Martin, J., & Kensinger, J. (1990). Corporate research and development
expenditures and share value. Journal of Financial Economics, 26(2), 255–276.
Chauvin, K. W., & Hirschey, M. (1993). Advertising, R&D expenditures and the market
value of the firm. Financial Management, 22(4), 128–140.

29
Chen, C. J. P., & Jaggi, B. (2000). Association between independent non-executive directors,
family control and financial disclosures in Hong Kong. Journal of Accounting and Public
Policy, 19(4), 285–310.
Cheng, E. C. M., & Courtenay, S. M. (2006). Board composition, regulatory regime and
voluntary disclosure. International Journal of Accounting, 41(3), 262–289.
Cheng, S. (2004). R&D Expenditures and CEO Compensation. Accounting Review, 79(2),
305–328.
Cheung, Y., Jiang, P., & Tan, W. (2010). A transparency disclosure index measuring
disclosures: Chinese listed companies. Journal of Accounting and Public Policy, 29(3),
259–280.
Collier, P. A. (1993). Factors affecting the formation of audit committees in major UK listed
companies. Accounting and Business Research, 23(91), 421–30.
Ding, Y., Entwistle, G., & Stolowy, H. (2004). Differences in R&D disclosure practices:
Evidence in a French and Canadian context. Advances in International Accounting, 17,
55–72.
Dye, R. A. (1985). Disclosure of non-proprietary information. Journal of Accounting
Research, 23(1), 123–145.
Elshandidy, T., Fraser, I., & Hussainey, K. (2011). Aggregated, voluntary, and mandatory risk
disclosures incentives: evidence from UK FTSE all share. International Review of
Financial Analysis, 30, 320–333
Eng, L., & Mak, Y. (2003). Corporate governance and voluntary disclosure’, Journal of
Accounting and Public Policy, 22(4), 325–345.
Entwistle, G. M. (1999). Exploring the R&D disclosure environment. Accounting Horizons,
13(4), 353–385.
Francis, J., Nanda, D., & Olsson, P. (2008). Voluntary disclosure, earnings quality, and cost
of capital. Journal of Accounting Research, 46, 53–99.
Gelb, D. S. (2002). Intangible assets and firms’ disclosures: An empirical investigation.
Journal of Business Finance & Accounting, 29(3&4), 457–476.
Gul, F. A., & Leung, S. (2004). Board leadership, outside directors’ expertise and voluntary
corporate disclosures. Journal of Accounting and Public Policy, 23(5), 351–379.
Haggard, K. S., Martin, X., & Pereira, R. (2008). Does voluntary disclosure improve stock
price informativeness?. Financial Management, 37(4), 747–768.

30
Hall, B. H., & Oriani, R. (2006). Does the market value R&D investment by European firms?
Evidence from a panel of manufacturing firms in France, Germany, and Italy.
International Journal of Industrial Organization, 24(5), 971–993.
Hassan, O., Romilly, P., Giorgioni, G., & Power, D. (2009). The value relevance of
disclosure: Evidence from the emerging market of Egypt. International Journal of
Accounting, 44(1), 79–102.
Hausman, J. A. (1978). Specification tests in econometrics. Econometrica, 46(6), 1251–1271.
Healy, P. M., & Palepu, K. G. (1993). The effect of firms’ financial disclosure strategies on
stock prices. Accounting Horizons, 7(1), 1–11.
Ho, S. S. M., & Wong, K. S. (2001). A study of the relationship between corporate
governance structures and the extent of voluntary disclosure. Journal of International
Accounting, Auditing & Taxation, 10(2), 139–156.
Holthausen, R. W., Larcker, D. F., & Sloan, R. G. (1995). Business unit innovation and the
structure of executive compensation. Journal of Accounting and Economics, 19(2&3),
279–313.
Hossain, M., Ahmed, K., & Godfrey, J. M. (2005). Investment opportunity set and voluntary
disclosure of prospective information: A simultaneous equations approach. Journal of
Business Finance and Accounting, 32(5&6), 877–907.
Hussainey, K., & Al-Najjar, B. (2011). Future-oriented narrative reporting: Determinates and
use. Journal of Applied Accounting Research, 12(2), 123–138.
Hussainey, K., & Walker, M. (2009). The effects of voluntary disclosure policy and dividend
propensity on prices leading earnings. Accounting and Business Research, 39(1), 37–55.
Jeanjean, T., & Stolowy, H. (2009). Determinants of board members’ financial expertise:
Empirical evidence from France. International Journal of Accounting, 44(4), 378–402.
Jensen, M. C., & Meckling, W. H. (1976). Theory of the firm: managerial behavior, agency
costs and ownership structure. Journal of Financial Economics, 3(4), 305–360.
Jiao, Y. (2011). Corporate disclosure, market valuation, and firm performance. Financial
Management, 40(13), 647–676.
John, K., & Senbet, L. W. (1998). Corporate governance and board effectiveness. Journal of
Banking and Finance, 22(4), 371–403.
Jones, D. A. (2007). Voluntary disclosure in R&D-intensive industries. Contemporary
Accounting Research, 24(2), 489–522.

31
Kang, H. H., & Gray, S. J. (2011). Reporting intangible assets: voluntary disclosure practices
of top emerging market companies. The International Journal of Accounting, 46(4), 402–
423.
Kole, S. R. (1997). The complexity of compensation contracts. Journal of Financial
Economics, 43(1), 79–104.
Lang, M., & Lundholm, R. (1993). Cross-sectional determinants of analyst ratings of
corporate disclosures. Journal of Accounting Research, 31(2), 246–271.
Leung, S., & Horwitz, B. (2004). Director ownership and voluntary segment disclosure: Hong
Kong evidence. Journal of International Financial Management & Accounting, 15(3),
235–260.
Lev, B., & Sougiannis, T. (1996). The capitalization, amortization and value-relevance of
R&D. Journal of Accounting and Economics, 21, 107–138.
Lev, B., & Zarowin, P. (1999). The boundaries of financial reporting and how to extend them.
Journal of Accounting Research, 37, 353–385.
Lim, S., Matolcsy, Z., & Chow, D. (2007). The association between board composition and
different types of voluntary disclosure. European Accounting Review, 16(3), 555–583.
Meek, G. K., Roberts, C. B., & Gray, S. J. (1995). Factors influencing voluntary annual report
disclosures by U.S., U.K. and continental European multinational corporations. Journal of
International business studies, 26(3), 555–572.
Merkley, K. (2014). Narrative disclosure and earnings performance: Evidence from R&D
disclosures. The Accounting Review, 89(2), 725–757.
Mulkay, B., Hall, B. H., & Mairesse, J. (2001). Firm level investment and R&D in France and
the United States: A comparison. National Bureau of Economic Research, Working Paper,
8038: Cambridge, MA.
Nagar, V., Nanda, D., & Wysocki, P. (2003). Discretionary disclosure and stock-based
incentives. Journal of Accounting & Economics, 34(1&3), 283–309.
Nekhili M., Boubaker S., & Lakhal F. (2012). Ownership structure, R&D voluntary
disclosure and market value of firms: The French case. International Journal of Business,
17(2), 126–140.
Neter, J., Wasserman, W., & Kutner, M. (1983), Applied Linear Regression Models, Richard
D. Irwin, Illinois, USA.
Nor, H. M., Saleh, N. M., Jaffar, R., & Shukor, Z. A. (2010). Corporate governance and R&D
reporting in Malaysian MESDAQ Market. International Journal of Economic and
Management, 4(2), 350–372.
32
Oswald, D. R., & Zarowin, P. (2007). Capitalization of R&D and the informativeness of stock
prices. European Accounting Review, 16(4), 703–726.
Pandit, G., Subrahmanyam, V., & Conway, G. (2006). Are the audit committee reports
disclosing enough after the Sarbanes-Oxley Act?. Managerial Auditing Journal, 21(1),
34–45.
Patelli, L., & Prencipe, A. (2007). The relationship between voluntary disclosure and
independent directors in the presence of a dominant shareholder. European Accounting
Review, 16(1), 5–33.
Percy, M. (2000). Financial reporting discretion and voluntary disclosure: Corporate research
and development expenditure in Australia. Asia-Pacific Journal of Accounting &
Economics, 7(1), 1–31.
Rafournier, B. (1995). The determinants of voluntary financial disclosure by Swiss listed
companies. European Accounting Review, 4(2), 261–280.
Samaha, K., Dahawy, K., Abdel-Meguid, A., & Abdallah, S. (2012). Propensity and
comprehensiveness of corporate internet reporting in Egypt: Do board composition and
ownership structure matter?. International Journal of Accounting and Information
Management, 20(2), 142–170.
Samaha, K., Khlif, H., & Hussainey, K. (2014). The impact of board characteristics and audit
committee on voluntary disclosure: A meta-analysis. Journal of International Accounting,
Auditing and Taxation, forthcoming.
Singh, M., Mathur, I., & Gleason, K. (2004). Governance and performance implications of
diversification strategies: Evidence from large US firms. Financial Review, 39, 489–526.
Skinner, D. J. (1995). Do the SEC’s safe harbor provisions encourage forward-looking
disclosures?. Financial Analysts Journal, 51(4), 38–44.
Tsoligkas, F., & Tsalavoutas, I. (2011). The value relevance of R&D reporting in the UK after
IFRS mandatory implementation. Applied Financial Economics, 21(13), 957–967.
Verrecchia, R. E. (1983). Discretionary disclosure. Journal of Accounting and Economics,
5(4), 179–194.
Verrecchia, R. E. (2001). Essays on disclosure. Journal of Accounting and Economics,
32(1&3), 97–180.
Wang, M., & Hussainey, K. (2013). Voluntary forward-looking statements driven by corporate
governance and their value relevance. Journal of Accounting and Public Policy, 32(3), 26-
49.

33
Watts, R., & Zimmerman, J. (1990). Positive Accounting Theory: A Ten-year Perspective.
Accounting Review, 65(1), 131–156.
White, G., Lee, A., Yuningsih, Y., Nielsen, C., & Bukh, P. N. (2010). The nature and extent
of voluntary intellectual capital disclosures by Australian and UK biotechnology
companies. Journal of Intellectual Capital, 11(4), 519–536.
Xiao, H., & Yuan, J. (2007). Ownership structure, board composition and corporate voluntary
disclosure: Evidence from listed companies in China. Managerial Auditing Journal,
22(6), 604–619.
Zéghal, D., Mouelhi, R., & Louati, H. (2007). An analysis of the determinants of research &
development voluntary disclosure by Canadian firms. The Irish Accounting Review,
14(2), 61–89.
Zhao, R. (2002). Relative value relevance of R&D reporting: An international comparison.
Journal of International Financial Management and Accounting, 13(2), 153–174.

34
Appendix R&D Disclosure Score and Items Current and future R&D spending 1- Discussion of R&D intensity as a percentage of sales 2- Discussion of changes in R&D as a percentage of sales 3- Description of new R&D programs 4- Description of current R&D spending components 5- Description of future R&D spending components R&D inputs 1- Number of research units 2- Geographic localization of research units 3- R&D spending by research unit 4- Distinction of R&D program partners: domestic or foreign 5- Number of R&D program partners (domestic and foreign) 6- Description of the relationship between R&D and corporate societal responsibilities 7- Number of employees in R&D programs R&D outputs 1- Description of new products 2- Cost of new products 3- Customer satisfaction 4- Discussion of new products introduced 5- Date sales will begin 6- Discussion of patents R&D accounting and budgeting 1- IFRS and/or GAAP used in R&D accounting 2- Accuracy of amount of R&D spending 3- Discussion of the impact of IFRS and/or GAAP application on operating income 4- Budget of future R&D spending 5- Comparison between real R&D spending and forecast budget 6- Identification of funding sources of R&D projects 7- Identification of the amount of each funding source 8- Comparison between current and past funding sources of R&D projects R&D strategy 1- General discussion of R&D activities 2- R&D spending by activity 3- Separation of basic versus applied research 4- Distinction between headquarters R&D and subsidiaries R&D 5- Amount of R&D decentralization in each subsidiary 6- Comparison of R&D spending with competitors’ spending
35
Table 1 Descriptive Statistics Panel A: Continuous variables Variable Mean Std. Dev. Min Max MTB 1.456 0.704 0.008 13.297 R&D_DISC 22.15% 13.49% 0 62.50% R&D 5.89% 8.57% 0.05% 49.60% BOARD_SIZE (number of Directors) 10.602 4.086 3 21 BOARD_IND 27.17% 27.93% 0 94.12% AUDCOM_IND 46.57% 40.49% 0 100% MIN_OWN 50.46% 24.36% 3.57% 99.99% FAM_OWN 37.14% 48.37% 0 74.85% MAN_OWN 12.96% 16.89% 0 68.87% DOMINS_OWN 10.39% 13.26% 0 74.30% FORINS_OWN 9.92% 16.18% 0 78.12% LEVERAGE 23.18% 13.81% 0 81.80% ROA 2.41% 7.97% –64.47% 28.00% FIRM_SIZE (in millions of euros) 9179.766 1021.361 22.06 150737.9 Panel B: Binary variables
Notes: MTB: market value of common shares divided by book value of ordinary shareholders’ equity; R&D_DISC: total disclosure score divided by the potential maximum score out of 33 items; BOARD_SIZE: natural logarithm of the number of directors on board; BOARD_IND: ratio of independent directors to total directors on the board; DUAL: binary variable coded one if the company’s CEO is also the chairman of the board and zero otherwise; STK_OPT: dummy variable coded one if the firm offers equity-based compensation for the CEO and zero otherwise; AUDCOM: dummy variable coded one if the firm has an audit committee and zero otherwise; AUDCOM_IND: ratio of independent directors to total directors on the audit committee; MIN_OWN: proportion of shares owned by minority shareholders; FAM_OWN: binary variable equals one if some shares are owned by family members, 0 otherwise; MAN_OWN: proportion of shares owned by managers; DOMINS_OWN: cumulative proportion of shares above 5% owned by French institutional investors; FORINS_OWN: cumulative proportion of shares above 5% owned by foreign institutional investors; BIG: trichotomous variable coded two if each of the two statutory auditors is a Big 4/5 accounting firm, one if only one of the two statutory auditors is a Big 5/4, and zero otherwise; LEVERAGE: total liabilities to total assets ratio; R&D: ratio of R&D expenditures to total sales; R&D_ACC: binary variable coded one if R&D is capitalized, and zero otherwise; ROA: return on assets measured as ratio of EBIT (earnings before interest and taxes) to total assets; FIRM_SIZE: natural logarithm of total assets.
Variable Frequency DUAL 0
1 148 (30.20%) 342 (69.80%)
STK_OPT 0 1
89 (18.16%) 401 (81.84%)
AUDCOM 0 1
171 (34.90%) 319 (65.10%)
BIG 0 1 2
104 (21.22%) 260 (53.06%) 126 (25.71%)
R&D_ACC 0 1
364 (74.29%) 126 (25.71%)

36
Table 2 Pairwise Correlation Matrix
All p-values are two tailed. *, ** denote significance at the 5% and 1% levels (two-tailed), respectively.
MTB R&D_DISC R&D R&D_ACC BOARD_SIZE BOARD_IND DUAL STK_OPT AUDCOM AUDCOM_IND MIN_OWN VIF
MTB 1.000 ---
R&D_DISC 0.069 1.000 1.58
R&D 0.348** 0.344** 1.000 1.43
R&D_ACC –0.026 0.244** 0.044 1.000 1.29
BOARD_SIZE –0.260** 0.043 –0.114* –0.117** 1.000 1.52
BOARD_IND –0.088* 0.017 0.001 –0.163** 0.159** 1.000 1.92
DUAL –0.034 0.034 –0.043 –0.019 –0.062 0.156** 1.000 1.16
STK_OPT 0.009 0.178** –0.011 –0.134** 0.193** 0.188** 0.059 1.000 1.43
AUDCOM 0.028 0.234** 0.029 –0.147** 0.293** 0.475** 0.087 0.332** 1.000 4.47
AUDCOM_IND 0.136** 0.227** 0.107* –0.072 0.235** 0.462** 0.111* 0.298** 0.835** 1.000 4.13
MIN_OWN 0.099* 0.056 –0.009 –0.106* 0.075 0.519** 0.180** 0.287** 0.352** 0.452** 1.000 2.01
FAM_OWN 0.012 –0.109* 0.045 0.079 –0.064 –0.382** –0.165** –0.054 –0.349** –0.273** –0.443** 1.58
MAN_OWN 0.072 –0.066 –0.078 0.260** –0.427** –0.366** –0.087 –0.116* –0.445** –0.357** –0.290** 1.76
DOMINS_OWN –0.121** –0.030 –0.166** –0.108* 0.247** 0.200** 0.135** 0.184** 0.068 0.074 0.112* 1.56
FORINS_OWN –0.035 0.088* 0.028 –0.218** 0.224** 0.359** 0.176** 0.210** 0.264** 0.259** 0.402** 1.85
BIG 0.138** 0.193** 0.221** –0.072 0.142** 0.166** 0.023 –0.000 0.323** 0.393** 0.179** 1.32
LEVERAGE –0.146** –0.042 –0.293** 0.053 0.021 –0.028 0.185** 0.160** –0.031 –0.042 0.083 1.24
ROA 0.128** –0.195** –0.176** –0.125** –0.013 –0.028 –0.124** –0.117** –0.071 –0.083 0.030 1.19
FIRM_SIZE –0.135** –0.274** –0.180** –0.217** 0.295** 0.423** 0.050 –0.009 0.386** 0.290** 0.198** 1.74
37
Table 2 (Continued)
All p-values are two tailed. *, ** denote significance at the 5% and 1% levels (two-tailed), respectively. Notes: MTB: market value of common shares divided by book value of ordinary shareholders’ equity; R&D_DISC: total disclosure score divided by the potential maximum score out of 33 items; BOARD_SIZE: natural logarithm of the number of directors on board; BOARD_IND: ratio of independent directors to total directors on the board; DUAL: binary variable coded one if the company’s CEO is also the chairman of the board and zero otherwise; STK_OPT: dummy variable coded one if the firm offers equity-based compensation for the CEO and zero otherwise; AUDCOM: dummy variable coded one if the firm has an audit committee and zero otherwise; AUDCOM_IND: ratio of independent directors to total directors on the audit committee; MIN_OWN: proportion of shares owned by minority shareholders; FAM_OWN: binary variable equals one if some shares are owned by family members, 0 otherwise; MAN_OWN: proportion of shares owned by managers; DOMINS_OWN: cumulative proportion of shares above 5% owned by French institutional investors; FORINS_OWN: cumulative proportion of shares above 5% owned by foreign institutional investors; BIG: trichotomous variable coded two if each of the two statutory auditors is a Big 4/5 accounting firm, one if only one of the two statutory auditors is a Big 5/4, and zero otherwise; LEVERAGE: total liabilities to total assets ratio; R&D: ratio of R&D expenditures to total sales; R&D_ACC: binary variable coded one if R&D is capitalized, and zero otherwise; ROA: return on assets measured as ratio of EBIT (earnings before interest and taxes) to total assets; FIRM_SIZE: natural logarithm of total assets.
FAM_OWN MAN_OWN DOMINS_OWN FORINS_OWN BIG LEVERAGE ROA FIRM_SIZE
FAM_OWN 1.000
MAN_OWN 0.341** 1.000
DOMINS_OWN –0.046 –0.043 1.000
FORINS_OWN –0.212** –0.235** 0.481** 1.000
BIG –0.149** –0.229** 0.036 0.237** 1.000
LEVERAGE –0.076 0.099* 0.061 0.014 –0.087 1.000
ROA 0.113* 0.084 0.047 0.008 –0.072 –0.097* 1.000
FIRM_SIZE –0.234** –0.338** 0.032 0.182** 0.106* 0.043 0.111* 1.000

38
Table 3 Regression analysis
Variables
Model 1 Model 2 Model 3 First stage Second stage First stage Second stage First stage Second stage Coef. t-Stat Coef. t-Stat Coef. t-Stat Coef. t-Stat Coef. t-Stat Coef. t-Stat
R&D_DISC 3.170 1.88 –4.444* –2.10 14.263** 3.60 R&D 0.447** 6.57 0.356** 5.06 6.662** 5.45 0.356** 5.06 R&D_ACC 0.063** 5.20 0.076** 6.17 0.076** 6.17 –1.431** –3.56 BOARD_SIZE 0.009 0.56 –1.173** –5.53 0.004 0.28 –0.954** –4.65 0.004 0.28 –1.036** –3.34 BOARD_IND –0.034 –1.41 –1.061** –3.13 –0.033 –1.39 –1.332** –4.10 –0.033 –1.39 –0.707 –1.41 DUAL 0.021 1.80 0.089 0.53 0.021 1.78 0.265 1.62 0.021 1.78 –0.131 –0.52 STK_OPT 0.034* 2.38 0.097 0.49 0.037** 2.59 0.265 1.38 0.037** 2.57 –0.428 –1.31 AUDCOM_IND 0.055** 3.40 0.291 1.16 0.056** 3.47 0.672** 2.72 0.056** 3.47 –0.382 –0.93 MIN_OWN –0.052 –1.86 0.843* 2.11 –0.056* –2.00 0.580 1.52 –0.056* –2.00 1.630** 2.62 FAM_OWN –0.038** –3.18 0.129 0.73 –0.038** –3.16 –0.171 –0.97 –0.038** –3.16 0.542 1.92 MAN_OWN –0.059 –1.50 –0.775 –1.45 –0.074 –1.88 –0.684 –1.35 –0.074 –1.88 0.714 0.81 DOMINS_OWN –0.010 –0.22 1.001 1.52 –0.013 –0.28 1.032 1.66 –0.013 –0.28 1.282 1.34 FORINS_OWN 0.121** 2.84 –0.729 –1.19 0.123** 2.89 0.114 0.19 0.123** 2.89 –1.196 –1.23 BIG 0.006 0.71 0.266* 2.36 0.008 0.98 0.229* 2.15 0.008 0.98 0.079 0.47 LEVERAGE –0.001 –0.01 –0.973 –1.83 –0.018 –0.47 –0.324 –0.63 –0.018 –0.47 0.024 0.03 ROA 0.007 0.12 3.914** 4.43 –0.004 –0.06 4.372** 5.20 –0.004 –0.06 4.445** 3.45 FIRM_SIZE –0.019** –6.00 –0.002 –0.03 –0.020** –6.07 –0.145* –2.27 –0.020** –6.07 0.231 2.09 Intercept 0.149* 2.19 2.958** 2.89 0.157* 2.30 3.818** 3.88 0.157* 2.30 0.872 0.55 INDUSTRY Yes Yes Yes Yes Yes Yes R-squared chi2 Prob > chi2
42.90% 280.98 0.000
32.69% 372.10 0.000
43.21% 369.09 0.000
39.60% 342.85 0.000
43.21% 369.09 0.000
41.51% 146.34 0.000
*, ** denote significance at the 5% and 1% levels, respectively. Notes: MTB: market value of common shares divided by book value of ordinary shareholders’ equity; R&D_DISC: total disclosure score divided by the potential maximum score out of 33 items; BOARD_SIZE: natural logarithm of the number of directors on board; BOARD_IND: ratio of independent directors to total directors on the board; DUAL: binary variable coded one if the company’s CEO is also the chairman of the board and zero otherwise; STK_OPT: dummy variable coded one if the firm offers equity-based compensation for the CEO and zero otherwise; AUDCOM_IND: ratio of independent directors to total directors on the audit committee; MIN_OWN: proportion of shares owned by minority shareholders; FAM_OWN: binary variable equals one if some shares are owned by family members, 0 otherwise; MAN_OWN: proportion of shares owned by managers; DOMINS_OWN: cumulative proportion of shares above 5% owned by French institutional investors; FORINS_OWN: cumulative proportion of shares above 5% owned by foreign institutional investors; BIG: trichotomous variable coded two if each of the two statutory auditors is a Big 4/5 accounting firm, one if only one of the two statutory auditors is a Big 5/4, and zero otherwise; LEVERAGE: total liabilities to total assets ratio; R&D: ratio of R&D expenditures to total sales; R&D_ACC: binary variable coded one if R&D is capitalized, and zero otherwise; ROA: return on assets measured as ratio of EBIT (earnings before interest and taxes) to total assets; FIRM_SIZE: natural logarithm of total assets. INDUSTRY: Binary variable that takes the value 1 if the company belongs to the sector in question and 0 otherwise. The industry classification is based on Industry Classification Benchmark (ICB).