
Customer portfolio management
38
Customer portfolio management Chapter 5
-
Upload
khangminh22 -
Category
Documents
-
view
5 -
download
0
Transcript of Customer portfolio management
Customer portfolio management
Chapter 5

Chapter objectives By the end of this chapter you will understand:
1. the benefi ts that fl ow from managing customers as a portfolio 2. a number of disciplines that contribute to customer portfolio management: market
segmentation, sales forecasting, activity-based costing, lifetime value estimation and data mining
3. how customer portfolio management differs between business-to-consumer and business-to-business contexts
4. how to use a number of business-to-business portfolio analysis tools 5. the range of customer management strategies that can be deployed across a
customer portfolio.
What is a portfolio? The term portfolio is often used in the context of investments to describe the collection of assets owned by an individual or institution. Each asset is managed differently according to its role in the owner’s investment strategy. Portfolio has a parallel meaning in the context of customers. A customer portfolio can be defi ned as follows:
A customer portfolio is the collection of mutually exclusive customer groups that comprise a business’s entire customer base.
In other words, a company’s customer portfolio is made up of customers clustered on the basis of one or more strategically important variables. Each customer is assigned to just one cluster in the portfolio. At one extreme, all customers can be treated as identical; at the other, each customer is treated as unique. Most companies are positioned somewhere between these extremes.
One of strategic CRMs fundamental principles is that not all customers can, or should, be managed in the same way, unless it makes strategic sense to do so. Customers not only have different needs, preferences and expectations, but also different revenue and cost profi les, and therefore should be managed in different ways. For example, in the B2B context, some customers might be offered customized product and face-to-face account management; others might be offered standardized product and web-based self-service. If the second group were to be offered the same product options and service levels as the fi rst, they might end up being value-destroyers rather than value-creators for the company.
Customer portfolio management (CPM) aims to optimize business performance – whether that means sales growth, enhanced customer profi tability, or something else – across the entire customer base. It does

126 Customer Relationship Management
this by offering differentiated value propositions to different segments of customers. For example, the UK-based NatWest Bank manages its business customers on a portfolio basis. It has split customers into three segments based upon their size, lifetime value and creditworthiness. As Figure 5.1 shows, each cluster in the portfolio is treated to a different value proposition. When companies deliver tiered service levels such as these, they face a number of questions. Should the tiering be based upon current or future customer value? How should the sales and service support vary across tiers? How can customer expectations be managed to avoid the problem of low tier customers resenting not being offered high tier service? What criteria should be employed when shifting customers up and down the hierarchy? Finally, does the cost of managing this additional complexity pay off in customer outcomes such as enhanced retention levels, or fi nancial outcomes such as additional revenues and profi t?
Corporate Banking Services has three tiers of clients ranked by size, lifetime value and credit worthiness.
– The top tier numbers some 60 multinational clients. These have at least one individual relationship manager attached to them.
– The second tier numbering approximately 150 have individual client managers attached to them.
– The third tier representing the vast bulk of smaller business clients have access to a‘Small Business Advisor’ at each of the 100 business centres.
Figure 5.1 Customer portfolio management in NatWest Corporate Banking Services
Who is the customer? The customer in a B2B context is different from a customer in the B2C context. The B2C customer is the end consumer: an individual or a household. The B2B customer is an organization: a company (producer or reseller) or an institution (not-for-profi t or government body). CPM practices in the B2B context are very different from those in the B2C context.
The B2B context differs from the B2C context in a number of ways. First, there are fewer customers. In Australia, for example, although there is a population of twenty million people, there are only one million registered businesses. Secondly, business customers are much larger than household customers. Thirdly, relationships between business customers and their suppliers typically tend to be much closer than between household members and their suppliers. You can read more about this in Chapter 2. Often business relationships feature reciprocal trading. Company A buys from company B, and company B buys from company A. This is particularly common among small and medium-sized enterprises.

Customer portfolio management 127
Fourthly, the demand for input goods and services by companies is derived from end user demand. Household demand for bread creates organizational demand for fl our. Fifthly, organizational buying is conducted in a professional way. Unlike household buyers, procurement offi cers for companies are often professionals with formal training. Buying processes can be rigorously formal, particularly for mission-critical goods and services, where a decision-making unit composed of interested parties may be formed to defi ne requirements, search for suppliers, evaluate proposals and make a sourcing decision. Often, the value of a single organizational purchase is huge: buying an airplane, bridge or power station is a massive purchase few households will ever match. Finally, much B2B trading is direct. In other words, there are no channel intermediaries and suppliers sell direct to customers.
These differences mean that the CPM process is very different in the two contexts. In the B2B context, because suppliers have access to much more customer-specifi c information, CPM uses organization-specifi c data, such as sales volume and cost-to-serve, to allocate customers to strategic clusters. In the B2C context, individual level data is not readily available. Therefore, the data used for clustering purposes tends not to be specifi c to individual customers. Instead, data about groups of customers, for example geographic market segments, is used to perform the clustering.
Basic disciplines for CPM In this section, you’ll read about a number of basic disciplines that can be useful during CPM. These include market segmentation, sales forecasting, activity-based costing, customer lifetime value estimation and data mining.
Market segmentation CPM can make use of a discipline that is routinely employed by marketing management: market segmentation. Market segmentation can be defi ned as follows:
Market segmentation is the process of dividing up a market into more-or-less homogenous subsets for which it is possible to create different value propositions.
At the end of the process the company can decide which segment(s) it wants to serve. If it chooses, each segment can be served with a different value proposition and managed in a different way. Market segmentation processes can be used during CPM for two main purposes. They can be used to segment potential markets to identify which customers to acquire, and to cluster current customers with a view to offering differentiated value propositions supported by different relationship management strategies.

128 Customer Relationship Management
In this discussion we’ll focus on the application of market segmentation processes to identify which customers to acquire. What distinguishes market segmentation for this CRM purpose is its very clear focus on customer value. The outcome of the process should be the identifi cation of the value potential of each identifi ed segment. Companies will want to identify and target customers that can generate profi t in the future: these will be those customers that the company and its network are better placed to serve and satisfy than their competitors.
Market segmentation in many companies is highly intuitive. The marketing team will develop profi les of customer groups based upon their insight and experience. This is then used to guide the development of marketing strategies across the segments. In a CRM context, market segmentation is highly data dependent. The data might be generated internally or sourced externally. Internal data from marketing, sales and fi nance records are often enhanced with additional data from external sources such as marketing research companies, partner organizations in the company’s network and data specialists (see Figure 5.2 ).
Intuitive– brain-storm segmentation variables
age, gender, lifestyleSIC, size, location
– produce word-profiles– compute sizes of segments– assess company/segment fit– make targeting decision
one/several/all segments?
Data-based– obtain customer data
Internal and external– analyse customer data– identify high/medium/low-value customer
segments– profile customers within segments
age, gender, lifestyleSIC, size, location
– assess company/segment fit– make targeting decision
one/several/all segments? Figure 5.2 Intuitive and data-based segmentation processes
The market segmentation process can be broken down into a number of steps:
1. identify the business you are in 2. identify relevant segmentation variables 3. analyse the market using these variables 4. assess the value of the market segments 5. select target market(s) to serve.
Identify the business you are in This is an important strategic question to which many, but not all, companies have an answer. Ted Levitt’s classic article, ‘ Marketing Myopia ’ warned companies of the dangers of thinking only in terms of

Customer portfolio management 129
product-oriented answers. 1 He wrote of a nineteenth century company that defi ned itself as being in the buggy-whip industry. It has not survived. It is important to consider the answer from the customer point of view. For example, is Blockbuster in the video-rental business or some other business, perhaps home entertainment or retailing? Is a manufacturer of kitchen cabinets in the timber processing industry, or the home-improvement business?
A customer-oriented answer to the question will enable companies to move through the market segmentation process because it helps identify the boundaries of the market served, it defi nes the benefi ts customers seek, and it picks out the company’s competitors.
Let’s assume that the kitchen furniture company has defi ned its business from the customer’s perspective. It believes it is in the home value improvement business. It knows from research that customers buy its products for one major reason: they are home owners who want to enhance the value of their properties. The company is now in a position to identify its markets and competitors at three levels:
1. benefi t competitors : other companies delivering the same benefi t to customers. These might include window replacement companies, heating and air-conditioning companies and bathroom renovation companies
2. product competitors : other companies marketing kitchens to customers seeking the same benefi t
3. geographic competitors : these are benefi t and product competitors operating in the same geographic territory.
Identify relevant segmentation variables and analyse the market There are many variables that are used to segment consumer and organizational markets. Companies can enjoy competitive advantage through innovations in market segmentation. For example, before Häagen-Dazs, it was known that ice-cream was a seasonally sold product aimed primarily at children. Häagen-Dazs upset this logic by targeting an adult consumer group with a different, luxurious product, and all-year-round purchasing potential. We’ll look at consumer markets fi rst.
Consumer markets Consumers can be clustered according to a number of shared characteristics. These can be grouped into user attributes and usage attributes, as summarized in Figure 5.3 .
In recent years there has been a trend away from simply using demographic attributes to segment consumer markets. The concern has been that there is too much variance within each of the demographic clusters to regard all members of the segment as more-or-less homogenous. For example, some 30–40 year olds have families and mortgaged homes; others live in rented apartments and go clubbing at weekends. Some members of religious groups are traditionalists; others are progressives.

130 Customer Relationship Management
The family lifecycle (FLC) idea has been particularly threatened. The FLC traces the development of a person’s life along a path from young and single, to married with no children, married with young children, married couples with older children, older married couples with no children at home, empty nesters still in employment, retired empty nester couples, to sole survivor working or not working. Life for many, if not most people, does not follow this path. It fails to take account of the many and varied life choices that people make: some people never marry, others marry late, there are also childless couples, gay and lesbian partnerships, extended families, single-parent households and divorced couples.
Let’s look at some of the variables that can be used to defi ne market segments. Occupational status is widely used to classify people into social grades. Systems vary around the world. In the UK, the JICNARS social grading system is employed. This allocates households to one of six categories (A, B, C1, C2, D and E) depending on the job of the head of household. Higher managerial occupations are ranked A; casual, unskilled workers are ranked E. Media owners often use the JICNARS scale to profi le their audiences.
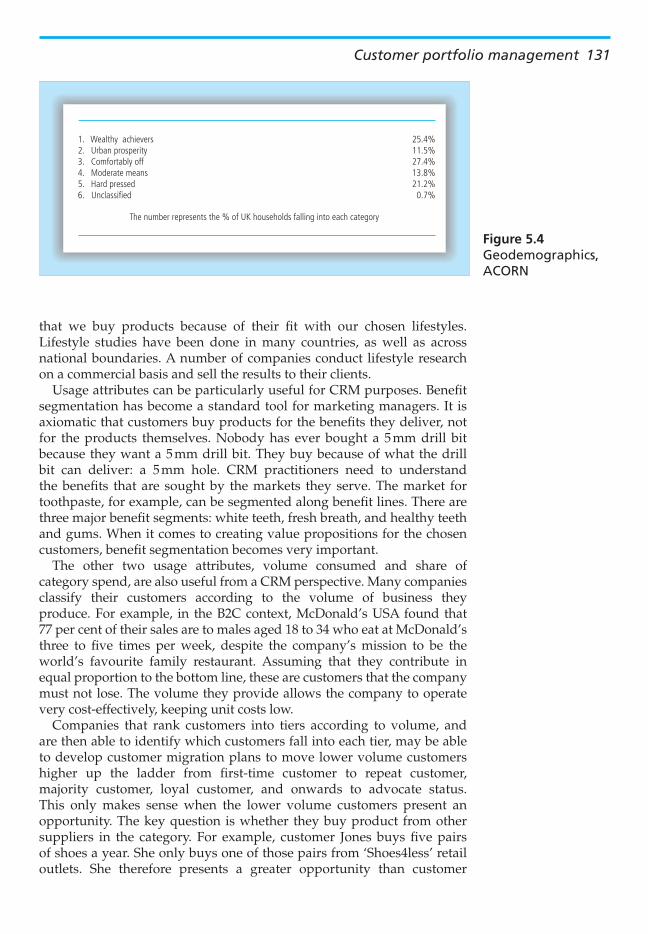
A number of data analysis companies have developed geodemographic classifi cation schemes. CACI, for example, has developed ACORN which allocates individuals, households and postcodes to one of the fi ve categories shown in Figure 5.4 , and beyond into 17 groups and 56 types. ACORN data suggest that clusters of like households exhibit similar buying behaviours. This clustering outcome is based on data covering over 400 variables, from online behaviour to housing type, education and family structure.
Lifestyle research became popular in the 1980s. Rather than using a single descriptive category to classify customers as had been the case with demographics, it uses multivariate analysis to cluster customers. Lifestyle analysts collect data about people’s activities, interests and opinions. A lifestyle survey instrument may require answers to 400 or 500 questions, taking several hours to complete. Using analytical processes such as factor analysis and cluster analysis, the researchers are able to produce lifestyle or psychographic profi les. The assertion is made
User attributes Demographic attributes : age, gender, occupational status, household size,marital status, terminal educational age, household income, stage of familylifecycle, religion, ethnic origin, nationality
Geographica attributes : country, region, TV region, city, city size,postcode, residential neighbourhood
Psychographic attributes : lifestyle, personality
Usage attributes Benefits sought, volume consumed, share of category spend Figure 5.3 Criteria for segmentingconsumer markets
Customer portfolio management 131
that we buy products because of their fi t with our chosen lifestyles. Lifestyle studies have been done in many countries, as well as across national boundaries. A number of companies conduct lifestyle research on a commercial basis and sell the results to their clients.
Usage attributes can be particularly useful for CRM purposes. Benefi t segmentation has become a standard tool for marketing managers. It is axiomatic that customers buy products for the benefi ts they deliver, not for the products themselves. Nobody has ever bought a 5 mm drill bit because they want a 5 mm drill bit. They buy because of what the drill bit can deliver: a 5 mm hole. CRM practitioners need to understand the benefi ts that are sought by the markets they serve. The market for toothpaste, for example, can be segmented along benefi t lines. There are three major benefi t segments: white teeth, fresh breath, and healthy teeth and gums. When it comes to creating value propositions for the chosen customers, benefi t segmentation becomes very important.
The other two usage attributes, volume consumed and share of category spend, are also useful from a CRM perspective. Many companies classify their customers according to the volume of business they produce. For example, in the B2C context, McDonald’s USA found that 77 per cent of their sales are to males aged 18 to 34 who eat at McDonald’s three to fi ve times per week, despite the company’s mission to be the world’s favourite family restaurant. Assuming that they contribute in equal proportion to the bottom line, these are customers that the company must not lose. The volume they provide allows the company to operate very cost-effectively, keeping unit costs low.
Companies that rank customers into tiers according to volume, and are then able to identify which customers fall into each tier, may be able to develop customer migration plans to move lower volume customers higher up the ladder from fi rst-time customer to repeat customer, majority customer, loyal customer, and onwards to advocate status. This only makes sense when the lower volume customers present an opportunity. The key question is whether they buy product from other suppliers in the category. For example, customer Jones buys fi ve pairs of shoes a year. She only buys one of those pairs from ‘ Shoes4less ’ retail outlets. She therefore presents a greater opportunity than customer
1. Wealthy achievers 25.4%2. Urban prosperity 11.5%3. Comfortably off 27.4%4. Moderate means 13.8%5. Hard pressed 21.2%6. Unclassified 0.7%
The number represents the % of UK households falling into each category
Figure 5.4 Geodemographics, ACORN

132 Customer Relationship Management
Smith who buys two pairs a year, but both of them from Shoes4less. Shoes4less has the opportunity to win four more sales from Jones, but none from Smith. This does not necessarily mean that Jones is more valuable than Smith. That depends on the answers to other questions. First, how much will it cost to switch Jones from her current shoe retailer(s), and what will it cost to retain Smith’s business? Secondly, what are the margins earned from these customers? If Jones is very committed to her other supplier, it may not be worth trying to switch her. If Smith buys high margin fashion and leisure footwear and Jones buys low margin footwear, then Smith might be the better opportunity despite the lower volume of sales.
Most segmentation programmes employ more than one variable. For example, a chain of bars may defi ne its customers on the basis of geography, age and music preference. Figure 5.5 shows how the market for chocolate can be segmented by usage occasion and satisfaction. Four major segments emerge from this bivariate segmentation of the market.
Hunger
Planned10%
Emotionalneed 20%
Latersharing30%
Functional40%
Satisfaction
Gifts
Familysharing
Takehome
Eat now
Usag
e
Light snacking Indulgence Figure 5.5 Bivariate segmentation of the chocolate market (Source: Mintel 1998)
Business markets Business markets can also be segmented in a number of ways, as shown in Figure 5.6
The basic starting point for most B2B segmentation is the International Standard Industrial Classifi cation (ISIC), which is a property of the United Nations Statistics Division. While this is a standard that is in widespread use, some countries have developed their own schemes. In the USA, Canada and Mexico, there is the North American Industry Classifi cation System (NAICS). A 1400 page NAICS manual was

Customer portfolio management 133
published in 2007. In New Zealand and Australia there is the Australia and New Zealand Standard Industrial Classifi cation (ANZSIC).
The ISIC classifi es all forms of economic activity. Each business entity is classifi ed according to its principal product or business activity, and is assigned a four-digit code. These are then amalgamated into 99 major categories. Figure 5.7 illustrates several four-digit codes.
Business market segmentationcriteria
Illustration
International Standard Industrial An internationally agreed standard for classifying goods and service producers
Geographically concentrated or dispersed Dispersion
Large, medium, small businesses: classified by number of employees, number of customers, profit or turnover
Size
Global account, National account, Regionalaccount, A or B or C class accounts
Account status
�$50 000, �$100 000, �$200 000, �$500 000 Account value
Open tender, sealed bid, internet auction, centralized, decentralized
Buying processes
Continuity of supply (reliability), product quality, price, customization, just-in-time, service supportbefore or after sale
Buying criteria
Propensity to switch Satisfied with current suppliers, dissatisfied
Share of customer spend in thecategory
Sole supplier, majority supplier, minority supplier,non-supplier
City, region, country, trading bloc (ASEAN, EU) Geography
Risk averse, innovator Buying style
Classification
Figure 5.6 How business markets are segmented
ISIC 4-digit code
1200
2511
55208030
Activity
Mining of uranium and thorium ores Manufacture of rubber tyres and tubes; re-treading andrebuilding of rubber tyres
Restaurants, bars and canteens Higher education
Figure 5.7 Examples of ISIC codes

134 Customer Relationship Management
Account value Most businesses have a scheme for classifying their customers according to their value. The majority of these schemes associate value with some measure of sales revenue or volume. This is not an adequate measure of value, because it takes no account of the costs to win and keep the customer. We address this issue later in the chapter.
Share of wallet (SOW) Share of category spend gives an indication of the future potential that exists within the account. A supplier with only a 15 per cent share of a customer company’s spending on some raw material has, on the face of it, considerable potential.
Propensity-to-switch Propensity-to-switch may be high or low. It is possible to measure propensity-to-switch by assessing satisfaction with the current supplier, and by computing switching costs. Dissatisfaction alone does not indicate a high propensity to switch. Switching costs may be so high that,
Case 5.1 Customer segmentation at Dell Computer Dell was founded in 1984 with the revolutionary idea of selling custom-built computers directly to the customer. Dell has grown to become one of the world’s larger PC manufacturers and continues to sell directly to individual consumers and organizations.
The direct business model of Dell and the focus on serving business customers has resulted in the organization investing heavily in developing an advanced CRM system to manage its clearly segmented customers. Dell has identifi ed eight customer segments, these being: Global Accounts, Large Companies, Midsize Companies, Federal Government, State and Local Government, Education, Small Companies and Consumers. Dell has organized its business around these eight segments, where each is managed by a complete business unit with its own sales, fi nance, IT, technical support and manufacturing arms.
Governments and trade associations often collect and publish information that indicates the size of each ISIC code. This can be a useful to guide when answering the question, ‘ Which customers should we acquire? ’ However, targeting in the B2B context is often conducted not at the aggregated level of the ISIC, but at an individual account level. The question is not so much, ‘ Do we want to serve this segment? ’ as much as ‘ Do we want to serve this customer? ’
Several of these account-level segmentation variables are specifi cally important for CRM purposes: account value, share of category (share of wallet) spend and propensity-to-switch.

Customer portfolio management 135
even in the face of high levels of dissatisfaction, the customer does not switch. For example, customers may be unhappy with the performance of their telecommunications supplier, but may not switch because of the disruption that such a change would bring about.
Assess the value in a market segment and select which markets to serve A number of target market alternatives should emerge from the market segmentation process. The potential of these to generate value for the company will need to be assessed. The potential value of the segmentation opportunities depends upon answers to two questions:
1. How attractive is the opportunity? 2. How well placed is the company and its network to exploit the
opportunity?
Figure 5.8 identifi es a number of the attributes that can be taken into account during this appraisal. The attractiveness of a market segment is related to a number of issues, including its size and growth potential, the number of competitors and the intensity of competition between them, the barriers to entry, and the propensity of customers to switch from their existing suppliers. The question of company fi t revolves around the issue of the relative competitive competency of the company and its network members to satisfy the requirements of the segment.
Segment attractiveness– size of segment, segment growth rate, price sensitivity of customers, bargaining power of customers, customers’ current relationships with suppliers, barriers to segment entry, barriers to segment exit, number and power of competitors, prospect of new entrants, potential for differentiation, propensity for customer switching
Company and network fit– Does the opportunity fit the company’s objectives, mission, vision and values? Does the company and its network possess the operational, marketing, technological, people and other competencies, and liquidity to exploit the opportunity? Figure 5.8
Evaluating segmentationalternatives
In principle, if the segment is attractive and the company and network competencies indicate a good fi t, the opportunity may be worth pursuing. However, because many companies fi nd that they have several opportunities, some kind of scoring process must be developed and applied to identify the more valuable opportunities. The matrix in Figure 5.9 can be used for this purpose. 2 To begin with, companies need to identify attributes that indicate the attractiveness of a market segment

136 Customer Relationship Management
(some are listed in Figure 5.8 ), and the competencies of the company and its network. An importance weight is agreed for each attribute. The segment opportunity is rated against each attribute and a score is computed. The opportunities can then be mapped into Figure 5.9 .
Fit to company and network competencies
Attra
ctiv
enes
s of
mar
ket s
egm
ent
Strong
woL
Weak
hgiH
Average
muideM
Attractive markets Medium-priority markets Unattractive markets Figure 5.9 McKinsey/General Electric customer portfolio matrix
Sales forecasting The second discipline that can be used for CPM is sales forecasting. One major issue commonly facing companies that conduct CPM is that the data available for clustering customers takes a historical or, at best, present day view. The data identifi es those customers who have been, or presently are, important for sales, profi t or other strategic reasons. If management believes the future will be the same as the past, this presents no problem. However, if the business environment is changeable, this does present a problem. Because CPMs goal is to identify those customers that will be strategically important in the future, sales forecasting can be a useful discipline.
Sales forecasting, some pessimists argue, is a waste of time, because the business environment is rapidly changing and unpredictable. Major world events such as terrorist attacks, war, drought and market-based changes, such as new products from competitors or high visibility promotional campaigns, can make any sales forecasts invalid.

Customer portfolio management 137
There are a number of sales forecasting techniques that can be applied, providing useful information for CPM. These techniques, which fall into three major groups, are appropriate for different circumstances.
● qualitative methods: – customer surveys – sales team estimates ● time-series methods: – moving average – exponential smoothing – time-series decomposition ● causal methods: – leading indicators – regression models.
Qualitative methods are probably the most widely used forecasting methods. Customer surveys ask consumers or purchasing offi cers to give an opinion on what they are likely to buy in the forecasting period. This makes sense when customers forward-plan their purchasing. Data can be obtained by inserting a question into a customer satisfaction survey. For example, ‘ In the next six months are you likely to buy more, the same or less from us than in the current period? ’ And, ‘ If more, or less, what volume do you expect to buy from us? ’ Sometimes, third party organizations such as industry associations or trans-industry groups such as the Chamber of Commerce or the Institute of Directors collect data that indicate future buying intentions or proxies for intention, such as business confi dence.
Sales team estimates can be useful when salespeople have built close relationships with their customers. A key account management team might be well placed to generate several individual forecasts from the team membership. These can be averaged or weighted in some way that refl ects the estimator’s closeness to the customer. Account managers for Dyno Nobel, a supplier of commercial explosives for the mining and quarrying industries, are so close to their customers that they are able to forecast sales two to three years ahead.
Operational CRM systems support the qualitative sales forecasting methods, in particular sales team estimates. The CRM system takes into account the value of the sale, the probability of closing the sale and the anticipated period to closure. Many CRM systems also allow management to adjust the estimates of their sales team members, to allow for overly optimistic or pessimistic salespeople.
Time-series approaches take historical data and extrapolate them forward in a linear or curvilinear trend. This approach makes sense when there are historical sales data, and the assumption can be safely made that the future will refl ect the past. The moving average method is the simplest of these. This takes sales in a number of previous periods and averages them. The averaging process reduces or eliminates random variation. The moving average is computed on successive periods of data, moving on one period at a time, as in Figure 5.10 . Moving averages based on different periods can be calculated on historic data to generate an accurate method.
A variation is to weight the more recent periods more heavily. The rationale is that more recent periods are better predictors. In producing

138 Customer Relationship Management
an estimate for year 2009 in Figure 5.10 , one could weight the previous four years’ sales performance by 0.4, 0.3, 0.2, and 0.1, respectively, to reach an estimate. This would generate a forecast of 5461. This approach is called exponential smoothing.
The decomposition method is applied when there is evidence of cyclical or seasonal patterns in the historical data. The method attempts to separate out four components of the time series: trend factor, cyclical factor, seasonal factor and random factor. The trend factor is the long-term direction of the trend after the other three elements are removed. The cyclical factor represents regular long-term recurrent infl uences on sales; seasonal infl uences generally occur within annual cycles.
It is sometimes possible to predict sales using leading indicators. A leading indicator is some contemporary activity or event that indicates that another activity or event will happen in the future. At a macro level, for example, housing starts are good predictors of future sales of kitchen furniture. At a micro level, when a credit card customer calls into a contact centre to ask about the current rate of interest, this is a strong indicator that the customer will switch to another supplier in the future.
Regression models work by employing data on a number of predictor variables to estimate future demand. The variable being predicted is called the dependent variable; the variables being used as predictors are called independent variables. For example, if you wanted to predict demand for cars (the dependent variable) you might use data on population size, average disposable income, average car price for the category being predicted and average fuel price (the independent variables). The regression equation can be tested and validated on historical data before being adopted. New predictor variables can be substituted or added to see if they improve the accuracy of the forecast. This can be a useful approach for predicting demand from a segment.
Activity-based costing The third discipline that is useful for CPM is activity-based costing. Many companies, particularly those in a B2B context, can trace revenues
Year
20022003200420052006200720082009
2-yearmoving average
488049005040527054955550
4-yearmoving average
4960508552675410
Sales volumes
4830493048705210533056605440 Figure 5.10
Sales forecasting using moving averages

Customer portfolio management 139
to customers. In a B2C environment, it is usually only possible to trace revenues to identifi able customers if the company operates a billing system requiring customer details, or a membership scheme such as a customer club, store-card or a loyalty programme.
In a B2B context, revenues can be tracked in the sales and accounts databases. Costs are an entirely different matter. Because the goal of CPM is to cluster customers according to their strategic value, it is desirable to be able to identify which customers are, or will be, profi table. Clearly, if a company is to understand customer profi tability, it has to be able to trace costs, as well as revenues, to customers.
Costs do vary from customer to customer. Some customers are very costly to acquire and serve, others are not. There can be considerable variance across the customer base within several categories of cost:
● customer acquisition costs : some customers require considerable sales effort to move them from prospect to fi rst-time customer status: more sales calls, visits to reference customer sites, free samples, engineering advice, guarantees that switching costs will be met by the vendor
● terms of trade : price discounts, advertising and promotion support, slotting allowances (cash paid to retailers for shelf space), extended invoice due dates
● customer service costs : handling queries, claims and complaints, demands on salespeople and contact centre, small order sizes, high order frequency, just-in-time delivery, part load shipments, breaking bulk for delivery to multiple sites
● working capital costs : carrying inventory for the customer, cost of credit.
Traditional product-based or general ledger costing systems do not provide this type of detail, and do not enable companies to estimate customer profi tability. Product costing systems track material, labour and energy costs to products, often comparing actual to standard costs. They do not, however, cover the customer-facing activities of marketing, sales and service. General ledger costing systems do track costs across all parts of the business, but are normally too highly aggregated to establish which customers or segments are responsible for generating those costs.
Activity-based costing (ABC) is an approach to costing that splits costs into two groups: volume-based costs and order-related costs. Volume-based (product-related) costs are variable against the size of the order, but fi xed per unit for any order and any customer. Material and direct labour costs are examples. Order-related (customer-related) costs vary according to the product and process requirements of each particular customer.
Imagine two retail customers, each purchasing the same volumes of product from a manufacturer. Customer 1 makes no product or process demands. The sales revenue is $5000; the gross margin for the vendor is $1000. Customer 2 is a different story: customized product, special overprinted outer packaging, just-in-time delivery to three sites, provision of point-of-sale material, sale or return conditions and discounted

140 Customer Relationship Management
price. Not only that, but Customer 2 spends a lot of time agreeing these terms and conditions with a salesperson who has had to call three times before closing the sale. The sales revenue is $5000, but after accounting for product and process costs to meet the demands of this particular customer, the margin retained by the vendor is $250. Other things being equal, Customer 1 is four times as valuable as Customer 2.
Whereas conventional cost accounting practices report what was spent, ABC reports what the money was spent doing. Whereas the conventional general ledger approach to costing identifi es resource costs such as payroll, equipment and materials, the ABC approach shows what was being done when these costs were incurred. Figure 5.11 shows how an ABC view of costs in an insurance company’s claims processing department gives an entirely different picture to the traditional view. 3
General ledger: claims processing department
Salaries
Equipment
Travel expenses
Supplies
Use & Occupancy
Total
ABC view: claims processing dept.
$Key/scan claimsAnalyse claimsSuspend claimsReceive provider enquiriesResolve member problemsProcess batchesDetermine eligibilityMake copiesWrite correspondenceAttend trainingTotal
31 500
32 500
83 40045 000
101 500
119 000
158 000914 500
145 50077 100
121 000
Actual$
620 400
161 200
914 500
58 000
43 900
30 000
Plan$
880 000
60 000
40 000
30000
150 000
600 000
Variance
-----
$
2000
(21 400)
(11 200)
(3900)
(34 500) Figure 5.11 ABC in a claims processingdepartment
ABC gives the manager of the claims-processing department a much clearer idea of which activities create cost. The next question from a CPM perspective is ‘ which customers create the activity? ’ Put another way, which customers are the cost drivers? If you were to examine the activity cost item ‘ Analyse claims: $121 000 ’ , and fi nd that 80 per cent of the claims were made by drivers under the age of 20, you’d have a clear understanding of the customer group that was creating that activity cost for the business.
CRM needs ABC because of its overriding goal of generating profi table relationships with customers. Unless there is a costing system in place to trace costs to customers, CRM will fi nd it very diffi cult to deliver on a promise of improved customer profi tability. Overall, ABC serves customer portfolio management in a number of ways:
1. when combined with revenue fi gures, it tells you the absolute and relative levels of profi t generated by each customer, segment or cohort

Customer portfolio management 141
2. it guides you towards actions that can be taken to return customers to profi t
3. it helps prioritize and direct customer acquisition, retention and development strategies
4. it helps establish whether customization and other forms of value creation for customers pay off.
ABC sometimes justifi es management’s confi dence in the Pareto principle, otherwise known as the 80:20 rule. This rule suggests that 80 per cent of profi ts come from 20 per cent of customers. ABC tells you which customers fall into the important 20 per cent. Research generally supports the 80:20 rule. For example, one report from Coopers and Lybrand found that, in the retail industry, the top 4 per cent of customers account for 29 per cent of profi ts, the next 26 per cent of customers account for 55 per cent of profi ts and the remaining 70 per cent account for only 16 per cent of profi ts.
Lifetime value estimation The fourth discipline that can be used for CPM is customer lifetime value (LTV) estimation, which was fi rst introduced in Chapter 2. LTV is measured by computing the present day value of all net margins (gross margins less cost-to-serve) earned from a relationship with a customer, segment or cohort. LTV estimates provide important insights that guide companies in their customer management strategies. Clearly, companies want to protect and ring-fence their relationships with customers, segments or cohorts that will generate signifi cant amounts of profi t.
Sunil Gupta and Donald Lehmann suggest that customer lifetime value can be computed as follows:
LTV mri r
�� �1
⎛⎝⎜⎜⎜
⎞⎠⎟⎟⎟
where LTV � lifetime value m � margin or profi t from a customer per period (e.g. per year) r � retention rate (e.g. 0.8 or 80%) i � discount rate (e.g. 0.12 or 12%). 4
This means that LTV is equal to the margin (m) multiplied by the factor r /(1 � i � r ). This factor is referred to as the margin multiple, and is determined by both the customer retention rate ( r ) and the discount rate ( i ). For most companies the retention rate is in the region of 60 to 90 per cent. The weighted average cost of capital (WACC), which was discussed in Chapter 2, is generally used to determine the discount rate. The discount rate is applied to bring future margins back to today’s value. Table 5.1 presents some sample margin multiples based on the two variables: customer retention rate and discount rate. For example, at a 12 per cent discount rate and 80 per cent retention rate the margin

142 Customer Relationship Management
multiple is 2.5. From this table, you can see that margin multiples for most companies, given a WACC of 10 to 16 per cent, and retention rates between 60 and 90 per cent, are between 1.07 � and 4.5 � . When the discount rate is high, the margin multiple is lower. When customer retention rates are higher, margin multiples are higher.
The table can be used to compute customer value in this way. If you have a customer retention rate of 90 per cent and your WACC is 12 per cent and your customer generates $100 margin in a year, the LTV of the customer is about $400 (or $409 to be precise; i.e. 4.09 times $100). The same mathematics can be applied to segments or cohorts of customers. Your company may serve two clusters of customers, A and B. Customers from cluster A each generate annual margin of $400; cluster B customers each generate $200 margin. Retention rates vary between clusters. Cluster A has a retention rate of 80 per cent; cluster B customers have a retention rate of 90 per cent. If the same WACC of 12 per cent is applied to both clusters, then the LTV of a customer from cohort A is $1000 ($400 � 2.50), and the LTV of a cohort B customer is $818 ($200 � 4.09). If you have 500 customers in cluster A, and 1000 customers in cluster B, the LTV of your customer base is $1 318 000, computed thus: ((500 � $1000) � (1000 � $818)).
Application of this formula means that you do not have to estimate customer tenure. As customer retention rate rises there is an automatic lift in customer tenure, as shown in Table 2.2 in Chapter 2. This formula can be adjusted to consider change in both future margins and retention rates either up or down, as described in Gupta and Lehmann’s book Managing Customers as Investments .5
The table can be used to assess the impact of a number of customer management strategies: what would be the impact of reducing cost-to-serve by shifting customers to low-cost self-serve channels? What would be the result of cross-selling higher margin products? What would be the outcome of a loyalty programme designed to increase retention rate from 80 to 82 per cent?
An important additional benefi t of this LTV calculation is that it enables you to estimate a company’s value. For example, it has been computed that the LTV of the average US-based American Airlines
Table 5.1 Margin multiples
Retention rate Discount rate
10% 12% 14% 16%
60% 1.20 1.15 1.11 1.0770% 1.75 1.67 1.59 1.5280% 2.67 2.50 2.35 2.2290% 4.50 4.09 3.75 3.46

Customer portfolio management 143
customer is $166.94. American Airlines has 43.7 million such customers, yielding an estimated company value of $7.3 billion. Roland Rust and his co-researchers noted that, given the absence of international passengers and freight considerations from this computation, it was remarkably close to the company’s market capitalization at the time their research was undertaken. 6
Data mining The fi fth discipline that can be used for CPM is data mining. It has particular value when you are trying to fi nd patterns or relationships in large volumes of data, as found in B2C contexts such as retailing, banking and home shopping.
An international retailing operation like Tesco, for example, has over 14 million Clubcard members in its UK customer base. Not only does the company have the demographic data that the customer provided on becoming a club member, but also the customer’s transactional data. If ten million club members use Tesco in a week and purchase an average basket of 30 items, Tesco’s database grows by 300 million pieces of data per week. This is certainly a huge cost, but potentially a major benefi t.
Data mining can be thought of as the creation of intelligence from large quantities of data. Customer portfolio management needs intelligent answers to questions such as these:
1. How can we segment the market to identify potential customers? 2. How can we cluster our current customers? 3. Which customers offer the greatest potential for the future? 4. Which customers are most likely to switch?
Data mining can involve the use of statistically advanced techniques, but fortunately managers do not need to be technocrats. It is generally suffi cient to understand what the tools can do, how to interpret the results, and how to perform data mining.
Two of the major vendors of data mining tools have developed models to guide users through the data mining process. SAS promotes a fi ve-step data mining process called SEMMA (sample, explore, modify, model, assess) and SPSS opts for the 5As (assess, access, analyse, act and automate). These models, though different in detail, essentially promote a common step-wise approach. The fi rst step involves defi ning the business problem (such as the examples listed above). Then you have to create a data mining database. Best practice involves extracting historical data from the data warehouse, creating a special mining data mart, and exploring that dataset for the patterns and relationships that can solve your business problem. The problem-solving step involves an iterative process of model-building, testing and refi nement. Data miners often divide their dataset into two subsets. One is used for model training, i.e. estimating the model parameters, and the other is used for model validation. Once a model is developed that appears to solve the business
144 Customer Relationship Management
problem, it can be adopted by management. As new data is loaded into the data warehouse, further subsets can be extracted to the data mining data mart and the model can be subjected to further refi nement.
A number of different data mining tools are applicable to CPM problems: clustering, decision trees and neural networks.
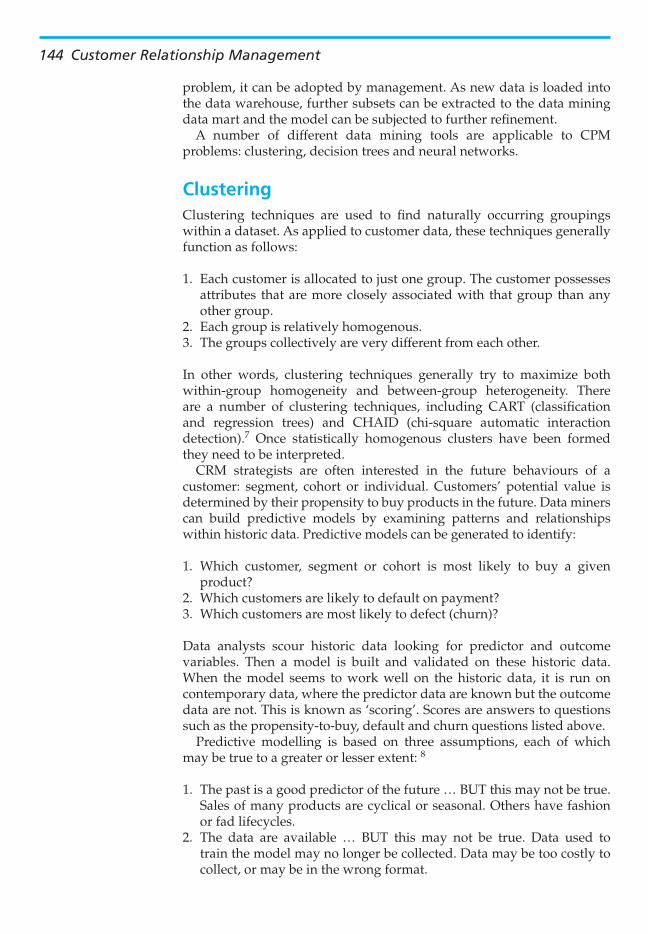
Clustering Clustering techniques are used to fi nd naturally occurring groupings within a dataset. As applied to customer data, these techniques generally function as follows:
1. Each customer is allocated to just one group. The customer possesses attributes that are more closely associated with that group than any other group.
2. Each group is relatively homogenous. 3. The groups collectively are very different from each other.
In other words, clustering techniques generally try to maximize both within-group homogeneity and between-group heterogeneity. There are a number of clustering techniques, including CART (classifi cation and regression trees) and CHAID (chi-square automatic interaction detection).7 Once statistically homogenous clusters have been formed they need to be interpreted.
CRM strategists are often interested in the future behaviours of a customer: segment, cohort or individual. Customers ’ potential value is determined by their propensity to buy products in the future. Data miners can build predictive models by examining patterns and relationships within historic data. Predictive models can be generated to identify:
1. Which customer, segment or cohort is most likely to buy a given product?
2. Which customers are likely to default on payment? 3. Which customers are most likely to defect (churn)?
Data analysts scour historic data looking for predictor and outcome variables. Then a model is built and validated on these historic data. When the model seems to work well on the historic data, it is run on contemporary data, where the predictor data are known but the outcome data are not. This is known as ‘ scoring ’ . Scores are answers to questions such as the propensity-to-buy, default and churn questions listed above.
Predictive modelling is based on three assumptions, each of which may be true to a greater or lesser extent: 8
1. The past is a good predictor of the future … BUT this may not be true. Sales of many products are cyclical or seasonal. Others have fashion or fad lifecycles.
2. The data are available … BUT this may not be true. Data used to train the model may no longer be collected. Data may be too costly to collect, or may be in the wrong format.

Customer portfolio management 145
3. Customer-related databases contain what you want to predict … BUT this may not be true. The data may not be available. If you want to predict which customers are most likely to buy mortgage protection insurance, and you only have data on life policies, you will not be able to answer the question.
Two tools that are used for predicting future behaviours are decision trees and neural networks.
Decision trees Decision trees are so called because the graphical model output has the appearance of a branch structure. Decision trees work by analysing a dataset to fi nd the independent variable that, when used to split the population, results in nodes that are most different from each other with respect to the variable you are tying to predict. Figure 5.12 contains a set of data about fi ve customers and their credit risk profi le. 9
Income
High
High
High
Low
Low
Married?
Yes
Yes
No
Yes
Yes
Risk
Good
Good
Poor
Poor
Poor
Name
Joe
Sue
John
Mary
Fred
Debt
High
Low
Low
High
Low
Figure 5.12 Credit risk training set
We want to use the data in four of the fi ve columns to predict the risk rating in the fi fth column. A decision tree can be constructed for this purpose.
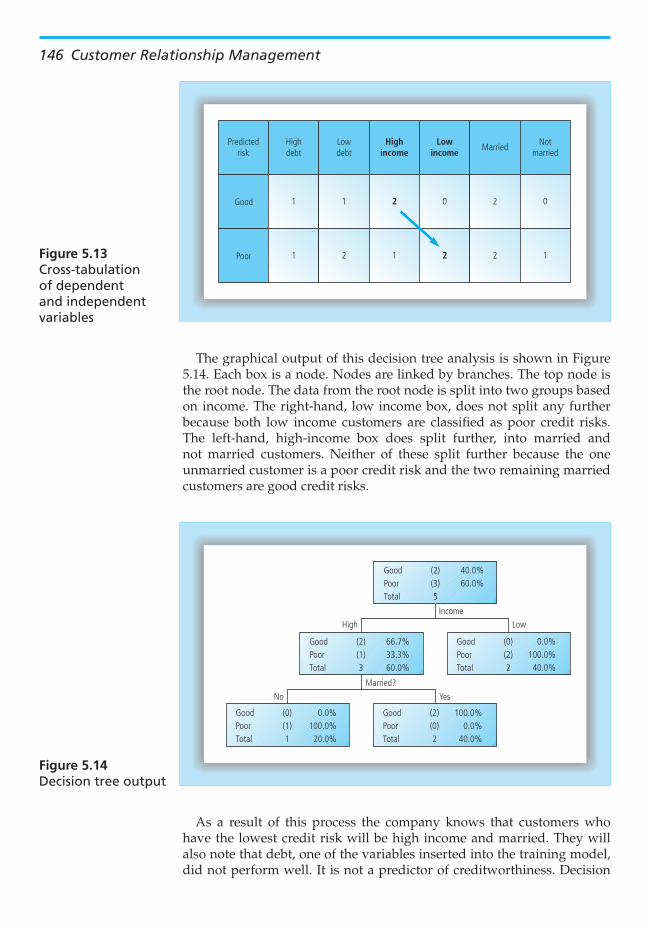
In decision tree analysis, Risk is in the ‘ dependent ’ column. This is also known as the target variable. The other four columns are independent columns. It is unlikely that the customer’s name is a predictor of Risk, so we will use the three other pieces of data as independent variables: debt, income and marital status. In the example, each of these is a simple categorical item, each of which only has two possible values (high or low; yes or no). The data from Figure 5.12 are represented in a different form in Figure 5.13 , in a way which lets you see which independent variable is best at predicting risk. As you examine the data, you will see that the best split is income (four instances highlighted in bold on the diagonal: two high income/good risk plus two low income/poor risk). Debt and marital status each score three on their diagonals.
Once a node is split, the same process is performed on each successive node, either until no further splits are possible or until you have reached a managerially useful model.
146 Customer Relationship Management
The graphical output of this decision tree analysis is shown in Figure 5.14 . Each box is a node. Nodes are linked by branches. The top node is the root node. The data from the root node is split into two groups based on income. The right-hand, low income box, does not split any further because both low income customers are classifi ed as poor credit risks. The left-hand, high-income box does split further, into married and not married customers. Neither of these split further because the one unmarried customer is a poor credit risk and the two remaining married customers are good credit risks.
IncomeLowHigh
Married?
YesNo
GoodPoorTotal
(0)(1)1
0.0%100.0%
20.0%
GoodPoorTotal
(2)(0)2
100.0%0.0%
40.0%
GoodPoorTotal
GoodPoorTotal
GoodPoorTotal
(2)(1)3
(0)(2)2
(2)(3)5
66.7%33.3%60.0%
0.0%100.0%40.0%
40.0%60.0%
Figure 5.14 Decision tree output
Predictedrisk
Good
Poor
Highdebt
Lowdebt
Highincome
Lowincome
MarriedNot
married
2 0 02
11
1 1
2 1 2 2 Figure 5.13 Cross-tabulation of dependent and independent variables
As a result of this process the company knows that customers who have the lowest credit risk will be high income and married. They will also note that debt, one of the variables inserted into the training model, did not perform well. It is not a predictor of creditworthiness. Decision

Customer portfolio management 147
trees that work with categorical data such as these are known as classifi cation trees. When decision trees are applied to continuous data they are known as regression trees.
Neural networks Neural networks are another way of fi tting a model to existing data for prediction purposes. The expression ‘ neural network ’ has its origins in the work of machine learning and artifi cial intelligence. Researchers in this fi eld have tried to learn from the natural neural networks of living creatures.
Neural networks can produce excellent predictions from large and complex datasets containing hundreds of interactive predictor variables, but the neural networks are neither easy to understand nor straightforward to use. Neural networks represent complex mathematical equations, with many summations, exponential functions and parameters. 10
Like decision trees and clustering techniques, neural networks need to be trained to recognize patterns on sample datasets. Once trained, they can be used to predict customer behaviour from new data. They work well when there are many potential predictor variables, some of which are redundant.
Case 5.2 Customer portfolio management at Tesco Tesco, the largest and most successful supermarket chain in the UK, has developed a CRM strategy that is the envy of many of its competitors. Principally a food retailer in a mature market that has grown little in the last 20 years, Tesco realized that the only route to growth was taking market share from competitors. Consequently, the development of a CRM strategy was seen as imperative.
In developing its CRM strategy, Tesco fi rst analysed its customer base. It found that the top 100 customers were worth the same as the bottom 4000. It also found that the bottom 25 per cent of customers represented only 2 per cent of sales, and that the top 5 per cent of customers were responsible for 20 per cent of sales.
The results of this analysis were used to segment Tesco’s customers and to develop its successful loyalty programmes.
CPM in the business-to-business context Many B2B companies classify their customers into groups based on sales revenue. They believe that their best customers are their biggest customers. Some of these companies consciously apply the Pareto

148 Customer Relationship Management
principle, recognizing that 80 per cent of sales are made to 20 per cent of customers, as shown in Figure 5.15 .
Top 20%by volume
Bottom 20%by volume
Quintile
Sale
s
Figure 5.15 The Pareto principle, or 80:20 rule
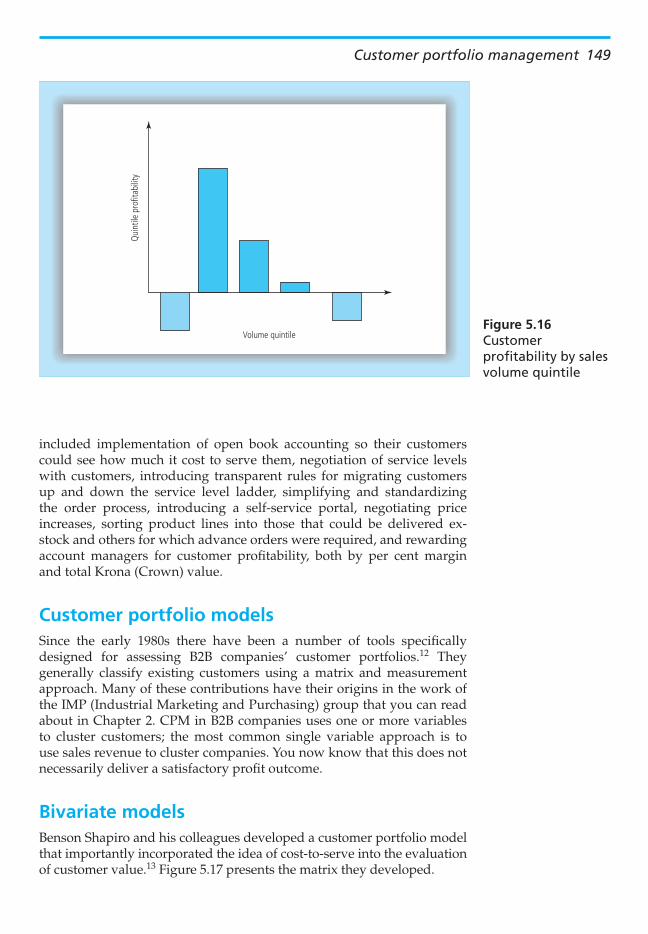
Having clustered their customers by volume, they may then assign their best representatives, and offer the best service and terms of trade to these, the biggest and best customers. The assumption is often made in B2B contexts that large accounts are profi table accounts. Activity-based costing tells us that this is not necessarily so. It is not uncommon to fi nd that small customers are unprofi table because their activity costs are greater than the margins they generate. Similarly, many companies fi nd that their largest accounts are also unprofi table. Why? Large accounts create more work, more activity. The work of managing the account might require the services of a large number of people: a sales manager, a customer service executive and an applications engineer among others. The customer might demand customized product, delivery in less than container loads, just-in-time delivery, extended due dates for payment, and, ultimately, volume discounts on price. Very often it is the mid-range sales volume customers that are the most profi table. Figure 5.16 shows the profi tability of customers who have been previously clustered according to volume. The chart shows that the top 20 per cent of customers by volume are unprofi table, just as are the bottom 20 per cent by volume.
When Kanthal, a Swedish manufacturer of electrical resistance heating elements, introduced ABC they found that only 40 per cent of their customers were profi table. Two of their top three sales volume customers were among the most unprofi table. The most profi table 5 per cent of customers generated 150 per cent of profi ts. The least profi table 10 per cent lost 120 per cent of profi t. The challenge for Kanthal was deciding what to do with the unprofi table customers. 11 Their options
Customer portfolio management 149
included implementation of open book accounting so their customers could see how much it cost to serve them, negotiation of service levels with customers, introducing transparent rules for migrating customers up and down the service level ladder, simplifying and standardizing the order process, introducing a self-service portal, negotiating price increases, sorting product lines into those that could be delivered ex-stock and others for which advance orders were required, and rewarding account managers for customer profi tability, both by per cent margin and total Krona (Crown) value.
Customer portfolio models Since the early 1980s there have been a number of tools specifi cally designed for assessing B2B companies ’ customer portfolios. 12 They generally classify existing customers using a matrix and measurement approach. Many of these contributions have their origins in the work of the IMP (Industrial Marketing and Purchasing) group that you can read about in Chapter 2. CPM in B2B companies uses one or more variables to cluster customers; the most common single variable approach is to use sales revenue to cluster companies. You now know that this does not necessarily deliver a satisfactory profi t outcome.
Bivariate models Benson Shapiro and his colleagues developed a customer portfolio model that importantly incorporated the idea of cost-to-serve into the evaluation of customer value. 13 Figure 5.17 presents the matrix they developed.
Volume quintile
Qui
ntile
pro
fitab
ility
Figure 5.16 Customer profi tability by sales volume quintile

150 Customer Relationship Management
In this model customers are classifi ed according to the price they pay and the costs incurred by the company to acquire and serve them. Four classes of customer are identifi ed: carriage trade (often newly acquired customers who are costly to serve but pay a relatively high price), passive customers, aggressive customers and bargain basement customers. The important contribution of this model is that it recognizes that costs are not evenly distributed across the customer base. Some customers are more costly to win and serve and, if this is accompanied by a relatively low received price, the customer may be unprofi table. Table 5.2 shows how costs can vary before the sale, in production, in distribution and after the sale.
Passive
Rece
ived
pric
eLo
w
Low HighCost-to-serve
High
Carriagetrade
Bargain basement Aggressive
Figure 5.17 Shapiro et al. customerclassifi cation matrix
Pre-sale costs Production costs Distribution costs Post-sale costs
Geographic location: close versus distant
Order size Shipment consolidation Training
Prospecting Set-up time Preferred transportation mode
Installation
Sampling Scrap rate Back-haul opportunity Technical support
Human resource: management versus representatives
Customization Location: close versus distant
Repairs and maintenance
Service: design support, applications engineering
Order timing Logistics support, e.g. fi eld inventory
Table 5.2 How costs vary between customers

Customer portfolio management 151
Renato Fiocca created an advance in customer portfolio modelling when he introduced his two-step approach. 14 At the fi rst step customers are classifi ed according to:
1. the strategic importance of the customer 2. the diffi culty of managing the relationship with the customer.
The strategic importance of a customer is determined by:
● the value/volume of the customer’s purchases ● the potential and prestige of the customer ● customer market leadership ● general desirability in terms of diversifi cation of the supplier’s
markets, providing access to new markets, improving technological expertise and the impact on other relationships.
The diffi culty of managing the customer relationship is related to:
● product characteristics, such as novelty and complexity ● account characteristics, such as the customer’s needs and requirements,
customer’s buying behaviour, customer’s power, customer’s technical and commercial competence and the customer’s preference to do business with a number of suppliers
● competition for the account, which is assessed by considering the number of competitors, the strength and weaknesses of competitors and the competitors ’ position vis à vis the customer.
On the basis of this information it is possible to construct a two-dimensional matrix as in Figure 5.18 .
Keydifficult
Diffi
culty
in m
anag
ing
the
cust
omer
Strategic importance of the account
woL
LowHigh
High
Non-keydifficult
Keyeasy
Non-keyeasy
Figure 5.18 Fiocca’s CPM model: step 1

152 Customer Relationship Management
The second step involves further analysis of the key accounts, shown in the left-hand cells of Figure 5.18 . They are classifi ed according to:
● the customer’s business attractiveness ● the relative strength of the buyer/seller relationship.
The attractiveness of the customer’s business is strongly infl uenced by conditions in the customer’s served market. Fiocca identifi es these as market factors, competition, fi nancial and economic factors, technological factors and socio-political factors, as detailed in Table 5.3 .
Market factors Size of key segments served by customer Customer’s share of key segments Customer’s growth rate Customer’s infl uence on the market
Competition in the customer’s market Customer’s position and strength Customer’s vulnerability to substitutes Customer’s level of integration
Socio-political factors Customer’s ability to adapt and fi t
Financial and economic factors Customer’s margins Customer’s scale and experience Barriers to customer’s entry or exit Customer’s capacity utilization
Technological factors Customer’s ability to cope with change Depth of customer’s skills Types of technological know-how Level of customer patent protection
Table 5.3 Factors infl uencing the customer’s attractiveness(Fiocca’s model)
The strength of the customer relationship is determined by:
● the length of relationship ● the volume or dollar value of purchases ● the importance of the customer (percentage of supplier’s sales accounted
for by this customer) ● personal friendships ● cooperation in product development ● management distance (language and culture) ● geographical distance.
The data from this second step are then entered into a fi nal nine-cell matrix, as shown in Figure 5.19 , which point to three core customer management strategies: hold, withdraw or improve.
There have been a couple of published validations of this model, 15 but it has been criticized for its failure to consider customer profi tability, and its rejection of non-key customers at step 1.
Customer portfolio management 153
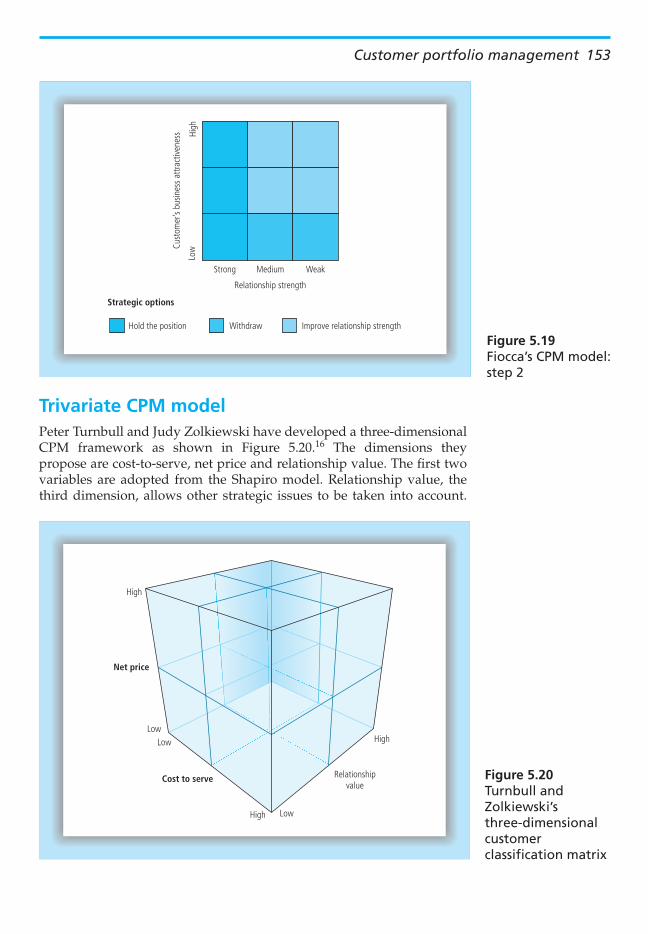
Trivariate CPM model Peter Turnbull and Judy Zolkiewski have developed a three-dimensional CPM framework as shown in Figure 5.20 . 16 The dimensions they propose are cost-to-serve, net price and relationship value. The fi rst two variables are adopted from the Shapiro model. Relationship value, the third dimension, allows other strategic issues to be taken into account.
High
LowCu
stom
er’s
busin
ess
attra
ctiv
enes
s
Strong Medium Weak
Relationship strength
Strategic options
WithdrawHold the position Improve relationship strength
Figure 5.19 Fiocca’s CPM model: step 2
High
Low
Low
Relationshipvalue
HighLow
High
Net price
Cost to serve Figure 5.20 Turnbull and Zolkiewski’s three-dimensionalcustomerclassifi cation matrix

154 Customer Relationship Management
Relationship value is ‘ softer ’ or more judgemental than the other two dimensions. Among the questions considered when forming a judgement on relationship value are the following:
1. Are the goods or services critical to the customer? 2. Is the customer a major generator of volume for the supplier? 3. Would the customer be hard to replace if he switched to another
supplier? 4. Does the customer generate cost savings for the supplier?
Additional customer portfolio management tools In addition to specifi cally designed CPM tools there are a number of other tools in common use for strategic planning. These can also be very useful for CRM applications. These tools, however, operate at company-specifi c levels. This means that a CRM strategist would apply the tools to a specifi c customer to help in the assessment of that customer’s future value. Among the tools are SWOT analysis, PESTE analysis, fi ve-forces analysis and BCG matrix analysis.
We’ll introduce them here briefl y. For a fuller report you’d be well advised to refer to any basic corporate strategy or marketing strategy book.
SWOT and PESTE SWOT is an acronym for strengths, weaknesses, opportunities and threats. SWOT analysis explores the internal environment (S and W) and the external environment (O and T) of a strategic business unit. The internal (SW) audit looks for strengths and weaknesses in the business functions of sales, marketing, manufacturing or operations, fi nance and people management. It then looks cross-functionally for strengths and weaknesses in, for example, cross-functional processes (such as new product development) and organizational culture.
The external (OT) audit analyses the macro- and micro-environments in which the customer operates. The macro-environment includes a number of broad conditions that might impact on a company. These conditions are identifi ed by a PESTE analysis. PESTE is an acronym for political, economic, social, technological and environmental conditions. An analysis would try to pick out major conditions that impact on a business, as illustrated below:
● political environment : demand for international air travel contracted as worldwide political stability was reduced after September 11, 2001
● economic environment : demand for mortgages falls when the economy enters recession

Customer portfolio management 155
● social environment : as a population ages, demand for healthcare and residential homes increase
● technological environment : as more households become owners of computers, demand for Internet banking increases
● environmental conditions : as customers become more concerned about environmental quality, demand for more energy effi cient products increases.
The micro environmental part of the external (OT) audit examines relationships between a company and its immediate external stake-holders: customers, suppliers, business partners and investors.
A CRM-oriented SWOT analysis would be searching for customers or potential customers that emerge well from the analysis. These would be customers that:
1. possess relevant strengths to exploit the opportunities open to them 2. are overcoming weaknesses by partnering with other organizations to
take advantage of opportunities 3. are investing in turning around the company to exploit the
opportunities 4. are responding to external threats in their current markets by
exploiting their strengths for diversifi cation.
Five forces The fi ve-forces analysis was developed by Michael Porter. 17 He claimed that the profi tability of an industry, as measured by its return on capital employed relative to its cost of capital, was determined by fi ve sources of competitive pressure. These fi ve sources include three horizontal and two vertical conditions. The horizontal conditions are:
● competition within the established businesses in the market ● competition from potential new entrants ● competition from potential substitutes.
The vertical conditions refl ect supply and demand chain considerations:
● the bargaining power of buyers ● the bargaining power of suppliers.
Porter’s basic premise is that competitors in an industry will be more profi table if these fi ve conditions are benign. For example, if buyers are very powerful, they can demand high levels of service and low prices, thus negatively infl uencing the profi tability of the supplier. However, if barriers to entry are high, say because of large capital requirements or dominance of the market by very powerful brands, then current players will be relatively immune from new entrants and enjoy the possibility of better profi ts.
Why would a CRM-strategist be interested in a fi ve-forces evaluation of customers? Fundamentally, a fi nancially healthy customer offers

156 Customer Relationship Management
better potential for a supplier than a customer in fi nancial distress. The analysis points to different CRM solutions:
1. Customers in a profi table industry are more likely to be stable for the near-term, and are better placed to invest in opportunities for the future. They therefore have stronger value potential. These are customers with whom a supplier would want to build an exclusive and well-protected relationship.
2. Customers in a stressed industry might be looking for reduced cost inputs from its suppliers, or for other ways that they can add value to their offer to their own customers. A CRM-oriented supplier would be trying to fi nd ways to serve this customer more effectively, perhaps by stripping out elements of the value proposition that are not critical, or by adding elements that enable the customer to compete more strongly.
BCG matrix The Boston Consulting Group matrix was designed to analyse a company’s product portfolio with a view to drawing strategy prescriptions. The analysis takes into account two criteria, relative market share and market growth rate, to identify where profi ts and cash fl ow are earned. Figure 5.21 is a sample BCG matrix. The BCG claims that the best indicator of a market’s attractiveness is its growth rate (hence the vertical axis of the matrix) and that the best indicator of competitive strength is relative market share (the horizontal axis). Relative market share, that is the market share of the business unit relative to its largest competitor, is claimed to improve the relative cost position due to the experience curve.
Star
Relative market share
Mar
ket
grow
th
10x
Low
0.1x
High
Question mark
Cash cow
1x
Cash use equalscash generation Heavy cash users
Cash generators Cash users
Strategy:Grow and build
Strategy:Aggressive growth
or divest
Strategy:Maintain and milk
Strategy:Divest
Product evolution Direction of cash movement
Dog
Figure 5.21 Boston Consulting Group matrix

Customer portfolio management 157
The matrix categorizes products in a portfolio into one of four boxes and prescribes certain strategies: milk the cows, invest in the stars, ditch the dogs and then sort the question marks into those that you want to support as they become stars, and the remainder that you expect to convert into dogs.
A balanced portfolio of products contains question marks, stars and cash cows. Cash cows generate the cash fl ow that supports the question marks. As the question marks grow their relative market share, and become stars, they are establishing a position in the market that will eventually yield strong positive cash fl ows. This happens when a leading product maintains that position in a mature market.
From a CRM perspective, a customer with a balanced portfolio of products of its own has greater lifetime potential for a supplier than a customer with an unbalanced portfolio. A company with no new products in the pipeline will struggle to remain viable when the existing cash cows dry up. This happens as competitors fi ght to win market share and substitutes emerge.
Strategically signifi cant customers The goal of this entire analytical process is to cluster customers into groups so that differentiated value propositions and relationship management strategies can be applied. One outcome will be the identifi cation of customers that will be strategically signifi cant for the company’s future. We call these strategically signifi cant customers (SSCs). There are several classes of SSC, as follows:
1. High future lifetime value customers : these customers will contribute signifi cantly to the company’s profi tability in the future.
2. High volume customers : these customers might not generate much profi t, but they are strategically signifi cant because of their absorption of fi xed costs, and the economies of scale they generate to keep unit costs low.
3. Benchmark customers : these are customers that other customers follow. For example, Nippon Conlux supplies the hardware and software for Coca Cola’s vending operation. While they might not make much margin from that relationship, it has allowed them to gain access to many other markets. ‘ If we are good enough for Coke, we are good enough for you ’ , is the implied promise. Some IT companies create ‘ reference sites ’ at some of their more demanding customers.
4. Inspirations : these are customers who bring about improvement in the supplier’s business. They may identify new applications for a product, product improvements, or opportunities for cost reductions. They may complain loudly and make unreasonable demands, but in doing so, force change for the better.

158 Customer Relationship Management
5. Door openers : these are customers that allow the supplier to gain access to a new market. This may be done for no initial profi t, but with a view to proving credentials for further expansion. This may be particularly important if crossing cultural boundaries, say between west and east.
One company, a Scandinavian processor of timber, has identifi ed fi ve major customer groups that are strategically signifi cant, as in Figure 5.22 .
1. Economic return2. Future business potential3. Learning value4. Reference value5. Strategic value by
providing access to new marketsstrengthening incumbent positionsbuilding barriers to new entrants
This company considers 5 attributes in identifying theirstrategically significant customers
Figure 5.22 Strategically signifi cant customers at a Scandinavian timber processor
The seven core customer management strategies This sort of analysis pays off when it helps companies develop and implement differentiated CRM strategies for clusters of customers in the portfolio. There are several core customer management strategies:
1. Protect the relationship : this makes sense when the customer is strategically signifi cant and attractive to competitors. We discuss the creation of exit barriers in our review of customer retention strategies in Chapter 9.
2. Re-engineer the relationship : in this case, the customer is currently unprofi table or less profi table than desired. However, the customer could be converted to profi t if costs were trimmed from the relationship. This might mean reducing or automating service levels, or servicing customers through lower cost channels. In the banking industry, transaction processing costs, as a multiple of online processing costs are as follows. If Internet transaction processing has a unit cost of 1, an in-bank teller transaction costs 120 units, an ATM transaction costs 40, telephone costs 30 and PC banking costs 20. In other words, it is 120 times more expensive to conduct an in-bank transaction than the identical online transaction. Cost-reduction programmes have

Customer portfolio management 159
motivated banks to migrate their customers, or at least some segments of customers, to other lower cost channels. An Australian electricity company has found that its average annual margin per customer is $60. It costs $13 to serve a customer who pays by credit card, but only 64 cents to service a direct debit customer. Each customer moved to the lower cost channel therefore produces a transaction cost saving of more than $12, which increases the average customer value by 20 per cent. Re-engineering a relationship requires a clear understanding of the activities that create costs in the relationship (see Case 5.3).
3. Enhance the relationship : like the strategy above, the goal is to migrate the customer up the value ladder. In this case it is done not by re-engineering the relationship, but by increasing your share of customer spend on the category, and by identifying up-selling and cross-selling opportunities.
4. Harvest the relationship : when your share of wallet is stable, and you do not want to invest more resources in customer development, you may feel that the customer has reached maximum value. Under these conditions you may wish to harvest, that is, optimize cash fl ow from the customer with a view to using the cash generated to develop other customers. This may be particularly appealing if the customer is in a declining market, has a high cost-to-serve or has a high propensity-to-switch to competitors.
5. End the relationship : sacking customers is generally anathema to sales and marketing people. However, when the customer shows no sign of making a signifi cant contribution in the future it may be the best option. You can read about strategies for sacking customers in Chapter 9.
6. Win back the customer : sometimes customers take some or all of their business to other suppliers. If they are not strategically signifi cant, it may make sense to let them go. However, when the customer is important, you may need to develop and implement win back strategies. The starting point must be to understand why they took their business away.
7. Start a relationship : you’ve identifi ed a prospect as having potential strategic signifi cance for the future. You need to develop an acquisition plan to recruit the customer onto the value ladder. You can read about customer acquisition strategies in Chapter 8.
Case 5.3 Sales support varies by segment at Syngenta Syngenta, a leading global agribusiness organization, sought to segment the global market for crop protection products, such as herbicides and pesticides. Using qualitative and quantitative data Syngenta identifi ed four segments among farmers.
1. ‘ Professionals ’ : these are large spenders and keen to trial new technologies. 2. ‘ Progressives ’ : these have large landholdings and are early adopters of new technologies.

160 Customer Relationship Management
3. ‘ Traditionalists ’ : these are older and spend the least on crop protection products. 4. ‘ Operators ’ : these are pessimistic about farming and have diffi culty in keeping up to date
with new technologies and farming practices.
Syngenta now uses these four segments to guide all of its marketing activities. Service levels vary between segments. Face-to-face communications are available to professionals and progressives, and direct mail is used for traditionalists and operators.
Summary In this chapter you have learned about customer portfolio management. CPM is an essential component of strategic CRM. CPM is underpinned by analysis that clusters customers into groups that can then be treated to differentiated value propositions and customer management strategies. It strives to do this by estimating the current and future value of each group, taking into account the revenues each group will generate and the costs that will be incurred in acquiring and serving those customers. A number of basic disciplines underpin the CPM process: market segmentation, sales forecasting, activity-based costing, customer lifetime value estimation, and data mining. Market segmentation, which is widely practised by marketing management, needs to have a clear focus on customer value when used for CPM purposes. A number of sales forecasting techniques can also be used to estimate what customers are likely to buy in the future. Activity-based costing enables companies to understand the costs of marketing, selling and servicing customers, and consequently customer profi tability. Customer lifetime value estimation models can be used to evaluate a customer’s future worth to a company, and data mining techniques are particularly useful for detecting patterns and relationships within historic customer data.
The CPM processes tend to differ from business-to-consumer to business-to-business contexts. Not only have a number of portfolio analysis tools been developed specifi cally for B2B contexts, but activity-based costing is more easily applied in B2B contexts, whereas data mining is more visible in B2C contexts.
The purpose of all this analysis is to disaggregate potential and current customers into subsets so that different value propositions and relationship management strategies can be developed for each group. We close the chapter by identifying seven core customer management strategies that can be applied selectively across the customer portfolio.
References 1. Levitt , T. ( 1960 ) Marketing myopia . Harvard Business Review , July–
August , pp. 45 – 56 . 2. Day , G.S. ( 1986 ) Analysis for strategic market decisions . St Paul, MN:
West Publishing .

Customer portfolio management 161
3. Cokins , G. ( 1996 ) Activity-based cost management: making it work . London: McGraw-Hill .
4. Gupta , S. and Lehmann , D.R. ( 2005 ) Managing customers as investments: the strategic value of customers in the long run . Philadelphia: Wharton School Publishing .
5. Gupta , S. and Lehmann , D.R. ( 2005 ) Managing customers as investments: the strategic value of customers in the long run . Philadelphia: Wharton School Publishing .
6. Rust , R.T. , Lemon , K.N. and Narayandas , D. ( 2005 ) Customer equity management . Upper Saddle River, NJ: Pearson Prentice Hall .
7. Saunders , J. ( 1994 ) Cluster analysis . In: G.J. Hooley and M.K. Hussey (eds) . Quantitative methods in marketing . London: Dryden Press , pp. 13 – 28 .
8. Berry , M.J.A. and Linoff , G.S. ( 2000 ) Data mining: the art and science of customer relationship management . New York: John Wiley .
9. The illustration is taken from Brand, E. and Gerritsen, R. DecisionTrees . Available online at http://www.dbmsmag.com/9807m05.html
10. Berry , M.J.A. and Linoff , G.S. ( 2000 ) Data mining: the art and science of customer relationship management . New York: John Wiley .
11. Kanthal, A. Harvard Business School case study number 9–190–002. Robert S. Kaplan, author.
12. Reviewed by Zolkiewski, J. and Turnbull, P. (1999) A review of customer relationships planning: does customer profi tability and portfolio analysis provide the key to successful relationship management? UMIST, Manchester, UK: MSM Working Paper Series. See also Zolkiewski, J. (2005) Customer portfolios. Blackwell Encyclopaedia of Marketing , pp. 1–87, and Johnson, M.D. and Selnes, F. (2004) Customer portfolio management: towards a dynamic theory of exchange relationships. Journal of Marketing, Vol. 68(2), pp. 1–17.
13. Shapiro , B.P. , Rangan , K.V. , Moriarty , R.T. and Ross , E.B. ( 1987 ) Manage customers for profi ts (not just sales) . Harvard Business Review , September–October , pp. 101 – 108 .
14. Fiocca , R. ( 1982 ) Account portfolio analysis for strategy development .Industrial Marketing Management , Vol. 11 , pp. 53 – 62 .
15. Turnbull, P.W. and Topcu, S. (1994) Customers ’ profi tability in relationship life-cycles. Proceedings of the 10th IMP conference, Groningen, Netherlands; Yorke, D.A. and Droussiotis, G. (1994) The use of customer portfolio theory: an empirical survey. Journal of Business and Industrial Marketing , Vol. 9(3), pp. 6–18.
16. Turnbull , P. and Zolkiewski , J. ( 1997 ) Profi tability in customer portfolio planning . In: D. Ford (ed.) . Understanding business markets , 2nd edn. London: Dryden Press .
17. Porter , M.E. ( 1980 ) Competitive strategy: techniques for analysing industries and competitors . New York: Free Press .