Measuring human development: a stochastic dominance approach
Upload
independentCategory
view
2download
0
APPLIED AND ENVIRONMENTAL MICROBIOLOGY, July 2007, p. 4532–4542 Vol. 73, No. 140099-2240/07/$08.00�0 doi:10.1128/AEM.02956-06Copyright © 2007, American Society for Microbiology. All Rights Reserved.
Serial Analysis of rRNA Genes and the Unexpected Dominance ofRare Members of Microbial Communities�
Matthew N. Ashby,1* Jasper Rine,2 Emmanuel F. Mongodin,3
Karen E. Nelson,3,4 and Dago Dimster-Denk1
Taxon Biosciences, Inc., 3152 Paradise Drive, Tiburon, California 949201; Department of Molecular and Cell Biology,University of California, 16 Barker Hall, Berkeley, California 94720–32022; The Institute for Genomic Research,
J. Craig Venter Institute, 9712 Medical Center Drive, Rockville, Maryland 208503; and Howard University,Department of Biology, 415 College Avenue, NW, Washington, D.C. 200594
Received 20 December 2006/Accepted 20 May 2007
The accurate description of a microbial community is an important first step in understanding the roles of itscomponents in ecosystem function. A method for surveying microbial communities termed serial analysis of rRNAgenes (SARD) is described here. Through a series of molecular cloning steps, short DNA sequence tags arerecovered from the fifth variable (V5) region of the prokaryotic 16S rRNA genes from microbial communities. Thesetags are ligated to form concatemers comprised of 20 to 40 tags which are cloned and identified by DNA sequencing.Four agricultural soil samples were profiled with SARD to assess the method’s utility. A total of 37,008 SARD tagscomprising 3,127 unique sequences were identified. A comparison of duplicate profiles from one soil genomic DNApreparation revealed that the method was highly reproducible. The large numbers of singleton tags, together withnonparametric richness estimates, indicated that a significant amount of sequence tag diversity remained unde-tected with this level of sampling. The abundance classes of the observed tags were scale-free and conformed to apower law distribution. Numerically, the majority of the total tags observed belonged to abundance classes that wereeach present at less than 1% of the community. Over 99% of the unique tags individually made up less than 1% ofthe community. Therefore, from either a numerical or diversity standpoint, taxa with low abundance comprised asignificant proportion of the microbial communities examined and could potentially make a large contribution toecosystem function. SARD may provide a means to explore the ecological roles of these rare members of microbialcommunities in qualitative and quantitative terms.
Microbial communities are typified by extraordinary numbersof cells and species richness (43). A key step in understanding theecological role of these communities is an accurate census of thecommunity structure and composition. Culture indepen-dence is a crucial part of any microbial surveying method, sincethe overwhelming majority of environmental prokaryotes arenot culturable under standard laboratory conditions (3).
Current molecular microbial surveying methods, such as ter-minal restriction fragment length polymorphism (28), auto-mated ribosomal intergenic spacer analysis (17), and denatur-ing gradient gel electrophoresis (30), offer fairly quick andinexpensive means to detect a few hundred of the most-abun-dant taxa in a sample. Comparison of the profiles created withthese methods has been a valuable approach for addressingecological questions about microbial communities, especiallyin studies where large numbers of samples are involved (re-viewed in reference 24).
Another approach for surveying microbial communities hasbeen through DNA sequencing of 16S rRNA gene clones (35).Although this approach provides good phylogenetic resolution,it is not the most efficient method of surveying a complexcommunity, since the majority of the 16S rRNA gene sequenceis conserved among prokaryotes (10). Thus, considerable effortis expended sequencing regions of the gene with little infor-
mation content. An alternative approach, including that takenin this report, has been to focus sequencing resources on agiven variable region within the 16S rRNA gene (27, 32, 33,39). While the details of the methods that use this strategydiffer, their common theme is a tradeoff of phylogenetic reso-lution for sequence throughput.
The need for methods that can be used for deep surveys ofmicrobial communities is exemplified by studies showing thatthe majority of species are present at very low abundance (1, 5,12, 42, 49). Moreover, the members of such communities withlow abundance are disproportionately affected by environmen-tal stress or disturbances (19, 44). Are these species with lowabundance viable, and if so, do they contribute to ecosystemfunction in meaningful ways? To address these questions, newsurveying methods are needed that can detect species with lowabundance. A new method, termed SARD for serial analysis ofrRNA genes, is described here that enables the detection andquantitation of rare sequences in microbial communities. Inagricultural soil samples, this method indicated that, numeri-cally, most of the DNA sequences came from prokaryotic spe-cies that were among the least abundant, revealing an unex-pected dominance of rare species in the overall microbialpopulation.
MATERIALS AND METHODS
Molecular biological reagents. Oligonucleotides were obtained from OperonTechnologies (Alameda, CA). AmpliTaq Gold DNA polymerase was obtainedfrom Applied Biosystems (Foster City, CA). All other DNA-modifying enzymes,
* Corresponding author. Mailing address: Taxon Biosciences, Inc.,3152 Paradise Drive, Tiburon, CA 94920. Phone: (415) 435-5116. Fax:(415) 435-5117. E-mail: [email protected].
� Published ahead of print on 25 May 2007.
4532
on August 6, 2015 by guest
http://aem.asm
.org/D
ownloaded from

including Taq DNA polymerase, were obtained from New England Biolabs(Beverly, MA).
Soil sampling. Soil samples were collected from Union Island and VictoriaIsland in the Sacramento River delta of California in October, 2004. These sitescorresponded to locations directly above potential natural gas accumulationsidentified by three-dimensional seismic surveys. Wells were drilled at these siteswithin 4 weeks after the samples were collected, and the structures at bothlocations were found to contain noncommercial levels of hydrocarbons.
The sampling locations were determined with a wide area augmentation sys-tem-enabled Garmin GPS V (Olathe, KS) handheld unit. The coordinate mea-surements were averaged for approximately 10 min to increase accuracy. At eachlocation, a hole was drilled to a depth of 30 cm with a Stihl BT45 gas-powereddrill fitted with a 3.5-cm-diameter ship auger bit (no. 47422; Irwin). Core sampleswere collected at the bottom of the hole with a 2.5-cm-diameter by 30-cm AMSsoil core sampler tool (American Falls, ID). The core sampler had a replaceabletip that was changed between samples. The tool was modified by adding a1-in.-diameter by 8-in. (2.5 by 20 cm) plastic plug such that 1-in. by 4-in. (2.5 by10 cm) core samples were collected in a plastic liner. Following collection, thecore samples were capped and maintained on ice until they arrived at thelaboratory for DNA extraction.
Soil DNA extractions. Soil core samples were extruded from the samplingsleeves and were dissected to remove the outer portions that had been in contactwith the liner or sampler tip. Genomic DNA was extracted from about 0.5 g soilfrom each sample with a FastDNA spin kit for soil in a FastPrep FP120 instru-ment (MP Biomedicals, Irvine, CA), except that the components for the lysismatrix were obtained from CeroGlass (Columbia, TN). The bead-beating matrixconsisted of one 4-mm glass bead (GSM-40), 0.75 g 1.4- to 1.6-mm zirconiumsilicate beads (SLZ-15), and 1.0 g 0.07- to 0.125-mm zirconium silicate beads(BSLZ-1). The beads were prepared by acid washing with HCl and HNO3
followed by neutralization with extensive water washings and autoclaving. Pre-chilled samples were disrupted by bead beating in a FastPrep instrument at 6.5m/s for 45 s. Subsequent steps were performed according to the kit instructions.
SARD profiling. The following oligonucleotides were used in SARD profiles:TX-9, 5�-[BioTEG]-GGATTAGAWACCCBGGTAGTC-3�; 1391R, 5�-GACGGGCRGTGWGTRCA-3� (45); TX12, 5�-[Phos]CTCCAGGTCTACATCCTAGTCAGGAC[23-ddC-Q]-3�; TX13, 5�-ATAGGTCCTGACTAGGATGTAGACCTGGAG-3�; TX14, 5�-[Phos]CTCCAGACTAGCATCCGCTGACTTGA[23-ddC-Q]-3�; TX15, 5�-AATGTCAAGTCAGCGGATGCTAGTCTGGAG-3�;TX131, 5�-[BioTEG]-GTACGATTACTCGATAGTCACGGTCCTGACTAGGATGTAGACC-3�; and TX141, [BioTEG]-GGATATACTCAGGTTGCAACGGTCAAGTCAGCGGATGCTAGTC-3�.
Primers TX9 and 1391R were used to PCR amplify a 600-bp region of the 16SrRNA gene from 600 ng soil genomic DNA in a 400-�l reaction mixture volumeas outlined in Fig. 1. The numbers of PCR-amplifiable 16S rRNA genes withthese primers in 600 ng of soil genomic DNA were determined by quantitativePCR to be 2.8 � 107, 2.2 � 107, 7.3 � 107, and 2.4 � 107 for samples WP43,WP45, Pol-NE, and Pol-W, respectively.
The PCR conditions for the SARD library included 7.5 min at 95°C followedby 20 to 24 cycles (depending upon the sample) of 30 s at 94°C, 30 s at 55°C, and1 min at 72°C. The number of cycles was kept to a minimum to reduce PCR-dependent biases and errors resulting from misincorporation of nucleotides. Theresulting amplicon was agarose gel purified, recovered with a QIAquick gelextraction kit (QIAGEN, Valencia, CA), and cleaved with AluI. The �80-bprestriction digest band, including fragments corresponding to 40 to 120 bp in size,was purified on a 10% polyacrylamide gel electrophoresis–Tris-borate-EDTA(PAGE-TBE) gel. The acrylamide pieces were fragmented by passage from a0.5-ml microcentrifuge tube, with a hole pierced in the bottom with a 21-gaugeneedle, into a 1.5-ml microcentrifuge tube by centrifugation at 13,000 � g for 2min. The excised DNA fragments were extracted from the acrylamide gel bydiffusion in TEN buffer (10 mM Tris HCl, pH 8, 1 mM EDTA, 50 mM NaCl) at55°C for 20 min. The buffer-acrylamide mixture was transferred to a Spin-X tube(no. 8163; Corning Inc., Corning, NY). The buffer containing DNA was sepa-rated from the acrylamide by centrifugation.
The �80-bp AluI fragments were immobilized by binding to Dynal M-280streptavidin beads (Invitrogen, Carlsbad, CA) in 1� BW buffer (5 mM Tris HCl,pH 7.5, 0.5 mM EDTA, 1.0 M NaCl). The beads were washed twice in 1� BWbuffer and twice in wash buffer (10 mM Tris HCl, pH 8, 10 mM MgSO4, 50 mMNaCl). During the final wash, the beads were split into two pools and the bufferwas removed while the beads were positioned next to the magnetic tube holder.Each bead pool was resuspended in a ligation mixture containing T4 DNA ligase,buffer, and either of the double-strand adapters TX12/13 and TX14/15. Theligations were incubated overnight at 16°C, followed by heat inactivation at 65°C
for 15 min. The ligations were washed twice in 1� BW buffer and twice in washbuffer.
SARD tags were cleaved from the streptavidin beads by incubation with 2.5 UBpmI for 2 h at 37°C. Released tags were transferred to a new tube and heatinactivated at 65°C for 20 min. The 3� overhangs were removed by incubationwith 2.5 U Klenow fragment in the presence of 200 �M deoxynucloside triphos-phates at 25°C for 30 min. The split pools were recombined and heat inactivatedat 70°C for 30 min. The SARD tag adapters were ligated together to form ditagsby adding rATP to 1 mM and 200 U of T4 DNA ligase and incubating overnightat 16°C.
The ditags were amplified in two steps, utilizing the primers TX131 andTX141, to prepare an adequate amount for concatenation. Prior to each step, thenumber of cycles that would lead to the greatest amount of 120-bp ampliconproduct without the appearance of artifact bands or smears was determinedempirically in small-scale (15 �l) reaction mixtures. PCR conditions for the firststep consisted of 94°C for 5 min followed by 10 cycles of 94°C for 20 s, 55°C for30 s, and 72°C for 30 s followed by 6 to 10 cycles (depending upon the sample)of 94°C for 20 s and 72°C for 45 s. Ditags were amplified with AmpliTaq GoldDNA polymerase in three 100-�l reaction mixtures. The amplified ditags werepurified on 10% PAGE-TBE gels and served as the template for the secondamplification. PCR conditions for the second step included 94°C for 2 minfollowed by 6 to 10 cycles of 94°C for 30 s and 72°C for 1 min. The ditags wereamplified with Taq DNA polymerase (New England Biolabs) in 96 100-�l reac-tion mixture flasks (9.6 ml total) in the second large-scale PCR step. The am-plified ditags were purified on 10% PAGE-TBE gels.
The PAGE-purified large-scale ditag preparations were digested with 240 U ofFokI for 4 h at 37°C to release the adapters. The 28-bp ditags were purified bytwo rounds of PAGE-TBE purification, first on a 12% gel and then on a 16% gel.DNA was recovered from the acrylamide gel by fragmentation and diffusion asdescribed above, phenol-chloroform extracted, and ethanol precipitated.
The purified 28-bp ditags were concatenated by resuspending ethanol precip-itates in a ligation mixture including 1,000 U of T4 DNA ligase. The ligationswere incubated overnight at 16°C. The reaction mixtures were heated to 65°C for15 min, followed by incubation on ice for 15 min as described previously (23).The ditag concatemers were ethanol precipitated and purified on 8% PAGE-TBE gels. DNA fragments corresponding to 300 to 700 bp were excised andpurified by fragmentation/diffusion followed by ethanol precipitation. The re-sulting ditag concatemers were ligated into the HindIII site of pUC19 andtransformed into chemically competent Escherichia coli DH10B cells (Invitrogen,Carlsbad, CA).
Bacterial transformants were plated on medium containing 5-bromo-4-chloro-3-indolyl-�-D-galactopyranoside for blue/white screening to identify cells harbor-ing plasmids with inserts. Cells from white colonies were further screened forclones with large inserts by colony PCR utilizing M13 forward and reverseprimers. Amplicons were resolved on 1.5% agarose gels. Clones with insert sizesof 300 to 600 bp (20 to 40 SARD tags) were selected for sequencing.
SARD clone DNA sequencing. Sequencing of the SARD clones was performedby using a modification of the BigDye terminator method used for microbialgenome sequencing at The Institute for Genomic Research (18, 40). Briefly, thesequencing reaction used the M13 forward primer only, and a sequencing buffercontaining sucrose and betaine (final concentrations, 80 mM Tris HCl, pH 9.0, 2mM MgCl2, 2% sucrose, 0.75 M betaine) was substituted for the original se-quencing buffer. Finally, the following cycling conditions were used: 98°C for 2min, 98°C for 10 min to 50°C for 5 min to 70°C for 4 min (40 cycles).
SARD profile analysis. A software program was written to extract the SARDtag sequences from the raw sequence files and convert the data into a tab-delimited file that could be further manipulated in a spreadsheet program suchas Microsoft Excel. Any SARD tags that were too short or that were greater than1 nucleotide too long were discarded. Tags that were 1 nucleotide too long weretrimmed to the correct length and included in the analyses. These tags likelyresulted from incomplete removal of the 3� overhang by the Klenow enzymeprior to the head-to-head tag ligation to form ditags. A small number of tags(�0.4%) that were either presumptive cloning artifacts derived from TX131/TX141 or were from a downstream, conserved AluI site at position 1067 (E. colinumbering) of the 16S rRNA gene were filtered out of the tag set. The programreported additional numerical features of the profiles, including, for each tag, theminimum number of nucleotide position changes necessary to equal another tagsequence. SARD tag richness and diversity estimates were made with the Esti-mateS software package, version 7.5 (9). To construct the rarefaction plots andChao1 estimates, the SARD data was randomized a total of 50 times.
16S rRNA gene libraries. Approximately 600 bp of the bacterial 16S rRNAgenes were PCR amplified with the same primers used for SARD profiling (TX9and 1391R), except that neither primer had a biotin modification and both
VOL. 73, 2007 SERIAL ANALYSIS OF rRNA GENES 4533
on August 6, 2015 by guest
http://aem.asm
.org/D
ownloaded from

primers possessed 5� phosphate groups to facilitate cloning. The number of PCRcycles was kept to 20 to 22 cycles to minimize amplification-dependent biases.Amplicons were purified on agarose gels with a QIAquick gel purification kit(QIAGEN, Valencia, CA).
PCR products were ligated nondirectionally into the SmaI site of pUC19 andwere transformed into E. coli DH10B cells (Invitrogen, Carlsbad, CA). Trans-formants were plated onto LB agar–ampicillin plates containing 5-bromo-4-chloro-3-indolyl-�-D-galactopyranoside for blue/white screening. White colonieswere picked and grown in LB-ampicillin medium. Plasmid template DNA wasprepared by a modified alkaline lysis method. The 16S rRNA gene nucleotidesequences of the clone inserts were determined by using BigDye terminators(Applied Biosystems, Foster City, CA) and 3.2 pmol of M13F sequencing primeras described previously (20). Sequences were analyzed on ABI 3730xl sequencers(Applied Biosystems, Foster City, CA) and trimmed to remove the vector se-quence.
Phylogenetic analysis. 16S rRNA gene sequences were aligned with ClustalX,version 1.81 (41). Unrooted phylogenetic trees were created with the PHYLIPpackage of programs, version 3.63 (16), including DNADIST and NEIGHBOR,
where the output file of one program served as the input for the next program.The evolutionary distances were computed with DNADIST using the Kimuratwo-parameter model. The trees were edited using RETREE. The bootstrapvalues for the nodes were determined from 1,000 iterative analyses with theSEQBOOT, DNADIST, NEIGHBOR, and CONSENSE programs.
Nucleotide sequence accession numbers. Partial 16S rRNA gene sequenceswere deposited in the GenBank database (accession nos. EF600115 to EF600228[Pol-NE], EF600229 to EF600332 [Pol-W], EF600333 to EF600441 [WP43], andEF600442 to EF600552 [WP45]).
SARD data accession numbers. SARD tag sequences and abundance datawere deposited in the NCBI Gene Expression Omnibus (GEO) site located athttp://www.ncbi.nlm.nih.gov/geo (accession no. GSE8119).
RESULTS
SARD library construction. The test samples were com-prised of four soil samples collected from a depth of about 40
FIG. 1. Serial analysis of rRNA genes (SARD). A conserved AluI restriction enzyme recognition site is located immediately downstream of thefifth variable (V5) region of the bacterial 16S rRNA gene. Step I, “universal” bacterial PCR primers are employed to create amplicons flankingthis region from environmental genomic DNA. The amplicons, containing 5� biotin groups, are digested with AluI. Step II, the 5�-most AluIrestriction fragments are immobilized on magnetic streptavidin-coated (SA) beads. Step III, the beads are split into two pools and a uniquedouble-stranded adapter is ligated to each pool. Step IV, the adapters, including short sequence tags, are released from the beads by digestion withBpmI. Step V, the 3� overhangs of the released fragments are removed with the Klenow fragment and the products are recombined. Step VI, DNAfragments are ligated head-to-head, PCR amplified with primers specific to the unique adapters, and cleaved with the restriction enzyme FokI. StepVII, the resulting 28-bp ditags, possessing 4-bp AGCT 5� overhangs, are purified and ligated to form concatemers. Step VIII, concatemerscomprising 30 or more SARD tags are purified and cloned into the HindIII site of pUC19.
4534 ASHBY ET AL. APPL. ENVIRON. MICROBIOL.
on August 6, 2015 by guest
http://aem.asm
.org/D
ownloaded from

cm from the Sacramento River delta area of California. Thefour samples were collected as two pairs of two samples. Eachpair of samples was located about 7 km apart; each samplewithin a pair was collected about 25 m apart. Two of thesamples were located within an irrigated asparagus field(WP43 and WP45), and two were located within an alfalfa field(Pol-W and Pol-NE). Genomic DNA extracted from these soilsamples served as the starting material both for SARD profilesand 16S rRNA gene clone libraries.
SARD was designed to recover a 16-bp sequence tag fromthe fifth variable region (V5) of the bacterial 16S rRNA gene(4). The method begins by PCR amplification of a subregion ofthe 16S rRNA gene at positions 790 to 1391 (Fig. 1). Thelocation where the SARD tag is recovered from the 16S rRNAgene is defined by the first occurrence of an AluI restrictionsite downstream of the forward primer (TX9). The forwardprimer is complementary to a conserved DNA sequence im-mediately upstream of the V5 region. In most cases, the firstAluI site downstream of TX9 occurs at position 860 (E. colinumbering), which is located at the downstream junction of theV5 region and the subsequent conserved region (10). As de-scribed below, the AluI site was found to be conserved at thislocation (or within the V5 region) in 70 to 80 percent of 16SrRNA gene sequences examined.
The forward primer, TX9, was biotinylated to facilitate bind-ing to a solid support following digestion with AluI. However,prior to binding to the streptavidin beads, the AluI-digestedPCR products were PAGE purified to recover only those frag-ments where the AluI site was located within or adjacent to the5� region. These fragments were then bound to a streptavidinsolid support, which resulted in the V5 variable sequence beingexposed at the free end of the bound DNA. Double-strandedDNA adapters that include recognition sites for the type IISrestriction enzyme BpmI were ligated to the bound DNA. TypeIIS restriction enzymes cleave DNA at a distance from theirrecognition sites. Thus, cleavage of these bound DNA frag-ments with BpmI released the adapter sequences, including 12bp of variable sequence from the V5 region.
In a series of subsequent enzymatic modifications, the 3�overhangs of the released sequence tags were removed withthe Klenow fragment, and the resulting blunt end tags wereligated together to form ditags. Following amplification andPAGE purification, the adapter sequences were released fromthe ditags by cleavage with a second type IIS restriction en-zyme, FokI, whose recognition site was also located within theadapter sequences. FokI digestion resulted in 24-bp ditags that
possessed 4-bp AGCT 5� overhangs on each end. These ditagswere purified and ligated together to form concatemers. Theseconcatemers were cloned into the HindIII site of pUC19.
The SARD tag concatemers were free from adapter se-quences, which increased the throughput of tags identified persequencing run. The ditags that comprise the concatemerswere themselves the result of head-to-head ligation of individ-ual tags. Therefore, the SARD tags were arranged within theconcatemers on alternating DNA strands separated by an AluIsite every 28 bp. Each tag consisted of 12 bp of variable se-quence plus the 4-bp AluI site. A software program was writtento identify and extract SARD tags from the raw sequence data.
A total of 37,008 SARD tags were identified from the foursoil sample genomic DNA preparations (Table 1). These tagscomprised 3,127 unique tag sequences. The number of times atag sequence is present in a sample is expected to reflect theabundance of the corresponding 16S rRNA gene sequence inthe sample community. Most unique SARD tags were ob-served only once (singletons) or twice (doubletons) in eachsample, indicating extensive tag richness in these samples andthat the profiles had captured only a fraction of the tag diver-sity present.
The extent of a SARD survey is determined by the numberof tags per concatemer and the number of concatemers thatare sequenced. Since typically only a fraction of the SARDclones in a library are sequenced, the extent of coverage of aSARD library can be increased by additional sequencing of thesame library. The sensitivity of SARD is thus dependent uponthe level of sequencing that is performed. Additional sequenc-ing of SARD clones from these samples would be expected tohave revealed a greater proportion of the tag sequencespresent.
A total of five SARD profiles were conducted from soilgenomic DNA extracted from four samples. Two profiles wereconducted from the same genomic DNA, prepared from thesample Pol-W, to assess the reproducibility of SARD (Fig. 2).As expected, the least-abundant tags (seen the least number oftimes) showed the most variability between the duplicate pro-files. Since the data are plotted on a log-log scale, only thosetags that were present in both SARD profiles were included.The Pearson correlation from this comparison (r2 � 0.99) andthe plots on a linear scale obtained from the entire data set(data not shown) were similarly robust.
Error rate estimates. Some fraction of the SARD tags iden-tified in these profiles were expected to contain incorrect se-quences that could have resulted either from Taq polymerase
TABLE 1. SARD profile summary
Sample Total no. tags No. unique tags Total no. tags at �1%abundance (%)
No. unique tags at�1% abundance (%) No. singletons No. doubletons
Pol-W 7,625 819 2,609 808 515 98Pol-NE 10,062 1,045 4,876 1,031 602 141WP43 8,120 1,143 4,331 1,130 791 115WP45 11,201 1,253 5,777 1,234 810 148
Totala 37,008 3,127 19,910 (53.8)b 3,110 (99.5%)c 2,017 366
a Determined by combining tags from the four profiles and recalculating the results.b Total number of tags at less than 1% abundance divided by the total number of tags.c Total number of unique tags at less than 1% abundance divided by the total number of unique tags.
VOL. 73, 2007 SERIAL ANALYSIS OF rRNA GENES 4535
on August 6, 2015 by guest
http://aem.asm
.org/D
ownloaded from

errors during PCR or during DNA sequencing. Knowing whatlevel of artifact contamination existed in the SARD profileswas important, since these tags will contribute to the numbersof rare tags and will thus influence richness estimates. Whilethe exact number of SARD tag artifacts was unknown, someestimates could be made.
One approach for estimating the number of tag artifacts isthrough published error rate determinations. Taq polymerasemisincorporates nucleotides at a rate of 8 � 106/bp/duplica-tion (8). Therefore, under the conditions used in this study,�180 of the tags identified in this study were expected to beartifacts as a result of Taq replication errors. DNA sequencingerrors, which can be discriminated during automated sequenc-ing by using Phred scores (13, 14), were expected to haveresulted in �550 tag artifacts. Taken together, the total num-ber of tag artifacts was expected to comprise �730 (2%) of the�37,000 tags identified.
Community structure assessment. Rank abundance plotswere used to assess the SARD tag diversity of the four agri-cultural soil samples (Fig. 3). In this and subsequent experi-ments, the data from the two SARD profiles from Pol-W werecombined into a single data set. The SARD profiles werefound to be comprised of a large number of rare sequence tagsand a small number of abundant tags. The Simpson’s recipro-
cal diversity index values were similar for three of the foursamples. The lower diversity value for the fourth sample,Pol-W, could be attributed to the presence of two abundantSARD tag sequences that were each present at levels of 16 and17 percent of the sample. The most-abundant tag found in anyof the other three samples was present at 11 percent.
The same SARD tag abundance data were used to examineabundance class distributions. Histograms of SARD tag abun-dance class data were made where the width of each bin sizewas adjusted through logarithmic binning (34). Plots of theabundance classes as a function of the proportion of all tagsthat each class comprised showed a linear relationship on alog-log scale (Fig. 4). Thus, the abundance classes were foundto be scale-free and to follow a power law distribution. Simi-larly, the data fit a power law form when plotted as cumulativeZipf distributions (not shown).
Richness estimates. SARD profiles are based on samplingindividual tags in a population where the number of times anygiven tag is seen is proportional to its abundance in the originalsample. To determine whether the sampling effort of theSARD profiles had captured a significant fraction of the dif-ferent tags present in the samples, the SARD data was plottedas accumulation curves. These accumulation curves were com-puted using resampling of the data with a total of 50 random-izations without replacement with the program EstimateS (9).In addition, predictions of the total tag richness from thesesamples were made by using the nonparametric richness esti-mator Chao1 (6, 7).
In the case of the Pol-NE and Pol-W samples, the accumu-lation plots and Chao1 estimates from the two samples areessentially indistinguishable from one another. In contrast tothe observed richness in the accumulation plots, the Chao1richness estimates of WP43 were significantly higher than thatof the WP45 sample. The difference between these samples didnot become significant at the 95% confidence level until thesample size had reached about 5,000 tags. Despite similaraccumulation plots in the four samples, the Chao1 richnessestimates varied by nearly a factor of two between the alfalfafield (Pol-NE and Pol-W) and asparagus field (WP43 andWP45) sampling locations (Fig. 5). Importantly, the richnessestimates appeared sample-size dependent and did not reach aplateau. Therefore, additional sampling would be expected tolead to higher richness estimates.
FIG. 2. Reproducibility of SARD profiles. Data from two separateSARD profiles of the same sample are plotted against one another.Values are shown only for tags that were observed in both profiles. Thesymbol sizes reflect the number of coincident tags that overlapped onthe plot as a result of occurring at the same abundance levels. Thelargest symbol corresponds to 45 tags that were seen once in bothprofiles.
FIG. 3. Rank abundance plot of SARD tag sequences from four soil samples. Boxed values indicate Simpson’s reciprocal diversity index (1/D)values.
4536 ASHBY ET AL. APPL. ENVIRON. MICROBIOL.
on August 6, 2015 by guest
http://aem.asm
.org/D
ownloaded from

SARD tag occurrence in 16S rRNA genes. To determine howwell a SARD profile represents a bacterial community, a 16SrRNA clone library was created from the sample WP45 forcomparison. The clone library was constructed by PCR ampli-fication of an approximately 600-bp region of the 16S rRNAgenes with the same primers (TX9/1391R) and from the samesoil genomic DNA preparation that was used for the SARDprofiles. These PCR amplicons were ligated into the pUC19vector. The DNA sequences from 110 clones passed qualitycontrol (long, high-quality sequencing read and nonchimeric)and were the subject of subsequent analysis. Each sequencewas examined for the presence of a SARD tag that would beexpected to be recovered in a SARD profile. Eighty-five ofthe 110 clone sequences (77%) possessed an AluI restriction sitewithin or adjacent to the V5 region and, therefore, would beexpected to be identified in a SARD profile. There were a totalof 53 different SARD tags identified out of the 85 tags presentin the clone sequences. Of these tags, 49 (93%) were alsoidentified in the corresponding SARD profile. In summary,
there were 110 total sequences, 85 informative tags, 53 uniquetags, and 49 tags in common in the 16S rRNA clone sequencesfrom WP45. The four tags not seen in the WP45 SARD profilewere observed once (singletons) in the clone sequences, andthus, the actual abundance of these sequences in the commu-nity may be very low and could explain their absence in theSARD profiles.
Two factors can limit the resolution of SARD profiles: (i)different 16S rRNA genes may share the same SARD tagsequence, and (ii), some 16S rRNA genes may not produce aninformative SARD tag. To understand how these limitationsaffect SARD profiles, a phylogenetic tree was constructed fromthe WP45 16S rRNA clones and was annotated with the cor-responding SARD tags (Fig. 6). Sixteen of the 53 SARD tagsidentified in the 16S rRNA clones occurred in more than oneclone sequence. In these cases, where different 16S rRNAclones possessed the same SARD tag sequence, the 16S genesequences were significantly similar to one another and weremembers of the same bacterial division, except in two cases.
FIG. 4. Abundance class distributions of SARD data. SARD tag abundance data plotted as histograms with logarithmic binning.
FIG. 5. Observed and estimated SARD tag richness from four agricultural soil samples. The bars show the 95% confidence intervals providedfor the Chao1 richness estimates. The plots were made with EstimateS (9) following 50 randomizations. For clarity, only every 300th data pointis plotted.
VOL. 73, 2007 SERIAL ANALYSIS OF rRNA GENES 4537
on August 6, 2015 by guest
http://aem.asm
.org/D
ownloaded from
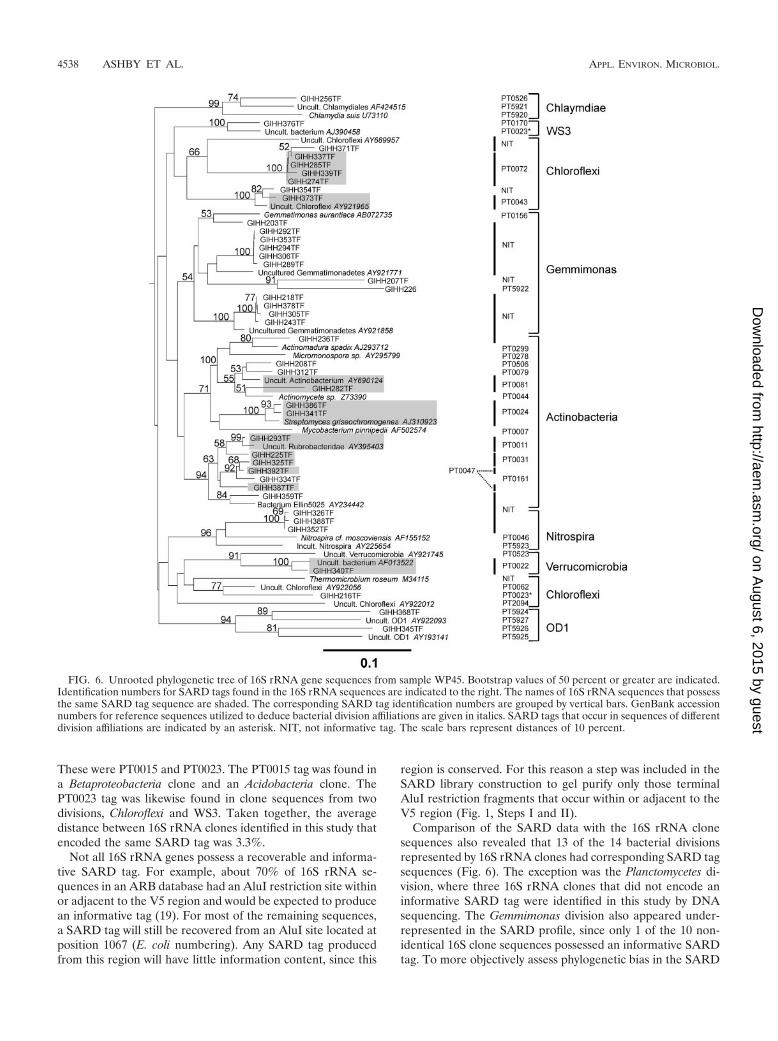
These were PT0015 and PT0023. The PT0015 tag was found ina Betaproteobacteria clone and an Acidobacteria clone. ThePT0023 tag was likewise found in clone sequences from twodivisions, Chloroflexi and WS3. Taken together, the averagedistance between 16S rRNA clones identified in this study thatencoded the same SARD tag was 3.3%.
Not all 16S rRNA genes possess a recoverable and informa-tive SARD tag. For example, about 70% of 16S rRNA se-quences in an ARB database had an AluI restriction site withinor adjacent to the V5 region and would be expected to producean informative tag (19). For most of the remaining sequences,a SARD tag will still be recovered from an AluI site located atposition 1067 (E. coli numbering). Any SARD tag producedfrom this region will have little information content, since this
region is conserved. For this reason a step was included in theSARD library construction to gel purify only those terminalAluI restriction fragments that occur within or adjacent to theV5 region (Fig. 1, Steps I and II).
Comparison of the SARD data with the 16S rRNA clonesequences also revealed that 13 of the 14 bacterial divisionsrepresented by 16S rRNA clones had corresponding SARD tagsequences (Fig. 6). The exception was the Planctomycetes di-vision, where three 16S rRNA clones that did not encode aninformative SARD tag were identified in this study by DNAsequencing. The Gemmimonas division also appeared under-represented in the SARD profile, since only 1 of the 10 non-identical 16S clone sequences possessed an informative SARDtag. To more objectively assess phylogenetic bias in the SARD
FIG. 6. Unrooted phylogenetic tree of 16S rRNA gene sequences from sample WP45. Bootstrap values of 50 percent or greater are indicated.Identification numbers for SARD tags found in the 16S rRNA sequences are indicated to the right. The names of 16S rRNA sequences that possessthe same SARD tag sequence are shaded. The corresponding SARD tag identification numbers are grouped by vertical bars. GenBank accessionnumbers for reference sequences utilized to deduce bacterial division affiliations are given in italics. SARD tags that occur in sequences of differentdivision affiliations are indicated by an asterisk. NIT, not informative tag. The scale bars represent distances of 10 percent.
4538 ASHBY ET AL. APPL. ENVIRON. MICROBIOL.
on August 6, 2015 by guest
http://aem.asm
.org/D
ownloaded from

method, we examined a database of 5,100 16S rRNA genesequences (21) to determine whether different bacterial divi-sions would be equally represented in a SARD profile (Fig. 7).In addition to Planctomycetes and Gemmimonas, less than 50
percent of the 16S sequences from five other divisions, includ-ing Haloanaerobiales, Fibrobacteres, Bacteroidetes, Synergistes,and Deinococcus-Thermus, were predicted to be identified in aSARD profile and these divisions would therefore be under-
FIG. 6—Continued.
VOL. 73, 2007 SERIAL ANALYSIS OF rRNA GENES 4539
on August 6, 2015 by guest
http://aem.asm
.org/D
ownloaded from

represented. The majority of 16S rRNA sequences from 28other bacterial phylum-level divisions were predicted to be wellrepresented in a SARD profile.
DISCUSSION
In any sampling-based survey method, there is a premiumplaced on the ability to create large datasets. This situation isespecially true when surveying microbial communities, whichare often characterized by a large number of rare species anda small number of abundant species (19, 39, 42). Large, coher-ent datasets are necessary to carry out statistically significantquantitative analyses of microbial communities. SARD wasdeveloped to facilitate such surveys.
SARD is based on concatenating short DNA sequence tagsand is similar to a method devised to measure gene expression,termed SAGE, for serial analysis of gene expression (46–48).One advantage that SAGE has over other methods of geneexpression analysis, such as microarrays or reporter matrices, isthat no prior DNA sequence information for the genome un-der study is necessary. This attribute is a critical property ofany microbial community surveying method, since only a smallfraction of bacterial DNA sequences are known (37). SAGEper se would not work as a microbial community profiling tool,since the method relies on the fact that essentially none of themRNA transcripts being surveyed share sequence similarities.Thus, the location of a SAGE tag within a given mRNA is notimportant. For the purpose of surveying a common gene froma community of genomes, a method necessarily must target avariable region. SARD accomplishes this point by targeting aconserved AluI restriction site located immediately adjacent tothe V5 variable region of the 16S gene (Fig. 1).
Methods similar to SARD that rely on concatenation of
variable regions of the 16S rRNA have been developed. One ofthese methods, termed SARST, for serial analysis of ribosomalsequence tags (RSTs), uses PCR to amplify and concatenatethe V1 region of the 16S gene (33). SARST produces variableregion RSTs that are from 17 to 55 bp in length. In a recentapplication of SARST, nearly 13,000 RSTs were identifiedfrom arctic tundra and boreal forest samples (32). A variationon SARST that targets the V6 region has also been reported(27). In each of these methods, there is a tradeoff between RSTlength and phylogenetic resolution. Relative to SARST and itsrelated methods, SARD provides less phylogenetic resolution(shorter tags) for increased throughput (more tags/sequencerun) to create deeper surveys.
SARD may be further distinguished from these other meth-ods in that SARD tags are perhaps best utilized as barcodes tofacilitate quantitative analysis of the abundance and distribu-tion of microbial taxa rather than to make phylogenetic infer-ences between tags that possess various degrees of sequenceidentity. In order to realize the most value from the longer tagsequences recovered by SARST and related methods, align-ments need to be made to accommodate insertions and dele-tions in related sequences. While this step enables the group-ing of related RSTs into operational taxonomic units to lessenthe effects of artifacts, the alignment of large sets of sequencedata is computationally intensive and currently limited byavailable bioinformatics tools. The much larger molecular sur-vey data sets that are now possible with new sequencing tech-nologies (39) pose a significant challenge to software normallyemployed to handle DNA sequence data. SARD tags, by con-trast, are treated as unique sequence identifiers, resulting inmuch smaller-sized data files that can be manipulated andanalyzed with common spreadsheet software. The presence ofSARD tag artifacts in the resulting SARD profiles must bekept in mind, however, when interpreting the results.
Phylogenetic resolution of a SARD tag. A SARD tag iscomprised of 12 bp of variable sequence and 4 bp of the AluIrestriction site (AGCT). The resolution of a 16-bp tag corre-sponds to a single base change, or 6.3% (1/16). For example,the smallest difference that could be detected when comparingtwo 16-mer sequences was �6%. As a broad approximation,when comparing 16S rRNA gene sequences, distance values of3%, 5%, and 10% correspond to species-, genus-, and family-level phylogenetic resolutions, respectively (37). From a prac-tical standpoint, the phylogenetic resolution of a SARD tagmay be somewhat greater. For example, 75% (12/16) of aSARD tag is variable sequence, whereas variable regions com-prise only 38% (591/1,542) of the E. coli 16S rRNA gene (10).A SARD tag can then be considered to possess more informa-tion content per unit length than a longer piece of DNA havinga greater proportion of conserved sequence. Also, the infor-mation content of the 16S gene is partially redundant becauseof the intramolecular base pairing that occurs to produce therRNA secondary structure. The targeted location of a SARDtag within the 16S rRNA gene is on one side of a hairpinstructure that forms the V5 region, and thus, the SARD tagitself has no redundant sequence.
The notion that a SARD tag contains more informationdensity than a longer piece of DNA that includes conservedDNA and inverted repeats was supported by the observationthat nonidentical 16S rRNA clone sequences from this study
FIG. 7. Expected phylogenetic coverage of a SARD profile. Ap-proximately 5,100 16S rRNA gene sequences (21) were examined todetermine the predicted locations of SARD tags for each sequence.The fraction of sequences for each bacterial division where a tag wouldbe expected to be recovered from the V5 region is indicated. A SARDtag will not be recovered from 16S rRNA genes where an AluI restric-tion site is not present in or near the V5 region.
4540 ASHBY ET AL. APPL. ENVIRON. MICROBIOL.
on August 6, 2015 by guest
http://aem.asm
.org/D
ownloaded from

that encoded the same SARD tag were, on average, only 3.3%different from one another. Therefore, at least operationally,the phylogenetic resolution of a SARD tag corresponds tosomewhere between the species and genus levels.
SARD limitations. As with all microbial surveying methods,SARD has inherent limitations and biases. Sources of bias thatare intrinsic to most microbial surveying projects include thechoice of the sample DNA extraction method and the choice of“universal” primers for the initial PCR amplification of the 16SrRNA gene. In addition, the differential amplification of tem-plates, or PCR bias, can lead to distortions of the relativeabundance of DNA sequences in a sample. This type of biasoccurs in a small minority of 16S rRNA templates and can belessened by decreasing the amplification cycles and increasingthe template concentrations (2, 15, 29, 36), as was done in thisstudy.
A potentially more significant bias arises from variability inthe location of the first AluI site downstream of the TX9primer. For example, the position within the 16S gene where aSARD tag will be recovered is determined by the presence ofa conserved AluI restriction site within or adjacent to the V5region. This site was found to be present in about 70 percent ofsequences examined. 16S rRNA gene sequences that do nothave an AluI site in this region will be excluded from a SARDprofile. Some bacterial divisions will be disproportionably af-fected by this bias, which will lead to their being underrepre-sented in a SARD profile (Fig. 7). This bias highlights the needfor conducting more than one type of survey method. Sequenc-ing 16S rRNA gene clones is complementary to SARD in thatthe approach provides a qualitative framework of a microbialcommunity, as well as identifying underrepresented sequencesin a SARD profile.
rRNA operons are known to vary from 1 to 15 copies pergenome (26). As a result, 16S-based survey data cannot betranslated directly to genome equivalents or cell numbers.Nevertheless, in comparisons of 16S data from two samples toidentify relative differences or ratios, the variation in rRNAoperon copy number is not relevant, since it cancels out in thearithmetic. Therefore, meaningful quantitative comparisons of16S data can be made despite rRNA operon copy numbervariation between species. A potentially relevant exceptioncould occur when two different species that harbor identical16S rRNA gene sequences (or SARD tags) and that possessdifferent rRNA operon copy numbers are being compared intwo samples. This possibility may not significantly detract fromsuch comparative analyses, since rRNA operon copy numberappears to have a phylogenetic basis (related genomes equalsimilar rRNA copy numbers) (25).
SARD tag abundance distribution. The abundance class dis-tribution of a bacterial community is an important parameterthat can enable estimates to be made of certain features of thecommunity based on relatively small samples. Such featuresinclude estimates on the amount of sampling necessary toachieve a given level of coverage, estimates of species diversity,and estimates of the total species richness present. Withoutknowing what type of abundance distribution a communityfollows, species or operational taxonomic unit richness esti-mates must rely on nonparametric estimators (22).
Abundance classes of bacterial communities have been sug-gested to follow log-normal (11, 38), power law (Zipf) (19), or
other distributions (31), to name a few. The abundance classdata presented here from four soil samples clearly followed apower law distribution down to a lower abundance level of0.01%. Interestingly, the observed power law distributionmodel would not be consistent with a single-copy abundanceclass. Since the total number of PCR-amplifiable 16S genesused in the construction of the SARD libraries (determined byquantitative PCR) was �25 million, tags present in single copywould represent an abundance class of �4 � 106 percent.Such an abundance class would not fit the line in any of theplots in Fig. 4 at any tag fraction. The data therefore anticipatethat either of two mutually exclusive scenarios exists: (i), theSARD tag abundance distribution for the entire communityfollows a power law and does not include very-low-abundanceclasses, or (ii), the data follow a bimodal (e.g., log normal)distribution with an inflection point that has not yet becomeevident with the current level of sampling. Whether the ob-served SARD tag distribution from these four samples trans-lates to other taxonomic levels of resolution is not known.
SARD tag richness estimates. Soil habitats are known toharbor significant numbers of bacterial cells and species. Theclassic DNA reassociation experiments by Torsvik et al. indi-cated that as many as 4,000 different bacterial genomes werepresent in a 30-g soil sample (42). More recently, a mathemat-ical reevaluation of published soil genomic DNA reassociationdata indicated that there may have been �107 prokaryoticspecies in a 10-g soil sample (19). Richness estimates madefrom sampling-based survey data, such as 16S rRNA clonelibraries, have tended to be much lower and are probably theresult of inadequate sampling.
In the SARD data presented here, both the accumulationcurves and Chao1 richness estimates of the SARD profiles ofthe four soil samples were found to be sample-size dependent.Thus, additional sampling would be expected to identify moreunique tags and lead to higher estimates of the total richness.Taken together with the large number of singleton tags ob-served, the level of sampling of these soil communities was notsufficient to estimate the total tag richness in these samples.The inadequate sampling of these profiles was significant giventhe size of these surveys (�104) and the level of taxonomicresolution of the SARD profiles (approximately between thegenus and species level).
SARD tags do not provide a species-level resolution, andthus, one SARD tag may represent multiple different 16S se-quences (species). Importantly, these sequences are usuallyquite closely related (Fig. 6). For some applications, this se-quence consolidation aspect of SARD can be an asset. Forexample, to our knowledge, no soil or similarly complex bac-terial community has been surveyed to completion. A method,such as SARD, that effectively reduces microbial complexity ina coherent manner and provides increased throughput may bean important tool for characterizing extraordinarily species-rich bacterial communities, such as those found in soil andsediments.
ACKNOWLEDGMENTS
We thank G. Nichols and T. Piazza (Victoria Island Farms) and R.Ferguson (Ferguson Farms) for generously sharing their time and forproviding access to their properties for soil sample collection.
VOL. 73, 2007 SERIAL ANALYSIS OF rRNA GENES 4541
on August 6, 2015 by guest
http://aem.asm
.org/D
ownloaded from
Authors M.N.A., J.R., and D.D.-D. declare a financial interest in thesubject matter as founders/stockholders of Taxon. This work was sup-ported in part by Department of Energy Small Business InnovationsResearch (SBIR) grant DE-FG02-04ER84089.
REFERENCES
1. Acinas, S. G., V. Klepac-Ceraj, D. E. Hunt, C. Pharino, I. Ceraj, D. L. Distel,and M. F. Polz. 2004. Fine-scale phylogenetic architecture of a complexbacterial community. Nature 430:551–554.
2. Acinas, S. G., R. Sarma-Rupavtarm, V. Klepac-Ceraj, and M. F. Polz. 2005.PCR-induced sequence artifacts and bias: insights from comparison of two16S rRNA clone libraries constructed from the same sample. Appl. Environ.Microbiol. 71:8966–8969.
3. Amann, R. I., W. Ludwig, and K. H. Schleifer. 1995. Phylogenetic identifi-cation and in situ detection of individual microbial cells without cultivation.Microbiol. Rev. 59:143–169.
4. Ashby, M. September 2003. Methods for the survey and genetic analysis ofpopulations. U.S. patent 6,613,520.
5. Borneman, J., and E. W. Triplett. 1997. Molecular microbial diversity in soilsfrom eastern Amazonia: evidence for unusual microorganisms and microbialpopulation shifts associated with deforestation. Appl. Environ. Microbiol.63:2647–2653.
6. Chao, A. 1987. Estimating the population size for capture-recapture datawith unequal catchability. Biometrics 43:783–791.
7. Chao, A. 1984. Non-parametric estimation of the number of classes in apopulation. Scand. J. Stat. 11:265–270.
8. Cline, J., J. C. Braman, and H. H. Hogrefe. 1996. PCR fidelity of pfu DNApolymerase and other thermostable DNA polymerases. Nucleic Acids Res.24:3546–3551.
9. Colwell, R. K. 2005. EstimateS: statistical estimation of species richness andshared species from samples, version 7.5. User’s guide. University of Con-necticut, Storrs. http://viceroy.eeb.uconn.edu/EstimateS.
10. De Rijk, P., J. M. Neefs, Y. Van de Peer, and R. De Wachter. 1992. Compi-lation of small ribosomal subunit RNA sequences. Nucleic Acids Res. 20:2075–2089.
11. Dunbar, J., S. M. Barns, L. O. Ticknor, and C. R. Kuske. 2002. Empiricaland theoretical bacterial diversity in four Arizona soils. Appl. Environ. Mi-crobiol. 68:3035–3045.
12. Dunbar, J., S. Takala, S. M. Barns, J. A. Davis, and C. R. Kuske. 1999.Levels of bacterial community diversity in four arid soils compared by cul-tivation and 16S rRNA gene cloning. Appl. Environ. Microbiol. 65:1662–1669.
13. Ewing, B., and P. Green. 1998. Base-calling of automated sequencer tracesusing Phred. II. Error probabilities. Genome Res. 8:186–194.
14. Ewing, B., L. Hillier, M. C. Wendl, and P. Green. 1998. Base-calling ofautomated sequencer traces using Phred. I. Accuracy assessment. GenomeRes. 8:175–185.
15. Farrelly, V., F. A. Rainey, and E. Stackebrandt. 1995. Effect of genome sizeand rrn gene copy number on PCR amplification of 16S rRNA genes from amixture of bacterial species. Appl. Environ. Microbiol. 61:2798–2801.
16. Felsenstein, J. 2004. PHYLIP (phylogeny inference package), version 3.6.Department of Genome Sciences, University of Washington, Seattle, WA.
17. Fisher, M. M., and E. W. Triplett. 1999. Automated approach for ribosomalintergenic spacer analysis of microbial diversity and its application to fresh-water bacterial communities. Appl. Environ. Microbiol. 65:4630–4636.
18. Fleischmann, R. D., M. D. Adams, O. White, R. A. Clayton, E. F. Kirkness,A. R. Kerlavage, C. J. Bult, J. F. Tomb, B. A. Dougherty, J. M. Merrick, et al.1995. Whole-genome random sequencing and assembly of Haemophilusinfluenzae Rd. Science 269:496–512.
19. Gans, J., M. Wolinsky, and J. Dunbar. 2005. Computational improvementsreveal great bacterial diversity and high metal toxicity in soil. Science 309:1387–1390.
20. Gill, S. R., M. Pop, R. T. Deboy, P. B. Eckburg, P. J. Turnbaugh, B. S.Samuel, J. I. Gordon, D. A. Relman, C. M. Fraser-Liggett, and K. E. Nelson.2006. Metagenomic analysis of the human distal gut microbiome. Science312:1355–1359.
21. Hugenholtz, P. 2002. Exploring prokaryotic diversity in the genomic era.Genome Biol. 3:REVIEWS0003.1–0003.8.
22. Hughes, J. B., J. J. Hellmann, T. H. Ricketts, and B. J. Bohannan. 2001.Counting the uncountable: statistical approaches to estimating microbialdiversity. Appl. Environ. Microbiol. 67:4399–4406.
23. Kenzelmann, M., and K. Muhlemann. 1999. Substantially enhanced cloningefficiency of SAGE (serial analysis of gene expression) by adding a heatingstep to the original protocol. Nucleic Acids Res. 27:917–918.
24. Kirk, J. L., L. A. Beaudette, M. Hart, P. Moutoglis, J. N. Klironomos, H. Lee,
and J. T. Trevors. 2004. Methods of studying soil microbial diversity. J.Microbiol. Methods 58:169–188.
25. Klappenbach, J. A., J. M. Dunbar, and T. M. Schmidt. 2000. rRNA operoncopy number reflects ecological strategies of bacteria. Appl. Environ. Mi-crobiol. 66:1328–1333.
26. Klappenbach, J. A., P. R. Saxman, J. R. Cole, and T. M. Schmidt. 2001.rrndb: the ribosomal RNA operon copy number database. Nucleic AcidsRes. 29:181–184.
27. Kysela, D. T., C. Palacios, and M. L. Sogin. 2005. Serial analysis of V6ribosomal sequence tags (SARST-V6): a method for efficient, high-through-put analysis of microbial community composition. Environ. Microbiol.7:356–364.
28. Liu, W. T., T. L. Marsh, H. Cheng, and L. J. Forney. 1997. Characterizationof microbial diversity by determining terminal restriction fragment lengthpolymorphisms of genes encoding 16S rRNA. Appl. Environ. Microbiol.63:4516–4522.
29. Lueders, T., and M. W. Friedrich. 2003. Evaluation of PCR amplificationbias by terminal restriction fragment length polymorphism analysis of small-subunit rRNA and mcrA genes by using defined template mixtures of metha-nogenic pure cultures and soil DNA extracts. Appl. Environ. Microbiol.69:320–326.
30. Muyzer, G., E. C. de Waal, and A. G. Uitterlinden. 1993. Profiling of complexmicrobial populations by denaturing gradient gel electrophoresis analysis ofpolymerase chain reaction-amplified genes coding for 16S rRNA. Appl.Environ. Microbiol. 59:695–700.
31. Narang, R., and J. Dunbar. 2004. Modeling bacterial species abundancefrom small community surveys. Microb. Ecol. 47:396–406.
32. Neufeld, J. D., and W. W. Mohn. 2005. Unexpectedly high bacterial diversityin arctic tundra relative to boreal forest soils, revealed by serial analysis ofribosomal sequence tags. Appl. Environ. Microbiol. 71:5710–5718.
33. Neufeld, J. D., Z. Yu, W. Lam, and W. W. Mohn. 2004. Serial analysis ofribosomal sequence tags (SARST): a high-throughput method for profilingcomplex microbial communities. Environ. Microbiol. 6:131–144.
34. Newman, M. E. J. 2005. Power laws, Pareto distributions and Zipf’s law.Contemp. Physics 46:323–352.
35. Pace, N. R. 1997. A molecular view of microbial diversity and the biosphere.Science 276:734–740.
36. Polz, M. F., and C. M. Cavanaugh. 1998. Bias in template-to-product ratiosin multitemplate PCR. Appl. Environ. Microbiol. 64:3724–3730.
37. Schloss, P. D., and J. Handelsman. 2004. Status of the microbial census.Microbiol. Mol. Biol. Rev. 68:686–691.
38. Schloss, P. D., and J. Handelsman. 2006. Toward a census of bacteria in soil.PLoS Comput. Biol. 2:e92.
39. Sogin, M. L., H. G. Morrison, J. A. Huber, D. M. Welch, S. M. Huse, P. R.Neal, J. M. Arrieta, and G. J. Herndl. 2006. Microbial diversity in the deepsea and the underexplored “rare biosphere.” Proc. Natl. Acad. Sci. USA103:12115–12120.
40. Tettelin, H., and T. V. Feldblyum. 2004. Genome sequencing and analysis.John Wiley & Sons, Ltd., London, United Kingdom.
41. Thompson, J. D., T. J. Gibson, F. Plewniak, F. Jeanmougin, and D. G.Higgins. 1997. The CLUSTAL_X windows interface: flexible strategies formultiple sequence alignment aided by quality analysis tools. Nucleic AcidsRes. 25:4876–4882.
42. Torsvik, V., J. Goksoyr, and F. L. Daae. 1990. High diversity in DNA of soilbacteria. Appl. Environ. Microbiol. 56:782–787.
43. Torsvik, V., L. Ovreas, and T. F. Thingstad. 2002. Prokaryotic diversity—magnitude, dynamics, and controlling factors. Science 296:1064–1066.
44. Torsvik, V., R. Sorheim, and J. Goksoyr. 1996. Total bacterial diversity in soiland sediment communities—a review. J. Ind. Microbiol. Biotechnol. 17:170–178.
45. Tyson, G. W., J. Chapman, P. Hugenholtz, E. E. Allen, R. J. Ram, P. M.Richardson, V. V. Solovyev, E. M. Rubin, D. S. Rokhsar, and J. F. Banfield.2004. Community structure and metabolism through reconstruction of mi-crobial genomes from the environment. Nature 428:37–43.
46. Velculescu, V. E., L. Zhang, B. Vogelstein, and K. W. Kinzler. 1995. Serialanalysis of gene expression. Science 270:484–487.
47. Velculescu, V. E., L. Zhang, W. Zhou, J. Vogelstein, M. A. Basrai, D. E.Bassett, Jr., P. Hieter, B. Vogelstein, and K. W. Kinzler. 1997. Character-ization of the yeast transcriptome. Cell 88:243–251.
48. Zhang, L., W. Zhou, V. E. Velculescu, S. E. Kern, R. H. Hruban, S. R.Hamilton, B. Vogelstein, and K. W. Kinzler. 1997. Gene expression profilesin normal and cancer cells. Science 276:1268–1272.
49. Zhou, J., B. Xia, D. S. Treves, L. Y. Wu, T. L. Marsh, R. V. O’Neill, A. V.Palumbo, and J. M. Tiedje. 2002. Spatial and resource factors influencinghigh microbial diversity in soil. Appl. Environ. Microbiol. 68:326–334.
4542 ASHBY ET AL. APPL. ENVIRON. MICROBIOL.
on August 6, 2015 by guest
http://aem.asm
.org/D
ownloaded from
Copyright © 2022 FDOKUMEN