Describing the organization of dominance relationships by dominance-directed tree method
19
RESEARCH ARTICLE Describing the Organization of Dominance Relationships by Dominance-Directed Tree Method PATRI ´ CIA IZAR 1n , RENATA G. FERREIRA 2 , and TAKECHI SATO 1 1 Department of Experimental Psychology, University of Sa˜o Paulo, Sa˜o Paulo, Brazil 2 Department of Biological Anthropology, University of Cambridge, Cambridge, United Kingdom Methods to describe dominance hierarchies are a key tool in primatology studies. Most current methods are appropriate for analyzing linear and near-linear hierarchies; however, more complex structures are common in primate groups. We propose a method termed ‘‘dominance-directed tree.’’ This method is based on graph theory and set theory to analyze dominance relationships in social groups. The method constructs a transitive matrix by imposing transitivity to the dominance matrix and produces a graphical representation of the dominance relationships, which allows an easy visualization of the hierarchical position of the individuals, or subsets of individuals. The method is also able to detect partial and complete hierarchies, and to describe situations in which hierarchical and nonhierarchical principles operate. To illustrate the method, we apply a dominance tree analysis to artificial data and empirical data from a group of Cebus apella. Am. J. Primatol. 68:189–207, 2006. r 2006 Wiley-Liss, Inc. Key words: dominance hierarchy, graph theory, social structure, Cebus INTRODUCTION The concept of dominance hierarchy has been considered a central feature for understanding the organization of primate social groups. Dominance is defined as the attribute of repeated patterns of agonistic interactions between two individuals, such that dominants win most of the conflicts over subordinate individuals [Drews, 1993]. If individuals of a social group can be ordered based on dominance relationships, then a dominance hierarchy is present. The concept is very appealing because the complexities of the social relationships can be Contract grant sponsor: CAPES; Contract grant numbers: 00022/03-9; 2172-97/6; Contract grant sponsor: FAPESP; Contract grant number: 914038-1. n Correspondence to: P. Izar, Department of Experimental Psychology, University of Sa ˜o Paulo, Av. Prof. Mello Moraes, 1721, CEP 05508-030, Sa ˜o Paulo, Brazil. E-mail: [email protected] Received 19 June 2004; revised 2 May 2005; revision accepted 3 May 2005 DOI 10.1002/ajp.20216 Published online in Wiley InterScience (www.interscience.wiley.com). r 2006 Wiley-Liss, Inc. American Journal of Primatology 68:189–207 (2006)
Transcript of Describing the organization of dominance relationships by dominance-directed tree method

RESEARCH ARTICLE
Describing the Organization of Dominance Relationshipsby Dominance-Directed Tree Method
PATRICIA IZAR1n, RENATA G. FERREIRA2, and TAKECHI SATO1
1Department of Experimental Psychology, University of Sao Paulo, Sao Paulo, Brazil2Department of Biological Anthropology, University of Cambridge, Cambridge,United Kingdom
Methods to describe dominance hierarchies are a key tool in primatologystudies. Most current methods are appropriate for analyzing linear andnear-linear hierarchies; however, more complex structures are commonin primate groups. We propose a method termed ‘‘dominance-directedtree.’’ This method is based on graph theory and set theory to analyzedominance relationships in social groups. The method constructs atransitive matrix by imposing transitivity to the dominance matrix andproduces a graphical representation of the dominance relationships,which allows an easy visualization of the hierarchical position of theindividuals, or subsets of individuals. The method is also able to detectpartial and complete hierarchies, and to describe situations in whichhierarchical and nonhierarchical principles operate. To illustrate themethod, we apply a dominance tree analysis to artificial data andempirical data from a group of Cebus apella. Am. J. Primatol. 68:189–207,2006. r 2006 Wiley-Liss, Inc.
Key words: dominance hierarchy, graph theory, social structure, Cebus
INTRODUCTION
The concept of dominance hierarchy has been considered a central feature forunderstanding the organization of primate social groups. Dominance is defined asthe attribute of repeated patterns of agonistic interactions between twoindividuals, such that dominants win most of the conflicts over subordinateindividuals [Drews, 1993]. If individuals of a social group can be ordered based ondominance relationships, then a dominance hierarchy is present. The concept isvery appealing because the complexities of the social relationships can be
Contract grant sponsor: CAPES; Contract grant numbers: 00022/03-9; 2172-97/6; Contract grantsponsor: FAPESP; Contract grant number: 914038-1.
nCorrespondence to: P. Izar, Department of Experimental Psychology, University of Sao Paulo,Av. Prof. Mello Moraes, 1721, CEP 05508-030, Sao Paulo, Brazil. E-mail: [email protected]
Received 19 June 2004; revised 2 May 2005; revision accepted 3 May 2005
DOI 10.1002/ajp.20216Published online in Wiley InterScience (www.interscience.wiley.com).
r 2006 Wiley-Liss, Inc.
American Journal of Primatology 68:189–207 (2006)
summarized by a reduced set of relationships or by some simple rules as given bythe hierarchical principles.
However, the term ‘‘hierarchy’’ has been loosely used in behavioral studiesand may have contradictory meanings. It is not true that any set of dominancerelationships forms a hierarchy [Drews, 1993]. Moreover, lack of linearity is notsynonymous with nonhierarchical dominance relationships. This mistakenassumption is probably related to the fact that nearly all current methods ofstudying dominance structure are based on the linear hierarchical model, eitherby calculating an index of linearity or by ordering individuals of a social groupinto linear or near-linear dominance hierarchies [reviewed in de Vries, 1998;de Vries & Appleby, 2000].
However, primates may present more complex dominance relationships,organized into partial hierarchies with several independent branches, that arenot properly assessed by current methods [Jameson et al., 1999].
In the present work we propose the use of set theory and the graph theoryconcept of directed tree as a more general method for describing dominanceorganization. We begin with a formal definition of structure and hierarchy withthe aid of set and graph theories, and suggest that the number of individualsrestricts the type of organization and the type of hierarchy that may arise in thesocial structure. We illustrate the method (here called dominance tree analysis)by analyzing hypothetical data sets that were devised to mimic the complexitiesgenerally found in real data, and provide an example using field data from Cebusapella.
The use of formal terms is by no means standard in set theory and graphtheory. Thus, explicit definitions and notations are needed. Whenever possible,we adapted the formal terms to those customarily used in the study of socialgroups (see Pinter [1971] and Pollock [1990] for expositions of set theory, andHarary et al. [1965] and Carley and Prietula [1994] for graph theory)
MATERIALS AND METHODS
Structures and Hierarchy
In this work a social structure is defined by a nonempty set of members(the individuals of a social group) and a set of dyadic dominance relationships(a binary relation on the set of members). So defined, the structure is a graph, asdefined in graph theory. The number of members (here denoted by N) defines thesize of the structure. For simplicity, here ‘‘relation’’ refers only to dominancerelationships, and covers different types of relationships (overt aggression,threatening, displacement of the opponent, priority of access to food or females,etc.).
To conform to the concept of structure, dominance should be stated as abinary relation within the set of members. We denote the dominance relationshipby the ‘‘greater than’’ sign (e.g., A4B means ‘‘A dominates B’’ or ‘‘A defeats B’’).
A structure may be represented by a matrix of dominance relationships inwhich the cells take a value of one if the row member dominates the columnmember, or zero if the row member does not dominate the column member. Wedenote the cell of the row member A and column member B as [A,B], and, forsimplicity, its value as [A,B] = 1 if individual A dominates individual B, or [A,B] =0 if A does not dominate B. A general cell is denoted by letters in italics, e.g., [i,j].By definition, every dominance matrix has the property of irreflexivity (for everymember i, [i,i] = 0) and asymmetry (for all different members i and j, if [i,j] = 1,
Am. J. Primatol. DOI 10.1002/ajp
190 / Izar et al.
then [j,i] = 0). It is not necessary for all dyads to show dominance relationships,so it is possible that, for some dyads, [i,j] = 0 and [j,i] = 0.
Orders
A structure is said to be an order if in addition to irreflexivity and asymmetry,it has the property of transitivity: for every members i, j and k, if i4j andj4k, then i4k. Or, in terms of the matrix notation, if [i,j] = 1 and [j,k] = 1,then [i,k] = 1. A structure fails to be transitive (and hence is not an order) if thereexist members i, j, and k such that [i,j] = 1, [j,k] = 1, but [i,k] = 0. A severefailure of transitivity occurs when the structure shows circular triads: for somei, j, and k, i4j, j4k, and k4i.
In this work ‘‘hierarchy’’ is defined as an order. Hence, a hierarchy is astructure that is irreflexive, asymmetric, and transitive. Irreflexivity andasymmetry result directly from the definition of the dominance relationship.Transitivity should be checked in each case.
Hierarchies may be linear or partial.
Linear Hierarchy
A linear hierarchy is a structure that in addition to being an order, is alsocomplete: for every different pair i and j, [i,j] = 1 or else [j,i] = 1. Therefore, weneed to assess the dominance relationship in all possible dyads, as in a round-robin tournament. Thus, the number of nonzero dominance relationships is givenby N(N�1)/2. In terms of set theory, we say that every two members showcomparability in respect to the dominance relation.
It is very easy and simple to describe a complete order. All of the relevantinformation is given by a unique ordered arrangement of the membersFforexample, A4B4C4D4E in a group of five members. Here we call this type ofordered arrangement a lineage. Only N�1 relationships (those relating twoadjacent members in the lineage (four, in the example above)) are relevant todescribe the hierarchy. The other relationships are given by the transitiveproperty: if A4B and B4C, then in a linear hierarchy we also have A4C. So, byusing only the N�1 relevant relationships and the transitive property, weretrieved the totality of the N (N�1)/2 relationships of the dominance matrix. Anexample of a complete order is a set of real numbers, in which each pair ofnumbers is related by the ‘‘greater than’’ relation.
The concept of linear hierarchy is customarily found in studies of thedominance relationships of small structures [Drews, 1993]. The concept is stilluseful if the departures from linearity, as caused by circular triads, nontransi-tivity, or noncomparability between two members, are small. These departuresmay be measured and statistically tested (for statistical methods see Appleby[1983] and de Vries [1995]).
A small index of linearity means a low degree of linear hierarchy, but it doesnot mean the absence of hierarchy. Another type of hierarchy, called partialhierarchy, may be in operation.
Partial Hierarchy
The requirement of completeness restricts the use of the linear hierarchymodel to small groups. It is practically impossible to obtain completeness amongmembers of a large group of, say, 200 individuals. Temporal limitations preventthe sampling of a sufficient amount of dominance relationships. Even when it is
Am. J. Primatol. DOI 10.1002/ajp
Dominance-Directed Tree Method / 191

possible to gather a sufficient amount of dominance relationships, the structure isnot expected to be the same after the long period of time needed to gather all ofthe dominance relationships has passed.
A hierarchy that is not complete is called a partial hierarchy. Therefore, giventhat some dyads are not comparable, the total amount of dominance relationshipsis smaller than N(N�1)/2. In a partial hierarchy, we cannot graphically display allof the members in a unique lineage. Partial hierarchies may be of two typesdepending on the number of relevant relationships needed to describe the partialhierarchy.
In the first type, the number of relevant dominance relationships is still equalto N�1, but they are distributed in at least two lineages that emerge from acommon member. Suppose, for example, that the relevant relationships are givenby the two lineages A4B4C and A4B4D4E. In each lineage, each member iscomparable to the other. Except for the common members, members from distinctlineages do not show comparability. The common members of these two lineagesare A and B. The relationship A4B appears in the two lineages. If we eliminatethe redundancy by discarding the relationship A4B from one lineage, we maydescribe the partial hierarchy by A4B4C and B4D4E or, equivalently, by B4Cand A4B4D4E, so that the amount of relevant relationships is still N�1. Aparticular example of a partial hierarchy with (N�1) relevant relationships is thedespotic hierarchy (i.e., one member dominates the others and no dominancerelationship exists among the other members [Wilson, 1975]). A despotichierarchy may be represented by a radial display, with the dominant memberat the center and generating several lineages, that reflects the relevantrelationships (four dominance relationships, A4B, A4C, A4D, A4E, in a groupof five members, with A being the despotic member).
In the second type, the number of relevant relationships is less than N�1;that is, there are at least two independent lineages. For example, a partialhierarchy with five members may be formed by the two independent lineagesA4B4C and D4E. Note that the number of relevant relationships is smallerthan N�1 (in this example, three instead of four).
Distinguished Members in a Hierarchy
Ordered sets have distinguished elements. For a hierarchical structure, thecorresponding distinguished members are as follows (the corresponding names inset theory are in parentheses):
The dominant member (last element) dominates every member in thestructure. A hierarchy has at most one dominant member. A dominant memberonly exists in linear hierarchies and in partial hierarchies where all lineages beginat the dominant member.
The partial-dominant member (maximal element) is not dominated by anymember of the structure. The single partial-dominant member of a structure isalso the dominant member, but partial hierarchies may have more than onepartial-dominant member (for example, two in a structure with two independentlineages). In this case, the structure has several partial-dominant members but nodominant member.
The subordinate member (first element) is dominated by every member of thestructure. Like the dominant member, the subordinate member (if there is one) isunique. This type of dominance relationship occurs in linear hierarchies or inpartial hierarchies in which all lineages end at the subordinate member.
Am. J. Primatol. DOI 10.1002/ajp
192 / Izar et al.
The partial-subordinate member (minimal element) does not dominate anymember of the structure. The single partial-subordinate member of a structure isalso the subordinate member, but partial hierarchies may have more than onepartial-subordinate member. In this case, the structure has several partial-subordinate members but no subordinate member.
Assumption of Transitivity
In large structures, it is biologically unrealistic to expect that the ‘‘dominant’’member should fight against all the other members of the group. In this case, wehave to imply transitivity to try to uncover its hierarchical nature. That is, giventhe observed dominant relationships A4B, B4C, C4D, etc., but not necessarilyA4C, or A4D, or B4D, etc., we simply force the structure to be transitive byimplying A4C, A4D, B4D, etc. After the assumption of transitivity is appliedrepeatedly until no more changes occur, the modified dominance matrix is calledthe transitive closure graph (here the transitive matrix). Therefore, theassumption of transitivity may distort the dominance matrix by introducingextra dominance relationships. We can evaluate the severity of the distortion byanalyzing the quantity and nature of the extra dominance relationships.
The assumption of transitivity states simply that if [A,B] = 1 and [B,C] = 1,we have to make [A,C] = 1, whatever may be the observed value of [A,C]. If thisvalue is already 1 (that is, transitivity already holds), no information is added tothe dominance matrix. If the value is zero, however, the severity of the distortiondepends on the value of [C,A]. In the simplest case in which [C,A] is also zero, theonly distortion is that we force the structure to be transitive. If, however, [C,A] =1, a circular triad occurs, and then the transitive matrix fails to be asymmetricand irreflexive. It fails to be asymmetric because [A,C] = 1 and [C,A] = 1.Furthermore, it fails to be irreflexive because [A,A] = 1 (under the assumption oftransitivity, if [A,C] = 1 and [C,A] = 1, then [A,A] = 1).
Treatment of Ties
Dominance matrices are constructed from the observed contests between anytwo members. In general, the decision as to which member is the winner andwhich is the loser is based on the net result of the contests. However, ties mayoccur.
There are three types of ties to the points discussed here: zero ties, low-valueties, and high-value ties. The definition of structure given above admits zero ties.However, nonzero ties must be managed somehow to preserve the property ofasymmetry.
Zero Ties
Zero ties occur when there exist members i and j such that [i,j] = 0 and[j,i] = 0. Zero ties may occur by insufficient or biased sampling (in which cases theonly recommendation is to correct the sampling procedure), or by the absence ofdominance relationships. In the second case, a zero tie is a real phenomenonresulting from the impossibility of the members interacting (due, e.g., to physicaldistance or to formal impediments), from their unwillingness to contest (e.g.,between a mother and her juveniles in some primate groups), or from anyunknown avoidance strategy adopted by one or another member. In this work, allzero ties are treated as observational zeros (see also de Vries [1995]).
Am. J. Primatol. DOI 10.1002/ajp
Dominance-Directed Tree Method / 193

Low-Value Ties
Some pairs of members may show relatively low-value ties (say, one). We mayconsider these low values as reflecting only fortuitous and rare encounters thatsupposedly do not represent the general and regular absence of the dominancerelationships that characterize the interaction between the members of the pair.In this case, a clearer and simpler account of the social structure may be obtainedby setting these low values to zero.
We may extend the argument to cover those cases in which the dominance isestablished with relatively low values (say, 1 � 0). However, to define howrelatively low these values are, and to evaluate the consequences of zero ties, adeeper analysis of each specific empirical dominance matrix is needed.
High-Value Ties
The occurrence of high-value ties is not expected in social structures in whichdominance relationships are well established. High-value ties may occur in sometransient phases of the dominance process (e.g., as a consequence of the groupsplitting or the introduction of new members), the high values resulting from atemporary escalation in the contests for hierarchical position. These conditions ofunstableness generally cannot be satisfactorily dealt with by any method fordescribing structures (but see Broom [2002]). If a high-value tie is encountered,one has to decide the direction of the dominance relationship by using other kindsof information or collecting additional data. Obviously, since high values reflectcontests for position in the social structure, they cannot be simply set to zero.
Dominance Trees
Lineages such as A4B4C4D are easily represented in hierarchicaldiagrams as, say, A-B-C-D. The specific member of the structure chosen tobegin all lineages is called the root (A, if the lineage in the example is unique). Alinear hierarchy is represented by a unique lineage beginning at the dominantmember and ending at the subordinate member. For example, suppose thehierarchy is partial and has the second lineage A-B-E-F. Both arrangementsmay be represented in a single directed tree diagram that bifurcates at B. Thecommon parts of the paths are represented collectively as A-B and, emergingfrom B, the substructures C-D and E-F.
Before we discuss this type of representation further, we will review somegraph theory concepts that are useful for understanding dominance structures.
Paths in Dominance Structures
We have said that a dominance structure is a graph. We refer to a dominancestructure as an elementary path (or path, for short) as an ordered arrangement ofmembers, such as A-B-C-D, in which no member is repeated. The membersof a path are related by the reachability relation. In the example above, we maysay that A reaches the other four members, C reaches D, D is reached from A, etc.Therefore, reachability is a one-way relationship from higher members of thehierarchy to lower ones, i.e., reachability is a relation in which transitivity holds.
If the substructure represented by a given path is hierarchical, then bydefinition no hierarchically lower member reaches a higher member. In contrast,if we assume that the members of the path are involved in circular triads, then bydesignating each member as the root, every member reaches and is reached by
Am. J. Primatol. DOI 10.1002/ajp
194 / Izar et al.

other members of the substructure. In this case, the structure is not hierarchicalat all.
Dominance Tree Representation
A given path encloses all information contained in its subpath. For example,the information contained in the path B-C-D is already contained in theaugmented path A-B-C-D-E. Thus, to get the maximum path informationand eliminate redundancies, only the maximal paths are represented in thedominance tree. All information about direct dominance relations, such as A-D,are already encompassed in the maximal path and are skipped in the dominancetree.
The tree representation of all non-redundant maximal paths from a givenmember R is called the dominance tree of R. Given the dominance tree of R, thereachability relation can be used to construct a matrix based on the reachabilityrelation. We call this the tree-dominance matrix of R. The importance of amember in the structure is given by the number of relationships in the transitivematrix that is explained by its tree-dominance matrix. For example, the tree-dominance matrix of the dominant member is identical to the transitive matrix.
Reduced Graph
Suppose that A dominates all the others, B dominates all the others except A,and that C, D, and E are involved in circular triads (for example, C4D, D4E, andE4C). The best dominance tree (that for member A) has three maximal paths:A-B-C-D-E, A-B-D-E-C, and A-B-E-C-D. Note that C, D, andE are represented more than once in the dominance tree because of theirnonhierarchical relationships. The maximal subset (in this example, formed by C,D, and E) in which each member reaches all the others is called a ‘‘strongcomponent’’ in graph theory. If each strong component is considered as a unit,and, given two units X and Y, [X,Y] = 1 if there exist a member x of X and amember y of Y such that [x,y] = 1, then the graph formed by these units and theirrelationships is called a reduced graph of the structure. Thus, the dominance treeof the example above can be represented by the diagram A-B-{C,D,E}, inwhich the keys enclose the members of the maximum strong component. Underthe assumption of transitivity, every reduced graph of a dominance structure is ahierarchy, so we can analyze the reduced graph of a nonhierarchical structurewith the concepts used here.
Reduced graphs are also useful for describing situations in which two or morelineages merge, as in A-B-C-D-F-G, A-B-E-F-G (see DominanceTree Analysis of Empirical Data below).
Algorithm for Constructing Dominance Trees
In this work we constructed dominance trees with the use of DOMINA, aDelphi application that can be sent upon request. The general features of thealgorithm are described below.
Initialization
A. Construct the dominance matrix, with one if the row member won thecolumn member, or zero otherwise.
Am. J. Primatol. DOI 10.1002/ajp
Dominance-Directed Tree Method / 195
B. To find the transitive closure of the dominance matrix, impose transitivityto the matrix by the repeated application of the assumption of transitivity untilthe matrix does not change any more. The resultant matrix is the transitivematrix of dominance.
C. Select a given member R as the root of the tree representation.
Steps
1. Enumerate all the paths from R to the other members.2. Discard the non-maximal paths.3. Discard the redundant paths (i.e., paths whose information is already
present in another path).4. Stop.The result of the algorithm is a set of paths that can be represented as a
hierarchical tree rooted at R. Every path of the tree is elementary (a member ofthe path is traversed only once), but a member may be represented in more thanone lineage in the tree.
DOMINA also produces a text file containing the transitive matrix, thedominance tree, and the tree-dominance matrix of each member; a list of the tiesof the dominance matrix; the partial-dominant and partial-subordinate sets; andthe strong components of the transitive matrix.
Dominance Tree Analysis of Artificial Data
To illustrate the properties and some of the potential applications ofdominance trees for describing dominance structures, we applied this methodto a hypothetical data set that was constructed to mimic complex socialinteractions, expressed as violations of the hierarchical properties (irreflexivity,asymmetry, and transitivity), that may occur in empirical dominance matrices.
The seven artificial dominance data sets are shown in Table I, row a.Dominance matrix 1a is a linear hierarchy, and dominance matrices 2a and 3a arepartial hierarchies. The dominance matrices 4a and 5a are not hierarchical, butthey become hierarchical under the assumption of transitivity: transitive matrix4a is a linear hierarchy, and transitive matrix 5a is a partial hierarchy. In relationto data sets 6 and 7, neither the dominance nor the transitive matrices arehierarchical. The tree dominance analysis of the seven data sets gives thefollowing results:
Dominance matrix 1a is a typical linear hierarchy (index of linearity equal to1.000) in which the member A dominates the other members, B dominates theother members except A, C dominates the other members except A and B, etc.Note that when the transitive matrix is identical to the dominance matrix, noinformation is added by the assumption of transitivity. The dominance tree ofeach of the five members is represented in Fig. 1a–e. The relative hierarchicalposition of a given member can be measured by the number of individuals itdominates in its dominance tree (see matrix 1a). The complete representation ofthe structure is given by the dominance tree of the dominant member A (Fig. 1a),in which each member is ranked according to its hierarchical position. It strictlyprovides all the information of the dominance matrix, as can be seen by the tree-dominance matrix of member A, matrix 1b. Notice that the dominance trees of theother members are merely subpaths in the dominance tree of member A. MemberE is the subordinate member of the structure.
Am. J. Primatol. DOI 10.1002/ajp
196 / Izar et al.

TA
BL
EI.
Do
min
an
ce
Tre
eA
na
lysi
so
fS
ev
en
Hy
po
theti
ca
lD
om
ina
nce
Da
te
12
34
56
7
aA
BC
DE
AB
CD
EA
BC
DE
AB
CD
EA
BC
DE
AB
CD
EA
BC
DE
A1
11
14
11
11
41
11
14
1+
1+
1+
14
1+
12
11
11
4=
11
11
+1
4B
11
13
01
11
+1
+1
31
11
11
3+
1=
11
11
4C
11
20
11
1+
12
0=
11
+1
2+
1+
1=
11
14
D1
10
01
11
1+
1=
11
2+
1+
1+
1=
11
4E
10
00
00
1+
1=
12
1+
1+
1+
1=
14
01
23
40
11
11
01
12
20
12
34
01
20
10
14
44
44
44
4
bA
BC
DE
AB
CD
EA
BC
DE
AB
CD
EA
BC
DE
AB
CD
EA
BC
DE
A1
11
1n
11
11
n1
11
1n
11
11
n1
1n
11
11
n1
11
11
n
B1
11
11
11
11
11
11
11
1n
C1
11
11
11
11
11
11
n
D1
11
n1
11
11
11
1n
E1
11
11
11
1n
1)
Mem
ber
sare
lab
elle
dfr
om
Ato
E;
2)
zero
valu
esare
om
itte
d;
3)
majo
rro
wa
:d
om
inan
ce(u
nsi
gn
ed1
-valu
edce
lls)
an
dtr
an
siti
ve
(un
sign
ed1
-valu
edce
lls
plu
ssi
gn
ed1
-valu
edce
lls
ad
ded
by
the
ass
um
pti
on
of
tran
siti
vit
y:
‘=’,
dia
gon
al
cell
s;‘+
’,off
-dia
gon
al
cell
s)m
atr
ices
;it
ali
zed
nu
mb
ers
inco
lum
nsi
xof
each
matr
ix:
nu
mb
erof
mem
ber
sre
ach
edb
yth
ere
spec
tive
row
mem
ber
init
sd
om
inan
cetr
ee;
itali
zed
nu
mb
ers
inro
wsi
xof
each
matr
ix:
nu
mb
erof
mem
ber
sth
at
reach
the
resp
ecti
ve
colu
mn
mem
ber
init
sd
om
inan
cetr
ee;
4)
majo
rro
wb:
tree
-dom
inan
cem
atr
ixof
the
row
(s)
mem
ber
(s)
mark
edb
yast
eris
k.
Am. J. Primatol. DOI 10.1002/ajp
Dominance-Directed Tree Method / 197

Fig. 1. Dominance trees of the artificial data in Table I: (a–e) data 1, (f) data 2, (g) data 3, (h and i)data 5, (j–m) data 6, and (n–s) data 7.
Am. J. Primatol. DOI 10.1002/ajp
198 / Izar et al.

Dominance matrix 2a is a particular type of partial hierarchy, the despoticstructure, in which the dominant member A dominates other members and nodominance relationship exists among the other members (i.e., all members,except A, are partial-subordinate members). As occurs for every hierarchicalstructure, the transitive matrix is identical to the dominance matrix. Figure 1fillustrates the tree diagram of member A that completely represents thestructure. The tree-dominance matrix of A is identical to the dominance matrix.The dominance trees of the other members (not represented here) contain onlyone member (the root).
Dominance matrix 3a is a partial hierarchy with two lineagesFA-C-E andA-B-DFemerging from the dominant member A, with D and E being the twopartial-subordinate members. Again, notice that the dominance and transitivematrices are identical. The most informative tree is that of the dominant memberA (Fig. 1g). The tree-dominance matrix of A is identical to the dominance matrix.
Dominance matrix 4a is not hierarchical because it fails to be transitive.However, after the dominance-directed tree analysis is applied, the resultingtransitive matrix is a linear hierarchy that is identical to the dominance matrix1a. The dominance trees of matrix 4a (not represented here) are identical to thatrepresented in Fig. 1a–e. The assumption of transitivity allows us to imply linearhierarchy where only the adjacent members of the lineage show dominancerelationships. The tree representation of member A recovers all the informationof the transitive matrix (its tree-dominance matrix is identical to the transitivematrix).
In the dominance matrix 5a there are two independent substructures. Aninspection of the dominance trees allows us to detect two independent lineages:A-B-C and D-E. To represent the dominance structure, we need the trees ofthe two partial-dominant members A and D (Fig. 1, trees h and i). Thus, toretrieve all the information of the transitive matrix we need to sum up the tree-dominance matrices of member A and D (the resultant matrix is the tree-dominance matrix 5b).
In the transitive matrices of examples 4 and 5, the assumption of transitivityaffects only off-diagonal cells, that is, no circular triads are introduced. Thefollowing analysis of data 6 and 7 are examples of a more severe type of distortion.
The dominance matrix 6a represents a dominance structure that mixeshierarchical and nonhierarchical properties: on the one hand are dominantmembers A (which dominates all other members) and B (which dominates allother members except A), and on the other hand are circular triads involving C,D, and E. Note that the diagonal entries of the transitive matrix 6a for C, D, and Edo not obey the irreflexivity property. The dominance tree that recovers mostinformation from the transitive matrix is that of member A (Fig. 1j). This tree-dominance matrix is identical to the transitive matrix. However, the trees ofmembers D and E show the circularity (Fig. 1k–l) and a reduced graph representsthe circularity (Fig. 1m).
Finally, dominance matrix 7a is obtained by two modifications of dominancematrix 1a, with the cell [A,E] becoming zero and the cell [E,A] becoming one. Thematrix is by no means hierarchical and the assumption of transitivity maximallydistorts the dominance matrix, as can be seen by the reflexivity of the transitivematrix (in the transitive matrix 7a, all diagonal cells are one-valued). Althoughthere are some differences in the tree representation of each member (seeFig. 1n–r), which may be explored if a deeper investigation of the dominancerelationships is needed, the basic dominance information is that each memberdominates all the other members. To retrieve the dominance information from
Am. J. Primatol. DOI 10.1002/ajp
Dominance-Directed Tree Method / 199

the matrix, all the dominance trees must be inspected. In fact, the transitivematrix can be retrieved only by summing up the tree-dominance matrices of allfive members (matrix 7b). A reduced graph represents the circularity (Fig. 1s).
Evaluation of Distortion
The distortion produced by the assumption of transitivity may be measuredby the amount of intrusive information added to the dominance matrix. If thedominance matrix is a hierarchical structure, then the transitive matrix is equalto the dominance matrix and the distortion is zero (see the matrices for data 1–3in Table I).
A mild degree of distortion occurs when the assumption of transitivity doesnot produce information that contradicts the irreflexivity property, as indicated indata sets 4 and 5 in Table I. Every method of data simplification may imply somedistortion of the original data. To evaluate the pros and cons of a given method,we need to balance the degree of distortion produced by it, and its ability touncover the ‘‘subjacent’’ structure of the data. An analysis of matrix 4a isillustrative in this respect.
The transitive matrix 4a shows a lot of new dominance information. Itstransitive matrix is equal to the linear (complete) hierarchical dominance matrix1a. Given the assumption of transitivity, the four dominance relationships ofmatrix 4a are sufficient to produce a linear hierarchy, and in this respect are moreparsimonious than matrix 1a. In some sense, matrix 1a has redundant dominanceinformation that we can completely retrieve by applying the assumption oftransitivity on a more parsimonious dominance matrix (matrix 4a).
The great degree of distortion occurs when the dominance matrix hascircular triads, as in matrix 6a and, particularly, matrix 7a. The correspondingtransitive matrices show diagonal cells in which the property of irreflexivity isdisobeyed. Despite the great amount of distortion introduced by the assumptionof transitivity, the dominance tree analysis may be still useful for describing thestructure, as can be seen in Fig. 1j. In this figure the mixed structure of matrix 6amay be represented by the tree structure A-B-{C,D,E}, where the members inbrackets form a subset in which every member reaches the others. In thetransitive matrix 7a, every member reaches all the other members. Therefore, allmembers form the unique strong component {A,B,C,D,E}. In this case, thedominance structure cannot be fully represented by any single dominance tree.
Information Conveyed by a Dominance Tree Analysis
The dominance tree allows a flexible evaluation of the role and status of eachmember in the structure to be performed. Particularly for the linear hierarchy,the dominant member is that which reaches all the others but is not reached byanyone, and the subordinate member is that which does not reach anyone but isreached by all others. Given that a given hierarchy may be partial or may beformed by two or more independent subsets of members, we have to enumeratethe members that are in the partial-dominant or partial-subordinate set (forexample, in a partial hierarchy with two lineages there are two members in thesubordinate set, one for each lineage). Then, the partial-dominants are membersof the set of individuals that are not reached by anyone, whereas the partial-subordinates are members of the set of individuals that do not reach anyone. Theisolated members are simultaneously partial-dominant and partial-subordinate.
Am. J. Primatol. DOI 10.1002/ajp
200 / Izar et al.

They are easily enumerated by finding the intersection (in set theory terms) ofthe partial-dominant and partial-subordinate sets.
In practice, only the dominance trees of the partial-dominant members arerelevant to an analysis of the structure. Other members produce trees withredundant information. The information of the transitive matrix is retrieved onlyby summing up the tree-dominance matrix of each partial-dominant member.
A rank may be constructed by attaching, for each member, the number ofindividuals it reaches in its dominance tree (see the numbers in column 6 of eachmatrix of row a, Table I). In the linear hierarchies of matrices 1a and 4a (Table I)these numbers have a simple meaning in terms of the hierarchical rank of theindividuals. In the partial hierarchies of matrices 3a and 5a (Table I) thesenumbers are only meaningful in terms of the hierarchical rank of the individualsin each lineageFthey are meaningless for different lineages. Thus, in matrix 5a,rank 2 for B is not directly comparable to rank 2 for E because they pertain todifferent lineages (see that B is not a subordinate member, whereas E is).
Dominance Tree Analysis of Empirical Data
To illustrate the practical usefulness of the dominance tree analysis, weapplied the method to infer the dominance structure of a semifree-ranging groupof brown capuchin monkeys (Cebus apella). These data were collected by R.G.F.from a group of 17 individuals (three adult males, two subadult males, four adultfemales, and eight immatures of both sexes) inhabiting a peninsula of 18 hawithin the Tiete Ecological Park (Sao Paulo, Brazil), a reforested area where theanimals were introduced (for further details on the study group and site, seeOttoni and Mannu [2001] and Ferreira et al. [2002]). The indicators of dominanceused in this work included aggression/receive aggression (chase, bite, oraggressive display), approach/retreat, and displace/be displaced. Data werecollected on an all-occurrences basis. Only clear dyadic interactions were used.The data used here comprise ca. 500 hr of observations collected from February2000 to January 2001 [Ferreira, 2003].
The dominance matrix of the studied group (Table II) is not hierarchicalbecause it fails to be transitive. Zero ties accounted for 46 dyadic relations. Threedyads had low-value above zero ties, all between immature males (EdMj � MnMj= 1; FrMj � LbMj = 1; MnMj � DwMi = 1). After the dominance-directed treeanalysis is applied, the resulting transitive matrix (Table III) is a partialhierarchy with several lineages emerging from the partial-dominant partial-subordinate members. The treatment of ties and imposition of transitivityintroduced 27 dominance relations to the matrix, but did not provoke severedistortions in the original structure. In particular, no information was added tothe main diagonal (i.e., the irreflexivity was not violated by the assumption oftransitivity).
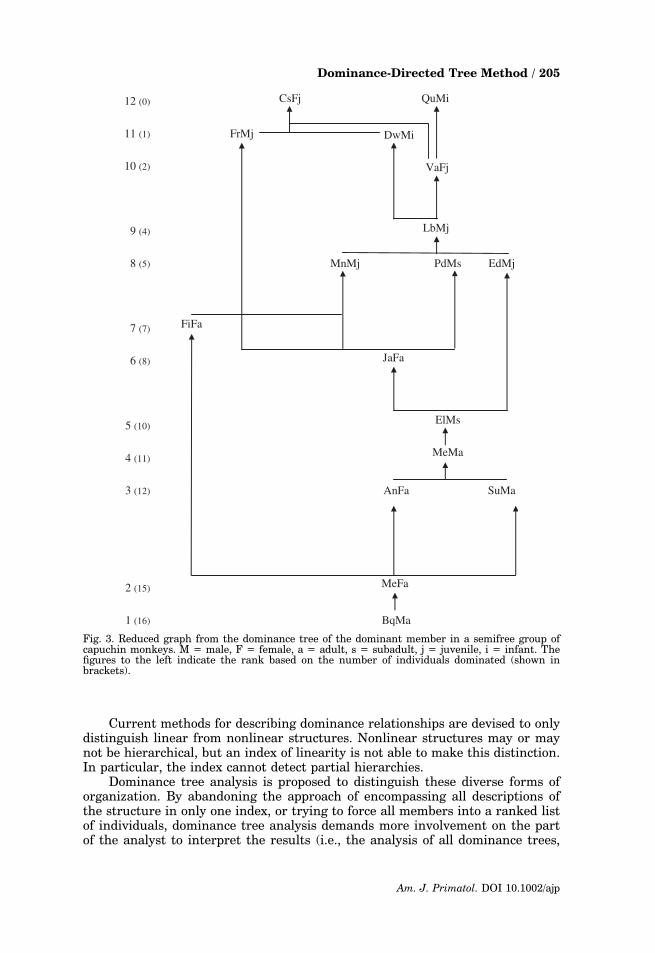
The most informative tree is that of the dominant member BqMa (Fig. 2).The tree-dominance matrix of BqMa is identical to the dominance matrix. Severalpaths are represented more than once in the dominance tree due to theirnonhierarchical relationships. Thus, the dominance tree can be represented bythe reduced graph of Bq’s dominance tree (Fig. 3), in which the individuals areranked by the number of vertices presented on their trees. The reduced graphshows the adult male Bq as the dominant member, followed by the adult femaleMe. Three adults emerge with different ranks (AnFa and SuMa: rank 3; FiFa:rank 7). Then a merging occurs, with members AnFa and SuMa dominatingthe member MeMa (rank 4). The structure splits again into different lineages
Am. J. Primatol. DOI 10.1002/ajp
Dominance-Directed Tree Method / 201

TA
BL
EII
.D
om
ina
nce
Ma
trix
of
Em
pir
ica
lD
ata
Fro
ma
Sem
ifre
eG
rou
po
fC
eb
us
ap
ell
a
Bq
Ma
Su
Ma
MeM
aE
lMs
PeM
sE
dM
jF
rMj
VsF
jL
bM
jC
sFj
Mn
Mj
Qu
Mi
Dw
Mi
FiF
aA
nF
aM
eFa
JaF
a
Bq
Ma
34
66
84
55
21
01
51
15
48
Su
Ma
30
20
20
10
00
00
00
0M
eMa
01
35
24
43
02
10
00
02
ElM
s0
00
12
10
14
98
59
72
00
01
PeM
s0
00
00
01
16
00
10
00
0E
dM
j0
00
00
02
24
21
33
00
00
FrM
j0
00
00
00
16
00
00
00
0V
sFj
00
00
00
00
30
10
00
00
Lb
Mj
00
00
00
11
40
21
00
00
CsF
j0
00
00
00
00
00
00
00
0M
nM
j0
00
00
10
41
21
10
00
0Q
uM
i0
00
00
00
00
00
00
00
0D
wM
i0
00
00
00
00
31
00
00
0F
iFa
00
00
00
23
00
11
00
00
An
Fa
00
10
02
01
00
21
00
00
MeF
a0
12
01
00
21
01
22
23
2JaF
a0
00
01
02
21
22
05
00
0
M,
male
;F
,fe
male
,a,
ad
ult
;s,
sub
ad
ult
;j,
juven
ile;
i,in
fan
t.
Am. J. Primatol. DOI 10.1002/ajp
202 / Izar et al.

TA
BL
EII
I.D
om
ina
nce
(‘‘U
nsi
gn
ed
1�
0’’
)a
nd
Tra
nsi
tiv
e(‘
‘Sig
ned
1�
0’’
)M
atr
ix(Z
ero
Va
lues
Om
itte
d)
of
em
pir
ica
lD
ata
Fro
ma
Sem
ifre
eG
rou
p
of
Ceb
us
ap
ell
a
Bq
Ma
Su
Ma
MeM
aE
lMs
PeM
sE
dM
jF
rMj
VsF
jL
bM
jC
sFj
Mn
Mj
Qu
Mi
Dw
Mi
FiF
aA
nF
aM
eFa
JaF
a
Bq
Ma
11
11
11
11
11
11
11
11
Su
Ma
1+
11
+1
1+
11
+1
+1
+1
+1
+1
MeM
a1
11
11
11
+1
11
+1
1E
lMs
11
11
11
11
11
PeM
s1
11
+1
1E
dM
j1
11
11
FrM
j1
VsF
j1
1L
bM
j1
11
1C
sFj
Mn
Mj
11
11
1+
1Q
uM
iD
wM
i1
FiF
a1
1+
1+
11
1+
1A
nF
a1
+1
+1
1+
11
+1
+1
11
+1
+1
MeF
a1
1+
11
+1
+1
11
+1
11
11
11
JaF
a1
11
11
1+
11
M,
male
;F
,fe
male
,a,
ad
ult
;s,
sub
ad
ult
;j,
juven
ile;
i,in
fan
t.
Am. J. Primatol. DOI 10.1002/ajp
Dominance-Directed Tree Method / 203

from ranks 5, 6, 8 and 10, but these lineages are merged through commonsubordinate members at ranks 8 (FiFa and JaFa dominating MnMj), 9 (threelineages dominating LbMj), 11 (FiFa and JaFa dominating FrMj), and 12 (threelineages dominating CsFj). In each case, the common subordinate member is ajuvenile.
The resulting partial-dominance hierarchy, with more than one individualoccupying the same rank position, is related to the absence of actual aggressiveconflicts between some members. The absence of aggressive conflicts can becredited to an avoidance strategy adopted by subordinate group members [Izar &Sato, 1997] or to tolerance from dominant members [Izar, 2004]. In fact,according to socioecological models, tolerant dominance hierarchies are expectedwhen primate groups are subjected to strong food competition within andbetween groups [Sterck et al., 1997]. This kind of structure cannot be properlyassessed by other methods, as stated in the Introduction.
CONCLUSIONS
In this work we defined a social structure by its set of members and set ofdominance relationships. A hierarchy is a structure that must be irreflexive,asymmetric, and transitive. If all pairs of members show dominance relationships,the hierarchy is said to be linear; otherwise, it is a partial hierarchy. Structuresmay mix hierarchical and nonhierarchical properties, or they may be non-hierarchical.
Fig. 2. Dominance tree of the dominant member based on empirical data from a semifree group ofcapuchin monkeys (Tables II and III). M = male, F = female, a = adult, s = subadult, j = juvenile, i= infant.
Am. J. Primatol. DOI 10.1002/ajp
204 / Izar et al.
Current methods for describing dominance relationships are devised to onlydistinguish linear from nonlinear structures. Nonlinear structures may or maynot be hierarchical, but an index of linearity is not able to make this distinction.In particular, the index cannot detect partial hierarchies.
Dominance tree analysis is proposed to distinguish these diverse forms oforganization. By abandoning the approach of encompassing all descriptions ofthe structure in only one index, or trying to force all members into a ranked listof individuals, dominance tree analysis demands more involvement on the partof the analyst to interpret the results (i.e., the analysis of all dominance trees,
12 (0) CsFj QuMi
11 (1) FrMj DwMi
10 (2) VaFj
9 (4) LbMj
8 (5) MnMj PdMs EdMj
7 (7) FiFa
6 (8) JaFa
5 (10)ElMs
4 (11)MeMa
3 (12) AnFa SuMa
2 (15) MeFa
1 (16) BqMa
Fig. 3. Reduced graph from the dominance tree of the dominant member in a semifree group ofcapuchin monkeys. M = male, F = female, a = adult, s = subadult, j = juvenile, i = infant. Thefigures to the left indicate the rank based on the number of individuals dominated (shown inbrackets).
Am. J. Primatol. DOI 10.1002/ajp
Dominance-Directed Tree Method / 205

evaluation of the status of each member in the tree structure, occurrence ofcircular triads, etc.). In so doing, dominance tree analysis allows the researcher toperform a richer and more flexible analysis of the organization of the dominancerelationships than the current methods. A distinctive feature of dominancetree analysis is that it is devised not only to detect hierarchical organizations, butalso to determine when hierarchical and nonhierarchical principles are operatingin different subsets of individuals. In so doing, it provides a simple treerepresentation where both situations are clearly differentiated.
The degree of distortion produced by the assumption of transitivity may beexplicitly evaluated by inspecting the amount and the nature of the extradominance relationships introduced by the assumptions of the dominance matrix.Departures from the hierarchical principles can be measured by the amount ofviolations of the principle of irreflexivity. These violations of irreflexivity may begeneralized or may be restricted to some cells. Dominance tree analysis is able todistinguish between these mixed cases, with hierarchical and nonhierarchicalprinciples operating in different places of the structure.
Each member may be the root of the dominant tree. So, from a structurewith N members, a total of N trees may be constructed, but only those ofthe partial dominant members are relevant for describing the structure. Theother trees can be discarded because they show redundant information.The analysis of the dominant trees allows us to describe the characteristics ofthe dominant structure, whether it is hierarchical or not, as well as thehierarchical status of each member in the structure. The degree of importanceof a given member may be evaluated by the number of individuals it dominatesin its dominance tree, and thus a rank may be constructed even if some dyadsfail to show hierarchical relationships. The number of relevant dominancetrees is directly related to the complexity of the structure. For example, anylinear hierarchy requires only the dominance tree of the dominant member.This tree encompasses all of the information from the dominance matrixor the tree dominance matrix. At the other extremes, all dominance trees areneeded to describe the structure in which any member is involved in circulartriads with any other two members (that is, in which the tree dominance matrixis reflexive).
Dominance trees allow the identification of different substructures in apartial hierarchy. These substructures may take the form of different lineagesbeginning from a common substructure, or that of independent substructures,or they may even constitute a subset of members in which no hierarchicalrelationships occur.
The use of dominance trees to describe dominance structures relies on thevalidity of adopting the assumption of transitivity. When the structure is alreadyhierarchical, irrespectively of being linear or partial, the assumption oftransitivity does not produce any change in the dominance matrix. Minordistortions resulting from the introduction of dominance relationships into theoff-diagonal cells may appear, but they do not constitute a real impediment touncovering the hierarchical nature of the dominance relationships in the group.
Important distortions occur when the assumption of transitivity introducesreflexivity into the transitive matrix. In that case the entire structure is notstrictly hierarchical; however, dominance tree analysis is still able to show wherethe hierarchical property of irreflexivity is obeyed and where it is not obeyed.Thus it can provide a detailed description of the mixed dominance structure (e.g.,where hierarchy occurs, which members are involved in nonhierarchical circulartriads, the status of each member, etc.).
Am. J. Primatol. DOI 10.1002/ajp
206 / Izar et al.
ACKNOWLEDGMENTS
We thank the managers of Tiete Ecological Park, where we conducted ourstudies, and two anonymous reviewers who contributed helpful comments onearly versions of the manuscript. This work was supported by CAPES (grants00022/03-9 to P.I. and 2172-97/6 to R.G.F.) and FAPESP (grant 914038-1 to P.I.).
REFERENCES
Appleby MC. 1983. The probability of linear-ity in hierarchies. Anim Behav 31:600–608.
Broom M. 2002. A unified model of dominancehierarchy formation and maintenance.J Theor Biol 219:63–72.
Carley KM, Prietula MJ. 1994. Computationalorganization theory. Hillsdale, NJ: Lawr-ence Erlbaum Associates. 320p.
de Vries H. 1995. An improved test oflinearity in dominance hierarchies contain-ing unknown or tied relationships. AnimBehav 50:1375–1389.
de Vries H. 1998. Finding a dominance ordermost consistent with a linear hierarchy:a new procedure and review. Anim Behav55:827–843.
de Vries H, Appleby MC. 2000. Finding anappropriate order for a hierarchy: a com-parison of the I&SI and the BBS methods.Anim Behav 59:239–245.
Drews C. 1993. The concept and definition ofdominance in animal behaviour. Behaviour125:283–313.
Ferreira RG, Resende BD, Mannu M, OttoniEB, Izar P. 2002. Bird predation and prey-transference in brown capuchin monkeys(Cebus apella). Neotrop Primates 10:84–89.
Ferreira RG. 2003. Coalitions and socialdynamics of a semi-free ranging Cebusapella group. Ph.D. dissertation, Universityof Cambridge, Cambridge, UK. 155p.
Harary F, Norman RZ, Cartwright D. 1965.Structural model: an introduction to the
theory of directed graphs. New York: JohnWiley & Sons. 415p.
Izar P, Sato T. 1997. Influencia de abundanciaalimentar sobre a estrutura de espacamen-to interindividual e relacoes de dominanciaem um grupo de macacos-prego (Cebusapella). In: Ferrari SF, Schneider H, edi-tors. A primatologia no Brasil 5. Belem:UFPA. p 249–267.
Izar P. 2004. Female social relationships ofCebus apella nigritus in southeasternAtlantic forest: an analysis through ecolo-gical models of primate social evolution.Behaviour 141:71–99.
Jameson KA, Appleby MC, Freeman LC.1999. Finding an appropriate order for ahierarchy based on probabilistic domi-nance. Anim Behav 57:991–998.
Ottoni EB, Mannu M. 2001. Semifree-rangingtufted capuchins (Cebus apella) sponta-neously use tools to crack open nuts. Int JPrimatol 22:347–358.
Pinter CC. 1971. Set theory. Reading, MA:Addison-Wesley Publishing Co. 216p.
Pollock JL. 1990. Technical methods inphilosophy. London: Westview Press. 126p.
Sterck EHM, Watts DP, van Schaik CP. 1997.The evolution of female social relationshipsin nonhuman primates. Behav Ecol Socio-biol 41:291–309.
Wilson EO. 1975. Sociobiology. The newsynthesis. Cambridge: Harvard UniversityPress. 697p.
Am. J. Primatol. DOI 10.1002/ajp
Dominance-Directed Tree Method / 207