The New York Cotton Exchange and the Development of the Cotton Futures Market

Soil microbial communities under conventional-till and no-till
continuous cotton systems
Y. Fenga,*, A.C. Mottaa,b, D.W. Reevesb,1, C.H. Burmestera, E. van Santena, J.A. Osbornec
aDepartment of Agronomy and Soils, Auburn University, Auburn, AL 36849, USAbUSDA-ARS National Soil Dynamics Laboratory, 411 S. Donahue Dr, Auburn, AL 36832, USA
cDepartment of Statistics, North Carolina State University, Raleigh, NC 27695, USA
Received 30 July 2002; received in revised form 22 July 2003; accepted 13 August 2003
Abstract
Soil management practices affect soil microbial communities, which in turn influence soil ecosystem processes. In this study, the effects of
conventional- (fall disking, chiseling and spring disking, field cultivation) and no-tillage practices on soil microbial communities were
examined under long-term continuous cotton (Gossypium hirsutum L.) systems on a Decatur silt loam soil. Soil samples were taken in
February, May, and October of 2000 at depths of 0–3, 3–6, 6–12, and 12–24 cm. Compared to the conventional-till treatment, the no-till
treatment increased soil organic carbon and total nitrogen contents in the surface layer by 130 and 70%, respectively. Microbial biomass C
content under no-till treatment was 60, 140, and 75% greater than under conventional-till treatment in February, May, and October,
respectively. Principal components analysis of phospholipid ester-linked fatty acid (PLFA) profile indicated soil microbial communities
shifted over time and with soil depth. This change appeared to be driven primarily by soil bacterial populations as indicated by the major
PLFA contributors (i.e. fatty acids 16:0, 10Me16:0, cy19:0, 16:1 2OH, and i15:0) to the first two principal components. Tillage treatment
differences were revealed by analysis of variance on the first principal components (PC 1), which accounted for 62% of the total sample
variance, and by the relative abundance of selected PLFAs and PLFA ratios. The impact of tillage practices was significant in February and
May, but not in October. During the growing season, changes in the microbial community may be primarily determined by soil conditions
responding to cotton growth and environmental variables such as moisture and temperature; during fallow or prior to cotton establishment,
community changes associated with tillage practices become more pronounced. These findings have implications for understanding how
conservation tillage practices improve soil quality and sustainability in a cotton cropping system.
q 2003 Elsevier Ltd. All rights reserved.
Keywords: Microbial community; Phospholipid ester-linked fatty acid; No tillage; Conventional tillage; Cotton
1. Introduction
Soil management practices affect soil microbial commu-
nities, which mediate many processes essential to the
productivity and sustainability of soil. Until very recently,
conventional tillage has been the predominant method of
land preparation in the southeastern US where continuous
cotton has been grown for decades on soils with low
inherent fertility, susceptible to aggregate disruption,
crusting formation, and erosion (Miller and Radcliffe,
1992; Reeves, 1994). The primary reasons for tillage were
to: (1) provide a smooth and suitable seedbed given the type
of seeding equipment available; (2) (temporarily, at least)
reduce soil compaction to promote crop rooting; (3)
incorporate fertilizers and lime (which is not necessary in
most situations); (4) control weeds before the advent of
herbicides, and later to incorporate some residual soil
herbicides; (5) bury crop residues for certain types of plant
disease control; (6) warm the soil in humid and cooler
regions; and finally; (7) follow tradition (Gebhardt et al.,
1985).
The improvement of seeding equipment and availability
of pesticides and alternative weed/pest control strategies
have reduced the need for conventional tillage practices.
Although it temporarily reduces soil compaction, conven-
tional tillage promotes a vicious cycle of soil loosening and
reconsolidation that results in denser soils with the loss of
0038-0717/$ - see front matter q 2003 Elsevier Ltd. All rights reserved.
doi:10.1016/j.soilbio.2003.08.016
Soil Biology & Biochemistry 35 (2003) 1693–1703
www.elsevier.com/locate/soilbio
1 Present address: USDA-ARS, J. Phil Campbell Sr.-Natural Resource
Conservation Center, Watkinsville, GA 30677, USA.
* Corresponding author. Tel.: þ1-344-844-3967; fax: þ1-334-844-3945.
E-mail address: [email protected] (Y. Feng).

organic matter and repeated traffic. Soils in humid thermic
regimes are more sensitive to degradation from repeated
tillage due to erosion and loss of soil organic matter. Thus,
they are better candidates for adoption of no-tillage systems.
It is well-known that no-till practices increase soil organic
matter content in the surface layer, improve soil aggrega-
tion, and preserve the soil resources better than conventional
till practices. Increased soil organic matter content associ-
ated with no-till practices not only improves soil structure
and water retention, but also serves as a nutrient reservoir
for plant growth and a substrate for soil microorganisms.
Different tillage systems have been reported to impact
soil microbial and biochemical properties (Doran, 1980).
Although much information exists regarding effects of
tillage practices on gross microbial response (e.g. microbial
biomass and respiration) and numbers of total or culturable
microorganisms, characterization of the soil microbial
diversity using culture-independent and community-level
approaches did not appear until recently. These new
approaches, such as nucleic acid-based methods and
phospholipid ester-linked fatty acid (PLFA) analysis, are
advantageous for ‘fingerprinting’ the soil microbial com-
munity at a finer resolution to monitor changes of
community structure resulting from different management
practices. To date, there are only four reported studies that
examined the tillage effects on soil microbial communities
as indicated by PLFA profiles (Bossio et al., 1998; Calderon
et al., 2001; Drijber et al., 2000; Ibekwe et al., 2002)
Cotton is the most important row crop in Alabama, USA,
contributing 30% of total crop cash receipts annually
(Alabama Agricultural Statistics Service, 2002). Lately,
more and more cotton farmers have adopted conservation
tillage systems. Changes in soil physical and chemical
properties associated with different tillage practices have
been studied extensively (Edwards et al., 1992; Reeves,
1997). Biological changes brought about by conversion
from conventional- to no-tillage practices in the region have
not been evaluated. In this study, we used the phospholipid
fatty acid profile to characterize microbial communities
developed under long-term conventional-till and no-till
treatments in a kaolinitic soil cropped to cotton. The
objective of the study was to determine the effects of
conventional and no-tillage practices on the size and
composition of the soil microbial community under
continuous cotton systems over time and at various soil
depths.
2. Materials and methods
2.1. Field experiment and soil sampling
The long-term cotton tillage and rotation experiment is
located on a Decatur silt loam (fine, kaolinitic, thermic
Rhodic Paleudults) at the Tennessee Valley Research
and Extension Center, Belle Mina, Alabama, USA.
The experiment is a randomized complete block design
with four blocks and nine treatments. The soil was sampled
in 2000 from two winter fallow continuous cotton
treatments subjected to conventional tillage and no-tillage.
Conventional-till plots were established in 1979 and no-till
plots in 1988 from previously conventionally tilled plots.
Conventional tillage involved disking and chisel plowing in
the fall and disking and field cultivation in the spring prior to
planting. No-till cotton was planted into the cotton stubble
of the previous year. Fertilizers, insecticides, herbicides,
and defoliants were applied according to Auburn University
recommendations (Adams et al., 1994). On average, cotton
yields for the no-till treatment were 4% higher than for the
conventional-till treatment from 1988 to 2000. No-till
cotton yield was 1.7% higher than conventional-till cotton
in 2000.
The soil was sampled on February 10, May 4 (13 days
after cotton planting), and October 2 (12 days after cotton
harvest) of 2000. Ten 3.9 cm diameter soil cores (0–24 cm
depth) were collected randomly from 93 m2 (500 £ 200,
15.2 m £ 6.1 m) individual plots. Soil cores were divided
into four depths (0–3, 3–6, 6–12, and 12–24 cm),
composited by depth, and passed through a 4–mm sieve.
After thorough mixing, subsamples were taken for water
content, microbial biomass determination, and extraction of
lipids. Field-moist soil samples were stored at 4 8C for no
more than 1 week before microbial biomass determination
and no more than 3 weeks before lipid extraction. The
concentrations of fatty acids generally do not change
significantly over a 7-week storage period at 4.5 8C
(Petersen and Klug, 1994). Samples for soil bulk density
ðDbÞ determination were collected in April of 2000.
2.2. Laboratory analysis
2.2.1. Soil analysis
Soil samples collected in February were air-dried, passed
through a 2-mm sieve, and used for soil chemical analyses.
Total carbon and nitrogen contents were determined by dry
combustion using a C/N analyzer (Fisons Instruments,
Beverly, MA). Since there is no appreciable carbonate C in
this inherently acid soil, the total carbon content is
equivalent to the soil organic carbon (SOC) content. The
pH was measured in a 1:1 soil/water suspension (Page et al.,
1982). Microbial biomass C was determined using the
fumigation–incubation method with a 5-day pre-incubation
period (Horwath and Paul, 1994). Biomass carbon was
calculated using a conversion factor of 0.41 without the
subtraction of a control (Voroney and Paul, 1984;
Franzluebbers et al., 1999a).
2.2.2. Phospholipid fatty acid (PLFA) analysis
Duplicate field-moist soil samples were used for PLFA
analysis according to a procedure modified after Findlay and
Dobbs (1993), and Bossio et al. (1998). Briefly, 4 g (dry
weight) soil was extracted using 19 ml of a single-phase
Y. Feng et al. / Soil Biology & Biochemistry 35 (2003) 1693–17031694

mixture (1:2:0.8 v/v/v) containing chloroform, methanol
and citrate buffer (0.15 M, pH 4) for 2 h on a rotator in the
dark. After centrifugation for 10 min at 2500 rev min21, the
supernatant was decanted to a fresh tube. The soil was then
vortexed with an additional 8 ml of extractant and the
supernatant was combined with the first extraction. More
buffer (5.7 ml) and chloroform (7.1 ml) were added to the
extraction mixture to break phase and the phases allowed to
separate overnight. The chloroform layer was then trans-
ferred to a fresh tube and dried under nitrogen at 37 8C.
Phospholipids were separated from neutral and glycolipids
using packed activated silicic acid (0.5 g, Unisil 100–200
mesh) columns. The column was conditioned with 3-ml
chloroform; lipids were transferred to the column with
4 £ 150 ml of chloroform. Neutral lipids, glycolipids, and
phospholipids were eluted with 5 ml chloroform, 10 ml
acetone, and 5 ml methanol, respectively. Methanol eluates
were collected and dried under nitrogen at 37 8C. The
phospholipids were then subjected to a mild alkaline
methanolysis. Samples were dissolved in 1 ml 1:1 metha-
nol:toluene and 1 ml 0.2 M NaOH in methanol, heated at
37 8C for 15 min, and cooled to room temperature. After
addition of 2 ml of deionized water and 0.3 ml of 1 M acetic
acid, fatty acid methyl esters (FAMEs) were extracted twice
with 2 ml of hexane by vortexing for 30 s. Hexane fractions
were combined and dried under nitrogen at 37 8C. Prior to
GC analysis, samples were dissolved in appropriate
amounts of hexane containing 19:0 methyl ester as an
internal standard.
2.2.3. GC analysis
FAMEs were analyzed using a Hewlett Packard 5890 gas
chromatograph with a 25-m HP Ultra 2 capillary column
and a flame ionization detector. The column temperature
was 170 8C initially, increased to 270 8C at 5 8C min21, and
finally ramped to 315 8C at 2 8C min21. The injector and
detector temperatures were held at 2508 and 300 8C,
respectively. Fatty acid peaks were identified using the
MIDI peak identification software (MIDI, Inc., Newark,
DE) and bacterial FAME standards (Matreya, Inc., Pleasant
Gap, PA). Identification of the FAMEs was confirmed by
gas chromatography mass spectrometry using a Varian
Saturn 4 Ion Trap GCMS system.
2.3. Nomenclature of fatty acids
Fatty acids are designated according to the convention
X:YvZ, where ‘X’ indicates the total number of carbon
atoms in the molecule (except for molecules with a mid-
chain branch), ‘Y’ indicates the number of double bonds,
‘Z’ indicates the position of the 1st double bond or
cyclopropane ring, and v indicates the position counted
from the methyl end of the molecule. The prefix ‘i’ indicates
iso branching, ‘a’ indicates anteiso branching, ‘10Me’
refers to methyl branching on the 10th carbon from the
carboxyl end, and ‘cy’ stands for cyclopropane ring.
Suffixes ‘c’ and ‘t’ indicate the cis and trans configuration,
respectively. The number before an OH refers to the
location of a hydroxy group relative to the carboxyl end of
the molecule. When branching occurs in the middle of the
carbon chain, the branching C is not added to ‘X’ (Gunstone
and Herslof, 1992).
2.4. Statistical analysis
The mole percentage distribution of PLFAs was analyzed
with SAS software using principal components analysis
(PCA). Analysis of variance on the first principal com-
ponent (PC 1) was conducted to assess the effects of tillage,
sampling time, and soil depth. PCA was performed on
combined PLFA data of all three sampling dates as well as
PLFA data of each sampling date. All samples were
analyzed for PLFA profiles using a set of 46 fatty acids
that were present in most of the samples.
3. Results
3.1. Soil physical and chemical properties
Tillage treatments greatly affected soil physical and
chemical properties (Table 1). Soil organic C content was
more than twice as high in the surface layer of the no-till
treatment compared to the conventional-till treatment.
Differences in SOC between the two tillage treatments
were not significant at the three lowest depths. The SOC in
no-till plots decreased sharply with increasing soil depth.
Table 1
Selected chemical and physical properties of a silt loam soil from
conventional-till and no-till cotton plots
Tillage treatment Depth (cm)
0–3 3–6 6–12 12–24
Soil organic carbon (mg g21)
Conventional 8.3 9.3 6.4 5.4
No-till 18.8 10.0 6.5 6.1
LSD(0.05) 0.9 0.9 0.9 0.9
Total nitrogen (mg g21)
Conventional 1.0 1.0 0.9 0.8
No-till 1.7 1.0 0.9 0.8
LSD(0.05) 0.1 0.1 0.1 0.1
Bulk density (g cm23)
Conventional 1.27 1.38 1.46 1.59
No-till 1.22 1.55 1.58 1.56
LSD(0.05) 0.03 0.03 0.03 0.03
pH
Conventional 6.5 6.4 6.7 6.7
No-till 6.7 6.7 6.6 6.4
LSD(0.05) 0.2 0.2 0.2 0.2
Soil samples were collected in April 2000 for bulk density
determination and in February 2000 for other analyses.
Y. Feng et al. / Soil Biology & Biochemistry 35 (2003) 1693–1703 1695

There was a significant increase in organic carbon at the
3–6 cm sampling depth compared to the surface layer (9.3
vs. 8.3 mg g21) for conventional-till plots; thereafter, SOC
declined linearly with depth. The decline in organic carbon
for no-till plots was best described with a polynomial
response function in log-linear space (% SOC ¼ 2.4–2.9
log(depth) þ 2.4 [log(depth)]2; R2 ¼ 0.95). Total soil N
was 70% higher in no-till compared to conventional-till
plots (1.7 vs. 1.0 mg g21) at the surface layer (Table 1).
While there was no change in soil N between the 0–3 and
3–6 cm depths for conventional-till plots, total N for no-till
plots declined sharply at the 3–6 cm sampling depth and
stabilized at approximately 0.9 mg g21. Additionally, no-till
plots had significant lower bulk density at the surface layer
compared to the conventional-till plots (Table 1). In the
latter, bulk density increased linearly with soil depth
(Db ¼ 0.02 depth þ 1.27, R2 ¼ 0.96) whereas the bulk
density in the former increased from 1.22 in the surface
layer to 1.55 g cm23 in the second sampling depth and did
not change any further. There was little change in soil pH
for either conventional-till or no-till treatments (Table 1).
3.2. Microbial biomass C and total PLFAs
Microbial biomass C ranged from 63 to 266 mg g21 in
conventional-till soils and 73–633 mg g21 in no-till soils for
all sampling depths and months (Fig. 1). The percentages of
SOC as biomass C ranged from 1.17 to 3.21% for
conventional-till treatments and 1.20–3.37% for no-till
treatments, and the values decreased as soil depth increased.
The total amounts of PLFAs ranged from 13 to 47 nmol g21
in conventional-till soils and 12–147 nmol g21 in no-till
soils. The ratios of total PLFAs (in nmol) to microbial
biomass C (in mg) averaged 189 in conventional-till soils
and 181 in no-till soils. No-till soils contained significantly
higher amounts of microbial biomass C and total PLFAs
than conventional-till soils at the surface layer for all
sampling months (Fig. 1). Both microbial biomass C and
total PLFAs decreased with increasing soil depths. The
changes for conventional-till plots were fitted through a
second order polynomial response curve, whereas the
changes were modeled on log (depth) for no-till plots
(Table 2). The largest changes occurred between the 0–3
and 3–6 cm depths, irrespective of the sampling month.
Differences in both microbial biomass C and total PLFAs
between the two upper depths were most pronounced for the
no-till treatment sampled in May; these changes were at
least twice as large as for other months. The linear
correlation coefficient between microbial biomass C and
total PLFAs was 0.73 ðn ¼ 96Þ:
3.3. Soil microbial community structure as indicated
by PLFA profiles
PLFA analysis identified a total of 66 different fatty
acids. Forty-six of them were consistently present in the
samples and were used for data analysis. These 46 fatty
acids ranging in carbon chain length from C12 to C20
consisted of saturated, mono- and polyunsaturated,
methyl-branched, hydroxylated, and cyclopropane fatty
acids. PLFA mole percents were analyzed using PCA
and the first two principal components (PCs) accounted
Fig. 1. Microbial biomass C and total PLFAs for conventional-till and no-till treatments at four soil depths sampled in February, May, and October 2000.
Y. Feng et al. / Soil Biology & Biochemistry 35 (2003) 1693–17031696

for 62% and 9% of the total sample variance. The PCA
plot of the first two PCs (Fig. 2) showed that PLFA
profiles varied primarily by depth and by sampling
month, but not by tillage treatment. Principal component
1 separated PLFA profiles by depth with 11 of the 12
data points for 0–3 and 3–6 cm depths having negative
scores and 11 of the 12 data points for 6–12 and
12–24 cm depths having positive scores. The PCA plot
also showed that October data formed a cluster and had
negative scores for PC 2, whereas data points for
February and May were intermixed and 13 of the 16
data points had positive scores for PC 2 (Fig. 2). This
Table 2
Coefficients (SE: standard error) from the regression of microbial biomass and total PLFAs on depth from soils of conventional-till and no-till plots
Conventional tillage No-tillage
Intercept (SE) Depth (SE) Depth2 (SE) R2 Intercept (SE) Log (depth) (SE) (Log(depth))2 (SE) R2
Microbial biomass
February 53.6 (1.34) 24.5 (0.37) 0.14 (0.018) 0.95 77 (7.8) 2103 (25.8) 44 (17.9) 0.94
May 45.4 (0.07) 24.0 (0.02) 0.12 (0.001) 0.99 206 (20) 2375 (66.2) 178 (45.7) 0.96
October 29.1 (0.99) 21.6 (0.27) 0.04 (0.013) 0.96 65 (3.0) 279 (9.9) 31 (6.8) 0.98
Total PLFAs
February 269.9 (1.73) 222.8 (0.47) 0.66 (0.023) 0.99 493 (4.4) 2696 (14.5) 291 (10.1) 0.95
May 306.6 (31.6) 234.8 (8.62) 1.20 (0.417) 0.92 859 (51.7) 21420 (172) 678 (119) 0.97
October 248.5 (6.63) 220.3 (1.81) 0.56 (0.087) 0.98 490 (9.1) 2617 (29.9) 227 (20.7) 0.99
Data from conventional-till plots were regressed on depth, whereas no-till data were fitted on log(depth).
Fig. 2. Plot of the first two principal axes from the principal components analysis of PLFA profiles for conventional-till and no-till treatments at four soil depths
sampled in February, May, and October 2000. Labels for data points stand for Month_Tillage treatment_Depth (C: conventional tillage; N: no-tillage; 1:
0–3 cm; 2: 3–6 cm; 3: 6–12 cm; 4: 12–24 cm).
Y. Feng et al. / Soil Biology & Biochemistry 35 (2003) 1693–1703 1697

suggests that microbial community composition was
similar at the two earlier sampling times.
Since PC 1 explained 62% of the total sample variance,
ANOVA on the first PC was performed using a complete
2 £ 4 £ 3 factorial model with tillage, depth, and month as
sources of variation. There was a significant tillage £ depth
interaction ðP , 0:01Þ; the responses of PC 1 to depth were
different for conventional-till and no-till systems (Fig. 3a).
The response was linear for conventional till system (PC
1 ¼ 23.82 þ 0.49 depth, R 2 ¼ 0.99) but log linear for no-
till system (PC 1 ¼ 26.37 þ 8.54 log (depth), R 2 ¼ 0.99).
The depth effect was less pronounced with conventional
tillage than no-tillage as indicated by the slopes of
the regression lines. The ANOVA also revealed a significant
month £ depth interaction ðP , 0:01Þ: Fig. 3b indicates that
microbial communities in the late season (October) samples
differed from those in two early season samples, which is
also shown in Fig. 2. There was no significant tillage £
depth £ month interaction.
PCA also identified fatty acids that were important in
explaining the variability in PLFA profiles. The PLFAs
16:0, 10Me16:0, cy19:0, 18:1v9c, and 18:1v7c were
influential fatty acids to PC 1 whereas 16:1 2OH, i15:0,
and 18:1v9c were the major contributors to PC 2 (Table 3).
Fig. 4 shows the depth distributions of selected influential
PLFAs in mole percent averaged across sampling months.
The PLFAs 16:0 and 16:1 2OH have not been associated
with any particular groups of microorganisms. The fatty
acid 16:0 is present in almost all microorganisms (Ratledge
and Wilkinson, 1988). It constituted the largest mole
fraction of all fatty acids in the samples and correlated
well with total PLFAs and microbial biomass C. 10Me16:0
and i15:0 are Gram-positive bacterial biomarkers and their
mole percentages increased as soil depths increased in both
conventional-till and no-till soils (10Me16:0 in Fig. 4a;
i15:0 not shown). 10Me16:0 may also occur in sulfate-
reducing bacteria (Findlay and Dobbs, 1993). The PLFAs
cy19:0 and 18:1v7c are signature fatty acids of Gram-
negative bacteria; 18:1v7c is the precursor molecule of
cy19:0. The ratio of cy19:0/18:1v7c increased with soil
depths and was 17.8 and 23.6% higher in no-till than
conventional-till soils at the two middle depths (Fig. 4b).
The relative abundance of PLFA 18:1v9c decreased with
increasing soil depth under both tillage treatments and was
lower in no-till plots (Fig. 4c).
The mean ratio of fungal to bacterial PLFAs (the sum of
mole percent for 18:2v6,9c, 18:1v9c, 18:3v6c, and
20:1v9c to that for i15:0, i16:0, 10Me16:0, a15:0, cy17:0,
18:1v7c, cy19:0, 14:0, 15:0, 16:1v9c, 16:1v7c, 16:1v5c,
a17:0, i17:0, 17:0, and 18:0) decreased with increasing soil
depth. The fungal to bacterial PLFA ratio was similar at
Fig. 3. Responses of the first principal component (PC 1) to increasing soil
depth for tillage treatments (A) and sampling months (B) from a continuous
cotton field. The principal components analysis was based on all three
sampling dates. The regression equations for tillage treatment are: PC
1 ¼ 0.436 depth 2 3.823 ðR2 ¼ 0:991Þ for conventional tillage; PC
1 ¼ 20.048 depth2 þ 1.474 depth 2 6.89 (R2 ¼ 0.996) for no-tillage
(quadratic); and PC 1 ¼ 8.539 depth 2 6.37 ðR2 ¼ 0:992Þ for no-tillage
(log-linear). The regression equations for sampling months are: PC
1 ¼ 20.0279 depth2 þ 1.085 depth 2 6.218 ðR2 ¼ 1Þ for February;
PC 1 ¼ 20.0423 depth2 þ 1.436 depth 2 8.178 ðR2 ¼ 0:999Þ for May;
PC 1 ¼ 20.015 depth2 þ 0.6 depth 2 2.41 ðR2 ¼ 0:998Þ for October.
Table 3
PLFAs receiving scores . l ^ 0.20l on the first two principle components
Fatty acid Score Specificity as a biomarkera,b
PC 1
16:0 20.60 Nonspecific
10Me16:0 0.57 Gram-positive bacteria, sulfate-reducing bacteria
cy19:0 0.31 Anaerobes, Gram-negative bacteria
18:1v9c 20.21 Fungi, aerobic bacteria
18:1v7c 20.20 Aerobic bacteria, Gram-negative bacteria
PC 2
16:1 2OH 20.87 Nonspecific
i15:0 0.32 Gram-positive bacteria
18:1v9c 20.21 Fungi, aerobic bacteria
a The principal component analysis was carried out using 46 PLFAs. Soil
samples were taken at four depths in February, May, and October 2000.b Source: Ratledge and Wilkinson (1988), Findlay and Dobbs (1993) and
Paul and Clark (1996).
Y. Feng et al. / Soil Biology & Biochemistry 35 (2003) 1693–17031698

the surface layer for both tillage treatments and 10% lower
in no-till plots than conventional-till plots at the 6–12 cm
depth (Fig. 4d). The ratio of Gram-positive to Gram-
negative bacterial PLFAs (the sum of mole percent of i15:0,
i16:0, 10Me16:0, a15:0 to that for cy17:0, 18:1v7c, cy19:0)
increased with soil depths (Fig. 4e), suggesting that Gram-
positive bacterial population increased with soil depth. The
average mole percent of actinomycete PLFA 10Me18:0
increased with soil depth and was 26% higher in
conventional-till soil than in no-till soil at the surface
layer (Fig. 4f). For the two mid-chain branched fatty acids,
the mole percentages of 10Me 16:0 was 3–4 times higher
than 10Me 18:0 averaged across sampling months and
depths. Fig. 4 also shows that changes in relative amounts of
PLFA and PLFA ratios by depth were linear for conven-
tional-till treatment and nonlinear for no-till treatment,
indicating dissimilar compositions of the soil microbial
community under different tillage treatments.
When principal component analysis was performed for
each sampling month, PC 1 accounted for 60, 61, and 56%
of the total variance for February, May, and October,
respectively. The influential fatty acids identified in PCA of
combined data were also major contributors identified in
PCA of each month. ANOVA of PC 1 revealed significant
tillage £ depth interactions ðP , 0:01Þ for February and
May but not for October samples ðP ¼ 0:93Þ:
4. Discussion
Conservation tillage systems improve soil chemical,
physical, and biological properties of previously tilled soil,
especially in the surface layer. In this study, implementation
of no-till practices for 12 years in a continuous cotton field
has resulted in significantly greater soil carbon and nitrogen,
microbial biomass C, and total PLFAs in no-till plots than
Fig. 4. Depth distributions of several PLFAs and PLFA ratios for conventional-till and no-till treatments. Values given are means averaged across sampling
dates.
Y. Feng et al. / Soil Biology & Biochemistry 35 (2003) 1693–1703 1699
conventional-till plots for the 0–3 cm depth. These results
support the findings that no-till systems result in the surface
enrichment of SOC (Edwards et al., 1992; Wander et al.,
1998; Motta et al., 2001; Ding et al., 2002) and microbial
biomass C (Granatstein et al., 1987; Franzluebbers et al.,
1994; Motta et al., 2001). Microbial biomass responds
rapidly to conditions that eventually result in changes of soil
organic matter contents and has been used as an sensitive
and early indicator of soil quality (Powlson et al., 1987;
Sparling, 1997; Franzluebbers et al., 1999b).
Microbial biomass C determined by chloroform-fumi-
gation incubation was well correlated with the total PLFAs
that are quantitative measures of the viable biomass (White
and Macnaughton, 1997). Our observation is consistent with
previous reports of significant correlation between total
PLFAs and microbial biomass (Zelles et al., 1995; Yao et al.,
2000). Calderon et al. (2001), however, reported the lack of
correspondence of the microbial biomass C and total PLFA
data in a study of short-term dynamics of soil microbial
properties after tillage. They suggested that a close
correlation between microbial biomass C and total PLFA
should not always be expected. The ratios of total PLFAs to
microbial biomass C found in this study fall with the range
of 49–340 nmol/mg for agricultural and forest soils (Hill
et al., 1993).
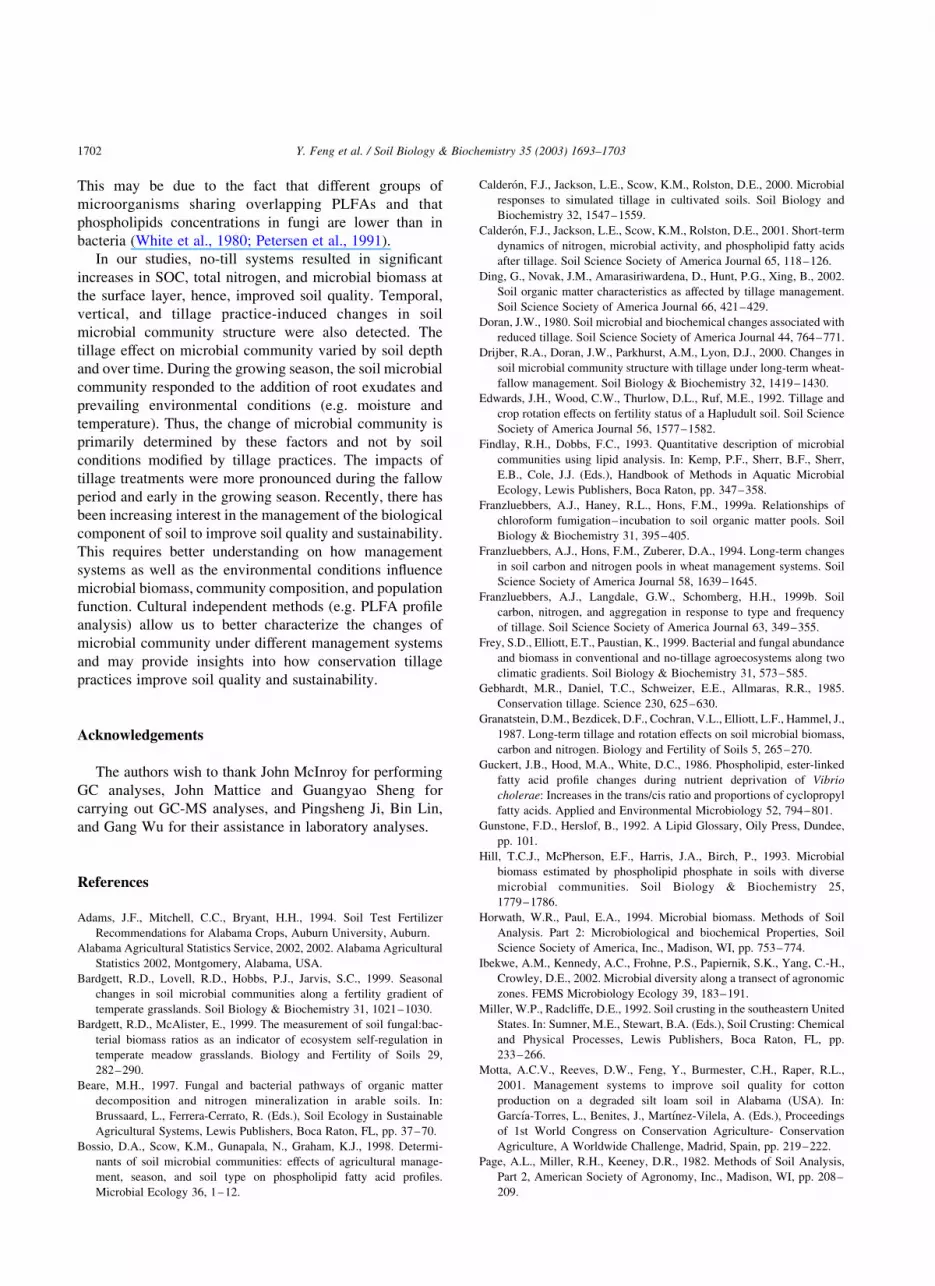
4.1. Tillage induced changes
We detected three primary effects on the microbial
community structure in this study, i.e. the presence of
temporal, vertical, and tillage management-induced
changes in the composition of the microbial communities
(Figs. 2 and 3). A significant tillage £ depth interaction
revealed by ANOVA of PC 1, as well as the different
depth response curves (Figs. 3 and 4), suggests that
microbial community structure shifted as its surrounding
physical and chemical environment was altered by tillage
system. Our finding is consistent with those reported by
Drijber et al. (2000) and Calderon et al. (2000). Soils
under no-till treatment have greater crop residues and
higher soil organic matter contents in the surface layer,
which result in increased infiltration and higher water
holding capacity than soils under conventional treatment.
Thus, no-till soils are not only high in available
substrate, but also wetter, cooler and fluctuate less in
moisture and temperature (Doran, 1980). These con-
ditions stimulate the growth and activity of soil
microorganisms. Further, there is also evidence indicating
that the chemical composition and structure of soil
organic matter are different under conventional and
conservation tillage system (Ding et al., 2002). Surface
soils (0–5 cm) under conservation tillage are high in
light fraction material (Ding et al., 2002) as well as
particular organic matter (Motta et al., 2001). Humic acid
in conservation tilled soil contained more reactive
functional groups than in conventionally tilled soil
(Ding et al., 2002).
When data were analyzed for each sampling month,
ANOVA of PC 1 revealed significant tillage x depth
interactions ðP , 0:01Þ for February and May but not for
October samples ðP ¼ 0:93Þ: This suggests that the effect of
tillage treatments were more pronounced during winter
fallow (February) and when influence of cotton root growth
was minimal (May). Our result supports the findings of a
long-term wheat-fallow management study (Drijber et al.,
2000). Drijber et al. (2000) compared plots remaining in
mixed prairie sod and those cropped to wheat or left fallow
under no-till, sub-till or plow management. Although PLFA
profiles differentiated wheat and fallow systems by tillage,
discrimination among tillage treatments was expressed most
strongly during fallow. They suggested that during the
wheat cycle the soil microbial community was influenced
mostly by inputs from wheat, while during fallow, it
responds to the physicochemical environment resulting
from tillage management. Petersen et al. (2002) conducted
studies during the growing season of spring wheat (May
through September) and showed limited tillage effects on
soil microbial communities. It is probably because the shift
of the microbial community was regulated mainly by soil
environmental conditions responded to wheat growth rather
than long-term tillage treatments.
4.2. Temporal variation
Temporal changes in soil microbial communities are
likely due, in part, to plant root growth as well as
environmental conditions, such as soil moisture and
temperature. The PLFA profiles for October was dissimilar
to those for February and May. October samples were taken
right after cotton harvest. The soil microbial community at
this time may be dominated by the organisms responding to
cotton growth during the growing season. It is well known
that the plant is able to affect rhizosphere microorganisms
and stimulate the growth of zymogenous populations. The
rhizosphere usually harbors more Gram-negative bacteria
and fewer Gram-positive and Gram-variable bacteria (Paul
and Clark, 1996). In addition, the drier soil and higher soil
temperature at the October sampling time may have also
played important roles. Year 2000 precipitation in the area
was 60% of the normal level, primarily due to low rainfall in
the summer months (Fig. 5). Soil moisture content in
October was the lowest of all three sampling months.
Moisture content of the conventional-till soil at the surface
layer was 41 and 31% lower in the October sample
compared to the February and May samples, respectively.
For no-till soil at the 0–3 cm depth, soil moisture content of
the October sample was 46 and 47% lower than the
February and May samples, respectively. Moreover, the
daily mean soil temperature at 10 cm depth 30 days prior to
sampling averaged 6.8, 16.9, and 27.4 8C for February,
May, and October sampling dates, respectively (Fig. 5).
Y. Feng et al. / Soil Biology & Biochemistry 35 (2003) 1693–17031700

These environmental factors affect the growth and activities
of microorganisms and may have contributed in changes of
the soil microbial communities. Bossio et al. (1998) found
that, for a given soil, microbial community changes over
time were of greater magnitude than changes associated
with management regimes such as inputs of manure, cover
crops, and mineral fertilizers.
4.3. Soil depth effect
The shift in microbial communities by soil depths may
result from the interactions of soil moisture, temperature,
aeration, and substrate availability collectively. With
increasing soil depths, both rhizosphere effect and SOC
contents decrease, as well as the composition of the humic
material. Ding et al. (2002) characterized the humic acid
from a Norfolk soil under long-term (20 years) conventional
and conservation tillage management. The aliphatic C
content decreased with increasing depth (0–15 cm) for both
conventional and conservation tillage treatments whereas
the more recalcitrant aromatic C content increased. The
increases in the relative abundance with depth of two
influential fatty acids 10Me16:0 and i15:0, which are Gram-
positive bacterial biomarkers, as well as actinomycete
marker 10Me18:0 (Fig. 4), support the above findings.
Actinomycetes are Gram-positive filamentous bacteria
known to utilize many resistant compounds. Since 10Me
16:0 is also found in sulfate-reducing bacteria, its increase in
the relative abundance may also indicate increasing sulfate-
reducing bacterial populations as well as anaerobic
conditions with soil depth.
4.4. Significance of biomarker fatty acids
Formation of cy19:0 from its precursor 18:1v7c has been
associated with the development of anaerobic conditions in
the subsoils and cell stasis or stress (Guckert et al., 1986;
White and Macnaughton, 1997). Increases in the PLFA
cy19:0 with soil depth suggest the development of anaerobic
conditions in the subsoils. Additionally, greater cy19:0/
18:1v7c ratios at lower depths may also reflect the effects of
progressive decreases in available substrates as soil depth
increased. Drijber et al. (2000) reported that the ratio of
cy19:0/18:1v7c was greatest under fallow-plowed and sod
treatments, indicating that a greater proportion of the
bacteria in fallow-plowed and sod soils was in stasis. An
increase in cy19:0 in tilled soil was noted by Calderon et al.
(2001), due to increased anaerobic microsites after tillage.
Petersen et al. (2002) found that the ratios of cyclopropyl
fatty acids (cy17:0 and cy19:0) to their precursors increased
with time (from May to September), which was attributed to
the influences of the hot and dry summer period.
The proportion of the microbial biomass composed of
fungi under no-till practices has been shown to be greater
than that under conventional-till practices in surface soil
(Beare, 1997; Frey et al., 1999). Frey et al. (1999) reported
that the ratios of fungal to bacterial biomass determined
using microscopy method are above 1 in 5 out of 6 no-till
soils for the 0–5 cm depth increment. In our study,
however, the fungal to bacterial PLFAs ratios in no-till
soil were similar to conventional-till soil, ranging from 0.11
to 0.18. Several other studies also reported that the fungal to
bacterial biomass ratios determined by PLFAs are less than
1 under various natural or managed systems (Bardgett et al.,
1999; Bardgett and McAlister, 1999; Zeller et al., 2001).
Fig. 5. Daily average soil temperature (bare soil at 10 cm depth) and daily rainfall totals at the Tennessee Valley Research and Extension Center from October
1999 to December 2000. The asterisks indicate sampling months.
Y. Feng et al. / Soil Biology & Biochemistry 35 (2003) 1693–1703 1701
This may be due to the fact that different groups of
microorganisms sharing overlapping PLFAs and that
phospholipids concentrations in fungi are lower than in
bacteria (White et al., 1980; Petersen et al., 1991).
In our studies, no-till systems resulted in significant
increases in SOC, total nitrogen, and microbial biomass at
the surface layer, hence, improved soil quality. Temporal,
vertical, and tillage practice-induced changes in soil
microbial community structure were also detected. The
tillage effect on microbial community varied by soil depth
and over time. During the growing season, the soil microbial
community responded to the addition of root exudates and
prevailing environmental conditions (e.g. moisture and
temperature). Thus, the change of microbial community is
primarily determined by these factors and not by soil
conditions modified by tillage practices. The impacts of
tillage treatments were more pronounced during the fallow
period and early in the growing season. Recently, there has
been increasing interest in the management of the biological
component of soil to improve soil quality and sustainability.
This requires better understanding on how management
systems as well as the environmental conditions influence
microbial biomass, community composition, and population
function. Cultural independent methods (e.g. PLFA profile
analysis) allow us to better characterize the changes of
microbial community under different management systems
and may provide insights into how conservation tillage
practices improve soil quality and sustainability.
Acknowledgements
The authors wish to thank John McInroy for performing
GC analyses, John Mattice and Guangyao Sheng for
carrying out GC-MS analyses, and Pingsheng Ji, Bin Lin,
and Gang Wu for their assistance in laboratory analyses.
References
Adams, J.F., Mitchell, C.C., Bryant, H.H., 1994. Soil Test Fertilizer
Recommendations for Alabama Crops, Auburn University, Auburn.
Alabama Agricultural Statistics Service, 2002, 2002. Alabama Agricultural
Statistics 2002, Montgomery, Alabama, USA.
Bardgett, R.D., Lovell, R.D., Hobbs, P.J., Jarvis, S.C., 1999. Seasonal
changes in soil microbial communities along a fertility gradient of
temperate grasslands. Soil Biology & Biochemistry 31, 1021–1030.
Bardgett, R.D., McAlister, E., 1999. The measurement of soil fungal:bac-
terial biomass ratios as an indicator of ecosystem self-regulation in
temperate meadow grasslands. Biology and Fertility of Soils 29,
282–290.
Beare, M.H., 1997. Fungal and bacterial pathways of organic matter
decomposition and nitrogen mineralization in arable soils. In:
Brussaard, L., Ferrera-Cerrato, R. (Eds.), Soil Ecology in Sustainable
Agricultural Systems, Lewis Publishers, Boca Raton, FL, pp. 37–70.
Bossio, D.A., Scow, K.M., Gunapala, N., Graham, K.J., 1998. Determi-
nants of soil microbial communities: effects of agricultural manage-
ment, season, and soil type on phospholipid fatty acid profiles.
Microbial Ecology 36, 1–12.
Calderon, F.J., Jackson, L.E., Scow, K.M., Rolston, D.E., 2000. Microbial
responses to simulated tillage in cultivated soils. Soil Biology and
Biochemistry 32, 1547–1559.
Calderon, F.J., Jackson, L.E., Scow, K.M., Rolston, D.E., 2001. Short-term
dynamics of nitrogen, microbial activity, and phospholipid fatty acids
after tillage. Soil Science Society of America Journal 65, 118–126.
Ding, G., Novak, J.M., Amarasiriwardena, D., Hunt, P.G., Xing, B., 2002.
Soil organic matter characteristics as affected by tillage management.
Soil Science Society of America Journal 66, 421–429.
Doran, J.W., 1980. Soil microbial and biochemical changes associated with
reduced tillage. Soil Science Society of America Journal 44, 764–771.
Drijber, R.A., Doran, J.W., Parkhurst, A.M., Lyon, D.J., 2000. Changes in
soil microbial community structure with tillage under long-term wheat-
fallow management. Soil Biology & Biochemistry 32, 1419–1430.
Edwards, J.H., Wood, C.W., Thurlow, D.L., Ruf, M.E., 1992. Tillage and
crop rotation effects on fertility status of a Hapludult soil. Soil Science
Society of America Journal 56, 1577–1582.
Findlay, R.H., Dobbs, F.C., 1993. Quantitative description of microbial
communities using lipid analysis. In: Kemp, P.F., Sherr, B.F., Sherr,
E.B., Cole, J.J. (Eds.), Handbook of Methods in Aquatic Microbial
Ecology, Lewis Publishers, Boca Raton, pp. 347–358.
Franzluebbers, A.J., Haney, R.L., Hons, F.M., 1999a. Relationships of
chloroform fumigation–incubation to soil organic matter pools. Soil
Biology & Biochemistry 31, 395–405.
Franzluebbers, A.J., Hons, F.M., Zuberer, D.A., 1994. Long-term changes
in soil carbon and nitrogen pools in wheat management systems. Soil
Science Society of America Journal 58, 1639–1645.
Franzluebbers, A.J., Langdale, G.W., Schomberg, H.H., 1999b. Soil
carbon, nitrogen, and aggregation in response to type and frequency
of tillage. Soil Science Society of America Journal 63, 349–355.
Frey, S.D., Elliott, E.T., Paustian, K., 1999. Bacterial and fungal abundance
and biomass in conventional and no-tillage agroecosystems along two
climatic gradients. Soil Biology & Biochemistry 31, 573–585.
Gebhardt, M.R., Daniel, T.C., Schweizer, E.E., Allmaras, R.R., 1985.
Conservation tillage. Science 230, 625–630.
Granatstein, D.M., Bezdicek, D.F., Cochran, V.L., Elliott, L.F., Hammel, J.,
1987. Long-term tillage and rotation effects on soil microbial biomass,
carbon and nitrogen. Biology and Fertility of Soils 5, 265–270.
Guckert, J.B., Hood, M.A., White, D.C., 1986. Phospholipid, ester-linked
fatty acid profile changes during nutrient deprivation of Vibrio
cholerae: Increases in the trans/cis ratio and proportions of cyclopropyl
fatty acids. Applied and Environmental Microbiology 52, 794–801.
Gunstone, F.D., Herslof, B., 1992. A Lipid Glossary, Oily Press, Dundee,
pp. 101.
Hill, T.C.J., McPherson, E.F., Harris, J.A., Birch, P., 1993. Microbial
biomass estimated by phospholipid phosphate in soils with diverse
microbial communities. Soil Biology & Biochemistry 25,
1779–1786.
Horwath, W.R., Paul, E.A., 1994. Microbial biomass. Methods of Soil
Analysis. Part 2: Microbiological and biochemical Properties, Soil
Science Society of America, Inc., Madison, WI, pp. 753–774.
Ibekwe, A.M., Kennedy, A.C., Frohne, P.S., Papiernik, S.K., Yang, C.-H.,
Crowley, D.E., 2002. Microbial diversity along a transect of agronomic
zones. FEMS Microbiology Ecology 39, 183–191.
Miller, W.P., Radcliffe, D.E., 1992. Soil crusting in the southeastern United
States. In: Sumner, M.E., Stewart, B.A. (Eds.), Soil Crusting: Chemical
and Physical Processes, Lewis Publishers, Boca Raton, FL, pp.
233–266.
Motta, A.C.V., Reeves, D.W., Feng, Y., Burmester, C.H., Raper, R.L.,
2001. Management systems to improve soil quality for cotton
production on a degraded silt loam soil in Alabama (USA). In:
Garcıa-Torres, L., Benites, J., Martınez-Vilela, A. (Eds.), Proceedings
of 1st World Congress on Conservation Agriculture- Conservation
Agriculture, A Worldwide Challenge, Madrid, Spain, pp. 219–222.
Page, A.L., Miller, R.H., Keeney, D.R., 1982. Methods of Soil Analysis,
Part 2, American Society of Agronomy, Inc., Madison, WI, pp. 208–
209.
Y. Feng et al. / Soil Biology & Biochemistry 35 (2003) 1693–17031702

Paul, E.A., Clark, F.E., 1996. Soil Microbiology and Biochemistry,
Academic Press, San Diego, CA.
Petersen, S.O., Frohne, P.S., Kennedy, A.C., 2002. Dynamics of a soil
microbial community under spring wheat. Soil Science Society of
America Journal 66, 826–833.
Petersen, S.O., Henriksen, K., Blackburn, T.H., King, G.M., 1991. A
comparison of phospholipid and chloroform fumigation analyses for
biomass in soil: potentials and limitations. FEMS Microbiology
Ecology 85, 257–268.
Petersen, S.O., Klug, M.J., 1994. Effects of sieving, storage, and incubation
temperature on the phospholipid fatty acid profile of a soil microbial
community. Applied and Environmental Microbiology 60, 2421–2430.
Powlson, D.S., Brookes, P.C., Christensen, B.T., 1987. Measurement of soil
microbial biomass provides an early indication of changes in total soil
organic matter due to straw incorporation. Soil Biology & Biochemistry
19, 159–164.
Ratledge, C., Wilkinson, S.G., 1988. Microbial lipids, Academic Press,
London.
Reeves, D.W., 1994. Cover crops and rotations. In: Hatfield, J.L., Stewart,
B.A. (Eds.), Crops Residue Management, CRC Press, Inc., Boca Raton,
FL, pp. 125–172.
Reeves, D.W., 1997. The role of soil organic matter in maintaining soil
quality in continuous cropping systems. Soil and Tillage Research 43,
131–167.
Sparling, G.P., 1997. Soil microbial biomass, activity and nutrient cycling
as indicators of soil health. In: Pankhurst, C., Doube, B.M., Gupta,
V.V.S.R. (Eds.), Biological Indicators of Soil Health, CAB Inter-
national, New York, pp. 97–119.
Voroney, R.P., Paul, E.A., 1984. Determination of Kc and KN in situ for
calibration of the chloroform fumigation–incubation method. Soil
Biology & Biochemistry 16, 9–14.
Wander, M.M., Bidart, M.G., Aref, S., 1998. Tillage impacts on depth
distribution of total and particulate organic matter in three Illinois soils.
Soil Science Society of America Journal 62, 1704–1711.
White, D.C., Bobbie, R.J., Nickels, J.S., Fazio, S.D., Davis, W.M., 1980.
Nonselective biochemical methods for the determination of fungal
biomass and community structure in estuarine detrital microflora.
Botanica Marina 23, 239–250.
White, D.C., Macnaughton, S.J., 1997. Chemical and molecular approaches
for rapid assessment of the biological status of soils. In: Pankhurst, C.,
Doube, B.M., Gupta, V.V.S.R. (Eds.), Biological Indicators of Soil
Health, CAB International, New York, NY, pp. 371–397.
Yao, H., He, Z., Wilson, M.J., Campbell, C.D., 2000. Microbial biomass
and community structure in a sequence of soils with increasing fertility
and changing land use. Microbial Ecology 40, 223–237.
Zeller, V., Bardgett, R.D., Tappeiner, U., 2001. Site and management
effects on soil microbial properties of subalpine meadows: a study of
land abandoment along a north–south gradient in European Alps. Soil
Biology & Biochemistry 33, 639–649.
Zelles, L., Bai, Q.Y., Rackwitz, R., Chadwick, D., Beese, F., 1995.
Determination of phospholipid- and lipopolysaccharide-derived fatty
acids as an estimate of microbial biomass and community structures in
soils. Biology and Fertility of Soils 19, 115–123.
Y. Feng et al. / Soil Biology & Biochemistry 35 (2003) 1693–1703 1703
Copyright © 2022 FDOKUMEN