EWRS Physical and Cultural Weed Control Working Group
246
EUROPEAN WEED RESEARCH SOCIETY Proceedings 6 th EWRS Workshop on Physical and Cultural Weed Control Lillehammer, Norway 8-10 March 2004
-
Upload
khangminh22 -
Category
Documents
-
view
0 -
download
0
Transcript of EWRS Physical and Cultural Weed Control Working Group

EUROPEAN WEED RESEARCH SOCIETY
Proceedings
6th EWRS Workshop on Physical and Cultural Weed Control
Lillehammer, Norway
8-10 March 2004

ii
Proceedings were compiled and edited by: Daniel C. Cloutier Weed Science Institute P.O. Box 222 Sainte-Anne-de-Bellevue (Québec) H9X 3R9 Canada Tel.: +1 514 630 4658 Fax: +1 514 695 2365 E-mail: [email protected]
Johan Ascard National Board of Agriculture Box 12 SE-230 53 Alnarp Sweden Tel.: + 46 40 41 52 87 Fax: + 46 40 46 07 82 E-mail: [email protected]
Scientific organisers Johan Ascard National Board of Agriculture Box 12 SE-230 53 Alnarp Sweden Tel.: + 46 40 41 52 87 Fax: + 46 40 46 07 82 E-mail: [email protected]
Daniel C. Cloutier Weed Science Institute P.O. Box 222 Sainte-Anne-de-Bellevue (Québec) H9X 3R9 Canada Tel.: +1 514 630 4658 Fax: +1 514 695 2365 E-mail: [email protected]
Local organisers Jan Netland The Norwegian Crop Research Institute Plant Protection Centre Høgskoleveien 7 N-1432 Ås Norway Tel.: + 47 64 949315 Fax: + 47 64 949226 E-mail: [email protected]
Thomas Cottis Hedmark University College Blæstad N- 2322 Ridabu Norway Tel.: +47 62 54 16 16 Fax: +47 62 54 16 01 E-mail: [email protected]
Lars O. Brandsæter The Norwegian Crop Research Institute Plant Protection Centre Høgskoleveien 7 N-1432 Ås Norway Tel.: + 47 64 949492 Fax: + 47 64 949226 E-Mail: [email protected]
Corrected December 22, 2004

iii
Table of contents
Cultural and physical weed control in organic farming systems . . . . . . . . . . . 1
Cultural weed control in organic pigeon bean (Vicia faba L. var. minor) throughoptimisation of crop spatial arrangementP. Bàrberi, P. Belloni, D. Cerrai, M. Fontanelli, A.C. Moonen & M. Raffaelli . . . . . . . . . . . 2
Pre-planting and tree row treatments in organic apple productionL.O. Brandsæter & D. Røen . . . . . . . . . . . . . . . . . . . . . . . . . . . . . . . . . . . . . . . . . . . . . . . . . . 8
Development of a Decision Support System (DSS) for weed management in organicwinter wheat productionD. H. K. Davies & D. Neuhoff . . . . . . . . . . . . . . . . . . . . . . . . . . . . . . . . . . . . . . . . . . . . . . . . 9
Cover crops in cauliflower production: Implications for weeds, insects, beneficialarthropods and yieldW. Hall, L.O. Brandsæter, T.A. Breland & R. Meadow . . . . . . . . . . . . . . . . . . . . . . . . . . . . 10
Designing crop rotations for organic plant production with low livestock density,combining weed control and nutrient supplyA.K. Løes, L.O. Brandsæter & H. Riley . . . . . . . . . . . . . . . . . . . . . . . . . . . . . . . . . . . . . . . . 11
The effects of different cover crops on weed control and yield in organic potato andtomato productionC. Mirabelli, R. Paolini, F. Faustini & F. Saccardo . . . . . . . . . . . . . . . . . . . . . . . . . . . . . . . . 13
Physical weed control in organic spinach productionA. Peruzzi, M. Ginanni, M. Raffaelli & M. Borelli . . . . . . . . . . . . . . . . . . . . . . . . . . . . . . . . 15
Physical weed control in organic carrot productionA. Peruzzi, M. Raffaelli, M. Ginanni & M. Borelli . . . . . . . . . . . . . . . . . . . . . . . . . . . . . . . . 24
Mulching compared to physical weed control measures in organically grown vegetablesH. Riley, L. O. Brandsæter & G. Danielsberg . . . . . . . . . . . . . . . . . . . . . . . . . . . . . . . . . . . . 39
Crop-weed interactions and cultural and physical weed control . . . . . . . . . 40
First results on the competitive ability of lentil (Lens culinaris) genotypesF. Faustini, R. Paolini, F. Saccardo, P. Crinò & C. Mirabelli . . . . . . . . . . . . . . . . . . . . . . . . 41
Do control technologies substantially alter the large-scale patterns of weed occurrence?C.M. Hammond & E.C. Luschei . . . . . . . . . . . . . . . . . . . . . . . . . . . . . . . . . . . . . . . . . . . . . . 43

iv
Effects of plant density and nitrogen fertilizer on the competitive ability of canola(Brassica napus L.) with weedsN. M. Hosseini, H. M. Alizadeh & H. M. Ahmadi . . . . . . . . . . . . . . . . . . . . . . . . . . . . . . . . 44
The sensitivity of field peas (Pisum sativum L.) to weed harrowingH. L. F. Larsen & C. Andreasen . . . . . . . . . . . . . . . . . . . . . . . . . . . . . . . . . . . . . . . . . . . . . . 55
Composition of weed floras in different agricultural management systems within theEuropean climatic gradientL. Radics, M. Glemnitz, J. Hoffmann & Gy. Czimber . . . . . . . . . . . . . . . . . . . . . . . . . . . . . 58
Computer model for simulating the long-term dynamics of annual weedsI.A. Rasmussen & N. Holst . . . . . . . . . . . . . . . . . . . . . . . . . . . . . . . . . . . . . . . . . . . . . . . . . . 69
Spot ploughing and population dynamics of weedsK. Shoji . . . . . . . . . . . . . . . . . . . . . . . . . . . . . . . . . . . . . . . . . . . . . . . . . . . . . . . . . . . . . . . . . 70
Population dynamics of weeds affected by time and type of tillageK.S. Tørresen . . . . . . . . . . . . . . . . . . . . . . . . . . . . . . . . . . . . . . . . . . . . . . . . . . . . . . . . . . . . . 82
Row distance as a key to efficient weed management in organic sugar beetsJ.D.A.Wevers & L. Bastiaans . . . . . . . . . . . . . . . . . . . . . . . . . . . . . . . . . . . . . . . . . . . . . . . . 84
Weed population dynamic by influence of crop rotation in 40-years periodL. Zarina . . . . . . . . . . . . . . . . . . . . . . . . . . . . . . . . . . . . . . . . . . . . . . . . . . . . . . . . . . . . . . . . . 85
Mechanical weed control and engineering . . . . . . . . . . . . . . . . . . . . . . . . . . . . . . . 93
The design of an autonomous weeding robotT. Bakker, C.J. van Asselt, J. Bontsema, J. Müller & G. van Straten . . . . . . . . . . . . . . . . . . 94
The Swiss pocket knife concept for crop nursingR. Bauermeister, R. Total, P.O. Bleeker & D.T. Baumann . . . . . . . . . . . . . . . . . . . . . . . . . . 95
Different strategies to improve mechanical intra-row weed control in bulb onionsP.O. Bleeker, D.A. van der Schans & R.Y. van der Weide . . . . . . . . . . . . . . . . . . . . . . . . . . 97
Defining optimal conditions for weed harrowing in winter cereals on Papaver rhoeas L.and other dicotyledoneous weedsA. Cirujeda & A. Taberner , , . . . . . . . . . . . . . . . . . . . . . . . . . . . . . . . . . . . . . . . . . . . . . . . 101
Crop growth stage susceptibility to rotary hoe cultivation in narrow row and wide rowsoyabean cropping systemsD.C. Cloutier & M.L. Leblanc . . . . . . . . . . . . . . . . . . . . . . . . . . . . . . . . . . . . . . . . . . . . . . . 106

v
Water-jet cutting of potato tops – some experiences from Sweden 2003F. Fogelberg . . . . . . . . . . . . . . . . . . . . . . . . . . . . . . . . . . . . . . . . . . . . . . . . . . . . . . . . . . . . . 111
Seed mapping of sugar beet to guide weeding robotsH.-W. Griepentrog & M. Nørremark . . . . . . . . . . . . . . . . . . . . . . . . . . . . . . . . . . . . . . . . . . 112
Achieving an optimal balance between machine vision capability and weed treatmenteffectiveness using competition modelsA.C. Grundy, C.M. Onyango, K. Phelps, R. Reader & J.A. Marchant . . . . . . . . . . . . . . . . 113
Modelling the effectiveness and selectivity of mechanical weedingD.A.G. Kurstjens . . . . . . . . . . . . . . . . . . . . . . . . . . . . . . . . . . . . . . . . . . . . . . . . . . . . . . . . . 114
The effect of blind harrowing using a flex-tine harrow or a rotary hoe combined withmanure amendment on bread wheat yieldM.L. Leblanc & D.C. Cloutier . . . . . . . . . . . . . . . . . . . . . . . . . . . . . . . . . . . . . . . . . . . . . . . 115
Lay-down working cart improves efficacy of hand weedingP. Leinonen & V. Närkki . . . . . . . . . . . . . . . . . . . . . . . . . . . . . . . . . . . . . . . . . . . . . . . . . . . 124
Finger weeder for cabbage and lettuce culturesP. Leinonen, A. Saastamoinen & J. Vilmunen . . . . . . . . . . . . . . . . . . . . . . . . . . . . . . . . . . 125
Criteria for optimised weed harrowing in cereals including development ofexperimental equipment for weed harrowing trialsK. Mangerud, L.O. Brandsæter, & J. Netland . . . . . . . . . . . . . . . . . . . . . . . . . . . . . . . . . . 126
Analysis and definition of the close-to-crop area in relation to robotic weedingM. Nørremark & H.W. Griepentrog . . . . . . . . . . . . . . . . . . . . . . . . . . . . . . . . . . . . . . . . . . 127
Comparison of alternative interrow weeder steering systemsD.W.M. Pullen & P.A. Cowell . . . . . . . . . . . . . . . . . . . . . . . . . . . . . . . . . . . . . . . . . . . . . . 141
Are we making significant progress in mechanical weed control research? J. Rasmussen . . . . . . . . . . . . . . . . . . . . . . . . . . . . . . . . . . . . . . . . . . . . . . . . . . . . . . . . . . . . 142
Techniques for green manure cutting: Energy requirement and ley recoveryM. Tobiasson & G. Danielsberg . . . . . . . . . . . . . . . . . . . . . . . . . . . . . . . . . . . . . . . . . . . . . 150
Thermal weed control . . . . . . . . . . . . . . . . . . . . . . . . . . . . . . . . . . . . . . . . . . . . . . . . . 151
Steaming soil in narrow strips for intra-row weed control in sugar beetD. Hansson & S.-E. Svensson . . . . . . . . . . . . . . . . . . . . . . . . . . . . . . . . . . . . . . . . . . . . . . . 152
A device to kill weed seeds captured during crop harvestingJ. Matthews, P. Harris & D. E. Miegel . . . . . . . . . . . . . . . . . . . . . . . . . . . . . . . . . . . . . . . . 153

vi
Recent results in the development of band steaming for intra-row weed controlB. Melander, M.H. Jørgensen & L. Elsgaard . . . . . . . . . . . . . . . . . . . . . . . . . . . . . . . . . . . 154
Weed seeds control by steam and substances in exothermic reactionA. Peruzzi, M. Borelli, M. Mazzoncini, M. Raffaelli, M. Ginanni & P. Bàrberi . . . . . . . . 155
Flaming for intra-row weed control in Globe ArtichokeM. Raffaelli , F. Filippi, A. Peruzzi & A. Graifenberg . . . . . . . . . . . . . . . . . . . . . . . . . . . . 166
Thermal weed control by water steam in bulb onionsA.Sirvydas, P.Lazauskas, R.Vasinauskien, A. Stepanas & P.Kerpauskas . . . . . . . . . . . . . 170
Thermal desinfection of soil by water steamA.Sirvydas, A.Stepanas & P.Kerpauskas . . . . . . . . . . . . . . . . . . . . . . . . . . . . . . . . . . . . . . 174
Thermal weed control by steaming in vegetable cropsH. Sjursen & J. Netland . . . . . . . . . . . . . . . . . . . . . . . . . . . . . . . . . . . . . . . . . . . . . . . . . . . . 179
Control of perennial weeds . . . . . . . . . . . . . . . . . . . . . . . . . . . . . . . . . . . . . . . . . . . . 180
Terminating ley with mid-summer bare fallow controls Elymus repensS. Kakriainen-Rouhiainen, J. Väisänen, P. Vanhala & T. Lötjönen . . . . . . . . . . . . . . . . . . 181
Puccinia punctiformis as mycoherbicide on Cirsium arvenseS. Sørensen . . . . . . . . . . . . . . . . . . . . . . . . . . . . . . . . . . . . . . . . . . . . . . . . . . . . . . . . . . . . . . 183
Temporal sensitivity of Cirsium arvense in relation to competition, and simulatedpremechanical treatmentM.G.Thomsen, L.O.Brandsæter & H.Fykse . . . . . . . . . . . . . . . . . . . . . . . . . . . . . . . . . . . . 184
Participatory organic weed management: Rumex spp. control - a farmer perspectiveR.J. Turner & W. Bond . . . . . . . . . . . . . . . . . . . . . . . . . . . . . . . . . . . . . . . . . . . . . . . . . . . . 185
Response of Sonchus arvensis to mechanical and cultural weed controlP. Vanhala, T. Lötjönen & J. Salonen . . . . . . . . . . . . . . . . . . . . . . . . . . . . . . . . . . . . . . . . . 186
Effect of crop rotation and tillage on infestation of Cirsium arvense in organic farmingsystemsA. Verschwele & A. Häusler . . . . . . . . . . . . . . . . . . . . . . . . . . . . . . . . . . . . . . . . . . . . . . . . 187
Integrated weed management . . . . . . . . . . . . . . . . . . . . . . . . . . . . . . . . . . . . . . . . . 195
Integrated weed control methods in winter and spring sown lentil (Lens culinaris) H. M. Alizadeh, H. K. Mojni & N. M. Hosseini . . . . . . . . . . . . . . . . . . . . . . . . . . . . . . . . 196

vii
Destruction of Orobanche ramosa seeds with a new soil drench and control ofemergence by herbicidesJ. M. Matthews & D. E. Miegel. . . . . . . . . . . . . . . . . . . . . . . . . . . . . . . . . . . . . . . . . . . . . . 197
Information from other working groups . . . . . . . . . . . . . . . . . . . . . . . . . . . . . . . 200
Crop-weed interaction research; its link with physical and cultural weed controlL. Bastiaans . . . . . . . . . . . . . . . . . . . . . . . . . . . . . . . . . . . . . . . . . . . . . . . . . . . . . . . . . . . . . 201
EWRS Working Group Education and TrainingD.T. Baumann, D.C. Cloutier & P. Bàrberi . . . . . . . . . . . . . . . . . . . . . . . . . . . . . . . . . . . . . 203
EWRS Working Group: Germination & Early Growth An overview of working groupactivities and opportunitiesA. Grundy . . . . . . . . . . . . . . . . . . . . . . . . . . . . . . . . . . . . . . . . . . . . . . . . . . . . . . . . . . . . . . 205
Combining physical and cultural weed control with biological methods – prospects forintegrated non-chemical weed management strategiesP. E. Hatcher & B. Melander . . . . . . . . . . . . . . . . . . . . . . . . . . . . . . . . . . . . . . . . . . . . . . . . 206
Methodology in physical weed control . . . . . . . . . . . . . . . . . . . . . . . . . . . . . . . . . 207
Guidelines for physical weed control research: flame weeding, weed harrowing andintra-row cultivationP. Vanhala, D. Kurstjens, J. Ascard, A. Bertram, D. Cloutier, A. Mead, M. Raffaelli& J. Rasmussen . . . . . . . . . . . . . . . . . . . . . . . . . . . . . . . . . . . . . . . . . . . . . . . . . . . . . . . . . . 208

6th EWRS Workshop on Physical and Cultural Weed Control 1 Lillehammer, Norway, 8-10 March 2004
Cultural and physical weed control in organic farming systems

6th EWRS Workshop on Physical and Cultural Weed Control 2 Lillehammer, Norway, 8-10 March 2004
Cultural weed control in organic pigeon bean (Vicia faba L. var. minor) through optimisation of crop spatial arrangement
P. Bàrberi1, P. Belloni2, D. Cerrai1, M. Fontanelli3, A.C. Moonen1 & M. Raffaelli3 1Land Lab, Scuola Superiore Sant'Anna, Pisa, Italy; 2Centro Interdipartimentale di Ricerche Agro-ambientali E. Avanzi, University of Pisa, Italy; 3Dipartimento di Agronomia e Gestione dell’Agro-
ecosistema, University of Pisa, Italy
Introduction
In low-external input systems, the effectiveness of direct weed control methods is very much dependent on the application of preventive and cultural measures aimed to reduce weed emergence in the field and increase crop competitiveness against weeds. This approach is especially important in organic agriculture (Bàrberi, 2002), where farmers must rely on non-chemical (usually mechanical) direct weed control methods.
Pigeon bean (Vicia faba L. var. minor) is an important crop for organic systems in Central and Southern Italy because it has a high protein content and can be used either as a grain fodder or a green manure crop. Pigeon bean has a high phenotypic plasticity, i.e. it is able to adjust its growth habitus and photosintate allocation in plant organs to different sowing densities and/or inter-row spacing (Bonari & Macchia, 1975). Consequently, this crop can potentially be grown either in narrowly-spaced or widely-spaced rows. The latter is a potentially interesting technique in low-external input and organic farming systems since it can allow inter-row hoeing.
This experiment aimed to evaluate the effect of different crop spatial arrangements and mechanical weed control treatments on crop growth and yield and on weed density and biomass in order to find the best cultural "package" for pigeon bean grown in organic conditions. Material and methods A field experiment was carried out in the 2001-02 and 2002-03 growing seasons at the Centro Interdipartimentale di Ricerche Agro-ambientali E. Avanzi of the University of Pisa (S. Piero a Grado, Tuscany, Central Italy, 43°40' lat. N, 10°19' long. E) within a large scale long-term experiment comparing conventional and organic systems (Mazzoncini & Bàrberi, 2002). Three pigeon bean spatial arrangements and four direct weed control treatments were arranged in a split-plot design (sub-plot size: 40 m2). Crop spatial arrangements (main plots) were: narrowly-spaced rows (NSR), i.e. 14 cm inter-row distance; widely-spaced rows (WSR), i.e. 42 cm inter-row distance; paired rows (PR), i.e. 14 and 42 cm distance between the rows in the pair and between pairs, respectively. Weed control treatments (sub-plots) were: spring-tine harrowing with different tine adjustments (-15°, 0° and +15° in NSR, only +15° in WSR and PR; the value is the angle between the upper tine part and the perpendicular to the soil surface; Raffaelli et al., 2002), precision hoeing with or without a torsion weeder (in WSR and PR), and an untreated control (in all main plot treatments). The crop was sown in late October of both years and harvested on 1 July 2002 and 18 June 2003. Total seasonal (November-June) rainfall and temperature (T) was similar in the two years (512 vs 470 mm rainfall and 5.7/17.5 vs 5.8/17.9 °C min/max T in 2002 and 2003 respectively), but the March-June sub-period was warmer (+0.3/0.8 °C min/max T) and much drier (-58% of total rainfall) in 2003 than in 2002 (Fig. 1).

6th EWRS Workshop on Physical and Cultural Weed Control 3 Lillehammer, Norway, 8-10 March 2004
Fig. 1. Mean decadic minimum and maximum temperature (top left/right charts) and total decadic rainfall (bottom left/right charts) registered during the 2001-02 and 2002-03 growing seasons at S. Piero a Grado (Pisa). Soil conditions in mid-March 2002 impeded the use of the torsion weeder, thus all data taken in the hoed plots in that year were averaged before statistical analyses. Crop and weed densities were measured before and after mechanical weed control. Several crop growth parameters as well as crop yield, yield components and total weed biomass were measured at pigeon bean harvest. Data were subjected to three series of ANOVAs: (1) comparison among the four tine adjustments in NSR; (2) comparison among three crop spatial arrangements and their common weed control treatments (unweeded control vs spring-tine harrowing at +15°); (3) comparison between WSR and PR and their common weed control treatments (unweeded control vs spring-tine harrowing at +15° vs precision hoeing). Means comparisons were performed by a LSD test at P≤0.05. Results Crop and weed densities and weed biomass In 2002, crop and weed parameters did not significantly differ neither among tine adjustments of the harrow (in NSR) nor in several of the WSR vs PR comparisons. Besides this, weed control treatments did not differ from the unweeded control in any crop spatial arrangements, and no significant "spatial arrangement (S)" by "weed control (W)" interaction was found. Most of the significant differences among treatments came out from the NSR vs WSR vs PR comparison (Bàrberi et al., 2003). An early frost coupled with long-lasting soil crust considerably reduced pigeon bean stand especially in WSR and PR, in which crop density just before mechanical weed
2001-02 season
-5.00.05.0
10.015.020.025.030.035.0
XI2001
XII2001
I2002
II2002
III2002
IV2002
V2002
VI2002
Tem
pera
ture
(°C
) TminTmax
2002-03 season
-5.00.05.0
10.015.020.025.030.035.0
XI2002
XII2002
I2003
II2003
III2003
IV2003
V2003
VI2003
Tem
pera
ture
(°C
) TminTmax
2001-02 season
0.010.020.030.040.050.060.070.080.0
XI2001
XII2001
I2002
II2002
III2002
IV2002
V2002
VI2002
Rai
nfal
l (m
m)
2002-03 season
0.010.020.030.040.050.060.070.080.0
XI2002
XII2002
I2003
II2003
III2003
IV2003
V2003
VI2003
Rai
nfal
l (m
m)

6th EWRS Workshop on Physical and Cultural Weed Control 4 Lillehammer, Norway, 8-10 March 2004
control was 49% and 71% that in NSR, respectively (Table 1). However, this difference in crop stand did not affect total weed density. Lack of significant differences in weed density or biomass among crop spatial arrangements persisted until pigeon bean harvest (Table 1). In contrast, no difference in crop stand density due to spatial arrangement was found in 2003 (Table 1). As in 2002, total weed density and biomass were not influenced by crop spatial arrangement at any stage and no significant S x W interaction was observed (Table 1). Table 1. Crop and total weed density (plants m-2) just before mechanical weed control (MWC, 19 March 2002 and 17 February 2003), total weed density (plants m-2) 4 wk after MWC (19 April 2002 and 19 March 2003), and total weed biomass (g m-2 d.m.) at crop harvest (1 July 2002 and 18 June 2003) in the three crop spatial arrangements (averaged over weed control treatments). For each row, means in a given year labelled with the same letter are not significantly different at P≤0.05 (LSD test); ** significant at P≤0.05, ns not significant; NSR, narrowly-spaced row; WSR, widely-spaced rows; PR, paired rows.
Crop spatial arrangement Year 2002 Year 2003
Parameter1 NSR WSR PR NSR WSR PR Crop density before MWC **/ns 34.9 a 17.1 b 24.8 b 35.5 35.7 40.2 Weed density before MWC ns/ns 281.4 337.0 307.2 89.7 100.0 75.4 Weed density after MWC ns/ns 158.1 146.0 153.4 79.4 125.0 94.4 Weed biomass at harvest ns/ns 35.4 63.3 62.6 134.4 157.4 139.4
1The significance symbol before the slash refers to year 2002, the one after the slash to year 2003. However, unlike what was observed in the first season, in 2003 total weed density after mechanical weed control was on average 37% lower in the spring-tine harrowed plots (at +15°) than in the unweeded control, but total weed biomass at harvest did not differ between the two treatments (Table 2). Averaged over WSR and PR, total weed density was not significantly reduced by any mechanical treatments (possibly also due to uneven weed density across treatments before mechanical weed control: see Table 3), although they significantly reduced Poa annua density by an average 67% compared to the unweeded control (Table 3). The precision hoe + torsion weeder was the only tool that significantly reduced total weed biomass at harvest (by 36%). Table 2. Year 2003. Crop and total weed density (plants m-2) just before mechanical weed control (MWC, 17 February), total weed density and density of Polygonum aviculare (plants m-2) 4 wk after MWC (19 March), and total weed biomass (g m-2 d.m.) at crop harvest (18 June) in the unweeded control and in spring-tine harrowing performed with the +15° tine adjustment (averaged over three crop spatial arrangements). (*),* significant at P≤0.1 and P≤0.05 respectively, ns not significant.
Parameter Unweeded control Spring-tine harrowing at +15° Crop density before MWC ns 35.0 39.3 Weed density before MWC (*) 73.8 102.9 Weed density after MWC * 122.2 77.0 P. aviculare density after MWC (*) 49.5 33.2 Weed biomass at harvest ns 143.1 144.4

6th EWRS Workshop on Physical and Cultural Weed Control 5 Lillehammer, Norway, 8-10 March 2004
Table 3. Year 2003. Crop and total weed density (plants m-2) just before mechanical weed control (MWC, 17 February), total weed density and densities of Matricharia chamomilla and Poa annua (plants m-2) 4 wk after MWC (19 March), and total weed biomass (g m-2 d.m.) at crop harvest (18 June) in the unweeded control, in precision hoeing ± torsion weeder and in spring-tine harrowing performed with the +15° tine adjustment (averaged over the widely-spaced rows and paired rows crop spatial arrangements). In each row, means labelled with the same letter are not significantly different at P≤0.05 (LSD test). (*),* significant at P≤0.1 and P≤0.05 respectively, ns not significant.
Parameter Unweeded control
Precision hoeing Precision hoeing + torsion weeder
Spring-tine harrowing
at +15° Crop density before MWC ns 34.6 39.2 41.2 41.1 Weed density before MWC * 65.9 b 85.3 ab 114.3 a 109.5 a Weed density after MWC ns 127.0 71.0 93.3 92.5 M. chamomilla density after MWC * 2.8 b 1.2 b 5.2 a 2.0 b P. annua density after MWC (*) 34.1 a 11.1 b 9.5 b 13.5 b Weed biomass at harvest (*) 164.8 a 123.6 ab 104.8 b 132.0 ab
Crop biometric traits, yield and yield components In 2002, as expected, pigeon bean reacted to the narrowing of inter-row width by increasing plant height and the insertion height of the first pod on the stem (Table 4). Grain yield per plant in NSR was 54% and 59% that in WSR and PR, respectively. Despite this, no significant differences were observed in grain yield per unit area because of a higher plant (on average +38%) and stem (+18%) density in NSR than in WSR or PR (Table 4). In 2003, drought conditions and higher weed biomass present during the pod formation and grain filling periods (March to June) dramatically reduced pigeon bean growth and yield compared to the previous year. Plant height and grain yield were on average 59% and 82% lower in 2003 than in 2002, the effect being common to all crop spatial arrangements (Table 4). Table 4. Pigeon bean biometric traits, yield and yield components measured at crop harvest (1 July 2002 and 18 June 2003) in the three crop spatial arrangements (averaged over weed control treatments). For each row, means in a given year labelled with the same letter are not significantly different at P≤0.05 (LSD test); (*),*,** significant at P≤0.1, P≤0.05 and P≤0.01 respectively, ns non significant; NSR, narrowly-spaced row; WSR, widely-spaced rows; PR, paired rows.
Crop spatial arrangement Year 2002 Year 2003
Parameter1 NSR WSR PR NSR WSR PR Plant height, cm (*)/ns 137.5 a 126.2 b 131.7 ab 57.6 51.7 54.0 Height of first pod, cm (*)/ns 33.2 a 29.8 ab 28.1 b 16.4 13.5 15.5 Plant density, No. m-2 */ns 21.0 a 14.5 b 15.9 b 19.6 15.5 15.3 Stem density, No. m-2 */ns 70.0 a 59.7 b 59.0 b 41.7 35.8 38.5 Grain yield, t ha-1 ns/ns 3.4 4.1 4.3 0.6 0.8 0.7 Unit grain yield, g plant-1 */ns 15.9 b 29.2 a 27.0 a 3.0 4.9 4.5
1The significance symbol before the slash refers to year 2002, the one after the slash to year 2003. However, spring-tine harrowing usually improved pigeon bean biometric traits, yield and yield components compared to the unweeded control, although not always significantly (Table 5).

6th EWRS Workshop on Physical and Cultural Weed Control 6 Lillehammer, Norway, 8-10 March 2004
Table 5. Year 2003. Pigeon bean biometric traits, yield and yield components measured at crop harvest (18 June) in the unweeded control and spring-tine harrowing performed with the +15° tine adjustment (averaged over three crop spatial arrangements). (*),*,** significant at P≤0.1, P≤0.05 and P≤0.01 respectively, ns not significant.
Parameter Unweeded control Spring-tine harrowing at +15° Plant height, cm (*) 51.4 57.6 Height of first pod, cm (*) 13.9 16.4 Stem density, No. m-2 ** 28,0 49,4 Plant density, No. m-2 ns 15.5 18.1 Fertile pods density, No. m-2 (*) 104.6 145.5 Sterile pods, % * 21.3 17.6 No. pods plant-1 (*) 9.0 9.8 Stem yield, t ha-1 d.m. * 0.5 1.0 Pod yield, t ha-1 d.m. (*) 0.9 1.2 Grain yield, t ha-1 d.m. (*) 0.6 0.8 Total yield, t ha-1 d.m. (*) 2.0 3.0 Harvest Index, % (*) 28.4 26.8
Averaged over WSR and PR, plant height; plant and stem density; stem, grain and total yield were higher in spring-tine harrowing than in the unweeded control (by 18%, 37%, 114%, 143%, 84% and 93% respectively). Precision hoeing did not exert the same effect, regardless of the presence or absence of the torsion weeder (Table 6). Table 6. Year 2003. Pigeon bean biometric traits, yield and yield components measured at crop harvest (18 June) in the unweeded control, in precision hoeing ± torsion weeder and in spring-tine harrowing performed with the +15° tine adjustment (averaged over the widely-spaced rows and paired rows crop spatial arrangements). In each row, means labelled with the same letter are not significantly different at P≤0.05 (LSD test). (*),*,** significant at P≤0.1, P≤0.05 and P≤0.01 respectively, ns not significant.
Parameter Unweeded control Precision hoeing Precision hoeing + torsion weeder
Spring-tine harrowing at +15°
Plant height, cm * 48.6 b 51.5 ab 55.5 a 57.2 a Height of first pod, cm ns 13.0 12.7 15.4 16.0 Stem density, No. m-2 ** 23.7 c 32.6 bc 37.4 bc 50.7 a Plant density, No. m-2 * 13.0 b 13.4 b 12.0 b 17.8 a Fertile pods density, No. m-2 (*) 102.5 b 128.4 ab 123.7 ab 170.4 a Sterile pods, % ns 20.1 22.7 21.0 16.9 No. pods plant-1 na 10.1 11.6 13.1 11.5 Stem yield, t ha-1 * 0.5 c 0.7 bc 0.9 ab 1.1 a Pod yield, t ha-1 ns 0.8 1.1 1.0 1.4 Grain yield, t ha-1 (*) 0.5 b 0.7 ab 0.7 ab 1.0 a Total yield, t ha-1 * 1.8 b 2.5 ab 2.6 ab 3.5 a Harvest Index, % ns 28.9 27.8 26.4 27.5
Discussion In 2003, crop performance was severely affected by unusually dry weather conditions, while in 2002 the season was quite standard for the study area. The experimental data obviously reflect this difference, thus it seems premature to draw any general conclusions from this trial. In the standard season, pigeon bean confirmed its phenotypic plasticity as influenced by a different crop spatial arrangement, although this did not turn into significant differences neither in crop yield per unit area nor in weed density or biomass, an effect possibly influenced also by the unevenness of initial plant and weed stand. Despite the relatively high weed density in mid-March,

6th EWRS Workshop on Physical and Cultural Weed Control 7 Lillehammer, Norway, 8-10 March 2004
the crop did not seem to have suffered a high competitive pressure from weeds in the 2001-02 season, as indicated by the good yield levels obtained (on average 3.8 t ha-1 d.m.) and by lack of significant differences in yield between mechanically-treated and control plots. Some mechanisms of resource complementarity between crop and weeds might have occurred during this growing season. No significant crop spatial arrangement effects were observed also in the dry season, in which spring-tine harrowing at +15° generally appeared as the most effective mechanical weed control treatment of those included in the trial. Hopefully, further experimental data could help clarify experimental patterns so far partly masked by unexpectedly great weather fluctuations. References BÀRBERI P (2002) Weed management in organic agriculture: are we addressing the right issues?
Weed Research 42, 176-193. BÀRBERI P, MOONEN AC, BELLONI P & MAZZONCINI M (2003) Optimisation of crop spatial
arrangement for cultural weed control in organic pigeon bean (Vicia faba L. var. minor). Preliminary results. Proceedings 7th EWRS Mediterranean Symposium, Adana (TR), 6-9 May, 33-34.
BONARI E & MACCHIA M (1975) Effetto dell'investimento sulla produzione del favino (Vicia faba L. var. minor Peterm Beck). Rivista di Agronomia 9, 416-423 (in Italian with English abstract).
MAZZONCINI M & BÀRBERI P (2002) Ricerca: gli obiettivi e il metodo. A.Z. Bio 2, 36-41. RAFFAELLI M, PERUZZI A, BÀRBERI P & GINANNI M (2002) Options for mechanical weed control in
grain maize – work parameters and crop yield. Proceedings 5th Workshop of the EWRS Working Group on Physical and Cultural Weed Control, Pisa (IT), 11-13 March, 153-158.

6th EWRS Workshop on Physical and Cultural Weed Control 8 Lillehammer, Norway, 8-10 March 2004
Pre-planting and tree row treatments in organic apple production
L.O. Brandsæter 1 & D. Røen 2 1 The Norwegian Crop Research Institute, Plant Protection Centre, Høgskolevn. 7,
N-1432 Ås, Norway. Email: [email protected] 2 The Norwegian Crop Research Institute, Division Njøs, PO Box 42, N-6861 Leikanger, Norway.
Email:[email protected]
Our objective was to study the effect of some pre-planting and tree row treatments on weed
control, tree growth, fruit yield and damage caused by diseases and pests in organic apple production.
Choice of an efficient pre-planting procedure is important for weed control before establishing an organic apple orchard. We tested mechanical fallowing by milling cutter and a hairy vetch (Vicia villosa) ground cover in comparison with continuous grassland in the year before planting apple trees. Mechanical fallowing gave the best weed control after planting. The effect was particularly notable on couch grass (Elymus repens) density. A significant reduction in weed density was also found as a result of using a hairy vetch ground cover.
Different tree row treatments after planting were studied in two experimental apple orchards. Our results from the first three years after planting indicated that the best control of weeds in the tree row was when either using a milling cutter or a plastic mulch. Lowest yields were recorded on trees with a mulch of chips made from fruit tree wood. In plots with a ground cover of Trifolium repens, competition from the cover crop seemed to reduce the fruit yield. The use of a cover crop in the tree rows, combined with milling, needs further development before we can recommend such methods.
Diseases as well as harmful and beneficial insects were recorded per tree in this trial, and fruit samples were checked for diseases and insect-related damage. By this approach we aim to detect effects of tree row treatments on diseases and pests. So far the only significant difference discovered is an increased problem with green apple aphid (Aphis pomi) on trees with plastic mulch.

6th EWRS Workshop on Physical and Cultural Weed Control 9 Lillehammer, Norway, 8-10 March 2004
Development of a Decision Support System (DSS) for weed management in organic winter wheat production
D. H. K. Davies1 & D. Neuhoff2
1 Scottish Agricultural College, West Mains Road, Edinburgh EH9 3 JG, United Kingdom 2 Institute of Organic Agriculture, Prof. Dr. U. Köpke, Katzenburgweg 3, 53115 Bonn, Germany
[email protected] , [email protected]
Within the framework of the EU-funded project 'Strategies of Weed control in Organic Farming' (WECOF, Internet: http://www.wecof.uni-bonn.de/), various methods of cultural weed control in organic winter wheat are investigated and evaluated over different sites in Europe (UK, Germany, Poland and Spain). The experimental programme includes trials on competitive ability, mechanical control, photocontrol and allelopathy. Results from the experiments will be complemented by expert knowledge and literature reviews and integrated within a Decision Support System (DSS) that assists advisers and farmers in selecting site specific strategies for effective weed management. The DSS is based on a Java script compiler able to produce internet pages within which the inquiry and the subsequent evaluation are carried out. The main features of the DSS are a critical evaluation of current individual weed management practices utilised, and suggestions for their improvement mainly based on if / then decisions. A farmer’s data input on weed flora, site conditions and management practices will be analysed resulting in a list of recommendation. The primary output consists of an estimation as to whether or not weed pressure is expected to be controllable by indirect methods, e.g. improved crop competition, rotation, or whether direct methods, in particular mechanical, control should be applied as well. By categorising weeds with respect to their main germination period, the expected critical periods of weed competition can be determined to allow specification of varietal choice in terms of shading characteristics. Furthermore the DSS user is able to get detailed encyclopaedic and practical information on main weed species occurring in winter wheat, helping to select appropriate control measures. Apart from variety choice, further approaches on how to increase the competitive ability of the crop are evaluated, dependent on the data entered by the farmer. These options include crop spacing, fertility management, soil tillage, seed quality and other factors expected to promote crop growth and shading ability. For example, the analysis of site conditions may result in recommending the use of specific mechanical control measures. Crop rotation plays a key role in preventing high weed pressure in Organic Farming Systems. Therefore an analysis of the farmer’s crop rotation (crop types and their sequence) with respect to weed management will be carried out by the DSS. Competitive crops also need a sufficient supply with nutrients. Based on the farmer’s data input, e.g. on livestock units, manuring and crop rotation, an overall estimation of the fertility status of the farm/ field will be calculated, producing a practical recommendation for appropriate improved fertilisation strategies. The overall aim of the DSS in providing the farmer with the best current knowledge on weed control in organic/ ecological farming systems is expected to result in an improved weed management and higher revenues. Literature: DAVIES, K. & D.TAYLOR (2003):‘Selecting cereals’. Organic Farming, Spring 2003, 76 DREWS, S., D. NEUHOFF, P. JUROSZEK & U. KÖPKE (2002): Competitiveness of winter wheat stands
against wheats: effects of cultivar choice, row distance and drilling direction. In: Proceedings of the 12th EWRS - Symposium, Wageningen 24 – 27. June 2002, 282 – 283.
GAWRONSKI S.W. (2003): Allelopathy as a strategy for weed control in organic farming. Acta Physiol. Plantarum, 25, 3, supplement p. 25.

6th EWRS Workshop on Physical and Cultural Weed Control 10 Lillehammer, Norway, 8-10 March 2004
Cover crops in cauliflower production: Implications for weeds, insects, beneficial arthropods and yield
W. Hall1, L.O. Brandsæter2, T.A. Breland1 & R. Meadow2 1 Agricultural University of Norway, Department of Plant and Environmental Sciences, PO Box
5022, N-1432 Ås, Norway. Email:[email protected] / [email protected]
2 The Norwegian Crop Research Institute, Plant Protection Centre, Høgskolevn. 7, N-1432 Ås, Norway. Email: [email protected] / [email protected]
Cover cropping systems may help to improve agroecosystems, through decreased soil erosion, improved soil fertility, promotion of beneficial insects and reduced weed competition. If these benefits are realized they can improve the sustainability of the system, as cycling, diversity, stability and capacity are enhanced. These changes bring the system to more closely resemble natural systems.
Within three experimental years, hairy vetch (Vicia villosa Roth.), fall rye (Secale cerealeL.), yellow sweet clover (Melilotus officinalis L.) and white clover (Trifolium repens L.) were grown as cover crops with cauliflower (Brassica oleracea L. var. botrytis), and compared to monoculture cauliflower. In an effort to reduce competition between the cauliflower and cover crops, the cover crops were either mowed or rototilled prior to transplanting the cauliflower. The effects of the cover crops on weeds, allelopathy, cabbage and turnip root flies (Delia radicum L.and D. floralis Fall.), beneficial arthropods and cauliflower yield were investigated.
Monoculture and rototilled hairy vetch plots showed the highest number of weeds throughout the experiment. Mowed plots showed the lowest weed densities. None of the experimental treatments tested (rototilled hairy vetch, yellow sweet clover and white clover and mowed white clover) showed significant allelopathic potential. In 2000, the number of cabbage and turnip root fly eggs was not significantly different between the treatments. In 2001 however, fewer eggs were collected in cover crop plots, compared to the monoculture plots. In 2002, hairy vetch plots showed the largest number of eggs, but also had the largest abundance of beneficial insects, including spiders, carabids and staphylinids. Within week 28 and 29 of 2002, cabbage and turnip root fly egg registration was greatest. As well, carabid and staphylinid populations were largest during these two weeks, indicating that the populations were possibly influenced by the eggs. The resultant yields in the plots showed that rototilling of the cover crop prior to planting improved cauliflower yield, compared to mowing. The rototilled plots generally had the most weeds, but presumably the increased nutrient availability and reduced competition from the cover crops resulted in improved cauliflower yields, compared to mowed plots. Mowing of the cover crop decreased weed numbers, but most likely the higher level of competition and lower nutrient availability resulted in smaller cauliflower yields. Cover cropping systems have the potential to improve the sustainability of vegetable cropping systems, but more knowledge is required to establish and maintain ecological benefits, while still producing yields acceptable to farmers.

6th EWRS Workshop on Physical and Cultural Weed Control 11 Lillehammer, Norway, 8-10 March 2004
Designing crop rotations for organic plant production with low livestock density, combining weed control and nutrient supply
A.K. Løes1, L.O. Brandsæter2 & H. Riley3 1Norwegian Centre for Ecological Agriculture, NO-6630 Tingvoll, Norway
2The Norwegian Crop Research Institute, Plant Protection Centre, NO-1430 Ås, Norway 3The Norwegian Crop Research Institute, Apelsvoll Research Centre div. Kise,
NO-2350 Nes, Norway Introduction
Due to official regulations, Norwegian agriculture is divided into cereal cropping areas with very little animal husbandry, and areas with high livestock density in the coastal and mountain regions. Stockless organic farming requires a good management of green manure crops. Available green manure species as well as the amount of nitrogen (N) that is fixated, are restricted due to climatic conditions, with short growing seasons and cold winter climate. Crop rotations on stockless organic farms may be composed by a combination of subcropping legumes in cereals, mulching of vegetables with chopped plant material (Brandsæter & Riley 1999; Riley et al., 2003) and growing leys rich in legume to produce the mulch or nourish a subsequent cash crop. In the climatically best regions, production of legume or grass seeds is a further option. Crop rotations
Rotation 1 is designed for a full-time farmer with good access to cultivated land. 66% of the land is used for cereals and rapeseed, and 34% for green manure. Rotation 2 is designed for a part-time farmer with less farmland who wants to keep the land in shape and produce some cash crops, but can not manage to cultivate all the farmland intensively. 44% of the land is then used for vegetables and herbs, and 56% to produce mulch or green manure crops. Rotation 1 Rotation 2 1. Green manure 1. Cereal or lettuce + est. of ley 2. Barley with subcropped legume 2.-5. Ley 3. Oats and peas 6. Potatoes 4. Green manure/winter rye 7. Green manure 5. Rye, then ryegrass-clover 8. Cabbage with early mulch 6. Late planted rapeseed 9. Carrots with late mulch Weed regulation
The main bottlenecks to achieve satisfactory yields and income in these cropping systems will be the nutrient availability, weed regulation and amelioration of soil structure (Etun et al 2002). Green manure and mulch leys must be cut regularly to control perennial weeds.

6th EWRS Workshop on Physical and Cultural Weed Control 12 Lillehammer, Norway, 8-10 March 2004
References BRANDSÆTER, L.O. and H. RILEY 1999. Plant residues for weed management in vegetables.
Workshop : Designing and testing crop rotations for organic farming, Borris, Denmark 14-16 June 1999. DARCOF Report no.1.
ELTUN, R. 2002. Organic cropping systems for higher and more stable cereal yields. Proposal for The Norwegian Research Council. Planteforsk Apelsvoll forskingssenter, Kapp. 21 s.
RILEY, H., A.K. LØES, S. HANSEN and S. DRAGLAND, 2003. Yield responses and nutrient utilization with the use of chopped grass and clover material as surface mulches in an organic vegetable growing system. Biological Agriculture and Horticulture, 21, 63-90

6th EWRS Workshop on Physical and Cultural Weed Control 13 Lillehammer, Norway, 8-10 March 2004
The effects of different cover crops on weed control and yield in organic potato and tomato production
C. Mirabelli, R. Paolini, F. Faustini & F. Saccardo Dipartimento di Produzione Vegetale, University of Tuscia
Via S. Camillo de Lellis, 01100 Viterbo, Italy [email protected]
Introduction
Cover crops can have many beneficial effects on the cropping system, such as the improvement of the soil structure and the prevention of erosion and loss of nitrates, and the increase of soil organic matter and nutrient content when used as a green manure (Brandsaeter et al., 1999). Cover crops can be also good weed suppressors (Boydston et al., 1995) and integrate the effect of other weed control methods in organic or low input systems.
This study aimed to evaluate the effect of different legumes and non-legume cover crops on weed control and yield of potato and tomato in an organic rotation with chick-pea as the preceding crop. Materials and methods
A field experiment started at Viterbo in winter 2001/2002 with a 3-year rotation in space and time, where a cover crop was grown in the interval between two main crops (chick-pea /cover crop / potato / cover crop / tomato). In the first year, chick-pea opened the rotation. In the second year, on 13 September 2002, the following five cover crops were sown in sub-plots following chick-pea: hairy vetch (Vicia villosa), snail medick (Medicago scutellata), rapeseed (Brassica napus var. oleifera), italian ryegrass (Lolium multiflorum) and subterranean clover (Trifolium subterraneum). A sub-plot without cover crop (fallow) was also included. Some months later, one week before the planting of the following potato (12 March) and tomato (23 April), the cover crops were cut and incorporated into the soil by disk-harrowing after biomass sampling to measure dry matter production and nitrogen content. Weed biomass was also sampled, counted and dried per species. The fallow sub-plot was splitted in two sub-sub-plots, one managed with no N fertilisation (no N control), and the other fertilised with 200 kg ha-1 mineral N (mineral N control). In the other sub-plots, the following potato and tomato received only the green manure as nutrient source. In potato and tomato, weeds were controlled by 1 inter-row hoeing and hilling up, and 2 inter-row hoeing + 1 intrabine hoeing, respectively. In each sub-plot, a sample area kept weed-free was also present. Results and discussion
Compared to mineral N control, cover crops resulted in clear weed suppression in the following potato (on average 66 g m-2 of weed DM vs 111 g m-2, P < 0.05). Compared to mineral N control, potato following cover crops had also a lower yield reduction in the weed presence for respect to weed-free conditions (8.3 vs 16.9 %, P < 0.05). In weed-free conditions potato yielded more when following legume cover crops and in mineral N control than when following rapeseed and italian ryegrass and in no N control (on average 50.6 vs 46.0 t ha-1 tuber FM, respectively, P < 0.05).

6th EWRS Workshop on Physical and Cultural Weed Control 14 Lillehammer, Norway, 8-10 March 2004
Compared to mineral N control, italian ryegrass and snail medick were more weed suppressive in the following tomato (on average 266 g m-2 of weed DM vs 409 g m-2, P < 0.05). Compared to mineral N control, tomato following these two cover crops had also lower yield reduction in the weed presence for respect to weed-free conditions (on average 15.2 vs 28.6 %, P < 0.05). Hairy vetch gave low yield reduction in the weed presence (16.9 %) but did not have relevant weed suppression effect. This was probably due to a complementarity effect with late emerging weeds (mainly Amaranthus retroflexus) in the use of nitrogen. In weed-free conditions, tomato yielded more when following hairy vetch and in mineral N control, and least in no N control (61.6 vs 46.2 t ha-1 fruit FM, respectively, P < 0.05). References BRANDSAETER L O & NETLAND J (1999) Crop Science 39, 1369-1379. BOYDSTON R & HANG A (1995) Weed Technology 9, 669-675.

6th EWRS Workshop on Physical and Cultural Weed Control 15 Lillehammer, Norway, 8-10 March 2004
Physical weed control in organic spinach production
A. Peruzzi, M. Ginanni, M. Raffaelli & M. Borelli Centro Interdipartimentale di Ricerche Agro-Ambientali “E.Avanzi”- University of Pisa
Via Vecchia di Marina, 6 – 56010 S.Piero a Grado (PI) – Italy Email: [email protected]
Abstract
Field research was carried out in autumn 2002 to test improved physical and mechanical weed control strategies in organic spinach. Four different work chains were compared. Specific operative machines (spring tine harrow, flame weeder and precision hoe) were set for the conventional soil preparation (ridge 1,4 m wide) adopted by farmers for organic spinach for fresh market (hand picking).Throughout the testing period weed community, weed density and its total biomass were sampled. Preliminary results showed that relevant improvement in weed control and crop production may be obtained by new tested operative machine. Good control in terms of biomass and number of weeds was obtained with a relevant save of labour time. Introduction
Spinach is a quick-maturing, cool season, vegetable crop that is grown for fresh market and processing market. Italy is the first European Country in spinach production. Spinach is cultivated on 7000-8000 ha year-1(INEA, 2001; ISMEA 2003). Tuscany is the first Italian Region in spinach production and the soils located along the coastal area of Tuscany are particularly suitable for spinach crop. On average (fresh and processing products) in Tuscany spinach production is about 14,7 t ha-1 (Regione Toscana, 2001 and 2003).
Weed control in spinach is necessary throughout the season to achieve a sufficient marketable yield. Early season weed control is especially important in precision planted crops like spinach because it is a relatively poor competitor against weeds.
Spinach is cultivated in Central Italy from September to May. Generally crop cycle is very short (60 days) when sown in September and at the end of winter, whereas crop cycle is longer when sown in winter. As a consequence an integrated weed control program must take into account planting date and weed spectrum which determine choice of weed control strategy.
This paper reports the preliminary results obtained in 2002 on the effect of various mechanical strategies on weed control in organic spinach. Materials and Method
The field experiment started in September 2002 and it is still in progress in an organic farm located at San Martino Ulmiano (Pisa-Italy). Chemical and physical characteristics of experimental site are shown in table 1.
Four weed management strategies (summarized in tab.2) in organic spinach for fresh market were compared in 2002. Strategies 1 and 2 represent two different work chains for weed control applied to farmer's crop management (Organic Conventional - OC) whereas work chains 3 and 4 represent two alternatives for weed control applied to an innovative crop management (Organic Innovative - OI).

6th EWRS Workshop on Physical and Cultural Weed Control 16 Lillehammer, Norway, 8-10 March 2004
Soil tillage was performed by shallow ploughing (25-30 cm depth) followed by rotary harrowing. Fertilization was carried out by spreading 1 t ha-1 of "Prodigy" (title: 7.3.2), a manure authorized for organic farming.
Spinach cv "Allegro" (suitable for fresh market) was sown on 17 September 2002 at a seed rate of 520000 seeds ha-1.
In both organic crop systems spinach was cultivated in a ridged soil; ridges 1,4 m wide represent the conventional soil preparation for spinach for fresh consumption. Experimental area was ridged 2 weeks before spinach sowing to perform false seed bed technique. Tab 1 Soil characteristics of experimental site (0-30 cm depth)
Soil characteristics Values Sand Silt Clay
% % %
55,7 37,1 7,2
pH 6,8 Total N ‰ 1,2 P Olsen ‰ 114,4 Organic matter % 2,0
Tab 2 Different work chains tested in 2002 (CO: conventional Organic; IO: Innovative Organic)
CO IO Work chains n° 1 2 3 4 Spring tine harrowing (x 2) Flame weeding Sowing (rows/ridge) 4 4 5 5 Conventional hoeing Precision hoeing (x 2)
Both in OC and OI spring tine harrowing was applied two times, whereas flame weeding was applied only in work chains 2 and 4 just before spinach sowing. All the mechanical equipments were built in order to operate in ridged soil. Spring tine harrow was 1,5 m wide to obtain complete weed control on the entire ridge by a pass and it is constituted by a frame composed of six transverse rows of 8 tines. Tines are 36 cm long and are made of steel with a diameter of 0,6 cm.
Other characteristics of spring tine harrow are described in previous papers (Peruzzi et al., 1993 and 2003; Peruzzi &Raffaelli, 2001; Raffaelli et al., 2002). Spring tine harrow was always adjusted with an angle of +15°, thus the most aggressive tine adjustment (Peruzzi et al., 1993; Peruzzi &Raffaelli, 2001).
The flamer is an open flame machine (fig.1) equipped with five 25 cm wide rod burners. In the experimental field trials the operative machine was used in pre sowing treatment with a driving speed of about 3 km h-1 and LPG pressure of about 0,3 MPa. Flame weeding was performed just before sowing.

6th EWRS Workshop on Physical and Cultural Weed Control 17 Lillehammer, Norway, 8-10 March 2004
Fig. 1 Operative machine for pre sowing flame weeding
Fig. 2 Conventional mechanical drill for spinach sowing
In OC four spinach rows/ridge were sown whereas five spinach rows/ridge were sown in OI. The inter-row distance was 25 cm and 20 cm respectively in OC and OI A mechanical drill (fig.2) equipped with a packer-roll was adopted for conventional organic spinach crop whereas a pneumatic precision planter (fig.3) was adopted to sow innovative organic spinach management plot.
Post emergence hoeing were applied in all systems. A manual driving hoe (fig. 4) was adopted in OC work chains whereas an innovative precision hoe (fig. 5) was adopted in IO. Manual hoeing was carried out only in the three inter rows present in each OC plots, whilst precision hoeing was able to operate on entire ridge wide.
Precision hoe was equipped with a seat and steering handles and directional wheel. The machine is equipped with six working units connected to the frame by means of articulated parallelograms. Each working unit was provided with a 9 cm wide horizontal blade and with two couples (fig.6) of specific tools (elastic teeth suitable as vibrating tines and torsion weeder) to implement and perform the inter and intra row weed control.

6th EWRS Workshop on Physical and Cultural Weed Control 18 Lillehammer, Norway, 8-10 March 2004
Fig. 3 Pneumatic precision planter adopted for Innovative Organic managememt
Fig. 4 Manual hoe adopted by the organic farmer in Organic Conventional weed management
Fig. 5 Precision hoe adopted in organic innovative weed management.

6th EWRS Workshop on Physical and Cultural Weed Control 19 Lillehammer, Norway, 8-10 March 2004
Fig. 6 Elastic teeth: A Torsion weeder B Vibrating tines
Throughout all the testing period working times, fuel consumption and the work chain characteristics were recorded in order to compare the total times connected with the four different weed managements.
Weed density and species were monitored just before each mechanical operation by a 0,225 m2 sample area in each experimental plot.
At harvest two areas 1 m2 each were sampled in each experimental plot to determine crop production and weed biomass.
Marketable fresh product was evaluated as kg ha-1of fresh leaves, wheras weed biomass was evaluated as g m-2of dry matter. Also spinach crop density was evaluate at harvest. Experimental design was a randomised complete block with four replicates. Data collected were analysed by ANOVA. Treatment means were separated by Duncan's Multiple Range Test at P≤ 0,05 (Gomez & Gomez, 1984). Results and Discussion Mechanical aspects
Main characteristics of operative machines recorded in the field test are shown in table 3. All
the operative machines were coupled to a 4WD 55 kW tractor. With the exception of conventional hoe, all the machines adopted are characterized by working width of 1,4 m.
From the data collected throughout the entire crop cycle we can observe the high work capacity connected to a very low fuel consumption of spring tine harrow with respect to flamer in the pre-sowing treatment. On average of two spring tine harrowing, driving speed was about 10 km h-1 and the work capacity was 1,25 ha h-1. Precision hoe required very low driving speed and as a consequence its work capacity was about 0,17 ha h-1.
As shown in table 4, adoption of precision hoe was connected with a relevant reduction in labour time with respect to conventional hoeing. The labour required by precision hoe was 23,2 h ha-1 as a consequence of two precision hoeing, while 33,1 h ha-1 is the time connected with one conventional hoeing.

6th EWRS Workshop on Physical and Cultural Weed Control 20 Lillehammer, Norway, 8-10 March 2004
Tab 3 Performances of operative machines adopted for mechanichal and physical weed control on spinach
Spring tine
harrowingFlame
weeding Precision Hoeing
Manual Hoeing
Work wide (m) 1,4 1,4 1,4 0,15 Work depth (cm) 2,2-3,8 - 2,3 2,3 Driving speed (km h-1) 9,9 3,0 1,4 0,7 Work capacity (ha h-1) 1,25 0,37 0,17 0,03 Working time (h ha-1) 0,8 2,7 5,8 33,1 Worker (n) 1 1 2 1 Tractor power (kW) 55 55 55 Engine load (%) 20 20 20 Fuel consumption (kg ha-1) 2,4 8,1 17,4 LPG pressure (MPa) 0,3 LPG consumption (kg ha-1) 38
Tab.4 Labour time required (h ha-1) for weed control in different work chains
Work chains CO IO 1 2 3 4 Spring tine harrowing (x 2) 1,6 1,6 1,6 1,6 Flame weeding 2,7 2,7 Conventional hoeing 33,1 33,1 Precision hoeing (x 2) 23,2 23,2 Total 34,7 37,4 24,8 27,5
Weed control
Before the first spring tine harrowing, 528 weeds m-2 were present. Portulaca oleracea (L.) and Poa spp were the quantitative most important weed species present after false seed-bed preparation (up than 70% of total weed plant recorded).
After first spring tine harrowing about 84% of weeds were removed (528 and 86 plants m-2 respectively before and after harrowing). Strong reduction in weed population were observed especially in Portulaca oleracea (L.) and Poa spp (respectively -130 plants m-2 and -188 plants m-
2). After second spring tine harrowing a very good control of weed was observed and weeds were reduced to 36 plants m-2. At the same time check (control) without any treatment showed an increase in weed plant population that arose to 807 plants m-2. After two passes by spring tine harrow the most represented weeds remained Portulaca oleracea (L.), Poa spp. and Solanum nigrum (L.).
Effectiveness of flame weeding was observed after sowing. In CO work chain 2 flame weeding and conventional sowing (four rows/ridge) allowed a weed reduction of about 100% with respect to the direct sowing without flame weeding (respectively 0 and 10 weeds m-2).
Similarly in IO work chains the adoption of flame weeding was connected with a reduction of weed density (about -90%). After sowing CO are characterized by a generalized reduction of weeds with respects to IO (table 5). This difference probably may be a consequence of weed crushing

6th EWRS Workshop on Physical and Cultural Weed Control 21 Lillehammer, Norway, 8-10 March 2004
carried out by the packer-roll seated on the conventional drill (fig.2). No significant differences were recorded between work chains 2 and 4. Tab. 5- Weed density (plants m-1) at different stage of spinach crop cycle. In the same row values
followed by different letters are significantly different at P≤ 0,05 (Duncan's Multiple Range Test)
Organic system OC IO Work chains 1 2 3 4 Before false sowing 528 After first spring tine harrow 86 After second spring tine harrow 36 After sowing 10 b 0 b 38 a 4 b Before hoeing 333 ab 267 b 383 a 253 b Before harvest 309 a 273 ab 225 bc 172 c
Fig. 7 Experimental plots after precision hoeing.
About one month after sowing weed density showed e relevant increase (on average + 309 weeds m-2). Both work chains where flame weeding was not applied (work chains 1 and 3) showed on average an highest weed presence (+ 98 weeds m-2).
It is remarkable the "long term effect" of flame weeding; the adoption of pre-sowing flame weeding allowed a significant reduction of weeds number both in OC and in OI just after sowing (short term effect) until before hoeing (long term effect).
Significant differences were observed after conventional (1 pass) and innovative precision hoeing (2 passes). On average weed density was lower when precision hoe (fig. 6) was applied with respect to conventional manual hoe (respectively 198 and 291 weeds m-2). Moreover, precision hoeing was connected to a significant reduction of labour required.
At harvest (tab. 6) weed biomass was strongly reduced in the experimental plot where precision hoe was adopted. On average total weed biomass under Organic Innovative was reduced about by 30% with respect to Organic Conventional. In particular work chain 4 showed a significant reduction of weed biomass with respect to the other weed management systems.

6th EWRS Workshop on Physical and Cultural Weed Control 22 Lillehammer, Norway, 8-10 March 2004
Tab. 6 Weed biomass (g m-2) at harvest; values followed by different letters indicate significant differences at P≤0,05 (Duncan's Multiple Range Test)
Organic system OC OI Work chains 1 2 3 4 Weed biomass 101,3 a 80,2 b 75,1 b 57,4 c
Crop production (tab.7) was significantly higher under both OI weed management systems. On
average fresh marketable product increased of about 8,8 t ha-1 in OI with respect to OC. Crop density followed the same trend with a significant increasing (+17,5 plant m-2) under OI systems (fig.7). Tab. 7 Spinach plant density (n° m-2) and marketable fresh product (t ha-1) obtained under
Conventional Organic (work chains 1 and 2) and Innovative Organic (work chains 3 and 4). In the same row values followed by different letters indicate significant differences at P≤0,05 (Duncan's Multiple Range Test)
Organic system OC IO Work chains 1 2 3 4 Marketable spinach (t ha-1) 6,4 b 4,6 b 13,2 a 14,4 a Plant (n° m-2) 15,7 b 13,2 b 32,5 a 31,4 a
Conclusions
Innovative weed management in organic spinach seems to be connected with a good control of weeds. Little weed biomass does not represent a big problem when hand picking was applied whereas it is a big trouble for processing spinach crops (Tei et al, 2002).
Furthermore, precision hoeing represents a possible strategy to improve inter and intra row weed control connected with a relevant saving of required labour. Increasing crop production under both OI may be a consequence of a better crop implant technique and an improved weed control throughout crop cycle especially after hoeing when spinach growth rate increases quickly.
Problems of primary importance may be connected with the meteorological trend observed in our experimental area. The period within the end of summer and autumn is characterized by a relevant number of rainy days; so an optimal soil drainage is required to avoid field impracticability by operative machines for weed control. Thus, the adoption of precision hoe, is probably most suitable for spring spinach, whereas end summer and autumn sowing required a more careful adoption of false seed bed technique to obtain a significant weed reduction before crop planting. In this context researchers of CIRAA are working out a new versatile operative machine, basket weeder-like, suitable both in pre-sowing and post-emergence weed control treatments. Acknowledgements
The authors want to thank very much for their precious collaboration and participation in the experimental work Mrs Roberta Del Sarto, Mr. Silvano Toniolo, Mr. Claudio Marchi, Mr. Alessandro Pannocchia, Mr. Calogero Plaia and Mr. Paolo Gronchi (technicians of Centro “E.Avanzi” of Pisa University), Mr. Alessandro Bonamici and Mr. Gino Corridoni (organic

6th EWRS Workshop on Physical and Cultural Weed Control 23 Lillehammer, Norway, 8-10 March 2004
farmers) and, last but not least, Dr. Elena Fantoni (agronomist of Comune of San Giuliano Terme that funded this research). References GOMEZ K.A. & GOMEZ A.A. (1984). Statistical procedures for agricultural research. 2nd edn, J Wiley
& Sons, New York, USA. INEA (2001) Le produzioni ortofrutticole. Annuario dell'Agricoltura Italiana 2001. INEA, Roma
413-442. ISMEA (2003) www.ismea.it. PERUZZI A.& RAFFAELLI M. (2001) Macchine per il controllo fisico delle infestanti: risultati di dieci
anni di sperimentazione. M.&M.A. 9, 45-58. PERUZZI A., SILVESTRI N., COLI A., GINI N. (1993) Winter cereals weeds control by means of
weeding harrows: first experimental results. Agricoltura Mediterranea 3, 236-242. PERUZZI A., RAFFAELLI M., GINANNI M. & BORELLI M (2003) Physical weed control in organic
carrot in the Fucino Valley (Italy). Proceedings of the 7 th EWRS Mediterranean Symposium, Adana (Turkey) 6-9 May 2003, 37-38.
RAFFAELLI M., PERUZZI A., GINANNI M. & DI CIOLO S. (2002). Mechanical weed control in sunflower and soyabean crops using spring tine harrow: results of two-year trials. Agricoltura Mediterranea, vol. 132, 112-121.
REGIONE TOSCANA (2001) www.regione.toscana.it REGIONE TOSCANA (2003). www.regione.toscana.it TEI F., STAGNARI F. & GRANIER A. (2002) Preliminary results on physical weed control in
processing spinach. Proceedings 5th EWRS Workshop on Physical and Cultural Weed Control, Pisa, Italy, 11-13 March, 164-171.

6th EWRS Workshop on Physical and Cultural Weed Control 24 Lillehammer, Norway, 8-10 March 2004
Physical weed control in organic carrot production.
A. Peruzzi, M. Raffaelli, M. Ginanni & M. Borelli Centro Interdipartimentale di Ricerche Agro-Ambientali “E.Avanzi”- University of Pisa
Via Vecchia di Marina, 6 – 56010 S.Piero a Grado (PI) – Italy Email: [email protected]
Abstract
A three years experiment (2000-2002) was carried out on the possibility to perform the physical weed control of carrot in the typical cultural and environmental condition of the Fucino Valley (that is the most important area of carrot production in Italy), in order to obtain a “biological” product.
Firstly, the strategy of physical weed control of carrot in the Fucino Valley was defined and included the realization of the false seed-bed technique, a flame treatment before crop emergence and one or more mechanical (precision hoeing) and manual interventions in post-emergence.
False seed-bed technique was performed by means of a specific spring tine harrow two meters wide, while flaming was performed by means of an operative machine equipped with four “open flame” rod burners 50 cm wide.
A specific precision hoe with eleven units (inter-row of about 18 cm) was built, tested, improved and set up to perform weed control both between (by means of a rigid tine supporting a 9 cm wide horizontal blade) and in rows (by means of vibrating teeth or torsion weeder).
During the testing period the evolution of weed flora (both presence and biomass) was monitored and carrot root yield was recorded. Moreover work chains characteristics, manpower use and physical weed control cost were determined.
The results were quite good and put in evidence that physical weed control in organic carrot cultivated in the Fucino Valley can be performed, obtaining relevant and high quality yields, without the need of too many hours of manual labour and with fully acceptable costs, taking also into account that in Italy the market price of “biological” carrot is quite high. Introduction
Carrot cultivation is decidedly important in Italy. Italy places in fact to the third party place in Europe, after Great Britain and France, for surface cultivated, with values higher than 10000 ha year-1 and average yields of approximately 50 t ha-1 of roots. The Abruzzo Region - and in particular the zone of Fucino Valley - is the area where carrot is mainly cultivated and where the most elevated productions are obtained. The average cultivated surface is about 2500 ha year-1 and yields in roots are on average 60-70 t ha-1. The product is almost completely destined to fresh market and only in small part (less than 10 %) conferred to the industry (Inea, 2001; Peruzzi et al., 2002; Cianfarra et al., 2003; Ismea, 2003).
The salable gross production deriving from this cultivation in Abruzzo ranged from 10 up to 15 millions of euro year-1. Moreover the carrot produced in the Fucino Valley is associated to an UE quality mark called IGP (Protected Geographical Indication) for its high content of vitamins (in particular ascorbic acid) and oligoelements (Cianfarra et al., 2003; Peruzzi et al., 2002 and 2003a).
The high quality that characterizes the carrot produced in this area unfortunately is not well exploited at the moment because most of the used cultivation techniques are of conventional type and thus based on a wide use of agrochemicals (especially fertilizers and herbicides). Thus, there is the clear need to increase the value and the quality of carrot cultivation in Fucino Valley,

6th EWRS Workshop on Physical and Cultural Weed Control 25 Lillehammer, Norway, 8-10 March 2004
introducing environment sound techniques on one hand and setting up systems for organic management on the other. All that in order to produce carrots characterized by high qualitative standards, “wholesome” and lacking in whichever risk of chemical nature (Cianfarra et al., 2003; Peruzzi et al., 2002 and 2003a).
This evolution of the techniques is for many reasons an obliged road because on one hand the market more and more often demands the adoption of disciplinary of production enough rigid and on the other the consumers are more and more sensitive to the problematic connected to environment protection and health safety and, consequently, they are disposed to pay high prices if the product introduces high and satisfactory guarantees of quality. Moreover, at present, the trend in action - especially for the section of vegetables cultivation for fresh consumption - emphasizes that Italy it is the first producer in Europe of organic products with a surface dedicated to organic cultivation equal to 10% approximately of the total cultivated area (Cianfarra et al., 2003; Peruzzi, 2003; Peruzzi & Raffaelli, 2001; Peruzzi et al., 2002 and 2003b).
However, it is necessary to specify that an indispensable condition for being able to use for carrot (like for other herbaceous and vegetable species) technical of cultivation alternatives to those conventional (and in particular organic ones) is obviously the availability of innovative mechanical equipments, usable in simple, but however rigorous way, by the farmers and fit to the specific requirements of the environment of cultivation. In the light of these considerations, the opportunity of an organic management of carrot appeared very interesting in this context, taking also into account the experiences carried out in other Countries on the definition of strategies for physical weed control, that is surely one of the most important problematic in organic carrot (Ascard, 1990 and 1995; Fogelberg, 1998 and 1999; Melander, 1998; Melander & Hartvig, 1995; Radics et al., 2002).
The critical analysis of the results obtained in some specific researches on the application of physical weed control for organic cultivation carried out both in other Countries on carrot and in Italy at the Centro Interdipartimentale di Ricerche Agro-Ambientali “E.Avanzi” of the University of Pisa on other herbaceous and vegetable crops (maize, sunflower, soia, string bean, onion, etc.) (Peruzzi, 2003; Peruzzi et al., 1998a, 1998b, 1999 and 2003b; Peruzzi & Raffaelli, 2000, 2001 and 2002; Raffaelli et al. 2002a, 2002b and 2002c) carried to the definition of a specific research programme for “not-chemical” weed control of organic carrot in the Fucino Valley. This research programme, funded by ARSSA (the Regional Agency for the Services of Agricultural Development) of Avezzano (AQ), was carried out in the three year period 2000-2002 and allowed to obtain very interesting and promising results regarding the definition and setting up of specific techniques and operative machines for physical weed control in organic carrot cultivated in the Fucino Valley.
Materials and methods The tecnique and the operative machines
The technique of physical weed control of carrot in the typical conditions of cultivation of Fucino Valley, was gradually developed in the course of the three years, reaching in 2002 an appreciable degree of optimization with consequent possibility to program the interventions and to highly reduce the use of expensive hand weeding. In substance, with the exception of the first year of test that was only useful to verify “in the field” the feasibility of physical weed control and to define the equipments and their modalities of employment, the organic management of weed flora has been realized putting into effect in succession the following treatments: • false seed-bed tecnique carried out by means of a specific spring-tine harrow;

6th EWRS Workshop on Physical and Cultural Weed Control 26 Lillehammer, Norway, 8-10 March 2004
• pre-emergence flame weeding carried out by means of a specific operative machine;
• post-emergence precision hoeing carried out by means of an equipment purposely realized and equipped in the definitive version with tools for intra-row weed control;
• hand weeding.
All the equipments were realized in order to perform the physical weed control of organic carrot in the conditions of cultivation of Fucino Valley. In particular the spring-tine harrow, the precision hoe with eleven weeding elements and the flamer equipped with four 50 cm wide rod burners were adapted to work on one standard width (that one of the “goblet” that is a strip 2 m wide and 250 m long and is used in the Fucino Valley as a unit of agricultural surface), and (in the case of the hoeing machine) on single row carrot with an inter-row distance of 18 cm.
The specific 2 m wide spring-tine harrow able to properly work on the “goblet” was realized and used on carrot in the course of 2001 and 2002 for the carrying out of false seed-bed tecnique, adopting the maximum angle-shot of the teeth with respect to the normal to soil surface (+15°) and with a driving speed dependent on the environmental and operative conditions (about 8 km h-1 in 2001 and 5 km h-1 in 2002) (fig.1).
Fig.1 Specific 2 m wide spring-tine harrow realized in order to work on the “globlet” in the Fucino Valley and used for false seed-bed technique.
The specific flamer was an open flame machine equipped with four 50 cm wide rod burners
and therefore with a total working width of 2 m (fig.2). The burners were always adjusted at a distance of 10 cm and an inclination of 45° with respect to soil surface in order to obtain a very high efficiency of heat transfer according to the results obtained in previous studies carried out at the University of Pisa (Peruzzi et al., 1996 and 1997; Raffaelli & Peruzzi, 2002). In the testing period, the machine was used to carry out a pre-emergence treatment with a driving speed of about 3 km h-1
and a LPG pressure ranging from 0,2 to 0,3 MPa (fig.3).

6th EWRS Workshop on Physical and Cultural Weed Control 27 Lillehammer, Norway, 8-10 March 2004
Fig.2 Scheme of the flamer: (A) LPG tank; (B) hopper containing water; (C) heat exchanger; (D) articulated
parallelogram; (E) burner; (F) shelf on which the inflow LPG control system is located; (R) pressure regulator and manometer.
The precision hoeing machine was realized in order to perform a post-emergence selective
weed control on single row organic carrot cultivated in the Fucino Valley. As a matter of fact, the implement is able to work on the goblet (total working width of 2 m) carrying out an inter-row superficial tillage in carrot planted on ten rows/globlet (fig.4). The machine is equipped with a seat, steering-handles and directional wheel in order to carry out a precision treatment without any damage of carrot plants.
Fig.3 Flamer at work in pre-emergence of carrot in the Fucino Valley.

6th EWRS Workshop on Physical and Cultural Weed Control 28 Lillehammer, Norway, 8-10 March 2004
Fig.4 Version 2001 of the specific precision hoe equipped with eleven units realized to perform post-emergence weed control on single-row planted organic carrot in the Fucino Valley.
Fig.5 Working tools of the version 2001 of the specific precision hoe.
The hoeing machine is equipped with eleven working units, connected to the frame by means
of articulated parallelograms. In the first version (used in 2001) each unit was equipped with a rigid tine and a foot-goose push-rod that was subsequently replaced (in the 2002 version) with a 9 cm wide horizontal blade (able to perform weed control without excessive digging of the soil and avoiding problems of engulfing), a couple of concave discs and a wheel for depth adjustment (fig.5).
Fig.6 Scheme of the version 2002 of the precision hoe: (A) seat; (B) steering handles; (C) directional wheel; (D) articulated parallelogram; (E) tine with blade tool; (F) side discs; (G) support wheel; (H) tools for intra-row weeding (in the circle: (T) torsion weeder; (V) vibrating tines).

6th EWRS Workshop on Physical and Cultural Weed Control 29 Lillehammer, Norway, 8-10 March 2004
In 2001 the hoeing machine was used to perform two treatments, one in early and one in late post-emergence of single row planted carrot. According to the aim of the intervention, the driving speed was always very low (about 2 km h-1). The use of the hoeing machine allowed to perform very efficient interventions, increasing the weeded surface with respect to the traditional strip planting technique of carrot (five strips about 5 cm wide with an inter-row distance of 30 cm), commonly used in the Fucino Valley.
Fig.7 Precision hoeing machine equipped with vibrating tines, at work on organic carrot in the experimental fields of Fucino Valley.
According to good results obtained in 2001, a further improvement of this machine was
planned and realized in 2002. Each unit was equipped with specific tools (consisting in a couple of elastic teeth usable as both vibrating tines and torsion weeder) able to perform a selective intra-row weed control with the aim of reducing the need of hand weeding (fig.6).
The action of these tools was in any case “gentle” and respectful for carrot and allowed a good control of weed small plants present in the row (fig.7). Experimental tests and carrot management
In the first year of test (2000) physical weed control was compared with the traditional chemical weeding and an untreated control in a farm where the conventional cultivation of carrot was carried out. Carrot was planted only by means of the conventional method, consisting in the precision sowing of five strips/globlet (with random seed distribution in each strip). This first adoption of carrot physical weed control was very useful to define and set up the strategy for organic management of weed subsequently used.
In the two years period 2001-2002, the tests were carried out in two organic farms in silty-loam soils (27% sand, 60% silt and 13% clay) well provide of organic matter (5,8%). In this case physical weed control was performed both on conventionally planted carrot (5 strips/globlet) and single row planted carrot (10 rows/globlet). Weed control strategy included in both cases, finger harrowing, flaming, precision hoeing and hand weeding. The interventions were obviously diversified according to the requirements, the planting systems and the management of the crop. In particular in 2002 also the effects of the two different tools (vibrating tines and torsion weeder) used for intra-row weeding were compared, in terms of both weed control and carrot yield.
The “conventional” organic management of carrot performed in the Fucino Valley was used in both the experimental farms, consisting in the distribution of 50-100 m3 ha-1 of manure followed by a deep primary tillage (plowing and/or chiseling) performed at the beginning of autumn. Subsequently a consisting number of interventions (tine harrowing, rotary harrowing and rotary

6th EWRS Workshop on Physical and Cultural Weed Control 30 Lillehammer, Norway, 8-10 March 2004
hoeing) for seed-bed preparation were carried out. Afterwards, the fields are subdivided in globlets using always 2WD or 4WD tractors with wide track (2,1 m), thus realizing a sort of “controlled traffic” system.
Before carrot planting, false seed-bed technique was always performed by means of the finger harrow. Crop planting was performed in both the farms both conventionally (5 strips/globlet with inter-row distance of 30 cm) and in the innovative way (10 single rows/globlet with inter-row distance of 18 cm). However, in both farms and years of test, neither the typology (hybrid F1 Nandor), nor the dose (2.500.000 seeds ha-1) of carrot seeds changed. In both the testing years sowing was carried out precociously (within the second decade of April) in the farm (1) and late (at the end of May) in the farm (2). Test methodology
In the two years period 2001-2002 the comparison between the conventional (C) and the innovative (I) techniques of planting and management of organic carrot was carried out in terms of both fresh roots yield and characterization of the carrot production. With this aim the carrots were subdivided in four market classes (extra, first category, second category and out of category) according to a specific UE rule (UE rule 730, 1999). In each plot (2 m wide and 25 m long) carrot yield was determined in 2 m2 isolated homogenous areas. Afterwards, each sample was subdivided in the above mentioned four market classes. A randomised block experimental design with four replicates was used.
In 2001 in order to evaluate the effectiveness of the various treatments, in both the farms, on single row planted carrot, the number and the species of weeds were determined before and after finger harrowing, after flaming, after precision hoeing and after the last hand weeding (at harvest). In 2002, the surveys were instead carried out both on innovative and conventional organic carrot, before and after all the treatments of weed control. In both the testing years carrot density (plants m-2) was also determined at emergence and at harvest.
In the two years period the working times, the fuel consumption and the work chains characteristics were recorded, in order to compare the total times and the costs connected with the use of the two tested managements of physical weed control in organic carrot. Results and discussion Operative machines performances and labour times
All the operative machines used for physical weed control in this experiment were coupled to a 2WD 48 kW tractor equipped with narrow tires and track of 2.1 m (in order to properly work on the globlet). However, the main characteristics of the work chains used in 2001 and 2002 are shown in tables 1 and 2 respectively. Finger harrow working depth was always low (3-4 cm), while its operative capacity was higher in 2001 and its working time and fuel consumption were higher in 2002. Flaming was carried out at a speed of 3 km h-1 in both testing years, while LPG pressure and consumption were higher in 2002. Precision hoeing was performed at a lower working depth in 2002 (as a consequence of the modification of the tines), while driving speed, working capacity, fuel consumption, etc. were similar in the two years of test.

6th EWRS Workshop on Physical and Cultural Weed Control 31 Lillehammer, Norway, 8-10 March 2004
Tab.1 Performances of the work chains used for physical weed control in carrot in 2001.
Characteristics Harrowing Flaming Hoeing Working width m 2,00 2,00 2,00 Working depth cm 3,30 - 4,90 Driving speed km h-1 7,60 3,00 2,25 Working capacity ha h-1 1,30 0,60 0,38 Total working time h ha-1 0,77 1,67 2,61 N. workers - 1 1 2 Tractor power kW 48 48 48 Engine load % 20 20 40 Fuel consumption kg ha-1 2,00 4,30 13,5 LPG pressure MPa - 0,20 - LPG consumption kg ha-1 - 40 -
Tab.2 Performances of the work chains used for physical weed control in carrot in 2002.
Characteristics Harrowing Flaming Hoeing Working width m 2,00 2,00 2,00 Working depth cm 4,10 - 2,90 Driving speed km h-1 4,60 2,40 1,80 Working capacity ha h-1 0,83 0,43 0,32 Total working time h ha-1 1,09 2,33 3,08 N. workers - 1 1 2 Tractor power kW 48 48 48 Engine load % 20 20 40 Fuel consumption kg ha-1 2,73 5,82 15,37 LPG pressure MPa - 0,30 - LPG consumption kg ha-1 - 64 -
Total labour times recorded in 2001-2002 for physical weed control performed with the
conventional (C) and the innovative (I) management of organic carrot in the two experimental farms, are shown in table 3. The influence of the time of use of the machines on the total working time was higher for (I) (12% on average) with respect to (C) (8% on average). Tab.3 Total labour time used for physical weed control of organic carrot managed with conventional and innovative systems in two farms of Fucino Valley in 2001/2002.
Carrot management Labour time (h ha-1) Farm (1) Farm (2) Average 2001 • Conventional 215 201 213
• Innovative 135 131 133 2002 • Conventional 168 91 184 • Innovative 166 54 110

6th EWRS Workshop on Physical and Cultural Weed Control 32 Lillehammer, Norway, 8-10 March 2004
Total labour times (mainly due to hand weeding) were lower in the farm (2) in 2002, independently of the performed carrot management, according to the realization of hand weeding of the more developed weed plants before precision hoeing, thus optimizing the performances of the tools used for intra-row weed control. The differences between the values of total labour time obtained in (I) and (C) management are clear and evident in farm (2), where (I) determined relevant reductions in both the testing years (35% in 2001 and 41% in 2002). In farm (1) this trend was recorded only in 2001, while in 2002 labour times were of the same order for both (I) and (C), according to the presence of weed plants at an advanced stage of development. Weed flora characterization and control
In 2001, in both the experimental farms, weed flora was mainly represented by Amaranthus spp. and Chenopodium album (L.) (with relative density ranging from 90 to 95%) and in a lower extent by other species, the most significant of which was Echinochloa crus galli (L.) (relative density of 10% in farm (2)). In 2002 weed flora composition was more differentiated in both the farms. The mainly represented species were Diplotaxis erucoides (L.), Chenopodium spp and Polygonum lapathifolium (L.) (with a relative density ranging from 65 to 90%). Tab.4 – Weed density and reduction measured in different periods of the growing cycle of carrot managed with the innovative system in 2001. In the same row, different letters indicate significant differences at P≤0,05 (Duncan’s Multiple Range test)
Period Weed density (plants m-2) Weed reduction (%) Farm (1) Farm (2) Farm (1) Farm (2) Before harrowing 233 a 184 b - - After harrowing 126 a 70 b 46 62 After flaming 82 a 33 b 35 53 At harvest 10 a 7 a 88 79 Total reduction - - 96 97
The values of weed density and weed reduction determined only on (I) management of carrot in
2001, in correspondence of all the performed treatments, are shown in table 4. The results emphasized that all the interventions were important in order to reach a high degree of weed control (that was in both the farms of about 95% with respect to the values of weed density recorded before false seed-bed). The values of weed density and weed reduction and increase (due to the emergence of new plants) determined before and after all the performed treatments on both (I) and (C) managements of carrot in 2002 in the two farms, are shown in tables 5 and 6. The observation of table 5 emphasized once again the importance and the need of all the performed treatments, but also the relevant increase of weed density (from 4 up to 7 times higher with respect to the value determined after flaming) caused by carrot sowing. Moreover, degrees of weed control being almost equal, some treatments showed to be more effective in (I) (flaming and second hoeing) and others in (C) (harrowing and first hoeing). The observation of table 6 also emphasized that the delay of sowing and the optimization of the sequence of treatments allowed to reach a weed control of about 100%.

6th EWRS Workshop on Physical and Cultural Weed Control 33 Lillehammer, Norway, 8-10 March 2004
Tab.5 – Weed density and reduction or increase measured in different periods of the growing cycle of carrot managed with the conventional and the innovative systems in the farm (1) in 2002. In the same row, different letters indicate significant differences at P≤0,05 (Duncan’s Multiple Range test)
Period Weed density (plants m-2) Weed reduction or increase (%) Conventional Innovative Conventional Innovative Before harrowing 100 a 100 a - - After harrowing 28 b 51 a - 72 - 49 After flaming 19 a 25 a - 32 - 51 Before 1st hoeing 157 a 127 a + 726 + 408 After 1st hoeing 18 b 48 a - 89 - 62 After 2nd hoeing + 2 hand weeding
4 a
6 a
- 78
- 88
Total reduction - - - 96 - 94 Tab.6 – Weed density and reduction or increase measured in different periods of the growing cycle of carrot managed with the conventional and the innovative systems in the farm (2) in 2002. In the same row, different letters indicate significant differences at P≤0,05 (Duncan’s Multiple Range test).
Period Weed density (plants m-2) Weed reduction or increase (%) Conventional Innovative Conventional Innovative Before harrowing 166 a 166 a - - After harrowing 22 a 28 a - 87 - 83 After flaming 6 a 7 a - 73 - 75 Before 1st hoeing 11 a 8 a + 83 + 14 After 1st hoeing + 1 hand weeding
8 a
2 b
- 27
- 75
Total reduction - - - 99,95 - 99,99
Intra-row weed reductions obtained in the two farms by means of the two different tools (vibrating tines and torsion weeder) connected to the precision hoeing machine are shown in table 7. The effectiveness was higher for both the tools in farm (2) were precision hoeing followed hand weeding. The difference between the two tools were not significant, although on average, the vibrating tines showed higher values of weed reduction with respect to the torsion weeder.

6th EWRS Workshop on Physical and Cultural Weed Control 34 Lillehammer, Norway, 8-10 March 2004
Tab.7 – Intra-row weed reduction obtained by means of two different tools used with the precision hoe on organic carrot planted in single row in 2002. There are no significant differences (Duncan’s Multiple Range test).
Experimental farm Intra-row weed reduction (%) Torsion weeder Vibrating tines Average Farm (1) 63,8 60,6 62,2 Farm (2) 75,0 87,5 81,3 Average 69,4 74,1 71,7
Carrot density and yield
Crop density at emergence and harvest, determined in both years and farms, are shown in table 8. In 2001 there were not significant differences between the values obtained with the two different managements of carrot. On the contrary, in 2002, (I) was characterized by significantly higher values of carrot density at both emergence and harvest, with respect to (C) management. Tab.8 – Carrot density at emergence and harvest obtained with conventional and innovative management in the two farms in the two testing years. In the same column, and for the same year, different letters indicate significant differences at P≤0,05 (Duncan’s Multiple Range test).
Carrot management Carrot density (plants m-2) Farm (1) Farm (2) Emergence Harvest Emergence Harvest 2001 • Conventional 154 a 135 a 141 a 129 a • Innovative 162 a 129 a 148 a 132 a 2002 • Conventional 156 b 140 b 82 b 73 b • Innovative 184 a 179 a 126 a 118 a
Tab.9 – Carrot yield as fresh roots (total and divided in the four market classes) obtained with the two different managements in farm (1) in 2001. In the same column, different letters indicate significant differences at P≤0,05 (Duncan’s Multiple Range test).
Carrot management Carrot yield (t ha-1) Total Extra Ist class 2nd class Out of class Innovative 75,9 a 0,0 b 27,5 a 35,7 a 12,7 a Conventional 77,5 a 2,1 a 26,6 a 35,5 a 13,3 a

6th EWRS Workshop on Physical and Cultural Weed Control 35 Lillehammer, Norway, 8-10 March 2004
Tab.10 – Carrot yield as fresh roots (total and divided in the four market classes) obtained with the two different managements in farm (2) in 2001. There are no significant differences (Duncan’s Multiple Range test).
Carrot management Carrot yield (t ha-1) Total Extra Ist class 2nd class Out of class Innovative 58,1 3,9 6,3 32,1 15,8 Conventional 57,4 2,0 6,7 34,7 14,0
Organic carrot yields (and roots division in the four market classes) obtained in both the tested
managements, are shown in tables 9 (2001 – farm (1)), 10 (2001 - farm (2)), 11 (2002 – farm (1)) and 12 (2002 – farm (2)). The observation of tables 9 and 10 emphasized that there were not significant differences between the values of yield obtained in (I) and (C) managements, with the exception of that of extra quality roots in farm (1) (tab.9). Tab.11 – Carrot yield as fresh roots (total and divided in the four market classes) obtained with the two different managements in farm (1) in 2002. In the same column, different letters indicate significant differences at P≤0,05 (Duncan’s Multiple Range test).
Carrot management Carrot yield (t ha-1) Total Extra Ist class 2nd class Out of class Innovative 119,3 a 2,9 a 25,3 a 73,5 a 17,6 a Conventional 91,8 b 3,0 a 22,0 a 50,9 b 16,0 a
Tab.12 – Carrot yield as fresh roots (total and divided in the four market classes) obtained with the two different managements in farm (2) in 2002. In the same column, different letters indicate significant differences at P≤0,05 (Duncan’s Multiple Range test).
Carrot management Carrot yield (t ha-1) Total Extra Ist class 2nd class Out of class Innovative 77,4 a 0,5 a 9,0 a 51,4 a 16,4 a Conventional 54,5 b 0,0 a 12,5 a 31,2 b 10,8 b
Carrot yields were on the contrary significantly higher in (I) management in both the farms in
2002 (with an average increase of about 35%) (tabs 11 and 12). Yield increase regarded mainly 2nd category carrots, although also the value of roots out of category was significantly higher in farm (2) (tab.12). Cost of physical weed control
In 2001, the total cost of physical weed control was lower of about 500 euro ha-1 in (I) with respect to (C) management, according to the lower use of labour for hand weeding (tab.13). In 2002 the costs were relevantly lower in farm (2) with respect to farm (1), according to the already mentioned optimization of the sequence of the interventions performed in post-emergence. Cost reduction was finally higher in (I) with respect to (C) management (more than 200 euro ha-1).

6th EWRS Workshop on Physical and Cultural Weed Control 36 Lillehammer, Norway, 8-10 March 2004
Tab.13 – Cost of physical weed control of organic carrot obtained with conventional and innovative management in the two farms of Fucino Valley in the two testing years.
Carrot management Cost of physical weed control (euro ha-1) Farm (1) Farm (2) Average 2001 • Conventional 1522 1435 1478
• Innovative 1026 1001 1013 2002 • Conventional 1243 741 992 • Innovative 1230 511 871
Conclusions
The experimental results obtained in the testing period 2000-2002 emphasized that there are very good prospects (and economic advantages) for the adoption of physical weed control of organic carrot in the Fucino Valley.
The strategy of physical weed control was gradually improved, according to the close definition of the techniques and the realizations of specific machines able to work properly in the environmental and operative conditions of cultivation of carrot in the Fucino Valley. Moreover, very simple changes in the sequence of the interventions (e.g. the realization of precision hoeing after hand weeding in post-emergence) seem to be connected with a relevant reduction of weed density and aggressiveness on one hand and labour time and cost on the other. Finally, the sowing of carrot in single row (that is really innovative in Fucino Valley) is connected with a higher effectiveness of post-emergence precision hoeing (allowing to perform a relevant intra-row weed control by means of vibrating tines or torsion weeder) and better yield results with respect to the conventional strip planting system. Acknowledgements
The authors want to thank very much for their precious collaboration and participation in the experimental work Mrs Roberta Del Sarto, Mr. Silvano Toniolo, Mr. Claudio Marchi, Mr. Alessandro Pannocchia, Mr. Calogero Plaia and Mr. Marco Parracone (technicians of Centro “E.Avanzi” of Pisa University), Mr. Guido Mancinelli, Mr. Valentino Alfonsi and Mr. Prospero Scafati (farmers of Fucino Valley) and, last but not least, Dr. Domenico Casaccia, Dr. Ernesto Recinelli and Dr. Paolo Verna (agronomists of ARSSA of Abruzzo Region). References ASCARD, J. (1990) Weed control in ecological vegetable farming. Proceedings of the Ecological
Agriculture NJF-Seminar 166, 178-184. ASCARD J. (1995) Thermal weed control by flaming: biological and technical aspects. Dissertation,
Dept. Agricultural Engineering, Swedish University of Agricultural Sciences, Sweden. CIANFARRA R., ARATARI A., BELMAGGIO S., RECINELLI E. & TUCCERI G. (2003) Filiera orticola.
Linee guida per lo sviluppo e la valorizzazione dell’orticoltura nella regione Abruzzo. ARSSA-Regione Abruzzo.

6th EWRS Workshop on Physical and Cultural Weed Control 37 Lillehammer, Norway, 8-10 March 2004
FOGELBERG, F. (1998) Physical weed control-intra-row brush weeding and photocontrol in carrots. PhD Dissertation, Dept. of Agricultural Engineering, Sweedish University of Agricultural Sciences, Alnarp.
FOGELBERG F. (1999) Night-time soil cultivation and intra-row brush weeding for weed control in carrots (Dacaus carota L.). Biological Agriculture and Horticulture, 17, 31-45.
INEA (2001) Le produzioni ortofrutticole. Annuario dell’agricoltura italiana 2001. INEA, Roma, 413-442.
ISMEA (2003) WWW.ismea.it MELANDER B (1998) Interaction between soil cultivation in darkness, flaming and brush weeding
when used for intra-row weed control in vegetables. Biological Agriculture and Horticulture, 16, 1-14.
MELANDER B. & HARTVIG P. (1995) Weed harrowing in seed onions. Proceedings 9th EWRS Symposium “Challenges for Weed Science in Changing Europe”, Budapest, 543-549.
PERUZZI A. (2003) Controllare le infestanti senza ricorrere alla chimica. Il Divulgatore, 10, 58 – 67. PERUZZI A. & RAFFAELLI M. (2000) Experimental test of selective flame weeding for different
spring summer crops in central Italy. Agricoltura Mediterranea Vol. 130, n. 2, 85-94. PERUZZI A.& RAFFAELLI M. (2001) Macchine per il controllo fisico delle infestanti: risultati di dieci
anni di sperimentazione. M.&M.A. 9, 45-58. PERUZZI A., DI CIOLO S. & RAFFAELLI M. (1996). An experimental test bench for the study of flame
weeding effects: first experimental results on rape plants (Sinapis alba L.). Proceedings of the AgEng ‘96 Conference, Madrid 23-26 September 1996, paper 96-A-122.
PERUZZI A., DI CIOLO S. & RAFFAELLI M. (1998a) - Effects of flaming on soyabean plants. Proceedings AgEng ‘98 International Conference on Agricultural Engineering, Oslo 24/28 August, 1998, 605-606.
PERUZZI A., RAFFAELLI M.& DI CIOLO S. (1998b) Effetti del pirodiserbo su piante di mais e girasole. L’Informatore Agrario 25, 53-58.
PERUZZI A., RAFFAELLI M. & DI CIOLO S. (1999) Tecniche per la produzione di olio di semi di girasole di alta qualità. Atti Convegno Nazionale A.I.I.A. – L’Innovazione Tecnologica per l’Agricoltura di precisione e la qualità produttiva, Grugliasco, 22/23 giugno 1999, 401-410.
PERUZZI A., DI CIOLO S., CECCATELLI M. & MELCHIORRE L. (1997). Banco prova per lo studio in ambiente controllato degli effetti del pirodiserbo. Primo contributo. Rivista di Ingegneria Agraria, 3, 136-149.
PERUZZI A., RAFFAELLI M., GINANNI M. & BORELLI M (2003a) - Physical weed control in organic carrot in the Fucino Valley (Italy). Proceedings of the 7 th EWRS Mediterranean Symposium, Adana (Turkey) 6-9 May 2003, 37-38.
PERUZZI A., RAFFAELLI M., GINANNI M., MAINARDI M., DEL SARTO R., BORELLI M., CASACCIA D. & RECINELLI E. (2002) Risultati di un triennio di sperimentazione per il controllo fisico delle infestanti della carota dell’altopiano del Fucino prodotta con il metodo biologico. Atti 2° Incontro Nazionale sulla carota Avezzano, 4 – 5 ottobre 2002.
PERUZZI A., GINANNI M., RAFFAELLI M., DI CIOLO S., DEL SARTO R., BORELLI M., PANNOCCHIA A. & GRONCHI P. (2003b) Il controllo delle infestanti su spinacio in coltivazione biologica. L’Informatore Agrario, 32, 40 – 44.
RADICS, L., GÀL I.& PUSZTAI P. (2002) Different combinations of weed management methods in organic carrot. 5th EWRS Workshop on Physical and Cultural Weed Control, Pisa 11-13 March 2002, 137-146.
RAFFAELLI M. & PERUZZI A. (2002) Sviluppo di una nuova macchina per il pirodiserbo: risultati di un biennio di sperimentazione su girasole. Rivista di Ingegneria Agraria, 2, 39-46.
RAFFAELLI M., PERUZZI A., GINANNI M. & DI CIOLO S. (2002a) Mechanical weed control in sunflower and soyabean crops using spring-tine harrow: results of two-year trials. Agricoltura Mediterranea, 132, 112-121.

6th EWRS Workshop on Physical and Cultural Weed Control 38 Lillehammer, Norway, 8-10 March 2004
RAFFAELLI M., BARBERI P., PERUZZI A. & GINANNI M. (2002b) Options for mechanical weed control in string bean – work parameters and crop yield. 5th EWRS Workshop on Physical and Cultural Weed Control, Pisa 11-13 March 2002, 119-124.
RAFFAELLI M., BARBERI P., PERUZZI A. & GINANNI M. (2002c) Options for mechanical weed control in string bean – effects on weeds. 5 th EWRS Workshop on Physical and Cultural Weed Control, Pisa 11-13 March 2002, 159-163.
UE Rule 730/99 (1999) Laying down the marketing standard for carrots. Official journal of the european communities, L93, 14-19.

6th EWRS Workshop on Physical and Cultural Weed Control 39 Lillehammer, Norway, 8-10 March 2004
Mulching compared to physical weed control measures in organically grown vegetables
H. Riley1, L. O. Brandsæter2 & G. Danielsberg3
1 Norwegian Crop Research Institute, Nes på Hedmark, Norway 2 Norwegian Crop Research Institute, Ås. Norway
3 Hedmark College, Hamar, Norway
Mulching vegetables with chopped plant material both supplies nutrients and suppresses weeds. In order to compare its effectiveness with other non-chemical means of weed control, a trial was performed with inter-row harrowing (twice), flaming (twice) and rotary brushing (three times) in white cabbage and beetroot. A control treatment that was weeded manually was included in the trial. The plots to which mulch (chopped cocksfoot, Dactylis glomerata) were applied were flamed once before mulching. A treatment in which the mulched plots were hand-weeded was included, in attempt to distinguish between nutrient and weed control effects. Highly significant yield effects were found in both vegetable crops. Relative to the control treatment, beet yields were 135% and 123% after mulching, with and without hand-weeding, respectively, whilst cabbage yields were 124% and 118%. Yields after inter-row harrowing were 79% for beet and 83% for cabbage, relative to hand-weeding. Comparable figures for brushing were 65% and 86% of the control, whilst the poorest yield results were obtained with flaming (40% and 62%), due to heat damage of the crop plants, particularly in the case of beetroot. As well as increasing crop yields, the use of chopped mulch also gave the greatest degree of weed control. Weed control on mulched plots was satisfactory throughout the growing season, probably due to the slow decay of the grass. Flaming gave the next best degree of weed control, while harrowing and brushing gave poorer weed control in this trial. As well as effects on total weed biomass, the different treatments also strongly influenced the weed flora composition. For instance, Erodium cicutarium dominated flamed plots, probably because of heat tolerance of this species, while the weed flora was more diverse in other plots. As mulching may be more expensive than other weed control methods, it is an important requirement that the benefits of mulching compensate for their additional cost. This study showed that chopped plant material prevents weed growth as well as supplying nutrients.

6th EWRS Workshop on Physical and Cultural Weed Control 40 Lillehammer, Norway, 8-10 March 2004
Crop-weed interactions and cultural and physical weed control

6th EWRS Workshop on Physical and Cultural Weed Control 41 Lillehammer, Norway, 8-10 March 2004
First results on the competitive ability of lentil (Lens culinaris) genotypes
F. Faustini, R. Paolini, F. Saccardo, P. Crinò & C. Mirabelli Dipartimento di Produzione Vegetale, University of Tuscia, Via S. Camillo de Lellis, 01100
Viterbo, Italy, [email protected] Introduction
Cultural means such as the growing of more competitive genotypes can enhance the effect of partially weed suppressive means like mechanical or reduced-rate chemical control (Lemerle et al., 1996). More competitive genotypes have been detected in barley (Didon, 2002), bread (Lemerle et al., 2001) and durum wheat (Paolini et al., 2002), but other crops need to be characterized by this point of view. Lentil (Lens culinaris Medik.) is an important protein source for human consumption. In Italy the growing of lentil declined in the last decades owing to the low yield potential and the tendency to lodging of locally grown populations. Erect, higher yielding genotypes have been recently developed, which may renew the interest for the crop. This study aimed to test the competitive ability of some of these genotypes, eligible to be registered as new varieties and introduced in sustainable cropping systems. Material and methods
A field study started at Viterbo in winter 2003, where in a split-plot design with three replicates in randomized blocks the following factors were applied: a) 10 lentil genotypes (plots); b) 2 levels of a natural weed infestation: absent or present (sub-plots). A weed stand in the crop absence per block was also grown. Lentil was drill-sown on 17 January to have a density of 200 plants m-2, and fertilized with 100 kg P2O5 ha-1. Sub-plots allocating the “weed infestation absent” level were kept weed-free. Beginning of flowering, insertion angle of the secondary branches to the main stem, plant height, percent of fertile and sterile pods, grains per pod, above-ground biomass and grain yield were determined on the crop at harvest. Beginning of flowering, plant height and biomass total and per species were determined on the weeds. The ratio of crop and weed relative biomass [.i.e. (Bcw/Bwc) /(Bc/Bw), with B as the biomass per unit area of crop or weeds competing with each other (cw or wc) or of the weed-free crop (c) or of the weed stand in the crop absence (w)] was log transformed to the competitive balance index Cb. Higher Cb values mean higher crop competitive ability. Results and discussion
Seven genotypes out of ten resulted to be less competitive than weeds (Cb < 0), mostly represented by Polygonum aviculare, Chenopodium album, Fallopia convolvulus, Cirsium arvense, Atriplex patula and Fumaria officinalis in order of abundance. Instead, three genotypes were more competitive than weeds (Cb > 0) and more competitive than the others as well. The same genotypes also showed the least yield decrease in the weeds presence (ranging from 4.5 to 7.1 % compared to an average of about 25.4 % for the others) and, given the extremely low precipitation during their whole growing cycle (105 mm), a reasonably good grain yield in the weed absence (ranging from 1.13 to 0.89 t ha-1 DM). Crop competitive ability resulted to be mainly related to the earliness of

6th EWRS Workshop on Physical and Cultural Weed Control 42 Lillehammer, Norway, 8-10 March 2004
flowering, which likely gave to lentil a higher competitive advantage against late emerging species (C. album and A. patula). Results suggest an interesting variability in the competitive ability of genotypes. In our conditions, earliness of flowering and an erect plant habit seemed to be the traits most related to crop competitive ability. References DIDON UME (2002) Journal of Agronomy & Crop Science 188, 176-184. LEMERLE D et al,. (1996) Weed Science 44, 634-639. LEMERLE D et al., (2001) Weed Research 41, 197-209. PAOLINI R et al., (2002) Proceedings 12th EWRS Symposium, 266-267.

6th EWRS Workshop on Physical and Cultural Weed Control 43 Lillehammer, Norway, 8-10 March 2004
Do control technologies substantially alter the large-scale patterns of weed occurrence?
C.M. Hammond1 & E.C. Luschei1
1University of Wisconsin – Madison Madison, WI 53706 USA
The association between physical and chemical weed control technologies and temporal changes in weed communities is both logical and well documented. There is a generally held belief that technologies selectively filter community composition from an environmentally determined species pool. We report on a landscape-scale survey in which we explore redefinition of the concept of agricultural system to include farmer attitudes and constraints. We hypothesize that, in practice, the performance of control technologies can substantially differ from theoretical optima for reasons that have nothing to do with the technologies themselves. In order to address our hypotheses, we collected data on weed seedbank composition, margin floral diversity and the farmer’s decision-making process. Field margin floral composition, which we use as a surrogate measure of the diversity of the local species pool, was collected from 70 sites in 6 counties spanning the breadth of the corn-producing portion of the state of Wisconsin. Field margins were surveyed in 2002, and adjacent field seedbanks were sampled from 30 fields in 2003 using elutriation techniques. In addition to information about soil, weather, and production history of the fields, farmers were asked to complete an extensive written survey that examined their attitudes about weeds and the use of cultural, physical and chemical weed control technologies. This survey shared many questions with a much more extensive statewide survey to ensure that the representativeness of sociological component of the sampled fields was representative of a larger group within the state of Wisconsin.
Anywhere from 11 to 33 agriculturally significant weed species were recorded in margins that ranged from 200 to more than 3300 meters in perimeter. The shapes of the field, which in some instances could strongly impact the realized efficacy of control technologies, had corrected perimeter-area ratios of 1.12 to 2.40. Particular life-history characteristics were associated with the land-use and structure directly adjacent. In particular, adjacent to forested land, many large-leaved perennials traded resources for physical protection from control measures. Over fifteen weeds had large-scale spatial distributions that were cosmopolitan; occurring in over half of fields sampled.
Even when accounting for the sizeable uncertainty in the seedbank sampling procedure, it was clear that weed communities were not regulated by efficacy of physical and chemical control technologies alone. While the logic that the type and efficacy of control technology exerts a selective influence on the weed community is unassailable, it is unclear how important the hypothetical selection pressure is in practice. For the case of Wisconsin production systems, implementation of control practices was sufficiently variable to allow for the prolonged persistence of a large set common agricultural weeds. Our study begs the question of whether we should consider technologies divorced from the socio-political milieu in which they will be used. We suggest that an understanding of environmental and ecological impact of technologies will require addressing this hidden dimension.

6th EWRS Workshop on Physical and Cultural Weed Control 44 Lillehammer, Norway, 8-10 March 2004
Effects of plant density and nitrogen fertilizer on the competitive ability of canola (Brassica napus L.) with weeds
N. M. Hosseini, H. M. Alizadeh & H. M. Ahmadi1 1 Respectively, assistant professors of Agronomy & formerly post-graduate student of weed science,
Dep. of Agronomy, College of Agriculture, Tehran University, Karaj – Iran Abstract
Effective weed control usually arises from a combination of cultural, mechanical and chemical applications. The cultural exercises comprise adequate soil fertility; optimum crop stands (proper seeding rate) and optimum sowing date. In due respect, an experiment as a factorial complete block design with 4 replications was conducted to determine the optimum plant density and nitrogen fertilizer levels in order to increase competitive ability of canola (Regent × Cobra; an inbred variety) with weeds. The treatments included four levels of plant density viz. 150, 190, 230, and 270 plants m-2, and four levels of nitrogen fertilizer viz. 0, 46, 92, and 138 Kg ha –1.
The results showed that the different levels of plant density and nitrogen fertilizer (N) had significant effects on canola’s leaf area index (LAI) and dry matter accumulation, as well as on weed’s dry matter at three stages of plant growth viz. rosette, stem elongation, and 50% flowering. Addition of N fertilizer resulted in increasing plant LAI and decreasing weeds dry matter. The density treatments of 150 and 270 plants m-2, along with 138 Kg ha–1 nitrogen showed the highest LAI at rosette and stem elongation stages. The LAI at different plant growth stages was an important factor in enhancing the competitive ability with weeds.
There were significant differences between different plant density and N fertilizer levels for traits such as plant height, pod bearing stem length, biomass and seed yield. Increasing plant density significantly decrease pod bearing stem length, and total pod numbers per plant (i.e. pod numbers in main and sub-branches), but increased plant height. The highest seed yield resulted at 190 plants m-
2 along with 138 nitrogen Kg ha–1. Finally, it is concluded that the increasing plant density as well as N fertilizer may increase the competitive ability of canola to suppress weeds. Introduction
Increasing trends in consumption, production and import of vegetable oils in Iran indicating that the consumption rate has been increased from 2.5 to 15.5 kg per head (from 1961 to 2002); consequently the total consumption from 50,000 tones reached to over 1,000,000 tones from which only about 10 percent is produced annually in the country. The production of oilseed crops such as soybean, canola, sunflower, safflower, sesame, cottonseed etc. have been increased slightly during the third national agricultural plan, and since 1996 there have been a number of government organized mission to promote the use of canola oil in Iran (Personal communication).
However, the growing conditions suggest that limited amount of canola could be produced due to certain constrains including the improved sowing seed, optimum stands, proper seeding date, weed and fertilizer management, proper harvesting machinery etc. Among these constrains weeds are one of the important factor in limiting canola production in many countries. Weeds have direct effects on seed yield and quality of refined oils. The other factor is the crop stands that can affect the seedling establishment, canopy development and total dry matter accumulation during canola growing season. Crop stands can also affect weed population and its growth. The optimum seed requirement for canola production requires from 2.4 – 5.6 Kg ha-1 which varies depending upon

6th EWRS Workshop on Physical and Cultural Weed Control 45 Lillehammer, Norway, 8-10 March 2004
land preparation, method of seed sowing, environmental conditions, and other reducing crop density factors such as weed infestation and birds damage (Malek Ahmadi, 2003).
The weed competition with canola reduced crop growth, leaf area and subsequently increased infertile flowers and pods (Tomass, 1992). Moreover, the weed competition and crop loss in winter-sown canola, with slow growing rate, as compared with spring - sown would be more sever. Therefore, the weed control at initial growth stages is indispensable for gaining higher seed yield of canola (Blackshaw, 1993). The most notorious weed species in winter-sown canola reported in north Europe (Tomass, 1992), included wild mustard (Sinapis arvensis), foxtail (Stelaria media), bedstraw (Galium tricoranthum danay) and lamb squarters (Chenopodium album). Esser et al. (1999) in an experiment examined the weed competition effects on canola and showed that white mustard (Sinapis alba) had the biggest affect in all treatments. Similarly, the competition ability of weeds on canola was measured by weeds biomass. David et al. (1999) studied the effect of weed seeds of Brassica family, included wild mustard (Brassica kaber), black mustard (Brassica nigra), rapeseed mustard (Brassica rapa), shepherd purse (Capsulla bursa – pastoris), tansy mustard (Descurainia sophis), flix weed (Sisymbrium altissimum) and fan weed (Thelapsi arvensis), on quality of canola oil and seed cake and concluded that the presence of at the most two percent of weed seeds in canola seed would reduce considerably the quality of oil and seed cake.
Fathi et al. (2002) reported that increasing nitrogen fertilizer and plant density caused boosting seed yield in colza and the highest yield per hectare resulted from 225 kg N ha-1 and plant density of 90 plants per meter square. Salehian et al. (2002) showed that plant density significantly affected the number of pods, secondary branches and seeds per plant. The maximum and minimum pods and seeds per plant obtained at 110 and 50 plants m-2, respectively. However, the maximum and minimum number of secondary branches achieved at 50 and 110 plants m-2. Leach et al. (1998) stated that increasing plant population to 110 plants m-2 decreased pods and number of branches significantly. Prasad & Shakla (1991) concluded that the canola seed yield was affected by the interaction of plant density and nitrogen fertilizer, in which with increasing plant density and nitrogen levels, the optimal seed yield could be achieved.
Hence, considering the expansion of canola acreage in Iran and presuming the accessibility of plant population and nitrogen fertilizer inputs more readily to farmers this study was performed. Materials and Methods Experimental site
The experiment was conducted at Karaj (Iran; Lat. 35°48´N; Long. 50°57´E; Alt. 1313m). Climatically, the area is in the semi – arid temperate zone with a well-defined cold and hot summer. Average rainfall is 243 mm, occurring mostly between November-February. The soil was loam with 0.05% total nitrogen, 7.4 and 180 ppm available phosphorus (P) and potassium (K), respectively. Soil samples were taken for analysis before the land preparation and were fertilized based on soil test recommendation with the basal dose of P (70 kg h-1 P2O5) and K (75 kg h-1 K2O).
Experiment
Plant population treatments comprised 150,190, 230 and 270 plants m-2 that were maintained by using the seed rates of 6, 8, 10 and 12 kg h-1, respectively. Nitrogen fertilizer included zero, 46, 92 and 138 kg N h-1 applied in the form of urea (46%N) in three splits at planting, stem elongation and flowering stages. The design was factorial experiment based on randomized complete block design with four replications. Sowing was performed on 29 September 2001 and harvesting date was 14 June 2002. Each experimental unit comprised four adjacent rows 5 m long with 0.6 m mid-furrow to mid – furrow, separated by two fallow ridges as a border on each side to avoid nutrient leakage. The canola cultivar used was an inbred line named Regent * cobra.

6th EWRS Workshop on Physical and Cultural Weed Control 46 Lillehammer, Norway, 8-10 March 2004
After land leveling and furrow preparation the plots were irrigated using furrow irrigation method (with siphon) and subsequent irrigation was applied every 10 days before rosette in autumn and every 7-8 days in spring season. During growing season no insect pests and diseases were observed. The data were collected separately for plants and weeds. Traits such as plant height (cm), pods per plant, seed per pods measured by selecting 10 plants at random in a plot. When sampling for total dry matter, seed yield and other yield attributes, a 3.0 m long harvest sample from the two middle rows was taken. To obtain a frequent measure of leaf area (LAI) and total aboveground dry matter (DM), plant samples were taken from the two center rows of each plot by a quad rate of 0.25 m at three growth stages (rosette, stem elongation and flowering). Similarly, for weed count, identification and dry matter accumulation sampling were taken at these plant stages. Statistical analysis
Analysis of variance was performed with MSTAT-C a computer software package (Michigan State University, 1989 supplier). Main effects and interactions were tested using the Duncan’s multiple range tests. Results & Discussion
The analysis of variance for canola seed yield and other traits (Table 1) at different levels of plant density and nitrogen showed that these two agronomic factors could enhance canola yield and yield attributes significantly (except oil percentage). The interaction effects of plant density and nitrogen were also significant except for pods per plant and oil percentage (Table 1).
Similarly, the increased plant density and nitrogen levels rendered a significant increase in DM accumulation and LAI of canola at three growth stages (Table 2). The highest DM accumulation at rosette stage (Fig. 1) was recorded at density of 270 plants m-2 for 92 kg N ha-1 (d4n2) with 343.4 g m-2. This trend was approximately observed for stem elongation and 50% flowering stages (Figs. 2 & 3). The lower density of 150 plants m-2 with no nitrogen application (d1n0) had the lowest DM accumulations at these growth stages. The increased DM accumulation in canola together with addition of plant density and nitrogen levels has been resulted from a rapid canopy development, especially during the stem elongation (vegetative growth). The LAI at this stage as compared to 50% flowering stage was greater at higher plant density (Fig. 4) and nitrogen levels (Fig. 5), which might be due to closer canopy, light intercept prevention and leaves senescence at higher plant densities. The treatment combination of 150 plants m-2 along with no nitrogen (d1n0) produced the lowest LAI at all growth stages, whereas the addition of plant density (d3 & d4) and nitrogen levels (n2 & n3) had higher LAI.
The increasing LAI in d1n3 have been possibly resulted from nitrogen fertilizer (Fig.5) whereas, in d4n3 the increasing LAI might be from higher plant densities (Fig 4). Cheema et al. (2001) reported that the increasing application of N from 90 to 120 kg ha-1 produced higher LAI as compared to check (No fertilizer) and the lower levels of nitrogen. Salehian et al. (2002) showed that the highest plant density (i.e. 110 plants m-2) produced the highest DM and LAI.
Linqisted & Mortensen (1998) measured the LAI and photosynthetic photon flux density (PPFD) in two old and two new corn hybrid and reviewed the suppression ability of these hybrids on velvetleaf (Abutilon theophrasti). The hybrids that produced a higher PPED had a good suppression effects on velvetleaf growth & development. Therefore, they suggested that optimum LAI and PPED could be utilized in integrated weed management programmed
The analysis of variance of weed dry weight at different plant growth stages (Table 3) revealed the significant effects of plant density and nitrogen fertilizer. The main effect treatments at these crop stages, was indicated a reduction in weed dry weight (g m-2) due to the addition of plant density (Fig. 6) and nitrogen fertilizer (Fig. 7). The reduction trend in weed dry weight could be

6th EWRS Workshop on Physical and Cultural Weed Control 47 Lillehammer, Norway, 8-10 March 2004
from the increased competition ability of canola plants, due to more and rapid canopy developments, in such a way that the density of 270 plants m-2 and application of 138 kg N ha-1 (d4n3) rendered the highest weed DM accumulation and the treatment of 150 plants m-2 with no nitrogen fertilizer (d1n0) gave the highest weed dry weight accumulations.
Donovan (1994) reported that the canola density of 300 plants m-2 significantly reduced the weed adverse effects on yield, and further decrease the weed DM. The figures 6 & 7 revealed that the weed DM at later stages of canola (e.g. flowering stage) would be higher as compared to the earlier stages; consequently the early weed control measures in the field would curtail the yield loss. In this experiment with the help of these cultural practices, such as the increasing plant density and nitrogen levels, the weed DM has been drastically reduced; especially at 50% flowering stage the weed DM reduction was two fold with d4 & n3 as compared to d1 & n0 (Figs. 6 & 7).
Paolini et al. (1999) stated that if certain weed control methods in growing canola is not possible, then the application of N could bring about an effective weed control due to a rapid crop growth & enhance canopy development. These workers also stated that the competition ability of sunflower with weeds depended upon the crop biomass at different growth stages. Similarly, narrow crop spacing (higher plant density) in canola could suppress weeds and their growth (Donovan, 1994). In present experiment, the following weed species such as wild oats (Avena fatua), lamb squarters (Chenopodium album), wild mustard (Brassica arvensis), garlic mustard (Sisymbrium altissimum), shepherd purse (Capsulla bursa – pastoris), foxtail, (Stellaria media), sow thistle (Sanchus arvensis), bedstraw (Galium tricorantum danay), red root amaranth (Amaranthus retloflexus) and running mallow (Malva rotundifolia) were identified in the field. Out of these species the wild oats, running mallow, garlic mustard and sow thistle had more density and kept on their competition with canola plants. At three growth stages, the increasing plant density reduced the relative density of garlic mustard; running mallow and sow thistle significantly (the data are not presented), however the relative density of wild oats was not affected. The effect of nitrogen fertilizer and the interaction effects of plant density and nitrogen levels on relative density of these weeds were not significant.
The treatment effects on canola height showed (Fig. 8) that combination of 270 plants m-2 with 138 kg N ha-1 had the tallest plant, mainly due to plant competition and higher nitrogen levels. Whereas, the lowest plant density with no fertilizer (d1n0 = 150 plants m-2 with zero N) produced the shortest plant stature. Norris et al. (1996) studied the effects of tomato spatial arrangement and population density on barnyard grass (Echinochloa cruss-galli) concluded that the high shading capacity of tall plant of tomato reduced the height and growth of barnyard grass. Our study also showed that the weed DM (Figs. 6 & 7) reduced due to competition and shading effects of tall stature plants at higher density as well as nitrogen levels.
With increasing plant density along with nitrogen levels the canola seed yield increased (Fig. 10), but it was maximized at d2n3 (190 plants m-2 + 138 kg N ha-1) and minimized at d1n0 (150 plants m-2 + zero N). Fathi et al. (200) has reported a higher canola seed yield with addition of plant density at 90 plants m-2 + 225 kg N ha-1. Here, the higher seed yield was achieved at 190 plants + 138 kg N ha-1 that was not significantly different with 190 plants m-2 + 92 kg N ha-1 (Fig 10).
The increasing plant density reduced the pods number per plant (Fig 9), whereas addition of nitrogen increased pods per plant but not significantly. Cheema et al. (2001) has reported that the increased canola seed yield was mainly due to the increased pods per plant; but in contrast to this result here the higher densities resulted in lower pods per plant (Fig. 9) and higher seed yield (Fig. 10); and the increased canola seed yield was not correlated with pods per plant.
On the whole, the results revealed that higher plant density and addition of nitrogen could enhance the canola seed yield and its attributes, however it seemed that the canola crop is to be sensitive to higher plant densities. Granted that the LAI & DM increased with increasing plant density at different growth stages and resulted in reduced weed dry matter accumulation, yet maximum canola seed yield in this study was achieved at 190 plants m-2.

6th EWRS Workshop on Physical and Cultural Weed Control 48 Lillehammer, Norway, 8-10 March 2004
Table 1. Analysis of variances showing the effects of plant density and nitrogen treatments on canola seed yield and other traits.
Mean square S. O. V. d. f. Plant
height Pods
per plant 1000 seed
weight Seed yield
Oil percentage
Replication 3 6.17 ns 359.7 ns 0.004 ns 27790.7 ns 2.7 ns
Plant density (D) 3 517.4 ** 11200.7 ** 0.156 ** 433316.0 ** 3.6 ns
Nitrogen fertilizer (N) 3 806.5 ** 592.7 * 0.211 ** 716825.2 ** 5.5 ns
Interaction (D*N) 9 268.3 ** 310.9 ns 0.051 ** 205970.1 ** 5.0 ns
Errors 45 7.5 174.9 0.009 26160.8 2.8
Mean 173.7 179.4 22.2 3109.3 45.1
C.V. % 106 7.3 2.3 5.2 3.7
S.E. 2.74 13.22 0.045 161.74 1.67
ns, * and ** are shown, respectively the non – significant and significant differences at 5 and 1 percent level. Table 2. Analysis of variances indicating the effects of plant density and nitrogen treatments on canola leaf area index and total dry matter (g m-2) at three growth stages.
Mean square
Rosette stage Stem elongation stage 50% Flowering stage S.O.V. d. f.
LAI D.M. LAI D.M. LAI D.M.
Replication 3 0.02 ns 4.26 ns 0.02 ns 8. 95 ns 0.02 ns 26.44 ns
Plant density (D) 3 2.25 ** 55.48 ** 7.09 ** 497.57 ** 3.58 ** 1499.83 **
Nitrogen fertilizer (N) 3 1.62 ** 35.81 ** 1.48 ** 43.71 ** 1.71 ** 163.60 **
Interaction (D*N) 9 0.43 ** 15.17 * 0.19 * 15.24 ** 0.64 ** 39.56 *
Errors 45 0.03 4.04 0.07 5.28 0.05 20.75
Mean 3.03 262.0 3.87 406.3 3.41 2349.8
C. V. % 6.1 15.3 7.1 13.0 6.7 13.5
S.E. 0.173 2.001 0.264 2.298 0.224 4.55
ns, * and ** are shown, respectively the non – significant and significant differences at 5 and 1 percent level.

6th EWRS Workshop on Physical and Cultural Weed Control 49 Lillehammer, Norway, 8-10 March 2004
Table 3. Analysis of variance presenting the effects of plant density and nitrogen treatments on weed dry matter accumulation at three growth stages of canola.
Mean square S.O.V d. f. Rosette stage Stem elongation stage 50% flowering stage
Replication 3 0.001ns 0.001 ns 0.004 ns
Plant density (D) 3 0.009** 0.078** 0.234**
Nitrogen fertilizer (N) 3 0.006** 0.007** 0.026**
Interaction (D * N) 9 0.002** 0.002** 0.006 ns
Error 45 0.001 0.001 0.003
Mean 0.164 0.221 0.423
C.V. % 70.8 68.0 74.0
S.E. 0.032 0.032 0.055
ns, * and ** are shown, respectively the non – significant and significant differences at 5 and 1 percent level.
Fig. 1. Interaction effects of plant density and nitrogen levels on canola dry w t. at rosette stage
de cdecde
f
abbcdcde
e
aba
cdee
bc abbc
de
0
100
200
300
400
d1 d2 d3 d4Plant density
Can
ola
dry
wt.
(g m
-2) n0
n1
n2
n3
Fig. 2. Interaction effects of plant density and nitrogen levels on canola dry w t. at stem elongation stage
de cd
i hicd
hf
bcg
faba
g efa
0
100
200
300
400
500
d1 d2 d3 d4
Plant density
Can
ola
dry
wt.
(g m
-2) n0
n1
n2
n3

6th EWRS Workshop on Physical and Cultural Weed Control 50 Lillehammer, Norway, 8-10 March 2004
Fig. 3. Interaction effects of plant density and nitrogen levels on canola dry w t. at 50% flowering stage
i i hibcde
fghi ghcde
bcdef ef efg
abbc bcdefgh
a
0500
100015002000250030003500
d1 d2 d3 d4
Plant densityd1 = 150 plants m-2 n0 = 0 Kg N ha-1
d2 = 190 plants m-2 n1 = 46 Kg N ha-1
d3 = 230 plants m-2 n2 = 92 Kg N ha-1
d4 = 270 plants m -2 n3 = 138 Kg N ha-1
Can
ola
dry
wt.
(g m
-2) n0
n1
n2
n3
Fig. 4. Main effects of plant density on leaf area index of canola at different growth stages
0
1
2
3
4
5
d1 d2 d3 d4
Plant density
d1 = 150 plants m -2 d2 = 190 plants m -2
d3 = 230 plants m -2 d4 = 270 plants m -2
Leaf
are
a in
dex
LAI at rosette LAI at stem elongation LAI at 50% flow ering

6th EWRS Workshop on Physical and Cultural Weed Control 51 Lillehammer, Norway, 8-10 March 2004
Fig. 5. Main effects of nitrogen fertilizer on leaf area index of canola at different grow th stages
0
1
2
3
4
5
n0 n1 n2 n3Nitrogen levels
n0 = 0 Kg N ha-1 n1 = 46 Kg N ha-1
n2 = 92 Kg N ha-1 n3 = 138 Kg N ha-1
Leaf
are
a in
dex
LAI at rosette LAI at stem elongation LAI at 50% f low ering
Fig. 6. Main effects of plant density on w eed dry matter accumulation at different stages of canola
0.000.100.200.300.400.500.60
0.70
d1 d2 d3 d4
Plant density
d1 = 150 plants m-2 d2 = 190 plants m-2
d3 = 230 plants m-2 d4 = 270 plants m-2
Wee
d dr
y m
atte
r acc
umul
atio
n (g
m-2)
w eed dry w t. at rosette w eed dry w t. at stem elongation w eed dry w t. at 50% f low ering

6th EWRS Workshop on Physical and Cultural Weed Control 52 Lillehammer, Norway, 8-10 March 2004
Fig. 7. Main effects of nitrogen levels on weed dry matter accumulation at different stages of canola
0
0.2
0.4
0.6
0.8
n0 n1 n2 n3Nitrogen levels
n0 = 0 Kg N ha-1 n1 = 46 Kg N ha-1
n2 = 92 Kg N ha-1 n3 = 138 Kg N ha-1
Wee
d dr
y m
atte
r acc
umul
atio
n (g
m-2)
w eed dry w t. at rosette w eed dry w t. at stem elongation w eed dry w t. at 50% f low ering
Fig. 8. Interaction effects of plant density and nitrogen levels on canola height
ghi hi kjk
fghi defg jkjkefgh c b
j ij cd c a
0
50
100
150
200
250
d1 d2 d3 d4
Plant density
Plan
t hei
ght (
cm)
n0 n1n2n3
Fig. 9. Main effects of plant density and nitrogen levels on canola pods number per plant
050
100150200250
d1 d2 d3 d4 n0 n1 n2 n3 Treatments
Pods
per
pla
nt

6th EWRS Workshop on Physical and Cultural Weed Control 53 Lillehammer, Norway, 8-10 March 2004
Fig. 10. Interaction effects of plant density and nitrogen levels on canola seed yield
0
1000
2000
3000
4000
5000
d1 d2 d3 d4Plant density
Seed
yie
ld (k
g ha
-1)
n0
n1
n2
n3
d1 = 150 plants m-2 n0 = 0 Kg N ha-1
d2 = 190 plants m-2 n1 = 46 Kg N ha-1
d3 = 230 plants m-2 n2 = 92 Kg N ha-1
d4 = 270 plants m-2 n3 = 138 Kg N ha-1
Acknowledgements
We would like to thanks our partner Dr. AH SHIRANI-RAD the academic member of oilseed research department of the Institute of plant & Seed Improvement, Karaj-IRAN for his scientific contributions. I feel indebted to Mr. AH NASSERCHIAN and Mrs. A RASOULI for their helps in preparation of the manuscript. Dean of Research of Tehran University has supported the research fund. References BLACKSHOW R E (1993). Safflower (Cartamus tinctorius) density and row spacing effects on
competition with green foxtail (Setaria viridis) Weed Sci 41 (3), 403-405. CHEEMA M A, MALIK M A, HUSSAIN A, SHAH S H & BASRA S M A (1997). Effect of time and rate
of nitrogen and phosphorus application on the growth and the seed and oil yields of canola (Brassica napus) Journal of Agricultural and Crop Sci 186 (2), pp 103.
DONOVAN O J (1994). Plant density influences Tartary buckwheat (Fagopyrum tataricum) interference in field crops. Weed Technology 8 (2), 311-316.
FATHI G, BANI SAEIDI A, SIADAT S A & EBRAHIMPOUR F (2002). Effect of different levels of nitrogen fertilizer and plant density on seed yield of colza cv. PF 7045 under Khuzestan province conditions. Scientific J. Agriculture Shahid Chamran University, Ahwaz (Iran) 25 (1), 43-58.
LEACH J, STEVENSEN H & RENBOW A J (1998). Effect of high plant population on growth and yield of winter rapeseed oil. J. Agricultural Cambridge Science 132, 173-180.
LINQISTED J L & MORTENSEN D A (1998). Tolerance of velvetleaf (Abutilon theophrasti) suppressive ability of two old and two new modern corn (Zea mays) hybrids. Weed Sci. 46, 569 – 574.
NORRIS R F, CLYDE L E, MARCEL R & AKEY W C (2001). Spatial arrangement, density and competition between barnyard grass (Echinochloa cruss-galli) and tomato. 1. Crop growth and yield. Weed Science 49, 61-68.

6th EWRS Workshop on Physical and Cultural Weed Control 54 Lillehammer, Norway, 8-10 March 2004
MALEK AHMADI H (2003). Effects of plant density and nitrogen fertilizer on competition ability of canola (Brassica napus L.) with weeds. M. Sc. Thesis in weed Science. College of Agriculture, Tehran University, Karaj - Iran.
PAOLINI P, FROUD W & DUGLIA D (1999). Competition between sugarbeet and (Sinapis arvensis) & (Chenopodium album) as affected by time of nitrogen fertilizer. Weed Research 19, 425-432.
PRASAD S & SHAKLA D N (1991). The response of nitrogen and plant population on yield, percent oil seed of canola (Brassica napus L.). Canadian J. Plant Sci. 38 (3), 283-291.
SALEHIAN H, RAFIEY M, FATHI G & SIADAT S A (2002). Effect of plant density on growth and seed yield of colza varieties under Andimeshk conditions. Proceeding of the 7th Iranian crop sciences congress. Karaj - Iran 24-26thAugust, 2002.

6th EWRS Workshop on Physical and Cultural Weed Control 55 Lillehammer, Norway, 8-10 March 2004
The sensitivity of field peas (Pisum sativum L.) to weed harrowing
H. L. F. Larsen1 & C. Andreasen2 Department of Agricultural Sciences, The Royal Veterinary and Agricultural University,
Thorvaldsensvej 40, DK-1871 Frederiksberg C, Denmark,1 [email protected], 2 [email protected]
Introduction Field pea (Pisum sativum L.) is an important crop in organic farming because of its nitrogen
fixation ability, and the high protein content in the seeds. Field peas have low competitive ability and therefore weed harrowing is often necessary. A field experiment was conducted to investigate sensitivity of field pea to weed harrowing. Materials and Method
The field experiment was designed with 4 replications. Treatments were: 1. Untreated; 2. Harrowed at stage 004 (emergence, stages according to Knott (1987)); 3. Harrowed at stages 004 + 102 (2 nodes); 4. Harrowed at stages 004 + 104 (4 nodes). One half of the harrowed plots were treated with herbicide to avoid mixing the effects of the harrowing and the effect of the competi-tion from the remaining weed plants. During the growth season the height of the stands was measured. The max-imum height was estimated using a model fitting the height of the stands as a function of degree days (Larsen, 2004). Results and discussion
Both seed yield and height of the crop were affected by the harrowing (Fig. 1). The sensitivity in stage 004 (Fig. 2) resulted in yield loss and a reduced height (Fig. 1).
Following harrowing in stage 102 (Fig. 2) or 104 did not result in further yield loss or smaller
stands (Fig. 1). This indicates less sensitivity of field peas to harrowing in stage 102 and 104 compared to stage 004.
Additionally, there was relationship between maximum height (h) and seed yield (y) (h = 0.27y + 26.02) (Fig. 3). The slope was significantly different from 0 (P = 0.017). Thus, maximum stand height that appeared late in June seems to indicate the yield level at harvest time.

6th EWRS Workshop on Physical and Cultural Weed Control 56 Lillehammer, Norway, 8-10 March 2004
Figure 1. Yields (A) and maximum height (B) for each treatment in the experiment. 95% confidence intervals marked with bars. Figure 2. A: Peas before harrowing in stage 004. B: Peas after harrowing in stage 004. C: Peas before harrowing in stage 102. D: Peas after harrowing in stage 102.
A
B
0
1020
30
40
5060
70
Hkg
seed
s per
ha
Herbicide + Harrowed -
Herbicide - Harrowed -
Herbicide +Harrowed +Stage 004
Herbicide + Harrowed + Stage 004,102
Herbicide + Harrowed + Stage 004,104
01 02 03 04 05 06 07 08 09 0
1 0 0
Herbicide + Harrowed -
Herbicide - Harrowed -
Herbicide +Harrowed +Stage 004
Herbicide + Harrowed + Stage 004,102
Herbicide + Harrowed + Stage 004,104
Max
imum
hei
ght (
cm)
D
BA
C

6th EWRS Workshop on Physical and Cultural Weed Control 57 Lillehammer, Norway, 8-10 March 2004
Figure 3. Yield in relation to height for each treatment in the experiment. References KNOTT CM (1987) A key for stages of development of the pea (Pisum sativum L.). Annals of
Applied Biology 111, 233-244. LARSEN HLF (2004) The sensitivity of field peas (Pisum sativum L.) to weed harrowing and the
competition ability of field peas against weeds. M.Sc. Thesis. Department of Agricultural Sciences, The Royal Veterinary and Agricultural University, Thorvaldsensvej 40, DK-1871 Frederiksberg C, Copenhagen, Denmark. 149 pp.
Hkg
seed
s per
ha
Maximum height (cm)
40
45
50
55
60
60 70 80 90 100 110
A

6th EWRS Workshop on Physical and Cultural Weed Control 58 Lillehammer, Norway, 8-10 March 2004
Composition of weed floras in different agricultural management systems within the European climatic gradient
L. Radics1, M. Glemnitz2, J. Hoffmann3 & Gy. Czimber4 1 Department of Ecological and Sustainable Production Systems, University of Economy and Public
Administration, Budapest, Hungary, 2 Institute for Land Use Systems and Landscape Ecology, Centre for Agricultural Landscape and
Land Use Research, Müncheberg, Germany, 3 Institute of Crop and Grassland Research, Federal Agricultural Research Centre, Braunschweig,
Germany, 4 Department of Botany, University of West Hungary, Mosonmagyaróvár, Hungary.
Abstract
Current paper presents the first results of field investigations on weed flora compositions along a climate gradient from South to North Europe. The field investigations have been carried out between 1999 and 2003 in eight regions situated in a climate gradient which reached from South Italy, via Hungary, Germany and Sweden up to Finland. The investigations on the weed flora were designed to characterise i.) the regional differences in the weed flora composition along the climate gradient, not only in terms of species diversity and weed flora composition but also for the dominance structure and some functional groups within the weed flora and ii.) to analyse the influence of different land use types on it. For identifying the impact of land use, we have included weed surveys on three types of arable fields within every region: i.) cereals under conventional/ integrated farming; ii.) cereals under extensive use/ ecological farming and iii.) fallow fields / set aside fields.
We have found at all nearly 700 weed species in the eight selected regions. The number of weed species decreased from more than 400 in South-Europe to 130 in Northern Europe. Species richness on fields under extensive use/ ecological farming was in average higher by 50-70 % than on fields under conventional/ integrated use. Beside the differences in diversity, we have observed different patterns of species response on climate conditions. One group of them, probably one of the most problematic from the land users point of view, were species occurring according the whole length of the climate transect. This group was mainly related to cereal fields under conventional/ integrated land use. Species of special interest for nature protection or for use as plant genetic resource could also been found. But those species were mostly restricted to particular regions or fields of extensive/ ecological land use type. Introduction
Arable land is been used by nearly 10-15 % of the overall plant diversity as main habitat (Hanf, 1982). Decreases in flora diversity on arable land have been observed throughout Europe in the last three decades (Erviö and Salonen, 1987; Hilbig and Bachthaler, 1992; Andreasen et al., 1996; Tóth et al., 1999; Montemurro and Viaggiani, 2000). In some regions, more than one-third of the entire species inventory has been categorised as extinct, endangered or rare (Schneider et al., 1994; Györffy et al., 1995). Despite of a different perception within the society, this rate of decline is comparable to that rate, we can notice in overall biodiversity (Wilcove et al., 1998). Species, which are most dramatically impacted, are often specialists, e.g. - those adapted to chalky, acidic and wet soil conditions (Hilbig and Bachthaler, 1992) or species with specific climatic or site requirements as well as species with limited dispersal abilities. As species richness decreases through a loss of

6th EWRS Workshop on Physical and Cultural Weed Control 59 Lillehammer, Norway, 8-10 March 2004
specialists, the average cover of wildlife plants may remain unchanged due to the increased dominance of a few species (Györffy et al., 1995) or the invasion of new species (neophytes). Both trends, the disappearance of site adapted species or species with regional limited occurrence and the introduction of new species may lead to a loss in regional specificity and a homogenisation of floras on arable land across Europe.
The occurrence of many of the weed species depend on specific farming systems to maintain suitable habitat conditions. Taking into account the technical, cultural and societal development over time, the choice of technology in agriculture is still the most important tool to prevent wildlife floras diversity and nativeness on arable land. A number of studies have shown the benefits of e.g. organic farming systems on the diversity of wildlife plants on arable land (Moreby et. al., 1994; Frieben and Köpke, 1996). Using proper land use systems and adjusting land use practices will support first those plants, which have significantly declined in the recent years (Azeez, 2000).
To balance ecological effects against economic restrictions on arable land, comparative studies about the interactions between environmental conditions (e.g. changing climate) and different land use intensity are lacking. Complex ecological assessments need to be firmly based on reliable, consistent, comprehensive data. Determining the status of floras on arable land is the necessary basis for further analyses and evaluations as well as for create awareness and call the attention of decision makers, stakeholders and society on the degree of vulnerability of arable ecosystems. Focusing on further investigations mainly on the interactions between land use and climate changes, we have started field investigations in climatically different regions in Europe in 1999. Our first aims were to get impressions on the general trends in Europe by creating comparable datasets. Based on this, we have tried to identify species or communities characteristics, which might be used as indicators for specific climatic and land use conditions. Further on the data should be analysed with regard on site requirements, ecological importance, weed control relevance and functional aspects of the single species. This paper presents only some first results and trends. Material and Methods Area selection
The stations for investigations were pre-selected in a way to be situated on locations with differences in average annual air temperature in steps of 1,5 K (in 2 metres height). According to the predictions from the IPCC (1996) for a temperature increase of between 1,3 - 4,5 °K in the next 100 years, we have decided to use the lower value of these predictions as basis for the pre-selection of investigational areas. Estimates on possible effects of climate change should be achieved based on this design by using the space-for-time-substitution-method (Figure 1; Table 1). Figure 1: Arrangement of the investigation areas on the north-south climatic gradients (for details see table1)
Lecce
Roma
Milano
Müncheberg
Vaasa
Uppsala
Osby

6th EWRS Workshop on Physical and Cultural Weed Control 60 Lillehammer, Norway, 8-10 March 2004
Table 1: Short description of the investigation areas by climatic data and geographical situation (data and name from their corresponding meteorological stations)
location country latitude longi-tude
height above sea level
annual average
temperature
average rainfall
Vaasa Finnland 63,1°N 21,7°E 5m 3,5°C 514 mmUppsala Sweden 59,9˚N 17,6˚E 15m 5,1˚C 541 mm Osby Sweden 56,4˚N 13,9˚E 83m 6,9˚C 627 mm
Müncheberg Germany 52,4˚N 14,2˚E 64m 8,3˚C 527 mm
Magyarovar Hungary 47,9˚N 17,3˚E 121m 9,7˚C 594 mm Milano-Udine Italy 45,6˚N- 8,7˚E- 100- 211m 11,8˚C 790 mm
Roma Italy 41,8˚N 12,6˚E 129m 15,0˚C 793 mm
Lecce Italy 40,2°N 18,2°E 61m 16,4°C 556mm Soil type
To ensure comparability between the investigated regions, weed releves were carried out only on loamy-sandy soil, sandy-loamy soil and soddy-alluvial soil. The sites for plant releves were pre-selected by using regional soil maps. Weed flora releves
For every survey station, we have analysed nine fields among them six cereal fields (winter barley, winter wheat), three of them under extensive use /organic farming (further on in the text only “extensive”) and three under conventional farming (further on only “intensive”) and three one-year fallows (further on only “fallow”). The fallows were chosen to gain any information about the potential weed flora composition within the different regions. Investigations were carried out in the same state of culture development before and shortly after flowering of the cereals (BBCH 59-71).
According to the main focus of our investigations, field investigations aimed on the observation of the whole species inventory (species list) accompanied by assessments on the dominance structure within the weed flora. Therefore four persons inspected the area of 0,5-1 ha of every single field and did assessments on the abundance of single species. The classification of abundance was based on the following scale, including their intermediate values: Sh – most frequent (occurring on at least 50% of the field), H – frequent (occurring on at least 25% of the field), Z – scattered/ diffuse (occurring on at least 10% of the field), S – rare/infrequent (occurring only with a few species), Ss – most rare (not more than 1-3 individuals on the field). Identification of weed species was following the nomenclature of the national flora for every country, included in the investigation.
The floristic data were captured in a databank together with some descriptive information about the observed fields. Species nomenclature was tested against synonymity based on standard species list for Germany (Wisskirchen and Haeupler, 1998), supplemented by using Mediterranean nomenclature (Pignatti, 1997) and Scandinavian nomenclature (Mossberg et al., 1992). The species nomenclature was combined with classifications for their systematics and ecological behavior. The following classifications for the ecological behavior were included in the data analysis: affiliation to plant families (Ellenberg 1996) and life forms (Ellenberg 1996). These classifications were created for central European conditions and therefore cross validated by using information from Mediterranean and Scandinavian floras (Pignatti, 1997; Mossberg et al., 1992).

6th EWRS Workshop on Physical and Cultural Weed Control 61 Lillehammer, Norway, 8-10 March 2004
Data analysis The data delivered by the comparative investigations were analysed in a holistic way. We used
multivariate analyses to identify i.) major dissimilarities (also interpretable as characteristics) between the European regions, ii.) key parameters (species) for different climatic conditions using two-way indicator species analysis and several methods of multivariate variance analysis (e.g. PCA) to analyse iii.) the relative importance of climate factors on variance in species occurrence for the analysed investigation stations.
The following multivariate statistical valuation methods were used: i.) Multiple Cluster Analysis (TWINSPAN program), ii.) Multiple Discriminant Analysis (SPSS 8.0 program), iii.) Canonical Correspondence Analysis (CANOCO program) and iiii.) Canonical Correlation Analysis (SYN-TAX 5.1 program).
A number of species occurred rare and / or with only low dominance in the single regions. These species were decisive in influencing the characteristics of those regions. Hereinafter these species were included in the valuation of ecological group. In the valuation of single species occurrence, we concentrated only on frequent species because of statistical reasons. Results Species richness
During our field work, we have visited every investigational area there times and we have made weed surveys at nine fields every year. That makes 210 surveys on different arable fields in total. As result of these field investigation, we have found at all 768 plant species growing on arable land, 550 of them were occurring on more than one single field, occurring more than once. Between the different land use types this number was divided as follow: the total species number on fallow fields was 634, on fields under extensive use 554 and under intensive use 346. Nearly two third of the total species number occurred rarely, only on less than 10% of the observed fields. This trend was nearly the same for all land use types.
Taking into account the relatively low number of fields at every particular investigational area, and the random selection of the fields for the survey, the number seems to be rather high. Despite the fact, that we could use at all stations support by local experts in species identification, we estimate the success in detecting the whole species occurrence by our own as to be underestimated by about 10-15%.
The spatial distribution of the whole species number we have found is shown in figure 2. As expected, we have found a clear increasing south-north trend in total species number. The species number varied from maximum 405 species at all in the southernmost investigational area Lecce (Italy) up to the minimum of 126 species in the northernmost area Vaasa (Finland). In the middle sector of the gradient, from North Italy via Hungary up to northeast Germany the total species number was nearly equal (237 in north Italy, 196 in Hungary, 227 in Germany).
The differences between the land use types are also shown in figure 2. The general trend was that nearly 80% (variation between 70-85% in the single regions) of the species richness on fallow fields could be found on fields under extensive use and only about 50% (40-65%) on fields under intensive land use. Patterns of species occurrence
Analysing the occurrence of single species along the European transect, we could identify at least three different groups of single species response to the climate gradient. The first group includes those species, that are occurring mainly under Scandinavian climate with high frequencies. The most frequent species belonging into this first group are summarised in table 2. In this group, we can find species of alluvial, partly moist soils, which are typical for large areas in northern

6th EWRS Workshop on Physical and Cultural Weed Control 62 Lillehammer, Norway, 8-10 March 2004
Europe, for instance Galeopsis bifida, Galeopsis speciosa, Erysimum cheiranthoides, Alopecusrus geniculatus and Tussilago farfara. Some of the species in the first group are also known as indicators for acid soil conditions, like f.i. Spergula arvensis .
0
50
100
150
200
250
300
350
400
450
Vaasa Uppsala Osby Müncheberg Magyaróvár Milano -Udine
Roma Lecce
Investigational areas
spec
ies n
umbe
r
extensiveintensivefallowall
figure 2: spatial distribution of the total species number along the climate transect from north to
south Europe related to different land use types (fallow, extensive, intensive) (N= 27 for every area, N=9 for every land use type in a particular area)
The second group covers just the opposite, the species preferring Mediterranean climate. There
we found numerous legume species like f.i. Medicago polymorpha, Trigonella corniculata and Vicia pseudocracca. Beside of this, there are concentrated in this group (table 3) some grasses f.i.: Lolium rigidum, Lolium multiflorum and Bromus sterilis also. Additional to this, there usually could be detected some very attractive flowering species, f.i.: Legousia speculum-veneris and Chrysanthemun segetum too.
Picture 1: Galeopsis speciosa was found with high abundances mainly in northern Europe (example from Uppsala- Sweden)
The last group differ from the species in other groups by showing no climate preferences and occurring with high abundances along the whole gradient (table 4). Looking at this group, we can easily consider, that most of the well known and very common weeds belong into this group. Species like Galium aparine, Chenopodium album, Cirsium arvense and Avena fatua have been targets for weed control since decades. Actually these species are widely distributed all over the investigated countries

6th EWRS Workshop on Physical and Cultural Weed Control 63 Lillehammer, Norway, 8-10 March 2004
and show high frequencies of occurrence. The difference between the investigated land use types related to the occurrence of these species is, that in Table 2: Group of weed species more common and abundant in Northern Europe (mean abundance
(%) over all land use types for every particular investigational area on the climate transect, N= 27 for every single area)
Northern Europe Southern Europe
species name Vaasa Uppsala Osby
Münche-berg
Magyar-ovar
Milano- Udine Roma Lecce
Galeopsis speciosa 81,48 62,96 39,15 0,00 0,00 0,00 0,00 0,00Phleum pratense 51,85 40,74 42,33 3,70 0,00 0,00 0,00 0,00Alopecurus geniculatus 51,85 3,70 43,92 3,70 0,00 0,00 0,00 0,00Spergula arvensis 51,85 7,41 38,10 11,11 0,00 0,00 3,70 0,00Erysimum cheiranthoides 77,78 55,56 20,63 18,52 0,00 0,00 0,00 0,00Galeopsis bifida 74,07 33,33 73,02 0,00 3,70 0,00 0,00 0,00Matricaria discoidea 74,07 18,52 62,96 14,81 7,41 0,00 0,00 0,00Tussilago farfara 11,11 48,15 26,98 3,70 22,22 3,70 0,00 0,00Sonchus arvensis 7,41 48,15 19,58 11,11 25,93 0,00 0,00 7,41Thlaspi arvense 33,33 74,07 34,39 44,44 29,63 0,00 0,00 0,00Lapsana communis 48,15 62,96 59,26 7,41 0,00 11,57 0,00 0,00Polygonum lapathifolium 51,85 25,93 69,84 33,33 37,04 35,19 0,00 0,00Epilobium angustifolium 51,85 0,00 13,23 7,41 0,00 11,57 4,76 0,00Taraxacum officinale 70,37 77,78 77,78 59,26 44,44 26,85 8,47 0,00Gnaphalium uliginosum 44,44 11,11 47,62 3,70 0,00 0,00 9,52 0,00Ranunculus repens 48,15 59,26 44,97 7,41 0,00 4,17 13,23 0,00Galium spurium 59,26 33,33 0,00 3,70 0,00 0,00 14,29 0,00Tripleurospermum perforatum 96,30 85,19 96,30 70,37 74,07 54,17 39,68 3,70Viola arvensis 92,59 85,19 92,59 66,67 81,48 69,91 56,61 0,00Elymus repens 88,89 92,59 80,42 81,48 88,89 37,96 27,51 11,11Stellaria media 88,89 81,48 71,96 55,56 70,37 61,57 17,99 25,93 Picture 2: Gladeolus segetum is a typical and very attractive representative of the bulbous plants,
which were a typical requisite of the weed floras in southern Europe (example from Lecce - Italy)

6th EWRS Workshop on Physical and Cultural Weed Control 64 Lillehammer, Norway, 8-10 March 2004
Picture 3: Convolvulus arvensis is one of those species occurring along the whole climate transect from south Italy up to middle of Sweden, it reached high abundances mainly in fields under intensive use (with herbicide use) (example from Roma - Italy)
Table 3: Group of weed species more common and abundant in Southern Europe (mean abundance
(%) over all land use types for every particular investigational area on the climate transect, N= 27 for every single area)
Northern Europe Southern Europe
species name Vaasa Uppsala Osby
Münche-berg
Magyar-ovar
Milano- Udine Roma Lecce
Arenaria serpyllifolia 0,00 14,81 8,47 40,74 37,04 23,15 9,52 66,67Sonchus asper 0,00 7,41 21,69 11,11 25,93 26,39 53,97 44,44Raphanus raphanistrum 0,00 3,70 3,70 3,70 7,41 7,87 50,26 48,15Daucus carota 0,00 0,00 9,52 11,11 37,04 22,69 34,92 51,85Vicia sativa 0,00 0,00 8,47 11,11 3,70 53,70 39,68 55,56Anagallis arvensis 0,00 0,00 4,76 29,63 77,78 73,61 64,02 81,48Papaver rhoeas 0,00 0,00 3,70 74,07 88,89 88,89 90,48 100,00Bromus sterilis 0,00 0,00 0,00 55,56 14,81 38,43 51,85 11,11Anthemis arvensis 0,00 0,00 3,70 3,70 14,81 19,44 52,91 74,07Chrysanthemum segetum 0,00 0,00 3,70 0,00 0,00 0,00 68,78 62,96Legousia speculum-veneris 0,00 0,00 0,00 0,00 0,00 42,13 53,97 55,56Anagallis foemina 0,00 0,00 0,00 0,00 25,93 19,91 25,40 74,07Lolium multiflorum 3,70 0,00 0,00 0,00 14,81 45,83 52,91 11,11Ranunculus arvensis 0,00 0,00 0,00 0,00 3,70 50,46 43,39 11,11Calystegia sepium 0,00 0,00 0,00 0,00 25,93 54,17 14,29 0,00Calendula arvensis 0,00 0,00 0,00 0,00 0,00 0,00 22,75 70,37Medicago polymorpha 0,00 0,00 0,00 0,00 0,00 0,00 14,29 59,26Trigonella corniculata 0,00 0,00 0,00 0,00 0,00 0,00 9,52 62,96Lolium rigidum 0,00 0,00 0,00 0,00 0,00 0,00 4,76 66,67Campanula erinus 0,00 0,00 0,00 0,00 0,00 0,00 0,00 70,37Bellardia trixago 0,00 0,00 0,00 0,00 0,00 0,00 0,00 51,85Melilotus sulcatus 0,00 0,00 0,00 0,00 0,00 0,00 0,00 51,85Vicia pseudocracca 0,00 0,00 0,00 0,00 0,00 0,00 0,00 51,85

6th EWRS Workshop on Physical and Cultural Weed Control 65 Lillehammer, Norway, 8-10 March 2004
fields under intensive use, this group dominates. Compared with this on fields under extensive use, the occurrence of species of this group is limited or supplemented by species of only local occurrence.
Noteable is also the wide introduction and high frequency of Brassica napus within the weed flora across all of the observed countries.
In a first attempt, we have tried to analyse the importance of different species groups in weed floras. Figure 3 shows the ranking of the average abundance of the occurring particular species related to their taxonomical affiliation for the whole transect. According to this result, species of the Asteraceae and Poaceae families are the most abundant within the overall species inventory. This trend could be observed over all single investigational areas. Regional differences between the abundance of the particular regions could be found for the plant species of Papaveraceae and Fabaceae, which were more abundant in the south and the Lamiaceae, which prevailed in the north.
Beside the most abundant 5-7 plant families, there are numerous plant families with only sporadic or less dominant occurrence. Table 4: Group of weed species with high abundances along the whole investigated transect and
with no preferences to specific climate conditions (mean abundance (%) over all land use types for every particular investigational area on the climate transect, N= 27 for every area)
Northern Europe Southern Europe
species name Vaasa Uppsala Osby
Münche-berg
Magyar-ovar
Milano- Udine Roma Lecce
Polygonum aviculare 81,48 85,19 86,77 77,78 81,48 76,39 84,13 29,63Fallopia convolvulus 81,48 88,89 95,24 96,30 81,48 62,04 64,02 18,52Chenopodium album 85,19 77,78 88,89 81,48 85,19 61,57 53,97 40,74Cirsium arvense 74,07 88,89 80,42 77,78 88,89 54,17 39,68 25,93Capsella bursa-pastoris 51,85 59,26 88,89 74,07 70,37 84,72 61,38 29,63Galium aparine 7,41 59,26 60,85 59,26 96,30 45,37 74,60 18,52Myosotis arvensis 85,19 92,59 81,48 55,56 14,81 31,02 32,28 0,00Convolvulus arvensis 0,00 33,33 3,70 48,15 88,89 63,89 70,90 81,48Sonchus oleraceus 66,67 77,78 57,14 7,41 29,63 38,89 33,86 62,96Fumaria officinalis 51,85 88,89 30,69 7,41 3,70 46,76 77,25 59,26Avena fatua 14,81 3,70 0,00 22,22 44,44 69,44 85,71 77,78Equisetum arvense 37,04 62,96 67,20 55,56 48,15 16,20 14,29 0,00Poa trivialis 55,56 18,52 65,61 11,11 11,11 76,85 50,26 0,00Poa annua 48,15 11,11 91,53 25,93 11,11 50,00 31,22 14,81Euphorbia helioscopia 0,00 40,74 51,32 44,44 44,44 35,19 19,05 48,15Artemisia vulgaris 11,11 22,22 69,31 62,96 62,96 42,59 4,76 0,00Trifolium repens 51,85 55,56 60,85 18,52 3,70 31,94 31,22 3,70Sinapis arvensis 14,81 51,85 43,92 18,52 29,63 31,48 40,74 14,81Senecio vulgaris 11,11 33,33 55,56 11,11 3,70 23,15 49,21 48,15Lactuca serriola 0,00 14,81 4,76 33,33 66,67 50,00 41,80 11,11Brassica napus 40,74 62,96 36,51 22,22 11,11 0,00 20,63 7,41Cerastium holosteoides 14,81 14,81 49,74 22,22 0,00 57,87 37,04 3,70

6th EWRS Workshop on Physical and Cultural Weed Control 66 Lillehammer, Norway, 8-10 March 2004
0,00 10,00 20,00 30,00 40,00 50,00 60,00
AsteraceaePoaceae
PolygonaceaeCaryophyllacea
BrassicaceaePapaveraceae
FabaceaeScrophulariaceaChenopodiaceae
LamiaceaeRubiaceaeViolaceae
RanunculaceaeBoraginaceae
ConvolvulaceaePrimulaceae
ApiaceaeCampanulaceaeEuphorbiaceae
EquisetaceaePlantaginaceae
IridaceaeGeraniaceae
mean abundance for every single species
Figure 3: Importance of different plant families as weeds on the investigated transect in general (mean value for the abundance (%) of single species per family, list of plant families is reduced to the most dominant ones)
Discussion
In the period between 1999 and 2003, we have examined the species composition in the respect of macro-climate and land use intensity. Our investigations focused in a first approach on the characterisation of the regional differences within the weed flora along a climate gradient in Europe. From our first results, we can make the following statements:
The main objective of our fieldwork was to gain comparable data for a large European part. This work was restricted by our resources and methods to a detail of the overall weed flora of every region. To get a more complex and complete picture about the state of weed floras in Europe, more investigations or a network of investigations are needed. Field investigations for such a large regions are a necessary supplement to existing expert assessments (Williams, 1982; Hunyadi and Williams, 1987; Hanf, 1982) and models. Despite the fact, that we were able to look at only a detail of the overall weed flora of the investigated regions, the number of plant species, we have found was rather high. The number of plant species, which uses arable fields at least as temporal habitat, seems to be much more higher, than actually assumed. As a consequence of this general perception, the role of arable land as habitat for weeds and other e.g. pioneer plants seems to be underestimated. From our results we want to encourage other experts and colleagues to initiate similar ecologically oriented surveys to validate the habitat function of arable fields.
Species richness of weeds is positively correlated with average temperature. Most of the species could be found on fallow fields. This finding underpin the importance of sucessional fallows for re- vitalising species inventory, mainly for species with rare and unstable occurrence under recent cropping conditions. If we regard the spontaneous vegetation on young fallows as “potential” weed flora for the given site conditions, regional diversity of weed flora was limited by about 20% in extensively used fields and by nearly 50% in intensively used fields by the land use practice in general. As most of the species surplus in extensive fields have shown a rare occurrence or low abundances, most of the species in intensively used fields were common or have had high abundances.

6th EWRS Workshop on Physical and Cultural Weed Control 67 Lillehammer, Norway, 8-10 March 2004
Warming of climate, theoretically conduces an increasing of species diversity, as Saetersdal (1998) modelled beside a South-North climate gradient in Scandinavia. This could not happen if we decrease the populations of most of species to the smallest value and create unique weed flora with a predomination of a few species. Under these conditions a large number of species hardly has chance of spreading in other areas. Our examinations showed that the specialised species were very rare or rare in the abundance scale, so populations of many of those species reached the indicatory value and their state needs protection. Much rather species number will be reduced in the case of climate warming by disappearance of specialists, the homogenisation of habitats and frequent herbicide use.
Related to the climate requirements of weeds we have detected three different pattern of response of weeds to the macro-climate. Species indicating the Southern character and limited in their occurrence to this area are e. g.: legume species like f.i. Medicago polymorpha, Trigonella corniculata and Vicia pseudocracca, grasses like Lolium rigidum, Lolium multiflorum or Bromus sterilis, some very attractive flowering species, f.i.: Legousia speculum-veneris or Chrysanthemun segetum and bulbous species like f.i. Gladiolus segetum, Allium sp. or Leopoldia comosa. Other species are attached rather to 5-8 °C annual average temperature or colder and occurred mainly in Northern Europe. Examples for this group are e. g. species of moist alluvials like Galeopsis bifida, Galeopsis speciosa, Erysimum cheiranthoides, Alopecusrus geniculatus and Tussilago farfara or species of acid soil conditions, like f.i. Spergula arvensis and others like f.i.: Lapsana communis. We have found also as a third group species, which are not correlated to the climate, which occurre everywhere in Europe. Most of them are common, dangerous weeds e.g. Galium aparine, Chenopodium album, Cirsium arvense and Avena fatua.
Our work in this form can be evaluated only as a previous exposure. After all we know that our work should be extended in several important directions, so we would like to develop that in an international team to stress particularly the interactions between land use systems or cultural practices and climate on weed flora, as well as the flexibility of current inventories with respect to climate change, the role of intrinsic factors for the processes of invasion of new species and the ecological evaluation of possible climate induced changes within the weed flora. Acknowledgements
This research was supported by the German-Hungarian Intergovernmental Co-operation in Agricultural Science (BML/TéT 01/98), UNDP (UNDP-HUN/95/002-0111), by OTKA (Hungary) and the Prof-Werner-Schulze-Foundation (Germany). We want to thank especially the following persons and institutions for their local support: BIOLECCE (Prof. Marchiori and team); Università della Tuscia - Facoltà di Agraria (Prof. Faustini); H. Bengtsson (Kvidinge - Sweden); University of Agricultural Sciences Uppsala, (Prof. Fogelfors, M. Hansson, K. Höök); MTT Jokioinen (J. Salonen and T. Hyvönen). References ALBRECHT H & BACHTHALER G (1988) Die Segetalflora zweier bayrischer Ackerstandorte 1896/87
imvergleich zu Untersuchungsergebnissen 1955/56. Z. Pflkrankh. PflSchutz Sonderh XI, 163-174.
ANDREASEN C, STRYN H & STREIBIG, JC (1996) Decline of the flora in Danish arable fields. Journal of Applied Ecology (1996) 33: 619-626.
AZEEZ, G. (2000) The biodiversity benefits of organic farming. The soil association report May 2000, Bristol, 34p.

6th EWRS Workshop on Physical and Cultural Weed Control 68 Lillehammer, Norway, 8-10 March 2004
BÀRBERI P, SILVESTRI N & BONARI E (1997) Weed communities of winter wheat as influenced by input level and rotation. Weed Research, 37, 301-313.
ELLENBERG H (1996) Vegetation Mitteleuropas mit den Alpen in ökologischer, dynamischer und historischer Sicht. 5.Aufl. Ulmer : Stuttgart.
ERVIÖ LR & SALONEN J (1987) Changes in the weed population of spring cereals in Finland. Annales Agriculturae Fenniae, 26: 201-226.
FRIEBEN B & KÖPKE U (1996) Effects of farming systems on biodiversity. In: ISART J & LLERENA JJ (eds): Biodiversity and Land Use: The role of Organic farming. Proceedings of the first ENOF-Workshop Bonn, 1995, 11-21.
GLEMNITZ M, CZIMBER G, RADICS L. & HOFFMANN J(2000) Weed flora composition along a north-south climate gradient in Europe.Acta Agronomica Ovariensis, 42 (2), 155- 169.
GYÖRFFY B, HUNYADI K, KADAR A, MOLNAR J, & TÓTH A(1995) Hungarian national weed surveys 1950-1992. Proceedings 9th Symposium EWRS “Challenges for Weed Science in a Changing Europe”, Budapest.
HANF M (1982) Ackerunkräuter Europas mit ihren Keimlingen und Samen. BASF Aktiengesellschaft, Ludwigshafen. 496 pp.
HILBIG W & BACHTHALER G (1992) Changes in the segetal vegetation dependent on the land use systems in Germany from 1950 to 1990. Angewandte Botanik (Germany); 66(5-6), 192-200.
HUNYADI K & WILLIAMS G (1987) Dictionary of weeds of eastern europe. Akademiai Kiado, Budapest 1987.
IPCC (1996) Intergovernmental Panel on Climate Change - IPCC Second Assessment Synthesis of Scientific-Technical Information Relevant to Interpreting Article 2 of the UN Framework Convention on Climate Change 1995. Environmental science and pollution research; 3(1), 52-57.
MONTEMURRO P &. VIAGGIANI P(2000) La flora di sostituzione nei cereali a ciclo autunnovernino: situazione attuale nel netro Paese. Informatore Fitopatologico.
MOREBY SJ, & AEBISCHER NJ (1994) A comparison of the flora and arthropod fauna of organically and conventionally grown winter wheat in southern England, Annals of Applied Biology, 1994, 125:13-27.
MOSSBERG B, STENBERG L & ERICSSON S (1992) Den Nordiska Floran.Wahlström and Widstrand, 696 p.
PIGNATTI S(1997) Flora d’Italia.- Bologna, Edagricole. SCHNEIDER C, SUKOPP U & SUKOPP H (1994) Biologisch-ökologische Grundlagen des Schutzes
gefährdeter Segetalpflanzen. Schriftenreihe für Vegetationskunde, 26, Bonn-Bad Godesberg, 356 p.
TÓTH Á, BENÉCS-BÁRDI G & BALZÁS G (1999) Results of national weed surveys in arable land during the past 50 years in Hungary. Proceedings The 1999 Brighton Conference – Weeds, 805-810.
WILCOVE DS, ROTHSTEIN D, DUBOW J, PHILLIPS A & LOSOS E (1998) Quantifying threats to imperiled species in the United States. Bioscience, 48, 607-61
WILLIAMS G (1982) Elsevier’s dictionary of weeds of western Europe. Elsevier scientific publishing company Amsterdam - Oxford - New York 1982.
WISSKIRCHEN R & HAEUPLER H (1998) Standardliste der Farn- und Blütenpflanzen Deutschlands. Ulmer Stuttgart, 765 p.

6th EWRS Workshop on Physical and Cultural Weed Control 69 Lillehammer, Norway, 8-10 March 2004
Computer model for simulating the long-term dynamics of annual weeds
I.A. Rasmussen & N. Holst Department of Crop Protection, Research Centre Flakkebjerg,
Danish Institute of Agricultural Sciences, DK-4200 Slagelse, Denmark
A simulation model of the population dynamics of annual weeds and how it is affected by crop rotation, cultivation practices and weed control was presented by Rasmussen et al. (2002). The model aims to predict the development of a certain weed species in order to plan crop rotation and cultivation practices to minimise the risk of proliferation. The model does not predict the exact number of weeds expected to be found in a certain year or crop, but rather the general development over a number of years. It included the most important processes of the weed life cycle: seed survival in the soil, seed placement in soil after tillage, seed germination depending on soil depth, time of year and tillage and weed physiological development. The component describing the number of weed seeds resulting from a certain density of emerging seedlings was however rudimentary.
In Rasmussen & Holst (2003) a simple model to predict seed production from seedling density was presented, and its six parameters for Chenopodium album and Papaver rhoeas estimated from literature data, supplemented with field data on P. rhoeas seed production in Denmark. Parameter values were specified by their expected ranges rather than just point estimates, which enabled us to determine the expected ranges of seed production at given seedling densities. The model has been incorporated into the model framework presented earlier for a more complete description of annual weed seedbank dynamics in a crop rotation.
While the model needs to be validated, parameters for the two selected species were readily estimated from available literature and more species can be easily added.
In Rasmussen et al. (2003), the model was extended to include volunteer oilseed rape. The model was compared with an alternative model, and the pros and cons of both models was discussed.
The model can be freely downloaded from the Internet at http://www.agrsci.dk/plb/nho/Fieldweeds.htm.
References RASMUSSEN, I.A. & HOLST, N. (2003): Computer model for simulating the long-term dynamics of
annual weeds: from seedlings to seeds. Aspects of Applied Biology 69: Seedbanks: Determination, Dynamics & Management, 277-284.
RASMUSSEN, I.A., HOLST, N. & MADSEN, K.H. (2003): Modelling the effect of management strategies on the seed bank dynamics of volunteer oilseed rape. In: Boelt, B. (ed.): Proceedings of the 1st European conference on the Co-existence of Genetically Modified Crops with Conventional and Organic Crops, p. 184-186. (http://www.agrsci.dk/GMCC-03/gmcc_proceedings.pdf)
RASMUSSEN, I.A., HOLST, N., PEDERSEN, L. & RASMUSSEN, K. (2002): Computer model for simulating the long-term dynamics of annual weeds under different cultivation practices. In: Proceedings of the 5th EWRS Workshop on Physical and Cultural Weed Control, Pisa, 6-13. (http://www.ewrs-et.org/pwc/2002_meeting.htm)

6th EWRS Workshop on Physical and Cultural Weed Control 70 Lillehammer, Norway, 8-10 March 2004
Spot ploughing and population dynamics of weeds
K. Shoji Faculty of Agriculture, Kobe University, 657-8501, Japan
Abstract
A tillage practice of ‘complete inversion’ of soil i.e. overturning of the soil block in 180° was defined and proposed, a simulation was conducted to evaluate its effect on weed control, and a ‘spot plough’ was developed and tested to accomplish such specific task. A simple linear matrix model of population dynamics of annual weeds was employed for the simulation, where four layers were set to describe the population of weed seeds, and the tillage practices were expressed by probability matrices of the complete inversion with the spot plough and ‘complete mixing’ with a rotary harrow. The simulation showed that alternately changing the depth of ploughing year by year had significant effect on weed control, and the effect was greater when a lower survival rate of the seeds was assumed. The spot plough was designed as a tool for the complete inversion that was accompanied by least lateral displacement of soil. It had the working width and depth of 360 mm and 100 - 180 mm, respectively, and was designed to operate at a speed of 1.9 m s-1 to utilise the inertia of the soil slice to securely rotate itself. A field experiment of the spot plough was conducted in a fallow land to evaluate its performance. The complete spot inversion required an operating speed of at least 1.6 m s-1; setting the speed lower than that resulted in a portion the soil block left half-inverted, and further reduction led to considerable lateral displacement of soil. The displacement in forward direction was also minimal (50 – 90 mm) as well as in lateral direction, implying that the spot ploughing is suitable for potential application and verification of the demographical model in the field basis. Introduction
Tillage practice is one of the most effective methods of physical weed control, and its value has been re-evaluated in the last decade, in accordance with more attention paid to the environmental effects around the crop field and to the consumers’ security against chemicals. Several model approaches in population dynamics have been attempted to evaluate the effect of tillage on weed control. Cousens and Moss (1990) has introduced ‘Leslie’ matrices of probability to express vertical translocation of weed seeds induced by tillage and other practices, and combined it with other biological and environmental parameters to simulate the effect of cultural practices on weed control. Sakai et al. (1998) have presented a similar model and showed that biannual alternation of the ploughing depth depresses the weed population than without the alternation.
Describing the movement of soil induced by tillage is the most important part in the model to compare the effect of the specific cultural practices. However, it is sometimes followed by technical difficulties or lack of generality, and efforts have been made to overcome them. For example, both Cousens and Moss (1990) and Sakai et al. (1998) have defined the probability matrices for plough or cultivator at given soil condition by directly measuring the movement of beads buried in different layers. Colbach et al. (2000) and Roger-Estrade et al. (2001) have modelled vertical and lateral movements of weed seeds induced by mouldboard ploughing, where they introduced ‘slivers’ or pulverised soil slices to illustrate the soil movement in a projected plane, and they confirmed that their description agreed well with the actual measurement of the movement.

6th EWRS Workshop on Physical and Cultural Weed Control 71 Lillehammer, Norway, 8-10 March 2004
Examples of probability matrices for ploughing [pij] and for shallow cultivation [dij] are shown below, where each element of the matrix indicates the probability of moving from the layer i to the layer j. Roger-Estrade et al. (2001) have shown:
⎥⎥⎥⎥
⎦
⎤
⎢⎢⎢⎢
⎣
⎡
=
27.013.019.043.027.027.027.027.023.023.023.023.023.037.031.007.0
][ ijp …(1) ⎥⎥⎥⎥
⎦
⎤
⎢⎢⎢⎢
⎣
⎡
=
19.019.021.021.029.029.029.029.028.028.027.028.025.024.023.022.0
][ ijp …(2)
where Equations (1) and (2) represent with and without a ‘skim-coulter’ (small mouldboard), respectively, both at the operating depth and width of 200 mm and 300 mm, respectively. Cousens and Moss (1990) have presented:
⎥⎥⎥⎥
⎦
⎤
⎢⎢⎢⎢
⎣
⎡
=
48.018.021.046.012.020.030.040.010.026.027.011.029.037.021.002.0
][ ijp …(3) ⎥⎥⎥⎥
⎦
⎤
⎢⎢⎢⎢
⎣
⎡
=
84.018.001.002.016.068.015.006.000.015.050.023.000.002.033.070.0
][ ijd …(4)
where a mouldboard plough and a rigid tine cultivator were used for Equations (3) and (4), respectively, and the operating depth was set at 200 mm for the both (operating width of the ploughing unknown). Sakai et al. (1998) have similarly demonstrated:
⎥⎥⎥⎥
⎦
⎤
⎢⎢⎢⎢
⎣
⎡
=
45.014.020.035.019.028.018.033.008.018.027.027.028.040.035.006.0
][ ijp …(5) ⎥⎥⎥⎥
⎦
⎤
⎢⎢⎢⎢
⎣
⎡
=
92.006.001.001.009.061.017.012.000.020.038.043.000.013.043.044.0
][ ijd …(6)
where the original 12×12 matrix (operating depth and width of 300 mm and 500 mm, respectively) has been ‘compressed’ here for comparison in Equation (5), and a disc harrow was employed at the depth of 100 mm in Equation (6).
The Matrices (4) and (6) for shallow cultivation indicates little translocation among the layers, which is idealised by:
⎥⎥⎥⎥
⎦
⎤
⎢⎢⎢⎢
⎣
⎡
=
1000010000100001
][ ijp …(7)
On the other hand, the matrices for ploughing [pij] above indicates the nature of mixing idealised by:
⎥⎥⎥⎥
⎦
⎤
⎢⎢⎢⎢
⎣
⎡
=
25.025.025.025.025.025.025.025.025.025.025.025.025.025.025.025.0
][ ijp …(8)
to which Matrix (2) closely corresponds. Contrary to the well-recognised function of ploughing of surface burial, this is attributed to the diagonal placement of the inverted slices of soil after ploughing [Fig. 1(a)]. However, Matrices (1), (3) and (5) still indicate certain function of inversion, with a relatively large value of p41 and a small p11 shown. This function was mainly achieved by

6th EWRS Workshop on Physical and Cultural Weed Control 72 Lillehammer, Norway, 8-10 March 2004
the skim-coulter [Matrix (1)] or a ‘cover-board’ (an auxiliary upper mouldboard) [Matrix (5)], which have bypassed specific portion of the surface soil and weed seeds directly into the bottom of the furrow [specification of the plough for Matrix (3) is unknown].
(a) (c) (b) Fig. 1. Modes of ploughing: (a) diagonal placement of soil slices at a large operating depth; (b)
complete inversion with a ‘spot plough’; (c) inversion at a small operating depth
Although combination of these cultural practices above undoubtedly contributes to weed control, the function of soil inversion should be explored more to derive enhanced effects of tillage. As certain portion of annual weed seeds is not able to survive during winter, it would be effective to concentrate newly reproduced seeds around the bottom of the ploughed furrow and to leave them for winters without redistributing them among the layers by inversing the soil slice in 180° [Fig 1(b) and (c)]. This practice hereinafter is referred to as ‘complete inversion’ and is idealised by the expression:
⎥⎥⎥⎥
⎦
⎤
⎢⎢⎢⎢
⎣
⎡
=
0001001001001000
][ ijp …(9)
This idea has been partly attempted by Shoji et al. (2000), where a simulation showed its effect, especially if the ploughing depth was alternately changed. The effect of complete inversion is discussed in depth and generalised in this paper.
Little attention has been paid to the design of plough for such specific function of complete inversion. Shoji et al. (2000) have designed a conventional mouldboard plough that aimed at the complete inversion, but it was only feasible at a shallow depth of 100 mm with respect to 360 mm of operating width, such as illustrated in Fig. 1(c). This is attributed to the result that the diagonal placement of soil slices [Fig. 1(a)] is unavoidable at a large aspect ratio (the depth divided by the width of operation), no matter how well the mouldboard is designed under the scheme of conventional ploughing that involves lateral displacement of soil. Therefore, as an alternative tillage implement, ‘spot plough’ (Shoji, 2001; 2003) is considered here for the complete inversion of the soil. In this paper, a single bottom prototype is used to explore the possibilities of the complete inversion ‘on the spot’ without lateral displacement of the soil. Materials and Methods The model
The model (Shoji et al. 2000) used here is rather simplified where tillage practices are not concerned. For simplicity, only 4 layers of soil are considered, each of which are assumed to correspond to the depth of 50 mm (Cousens and Moss, 1990):

6th EWRS Workshop on Physical and Cultural Weed Control 73 Lillehammer, Norway, 8-10 March 2004
⎟⎟⎟⎟⎟
⎠
⎞
⎜⎜⎜⎜⎜
⎝
⎛
⎟⎟⎟⎟⎟
⎠
⎞
⎜⎜⎜⎜⎜
⎝
⎛
⎟⎟⎟⎟⎟
⎠
⎞
⎜⎜⎜⎜⎜
⎝
⎛
⎟⎟⎟⎟⎟
⎠
⎞
⎜⎜⎜⎜⎜
⎝
⎛
⎟⎟⎟⎟⎟
⎠
⎞
⎜⎜⎜⎜⎜
⎝
⎛
=
⎟⎟⎟⎟⎟
⎠
⎞
⎜⎜⎜⎜⎜
⎝
⎛
+
+
+
+
nk
n
n
n
n
n
n
n
xxxxr
pppppppppppppppp
dddddddddddddddd
xxxx
,
,3
,2
,1
44434241
34333231
24232221
14131211
44434241
34333231
24232221
14131211
1,4
1,3
1,2
1,1
100001000010000
000000000000
…(10)
The column vector [xi,n] represents number of seed of a specific annual weed at the soil layer i in the n-th year. The matrices multiplied to the left represent events and transformations in time series. The r is total reproduction rate during a growing period, including germination, chemical and mechanical control, loss of weed seeds etc. For example, a r of 2 means that if one plant produces 100 seeds in the previous season, 98 are removed by either incapability in emergence or weed control practices during the cropping season. These events occur only at the surface layer; therefore the rest of the diagonal elements remain 1. The ‘winter survival rate’ q is the proportion of seeds surviving during each winter, which is assumed to be independent of the depth for simplicity. There are, however, various models available concerning the reproduction and the survival (e.g. Cousins & Moss, 1990; Mohler, 1993; Mohler & Gulford, 1997). It is readily indicated from the model that the survival rate q of 1 always requires the maximum allowable reproduction rate r of 1 regardless of the tillage practices, since all the seeds survive and therefore their redistribution induced by the tillage is not meaningful at all.
The matrix [pij] represents deep tillage in autumn with the spot plough, and the matrix [dij] the seedbed preparation in spring operated with rotary harrow where the layers are completely mixed. For example, the ploughing and the rotary harrowing at the operating depths of 150 mm and 100 mm, respectively, are expressed by:
⎥⎥⎥⎥
⎦
⎤
⎢⎢⎢⎢
⎣
⎡
=
1000000100100100
][ ijp …(11) ⎥⎥⎥⎥
⎦
⎤
⎢⎢⎢⎢
⎣
⎡
=
10000100005.05.0005.05.0
][ ijd …(12)
It is inferred, from the fact that [qij] is the product of a constant and a unit matrix, that the timing of such tillage practices does not matter whether they are done before or after the winter, although the change in the order of the practice affects the result. It should be also noted that the tillage depth of one layer (50 mm) means no operation done.
In the simulation, operating depths for the spot ploughing and the harrowing were varied at given survival rate q, and the convergence of the n-th power (n → ∞) of the total product of the matrices i.e. [dij][qij][pij][rij] in Equation (10) was examined. This procedure, unlike giving specific initial distribution of seed numbers (e.g. Cousins & Moss, 1990; Sakai et al., 1998; Shoji et al., 2000), was to generalise the property of the model by avoiding the dependence on the initial distribution of the seeds. In theory, the convergence is guaranteed if the maximum absolute value of the eigenvalues of the product [dij][qij][pij][rij] is less than 1 under the assumption that its diagonalisation is feasible. The maximum allowable reproduction rate r that would make the n-th power of the product [dij][qij][pij][rij] converged was sought for a given tillage practices and the survival rate. This means that the greater the allowable r, the less weed control is required during the cropping season i.e. the greater the effect of the off-season tillage practices on weed control.
The value of winter survival rate q was set at 0.7, 0.5, and 0.25, in reference to the review by Mohler (1993). The depth of rotary harrowing was set shallower than that of ploughing, since harrowing deeper than ploughed to equally redistribute the seeds cancels out the effect of the ploughing, which can be easily understood by simply calculating the product [dij][pij]. To compare the effect of the complete inversion with the spot plough to an existing ploughing scheme, the probability Matrix (3) (Cousens and Moss, 1990) was also employed in addition to the Matrix (11) for the complete inversion.

6th EWRS Workshop on Physical and Cultural Weed Control 74 Lillehammer, Norway, 8-10 March 2004
The spot plough
A prototype of spot plough was developed (Fig. 2). It was constructed on the base frame of a conventional mouldboard plough (SUGANO, QY-141) that had single bottom of 360 mm in width, and it inverted the soil slice in clockwise direction facing forward. Working width and depth were 360 mm and 100-180 mm, respectively. Four principal working components were arranged in sequence: front disc coulter, share, short mouldboard, and tilted disc coulter. The front disc coulter and the share remained as originally manufactured, whilst the mouldboard and the tilted disc coulter were newly fabricated or allocated. The shoe and the landside were removed during the experiment.
It was designed so that the soil block was further lifted and rotated by its own inertia before completing the spot inversion, and the design was tuned to operate at the speed of 1.9 m s-1. It was assumed that the cross-section of the soil was not severely pulverised in the process; soils with root-mats, certain content of clay, or with certain moisture content such as drained paddy soils as bonding agent would be the target for this spot ploughing. The soil block receives rotational acceleration from the mouldboard and the tilted disc coulter, and lands on its own furrow without being displaced. Therefore, the mouldboard handles the soil slice only up to the angle of rotation of 60°, and the length from the share point to the rear edge of the tilted disc coulter became as short as 650 mm. Specification of the mouldboard and the tilted disc coulter in detail has been already described by Shoji (2003).
Fig. 2. Overview and principal working components of the spot plough
An experiment was conducted to verify the completeness of spot inversion, specifically in view
of assessing the effect of operating speed. The experimental field was set up in an upland field in the Food-Resource Education and Research Centre (formerly the Experimental Farm) of the Faculty of Agriculture, Kobe University, in Kasai City, Hyogo, Japan (134°52’E, 34°53’N, 53 m above sea level). The soil was classified as ‘Fine yellow soil’ according to the Japanese Soil Taxonomy; having a high content of clay, it allowed little vertical infiltration of water once it was compacted. The upland field has not been cultivated for more than five years; well-developed root-mats of weed
Tilted disc coulter Mouldboard Share
Gauge wheel
Speed detector
Front disc coulter

6th EWRS Workshop on Physical and Cultural Weed Control 75 Lillehammer, Norway, 8-10 March 2004
roots were dominant only near the surface and the root density below 30 mm was rather sparse. However, macro-pores generated by the roots have promoted good drainage of water despite the high clay content, and the soil was not so compacted as to allow good penetration and certain pulverisation upon ploughing. The field was mowered approximately one week prior to the experiment, and the dried residues of the mowered grass remained on the surface. The cone penetration resistance was 2.7 ± 0.3 MPa at the moisture content of 27.2 ± 1.9% d.b. The prototype was directly hitched and pulled by a four-wheel-drive tractor (Yanmar FX-22D, 16.5 kW). The operating depth was mostly adjusted to between 110 mm and 130 mm (maximum of 160 mm), and the speed was varied at 0.60 - 1.64 m s-1.
After the operation, cross-sectional profiles were taken with a laser-beam range finder (KEYENCE, LB-1200) mounted on an electro-magnetic linear scale (MTB, Temposonics® LP-SKVM1500): (1) on tilled surface right after the operation, (2) with only inverted or half-inverted soil blocks removed, and (3) with all the tilled soil removed. The inverted soil blocks were facilely distinguished from the one not inverted, as the stem and roots of the mowered weeds still remained on the surface. The forward displacement of soil in the direction of travel was also measured in a simple manner; the surface of the prospective path of the plough was scribed perpendicular to the travelling direction with a stick and painted with lacquer spray, and after the ploughing, the sides of the furrow were excavated and the painted line on the soil block was discovered. This simple procedure was practicable because the tilled and inverted soil blocks were always reallocated in a uniform and consistent manner such as with wet plastic soil. Burial and excavation of tracers, therefore, was not attempted here on account of the constancy of ploughing and of the visual readiness of distinguishing the inverted soil blocks. Results and discussion The model simulation
The results of the simulation is summarised in Table 1, where the greater the value of maximum allowable r, the more effective the tillage practice on weed control.
A simple tillage with the existing mouldboard plough (2nd row) showed significant effect, as such ploughing operation involves both mixing and inversion in itself [Matrix (3)]. Therefore, the effect decreased as the depth of rotary harrowing i.e. equal redistribution of seeds increased, indicating that tine cultivator [Matrix (4)] or disc harrow [Matrix (6)] that does not intensively redistribute the seeds is more suitable, specifically for weed control, as a secondary tillage tool after conventional mouldboard ploughing.
On the other hand, complete inversions with the spot plough at a fixed depth (4th to 6th row, d=1) without rotary harrowing did not contribute to weed control as much as with the conventional plough. This procedure is actually pending the germination of seeds for one more winter by burying and turning up them in a period of two years; therefore the allowable r is the square of no tillage operation (3rd row) regardless of the depth of the complete inversion. The effect increased as the depth of rotary harrowing increased (5th row, d=2; 6th row, d=2 and 3), indicating that certain mixture should be combined with the complete inversion to obtain as much effect as with conventional ploughing. However, setting the same depths for the rotary harrowing and the ploughing (4th to 6th row, p=d) again weakened the effect, since this procedure is equivalent to omitting the ploughing, which is readily indicated by calculating the product [dij][pij]. In general, as far as the depth of the ploughing is fixed each year, the effect of complete inversion on weed control was not significantly different from the one with the conventional mouldboard ploughing, and in some cases, the effect was even less significant.

6th EWRS Workshop on Physical and Cultural Weed Control 76 Lillehammer, Norway, 8-10 March 2004
Therefore, another simulation was attempted to alter the depth of ploughing every two years (7th – 8th row). This procedure was to retain the reproduced seeds as long as possible in the soil by maximising the advantage of the least redistribution of the seeds induced by the complete inversion. Significant effect was obtained even if the depth of ploughing was not set at maximum. The effect of depth alternation was more evident with a smaller value of winter survival rate q, reflecting the strategy of preserving the seeds in the soil. However, this effect was diluted by the equal redistribution by the rotary harrowing (8th row, d=2); therefore, other secondary tillage tool or extremely shallow cultivation would be preferable for the secondary tillage within this specific scheme of cultural practice for weed control. Table 1. Simulated effect of tillage practices expressed in terms of allowable maximum
reproduction rate of the weed r
q 1) p 2) d 3)
Allowable maximum r q p d Allowable
Maximum r q p d Allowable Maximum r
4 a) 1 2 3 4
3.41 3.58 3.17 2.75
4 a) 1234
8.13 8.09 6.22 5.06
4 a) 1 2 3 4
36.2 29.5 17.3 13.1
1 1 1.42 1 1 2.00 1 1 4.0 2 1
2 2.04 1.85 2 1
24.00 3.00 2 1
2 16.0 7.0
3 1 2 3
2.04 2.62 2.28
3 123
4.00 5.88 4.00
3 1 2 3
16.0 26.1 10.0
4 1 2 3 4
2.04 3.08 3.25 2.71
4 1234
4.00 7.00 8.00 5.00
4 1 2 3 4
16.0 31.0 38.4 13.0
2 - 3 b) 1 2.91 2 -
3 b) 1 8.00 2 - 3 b) 1 64.0
0.7
3 - 4 b)
1 2
4.16 3.08
0.5
3 - 4 b)
12
16.00 7.00
0.25
3 - 4 b)
1 2
256.0 31.0
1) Winter survival rate of weed seeds 2) Depth of autumn ploughing expressed in terms of the treated number of layers from the
surface 3) Depth of spring rotary harrowing expressed in terms of the treated number of layers from the
surface Note: Depth 1 for p or d indicates that the tillage operation is not done. b) Probability Matrix (3) for conventional ploughing (Cousens and Moss, 1990) was used. a) Depth of ploughing alternately changed every two years under the same values of q and d
given Performance of the spot plough
Operating speed was an important factor that affected the completeness of spot inversion of the soil, as the rotation of the soil is dependent on its own inertia once it is released behind from the plough. At the operating speed less than a third the designated speed, a considerable portion on the side of the tilted disc coulter resulted in not inverted and remained where it was [Fig. 3(a)] despite no residues or weeds left on the surface. This implies that the portion was sufficiently accelerated neither by the mouldboard nor by the tilted disc coulter. The lateral displacement of the soil to the right was evident; the portion originally located at the left was excessively accelerated by the

6th EWRS Workshop on Physical and Cultural Weed Control 77 Lillehammer, Norway, 8-10 March 2004
mouldboard as the right portion was separated. Operations at a similar speed to this example sometimes resulted in the whole portion returned to its original position without any rotation at all. Therefore, an operating speed near 0.6 m s-1 is a grey zone whether the furrow and the untilled surface nearby are covered or not with the partially inverted soil.
As the speed was increased to over 60% the designated speed, the soil was disturbed throughout the whole working width, and the finished surface appeared to have been completely ‘spot ploughed’ without residues or weeds on the tilled surface, and particularly, without any visible lateral displacement of the soil [Fig. 3(b)]. However, cautious excavation and observation revealed that there was still incompletely inverted portion remaining even at a speed over 70% the designated [Fig. 4(b)], although the portion has moved to the other side of the furrow to the left in this case unlike Fig. 3(a). This phenomenon is explained that the portion on the right-hand side before the operation [Fig. 4(c), upper panel] has been lifted and accelerated to the left, but has landed earlier than anticipated for lack of operating speed and remained half-inverted on the left-hand side [Fig. 4(c), lower panel]. The case in Fig. 3(b) was similar to this case of invisible incompleteness of inversion despite the perfect appearance at first glance. Operating at the speed of 1.64 m s-1, however, did not show any more incompleteness of inversion associated with the lack of operating speed (appearance shown in Fig. 5).
.
.
(a) (b) Fig. 3. Cross-sectional profiles with two replicates (upper and lower panels): (a) speed 0.6 m s-1,
depth 126 mm; (b) speed 1.2 m s-1, depth 111 mm; an intervals of the scales is 100 mm
Tilled & inverted surface
Portion not inverted
Furrow
Tilled & inverted surface
Furrow

6th EWRS Workshop on Physical and Cultural Weed Control 78 Lillehammer, Norway, 8-10 March 2004
(a) (b) (c)
Fig. 4. ‘Invisible incompleteness’ of inversion of soil: (a) appearance after operation; (b) partial excavation showing half-inverted portion on the left-hand side; (c) schematic diagram of process for this case; operated at the speed of 1.4 m s-1 and the depth of 120 mm
Fig. 5. Complete inversion of soil achieved at the speed of 1.64 m s-1 and the depth of 115 mm
Displacement of soil in forward direction was minimal of 50-90 mm (Fig. 6). The depth was
not influential in the range provided, but the displacement gradually increased with the speed. This small amount of forward displacement is attributed to the structure that ensures the release of the soil from the plough, accredited to the shortened mouldboard and the enhanced interaction of the tilted disc coulter with the soil slice or blocks. The result is comparable to the one measured at operations with conventional tillage tools. For example, Nichols and Reed (1934) have presented a data set that forward displacement was about 0.4 m on the average and up to 0.8 m with a conventional mouldboard plough of 450 mm in width. In view of a contemporary challenge referred to as ‘tillage erosion’ or tillage-induced translocation of soil (Govers et al. 1999), a rotary harrow or rotary tiller, for example, has been reported to transport the soil up to 0.6 m downhill and
Dir
ectio
n of
trav
el

6th EWRS Workshop on Physical and Cultural Weed Control 79 Lillehammer, Norway, 8-10 March 2004
0.3 m uphill (Van Muysen & Govers, 2002). These comparisons show that the spot plough presented here is also beneficial in minimising the forward displacement of soil as well as in lateral direction.
Minimal displacement of soil in both forward and lateral directions is beneficial in applying a simple model of population dynamics such as used in this study. As the demographical model [Equation (10)] involves the translocation of soil and weed seeds only in the vertical directions, dispersal of soil in other directions potentially becomes a source of error in the model. For example, Colbach et al. (2000) and Roger-Estrade et al. (2001) have also illustrated lateral movement of soil induced by conventional mouldboard ploughing, where they have indicated that soils located at different depths are transported in different distance in the lateral direction. Therefore, the spot plough having minimal soil displacement can be suited to potential application and validation of the demographical model in the field basis.
The spot plough was also applicable to weedy environment (Fig. 7). Although the inversion was incomplete at the beginning where the tractor was not accelerated enough, existence of surface residue did not affect the process of spot inversion.
However, more development and experiment are necessary to verify the adaptability of the spot plough for various operating conditions, so that the prospected effect on weed control discussed in the simulation could be proved in reality. For example, a greater operating depth should be tested, whereas a depth of more than 160 mm was not feasible in this experiment due to the capacity of the tractor. Although there is a limitation in the aspect ratio of around 2.0 (i.e. the depth at 180 mm for the current design) in geometrical point of view to compromise with the interference of the soil slice with untilled wall of soil (Shoji, 2001), exploring the possibility of deep spot ploughing will definitely widen the degree of freedom in the strategy for weed control. For such a specific purpose, a symmetric design to invert a pair of slices inward [Fig. 1(b)] is one of the possible measures; in case thick soil blocks are left facing with each other [chain line in Fig. 1(b)], the gravity or a supplemental apparatus is expected to settle down the blocks to accomplish spot inversion. The spot plough should be also tested in sandy or fragile soils and further adjusted to, and then the idea of complete inversion and depth alternation could be applied in various types of fields for enhanced effect of tillage practices on weed control.
Fig. 6. Forward displacement of soil:∆, average depth of 111 mm; ○, average depth of 127 mm
Forw
ard
disp
lace
men
t, m
m
0
Operating speed, m s-1
50
1.0 2.0 1.5
100

6th EWRS Workshop on Physical and Cultural Weed Control 80 Lillehammer, Norway, 8-10 March 2004
Fig. 7. Spot inversion in weedy environment Conclusions
The effect of complete inversion of soil on weed population dynamics was discussed and simulated, and a spot plough was proposed to accomplish such specific task.
1) The effect of complete inversion on weed control was not simulated to be significant, as far as the ploughing depth was fixed for years. However, alternating the ploughing depth drastically decreased the population of seeds by preserving them in the soil for several years, and such effect was more evident with a lower winter survival rate of the seeds.
2) With the developed spot plough, about 86% of the speed employed for the design was at least required to accomplish spot inversion in a relatively cohesive soil. Further reduction in speed produced a portion of soil block insufficiently inverted or substantial lateral displacement of the soil occurred. The forward displacement of the soil was minimal as well as its lateral displacement, implying that the simple model of weed population dynamics could be potentially applicable and verifiable with the spot plough in the field.
Acknowledgements Part of this research was supported by Grant-in-Aid for Scientific Research (2002-2003) from
Ministry of Education, Culture, Sports, Science and Technology, Japan.

6th EWRS Workshop on Physical and Cultural Weed Control 81 Lillehammer, Norway, 8-10 March 2004
References COLBACH N, ROGER-ESTRADE J, CHAUVEL B & CANEILL J (2000) Modelling vertical and lateral
seed bank movements during mouldboard ploughing. European Journal of Agronomy 13, 111-124.
COUSENS R & MOSS SR (1990) A model of the effects of cultivation on the vertical distribution of weed seeds within the soil. Weed Research 30, 61-70.
GOVERS G, LOBB DA & QUINE TA (1999) Tillage erosion and translocation: emergence of a new paradigm in soil erosion research. Soil and Tillage Research 55, 167-174.
MOHLER CL (1993) A model of the effects of tillage on emergence of weed seedlings. Ecological Applications 3, 53-73.
MOHLER CL & GALFORD AE (1997) Weed seedling emergence and seed survival: separating the effects of seed position and soil modification by tillage. Weed Research 37, 147-155.
NICHOLS ML & REED I F (1934) Soil dynamics: VI. Physical reaction of soils to moldboard surfaces. Agricultural Engineering 15, 187-190.
ROGER-ESTRADE J, COLBACH N, LETERME P, RICHARD G & CANEILL J (2001) Modelling vertical and lateral weed seed movements during mouldboard ploughing with a skim-coulter. Soil and Tillage Research 63, 35-49.
SAKAI K, TANI S & TAKAI M (1998) A model of effects of reciprocally changed plowing depth on weed seed population (in Japanese). Journal of the Japanese Society of Agricultural Machinery 60(6), 19-26.
SHOJI K,YAMAMOTO H & HORIO H (2000) Development of a plow for complete inversion and effective weed control. Proceedings of the 15th conference of the International Soil Tillage Research Organisation, Fort Worth, USA, CD-ROM.
SHOJI K (2001) Design of a model ‘spot plough’ for inversion of soil slice within the furrow. Journal of Agricultural Engineering Research 79, 283-297.
SHOJI K (2003) Field performance of ‘spot plough’. Proceedings of the 16th International Soil and Tillage Research Conference, Brisbane, Australia, 1120-1126.
VAN MUYSEN W & GOVERS G (2002) Soil displacement and tillage erosion during secondary tillage operations: the case of rotary harrow and seeding equipment. Soil and Tillage Research 65, 185-191.

6th EWRS Workshop on Physical and Cultural Weed Control 82 Lillehammer, Norway, 8-10 March 2004
Population dynamics of weeds affected by time and type of tillage
K.S. Tørresen The Norwegian Crop Research Institute, Plant Protection Centre, Høgskoleveien 7, N-1432 Ås,
Norway Introduction
Type and time of tillage can affect different stages of a weed’s life cycle: dormancy status of
the seeds, germination, emergence, control of established plants and thus the seed production. As a part of two projects concerning tillage and plant protection in spring cereal production financed by the Royal Ministry of Agriculture, one field experiment was conducted at Ås from 1994 to 2000. The aims were to study the population dynamics of certain weed species with various tillage systems and to develop population dynamic models for each species. Materials and methods
Four tillage treatments were performed: Mouldboard ploughing (simulated by hand spade) to
18 cm in autumn or spring, or harrowing (by rotary cultivator) in autumn (6-8 cm depth) or spring prior to sowing (ca. 5 cm depth). Plots with ploughing or autumn harrowing were harrowed in spring too. No herbicides were applied. To ensure establishment of eight weed species, including the four species mentioned in this study, seedlings were transplanted to the field after emergence of the cereals at start in spring 1994. The spring cereals grown in all years were barley, except for oats in 1995 and 1999. From start in 1994 for Galeopsis tetrahit, Matricaria perforata and Sonchus asper and from 1998 for Chenopodium album the number of weed plants and seed production during the growing season, and the seedbank before tillage in the autumn were assessed each year. Twenty soil samples per plot, 2.5 cm in diameter, were taken to 18 cm depth, bulked and the seedbank estimated by a one-year greenhouse germination procedure as described by Tørresen (1998). The number of plants when the cereals had 3-4 leaves and the seedbank were assessed for all species present. Results and discussion
During the experimental period the total number of weeds and the seedbank in the upper 18 cm
soil depth increased in harrowed plots compared to ploughed plots. Only a few percentage of the total seedbank emerged to new plants.
There was a good correspondence between number of plants in early summer, seed production and the weed seedbank for M. perforata and C. album. M. perforata had most plants, largest seed production and seedbank with harrowing in autumn or spring. C. album had most plants and seeds produced in plots with harrowing in autumn. C. album had more plants and larger seedbank than the three other species on ploughed plots. The number of plants, seed production and the seedbank of G. tetrahit and S. asper were little compared with those of M. perforata and C. album. The emergence of G. tetrahit was favoured by spring ploughing. These data were used to develop simple population dynamic models of the species. We plan to validate the models with independent data from an adjacent field experiment conducted in 1994-2000.

6th EWRS Workshop on Physical and Cultural Weed Control 83 Lillehammer, Norway, 8-10 March 2004
References TØRRESEN KS (1998). Emergence and longevity of weed seeds in soil with different tillage treatments. In: Aspects of Applied Biology 51, Weed seedbanks: determination, dynamics and manipulation (eds GT Champion, AC Grundy, NE Jones, EJP Marshall & RJ Froud-Williams), 197-204. The Association of Applied Biologists, Warwick, UK.

6th EWRS Workshop on Physical and Cultural Weed Control 84 Lillehammer, Norway, 8-10 March 2004
Row distance as a key to efficient weed management in organic sugar beets
J.D.A.Wevers1 & L. Bastiaans2 1 IRS, P.O.Box 32, 4600 AA, Bergen op Zoom, the Netherlands ([email protected]) 2 Wageningen University, P.O. Box 430, 6700 AK Wageningen, the Netherlands
In sugar beet growing, as well as in most other crop production systems, weed control is essential to obtain profitable yields. At the same time, the costs related to achieving an effective weed control reduce this profit. In The Netherlands, the opportunity to process organically grown sugar beets separate from conventionally produced sugar beets has considerably raised the interest of organic growers in this particular crop. In organic sugar beet growing mechanical weeding in between the rows, hand weeding in the row and suppression of the weeds by the crop are the main means of weed control. Currently, farmers perceive that the labour required to obtain an effective weed control, which is mainly related to the amount of hand weeding, is far too large. The question arose whether an adaptation of the standard row distance, which currently in The Netherlands is put at 0.50 m, can contribute to a more effective weed control.
Two directions were explored. A decreased row distance will result in a more homogeneous distribution of crop plants and consequently the competitiveness of the crop is expected to increase, reducing the late development of weeds. Another option would be to increase the row distance, as this will reduce the total length of crop rows per unit area. As a result, the need for hand labour will decrease, as hand weeding is mainly needed to control the weeds in a small band in and alongside the sugar beet rows. Between the rows weeds can be controlled rather easily by mechanical means.
In 2002 and 2003, the effects of row distance on weed growth, crop competitiveness and sugar beet yields were studied in a number of field experiments in the Netherlands, both at Wageningen UR (WUR) and IRS. In the trials, row distances were varied between 0.30 m – 0.80 m. In some of the WUR trials, the drilling distance was kept constant independent of row distance, which led to a lower plant number with greater row distance. In other WUR trials, plant number was kept constant by decreasing the drilling distance with increasing row distance. Also in the IRS trials the drilling distance was decreased with increasing row distance. In these trials, plant density was not exactly constant, but the obtained plant number was between 60,000 and 90,000 per hectare. From earlier trials it is known that plant numbers in this range hardly affect sugar beet yield and quality.
From the trials it can be concluded that row distance and drilling distance hardly affected the number of weed plants per meter of row length. This means that increasing the row distance will reduce the amount of weeds per hectare and thus the labour requirement for hand weeding. An additional advantage of a larger row distance was that the weed seedlings present in the crop row were growing slower, due to the smaller drilling distance. For the row distances used in the current trials, no significant differences in yield and quality characteristics were observed, as long as plant number was maintained. Only in the situation were the larger row distance of the sugar beet crop was not compensated through a reduced drilling distance a reduction in yield was observed at the widest row distance. This means that within a reasonable range, the sugar beet crop can compensate largely for row distance provided that plant number is kept at the same level and not lower than about 60,000 plants per hectare.
Based on these results it is concluded that an increased row distance offers good opportunities for a more effective weed management in organically grown sugar beets. Increasing the row distance from 0.50 to 0.75 m means a reduction of the total row length, and thus a reduction in hand labour requirement for weeding, with one third. As these adjustments do not have a negative effect on yield and quality of the product, it is not surprising that organic growers have already shown great interest in adopting larger row distances.

6th EWRS Workshop on Physical and Cultural Weed Control 85 Lillehammer, Norway, 8-10 March 2004
Weed population dynamic by influence of crop rotation in 40-years period
L. Zarina Priekuli Plant Breeding Station, Zinatnes Street 1a, Priekuli, LV-4126, Latvia
Email:[email protected] Abstract
On bases of long-term crop rotations experiments the influence of crop rotation and fertilization
systems on weed population dynamic was determined. Experiment has been conducted in Priekuli (Latvia) since 1958 and includes 11 different crop rotations, and five different fertilizations systems. The experiment is located on a soddy podzolic light loam with the following characteristics in the year of establishing: organic matter content 2.1 %, soil pHHCl 5.8 to 6.1, P2O5 80-100 mg kg-1, and K2O 100-120 mg kg-1. Measurements of soil nutrient content and of crop yield were performed every year. The normal mean temperature varies from -6.2 0C in January to 16.7 0C in July. The mean annual rainfall is 691 mm. Herbicide were not used.
Results show that during a more than 40-years' period by influence of crop rotation and fertilizing there were in investigations field essential changes of weed populations. In average the amount of weeds species in this period were decreased. Amount of fixed weed species varies from 23 to 34. Introduction
Weeds, part of the all biodiversity, are evidence of nature struggling to bring about ecological
succession because high diversity of plants (and animals) increases the stability of the whole agro-ecosystem. Stability through biodiversity is one of the nature’s fundamental rules. When we clear native vegetation and establish annual crops, we are holding back natural plant succession.
Weed population size and diversity of their communities are shaped by a number of biotic, abiotic and anthropogenic factors. Agricultural cropping systems, which are typical anthropogenic factor, incompletely utilize resources for growth and reproduction available in those habitats. These unused resources are a “niche-vacuum” within which weeds have adapted over short and long time periods.
Modern crop agriculture is typified by large areas of a simple plant type, accompanied by a high percentage of bare ground what is the ideal environment for growth of annual weeds to prosper in the first stage of succession (Lejins, 1986). Monocultures and other simple crop rotations, homogeneous crop cultivars, and farming trends intensifying and simplifying managed habitats sharpen this condition (Mikelsons, 1990).
Properly planed crop rotations offer benefits to the soil, allow weed control and promote biodiversity. Crop rotations are central to the holistic approach to crop production, which provides opportunities to implement management strategies that enhance diversity: they limit the build-up of weed populations and prevent major weed species shifts. Weeds tend to prosper in crops that have requirements similar to the weeds. Fields of annual crops favour short-lived annual weeds, whereas maintaining land in perennial crops favours perennial weed species (Lejins & Lejina, 2003). In a crop rotation all necessary processes: the timing of cultivation, mowing, fertilization and harvesting changes from year to year. Rotation thus changes the growing conditions from year to year-a situation to which few weed species easily adapt. Rotations that include clean cultivated annual crops and mowed or grazed perennial sod crops create an unstable environment for weeds.

6th EWRS Workshop on Physical and Cultural Weed Control 86 Lillehammer, Norway, 8-10 March 2004
It is difficult to incorporate a weed control strategy without considering nutrients, and vice versa because weeds can be created and maintained also by fertilisations practices (Ciuberkis, 2002; Mikelsons, 1990). Nutrients ions do not work independently of each other. Deficiencies or excesses of many nutrients may affect the availability of other nutrients. Therefore it is very important to find optimal balance of nutrients in the soil to ensure both economically based crops yields and minimum of crops competitors- weeds.
To verify adjudgements published in scientifical literature in the beginning of 20 th century and to find optimal indices for local agro ecological conditions there were in the oldest in Latvia Plant breeding Station (Priekuli) in 1958 a long term crop rotation experiments established. Since beginning of experiments one of the main task was to find manners that promotes the health and vigour of the crop plants to reduce weed pressure without using of pesticide. Acquired dates lets to deduce of dynamic of weed populations in a long-term period. Materials and Methods Site
The experiment is located in Priekuli (57o19'N, 25o20'E) on a soddy podzolic light loam with organic matter content 2.1 %, soil pHHCl 5.8 to 6.1, P2O5 80-100 mg kg-1, and K2O 100-120 mg kg-1 in the year of establishing. The normal mean temperature varies from -6.2 0C in January to 16.7 0C in July. The mean annual rainfall is 691 mm.
Treatments The experiment included nine different rotations (1-9). In 1980 two additional rotations were
added (10-11). The clover in rotations 2 -5 is red clover, which is established as an under-sown crop in barley. The clover in rotation 8 is white clover. Five different fertilisation treatments are compared with the crop rotations as sub-plots within each fertiliser treatment. Crop rotations 1-6 are only included in the fertiliser treatment N132P180K270. Crop rotations:
1) barley-potato-barley or oat; 2) barley-grass/clover-rye-potato; 3) barley-grass/clover-barley-rye-barley-potato; 4) barley-grass/clover-potato; 5) barley-grass/clover-grass/clover-rye-barley-potato; 6) black fallow-rye; 7) barley-rye-oat-rye; 8) rye-rye-rye-rye-grass/clover-grass/clover-grass/clover-grass/clover; 9) black fallow-rye-barley-rye; 10) barley-potato; 11) potato.
Fertiliser systems:
1) unfertilised; 2) stable manure, 20 tonne ha-1 (N-68, P-38, K-58); 3) NPK (N-66, P-90, K-135); 4) stable manure, 20 t ha-1 + NPK (N-134, P-128, K-193); 5) NPK (N-132, P-180, K-270).
The field had been under grassland cultivation long years. The ley was broken in August 1958
by ploughing and soil cultivation was performed once during the autumn. Weeds emerging from the

6th EWRS Workshop on Physical and Cultural Weed Control 87 Lillehammer, Norway, 8-10 March 2004
seed bank were distributed in a relatively homogeneous fashion over the field. Only one course of each rotation is represented in any given year. The size of each plot is 100 x 5.9 m. Each plot is subdivided into 6 harvest plots (replicates). Herbicides and fungicides were not applied during the experiments, but the seeds were treated with fungicides. Weeds have been controlled by ridging in the potatoes and sharing of stubble surface after harvesting of cereals.
Cereal grain and straw were removed from the plots, as were harvested potato tubers. For clover crops the first one or two cuts were removed from the plots. The final cut was mulched and incorporated. Crop yields have been measured, including their contents of N, P and K. Soil samples from 0 to 20 cm have been taken in autumn each year in all plots for determination of pH, and contents of organic matter, P and K.
Weediness was determined in the first decade of June in ten replicates from the area 0.1 m2 by counting method (Rasins & Taurina, 1982). There were all weeds in stage from first actual seed leaves (cotyledons) counted. Results
Starting dates showed that in the period first ten years after establishing of experiments the
weed infestation at the experimental site was relatively evenly distributed [19.]. Total weed densities in all crop rotations spiral from 129 to 275 weed seedlings. There were 34 different weed species fixed. Measurements in 1970 showed that differences by influence of crop rotation increased (Table 2): the weed infestation ranged from 164 in crop rotation No 5 to 308 individuals m-2 in crop rotation No 1. Dominant weed species were: Chenopodium spp., Vicia hirsuta S.F.Gray, Barbarea vulgaris L., Raphanus raphanistrum L., Matricaria spp., Spergula arvensis L., Mentha arvensis L., Cirsium spp., Sonchus arvensis L., Tussilago farfara L., Equisetum arvense L.
In potato plantation in 1977 and 1980 years the weed infestation ranged from 35 to 79 individuals m-2 with following dominant weed species: Thlaspi arvense L., Spergula arvensis L., Chenopodium spp., Stellaria media (L.) Vill., Viola spp., Lamium purpureum L. Amount of fixed weed species- 23. In barley plantation in 1990 the weed infestation ranged from 104 in crop rotation No 2 to 433 individuals m-2 in crop rotation No 1 that point on very high influence of including in crop rotation of grass/ clover. As dominant weed species fixed: Chenopodium spp., Spergula arvensis L., Stellaria media (L.) Vill., Viola spp., Centaurea cyanus L., Capsella-bursa pastoris (L.)Medik. As dominant species in 1999* fixed: Vicia hirsuta S.F.Gray., Thlaspi arvense L., Chenopodium spp, Spergula arvensis L., Centaurea cyanus L., Raphanus raphanistrum L., Lamium purpureum L., Viola spp, Matricaria spp.
Dates about the influence of crop rotation on specific weed species showed in Table 1. The fixed amount of several weed seedlings vary in a high measure: differences for Vicia hirsuta S.F.Gray on 97 and 100 plants in 1970 and 1980 respectively.
Over the 20-years study period in the typical cereal crop rotations (1-6), weeds level in average of four crop rotations were: 39 and 65 plants per square metre for the annual weeds, and 32 and 30 plants per square metre for the perennial weeds in 1970 and 1980 respectively (Fig.1). In season of 1980 the average weediness level increased sharp, but “on account” of crop rotation No 9 mainly.
Continuous monoculture of potato effectively selects for population of weeds that are very adapted to those growing conditions. The high level common amount of weeds testify that managing of physical weed control was not effective (Table 3).
Dates showed that two fields crop rotation provide no restricting of weeds; on the contrary, in comparison with monoculture amount of weed seedlings in it were remarkably higher. On average in both crop rotation amounts of fixed weed species in the period of 15 years decreased from 26 to 14. Dominant weed species were: Chenopodium spp, Capsella-bursa pastoris (L.) Medik, Convolvulus arvensisL., and Stachus palustris L.

6th EWRS Workshop on Physical and Cultural Weed Control 88 Lillehammer, Norway, 8-10 March 2004
0
50
100
150p m2
Annual 1970 1980 Perennial 1970 1980
Dynamic of weediness in cereal crop rotations
Black fallow-ryeBarley-rye-oat-ryeRye-rye-rye-rye-grass/clover-grass/clover-grass/clover-grass/cloverBlack fallow-rye-barley-rye
Figure 1. Dynamic of weediness in cereal crop rotations Table 1. The influence of crop rotation on dominant weed species in 1970 1990, and 1998 years, p
m2. (In average of five different fertilization systems)
Crop rotations Dominant weed species 4 5 2 3 1
1970 Vicia hirsuta S.F.Gray Cirsium spp. Sonchus arvensis L. Tussilago farfara L. 1990 Vicia hirsuta S.F.Gray Centaurea cyanus L. Chenopodium spp Raphanus raphanistrum L. Cirsium spp. Sonchus arvensis L. 1998 Thlaspy arvense L. Chenopodium spp Vicia hirsuta S.F.Gray Sonchus arvensis L. Cirsium spp.
3.4 12.7 0.2 0.5
4 0
1.1 0.3 0.01 1.2
5 7
0.5 31 8
-*
0.3 0.01 0.08
64 0.6 0.6 0.3 0.2 0 - - - - -
8.6 0.16 0.01 0.08
40 1.6 0.8 0.05 0.3 0
14 33 19 6 3
-
0.31 0.07 0.10
104 2.0 0.4 0.2 0.02
0 -
39 13 8 6
23.0 0.30 0.09 0.17
88 0.1 0.4 0.2 0.5 0.2
77 29 7 39 5
* - no dates showed in this article

Table 2. The weediness of fields by influence of crop rotation and fertilization systems in 1970, 1977, and 1990 years.
Crop rotations 4 5 2 3 1 Fertilization system
* 1970
** 1980
* 1990
* 1970
** 1977
* 1990
* 1970
*** 1980
* 1990
* 1970
** 1977
* 1990
* 1970
** 1980
* 1990
Unfertilized: - in all -annual - perennial
145 65 80
50 9
41
103 30 73
155 123 32
84 40 44
119 110 9
102 80 22
292 262 30
117 77 40
138 122 16
57 20 37
207 172 35
194 155 39
54 16 38
289 240 49
St. manure: - in all - annual - perennial
140 101 39
34 9
25
105 94 11
171 150 21
43 31 12
273 272 1
185 160 25
148 140 8
209 203 6
145 120 25
81 45 36
510 477 33
257 200 57
61 30 31
612 551 62
NPK : - in all - annual - perennial
181 131 50
31 5
26
93 66 23
176 165 11
41 13 28
265 262 3
137 136 1
125 122 3
136 129 7
144 134 10
339 336 3
316 286 30
124 42 82
329 322 7
St.m. + NPK: - in all - annual - perennial
252 216 36
34 10 24
121 96 25
169 148 21
33 11 12
354 349 5
239 234 5
149 142 7
197 189 8
231 210 21
52 28 24
441 440 1
471 466 5
79 44 35
600 563 37
PK/2NPK - in all - annual - perennial
199 133 66
28 11 17
97 78 19
150 129 21
49 31 18
279 278 1
116 99 17
262 241 21
190 187 3
169 150 19
54 37 17
378 377 1
300 246 54
78 20 58
335 328 7
On average - in all - annual - perennial
183 129 54
35 9
26
104 73 31
164 143 21
50 27 23
258 254 4
156 142 14
195 181 14
170 157 13
165 147 18
57 31 26
375 360 15
308 271 37
79 30 49
433 401 32
Crop in the field: * - barley; ** - potato; *** - rye

6th EWRS Workshop on Physical and Cultural Weed Control 90 Lillehammer, Norway, 8-10 March 2004
Table 3. The weediness of crop rotations No 10 (barley-potato) and No 11 (potato monoculture) in different fertilization systems in 1995
Crop rotation and kind of weeds Unfertilized Stable
manure NPK Stable
manure +NPK
2 NPK On average
10.Barley-potato: -annual
-perennial
530 24 554
410 64 474
486 26 512
410 8 418
331 0 331
433 24 458
11.Potato:monoculture: -annual
-perennial
70 42
112
88 83
171
56 45 101
43 35 78
18 42 60
55 49
104 On average:
-annual -perennial
300 33 333
249 74 323
271 36 307
227 22 249
175 21 196
244 37 282
Dates in Table 4 point on the fact that the influence of crop rotation on weediness of fields were
depending on fertilization system widely. Amount of weed seedlings by influence of fertilising fluctuate on 486, 250 and 618 in crop rotations No 1, 2 and 3, and on 518, 404, 364 and 70 in crop rotations No 4, 5,10, and 11 respectively. In a long period wediness increased comparatively. In all crop rotations the major amount of weeds were in fertilizing systems with stable manure. Crop rotation No 2 (barley-grass/clover-rye-potato) comes to the top as effectual for restricting of weeds seedlings in a field. Table 4. The weediness in different crop rotation by influence of fertilization system in 2002
Fertilization system
Crop rotation Unfertilized Stable manure NPK
Stable manure +NPK
2 NPK
Annual weeds 1.Barley-potato-barley or oat; 2.Barley-grass/clover-rye-potato; 3.Barley-grass/clover-barley-rye-barley-potato; 4.Barley-grass/clover-potato; 5.Barley-grass/clover-grass/clover-rye-barley-potato; 10.Barley-potato; 11.Potato monoculture
226 16 37
19 52
476 216
712 266 612
537 456
540 150
365 86 236
173 371
392 212
445 217 655
364 362
277 146
490 85 232
133 282
176 189
Perennial weeds 1.Barley-potato-barley or oat; 2.Barley-grass/clover-rye-potato; 3.Barley-grass/clover-barley-rye-barley-potato; 4.Barley-grass/clover-potato; 5.Barley-grass/clover-grass/clover-rye-barley-potato; 10.Barley-potato; 11.Potato monoculture
6 13 4
45 35
40 1
14 8 38
45 5
95 8
6 2
10
20 3
25 7
1 9 4
12 2
6 3
4 1 6
24 3 2 3

6th EWRS Workshop on Physical and Cultural Weed Control 91 Lillehammer, Norway, 8-10 March 2004
Discussion
Weed population shifts occur in response to changes in the agroecosystem that are confused with different environmental conditions that occur during the growing season. When crop production systems change, an ecological selection pressure is imposed on the weed community that alters the relative dominance of each weed population (Hartzler R.G. & Owen M.D.K, 2003). In this case the variable crop productions systems were crop rotations and fertilization systems. Dates acquired in a 40-years period certify high importance concerning weed population dynamic of both crop rotation and fertilzation system, hereto both factors must be consider as an complex.
Several authors are discussing: are weed population dynamic chaotic (Freckleton & Watkinson, 2002)? Concerning dominant weed species we can answer: no, weed populations are dynamically stable, nevertheless their distribution it is possible to restrict with cultural management methods, in this case- number of crops and its sequence in rotation. The order of crops in a crop rotation will affect the wed population growth rate and its sensitivity to changes (Mertens, 2002). Crop rotation is one of the most effective cultural practices for improving long-term weed control because it aids in controlling weeds by providing the opportunity to plant highly competitive crops, which prevent weed establishment. Some production systems which utilize rotation to small seeded legumes or other densely grown perennial grass-legume forage mixtures are effective in reducing populations of some perennial weeds (Lapins & Lejina, 1997; Mikelsons, 1980).
Because many common grass seed weeds have a soil seed bank lifetime exceeding six years (Lejins, 1979), crop rotation will not entirely eliminate them, but their population density in new stands can be reduced to levels that are nearly undetectable in the field. We must to consider with fact that weed population shift may occur with an existing weed population in the weed community. Studies of weed infestation dynamic in Central part of Latvia, at what also investigation site belong, shown that 60 weed species were established, but in all the crop sowings 10 species were predominant (Vanaga, 2001). Fixiert amount of weeds in experimental field is nearly 2 times less that affirm facts find of many other authors (Ausmane et al, 2003; Hansson et al, 2001; Lapins, 1999; Lazauskas, 1995; Malecka, 2003; Recksiedler; Urbanowitch et al, 2002; Vincent et al, 2001): agricultural management (crop rotation, techniques, varieties, etc.) at specific site is uppermost, weeds are a symptom of field management.
Hartzler (Hartzler, 1999) predicate: “although our understanding of factors that drive weed infestations has greatly improved in recent years, the potential for using this information to enhance weed management programs is still unclear”. This article author’s point of view is more optimistic. References
AUSMANE M, LIEPINS J, & MELNGALVIS I (2003) Influence of reduced soil tillage on weed
population in sowings of crop rotation. In: Proceedings in agronomy 5, Jelgava, 158-160. CIUBERKIS S (2002) Dependence of weed infestation of crops on the rate of manure in acid and
limed soils. In: Scientific aspects of organic farming, Jelgava, 137-140. FRECLETON RP & WATKINSON AR (2002) Are weed population dynamics chaotic? Journal of
Applied Ecology V, 39, 699-719. HANSSON ML, BOSTROM U, & FOGELFORS H (2001) Influence of harvest time and stubble
height on weed seedling recruitment in a green cereal. Acta Agric. Scand., Sect.B, Soil and Plant sci.51, 2-9.
HARTZLER B (1999) Spatial weed distribution: Can it be used to improve weed management. In: Proceedings of the 1999 Integrated Crop Management Conference, Dec 1-2, Iowa State University, http://www.weeds.iastate.edu/mgmt/qtr99-1/spatial.htm

6th EWRS Workshop on Physical and Cultural Weed Control 92 Lillehammer, Norway, 8-10 March 2004
HARTTZLER RG, & OWEN MDK (2003) Issues in Weed Management for 2004, http://www.extension.iastate.edu
LAPINS D (1999) Dynamics of weediness in Latvia during last fifty years. In: Agroecological optimization of husbandry technologies, Jelgava, 211-218.
LAPINS D & LEJINA B (1997) Crop rotations (Original title: Augu sekas.), Ozolnieki, 80. LAZAUSKAS P (1995) Strategy of non- chemical weed control. In: Challenges for weed science in
a changing Europe, 571-576. LEJINS A (1979) Recognition and abatement of weed seedlings. (Original title: Nezalu digstu
pazisana un apkarosana), Riga,137. LEJINS A (1986) Recommendation on abatement of weeds in the main field crops areas. (Original
title: Ieteikumi nezalu apkarosanai svarigako kulturaugu platibas). LZ LEZPI, Riga,15. LEJINS A & LEJINA B (2003) Investigations on crop rotation and weed control in oats, spring
wheat and buckwheat in long-term field trials in Skriveri during 1997-2000. In: Proceedings in agronomy 5, Jelgava, 143-151.
MALECKA S (2003) Competitive ability of barley varieties and weeds im agrophytocenosis. In: Proceedings in agronomy 5, Jelgava, 151-155.
MERTENS SK (2002) On weed competition and population dynamics. Considerations for crop rotations & organic farming. Wageningen University dissertation no. 3282.
MIKELSONS V (1990) Clover, stable manure, fertilizer and humus balance. (Original title: Ābolins, kūtsmesli, minerālmēsli un humusa bilance intensīvajā tīrumu augu sekā). Riga, 53.
URBANOVITCZ J, PAWINSKA M, & ERLICHHOWSKI T (2002) Evaluation of weed infestation and developments in weed control in potato. In : Abstracts of papers and posters Potatoes Today and Tomorrow, 10 .
RASINS A & TAURINA M (1982) Methodic of counting of weeds in Latvia conditions. (Original title: Nezāļu uzskaites metodika Latvijas apstākļos). Riga, LMZTIP, 24.
RECKSIEDLER B, BRENZIL C, TREMBLAY M, JANS D, & GOODWLLIE D (2001) Principles of sustainable weed management for croplands. Saskatchewan Agriculture and Food. http://www.attra.org/attra-pub/wee.html.
ANNUAL REPORTS. (Original title: Gada pārskats). Priekuli, 1958.,1970.,1977.,1980.,1990.,1995., 2002.
VANAGA I (2001) Weed infestation dynamics in observation fields in Vidzeme region 1997-2000. (Original title: Nezāļu inficēšanās dinamika Vidzemes reģionā 1997-2000. With English summary). In: Science for developing of rural area, 46-51.
VINCENT C, PANNETON B, & FLEURAT-LESSARD F (2001) Physical control methods in plant protection, 329.

6th EWRS Workshop on Physical and Cultural Weed Control 93 Lillehammer, Norway, 8-10 March 2004
Mechanical weed control and engineering
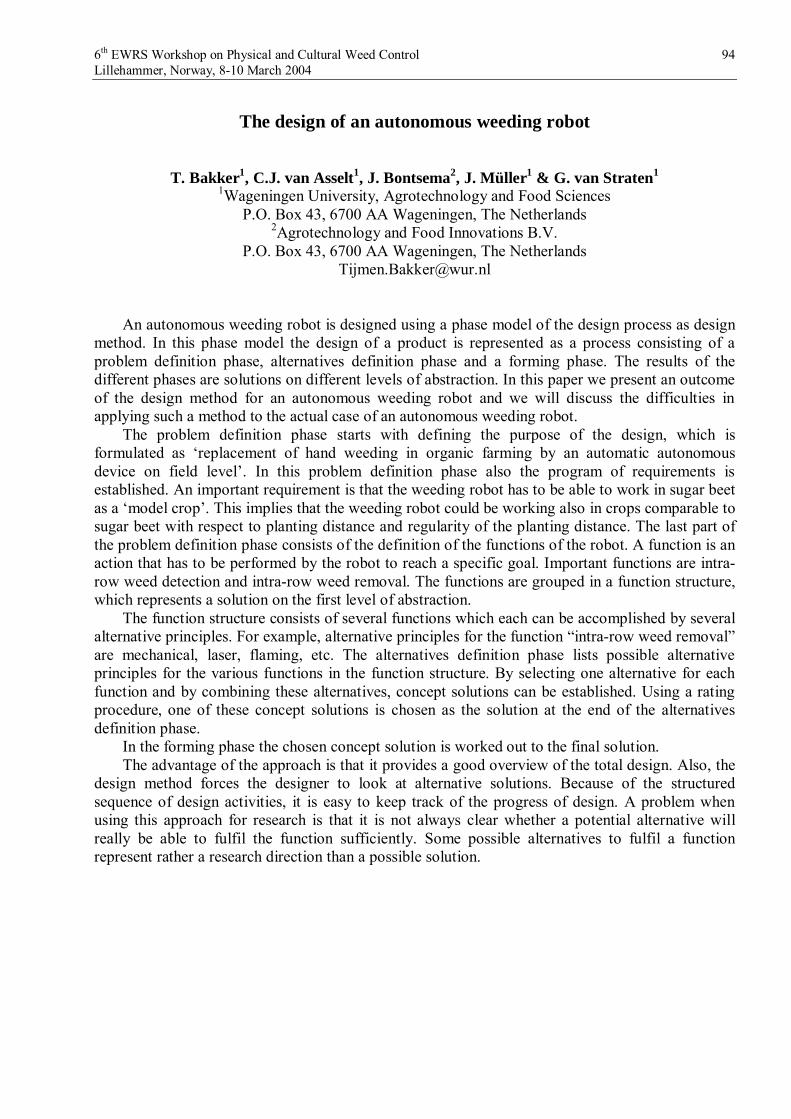
6th EWRS Workshop on Physical and Cultural Weed Control 94 Lillehammer, Norway, 8-10 March 2004
The design of an autonomous weeding robot
T. Bakker1, C.J. van Asselt1, J. Bontsema2, J. Müller1 & G. van Straten1
1Wageningen University, Agrotechnology and Food Sciences P.O. Box 43, 6700 AA Wageningen, The Netherlands
2Agrotechnology and Food Innovations B.V. P.O. Box 43, 6700 AA Wageningen, The Netherlands
An autonomous weeding robot is designed using a phase model of the design process as design method. In this phase model the design of a product is represented as a process consisting of a problem definition phase, alternatives definition phase and a forming phase. The results of the different phases are solutions on different levels of abstraction. In this paper we present an outcome of the design method for an autonomous weeding robot and we will discuss the difficulties in applying such a method to the actual case of an autonomous weeding robot.
The problem definition phase starts with defining the purpose of the design, which is formulated as ‘replacement of hand weeding in organic farming by an automatic autonomous device on field level’. In this problem definition phase also the program of requirements is established. An important requirement is that the weeding robot has to be able to work in sugar beet as a ‘model crop’. This implies that the weeding robot could be working also in crops comparable to sugar beet with respect to planting distance and regularity of the planting distance. The last part of the problem definition phase consists of the definition of the functions of the robot. A function is an action that has to be performed by the robot to reach a specific goal. Important functions are intra-row weed detection and intra-row weed removal. The functions are grouped in a function structure, which represents a solution on the first level of abstraction.
The function structure consists of several functions which each can be accomplished by several alternative principles. For example, alternative principles for the function “intra-row weed removal” are mechanical, laser, flaming, etc. The alternatives definition phase lists possible alternative principles for the various functions in the function structure. By selecting one alternative for each function and by combining these alternatives, concept solutions can be established. Using a rating procedure, one of these concept solutions is chosen as the solution at the end of the alternatives definition phase.
In the forming phase the chosen concept solution is worked out to the final solution. The advantage of the approach is that it provides a good overview of the total design. Also, the
design method forces the designer to look at alternative solutions. Because of the structured sequence of design activities, it is easy to keep track of the progress of design. A problem when using this approach for research is that it is not always clear whether a potential alternative will really be able to fulfil the function sufficiently. Some possible alternatives to fulfil a function represent rather a research direction than a possible solution.

6th EWRS Workshop on Physical and Cultural Weed Control 95 Lillehammer, Norway, 8-10 March 2004
The Swiss pocket knife concept for crop nursing
R. Bauermeister, R. Total, P.O. Bleeker1 & D.T. Baumann Agroscope FAW Wädenswil, Swiss Federal Research Station for Horticulture,
P.O. Box 185, CH-8820 Wädenswil, Switzerland. 1Applied Plant Research, P.O. Box 430, 8200 AK Lelystad, The Netherlands
Introduction Numerous tools and implements for physical weed control have been developed and optimised
in the last decade including innovative techniques for selective weed control. However, various tools will have to be applied to control weeds in different crops, growth periods and conditions. Due to lack of standardisation between implements and laborious adjustment operations for the tools producers are forced to buy a wide range of machinery which, particularly for small farms, cause unbearable investment costs. For small structured farms with a large variety of crops a light, flexible and easy to use crop nursing system would be ideal. Therefore a project was started at Agroscope FAW Wädenswil with the objective to develop a sophisticated crop nursing system. Concept
Components of this so called Swiss pocket knife concept for crop nursing are a light weight and inexpensive tool carrier and a user guide which enables practitioners to optimally apply commercially available tools and implements under there site specific conditions. Multifunctionality, flexibility, and easy to use are key requirements of the Swiss pocket knife concept. The tool carrier FOBRO-Mobil of the Bärtschi-FOBRO AG company, Hüswil (CH) was used as a basis. Advantages are its lightweight, the task specific engine power, its economics and the low initial costs. Size and hydraulic power transmission makes it a very manoeuvrable and benefits the ergonomic design. As a Swiss pocket knife, the tool carrier is multifunctional. Weed control is mechanically and/or thermally possible in and between crop rows. At the same time cover crops can be drilled and/or fertilizer be applied with high precision. The combination of carrier and tools is very flexible to use because it can easily be adapted to specific conditions such as soil type, crop stage, weed stage and population, climatic and topographical conditions. The tools are clearly arranged, easy accessible and controllable. A hydraulic guidance system allows to adjust the tools online during the work, potentially with optical guidance devices. Result
In close cooperation with the machinery industry and vegetable growers new tools were developed. Tools and guidance system are extensively tested in various vegetable crops and under a wide range of field conditions. One of these new developments is an actively vibrating hoe which allows a very shallow and precise soil treatment close to crop plants. Results and experiences from practical use of the tools are now used to work out an decision support system. Based on this decision support system a user guide will provide all necessary information for the farmer to find the most suitable tool and adjustment for the current crop, weed and field situation.

6th EWRS Workshop on Physical and Cultural Weed Control 96 Lillehammer, Norway, 8-10 March 2004
Discussion As there is not one Swiss pocket knife, there are many combinations of tools which can be combined to specifically meet the requirements of a vegetable grower. Although, the concept is designed for small farms its adaptability and the guide which helps the farmers to take the right decisions for technology and timing of weed control makes it likewise interesting for large farms. The tool carrier and most of the tools are commercially available but there is more work to do to improve tools and to optimize treatment combinations. The users guide for an efficient and labour saving use of mechanical and thermal weed control will be available in early 2005. Hopefully it will then help to promote the use of non-chemical weed control techniques in vegetable production. References LICHTENHAHN M, KOLLER M, DIERAUER HU & BAUMANN DT (2002) Unkrautregulierung –
termingerecht und schlagkräftig. Forschungsinstitut für biologischen Landbau, Frick, Switzerland.
TOTAL R & BAUMANN DT (2002) Das Schweizer Taschenmesser für die Unkrautbekämpfung, Der Gemüsebau 6A, 34.
BLEEKER PO, KURSTJENS DAG & WEIDE RY (2002) Experiences and experiments with new intra-row weeders. Abstract Workshop Physical Weed Control, Pisa, Italy.

6th EWRS Workshop on Physical and Cultural Weed Control 97 Lillehammer, Norway, 8-10 March 2004
Different strategies to improve mechanical intra-row weed control in bulb onions
P.O. Bleeker, D.A. van der Schans & R.Y. van der Weide
Applied Plant Research, P.O. Box 430, 8200 AK Lelystad, The Netherlands Email: [email protected]; [email protected]; [email protected]
Objective
In organic farming weed control involves a lot of hand labour to remove the escaped weeds. From 2000 till 2002 research with new intra-row weeders showed the possibilities to improve farmers strategies. Reduction of manual weeding by 40 till 70 % was achieved. Most years crop yield reduction was less than 2 to 3 %.
In onions the period between sowing and emergence is mostly very long, 4 – 6 weeks. In this period a lot of weeds are emerging. In organic farming flame weeding is common practice. This is a standard strategy for organic farmers to start with a weed free crop of onions. An important disadvantage of flame weeding is the energy consumption. The question arises how important the strategy of weed-control before emergence of the onion is, for the way weeds can be controlled afterwards. Possibilities to improve mechanical weed control after emergence of onions was investigated as well. Method
In a field experiment the effect of flaming or harrowing before emergence of the onions and the combination with different options for the mechanical weed control after emergence of the onions were tested. The treatments before emergence of the onions were: A. Two or tree times harrowing with a springtine harrow. B. The same as A, but the harrow covered to prevent light (and new weeds germinating). C. Flaming, when the first onions are emerging.
After the onions did emerge, over this three treatments, five weeding treatments were applied, to invest the interaction with: A. Only hoeing B. Hoeing with the fingerweeder C. Hoeing with the torsionweeder D. Hoeing with the finger- and the torsionweeder E. Flaming (onions 5 á 6 cm.)
The weeds were counted before the first treatment and after two treatments. After two treatments the trial was made weedfree by manual weeding. The time needed for this manual weeding, was also registrated. In border beds of the onions, where nothing was done before the onions emerged and only hoeyed at the same time as the trial, the weeds were counted at four places and also the time needed for manual weeding in this ‘untreated’ plots was recorded.

6th EWRS Workshop on Physical and Cultural Weed Control 98 Lillehammer, Norway, 8-10 March 2004
In a other trial at the same field there was tested how important the steering precision was for the finger- and the torsion weeder. The objects in the trial were combinations of different; working depth, overlap and the position of the intrarow weeders compared to crop row position. The beds in the trial had five rows and the three rows in the middle of the bed were used for the observations. Also this experiment had 4 replicates. Results and discussion
Before emergence of the onions the treatments of the harrow were treated twice. Harrowing was done by a flexible chain harrow, which was turned upside down, working depth was about 1 cm. The last time of harrowing the onions were about 0,5 cm below the soil surface. In one of the treatments the harrow was covered by black plastic and a canvas plaid. The effect in this trial was neglectable (table 1). The covering must protect the weed seeds for a light signal, so they don’t get a new impuls to germinate. The working depth of the harrow was little (1 cm) so it was not suprising that only few new weed seeds did get a new light impuls. In another expriment in onions we did get an almost significant effect of around 40% less Stelaria media by covering the harrow just before emergence of the onions.
Flaming when the first onions emerged resulted in more weed reduction than harrowing prior to emergence. (table 1).
The yield at the harrowed plots was much lower (about 10%) than at the flame weeded plots. Probably weed concurrence (density and the size of the weeds) were the reason of this lower yield. After two times mechanical weeding (size of the onions 5 and 8 cm) the weeds that have been left, where removed by hand. For the harrowed plots this was too late and competition did already occur. To start in time with manual weeding seems important.
The treatments after crop emergence showed that mechanical intrarow weeding starting when the onions did have 2 leaves was possible. Weed population decreased by 50 till 60 % ( Table 2) and also hours manual weeding decreased a little bit more. The weeds were only counted in the not hoeyed parts close to the row (6 cm). The yield of the different treatments after emergence were almost the same. Only flaming in the crop stage of 5 á 6 cm showed a lower yield. This yield reduction was more than was found in earlier trials. The reason of this isn’t clear. In the earlier trials the onions at this object died two or three week later than the other treatments. This year there was no difference between the treatments in ripening. Maybe the warm and dry summer in the Netherlands was the reason that this year onions died earlier. There was no difference in diseases.
Table 1 Effects of the treatments before emergence of the onions on weed control before the start of the mechanical intra-row weeding on 8 may and effects of all treatments on crop plant reduction, reduction manual weeding and yield. % weed
control % plant
reduction % reduction
manual weeding
Yield (bruto 46,3 t/ha)
Yield ( 40 mm. 38,2 t/ha)
Harrow 0 (75) a 5,7 a 0 (83)2 44,4 a 35,0 a Harrow covered
5 (76) a 6,8 a 0 (82)2 44,8 a 36,5 a
Burning 66 (91) b 6,2 a 50 (91)2 49,7 b 43,2 b Lsd 3,67 32,11 (5,60)2 2,55 3,21 ( ) = percentage of weed control compared to the untreated plots. Untreated is non weedcontrol between sowing and emerging. ( )2 = percentage reduction manual weeding in relation to the untreated plots.

6th EWRS Workshop on Physical and Cultural Weed Control 99 Lillehammer, Norway, 8-10 March 2004
Table 2 Effect of the treatments after onion emergence after two times of mechanical weed control on 3 juni, on weed control, crop plant reduction and yield. % weed
control % plant
reduction % reduction
manual weeding
Yield (bruto 46,3 t/ha)
Yield (< 40 mm. 38,2 t/ha)
Hoeing 0 (71) a 3,2 a 0 (71)2 47,9 b
398 b
Hoeing + fingerw. 51 (83) b
5,9 ab 48 (85)2 46,9 ab
387 b
Hoeing + torsionw.
55 (86) b
10,7 c 65 (90)2 46,0 ab
390 b
Hoeing + finger- and torsionw. 1
57 (87) b
8,7 bc 64 (90)2 47,9 b
406 b
Hoeing + burning Onions 5 á 6 cm.
62 (89) b
3,5 a 69 (91)2 43,2 a 336 a
Lsd 4,13 17,96 (5,21)2 3,79 4,86 1 = The first time only hoeing + finger weeding. ( ) = percentage of weed control compared to the untreated plots. Untreated is non weedcontrol between sowing and emerging. ( )2 = pergentage reduction manual weeding in relation to the untreated plots.
The other trial demonstrated that working depth and overlap of torsion- and the finger weeders determinated plant loss and weed control to an importand extend. Figure 1 shows that after three treatments more overlap between the tines gave more plant loss and a little bit better weed control. When the tines of the torsionweeder were not centered exactly to the middle of the crop row, the crop loss rised from 10 to 30 % (data not in abstract).
Figure 2 shows that by the fingerweeder depth and overlap gave also an effect but this was less than by the torsionweeder. When the fingerweeder didn’t go exactly over the row, the crop loss was much less than by steering deviations with the torsionweeder (data not in abstract).
Figure 1. The effects of overlap and working depth of three treatments with the torsion weeder on
plant loss and weed control.
torsionweeder
05
101520253035404550
D=1;O=-1
D=1;O=0
D=1;O=1
D=2;O=-1
D=2;O=0
D=2;O=1
D=3;O=-1
D=3;O=0
D=3;O=1
adjustment
perc
enta
ge
plantlosssurvived weed
D = depth, O = overlap

6th EWRS Workshop on Physical and Cultural Weed Control 100 Lillehammer, Norway, 8-10 March 2004
D = depth, O = overlap Figure 2, The effects of overlap and working depth of three treatments with the fingerweeder on
plant loss and weed control.
In the future new machinery or new ways of crop cultivation will become more important especially when manual hand weeding remains expensive and it becomes difficult to get good workers to do the job every year. New trials must give answer on the question why the yield on the harrowed plots was so much lower and whether it is possible to further improve strategy for weed control in onions. In 2004 we will start to investigate whether it is possible to use new intelligent intra row weeders (Pneumat, Sarl Radis and Inventicon) in onions in combination with planting the onions.
To improve efficacy of mechanical weed control, innovations should focus sensoring techniques, to determine position of crop rows and plants, and accurate steering devices for weeding equipment.
fingerweeder
0
5
10
15
20
25
30
D=1;O=0
D=1;O=1
D=1;O=3
D=2;O=0
D=2;O=1
D=2;O=3
D=3;O=0
D=3;O=1
D=3;O=3
adjustment
perc
enta
geplantlosssurvived weed

6th EWRS Workshop on Physical and Cultural Weed Control 101 Lillehammer, Norway, 8-10 March 2004
Defining optimal conditions for weed harrowing in winter cereals on Papaver rhoeas L. and other dicotyledoneous weeds
A. Cirujeda1 & A. Taberner 1, 2, 1 Departament d’Hortofructicultura, Botànica i Jardineria, Universitat de Lleida, Spain.
2 Plant Health Service, Weed Science, Lleida, Generalitat de Catalunya, Spain. Abstract
Thirteen field trials have been conducted in Catalonia between 1998 and 2003 on different
winter cereal fields highly-infested with Papaver rhoeas L. or, in two cases, with mixed dicotyledoneous weeds. The tine-harrow was used in a single pass as the only weed control method. Different climatic characteristics, state of the soil, size of the weeds and development of the crop were compared with weed control efficacy. Highest efficacy (>85%) was obtained in those trials with sunshine during and some time after the treatment and where no rainfall occurred at least 15 days afterwards. Efficacy was generally higher with P. rhoeas plants having a diameter less than 5 cm even if good results were also found for bigger plants provided that the crop was well-developed and showing competitive capacity. Another observation was that similar final efficacy values were achieved starting with different initial efficacy values. Initially low efficacy increased due to weed mortality caused by non-favourable climatic conditions for the weeds during the cropping cycle after harrowing or by strong crop competition. Initially high efficacy decreased in some cases due to new germination stimulated by the harrowing. The results observed for P. rhoeas were very similar for other tap-rooted dicotiledoneous weeds as Lamium amplexicaule, Daucus carota, Anthemis arvensis, Lactuca serriola and Capsella bursa-pastoris, frequent at two of the trials.
After confirming and defining the potential use of the harrow in the present conditions the next
step is to combine this tool with cultural or other preventive methods as sowing delay, soil ploughing, crop density modification or crop rotations, this is, using the tool within all the crop management practices. Introduction
The tine-weed harrow is still used mainly by organic farmers both in Spain as in Northern
Europe. Despite its long existence this tool has not widely accepted in Spain where the herbicides are still the main weed control used. However, there is an increasing interest at the conventional cereal production sector to combine the harrow with herbicides. This has been for example shown in the machinery exhibition September 2003 at Lleida (North-Eastern Spain) where a tine-harrow has been rewarded with a price in order to promote its use. Another aspect that encourages to do research with this tool is the increasing demand of organic cereal by organic livestock breeders at the Pyrenees, which are not able to furnish themselves with enough cereal. Together with crop rotation and soil preparation harrowing is the main weed control tool in organic cereal production, justifying the studies.
Work has been done in the last years in different parts of the country with the aim of getting to know the possibilities offered by this tool in the characteristic climatic and soil conditions of the Southern European area. Between others, contributions have been done by MOYANO et al. (1998), LEZAÚN et al. (2001), PARDO et al. (2001), CIRUJEDA (2001).

6th EWRS Workshop on Physical and Cultural Weed Control 102 Lillehammer, Norway, 8-10 March 2004
Intuitively, the most important factors on weed control are dry but not hard soil, dry climatic conditions if possible with wind or sunshine, small weeds and, with the aim to achieve a good selectivity and good competition, a well-established crop growing, if possible, after harrowing. In fact WILSON et al., (1993) state that in North European conditions it is often difficult to find a dry period in autumn and winter so that weeds are often too big to be harrowed effectively. This can also occur in our conditions even if probably not most of the years. This way It should be noticed that the wished conditions of environmental and soil dryness are the opposite of the conditions needed for herbicide control (AIBAR y ZARAGOZA, 1987).
As during the last years some experience has been accumulated on the most limiting factors for weed efficacy with the tine-harrow in winter cereal the following work aims to check which are the optimal conditions to achieve maximum efficacy. This way it could be possible to define what can be expected by the harrow and which are the best conditions to use this tool. In a second step it is aimed to combine the harrow with other weed control methods. Materials and Methods
Eleven trials have been conducted during the seasons 1998-99 until 2002-03 at different locations of the Lleida province at Baldomar (B), Torrelameu (T), Sanaüja (S) and Lleida (Ll). Two more trials were conducted at the Barcelona province at Nalec (N). In all cases the crop was winter cereal. Fields were highly infested with herbicide resistant poppy (Papaver rhoeas L.) excepting the field at Lleida, where the field was homogeneously infested with 14 different dicotyledoneous species.
Table 1 contains the details on soil texture, stoniness and rainfall during the crop cycle (October to June) as well as the initial weed density in each location and year. Table 1: Main characteristics of the tested sites. The considered species were Papaver rhoeas in all
cases excepting Lleida where the dicotyledoneous flora was considered as a whole. The dominating species were Lamium amplexicaule, Daucus carota, Anthemis arvensis, Lactuca serriola, P. rhoeas and Capsella bursa-pastoris. Year Baldomar Nalec Torrelameu Sanaüja Lleida
Soil type Loamy sand
Silt loam Loam Silt loam Silt loam
Stoniness Low Medium High Low Low
1998-99 51 240 75 - -
1999-00 77 139 453 - -
2000-01 36 263 - 314 -
2001-02 127 - - - 266
Initial weed density
(plants m-2)
2002-03 230 - - - 367
1998-99 421 253 298 - -
1999-00 338 295 273 - -
2000-01 372 262 - 350 -
2001-02 321 - - - 257
Total rainfall (mm)
October – June
2002-03 436 - - - 325

6th EWRS Workshop on Physical and Cultural Weed Control 103 Lillehammer, Norway, 8-10 March 2004
The harrow used was trademark Einböck with three parts measuring 1,5 metres width each. Each 1,5 linear meters count 10 spikes so that each part counts 60 tines and the total harrow, 180.
With the aim of simplifying the comparison between years and sites presented data refer to a single harrowing treatment as early as it was possible excepting the trial at Baldomar in 2002-03 where the harrow was used twice due to the new germination flush occurring after the first treatment.
Weed counts were done before and between 16 to 90 days after harrowing, depending on the trial, and being the last count at stem elongation stage of the cereal. Therefore, three counts per plot were done in 0,1 m2 squares, in some cases randomly, in other cases in fixed measuring areas. The plots measured 3 or 4,5 meters width and 10 meters length, depending on the trial.
Efficacy was calculated taking into account the plant density before the treatment. Calculation was done following: % efficacy = (1-Td / Ta) x 100, where Td is the number of weeds in the plot after treatment and Ta is the number of plants before treatment. Results
Table 2 contains observations on the soil conditions, weed size, climatic aspects, natural weed mortality at the end of the cropping cycle and the final efficacy. As it is shown in this table, observed efficacy was irregular within years regardless of the location. It should be pointed out that very different situations lead to the same results. This was for example observed in the trials of Lleida 2001-02 (L02) and Baldomar 2001-02 (B02). In the first case, initial efficacy was low due to the big size of weeds. Crop competition afterwards, sown in higher density as normally, increased strongly efficacy reaching the same results at the trial conducted at Baldomar in 2001-02 on smaller weeds with high efficacy since the beginning.
It was also observed that even if crop competition was strong, this was not enough when weeds were already big at the treatment date (Baldomar 1998-99, Sanaüja 2000-01 and Baldomar 2000-01).
As described in Table 2 efficacy changed in time. Efficacy decrease and increase occurred depending on the trial and year. Efficacy decrease was in most of the cases due to recover of buried weeds. In three cases this decrease were caused by new germination flushes caused by the harrow. This was observed at the trials Nalec 1998-99, Torrelameu 1998-99 and Baldomar 2003.
At the trials conducted in Lleida final control of the dicotyledoneous weeds was very high in both years due mainly to the strong competition with the crop. Surviving plants hardly developed seeds and were very small. Discussion
Highest efficacy was found at Baldomar during the season 1999-2000 (B00), Baldomar 2001-
02 (B02), Lleida 2001-02 (L02) and Torrelameu 1999-2000 (T00) (Table 2). Common characteristics in these cases were dry or soils at proper moisture conditions, small P. rhoeas size (excepting Lleida 2001-02 where strong crop competition compensated the bigger weed size) and a dry climate at least 15 days after treatment. It is surprising that crop competition shortly after treatment does not seem to be important on control when weeds were small at treatment.

Table 2: Description of the different characteristics of the soil, weeds and climatic conditions after treatment and the crop development. Data is
ordered following increasing final efficacy. N: Nalec, T: Torrelameu, B: Baldomar, L: Lleida.
N99 T99 B99 S01 B01 B03 N00 L03 N01 B00 B02 L02 T00
Very dry * * Dry * * * * * Proper soil condition * * * * Soil stage
Moist * * 0.7-3 * * * * * 1-3 * 1-5 * 1-7 3-5 * * * * *
P. rhoeas size (cm diameter)
3-8 * 13-14 * 13-21 * 21-22 * * * 22-23 * * *
Crop stage (BBCH)
23-24 * * * * * Several days of sunshine and wind; afterwards, rain. * *
Moisture few days after treatment. * * Climatology
after treatment Several days of sunshine; afterwards
drought for more than 15 days. * * * * * * * * *
Not well established, irregular emergence due to drought. * *
Little competition; small crop, it’s still cold or lack of moisture. * * * * *
Good competition later on. * *
Crop development
after treatment
Good competition. * * * * * Efficacy (%) 70-10 86-40 53 22-61 60-64 60-67 94-72 61-73 83-77 90-85 90-86 30-90 91-99 Days after treatment 22-35 25-54 36 23-50 16-44 37-68 16-50 38-71 17-66 12-50 16-90 24-50 8-96 Natural mortality at the end of the cropping cycle (%) 11 53 16 38 65 11 36 45 48 72 24 70 68

6th EWRS Workshop on Physical and Cultural Weed Control 105 Lillehammer, Norway, 8-10 March 2004
Another remarkable aspect is that in the other trials, despite efficacy was under 85% at the final evaluation, weed population was very reduced at the end of the cropping cycle (after the assessment). This was especially evident for the trials at Sanaüja 2000-01 and Lleida 2002-03. Another important final mortality is not reflected for the trial at Baldomar 2002-03 where a dry period in March decreased the P. rhoeas population strongly. At Baldomar 2000-01 a late frost also decreased final P. rhoeas population without that this could be reflected numerically.
The most limiting factor for P. rhoeas control using the harrow only has been observed to be the size of the weeds. When exceeding 5 cm diameter, approximately, this species develops a strong tap-root system making mechanical control very difficult. In some cases the moist autumn and winter situations described by WILSON et al., (1993) occurred also in the Mediterranean climate making it difficult to harrow at the appropriate moment.
Another key-factor for dicotyledoneous weed control by harrowing (including P. rhoeas) are that the climatic conditions during and after the treatment should be dry. When these conditions are not fitted, however, it has been observed that crop competition at the end of the cycle or a drought period can also reduce considerably P. rhoeas density, which survived the harrowing.
No important difficulties have been observed by using the harrow in moderately stony fields. What is more important is an even soil, avoiding wheel tracks where the tines can not reach the soil properly.
The obtained efficacy was in many cases lower than 80%. Therefore, in fields with a very high infestation this technique should be combined with other tools as crop rotation, sowing delay, ploughing etc. The use of the tine-harrow as a simple substitute of herbicides is often not an effective enough control method. References AIBAR J & ZARAGOZA C (1987) Estimación de las ocasiones favorables para realizar tratamientos
herbicidas en cereales aplicando datos meteorológicos. ITEA 71, 41-54. CIRUJEDA A (2001) Integrated management of herbicide resistant Papaver rhoeas L. populations.
PhD Thesis, Department of Botany and Hortofruticulture, University of Lleida, Spain. LEZAÚN JA, LAFARGA A & ARMESTO AP (2001) Control de las malas hierbas por métodos no
químicos. Proceedings of the XX Meeting of the Working Group on Weed Science and Herbicides, Jerez de la Frontera, Spain, 2001, 33-35.
MOYANO A, BENITO M, CARRAMIÑANA N & CIRIA Mª P (1998) Control mecánico de malas hierbas y su efecto sobre la producción de cebada y trigo en Soria. Proceedings of the III Congress of the Spanish Society of Organic Agriculture, 129-134.
PARDO G, VILLA F, AIBAR J & ZARAGOZA C (2001) Control de flora arvense y daños causados al cereal por una grada de varillas flexibles según la profundidad de trabajo y el número de labores efectuadas. Proceedings of the XX Spanish Working Group on Weed Science and Herbicides, Jerez de la Frontera, España, 37-41.
WILSON BJ, WRIGHT KJ & BUTLER RC (1993) The effect of different frequencies of harrowing in the autumn or spring on winter wheat and on the control of Stellaria media (L.) vill., Galium aparine L. and Brassica napus L. Weed Research 33, 501-506.

6th EWRS Workshop on Physical and Cultural Weed Control 106 Lillehammer, Norway, 8-10 March 2004
Crop growth stage susceptibility to rotary hoe cultivation in narrow row and wide row soyabean cropping systems
D.C. Cloutier1 & M.L. Leblanc2 1Institut de malherbologie, Ste-Anne-de-Bellevue, QC, Canada
2Institut de recherche et de développement en agroenvironnement, Saint-Hyacinthe, QC, Canada Introduction
The objectives of this project were to investigate soyabean response to row spacing
management systems, to evaluate the effect of tractor wheel tracks on soyabean yield in a narrow row system and to determine the susceptibility of various growth stages of soyabean to physical damage caused by cultivation with the rotary hoe in drilled and row planted soyabeans in a weed free situation. This three year experiment was conducted from 1999 to 2001. Soyabeans were systematically cultivated with a rotary hoe from the pre-emergence to the third trifoliate leaf stages in order to determine their susceptibility to cultivation. Two and three cultivations were done on a combination of growth stages. Selective herbicides were used to keep fields weed-free to avoid confounding effects between weed interference and cultivation. Within this project, narrow rows (17.6 cm spacing, planted with a drill seeder) production systems were compared with conventional rows (76 cm spacing, planted with a row planter) production systems. Materials and methods
The experiments were conducted on the IRDA research station, Saint-Hyacinthe, Quebec, Canada. Fields were kept weed free to avoid confounding effects on the crop between weed interference and cultivation with the rotary hoe by using selective herbicides: metolachlor, linuron, fenoxaprop-p-ethyl or bentazon applied as recommended for soybean. The soil type was St-Damase sandy loam (1999), Dujour clay loam (2000) and a Duravin loam (2001). Fertilization followed provincial recommendations. The experimental design was a split-plot with 4 replications. Main plot treatments: rotary hoeing
Main plots were 6 m wide x 6 m long. Main plots were cultivated once at different soybean growth stages from preemergence to 3rd trifoliate leaf. The cultivator used was the rotary hoe (Figure 1). There was also a control treatment that was not cultivated. Subplot treatments: row spacing management systems
Subplot sizes were 3 m wide x 6 m long. The soyabean variety Korada was seeded at a depth of 3.5 cm on 1999/05/06, 2000/05/17 and on 2001/05/12. The row spacing was 0.176-m (seeded with a 16-row International 510 drill (Figure 2)) or 0.76-m (seeded using a 4-row John Deere MaxEmerge2 7200 planter (Figure 3)). Results Tractor wheel tracks
Soybean population was reduced only on the wheel tracks when cultivation was done at 3rd trifoliate leaf stage (Table 2). Crop emergence was greater in the wheel tracks than in the remainder of the plot for the non-cultivated control. Soybean yield decreased significantly on the wheel tracks

6th EWRS Workshop on Physical and Cultural Weed Control 107 Lillehammer, Norway, 8-10 March 2004
when cultivation was done later than the 1st unifoliate leaf stage. Grain humidity at harvest varied between 12.4 and 13.3 %. It was not significantly different among cultivation treatments but was slightly lower (less than 1 %) on the tractor wheel tracks in the treatment that was cultivated at preemergence, the 2nd trifoliate leaf stage and in the non-cultivated control than between tracks. The 1000-grain dry weight varied between 186.2 and 194.7 g. No significant difference was observed between cultivation treatments but it tended to decrease on the tire tracks and was 7 g lower in the treatment that was cultivated at the 2nd trifoliate leaf. Table 1. Date, soybean growth stages and soybean height at which the cultivation treatments were done in the main plots.
1999 2000 2001 Date
(m/d) Height (cm)
Date (m/d)
Height (cm)
Date (m/d)
Height (cm)
Growth stages Planter Drill Planter Drill Planter & Drill Planter & Drill Preemergence (V0) 05/13 05/13 2 2 05/23 - 05/10 -
Hook (VE) 05/16 05/14 3 3 05/30 Soil cracking 05/11 Soil
cracking 1st unifoliate leaf (V1) 05/21 05/23 12 12 06/09 4 05/22 6
1st trifoliate leaf (V2) 05/31 06/05 14 14 06/21 10 06/01 9
2nd trifoliate leaf (V3) 06/05 06/07 20 14 06/28 17 06/08 15
3rd trifoliate leaf (V4) 06/07 06/09 06/29 20 06/11 19
Figure 1. Yetter rotary hoe, high-ground clearance model used in this project. Working width was 3
m., speed was 15 km h-1 and working depth was 4-5 cm.

6th EWRS Workshop on Physical and Cultural Weed Control 108 Lillehammer, Norway, 8-10 March 2004
Figure 2. Photo of the 16-row International 510 drill used to seed the soyabean in 0.176-m row
spacing.
Figure 3. Photo of the 4-row John Deere MaxEmerge2 7200 planter used used to seed the soyabean
in 0.76-m row spacing.

6th EWRS Workshop on Physical and Cultural Weed Control 109 Lillehammer, Norway, 8-10 March 2004
Table 2. Effect of the tractor wheel tracks in a narrow row spacing management system on soyabean population and yieldabc.
Treatments Population (plants/ha) Yield 14% (T/ha) One cultivation with rotary hoe at:
Between On wheel track
Signi- ficanced Between On wheel
track Sign-ficance
Preemergence (V0) 144628 169602 b NS 3.51 3.26 ab NS
Hook (VE) 152634 175852 b NS 3.50 3.39 ab NS 1st unifoliate leaf (V1) 151601 168130 b NS 3.57 3.35 ab NS
1st trifoliate leaf (V2) 156508 176136 b NS 3.68 2.99 bc *
2nd trifoliate leaf (V3) 156508 167898 b NS 3.54 2.40 d **
3rd trifoliate leaf (V4) 170712 150568 b * 3.69 2.67 cd ***
Non-cultivated control 156766 213068 a * 3.38 3.61 a NS
Significanced NS * NS *** a Data were pooled: as variances were homogenous and there were no significant interactionsbetween year and treatments. b There was a significant interaction between cultivation treatments and sampling positions(between or on the wheel track), therefore the analysis of variance was done by treatment and bysampling position. c Numbers in columns followed by the same letter are not significantly different at 0.05 level according to the Waller-Duncan test. d NS : non significant, * : significant at 0.05, ** : significant at 0.01, *** : significant at 0.001level according to F tests.
Growth stages susceptibility
For all the variables tested, there were no significant differences in susceptibility between the various growth stages of soyabean to physical damage caused by cultivation with the rotary hoe. These results were true both in drilled and in row planted soyabeans. Soyabean population tended to be greater in the non-cultivated control but differences were not statistically significant. Soybean response to row spacing management systems
Soybean population, yield, grain humidity at harvest and 1000-grain dry weight were significantly greater for the 0.76-m/planter (Table 3).

6th EWRS Workshop on Physical and Cultural Weed Control 110 Lillehammer, Norway, 8-10 March 2004
Table 3. Soybean response to row spacing management systemsa
Row
spacing/seeder treatments
Population (plants/ha)
Yield 14% (T/ha)
Grain humidity at harvest
(%)
1000-grain dry weight
(g) 0.176-m/drill 161322 3.40 12.81 192.69 0.76-m/planter 470847 3.56 13.12 195.28 Significanceb * * * * a Data were pooled: as variances were homogenous and there were no significant interactions between year and treatments or between cultivations treatments and row spacing management systems. b * : significant at 0.05 level according to F tests.
Discussion and conclusion
Crop stand was less in the treatments planted with the drill seeder rather than with the row planter. The soybean population represented only 28 and 73 % of seeding rate in 0.176-m drill seeder and 0.76-m planter, respectively. This difference is probably due to the absence of press wheels on the drill seeder and to the increased emergence (through soil cracking) of the row planted soybean. A soybean population 290 % greater (row planter vs drill seeder) only increased yield by 5 %, indicating that soybean is very plastic and could have a lower seeding rate. Yield losses due to wheel tracks increased as cultivation was done later, indicating that soybean cannot compensate for late physical damage.

6th EWRS Workshop on Physical and Cultural Weed Control 111 Lillehammer, Norway, 8-10 March 2004
Water-jet cutting of potato tops – some experiences from Sweden 2003
F. Fogelberg Swedish University of Agricultural Sciences, Dept. Crop Science, POB 44, SE-230 53 Alnarp,
Sweden. E-mail: [email protected]
In Swedish potato production, the haulm is generally controlled before harvest. This operation can be carried out either by a chemical treatment with karfentrazonetyl or dikvat, or by crushing in combination with flaming. Chemical defoliation of potato tops is a standard method for most producers but there is an increased use of crushing and flaming, especially in potatoes intended for crisps. The “crushing and flaming-method” is considered as a more environmentally friendly method, but requires more working time compared to chemical defoliation since it generally only can cut four rows at a time.
A competitive physical method needs high cutting capacity, i.e. high driving speed and possibility to cut 8-12 rows at a time which, in turn, requires lower weight and less input of fossil fuel.
An interesting approach would be to use water-jet cutting for defoliation. The method is an industrial technique to cut plastics, metal and wood, blasting of metal constructions before painting, concrete demolishing. Water-jet cutting uses water with extreme pressures (2000-3000 bar) but has generally low water consumption (5-25 litres min-1). Basically, the method uses a high-pressure pump, high-pressure pipes/hoses and a nozzle made of synthetic sapphire. Water-jet cutting can be used either stationary for robotized cutting, or as a mobile unit operated by hand .
In August 2003, a commercial mobile unit mounted in a 10-feet container (Hammelmann high pressure pump unit HDP 114/Aquajet 11) with an operating pressure of 2350 bar was tested in potatoes to investigate the potential for cutting of potato haulm.
Different types of nozzles and water pressures were tested in field by the use of hand-held lance. Worker safety problems and potential development of the machine was identified.
It was concluded that a water pressure of 1000 bar was sufficient to cut the tops using a nozzle with 1.0 mm diameter. A water flow of 23 litres min-1 can supply about 20 nozzles with sufficient pressure and flow to cut potato tops. It was not possible to test cutting speed in field, but earlier studies have shown that cutting can be carried out by a speed of 18 km h-1.
Further experiments and a field prototype of a water-jet potato cutter will be developed in mid 2004 in cooperation with a Swedish manufacturer. References FOGELBERG, F & BLOM, A. 2001. Laser, UV-ljus och skärande vattenstråle som framtida metoder
för ogräsbekämpning. Institutionsmeddelande 2001:03, Institutionen för lantbruksteknik, Sveriges lantbruksuniversitet, Alnarp.
OHLSSON, L. 1995. The theory and practice of abrasive water jet cutting. Dissertation. Luleå University of Technology.

6th EWRS Workshop on Physical and Cultural Weed Control 112 Lillehammer, Norway, 8-10 March 2004
Seed mapping of sugar beet to guide weeding robots
H.-W. Griepentrog & M. Nørremark The Royal Veterinary and Agricultural University, Dept. of Agricultural Sciences,
AgroTechnology, Højbakkegaard Alle 2, DK-2630 Taastrup, Denmark Email: [email protected] and [email protected]
Individual plant care in agriculture will lead to new opportunities in crop management. Not only the weeding operation is in focus here but it will be more in general for individual chemical or physical treatments of individual weed or crop plants. For the application of fertilizers and chemicals in small dose rates and accurately targeted advanced sensor information e.g. based on spectral responses can be used to consider the individual plant needs ('the speaking plant'). This will have a significant effect on the reduction of inputs and increase the general efficiency rates of agricultural means.
The objective of this project was to provide high accuracy seed position mapping of a field of sugar beet to allow subsequent physical weeding as inter- and within-row treatments. By knowing where the seeds were placed the assumption was that the plants will show up close by. This information about where the individual plants are can be used to show where the crop rows are. Therefore, this can be used as an appropriate information for guiding tractors and/or implements. At least for steering operations for inter-row weeding this procedure can be sufficient.
A high accurate, cm-level, RTK GPS, optical seed detectors and a data logging system were retrofitted on to a conventional sugar beet precision seeder to map the seeds as they were planted (Nørremark et al., 2003). The average error between the seed map and the actual plant map was between 16 mm and 43 mm depending on vehicle speed and seed spacing (Griepentrog et al., 2003). Both parameters influenced the plant position estimates significantly. The seed spacing was particularly important because of its influence on the potential of seed displacements in the furrow after passing the seed detecting sensors.
The results showed that the overall accuracy of the estimated plant positions were acceptable for the guidance of vehicles and implements for weeding purposes as well as for individual plant treatments. This research is contributing to the ongoing Danish research project Robotic Weeding as a cooperative research project of The Royal Veterinary and Agricultural University (KVL), Frederiksberg and the Danish Institute of Agricultural Sciences (DIAS), Horsens. References GRIEPENTROG HW, NØRREMARK M, NIELSEN H & BLACKMORE S (2003) Individual plant care in
cropping systems. In: Proceedings 4th European Conference on Precision Agriculture, Berlin, Germany, 247-258.
NØRREMARK M, GRIEPENTROG HW, NIELSEN H & BLACKMORE S (2003) A method for high accuracy geo-referencing of data from field operations. In: Proceedings 4th European Conference on Precision Agriculture, Berlin, Germany, 463-468.

6th EWRS Workshop on Physical and Cultural Weed Control 113 Lillehammer, Norway, 8-10 March 2004
Achieving an optimal balance between machine vision capability and weed treatment effectiveness using competition models.
A.C. Grundy, C.M. Onyango1, K. Phelps, R. Reader & J.A. Marchant1
Horticulture Research International, Wellesbourne, Warwick, UK, 1Silsoe Research Institute, Wrest Park, Silsoe, Bedford, UK
To achieve greater precision in the detection and subsequent removal of weeds, an automated mechanical weeding device has been developed (by Silsoe Research Institute) that is guided by machine vision. Firstly it was necessary to test the algorithm of the detection system for its robustness over a range of different crop species. Secondly, the algorithm was tested for its ability to correctly classify crops and weeds during the early stages of crop establishment when physical weed removal would be typically implemented in the field. The detection system was linked with a competition model developed at Horticulture Research International. Using the competition model it was possible to demonstrate, in terms of final yield, the critical balance between increasing the sensitivity of the detection system vs. the possibility of, in doing so, misclassifying some crop plants as weeds and inadvertently removing them. A number of competition scenarios indicated that the detection system parameter settings to achieve optimum yields were particularly sensitive to the competitive ability of the weed species. For example, in the presence of a relatively uncompetitive weed, such as Veronica persica, crop yield was more sensitive to accidental crop removal than from weed competition. In contrast, yield loss was more attributable to weed competition than crop damage when in the presence of Tripleurospermum inodorum. Combining the detection system and the competition model in this way it was possible to simulate numerous scenarios. These simulations were used to demonstrate that optimum yield may not necessarily be achieved through simply maximising weed removal or minimising crop damage. Instead, optimum yields are more likely to be achieved through a “trade-off” strategy balanced for a specific crop and weed species combination. At present, the detection system may be able to achieve good classification of crop and weed material with operation speeds that are generally fast enough for real-time operation. However, if the accuracy of the actual removal method were relatively coarse then the whole system would become limited by this stage of the process. Therefore, development of this technology will ultimately depend on the associated weed removal technologies also being considerably more sophisticated in their ability to target and remove individual plants than at present.

6th EWRS Workshop on Physical and Cultural Weed Control 114 Lillehammer, Norway, 8-10 March 2004
Modelling the effectiveness and selectivity of mechanical weeding
D.A.G. Kurstjens Wageningen University, Soil Technology group, Box 17, 6700 AA Wageningen, The Netherlands
After many years of field experiments with available mechanical weeders, their possibilities and limitations are roughly known. To compensate for the limited selectivity in young sensitive crops, the limited effectiveness on established weeds and limited workability in spells of wet weather, current research emphasises more on the integration of multiple complementary tactics. Combining mechanical weeding with adapted planting times, false seedbeds, flaming, cover crops, tillage and other tactics is expected to increase non-chemical weed control reliability, reduce herbicide use or the need for manual weeding in organic farming.
Choosing appropriate combinations of tactics and mastering them in variable conditions requires considerable knowledge and skill. Models could be useful tools to derive practical guidelines, train farmers in making complex decisions and test how well the interactions between several weed management tactics are understood. Existing population dynamics models generally use fixed values for mechanical weeding effectiveness. Although the effect of varying effectiveness on long-term weed population dynamics could be approximated, these models are probably not sensitive enough to account for interactions between individual control measures. More sensitive approaches need to be developed because mechanical weeding effectiveness is very time-sensitive and highly influenced by environmental conditions and the way cultivations are carried out.
Detailed assessments and common field studies revealed that models should account for within-population variability in weed sensitivity arising from species- and weather-related emergence patterns and larger weeds escaping control. Models should also account for differences in working intensity of the implement as related to type, adjustment and soil conditions. It might as well be desirable to account for weather conditions that influence plant recovery after cultivation. This paper proposes a model to predict the selectivity and effectiveness of mechanical weeding that takes account of these factors and time-dependent phenomena.
The core of the envisioned model is a database containing a large number of crop and weed plants and their individual attributes at various times (e.g. biomass, anchorage force, height, flexibility, type of damage, desiccation status, position, growth stage). Various modules adapt these attributes by simulating continuous dynamic processes (e.g. plant growth, desiccation of uprooted plants), switching plant status at discrete (but individual-dependent) times (e.g. from “seed” into “white thread” and “emerged”), applying empirical relationships (e.g. between plant mass and sensitivity to uprooting), or other state transitions. This framework allows a flexible exchange of modules (e.g. replacing an empirical by a mechanistic model) and including various processes (e.g. competition, seed displacement) without major implications for the data structure.
The prospects of this approach are demonstrated by a dynamic spreadsheet model that links 1) crop and weed emergence patterns in time, 2) assumptions on early growth, 3) empirical species-, soil- and weeder-specific relationships between plant biomass and the probability of being buried and/or uprooted assessed in field experiments, and 4) assumptions on plant mortality resulting from uprooting and growth delay induced by burial. The model predicts weed control and crop damage (both density and biomass reduction) induced by multiple cultivations, accounting for population heterogeneity. If emergence patterns, growth rates and recovery of damaged plants are related to weather conditions, this model could predict effects of cultivation timing. When combined with workability predictions, the model could help assess weather dependency and evaluate solutions to weak spots in weed management systems before testing them in long-term experiments.

6th EWRS Workshop on Physical and Cultural Weed Control 115 Lillehammer, Norway, 8-10 March 2004
The effect of blind harrowing using a flex-tine harrow or a rotary hoe combined with manure amendment on bread wheat yield
M.L. Leblanc1 & D.C. Cloutier2 1Institut de recherche et de développement en agroenvironnement, Saint-Hyacinthe, QC, Canada
2Institut de malherbologie, Ste-Anne-de-Bellevue, QC, Canada Abstract
The first part of this research project was conducted to assess bread wheat susceptibility to mechanical weeding using a flex-tine harrow and a rotary hoe in a weed-free situation. The bread wheat was systematically cultivated at 7 growth stages, from pre-emergence to leaf erect stage. Two and three cultivations were done on a combination of growth stages. Wheat population decreased when cultivated with the flex-tine harrow at the 2- and 3-leaf stages and when more than a single cultivation was done. Wheat yield decreased in the treatments receiving 2 or 3 cultivations when including the 2-leaf stage treatment. After two years of field experimentation, the 2-leaf stage was identified as being the most sensitive stage to flex-tine harrowing. The rotary hoe did not reduce yield at any wheat growth stage and no sensitive stage was identified.
The second part of this study was to determine the effect of the type of nitrogen amendment
(organic (pig slurry, cow manure) or mineral) on weed populations combined with blind harrowing in bread wheat. There was no significant interaction between cultivation and fertilization treatments. As expected, the treatment with the flex-tine harrow done at the 2-leaf stage and at the second tiller stage was the most aggressive treatment in decreasing weed density, wheat population and yield. Also, weed development was greatest in the space that was left after wheat plants were removed by the cultivator. The control with the lowest weed density and biomass was the treatment with the rotary hoe done at the 2-leaf stage and at the second tiller stage compared to the conventional herbicide treatment. There was no significant difference between fertilization treatments.
Cultivations with the flex-tine harrow reduced final wheat population at harvest by 22 to 35%
compared with the treatment that was not cultivated. Cultivations with the flex-tine harrow done at the 2-leaf stage and at the second tiller stages reduced yield by 8 % compared to the treatment that was not cultivated. The final wheat population was not affected by the type of fertilization. Pig slurry application increased yield by 7 % compared to the conventional mineral application. Yield decreased by 12 % without fertilization compared to the conventional mineral fertilizer application. Objectives
The objectives of this project were to assess bread wheat susceptibility to mechanical weeding using a flex-tine harrow and a rotary hoe and to determine the effect of the type of nitrogen amendment (organic : pig slurry, cow manure or mineral) on weed populations combined with blind harrowing in bread wheat.

6th EWRS Workshop on Physical and Cultural Weed Control 116 Lillehammer, Norway, 8-10 March 2004
Materials and methods
All the experiments were conducted in 2002 and 2003 on the IRDA research station, Saint-Hyacinthe, Qc, Canada. All the fields used had a soybean crop the previous year and the soil type was a Duravin loam. The bread wheat variety was AC Barrie. The seeding rate was 450 seeds/m2 and the inter-row spacing was 17.6 cm.
Cultivators used Two cultivators were compared in this project, a rotary hoe and a flex-tine harrow. The rotary
hoe was a high-residue model from Yetter® for uses in field with crop residues. The flex-tine harrow was manufactured by Rabe Werk®. Bread wheat susceptibility to cultivators
Fields were kept weed free to avoid confounding effects on the crop between weed interference and cultivation with the flex-tine harrow and the rotary hoe by using selective herbicides: diclofop-methyl at 0.71 kg a.i. ha-1 and bromoxynil/MCPA at 0.56 kg a.i. ha-1 as recommended for wheat. Fertilization followed provincial recommendations. There was one experiment per cultivator. Wheat was seeded April 25 in 2002 and May 8 in 2003. The treatments consisted in cultivating at different wheat stages of development, from pre-emergence to stem elongation (Zadoks scale (scale used in the figures): Z07 (PRE), Z10 (L1), Z11 (L2), Z12 (L3), Z13,21 (T1), Z22 (T2), Z30 (E) and two and three cultivations were done on a combination of growth stages (these combination treatments are presented in the figures below). The rotary hoe was passed at a speed of 15 km/h while the flex-tine harrow was passed at a speed of 10 km/h in pre-emergence and at 6,4 km/h at the other crop growth stages. There was also a control treatment that received no cultivations. The experimental design was a randomised complete block with 4 replications and the plot size was 3 m wide x 6 m long. The measured variables were: wheat population at harvest, yield, grain humidity at harvest, specific weight and 1000-grain weight. Effect of the type of nitrogen amendment and of blind harrowing on bread wheat yield and on weed populations
Wheat was seeded May 6 in 2002 and May 17 in 2003. The nitrogen fertilizer treatments consisted in a calculated 25 kg/ha N (contributed by the previous crop : soybean) combined with 80 kg/ha N supplied by: cow manure (53 T/ha or 36 T/ha in the spring of 2002 or 2003, respectively); pig slurry (23 T/ha or 65 T/ha in the spring of 2002 or 2003, respectively); or conventional mineral fertilizers (296 kg/ha of 27-0-0). There was a control treatment where no fertilizers were applied. The experimental design was a split-plot with 4 replications. The sub-plot size was 3 m wide x 6 m long. The main plot treatments were the type of fertilization while the weed control treatments were the sub-plots (Table 1). Table 1. List of the weed control treatments in the experiment on the type of nitrogen amendment. Treatment Wheat growth stage at
1st cultivation Wheat growth stage at 2nd cultivation
1. Rotary hoe Pre-emergence (PRE, 15 km/h) 3 leaves (L3, 15 km/h) 2. Rotary hoe 2 leaves (L2, 15 km/h) 2 tillers (T2, 15 km/h) 3. Flex-tine harrow Pre-emergence (PRE, 15 km/h) 3 leaves (L3, 7,8 km/h) 4. Flex-tine harrow 2 leaves (L2, 7,8 km/h) 2 tillers (T2, 7,8 km/h) 5. No cultivation 6. Herbicides diclofop-methyl at 0.71 kg a.i. ha-1 and bromoxynil/MCPA at 0.56 kg a.i.
ha-1

6th EWRS Workshop on Physical and Cultural Weed Control 117 Lillehammer, Norway, 8-10 March 2004
The measured variables were: weed density, weed biomass, final wheat population at harvest, wheat yield, grain humidity at harvest, specific weight of grain, 1000-grain weight, protein level and falling number at 350 sec. Results Bread wheat susceptibility to the flex-tine harrow Final wheat population at harvest
Plant establishment caused a 20 % plant loss while 13-45% plant losses were due to cultivation (Fig. 1). Wheat population decreased when cultivated at the 2- and 3-leaf stages and when more than a single cultivation was done. Wheat yield at 13.5% moisture
Wheat yield decreased in treatments receiving 2 or 3 cultivations when cultivations were done that included the 2-leaf stages (Fig. 2). Grain moisture at harvest
Grain moisture at harvest increased in the treatments that were cultivated at the 2-leaf stage and in treatments receiving 2 or 3 cultivations. Cultivations done at later growth stages delayed maturity (Fig. 3).
0
1
2
3
4
5
6
Pre L1 L2 L3 T1 T2 E Pre L1 L2 L3 Pre L1 L2
T/ha
**
L2 T2L3 T1 L2 L3 T1T1 T2 E
*: Significant difference compared withcheck without cultivation
No cultivationCultivated
* * * * * * *
*: 2003
Figure 1. Wheat yield at 13.5% of moisture after flex-tine harrowing at different wheat growth stages.
0
50
100
150
200
250
300
350
400
450
Pre L1 L2 L3 T1 T2 E Pre L1 L2 L3 Pre L1 L2
Plants/m2
*
L2 T2L3 T1 L2 L3 T1T1 T2 E
Losses of 13- 45%
*: Significant difference compared withcheck without cultivation
Losses of 20%
*
Seeding rateNo cultivationCultivated
* * ** * * *
Figure 1. Final wheat population at harvest after flex tine harrowing at different wheat growth stages

6th EWRS Workshop on Physical and Cultural Weed Control 118 Lillehammer, Norway, 8-10 March 2004
Bread wheat susceptibility to the rotary hoe Final wheat population at harvest
30% of plant losses were due to plant establishment while 0 to 29% plant losses were due to cultivation (Fig. 4). Wheat population decreased when a single cultivation was done at 3-leaf. Wheat yield at 13.5% moisture
The rotary hoe did not reduce wheat yield at any growth stages (Fig. 5). Grain moisture at harvest
Grain moisture at harvest increased in treatments receiving 2 or 3 cultivations (Fig. 6).
0
5
10
15
20
25
PreL1 L2 L3 T1 T2 E PreL1 L2 L3PreL1 L2
%
***
***
L2 T2L3 T1 L2 L3 T1T1 T2 E
*: Significant difference compared withcheck without cultivation
No cultivationCultivated
Figure 2. Grain moisture at harvest after flex-tine harrowing at different wheat growth stages.
050
100150200250300350400450
PreL1 L2 L3 T1 T2 E PreL1 L2 L3PreL1 L2Pre
Plants/m2
*
Losses of 0 to 29%
Losses of 30%
L2 T2L3 T1 L2 L3 T1T1T2 E
*: Significant difference compared withcheck without cultivation
Seeding rateNo cultivationCultivated
T1E
L2
Figure 3. Final wheat population at harvest after rotary hoeing at different wheat growth stages.
0
1
2
3
4
5
6
Pre L1 L2 L3 T1 T2 E Pre L1 L2 L3Pre L1 L2Pre
T/haNo cultivationCultivated
L2 T2L3 T1 L2 L3 T1T1 T2 E T1
E
L2
*: Significant difference compared withcheck without cultivation
Figure 5. Wheat yield at 13.5% of moisture after rotary hoeing at different wheat growth stages.
0
5
10
15
20
25
PreL1 L2 L3 T1 T2 E PreL1 L2 L3PreL1 L2Pre
%
*******
No cultivationCultivated
L2 T2L3 T1 L2 L3 T1T1 T2 E T1
E
L2
*: Significant difference compared withcheck without cultivation
Figure 3. Grain moisture at harvest after rotary hoeing at different wheat growth stages.

6th EWRS Workshop on Physical and Cultural Weed Control 119 Lillehammer, Norway, 8-10 March 2004
Effect of the type of nitrogen amendment and of blind harrowing on bread wheat yield and on weed populations Weed control
Visual observations showed that more than 85 % of weeds were removed after flex tine harrowing whereas rotary hoe was less efficient when wheat was at the 3-leaf stage and at 2-tiller stage (Table 2). Since the rotary hoe is more efficient on very small weeds (cotyledons stage), these results suggest that weeds were more developed at these wheat stages and therefore that the efficacy of the rotary hoe was reduced, controlling less weeds.
For weed density and weed biomass, there was no significant interaction between the cultivation and the fertilization treatments. Cultivation treatments with the flex tine harrow done at 2-leaf and at second tiller stages had a weed density similar to the herbicide check (red line) while all the other cultivation treatments had significantly more weeds than the herbicide check (Figs. 7 and 8). There was no significance difference in weed density and weed biomass between fertilization treatments. With the exception of the treatment with no weed control, only the cultivation treatment with the flex-tine harrow done at 2-leaf and at second tiller stages had a significantly greater weed biomass than the herbicide check (red line). All the other cultivation treatment had a biomass similar to the biomass obtained in the treatment with the herbicides. harrow RH= rotary hoe.
Table 2. Visual assessment of weed control. Observed weed removal after
cultivation (%) Wheat stage
Flex tine harrow
Rotary hoe
- - Pre-emergence (Z07) + 3 leaves (Z12) 85 57
88 92 2 leaves (Z11) + 2 tillers (Z22) 91 72
020406080
100120140160
Nocultiv.
FTHPRE+L3
FTHL2+T2
RHPRE+L3
RHL2+T2
020406080
100120140160
No fert. Slurry Manure
Herbicide check
Mineral fertilizationPlants/m2
**
**
Plants/m2
Figure 7. Weed density at harvest after cultivation and fertilization treatments. FTH= flex-tine harrow RH= rotary hoe.
010203040506070
Nocultiv.
FTHPRE+L3
FTHL2+T2
RHPRE+L3
RHL2+T2
010203040506070
No fert. Slurry Manure
Herbicide check
Mineral fertilizationg/m2
**
g/m2
Figure 8. Weed biomass at harvest after cultivation and fertilization treatments. FTH= flex-tine harrow RH= rotary hoe.

6th EWRS Workshop on Physical and Cultural Weed Control 120 Lillehammer, Norway, 8-10 March 2004
Visual wheat damage Visual observations showed that more wheat plants were destroyed when the flex tine harrow
was passed at the 2-leaf wheat stage, confirming the results from the previous experiment in this project, where this stage was identified as being sensitive to the flex tine harrow (Table 3).
Final wheat population at harvest
There was no significant interaction between cultivation and fertilization treatments (Fig. 9). Cultivations with the flex-tine harrow reduced final population by 22-35% compared with the herbicide check (red line). The final wheat population at harvest was not affected by the type of fertilization.
Table 3. Visual assessment of wheat damage. Observed damage after cultivation
(%) Wheat stage
Flex tine harrow Rotary hoe
unearthed seed 0 1 Pre-emergence (Z07) + 3 leaves (Z12) missing plants 17 15
missing plants 50 11 2 leaves (Z11) + 2 tillers (Z22) missing plants 2 7
050
100150200250300350400450
Nocultiv.
FTHPRE+L3
FTHL2+T2
RHPRE+L3
RHL2+T2
plant/m2
050
100150200250300350400450
No fert. Slurry Manure
**
plant/m2
Seeding rateHerbicide check
Seeding rateMineral fertilization
Figure 4. Final wheat population at harvest after cultivation and fertilization treatments. FTH= flex-tine harrow RH= rotary hoe.
00.5
11.5
22.5
33.5
4
Nocultiv.
FTHPRE+L3
FTHL2+T2
RHPRE+L3
RHL2+T2
T/ha
00.5
11.5
22.5
33.5
4
No fert. Slurry Manure
*
**
T/ha
Herbicide check
Mineral fertilization
Figure 10. Wheat yield at 13.5 % of moisture after cultivation and fertilization treatments. FTH= flex-tine harrow RH= rotary hoe.

6th EWRS Workshop on Physical and Cultural Weed Control 121 Lillehammer, Norway, 8-10 March 2004
Wheat yield at 13.5% moisture There was no significant interaction between cultivation and fertilization treatments.
Cultivation with the flex-tine harrow done at 2-leaf and at second tiller stages reduced yield by 8% compared with the herbicide check (red line) (Fig. 10). Pig slurry application increased yield by 7 % compared with the conventional mineral application (red line). Yield decreased by 12% without fertilization compared with the conventional mineral application (red line). Grain protein content
There was no significant interaction between cultivation and fertilization treatments. Cultivation with the flex-tine harrow done at 2-leaf and at second tiller stages increased grain protein by 0.7% compared with the herbicide check (red line) (Fig. 11). Pig slurry and cow manure treatments slightly reduced grain protein by 0.4 and 0.5 %, respectively compared to the conventional mineral application (red line). Grain protein decreased by 0.9% without fertilization compared to the conventional mineral application (red line). 1000 grain weight
There was no significant interaction between cultivation and fertilization treatments. There was no significant difference between cultivation treatments (Fig. 12). Pig slurry and cow manure applications increased the size of the grain by 3% compared to the conventional mineral application (red line). The 1000-grain weight decreased by 0.8% without fertilization compared to the conventional mineral application (red line). Specific grain weight
There was no significant interaction between cultivation and fertilization treatments. Cultivation with the flex-tine harrow done at 2-leaf and at second tiller stages decreased specific weight of grain by 5% compared to the herbicide check (red line) (Fig. 13). There was no significant difference between fertilization treatments.
13.5
14
14.5
15
15.5
16
Nocultiv.
FTHPRE+L3
FTHL2+T2
RHPRE+L3
RHL2+T2
%
13.5
14
14.5
15
15.5
16
No fert. Slurry Manure
*
**
%
Herbicide check
Mineral fertilization
*
Figure 6. Grain protein after cultivation and fertilization treatments. FTH= flex-tine harrow RH= rotary hoe.
20222426283032343638
Nocultiv.
FTHPRE+L3
FTHL2+T2
RHPRE+L3
RHL2+T2
g
20222426283032343638
No fert. Slurry Manure
* *
Herbicide check
Mineral fertilizationg
Figure 6. 1000-grain weight after cultivation and fertilization treatments. FTH= flex-tine harrow RH= rotary hoe.

6th EWRS Workshop on Physical and Cultural Weed Control 122 Lillehammer, Norway, 8-10 March 2004
Grain moisture at harvest There was no significant interaction between cultivation and fertilization treatments.
Cultivation with the flex-tine harrow done at 2-leaf and at second tiller stages increased grain moisture by 2.6% compared to the herbicide check (red line) (Fig. 14). There was no significant difference between fertilization treatments.
Conclusions Bread wheat susceptibility to the flex-tine harrow
The 2-leaf stage seemed to be more sensitive to flex-tine harrowing. Wheat population and yield decreased when the growing season was not favourable and grain moisture increased. More than 2 cultivations might affect yield components. A single cultivation done at later stages did not affect yield components. Specific weight decreased by 5% when cultivation was done at 2-leaf stage in treatments receiving 2 or 3 cultivations (L2-T1, PRE-L2-T1,L2-T1-E) compared to the herbicide check. There was no significant difference in 1000-grain weight among the treatments Bread wheat susceptibility to the rotary hoe
The rotary hoe did not reduce yield at any wheat growth stage. No sensitive stage was identified. There was no significant difference in specific weight and 1000-grain weight among the treatments
60
65
70
75
80
Nocultiv.
FTHPRE+L3
FTHL2+T2
RHPRE+L3
RHL2+T2
g
60
65
70
75
80
No fert. Slurry Manure
Herbicide check
Mineral fertilizationg
*
Figure 8. Specific weight after cultivation and fertilization treatments. FTH= flex-tine harrow RH= rotary hoe.
12
13
14
15
16
17
Nocultiv.
FTHPRE+L3
FTHL2+T2
RHPRE+L3
RHL2+T2
%
12
13
14
15
16
17
No fert. Slurry Manure
Herbicide check
Mineral fertilization%
**
Figure 8. Grain moisture at harvest after cultivation and fertilization treatments. FTH= flex-tine harrow RH= rotary hoe.

6th EWRS Workshop on Physical and Cultural Weed Control 123 Lillehammer, Norway, 8-10 March 2004
Effect of the type of nitrogen amendment and of blind harrowing on bread wheat yield and on weed populations Flex-tine harrow
The flex-tine harrow was more aggressive than the rotary hoe and significantly decreased the wheat population in some cases. Wheat yield decreased while grain humidity at harvest increased when cultivation was done at the 2-leaf and at second tiller stages. The increase in humidity meant that there was a delay in maturity caused by cultivation at these growth stages with the flex-tine harrow. The grain protein content increased, probably because the wheat population was too low for the applied rate of nitrogen fertilizers. Weed populations did decrease but weed biomass decreased because there was some space left by wheat plants removed. Rotary hoe
The rotary hoe cultivation done at 2-leaf and at second tiller stages was the treatment with the best overall yield and weed control. Fertilization
The type of nitrogen fertilizers had no effect on weed control and very little on yield (pig slurry 7%) and grain protein (organic fertilizers 0.5%). Grain protein content was at the level required by the bread maker industry (13.5%). The falling number was at the level required by the baking industry (250-350) and was not affected by cultivation or nitrogen fertilizers

6th EWRS Workshop on Physical and Cultural Weed Control 124 Lillehammer, Norway, 8-10 March 2004
Lay-down working cart improves efficacy of hand weeding
P. Leinonen1 & V. Närkki2 1Elomestari Ltd, Partala, FIN-51900 Juva, Finland
Email: [email protected] 2Häme Polytechnic, Lepaa, FIN-14620 Lepaa, Finland
Hand work on (organically managed) horticultural fields is often unavoidable. Hand planting, hand weeding, and harvesting of strawberries and cucumbers are examples of tasks which are hard, if not impossible, to mechanize. Manual weed control is often the major limiting factor for organic vegetable production on a farm level.
We have developed a Crawler, a wagon designed to support and transport a worker on the field. Our construction is a three-wheel, electically powered transporter. We aim to quantify labour-saving and labour-easing effects of the Crawler.
During the summer 2000, we did different hand works on horticultural fields in different farms. In each time, work output of 30 min periods with and without Crawler were recorded. Several people, varying from experienced Crawler users to beginners, have been measured. Measurements include transplanting, hand weeding and picking of strawberries. Only data on hand weeding is presented.
The familiarity of the worker with the Crawler had a major effect on the efficiency of the Crawler. Whereas the experienced Crawler users improved their work performance on an average by 32 %, no effect was noticed when beginners worked with the Crawler.
Although many farmers argued, that with a low weed density (and therefore fast weeding) the Crawler helps more than with slow moving on the field (connected to high weed density), measurements did not support their observations. However, the variation between the measurements was large.
Most of the farmers who have used the Crawler considered the 30 min measurement as too short. According to their opinion, lower exertion to knees and back enable longer working days and weeks, thus improving the working capacity and well-being in a long run. This is difficult to measure and hard to calculate in economical terms.

6th EWRS Workshop on Physical and Cultural Weed Control 125 Lillehammer, Norway, 8-10 March 2004
Finger weeder for cabbage and lettuce cultures
P. Leinonen1, A. Saastamoinen2 & J. Vilmunen2 1Elomestari Oy, Partala, FIN-51900 Juva, Finland
Email: [email protected] 2 Uusimaa College for Rural Development, Uudenmaankatu 249, FIN-05840 Hyvinkää, Finland
Finger weeder has changed weed control strategy in many organic vegetable farms, where hand weeding or hand hoeing of planted vegetables has been nearly completely replaced by machine work. To replace herbicides in conventional farming, finger weeder must have acceptable efficacy compared to herbicides. For lettuce growers, however, no herbicides are registered in Finland. Still there has been doubts, whether plants get soiled through finger weeding, thus making the quality of the product commercially unacceptable.
Summer 2002 we compared finger weeder against net harrow and herbicides in cabbage. Field trial 2003 was dedicated to lettuce: we compared different intensities of finger weeding in two different lettuce cultivars. Trials were performed at Uusimaa Rural College as randomized block experiment with two replicates, plot size 1,6 x 20 m. Elomestari Weed Master was used as a tool carrier for goosefoot hoe and finger weeder.
Finger weeder, net harrow and herbicide treatments were compared in cabbage plots. For mechanical control, hoeing was done twice, using goosefoot hoe between the rows (inter-row) and either finger weeder or net harrow within the row (intra-row). Herbicide treatment program was planned and realized by Berner Oy, Helsinki and no hoeing was done. Measurements included plant density and yield, both crop and weeds.
All weed control treatments significantly increased the cabbage yield, whereas between mechanical and chemical control there was only small differences. Additional hand hoeing slightly improved the mechanical weed control, but was not necessary for acceptable result.
In lettuce experiment, two intensities for finger weeding was compared to simple inter-row hoeing: gentle, where fingers are appr. 1 cm distance from each other, and intensive, where they overlapped appr. 2 cm. Besides crop and weed yield, also soiling of the lettuce was scored.
Very few weeds emerged at lettuce plots and no differences between the treatments were observed. Finger weeder had no effect on lettuce quality, even intensive treatment left the crop undamaged.
Finger weeder proved to be an effective weed control tool for planted cabbage and lettuce. Even in conventional farming it is a realistic alternative to chemical control.

6th EWRS Workshop on Physical and Cultural Weed Control 126 Lillehammer, Norway, 8-10 March 2004
Criteria for optimised weed harrowing in cereals including development of experimental equipment for weed harrowing trials
K. Mangerud1, L.O. Brandsæter2,1 & J. Netland 2 1 Hedmark College, N-2322 Ridabu, Norway
Email: [email protected] 2 The Norwegian Crop Research Institute, Plant Protection Centre, Høgskolevn. 7,
N-1432 Ås, Norway. Email: [email protected] / [email protected]
The objective in a recently initiated project is to add new knowledge as a fundament for improving weed harrowing in organic cereal production as well as using weed harrowing as a alternative for the use of herbicides in conventional farming. The project has two main objectives: (a) Develop new experimental equipments for weed harrowing trials, and (b) Develop criteria for whether a farmer shall harrowing or not, and how to optimise the harrowing operation. The last objective includes also new knowledge of how to combine the use of harrows and subcropping legumes in cereals. One important aspect in the project is to study whether harrowing recommendations, build on experiments carried out in other countries with lighter soils, are suitable also on heavier soils and in stony conditions, which are typical for the cereal growing areas of Norway.
Developing new experimental equipments includes the use of narrow (1.5 meter) fingerweeders which have the same tines and specification as a broader one. The narrow fingerweeders are combined with the use of tractors with an increased gauge (ca 1.75 meter), to avoid tracks in the experimental plot. It is important to drive a fingerweeder with a certain speed. Normally you need a broad headland between each experimental plot to accelerate. With this system you can drive over the neighbouring plot with the harrow lifted and with right speed, and just put down the harrow at the start of the plot and lift it again at the end without stopping. By this methodology size of experimental plots can be reduced and more plots and treatments can be included in each trial. With a small experimental area also soil uniformity and weed distribution will be more homogenous. The strength of the harrowing operation is defined by cereal coverage before and after harrowing, using a software program analysing digital pictures.
Yield, as well as weed control parameters, from the first field experiment will be presented. This experiment includes different fingerweeders, harrowing at different cereal growth stages and different harrowing strength (aggressiveness), obtained both by different speed and by harrowing at different working depths.

6th EWRS Workshop on Physical and Cultural Weed Control 127 Lillehammer, Norway, 8-10 March 2004
Analysis and definition of the close-to-crop area in relation to robotic weeding
M. Nørremark & H.W. Griepentrog The Royal Veterinary and Agricultural University,
Department of Agricultural Sciences/AgroTechnology, Copenhagen, Denmark Abstract
The objective of this paper is to analyse and define the field conditions close to the crop plants of sugar beet (Beta vulgaris L.). The aim is to use this study for the choice and development of new physical weeding methods to target weeds at individual plant scale level. It was found that the close to crop area is like a ring structure, comprising an area between an inner- and outer-circle around the sugar beet seedling. Physical weeding should not be applied to the area within the inner circle. The radius of the inner circle increases with the appearance of young beet leaves during the growth season. It was also found, that no weeds were germinating within 1 cm around individual sugar beet seedlings. Therefore this distance should be added to the radius of the inner circle. The space between the inner and outer circle is termed the close to crop area where physical weeding should be applied. The size of this area is defined by the developmental stage of the sugar beet fibrous root system and foliage. Thus, the determination of the growth stage of individual crop plants is necessary before any physical weeding can take place in the close to crop area.
Uprooting, cutting between stem and root or damage of main shoot can do the physical control of most weed species located in the close to crop area. However, the targeting of weeds from above and from different angels above ground is limited in the close to crop area. This is caused by the fact that sugar beet leaves do not leave much space between leaves and ground and that our own study indicate that 26.4% of sugar beet plants at the 4-6 leaf stage are covering the main shoot of weeds. The most problematic weeds are the species, which have their main shoot and leaves located close to ground level. These species can either be controlled by damage of the main shoot or with a combination of shallow surface cutting and burial.
Discrimination between weed species is beneficial under certain circumstances. First, the efficiency of the physical control of individual weed species is depending on the timing. Secondly some weeds species do not have significant negative impact on the yield, but instead leaving these species uncontrolled could benefit to an increased bio-diversity and reduced time and energy input for a physical weeding process. This paper is contributing to the ongoing Danish research project Robotic Weeding. Introduction
So far, no commercial mechanical or physical method has been developed for highly selective control of weeds within the crop row. Concerning efficiency, the available inter-row weeding methods in sugar beet, maize and vegetables are non-selective and are therefore not fully satisfying. Thus, an area of 10 % to 20 % of a sugar beet (Beta vulgaris L.) field is either controlled by herbicide band spraying or by manual weeding. If this herbicide usage should be replaced or reduced, novel physical weeding methods have to be developed. Therefore, increased research on physical weed control in row crops can be recognised over the last decades (Rasmussen & Ascard, 1995; Bond & Grundy, 2001, Melander, 1997, Acard, 1998, Ascard & Mattson, 1994). Most of these are highly relevant for sugar beet or other high value crops. Furthermore precision-guided implements and robotic systems for more automated weed control received much attention (Van

6th EWRS Workshop on Physical and Cultural Weed Control 128 Lillehammer, Norway, 8-10 March 2004
Zuydam et al., 1995; Tillett et al., 2002, Tillett et al., 1998, Marchant et al., 1998, Astrand & Baerveldt, 2002, Blasco et al., 2002). The main obstacle for the progress of high selective weed control is; i) the lack of automated detection and classification of crop and weed plants, and ii) to target or treat weeds with high resolution and accuracy. The reliability of identification of crop seedlings using computer vision under field conditions can vary e.g. from 60 to 80% (Lee et al., 1999). This result is not acceptable for weeding operations. However, the rapid development of computer image and data processing in real-time is promising. On-going research of a vision system based on active shape modelling to recognise sugar beet and weed seedlings and locate their positions is done at the Research Centre Bygholm, Denmark (Søgaard & Heisel 2002). Weeding tools with high accuracy and high spatial resolution have also been investigated (Lee et al., 1999, Heisel et al., 2001). These systems are able to apply liquids in very small dose rates at precise locations (micro-spraying) or can cut weed plants by laser beams.
These novel weeding systems shall operate in the area within crop rows. In order to enhance the efficiency of these methods it seems to be recommendable to divide the target areas of a field into different zones. In this context the authors defined already previously the following target areas (Griepentrog et al. 2003):
• Inter-row area: Space in strips between and parallel to crop rows keeping a particular distance to the crop plants.
• Within-row area: Space between crop plants within rows, excluding the area close to the crop plant.
• Close-to-crop area: Space around a crop plant which should or cannot be targeted by within-row or inter-row weeding operations.
The objective of this paper is to analyse and define the close to crop area. The aim is to use this
study for the choice and development of new physical weeding methods to target weeds at individual plant scale level. The paper comprises a definition of the close to crop area for sugar beet based on a description of; i) the above and below ground properties for both sugar beet and weed plants, ii) crop and weed establishment factors, iii) crop and weed tolerance to physical interactions, and iv) the sugar beet:weed competition with focus on neighbourhood effects. Sugar beet Crop establishment
Under optimal conditions, sugar beet seedlings emerge within 5 days. Temperatures of at least 3 oC are required to start the germination process in otherwise suitable conditions (Milford et al., 1985ac). Suitable conditions are for instance moisture contents above 6% w/w. Suitable placement of seeds are on an untilled, firm and moist seedbed bottom with a layer of loose and fine soil with aggregate size range of 0.5-5 mm covering the seeds. The sowing depth is normally within 2-3 cm. The size distribution of soil clods and stones covering the seed has an influence on the deviation between where a single plant emerges and its related seed position. An estimate of the deviation influenced by seedbed conditions is between 1.1 cm and 1.7 cm for a sandy loam soil type (Griepentrog et al., 2003). Thus, the shoot emerged from seed do not exploit only vertically, but also laterally. The shoot travelling distance is limited by the seed reserves. Soil clods and stones bigger than 2-4 cm in diameter located above an emerging seed increase the travelling distance for an emerging seed, which consequently reduce emerging rates.

6th EWRS Workshop on Physical and Cultural Weed Control 129 Lillehammer, Norway, 8-10 March 2004
Properties above ground.
Sugar beet is a C3 plant with broad, dark green, succulent leaves. After emergence and cotyledon stage, successive leaves then develop in pairs throughout the growing season (Milford et al., 1985b). The first pair appear synchronously and later leaves appear singly on a spiral of five rings each with 13 leaves (~ 5:13 phyllotaxis) (Elliot & Weston, 1993, Meier et al., 1993). This phyllotaxis is growing in diameter during the growth season. The radii of the phyllotaxis is usually bigger than the one for the tap-root at early growth stages. That is, the appearance of new leaves are pressing the stem of earlier leaves outwards from the centre of the spiral.
The leaves of sugar beet plants are very small at the cotyledon stage. After the 2-leaf stage the leaves gets broad and long (Meier et al., 1993). 2-3 leaves appear each week during summer months (at intervals of 30 oD) (Bachmann, 1986). Leaves appear and expand in a linear relationship with the temperature that controls the developmental rate, the so-called physiological time (~oD) (Milford et al., 1985abc). At 42 days old, the plant has 8-10 leaves but only a small tap-root. From the 8-10 leaf stage onward, leaf and tap-root growth occur simultaneously, with the tap-root making up increasing proportion of the total plant dry weight (Elliott & Weston, 1993). The maximum size attained by individual leaves increase progressively about the 12-leaf stage (in some varieties the largest leave reached an area of 0.05 m2), and later formed leaves achieve smaller final sizes (Milford et al., 1985b). Early leaves die in the order in which they are produced. Leaf number 5 to 20 accounts for almost all the leaf area duration (Elliott & Weston, 1993). Sugar beet does not leave much space between leaf and ground level starting from the cotyledon stage to the beginning of wilting of the early leaves. The first 8 leaves are elongating from the phyllotaxis located just above ground and is exploiting mostly to the side, not upright, resulting in the limited space between leaf and ground.
The main shoot of weeds germinating underneath the leaves of sugar beet plant are impossible to detect from above the crop plant because of the relative broad beet leaves developed already at 4-leaf stage. A study based on analysing digital photos taken from above sugar beet plants at the 4-6 leaf stage showed that main shoots of one or more weed seedlings were hidden underneath crop leaves in 26.4% of the number of crop plants analysed (n = 212). Weed seedlings emerging underneath sugar beet leaves at the cotyledon stage were not observed. The digital photos were provided by previous work by Griepentrog et al. (2003) and Nørremark et al. (2003) Properties below ground
From the 2-leaf growth stage, the fibrous root system extends laterally at about 0.4 cm/day until approximately 80 days after sowing (Scott & Jaggard, 1993). After this, the fibrous root systems of plants growing in adjacent rows intermingled. It is unusual that the fibrous root system penetrate the soil above the seeding depth. The fibrous root system exploits the soil only laterally and vertically (Scott & Jaggard, 1993). During the first 30 days of growth the seedling tap root grows vertically 10 mm/day and by the time the first leaf has developed it can have grown 300 mm or more (Dunham, 1993). The tap root system of the plant can grow to depths of 2-4 m and is therefore very good at utilising soil nutrients and water. After about 30 days, both top and storage-root growth happens. Sucrose is constantly trans-located from the leaves to the storage root of the plant. This sucrose is primarily stored in concentric rings of vascular tissue (cambium) and in the storage root parenchyma cells that enlarge during growth. This enlargement of the storage root starts when the sugar beet is creating the phyllotaxis. Primary cambium develops during the first 14 days after emergence, gets 0.5 mm in diameter (Milford, 1973). Around 42 days after emergence, at growth stages with 10 to 12 leaves, the storage root is 1-1.5 cm in diameter (Elliott & Weston, 1993, Milford, 1973).

6th EWRS Workshop on Physical and Cultural Weed Control 130 Lillehammer, Norway, 8-10 March 2004
Tolerance to physical interaction
Because the seeds energy reserves are limited, the distance from the seed to the soil surface must not be too large. Furthermore, physically resistance to seedling growth must not be excessive, and the seedling must not be damaged physically, chemically or by pests or diseases (Scott & Jaggard, 1993). A surface crust (cap) is sometimes formed before or after the plants emerge, especially on clay soils. This may lead to a very poor numbers of emerged plants per area. The effects of crusting on crop emergence may depend to a small extend on the initial aggregate sizes of the soil. Breaking a surface crust mechanically and close to a sugar beet seedling can cause vial damage to the seedling, because the cap breaks up in relative big clods, which can cover, cut or uproot the seedlings. Once the seedling has become established, the plant enters a period of leaf initiation, during which there is very little root growth. The plant is therefore very sensitive to physical damage directly or in directly from e.g. movement of soil clods or stones (Meier et al., 1993, Scott & Jaggard, 1993). Only the seedling tap root is slowly exploiting the soil downwards until the 8-leaf stage. At this growth stage, the strength of the seedling tap root is higher and increase with later growth stages. At this stage the establishment of the whole plant is so good, that much energy is required to e.g. pull the plant out from the soil. However, the strength of the fibrous root system is not high compared to the strength of the tap root. Uprooting of the fibrous root system can occur with use of very little energy. In the early growth stages, uprooting of the fibrous roots exploiting laterally can be vial to the further development of the plant. When the fibrous root system have intermingled with adjacent rows, the uprooting effect becomes less important. Therefore, the sugar beet plant root system resistance to physical damage increase with growth development.
With the cotyledon to the 8-leaf stage as the stage where the plant roots, stem and leaves are less tolerant to physical damage. The physical damage may not be the damage it self, but the wound from a mechanical damage may allow establishment of diseases (Scott & Jaggard, 1993, Hatcher & Melander, 2003). Cutting a few leaves or some part of them, especially the early leaves, may not contribute to decreasing yield. However, damaged plant leaves are still sensitive to establishment of diseases (Elliot & Weston, 1993). Weeds Population dynamics
Mature annual weeds often produce seeds small in size, which allows for production of many seeds by individual plants. This facilitates colonization of new localisations of establishment of the weeds. Due to dormancy processes, most annual weed species germinate at particular times of year. The wandering perennial weeds also propagate at different time of year.
Following a severe disturbance like tillage prior to seedbed preparation of sugar beet, annuals predominate because they can survive the disturbance event in physiologically dormant state as seeds. The stationary perennials are similar tied to establishment shortly after tillage. However, they persist in a vegetative state for a longer period, their allocation of resources to roots is greater, and consequently, their seedling growth rate tends to be lower. The advent of tillage greatly changed conditions of life for wandering perennials. Tillage separates daughter plants from the parent and spreads them within and between fields. Simultaneously, tillage removes the competing vegetation. This puts spreading perennials in the advantageous position of having well-provisioned propagules establishing with relatively little competitive pressure.
Germination of weed seeds is more likely near the soil surface because seeds are more likely to experience light, fluctuated temperatures and other factors that commonly promote germination.

6th EWRS Workshop on Physical and Cultural Weed Control 131 Lillehammer, Norway, 8-10 March 2004
When shallow tillage stirs the upper soil layer, weed seeds will be exposed to light (Roberts and Potter, 1980, Jensen, 1999). Many subsequent studies have shown that germination of a great range of weeds species is promoted by light (Mohler, 2001).
Mohler (1993) reviewed 21 studies on seedling emergence from weed seeds placed at various depths and found that most individuals of most weed species depending on seed weight arise from the top 2-4 cm of soil. However, for many weed species, some individuals emerge from deeper soil layers, and a small percentage of some large-seeded species can emerge from 100 millimetre or deeper (Mohler, 1993; Cussans et al. 1996). The germination of weeds requires almost the same soil tilth, moisture and stone-free conditions as previously mentioned for sugar beet establishment. Shallow incorporation into the soil affects various species differently, but in general for most weed species shallow incorporation into the soil increase emergence rates (Mohler, 2001). Properties above ground
The relative high growth rates of weeds allow weeds to grow large rapidly and occupy space before resources are monopolised by crop seedlings. The height above ground for the most common weed species in Danish sugar beet fields is different from species to species. The main shoot of weeds species like Chamomilla suaveolens, Tripleurospermum inodorum, Cirsium arvense and Taraxacum officinale is located very close to the soil surface until the 6-8 leaf stage. The early leaves of these species are usually creeping along the soil surface. Species like Polygonum convolvulus and Chenopodium album have more upright and branched stems already from the first true leaf stage. The height of the main shoot above soil surface of these species is increasing with later growth stages. Properties below ground
The proportion of biomass invested in roots is low in most small seeded weed species, but their root diameter is small so that total length of roots is increased quickly after germination. Roots of many weed species are located in the 2-4 cm top soil at early growth stages. Later, the roots are exploiting the soil downwards and laterally. Rhizomes from wandering perennials like Elymus repens exploit laterally in the top 2.5-5 cm soil layer and can in a few days occupy a large proportion of the soil (Håkannson & Wallgren, 1976). To be able to target and uproot weed roots in the close to crop area at early growth stages, an operating depth of 4 cm is needed. Tolerance to physical interaction
Boutin & Harper (1991) studied the population dynamics of five species of Veronica in natural habitats and indicated that the period of establishment represents the most critical period for these species. The definition of period of establishment is the time between germination and the production of the first true leaf. Several mortality factors act on establishing weeds, including exhaustion of seed reserves, drought, seedling predation, disease, physical disturbance, and expression of morphological and genetic defects (Mohler, 2001, Hatcher & Melander, 2003). Although oxygen concentration influences germination, oxygen levels near the soil surface are rarely low enough to direct inhibit germination, except when the soil is saturated with water.
The susceptibility of a weed seedling to physical disturbance decreases as it grows. As the plant grows, stems and roots thicken and toughen with cellular fiber. Thus, impact with a hoe or cultivator tine is less likely to cause fatal breakage to a large old plant than to a small young seedling. Following the concept of modularity in botany (White, 1979) the growth of individual weed plants can be viewed as assemblages of repeated additions of metamers, units consisting of leaf, the subtended bud(s), and an internode. Potentially, a weed can loose most of its shoot and

6th EWRS Workshop on Physical and Cultural Weed Control 132 Lillehammer, Norway, 8-10 March 2004
with only one single bud still re-grow into a full size plant. The modularity in botany for root growth similarly allows recovery from drastic damage to the root system. However, for most herbaceous dicotyledons species, a seedling that is broken between the root and base of the cotyledons will not survive. At this growth stage, the weed has only one shoot meristem, and its loss is fatal. Establishing monocotyledons seedlings are somewhat less susceptible to damage than dicotyledons, because they lack the long hypocotyl between the roots and shoot meristems, but they too may fail to recover following loss of substantial portion of the cotyledon or primary root (Mohler, 2001). Thus, very small weeds in the cotyledon stages are more easily controlled by physical means than are weeds that are more developed. However, Heisel et al. (2001) found that the weed species Sinapsis arvensis L. and Lolium perenne L. was most susceptible to cutting two month after emerge. Most weed seedlings being uprooted only can re-root under circumstances that do not desiccate the seedling quickly. These conditions are dry weather and dry soil surface. The size, position and physiology of shoots and underground organs have a large influence on the weeds ability to survive a particular type of disturbance. For example Håkansson and Wallgren (1976) showed that Agropyron repens were most susceptible to damage by burial at the point when its perennating organs reached minimum dry mass. For Agropyron repens this occurs when three to four leaves have formed on the new shoots, just prior to initiation of tillers and new rhizomes. Frequent repeated tillage is often detrimental to wandering perennial weed species.
Vleeshouwers (1997) studied the emergence rate of the weed species Polygonum persicaria L., Chenopodium album L. and Spergula arvensis L. after burial of pre-germinated seeds at different depths in soil with different penetration resistances. For these species emergence through a surface crust or compact soil (i.e. untilled) is more difficult and requires more energy than through loose soil (i.e. tilled). Thus, in addition to indirectly affecting emergence via seed distribution, tillage changes soil properties that affect emergence. Cussans et al. (1996) showed that emergence percentages decreased with increasing burial depth for Alopecurus myosuroides Huds., Stellaria media L. (Vill.), Galium aparine L. and wheat (Triticum aestivum L.). Sugar beet:weed competition
The seed reserves are very important for sugar beet and weed to emerge successfully. Seed weight indicates how much reserves the species have. The seeds of many common annual weeds in a Danish sugar beet field weigh less than 2 mg and few exceed 10 mg, similar to seed weight of sugar beet. Sugar beet seeds are usually placed at 2-3 cm. This is giving the weed seeds placed from 0 to 2 cm an advantage, except when moisture content in that layer is too low for germination of the weed seeds.
Competition from uncontrolled annual weeds that emerge within 8 weeks of seeding or within 4 weeks of the crop reaching the 2-leaf stage can reduce root yields by 26-100% (Schweizer and May, 1993). Annual weeds that emerge 8 weeks after seeding, and particularly after the sugar beet plants have 8 or more leaves, are less likely to affect yield (Schweizer & May, 1993). The inter-specific competition from sugar beet plants is very low in the first 48 days after emergence or until the 6-8 leaf stage. Thereafter, the suppression of weeds increase with the size and number of sugar beet leaves developed, which is usually when the space between crop rows is covered by more than 30%. When sugar beet rows closure, the sugar beet suppress all weeds that will emerge late in the growing season. Weed seeds need a relatively high red:far-red ratio in order to germinate because light-sensitive germination is controlled by the phytochrome system (King, 1975). Veronica arvensis has a moderate germination rate in the dark. However, placing Veronica arvensis seeds under a shading leaf canopy reduces germination compared to germination on bare soil, due to a low red:far-red ratio under the leaf canopy (King, 1975). Thus, weed germination under established

6th EWRS Workshop on Physical and Cultural Weed Control 133 Lillehammer, Norway, 8-10 March 2004
sugar beet plants in the close to crop area is controlled not only by the amount of light, but also by its spectral composition.
Both sugar beet and weed seedlings are adapted to open habitats, and both are intolerant of shade. If the sugar beet is in a superior position, it will suppress the growth of weeds, especially if other factors like physical damage to weeds have been done. At emergence, the sugar beet has a similar or slightly greater leaf area and a larger root system than most small seeded weeds. Therefore the sugar beet absolute growth rate is initially greater, and usually remains greater for at least several weeks. Because small seeded weed species tend to have higher rate of root elongation, the weeds tend to rapidly occupy the soil volume to the detriment of the sugar beet plant. Probably because weeds are adapted to exploit the brief pulse of nutrient availability that follows disturbance, they also usually have substantially higher macronutrient concentrations in the shoot than do the crops with which they compete (Mohler, 2001). They thus sequester nutrients that would otherwise be available for the crop.
Resources like nutrients, hours of sun light, high temperatures greatly exceed the needs of both crop and weeds for several weeks after seedbed preparation and sowing of e.g. sugar beet seeds. During this period of time competition has a negligible effect on crop and weed seedling establishment. The annual weed species that do well in these conditions prosper because they have very high maximum relative growth rates and the seed numbers able to germinate are often very high per area relative to for example sugar beets.
Sugar beets growing in rows provide almost no competition against weeds at least not until the row closure of the crop canopy (van Heemst, 1985). If the land area that the foliage of the individual plant covers completely can be represented by a concentric circle, the root yield and weed suppression will be maximised when the area between the plants is within the circles so all land is exploited. The radius of the circle may change between varieties, but is normally in the range of 13-30 cm. Current row spacing is 45-50 cm, which then has to be decreased to enhance the suppression of weeds by sugar beet. However, the limitations for narrowing the distance between rows are associated to the need for access for mechanical weeding and harvesting procedures.
A limited number of studies of the effect of timing for physical control of weeds in sugar beet have been done. Farahbahsh & Murphy (1986) made a glass house pot experiment to study competition between sugar beet and the weed species Avena fatua L., Alopecurus myosuroides L. and Stellaria media L.. Avena fatua L competition caused significant loss in the growth, leaf chlorophyll and yield of sugar beet. In general, time of Avena fatua L emergence and beet plant and density was important factors of the severity of crop yield loss. There was no competition effect from the weeds on crop yield if the weeds were removed just before the true 6-leaf stage of the sugar beet. The field experiment by Heisel et al. (2001) showed similar results for the weed species Sinapsis arvensis L. and Lolium perenne L. The experiments showed significant higher yield when the cutting of the weeds was done 2 month after emergence, suggesting that the optimal period of weed cutting is a period between the final flush of weed emerge and the mutual overlapping of the leaves and roots of the species. However, it was noticed that a normal weed density might change that conclusion (Heisel et al., 2001).
All studies made on sugar beet competition against weeds have been focused on results per 1 m2, or a 1 meter row or a whole trial plot. However, Heisel et al. (2001) found that the distance between individual sugar beet plants and the weed species Sinapsis arvensis L. and Lolium perenne L. had significant effect on the yield of sugar beet. Increasing distance from 2 to 8 cm between beet and weed seedlings increased the beet yield significantly in average by 20% regardless of weed species. Pike et al. (1990) analysed the correlation between soybean (Glycine max) seed yield and the distances from crop plant to weeds ranging from 0 to 1 m. When the distance was decreased, a decrease in soybean seed yield was seen. Weiner (1982) has proposed a neighbourhood model estimating a measure for the close to crop competition. The study was based on monocultures of Polygonum minimum Wats and Polygonum cascadense. The model described seed production by

6th EWRS Workshop on Physical and Cultural Weed Control 134 Lillehammer, Norway, 8-10 March 2004
individual annual plants within a population as a function of the numbers and species of individuals within each of several circular neighbourhood areas. The close to crop area was set to 1.5 cm, as this was beyond the limit observed for horizontal root extension. The neighbours of each subject plant were categorised in one of three neighbourhoods defined by radius at 0.5 cm intervals. The output of the neighbourhood model was measure for competition based on number of weeds of a single weed species and distances. A hyperbolic relationship between the measure of competition and seed production was seen. The contribution of each individual plant to this hyperbolic effect was in inverse proportion to the square of its distance from the test individual.
In order to give an impression of the number of weed seedlings in the close neighbourhood to individual sugar beet plants, a small pre-study was carried out by the authors using digital photos of sugar beets. The photos were provided by previous work by Griepentrog et al. (2003) and Nørremark et al. (2003). The photos were digitised to reveal information about the positions of weed individuals relative to individual sugar beet plants. Weeds were located in a radius of 14 cm from the centre of the sugar beet. Figure 1 and 2 shows the results obtained at the sugar beet cotyledon stage and the 4-6 leaf stage respectively.
0
50
100
0 1 2 4 7 1098653 131211 14
[Plants m-2]
[cm]
WeedDensity
Distance from crop plant
Figure 1. Relationship between weed counts and distance from centre of sugar beet plant at the
cotyledon stage. The average weed density of whole plot is indicated by a dotted line.

6th EWRS Workshop on Physical and Cultural Weed Control 135 Lillehammer, Norway, 8-10 March 2004
0
50
100
150
200[Plants m-2]
[cm]
WeedDensity
Distance from crop plant0 1 2 4 7 1098653 131211 14
Figure 2. Relationship between weed counts and distance from centre of sugar beet plant at the 4-8
leaf stage. The average weed density of whole plot is indicated by a dotted line.
In the circular area with radii of 1 cm, the determined number of weed seedlings did not at any of the two growth stages coincides with the average number of weeds per m2. This indicates the existence of a weed free zone around sugar beet seedlings. Another finding was that the number of crop plants detected, where weeds germinate within the 1 cm radii, equalled only 0.5-1% of total number of crop plants analysed. Ecology and bio-diversity
Control of only particular weed species in the close to crop area provides new opportunities for ecology, weeding strategy and bio-diversity. First, highly selective weed control strategies can be successfully targeted towards key growth periods and key problem species in order to minimize the impact of weeds on crop yield and quality. Table 1 is showing the frequency of weed species on Danish sugar beet fields. The key problem species are grouped by their negative impact on yield.
Not all of the most frequent weed species in a Danish sugar beet field have a negative impact on yield as shown in table 1. That is indicating a possibility for applying highly species-selective weeding methods to a typical sugar beet field. This can help to minimise the energy and time input to the highly selective weeding methods.
Not only the savings of time and energy input can be beneficial, but the weeds also have positive properties that can be utilised in organic agricultural systems. Weeds can supply ground cover to an otherwise bare soil, reducing the risk of erosion, leaching and soil crusting. Soil structural characteristics can be affected by weed root systems. Roots exude large quantities of polysaccharides, which help to bind soil aggregates to form larger, more stable aggregates (Robson et al., 2002). Axial pressure exerted by roots as they grow and move through the soil compresses the area adjacent to the root channel; pressing aggregates together and increasing their stability. Bio-pores made by weed roots facilitate air and water movement into the subsoil (Robson et al., 2002).

6th EWRS Workshop on Physical and Cultural Weed Control 136 Lillehammer, Norway, 8-10 March 2004
Table 1. Frequency of weed species on Danish sugar beet fields. Data from a vegetation study during 1987 to 1989 on 47 locations in Denmark (Andreasen, 1990). The weed species, which have a negative impact on yield is indicated by ‘Yes’. ‘No’ means the weed species do not have an negative impact on yield (modified after Melander, 1993)
Latin name Frequency1 [%]
Yield reduction impact
Chenopodium album 37.4 Yes Stellaria media 33.6 Yes Viola arvensis/Viola tricolor 29.4 Yes Lamium spp. 23.8 Yes Veronica spp. 23.8 No Polygonum convolvulus 22.3 Yes Poa annua 13.0 No Elymus repens 11.1 Yes Cirsium spp. 10.4 Yes Polygonum persicaria 8.7 No2
Polygonum aviculare 8.7 No Trifolium repens 7.7 No
1 Percentage of locations with presence of each weeds species. 2 Have negative impact on crop yield at low moisture conditions only.
The additional roots in the soil also contribute to biological activity. As plant roots die, they
decompose to provide energy and nutrients for the microbial population. Weeds with different root biomass and architecture will deposit organic matter in varying amounts at different depths in the soil profile. This encourages microbial activity at different rooting depths and means that nutrients will be available for other plants at those depths. Weeds can also act as a reservoir for beneficial mycorrhizal fungi, which naturally occur on most crop species (Robson et al., 2002). Plant roots infected with mycorrhizal fungi have been shown to take up more soil nutrients and have greater resistance to root pathogens (AzconAguilar & Barea, 1996).
As previously mentioned, damaged leaves can survive the damage itself, but due to pathogenic fungi that naturally occur in the environment, there is a possibility that these fungi can act as a biological control organism (Hatcher & Melander, 2003). A correlation between the number of damaged plants and the amount of natural biological control organisms may exist.
Weed species increase the plant diversity within the cropping system, and provide habitats for a wider range of insects and other invertebrates. However, van Elsen (2000) has proposed that mechanical weeding may decline the number of long-lived winter annual weed species and support of short-lived summer annual weed species. This can improve static and impoverished weed vegetation (van Elsen, 2000). Conclusion
The above descriptions of different parameters have so far lead to the following definition of the close to crop area.
• The close to crop area is like a ring structure, comprising an inner- and outer-circular boundary around the sugar beet seedling. In this definition, it is assumed that the centre of sugar beet seedling is known and the land area that the foliage and fibrous root system covers can be represented by a circle.

6th EWRS Workshop on Physical and Cultural Weed Control 137 Lillehammer, Norway, 8-10 March 2004
• The inner circle is the area covered by the sugar beet seedling where no physical weeding should be applied. The inner circle is based on the radii of the phyllotaxis and the tap-root. The radii of the phyllotaxis and the tap-root is both increasing with the increasing number of leaves produced during the seedling growth. At the 10-12 leaf stage the tap-root have reached a radii of 0.5-1 cm. The radii of the phyllotaxis is presumably twice the size of the tap-root at the 10-12 leaf stage. Thus, the phyllotaxis is defining the radii of the inner circle, going from only a few mm at the cotyledon stage to 1-2 cm at the 10-12 leaf stage. This study presented an indication of that only 1% of the weeds germinate within a 1 cm radii from the center of a sugar beet plant at both the cotyledon and 4-6 leaf stage. This 1 cm ‘weed-free zone’ should be added to the phyllotaxis radii to reveal the true area where no physical weeding should be applied.
• The space between the inner and outer circle is then the close to crop area where physical
weeding should be applied. The size of this area is defined by the developmental stage of roots and foliage. At the cotyledons stage the radii of the close to crop area above ground is defined by the inner circle alone, because the foliage size is very small. However, there is a high risk of uprooting of sugar beet seedlings at very early growth stages within a radius of at least 2 cm from the plant center. This radius is based on the laterally wandering of the emerging shoot from the location of the seed. Uprooting directly or by disturbance of soil clods and stones should be considered at the cotyledon stage. The close to crop area is therefore increasing with increasing size distribution of soil clods and stones. If a soil cap is present, the close to crop area is also increased. After the first pair of true leaves have appeared the close to crop area above ground expands. At the 10-12 leaf stage the close to crop area can have expanded to more than 10 cm based on the foliage ground cover. However, the below ground close to crop area is usually less than 10 cm at that growth stage, because the risk of uprooting of the tap-root is getting lower from the 10-12 leaf stage and later growth stages. The depth of the close to crop area is 0-3 cm based on the usually depth of the fibrous root system
From the above it is obvious that a determination of the growth stage of individual crop plants
is necessary before any physical weeding process can take place in the close to crop area. The optimum timing for physical weed control in the close to crop area is influenced by the
first flushes of seedlings and weed density. The first and most numerous weed flush is emerging within 2-3 weeks after sowing, where the sugar beet seedlings have 2-4 leaves. The weed density also influences a second weed control, but in addition the competitive ability of the crop in the close to crop area and the growth stage of the weeds should be included in the weeding strategy. Uprooting, cutting between stem and root or damage of main shoot can do the physical control of most weed species. However, the targeting of weeds from above and from different angels above ground is limited in the close to crop area. This is caused by the fact that sugar beet leaves do not leave much space between leaves and ground and that our own study indicate that 26.4% of sugar beet plants at the 4-6 leaf stage are covering the main shoot of weeds. The most problematic weeds is the species which have their main shoot and leaves located close to ground level. These species can best be controlled by damage of the main shoot or with a combination of shallow surface cutting and burial.
Discrimination between weed species is beneficial under certain circumstances. First, the efficiency of the physical control on individual weed species is depending on the timing. Secondly, some weeds species do not have significant negative impact on the beet yield, but instead leaving these species uncontrolled could benefit to an increased bio-diversity and reduced time and energy input for a physical weeding process.

6th EWRS Workshop on Physical and Cultural Weed Control 138 Lillehammer, Norway, 8-10 March 2004
References ANDREASEN C (1990) The occurrence of weed species in Danish arable fields. PhD thesis, The
Royal Veterinary and Agricultural University, Copenhagen, Denmark ASCARD J (1998) Comparison of flaming and infrared radiation techniques for thermal weed
control. Weed Research 38, 69-76 ASCARD J & MATTSON B (1994) Inter-row cultivation in weed-free carrots: the effect on yield
of hoeing and brush weeding. Biological Agriculture and Horticulture 10, 161-173. ASTRAND B & BAERVELDT (2002) An agricultural mobile robot with vision-based perception
for mechanical weed control. Autonomous Robots 14, 21-35. AZCONAGUILAR C & BAREA JM (1996). Arbuscular mycorrhizas and biological control of
soil-borne pathogens - an overview of the mechanisms involved. Mycorrhiza 6, 457-464. BACHMANN L (1986) Zur Einführung eines zweiziffrigen Codes zur Kennzeichnung der
Wachstumsstadien bei Zuckerrüben. Feldwirtschaft 27, 392-394. BLASCO J, ALEIXOS N, ROGER JM et al. (2002) Robotic weed control using machine vision.
Biosystems Engineering 83, 149-157. BOND W & GRUNDY AC (2001) Non-chemical weed management in organic farming systems.
Weed Research 41, 383-405. BOUTIN C & HARPER JL (1991) A comparative study of the population dynamics of five species
of Veronica in natural habitats. Journal of Ecology 79, 199-122. CUSSANS GW, RAUDONIUS S, BRAIN S & CUMBERWORTH S (1996) Effects of depth of
seed burial and soil aggregate size on seedling emergence of Alopecurus myosurides, galium aparine, stellaria media and wheat. Weed Research 36, 133-141.
DUNHAM RJ (1993) Water use and irrigation. In: The Sugar Beet Crop (eds DA Cooke & RK Scott), 1st edn, 278-311. Chapman and Hall, London, UK.
ELLIOTT MC & WESTON GD (1993) Biology and physiology of the sugar beet plant. In: The Sugar Beet Crop (eds DA Cooke & RK Scott), 1st edn, 37-66. Chapman and Hall, London, UK.
FARAHBAKHSH A & MURPHY J (1986) Comparative studies of weed competition in sugar beet. Crop protection of sugar beet and crop protection and quality of potatoes. Aspects of applied biology 13, 11-17.
GRIEPENTROG HW, NØRREMARK M, NIELSEN H & BLACKMORE S (2003) Individual plant care in cropping systems. In: Proceedings 4th European Conference on Precision Agriculture, Berlin, Germany, 247-258.
HATCHER PE & MELANDER B (2003) Combining physical, cultural and biological methods: prospects for integrated non-chemical weed management strategies. Weed Research 43, 303-322.
HEISEL T, ANDREASEN C & CHRISTENSE S (2001) Sugar beet yield response to Lolium perenne L. or Sinapsis arvensis L. growing at three different distances from the beet and cut various times – prediction of yield loss based on early relative weed leaf area. Weeds in sugar beet rows: I Influence of neighbour plant on the beet yield, II Investigation of CO2 laser for in-row weed control. Danish Institute of Agricultural Sciences (DIAS) Report 51, 3-61.
HÅKANSSON S & WALLGREN B (1976) Agropyron repens (L.), Beauv., Holcus mollis L. and Agrostis gigantea Roth as weeds – some properties. Swedish Journal of Agricultural Research 6, 109-120.
JENSEN PK (1999) The e�ect of timing and frequency of soil cultivation on emergence and depletion of the soil seed bank of volunteer grass seeds and dicotyledonous weeds. Journal of Applied Seed Production 17, 27-34.
KING TJ (1975) Inhibition of seed germination under leaf canopies in Arenaria serpyllifolia, Veronica arvensis and Cerastium holosteoides. New Phytologist 75, 87-90.

6th EWRS Workshop on Physical and Cultural Weed Control 139 Lillehammer, Norway, 8-10 March 2004
LEE WS, SLAUGHTER DC & GILES DK (1999) Robotic weed control system for tomatoes. Precision Agriculture 1, 95-113.
MARCHANT JA, HAUGE T TILLETT N (1997) Row-following accuracy of an autonomous vision-guided agricultural vehicle. Computers and Electronics in Agriculture 16, 165-175.
MEIER U, BACHMANN L, BUHTZ E et al. (1993) Phänologische Entwicklungsstadien der Beta-Rüben (Beta vulagaris L. sspp.). Nachrichtenbl. Deut. Pflanzenschutzd. 45, 37-41.
MELANDER B (1993) Beskrivelse af ukrudtsarterne. In: Ukrudtsbekaempelse i Landbruget. 2nd edn, 41-186. Statens Planteavlsforsøg, Skejby, Denmark
MELANDER B (1997). Optimization of the Adjustment of a Vertical Axis Rotary Brush Weeder for Intra-Row Weed Control in Row Crops. Journal of Agricultural Engineering Research 68, 39-50.
MILFORD GFJ (1973) The growth and development of the storage root of sugar beet. Annals of Applied Biology 75, 427-438.
MILFORD GFJ, POCOCK TO, JAGGARD KW et al. (1985a) An analysis of leaf growth in sugar beet. IV: The expansion of the leaf canopy in relation to temperature and nitrogen. Annals of Applied Biology 107, 335-347.
MILFORD GFJ, POCOCK TO & RILEY J (1985b) An analysis of leaf growth in sugar beet. II: Leaf appearance in field crops. Annals of Applied Biology 106, 163-172.
MILFORD GFJ, POCOCK TO & RILEY J (1985c) An analysis of leaf growth in sugar beet. I: Leaf appearance and expansion in relation to temperature under controlled conditions. Annals of Applied Biology 106, 173-185.
MOHLER CL (1993) A model of the effects of tillage on emergence of weed seedlings. Ecological Applications 3, 53-73.
MOHLER CL (2001) Weed life history: identifying vulnerabilities. In: Ecological Management of Agricultural Weeds (eds M Liebman, CL Mohler & CP Staver), 1st edn, 40-84. Cambridge University Press, Cambridge, UK
NØRREMARK M, GRIEPENTROG HW, NIELSEN H & BLACKMORE S (2003) A method for high accuracy geo-referencing of data from field operations. In: Proceedings 4th European Conference on Precision Agriculture, Berlin, Germany, 463-468.
PIKE DR, STOLLER EW & WAX LM (1990) Modelling soybean growth and canopy apportionment in weed-soybean (Glycine max) competition. Weed Science 38, 522-527.
RASMUSSEN J & ASCARD J (1995) Weed control in organic farming systems. In: Ecology and Integrated Farming Systems (eds DM Glen, MP Graves & HM Anderson), 49-67. John Wiley & Sons, Chichester, UK.
ROBERTS HA & POTTER ME (1980) Emergence patterns of weed seedlings in relation to cultivation and rainfall. Weed Research 20, 377-386.
ROBSON MC, FOWLER SM, LAMPKIN NH, et al. (2002) The agronomic and economic potential of break crops for ley/arable rotations in temperate organic agriculture. Advances in Agronomy 37, 369-427.
SCHWEIZER & MAY (1993) Weeds and weed control. In: The Sugar Beet Crop (eds DA Cooke & RK Scott), 1st edn, 484-520. Chapman and Hall, London, UK.
SCOTT RK & JAGGARD KW (1993). Crop Physiology and Agronomy. In: The Sugar Beet Crop (eds DA Cooke & RK Scott), 1st edn, 179-233. Chapman and Hall, London, UK.
SØGAARD HT & HEISEL T (2002) Machine vision identification of weed species based on active shape models. In: Proceedings 2002 12th International Symposium of the European Weed Research Society, Wageningen, The Netherlands, 402-403.
TILLETT ND, HAUGE T & MILES SJ (2002) Inter-row vision guidance for mechanical weed control in sugar beet. Computers and Electronics in Agriculture 33, 163-177.
TILLETT ND, HAUGE T & MARCHANT JA (1998) A robotic system for plant-scale husbandry. Journal of Agricultural Engineering Research 69, 169-178.

6th EWRS Workshop on Physical and Cultural Weed Control 140 Lillehammer, Norway, 8-10 March 2004
VAN ELSEN T (2000) Species diversity as a task for organic agriculture in Europe. Agriculture, Ecosystems & Environment 77, 101-109.
VAN HEEMST HJD (1985) The influence of weed competition on crop yield. Agricultural Systems 18, 81-93.
VAN ZUYDAM RP, SONNEVELD C & NABER H (1995) Weed control in sugar beet by precision implements. Crop Protection 14, 335-340.
VLEEHOUWERS LM (1997) Modelling the effect of temperature, soil penetration resistance, burial depth and seed weight on pre-emergence growth of weeds. Annals of Botany 79, 553-565.
WEINER J (1982) A neighbourhood model of annual-plant interference. Ecology 63, 1237-1241. WHITE J (1979): The plant as a metapopulation. Annual Review of Ecology and Systematics 10,
109-145.

6th EWRS Workshop on Physical and Cultural Weed Control 141 Lillehammer, Norway, 8-10 March 2004
Comparison of alternative interrow weeder steering systems
D.W.M. Pullen1 & P.A. Cowell2 1Cranfield University at Silsoe, Silsoe, Bedford MK45 4DT, UK Email: [email protected]
2Consultant, formerly with Cranfield Univesity at Silsoe
The success of interrow weeding depends on being able to quickly and accurately guide the weeder along the rows. This can only be done by automatically guiding the weeder. Any automatic weeder steering system requires a sensor/s to provide an error or guidance signal and a mechanism to move the hoes to the correct lateral position at the correct time in response to this error signal. Many different guidance sensors have been developed for this application and much is known about their different characteristics (Jahns, 1976; Tillett, 1991). However, little has been reported about the steering system design.
This paper describes the different methods of mounting weeders onto the tractor and discusses in detail the alternative commercial steering designs used on rear-mounted weeders. It also describes the development and validation of a mathematical modelling technique that can be used to predict the behaviour of a tractor and weeder (Pullen & Cowell 2000). Three different steering techniques, ie sliding the weeding blades from side to side, steering by changing the weeding blade direction and using steered wheels, in response to an error signal were evaluated using the theory.
Results of the study show the modelling technique was accurate. The amplitude of the predicted weeder path was within 2% and the phase angle within 2 degrees of the actual value. The study also suggests fitting steered wheels, whose position moved proportionally with the error signal was overall the most suitable method of steering the weeder. For this steering system the model shows the critical parameters affecting overall performance were the steering gain and hoe position. The tractor type (ICR position), the sensing position, the steered wheel position and steered wheel axle position did not significantly influence performance. However, positioning the steered wheels behind the headstock but in front of the weeding blades would be better practically. References: PULLEN DWM & COWELL PA (2000). Prediction and experimental verification of a rear-mounted
inter-row weeder. J. agric. Engng Res 77, (2) 137-153. JAHNS G (1976). Automatic guidance of farm vehicles - a monograph. Agricultural Engineering
Departmental Series No 1. Agricultural Experiment Station, Auburn University. TILLETT ND (1991). Automatic guidance sensors for agricultural field machines - a review. J.
agric. Engng Res. 50, 167-187.

6th EWRS Workshop on Physical and Cultural Weed Control 142 Lillehammer, Norway, 8-10 March 2004
Are we making significant progress in mechanical weed control research?
J. Rasmussen Department of Agricultural Science, The Royal and Veterinary and Agricultural University,
Højbakkegård Allé 13, DK-2630 Taastrup, Denmark Abstract
This study investigates whether researchers’ perceptions of good research are in agreement with current research practice as reflected in Weed Research. A high degree of agreement is assumed to indicate progress.
The instrument used to survey researchers perceptions was a questionnaire consisting of 28 items related to (1) research methodologies, (2) research priorities, (3) quality of publications, (4) future developments in technology and agriculture and (5) general attitudes to alternative and conventional agriculture. Questions about gender and personal research engagement were also laid down in the questionnaire. The questionnaire was sent out by e-mail to about 140 researchers on the mailing list of the EWRS – Physical and Cultural Weed Control Group and 60 questionnaires were completed and returned. An analysis of all Weed Research publications in the period 1998-2003 investigated current research practices.
The questionnaire showed that researchers in the working group are not specialized. Of the respondents, only 4 researchers (7%) used 50% or more of their research hours on mechanical weed control but a total of 44 researchers (73%) were active within this area.
Views on research and agriculture varied significantly within the group and two counter paradigms were identified often refereed to as alternative and dominant. The alternative paradigm was connected with organic farming and the dominant paradigm was connected with conventional agriculture. Alternative paradigmatic positions prevailed among the respondents although strong dominant positions were also represented. Females (N=15) held more alternative positions than males (P < 0.01) and researchers engaged in herbicide technology (N=13) held more dominant positions than the rest (P < 0.05).
By using an alternative-dominant scale, it was evident that respondents’ perceptions of good research was linked to basic values and beliefs that determine the overall understanding of how agriculture works and should be developed. Alternative perceptions of good research, however, seemed to be inconsistent with the current research practice as reflected in Weed Research. Consistency between ideals and reality should result in (1) more multidisciplinary studies to facilitate broader perspectives on weed control, (2) more studies carried out on working farms, (3) more system approaches that include whole agro-ecosystems with farmers and other stakeholders, (4) value inquiries, (5) participative research and (6) reflective approaches. Papers published in Weed Research clearly demonstrate, that alternative research in the ideal is different from research in reality. The main difference between alternative and dominant research is in what gets studied, not in how it is studied.
In conclusion, research in physical and cultural weed control may be evaluated successful in a dominant paradigmatic perspective but progress is very limited in an alternative paradigmatic perspective. There seems to exist a mismatch between ideals and reality in weed research, which challenges ideals as well as practice.

6th EWRS Workshop on Physical and Cultural Weed Control 143 Lillehammer, Norway, 8-10 March 2004
Introduction
Mismatches between ideals and reality are challenging. If not considered, they may impede progress. If considered, they may develop ideals as well as practice.
This study aimed to investigate whether there exist mismatches in the EWRS – Physical and Cultural Weed Control group regarding perceptions of good research (the ideal) and conducted research (the reality).
The following text and table briefly adds some details to the abstract. The text constitutes not a full paper. A comprehensive presentation including results from other EWRS working groups will be published later in a journal. Materials and methods
The questionnaire was constructed on the basis of three main sources that relate to the alternative–dominant paradigmatic understandings of agriculture and research: (1) the Alternative-Conventional Agricultural Scale developed to measure basic beliefs and values assumed to constitute two competing perspectives in agriculture (Beus and Dunlap, 1991), (2) Lockeretz and Anderson’s (1993) analysis of alternative agricultural research and (3) the concepts behind the farming systems approach developed in Australia (Packham, 2003).
Seven bipolar statements were copied from the Alternative-Conventional Agricultural questionnaire developed by Beus and Dunlap (1991) to constitute the first group of items (20, 22, 23, 24, 25, 26, and 27 in Table 1), nine bipolar statements were formulated on the basis of Lockeretz and Anderson’s (1993) and Packham’s (2003) work to constitute the second group of items (1, 2, 3, 4, 5, 11, 13, 14, and 15 in Table 1) and twelve bipolar statements were formulated to get insights into the respondents’ general perception of research priorities, publication quality, and expected future developments in technology and agriculture (items 6, 7, 8, 9, 10, 12, 16, 17, 18, 19, 21, 28 in Table 1). The bipolar items in the first and second group, which were supposed to portray the respondents’ paradigmatic positions to agriculture and research, were randomly reversed in direction in the questionnaire. Sometimes the alternative statement was in the left column and sometimes it was in the right column. Some items presented completely opposite positions, while the positions in others were not totally opposite but were designed to accurately portray of the contrasting (but not necessarily diametrically opposed) positions.
Agricultural paradigms reflect coherent frameworks of knowledge, values and beliefs that determine people’s overall understanding of how agriculture works and should work in the future. Paradigmatic consistency, witch expresses the strength of the framework, was tested according to the procedures given in Rasmussen and Kaltoft (2003). Results
The first two groups of items were shown to be suitable to quantify respondents’ paradigmatic
position on an alternative-dominant scale. The paradigmatic consistency was very high for items in the first group (general attitudes) and somewhat lower in the second group (specific attitudes to research methodology). All items, however, were tested to be suitable to portray paradigmatic position on an alternative-dominant scale.
Table 1 presents the questionnaire and the frequencies of 60 respondents’ answers.

6th EWRS Workshop on Physical and Cultural Weed Control 144 Lillehammer, Norway, 8-10 March 2004
Table 1. Questionnaire about future directions in weed research and agriculture. Frequencies of given answers (N=60) are given in the questionnaire. For each pair of contrasting views, the respondents were asked to indicate which one of the two views they most agree with – the one in the left column or the one in the right hand column – by crossing the appropriate number:
1 = STRONGLY AGREE WITH THE VIEW IN LEFT HAND COLUMN
2 = MILDLY AGREE WITH THE VIEW IN LEFT HAND COLUMN
3 = AGREE WITH BOTH
4 = MILDLY AGREE WITH THE VIEW IN RIGHT HAND COLUMN
5 = STRONGLY AGREE WITH THE VIEW IN RIGHT HAND COLUMN
(Statements marked with ”A” are alternative positions and statements marked with “D” are dominant positions in items used to portray the alternative-dominant paradigmatic position. Statements without marks are open questions in Group 3). 1 More research should be
multidisciplinary to facilitate broader perspectives on weed control
“A”
More research should go in depth to improve basic understanding of mechanisms related to weed control
“D”
2 More research should adapt theories and methods from basic disciplines in natural sciences
“D”
More research should adapt systems approaches that include whole agro-ecosystem
“A”
3 Farmers’ knowledge and attitudes are critical to progress in weed control
“A”
Research is critical to progress in weed control
“D”
4 Researchers should aim to develop “product in a package” in order to provide the best option for farmers
“D”
Researchers should emphasise the importance of evaluating series of alternative solutions in order to provide the best option for farmer’s own choice “A”

6th EWRS Workshop on Physical and Cultural Weed Control 145 Lillehammer, Norway, 8-10 March 2004
5 More research should be done in strictly controlled environments to make results more precise
“D”
More research should be done on working farms to make results more realistic
“A”
6 Future research priorities should be given to direct control methods (curative methods)
Future research priorities should be given to indirect control methods (preventive methods)
7 Future research priorities should be given to chemical weed control
Future research priorities should be given to none-chemical weed control
8 Future weed management practices in industrialised countries will mainly be based on physical and cultural methods
Future weed management practices in industrialised countries will mainly be based on herbicides and/or gene modified crops
9 Future use of physical and cultural weed control will expand within conventional agriculture
Future use of physical and cultural weed control will primary be restricted to organic farming
10 Precision guided implements and robotic systems will revolutionize physical weed control within the next decade
Precision guided implements and robotic systems will only make limited contribution to physical weed control within the next decade
11
Weed research should include value-laden issues in the research process because they are important
“A”
Weed research should demarcate itself from value-laden issues and stick to unbiased and impersonal issues
“D”

6th EWRS Workshop on Physical and Cultural Weed Control 146 Lillehammer, Norway, 8-10 March 2004
12 Weed research should strengthen focus on advanced technology like robotic systems and/or biotechnology
Weed research should strengthen focus on complex agro-ecosystem processes and interactions
13 Holistic approaches should be integrated in weed research to an increasing extent
“A”
Holism is a misused phrase without much relevance to weed research
“D”
14 Objectivity is a core value in weed research
“D”
Objectivity is a misused phrase without much relevance to weed research
“A”
15 Good research produces knowledge which is useful in a scientific context
“D”
Good research produces knowledge which is useful in a societal context
“A”
16 Research papers would generally be improved if research methods were emphasised in order to clarify how experiments were conducted and data analysed
Research papers would generally be improved if it was emphasised how previous research had influenced the choice of question, interpretation of data and conclusion
17
More reviews are needed to critically examine what has actually been achieved to decide what to do next
More experimental research is needed before it is worthwhile to make more reviews

6th EWRS Workshop on Physical and Cultural Weed Control 147 Lillehammer, Norway, 8-10 March 2004
18 All papers published in Weed Research (all topics) are valuable because they contribute to scientific knowledge
Many papers published in Weed Research (all topics) are of limited value simply because they don’t seem to make a difference
19 Novelty is a crucial attribute in good weed research
Correctness is a crucial attribute in good weed research
20 Meeting food needs with fewer and fewer farmers is a positive outcome of research and technological progress
“D”
Meeting food needs with fewer and fewer farmers is a negative outcome of our free market system
“A”
21 Research should be better coordinated nationally and internationally to facilitate collaboration
Research is well coordinated, further coordination will impede competition between research environments
22 Technology should be used to make farm labour more rewarding and enjoyable, but not to replace it
“A”
Farm labour should be replaced whenever possible by more efficient machines and other technologies
“D” 23 Agricultural scientists
and policy-makers should recognize that there are limits to what nature can provide and adjust their expectations accordingly “A”
Agricultural scientists and policy-makers should expand efforts to develop biotechnologies and other innovations in order to increase food supplies
“D”

6th EWRS Workshop on Physical and Cultural Weed Control 148 Lillehammer, Norway, 8-10 March 2004
24 Good farming depends mainly on personal experience and knowledge of the land
“A”
Good farming depends mainly on applying the findings of modern agricultural science
“D”
25 Farmers should use primarily natural fertilizers and production methods such as manure, crop rotations, compost and biological pest control “A”
Farmers should use primarily synthetic fertilizers and pesticides in order to maintain adequate levels of production “D”
26 Modern agriculture is a major cause of ecological problems and must be greatly modified to become ecologically sound “A”
Modern agriculture is a minor cause of ecological problems and needs to be only fine-tuned periodically in order to be ecologically sound “D”
27 The key to agriculture’s future success lies in learning to imitate natural ecosystems and farm in harmony with nature “A”
The key to agriculture’s future success lies in the continued development of advanced technologies that will overcome nature’s limits “D”
28 Organic farming is a sustainable farming practice
Organic farming is not a sustainable farming practice

6th EWRS Workshop on Physical and Cultural Weed Control 149 Lillehammer, Norway, 8-10 March 2004
Personal information:
Male: Female:
My main research area(s) - please indicate percentage:
Mechanical weed control
Soil tillage
Thermal weed control
Preventive and cultural methods
Engineering
Herbicide technology
Weed biology
Other
E-mail address:
(Information given by individuals are kept confidential)
Comments:
I want an e-mail about the results of the inquiry Yes:
For further information please contact Jesper Rasmussen ([email protected])
´ Submit Reset
References BEUS CE & DUNLAP RE (1991). Measuring adherence to alternative vs. conventional agricultural
paradigms: A proposed scale. Rural Sociology, 56, 432-460. LOCKERETZ. W & ANDERSON MD (1993). Agricultural Research Alternatives. University of
Nebraska Press, Lincoln, USA. PACKHAM R (2003). Concepts behind the Farming Systems Approach. In The Australian
Farming Systems Conference, Toowoomba, Queensland, Australia, 7-11 September 2003, pp. 26-48.
RASMUSSEN, J. & KALTOFT P (2003). Alternative versus conventional values and attitudes in higher agricultural education. Biological Agriculture & Horticulture 20, 347-363.

6th EWRS Workshop on Physical and Cultural Weed Control 150 Lillehammer, Norway, 8-10 March 2004
Techniques for green manure cutting: Energy requirement and ley recovery
M. Tobiasson & G. Danielsberg College of Hedmark, Blæstad, N-2322 Ridabu, Norway
A green manure ley needs to be mowed several times every season to control the weeds. From a resource perspective, the number of mowings should be reduced to a minimum in order to save fuel. Additionaly, the farmer needs an economical and practical solution to the task.
Materials and methods
Two trials were carried out on grassland and clover ley respectively, where ley regrowth, evenness of spreading and evenness of cutting was measured after different mowing machines. Those included two flail mowers, bar cutter, rotary mower with conditioner and a pasture topper. One additional trial was carried out where fuel consumption was measured in clover ley by use of a tractor computer. From this, energy consumption per hectare was calculated. The clover leys used where quite thick, with an estimated dry matter yield of at least 5000 kg/ha. The grassland being a grazed pasture yielded approximately 1000 kg/ha. Yields were not measured. Results
The flail mowers very much cut the plants to pieces with 70% of mass in pieces less than 5 cm of length. The rotary mower and the cutter bar left more than 90% of the mass uncut.
Flail mowers required a relatively high transmission effect which was increased considerably with the mass flow. The disc mower with conditioner required the highest transmission effect, but this increased comparably slowly with the masses of plants passed through. The effect required for the transmission of the pasture topper and the cutter bar were negligible. The cutter bar used least total energy per hectare, followed by the disc mower.
The cutting capacity was decidedly highest for the disc mower and lowest for the cutter bar with comparably small differences between the other machines. The cutter bar was the only machine leaving the grass in a clear windrow.
The clover ley regrowth, measured by coverage and plant height, was more rapid after machines cutting up the plants. The grassland showed no differences except for the cutter bar whose swath hindered the regrowth to some extent. Discussion
All machines tested could be used for the purpose. The choice will, however, totally depend on yield, farm size and what other chores there might be for mowers.
Clearly, machines may not make much of a windrow. The regrowth was obviously favoured by cutting the plants into pieces. However, cutting on a
somewhat earlier date could have been a good choice considering the reduced time and energy consumption. This would have been favourable for all machines, but most notably for the rotary mower which would have increased the capacity most while probably reducing crop hindrance.
We do not know to what degree the slow down of regrowth in these cases affects the leys competitiveness against weeds or not. Further trials on this will be carried out.

6th EWRS Workshop on Physical and Cultural Weed Control 151 Lillehammer, Norway, 8-10 March 2004
Thermal weed control

6th EWRS Workshop on Physical and Cultural Weed Control 152 Lillehammer, Norway, 8-10 March 2004
Steaming soil in narrow strips for intra-row weed control in sugar beet
D. Hansson & S.-E. Svensson Swedish University of Agricultural Sciences,
Department of Horticultural Engineering, P.O. Box 66, SE–230 53 Alnarp, Sweden
The objective was to study the weed control effect and the energy use when soil was steamed in
narrow strips before sowing. The experiment was carried out on a sandy soil on an organically cultivated field in the southern part of Sweden (Österlen). The field was sown with sugar beet a couple of hours after the treatment. Annual weeds were predominant in the experiment, with the main species observed being Senecio vulgaris (L.), Chenopodium album (L.) Solanum nigrum (L). and Solanum physalifolium (Rusby).
Treatments were performed using tractor-drawn steaming equipment from Regero (France) with a 700 kW diesel boiler to heat the water. The hot steam was conveyed to nine applicators (9 rows). Each applicator heated a section of the soil 0.14 m wide and 0.04-0.05 m deep. The total working width for the equipment was 5.10 m. The amount of steam applied per hectare was adjusted by varying the tractor travel speed. Dose-response relationships were described in order to estimate the effective energy use and effective travel speed of steam treatment.
The soil temperature was 70 °C to 80 °C during the treatment. Preliminary results indicate that steam treatment can control S. vulgaris and C. album. It was not possible to show a significant weed control effect on S. nigrum, S. physalifolium and Fallopia convolvulus (L.) at the energy doses studied. One explanation for the insignificant effect may be that the soil temperature did not reach 70-80 °C in all parts of the treated soil volume, i.e. in the central part of the volume. The energy dose required to achieve a 90% reduction in plant number (LD90) was 850 L diesel ha-1. The steam-applicators used in the experiment were prototypes, i.e. there can be a great potential to decrease the energy use by technical development of the applicators.
The steam treatment made it possible to reduce the working-hours for manual weed control (hoeing) from approximately 110 h ha-1 to 60 h ha-1.
The cost to treat one hectare is estimated to 7500 SEK (830 €, 2003 price level) with the equipment from Stockholmsgården, under following circumstances. Investment 300 000 SEK, 79 L diesel oil h-1, 4 SEK L-1 diesel oil, driver 150 SEK h-1, tractor 100 SEK h-1, capacity 0.1 hectare h-1 and 20 hectare year-1. Decreasing the treated strip to half of the width will double the capacity and decrease the cost to approx. 4900 SEK hectare-1.

6th EWRS Workshop on Physical and Cultural Weed Control 153 Lillehammer, Norway, 8-10 March 2004
A device to kill weed seeds captured during crop harvesting.
J. Matthews1, P. Harris & D. E. Miegel 1University of Adelaide Roseworthy 5371 South Australia
CRC for Australian Weed Management Email, [email protected]
The harvesting of annual crops provides an opportunity to remove or kill the seed of weed species when mature and within the crop canopy. Petzold 1956, discussed the dispersal of seeds by modern harvesters and concluded that the harvesting process would distribute several important weed species more widely. Crops that are either direct headed or windrowed before harvest have possibilities for destruction of remaining weed seed at harvest. Lolium rigidum (annual ryegrass) is the major weed of interest in Australia because of widespread herbicide resistance. Management of such ryegrass depends upon physical and non-selective chemical control methods. A device has been developed to kill seeds by utilising the waste heat from the exhaust gases of the harvester motor. An Australian provisional patent application number 2003905285 has been granted.
Table 1. Germination of ryegrass from seedkilling treatment, mean of 10 replicates.
treatment Germination % (SD) Treated ryegrass 0.8% (1.09)
Untreated ryegrass 86% (1.41)
The device consists of an enclosed steel cylindrical cyclone into which the exhaust gases are introduced via a tangentially located inlet duct at one end. The device was tested in a standing wheat crop infested with annual ryegrass. Ten replicate samples of treated seed were collected from the field. The germination of the treated ryegrass was almost completely inhibited by exposure to the hot exhaust gas Table 1. Limiting seed return to the soil is a potential method to reduce both population size and spread of weeds within a field. In field trials with seed removal, seed return was reduced by 86% in barley crops and by 78% in wheat crop (Matthews 1992). Another positive outcome of non-herbicide methods of ryegrass control is the tendency for regression or loss of herbicide resistance from resistant populations when selective herbicide use is stopped (Matthews 2002). There is potential to kill nearly all weed and retained crop seed during the harvesting process. References PETZOLD, K. (1956) Combine Harvesting and Weeds, Journal of Agric.Eng Research, 1, 178-181. MATTHEWS J .M, (1996), PhD thesis, Aspects of the population genetics and ecology of herbicide
resistant annual ryegrass, University of Adelaide, South Australia. MATTHEWS J. M. (2002) Regression of herbicide resistance in some populations of annual
ryegrass, Proc. 13th Australian Weeds Conference, eds. H Spafford-Jacobs, J. Dodd and J.H.Moore, pp.

6th EWRS Workshop on Physical and Cultural Weed Control 154 Lillehammer, Norway, 8-10 March 2004
Recent results in the development of band steaming for intra-row weed control
B. Melander1, M.H. Jørgensen2 & L. Elsgaard3 1Danish Institute of Agricultural Sciences (DIAS), Department of Crop Protection,
Research Centre Flakkebjerg, DK-4200 Slagelse, Denmark, [email protected] 2Department of Agricultural Engineering (DIAS)
3Department of Agroecology (DIAS)
The idea of band steaming for intra-row weed control in row crops was introduced at the 5th workshop on Physical and Cultural Weed Control in Pisa 2002. The work on band steaming has been continued since then, and new results on technical and biological aspects have been produced.
The biological studies have shown that soil type, soil moisture content and soil structure (aggregate size) influence the lethal effect of soil steaming when the maximum soil temperatures are below 70oC. Steaming was more effective in a sandy soil than in a loamy soil, and increasing soil moisture content generally increased the susceptibility of weed seeds. More weed seeds survived the lethal effect of steam in soil containing many large aggregates as compared with soil having fewer large aggregates, presumably due to poorer steam penetration of the large aggregates. However, all the factors mentioned no longer had any effect when maximum soil temperature reached more than 70oC.
Studies of sowing crop seeds immediately after steaming showed that seeds of sugar beets, maize, leek, onion and partly carrots were surprisingly tolerant to the heat. This implies that crop sowing might be integrated with steaming so that steaming and sowing can be done in the same pass provided that crop sowing is done after steaming.
Technical studies have focussed on ways to distribute the steam as evenly as possible in the soil volume to be steamed with the aim to reach the desired maximum soil temperature all over the volume. Test-driving with a prototype band steamer in the field revealed that this might be difficult to achieve in the very topsoil layer and that technical modifications were necessary for further improvements. The test-driving also showed that a maximum soil temperature of 90oC was necessary in the field situation for sufficient weed control and that a fuel consumption of approx. 350 litres of fuel oil ha-1 was necessary to achieve that temperature.
A major concern about steaming the soil is the lethal effects on other soil organisms than weed seeds. Thus, many non-target organisms are most likely killed, and the time it takes for the soil to recover is not known. Some of these aspects were studied in 2003, and the results indicated that the recovery process is rather slow. Bacteria responsible for oxidation of ammonium-N were significantly inhibited and the population had not recovered after 90 days. Also fungi and enzyme activities were reduced significantly, but physical and chemical soil conditions such as water content, pH, nitrate content, water-soluble carbon and in situ respiration activity were not affected. However, it is not clear whether these effects will affect crop growth negatively or whether some may even be beneficial. Thus, further studies are needed to describe the effects of steaming on soil organisms and other soil properties and how it may affect crop growth.
For further information and references please contact Bo Melander (DIAS).

6th EWRS Workshop on Physical and Cultural Weed Control 155 Lillehammer, Norway, 8-10 March 2004
Weed seeds control by steam and substances in exothermic reaction
A. Peruzzi, M. Borelli, M. Mazzoncini, M. Raffaelli, M. Ginanni & P. Bàrberi Centro Interdipartimentale di Ricerche Agro-Ambientali “E.Avanzi”- University of Pisa
Via Vecchia di Marina, 6 – 56010 S.Piero a Grado (PI) – Italy Email: [email protected]
Abstract
Several prototypes of a machine (drawn, mounted and self-propelled) for soil disinfection by means of steam injection at different depth, after the incorporation in the soil of varying amounts of compounds (KOH, CaO, etc.), that cause an exothermic reaction, were developed and improved in five years period 1998-2003 by the Celli firm, in co-operation with the researchers of the Centro Interdipartimentale di Ricerche Agro-Ambientali “E. Avanzi” of the University of Pisa.
The tested system showed a promising potential, as it was able to perform a remarkable soil heating and to control telluric pathogens and potential weed flora.
To estimate this last matter a specific experiment was carried out - in controlled conditions - in spring-summer 2003 to evaluate the effects of the application of this system on seed germination of both microthermal and macrothermal weeds, with very interesting and encouraging results. Introduction
One of the gravest phytopathological problems connected with the cultivation of specialized horto-floricultural crops, whether in the open field or greenhouse, are “diseases” provoked by telluric pathogens that must almost always be removed from the soil by disinfection. This is accomplished in most cases through the application of methyl bromide usually giving very positive phytoiatric and productive results (Martino, 1997). Environmental, hygienic-sanitary and toxicological considerations constrain the inclusion of this disinfectant in the Montreal Protocol which totally prohibits its use from 2005 on (Ferrari et al., 1998; Gullino, 1998; Gullino et al., 1999; Katan, 1999). The disappearance within a few years of the only active principle able to guarantee good phytoiatric results under all conditions makes it particularly urgent to develop new defence strategies. In this respect, an “alternative” method that has shown promise of significant results is “solarization”. Though it is ever more widely diffuse in use, it is apparently penalized however because it is strongly dependent on climatic and seasonal factors and the need for a long interruption in the cultivation cycle (Katan, 1987; Katan et al., 1976; Materazzi et al., 1987; Triolo et al., 1991).
The only alternative system to both chemical disinfectants application and soil solarization, is represented by steaming the soil, technique well known and widely used in the past (Triolo & D’Errico, 2002).
Taking into account these problems, a new system for soil disinfection (called “Bioflash”) by means of specific operative machines was developed by the Celli firm in co-operation with the researchers of the Sezione Meccanica Agraria e Meccanizzazione Agricola of the DAGA of the University of Pisa (Peruzzi et al., 2000; Peruzzi et al., 2002b; Barberi et al., 2002; Moonen et al., 2002).
This new system was tested from 1999 in several environmental, operative and productive conditions (both in greenhouse and in open field), and on different plant diseases. The results relative at control of fungus pathologies and nematodes on several horticultural cultivations were

6th EWRS Workshop on Physical and Cultural Weed Control 156 Lillehammer, Norway, 8-10 March 2004
surely very positive and promising. Moreover, the experimentation carried out has shown a very positive effect of the “bioflash” system on the productivity of some horticultural cultivations and the absence of negative and permanent alterations on chemical and microbiological characteristics of soil (Gelsomino et al., 2002; Mazzoncini et al., 2002; Lenzi et al., 2002; Peruzzi et al., 2000). As a matter of fact, the results have shown that the “bioflash” system doesn’t produce in the soil an effect known as “biological empty” (Gelsomino et al., 2002).
Moreover this system seems to have a good capacity of control of potential weeds, because it reduces the germination of seed weeds (Pinel et al., 2000, Barberi et al., 2002, Barberi & Moonen, 2002, Moonen et al., 2002). The experimentation carried out during spring-summer of 2003 in controlled conditions (simulating open field conditions) had the aim of evaluating this capacity. The results were very positive, but rather variable according to the species and the substances utilised. Materials and methods
The experiment was carried out on plastic “chests” (with parallelepiped shape, square base with side of 30 cm and height equal to 50 cm) in which steam was injected at a depth of 15 cm by means of a specific dispenser. The amount of steam was the same used when the treatments are performed by means of the operative machines in open ground (fig.1). Four doses (corresponding to 1000, 2000, 3000 and 4000 kg ha-1) of two substances in exothermic reaction (KOH and CaO) were used and compared to an only steamed control and an untreated control. The compounds were mixed to a sandy soil until the depth of 15 cm, while weed seeds were put in specific permeable small plastic sacks (100 seeds/250 cm3) resistant to high temperatures and chemical reactions, that were placed at 7.5 cm of depth (fig. 2). The effect of the treatments was evaluated on seeds of three microtherm (Alopecurus myosuroides Hudson, Matricaria chamomilla L., and Raphanus raphanistrum L.) and four macrotherm (Amaranthus retroflexus L., Echinochloa crus-galli L., Fallopia convolvulus L. and Setaria viridis L.) weed species.
After the treatments the soil contained in the sacks was put in plastic pots with parallelepiped shape (cm 14 x 10,5 x 4,5), watered and monitored each day, until plants finished to emerge from all the viable seeds. The effects of the different treatments were determined in terms of both numbers of emerged plants and weed density reductions with respect to the untreated control (fig.3).
During all the tests the trends of soil temperature were monitored at 7.5 of depth by means of PT100 sensors 4 cm long that send a voltage signal to data loggers from which data are acquired and recorded on a personal computer using specially designed software.
The temperatures were measured for three hours and after divided in four “classes” (T<40°C; 40≤T<60°C; 60≤T<80°C; T≥ 80°C). The time of persistence in the soil of each class and the highest, the average and the final (after three hours) values of temperature were taken into account in order to compare the effects of the different treatments.
A completely randomised experimental design was used to compare the nine treatments and the untreated control, while a factorial design was used to compare the effect of the two substances and the four different doses.

6th EWRS Workshop on Physical and Cultural Weed Control 157 Lillehammer, Norway, 8-10 March 2004
Fig.1 Plastic chest during the treatment with steam.
Fig.2 Particular of small sacks with soil and seeds.
(a) (b) Fig 3 Pots with weed seeds in germination after the treatment (a) and detail of one pot (b).

6th EWRS Workshop on Physical and Cultural Weed Control 158 Lillehammer, Norway, 8-10 March 2004
Results and discussion
The trends of soil temperature, registered in chests at 7,5 cm of depth are shown in table 1. It is possible to observe that the only steamed control determine a quite limited heating, with a value of maximum temperature of 46°C. With the addition of KOH at 2000 kg ha-1, the values of temperature (T sum, T max and T average were statistically higher than those of the only steamed application. However, the increase of temperature seemed to be almost proportional with respect to the amount of distributed substance. Between the two substances the more efficient to increase soil temperature was surely the CaO, because, under the same dose determined significantly higher values of T sum, T max, T average and T final, with respect to KOH. For example at 2000 kg ha-1, CaO determined a significant increase of both T max (9°C) and average T (4°C) with respect to KOH. The same trend was present also for the dose of 4000 kg ha-1 where CaO determined again significant increase of both T max (19°C) and average T (4°C) with respect to KOH. Finally the differences registered in all the performed treatments between the maximum and the minimum value of final T were only of 4°C. Thus the differences between the treatments seemed to be less relevant as time passes.
Table 1. Temperature range and several variables (Temperature sum. max, average and final) for all treatments analysed. The first variable (T sum) was obtained by the sum of all registered temperature in 180 minutes, the second one (average T) dividing the T sum by 180 minutes, max T is the maximum temperature reached and final T is the temperature after 180 minutes. Data were analysed by ANOVA; different letters mean significant differences for p≤0,05 (Duncan test); the values must be compared only on the rows.
Steam KOH 1000
KOH 2000
KOH 3000
KOH 4000
CaO 1000
CaO 2000
CaO 3000
CaO 4000
Temperature range (°C)
Time of persistence (minute)
<40 10 a 0 b 0 b 0 b 0 b 0 b 0 b 0 b 0 b 40-60 170 a 180 a 180 a 174 a 178 a 177 a 154 b 145 c 130 d 60-80 0 d 0 d 0 d 6 d 2 d 3 d 26 c 35 b 50 a >80 0 a 0 a 0 a 0 a 0 a 0 a 0 a 0 a 0 a
Variables Temperature (°C) T sum 7925 g 8444 f 8810 e 9078 de 9405 bcd 9184 cd 9482 bc 9680 b 10052 a
Maximum T 46 e 50 de 53 cd 55 cd 57 c 57 c 62 b 65 b 72 a Average T 44 g 47 f 49 e 50 de 52 bcd 51 cd 53 bc 54 b 56 a
Final T 44 d 45 cd 46 bc 47 ab 48 a 45 cd 46 bc 47 ab 47 ab
The effects of treatments on weed seed germination are shown in table 2. Obviously the results changed according to the analysed weed species. It was possible however to identify some characteristics shared by the two great groups of weeds (microthermal and macrothermal). All the species from the first group showed a higher sensitivity to KOH rather than CaO, with reductions of germination of more than 90% for all the three species treated with steam in association with 4000 kg ha-1 KOH. In this respect, it was interesting to observe that on Raphanus raphanistrum the use of 1000 kg ha-1 KOH determined similar results with respect to those obtained with 2000 kg ha-1 CaO. The use of steam only, although connected with a good control of Alopecurus myosuroides (with a reduction of germination of 77% in comparison to the untreated control), stimulated the germination of Matricaria chamomilla and Raphanus raphanistrum, with a relevant increase (although not significant) of the number of emerged plants, with respect to the untreated control. Substantially

6th EWRS Workshop on Physical and Cultural Weed Control 159 Lillehammer, Norway, 8-10 March 2004
Matricaria chamomilla was the microthermal weed of more difficult control with this system and between the three species was the less sensitive to CaO.
Alopecurus myosuroides was on the contrary, the more sensitive specie to the treatment, because it was very simple to control, even with only steam and KOH at 1000 kg ha-1 (with a reduction in this last case of 86% compared to untreated control). The factorial analysis (with two factors: compounds and doses) for the microthermal species confirmed the previous considerations: the use of KOH always determined a significant reduction of germination (table 2), but the use of high amount of substance was necessary only in the case of Matricaria chamomilla. A good compromise could be represented by the use of 2000 kg ha-1 of compounds, because (Alopecurus myosuroides apart) the results were not statistically different from those obtained with 3000 kg ha-1. The interaction between substance and dose was significant only in the case of Raphanus raphanistrum, as shown in table 2.
The evaluation of the effects of the treatments on the macrothermal species, emphasized that there was a similar behaviour between Amaranthus retroflexus and Echinochloa crus-galli (less sensitive) and between Fallopia convolulus and Setaria viridis (more sensitive). As the matter of fact these latter species were significantly reduced also by the steam use only (with reduction in germination of 40% in comparison with the untreated control). On the contrary the former two species were more difficult to control. Amaranthus retroflexus did not show significant reductions with respect to untreated control, till a dose of 2000 kg ha-1 was used. Table 2. Number of germinated seeds for the analysed weed species after treatment with steam in
association with several doses of CaO and KOH (the control is untreated). Data were analysed with ANOVA; different letters mean significant differences for p≤0,05 (Duncan test); the values must be compared only on the columns.
Microthermal species Macrothermal species Treatment Alopecurus
myosuroides Matricaria chamomilla
Raphanus raphanistrum
Amaranthus retroflexus
Echinochloa crus-galli
Fallopia convolvulus
Setaria viridis
Control 77,0 a 82,0 a 87,0 a 69,8 a 89,5 a 83,0 a 80,3 a Steam 17,5 b 91,0 a 90,3 a 59,8 ab 78,0 ab 46,5 b 49,3 b
KOH 1000 10,8 de 37,0 bc 24,0 c 50,0 b 74,0 abc 26,8 c 39,5 bc KOH 2000 8,8 def 23,0 cd 10,5 d 27,0 c 56,0 bcd 22,8 cd 34,0 bcd KOH 3000 5,5 fg 11,0 de 8,8 d 25,0 c 49,8 cde 18,8 cd 28,8 cd KOH 4000 4,0 g 3,3 e 6,0 d 22,5 c 17,5 f 14,5 de 21,8 d CaO 1000 15,8 bc 49,3 b 41,3 b 23,5 c 73,2 abc 26,5 c 42,8 bc CaO 2000 12,3 cd 44,5 b 18,0 c 17,0 c 56,0 bcd 23,5 cd 29,0 cd CaO 3000 7,8 efg 36,0 bc 9,5 d 12,5 c 46,8 de 15,3 de 28,5 cd CaO 4000 7,0 efg 20,3 d 7,8 d 11,8 c 30,5 ef 7,8 e 17,8 d

6th EWRS Workshop on Physical and Cultural Weed Control 160 Lillehammer, Norway, 8-10 March 2004
Table 3 Influences of dose and substance on weed seed germination. Data were analysed with ANOVA; different letters mean significant differences for p≤0,05 (Duncan test); the values must be compared only on the columns. The sign”*” means that a factor is significant, “ns” that it is not significant.
Microthermal species Macrothermal species
Treatment Alopecurus myosuroides
Matricaria chamomilla
Raphanus raphanistrum
Amaranthus retroflexus
Echinochloa crus-galli
Fallopia convolvulus
Setaria viridis
Mean KOH 7,3 b 18,6 b 12,3 b 31,1 a 49,3 20,7 31,0 Mean CaO 10,7 a 37,5 a 19,1 a 16,2 b 51,6 18,3 29,5
Mean dose 1000 13,3 a 43,1 a 32,6 a 36,8 a 73,6 a 26,6 a 41,1 a Mean dose 2000 10,5 b 33,8 ab 14,3 b 22,0 b 56,0 b 23,1 ab 31,5 ab Mean dose 3000 6,6 c 23,5 b 9,1 bc 18,8 b 48,2 b 17,0 bc 28,6 bc Mean dose 4000 5,5 c 11,8 c 6,9 c 17,1 b 24,0 c 11,1 c 19,8 c
Dose *** *** *** *** *** *** ** Substance *** *** ** *** ns ns ns
Dose x substance ns ns * ns ns ns ns
The treatment, as shown in table 3, was not able to avoid that some seeds of Echinochloa crus-galli germinated, even when with high dose of substance were used. For the macrothermal weed species, the type of substance did not seem to influence relevantly the germination and the emergence of the plants; only Amaranthus retroflexus showed a significant reduction when treated with CaO (tab. 3), while the others three species did not show significant differences between the two substances. On the contrary, there was a clear influence of the dose on seed emergence for all the tested macrothermal species. Those more sensitive to low doses were Amaranthus retroflexus and Fallopia convolvulus. However, all the tested weeds showed significant reductions of seeds germination when 4000 kg ha-1 of the two substances were used.
The interaction between substance and dose was not significant for any of the tested macrothermal species.
The regressions curves between the doses of the two substances and the number of germinated seeds (for all the seven tested weeds) are shown in figures from 4 to 10.
Alopecurus myosuroides
0
2
4
6
8
10
12
14
16
18
20
0 1000 2000 3000 4000
Doses kg ha-1
KOH CaO
Fig.4 Regression curves between the doses of KOH and CaO and the germinated seeds number for
Alopecurus myosuroides.
KOH regression equation: y=18,006073-1,411284*ln(x) R2=0,8608* CaO regression equation: y=18,2993085285-1,014199313*ln(x)
R2 0 5711

6th EWRS Workshop on Physical and Cultural Weed Control 161 Lillehammer, Norway, 8-10 March 2004
Matricharia Chamomilla
0
10
20
30
40
50
60
70
80
90
100
0 1000 2000 3000 4000
Doses kg ha-1
KOH CaO
Fig.5 Regression curves between the doses of KOH and CaO and the germinated seeds number for
Matricharia chamomilla.
Raphanus raphanistrum
0
10
20
30
40
50
60
70
80
90
100
0 1000 2000 3000 4000
Doses kg ha-1
KOH CaO
Fig.6 Regression curves between the doses of KOH and CaO and the germinated seeds number for
Raphanus raphanistrum..
KOH regression equation: y=93,0643489622-9,7397193955*ln(x) R2=0,9497** CaO regression equation: y=92,6727823201-7,2174809529*ln(x)
R2 0 9107*
KOH regression equation: y=90,6735907973-10,185893427*ln(x) R2=0,9958*** CaO regression equation: y=92,4219542531-9,5867783041*ln(x)
R2=0,9373**

6th EWRS Workshop on Physical and Cultural Weed Control 162 Lillehammer, Norway, 8-10 March 2004
Amaranthus retroflexus
0
10
20
30
40
50
60
70
80
90
100
0 1000 2000 3000 4000
Doses kg ha-1
KOH CaO
Fig.7 Regression curves between the doses of KOH and CaO and the germinated seeds number for
Amaranthus retroflexus.
Fig.8 Regression curves between the doses of KOH and CaO and the germinated seeds number for
Echinochloa crus-galli.
Echinochloa crus-galli
0
10
20
30
40
50
60
70
80
90
100
0 1000 2000 3000 4000
Doses kg ha-1
KOH
CaO
KOH regression equation: y=62,0224034687-4,0836025607*ln(x) R2=0,7082ns CaO regression equation: y=60,1952234102-5,7280563392*ln(x)
R2=0 9920***
KOH regression equation: y=82,4393413642-4,4482577637*ln(x)
R2=0,4130ns CaO regression equation: y=81,5409012821-3,9989680516*ln(x)
R2=0,5130ns

6th EWRS Workshop on Physical and Cultural Weed Control 163 Lillehammer, Norway, 8-10 March 2004
Fallopia convolvolus
0
10
20
30
40
50
60
70
80
90
100
0 1000 2000 3000 4000
Doses kg ha-1
KOH CaO
Fig.9 Regression curves between the doses of KOH and CaO and the germinated seeds number for
Fallopia convolvolus.
Setaria viridis
0
10
20
30
40
50
60
70
80
90
100
0 1000 2000 3000 4000
Doses kg ha-1
KOH CaO
Fig.10 Regression curves between the doses of KOH and CaO and the germinated seeds number for
Setaria viridis.
In conclusion, the effects of the treatment on the tested weeds seed are surely encouraging, and emphasized that the bioflash system is able to control weed seeds germination, although further researches are needed, to analyse the sensitivity of other weeds, as well as the use of other substances in exothermic reaction.
KOH regression equation: y=47,216297549-3,4675331191*ln(x) R2=0,9474** CaO regression equation: y=47,7993158868-3,8786162727*ln(x)
R2=0,8558*
KOH regression equation: y=50,65051558-2,5950982962*ln(x) R2=0,7433ns CaO regression equation: y=51,148148719-2,8722298138*ln(x)
R2 0 6388

6th EWRS Workshop on Physical and Cultural Weed Control 164 Lillehammer, Norway, 8-10 March 2004
Acknowledgements
The authors want to thank Mr. Luciano Pulga, Mr. Giovanni Melai, Mr. Matteo Manetti and all the staff of CIRAA “E. Avanzi” for their collaboration in the experiment.
A very special thank to Mrs Roberta Del Sarto because without her help probably it would not have been possible to carry out these tests. References BARBERI P., MOONEM A. C., RAFFAELLI M., PERUZZI A., BELLONI P., MAINARDI M. (2002) Soil
steaming with an innovative machine-effects on the weed seedbank. 5th EWRS workshop on Physical and Cultural Weed Control, Pisa 11-13 March 2002, 238-241.
BARBERI P., MOONEN A. C., (2002) Effetti del vapore e di sostanze a reazione esotermica sul controllo della flora infestante reale e potenziale. Atti del convegno “vapor d’acqua e sostanze a reazione esotermica: una combinazione a ridotto impatto ambientale per la disinfezione e disinfestazione del terreno”. Forlì, 30 ottobre 2002, 103-110.
FERRARI M., MARCON E., MENTA A., (1998) Fitopatologia, Entomologia Agraria e Biologia Applicata, 3a Ed. Edagricole, Bologna.
GELSOMINO A., MARTELLI G., OLIVA S., BOLIGNANO M. S., CACCO G., (2002) Effetto del vapore e di sostanze a reazione esotermica su alcune caratteristiche microbiche del terreno: risultati preliminari. Atti del convegno “vapor d’acqua e sostanze a reazione esotermica: una combinazione a ridotto impatto ambientale per la disinfezione e disinfestazione del terreno”. Forlì, 30 ottobre 2002, 89-94.
GULLINO M., (1998) Anno 2005: addio al bromuro di metile. Terra e vita, 7/98, 22-23. GULLINO M., MINUTO A., GASPARRINI G., (1999) Bromuro di metile - La parola agli agricoltori,
Colture protette, 7/98, 39-42. KATAN J., (1987) Soil solarization. In I. Chet ed. “Innovative approaches to plant disease control”,
John Wiley & Sons, New York. KATAN J., (1999) The methyl bromide issue: problems and potential solution, Journal of Plant
Pathology, 81 (3), 153-159. KATAN J., GREENBERGER A., ALON H., GRINSTEIN A., (1976) Solar heating by polyethylene
mulching for the control of disease caused by soil-borne pathogens, Phytopathology, 66, 683-688.
LENZI A., LOMBARDI P., MAINARDI M., TESI R., (2002) Risposta di alcuni ortaggi alla disinfezione del terreno con vapore e sostanze a reazione esotermica. Atti del convegno “vapor d’acqua e sostanze a reazione esotermica: una combinazione a ridotto impatto ambientale per la disinfezione e disinfestazione del terreno”. Forlì, 30 ottobre 2002, 95-102.
MARTINO B., (1997) Il bromuro di metile in agricoltura, La difesa delle piante, 20 (3-4), 111-116. MATERAZZI A., IANDOLO R., TRIOLO E., VANNACCI G., (1987) La solarizzazione del terreno. Un
mezzo di lotta contro il “marciume del colletto” della lattuga, L’Informatore Agrario, 43/87, 97-99.
MAZZONCINI M., RISALITI R., GINANNI M., MAINARDI M., (2002) Effetto del vapore e di sostanze a reazione esotermica sulle principali caratteristiche chimiche del terreno: risultati di un quadriennio di sperimentazione. Atti del convegno “vapor d’acqua e sostanze a reazione esotermica: una combinazione a ridotto impatto ambientale per la disinfezione e disinfestazione del terreno”. Forlì, 30 ottobre 2002, 79-88.
MOONEM A. C., BARBERI P., RAFFAELLI M., MAINARDI M., PERUZZI A., MAZZONCINI M. (2002) Soil steaming with an innovative machine-effects on the weed seedbank. 5th EWRS workshop on Physical and Cultural Weed Control, Pisa 11-13 March 2002, 230-236.

6th EWRS Workshop on Physical and Cultural Weed Control 165 Lillehammer, Norway, 8-10 March 2004
PERUZZI A., RAFFAELLI M., DI CIOLO S., MAZZONCINI M., GINANNI M., MAINARDI M., RISALITI R., TRIOLO E., STRINGARI S., CELLI A., (2000) Messa a punto di un prototipo di sterilizzatore del terreno per mezzo di vapore e di sostanze a reazione esotermica. Rivista di Ingegneria Agraria, 4/2000, 226-242.
PERUZZI A., RAFFAELLI M., GINANNI M., MAINARDI M., DEL SARTO R., BORELLI M. (2002a) Messa a punto del sistema “bioflash” ed evoluzione delle macchine operatrici per la disinfezione e disinfestazione del terreno: risultati di un quadriennio di sperimentazione. Atti del convegno “vapor d’acqua e sostanze a reazione esotermica: una combinazione a ridotto impatto ambientale per la disinfezione e disinfestazione del terreno”. Forlì, 30 ottobre 2002, 35-43.
PERUZZI A., RAFFAELLI M., GINANNI M., MAINARDI M., (2002b) Development of innovative machines for soil disinfection by means of steam and substances in exotermic reaction. 5th EWRS workshop on Physical and Cultural Weed Control, Pisa 11-13 March 2002, 220-229.
PINEL M.P.C., BOND W., WHITE J.G., (2000) Control of soil-borne pathogens and weeds in leaf salad monoculture by use of a self-propelled soil steaming machine. Proceedings of the 5th International Symposium on Chemical and Non-Chemical Soil and Substrate Disinfestation. Acta Horticulturae Number 532-ISHS. Torino, Italy 11-15 September 2000.
TRIOLO E., MATERAZZI A., VANNACCI G., (1991) Risultati di un decennio di ricerche in Italia. La solarizzazione: un terzo metodo di sterilizzazione parziale del terreno, Terra e sole, 46/91, 22-28.
TRIOLO E., D’ERRICO F.P., (2002) Il vapor d’acqua: un secolo di esperienza per un sistema fitoiatrico attuale, Atti del convegno “vapor d’acqua e sostanze a reazione esotermica: una combinazione a ridotto impatto ambientale per la disinfezione e disinfestazione del terreno”. Forlì, 30 ottobre 2002, 11-17.

6th EWRS Workshop on Physical and Cultural Weed Control 166 Lillehammer, Norway, 8-10 March 2004
Flaming for intra-row weed control in Globe Artichoke
M. Raffaelli*, F. Filippi**, A. Peruzzi* & A. Graifenberg ** * D.A.G.A. Sezione Meccanica Agraria; ** D.B.P.A. Sezione Orticoltura e Floricoltura; University
of Pisa, Italy. Email: [email protected] Abstract
The artichoke (Cynara scolimus L.) is a perennial plant and today is mainly cultivated for the
production of the edible flower buds. Italy is the largest producer as well as the largest consumer of artichokes. Nearly half of the world artichokes are grown in Italy.
Artichoke, that is very strong crop, has in weed control one of the greater problems especially in organic farming. Non chemical intra-row weed control is carried out with hand hoeing that is a very long and hard work.
The present study aimed to investigate the possibility to change hand hoeing with flaming for intra-row weed control. The experiments compared two different intra row weed control techniques during the cultivation cycle, hand hoeing and flaming (performed with a knapsack flamer), and an unweeded control.
For any treatments were measured or calculated operative time, working capacity, and LPG consumption per hour and hectare, weed density, artichoke yield.
In the two years of tests intra-row weed control was performed with one treatment of hand hoeing and two of flaming. Flaming permitted a work saving on average of about 65 h/ha with a LPG consumption of 107.5 kg/ha. Artichoke yield (bud/ha) was not different for the two different intra-row weed control techniques and lower for the unweeded control. At the end of cultivation cycle the time to remove all the weed (standard cultural practices) was not different between the two technique and higher for the control.
These first results indicate that flaming is efficient for intra-row weed control in artichoke. Introduction
The cultivated artichoke is Cynara scolimus L. a member of the Asteraceae (Compositae), the
family that also includes lettuce, sunflower, aster, endive, chicory, thistles, and other cultivated and weedy species. The artichoke is a perennial plant and today is mainly cultivated for the production of the edible flower buds (Ryder et al., 1983).
Although the artichoke is grown on all the world’s continents, it is above all a Mediterranean crop. Nearly 85% of the world’s artichokes are grown in the countries bordering the Mediterranean Sea (Siviero, 2002).
Italy is the largest producer as well as the largest consumer of artichokes. Nearly half of the world artichokes are grown in Italy; in this country it represent for spread (48.000 ha) the third horticultural crop after tomato and potato (Ryder et al., 1983; Magnifico, 2000; Siviero, 2002).
Artichoke fields generally are maintained in perennial culture for 2 to 10 years and the cultivation cycle reaches up to 300 days. For this reason artichoke, that is a very strong crop and has not very important pests (Graifemberg & Giustiniani, 1997), has in weed control one of the greater problems especially in organic farming.
Non chemical intra-row weed control is carried out with hand hoeing that is a very long and hard work; it is not possible to use hoeing-machine because of plant morphology and crop lay out (Fig. 1).

6th EWRS Workshop on Physical and Cultural Weed Control 167 Lillehammer, Norway, 8-10 March 2004
The present study aimed to investigate the possibility to change hand hoeing with flaming for intra-row weed control.
Fig. 1 Intra-row weed control in artichoke performed with hand hoeing and flaming. Materials and Methods
Trials were carried out in 2002 and 2003 at the experimental station of the Division of Horticulture and Floriculture of the University of Pisa (43°40' lat. N, 10°19' long. E).
Artichoke (Cynara scolimus L. cv. Terom) was planted on 1997 and was grown according to the standard cultural practices in the study area, at a density of 0.7 plants m-2 with an inter-row spacing of 1.40 m. Mineral fertilisation was carried out for each year of cultivation with 37 N kg ha-
1, 22 kg ha-1 P2O5 and 16 kg ha-1 K2O. The experiment compared two different intra-row weed control techniques during the
cultivation cycle, hand hoeing and flaming, and an unweeded control. Flaming was performed with a knapsack flamer. The flamer was equipped with one rod burners
16 cm long and had total weight with full tank of 15.3 ± 0.5 kg. Hand hoeing was performed with a hand hoe that weighed 2 kg and with a blade 20 cm long and 15 cm large (Fig. 1).
The experiment was laid out in a randomised complete block design with four replicates (Gomez & Gomez, 1984). Elementary plots were 60 m long and 1.40 m wide.
For any treatments were measured or calculated operative time, working capacity, and LPG consumption per hour and hectare. Weed density in-row was sampled by species just before weed control treatment. Artichoke yield was determined at different times (as soon as the bud were ready for harvest) by complete harvest of each plot. Production data were subjected to analysis of variance using CoStat software (CoHort Software, 1998) Results and discussion
Total weed density determined before treatments was 438 and 473 plants m-2 in 2002 and 2003 respectively. In both years, the most important and abundant species were monocotyledons (on average about 80%). These are tolerant species to flaming and with this technique their control is rather complex and hard (Ascard, 1995; Netland et al., 1994; Peruzzi et al., 1998; Vester, 1985).
In 2002, intra-row weed control was performed with one treatment of hand hoeing and two of flaming. The working time was of 180.2 h/ha for hoeing and 129.3 h/ha for flaming in all. The LPG consumption was 99.9 kg/ha.

6th EWRS Workshop on Physical and Cultural Weed Control 168 Lillehammer, Norway, 8-10 March 2004
In 2003, the number of treatment was the same than in the previous year and the time needed was 238.1 h/ha for hand hoeing and 160.0 h/ha for flaming with a LPG consumption of 115.2 kg/ha.
In the first trial year, the effect of weed control treatments on artichoke yield (Tab. 1) was evident with the harvest of bud secondary of I° and II° order when the effect of weed competition reduced significantly the production in control compared with flame and hoe treatments. This effect was evident also in total bud yield. Productions obtained with flaming and hoeing were very similar in all the period, without significant differences.
In the second trial year, all yield values obtained were very low in consequence of a frost that damaged the buds in the annual first stage of growth in April, and of an hard drought in all the following period of growth and production. However, it was possible to observe the effect of weed control treatments on bud yield and the efficacy of flaming for intra-row weed control (Tab. 1).
In both years, artichoke yield (bud/ha) was not different for the two different intra-row weed control techniques and lower for the unweeded control.
Table 1. Artichoke yield (bud/ha). Yield (bud/ha) 2002 2003 Terminal Secondary Total Terminal Secondary Total Treatment I° II° I° II° Hoeing 5714 ns 21190 a 29048 a 55952 a 3690 ns 8214 a 0 11905 aFlaming 5476 ns 19881 a 29643 a 55000 a 4821 ns 7202 a 0 12024 aControl 5060 ns 14613 b 22649 b 42321 b 3810 ns 4405 b 0 8214 bIn each column, means followed by the same letter are not significantly different at P ≤ 0.05 (Duncan’s multiple range test)
At the end of cultivation cycle the time to remove all the weeds (standard cultural practices)
was not statistically different between the two techniques (on average 232.0 and 240.4 h/ha respectively for hand hoeing and flaming) hand higher for the control (321.9 h/ha).
In conclusion, in the two years of tests flaming permitted to achieve same yields of hand hoeing with a work saving on average of about 65 h/ha and a LPG consumption of 107.5 kg/ha.
These first results indicate that flaming is efficient for intra-row weed control in artichoke and that it can substitute hand hoeing that is a very hard, time demanding and expensive weed control technique. To improve the performances of flaming it is naturally needed to develop a specific flamer for artichoke. Acknowledgements
We are very grateful to R. Del Sarto for her precious cooperation in running the experiment.

6th EWRS Workshop on Physical and Cultural Weed Control 169 Lillehammer, Norway, 8-10 March 2004
References
ASCARD J (1995), Effects of flame weeding on weed species at different developmental stages. Weed Research 35, 397-411.
COHORT SOFTWARE (1998) Costat manual revision 5.01. Edition Cohort Software, P.O. Box 19272, Minneapolis, MN 55419 USA.
GOMEZ KA & GOMEZ AA (1984) Test for homogeneity of variance. In: Statistical procedures for agricultural research, 2nd edn, 467-471, J. Wiley & Sons, New York, USA.
GRAIFENBERG A & GIUSTINIANI L (1997) Problematiche colturali e valorizzazione del carciofo. L’informatore Agrario 27, 53-57.
MAGNIFICO V (2000) Una coltura importante ma dimenticata. L’informatore Agrario 26, 37-38. NETLAND J, BALLVOLL G & HOLMOY R (1994) Band spraying, selective flame weeding and hoeing
in late white cabbage. Acta horticulturae 372, 235-243. PERUZZI A, DI CIOLO S, RAFFAELLI M (1998). Effects of flaming on velvetleaf (Abutilon theophrasti
L.), common amaranth (Amaranthus retroflexus L.) and cockspur grass (Echinocloa crus-galli L.). Proceedings AgEng ‘98 International Conference on Agricultural Engineering, Oslo 24/28 August, 1998, 603-604.
RYDER EJ, DE VOS NE & BARI MA (1983) The Globe Artichoke (Cynara Scolymus L.). Hort Science 18(5), 646-653.
SIVIERO P (2002) Il carciofo e la sua coltivazione. L’informatore Agrario 22, 33-51. VESTER J (1985), New experience with flame cultivation for weed control. Proceedings of the
International Meeting (C. Castille, ed.), 20-22 Nov. 1984, Namur Belgium. Opprebais, Belgium: CRABE, 10-20.

6th EWRS Workshop on Physical and Cultural Weed Control 170 Lillehammer, Norway, 8-10 March 2004
Thermal weed control by water steam in bulb onions
A.Sirvydas1, P.Lazauskas2, R.Vasinauskienė1, A. Stepanas1 & P.Kerpauskas1 1 Lithuanian University of Agriculture, Department of Heat and Biotechnology Engineering,
Studentu 11, LT 4324 Kaunas-Akademija, Lithuania. 2 Lithuanian University of Agriculture, Department of soil management, Studentu 11, LT 4324
Kaunas-Akademija, Lithuania. Abstract
Laboratory and fields research studies for weed control by damp water steam in onions were carried out between 1998-2003 in Lithuanian University of Agriculture.
Water steam for the trials was made using experimental equipment heating with electricity. During three years of the field trials, double scalding of weeds by damp water steam in onions
was 9-10 per cent more effective than by hand weeding three times. It can be affirmed that after creation of mobile equipment, weed control by damp water steam
will become widely used weed control means in ecological and conventional farming. Introduction
Reasoning of original, not widely investigated technology of weed control in onion crop by damp steam requires establishing separate parameters of this method. Thermal duration of steam impact, which has a killing effect on weeds, is considered to be the most important parameter.
In order to determine the sensitiveness of from seedlings grown onion shoots to damp water steam special vegetative and field trials were carried out at the Lithuanian University of Agriculture. The sensitiveness of different age (1, 3, 6, 9 and 12 days after germination) onion shoots to damp water steam was examined in six variants of vegetative experiment. Besides, three years long field trial investigated the parameters of damp water steam application in onion crop. Further improvement of equipment and construction of mobile mechanism for the use of damp water steam in practical ecological weed control can be based on these parameters.
Material and methods
The experiment was carried out for three years (2000-2002) at the Experimental Station of the Lithuanian University of Agriculture. The area of the experimental plot was 4,5 m2. The layout consisted of six variants, presented in Table 1. The variants were laid out at random. The first and the second variants - control ones. In the third variant the crop was two times scalded with water steam, retention time - 2 s. Firstly, the crop was scalded with steam after mass germination of weeds by using the steam disperser with two steam outflow canals. Secondly, after the repeated germination weeds were scaled by the steam disperser with one steam outflow canal. In the fourth variant the weeds were scaled in the same way just steam retention time was 1 s. The aim was to establish minimum steam retention time under field conditions. In the fifth variant the onion crop was similarly treated with water steam but here onions were protected with protection shields against thermal impact of water steam. In the sixth variant the first treatment of onion crop with water steam was when weeds height was 7-10 cm. Onions were not protected against the impact of

6th EWRS Workshop on Physical and Cultural Weed Control 171 Lillehammer, Norway, 8-10 March 2004
water steam, and the steam was spread in the middle of the space between furrows. Secondly, steam was used after repeated germination of weeds.
In the field trial weeds in onion crop were scalded with water steam that had been produced by special equipment. Power of this equipment could be changed from 2,5 to 15 kW depending on the need for steam. Original steam dispersers, that had shown the best results in the laboratory tests of equipment, were used. Results
Previous laboratory, field and theoretical investigations (SIRVYDAS et all., 2000, 2002, 2003; VASINAUSKIENE 2002) have created the precondition to carry out the experiment of thermal weed killing with humid water steam in onion crop. Aim of the experiment is to determine the efficiency of new method of weed control under field conditions. This also involves determining the parameters that influence the efficiency of technological processes, well as the technological elements that must be evaluated in projecting and producing new, improved device of thermal weed control, operating on humid water steam. For this purpose a special field experiment was carried out for three years (2000-2002). This experiment involved the comparison of onion plots, treated by different weed killing with humid water steam technologies, with the unweeded I and three times weeded II control plots (table 1). The second aim is to test the necessity to protect onions against thermal impact of steam by special shields, and the third aim - to analyze the dependence of weed control efficiency on the duration of scalding and on the size of weeds at the time of scalding.
Data of the first year experiments (2000), carried out at the Experimental Station of the Lithuanian University of Agriculture, proved the hypothesis about possible weed control with humid water steam in onion crop to be correct. The onion yield comparison in the analyzed variants with the first variant of unweeded onion crop (control I) showed essential additional onion yield in three variants of four (Table 1). Later, in 2001 and 2002, in comparison with unweeded control I all four variants, treated with steam, produced big and essential additional yields. Comparison of onion yield in the variants, treated with water steam, with that in three times weeded control II plot showed that in three years of experiment the highest onion yields were produced in the third variant, where humid water steam had been used for weed control two times - after mass germination of weeds and after repeated germination of weeds. The duration of scalding was 2 seconds. In all years of experiment this variant produced additional onion yield, which was close to the results in three times weeded control II. In separate years they were 40,2; 48,5 and 38,5 dt/ha, respectively. In this variant successful weed killing with water steam, unloosened soil and uninjured onion root system probably were of great importance. Figure 1 shows the increase of onion yield at decreasing weediness.
In other three variants of the experiment - 4, 5, 6 - onion yields were significantly lower than that in the third variant. Comparison of the third variant with other mentioned variants, treated with steam, showed that the yield decrease was essential and was not equal to the manual weeding in eight cases of nine (Table 1). Such decrease of onion yield in the mentioned three variants can be explained by three differences of these variants: in the fourth - due to reduced scalding time to one second, in the fifth - due to limited spread of steam on soil surface by using shields to protect onions against possible thermal impact of steam weeds also avoided this impact, and in the sixth - due to too late thermal killing of weeds. In this variant water steam was first applied when weeds were 7-10 cm height, second time - after two weeks. In the mentioned three variants onion yields were significantly lower than that in the best third variant, but they almost always were reliably higher that that in the unweeded control I variant.

6th EWRS Workshop on Physical and Cultural Weed Control 172 Lillehammer, Norway, 8-10 March 2004
1. y = -22,551x + 5,6572; R2 = 0,9039
2. y = -18,418x + 5,0698; R2 = 0,9127
3. y = -15,865x + 4,2285; R2 = 0,90380
1
2
3
4
5
6
0 0,05 0,1 0,15 0,2
Weed mass kg/m2
Cro
p kg
/m2
1-2000m.2-2001m.3-2002m.
Figure 1. Dependence of onion bulbs yield (y) on weed mass (x) when humid water steam is used
for weed control.
Table. 1. Onion bulb yield at different weed control technologies.
Crop kg/m2 Variants
Year 2000m
Year 2001m
Year 2002m
1. Control I, no weed killing after onions are planted 2,913 3,677 1,008
2. Control II, weeded three times 4,766 4,753 3,882
3. Weeds are killed with humid water steam 2 times. Retention time - 2s. 5,168 5,238 4,267
4. Weeds are killed with humid water steam 2 times. Retention time - 1s. 4,227 5,118 3,102
5. Weeds are killed with humid water steam 2 times, onions are protected with shields against steam impact. retention time - 2s. 3,640 4,745 3,08
6. Big weeds (7-10 cm) are 2 times killed with steam in the spaces between furrows. Retention time - 2s. 3,372 4,498 2,583
R05 0,47 0,36 0,34
Discussion
The above presented data of vegetative and three-year field trials repeatedly proves weed control by humid water steam to be real, perspective and ecological means of weed control.
Theoretical evaluation of the above onion yield data, obtained under different methods of humid water steam application, states that this is the manifestation of the law of inverse dependence of agricultural plants yield on weed mass in the crop (LAZAUSKAS 1993), according to which the
1 2
3

6th EWRS Workshop on Physical and Cultural Weed Control 173 Lillehammer, Norway, 8-10 March 2004
yield of the crop agrophytocoenosis is inversely proportional to weed mass. This is absolutely confirmed by the calculations of onion bulbs yield dependence on separate variants of weed killing in the crop (Fig.1).
Preliminary calculations bring to the statement that reliable increase of yield, obtained having used water steam for weed killing in onion crop, covers the expenses related to this technological process.
Summarizing of the presented and earlier published (SIRVYDAS et all., 1998, 2000, 2001; LAZAUSKAS & Sirvydas 2002, Stepanas et all., 2000) data of theoretical investigations and vegetative and field experiments of the application of humid water steam for weed control brings to the statement that humid steam is effective, ecologically friendly means of weed control in onion and other agricultural plants crops, which is suitable for both organic farms and conventional agriculture. Acknowledgements
Lithuanian State Science and Studies Foundation References LAZAUSKAS P., P.A.SIRVYDAS. Weed control with water steam in barley.//Zeitschrift für
Pfalanzenkrakheit en und Pflanzenschutz ISSN 0938-9938 2002 Sonderheft XVIII, 633-638. SIRVYDAS P.A., P. LAZAUSKAS, J. ČĖSNA. Physical Changes in the Weed Plant in Thermal, Weed
Control // 3 rd EWRS Workshop on Physical Weed Control Wye College, University of London, UK.23-25 March 1998. - p.17.
SIRVYDAS P.A., P. LAZAUSKAS, R. VASINAUSKIENE, P. KERPAUSKAS. Thermal weed control by water steam. 5th EWRS Workshop on Physical Weed control Pica, Italy, 11-13 March 2002.- p. 253-262.
STEPANAS A., P.A.SIRVYDAS, J. ČĖSNA, P. KERPAUSKAS. Šiluminių energijos procesų, vykstančių terminiame peilyje ir jo aplinkoje, naikinant piktžoles tyrimas // Aplinkos inžinerija. ISSN 1392-1622. Vilnius: “Technika” 2000, T.8(1), p.3-7.
SIRVYDAS P.A., J. ČĖSNA . Energetinių procesų piktžolių audiniuose modeliavimas jas termiškai naikinant // Žemės ūkio inžinerija.. ISNN 1392-1134. 2000, T.32(1), p. 53-72.
SIRVYDAS P.A., J. ČĖSNA, P. KERPAUSKAS, R. VASINAUSKIENĖ. Piktžolių terminio naikinimo aukštatemperatūrėje aplinkoje tyrimai // Aplinkos inžinerija. ISSN 1392-1622. Vilnius: “Technika” 2000, T.8(1), p. 28-37.
SIRVYDAS P.A., P. KERPAUSKAS, A. STEPANAS. Aplinkos piktžolių terminiam naikinimui formavimo teoriniai pagrindai.// Vagos.-LŽŪU mokslo darbai. 2002 Nr. 54(7).- p. 86-95.
VASINAUSKIENĖ R. Terminis piktžolių naikinimas vandens garu. // Šilumos energetika ir technologijos. KTU, 2002. – p.383-388
SIRVYDAS P.A., P.KERPAUSKAS, R.VASINAUSKIENĖ. Piktžolių terminio naikinimo proceso drėgnuoju vandens garu tyrimas. // Šilumos energetika ir technologijos. KTU, 2003. – p.341-346
LAZAUSKAS P. The law of crops performance as a basis of weed control, 8th EWRS Symposium, „Quantitative approaces in weed and herbicide research and their application“-Bramschweig, 1993, p.71-72.

6th EWRS Workshop on Physical and Cultural Weed Control 174 Lillehammer, Norway, 8-10 March 2004
Thermal disinfection of soil by water steam
A.Sirvydas, A. Stepanas, P.Kerpauskas Lithuanian University of Agriculture, Department of Heat and Biotechnology Engineering,
Studentu 11, LT 4324 Kaunas-Akademija, Lithuania. E mail: [email protected]
Abstract
In recent years interest in thermal destruction of pathogenic microorganism and weed seeds has been shown. Water steam of 100 °C temperature has been used up till now. For the purpose of even heating of soil layer it is important to create the device, which enables to get the desirable temperature of 100 °C for soil layer sterilization. Investigations have showed, that making of the device requires to estimate feed water steam pressure, diameter of the steam supply holes and their layout in the perforated pipes. Shields of special construction prevent the steam supply holes from obstruction with soil. In this way efficienty of the device is significantly increased. The presented data gives the possibility to produce the device, working with wet water steam. The device has been designed for destruction of weed seeds and pathogen microorganisms in the sterilized soil layer.
Introduction
There are many weed seeds in the soil before sowing and planting. Later they germinate. In pursuance of weed control part of weed seeds should be destroyed. From the ecological viewpoint it is purposeful to use the method of thermal destruction by using water steam. During water steam condensation in the soil, its temperature rises to 100 °C. Weeds species, such as Senecio vulgaris, Stellaria media, Poa annua, ect. can be controlled when soil temperature is higher than 60 – 70 °C and is maintained for 6 – 9 minutes (Davies et all 1993; Melander & Rasmussen (2001); Sirvydas & Stepanas (1997). Therefore, application of water steam fully secures weed control quality and facilitates later plant growth. Quality of thermal disinfection of soil depends on 100°C temperature field form and intensity of distribution in the soil layer. In turn, character and intensity of 100 °C temperature field distribution depend on the quantity of water steam, provided into the soil layer. Quantity of the steam, provided into the soil layer, depends on steam pressure in perforated pipes, diameter of steam supply holes, their quantity and placing character. Research data has showed that water steam pressure and steam supply holes diameter are the main parameters from which depend 100 °C temperature field spreading intensity and distribution in the sterilized layer of soil. The purpose of the research was to determine the influence of steam pressure, steam supply holes diameter, distribution it’s in pipes on the change 100 °C temperature field area. Determining of these parameters enables to design different soil steaming devices.
Materials and methods
Distribution of 100 °C temperature field in soil was fixed by 0,18 mm diameter copper – constant thermo–couples. Thermo – couples were distributed around perforated pipes according to the net – scheme. Distance between thermo-couples by vertical and horizontal was 10 cm. Thermo – couples temperature recording was performed by device ALMEMO 2590-9.

6th EWRS Workshop on Physical and Cultural Weed Control 175 Lillehammer, Norway, 8-10 March 2004
Results
The influence of steam supply holes diameter and steam pressure in perforated pipes on the formation of 100 °C temperature field was determined by using 25,0 mm diameter pipe. During the investigations the pipe was put in the soil at the depth of thirty centimeters. To establish optimal diameter of steam supply holes, the investigations were done with holes of the following diameters: 1,0; 2,0; 3,0; 4,0; 5,0; 6,0; 7,0 millimeters. During the experiments fixed steam pressure in the pipe – 0,04 MPa was maintained.
Results of the investigations are showed in Fig. 1. Curves 1, 2 and 3 characterize the dependence of 100 °C temperature field area variation on the diameter of steam supply hole after 5; 10 and 15 minutes after water steam was switch on. Character of curves change shows, that intensive 100 °C temperature field significantly increases at steam supply hole diameter increase to 5,0 mm. When steam supply hole diameter is more than 5,0 mm, area of 100 °C temperature field increases marginally.
y = -0,0679x2 + 1,1821x - 0,7143R2 = 0,9361
y = -0,0964x2 + 1,775x - 0,7714R2 = 0,9912
y = -0,1357x2 + 3,2143x - 2,1714R2 = 0,972
0
2
4
6
8
10
12
14
16
0 2 4 6 8mm
g, m
2
Figure 1. Dependency of the size of 100 °C temperature field area on diameter of steam supply hole: 1 – 5 min after water steam was switched on; 2- 10 min after water steam was switched on; 3 –15 min after water steam was switched on.
Consequently, optimal diameter of steam supply hole is 5,0 mm. For the purpose to determine
the influence of steam pressure in the pipe on the formation of 100 °C temperature field, experiments have been done by using optimal diameter of steam supply hole – 5,0 mm. During the experiments different steam pressure in the pipe: 0,005; 0,02; 0,04; 0,06; 0,08; 0,1; 0,12 MPa has been used. Data of investigations is presented in Fig. 2.
Curves 1, 2, 3 characterize the variation of 100 °C temperature field area depending on steam pressure in the perforated pipe after 5; 10; 15 minutes, after water steam was switched on. Character of variation curves 1; 2; 3 shows, that intensive increasing of 100 °C temperature field occures before steam pressure achieves 0,06 MPa. Raising steam pressure over 0,06 MPa slightly increases the area of 100 °C temperature field. The curve 3 shows that when steam pressure achieves 0,08

6th EWRS Workshop on Physical and Cultural Weed Control 176 Lillehammer, Norway, 8-10 March 2004
MPa the area of 100 °C temperature field decreases. With reference to this we suppose that optimal steam pressure in the perforated pipe is 0,06 MPa.
Data of investigations shows that size and configuration of 100 °C temperature field depend on the position of steam supply holes in the perforated pipe respect vertical. This dependence has been analyzed by using optimal diameter of steam supply hole and optimal steam pressure in the perforated pipe.
y = -2254,5x2 + 386,38x - 1,2506R2 = 0,9338
y = -1097,8x2 + 229,43x - 0,998R2 = 0,9774
y = -760,11x2 + 133,19x - 0,3324R2 = 0,8896
0
2
4
6
810
12
14
16
18
0 0,02 0,04 0,06 0,08 0,1 0,12 0,14MPa
g, m
2
Figure 2. Dependency of the size of 100 °C temperature field area on steam pressure in the pipe: 1
–5 min after water steam was switched on; 2 –10 min after water steam was switched on; 3 –15 min after water steam was switched on.
d
2
a
9,0 dm
120°
10 dm2
0°
e f
135°7,0 dm2
b
7,1 dm
45°
2
4,5 dm
c
2
180°
90°
7,2 dm2
Figure 3. Dependency of the area size and configuration of 100 °C temperature field on the position
of steam supply hole in the perforated pipe respect vertical after 10 min after water steam was switched on.

6th EWRS Workshop on Physical and Cultural Weed Control 177 Lillehammer, Norway, 8-10 March 2004
Data of the investigations shows, that optimal spread of 100 °C temperature field in the soil is achieved when steam supply hole is at the head of the pipe and when its axis with vertical line makes the angle of 120 degrees. In this case after 10 min the biggest and of the best configuration 100 °C temperature field forms fig. 3.
Results of the experiment are the basis for the development of mobile technical equipment for soil sterilization by water steam. Principle technical scheme of this equipment is presented in fig. 4.
Figure 4. Principle scheme of “steam plough”: 1 – perforated pipe; 2 – hollow steam supply coulter; 3 – channel; 4 – shield; 5 – beam; 6 – collector; 7 – back wheel – roller; 8 – frame; 9 – tarpaulin; 10 - rope; 11 – stopper; 12 – depth regulation mechanism; 13 – front supporting wheels; 14 – tarpaulin laying mechanism; 15 – steam supply hole; 16 – condensate.
Mobile technical equipment for soil sterilization by water steam (“steam plough”) consists of
frame 4; collector 6; hollow steam supply coulters 2; perforated pipes 1; front supporting wheels 13; back wheel – roller 7; tarpaulin laying mechanism 14; depth regulation mechanism 12, ect. The main parts of the “steam plough” are six perforated pipes 1, by which water steam is supplied to the soil. The perforations in the pipes are of 5,0 mm diameter, ranged in groups at 1200 angle. The shields 4 located above the steam supply holes to prevent the latter from obstruction with soil. As “steam plough”is moving the shields form channel 3 in the soil. The diameter of these channels is bigger than that of perforated pipe, therefore, the contact area of water steam and sterilized soil increases. The increased contact of steam and soil intensifies the heat exchange and output of the equipment. The inside condidial shape of the shields makes a 12 degrees angle. According to the laws of thermodynamics the direction of the outgoing steam flow movement is parallel to the axis of perforated pipe. The outgoing steam flow maintains and does not destroy the form of the channel that has been formed in the soil. Additional water steam is supplied to the channel through the area between the perforated pipe and stopper 11. Length of this channel can be changed by changing the

6th EWRS Workshop on Physical and Cultural Weed Control 178 Lillehammer, Norway, 8-10 March 2004
length of the rope 10. Investigations show that thanks to the formed channel, soil heating to the sterilization temperature shortens down by 20 percents. Parameters of the “steam plough” are based on the investigation results. The presented construction of the mobile equipment for soil sterilization ensures equal and intensive formation of 100 °C temperature field in the sterilized layer of the soil. For reducing heat loss to the environment and slowing down the cooling of the surface the soil is covered with tarpaulin 9.
Thermal sterilization of the soil is effective but expensive method. 30 – 50 kg of water steam is used for sterilization of 1 square meter of soil. The amount of used steam changes according to the thickness and dampness of the soil layer.
“Steam plough” is designed for sterilization of greenhouses soil. Some changes can make the “steam plough” be usable for disinfection of the soil prior to crop sowing.
Conclusions
Soil steaming (disinfection) prior to crop sowing is an effective method of weed control. Intensive and even distribution of 100 °C temperature field in the soil layer depends on optimal
parameters of soil steaming device. Basic parameters of soil steaming device are the following: diameter of water steam supply
hole, steam pressure in the perforated pipe and location of steam supply holes in perforated pipes. Investigation data shows, that optimal diameter of steam supply hole is 5,0 mm, optimal steam
pressure in the perforated pipes is 0,06 MPa. The best position of steam supply holes in the perforated pipes is at the head of pipe and when its axis makes a 120 degree angle with vertical.
For the purpose to intensify the distribution of 100 °C temperature field in sterilized soil layer it is purposeful to use steam supply holes ranged in groups at 120 degrees angle.
Use of shields enables to increase working efficiency of “steam plough” by 20%.
References DAVIES D.H.K., STOCKDALE E.A., REES R.M., MCCREATH M., DRYDALE A., MCKINLAY R.G.,
DENT B. (1993). The use of black polyethylene as a pre-planting mulch in vegetables: Its effect on weeds, crop and soil. Proceedings of the Brighton Crop Protection Conference – Weeds, 467-472.
MELANDER B. & RASMUSSEN G. (2001) Effects of cultural methods and physical weed control on intrarow weed numbers, manual weeding and marketable yield in direct – sown leek and bulb onion. Weed Research 41, 491-508.
SIRVYDAS A. & STEPANAS A. (1997) Investigation of phase soil cooling. Agricultural Engineering 29(2), 33-40.

6th EWRS Workshop on Physical and Cultural Weed Control 179 Lillehammer, Norway, 8-10 March 2004
Thermal weed control by steaming in vegetable crops
H. Sjursen & J. Netland The Norwegian Crop Research Institute, Plant Protection Centre
Email: [email protected] & [email protected]
Thermal weed control by steaming was performed in two different series of experiments in vegetable crops in 2001-2003.
The first series of experiments was deep steaming down to about 20-30 cm soil depth in carrots. The steam, delivered by a separate aggregate via a drag pipe, was injected by vacuum into the soil by a new prototype of tractor-mounted equipment. One of the objectives was testing the weed effect of the new technology.
The second series of experiments was shallow steaming, by a self propelled machine, called ‘Regero’, injecting the steam by pressure down to about 7 cm soil depth in different kinds of lettuce. The objective was testing of a technology already on the market. To optimise the use under Norwegian conditions five different steaming intensities were compared.
The results show that deep steaming (6 minutes or more at 99-100) significantly reduced both the density (to about 5,3 % of untreated) and the percent cover (3,3 %) of weeds, and the seed bank (to about 9,0%) in the soil compared with untreated area. The yield increase was not consistent. At 10 cm soil depth the attained temperature was minimum 70 C in 6-9 minutes. At 20 cm soil depth the temperature not always was satisfied.
Shallow steaming in different salads and Chinese cabbage (about 2 minutes or more at 99-100 C) significantly reduced the weed density (4,0%) and the seed bank (to about 1% of untreated). The yield was significantly increased. At 2 cm soil depth it was achieved 70 C or more in minimum 10 minutes. At 5 cm soil depth only a few times the temperature was not satisfied.
According to the literature the letal temperature for weed seeds is about 60-80 C (Melander et al., 2002; Mariska et al., 2003). The experiments showed that it is possible to save fuel on the steaming machines, and still get significant weed control. References MARISKA, C.A. van LOENENoenen, Y. YZANNE, C.E. MULLINS, N.E.H. FEILEN, M.J.
WILSON, C. LEIFERT og W.E. SEEL (2003) Low temperature-short duration steaming of soil kills soil-borne pathogens, nematode pests and weeds. European journal of plant pathology 109, 993-1002.
MELANDER, B., T. HEISEL og M. HEIDE (2002) Stribedampning af ukrudt i økologiske grønsager. In Den nasjonale kongress for økologisk landbruk 2002 (Thomas Cottis ed.), Rapport nr. 3 (Høgskolen i Hedmark), 9-16.

6th EWRS Workshop on Physical and Cultural Weed Control 180 Lillehammer, Norway, 8-10 March 2004
Control of perennial weeds

6th EWRS Workshop on Physical and Cultural Weed Control 181 Lillehammer, Norway, 8-10 March 2004
Terminating ley with mid-summer bare fallow controls Elymus repens
S. Kakriainen-Rouhiainen1, J. Väisänen1, P. Vanhala2 & T. Lötjönen3 1MTT Agrifood Research Finland, Ecological Production, FIN-51900 Juva, Finland 2MTT Agrifood Research Finland, Plant Protection, FIN-31600 Jokioinen, Finland
3MTT Agrifood Research Finland, Agricultural Engineering, FIN-03400 Vihti, Finland
Perennial weeds, especially Elymus repens (L.) Gould (common couch), become often a problem in long-term leys. They cause problems also in the succeeding crop, particularly in organic farming, where chemical weed control is not used. The objective of this study was to find such ways for terminating long-term leys, which are more effective in suppressing E. repens than traditional autumn or spring ploughing. In addition to controlling perennial weeds our aim was to accelerate the nitrogen release from the ley in order to increase the availability of nitrogen to barley in the early summer.
The field experiment with four replicates was placed in medium fine sand soil field at Juva in eastern Finland. The ley was 3-year old in 2000, consisting of timothy and red clover. The percentage of red clover was about 50%. In the first experimental year, the timothy-clover ley was terminated using various types of cultivation with different timing. Treatments in terminating ley:
A1 Stubble cultivation (three times during about one month) after harvesting one forage yield, catch crop and autumn ploughing in October (“mid-summer bare fallow” treatment)
A2 Stubble cultivation after second forage yield, no catch crop, autumn ploughing in October A3 Plain ploughing in September, shortly after second forage harvest A4 Aftermath was grown, plain ploughing in October, just before winter A5 Plain ploughing in spring
The effect of different treatments on E. repens was assessed in 2001. In spring the whole experimental field was sown with barley. In early July, the number of shoots of perennial weeds was assessed on 2 × 0,25 m² at both ends of each plot. In statistical analyses, the number of E. repens shoots and barley yield in different treatments were compared to the “ploughing in October” treatment (A4), which was considered as the standard practice when terminating ley.
The alternative methods reduced E. repens infestation when compared to ploughing. After plain ploughing (A3, A4, A5) the density of E. repens varied from 147 shoots m-2 to 182 shoots m-2, none of the ploughing treatments being superior to the other. The “mid-summer bare fallow” treatment (A1) reduced significantly E. repens (having only 27 shoots m-2). Stubble cultivation in Autumn after harvesting second forage yield seemed to reduce E. repens (to 94 shoots m-2 in barley stand) when compared to plain ploughing, but the difference was not statistically significant.
The grain yield and hectolitre weight of barley were highest, 2390 kg ha-1 and 61,6 kg hectolitre-1, respectively, after combination of stubble cultivation and a catch crop (A1). The second highest grain yield was harvested after late plain ploughing (A4). However, none of the yields differed significantly from the yield in treatment A4. The availability of nitrogen was affected by the treatments. There was 40 kg ha-1 soluble nitrogen on the top soil (0–30 cm) in May, in the year after the mid-summer bare fallow (A4). The lowest content of soluble nitrogen was after springtime ploughing.

6th EWRS Workshop on Physical and Cultural Weed Control 182 Lillehammer, Norway, 8-10 March 2004
The results of this study suggest that mid-summer bare fallow is a relatively effective way to reduce the amount of E. repens when terminating ley. Early started stubble cultivation is also less sensitive to moist weather, leaving more time for exhausting the rhizome reserves of E. repens. Stubble cultivation and catch crop do increase the costs but not as much as bare fallowing for the whole summer would do. Additionally, mid summer bare fallow allows harvesting one forage yield prior to bare fallowing.

6th EWRS Workshop on Physical and Cultural Weed Control 183 Lillehammer, Norway, 8-10 March 2004
Puccinia punctiformis as mycoherbicide on Cirsium arvense
S. Sørensen Hedmark university college, Dept. Agricultural and Natural Science, Norway
Mail address: Mariendal, Nørrevej 10 DK 5900 Rudkøbing Denmark [email protected]
Cirsium arvense, Creeping or Canada thistle is an increasing problem for farmers. Several attempts to use biological control have been studied. As pathogen to C.arvense. Rostrup (1873) noticed the increased number of infected plants by Puccinia punctiformis with increased density of the weed and in 1923 this pathogen was tested in laboratory and in fields. In contrary to other pathogens P. punctiformis is an obligate parasite to C.arvense. The pathogen is ubiquitous, easy to distinguish and to extract and thus suitable as mycoherbicíde.In spring, 2002, we transplanted 120, apparently healthy, plantlets of C.arvense at 8-10 leaf stadium were in tubes, containing surface soil, with 10 plants in each tube. The dimension of the tubes was150 cm long, Ø 40 cm.
In late June, P.punctisformis infected thistle were collected outside the trial area. About 50 leaves were swilled in 1 l of water for 1 hour, with a drop of detergent. The suspended spores were harvested by sieving and centrifugation at 7000 rpm for 10 min and applied to the test plants in 9 tubes by household atomizer. The application was repeated once in mid-July. In August, all treated plants had developed uredosori. All adventitious shoots were heavily infected by the pathogen and died off before end of season. In October, the roots were harvested and stored at 3°C for 6 weeks. 25-30 cm pieces of roots, from the superficial part, were laid out in buckets in sterilized soil. The buckets where kept moist at 10-12°C in 16 hour light. In February, the plants and roots in the buckets were harvested. Green shoots and emerging shoots, the number of healthy or infected shoots, numbers of shoot buds, healthy or diseased, and degree of root infection, was assessed.
Shoots emerging in buckets showed both pycnium and uredium to a various degree. The two forms appeared on shoot from the same root piece. This suggest that the fungus can become systemic after a secondary infection. Roots from P.punctisformis infected plants exhibited increased sprouting compared to roots from non-infected plants. Increasing infection in root increased also senescence of shoots and shoot bud. Conclusions
•P.punctiformis enhances early sprouting from roots. •Early sprouting will enhance effect of mechanical weed control measures in spring. •Increased sprouting will deplete energy reserves in root and thus reduce delayed sprouting
after spring farming. •Puccinia puntiformis can be utilized as an agent for biological control of Cirsium arvense.
References ROSTRUP (1873). in FERDINANSEN (1923) FERDINANSEN C. (1923). Biologisk undersøgelser over tistelrust (Puccinia suaveolens (Pers.)
Rostr.). Nordisk Jordbrugsundersøgelser pp. 475-487

6th EWRS Workshop on Physical and Cultural Weed Control 184 Lillehammer, Norway, 8-10 March 2004
Temporal sensitivity of Cirsium arvense in relation to competition, and simulated premechanical treatment.
M.G.Thomsen1, L.O.Brandsæter2 & H.Fykse3
1 Hedmark College, N-2322 Ridabu, Norway. Email: [email protected] 2 The Norwegian Crop Research Institute, Plant Protection Centre, Høgskolevn. 7,
N-1432 Ås, Norway. Email: [email protected] 3 Agricultural University of Norway, Department of Plant and Environmental Sciences,
Høgskolevn.7, N-1432 Ås, Norway. Email: [email protected]
Cirsium arvense is regarded as one of the ten worst weeds in Europe and N. America. In Canada infested land increased from 20.000 Ha in 1975 to 200.000 Ha in 1997. Yield reductions in winter wheat in the range of 28 – 71% have been recorded. C. arvense is highly tolerant to mechanical treatment of upper plant parts. Combined actions to regulate growth of C. arvenes in organic farming are necessary. This includes crop rotation, soil cultivation, crop density, cultivar selection and mechanical control. The aim of the following study was to assess the effect of pre-mechanical treatment in spring, given as length and depth of burial of the roots. This was combinated with or without a one season green manure crop. The effect of cutting date was also evaluated. The experimental design was a randomised complete block in a split-split plot-design with three replicates. Totally there were, 2 root lengths (5 and 10 cm) x 2 planting depths (5 and 15 cm) x 2 cover crop treatments (±) x 3 replicates x 7 sampling dates giving, 168 subplots. Content of nonstructural carbohydrates as a qualitative measure on the critical nutrient level in the C. arvense roots will be measured. The cover crop consisted of a mixture of Phacelia tanacetifolia (5 kg/Ha), Vicia sativa (80 kg/Ha), Trifolium pratense (5 kg/Ha) and Lolium multiflorum (10 kg/Ha). Preliminary results show that the cover crop, strongly reduced above ground and below ground growth of C. arvense. Cover crop in combination with short root pieces had a strongly negative effect on growth and dryweight of C. arvense roots.
N u m b er of g reen sh o ots o f C .a rven se in re la tio n to tim e af te r p lan tin g and co v er c ro p trea tm en t. F rom roo ts p lanted in th e u p pe r so il lay e r (5 cm )
D ate o f sam p lin g
Num
ber o
f gre
en s
hoot
s of
C. a
rven
se (±
std.
err.)
0
2
4
6
8
10
12
14
16
18
10 cm long roo t p ieces , no cove r cro p
5 cm lo ng root p ieces, no co ve r cro p
1 0 cm lo ng roo t pieces ,w ith cove r c rop
5 cm lon g ro ot p ieces ,w ith cove r c rop
3/6 10/6 18/6 26/6 10 /7 22/7 7 /8

6th EWRS Workshop on Physical and Cultural Weed Control 185 Lillehammer, Norway, 8-10 March 2004
Participatory organic weed management: Rumex spp. control - a farmer perspective
R.J. Turner & W. Bond HDRA, Coventry, CV8 3LG, UK
Email: [email protected]
A new DEFRA funded project began in August 2002, taking a new approach to weed management in the UK. This is a participatory project where farmers, researchers and other organic stakeholders identify, prioritise, trial and develop solutions to weed problems. Organic farmers were surveyed and asked ‘What are your main weed management problems?’ and over 60% (n=152) responded that docks caused them the greatest concern. An open meeting was held in December 2002 where interested parties met and discussed organic weed management. Problems were prioritised and the project will focus on three main topics ‘Perennials’, ‘Systems approaches to weed management’ and ‘Knowledge collation and dissemination’. The research direction is steered by focus groups comprised of farmers, researchers and advisors.
In terms of Rumex spp. (docks) this project is aiming to collate all published literature both ‘scientific’ and ‘grey’ information on organic dock control and also document current farmer management practice. Farmer weed management interviews have been undertaken and written into case study information from different farming systems. Some basic monitoring of dock populations has been undertaken on 12 farms. These populations will be monitored over the course of the four-year trial to quantify the efficacy of different control methods. Research trials will be established to compare control techniques. Work is also underway to investigate the potential of biological control with the beetle Gastrophysa viridula.
Information will be presented here from the literature review of dock management and the current farmer opinions and practice in the UK. Dock management trials that farmers are taking part in will also be discussed.

6th EWRS Workshop on Physical and Cultural Weed Control 186 Lillehammer, Norway, 8-10 March 2004
Response of Sonchus arvensis to mechanical and cultural weed control
P. Vanhala1, T. Lötjönen2 & J. Salonen1 1MTT Agrifood Research Finland, Plant Protection, FIN-31600 Jokioinen, Finland
2MTT Agrifood Research Finland Agricultural Engineering, FIN-03400 Vihti, Finland
Perennial weeds are an increasing problem in Finland, particularly in organic farming. Sonchus arvensis L. (perennial sowthistle) is among the most common and harmful perennial weeds. Controlling it using physical weed control methods is not an easy task. However, crop competition and cultural practices like mowing, hoeing and bare fallowing provide some possibilities for management of S. arvensis.
In order to study the biology and physical control of S. arvensis, a 3-year field experiment was established in 2001 at Vihti, southern Finland. The experiment was sown on a clay soil (containing 6–12% organic matter) field under organic production, infested heavily with S. arvensis. The experimental design was randomised blocks with five replicates. The experimental field was fertilized with pig slurry (plant available N 60–100 kg ha-1) at cereal sowing time.
The treatments consisted of various crop plants and cultural practices, including fibre hemp, spring cereal (barley in 2001, oats in 2002) with or without inter-row hoeing, bare fallow and ley (timothy + red clover) with mowing. In 2003 the whole field was sown with spring wheat. Prior to cereal harvest, plant samples from two 0.5 m × 0.5 m quadrats were cut at the soil surface. The growth stage and height of each Sonchus shoot were assessed, as well as the number of shoots and dry mass per quadrat.
Statistical analyses were performed with the SAS statistical package. The plot-wise pooled numbers of S. arvensis shoots were square root transformed and the biomass log-transformed before subjecting to statistical tests with the MIXED procedure with the Tukey adjustment.
In 2001 S. arvensis was most abundant in fibre hemp and first year’s timothy + red clover ley, and rather abundant also in cereals without inter-row hoeing. Bare fallowing reduced the density and dry mass of S. arvensis most. Also inter-row hoeing reduced S. arvensis density compared to hemp or ley. Highest S. arvensis dry mass was observed in hemp plots. Fibre hemp is known to be a competitive plant, but in this field it grew poorly in both years.
Also in 2002 the density and dry mass of S. arvensis were highest in hemp plots and in oats plots with no mechanical weed control. The density and dry mass of S. arvensis were lowest in the bare fallow treatments. In plots where oats was grown after previous summer’s bare fallow, the dry mass of S. arvensis was significantly smaller than in hemp, oats, or hoed oats plots.
The rating of the treatments according to the control effect was: bare fallow > ley > cereal with inter-row hoeing > cereal > fibre hemp.
The results suggest that the following measures could be implemented in order to suppress S. arvensis infestation: A crop which is competitive in the conditions of the given field should be chosen. Bare fallow is an effective way to reduce S. arvensis, but it’s a costly method which may impair soil structure, in case of ample precipitation. Mowing the ley seems to have effect on S. arvensis; it would be profitable to have a perennial, regularly mown green fallow or silage ley included in crop rotation.
Mechanical control in crop stand is also possible; inter-row hoeing in cereals seems to impede S. arvensis, if it is done 2–3 times during the growing season. Inter-row hoeing is effective between cereal rows, but it can’t control the weeds within the crop rows. The subsequent effect of different treatments, assessed in spring wheat in 2003, will be published later.

6th EWRS Workshop on Physical and Cultural Weed Control 187 Lillehammer, Norway, 8-10 March 2004
Effect of crop rotation and tillage on infestation of Cirsium arvense in organic farming systems
A. Verschwele & A. Häusler Institute for Weed Research, Federal Biological Research Centre,
Messeweg 11/12, D-38104 Braunschweig, Germany, e-mail: [email protected] Abstract
Canada thistle (Cirsium arvense) is still difficult to control in organic farming systems. Since
low competitiveness of most of the crops and limited possibilities for direct control measures, C. arvense is stated as a main problem by organic farmers.
Therefore, it was the aim of a two-year-project to survey the recent situation on organic farms in Germany. In 2003 detailed interviews of 156 organic farmers were run throughout Germany sampling data on weed infestation, cultivation practices and measures of weed control. Most of the farmers (93%) stated to have problems with C. arvense. On average, 33% of the arable area grown organically is highly infested but farmers appraised that the problem will not arise in the next future. Evaluation of the data clearly shows that low abundance of C. arvense is correlated to a high portion of mulching crops, especially clover-grass or alfalfa-grass mixture. A moderate control effect is achieved by winter annual crops whereas undersown or row crops do not have any influence. According to the survey a high portion of cereals within the crop rotation is intensifying problems with C. arvense.
As a result of the survey soil tillage is widely based on turnover soil tillage by a conventional plough, probably because of its well-known beneficial weed control effects. The most common equipment for stubble tillage is the wing share cultivator followed by the disc harrow and other types of cultivators. There is no clear farmer’s estimation on the control effect of these machines. The so called Arado plough appears to reduce Cirsium populations but it is very rarely used in practice. Obviously the control of C. arvense does not depend on the type of the equipment but is more affected by the time and frequency of treatment. Finally the site- and time-specific use of the equipment combined with high competitive crop rotation plays an important role in weed management.
In addition field experiments on effects of crop rotation and soil tillage have been conducted at the BBA trial area for organic farming. Since conversion to organic farming in 1996 C. arvense has spread continuously over almost this field. This increase was mainly caused by growing summer crops in the first years and reduced frequency of stubble tillage. Since changing the experimental design in 2001 by separating the area into 8 plots with a more mixed crop rotation the spatial distribution could be decelerated. Growing and frequently mulching of grass-clover showed good control of C. arvense. Using a wing share cultivator 2-3 times could also reduce the density of C arvense, especially when tillage follows a crop with high competitiveness. These findings show the clear interactions between crop and tillage management and the need to use both tools for effective control of C. arvense.
Due to current economic conditions there might even be an increasing force for reducing soil tillage or more simplified crop rotations. This possible development of organic farming systems is not compliant to the needs of a preventive weed control. Therefore farms with a cereal-based crop rotation should use also other options to increase crop competition, e.g. cultivar choice, sowing methods or fertilizing practice.

6th EWRS Workshop on Physical and Cultural Weed Control 188 Lillehammer, Norway, 8-10 March 2004
Introduction C. arvense is known as a serious problem in organic farming systems. This perennial weed
species is characterised by a high competitiveness based on a wide adaptability, a dense and expanding root system and an ability to regenerate (Mitchell & Davis, 1996). This encourages spread, especially in situations with low or no crop competition, e.g. during a retarded early crop development or after harvest. Also, mechanical control measures are often ineffective (Häni & Zürcher, 2002). Therefore, approaches of improved measures to control C. arvense are aimed at crop rotation, crop management and soil tillage in order to disrupt vegetative growth and nutrient storage in the roots. A long-term control strategy depends on the ideal combination of these measures and must take into account the specific conditions of the farm and the site. Survey on organic farms Method of the survey
A survey on organic farms was run in order to record the recent situation concerning problems and management of C. arvense. This was done in cooperation with the Institute of Organic farming of the FAL and the Institute for Integrated Plant Protection of the BBA. 156 farmers were selected with regard to specific criteria (Fig. 1):
- region, production type
- organic growing for at least 5 years - problems and/or solutions regarding to C. arvense (farmers were asked in advance)
Fig. 1: Geographical position of the organic farms taking part in the survey.

6th EWRS Workshop on Physical and Cultural Weed Control 189 Lillehammer, Norway, 8-10 March 2004
The farmers were interviewed face-to-face and intensively asked for the following data and information:
- characteristics of the farm and the region - crop rotation and crop management
- equipment and practices of soil tillage - abundance and possible damage of C. arvense
- data on livestock and organic fertiliser - specific control strategies for annual and perennial weeds
Depending on the question data were given as metric (e.g. crop area), ordinal (e.g. as ranking
scale) or nominal (e. g. free text or multiple choice). A MS© Access data base was used for data sampling and evaluation. A lot of information given by the farmers were soft data, which could not be evaluated in a statistical way. However, the data base was very helpful to classify and rank characteristics. These results were the basis for more detailed and complex interpretations.
Results of the survey In general the survey shows that problems with C. arvense are of moderate to high extent. Most
of the farmers do not expect an increase of the infestation with C. arvense. There is no clear proof that the infestation is correlated to geographical or climatic conditions or to the production type of the farm. On average 30% of the arable area covered by the survey is infested with C. arvense. One third of the interviewees found C. arvense on more than 30% of their area (Tab. 1a) and even 12 farmers mentioned to have more than 90% infested with C. arvense. The weed is mostly dispersed in patches whereas an area-wide distribution is rarely (Tab. 1b). Although terms like ‘problem’ is of subjective character and the frequency is visually estimated the data point out the current importance and the need for an effective control of C. arvense.
Tab. 1a: Frequency of C. arvense. Tab. 1b: Distribution of C. arvense.
Farms (%) Area infested (%) Area (%) Distribution
7 0 7 sporadic
22 1-10 70 patchy 38 11-30 4 lowly area-wide
33 31-100 11 highly area-wide 0 no data 8 no data
Most of the farms (140) indicate to have trouble not only with C. arvense but also with Rumex spp. and/or Agropyron repens, 96 thereof have even heavy problems with these other perennial weed species. During the last years farmers have noticed that C. arvense is not only infesting arable land but also pasture land, whereas Rumex spp. has been more and more established on arable land.
Further evaluation was focussed on farms without significant infestation of C. arvense in order to find out specific characteristics and circumstances. Frequent growing of clover-grass or alfalfa-grass mixture is typical for those farms. On the other hand, problematic farms are characterised by a

6th EWRS Workshop on Physical and Cultural Weed Control 190 Lillehammer, Norway, 8-10 March 2004
high portion of cereals and/or summer annual crops within the crop rotation. Intercrops, undersown or row crops do not appear to affect the infestation (Fig. 2).
Another focus was set on the soil tillage methods on organic farms and machines respectively. According to the survey the turnover soil tillage by the conventional plough is most common (131 of 156 farms) and ploughing in autumn is much more frequent than in spring. Other equipment like the two-layer plough or the Arado plough are used very rarely. However, based on farmers’ experiences these machines appear to be very effective in controlling C. arvense.
Fig. 2: Effect of crop portion (%) within the crop rotation on the area (%) infested with C. arvense.
Stubble tillage on the organic farms is mostly done by different types of cultivators but farmers do not have a clear estimation on the efficacy (Fig.3). The wing share cultivator is most common, followed by the disc harrow and other different types of cultivators. The shallow plough is only used very rarely.
Although these results are based on a subjective estimation by the organic farmers, there is no clear advantage for one specific type of machine. Finally the control of C. arvense is not only affected by the equipment itself but also by its specific use, e.g. time, frequency or tillage depth. Differences and mistakes of stubble tillage or other cultivation practices are also of great importance but this general survey could not provide the required details.
The farmers were also asked for their motivations and reasons to control C. arvense (Tab. 2). Tab. 2: Consequences of high infestation of C. arvense (multiple nominations possible)
Consequences NominationsHigh work load and costs 145 Changes of crop rotation 119 Yield loss 99 Harvest problems 93 Reduced crop quality 88 Criticism of colleagues 82 Other 34
0
20
40
60
80
100
0 41-50 91-100Area (%) infested with C. arvense
Cro
p po
rtion
(%) w
ithin
rota
tion
otherrow cropsclover/alfalfa-grasscereals

6th EWRS Workshop on Physical and Cultural Weed Control 191 Lillehammer, Norway, 8-10 March 2004
Fig. 3: Use and effect of different machines for stubble tillage as stated by the survey (number of nominations on the right).
Of course farmers are aware of the risks caused by high infestation of C. arvense like reduced
crop yield and quality. If the problem would intensify, they are also afraid that the crop rotation must be changed or higher work load and costs would to be expected. This includes additional manual weeding as well as purchase of special equipment or a higher portion of fallow or fodder crops. They are even motivated by a possible critical view of their colleagues. Field trials Material and Methods
Field trials on organic farming have been conducted on the certified 12-ha site ‘Ahlum’ at the BBA since 1995. In 2001, when C. arvense has infested nearly the whole area, the experimental design was changed in order to compare different crops and tillage measures. For more details on earlier trials please refer to Verschwele & Häusler (2003). The area was separated into plots with a more mixed crop rotation (winter wheat, winter rye, summer barley, potatoes, oilseed rape, clover-grass and intercrops) The time of the turnover tillage was varied (autumn/spring) as well as the time and frequency of stubble tillage (Tab. 3).
Shoot densities (no. m-2) of C. arvense were examined at fixed measuring points in May 2002 and May 2003.
Results The spatial distribution of C. arvense was characterised by a high variability. Fig. 4 shows the
situation in 2001 before the experiments were started.
0% 20% 40% 60% 80% 100%
shallow plough
wing share cultivator
other cultivators
disc harrow
decrease of C. arvense no effect increase of C. arvense no meaning
25
30
59
12

6th EWRS Workshop on Physical and Cultural Weed Control 192 Lillehammer, Norway, 8-10 March 2004
Fig. 4: Spatial distribution of C. arvense at ‘Ahlum’ (BBA) in 2001. (distances (m) on x- and y-
axes) Beside this high variability statistical evaluations are difficult since shoot densities of certain
patches decreased whereas neighbour patches show increasing densities at the same time and plot. For that reason the effects of crops and tillage were calculated based on the density changes of all measuring points (Tab. 3).
C. arvense decreased markedly (73.3%) after a clover-grass mixture which was mulched three times (plot III). Also good control (72.2%) was achieved by winter rye which is known as a strong competitor followed by double stubble tillage (plot V). On the other hand, double tillage was not successful after winter wheat with low competition (plot IV). Another strategy, ploughing twice in autumn and spring combined with clover as intercrop reduced density of C. arvense to a similar extent (70.8%) (plot II). Reasons for the increases in plots I and IV can be found in the crops with low competition like summer barley and winter wheat. Neither a following intercrop nor a double stubble tillage could stop the growth of C. arvense.
There are indications that crop rotation or crop competition is more effective than stubble tillage. These findings also show the clear interactions between crop and tillage management and the need to use both tools for effective control of C. arvense. However, it has to be considered that due to the project duration the results reported here are of an one-year experiment. Discussion
Data of both the survey and the organic field trials give a clear proof for the good control effects of crops and rotation with a high competitiveness. The density of C. arvense can be reduced by growing clover-grass or alfalfa-grass mixture, especially when mulched several times. In contrast to this an exceeding growing of cereals results in an increase of C. arvense.
Comparing tillage equipment in specific field trials C. arvense can be markedly reduced by the Arado plough (Engelke & Pallutt, 2004) and also by the two layer plough (Pekrun et al., 2003; Lazauskas & Pilipavicius, 2003). In contrast to the experience expressed by the survey there is no clear proof that a shallow plough is more effective than ‘modern’ tillage machines (Pekrun & Claupein, 2004). A wing share cultivator reduces the shoot density of C. arvense, especially when used at least twice and when it follows a crop with high competitiveness (Häusler et al., 2004. For high efficacy of stubble tillage the roots of C. arvense must be cut in different depths and over the whole area. This can be preferably achieved by a so called exact cultivator but also other types of cultivators (Debruck & Koch, 2003).
These findings emphasise the role of crop rotation and stubble tillage for an effective control of C. arvense. However, especially for arable farming systems options for crop rotation are limited. Due to current economic conditions there might even be an increasing force for reducing soil tillage or more simplified crop rotations. This possible development of organic farming systems is not compliant to the needs of a preventive weed control. Therefore farms with a cereal-based crop
0 100 200 300 400 500 600 7000
100
2001 Shoots m-² 1 - 10
11 - 20
> 20

6th EWRS Workshop on Physical and Cultural Weed Control 193 Lillehammer, Norway, 8-10 March 2004
rotation should use also other options to increase crop competition, e.g. cultivar choice, sowing methods or fertilizing practice. In extreme cases farmers should accept loss of yield and receipts and replace cash crops by fallow or fodder crops like perennial clover grass which should be frequently mulched or cut. Also frequent stubble tillage is more suitable than growing an intercrop, especially under dry soil conditions. On the other hand, intensive tillage may result in risks of nitrogen loss. In a long-term view these tools should be used very variable in order to find the optimal balance of all requirements and objectives. Tab. 3: Effect of crop and tillage management on the abundance of C. arvense (Ahlum, BBA,
2002-2003)
Plot I II III IV V
Crop and tillage management :
Crop 2002: w. wheat w. wheat clover-grass oilseed rape s. barley Intercrop 2002/2003: clover clover - - - Stubble tillage: 0 0 1 2 2
Primary tillage: autumn autumn + spring autumn autumn autumn
Crop 2003: s. barley potatoes w. wheat w. wheat w. rye
Abundance (2002 to 2003, no. of measuring points):
< 50% 0 1 0 4 0 Increase:
≥ 50% 8 5 4 17 4 < 50% 2 0 0 3 3
Decrease: ≥ 50% 3 17 11 4 10
Stagnation: 2 1 0 2 1 Not infested: 13 8 13 2 14 Decrease (%) based on infested points: 33.3 70.8 73.3 23.3 72.2
Mean density (Shoots m –2): 2002: 13.9 38.4 2.6 25.0 15.0 2003: 12.1 12.5 2.1 43.4 9.1 Acknowledgements
We greatly thank our colleagues H. Böhm, T. Engelke, J. Finze, and B. Pallutt for their
contributions. The project was supported by the ‘Bundesprogramm Ökologischer Landbau’.

6th EWRS Workshop on Physical and Cultural Weed Control 194 Lillehammer, Norway, 8-10 March 2004
References DEBRUCK B, KOCH W (2003): Die Bekämpfung der Acker-Kratzdistel – Die mechanische
Bekämpfung in der herbstlichen Stoppel. In: BÖHM H et al.: Strategien zur Regulierung von Wurzelunkräutern im ökologischen Landbau - ein Verbundprojekt im Rahmen des Bundesprogramms Ökologischer Landbau. FAL Agricultural Research, Special Issue 255, 35-40.
ENGELKE T, PALLUTT B (2004): Bedeutung der Grundbodenbearbeitung für die Regulierung der Acker-Kratzdistel (Cirsium arvense) im ökologischen Landbau. Journal of Plant Diseases and Protection, Special Issue XIX, 553-562.
HÄNI F, ZÜRCHER J (2002) : Vermehrung, Ausbreitung und Regulierung der Acker-Kratzdistel Cirsium arvense – Ökoflächen im Focus. In: NENTWIG N: Streifenförmige ökologische Ausgleichsflächen in der Kulturlandschaft – Ackerkrautstreifen, Buntbrachen, Feldränder, Verlag Agrarökologie vaö Berlin, Hannover, 93-112.
HÄUSLER A, VERSCHWELE, A, ZWERGER P (2004): Bedeutung von Stoppelbearbeitung und Fruchtfolge für die Regulierung der Acker-Kratzdistel (Cirsium arvense) im ökologischen Landbau. Journal of Plant Diseases and Protection, Special Issue XIX, 563-572.
LAZAUSKAS P; PILIPAVICIUS V (2004): Weed control in organic agriculture by the two layer-plough. Journal of Plant Diseases and Protection, Special Issue XIX, 573-580.
MITCHELL R B & DAVIS L T (1996): Effect of control treatments on the root reserves of Californian Thistle (Cirsium arvense). Proceedings of the 49th New Zealand Plant Protection Conference, 229-233.
PEKRUN C; HÄBERLE A, CLAUPEIN W (2003): Bedeutung von Grund- und Stoppelbearbeitung für die Kontrolle der Acker-Kratzdistel (Cirsium arvense) im ökologischen Landbau. In: BÖHM H et al.: Strategien zur Regulierung von Wurzelunkräutern im ökologischen Landbau - ein Verbundprojekt im Rahmen des Bundesprogramms Ökologischer Landbau. FAL Agricultural Research, Special Issue 255, 29-34.
PEKRUN C, CLAUPEIN W (2004): The effect of stubble tillage and primary tillage on population-dynamics of Canada Thistle (Cirsium arvense) in organic farming. Journal of Plant Diseases and Protection, Special Issue XIX, 483-490.
VERSCHWELE A, HÄUSLER A (2003): Strategies to control Cirsium arvense in organic farming systems. Proceedings of the BCPC Congress - Crop Science and Technology, Glasgow, 481-486.

6th EWRS Workshop on Physical and Cultural Weed Control 195 Lillehammer, Norway, 8-10 March 2004
Integrated weed management

6th EWRS Workshop on Physical and Cultural Weed Control 196 Lillehammer, Norway, 8-10 March 2004
Integrated weed control methods in winter and spring sown lentil (Lens culinaris)
H. M. Alizadeh1, H. K. Mojni & N. M. Hosseini 1 Department of Agronomy, College of Agriculture, University of Tehran, Karaj- Iran
Sowing dates and weeds are two considerable factors in diminishing lentil production. In order to assess the effectiveness of sowing time and various weed control methods in lentil an experiment was laid out in randomized complete block design in a split plot arrangement with four replicates at research farm of College of Agriculture, Tehran University, Karaj (Iran) during 2001-2002. Treatments comprised two sowing dates viz. winter or “Entezari“ and spring as whole plots and eleven weed controls treatments as subplots. These treatments comprised of pre-plant application of trifluraline (960 gr. a.i./ha); pre-emergence application of pendimethalin (1.32 kg. a.i./ha); post-emergence applications of cyanazin (1 kg. a.i./ha), pyridate (1.2 kg. a.i./ha) and oxyfluorfen (480 gr. a.i./ha); six different combinations of the first two herbicides with pyridate / oxyfluorfen plus one hand weeding; finally a weed free and a weed infested plot also included as check. The results showed that lenil’s seed and biological yield; pods per plant; grain numbers per pod; thousand seed weight; main stem height and harvest index were significantly affected by sowing dates (p < 0.01) however, branch numbers per plant was not significant (p > 0.05). Similarly, these traits showed significant difference (p < 0.01) under weed control treatments except the main stem height. The interation effects was only observed for seed yield (p < 0.01). In Entezari sowing date the seed yield and other yield components, except 1000 seed weight, were significantly higher as compared to spring sowing. The combinations of pendimethalin + pyridate, pendimethalin + one hand weeding and ttrifluralin + one hand weeding compared with check (weed infested plot ) proved to be among the best treatments for weed control in Entezari and spring sown lentil. References MISHRA, J. S., V. P. SINGH, & V. M. BHMAN. 1996. Response of lentil to date of sowing and weed
control in Jabalpur, India. Lens Newsletter, 23(1, 2): 18-23. MOHAMED, E. S., A. H. NEURAL, G. E. MOHAMED, M. I. MOHAMED, & M. C. SABENA. 1997. Weed
and weed management in irrigated lentil in North Sudan. Weed Research, 37: 211-218 ASLEEP, S. R., K. A. AL-SASSILY. 2001. Effect of irrigation regime and some weed control
treatments on lentil yield and associated weeds. Annals of Agricultural Science (Cairo), 46(2): 605-617.
TURK, M. A., A. M. TAWAHA, & M. K. J. EL-SHATNAWI. 2003. Response of lentil (Lens culinaris Medik) to Plant density, sowing dates, Phosphorus fertilization and Ethephon application in the absence of moisture stress. Agronomy and Crop Science, 189:1-6.

6th EWRS Workshop on Physical and Cultural Weed Control 197 Lillehammer, Norway, 8-10 March 2004
Destruction of Orobanche ramosa seeds with a new soil drench and control of emergence by herbicides.
J. M. Matthews & D. E. Miegel. University of Adelaide, Department of Agronomy, Roseworthy. 5371 South Australia and CRC
for Australian Weed Management. Introduction
Destruction of weed seeds in the soil is a weed management objective that has rarely been achieved, especially by environmentally safe methods. Orobanche species pose serious weed problems perpetuated by high numbers of long-lived seed so destroying seeds allows the prospect of eradication.
A new and isolated outbreak of Orobanche ramosa was positively identified in South Australia in 1989. An area of about 4900 km2 is under strict quarantine. Eradication of the weed and release from quarantine is underway. The eradication effort relies upon intensive field surveys to identify and map infestations and prevention of emergence by strategic crop choices, herbicide use and fumigation.
O. ramosa is a parasite that attaches to weedy and cultivated members of the Compositae, Leguminaceae and Brassicacea in South Australia. It can decimate crops from these and other families. Eradication of this weed is contemplated because of the restricted distribution but requires methods that totally prevent germination or emergence or seed production, or methods that kill the seed in the soil. Methods and Results Herbicides
Previous research has shown most members of the group of herbicides that inhibit acetolactate synthase or amino acid synthesis to be effective against Orobanche species (Plakhine 1997; Garcia-Torres 1991). Further work was undertaken in an alkaline, calcareous soil in a 260mm rainfall environment (Table1). In this environment O. ramosa attaches to weeds of all crops and to canola and some legume species.

6th EWRS Workshop on Physical and Cultural Weed Control 198 Lillehammer, Norway, 8-10 March 2004
Table 1. Effectiveness of herbicides against O. ramose
Chemical name Crop situation and Growth stage
Product use rate
Effectiveness (% control)
Chlorsulfuron wheat post-em. Z14/22 <12gm/ha 100% Metsulfuron-methyl wheat post-em Z14/22 <3gm/ha 100% Triasulfuron Wheat pre-em. < 15gm/ha 100% Imazapic & Imazapyr Canola var. Clearfield
post-em 4leaf stage 40gm/ha 100%
Imazapic & Imazapyr & MCPA
wheat post-em. Z14/22 900mls/ha 100%
Imazethapyr Peas 100ml/ha 96.4% Lucerne 100ml/ha 94.3% Glyphosate Pasture post-em
Pre broomrape emergence
1l/ha (540mls/L)
99.8%
Results are from 4 replicates repeated over 3 years (2001-2003) compared to adjacent untreated
but otherwise similar control plots. Soil Drench
A novel soil drench “Seed Inhibitor 041202” from Certified Organics NZ (Certified Organics Ltd., PO Box 74 382, Market Road, Auckland, New Zealand. Email, [email protected]: WWW.certified-organics.com )was tested in a water dilution in vivo and in one-litre pots of field soil. The treatments reduced the viability of ryegrass and canola in petri dishes and in pots and broomrape in pots only, to zero (table 2). Table 3 shows the results of field trials where Seed Inhibitor was applied by hand spray or by boom to sandy soil in Southern Australian winter conditions. The higher water rates gave a high level of seed disappearance. Enumeration was made by association of DNA markers with seed from soil cores, variations may occur with this method. Table 2. Germination of seeds following “Seed Inhibitor” treatment on ryegrass, canola and O.
ramosa, mean of 3 reps.
Application and dilution rate
Effectiveness % control
In vitro 10cm petri dish
100mls 20% 100%
100mls 10% 100% Pot trials 1L field soil wet to 10% w/w
10% 100%
5% 100%

6th EWRS Workshop on Physical and Cultural Weed Control 199 Lillehammer, Norway, 8-10 March 2004
Table 3. Effectiveness of soil drench from field trials, mean of 3 reps, data from pre and post
treatment soil cores.
Water rates and dilution
Effectiveness (% seed reduction)
20,000L/Ha 10% 93% 20,000L/Ha 5% 84% 15,000L/Ha 10% 64% 15,000L/Ha 5% 56% 10,000L/Ha 10% 43%
Plant back trials indicate that the germination and establishment of following legume or T. aestivum crops was not affected 21 days after treatment, B. napus establishment required 28 days or more to avoid residual effects. Discussion
The use of Seed Inhibitor 041202 has great potential to kill weed seeds in the soil prior to establishment of high value crops or in eradication programs. It represents a new opportunity for weed management in many situations with the potential to replace dangerous fumigants for seed destruction and weed control. The soil drench is environmentally and operator safe and may gain organic registration as it has in New Zealand. The herbicide treatments are able to economically prevent emergence and thereby reduce the broomrape seed burden over time in appropriate crops. References GARCIA-TORRES L. AND F. LOPEZ-GRANDEZ, proc. Fifth International Symposium on Parasitic
Weeds, Kenya 1991. PLAKHINE, D., Y. GOLDWASSER, J. HERSHENHORN AND Y. KLEIFELD, Adv. Parasitic Plant Res.
pp718-724, 1997.

6th EWRS Workshop on Physical and Cultural Weed Control 200 Lillehammer, Norway, 8-10 March 2004
Information from other working groups

6th EWRS Workshop on Physical and Cultural Weed Control 201 Lillehammer, Norway, 8-10 March 2004
Crop-weed interaction research; its link with physical and cultural weed control
L. Bastiaans Crop and Weed Ecology, Department of Plant Sciences, Wageningen University, P.O. Box 430,
6700 AK Wageningen, The Netherlands
The EWRS Working Group ‘Crop-Weed Interactions’ focuses on the interactions between crop and weed plants. Attention is given to a fundamental understanding of processes governing crop-weed interactions, as well as the utilization of this knowledge for improved weed management. One of the main objectives is to bring fellow scientists together to exchange information and promote discussion on the Working Group topic.
At the time of establishment of the Working Group, research related to crop-weed interactions focused on the construction of robust damage relationships to support rational decision-making on the use of herbicides. Multi-location trials were laid out by the Working Group members (from Finland to Spain and from Italy to the UK and Canada) to evaluate the yield-loss weed density model of Cousens (1985) and the relative leaf area model of Kropff & Spitters (1991). The evaluation confirmed the good descriptive ability of both models (Lotz et al., 1996). At the same time, predictive ability of both models was found to be poor and suggestions for improvement were made.
In the last decades, interest in weed management strategies that are less dependent on herbicides has increased. Alternative control measures, like mechanical control received increased attention. At the same time, agronomic measures to manipulate crop-weed interactions, like competitive cultivars, crop spatial arrangement, timing, level and placement of fertilizers and intercropping practices were explored, opening new scope for research in the area of crop-weed interactions. Furthermore, the time horizon of interest of systems that aim at a reduced reliance on herbicides is not restricted to a single season. Main emphasis should be given to the long-term management of weed populations. In this situation, the effect of the crop on the weed, particularly on weed seed production, becomes increasingly important. Consequently, research on crop-weed interactions merges with research on weed population dynamics. In line with this, the interest of the WG has extended, of which the development of decision support systems that model the consequences of cropping systems on the population dynamics of weeds is just an example.
These new developments encourage a further collaboration with closely related working groups. Competitive relations between crops and weeds are largely determined early on in the cropping season, reason why the activities of the WG ‘Germination and Early Growth’ are of interest to the Working Group. There is also a close link with the WG ‘Physical and Cultural Weed Control’. The shared interest in cultural control measures is just one aspect. Selectivity and efficacy of intra-row mechanical control measures is closely related to size differences between crop and weed, and thus to competitive relations. At the same time, an improved crop competitive ability might help to suppress weeds that have escaped mechanical control. Obviously, options for further collaboration among Working Groups should be further explored.

6th EWRS Workshop on Physical and Cultural Weed Control 202 Lillehammer, Norway, 8-10 March 2004
References COUSENS, R., 1985. An empirical model relating crop yield to weed and crop density and a
statistical comparison with other models. J. Agric. Sci. 105, 513-521. KROPFF, M.J. & C.J.T. SPITTERS, 1991. A simple model of crop loss by weed competition from
early observations on relative leaf area of the weeds. Weed Res. 31, 97-105 LOTZ, L.A.P. et. al., 1996. Prediction of the competitive effects of weeds on crop yields based on
the relative leaf area of weeds. Weed Res. 36, 93-101.

6th EWRS Workshop on Physical and Cultural Weed Control 203 Lillehammer, Norway, 8-10 March 2004
EWRS Working Group Education and Training
D.T. Baumann, D.C. Cloutier & P. Bàrberi EWRS WG Education & Training, c/o Agroscope FAW Wädenswil,
P.O. Box 185, CH-8820 Wädenswil, Switzerland. [email protected]
Introduction
Weed science has changed in last decade. New weed management concepts and new technology in chemical and non-chemical weed control are developed, scientific approaches have diversified and methodology is continuously improving. Knowledge management and exchange are hot items and networking is considered the future motor of modern research and development. In this context education and training is of critical importance. The Scientific Committee of EWRS decided therefore to work out a new concept for a EWRS Working Group Education & Training. Mission
The mission of the EWRS Working Group Education and Training is to facilitate the transfer of
knowledge in all aspects of weed science for students and professionals at all levels of training. Objectives
The overall objective of our working group is to develop a permanent, constantly updated,
source of information in weed science that can be freely shared with instructors, teachers, professionals, students and fellow weed scientists to learn and/or teach weed science. Activities
Through our web portal (Weed Portal) we provide teaching and training material and a training
network bulletin board. The Weed Portal is financially supported by the EWRS and can be accessed at http://www.ewrs-et.org/ for teaching and training purposes.
The type of teaching material offered is diverse, ranging from short introductory paragraphs to in-depth and comprehensive textbook chapters or documents. The scope of the topics covered can range from general, with broad views, to specialised, in depth and focused on specific problems. Other types of materials are also presented, such as pictures, references and links to similar or complementary material.
The content of the Web Site and its comprehensiveness will depend on your contribution. You will find a comprehensive directory on weed science topics ready to be filled with content. You will find a discussion platform to exchange information and ideas. The more you contribute the more you can profit.

6th EWRS Workshop on Physical and Cultural Weed Control 204 Lillehammer, Norway, 8-10 March 2004
Collaboration
The EWRS Working Group Education and Training works together with other EWRS Working
Groups, with organisations and universities all over the World and of course with you. You are invited to visit our web site to download material and to contribute with your own work. How many of us did prepare lectures, scripts and presentations on weed science, technology and management? Sharing this work will help to disseminate weed science, the work of EWRS and its members.
With your help we will continue to improve our activities. We consider Education and Training a core activity of EWRS and we will enhance Education and Training to a core competence of EWRS.

6th EWRS Workshop on Physical and Cultural Weed Control 205 Lillehammer, Norway, 8-10 March 2004
EWRS Working Group: Germination & Early Growth An overview of working group activities and opportunities
A. Grundy Plant Establishment & Vegetation Management
Horticulture Research International, Wellesbourne Warwick, CV35 9EF, UK
e-mail [email protected]
A better understanding of the emergence behaviour of weed species in relation to cultural and meteorological events presents a number of opportunities. For example, the magnitude and relative timing of a flush of emergence will influence the size and competitive pressure of a weed population hence impact on subsequent crop weed interactions and population dynamics. This combined information could be used to target the timing of cultivation and maximise the efficacy of control strategies (physical and chemical), or indeed to help the development of new strategies that build on this improved knowledge.
In recent years there have been significant research developments to understand and predict the emergence patterns for a number of important weed species. Since the autumn of 1999, a number of members of the EWRS Germination and Early Growth Working group have collaborated in a simple joint experiment to gain a better understanding of this early stage of the life cycle of weeds. The experiment has formed the focal point of the working group’s activities. The aim has been to produce a weed emergence dataset for weed seeds collected from different countries and subsequently buried in contrasting climatic locations. So far the study has explored some of the differences between the study populations in their emergence behaviour. The resulting dataset has also been used to illustrate a simple emergence model and hence to test some of the assumptions that are frequently made when models are applied to a wide range of environments and weed populations. The working group plans to initiate other simple collaborative experiments in the future and through annual workshops, the working group also provides a forum for discussion and the exchange of ideas.

6th EWRS Workshop on Physical and Cultural Weed Control 206 Lillehammer, Norway, 8-10 March 2004
Combining physical and cultural weed control with biological methods – prospects for integrated non-chemical weed management strategies
P. E. Hatcher1 & B. Melander2
1The University of Reading, 2 Earley Gate, Whiteknights, Reading, RG6 6AU, UK Email: [email protected]
2 Danish Institute of Agricultural Sciences, Research Centre Flakkebjerg, DK-4200 Slagelse, Denmark. Email: [email protected]
We aim, through this paper and discussions during this workshop, to promote greater integration of activities between the Physical and Cultural Working Group and the Biocontrol Working Group of the European Weed Research Society. This process started at the 2002 EWRS Symposium at Wageningen, where papers offered from both working groups were combined into one session ‘Integrated Weed Management, Physical Control, Biological Control and Allelopathy’, and led to the authors reviewing examples and possibilities for integration between these weed control methods (Hatcher & Melander, 2003). It was clear that there were only a few examples of combining physical/cultural and biological weed control methods in the literature, and no review had been undertaken before.
In this talk we will present our conclusions on circumstances where we think physical and biological weed control can be combined, or is worthy of further investigation, and situations in which we think this combination would not be successful.
We considered four physical and cultural methods for weed control: mechanical, thermal, cutting, and intercropping, and reviewed how they affect factors that are important to biocontrol agents, for example: soil moisture; disturbance; soil surface cover; plant nutrient and allelochemical status; and age of plant material.
We conclude that it will be easiest to combine biological control with fire and cutting in grasslands; within arable systems it would be most promising to combine biological control (especially using seed predators and foliar pathogens) with cover-cropping, and mechanical weeding combined with foliar bacterial and possibly foliar fungal pathogens. However, some combinations cannot be recommended. For example, changes to the soil brought about by mechanical and thermal weeding in arable crops may be particularly harmful to insect biological control agents, which are already difficult to introduce into these habitats.
We stress also the need to consider the timing of application of the combined control methods in order to cause the least damage to the biological control agent, along with maximum damage to the weed and to consider the wider implications of these different weed control methods. For example, weeds also interact with pests and diseases of crops by acting as alternate hosts for them and their predators, and the effects of physical and cultural control methods may change this relationship (Norris & Kogan, 2000; Hartwig & Ammon, 2002). References HARTWIG NL & AMMON HU (2002) Cover crops and living mulches. Weed Science 50, 688–699. HATCHER PE & MELANDER B (2003) Combining physical, cultural and biological methods:
prospects for integrated non-chemical weed management strategies. Weed Research 43, 303–322. (A pdf file of this paper is available from the authors – e-mail [email protected])
NORRIS RF & KOGAN M (2000) Interactions between weeds, arthropod pests, and their natural enemies in managed ecosystems. Weed Science 48, 94–148.

6th EWRS Workshop on Physical and Cultural Weed Control 207 Lillehammer, Norway, 8-10 March 2004
Methodology in physical weed control

6th EWRS Workshop on Physical and Cultural Weed Control 208 Lillehammer, Norway, 8-10 March 2004
Guidelines for physical weed control research: flame weeding, weed harrowing and intra-row cultivation
P. Vanhala1, D. Kurstjens2, J. Ascard3, A. Bertram4, D.C. Cloutier5, A. Mead6, M. Raffaelli7 & J. Rasmussen8
1MTT Agrifood Research Finland, Plant Protection, FIN-31600 Jokioinen, Finland 2Wageningen University, Soil Technology group, Box 17, 6700 AA Wageningen, Netherlands
3National Board of Agriculture, Box 12, 230 53 Alnarp, Sweden 4University of Applied Sciences Osnabrück, Oldenburger Landstr. 24, D-49090 Osnabrück,
Germany 5Institut de malherbologie, Box 222, Ste-Anne-de-Bellevue, Quebec, H9X 3R9 Canada 6Plant Establishment and Vegetation Management, Horticulture Research International,
Wellesbourne, Warwick, CV37 9EF, United Kingdom 7Sezione Meccanica Agraria D.A.G.A., Università di Pisa, 56124 Pisa, Italy
8Department of Agricultural Sciences, The Royal Veterinary and Agricultural University, DK-2630 Taastrup, Denmark
Abstract
A prerequisite for good research is the use of appropriate methodology. In order to aggregate sound research methodology, this paper presents some tentative guidelines for physical weed control research in general, and flame weeding, weed harrowing and intra-row cultivation in particular. Issues include the adjustment and use of mechanical weeders and other equipment, the recording of impact factors that affect weeding performance, methods to assess effectiveness, the layout of treatment plots, and the conceptual models underlying the experimental designs (e.g. factorial comparison, dose response).
First of all, the research aims need to be clearly defined, an appropriate experimental design produced and statistical methods chosen accordingly. Suggestions on how to do this are given. For assessments, quantitative measures would be ideal, but as they require more resources, visual classification may in some cases be more feasible. The timing of assessment affects the results and their interpretation.
When describing the weeds and crops, one should list the crops and the most abundantly present weed species involved, giving their density and growth stages at the time of treatment. The location of the experimental field, soil type, soil moisture and amount of fertilization should be given, as well as weather conditions at the time of treatment.
The researcher should describe the weed control equipment and adjustments accurately, preferably according to the prevailing practice within the discipline. Things to record are e.g. gas pressure, burner properties, burner cover dimensions and LPG consumption in flame weeding; speed, angle of tines, number of passes and direction in weed harrowing.
The authors hope this paper will increase comparability among experiments, help less experienced scientists to prevent mistakes and essential omissions, and foster the advance of knowledge on non-chemical weed management.

6th EWRS Workshop on Physical and Cultural Weed Control 209 Lillehammer, Norway, 8-10 March 2004
Table of contents 1 Introduction .........................................................................................................................210 2 General aspects....................................................................................................................210
2.1 Experimental design.....................................................................................................210 2.2 Assessing weed control ................................................................................................212
2.2.1 General overview .................................................................................................212 2.2.2 Visual evaluations ................................................................................................213 2.2.3 Weed sampling.....................................................................................................215 2.2.4 The number of plants to be counted ......................................................................216 2.2.5 Dealing with spatial heterogeneity........................................................................217
2.3 Assessing crop damage ................................................................................................217 2.3.1 Visual evaluation of crop tolerance.......................................................................217 2.3.2 Crop sampling ......................................................................................................218
2.4 Assessment timing and frequency ................................................................................218 2.5 Analysis .......................................................................................................................219 2.6 Describing the experiment............................................................................................220
2.6.1 Site and experimental conditions ..........................................................................220 2.6.2 Machines and adjustments ....................................................................................220 2.6.3 Weeds and crops...................................................................................................221
3 Thermal weed control ..........................................................................................................221 3.1 Experimental set-up .....................................................................................................222 3.2 How to perform the treatments .....................................................................................223 3.3 Describing the equipment and adjustments...................................................................223 3.4 Assessing plant response ..............................................................................................224
3.4.1 What to assess? ....................................................................................................224 3.4.2 Time of assessments .............................................................................................225 3.4.3 Temperature measurements ..................................................................................226
4 Mechanical weeding – weed harrowing and intra-row cultivation ........................................228 4.1 Introduction .................................................................................................................228 4.2 Objectives and approaches ...........................................................................................228
4.2.1 Comparing implement selectivity .........................................................................228 4.2.2 Comparing methods by single cultivations............................................................230 4.2.3 Fundamental research...........................................................................................231 4.2.4 Comparing implements.........................................................................................233
4.3 Describing the intensity, equipment and adjustments....................................................233 4.4 Assessing plant response ..............................................................................................234
4.4.1 Tolerance experiments ................................................................................................234 4.4.2 Crop soil cover............................................................................................................234 4.4.3 Determination of mechanical weed control equipment efficacy ...................................235 4.4.4 Determination of crop susceptibility to flex-tine harrows and to rotary hoes ................235
5 Concluding remarks.............................................................................................................235 References...................................................................................................................................236

6th EWRS Workshop on Physical and Cultural Weed Control 210 Lillehammer, Norway, 8-10 March 2004
1 Introduction
Experimentation is indispensable to knowledge development and transfer in all stages and at all levels. From trying out new ideas or weeder prototypes, systematic comparison of machines, sets of practical management guidelines and complete weed management systems, to their demonstration to farmers and joint learning processes, experiments are the proof of the pudding in deciding which machine to buy, testing hypotheses, gathering fundamental insights in the working mechanisms, and assessing parameters for models. Whatever the approach and objective, tailoring labour- and cost-efficient experiments that allow sound and sufficiently precise inferences on the predefined issues is an art that develops over the years. New experimental methods are often at the basis of scientific and technological breakthroughs. Therefore, exchanging experiences on existing methodology, identifying problems and flaws, and searching ways to overcome them within the constraints of time and money is an important role of communities like the EWRS working group on Physical and Cultural Weed Control.
Since the working group was established in 1994, several contributions and roundtable discussions have dealt with methodology. International exchange of research staff has assisted in the dissemination of advancements and new approaches as well. In the meantime, the research area of non-chemical weed management has matured and nowadays includes a wide variety of approaches, with increasing crosslinks to other areas in weed science. As many methodological topics specific to non-chemical weed control are not yet adequately addressed in textbooks on statistics and experimental design (Gomez & Gomez, 1984; Little and Hills, 1978) or experimental methodology in weed science (Burril et al., 1976; Frans et al., 1986), the authors feel a need to document insights gathered in the last 15 years. Issues include the adjustment and use of mechanical weeders and other equipment, the recording of impact factors that affect weeding performance, methods to assess effectiveness, the layout of treatment plots, and the conceptual models underlying the experimental designs (e.g. factorial comparison, dose response).
This work should be perceived as a working paper to collect scattered knowledge and stimulate discussions. It is open for improvement. Where possible, we aim to define guidelines. In other occasions, present methodological flaws are identified and useful options for further exploration suggested. We hope this will increase comparability among experiments, help less experienced scientists to prevent mistakes and essential omissions, and foster the advance of knowledge on non-chemical weed management.
2 General aspects
2.1 Experimental design
In designing any experiment there are a number of key steps. The first is to clearly identify the objectives of the experiment. These may be: • to compare the efficacy of a number of different weed control tools or methods, • to assess the effect of timing, dose or intensity on the efficacy of a method, • to compare different combinations of methods.
The clear identification of the objective of the experiment will then aid the selection of appropriate treatments to be included in the experiment. Objectives of the first type will generally lead to the selection of qualitative treatments, for example different methods, probably with the inclusion of a control or standard treatment (e.g. un-weeded, hand-weeded, “industry” standard) with which the different treatments will be compared. Objectives of the second type will lead to the selection of quantitative treatments such as the timing of application, the number of applications or the intensity of application. Here it is important to select treatments that will cover the range of possible responses, probably including both a negative control (e.g. un-weeded) and a positive control (e.g. hand-weeded) to define the worst and best responses. Objectives of the third type

6th EWRS Workshop on Physical and Cultural Weed Control 211 Lillehammer, Norway, 8-10 March 2004
suggest the use of some sort of factorial treatment structure, allowing the comparison of the different combinations of levels of each treatment factor. Treatment factors in such experiments might include both quantitative and qualitative treatments, and often an incomplete factorial structure might be necessary to incorporate appropriate controls or standards. Factorial structure provides the dual benefits of testing the effect of each treatment across a range of conditions (the level of the other treatment factors), whilst also allowing the identification of interactions between treatment factors.
Having identified the appropriate treatments and treatment structure, we can then identify the resources to be used. With glasshouse and laboratory experiments this is usually fairly straightforward – treatments will be applied to plants in pots or trays, and we just need to allow for possible sources of variability, such as position within the glasshouse in which plants are grown, and allocate plants to blocks appropriately. Unless there are very many treatments we will probably be able to have each treatment occurring just once in each block (e.g. using a randomised complete block design) so that the design and analysis will be relatively simple.
For field trials, we need to take account of any constraints on plot size and position within the field. Is there a minimum plot size that will be necessary for the realistic application of a treatment? This may differ between treatments, and may be much larger that it is realistic to assess, so that assessment will be of one or more sub-plots within each plot, or by selecting random or systematic quadrat positions. Both approaches have their place depending on what is being assessed – e.g. for intra-row cultivation it might be sensible to systematically position quadrats between rows, or to separately make within- and between-row assessments. Having selected the required plot size we then need to position the plots within the field. Are there features of the field that are likely to cause variability in the response? These might include the position relative to the field boundaries, slopes or the direction of prevailing winds, or even an observed variation in weed density or species composition. These sources of variation need to be accounted for in the blocking structure that is used. Note that blocks do not need to be contiguous – particularly where weed density is variable, it would be appropriate to allocate plots to blocks based on their weed density rather than their physical position.
For most experiments it will be most appropriate to use a randomised complete block design – that is a design where the number of plots per block is the same as the number of treatments, so that each block contains each treatment once. This may not be practical where there are a large number of treatments, in which cases an incomplete block design should be used, preferably a balanced incomplete block design to make the analysis as simple as possible. Other complications can include the need for two independent blocking structures. Where this is due to sources of field variability, a row-and-column design, such as a Latin square, should be used, though be aware of the constraints this may impose on the number of replicates. Two separate blocking structures can also be required in multi-factorial experiments where levels of one treatment factor need to be applied to much larger field areas than levels of the other factors. In such cases a split-plot type design would be appropriate. This type of design is often used inappropriately, where, for example, there is little interest in one factor (applied to main plots), to improve the precision of comparisons between treatment means for the other factors.
However, there are a number of disadvantages associated with using split-plot designs. The first is that by its nature, information in a split-plot design occurs at two levels, and the estimation of both error variances (residual mean squares) is on fewer degrees of freedom than would be available in the equivalent randomised complete block design – possibly requiring additional replication to have sufficient precision in the lowest stratum. Note that comparisons in the higher stratum will generally have poor precision because of the few residual degrees of freedom, and that this also impacts on the precision of some comparisons in interaction tables. A second disadvantage is that the loss in precision for the main-plot factors is much greater than the gain in precision for the sub-plot factors (based on a comparison of the expected mean squares for the two designs). A

6th EWRS Workshop on Physical and Cultural Weed Control 212 Lillehammer, Norway, 8-10 March 2004
third disadvantage concerns the comparison of treatment means, and in particular those for the interaction between a main-plot factor and a sub-plot factor. Comparisons between interaction means with different levels of the main-plot factor will generally be less precise in the split-plot design than they would be in the equivalent randomised complete block design. A final disadvantage is the extra complexity involved in presenting tables of interaction means for split-plot designs, where it will generally be necessary to present two different SEDs, plus possibly SEDs for the main effects. Thus split-plot designs should only be used where necessary to allow sensible application of treatments.
Finally we reach the often difficult question of replication. Where information is available about the plot-to-plot variability (e.g. from previous similar experiments), and we know the size of difference that we would like to be able to detect as significant, then we can calculate an appropriate replication level. For most experiments we would recommend a minimum of three replicates, and a useful “rule of thumb” (based on critical values of the t-distribution) is to aim for between 12 and 20 residual degrees of freedom. Other issues include the replication levels used for control or standard treatments. Where many qualitative treatments are to be compared with these it is often beneficial to increase the replication to a level equal to approximately the square-root of the number of treatments.
Another replication issue concerns the decision about increasing the number of replicate or increasing the within-plot sample size of area to increase the precision of comparisons. The decision depends on the relationship between plot size and spatial variability within the experimental area. Where there is little spatial variability within each plot then increasing the number of replicates is the best approach. However, where the within-plot variability is high, the within-plot sample size or area needs to be increased to provide a representative measure of the treatment effect across the range of within-plot conditions. Where plot size is not constrained by physical requirements, it is sensible to fit the plot size to the scale of the spatial variability.
A final issue is the use of multi-site trials. These can be particularly useful in demonstrating the robustness of treatment differences or effects across a range of environments, and, if carefully designed, can usually be analysed together. This usually requires the use of identical designs (different randomisations) on each site. Where separate analyses of each site are not intended, the replication level within a site can often be reduced.
2.2 Assessing weed control
2.2.1 General overview
It may be useful to develop guidelines for the kinds of measurements to be used in different types of experiments, to allow a sensible comparison of results from different experiments. Assessments can be either done using quantitative methods (weed counts, weed biomass, weed seed production etc.) or qualitative methods (e.g. visual estimation of weed control). Where there are only a few dominant species, a count of the number of weeds in a given area may be possible. With many different species, an overall count will not take account of different sizes of plant, so that a total weed biomass may be more appropriate. Often, a combination of quantitative and qualitative measures are used. For example, the visual evaluations might be done early during the season while the crop and weed densities might be determined later at the end of the growing season or prior to crop harvest. Weed biomass along with crop yield might also be determined at harvest.
Quantitative measures are ideal since they give actually measured values of weed density or biomass at a given point in time. However, the cost in resources and time is often prohibitive and this is why experimenter will resort to qualitative measures such as visual evaluations to assess the effect of weed control treatments on weeds and on crops. Although countings seem accurate, they can be very imprecise if only few (<50) plants are found on a relatively small fraction of the plot area (i.e. within the quadrats, see 2.2.4 and Fig. 1). If visual classifications allow a larger area to be

6th EWRS Workshop on Physical and Cultural Weed Control 213 Lillehammer, Norway, 8-10 March 2004
“sampled”, the inaccuracy in assessing weed density may be partially compensated by lower sampling errors. If this trade-off is sufficiently large, visual classification might even have similar accuracy than countings. Whether to prefer qualitative or quantitative assessments is still subject to debate.
Whilst visual scores can be quicker and easier to collect, they will usually have the disadvantage of being less easy to analyse. In particular, if an overall score (say, on a 0–5 scale) of crop damage or weed control is obtained for each plot, such data will rarely satisfy the assumptions of any standard method of analysis. They will also rarely provide strong discrimination between treatments. Hence the choice of qualitative or quantitative measurements is the balance between the time and resources needed to make the assessment, and the ability to discriminate between treatments.
010
203040
5060
7080
10 100 1000Number of plants counted before treatment
Effe
ctiv
enes
s (%
)
maximum mean maximum standard deviation
minimum mean minimum standard deviation
Figure 1. The effect of the number of plants per plot counted before treatment on the observed
variability of the mean effectiveness (set mean =50%) and the standard error between the 4 repetitions. Binomial distribution, 500 virtual experiments per data point (Kurstjens, unpublished).
2.2.2 Visual evaluations The following text has been partially adapted from an anonymous Canadian Weed Science
Society document published in 1994 (Anonymous, 1994) and from Frans et al. (1986). Visual assessments of the effect of weed control treatments on weeds can be used to
complement weed counts or weed biomass sampling, or instead of these samplings. Visual observations can be taken very rapidly and more frequently than quantitative measures. In order to be reliable, these observations must be taken using a rating system that is clearly defined and simple. Weed scientists have developed several systems (Shaw and Swanson, 1952; Willard, 1958; Frans et al., 1986; Gnegy, 1991; Anonymous, 1994). The most widely spread scale uses a 0 to 100 rating which is then used directly as percentages in analyses of variance (e.g. Table 1). The data might have to be transformed using the angular transformation (arcsin) in order to be normalized. However, if the scale is fairly crude (e.g. as percentage cover to the nearest 20%), data rarely satisfy the assumptions of analysis of variance (or other analysis methods), and will rarely discriminate between treatments.
There is some concern about the comment above relating to the use of a "0 to 100 rating scale". Analysis of such data as an arcsine transformed percentage is only really valid if the data are a

6th EWRS Workshop on Physical and Cultural Weed Control 214 Lillehammer, Norway, 8-10 March 2004
proportion based on counts (e.g. the number of mini-squares in a quadrat that are filled by weeds). If it is purely a visual score then it may not have the appropriate properties for this transformation, particularly as the precision associated with particular scores will probably vary in an odd way with the mean score. There is also an issue with visually comparing treatments with the weedy or weed-free check plots. This is fine if all plots have the same initial weed density and composition, but in practise this is rarely the case. It is almost always better to take pre-treatment assessments and consider the post-treatment differences allowing for the pre-treatment variation. This again indicates the value of using a truly quantitative assessment, as using a pre-treatment score as a covariate will often have insufficient precision to discriminate between different levels of response. Table 1. A linear rating scale that can be used to assess weed control or crop damage. (Modified
from Frans et al., 1986). Rating Weed Control Crop Damage Precision (%)
0 No weed control No crop reduction or injury 210 Very poor weed control Slight crop discoloration or stunting 520 Poor weed control Some crop discoloration, stunting, or stunt loss 530 Poor to deficient weed control Crop injury more pronounced, but not lasting 1040 Deficient weed control Moderate injury, crop usually recovers 1050 Deficient to moderate weed control Crop injury more lasting, recovery doubtful 1060 Moderate weed control Lasting crop injury, no recovery 1070 Weed control somewhat less than satisfactory Heavy crop injury and stand loss 1080 Satisfactory to good weed control Crop nearly destroyed - A few surviving plants 590 Very good to excellent weed control Only occasional live crop plants left 5
100 Complete weed destruction Complete crop destruction 2
It should be obvious that it is vital that all plots within an experiment are assessed in the same
way and at the same time. Ideally, more than one person would rate each treatment and the average rating would be used. Where different assessors are to be used within an experiment, they should each be assigned to assess all plots within a block, so that any differences between assessors are accounted for by differences between the blocks, and do not affect the treatment effects.
The assessment of the weed control action of a treatment should be based on the comparison of the treated plots with the untreated control plots (weedy check). The aim is to assess as accurately as possible the decrease in biomass (i.e. number of plants, height, number of leaves, etc.) per weed species as compared to the check. The decrease in biomass is attributed to the action of the treatment. This reduction can be expressed using the rating system presented in Table 1 above. Weed control on paved areas (streets, walkways and other hard surfaces) can be assessed by visually rating the “picture quality” (Table 2 below). This reference scale is often used without comparison to a weedy check and thus serves as an absolute reference for “weediness”.
Table 2. Picture quality classes for weed growth (Sluijsmans et al., 1997). Class Weed growth Description I none no weeds II little in places, no patches II moderate Weed growth in many joints, in places patches IV heavy Heavy weed growth in patches, no woody weeds V very heavy Heavy weed growth in patches, including woody weeds

6th EWRS Workshop on Physical and Cultural Weed Control 215 Lillehammer, Norway, 8-10 March 2004
Without an exact count, there are limits to the accuracy of assessment even for the practiced eye. It has therefore been found useful to aim for a differentiation of approximately 2% exactitude in the extremes of the scale range, with a 5% to 10% accuracy in the rest of the scale (Anonymous, 1994). Similar observations have been reported in plant pathology (Horsfall & Barrat, 1945; Jenkins & Wehner, 1983). The precision of visual rating scales is generally believed to be variable within the scale with greater precision at the extremes and less in the mid-ranges (Horsfall & Barrat, 1945; Jenkins & Wehner, 1983). The use of the 0–100% biomass reduction assessment is no more or no less subjective than using any other scale (ie. 0–9 or 0–10), and the researcher's judgment still can be incorporated in the assessment.
If a particular weed is not uniformly present in the untreated control plots and is similarly non-uniformly distributed in the treated plots, then it must not be evaluated. If, on the other hand, a weed is not present in the untreated control plots but does appear in the treated plots, it must be classified as "not controlled" (i.e. 0% control). Some additional guidelines are (Anonymous, 1994):
1. First inspect all the untreated control plots (weedy check) and observe which weeds are
uniformly and frequently present. 2. Decide which of the regularly present weed species correspond to the objective of the
experiment. 3. Assess the effect (biomass reduction) of the treatment on each individual species of weeds to be
monitored when compared to the control treatment and record as a percentage number. Do not rate minor infestations or non-uniformly distributed weeds when making a systematic analysis. Make note of any additional observed effects (e.g. suppression of weeds rather than total kill, potential for regrowth, uprooting, patchy control, etc.).
4. To have a clear view of the weed pressures at each site, one should characterize the weed infestation in the untreated control plots. Provide an estimate of the soil coverage by total weed infestation as a percentage. Determine the development stage (BBCH scale: Meier 1997) and density (number of plants per m²) of the weed species to be monitored. This can be expressed as a percentage of the total weed infestation. It must be recognized that a visual assessment does not represent an actual count. If actual
counts are done, then the ratings should be expressed as number of plants per m², which can then be converted as a percent of the total weed density or as a percent of the weed-infested control. Assessment of percentage cover can be made more precise, for example by counting “weed-filled” squares within a quadrat, giving a value to the nearest 1%, and this is then more useful.
2.2.3 Weed sampling
Weeds are generally sampled using quadrats and this topic is abundantly covered in ecology and vegetation textbooks (e.g. Kent & Coker, 1992).
There are two broad approaches to sampling weeds in the field that will be discussed in this text: permanent quadrat or randomly placed quadrats. A quadrat is an open frame (wooden or metallic) that is placed in the field and where weeds are sampled (counted, harvested, etc). A permanent quadrat is one which is established when the plots are laid out in the field. Its location is randomly chosen but it is marked in order to ensure that subsequent measures are always taken at the same place during the growing season. This avoids sampling errors induced by spatial heterogeneity. A randomly placed quadrat is one that is placed immediately prior to a sampling and usually this section of a plot is not sampled again.
On paved areas, such as streets and walkways, weeds grow in joints between stones or pavers. The total joint length within a 0.25 or 1 m² quadrat can be calculated from the stone or paver dimensions. Measuring the joint length covered by weeds and dividing that by the total joint length within the quadrat yields a reliable estimate of weed cover on paved areas.

6th EWRS Workshop on Physical and Cultural Weed Control 216 Lillehammer, Norway, 8-10 March 2004
Typically, quadrats are of a rectangular shape in fields where the crops have been seeded in rows. Again, depending on the objectives of the experiment, the quadrat can be placed intra-row or perpendicular to the crop row. In very narrow crop rows when blind harrowing is used (flex-tine in cereals, for example), a quadrat might be placed perpendicularly to the crop row and include several rows. When inter-row cultivation is used alone or combined with intra-row tools, weeding effectiveness within and between the rows can differ considerably. In such cases, these areas should preferably be assessed separately. If the effectiveness of intra-row tools such as torsion weeders and finger weeders is of interest, the quadrats will be placed on the intra-row only, parallel to the crop row. The quadrat width should preferably correspond to the area not cultivated by the inter-row tools (i.e. 5 to 15 cm).
As variations in light and soil conditions differ between the intra-row and inter-row area, which may lead to difference in conditions for weed emergence and growth, the untreated control for intra-row weeding effectiveness should also be an intra-row area. This can be an inter-row cultivated plot, with for example 10 cm between the protecting discs of the row crop cultivator, so that intra-row effects are minimized. This inter-row treatment should be made similar in all plots, including the untreated control, in case there is some additional intra-row effect.
Quadrats should be sufficiently long to ensure that weed density is satisfactory in the weedy check (see 2.2.4). Note that the number of quadrats could also be increased to increase the number of weeds counted per plot. An increase in the number of quadrats, rather than an increase in the quadrat size, can improve sampling accuracy, especially with weed populations that are inherently variable as demonstrated by Lemieux et al. (1992) in sampling populations of Elymus repens.
The weeds in the quadrats could be sampled according to broad categories (monocotyledonous and dicotyledonous) or other categories such as perennial and annual, or could be sampled by species, and even by growth stage within a species. Such distinctions are only sensible if sufficient numbers are present for each class.
2.2.4 The number of plants to be counted
The number of plants to be counted on each plot depends on the variability of the weeding operation itself (e.g. working depth, steering precision) and its effectiveness, and the aspired accuracy. Ideally, treatment differences of 3–5% crop plant loss and 5–10% weed control effectiveness should have a fairly high chance (say 80%) of being detected at a 95% confidence level. The number of plants could be calculated from information on the magnitude and type of variation (i.e. the type of distribution that best describes the errors, e.g. a normal, lognormal, poisson or binomial distribution). However, in most field experiments, a previously fixed number of (generally 1–4 50×50 cm) quadrats per plot are counted, without knowledge on the actual weed density and its spatial variability at that time and location.
If the percentage (weed) control or (crop) plant loss are assessed by counting plants in permanent quadrats before and after treatment, the number of plants per plot can be estimated by a randomiser with a binomial distribution and a set probability (i.e. effectiveness) and number of units (i.e. plants before treatment). With 50% effectiveness, this would resemble repeated “coin tossing”.
Table 3 and Fig. 1 show results from a simulation study based on 500 virtual experiments with 4 repetitions of two treatments with a preset difference in plant loss. Based on simulations with different preset differences, counting 100 weeds and 180 crop plants per plot before treatment is a reasonable guideline (Table 3). Counting less weeds would increase the probability of finding a significant effect that does not really exist (i.e. if the estimated variance is accidentally low). The probability of not detecting a significant effect increases as well. The observed variation between the repetitions decreases as the number of plants counted increases (Fig. 1). As the number of weeds counted is generally lower, often even below 50, it can be questioned whether the variable effectiveness of mechanical weeding can be attributed to the weeding technique or to inaccurate

6th EWRS Workshop on Physical and Cultural Weed Control 217 Lillehammer, Norway, 8-10 March 2004
assessments. Trying to distinguish species-specific effects with such low numbers will rarely be sensible, even if the effects found are (accidentally) significant. For example, in very low density situations, a natural variability of 1 or 2 weeds might mean a 25 or 50% increase in an average population of 4 weeds. Table 3. The number of plants per plot to be counted before treatment to significantly (P < 0.05)
assess treatment differences in plant loss by t-test in experiments with 4 repetitions. Simulations with Genstat 5, a binomial distribution and 500 virtual experiments, using two references: 50% (weed) control and 0.1% (crop) plant loss (Kurstjens, unpublished).
effectiveness Probability of significance reference difference 50 % 80 %
5 % 180 460 7,5% 75 180 10 % 45 100
50 %
15 % 20 40 1 % 275 460 3 % 180 400 0 % 5 % 180 400
It is not clear whether the level of variability simulated by the randomiser adequately represents
the variability of weeder effectiveness in real fields. The values in Table 3 might be too low, because simulation did not account for spatially heterogeneous weed infestations and variability of weeder performance itself. Particularly if weed density before treatment is estimated from weedy checks, guidelines from Table 3 may be far too low because weed infestations are spatially heterogeneous, even within short distances (metres). This is just an example of the approach that might be taken to calculating sensible sample sizes. The numbers given are under a particular set of assumptions, and therefore shouldn't be taken as a fixed answer for all situations. A similar approach could be taken for other sets of assumptions.
2.2.5 Dealing with spatial heterogeneity
It should be pointed out that a basic assumption in our experimental layouts and statistical analysis is rarely met, as homogeneous weed densities are rather exceptional. Assuming weed distribution to be continuously variable seems more realistic. Experimental layouts that minimise the impact of weed heterogeneity and allow statistical discrimination of treatment effects from spatial patterns need to be developed. Further discussion and research in this area is definitely required.
Where a intra-row cultivation treatment is applied it may be appropriate to assess weeds between and within rows separately. Otherwise you need to take sufficient samples (see above) to have a representative measure of the within-plot variability (both natural and as caused by any treatment).
2.3 Assessing crop damage 2.3.1 Visual evaluation of crop tolerance
The same basic principles in weed assessments apply to crop tolerance assessment. In this case, however, the control treatment should be an untreated treatment kept weed-free by hand (weed-free check). Herbicides should not be used due to the possibility of confounding the results. Evaluations should be done with a comparison to this weed-free check.

6th EWRS Workshop on Physical and Cultural Weed Control 218 Lillehammer, Norway, 8-10 March 2004
Details of the rating scale are presented in Table 1. Inclusion of decimal values is inappropriate. Use whole numbers only to report. Initial damage of up to 10% will generally be outgrown and will disappear with time. The impact of these low levels of injury are generally not reflected in yield losses. More severe injury, however, will almost always result in yield losses unless the suppression of a dense weed population can compensate for such damage. The observed damage should also be described (i.e. stunting, broken leaves or stems, uprooting, bent stems, etc.). Yield determinations are a critical component of tolerance trials (Anonymous, 1994).
2.3.2 Crop sampling
The most obvious crop variable to sample is the commercial yield (quantity and quality). However, other data should be collected both prior to and after the treatments to better document the crop response. The same sampling techniques and the same times that were presented above can be used for sampling the crops. However, for crops that do not produce tillers, the quadrats can become simple lengths of crop rows. Again, the length used should insure that there is a sufficient density of crop plants to be able to do meaningful statistical analyses. In general, 30 to 75% of the crop rows within the plot could be sampled (excluding the guard space or guard rows), depending on the plot size and on the crop density. The variables measured could be: number of seeds pulled out of the ground, number of seedlings uprooted, number of plants left standing after a treatment, number of plants bent, broken, number of leaves damaged, crop growth stage at different dates, etc.
2.4 Assessment timing and frequency
Weed control efficacy evaluations and crop tolerance evaluations could be conducted prior to a treatment and 7, 14, 21, 28 and 42 days after the treatment and at harvest. The frequency and intensity of sampling will vary according to the objectives of a given experiment.
Where the natural weed flora is being assessed, and where there is substantial plot-to-plot variability prior to treatment application, it may be useful to take a pre-treatment assessment to be used as a covariate in any analysis.
The timing of weed counting may have a strong effect on the results (see Fig. 2). Using fixed spots for successive weed countings should reduce random variation. Assess the situation prior to weed control treatment to see the initial situation, so you can measure the change due to control treatment, and use the initial situation as a covariate in statistical analyses.
0
100
200
300
400
500
-5 0 5 10 15 20 25 30 35Days after flame weeding
Wee
ds m
-2
AB
Figure 2. An example of three different weed assessments: Immediately before weed control
treatment, and 5 days and 30 days after treatments A and B (modified from Vanhala, 2000). The results and their interpretation may strongly depend on which of these assessments are done.
Generally the weeds are counted after treatment only once. The time depends on whether
competition and new emergence effects should be included, and whether the combined effect of

6th EWRS Workshop on Physical and Cultural Weed Control 219 Lillehammer, Norway, 8-10 March 2004
treatments involving multiple weedings would be of interest. An open question still is: how many days does it take for weeds and crops to recover? To distinguish between the effectiveness on white threads and emerged weeds, and to account for new weed emergence, permanent quadrats that are (accurately) hand weeded just before treatment can be included on treated and untreated plots. All permanent quadrats (both weeded and not weeded) are counted just before the subsequent treatment. Weed counts from previously weeded quadrats indicate new emergence, that can be used to correct counts from non-weeded quadrats. Spatial heterogeneity and quadrat size are important considerations in quadrat layout within the plots. Collecting, washing and weighing plants from the previously weeded quadrats provides information on cultivation timeliness. Principally, it is possible to assess growth reduction of surviving weeds. However, spatial variability and low weed densities limit the achievable precision considerably.
2.5 Analysis
For any designed experiment, it will usually be sensible to use analysis of variance to provide an initial analysis of the data. For a well-designed experiment this should be simple in most statistical packages. Some measured variables will require transformation prior to analysis – counts often require a square-root transformation, proportion based on counts require an arcsine transformation, and weights can require a log transformation. An alternative approach for counts and proportions based on counts is to use a generalised linear model (GLM) analysis assuming a Poisson or binomial distribution, respectively.
Another area of concern is the transformation of responses to a percentage of the weedy check. It is important to analyse data in such a way that the plot-to-plot variability in these treatments is included, and not to convert data to percentages prior to analysis. If required it is relatively easy to convert the treatment means produced by an analysis to percentages of the weedy check, with the added advantage of having an SED to assess whether the difference is important. Converting the data prior to analysis will deflate the residual mean square, resulting in differences appearing more significant than they should be.
If all treatment factors are qualitative, then the analysis of variance may be all that is needed. Paying careful attention to the treatment structure can help in the interpretation of the response, and it may be helpful to partition treatment sums of squares into single degree-of-freedom contrasts to address specific questions or comparisons. Where control or standards have been included it will often be most appropriate to compare all the other treatments with these, rather than with each other. Where a factorial treatment structure has been used, then use this structure to interpret the results, first considering the main effects, then two-factor interactions (where these are large compared with the main effects), and so on.
Where treatments are quantitative some form of regression analysis may be appropriate. Both linear and non-linear regression approaches may be useful. Linear (polynomial) regression is limited to providing a simple description of the shape of the response. The choice of an appropriate non-linear response function (based on previous experience or plotting of the data) will allow a more detailed interpretation of the response. Even more complex models could be developed based on knowledge of the mechanisms involved. Where both qualitative and quantitative factors are included, a parallel regression approach will be appropriate, allowing parameters of the regression models to vary with the different levels of the qualitative factors.
Of course efficacy of weed control may not be the only measure of interest. It may be important to assess the effects of treatments on the crop (harvest yield or assessments during crop growth), soil structure, N-mineralisation, etc., or to assess the cost of applying the treatment in terms of energy or time required per unit area. Often there will be multiple responses of interest, and some form of multivariate analysis might be appropriate, or a combined measure of treatment effect might be calculated. Multivariate analysis of variance can be used to assess for treatment effects in the same way as univariate ANOVA, though it is often difficult to interpret the effects. Most other

6th EWRS Workshop on Physical and Cultural Weed Control 220 Lillehammer, Norway, 8-10 March 2004
methods (e.g. principal component analysis or cluster analysis) are purely descriptive, though discriminant analysis can be used to identify the variables that contribute most to differences between treatments.
Presentation of the results of any experiment should include a full description of:
• the experimental design, including the type of design used, replication level, treatment structure, and level of each treatment factor,
• the measurements taken, including any calculations or transformations performed prior to analysis,
• the methods of analysis used, including references where the method is not standard, and indicating any important assumptions made. Where treatment means are presented, these should always be accompanied by standard errors
of differences (SEDs) or LSDs (usually more appropriate than standard errors of means, as we are interested in comparing treatments). Where regression analyses are used, a graphical display of the observed data and fitted lines is usually valuable, along with details of parameter values (and their standard errors). Where SEDs, LSDs or standard errors are presented, the residual degrees of freedom on which they are based (and significance levels for LSDs) should also be presented. However, the required practice in reporting statistics may vary between journals.
2.6 Describing the experiment 2.6.1 Site and experimental conditions
A basic thing in reporting is to tell when and where the experiment was conducted. Describe the following weather conditions in open field, both during the treatment and during
the whole experiment: temperature (also max and min), quantity of water (rain or irrigation). In controlled conditions describe all the climate parameters that is possible to measure. Record the time of the day when the treatments were done (relevant for soil moisture and plant turgidity). In many cases it is relevant to describe whether there was dew or other moisture on weeds and crop plants, as well as the velocity and direction of wind (e.g. in relation to burners in flame weeding).
Soil type (Anonymous, undated a), moisture and fertility may considerably affect the plant condition, effect of treatments and survival of weeds and crops. Therefore it is essential to record at least the soil type, soil moisture (see e.g. Klocke & Fischbach, 1998), condition of the surface (roughness, unevenness) and amount of (soluble) nitrogen given in fertilization. To be more specific, the authors may describe soil physical and mechanical characteristics: texture, classification (ISSS or USDA), Atterberg limits, soil water content, dry bulk density, cone resistance, and others characteristics (see Anonymous, 2001) that they consider useful to describe their trial. This soil characterization is particularly useful for experiments that involve the interaction of implements with the soil. Some of them – soil water content, dry bulk density, cone resistance – should be assessed immediately prior to the treatments.
2.6.2 Machines and adjustments
The first step should be to identify the manufacturer of the equipment used and the model number or name. Also, the year of manufacture should be included if known because some models are modified or stop being manufactured after some time. The overall dimensions of the equipment and the modifications made to it should be also reported. A small multi-language glossary of cultivators and other implements that are used in physical weed control is available at the web site of EWRS Working Group Physical and Cultural Weed Control (Anonymous, undated b).
The proper adjustment of a tool is often more important than the choice of tool. Therefore it is of little information just to mention that you used this or that tool without saying anything of the

6th EWRS Workshop on Physical and Cultural Weed Control 221 Lillehammer, Norway, 8-10 March 2004
adjustment and way of working. It is like saying I used a Hardi sprayer, and tell nothing about the herbicide, dose or spray volume.
Where there are no standard methods to describe the adjustments and mode of action (please find more specific information in section 3 and 4), at least try to describe the work the tool did, including all parameters that could be of relevance (e.g. driving speed, working depth, tine angle, distance to the row). Factors that do not affect weeding effectiveness or crop growth per se might also be of interest (to others, later), such as the effective, accessory and operative time (to calculate working capacity, fuel consumption per hectare and hour), the drawbar pull or p.t.o. torque and rpm. Using parameters such as useful power and wheel slip of the tractor is not recommended as they depend on other factors as well (e.g. tractor weight, tire size and inflation pressure, engine and transmission efficiency) and therefore may not be representative. Also direct energy or/and total input can be useful when different weed control techniques are confronted (with different machines, fertilization, etc.).
2.6.3 Weeds and crops
When describing the weeds and crops, one should list the crops or/and the (most abundantly present) weed species involved (identify them using Latin names and report the names of the cultivars used along with the crop names) and the cultural practises. For weeds (and preferably for crops, too) their density and growth stages at the time of treatment should be given. The BBCH scale (Meier 1997) is a good reference point for people to be talking uniformly about the same growth stage of a weed or a crop. Any abnormalities (like plant diseases) should be recorded. 3 Thermal weed control
In thermal weed control, weeds are heated in order to kill them or at least reduce their
competitive ability. There are three main categories which determine the result: technological, biological and environmental factors. Technological factors are e.g. heat transfering medium (flame, hot water, steam, e.g.) the fuel, properties and adjustments of the equipment, driving speed and the uniformity of the heat transfer rate across the working width. Biological factors include: plant species, developmental stage, plant density etc. Plant species and developmental stage determine the location of sensitive parts of the plant and how well they are protected. Environmental factors such as wind, rain, dew, cloddishness of soil may affect burner function, heat transfer etc. These factors should be recorded and their effect on the experimental results considered. Each of them may be a subject of research.
A necessary prerequisite for the development of experimental designs or the interpretation of experimental results is the knowledge about the thermodynamic principles. To kill off a plant it is necessary to heat up the essential parts up to a lethal temperature. The essential part of a plant is depending on plant kind and growing stage (Bertram, 1993, 1996, 1997, 2001, 2002a).
The task of the weeder is to transfer the necessary energy to the surface of the plant. The heat transfer to the plant surface can take place by convection, radiation, condensation or by conduction (Fig. 3). For this purpose, different technical solutions (flame, hot water, steam, heat radiation) had been developed. Within the plant tissue, the heat transfer takes place only by conduction. In general, the heat transfer rate from the plant surface to the inner parts by conduction is very low compared with the heat transfer rate to the plant surface. This means that all plant parts (leave, stem, vegetative point) must be heated for a sufficient period of time.
The paper focus on flame weeding. For evaluating other or comparing different types of thermal weeders the presented hints and research methods can be also very useful.

6th EWRS Workshop on Physical and Cultural Weed Control 222 Lillehammer, Norway, 8-10 March 2004
heat sensitiveessential point close to the surface
heat tolerantessential well protected fromplant tissue.
conduction
Convection (gas flow)radiation (surface, gas body)condensation (steam)conduction (water, foam)
transpirationradiation
Figure 3. Heat transfer mechanism in thermal weed control and model of a heat tolerant and a heat
sensitive plant (Bertram 1996, 1997, 2001, 2002a). 3.1 Experimental set-up
Applied field research aiming at evaluating proper strategies for weed control should be performed in real life in fields with real crops and weeds. However, when the aim is to compare e.g. two flamers or to evaluate the optimal adjustments of a flamer, there are clear advantages of using standardised test methods using homogenous stands with test plants of e.g. Sinapis alba (see e.g. Ascard, 1994, 1997, 1998). It is important to keep in mind that the plants still have to be treated in the right stage, e.g. the optimal settings and dose needed for relative large test plants (2–4 leaves) are not the same as for treating susceptible weeds in the cotyledon stage.
In flame weeding research, the flame treatments are often compared at a few pre-set intensity levels, often quantified by e.g. the travel speed or the fuel pressure. When the effects of such treatments are compared by analysis of variance, a qualitative assessment is performed to see whether one treatment is significantly different from the other. This kind of qualitative assessment is, however, often not relevant when treatments are compared with highly different energy inputs.
The most suitable way of quantifying the lethal dose is choosing a dose-response (or speed-response) experimental set-up. In herbicide research this kind of bioassay has been developed and widely used by Streibig et al. (1993). Dose-response and speed response models for flame weeding have been developed by Ascard (1994, 1995, 1997, 1998) and also used by e.g. Bertram (1996, 2002b) and Hansson & Ascard (2002). The main advantage of this quantitative approach is that comparisons between machines and adjustments can be made at a fixed effectiveness level (e.g. 50% or 95% biomass reduction). As it is difficult to accurately estimate the final effect from visual assessments directly after treatment, dose-response experiments provide more accurate values of the lethal dose.
Generally five speeds in the range 10–90% weed reduction (plus an untreated control, and a very high dose giving maximum reduction), are necessary to establish a complete dose-response or speed response curve, which adjacent speeds differing a factor 1.3–1.7 (e.g. 1.0, 1.5, 2.25, … km/h). The smaller the factor, the more accurate effective doses can be estimated. If weeds are likely to
6th EWRS Workshop on Physical and Cultural Weed Control 223 Lillehammer, Norway, 8-10 March 2004
recover (e.g. grasses), including a very high dose (>500 kg LPG/ha) and manually clipping at the soil surface at treatment provide useful reference plots.
To set the speed range, operate the machines outside the plots at various speeds. The lowest speed should certainly kill all plants, whereas the highest speed should yield a growth reduction of less than 40% (Fig. 4). It is recommendable to calibrate tractor speeds at different gears at 2000 engine rpm in advance, so that adequate gears and engine speeds can be selected after the desired speed range is defined (palmtop computer is handy here). If machines have a variable transmission, record the speeds on all plots.
Figure 4. Direct effects of flaming at the early 2-leaf stage (top) and the late 4-leaf stage (bottom)
of Sinapis alba. Untreated (left), lethal damage (middle) and mild growth reduction (right) (photos: D. Kurstjens).
3.2 How to perform the treatments As compaction can induce large variability within the population and across the experimental
field (also with Sinapis alba), wheel tracks created by seedbed preparation, sowing and treatments should preferably be matched and excessive rolling prevented. For Sinapis alba, a sowing density of about 15 kg/ha in rows spaced 10 cm and a plant density of about 250 plants per m² is common. It is recommendable to plan 25–40% extra space to be able to leave out irregular plots and provide space for adjusting implement speed. 3.3 Describing the equipment and adjustments
There are few standard burners today. Therefore you have to describe as carefully as possible, the brand of the burner, any serial number or model, the nozzle size, number of nozzles per m burner width, the fuel (e.g. propane), gas phase or liquid phase burner, flame temperature or the gas:air ratio, the place where gas and air are mixed, natural or forced air supply, etc. Any burner cover should be described, e.g. the length and the height in the forward and rear end. Also measure the width and height of the open area at the front side of the flamer, through which cold air enters under the cover. A picture/drawing often says more than thousand words, and a measuring scale can then replace a lot of figures. Please also describe the flame length and the height of the burner above ground, and the angle, and specify which angle you mean (Fig. 5).

6th EWRS Workshop on Physical and Cultural Weed Control 224 Lillehammer, Norway, 8-10 March 2004
Figure 5. The angle of burner in relation to driving direction should be recorded, as well as the
height of the lower part of the burner above ground. The angle may be given relative to the horizontal ground (downward directed burner would be 90°) as in the picture, or relative to the vertical (downward directed burner would be 0°), but this should be stated clearly (Vanhala, unpublished).
Very useful information is the LPG consumption in kg h-1. If several burners are mounted on a
flamer, please give also the burner power in kg h-1 per metre working width, since this measure is very valuable in comparing the burner power of different flamers and also in calculating the gas consumption per hectare. See examples in Ascard (1994, 1995, 1997, 1998), Peruzzi et al. (2000) and Raffaelli et al. (2002). The LPG (propane) consumption MUST be determined by the researcher in separate repeated tests, by weighing of propane tanks before and after each test, with the actual flamer unit. Never trust gas consumption given by the company. Never just calculate the consumption using a formula with nozzle size and gas pressure. The difference in reality may by surprising. Nor can you count on gas pressure values given by a non-calibrated manometer (pressure gauge).
If the experiment compares different flaming intensities, state if the LPG dose was regulated by the driving speed, the gas pressure or both. Give the dose in kg LPG ha-1 treated area. This means that if you are doing banded treatment in 10 cm strips in the rows using a dose of 50 kg ha-1 per treated area, and the row spacing is 50 cm, then the gas consumption is 10 kg ha-1 per cultivated area. The energy input can also be given in e.g. MJ ha-1, but please then state the conversion factor used. The intensity can also be described by giving the driving speed, but remember always stating the dose also in kg ha-1, since the driving speed itself is not relevant if you use flamers with different energy input.
3.4 Assessing plant response
3.4.1 What to assess?
Temperature measurements with a defined measuring body can be helpful for a rough estimation of a system. But the proposed measuring body is not a plant model. For killing off a given plant (species, growing stage) it is necessary to measure the necessary amount of energy which has to be transferred. Only the speed/dose response relationship is suitable for this purpose.
Common response parameters are plant density and the oven-dry plant weight per square metre. The fresh weight is a less reliable parameter, as water content depends on growth stage and

6th EWRS Workshop on Physical and Cultural Weed Control 225 Lillehammer, Norway, 8-10 March 2004
environmental conditions. If it rains between treatment and clipping, considerable amounts of soil can splash onto the plants. After rinsing off the soil, drying to constant weight at 65°C should be done rapidly to prevent rotting, using a ventilated oven and preventing compression of plant material. Try to prevent slow drying when the material is too massive or compressed. The material could be turned around within pots, quickly pre-dried in direct sunlight in a ventilated space, or placed in a very thoroughly ventilated stove. Harvest at least 40 plants (if present) from each of two random but representative locations within a plot, recording the number of plants and the harvested area (minimum 0.25 m² each, up to 10 m² in highly effective treatments). If surviving plants contain a significant amount of dry dead material, it is possible to derive the alive dry mass from the fresh weight and the dry matter content of undamaged plants and plant material according to the following formula:
ADW=(MFW*DMD*DMU-MDW*DMU)/(DMD-DMU) where
MFW= net measured fresh plant weight MDW= net measured dry plant weight DDW= net dry weight of dead material in MDW ADW= net dry weight of alive material in MDW DMD= dry matter content of dead material (=net dry weight / net fresh weight) DMU= dry matter content of untreated plants (=net dry weight / net fresh weight) Assessing plant density and plant weight at the time of treatment is not common. However, it is
very helpful in comparing between experiments (e.g. the dose required to reduce dry plant mass after 14 days to the same level that the mass was at treatment time).
If experiments are conducted on weeds that have a high probability of recovery (e.g. grasses), the effect can be assessed by clipping at least two times 1.5 m rows on fields plots, or by visual assessment (both on fields plots and paved area). Defining a common and clear assessment scale (e.g. Table 2), training the assessors before judging the treatments by at least two persons independently, and withholding information on the treatments applied from the assessors enables reliable classification.
3.4.2 Time of assessments
The time of assessment depends on the purpose of the treatment. When flame treatment is carried out pre-emergence of the crop, the aim is to reach a complete kill of young weed seedlings. Then the counting of weeds that survived is relevant soon after the wilting of treated weeds, when it is clear if the treated weeds will survive or not.
When you flame the weeds pre-emergence of the crop, and then count the weeds some time afterwards, you will have a mixture of treated weeds that emerged before the treatment and newly emerged weeds that emerged after the treatment. This means that even if the flame treatment gave 100% control of emerged weeds, a weed count some weeks later may indicate that the weed reduction was much less (Fig. 2). The longer you wait, the lower the final weed reduction will be. In applied research the most relevant time for assessment is just before hand weeding, which is the measure relevant for the grower who has to hand weed the remaining weeds.
However, if you want to estimate the optimal dose for achieving near 100% control of emerged weeds, you will have to count the weeds both before and after the treatment. Do not wait until all weeds have emerged because then many weeds have grown beyond the cotyledon stage, when the treatment is normally done (or at least should be done), and then you will need a greater energy input.

6th EWRS Workshop on Physical and Cultural Weed Control 226 Lillehammer, Norway, 8-10 March 2004
Assessing the effect of flame weeding should be performed when the treated plants and leaves have wilted and it is clear if a plant will survive or not. In the field, this may take from a 3–4 days up to 1–2 weeks depending on the conditions. One way is to wait until surviving plants show a little regrowth. If you treat weeds with protected growth points or perennial weeds that will always survive and regrow after treatment, weed counts only is less valuable, and you then have to estimate the weed cover or weed weight.
If you are doing repeated flame treatments on e.g. weeds in urban areas or in orchards, one relevant question is how many treatments per year are required to obtain a desired control level. If so, one has to decide a certain weed stage when the next treatment should be done. If weeds recover, estimating the number of days required for the original weed infestation level to recover seems more relevant than estimating the growth reduction at a certain time per se. In this case a rough guideline for the time between treatment and assessment is 14 days, but this may vary considerably depending on geographical location and weather conditions etc. As plant surface should be dry at harvest, such a guideline would only be approximate. To assess the recovery time, multiple assessments should be done from one week after treatment onwards in weekly intervals. 3.4.3 Temperature measurements
Temperature measurements using thermocouples are of little use for evaluation of flame weeding, if not complemented with evaluations on weeds in relevant stages and growing conditions. The fundamental problem of using thermocouples to predict the weed control of a thermal treatment is that weed control depends on the effected temperature in the plant tissue and not on the temperature of the flowing medium. For example, steam or steam/air mixtures are effective at a lower temperature because the heat transfer takes place mainly by condensation (Bertram, 2001).
1 thermocouple (K, 0.25 mm)
2 measuring point
3 measuring body ( aluminium )
4 plain board
1
2
3
4
Figure 6. Standardized measuring body for evaluating heat transfer in thermal weed control
(Bertram 1996, 2001).
The temperature increase of a bare thermocouple and a given thermal treatment depends additionally on the size of the thermocouple. The reaction time of thin thermocouples is faster than the reaction time of thick thermocouples. For a good temperature measurement, it is necessary that the measuring point of the thermocouple quickly reaches the temperature of the evaluated medium. For evaluating the heat transfer rate, it is necessary to do the opposite. A measuring body, which

6th EWRS Workshop on Physical and Cultural Weed Control 227 Lillehammer, Norway, 8-10 March 2004
covers the thermocouple, reduces the temperature increase during the thermal treatment (Fig. 6) (Bertram, 1996, 1997, 2001, 2002a). The proposed measuring body leads to a temperature increase for a successful weed control of small plants (pre emergence flaming) of around 20–60 K and a transferred energy of 3.7 J – 11.2 J. From the thermodynamic point of view there is a need for the standardization of size, material and location (height over ground) of the measuring body (Bertram, 1996, 2001, 2002).
If temperature measurements are used they must be performed on dynamic flamers, not on stationary flamers. The choice of thermocouple highly influence the response and maximum temperature obtained, as shown by Ascard (1997: fig. 9). Therefore the type of thermocouple, the size of the wire and the welded conjunction point should be given, in order to be able to evaluate and repeat the experiments. Alternatively, one could derive the environment temperature by measuring the step response of individual thermocouples (using a lighter, Fig. 7) and correct the recorded curves for the slow sensor response. There is usually a sigmoidal relationship between the recorded maximum temperature obtained from dynamic flamers in the laboratory, and the weed reduction in the field. This means that above a certain temperature there is a little increase in weed control (Ascard, 1997, 1998). There was a high correlation between temperature and weed reduction mainly in the sublethal flame treatments (say 20–80% weed reduction), that were of minor relevance for practical use.
Fire Only
0
200
400
600
800
1000
1200
0 1 2 3 4 5 6 7 8 9 10 11 12
Time [sec]
Tem
pera
ture
[C]
Figure 7. Measured temperature in the flame of a lighter, using a type K 0.127 mm chromel-alumel
thermocouple with exposed junction (Omega Engineering, SPCH Chromel 0.005 inch chrome/nickel, SPAL-005 Alumel 0.005 inch Aluminium/nickel) (Dedousis, 2003).
The uniformity of the heat transfer across the working width and along the treated area is an
important factor on the speed/dose response relationship. This uniformity is influenced by the weeder, the soil surface and the wind. Temperature measurements with measuring bodies can help in evaluating this influence on the results. For this task, temperature measurements are a smart method to get important information of the evaluated system without being labour-intensive (Bertram, 1996, 2002a).

6th EWRS Workshop on Physical and Cultural Weed Control 228 Lillehammer, Norway, 8-10 March 2004
4 Mechanical weeding – weed harrowing and intra-row cultivation 4.1 Introduction
Weeds can be controlled mechanically by a large variety of implements that cultivate on the crop row or on narrow strips close to the crop rows (intra-row weeders, e.g. finger weeders, torsion weeders, pressurised air, or powered vertical brushes), strips between crop rows (inter-row cultivation by e.g. steerage hoes, powered horizontal brushes, or S- or C-shanks with sweeps) or both (e.g. weed harrowing or rotary hoeing). Inter-row weeding is usually very effective and assessments are quite straightforward. The main challenge to both practical farmers and research is the selective control of weeds within the crop rows.
As there are limited possibilities to control weeds once they have escaped control (i.e. by herbicides or hand weeding), interactions between subsequent cultivations, interactions between cultivations and weather-, soil-, and species-related weed emergence flushes, and crop-weed interactions are very important. Pre-emergence harrowing is carried out after drilling but before crop emergence. The aim is to kill the first flush of emerging weeds and to give the crop an early advantage over the weeds. This may aid selectivity of subsequent weeding operations. The effect of pre-emergence harrowing is highly influenced by factors that affect weed and crop emergence. Post-emergence harrowing is carried out in early crop growth stages. The effect is mainly influenced by soil and weather conditions, weed species, and size characteristics of weeds and crops. Weed harrowing in late growth stages is occasionally called selective harrowing and may perform the functions of an inter-row cultivator if the crop has dense rows and clear size advantages over the weeds (Rasmussen & Svenningsen, 1995).
As weeds are highly sensitive in early growth stages, both pre- and post-emergence control efficacy are very time sensitive. Untimely weeding may cause the largest weeds to escape control. Particularly weeds that germinate early in the period between crop emergence (or earlier in the case of small-seeded shallowly-drilled crops) and the moment when the crop tolerates gentle cultivation may be difficult to control with the level of weeding aggressiveness tolerated by the crop. Thus, improving weeder selectivity, optimising cultivation aggressiveness and integration with other tactics that control these weeds (e.g. flaming at crop emergence), reduce or delay weed emergence (e.g. stale seedbeds, allelochemicals from compost and green manure, punch planting), or shorten or shift this critical period (e.g. transplanting, delayed drilling) are major research items. Before the crop becomes sensitive to pre-emergence weeding and after the crop rows are sufficiently dense and tall to withstand selective weeding, maximising weed control and increasing the size of weeds that can still be controlled by intensive disturbance and displacement of a preferably shallow topsoil layer is the main research objective.
4.2 Objectives and approaches
Depending on the research objectives, several experimental designs, measurement methods and approaches have been used. These objectives can be classified according to the sections below.
4.2.1 Comparing implement selectivity
Comparing different implements with respect to their selectivity and achievable range of aggressiveness in various crop and soil conditions contributes to optimising adjustments of single operations and selecting and innovating implements. To assist differences in selectivity, implements should be compared at the same level of weed control (this assessing differences in crop damage) or at the same level of crop damage (this assessing differences in weed control). As it is difficult to achieve this by repeatedly adjusting weeder performance (e.g. by working depth, driving speed, the number of passes or tine angle adjustment), quantitative approaches should be adopted in which each implement is operated at different levels of crop damage and associated weed control. The target range of aggressiveness is between 1% crop damage (gentle action) and 99% weed control

6th EWRS Workshop on Physical and Cultural Weed Control 229 Lillehammer, Norway, 8-10 March 2004
(aggressive action)(Fig. 8). If crop damage equals 0%, a more aggressive action would increase weed control but might not necessarily cause more crop damage. Thus, unless adjustments reflect the maximum achievable aggressiveness under the present situation, their optimality cannot be judged. The same holds for the situation where 100% weed control is achieved, because crop damage might be reduced without compromising weed control. Assessing the relationship between weed control and crop damage over the full range of achievable aggressiveness is important to acquire information on the size of weeds that can still be controlled and the earliest crop growth stages allowing cultivation.
achievable aggressiveness
min max
Crop damage
Weed control
Wa0% 100%W1
0% Ca C1
W2 W3
relevant range
optimum window Figure 8. Hypothetical levels of weed control (top bar) and crop damage (lower bar) as related to
weeding agressiveness (left = gentle, right = aggressive). Ca is the maximum acceptable crop damage, Wa the minimum acceptable weed control. W1, W2, W3 and C1, C3 represent the hypothetical weed and crop damage observed at various steps in the adjustment optimisation procedure (see text)(adapted from Kurstjens 1999).
Quantitative approaches are particularly important if weed and/or crop damage cannot be
reliably assessed during treatment, or if the relevant parameters can only be assessed after a while, when damaged plants have either recovered or are killed. Rasmussen (1990; 1992) introduced a selectivity concept based on the relationship between weed control and crop soil cover, where weed control was assessed by density reduction 4–8 days after treatment and crop soil cover was assessed as the degree of soil covering of the crop immediately after harrowing. Although, this definition of selectivity only reflects the initial crop and weed responses and does not account for weed and crop recovery or further weed germination after harrowing, Rasmussen’s work showed that selectivity always declines at increased levels of weed control. The same applies to intra-row weeders.
Analysing progressive series of cultivation aggressiveness by regression models (for relationships between weed control and crop damage or aggressiveness-response curves for single species) is valid if single cultivations are compared at identical conditions. As these empirical relationships are specific for the weed, crop and soil conditions present, an alternative modelling approach is being developed to distinguish between the selective ability of the weeder and the potential selectivity that can theoretically be achieved in specific crop-weed situations (Kurstjens et al., 2004). Deriving the potential selectivity from crop and weed characteristics (e.g. anchorage force, plant height, plant flexibility) is required to adequately separate the effects of crop and weed size, soil conditions and implement adjustments. The dimensionless selectivity parameters for the crop-weed situation and the weeder-soil combination are intended to be independent of cultivation aggressiveness. If models simulating weed emergence and early growth could predict the crop-weed selectivity parameter, this approach could be used to optimise weed management scenarios (e.g. minimising weather dependence) and predict optimum timings and aggressiveness of consecutive weeding operations.

6th EWRS Workshop on Physical and Cultural Weed Control 230 Lillehammer, Norway, 8-10 March 2004
4.2.2 Comparing methods by single cultivations In experiments without different levels of aggressiveness, each method (or weeder) should be
used in an optimal way to adequately reflect their true potential. However, basic questions are: “what adjustment is optimal for the situation?” and “how can we achieve it?”. This applies to experiments that compare different weeding methods (e.g. harrowing, hoeing and flaming), assess crop tolerance and weed control at various growth stages, or other experiments in which weeders are used at one single adjustment. In such experiments, it is important to describe when and how implements have been used and the assumption behind the treatments. Based on Fig. 8, a procedure to arrive at the optimum weeder aggressiveness can be devised (Kurstjens, 1999):
1. Use the most aggressive adjustment and assess the associated weed control W1 and crop
damage C1. If crop damage equals 1% or less, the adjustment is optimal. However, if W1 < Wa (the minimum acceptable weed control level), the treatment is not efficient and should be reconsidered. Else, proceed to step 2.
2. Adjust the implement more gently, to achieve a crop damage level that can just be compensated (i.e. the most aggressive action that still causes no crop damage), and assess the associated weed control W2. If crop damage exceeds the acceptable level Ca, the cultivation should be postponed until the crop is less sensitive. If weed control equals 99% or more, or if the objective is to assess the achievable level of weed control without (expected!) crop damage, this is the optimum adjustment. To be able to check whether this adjustment causes no crop damage later on, describe the situation or take a picture. Else, proceed to step 3.
3. Increase weeder aggressiveness to achieve the maximum acceptable crop damage Ca and record the level of weed control W3. If W3 equals 99% or more, reduce the aggressiveness again to achieve just 99% weed control with minimum crop damage. Then record crop damage C3. If the objective is to minimize the number of cultivations and assess the crop damage associated to maximum weed control, this is the optimum adjustment. Else, proceed to step 4 to further reduce crop damage.
4. Choose an aggressiveness between the level at step 2 and 3. The window within which the compromise between weed control and crop damage is defined by (0, W2) on the “gentle” side and (W3, C3) on the “aggressive” side. Within this window, the economic optimum is at the aggressiveness where the expected incremental crop yield decrease (by increasing crop damage) equals the incremental decrease of additional weed control costs. Although this optimum can be calculated from the relationship between weed density and hand weeding costs, cultivation costs, and the relationship between crop damage and financial yield, the concepts developed by Kurstjens (1999) still need to be further elaborated and tested.
Understanding of the damaging mechanisms and qualitatively assessing the specific weaknesses of weeds and strengths of the crop (Fig. 9) could help in optimising weeder adjustments. Measuring crop and weed characteristics such as plant anchorage force, height and flexibility, could be helpful to characterise their susceptibility and predict the shape of relationships between weed control and crop damage (Kurstjens et al., 2004), but is not practical for optimising implement adjustments in field experiments.

6th EWRS Workshop on Physical and Cultural Weed Control 231 Lillehammer, Norway, 8-10 March 2004
Crop and weed susceptibility weed no difference cropcharacteristicTall plant XDifficult to bend downward XStrong anchorage in topsoil XStrong anchorage in deeper layer X…
Relative advantage
Figure 9. Assessment schedule for weed and crop characteristics that determine their relative
sensitivity to mechanical damage, with scores for an imaginary crop-weed combination (Kurstjens 2002).
4.2.3 Fundamental research When several types of equipments are evaluated, e.g. torsion weeder, versus finger weeder, the
selectivity of the tools are relevant to evaluate, not the weed control effect itself, or the crop damage itself. Some type of intensity-response curves are useful here. In any case the tools have to be compared at similar cultivation intensity, in regards to e.g. crop damage, or else one may reach irrelevant conclusion such as one tool is more gentle towards the crop than the other, which is simply because it was used on a lower intensity also resulting in lower weed control. Weed harrowing before and after crop emergence is used in cereals and some broad-leaved crops to control weed seedlings. Weed harrows and rotary hoes have similar effects on weeds and crops in early growth stages.
Weed harrowing is normally performed with harrows with flexible spring-loaded tines. Chain
harrows and other rigid tine harrows are rare in present-day experiments. The intensity of treatment (aggressiveness) is adjusted by driving speed, angle of penetration of
the tines and number of passes. Different brands of weed harrows hold different possibilities to adjust the intensity.
Weed harrows bury and uproot small weed seedlings under loose soil conditions. Weeds in late growth stages are to some extent torn. Crop injuries are often associated with weed harrowing, which limits the possibilities to obtain high degrees of weed control without associated crop damages. Selectivity is acknowledged as a key parameter in weed harrowing.
Main challenges The main challenges in experiments with post-emergence weed harrowing is that
• there is no unambiguous method to describe the intensity of treatment • treatments should be optimised to the combined effects on weeds and crop (low
selectivity) • plant recovery processes after harrowing make crop and weed responses time dependent • there are no objective real-time methods to assess crop damage
Treatments The following objectives may influence the experimental designs and approaches:
• to acquire knowledge about basic mechanism in mode of operation • to optimise treatment at single or multiple growth stages • to compare different implements • to compare different methods

6th EWRS Workshop on Physical and Cultural Weed Control 232 Lillehammer, Norway, 8-10 March 2004
Mode of operation
• Guidelines are not recommended Detailed studies of the basic mechanisms of the mode of operation should be well adapted to
the given objective. Studies may be conducted in laboratories with special equipment (Kurstjens et al., 2000) or in fields where simple hypotheses about the mode of operation are tested with crop plants as artificial weeds (Rasmussen, 1991). There is no sense in developing guidelines for such studies as they are highly specialized.
The optimum treatment in fields
• Use graded levels of treatments • Adjust intensity of treatment by increasing driving speeds, number of passes and/or
angle of tines • Describe intensity of treatment in terms of attempted target response and in terms of
applied equipment and adjustments • Use weed as well as crop responses
When crop damage is associated with weed harrowing, the optimum treatment is reflected in
the combined effects on crop and weeds. Both responses should be considered when treatments are planned and conducted. If possible, graded levels of experimental treatments should be carried out and crop and weed responses analysed by analysis of regression (linear or non-linear).
The intensity of treatment may be varied by increasing driving speed in the range of 2 km h-1 to about 12 km h-1. High driving speeds require that the surface is completely plane, otherwise there will be significant treatment variation. Rasmussen (1992) used a range of driving speeds to vary intensity.
The angle of penetration of the tines is important to the intensity. Lowering the angle (high negative value according to Fig. 10) decreases the intensity of treatment and positive angles represent very aggressive treatments. Positive angles may result in unstable movements of the harrow, which should be avoided. Böhrnsen (1993) used tine angle to vary intensity.
Increasing number of passes per cultivation time increases the intensity of treatment. This is probably the most common way to increase the intensity in experiments where graded levels of intensities are used. Rasmussen (1993) used number of passes to vary intensity.
Harrowing parallel to the crop rows normally gives a more uniform treatment than harrowing across the rows. Harrowing across may, however, increase the intensity of treatment. Rydberg (1994) used direction to vary intensity.

6th EWRS Workshop on Physical and Cultural Weed Control 233 Lillehammer, Norway, 8-10 March 2004
+ -
β
Figure 10. Shape and possible adjustments of the tines of the spring-tine harrow. The arrow
indicates the driving direction. The tine adjustments range from – 45° up to + 15° where values represent the angle b between the upper part of the tine and the perpendicular to the soil surface (Peruzzi et al., 1993).
4.2.4 Comparing implements • Comparing different implements ability to control weeds without damaging the crop
requires that implements are compared at the same level of weed control Not only selectivity comparison is important. A good weed harrow is a harrow that fits to a
given purpose. For example, if flexibility is a key issue, because the harrow should be applicable on different soil types and in different crops, flexibility should be the experimental main focus. If depth adjustment is a key issue, because the harrow should be applicable in small seeded crops like seeded onions and carrots, depth adjustments and depth stability should be the experimental focus. In arable crops capacity (ha h-1) and homogeneity of treatment intensity are key issues.
4.3 Describing the intensity, equipment and adjustments
As outlined above, the intensity of weed harrowing treatment may be adjusted in several ways. Technical descriptions of treatments (speed, angle (Fig. 10), number of passes and direction) are often considered as an absolute necessity in the research process. However, in weed harrowing research, technical descriptions may be of secondary importance to the impacts on crop and weeds. This means that a description of attempted target responses on the crop-weed systems may provide more valuable information than a description of technical adjustments of an implement. For example, the intensity of treatment might be adjusted to create visual damages on the crop plants in the range of 5 to 50%. The description of technical adjustments only provides little information about the intensity because there exist significant and complex interactions between implement adjustments, soil and crop-weed responses. For example, a given driving speed gives totally unpredictable weed control effects in different environments.
This leads to two important points: (1) the intended intensity of treatment should be clearly expressed in terms of immediate crop-weed responses and (2) the reasoning for choosing the intensities should be outlined (for example by the procedure in 4.2.2).
If the objective of the experiment is to reveal relationships between technical adjustments and the crop-weed responses, technical descriptions are important.

6th EWRS Workshop on Physical and Cultural Weed Control 234 Lillehammer, Norway, 8-10 March 2004
As there is a wide range of different equipment for intra-row cultivation, the implement description varies from case to case. See examples of descriptions and pictures in Fig. 11, and in e.g. Ascard & Bellinder (1996) and Hallefält, Ascard & Olsson (1998).
A B C
Figure 11. Possible adjustments of tools for intra-row weeding: (A) torsion weeder operated with the tines crossed; (B) torsion weeder; (C) vibrating teeth (Peruzzi et al., 2003).
4.4 Assessing plant response 4.4.1 Tolerance experiments
To evaluate the general prospects of successful post-emergence weed harrowing, information on at least two crop aspects is important; the ability of the crop to resist soil covering and other damages (the initial effect and the recovery effect). Both aspects relate to selectivity. Soil covering relates to the harrowing process and tolerance relate to the plant recovery process after harrowing.
Initial crop effects may be assessed in different ways. Leblanc and Cloutier (2001a; 2001b) used density reductions and Jensen et al. (2004) used crop soil cover. Crop soil cover seems to be better correlated with crop yield response than density reductions in experiments with weed harrowing (Jensen et al., 2004), but current disadvantages by using crop soil cover assessment in scientific work has to be overcome before this assessment is generally adopted.
If the objective is to make relative comparisons among crops or cultivars, crop yield response to harrowing in weed-free environments may give valuable information.
4.4.2 Crop soil cover
One advantage of using crop soil cover as a measure of the initial crop damage in experiments with weed harrowing is that the information is accessible at the time of harrowing and therefore may be used in real-time adjustments. Crop density is more labour-intensive to assess and it may be practically impossible to assess immediately after harrowing if crop plants are covered. However, it

6th EWRS Workshop on Physical and Cultural Weed Control 235 Lillehammer, Norway, 8-10 March 2004
is less likely to be biased. This problem is particularly pronounced if different individuals assess soil cover and if absolute values are of interest.
It may, however, be possible in the near future to replace visual assessments with image analysis, which may create unbiased and reproducible assessments.
4.4.3 Determination of mechanical weed control equipment efficacy
Weed populations are generally not uniformly distributed in the field and make weed control assessment difficult and sometimes unreliable, depending on the sampling techniques used. One technique that can be used consists in using "artificial" weed populations and in determining their response to various treatments (Benoit et al., 1995; Portillo-Nunez, 1996).
The method consists in using seeds of plant species that are not already present in the experimental area and in seeding them in narrow lines across the path of the equipment (generally perpendicular to the crop rows). The plants are seeded at known densities and are counted prior to a treatment and as soon as possible after the treatment and a week later. They are also counted up in the path of the cultivator in order to determine if the machinery carried some seedlings further away. Similarly, lateral displacement of seedlings can also be measured, etc. Seedling counts before and after a treatment can give a good indication of the efficacy of a cultivator. The number of seedlings buried, uprooted etc can also be determined. These cultivations have to be done when the "artificial" weed is still at an early growth stage, preferably at less than 1 leaf stage for a monocotyledonous species and less than 2 leaves stage for a dicotyledonous species.
Using crop seeds generally means that they mostly germinate at the same time, preventing confounding between the effect of the treatment and the addition of new seedlings by plants that germinated right after the treatment. Brassica seeds such as mustard were successfully used as well as seeds of ryegrass although the latter had to be treated before the initiation of tiller production (Benoit et al, 1995; Portillo-Nunez, 1996).
4.4.4 Determination of crop susceptibility to flex-tine harrows and to rotary hoes
A simple protocol can be used to determine crop growth stages susceptibility to various mechanical weed control equipment. In a weed-free field, all the early growth stages of the crop are cultivated systematically once (e.g. treatment 1 might be cultivated pre-emergence, treatment 2 might be cultivated at the cotyledon stage, etc). Other treatments can consist in cultivating at different combinations of crop growth stages, resulting in some plots receiving 2 or more cultivations (Leblanc and Cloutier, 2001a; 2001b). The advantage of conducting this type of experiment in a weed-free field is that there are no confounding effects with weed interference on crop yield. Herbicides can be used to insure that there are no weeds in the experimental area.
The variables that can be measured are: crop density before and after a treatment, crop damage, crop yield etc.
5 Concluding remarks
In the previous pages we have suggested some guidelines on research techniques for flame weeding, weed harrowing and intra-row cultivation, also summarized in Table 4. We are confident that this paper serves as a guideline for physical weed control research and as a basis for further discussion on and development of research methodology. We would like to emphasize that these guidelines are not intended to limit the development of new methodology, but to help exploit current methodology and improve it. The diversity of methodology is not an end itself.
However, it is evident that the topic can’t be treated exhaustively within a few pages. There is still a lot to do even within the topics covered here, not to mention all the other physical weed control methods – e.g. hoeing, brush weeding, steaming, electroporation and the whole area of cultural weed control – which were not dealt with in this paper. There are also several challenges

6th EWRS Workshop on Physical and Cultural Weed Control 236 Lillehammer, Norway, 8-10 March 2004
for physical weed control research methodology, which were only superficially mentioned, but would be worth a thorough discussion and should be presented in a future paper.
We feel that it would be beneficial to continue writing the guidelines. One option for that would be establishing a working group on guidelines within the Physical and Cultural Weed Control working group. The core group, working with several contributors, would prepare more thorough guidelines, which could be presented e.g. in a separate session (oral or poster) during the next Workshop, and posted on the PWC web site. Other options for continuing the work should be considered as well.
We hope that this paper acts as a catalyst stimulating thinking and discussion the subject of guidelines for physical weed control, as well as helps to raise the standard for physical weed control research.
Table 4. Checklist for research. The following checklist may be used when preparing experiments
in physical weed control. All boxes should be checked before the experiment is conducted.
The research aims are clearly defined An appropriate experimental design has been produced It is clear which statistical methods to use
We know how to describe… The methodology Equipment and adjustments Weed and crop plants Environmental conditions
…and intend to do so We know when and how to do the assessments We know how many weed and crop plants should be counted We are ready to do it!
References ANONYMOUS (1994) Description of the visual 0–100 rating scale. Canadian Weed Science Society,
2 p. ANONYMOUS (2001). Internet Glossary of Soil Science Terms. Soil Science Society of America.
(Feb.10,2004: http://www.soils.org/sssagloss/) ANONYMOUS (undated a) Graph showing the percentages of sand, silt, and clay in the soil texture
classes (USDA soil texture classification triangle). Soil Science Society of America. (Feb.10,2004: http://www.soils.org/sssagloss/figure1.html)
ANONYMOUS (undated b) Glossary of cultivators and other implements that are used in physical weed control. EWRS Working Group Physical and Cultural Weed Control. (Feb.10,2004: http://www.ewrs-et.org/pwc/glossary.htm)
ASCARD J (1994) Dose response models for flame weeding in relation to plant size and density. Weed Research 34, 377–385.
ASCARD J (1995) Effects of flame weeding on weed species at different developmental stages. Weed Research 35, 397–411.
ASCARD J (1997) Flame weeding: effects of fuel pressure and tandem burners. Weed Research 37, 77–86
ASCARD J (1998) Comparison of flaming and infrared radiation techniques for thermal weed control. Weed Research 38, 69–76

6th EWRS Workshop on Physical and Cultural Weed Control 237 Lillehammer, Norway, 8-10 March 2004
ASCARD J & BELLINDER RR (1996) Mechanical in-row cultivation in row crops. In: Proceedings Second International Weed Control Congress, Copenhagen. pp. 1121–1126.
BENOIT DL, CLOUTIER D & RECASENS J (1995) Metodos alternativos de represion de las malas herbas: escardadores mecanicos y tecnicas de evaluacion. In : Proceedings of the 1995 Congress of the Spanish Weed Science Society, Huesca, Spain, 14–16 November 1995. Sociedad Espanola de Malherbologia, Madrid, Spain: p. 27–36.
BERTRAM A (1993) Measurement of heat transfer in thermal weed control. Acta Horticulturae 372, 187–194.
BERTRAM A (1996) Geräte- und verfahrenstechnische Optimierung der thermischen Unkrautbekämpfung. Forschungsbericht des Arbeitskreises Forschung und Lehre der Max-Eyth-Gesellschaft Agrartechnik im VDI (MEG), 284, Hrsg.: Landtechnik Weihenstephan. Freising: Selbstverlag, 195 p.
BERTRAM A (1997) Developement of Optimized Thermal Weeders by Mathematical Modelling. In: Proceedings of the 3rd IFAC Workshop on Mathematical Control Applications in Agriculture and Horticulture, 28 September – 2 October 1997, Hannover, Germany, Elsevier Science Ltd, The Boulevard, Langford Lane, Kidlington, Oxford, OX5 1GB, UK.
BERTRAM A (2001) Investigations on heat transfer rates of steam/air mixtures for thermal weed control. Acta Horticulurae. (in press)
BERTRAM A (2002a) Optimizing thermal weeders for pre-emerging flaming. In: Proceedings of the 6th International Symposium on Fruit, Nut and Vegetable Production Engineering, ATB Potsdam, Germany, 11.–14. September 2001, 205–210.
BERTRAM A (2002b) Thermal weed control and selectivity in tranplanted herbs. In: Proceedings of the 6th International Symposium on Fruit, Nut and Vegetable Production Engineering, ATB Potsdam, Germany, 11.–14. September 2001, 211–214.
BÖHRNSEN A (1993) Several years results about mechanical weeding in cereals. In: Communications 4th International Conference IFOAM, Non-chemical Weed Control, Dijon, France, 95–101.
BURRIL LC, CARDENAS J & LOCATELLI E (1976) Field manual for weed control research. International Plant Protection Center, Corvallis, Oregon, U.S. 60 p.
CAMPER ND (ed) (1986) Research Methods in Weed Science. 3rd edition. Champaign, IL: Southern Weed Science Society. 486 p.
DEDOUSIS AP (2003) Development of high density energy techniques in robotic weeding. MSc Thesis Farm Technology Group, Wageningen University, 82 pp.
FRANS R, TALBERT R, MARX D & CROWLEY H (1986) Experimental design and techniques for measuring and analyzing plant responses to weed control practices. In: Research Methods in Weed Science. (ed. ND Camper). 3rd edition. Champaign, IL: Southern Weed Science Society. pp 29–46.
GNEGY JD (1991) Visual Rating Systems for Target and Crop Species. In: Standard Methods for Forest Herbicide Research. (eds JH Miller & GR Glover) Southern Weed Science Society. pp. 40–43.
GOMEZ KA & GOMEZ AA (1984). Statistical procedures for agricultural research. 2nd edn, J Wiley & Sons, New York, USA.
HALLEFÄLT F, ASCARD J & OLSSON R (1998) Mechanical weed control by torsion weeder – A new method to reduce herbicide use in sugar beets. Aspects of Applied Biology, 52, 127–130.
HANSSON D & ASCARD J (2002) Hot water weed control as influenced by developmental stage and time of assessment. Weed Research, 42, 307–316.
HORSFALL JG & BARRATT RW (1945) An improved system for measuring plant disease. Phytopathology 36, 655 (Abstr.)
JENKINS SF JR & WEHNER TC (1983) A System for the Measurement of Foliar Diseases of Cucumber. Cucurbit Genetics Cooperative Report No. 6. Department of Horticulture,

6th EWRS Workshop on Physical and Cultural Weed Control 238 Lillehammer, Norway, 8-10 March 2004
University of Wisconsin, Madison, WI 53706. (Feb.4, 2004: http://www.umresearch.umd.edu/CGC/cgc6/art/CGC6-5.html)
JENSEN RK, RASMUSSEN J & MELANDER B (2004) Selectivity of weed harrowing in lupin. Weed Research 44 (in press)
KENT M & COKER P (1992) Vegetation Description and Analysis. England: John Willey and Sons, 363 p
KLOCKE NL & FISCHBACH PE (1998) Estimating soil moisture by appearance and feel. University of Nebraska. (Feb.10,2004: http://www.ianr.unl.edu/pubs/irrigation/g690.htm.
KURSTJENS DAG (1999) Methode voor het optimaliseren van de instelling van torsiewieders en vingerwieders. Internal report (unpublished, in Dutch), IMAG-DLO, Wageningen, The Netherlands, 21 p.
KURSTJENS DAG, PERDOK UD & GOENSE D (2000) Selective uprooting by weed harrowing on sandy soils. Weed Research 40, 431–447.
KURSTJENS DAG (2002) Mechanisms of selective mechanical weed control by harrowing. PhD Thesis, Soil Technology group, Wageningen University, The Netherlands, 156 pp.
KURSTJENS DAG, KROPFF MJ & PERDOK UD (2004) Method for predicting selective uprooting by mechanical weeders from plant anchorage forces. Weed Science 52, 123–132.
LEBLANC ML & CLOUTIER DC (2001a) Susceptibility of row-planted soybean (Glycine max) to the rotary hoe. Journal of Sustainable Agriculture 18 (4), 53–61.
LEBLANC ML & CLOUTIER DC (2001b) Susceptibility of dry edible bean (Phaseolus vulgaris, cranberry bean) to the rotary hoe. Weed technology 15, 224–228.
LEMIEUX C, CLOUTIER DC & LEROUX GD (1992) Sampling quackgrass (Elytrigia repens) populations. Weed Science 40, 534–541.
LITTLE TM & HILLS FJ (1978) Agricultural Experimentation, Design and Analysis. John Wiley and Sons, New York, N.Y. USA 350 p.
MEIER U (ed.) (1997) Phenological growth stages and BBCH-identification keys of weed species. p. 135–139 In: Growth Stages of Mono- and Dicotyledonous Plants (ed. U Meier), BBCH-Monograph. Berlin; Wien: Blackwell Wissenschafts-Verlag. 622 p. Electronic version available at http://www.bba.de/veroeff/bbch/bbch.htm
PERUZZI A, SILVESTRI N, COLI A & GINI N (1993) Winter cereals weeds control by means of weeding harrows: first experimental results. Agricoltura Mediterranea 123, 236–242.
PERUZZI A, RAFFAELLI M, DI CIOLO S (2000). Experimental tests of selective flame weeding for different spring summer crops in central Italy. Agricoltura Mediterranea, 130 (2), 85–94.
PERUZZI A, RAFFAELLI M, GINANNI M & BORELLI M (2003) Physical weed control in organic carrot in the Fucino Valley (Italy). In: 7th EWRS Mediterranean Symposium, Adana (Turkey), 6–9 May 2003, 37–38.
PORTILLO-NUNEZ D (1996) Development and validation of a theoretical method to evaluate the efficacy of mechanical cultivators. M.Sc. Thesis, McGill university, Montreal, Quebec, Canada.76 pp.
RAFFAELLI M, BÀRBERI P, PERUZZI A, GINANNI M (2002) Options for mechanical weed control in string bean – work parameters and crop yield. In: 5th EWRS Workshop on Physical and Cultural Weed Control, Pisa, 11–13 March 2002, 119–124.
RASMUSSEN J (1990) Selectivity – an important parameter on establishing the optimum harrowing technique for weed control in growing cereals. In: Proceeding of the European Weed Research Society Symposium, Integrated weed management in cereals: 197–204.
RASMUSSEN J (1991) A model for prediction of yield response in weed harrowing. Weed Research 31, 401–408.
RASMUSSEN J (1992) Testing harrows for mechanical control of weeds in agricultural crops. Weed Research 32, 267–274.

6th EWRS Workshop on Physical and Cultural Weed Control 239 Lillehammer, Norway, 8-10 March 2004
RASMUSSEN J (1993) Yield response models for mechanical weed control by harrowing in early growth stages in peas (Pisum sativum L.). Weed Research 33, 231–240.
RASMUSSEN J & SVENNINGSEN T (1995) Selective weed harrowing in cereals. Biological Agriculture and Horticulture 12, 29–46.
RYDBERG T (1994) Weed harrowing – the influence of driving speed and driving direction on degree of soil covering and the growth of weed and crop plants. Biological Agriculture and Horticulture 10, 197–205.
SHAW WC & SWANSON CR (1952) Techniques and equipment used in evaluating chemicals for their herbicidal properties. Weeds 1, 352–365.
SLUIJSMANS JJL, SPIJKER JH & BETIST MHH. (eds) (1997) Gif van de straat; reductieprogramma chemische onkruidbestrijding op verhardingen. IBN-DLO, Vewin & Gemeente Eindhoven, 64 p.
STREIBIG JC, RUDEMO M & JENSEN JE (1993) Dose response curves and statistical models. In: Herbicide bioassay (eds Streibig JC & Kudsk P). Boca Raton, Florida. CRC Press, pp. 29–55.
VANHALA P (2000) Relationship between the timing of seedbed preparation and the efficacy of pre-emergence flaming. In: 4th EWRS Workshop on Physical and Cultural Weed Control, Elspeet, The Netherlands, 20–22 March 2000. p. 27.
WILLARD CJ (1958) Rating scales for weed control experiments. Weeds 6, 327–328.