Genome-wide QTL analysis for pre-harvest sprouting tolerance in bread wheat
11
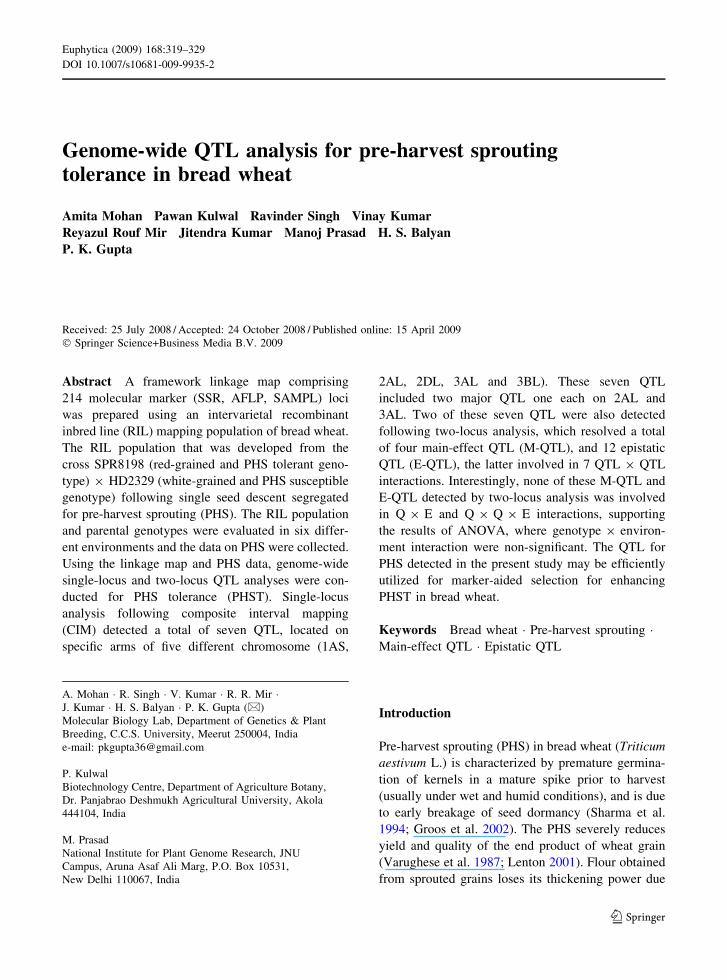
Genome-wide QTL analysis for pre-harvest sprouting tolerance in bread wheat Amita Mohan Pawan Kulwal Ravinder Singh Vinay Kumar Reyazul Rouf Mir Jitendra Kumar Manoj Prasad H. S. Balyan P. K. Gupta Received: 25 July 2008 / Accepted: 24 October 2008 / Published online: 15 April 2009 Ó Springer Science+Business Media B.V. 2009 Abstract A framework linkage map comprising 214 molecular marker (SSR, AFLP, SAMPL) loci was prepared using an intervarietal recombinant inbred line (RIL) mapping population of bread wheat. The RIL population that was developed from the cross SPR8198 (red-grained and PHS tolerant geno- type) 9 HD2329 (white-grained and PHS susceptible genotype) following single seed descent segregated for pre-harvest sprouting (PHS). The RIL population and parental genotypes were evaluated in six differ- ent environments and the data on PHS were collected. Using the linkage map and PHS data, genome-wide single-locus and two-locus QTL analyses were con- ducted for PHS tolerance (PHST). Single-locus analysis following composite interval mapping (CIM) detected a total of seven QTL, located on specific arms of five different chromosome (1AS, 2AL, 2DL, 3AL and 3BL). These seven QTL included two major QTL one each on 2AL and 3AL. Two of these seven QTL were also detected following two-locus analysis, which resolved a total of four main-effect QTL (M-QTL), and 12 epistatic QTL (E-QTL), the latter involved in 7 QTL 9 QTL interactions. Interestingly, none of these M-QTL and E-QTL detected by two-locus analysis was involved in Q 9 E and Q 9 Q 9 E interactions, supporting the results of ANOVA, where genotype 9 environ- ment interaction were non-significant. The QTL for PHS detected in the present study may be efficiently utilized for marker-aided selection for enhancing PHST in bread wheat. Keywords Bread wheat Á Pre-harvest sprouting Á Main-effect QTL Á Epistatic QTL Introduction Pre-harvest sprouting (PHS) in bread wheat (Triticum aestivum L.) is characterized by premature germina- tion of kernels in a mature spike prior to harvest (usually under wet and humid conditions), and is due to early breakage of seed dormancy (Sharma et al. 1994; Groos et al. 2002). The PHS severely reduces yield and quality of the end product of wheat grain (Varughese et al. 1987; Lenton 2001). Flour obtained from sprouted grains loses its thickening power due A. Mohan Á R. Singh Á V. Kumar Á R. R. Mir Á J. Kumar Á H. S. Balyan Á P. K. Gupta (&) Molecular Biology Lab, Department of Genetics & Plant Breeding, C.C.S. University, Meerut 250004, India e-mail: [email protected] P. Kulwal Biotechnology Centre, Department of Agriculture Botany, Dr. Panjabrao Deshmukh Agricultural University, Akola 444104, India M. Prasad National Institute for Plant Genome Research, JNU Campus, Aruna Asaf Ali Marg, P.O. Box 10531, New Delhi 110067, India 123 Euphytica (2009) 168:319–329 DOI 10.1007/s10681-009-9935-2
-
Upload
independent -
Category
Documents
-
view
0 -
download
0
Transcript of Genome-wide QTL analysis for pre-harvest sprouting tolerance in bread wheat
Genome-wide QTL analysis for pre-harvest sproutingtolerance in bread wheat
Amita Mohan Æ Pawan Kulwal Æ Ravinder Singh Æ Vinay Kumar ÆReyazul Rouf Mir Æ Jitendra Kumar Æ Manoj Prasad Æ H. S. Balyan ÆP. K. Gupta
Received: 25 July 2008 / Accepted: 24 October 2008 / Published online: 15 April 2009
� Springer Science+Business Media B.V. 2009
Abstract A framework linkage map comprising
214 molecular marker (SSR, AFLP, SAMPL) loci
was prepared using an intervarietal recombinant
inbred line (RIL) mapping population of bread wheat.
The RIL population that was developed from the
cross SPR8198 (red-grained and PHS tolerant geno-
type) 9 HD2329 (white-grained and PHS susceptible
genotype) following single seed descent segregated
for pre-harvest sprouting (PHS). The RIL population
and parental genotypes were evaluated in six differ-
ent environments and the data on PHS were collected.
Using the linkage map and PHS data, genome-wide
single-locus and two-locus QTL analyses were con-
ducted for PHS tolerance (PHST). Single-locus
analysis following composite interval mapping
(CIM) detected a total of seven QTL, located on
specific arms of five different chromosome (1AS,
2AL, 2DL, 3AL and 3BL). These seven QTL
included two major QTL one each on 2AL and
3AL. Two of these seven QTL were also detected
following two-locus analysis, which resolved a total
of four main-effect QTL (M-QTL), and 12 epistatic
QTL (E-QTL), the latter involved in 7 QTL 9 QTL
interactions. Interestingly, none of these M-QTL and
E-QTL detected by two-locus analysis was involved
in Q 9 E and Q 9 Q 9 E interactions, supporting
the results of ANOVA, where genotype 9 environ-
ment interaction were non-significant. The QTL for
PHS detected in the present study may be efficiently
utilized for marker-aided selection for enhancing
PHST in bread wheat.
Keywords Bread wheat � Pre-harvest sprouting �Main-effect QTL � Epistatic QTL
Introduction
Pre-harvest sprouting (PHS) in bread wheat (Triticum
aestivum L.) is characterized by premature germina-
tion of kernels in a mature spike prior to harvest
(usually under wet and humid conditions), and is due
to early breakage of seed dormancy (Sharma et al.
1994; Groos et al. 2002). The PHS severely reduces
yield and quality of the end product of wheat grain
(Varughese et al. 1987; Lenton 2001). Flour obtained
from sprouted grains loses its thickening power due
A. Mohan � R. Singh � V. Kumar � R. R. Mir �J. Kumar � H. S. Balyan � P. K. Gupta (&)
Molecular Biology Lab, Department of Genetics & Plant
Breeding, C.C.S. University, Meerut 250004, India
e-mail: [email protected]
P. Kulwal
Biotechnology Centre, Department of Agriculture Botany,
Dr. Panjabrao Deshmukh Agricultural University, Akola
444104, India
M. Prasad
National Institute for Plant Genome Research, JNU
Campus, Aruna Asaf Ali Marg, P.O. Box 10531,
New Delhi 110067, India
123
Euphytica (2009) 168:319–329
DOI 10.1007/s10681-009-9935-2
to starch breakdown, so that the baked products have
a smaller volume and a compact, sticky crumb
structure (Appels et al. 2003; Kottearachchi et al.
2006). The loss of quality due to PHS is mainly
caused by high a-amylase activity.
PHS and dormancy are related complex traits that
are together controlled by many genes and environ-
mental factors. Several other factors like spike and
plant morphology, kernel colour, presence of germi-
nation inhibitors in different tissues and physical
barriers to water penetration in the spike are also
associated with these traits (Nilson-Ehle 1914; King
1984; Salmon et al. 1986; Morris and Paulsen 1988;
Paterson et al. 1989; Gale 1989; Groos et al. 2002;
Himi et al. 2002; Rathjen et al. 2007; Farley and
Adkins 2007). In the past, inheritance of the genetic
components of PHS tolerance and seed dormancy in
wheat was studied using classical Mendelian and
molecular approaches. The initial studies suggested
that PHS tolerance and seed dormancy are quantita-
tive traits and are controlled by multiple genes.
Subsequent studies involving quantitative trait loci
(QTL) analysis using diverse mapping populations
identified a number of genes/QTL involving all the
21 different chromosomes (Anderson et al.1993;
Bailey et al. 1999; Roy et al. 1999; Zanetti et al.
2000; Kato et al. 2001; Mares and Mrva 2001; Groos
et al. 2002; Flintham et al. 2002; Kulwal et al. 2004,
2005; Mori et al. 2005; Mares et al. 2005; Ogbonnaya
et al. 2006, 2008; Imtiaz et al. 2008; Chen et al.
2008). In rice and barley also, QTL for PHS/
dormancy were identified on all the chromosomes
in each case (Gao et al. 2008; Ullrich et al. 2008).
Thus, the genetics of PHS in cereals is complex,
which makes the development of PHS tolerant cereals
a major challenge for crop geneticists and plant
breeders.
In our own laboratory, using the same RIL
population (SPR8198 9 HD2329), we initially iden-
tified two QTL for PHST in wheat, one each on
chromosome arms 6BS and 7DL (Roy et al. 1999),
and later identified a major QTL for PHST on
chromosome arm 3AL (Kulwal et al. 2005). The
present study is an extension of this earlier work, and
involved single-locus and two-locus QTL analyses,
which together led to the identification of nine main
effect QTL and 12 epistatic QTL that were involved
in seven QTL 9 QTL (Q 9 Q) interactions.
Materials and methods
Plant material and data recording
A mapping population in the form of 90 recombi-
nant inbred lines (RILs) derived from a cross
SPR8198 (red-grained; PHS tolerant) 9 HD2329
(white-grained; PHS susceptible) was procured from
Punjab Agricultural University, Ludhiana, India. The
details about the RIL population used during the
present study are available elsewhere (Kulwal et al.
2005). The RIL population along with two parental
genotypes was evaluated in replicated trials with
three replications during 2000–2001 at three differ-
ent locations (i.e. Meerut, Pantnagar and Ludhiana),
which are the major wheat growing areas of
Northern India. During 2001–2002 crop season,
the evaluation was again carried out in simple lattice
design experiments (two replications) at the same
three locations. This allowed collection of data from
six environments. In each environment, five spikes
from each of the two parents and from each of the
90 RILs from each replication were harvested as and
when they attained physiological maturity, charac-
terized by the loss of green colour by [75% florets
of the spike. There were no rains at the time of
harvesting of the sipkes, so that the level of PHS in
harvested spikes was determined in the laboratory
(Baier 1987). Data on PHS were scored on a scale
of 1–9 with score of 1 for genotypes with no visible
sprouting and a score of 9 for the genotypes with
complete sprouting. This scale corresponds to 1
through 10 scale of McMaster and Derera (1976)
with slight modifications (for details, see Kulwal
et al. 2004).
Genotype 9 environment interaction and rank
correlations
For the study of genotype 9 environment interac-
tions, analysis of variance (ANOVA) was con-
ducted by PROC GLM in SAS (SAS Institute
1996), using genotypes as fixed effects and all the
other sources as random effects. Spearman’s rank
correlations between 15 possible pairs of ranks of
RILs for PHS in six different environments were
determined using online statistical software (Wessa
2008).
320 Euphytica (2009) 168:319–329
123
DNA isolation and PCR primers for DNA
markers (SSR, AFLP/SAMPL)
DNA was isolated from leaves of one month-old field
grown plants using a modified CTAB method
(Saghai-Maroof et al. 1984).
A set of 778 SSR markers (gwm, wmc, gdm, cfa,
cfd and barc) was used; in each case, the forward
primer was synthesized with M13 tail, which was
fluorescently labeled either with IRdye 700 or with
IRdye 800. For AFLP analysis, 16 primer combina-
tions (two EcoRI primers, E35 and E36, each in
combination with eight MseI primers) were used.
Similarly, for SAMPL (selective amplification of
microsatellite polymorphic loci) analysis, nine primer
combinations (SAMPL primer S6 in combination
with four MseI primers, and SAMPL primer S7 in
combination with five MseI primers) were used. The
primers E36 (for AFLP) and S6 (for SAMPL) were
labeled with 6-FAM (6-carboxifluorescein) while the
primers E35 (for AFLP) and S7 (for SAMPL) were
labeled with NED [N-(1-naphthyl)-ethyletediamine].
The sequences for AFLP primers are available in Vos
et al. (1995) and those of SAMPL primers are
available in Witsenboer et al. (1997). The PCR
primers for SSR, AFLP and SAMPL analysis were
synthesized on contract either by Illumina (USA), or
by Microsynth (Switzerland), or by Applied Biosys-
tems (USA) depending upon convenience.
SSR, AFLP and SAMPL analyses
For SSR analysis, DNA amplification was carried out
in an Eppendorf Master Cycler 9600 using the
recommended annealing temperatures for the respec-
tive SSR primers (Roder et al. 1998). For visualizing
PCR products, the forward primer having M13 tail,
labeled with an IRDye (IRdye 700 or IRdye 800), and
the corresponding unlabelled reverse primer were
used in PCR reactions. The forward primers labeled
with IRDye 700 or IRDye 800 were used in separate
PCR reactions, and the amplification products from
two PCRs were mixed prior to loading of gels to
achieve high-throughput. PCR amplification was
carried out in 10 ll reaction mixtures containing
50 ng of template DNA, 200 nM of each unlabeled
primer, 1.0 pmole of IRDye 700/IRDye 800 labeled
primer, 0.2 mM each of dNTP, 2.5 mM MgCl2, 1X
PCR buffer and 0.5 U Taq Polymerase. The amplified
PCR products were separated on LI-COR 4300 DNA
analyzer using a 6.5% gel matrix. All marker data
were scored by visual inspection.
For AFLP/SAMPL analysis, restriction digestion,
ligation of adapters and pre-amplification were car-
ried out using AFLP System I Kit, Life Technology,
USA following Vos et al. (1995) with some modi-
fications. Selective amplification of the pre-amplified
DNA was carried out in an Applied Biosystems 9600
Thermal Cycler (PE/Applied Biosystems). The PCR
products were resolved on 4% PAGE using ABI
PrismTM 377 DNA sequencer (PE/Applied Biosys-
tems), using dROX (dichlororhodamine dye) as an
internal size standard, and the data were analyzed
using GeneScan� analysis software version 3.2.4
(PE/Applied Biosystems) and Genotyper� analysis
software version 2.5 as per the instructions given in
the user’s manual. The AFLP/SAMPL markers were
designated according to the prescribed nomenclature
available at the GrainGenes (http://wheat.pw.usda.
gov/ggpages/keygeneAFLPs.html).
Preparation of framework linkage map
The genotyping data on 90 RILs for polymorphic
markers were used for constructing a framework
linkage map of all the 21 chromosomes using
MAPMAKER/EXP v 3.0b (Lander et al. 1987).
Recombination frequencies were converted into cen-
tiMorgans (cM) using the Kosambi function (Kos-
ambi 1944) and using a minimum LOD (logarithm of
odds) score of 2.0 and maximum recombination
frequency of 50%.
QTL analysis
Single-locus QTL analysis using composite interval
mapping (CIM) for detection of main-effect QTL was
conducted using QTL Cartographer V2.5 (Wang et al.
2007) involving multiple linear regression with a
probability in and out of 0.05 and window size of
10 cM. LOD score of 2.5 was used for suggesting the
presence of a putative QTL. Threshold LOD scores,
calculated using 1,000 permutations, were used for
declaring definitive QTL. Two-locus analysis that
identifies main-effect QTL (M-QTL), epistatic QTL
(E-QTL), QTL 9 environment (QE) and QTL 9
QTL 9 environment (QQE) interactions was con-
ducted using QTLNetwork Version 2.0 (Yang et al.
Euphytica (2009) 168:319–329 321
123
2007). The relative contribution of a genetic compo-
nent was calculated as the proportion of the pheno-
typic variation explained (PVE) by that component.
The QTL were designated according to the standard
nomenclature for QTL as recommended for wheat
and used in our earlier study on PHS in wheat
(Kulwal et al. 2004).
Results
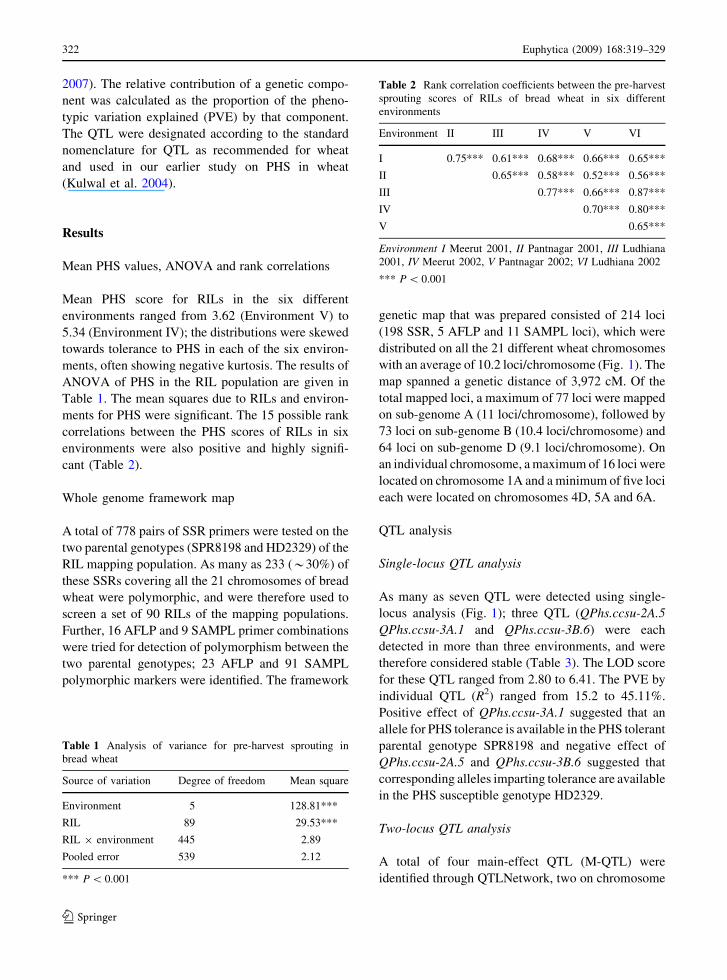
Mean PHS values, ANOVA and rank correlations
Mean PHS score for RILs in the six different
environments ranged from 3.62 (Environment V) to
5.34 (Environment IV); the distributions were skewed
towards tolerance to PHS in each of the six environ-
ments, often showing negative kurtosis. The results of
ANOVA of PHS in the RIL population are given in
Table 1. The mean squares due to RILs and environ-
ments for PHS were significant. The 15 possible rank
correlations between the PHS scores of RILs in six
environments were also positive and highly signifi-
cant (Table 2).
Whole genome framework map
A total of 778 pairs of SSR primers were tested on the
two parental genotypes (SPR8198 and HD2329) of the
RIL mapping population. As many as 233 (*30%) of
these SSRs covering all the 21 chromosomes of bread
wheat were polymorphic, and were therefore used to
screen a set of 90 RILs of the mapping populations.
Further, 16 AFLP and 9 SAMPL primer combinations
were tried for detection of polymorphism between the
two parental genotypes; 23 AFLP and 91 SAMPL
polymorphic markers were identified. The framework
genetic map that was prepared consisted of 214 loci
(198 SSR, 5 AFLP and 11 SAMPL loci), which were
distributed on all the 21 different wheat chromosomes
with an average of 10.2 loci/chromosome (Fig. 1). The
map spanned a genetic distance of 3,972 cM. Of the
total mapped loci, a maximum of 77 loci were mapped
on sub-genome A (11 loci/chromosome), followed by
73 loci on sub-genome B (10.4 loci/chromosome) and
64 loci on sub-genome D (9.1 loci/chromosome). On
an individual chromosome, a maximum of 16 loci were
located on chromosome 1A and a minimum of five loci
each were located on chromosomes 4D, 5A and 6A.
QTL analysis
Single-locus QTL analysis
As many as seven QTL were detected using single-
locus analysis (Fig. 1); three QTL (QPhs.ccsu-2A.5
QPhs.ccsu-3A.1 and QPhs.ccsu-3B.6) were each
detected in more than three environments, and were
therefore considered stable (Table 3). The LOD score
for these QTL ranged from 2.80 to 6.41. The PVE by
individual QTL (R2) ranged from 15.2 to 45.11%.
Positive effect of QPhs.ccsu-3A.1 suggested that an
allele for PHS tolerance is available in the PHS tolerant
parental genotype SPR8198 and negative effect of
QPhs.ccsu-2A.5 and QPhs.ccsu-3B.6 suggested that
corresponding alleles imparting tolerance are available
in the PHS susceptible genotype HD2329.
Two-locus QTL analysis
A total of four main-effect QTL (M-QTL) were
identified through QTLNetwork, two on chromosome
Table 1 Analysis of variance for pre-harvest sprouting in
bread wheat
Source of variation Degree of freedom Mean square
Environment 5 128.81***
RIL 89 29.53***
RIL 9 environment 445 2.89
Pooled error 539 2.12
*** P \ 0.001
Table 2 Rank correlation coefficients between the pre-harvest
sprouting scores of RILs of bread wheat in six different
environments
Environment II III IV V VI
I 0.75*** 0.61*** 0.68*** 0.66*** 0.65***
II 0.65*** 0.58*** 0.52*** 0.56***
III 0.77*** 0.66*** 0.87***
IV 0.70*** 0.80***
V 0.65***
Environment I Meerut 2001, II Pantnagar 2001, III Ludhiana
2001, IV Meerut 2002, V Pantnagar 2002; VI Ludhiana 2002
*** P \ 0.001
322 Euphytica (2009) 168:319–329
123
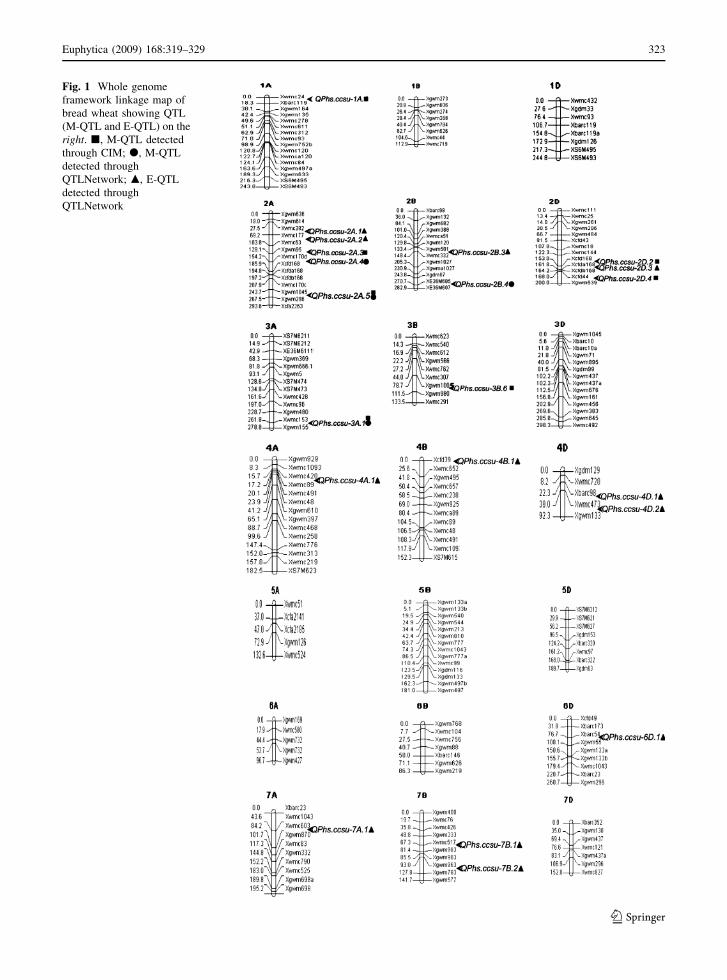
Fig. 1 Whole genome
framework linkage map of
bread wheat showing QTL
(M-QTL and E-QTL) on the
right. j, M-QTL detected
through CIM; d, M-QTL
detected through
QTLNetwork; m, E-QTL
detected through
QTLNetwork
Euphytica (2009) 168:319–329 323
123
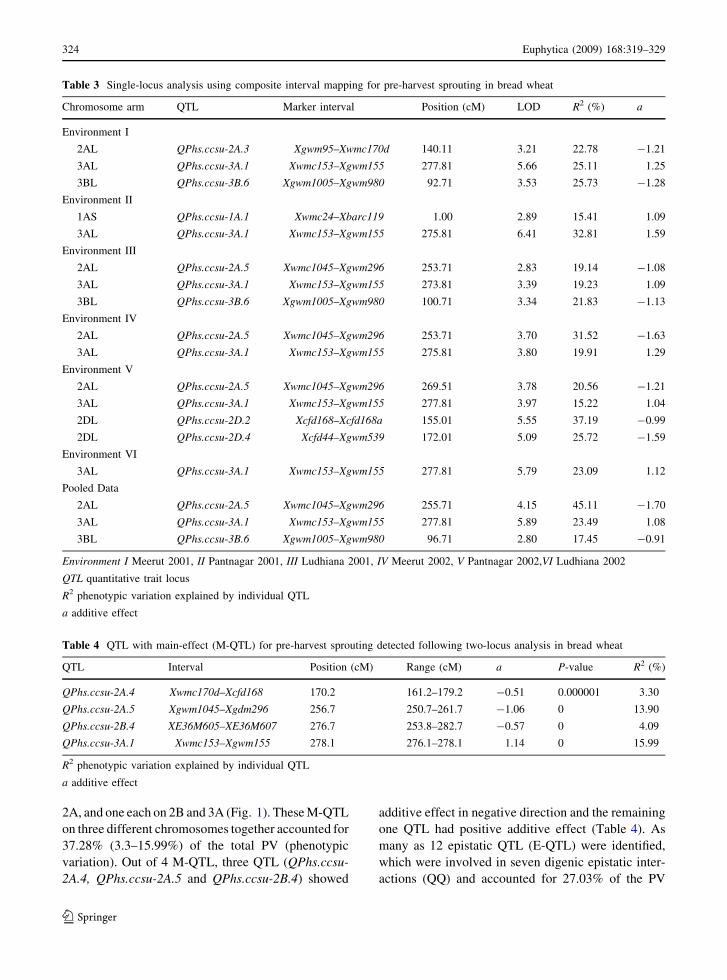
2A, and one each on 2B and 3A (Fig. 1). These M-QTL
on three different chromosomes together accounted for
37.28% (3.3–15.99%) of the total PV (phenotypic
variation). Out of 4 M-QTL, three QTL (QPhs.ccsu-
2A.4, QPhs.ccsu-2A.5 and QPhs.ccsu-2B.4) showed
additive effect in negative direction and the remaining
one QTL had positive additive effect (Table 4). As
many as 12 epistatic QTL (E-QTL) were identified,
which were involved in seven digenic epistatic inter-
actions (QQ) and accounted for 27.03% of the PV
Table 3 Single-locus analysis using composite interval mapping for pre-harvest sprouting in bread wheat
Chromosome arm QTL Marker interval Position (cM) LOD R2 (%) a
Environment I
2AL QPhs.ccsu-2A.3 Xgwm95–Xwmc170d 140.11 3.21 22.78 -1.21
3AL QPhs.ccsu-3A.1 Xwmc153–Xgwm155 277.81 5.66 25.11 1.25
3BL QPhs.ccsu-3B.6 Xgwm1005–Xgwm980 92.71 3.53 25.73 -1.28
Environment II
1AS QPhs.ccsu-1A.1 Xwmc24–Xbarc119 1.00 2.89 15.41 1.09
3AL QPhs.ccsu-3A.1 Xwmc153–Xgwm155 275.81 6.41 32.81 1.59
Environment III
2AL QPhs.ccsu-2A.5 Xwmc1045–Xgwm296 253.71 2.83 19.14 -1.08
3AL QPhs.ccsu-3A.1 Xwmc153–Xgwm155 273.81 3.39 19.23 1.09
3BL QPhs.ccsu-3B.6 Xgwm1005–Xgwm980 100.71 3.34 21.83 -1.13
Environment IV
2AL QPhs.ccsu-2A.5 Xwmc1045–Xgwm296 253.71 3.70 31.52 -1.63
3AL QPhs.ccsu-3A.1 Xwmc153–Xgwm155 275.81 3.80 19.91 1.29
Environment V
2AL QPhs.ccsu-2A.5 Xwmc1045–Xgwm296 269.51 3.78 20.56 -1.21
3AL QPhs.ccsu-3A.1 Xwmc153–Xgwm155 277.81 3.97 15.22 1.04
2DL QPhs.ccsu-2D.2 Xcfd168–Xcfd168a 155.01 5.55 37.19 -0.99
2DL QPhs.ccsu-2D.4 Xcfd44–Xgwm539 172.01 5.09 25.72 -1.59
Environment VI
3AL QPhs.ccsu-3A.1 Xwmc153–Xgwm155 277.81 5.79 23.09 1.12
Pooled Data
2AL QPhs.ccsu-2A.5 Xwmc1045–Xgwm296 255.71 4.15 45.11 -1.70
3AL QPhs.ccsu-3A.1 Xwmc153–Xgwm155 277.81 5.89 23.49 1.08
3BL QPhs.ccsu-3B.6 Xgwm1005–Xgwm980 96.71 2.80 17.45 -0.91
Environment I Meerut 2001, II Pantnagar 2001, III Ludhiana 2001, IV Meerut 2002, V Pantnagar 2002,VI Ludhiana 2002
QTL quantitative trait locus
R2 phenotypic variation explained by individual QTL
a additive effect
Table 4 QTL with main-effect (M-QTL) for pre-harvest sprouting detected following two-locus analysis in bread wheat
QTL Interval Position (cM) Range (cM) a P-value R2 (%)
QPhs.ccsu-2A.4 Xwmc170d–Xcfd168 170.2 161.2–179.2 -0.51 0.000001 3.30
QPhs.ccsu-2A.5 Xgwm1045–Xgdm296 256.7 250.7–261.7 -1.06 0 13.90
QPhs.ccsu-2B.4 XE36M605–XE36M607 276.7 253.8–282.7 -0.57 0 4.09
QPhs.ccsu-3A.1 Xwmc153–Xgwm155 278.1 276.1–278.1 1.14 0 15.99
R2 phenotypic variation explained by individual QTL
a additive effect
324 Euphytica (2009) 168:319–329
123
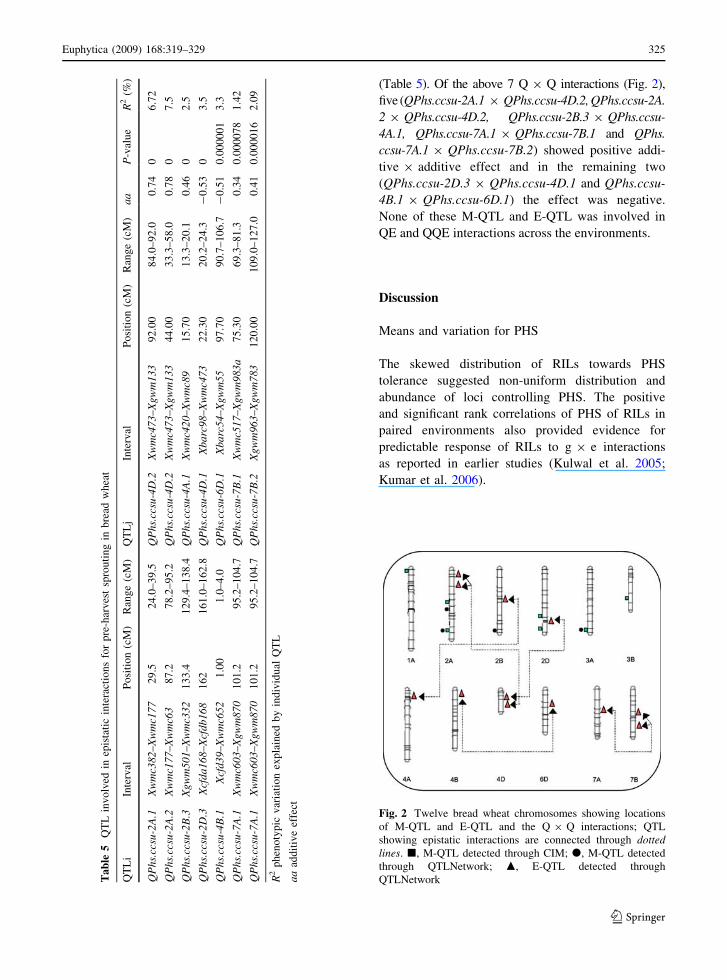
(Table 5). Of the above 7 Q 9 Q interactions (Fig. 2),
five (QPhs.ccsu-2A.1 9 QPhs.ccsu-4D.2, QPhs.ccsu-2A.
2 9 QPhs.ccsu-4D.2, QPhs.ccsu-2B.3 9 QPhs.ccsu-
4A.1, QPhs.ccsu-7A.1 9 QPhs.ccsu-7B.1 and QPhs.
ccsu-7A.1 9 QPhs.ccsu-7B.2) showed positive addi-
tive 9 additive effect and in the remaining two
(QPhs.ccsu-2D.3 9 QPhs.ccsu-4D.1 and QPhs.ccsu-
4B.1 9 QPhs.ccsu-6D.1) the effect was negative.
None of these M-QTL and E-QTL was involved in
QE and QQE interactions across the environments.
Discussion
Means and variation for PHS
The skewed distribution of RILs towards PHS
tolerance suggested non-uniform distribution and
abundance of loci controlling PHS. The positive
and significant rank correlations of PHS of RILs in
paired environments also provided evidence for
predictable response of RILs to g 9 e interactions
as reported in earlier studies (Kulwal et al. 2005;
Kumar et al. 2006).
Ta
ble
5Q
TL
inv
olv
edin
epis
tati
cin
tera
ctio
ns
for
pre
-har
ves
tsp
rou
tin
gin
bre
adw
hea
t
QT
Li
Inte
rval
Po
siti
on
(cM
)R
ang
e(c
M)
QT
Lj
Inte
rval
Po
siti
on
(cM
)R
ang
e(c
M)
aa
P-v
alu
eR
2(%
)
QP
hs.
ccsu
-2A
.1X
wm
c38
2–X
wm
c17
72
9.5
24
.0–
39
.5Q
Ph
s.cc
su-4
D.2
Xw
mc4
73–
Xg
wm
13
39
2.0
08
4.0
–9
2.0
0.7
40
6.7
2
QP
hs.
ccsu
-2A
.2X
wm
c17
7–X
wm
c63
87
.27
8.2
–9
5.2
QP
hs.
ccsu
-4D
.2X
wm
c47
3–
Xg
wm
13
34
4.0
03
3.3
–5
8.0
0.7
80
7.5
QP
hs.
ccsu
-2B
.3X
gw
m5
01
–X
wm
c33
21
33
.41
29
.4–
13
8.4
QP
hs.
ccsu
-4A
.1X
wm
c42
0–
Xw
mc8
91
5.7
01
3.3
–2
0.1
0.4
60
2.5
QP
hs.
ccsu
-2D
.3X
cfd
a1
68
–X
cfd
b1
68
16
21
61
.0–
16
2.8
QP
hs.
ccsu
-4D
.1X
ba
rc9
8–
Xw
mc4
73
22
.30
20
.2–
24
.3-
0.5
30
3.5
QP
hs.
ccsu
-4B
.1X
cfd
39
–X
wm
c65
21
.00
1.0
–4
.0Q
Ph
s.cc
su-6
D.1
Xb
arc
54
–X
gw
m5
59
7.7
09
0.7
–1
06
.7-
0.5
10
.00
00
01
3.3
QP
hs.
ccsu
-7A
.1X
wm
c60
3–X
gw
m8
70
10
1.2
95
.2–
10
4.7
QP
hs.
ccsu
-7B
.1X
wm
c51
7–
Xg
wm
98
3a
75
.30
69
.3–
81
.30
.34
0.0
00
07
81
.42
QP
hs.
ccsu
-7A
.1X
wm
c60
3–X
gw
m8
70
10
1.2
95
.2–
10
4.7
QP
hs.
ccsu
-7B
.2X
gw
m9
63–
Xg
wm
78
31
20
.00
10
9.0
–1
27
.00
.41
0.0
00
01
62
.09
R2
ph
eno
typ
icv
aria
tio
nex
pla
ined
by
ind
ivid
ual
QT
L
aa
add
itiv
eef
fect
Fig. 2 Twelve bread wheat chromosomes showing locations
of M-QTL and E-QTL and the Q 9 Q interactions; QTL
showing epistatic interactions are connected through dottedlines. j, M-QTL detected through CIM; d, M-QTL detected
through QTLNetwork; m, E-QTL detected through
QTLNetwork
Euphytica (2009) 168:319–329 325
123
Genetic map
The framework linkage map constructed during the
present study is a new intervarietal map based on a
cross between SPR8198 and HD2329. The map had a
total length of 3,972 cM, which is not very different
from the size of the earlier known maps including
ITMI population map (*3,700 cM; Roder et al.
1998; see Gupta et al. 1999 for review), Cour-
tot 9 Chinese Spring map (3,685 cM; Sourdille et al.
2003), Chinese Spring 9 SQ1 map (3,522 cM, Quar-
rie et al. 2005), and Fukuho-komugi 9 Oligoculm
map (3,948 cM, Suenaga et al. 2005). The excess
map length in the present study was attributed to the
presence of gaps ([45 cM) in the map. The order of
common markers along our maps is consistent with
the SSR map reported by Somers et al. (2004) with
only few exceptions. The genetic map constructed as
above was used for interval mapping of QTL
involved in PHS.
QTL analysis for PHS
For genetic studies on PHS, this trait has been treated
either as a qualitative trait controlled by only one
gene or two genes, as was initially done by us (Roy
et al. 1999), or as a quantitative trait controlled by
many genes, as done by us in subsequent studies (for
details see Kulwal et al. 2004). It is however certain
now that it is a quantitative trait, so that PHS data
have been recorded on a continuous scale of 1–9
(Anderson et al. 1993; Humphreys and Noll 2002;
Kulwal et al. 2004, 2005) to facilitate QTL interval
mapping for this trait. However, there are also two
alternative parameters [falling number (FN) and a-
amylase activity (Zanetti et al. 2000)] commonly
used for evaluating susceptibility to pre-harvest
sprouting, each having its own limitations. Germina-
tion test used in the present study is often preferred,
since it involves testing intact spikes giving an
estimate of sprouting susceptibility in natural condi-
tions. Seed dormancy measured as germination index
(GI), sprouting index (SI), and visibly sprouted seeds
(VI) (Imtiaz et al. 2008; Ogbonnaya et al. 2008) has
also been used to estimate pre-harvest sprouting
tolerance. However we believe that pre-harvest
sprouting and seed dormancy may not be the same,
and seed dormancy tests should not be used as a
measure for pre-harvest sprouting tolerance.
In the past, several studies have been conducted on
QTL analysis for PHS tolerance/dormancy in wheat
(Roy et al. 1999; Langridge et al. 2001; Jahoor et al.
2004; Li and Gill 2004; Tuberosa and Salvi 2004;
Kulwal et al. 2004, 2005; Mori et al. 2005; Mares
et al. 2005; Tan et al. 2006; Xia et al. 2008; Imtiaz
et al. 2008; Ogbonnaya et al. 2008). QTL analysis of
PHS in the present study is an extension of our earlier
study involving detection of a major QTL for PHS on
chromosome arm 3AL of bread wheat (Kulwal et al.
2005). A whole-genome molecular map constructed
during the present study allowed detection of seven
putative QTL for PHS on chromosome arms 1AS,
2AL, 2DL, 3AL and 3BL (Table 3). Only three of the
seven QTL located on chromosome arms 2AL, 3AL
and 3BL were stable (available in 3–6 environments),
the remaining four QTL on 1AS, 2AL 2DL were
detected in only one of the six different environments
suggesting that these QTL were unstable. Neverthe-
less, identification of several QTL for PHS during the
present study underlined the importance of genome-
wide QTL analysis, since only a solitary QTL
(QPhs.ccsu-3A.1) was earlier reported by us for
PHS while working with individual chromosome 3A
of the mapping population utilized during the present
study (Kulwal et al. 2005). Each of the seven QTL
explained varying proportion of PV (15.2–45.1%).
In earlier studies, QTL for PHS in wheat were
reported on all the 21 different chromosomes (Og-
bonnaya et al. 2008; Chen et al. 2008; Imtiaz et al.
2008, Kulwal et al. 2005, Anderson et al. 1993;
Flintham et al. 2002, Sorrells and Anderson 1996,
Zanetti et al. 2000, Roy et al. 1999, Groos et al. 2002)
and the major QTL for seed dormancy were mapped
to chromosomes 3AS (Osa et al. 2003; Mori et al.
2005) and 4AL (Kato et al. 2001; Noda et al. 2002;
Mares et al. 2005; Torada et al. 2005; Chen et al.
2008). QTL identified on 2AL and 2DL during the
present study are being reported for the first time, and
do not appear to be homoeo-QTL or paralogues.
Each of the three stable QTL for PHS, namely
QPhs.ccsu-2A.5, QPhs.ccsu-3A.1 and QPhs.ccsu-
3B.6 explained significant proportions of the PV
(range 15.22–45.11%) for PHS in individual envi-
ronments, suggesting that these were not minor QTL.
The presence of QTL on short arm of chromosome
1A (QPhs.ccsu-1A.1) was also reported in earlier
studies (Anderson et al.1993, Zanetti et al. 2000,
Knox et al. 2005, Kulwal et al. 2004). Mares et al.
326 Euphytica (2009) 168:319–329
123
(2007) also detected a QTL on chromosome 3BL
close to locus R-B1a, which seems to be associated
with higher expression of genes controlling key
enzymes in the flavonoid pathway. In rice, recently it
was reported that mutation in the genes encoding
major enzymes for the biosynthesis of the carotenoid
precursors of ABA resulted in impairment of carot-
enoid biosynthesis and ABA deficient phenotype,
thus leading to PHS (Fang et al. 2008).
Following two-locus QTL analysis, a total of
4 M-QTL on chromosome arms 2AL, 2BL and 3AL
were identified. Among these four QTL, two QTL on
chromosome arms 2AL and 3AL were also detected
in the same marker intervals using CIM. These two
M-QTL explained high PV, and were therefore
definitive.
Besides, the main-effect QTL, the role of epistasis
(QTL 9 QTL) in controlling quantitative genetic
variation in PHS in wheat and dormancy in rice has
also been demonstrated (Gu et al. 2004; Kulwal et al.
2004; Imtiaz et al. 2008). The phenotypic variation
for PHS due to M-QTL was found to be 37.28% and
that due to E-QTL was 27.03%, suggesting that more
than 50% of the variation for PHST is fixable.
Although, in earlier studies influence of environment
on PHS was suggested, during the present study, no
significant variation in PHS due to QE and QQE was
detected. The present results are thus in agreement
with our earlier results (Kulwal et al. 2004). This
may be due to the fact that the parents did not differ
for the QTL that interact with the environment,
although, the presence of such QTL in wheat genome
should not be ruled out (Gupta et al. 2007). In
another recent study, however, Imtiaz et al. (2008),
while using three environments reported that two out
of three parameters used for evaluating PHS (sprout-
ing index and visibly sprouted seeds) showed no
significant Q 9 E interaction while for the third
parameter (germination index), the Q 9 E interaction
was significant.
From the above results and discussion, we
concluded that the polygenic control of PHST in
bread wheat, involving only a few major QTL and
many QTL with minor effects, limits the chances of
success for improvement of PHST in bread wheat
through classical methods of plant breeding. Hence
molecular markers linked with PHST may be used
in marker-assisted selection (MAS) to accelerate
development of cultivars with high PHST. Some of
the major QTL for PHST identified in the present
study and earlier studies can be used for this
purpose. In our laboratory, using marker assisted
backcrossing programme, efforts are underway to
pyramid the two major PHST QTL, located on 2AL
and 3AL, in the genetic background of HD2329, an
important but PHS susceptible Indian bread wheat
cultivar.
Acknowledgments This work was supported by Department
of Biotechnology (DBT), Government of India, New Delhi and
the Indian National Science Academy (INSA), New Delhi. The
support by the DST through FIST-programme and by the
University Grants Commission (UGC), New Delhi through
SAP-DRS programme is also gratefully acknowledged. Thanks
are also due to Dr. Rajendra Prasad, Scientist, Indian
Agricultural Statistical Research Institute, New Delhi for
statistical analyses and to the Department of Plant Molecular
Biology, University of Delhi South Campus for their help with
ABI 377 DNA sequencer for AFLP/SAMPL genotyping.
References
Anderson JA, Sorrells ME, Tanksley SD (1993) RFLP analysis
of genomic regions associated with resistance to prehar-
vest sprouting in wheat. Crop Sci 33:453–459
Appels R, Francki M, Chibbar R (2003) Advances in cereal
functional genomics. Funct Integr Genomics 3:1–24
Baier AC (1987) Pre-harvest sprouting. Annu Wheat Newsl
33:40
Bailey PC, McKibbin RS, Lenton JR, Holdsworth MJ, Flin-
tham JE, Gale MD (1999) Genetic map locations for
orthologous Vp1 genes in wheat and rice. Theor Appl
Genet 98:281–284
Chen C-X, Cai S-B, Bai G-H (2008) A major QTL controlling
seed dormancy and pre-harvest sprouting resistance on
chromosome 4A in a Chinese wheat landrace. Mol
Breeding 21:351–358
Fang J, Chai C, Qian Q, Li C, Tang J, Sun L, Huang Z, Guo X,
Sun C, Liu M, Zhang Y, Lu Q, Wang Y, Lu C, Han B,
Chen F, Cheng Z, Chu C (2008) Mutations of genes in
synthesis of the carotenoid precursors of ABA lead to pre-
harvest sprouting and photo-oxidation in rice. Plant J
54:177–189
Farley G, Adkins SW (2007) An understanding of the physi-
ology of cereal preharvest sprouting through dormancy
studies on native grasses. 11th International Symposium
on Pre-harvest Sprouting in Cereals. November 5–8,
Mendoza, Argentina http://www.agro.uba.ar/epg/sprout
2007/summary-PHS.pdf
Flintham JE, Adlam R, Bassoi M, Holdsworth M, Gale M
(2002) Mapping genes for resistance to sprouting damage
in wheat. Euphytica 126:39–45
Gale MD (1989) The genetics of pre-harvest sprouting in
cereals, particularly in wheat. In: Derera NF (ed) Pre-
harvest field sprouting in cereals. CRC, Boca Raton
Euphytica (2009) 168:319–329 327
123

Gao FY, Ren GJ, Lu XJ, Sun SX, Li HJ, Gao YM, Luo H, Yan
WG, Zhang YZ (2008) QTL analysis for resistance to
preharvest sprouting in rice (Oryza sativa). Plant Breeding
127:268–273
Groos C, Gay G, Perretant M-R, Gervais L, Bernard M, De-
dryver F, Charmet G (2002) Study of the relationship
between pre-harvest sprouting and grain color by quanti-
tative trait loci analysis in a white 9 red grain bread-
wheat cross. Theor Appl Genet 104:39–47
Gu XY, Kianian SF, Foley ME (2004) Multiple loci and
epistases control genetic variation for seed dormancy in
weedy rice (Oryza sativa). Genetics 166:1503–1516
Gupta PK, Varshney RK, Sharma PC, Ramesh B (1999)
Molecular markers and their applications in wheat
breeding. Plant Breeding 118:369–390
Gupta PK, Balyan HS, Kulwal PL, Kumar N, Mir RR, Mohan
A, Kumar J (2007) QTL analysis for some quantitative
traits in bread wheat. J Zhejiang Univ Sci B 8:807–814
Himi E, Mares DJ, Yanagisawa A, Noda K (2002) Effect of
grain colour gene (R) on grain dormancy and sensitivity
of the embryo to abscisic acid (ABA) in wheat. J Exp Bot
53:1569–1574
Humphreys DG, Noll J (2002) Methods for characterization of
pre-harvest sprouting resistance in a wheat breeding pro-
gram. Euphytica 126:61–65
Imtiaz M, Ogbonnaya FC, Oman J, van Ginkel M (2008)
Characterization of quantitative trait loci controlling
genetic variation for preharvest sprouting in synthetic
backcross-derived wheat lines. Genetics 178:1725–1736
Jahoor A, Eriksen L, Backes G (2004) QTLs and genes for
disease resistance in barley and wheat. In: Gupta PK,
Varshney RK (eds) Cereal Genomics. Kluwer, The
Netherlands
Kato K, Nakamura W, Tabiki T, Miura H, Sawada S (2001)
Detection of loci controlling seed dormancy on group 4
chromosomes of wheat and comparative mapping with
rice and barley genomes. Theor Appl Genet 102:980–985
King RW (1984) Water uptake in relation to pre-harvest
sprouting damage in wheat: grain characteristics. Aust J
Agric Res 36:337–345
Knox RE, Clarke FR, Clarke JM, Fox SL (2005) Genetic
analysis of pre-harvest sprouting in a durum wheat cross.
Euphytica 143:261–264
Kosambi DD (1944) The estimation of map distances from
recombination values. Ann Eugen 12:172–175
Kottearachchi NS, Uchino N, Kato K, Miura H (2006)
Increased grain dormancy in white-grained wheat by
introgression of preharvest sprouting tolerance QTLs.
Euphytica 152:421–428
Kulwal PL, Singh R, Balyan HS, Gupta PK (2004) Genetic
basis of pre-harvest sprouting tolerance using single-locus
and two-locus QTL analyses in bread wheat. Funct Integr
Genomics 4:94–101
Kulwal PL, Kumar N, Gaur A, Khurana P, Khurana JP, Tyagi
AK, Balyan HS, Gupta PK (2005) mapping of a major
QTL for pre-harvest sprouting tolerance on chromosome
3A in bread wheat. Theor Appl Genet 111:1052–1059
Kumar N, Kulwal PL, Gaur A, Tyagi AK, Khurana JP,
Khurana P, Balyan HS, Gupta PK (2006) QTL analysis
for grain weight in common wheat. Euphytica 151:135–
144
Lander ES, Green P, Abrahamson J, Barlow A, Daly MJ,
Lincoln SE, Newburg L (1987) MAPMAKER: an inter-
active computer package for constructing primary genetic
linkage maps of experimental and natural populations.
Genomics 1:174–181
Langridge P, Lagudah ES, Holton TA, Appels R, Sharp P,
Chalmers KJ (2001) Trends in genetic and genome anal-
yses in wheat: a review. Aust J Agric Res 52:1043–1077
Lenton J (2001) Opportunities for the manipulation of devel-
opment of temperate cereals. Adv Bot Res 34:127–164
Li W, Gill BS (2004) Genomics for cereal improvement. In:
Gupta PK, Varshney RK (eds) Cereal genomics. Kluwer,
The Netherlands
Mares DJ, Mrva K (2001) Mapping quantitative trait loci
associated with variation in grain dormancy in Australian
wheat. Aust J Agric Res 52:1257–1265
Mares DJ, Mrva K, Cheong J, Williams K, Watson B, Storlie
E, Sutherland M, Zou Y (2005) A QTL located on chro-
mosome 4A associated with dormancy in white- and
redgrained wheats of diverse origin. Theor Appl Genet
111:1357–1364
Mares DJ, Rathjen J, Mrva K, Cheong J (2007) Dormancy in
white-grained wheat: mechanisms and genetic control.
11th International Symposium on Pre-harvest Sprouting in
Cereals. November 5–8, Mendoza, Argentina http://www.
agro.uba.ar/epg/sprout2007/summary-PHS.pdf
McMaster GJ, Derera NF (1976) Methodology and sample
preparation when screening for sprouting damage in
cereals. Cereal Res Commun 4:251–254
Mori M, Uchino N, Chono M, Kato K, Miura H (2005)
Mapping QTLs for grain dormancy on wheat chromosome
3A and group 4 chromosomes, and their combined effect.
Theor Appl Genet 110:1315–1323
Morris CF, Paulsen GM (1988) Localization and physical
properties of endogenous germination inhibitors in white
wheat grain. Cereal Chem 65:404–408
Nilson-Ehle H (1914) Zur Kennetnis der Keimungsphysiologie
des Weizens in Zusammenhang stehenden inneren Fak-
toren. Zeitschrift fur Planzenzuctung 2:53–187
Noda K, Matsuura T, Maekawa M, Taketa S (2002) Chromo-
somes responsible for sensitivity of embryo to abscisic
acid and dormancy in wheat. Euphytica 123:203–209
Ogbonnaya FC, Imtiaz M, Hearnden P, Wilson J, Eastwood RF,
et al. (2006) Identification of novel gene for seed dor-
mancy in wheat. In: Proceedings of the 13th Australasian
Plant Breeding Conference, Christchurch, New Zealand
Ogbonnaya FC, Imtiaz M, Ye G, Hearnden PR, Hernandez E,
Eastwood RF, Van Ginkel M, Shorter SC, Winchester JM
(2008) Genetic and QTL analyses of seed dormancy and
preharvest sprouting resistance in the wheat germplasm
CN10955. Theor Appl Genet 116:891–902
Osa M, Kato K, Mori M, Shindo C, Torada A, Miura H (2003)
Mapping QTLs for seed dormancy and the Vp1 homo-
logue on chromosome 3A in wheat. Theor Appl Genet
106:1491–1496
Paterson AH, Sorrells ME, Obendorf RL (1989) Methods of
evaluation for preharvest sprouting resistance in wheat
breeding programs. Can J Plant Sci 69:681–689
Quarrie SA, Steed A, Calestani C, Semikhodskii A, Lebreton
C, Chinoy C, Steele N, Pljevljakusic D, Waterman E,
Weyen J, Schondelmaier J, Habash DZ, Farmer P, Saker
328 Euphytica (2009) 168:319–329
123
L, Clarkson DT, Abugalieva A, Yessimbekova M, Turu-
spekov Y, Abugalieva S, Tuberosa R, Sanguineti MC,
Hollington PA, Aragues R, Royo A, Dodig D (2005) A
high-density genetic map of hexaploid wheat (Triticumaestivum L.) from the cross Chinese Spring X SQ1 and its
use to compare QTLs for grain yield across a range of
environments. Theor Appl Genet 110(5):865–880
Rathjen JR, Mares D J, Strounina E V (2007) Pathway for
water movement into dormant and non-dormant wheat
(Triticum aestivum L.) grains. 11th International Sym-
posium on Pre-harvest Sprouting in Cereals. November
5–8, Mendoza, Argentina http://www.agro.uba.ar/epg/
sprout2007/summary-PHS.pdf
Roder MS, Korzun V, Wendehake K, Plaschke J, Tixier MH,
Leroy P, Ganal MW (1998) A microsatellite map of
wheat. Genetics 149:2007–2023
Roy JK, Prasad M, Varshney RK, Balyan HS, Blake TK, Dhal-
iwal HS, Singh H, Edwards KJ, Gupta PK (1999) Identifi-
cation of a microsatellite on chromosomes 6B and a STS on
7D of bread wheat showing an association with preharvest
sprouting tolerance. Theor Appl Genet 99:336–340
Saghai-Maroof MA, Soliman KM, Jorgensen RA, Allard RW
(1984) Ribosomal DNA spacer length polymorphisms in
barley: Mendelian inheritance, chromosomal location, and
population dynamics. Proc Natl Acad Sci USA 81:8014–
8018
Salmon DF, Helm JH, Duggan TR, Lakeman DM (1986) The
influence of chaff extracts on the germination of spring
triticale. Agron J 78:863–867
SAS Institute (1996) The SAS system for windows. Release
6.12. SAS Inst. Cary, North Carolina
Sharma SK, Dhaliwal HS, Multani DS, Bains SS (1994)
Inheritance of preharvast sprouting tolerance in Triticumaestivum and its transfer to an amber-gained cultivar.
J Hered 85:312–314
Somers DJ, Isaac P, Edwards K (2004) A high-density
microsatellite consensus map for bread wheat (Triticumaestivum L.). Theor Appl Genet 109:1105–1114
Sorrells ME, Anderson JA (1996) Quantitative trait loci asso-
ciated with preharvest sprouting in white wheat. In: Noda
K, Mares DJ (eds) Pre-Harvest Sprouting in Cereals 1995.
Center for Academic Societies, Japan
Sourdille P, Cadalen T, Guyomarc’h H, Snape JW, Perretant
MR, Charmet G, Boeuf C, Bernard S, Bernard M (2003) An
update of the Courtot 9 Chinese Spring intervarietal
molecular marker linkage map for the QTL detection of
agronomic traits in wheat. Theor Appl Genet 106:530–538
Suenaga K, Khairallah M, William HM, Hoisington DA (2005)
A new intervarietal linkage map and its application for
quantitative trait locus analysis of ‘‘gigas’’ features in
bread wheat. Genome 48:65–75
Tan MK, Sharp PJ, Lu MQ, Hows N (2006) Genetics of grain
dormancy in a white wheat. Aust J Agric Res 57:1157–
1165
Torada A, Ikeguchi S, Koike M (2005) Mapping and validation
of PCR-based markers associated with a major QTL for
seed dormancy in wheat. Euphytica 143:251–255
Tuberosa R, Salvi S (2004) QTLs and genes for tolerance to
abiotic stresses in cereals. In: Gupta PK, Varshney RK
(eds) Cereal Genomics. Kluwer Academic Publishers, The
Netherlands
Ullrich SE, Clancy JA, del Blanco IA, Lee H, Jitkov VA, Han
F, Kleinhofs A, Matsui K (2008) Genetic analysis of
preharvest sprouting in six-row barley cross. Mol Breed-
ing 21:249–259
Varughese G, Barker T, Saari E (1987) Triticale. CIMMYT,
Mexico
Vos P, Hogers R, Bleeker R, Reijans M, Van dee Lee T,
Hornes M, Frijters A, Pot J, Peleman J, Kupier M, Zabeau
M (1995) AFLP: a new technique for DNA fingerprinting.
Nucleic Acids Res 23:4407–4414
Wang S, Basten CJ, Zeng Z-B (2007) Windows QTL Cartog-
rapher 2.5, Department of Statistics, North Carolina State
University, Raleigh, NC. (http://statgen.ncsu.edu/qtlcart/
WQTLCart.htm)
Wessa P (2008), Free Statistics Software, Office for Research
Development and Education, version 1.1.23-r1, URL
http://www.wessa.net/
Witsenboer H, Vogel J, Michelmore RW (1997) Identification,
genetic localization and allelic diversity of selectively
amplified microsatellite polymorphic loci in lettuce and
wild relatives (Lactuca spp.). Genome 40:923–936
Xia LQ, Ganal MW, Shewry PR, He ZH, Yang Y, Roder MS
(2008) Exploiting the diversity of Viviparous-1 gene
associated with pre-harvest sprouting tolerance in Euro-
pean wheat varieties. Euphytica 159:411–417
Yang J, Zhu J, Williams RW (2007) Mapping the genetic
architecture of complex traits in experimental populations.
Bioinformatics 23:1527–1536
Zanetti S, Winzeler M, Keller M, Keller B, Messmer M (2000)
Genetic analysis of pre-harvest sprouting resistance in a
wheat 9 spelt cross. Crop Sci 40:1406–1417
Euphytica (2009) 168:319–329 329
123