Fine Mapping of a Vigor QTL in Chickpea (Cicer arietinum L ...
Upload
independentCategory
view
1download
0
QTL mapping for yield and yield contributing traits in twomapping populations of bread wheat
N. Kumar Æ P. L. Kulwal Æ H. S. Balyan ÆP. K. Gupta
Received: 16 June 2006 / Accepted: 27 September 2006 / Published online: 25 October 2006� Springer Science+Business Media B.V. 2006
Abstract In bread wheat, single-locus and two-
locus QTL analyses were conducted for seven
yield and yield contributing traits using two
different mapping populations (P I and P II).
Single-locus QTL analyses involved composite
interval mapping (CIM) for individual traits and
multiple-trait composite interval mapping
(MCIM) for correlated yield traits to detect the
pleiotropic QTLs. Two-locus analyses were con-
ducted to detect main effect QTLs (M-QTLs),
epistatic QTLs (E-QTLs) and QTL · environ-
ment interactions (QE and QQE). Only a solitary
QTL for spikelets per spike was common between
the above two populations. HomoeoQTLs were
also detected, suggesting the presence of triplicate
QTLs in bread wheat. Relatively fewer QTLs
were detected in P I than in P II. This may be
partly due to low density of marker loci on P I
framework map (173) than in P II (521) and
partly due to more divergent parents used for
developing P II. Six QTLs were important which
were pleiotropic/coincident involving more than
one trait and were also consistent over environ-
ments. These QTLs could be utilized efficiently
for marker assisted selection (MAS).
Keywords Bread wheat � Pleiotropic QTL �Single-locus analysis � Two-locus analysis
Introduction
In bread wheat, a variety of complex traits have
been subjected to QTL analysis (for review see,
Gupta et al. 1999; Li and Gill 2004; Jahoor et al.
2004; Tuberosa and Salvi 2004). However, in
majority of these cases, an individual study
involved a single mapping population, and only
single-locus analysis was conducted. Conse-
quently, in each such study, only a limited number
of main effect QTLs (M-QTLs) could be detected,
and epistatic QTL · QTL (Q · Q = QQ) and
QTL · environment (Q · E = QE; Q · Q ·E = QQE) interactions could not be examined. A
dissection of these interactions is needed to better
understand the genetic control of a trait (Holland
2001; Mackay 2001; Carlborg and Haley 2004;
Erickson 2005). Two-locus analysis for the genetic
dissection of a few complex traits was also
attempted in bread wheat (Kulwal et al. 2004,
2005), oats (Holland et al. 2002), rice (Yu et al.
N. Kumar � P. L. Kulwal � H. S. Balyan �P. K. Gupta (&)Molecular Biology Laboratory, Department ofGenetics & Plant Breeding, Ch. Charan SinghUniversity, Meerut 250 004, Indiae-mail: [email protected]
P. L. KulwalDepartment of Agricultural Botany, BiotechnologyCenter, Dr. Panjabrao Deshmukh AgriculturalUniversity, Akola 444 104 Maharashtra (MS), India
Mol Breeding (2007) 19:163–177
DOI 10.1007/s11032-006-9056-8
123
1997; Li et al. 1997, 2003; Cao et al. 2001; Xing
et al. 2002; Zhuang et al. 2002; Gao et al. 2004;
Mei et al. 2003, 2005), maize (Yan et al. 2006), and
several other plant groups including cotton (Shen
et al. 2006), and the model plant system Arabid-
opsis (Juenger et al. 2005a, b). The results of these
latter studies reinforced the realization that while
conducting QTL analysis for an individual com-
plex trait, more than one mapping populations
should be used and single-locus as well as two-locus
analyses should be utilized.
In bread wheat, yield and yield contributing
traits were analyzed in only a few QTL studies
(Shah et al. 1999; Araki et al. 1999; Kato et al.
2000; Borner et al. 2002; Campbell et al. 2003;
Groos et al. 2003; Huang et al. 2003, 2004;
Quarrie et al. 2005; Marza et al. 2006; Nar-
asimhamoorthy et al. 2006). This is despite the
fact that these traits are economically the most
important and are complex in nature, exhibiting
low heritability (Grafius et al. 1978; Khalifa
et al. 1988). This warrants genetic dissection of
these traits using more than one population, and
employing more than one methods of QTL
analysis. Genetic relationship among yield traits
using simple correlations should also be worked
out and multitrait composite interval mapping
(MCIM) needs to be conducted for correlated
traits. In the present study, genetic dissection of
yield and yield contributing traits was attempted
to identify M-QTLs using single locus QTL
analysis following composite interval mapping
(CIM), to identify pleiotropic QTLs using
MCIM and to assess QQ and QE/QQE interac-
tions through two locus QTL analyses; two
different mapping populations were used, one
derived from two Indian bread wheat genotypes,
and the other the International Triticeae
Mapping Initiative population (ITMIpop).
Material and methods
Experimental populations and their
evaluation
Following two mapping populations were used: (i)
population I (P I) comprised a set of 100
recombinant inbred lines (RILs) derived from
the cross WL711 · PH132; and (ii) population II
(P II) was ITMIpop (for details, see Van Deynze
et al. 1995) comprising 110 RILs that were initially
derived from the cross, Opata85 · W7984. Both
these populations were used by us in an earlier
study also (Kulwal et al. 2005). The parents along
with the RILs were evaluated at three different
locations, Meerut, Pantnagar and Ludhiana, which
are the three major wheat-growing areas of
Northern India. The three locations provided six
environments for P I (environment I = Meerut
2000–2001, II = Pantnagar 2000–2001, III = Lu-
dhiana 2000–2001, IV = Meerut = 2001–2002,
V = Pantnagar 2001–2002, VI = Ludhiana 2001–
2002) and four environments for P II (environment
I = Meerut 2000–2001; II = Meerut 2001–2002;
III = Pantnagar 2001–2002; IV = Ludhiana 2001–
2002). In an individual replication, the parents and
each RIL were evaluated each in a plot of two rows
of 1 m each. The row-to-row distance was kept at
23 cm. All recommended agronomic practices
were followed. Data on seven yield and yield
contributing traits {tillers per plant (TPP), biolog-
ical yield (BY), grain yield (GY), harvest index
(HI), spike length (SL), spikelets per spike (SPS)
and grains per spike (GPS)} were recorded on all
the RILs and the parents using 10–15 plants (five
random plants from each replication) for each
individual genotype. Frequencies distributions of
means were tested for normal distribution using
MS Excel.
Molecular markers for QTL analysis in P I and
P II
Genotyping and mapping data for P I on a set of 173
SSR marker loci were available from an earlier
study (Prasad et al. 2003). Similar data for P II
(ITMIpop) on a set of 521 mapped molecular
markers was retrieved from the GrainGenes data-
base: http://wheat.pw.usda.gov/ggpages/map_sum-
mary.html.
Pearson’s correlation coefficient analysis
Correlation coefficients among the seven yield
contributing traits (pooled data of each trait)
were obtained using MS Excel.
164 Mol Breeding (2007) 19:163–177
123

QTL analyses for yield and yield contributing
traits
The QTLs in both the mapping populations were
identified by single-locus QTL analysis through CIM
using QTL Cartographer version 2.5 (Basten et al.
1994; Wang et al. 2004). For each trait, the analysis
was carried out for the data on individual environ-
ments as well as using the pooled data averaged over
all environments. The threshold LOD scores were
calculated using 1,000 permutations (Churchill and
Doerge 1994; Doerge and Churchill 1996).
Multiple-trait analysis involving MCIM was
conducted using the module JZmapqtl available
in QTL Cartographer with the objective to detect
pleiotropic QTLs. A LOD score of 3.0 was used for
detecting putative QTLs. A QTL was considered
consistent if the QTL was detected in at least four
of the seven sets of data (six environments + the
pooled data) in P I and in three of the five sets of
data (four environments + the pooled data) in P
II. Confidence intervals (CI) were obtained by
marking positions ±1LOD from the peak. QTLs in
the adjacent intervals and/or with overlapping
confidence intervals were treated as one QTL.
Two-locus analysis was conducted using QTLNet-
work version 2.0 http://ibi.zju.edu.cn/software/qtl-
network/, where P = 0.05 was used as the
threshold for detecting putative M-QTLs or epi-
static QTLs (E-QTLs).
Results
Performance of the RILs and correlations
among yield traits
In both the mapping populations, yield and yield
contributing traits showed a good fit to normal
distribution and the RILs transgressed both parents
in all the environments except for all traits grain
yield and harvest index in P I (data not shown). The
values of simple correlations among seven yield and
yield contributing traits obtained from each of the
two populations using data pooled over environ-
ments are presented in Table 1.
QTLs resolved by single-locus analysis
Composite interval mapping (CIM)
Following single-locus composite interval mapping,
25 QTLs in P I and 50 QTLs in P II were detected
above the threshold LOD scores (see Tables 2 and
3 for details). The number of QTLs for an individ-
ual trait ranged from two (BY and SL) to eight
(GY) in P I (Table 2), and from five (HI) to ten
(GPS) in P II (Table 3). In P I, a QTL for SPS,
which was consistent in four of the seven environ-
ments, was coincident with QTLs for two other
traits (BY and HI); it is possible that these three
QTLs for three traits represent one pleiotropic
QTL (Table 2; also see Table 4). Another QTL for
SL (on 2BL) was consistent over all the environ-
ments (Table 2). Similarly in P II, six sets of QTLs
were detected, each set having more than one
coincident QTLs (Table 3), four of these six sets of
QTLs represent, each a pleiotropic QTL as deter-
mined through MCIM and joint MCIM (Table 4).
Also in P II, six QTLs were consistent, which
included one QTL each for TPP, GY, HI, SPS, SL
and GPS; some of these consistent QTLs also
figured among the sets of coincident QTLs, sug-
gesting that they are definitive and reliable QTLs.
In the two mapping populations, the pheno-
typic variation explained (PVE) by individual
QTLs varied in an individual environment and
showed positive relationship with the LOD scores
Table 1 Simple correlations among seven yield contributing traits in P I and P II
Correlations BY GY HI SL SPS GPS
TPP 0.41**, 0.70** 0.24*, 0.45** –0.20*, –0.05 –0.03, –0.03 –0.03, 0.04 –0.13, 0.09BY 0.75**, 0.62** 0.36**, –0.08 0.64**, 0.33** 0.78**, 0.33** 0.66**, 0.40**GY 0.88**, 0.70** 0.80**, –0.05 0.85**, –0.14 0.78**, 0.64**HI 0.85**, –0.35** 0.86**, –0.45** 0.82**, 0.44**SL 0.94**, 0.57** 0.91**, 0.17SPS 0.95**, 0.17
* Significant at P < 0.05. ** Significant at P < 0.01. For each entry, the first figure belongs to P I and the second to P II
Mol Breeding (2007) 19:163–177 165
123

Ta
ble
2R
esu
lts
of
com
po
site
inte
rva
lm
ap
pin
gfo
ry
ield
an
dy
ield
con
trib
uti
ng
tra
its
inp
op
ula
tio
nI
(PI)
Ch
rom
oso
me
arm
aM
ark
er
inte
rva
lsb
QT
Ls
Po
siti
on
(cM
)L
OD
cA
PV
E(%
)
Til
lers
per
pla
nt
3A
LX
gw
m720-X
gw
m1063
(2;
II)
QT
p.c
csu
-3A
.144.5
13.2
00.3
712.5
07A
LX
gw
m1065-X
gw
m332
(6;
V,
VI,
P)
QT
p.c
csu
-7A
.3162.5
1/1
54.5
1/1
62.7
13.7
4/3
.40
/2.0
00.5
3/0
.74/0
.17
12.0
6/1
7.1
3/6
.17
7B
LX
gw
m897-X
gw
m1085
(3;
IV)
QT
p.c
csu
-7B
.168.8
13.3
2–0.7
612.5
9B
iolo
gic
al
yie
ld2B
LX
gw
m410-X
gw
m319
(5;
I,II
I,P
)Q
By.c
csu
-2B
.339.3
1/3
9.3
1/4
1.2
12.1
4/3
.02/4
.47
–3.2
1/–
2.2
2/–
1.4
27.4
0/1
0.6
9/1
2.0
24A
LX
gw
m959-X
gw
m832
(6;
IV,
V,
P)
QB
y.c
csu
-4A
.270.0
1/7
8.9
1/7
8.9
13.0
9/5
.32
/6.9
54.8
1/2
.94/2
.37
17.7
7/2
0.2
1/2
1.2
5G
rain
yie
ld1D
LX
gw
m957-X
gw
m232
(2;
II,
V)
QG
y.c
csu
-1D
.140.9
1/4
9.7
14.9
1/2
.06
–0.8
4/–
0.3
421.9
1/6
.53
2D
LX
wm
c41-X
gw
m608
(7;
I,II
,II
I)Q
Gy.c
csu
-2D
.298.3
1/9
8.3
1/9
8.3
12.5
6/3
.20/2
.22
0.4
8/0
.59/0
.45
8.8
6/1
0.8
6/7
.31
2D
LX
gw
m539-X
gd
m149
(11;
VI)
QG
y.c
csu
-2D
.3136.0
14.9
5–0.7
423.8
33B
LX
gw
m655-X
gw
m547
(9;
IV)
QG
y.c
csu
-3B
.3183.0
13.2
6–1.4
618.6
34A
SX
gw
m1093-X
gw
m894
(3;
IV)
QG
y.c
csu
-4A
.122.0
15.1
2–1.5
120.7
64D
LX
gw
m819-X
gw
m976
(2;
V)
QG
y.c
csu
-4D
.163.2
13.5
70.4
612.0
57A
SX
gw
m130-X
gw
m1171
(1;
IV)
QG
y.c
csu
-7A
.336.0
14.8
0–2.1
547.3
87A
LX
gw
m332-X
gw
m698
(7;
V)
QG
y.c
csu
-7A
.4186.7
13.3
50.8
038.3
0H
arv
est
ind
ex
2B
LX
gw
m1249-X
wm
c272
(7;
III)
QH
i.cc
su-2
B.2
53.9
13.3
31.8
912.1
33A
LX
gw
m155-X
wm
c83
(4;
II)
QH
i.cc
su-3
A.2
90.6
14.2
6–2.4
014.2
74A
LX
gw
m959-X
gw
m832
(6;
IV,
V,
P)
QH
i.cc
su-4
A.2
78.0
1/8
0.9
1/
80.9
12.7
0/4
.28
/4.7
4–2.0
2/–
3.7
1/–
1.7
68.4
3/1
9.3
8/1
9.0
9
Sp
ike
len
gth
2B
LX
wm
c272-X
wm
c474
(8;
I,II
,II
I,IV
,V
,V
I,P
)Q
Sl.
ccsu
-2B
.555.8
1/5
3.9
1/5
3.9
1/5
5.8
1/5
9.8
1/5
5.8
1/5
3.9
12.8
1/3
.46
/5.0
9/
4.5
7/2
.07/5
.98
/4.8
1–0.2
7/–
0.3
0/–
0.3
8/
–0.3
6/–
0.2
7/–
0.4
1/–
0.3
5
9.8
6/1
2.2
8/1
8.1
0/
14.8
0/9
.31/
18.0
2/1
7.0
1
2D
LX
gw
m349-X
gw
m382
(13;
V)
QS
l.cc
su-2
D.5
185.6
13.2
9–0.3
311.3
6S
pik
ele
tsp
er
spik
e2B
SX
gw
m1128-X
gw
m682
(1;
III)
QS
ps.
ccsu
-2B
.220.0
14.4
8–0.4
815.8
14A
LX
gw
m959-X
gw
m832
(6;
I,IV
,V
I,P
)Q
Sp
s.cc
su-4
A.5
50.0
1/8
8.9
1/7
8.0
1/
78.9
12.3
1/2
.00/3
.29
/3.4
40.6
0/0
.50/0
.62/0
.42
8.4
9/7
.18/1
2.5
1/1
2.2
16A
LX
gw
m570-X
gw
m1040
(6;
IV)
QS
ps.
ccsu
-6A
.390.4
13.3
90.5
112.4
6G
rain
sp
er
spik
e2A
SX
gw
m1115-X
gw
m1052
(6;
IV)
QG
ps.
ccsu
-2A
.378.2
13.4
8–2.3
410.8
74B
SX
wm
c42-X
gw
m898
(1;
V)
QG
ps.
ccsu
-4B
.40.0
14.0
1–2.3
514.2
87A
SX
gw
m1171-X
wm
c9(2
;II
,V
I)Q
Gp
s.cc
su-7
A.2
51.7
1/5
1.7
13.7
1/2
.73
3.1
4/–
1.9
017.6
1/8
.92
7A
LX
gw
m870-X
gw
m913
(4;
P)
QG
ps.
ccsu
-7A
.3128.7
13.3
8–1.2
210.5
0
aC
hro
mo
som
ea
rms
carr
yin
gco
inci
de
nt
QT
La
resh
ow
nin
bo
ldb
Inp
are
nth
ese
s,a
rab
icn
um
era
lsa
reth
em
ark
er
inte
rva
ls,
foll
ow
ed
by
rom
an
nu
me
rals
ind
ica
tin
ge
nv
iro
nm
en
ts,
inw
hic
hth
eQ
TL
wa
sd
ete
cte
dc
LO
Dsc
ore
tha
te
xce
ed
sth
eth
resh
old
are
sho
wn
as
bo
ld(Q
TL
sb
elo
wa
LO
Dsc
ore
of
3.0
we
ren
ot
incl
ud
ed
,e
xce
pt
wh
ere
QT
Ls
we
rea
va
ila
ble
on
lya
tL
OD
>2
<3
).P
VE
,P
he
no
typ
icv
ari
ati
on
ex
pla
ine
d.
A,
Ad
dit
ive
eff
ect
166 Mol Breeding (2007) 19:163–177
123

Ta
ble
3R
esu
lts
of
com
po
site
inte
rva
lm
ap
pin
gfo
ry
ield
an
dy
ield
con
trib
uti
ng
tra
its
inp
op
ula
tio
nII
(PII
)
Ch
rom
oso
me
arm
aM
ark
er
inte
rva
lsb
QT
Ls
Po
siti
on
(cM
)L
OD
cA
PV
E(%
)
Til
lers
per
pla
nt
1A
LX
mw
g632-X
mw
g912
(16;
IV)
QT
p.c
csu
-1A
.1145.1
14.7
6–0.6
818.5
61B
SX
bcd
1124-X
cdo
1173
(6;
I)Q
Tp
.ccs
u-1
B.1
31.8
13.0
20.9
59.0
63B
LX
fbb
293-X
tam
63
(82;
IV)
QT
p.c
csu
-3B
.3380.5
13.3
50.5
513.3
33D
LX
fba159-X
fbb
237
(29;
III)
QT
p.c
csu
-3D
.1151.9
14.4
7–1.1
518.1
94A
LX
bcd
1670-X
cdo
475
(8;
II)
QT
p.c
csu
-4A
.176.1
15.7
21.2
815.7
04A
LX
ksu
D9-X
bcd
130
(10;
P)
QT
p.c
csu
-4A
.287.1
13.1
70.5
48.8
76D
LX
bcd
1319-X
ksu
D27
(8;
I,II
,II
I,IV
,P
)Q
Tp
.ccs
u-6
D.1
114.9
1/1
20.9
1/1
36.0
1/
132.0
1/1
22.9
12.3
9/4
.10
/5.7
5/
2.8
5/5
.75
–0.8
7/–
1.2
7/
–1.0
1/
–0.4
6/–
0.8
97.4
2/1
6.1
9/2
1.6
0/
8.7
7/2
4.1
47A
SX
fba248-X
bcd
1066
(6;
II,
P)
QT
p.c
csu
-7A
.291.3
1/9
1.3
15.6
4/3
.47
–1.7
4/–
0.8
331.0
3/2
1.3
0B
iolo
gic
al
yie
ld1A
LX
ksu
H9-X
cdo
1160
(14;
III)
QB
y.c
csu
-1A
.1103.8
13.3
6–0.4
822.6
82A
SX
cdo
57-X
ksu
D18
(4;
I,P
)Q
By.c
csu
-2A
.214.9
1/1
2.9
14.1
3/4
.52
–0.4
1/–
3.0
416.3
5/1
3.2
92B
SX
cdo
405-X
cdo
152
(8;
IV)
QB
y.c
csu
-2B
.135.5
13.7
10.3
913.6
13B
LX
bcd
1418-X
mw
g818
(37;
II)
QB
y.c
csu
-3B
.1167.4
13.7
8–0.3
610.9
76D
LX
bcd
1319-X
ksu
D27
(8;
II,
III)
QB
y.c
csu
-6D
.1116.9
1/1
26.9
12.9
3/3
.47
–0.3
1/–
0.3
89.6
3/1
3.3
37A
LX
gw
m276-X
ksu
H9
(10;
III)
QB
y.c
csu
-7A
.1137.2
13.0
6–0.4
111.4
0G
rain
yie
ld1A
LX
bcd
265-X
ksu
H9
(13;
I,II
)Q
Gy.c
csu
-1A
.279.4
1/7
6.4
13.8
7/4
.37
–1.7
4/–
1.6
211.1
7/1
0.5
62A
SX
cdo
57-X
ksu
D18
(4;
P)
QG
y.c
csu
-2A
.112.9
13.7
6–0.9
69.9
12D
SX
gw
m261-X
cdo
1379
(6;
II,
III,
IV,
P)
QG
y.c
csu
-2D
.136.1
1/4
2.1
1/4
2.1
1/3
6.1
16.8
6/1
0.0
6/8
.11
/9.0
0–2.4
8/–
2.0
0/–
1.1
3/–
1.8
526.2
8/4
1.1
7/3
5.7
0/3
7.2
44B
LX
fbb
178-X
fbb
67
(8;
I,P
)Q
Gy.c
csu
-4B
.140.9
1/4
9.8
15.0
6/3
.43
–2.0
7/–
1.1
616.3
44B
LX
fbb
67-X
fba177
(9;
II)
QG
y.c
csu
-4B
.256.3
14.2
1–1.9
316.1
9/1
5.4
16D
LX
bcd
1319-X
ksu
D27
(8;
II)
QG
y.c
csu
-6D
.1118.9
16.3
0–2.2
020.5
7H
arv
est
ind
ex
2D
SX
gw
m261-X
cdo
1379
(6;
II,
III,
IV,
P)
QH
i.cc
su-2
D.2
40.1
1/4
0.1
1/4
2.1
1/4
0.1
112.7
3/1
3.2
0/4
.48
/8.5
7–5.1
7/–
6.3
2/–
4.3
2/–
4.1
442.4
3/5
2.1
4/2
2.6
1/3
2.7
12D
SX
cdo
1379-X
bcd
262
(7;
I)Q
Hi.
ccsu
-2D
.252.5
13.6
7–2.7
413.6
63B
LX
fbb
293-X
tam
63
(82;
IV)
QH
i.cc
su-3
B.1
382.5
13.1
14.1
110.5
74B
LX
cdo
1312-X
fbb
178
(8;
IV,
P)
QH
i.cc
su-4
B.1
45.8
1/4
3.8
13.0
3/2
.04
–3.4
1/–
1.3
914.5
7/4
.84
6A
LX
gw
m494-X
cdo
1428
(6;
I)Q
Hi.
ccsu
-6A
.273.9
13.5
4–2.4
310.6
2S
pik
ele
ngth
1A
SX
ab
c156-X
ksu
E18
(6;
IV)
QS
l.cc
su-1
A.1
27.6
14.8
70.4
514.4
81B
LX
ksu
G34-X
bcd
1562
(16;
III)
QS
l.cc
su-1
B.3
103.0
13.3
70.5
29.7
41D
LX
Ad
h-X
AT
Pase
(15;
II)
QS
l.cc
su-1
D.1
155.1
14.1
3–0.5
811.6
82D
SX
bcd
102-X
gw
m296
(4;
III,
P)
QS
l.cc
su-2
D.1
19.1
1/1
6.9
13.3
0/5
.55
0.5
3/0
.51
9.9
9/1
6.7
22D
SX
gw
m261-X
cdo
1379
(6;
II)
QS
l.cc
su-2
D.2
46.1
18.7
20.9
430.1
54A
LX
mw
g549-X
bcd
1670
(7;
II)
QS
l.cc
su-4
A.2
75.1
14.5
2–0.6
011.6
94A
LX
fba231-X
cdo
545
(12;
III,
P)
QS
l.cc
su-4
A.3
99.5
1/1
01.5
14.6
5/4
.13
–0.6
4/–
0.3
915.5
1/1
0.4
65A
LX
bcd
1235.1
-Xb
cd183
(10;
I,IV
,P
)Q
Sl.
ccsu
-5A
.197.9
1/9
3.9
1/9
5.9
14.5
7/2
.51/3
.36
0.6
5/0
.34/0
.40
16.3
0/9
.17/1
0.6
85D
LX
gw
m174-X
gw
m182
(9;
IV)
QS
l.cc
su-5
D.1
71.2
15.1
4–0.5
522.2
9S
pik
ele
tsp
er
spik
e2D
SX
gw
m261-X
cdo
1379
(6;
II,
III,
P)
QS
ps.
ccsu
-2D
.250.5
1/5
8.5
1/5
2.5
110.0
5/5
.27
/3.9
42.0
4/1
.19/0
.95
29.6
2/1
9.1
5/1
3.4
64A
LX
gw
m637-X
mw
g549
(6;
II,
P)
QS
ps.
ccsu
-4A
.171.2
1/7
6.1
14.2
5/2
.49
–1.1
6/–
0.5
911.2
2/5
.81
4D
SX
mw
g634-X
bcd
265
(1;
IV)
QS
ps.
ccsu
-4D
.108.0
12.7
30.9
016.5
65A
LX
mw
g522-X
mw
g624
(8;
III)
QS
ps.
ccsu
-5A
.171.1
13.5
80.7
79.1
75A
LX
bcd
1235.1
-Xb
cd183
(10;
I,P
)Q
Sp
s.cc
su-5
A.2
89.9
1/8
7.0
17.6
0/2
.32
1.5
4/0
.58
24.0
4/5
.78
Mol Breeding (2007) 19:163–177 167
123
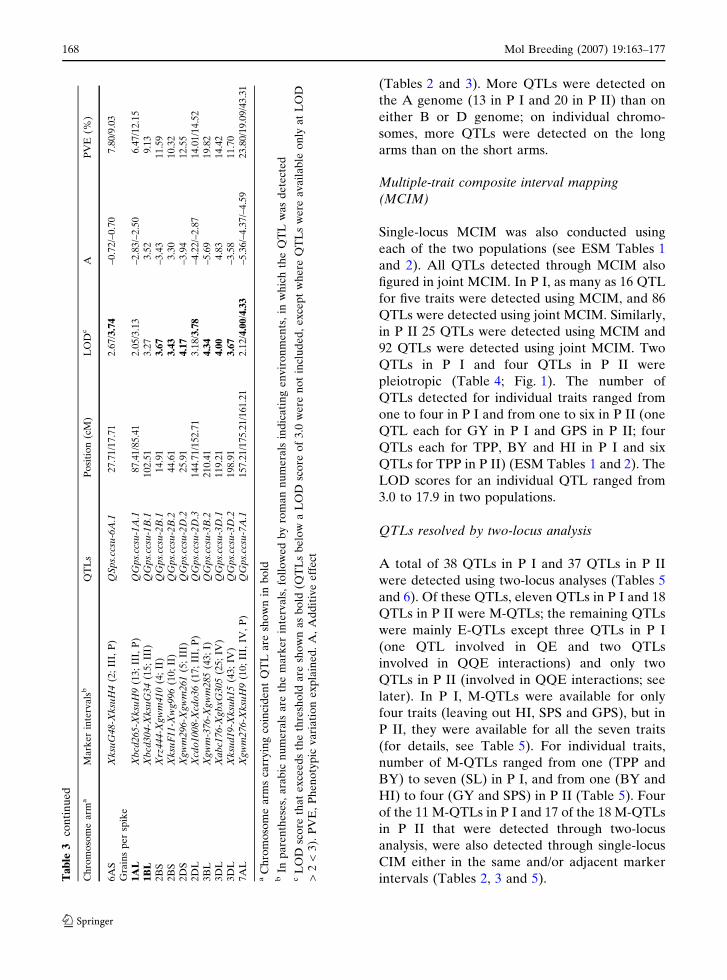
(Tables 2 and 3). More QTLs were detected on
the A genome (13 in P I and 20 in P II) than on
either B or D genome; on individual chromo-
somes, more QTLs were detected on the long
arms than on the short arms.
Multiple-trait composite interval mapping
(MCIM)
Single-locus MCIM was also conducted using
each of the two populations (see ESM Tables 1
and 2). All QTLs detected through MCIM also
figured in joint MCIM. In P I, as many as 16 QTL
for five traits were detected using MCIM, and 86
QTLs were detected using joint MCIM. Similarly,
in P II 25 QTLs were detected using MCIM and
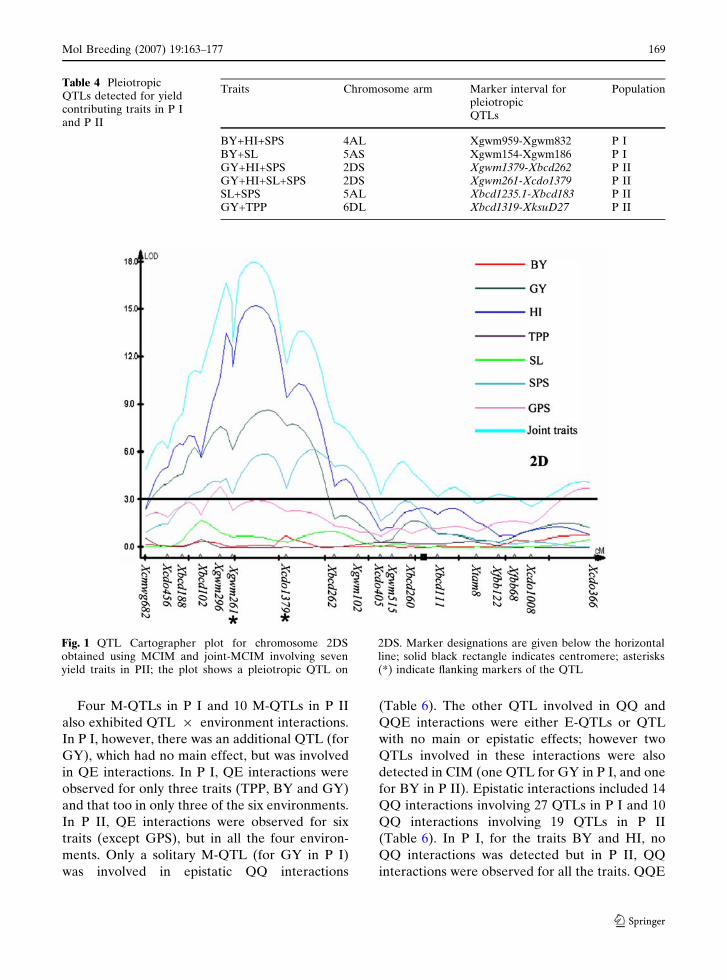
92 QTLs were detected using joint MCIM. Two
QTLs in P I and four QTLs in P II were
pleiotropic (Table 4; Fig. 1). The number of
QTLs detected for individual traits ranged from
one to four in P I and from one to six in P II (one
QTL each for GY in P I and GPS in P II; four
QTLs each for TPP, BY and HI in P I and six
QTLs for TPP in P II) (ESM Tables 1 and 2). The
LOD scores for an individual QTL ranged from
3.0 to 17.9 in two populations.
QTLs resolved by two-locus analysis
A total of 38 QTLs in P I and 37 QTLs in P II
were detected using two-locus analyses (Tables 5
and 6). Of these QTLs, eleven QTLs in P I and 18
QTLs in P II were M-QTLs; the remaining QTLs
were mainly E-QTLs except three QTLs in P I
(one QTL involved in QE and two QTLs
involved in QQE interactions) and only two
QTLs in P II (involved in QQE interactions; see
later). In P I, M-QTLs were available for only
four traits (leaving out HI, SPS and GPS), but in
P II, they were available for all the seven traits
(for details, see Table 5). For individual traits,
number of M-QTLs ranged from one (TPP and
BY) to seven (SL) in P I, and from one (BY and
HI) to four (GY and SPS) in P II (Table 5). Four
of the 11 M-QTLs in P I and 17 of the 18 M-QTLs
in P II that were detected through two-locus
analysis, were also detected through single-locus
CIM either in the same and/or adjacent marker
intervals (Tables 2, 3 and 5).Ta
ble
3co
nti
nu
ed
Ch
rom
oso
me
arm
aM
ark
er
inte
rvals
bQ
TL
sP
osi
tio
n(c
M)
LO
Dc
AP
VE
(%)
6A
SX
ksu
G48-X
ksu
H4
(2;
III,
P)
QS
ps.
ccsu
-6A
.127.7
1/1
7.7
12.6
7/3
.74
–0.7
2/–
0.7
07.8
0/9
.03
Gra
ins
per
spik
e1A
LX
bcd
265-X
ksu
H9
(13;
III,
P)
QG
ps.
ccsu
-1A
.187.4
1/8
5.4
12.0
5/3
.13
–2.8
3/–
2.5
06.4
7/1
2.1
51B
LX
bcd
304-X
ksu
G34
(15;
III)
QG
ps.
ccsu
-1B
.1102.5
13.2
73.5
29.1
32B
SX
rz444-X
gw
m410
(4;
II)
QG
ps.
ccsu
-2B
.114.9
13.6
7–3.4
311.5
92B
SX
ksu
F11-X
wg996
(10;
II)
QG
ps.
ccsu
-2B
.244.6
13.4
33.3
010.3
22D
SX
gw
m296-X
gw
m261
(5;
III)
QG
ps.
ccsu
-2D
.225.9
14.1
7–3.9
412.5
52D
LX
cdo
1008-X
cdo
36
(17;
III,
P)
QG
ps.
ccsu
-2D
.3144.7
1/1
52.7
13.1
8/3
.78
–4.2
2/–
2.8
714.0
1/1
4.5
23B
LX
gw
m-3
76-X
gw
m285
(43;
I)Q
Gp
s.cc
su-3
B.2
210.4
14.3
4–5.6
919.8
23D
LX
ab
c176-X
gb
xG
305
(25;
IV)
QG
ps.
ccsu
-3D
.1119.2
14.0
04.8
314.4
23D
LX
ksu
d19-X
ksu
h15
(43;
IV)
QG
ps.
ccsu
-3D
.2198.9
13.6
7–3.5
811.7
07A
LX
gw
m276-X
ksu
H9
(10;
III,
IV,
P)
QG
ps.
ccsu
-7A
.1157.2
1/1
75.2
1/1
61.2
12.1
2/4
.00
/4.3
3–5.3
6/–
4.3
7/–
4.5
923.8
0/1
9.0
9/4
3.3
1
aC
hro
mo
som
ea
rms
carr
yin
gco
inci
de
nt
QT
La
resh
ow
nin
bo
ldb
Inp
are
nth
ese
s,a
rab
icn
um
era
lsa
reth
em
ark
er
inte
rva
ls,
foll
ow
ed
by
rom
an
nu
me
rals
ind
ica
tin
ge
nv
iro
nm
en
ts,
inw
hic
hth
eQ
TL
wa
sd
ete
cte
dc
LO
Dsc
ore
tha
te
xce
ed
sth
eth
resh
old
are
sho
wn
as
bo
ld(Q
TL
sb
elo
wa
LO
Dsc
ore
of
3.0
we
ren
ot
incl
ud
ed
,e
xce
pt
wh
ere
QT
Ls
we
rea
va
ila
ble
on
lya
tL
OD
>2
<3
).P
VE
,P
he
no
typ
icv
ari
ati
on
ex
pla
ine
d.
A,
Ad
dit
ive
eff
ect
168 Mol Breeding (2007) 19:163–177
123
Four M-QTLs in P I and 10 M-QTLs in P II
also exhibited QTL · environment interactions.
In P I, however, there was an additional QTL (for
GY), which had no main effect, but was involved
in QE interactions. In P I, QE interactions were
observed for only three traits (TPP, BY and GY)
and that too in only three of the six environments.
In P II, QE interactions were observed for six
traits (except GPS), but in all the four environ-
ments. Only a solitary M-QTL (for GY in P I)
was involved in epistatic QQ interactions
(Table 6). The other QTL involved in QQ and
QQE interactions were either E-QTLs or QTL
with no main or epistatic effects; however two
QTLs involved in these interactions were also
detected in CIM (one QTL for GY in P I, and one
for BY in P II). Epistatic interactions included 14
QQ interactions involving 27 QTLs in P I and 10
QQ interactions involving 19 QTLs in P II
(Table 6). In P I, for the traits BY and HI, no
QQ interactions was detected but in P II, QQ
interactions were observed for all the traits. QQE
Table 4 PleiotropicQTLs detected for yieldcontributing traits in P Iand P II
Traits Chromosome arm Marker interval forpleiotropicQTLs
Population
BY+HI+SPS 4AL Xgwm959-Xgwm832 P IBY+SL 5AS Xgwm154-Xgwm186 P IGY+HI+SPS 2DS Xgwm1379-Xbcd262 P IIGY+HI+SL+SPS 2DS Xgwm261-Xcdo1379 P IISL+SPS 5AL Xbcd1235.1-Xbcd183 P IIGY+TPP 6DL Xbcd1319-XksuD27 P II
Fig. 1 QTL Cartographer plot for chromosome 2DSobtained using MCIM and joint-MCIM involving sevenyield traits in PII; the plot shows a pleiotropic QTL on
2DS. Marker designations are given below the horizontalline; solid black rectangle indicates centromere; asterisks(*) indicate flanking markers of the QTL
Mol Breeding (2007) 19:163–177 169
123

interactions (six QTLs) were also observed and
included three QQE interactions (involving six
QTLs) in P I; out of six QTLs, four were E-QTLs
(for GY) and the remaining two QTLs (for TPP)
were only involved in QQE interactions. Simi-
larly, in P II four QQE interactions (eight QTLs)
were detected; out of eight QTLs, six were
E-QTLs involving three traits (BY, GY and HI)
and remaining two QTLs (for HI) were involved
in QQE interactions only. None of the QQs for
SL, SPS and GPS in P I and for TPP, SL, SPS and
GPS in P II exhibited interaction with the
environment (Table 6).
Common QTLs resolved in both the populations
Since mapped markers used for QTL analysis in
two populations differed, a comparison of marker
Table 5 QTLs with main effects and those involved in interaction with the environment for yield and yield contributingtraits in bread wheat detected in P I and P II following two-locus analysis
Trait/Marker intervala QTLs Chromosome arm andPosition (cM)
A AE
Tillers per plantXgwm1065-Xgwm332 (6; P I) QTp.ccsu-7A.3 7AL (159.5) 0.25 –0.46 (AE4)Xbcd1670-Xcdo475 (8; P II) QTp.ccsu-4A.1 4AL (79.1) 0.49 0.71 (AE2)Xbcd1319-XksuD27 (8; P II) QTp.ccsu-6D.1 6DL (120.9) –0.89 –Xfba248-Xbcd1066 (6; P II) QTp.ccsu-7A.2 7AS (98.3) –0.68 –0.46 (AE2)Biological yieldXgwm130-Xgwm1171 (1; P I) QBy.ccsu-7A.2 7AS (26.0) –2.29 –4.76 (AE4)Xcdo57-XksuD18 (5; P II) QBy.ccsu-2A.2. 2AS (14.0) –3.12 –3.17 (AE1); 2.11 (AE4)Grain yieldXgwm232-Xgdm111 (3; P I) QGy.ccsu-1D.2 1DL (48.7) – 0.70 (AE4)Xgwm938-Xgwm980 (7; P I) QGy.ccsu-3B.4 3BL (141.5) –0.31 0.34 (AE5)Xgwm130-Xgwm1171 (1; P I) QGy.ccsu-7A.3 7AS (25.0) –0.34 –1.81 (AE4)Xbcd265-XksuH9.1 (13; P II) QGy.ccsu-1A.2 1AL (80.4) –0.83 –0.58 (AE1)Xgwm261-Xcdo1379 (6; P II) QGy.ccsu-2D.1 2DS (35.1) –1.67 0.69 (AE3)Xfbb178-Xfbb67 (8; PII) QGy.ccsu-4B.1 4BL (49.8) –1.04 –0.74 (AE1)Xbcd1319-XksuD27 (8; P II) QGy.ccsu-6D.1 6DL (117.9) –0.64 –1.03 (AE2)Harvest indexXgwm261-Xcdo1379 (6; P II) QHi.ccsu-2D.2 2DS (39.1) –4.66 1.67 (AE1)Spike lengthXgwm357-Xwmc312 (6; P I) QSl.ccsu-1A.5 1AL (91.0) –0.24 –Xwmc453-Xgwm1256 (14; P I) QSl.ccsu-2A.6 2AL (132.6) 0.17 –Xgwm1249-Xwmc272 (7; P I) QSl.ccsu-2B.7 2BL (54.9) –0.29 –Xgwm186-Xgwm1236 (2; P I) QSl.ccsu-5A.2 5AL (37.0) –0.18 –Xgwm700-Xgwm182 (2; P I) QSl.ccsu-5D.4 5DL (15.4) –0.11 –Xwmc256-Xgwm570 (5; P I) QSl.ccsu-6A.1 6AL (64.7) –0.19 –Xgwm825-Xgwm768 (2; P I) QSl.ccsu-6B.3 6BS (21.3) 0.13 –Xbcd102-Xgwm296 (4; P II) QSl.ccsu-2D.1 2DS (19.1) 0.33 –0.20 (AE4)Xfba231-Xcdo545 (12; P II) QSl.ccsu-4A.3 4AL (101.5) –0.35 –Xbcd1235.1-Xbcd183 (10; P II) QSl.ccsu-5A.1 5AL (96.9) 0.52 –Spikelets per spikeXcdo1379-Xbcd262 (7; P II) QSps.ccsu-2D.2 2DS (52.5) 1.16 0.83 (AE2); –0.84 (AE4)Xbcd1670-Xcdo475 (8; P II) QSps.ccsu-4A.1 4AL (76.1) –0.64 –Xmwg522-Xmwg624 (8; P II) QSps.ccsu-5A.1 5AL (71.1) 0.47 –XksuG48-XksuH4 (2; P II) QSps.ccsu-6A.1 6AS (23.7) –0.84 –Grains per spikeXksuH9.1-Xcdo1160 (14; P II) QGps.ccsu-1A.1 1AL (103.8) –3.19 –Xgwm296-Xgwm261 (5; P II) QGps.ccsu-2D.2 2DS (25.9) –3.12 –
a In parentheses, arabic numerals are the marker intervals, followed by P I = Population I and P II = Population II. A,additive effect; AE1, AE2, AE3, AE4 and AE5, QTL · environment interaction effects for environments 1, 2, 3, 4 and 5,respectively
170 Mol Breeding (2007) 19:163–177
123

Ta
ble
6Q
TL
sin
tera
ctio
ns
inv
olv
ing
(Q·
Qo
rQ
·Q
·E
)fo
ry
ield
an
dy
ield
con
trib
uti
ng
tra
its
inb
rea
dw
he
at
de
tect
ed
inP
Ia
nd
PII
foll
ow
ing
two
-lo
cus
an
aly
sis
Tra
it/M
ark
er
inte
rva
laQ
TL
sC
hro
mo
som
ea
rma
nd
po
siti
on
(cM
)M
ark
er
inte
rva
laQ
TL
sC
hro
mo
som
ea
rma
nd
po
siti
on
(cM
)A
AA
AE
Til
lers
per
pla
nt
Xw
mc2
89-X
gw
m720
(1;
PI)
QT
p.c
csu
-3A
.23A
S(0
.0)
Xw
mc2
56-X
gw
m570
(5;
PI)
QT
p.c
csu
-6A
.26A
L(8
7.7
)–
0.6
4(A
AE
4);
–0.3
9(A
AE
6)
Xb
cd1261-X
ksu
E11
(17;
PII
)Q
Tp
.ccs
u-1
D.2
1D
L(1
79.5
)X
ab
g460-X
cdo
1164
(10;
PII
)Q
Tp
.ccs
u-3
A.2
3A
S(6
6.3
)–0.5
6–
Bio
logic
al
yie
ldX
cdo
393-X
wg241
(18;
PII
)Q
By.c
csu
-1A
.21A
L(1
50.3
)X
cdo
405-X
bcd
152.1
(8;
PII
)Q
By.c
csu
-2B
.12B
S(3
3.5
)2.9
12.0
1(A
AE
1);
–1.8
3(A
AE
3)
Xcd
o795-X
bcd
1262
(3;
PII
)Q
By.c
csu
-4B
.24B
S(1
6.0
)X
cdo
475-X
ab
c158
(4;
PII
)Q
By.c
csu
-7A
.67A
S(5
2.8
)–2.4
9–
Gra
inyie
ldX
gw
m608-X
gw
m1264
(8;
PI)
QG
y.c
csu
-2D
.42D
L(1
01.7
)X
gw
m819-X
gw
m976
(2;
PI)
QG
y.c
csu
-4D
.14D
L(7
9.2
)0.6
00.7
1(A
E4)
Xgw
m980-X
gw
m655
(8;
PI)
QG
y.c
csu
-3B
.43B
L(1
57.8
)X
gw
m397-X
gw
m959
(5;
PI)
QG
y.c
csu
-4A
.24A
L(5
7.0
)–0.3
0–0.6
7(A
AE
2);
–0.5
9(A
AE
3);
0.9
0(A
AE
4)
Xw
g241-X
ksu
E11.2
(19;
PII
)Q
Gy.c
csu
-1A
.31A
L(1
55.2
)X
fba166-X
fba332
(18;
PII
)Q
Gy.c
csu
-5B
.15B
L(9
0.8
)0.7
90.8
3(A
AE
1);
–0.5
4(A
AE
4)
Xw
g241-X
ksu
E11.2
(19;
PII
)Q
Gy.c
csu
-1A
.31A
L(1
55.2
)X
cdo
638-X
psr
903
(22;
PII
)Q
Gy.c
csu
-3A
.13A
L(9
9.1
)–0.8
5–
Harv
est
ind
ex
Xfb
a347-X
gw
m391
(67;
PII
)Q
Hi.
ccsu
-3A
.33A
L(3
54.9
)X
bcd
1140-X
gw
m499
(12;
PII
)Q
Hi.
ccsu
-5B
.15B
L(5
9.0
)1.4
51.2
7(A
AE
1)
Xm
wg549-X
bcd
1670
(7;
PII
)Q
Hi.
ccsu
-4A
.34A
L(7
5.1
)X
wg114-X
gw
m126
(15;
PII
)Q
Hi.
ccsu
-5A
.25A
L(1
59.2
)–
–1.9
3(A
AE
4)
Sp
ike
len
gth
Xw
mc4
38-X
gw
m136
(1;
PI)
QS
l.cc
su-1
A.5
1A
S(0
.00)
Xgw
m234-X
gw
m213
(2;
PI)
QS
l.cc
su-5
B.2
5B
S(5
4.8
)–0.2
2–
Xgw
m1130-X
gw
m1078
(1;
PI)
QS
l.cc
su-1
B.4
1B
S(0
.00)
Xw
mc5
01-X
wm
c273
(6;
PI)
QS
l.cc
su-7
B.3
7B
L(1
05.1
)0.2
7–
Xgw
m1050-X
gw
m926
(3;
PI)
QS
l.cc
su-1
B.5
1B
L(2
1.6
)X
gw
m493-X
gw
m1037
(1;
PI)
QS
l.cc
su-3
B.2
3B
S(1
0.0
)0.2
4–
Xgw
m1050-X
gw
m926
(3;
PI)
QS
l.cc
su-1
B.5
1B
L(2
1.6
)X
gw
m963-X
wm
c501
(5;
PI)
QS
l.cc
su-7
B.2
7B
L(8
2.6
)–0.2
1–
Xgw
m614-X
gw
m830
(1;
PI)
QS
l.cc
su-2
A.5
2A
S(8
.00)
Xgw
m415b
-Xgw
m1043
(7;
PI)
QS
l.cc
su-5
B.3
5B
L(1
48.3
)0.2
3–
Mol Breeding (2007) 19:163–177 171
123

intervals carrying common QTLs was not always
possible except in few cases. There were only
three chromosome arms which carried QTLs for
the same trait in both the populations (common
QTL was detected only through CIM/MCIM; no
common QTL was detected in two-locus analy-
sis). These three arms included the following: (i)
4AL carrying QTL for SPS; (ii) 5AL carrying
QTL for SL, and (iii) 7AL carrying QTL for GPS.
However, positions of QTLs for SL (5AL) and
GPS (7AL) differed in P I and P II, suggesting
that different QTL on these arms were perhaps
detected in the two populations, unless the
populations differed for interchanges/inversions
on these chromosome arms. Thus, it seems that
only a solitary QTL for SPS (4AL) may be
common in the two populations used. The above
region on 4AL perhaps represents a gene-rich
region (GRR), because QTLs for several traits
are clustered in this region, which covers a
segment from 42.4 cM to 89.1 cM in P I, and
from 33.8 cM to 87.1 cM in P II.
Genetic variance configuration
During the present study, desirable alleles for the
different QTLs were distributed in both the
parents in each of the two populations. In P I,
among the two sets of important QTLs control-
ling four traits (BY, HI, SPS and SL), positive
QTL alleles for BY and SPS were carried by
PH132 and those for HI and SL were carried by
WL711. Similarly in P II, desirable QTL alleles
for GY, HI, TPP and GPS were carried by
Opata85 and those for SL and SPS were carried
by W7984.
Discussion
The results of the present study reconfirm that the
genetics of yield and yield components in bread
wheat is complex in nature, and is controlled by a
large number of major and minor QTLs. These
QTLs may have only main effects and/or may be
involved in epistatic (QQ) or environmental (QE,
QQE) interactions. The magnitude and directions
of the additive effects of individual QTLs may alsoTa
ble
6co
nti
nu
ed
Tra
it/M
ark
er
inte
rvala
QT
Ls
Ch
rom
oso
me
arm
an
dP
osi
tio
n(c
M)
Mark
er
inte
rvala
QT
Ls
Ch
rom
oso
me
arm
an
dP
osi
tio
n(c
M)
AA
AA
E
Xgw
m1264-X
gw
m1204
(9;
PI)
QS
l.cc
su-2
D.6
2D
L(1
09.7
)X
gw
m601-X
gw
m929
(1;
PI)
QS
l.cc
su-4
A.4
4A
S(0
.00)
–0.1
7–
Xgw
m1204-X
gw
m539
(10;
PI)
QS
l.cc
su-2
D.7
2D
L(1
25.6
)X
gw
m929-X
gw
m1093
(2;
PI)
QS
l.cc
su-4
A.5
4A
S(9
.00)
0.1
8–
Xgw
m513-X
gw
m375
(6;
PI)
QS
l.cc
su-4
B.1
4B
L(4
0.9
)X
gw
m745-X
gw
m577
(8;
PI)
QS
l.cc
su-7
B.6
7B
L(1
31.5
)–0.2
1–
Xk
suH
4-X
cdo
270
(3;
PII
)Q
Sl.
ccsu
-6A
.36A
S(3
7.4
)X
cdo
836-X
ksu
D27
(13;
PII
)Q
Sl.
ccsu
-6A
.46A
L(1
26.9
)0.3
6–
Sp
ikele
tsp
er
spik
eX
gw
m122-X
gw
m1045
(11;
PI)
QS
ps.
ccsu
-2A
.22A
S(9
6.7
)X
gw
m295-X
gw
m676
(3;
PI)
QS
ps.
ccsu
-7A
.37D
L(6
6.1
)–0.3
2–
Xw
mc2
89-X
gw
m720
(1;
PI)
QS
ps.
ccsu
-3A
.13A
S(3
2.0
)X
gw
m130-X
gw
m1171
(1;
PI)
QS
ps.
ccsu
-7A
.27A
S(0
.0)
–0.6
8–
Xgw
m131.2
-Xcd
o583
(35;
PII
)Q
Sp
s.cc
su-3
B.2
3B
L(1
59.9
)X
cdo
346.1
-Xb
cd1670.1
(15;
PII
)Q
Sp
s.cc
su-5
D.1
5D
L(1
45.6
)–0.5
5–
Gra
ins
per
spik
eX
gw
m513-X
gw
m375
(6;
PI)
QG
ps.
ccsu
-4B
.54B
L(4
0.9
)X
gw
m913-X
gw
m1065
(5;
PI)
QG
ps.
ccsu
-7A
.47A
L(1
37.5
)1.5
9–
Xk
suE
18.1
-Xcd
o580
(7;
PII
)Q
Gp
s.cc
su-1
A.3
1A
S(3
4.8
)X
gw
m403-X
bcd
442
(2;
PII
)Q
Gp
s.cc
su-5
A.3
5A
S(7
7.2
)3.2
1–
aIn
pa
ren
the
ses,
ara
bic
nu
me
rals
are
the
ma
rke
rin
terv
als
,fo
llo
we
db
yP
I=
Po
pu
lati
on
Ia
nd
PII
=P
op
ula
tio
nII
.A
Aa
dd
itiv
ee
ffe
ct;
AA
E1
,A
AE
2,
AA
E3
,A
AE
4,
AA
E5
an
dA
AE
6e
pis
tasi
sa
sso
cia
ted
wit
he
nv
iro
nm
en
ts1
,2
,3
,4
,5
an
d6
,re
spe
ctiv
ely
172 Mol Breeding (2007) 19:163–177
123

vary due to genetic background of different geno-
types and due to epistatic-by-environment inter-
actions. However, it was intriguing to find that most
major QTLs, which explained large proportion of
phenotypic variation and/or detected at high LOD
scores were those, which were not only consistent
over environments, but were also pleiotropic, and/
or coincident with QTLs for other traits.
In majority of QTL studies in bread wheat
conducted in the recent past, no interactions
(QE, QQ and QQE) were examined (Shah et al.
1999; Araki et al. 1999; Kato et al. 2000; Borner
et al. 2002; Campbell et al. 2003; Groos et al.
2003; Huang et al. 2003, 2004; Quarrie et al.
2005; Marza et al. 2006; Narasimhamoorthy
et al. 2006). We believe that QTL analysis
having no provision for detecting these interac-
tions would generally lead to a biased estimate
of main-effect QTLs, and consequently result in
considerable loss of response in marker assisted
selection (MAS). Knowledge about genetic var-
iance configuration and estimates of breeding
value are also important for achieving higher
response in MAS (Li et al. 2003). Another
important aspect of the present study is the use
of two populations, which permitted detection of
many more QTL. Surprisingly, only a solitary
QTL (on 4AL) was detected in both the popu-
lations, suggesting that for complete genetic
dissection of a trait, several diverse mapping
populations should be examined.
Comparison of P I and P II
Relatively fewer QTLs were detected in P I than in
P II. This may be partly because of low density of
marker loci on P I framework map (173) than in P
II (521) used in the present study and partly due to
more divergent parents used for developing P II
(ITMIpop). It may also be noted that in P I, D
genome carried the minimum number of QTLs,
perhaps due to relatively fewer markers mapped
on this genome as compared to the other two
genomes (Prasad et al. 2003). Similar situation was
available in another recent study (Quarrie et al.
2005). One may speculate that with increase in
density of markers on D genome, more QTL will
be detected on this genome in P I also.
Efficiency of two-locus analyses
When the results of two-locus QTL analysis were
compared with those of single-locus analysis
(including CIM and MCIM), it was interesting
to note that 17 of the 18 M-QTLs detected
following two-locus analysis in P II were also
detected following single-locus analysis (CIM and
in joint analysis of MCIM) either in the same and/
or adjacent intervals for all the traits. However, in
P I, only four of the 11 QTL detected in two locus
analyses were available in CIM. This also suggests
that many QTL detected through two locus
analysis escape detection in CIM and also that
this feature is more conspicuous in some popula-
tions than in others (perhaps also due to density
of the map that is used for QTL analysis).
It is also apparent in the present results that the
QTLs involved in QE interactions are mainly M-
QTLs, while QTLs involved in QQ/QQE inter-
actions are the QTLs, which have no main effects.
This suggests that many QTLs have no main
effects and exercise their effect through interac-
tions with other QTLs, which are either M-QTL
or E-QTLs. These QTLs will escape detection in
the analyses, where M-QTLs are first identified,
and interactions are examined only among these
M-QTLs. Also as expected, majority of QTLs
involved in QE interactions (five QE interactions
in P I and 10 in P II) are those, which were
detected only in one or two environments. The
so-called consistent QTL were stable and were
not involved in QE interaction. In addition to
other QQ interactions, there were three cases
(two in P I and one in P II), where same QTL is
involved in two epistatic interactions. In one of
these three interactions, a seemingly pleiotropic
QTL interacts with one QTL each for two
different traits (Fig. 2a, b, c).
Pleiotropic QTLs
Since the yield traits are correlated, MCIM and
joint MCIM were also conducted to detect
pleiotropic QTLs. Out of 86 QTLs detected
through MCIM and joint MCIM, some individual
QTLs that were available for more than one trait
in MCIM also figured in joint MCIM. Two such
pleiotropic QTLs in P I and four such QTLs in P
Mol Breeding (2007) 19:163–177 173
123

II were detected (Table 4 and Fig. 1). However,
additional sets of QTLs, which were coincident in
CIM were not detected by MCIM. This places
higher level of confidence in MCIM than in CIM
for detecting pleiotropic QTLs. This also sug-
gested that pleiotropy is the possible cause of the
correlations among yield traits. Molecular mech-
anism of pleiotropy has also been studied recently
suggesting that pleiotropy is largely due to con-
sequences of a single molecular function of the
gene product, rather than due to involvement of
the same gene product in several molecular
processes (Xionglei and Jianzhi 2006).
Two important genomic regions
In the present study following CIM, three
coincident M-QTLs for three traits (BY, HI
and SPS) were detected in the same marker
interval Xgwm959-Xgwm832 on chromosome
4AL in P I. Similarly, in P II consistent QTL
for five traits (GY, HI, SL, SPS and GPS) were
coincident in the interval Xgwm261-Xcdo1379
on 2DS. These coincident QTLs are largely
pleiotropic and consistent over environments. It
has been argued that the QTL(s) which are
detected in more than one environment or
detected by more than one method of QTL
analyses prove useful for marker assisted selec-
tion (Moncada et al. 2001). Therefore in P I,
the interval ‘Xgwm959-Xgwm832’ on 4AL asso-
ciated with QTLs for more than one trait is
important. Another important genomic region
that is associated with QTLs for more than one
trait was detected in P II and covers the
segment ‘Xgwm261-Xcdo1379-Xbcd262’ on
2DS. In earlier studies conducted by us, using
P II, this region on 2DS was also found
associated with growth traits (Kulwal et al.
2003), and two quality traits (grain protein
content and pre-harvest sprouting tolerance;
Kulwal et al. 2004, 2005). Borner et al. (2002)
also identified QTLs for 11 of the 20 agronomic
traits in the same region using the same
mapping population, thus confirming the signif-
icance of this region of chromosome 2DS.
Therefore, the above two segments one (on
4AL) identified in P I, and the other (on 2DS)
identified in P II, may be used in future for
MAS and high-resolution mapping leading to
Table 7 Homoeoloci detected for yield contributing traitsin population II
Trait Chromosomearm
Flankingmarkers
Method
SL 1AS Xabc156-XksuE18
CIM/JMCIM
1BS Xabc156-XksuE18
MCIM/JMCIM
GY/HI 4BL Xfbb178-Xfbb67
CIM
4DL Xgwm165-Xfbb178
JMCIM
GY 4BL Xfbb67-Xfba177
CIM
4DL Xfbb226-Xfba177
JMCIM
5AL Xcdo1326-Xabg391
JMCIM
5BL Xcdo1326-Xcdo584
JMCIM
GY/SPS 6AL XksuD27-Xfbb70
CIM/Twolocus
GY/BY/TPP
6DL Xbcd1319-XksuD27
JMCIM/CIM
Xwg241
XksuE11.2
1AL
5BL
3AL
Xfba166
Xfba332
Xcdo638
Xpsr903
P II
(a)
Xwmc289
Xgwm720
3AS
7AS
Xgwm570
Xgwm130
Xgwm1171
TPP/SPS
TPP
SPS
6ALXwmc256
Xgwm1050
Xgwm926
1BL
3BS
7BL
Xgwm493
Xgwm1037
Xgwm963
Xwmc501
P I P I
(c)(b)
Fig. 2 QTL · QTL interactions each involving three QTLs detected through two locus analyses (a) for SL in P I; (b) fortwo different traits (TPP and SPS), in P I and (c) for GY in P II
174 Mol Breeding (2007) 19:163–177
123

map-based cloning of QTLs for agronomically
important traits.
Homoeo-QTLs
In the present study, four homoeologous groups
(1, 4, 5 and 6) were also found to carry QTLs for
the same trait on seemingly similar position on
two of three homoeologous chromosomes. As
many as 10 QTLs belong to this class in P II
(Table 7). No such homoeo-QTLs were detected
in P I. This shows that perhaps QTLs also exhibit
the pattern of the presence of triplicate loci, a
characteristic of bread wheat, although one would
only seldom detect all the three homoeo-QTLs
for a specific trait in the same population.
Comparison with earlier studies
The results of the present study can also be
compared with the earlier studies conducted by
cytogenetic approaches or by QTL analysis
(Table 8). The available reports together suggest
presence of QTLs on a number of chromosomes
using both the above approaches (Law 1967;
Joshi and Kumar 1967; Law and Worland 1972;
Sadananda 1977; Bhat and Goud 1979; Shnaider
and Dorokhova 1979; Kamat 1980; Sutka and
Rajki 1981; Hanchinal and Goud 1982; Hoogen-
doorn 1985; Goud and Sridevi 1988; Kato et al.
2000; Blanco et al. 2001; Borner et al. 2002;
Groos et al. 2003; Huang et al. 2003, 2004; Marza
et al. 2006; Quarrie et al. 2005). The results for
different yield traits in the present study using
both the mapping populations were in conformity
with the earlier results. In addition, new loci were
also identified, suggesting the heterogeneity in
the material used in different studies (Kato et al.
2000; Blanco et al. 2001; Groos et al. 2003;
Huang et al. 2003, 2004; Marza et al. 2006;
Quarrie et al. 2005) and the effect of environ-
ment on these traits. Using ITMI pop (P II) all
the QTLs detected for ear length by Borner et al.
(2002) were also detected for spike length in the
present study using the same mapping popula-
tion. It should however be noted that the analysis
in this earlier study was based on simple interval
mapping, which can not resolve the QTLs
involved in different types of interactions.
Acknowledgements National Agricultural TechnologyProject, Indian Council of Agricultural Research, NewDelhi and Department of Biotechnology, Government ofIndia supported this work. During the period of this study,N.K. and P.L.K. each held a Senior Research Fellowshipof the Council of Scientific and Industrial Research(CSIR), New Delhi and P.K.G. held positions of UGCEmeritus Fellow (2002–2003) and INSA Senior Scientist.Thanks are due to Professor Jun Zhu, Zhejiang University,Hangzhou, China for conducting two-locus QTL analysisand to G.B.P.U.A. & T., Pantnagar and P.A.U., Ludhiana,India for their help in conducting field trials.
Table 8 Comparison of chromosomes identified carryingQTLs in the present study and earlier studies for yieldcontributing traits in bread wheat (plus and minus signs
indicate presence and absence of QTL; in each case, firstsign represents QTL identified in the present study and thenext sign represents QTL identified in earlier studies)
Trait Chromosome carrying QTL
TPP 1A (+/+), 1B (+/+), 1D (+/–), 2A (–/+), 2B (–/+), 3A (+/–), 3B (+/+), 3D (+/+), 4A (+/+), 4B (–/+), 4D (–/+), 5A (–/+),5D (–/+), 6A (+/+), 6D (+/+), 7A (+/+), 7B (+/+)
BY 1A (+/–), 2A (+/–), 2B (+/–), 3B (+/–), 4A (+/–), 4B (+/–), 6D (+/–), 7A (+/–) 7B (–/+)GY 1A (+/+), 1B (–/+), 1D (+/–), 2A (+/+), 2B (–/+), 2D (+/+), 3A (+/+), 3B (+/+), 4A (+/+), 4B (+/+), 4D (+/+), 5A (–/+),
5B (+/+), 6A (–/+), 6B (–/+), 6D (+/–), 7A (+/+), 7B (–/+), 7D (–/+)HI 2B (+/–), 2D (+/–), 3A (+/–), 3B (+/–), 4A (+/–), 4B (+/–), 5A (+/–), 5B (+/–), 6A (+/–)SL 1A (+/–), 1B (+/+), 1D (+/–), 2A (+/–), 2B (+/+), 2D (+/+), 3B (+/+), 3D (+/–), 4A (+/+), 4B (+/+), 5A (+/+), 5B (+/+),
5D (+/+), 6A (+/+), 6B (+/+), 7A (–/+), 7B (+/–), 7D (–/+)SPS 1A (–/+), 1B (–/+), 2A (+/+), 2B (+/+), 2D (+/+), 3A (+/+), 3B (+/+), 3D (–/+), 4A (+/+), 4B (–/+), 5A (+/+), 5B (–/+),
5D (+/+), 6A (+/+), 7A (+/+), 7B (–/+), 7D (+/+)GPS 1A (+/–), 1B (+/–), 1D (–/+), 2A (+/–), 2B (+/+), 2D (+/+), 3B (+/+), 3D (+/–), 4A (–/+), 4B (+/+), 5A (+/+), 5B (–/+),
6A (–/+), 6D (–/+), 7A (+/–)
Mol Breeding (2007) 19:163–177 175
123

References
Araki E, Miura H, Sawada S (1999) Identification ofgenetic loci affecting amylose content and agronomictraits on chromosome 4A of wheat. Theor ApplGenet 98:977–984
Basten CJ, Weir BS, Zeng Z-B (1994) Zmap—a QTLcartographer. In: Smith C, Gavora JS, Benkel J,Chesnais B, Fairfull W, Gibson JP, Kennedy BW,Burnsid EB (eds) Proceedings of the 5th worldcongress on genetics applied to livestock production:computing strategies and software, vol 22. OrganizingCommittee, 5th World Congress on Genetics Appliedto Livestock Production, Guelph, Ontario, pp 65–66
Bhat SR, Goud JV (1979) Monosomic analysis of somemorphological characters in wheat (Triticum aestivumL.). Wheat Inf Serv 50:14–18
Blanco A, Lotti C, Simeone R, Signorile A, De Santis V,Pasqualone A, Troccoli A, Di Fonzo N (2001)Detection of quantitative trait loci for grain yieldand yield components across environments in durumwheat. Cereal Res Commun 29:237–244
Borner A, Schumann E, Furste A, Coster H, Leithold B,Roder MS, Weber WE (2002) Mapping of quantita-tive trait loci determining agronomic important char-acters in hexaploid wheat (Triticum aestivum L).Theor Appl Genet 105:921–936
Cao G, Zhu J, He C, Gao Y, Yan J, Wu P (2001) Impact ofepistasis and QTL · environment interaction on thedevelopment behavior of plant height in rice (Oryzasativa L.). Theor Appl Genet 103:153–160
Carlborg O, Haley CS (2004) Epistasis: too often neglectedin complex trait studies. Nat Rev Genet 5:618–625
Campbell BT, Baenziger PS, Gill KS, Eskridge KM,Budak H, Erayman M, Dweikat I, Yen Y (2003)Identification of QTLs and environmental interac-tions associated with agronomic traits on chromosome3A of wheat. Crop Sci 43:1493–1505
Churchill GA, Doerge RW (1994) Empirical thresholdvalues for quantitative trait mapping. Genetics138:963–971
Doerge RW, Churchill GA (1996) Permutation tests formultiple loci affecting a quantitative character.Genetics 142:285–294
Erickson D (2005) Mapping the future of QTL’s. Heredity95:417–418
Gao YM, Zhu J, Song YS, He CZ, Shi CH, Zing YZ(2004) Analysis of digenic epistatic effects and QEinteraction effects QTL controlling grain weight inrice. J Zhejiang Univ (Agric & Life Sci) 5:371–377
Goud JV, Sridevi O (1988) Cytogenetic investigations ofsome quantitative characters in hexaploid wheat(Triticum aestivum L.) using F2 monosomic analysis.In: Miller TE, Koebner RMD (eds) Proceedings ofthe 7th International Wheat Genetics Symposium,Cambridge, UK, pp 521–525
Grafius JE (1978) Multiple characters and correlatedresponse. Crop Sci 18:931–934
Groos C, Robert N, Bervas E, Charmet G (2003) Geneticanalysis of grain protein-content, grain yield and
thousand-kernel weight in bread wheat. Theor ApplGenet 106:1032–1040
Gupta PK, Varshney RK, Sharma PC, Ramesh B (1999)Molecular markers and their applications in wheatbreeding. Plant Breed 118:369–390
Hanchinal RR, Goud JV (1982) Genetic analysis oftetraploid wheat Triticum durum cv. Bijaga Yellowby utilisation of monopentaploid hybrids. Wheat InfServ 55:22–26
Holland JB (2001) Epistasis and plant breeding. PlantBreed Rev 21:27–92
Holland JB, Portyanko VA, Hoffman DL (2002) Genomicregions controlling vernalization and photoperiodresponses in oat. Theor Appl Genet 105:113–126
Hoogendoorn J (1985) A reciprocal F1 monosomic anal-ysis of the genetic control of time of emergence,number of leaves, number of spikelets in wheat.Euphytica 34:545–558
Huang XQ, Coster H, Ganal MW, Roder MS (2003)Advanced backcross QTL analysis for the identifica-tion of quantitative trait loci alleles from wild relativesof wheat (Triticum aestivum L.). Theor Appl Genet106:1379–1389
Huang XQ, Kempf H, Ganal MW, Roder MS (2004)Advanced backcross QTL analysis in progeniesderived from a cross between a German elite winterwheat variety and synthetic wheat (Triticum aestivumL.). Theor Appl Genet 109: 933–943
Jahoor A, Eriksen L, Backes G (2004) QTLs and genes fordisease resistance in barley and wheat. In: Gupta PK,Varshney RK (eds) Cereal genomics. Kluwer AcademicPublishers, Dordrecht The Netherlands, pp 199–251
Joshi BC, Kumar S (1967) Variation and covariation ofquantitative characters in euploids and aneuploids forchromosome 5A in wheat. Indian J Genet 27:86–89
Juenger TE, Mckay JK, Hausmann N, Keurentjes JB, SenS, Stowe KE, Dawson TE, Simms EL, Richards JH(2005a) Identification and characterization of QTLunderlying whole-plant physiology in Arabidopsisthaliana: d13 C stomatal conductance and transpirationefficiency. Plant, Cell Env 28:697–708
Juenger TE, Sen S, Stowe KE, Simms EL (2005b) Epistasisand genotype environment interaction for quantita-tive trait loci affecting flowering time in Arabidopsisthaliana. Genetica 123:83–101
Kamat RT (1980) Disomic F3 analysis in hexaploid wheat(T. aestivum L. em.) using Pb C591 monosomic seriesand cv. UP 301. J Agri Sci 8:205
Kato K, Miura H, Sawada S (2000) Mapping QTLscontrolling grain yield and its components on chromo-some 5A of wheat. Theor Appl Genet 101:1114–1121
Khalifa MA, Mahdy EE, El-Hanawy HH (1988) Geneticstudies of yield components in some wheat crosses. In:Miller TE, Koebner RMD (eds) Proceedings of the7th International Wheat Genetics Symposium, Cam-bridge, UK, pp 1125–1132
Kulwal PL, Kumar N, Kumar A, Gupta RK, Balyan HS,Gupta PK (2005) Gene networks in hexaploid wheat:interacting quantitative trait loci for grain proteincontent. Funct Integr Genomics 5:254–259
176 Mol Breeding (2007) 19:163–177
123

Kulwal PL, Roy JK, Balyan HS, Gupta PK (2003) QTLmapping for growth and leaf characters in breadwheat. Plant Sci 164:267–277
Kulwal PL, Singh R, Balyan HS, Gupta PK (2004) Geneticbasis of pre-harvest sprouting tolerance using single-locus and two-locus QTL analyses in bread wheat.Funct Integr Genomics 4:94–101
Law CN (1967) The location of genetic factors controllinga number of quantitative characters in wheat. Genet-ics 56:445–461
Law CN, Worland AJ (1972) Aneuploidy in wheat and itsuse in genetic analysis. Plant Breeding Institute,Cambridge, Ann Rep, pp 25–65
Li W, Gill BS (2004) Genomics for cereal improvement.In: Gupta PK, Varshney RK (eds) Cereal genomics.Kluwer Academic Publishers, Dordrecht, The Neth-erlands, pp 585–634
Li ZK, Pinson SRM, Park WD, Paterson AH, Stansel JW(1997) Epistasis for three yield components in riceOryza sativa L. Genetics 145:453–465
Li ZK, Yu SB, Lafitte HR, Huang N, Courtois B,Hittalmani S, Vijayakumar CHM, Liu GF, WangGC, Shashidhar HE, Zhuang JY, Zheng KL, SinghVP, Sidhu JS, Srivantaneeyakul S, Khush GS (2003)QTL · environment interactions in rice. I. Headingdate and plant height. Theor Appl Genet 108:141–153
Mackay TFC (2001) The genetic architecture of quantita-tive traits. Annu Rev Genet 33:303–339
Marza F, Bai G-H, Carver BF, Zhou W-C (2006) Quan-titative trait loci for yield and related traits in thewheat population Ning7840 · Clark. Theor ApplGenet 112: 688–698
Mei HW, Li ZK, Shu QY, Guo LB, Wang YP, Yu XQ,Ying CS, Luo LJ (2005) Gene actions of QTLsaffecting several agronomic traits resolved in arecombinant inbred rice population and two back-cross populations. Theor Appl Genet 110:649–659
Mei HW, Luo LJ, Ying CS, Wang YP, Yu XQ, Guo LB,Paterson AH, Li ZK (2003) Gene actions of QTLsaffecting several agronomic traits resolved in arecombinant inbred rice population and two testcrosspopulations. Theor Appl Genet 110:649–659
Moncada P, Martinez CP, Borrero J, Chatel M, Gauch JrH, Guimaraes E, Tohme J, McCouch SR (2001)Quantitative trait loci for yield and yield componentsin an Oryza sativa · Oryza rufipogon BC2F2 popu-lation evaluated in an upland environment. TheorAppl Genet 102:41–52
Narasimhamoorthy B, Gill BS, Fritz AK, Nelson JC,Brown-Guedira GL (2006) Advanced backcross QTLanalysis of a hard winter wheat · synthetic wheatpopulation. Theor Appl Genet DOI 10.1007/s00122-005-0159-0
Prasad M, Kumar N, Kulwal PL, Roder MS, Balyan HS,Dhaliwal HS, Gupta PK (2003) QTL analysis forgrain protein content using SSR markers and valida-tion studies using NILs in bread wheat. Theor ApplGenet 106:659–667
Quarrie SA, Steed A, Calestani C, Semikhodskii A,Lebreton C, Chinoy C, Steele N, Pljevljakusic D,Waterman E, Weyen J, Schondelmaier J, Habash
DZ, Farmer P, Saker L, Clarkson DT, AbugalievaA, Yessimbekova M, Turuspekov Y, Abugalieva S,Tuberosa R, Sanguineti M-C, Hollington PA, Ara-gues R, Royo A, Dodig D (2005) A high-densitygenetic map of hexaploid wheat (Triticum aestivumL.) from the cross Chinese Spring · SQ1 and itsuse to compare QTLs for grain yield across a rangeof environments. Theor Appl Genet 110:865–880
Sadananda AR (1977) Cytogenetic investigations of somemorphological and grain characters in hexaploidwheat (T. aestivum L. em) using F2 monosomicanalysis. J Agri Sci 11:257
Shah MM, Gill KS, Baenziger PS, Yen Y, Kaeppler SM,Ariyarathne HM (1999) Molecular mapping of locifor agronomic traits on chromosome 3A of breadwheat. Crop Sci 39:1728–1732
Shen X, Zhang T, Guo W, Zhu X, Zhang X (2006) Mappingfiber and yield QTLs with main, epistatic andQTL · environment interaction effects in recombi-nant inbred lines of upland cotton. Crop Sci 46:61–66
Shnaider T, Dorokhova T (1979) Monosomic analysis ofsome quantitative characters in bread wheat. Biologia28:250–259
Sutka J, Rajki E (1981) Monosomic F2 analysis of somequantitative characters in the wheat variety-Ran-naayya12. Novenytermeles 30:97–102
Tuberosa R, Salvi S, (2004) QTLs and genes for toleranceto abiotic stresses in cereals. In: Gupta PK, VarshneyRK (eds) Cereal genomics. Kluwer, The Netherlands,pp 253–315
Van Deynze AE, Dubcovsky J, Gill KS, Nelson JC, SorrellsME, Dvorak J, Gill BS, Lagudah ES, McCouch SR,Appels R (1995) Molecular-genetic maps for group 1chromosomes of Triticeae species and their relation tochromosomes in rice and oat. Genome 38:45–59
Wang S, Basten CJ, Zeng Z (2004) Window QTLcartographer. V2.0 Program in statistical genetics,North Carolina State University, North Carolina.http:www.statgen.ncsu.edu/qtlcart/WQTLCart.htm
Xing YZ, Tan YF, Hua JP, Sun XL, Xu CG, Zhang Q(2002) Characterization of the main effects, epistaticeffects and their environmental interactions of QTLson the genetic basis of yield traits in rice. Theor ApplGenet 105:248–257
Xionglei H, Jianzhi Z (2006) Toward a molecular under-standing of pleiotropy. Genetics DOI.10.1534/genet-ics.106.060269
Yan JB, Tang H, Huang YO, Zheng YL, Li JS (2006)Quantitative trait loci mapping and epistatic analysisfor grain yield and yield components using molecularmarkers with an elite maize hybrid. Mol Breed DOI:10.1007/s10681–005–9060-9
Yu SB, Li JX, Xu CG, Tan YF, Gao YJ, Li XH, Zhang Q,Saghai Maroof MA (1997) Importance of epistasis asthe genetic basis of heterosis in an elite rice hybrid.Proc Natl Acad Sci USA 94:9226–9231
Zhuang J-Y, Fan Y-Y, Rao Z-M, Wu JL, Xia YW, ZhengKL (2002) Analysis on additive effects and additive-by-additive epistatic effects of QTLs for yield traits ina recombinant inbred line population of rice. TheorAppl Genet 105:1137–1145
Mol Breeding (2007) 19:163–177 177
123
Copyright © 2022 FDOKUMEN