QTL mapping of egg albumen quality in egg layers
8
RESEARCH Open Access QTL mapping of egg albumen quality in egg layers Mervi Honkatukia 1* , Maria Tuiskula-Haavisto 1 , Jesus Arango 3 , Jonna Tabell 1 , Matthias Schmutz 2 , Rudolf Preisinger 2 and Johanna Vilkki 1 Abstract Background: A fresh, good quality egg has a firm and gelatinous albumen that anchors the yolk and restricts growth of microbiological pathogens. As the egg ages, the gel-like structure collapses, resulting in thin and runny albumen. Occasionally thin albumen is found in a fresh egg, giving the impression of a low quality product. A mapping population consisting of 1599 F 2 hens from a cross between White Rock and Rhode Island Red lines was set up, to identify loci controlling albumen quality. The phenotype for albumen quality was evaluated by albumen height and in Haugh units (HU) measured on three consecutive eggs from each F 2 hen at the age of 40 weeks. For the fine-mapping analysis, albumen height and HU were used simultaneously to eliminate contribution of the egg size to the phenotype. Results: Linkage analysis in a small population of seven half-sib families (668 F 2 ) with 162 microsatellite markers spread across 27 chromosomes revealed two genome-wide significant regions with additive effects for HU on chromosomes 7 and Z. In addition, two putative genome-wide quantitative trait loci (QTL) regions were identified on chromosomes 4 and 26. The QTL effects ranged from 2 to 4% of the phenotypic variance. The genome-wide significant QTL regions on chromosomes 7 and Z were selected for fine-mapping in the full set composed of 16 half-sib families. In addition, their existence was confirmed by an association analysis in an independent commercial Hy-Line pure line. Conclusions: We identified four chicken genomic regions that affect albumen quality. Our results also suggest that genes that affect albumen quality act both directly and indirectly through several different mechanisms. For instance, the QTL regions on both fine-mapped chromosomes 7 and Z overlapped with a previously reported QTL for eggshell quality, indicating that eggshell membranes may play a role in albumen quality. Background Eggs for the table egg market should be microbiologically safe and look good. The number of eggs for processing egg products has increased during recent years, emphasizing the importance of high quality and good processing properties. Good quality albumen has a firm jelly-like structure that keeps the yolk in the center of the egg. Albumen quality starts to degenerate immediately after the egg is laid and thinning is a natural process during storage. For breeding purposes, albumen quality is measured in Haugh units (HU), expressed as a function of egg weight and the albumen height (AH) of a broken egg [1]. The egg industry is particularly interested in functional properties such as coagulation and foaming, which makes quality assessment complex [2]. Genetic background can explain, in part, differences in albumen quality among individuals and breeds [3]. The average heritability of albumen quality is moderate, reaching 0.30 [4]. It has also been demonstrated that sires have a higher influence on the heritability of AH and HU than dams, which indicates a sex-linked effect [4]. Among environmental factors, management and egg storage conditions have a substantial impact on maintaining albumen height, while feed composition has only a minor effect on albumen quality [2,5]. Furthermore, viruses in the reproductive tract may lead to the production of watery white eggs and extremely poor quality albumen [5]. Various causes of albumen deterioration have been suggested. Imperfections can emerge during the early * Correspondence: [email protected] 1 MTT Biotechnology and Food Research, Jokioinen 31600, Finland Full list of author information is available at the end of the article G enetics Selection Evolution © 2013 Honkatukia et al.; licensee BioMed Central Ltd. This is an Open Access article distributed under the terms of the Creative Commons Attribution License (http://creativecommons.org/licenses/by/2.0), which permits unrestricted use, distribution, and reproduction in any medium, provided the original work is properly cited. Honkatukia et al. Genetics Selection Evolution 2013, 45:31 http://www.gsejournal.org/content/45/1/31
Transcript of QTL mapping of egg albumen quality in egg layers
Ge n e t i c sSe lec t ionEvolut ion
Honkatukia et al. Genetics Selection Evolution 2013, 45:31http://www.gsejournal.org/content/45/1/31
RESEARCH Open Access
QTL mapping of egg albumen quality inegg layersMervi Honkatukia1*, Maria Tuiskula-Haavisto1, Jesus Arango3, Jonna Tabell1, Matthias Schmutz2,Rudolf Preisinger2 and Johanna Vilkki1
Abstract
Background: A fresh, good quality egg has a firm and gelatinous albumen that anchors the yolk and restrictsgrowth of microbiological pathogens. As the egg ages, the gel-like structure collapses, resulting in thin and runnyalbumen. Occasionally thin albumen is found in a fresh egg, giving the impression of a low quality product. Amapping population consisting of 1599 F2 hens from a cross between White Rock and Rhode Island Red lines wasset up, to identify loci controlling albumen quality. The phenotype for albumen quality was evaluated by albumenheight and in Haugh units (HU) measured on three consecutive eggs from each F2 hen at the age of 40 weeks. Forthe fine-mapping analysis, albumen height and HU were used simultaneously to eliminate contribution of the eggsize to the phenotype.
Results: Linkage analysis in a small population of seven half-sib families (668 F2) with 162 microsatellite markersspread across 27 chromosomes revealed two genome-wide significant regions with additive effects for HU onchromosomes 7 and Z. In addition, two putative genome-wide quantitative trait loci (QTL) regions were identifiedon chromosomes 4 and 26. The QTL effects ranged from 2 to 4% of the phenotypic variance. The genome-widesignificant QTL regions on chromosomes 7 and Z were selected for fine-mapping in the full set composed of 16half-sib families. In addition, their existence was confirmed by an association analysis in an independent commercialHy-Line pure line.
Conclusions: We identified four chicken genomic regions that affect albumen quality. Our results also suggest thatgenes that affect albumen quality act both directly and indirectly through several different mechanisms. Forinstance, the QTL regions on both fine-mapped chromosomes 7 and Z overlapped with a previously reported QTLfor eggshell quality, indicating that eggshell membranes may play a role in albumen quality.
BackgroundEggs for the table egg market should be microbiologicallysafe and look good. The number of eggs for processing eggproducts has increased during recent years, emphasizingthe importance of high quality and good processingproperties. Good quality albumen has a firm jelly-likestructure that keeps the yolk in the center of the egg.Albumen quality starts to degenerate immediatelyafter the egg is laid and thinning is a natural processduring storage. For breeding purposes, albumen quality ismeasured in Haugh units (HU), expressed as a function ofegg weight and the albumen height (AH) of a broken egg[1]. The egg industry is particularly interested in functional
* Correspondence: [email protected] Biotechnology and Food Research, Jokioinen 31600, FinlandFull list of author information is available at the end of the article
© 2013 Honkatukia et al.; licensee BioMed CenCreative Commons Attribution License (http:/distribution, and reproduction in any medium
properties such as coagulation and foaming, which makesquality assessment complex [2].Genetic background can explain, in part, differences in
albumen quality among individuals and breeds [3]. Theaverage heritability of albumen quality is moderate,reaching 0.30 [4]. It has also been demonstrated that sireshave a higher influence on the heritability of AH and HUthan dams, which indicates a sex-linked effect [4]. Amongenvironmental factors, management and egg storageconditions have a substantial impact on maintainingalbumen height, while feed composition has only a minoreffect on albumen quality [2,5]. Furthermore, viruses in thereproductive tract may lead to the production of waterywhite eggs and extremely poor quality albumen [5].Various causes of albumen deterioration have been
suggested. Imperfections can emerge during the early
tral Ltd. This is an Open Access article distributed under the terms of the/creativecommons.org/licenses/by/2.0), which permits unrestricted use,, provided the original work is properly cited.
Honkatukia et al. Genetics Selection Evolution 2013, 45:31 Page 2 of 8http://www.gsejournal.org/content/45/1/31
formation of albumen in the reproductive tract but alsoafter oviposition. A potential explanation for the declinein quality with time is linked with eggshell andmembrane traits. An intact eggshell with good innerand outer membrane structures plays an importantrole in albumen quality, particularly during storage,preventing evaporation and escape of metabolic gasesthrough the shell pores. CO2 leak is known to changealbumen pH towards alkaline values [6].Albumen quality, among other egg quality and pro-
duction traits, is a typical quantitative trait that has beenstudied by QTL mapping. Nevertheless, among the avail-able data on chicken QTL, there are relatively few QTLthat affect albumen quality [7]. In the ChickenQTLdb,16 distinct QTL locations are associated with HU, AHor albumen weight (AW). In the database, QTL regionsthat influence albumen quality are located on chromo-some 1 (HU between positions 48.17 and 53.13 Mb; AHand HU between 90.35 and 123.03 Mb) [8,9], chromo-some 2 (HU between 5.31 and15.36 and between 31.23and 38.97 Mb and AH between 80.69 and 104.34 Mb)[9,10], chromosome 3 (AW at position 106.44 Mb) [11]and chromosome 4 (AH and AW at 9.45 Mb, AWbetween 62.18 and 75.89 and AW at ~80 Mb)[11,12]. In addition, genome-wide association studiesrevealed significant SNP associations on chromosomes1, 3, 5, 18, 19, 23 and Z with early or late AH [13] andother interesting associations have been reported on chro-mosomes 7, 8, 9, 14, 20 and 24 [14]. These studies have re-vealed that several overlapping genomic regions areinvolved in various egg quality traits, but the relationshipsbetween these regions have not yet been detailed at thebiological level. Simple text-based searches in the chickengenome [15] for genes associated with egg white yielded20 hits, eight of which referred to known QTL regions,the remainder being annotated albumen related genes,such as LYZ (lysozyme, chr 1: 37.29 Mb), LYG2 (lysozymeG-like 2, chr 1: 136.64 Mb), PRL (prolactin, chr 2: 59.7Mb), SERPINB6 (serine (or cysteine) peptidase inhibitor,clade B, member 6e, chr 2: 68.85 Mb), CALB1 (calbindin1, 28kDa, chr 2: 129.15 Mb), CST3 (cystatin C, chr 3:16.49 Mb), SPP1 (secreted phosphoprotein 1, chr 4: 47.10Mb), MUC6 (mucin 6, oligomeric mucus/gel-formin, chr 5:16.121 Mb), MUC5B (ovomucin, alpha subunit, chr 5:15.95 Mb) and TF (transferrin, chr 9: 5.62 Mb). Althoughstudies on the egg albumen proteome have significantlyexpanded the list of identified albumen proteins[16,17], and the mechanisms involved in egg whitethinning have been studied at the protein level [18],no causal variations in albumen genes have yet beenidentified.In this study, we used an F2 intercross between the
two egg-layer lines, White Rock and Rhode Island Red,in order to identify QTL that affect albumen quality.
Mapping was performed in three steps: (1) identificationof QTL in a small F2 population, (2) fine-mapping ofthese QTL in a larger F2 population, and (3) verificationof the QTL in a commercial line, Hy-Line. We alsoinvestigated possible links between albumen qualityand eggshell properties based on overlapping QTLresults in the ChickenQTLdb (on the chicken genomebuild WASHUC2).
MethodsMapping populationsFor mapping, an F2 population was created between twocommercial egg-layer lines from Lohmann Tierzucht i.e.Rhode Island Red and White Rock. The crossed linesdiffered in albumen quality; the average HU was 56.31 forRhode Island Red and 69.29 for White Rock (Table 1).Practical management was similar to that used in previousQTL studies [19]. The full mapping population was madeup by reciprocal crosses between 14 Rhode Island Redindividuals (six males and eight females) and 15 WhiteRock individuals (six males and nine females). The F1generation consisted of 16 males and 96 females, leadingto 16 half-sib families. A genome scan was performed with162 microsatellite markers spread across 27 of the 39chicken chromosome pairs using a subset of seven half-sibfamilies with 668 F2 individuals. The full F2 mappingpopulation of 1599 individuals was used for fine-mapping.In order to reanalyze the QTL regions, a commercial
egg laying chicken population (Hy-Line) was used. TheHy-Line population consisted of 290 males belonging topaternal half-sib families (3.5 males per half-sib family).
PhenotypesAlbumen quality was evaluated in the F2 mapping popula-tion for three consecutive eggs, each within 24 h of laying,for each hen at the age of 40 weeks. To measure albumenquality, the egg was weighed, broken on a glass plate andthe height of the thick albumen (AH) was measured with amicrometer. AH was transformed into Haugh units (HU)with a standardized function of the AH and egg weight,and corrected with a constant [1]. In the whole-genomescan, only the corrected HU estimations were used,but both AH and HU estimations were used to excludecontribution of the egg weight to the phenotype and tomake the different datasets comparable. In the commercialHy-Line population, albumen quality was assessed by AHtwice during the production period i.e. at 26 weeks of age(= early) and again at 42 to 44 weeks of age (= late). Thephenotypes are presented as sire-daughter averages and aredescribed in Table 1.
GenotypingDNA preparation and genotyping of microsatellite markerswere carried out as described by Tuiskula-Haavisto et al.
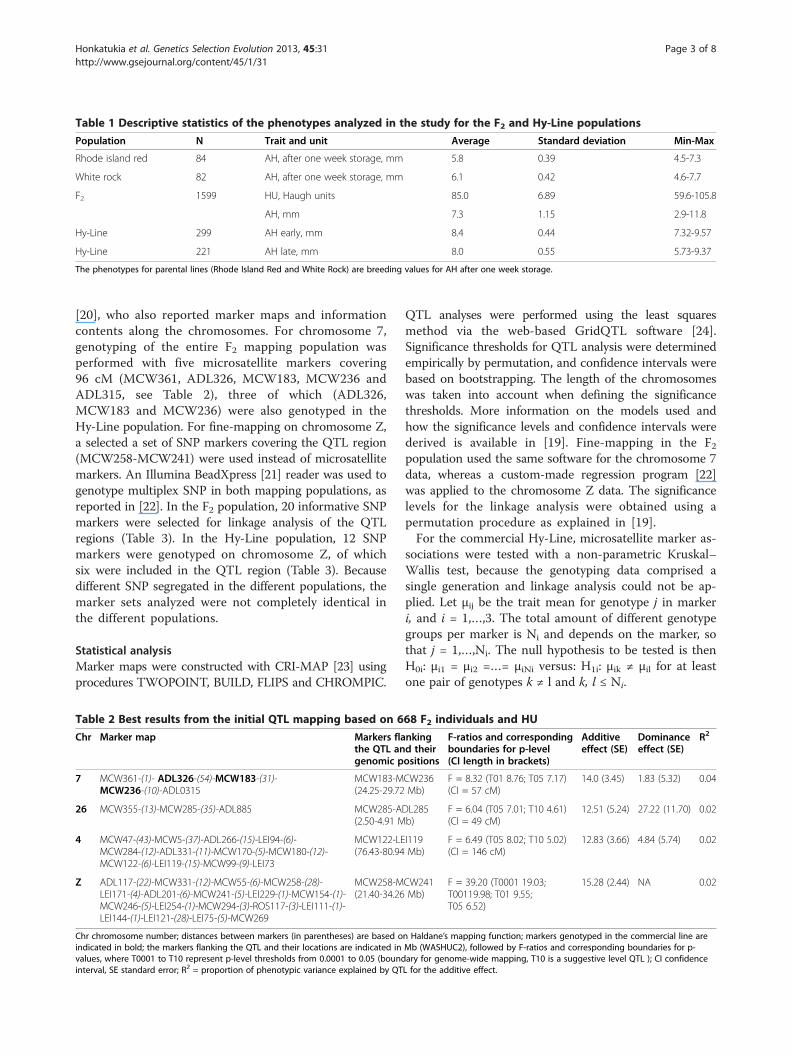
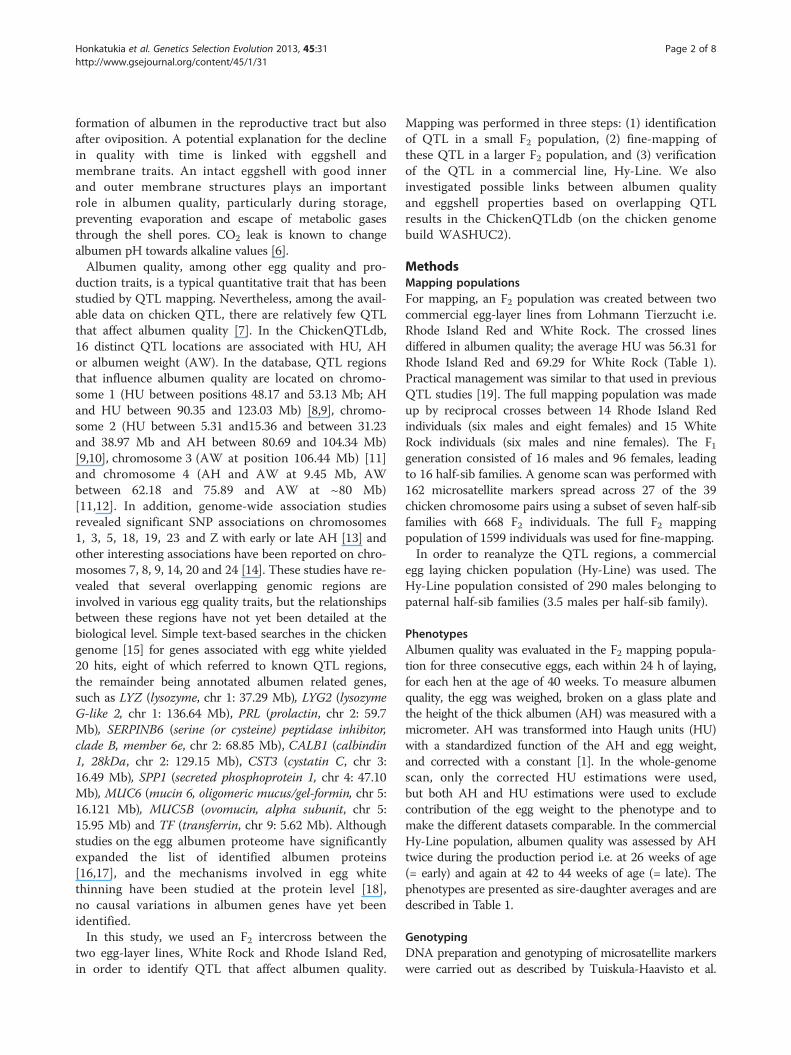
Table 1 Descriptive statistics of the phenotypes analyzed in the study for the F2 and Hy-Line populations
Population N Trait and unit Average Standard deviation Min-Max
Rhode island red 84 AH, after one week storage, mm 5.8 0.39 4.5-7.3
White rock 82 AH, after one week storage, mm 6.1 0.42 4.6-7.7
F2 1599 HU, Haugh units 85.0 6.89 59.6-105.8
AH, mm 7.3 1.15 2.9-11.8
Hy-Line 299 AH early, mm 8.4 0.44 7.32-9.57
Hy-Line 221 AH late, mm 8.0 0.55 5.73-9.37
The phenotypes for parental lines (Rhode Island Red and White Rock) are breeding values for AH after one week storage.
Honkatukia et al. Genetics Selection Evolution 2013, 45:31 Page 3 of 8http://www.gsejournal.org/content/45/1/31
[20], who also reported marker maps and informationcontents along the chromosomes. For chromosome 7,genotyping of the entire F2 mapping population wasperformed with five microsatellite markers covering96 cM (MCW361, ADL326, MCW183, MCW236 andADL315, see Table 2), three of which (ADL326,MCW183 and MCW236) were also genotyped in theHy-Line population. For fine-mapping on chromosome Z,a selected a set of SNP markers covering the QTL region(MCW258-MCW241) were used instead of microsatellitemarkers. An Illumina BeadXpress [21] reader was used togenotype multiplex SNP in both mapping populations, asreported in [22]. In the F2 population, 20 informative SNPmarkers were selected for linkage analysis of the QTLregions (Table 3). In the Hy-Line population, 12 SNPmarkers were genotyped on chromosome Z, of whichsix were included in the QTL region (Table 3). Becausedifferent SNP segregated in the different populations, themarker sets analyzed were not completely identical inthe different populations.
Statistical analysisMarker maps were constructed with CRI-MAP [23] usingprocedures TWOPOINT, BUILD, FLIPS and CHROMPIC.
Table 2 Best results from the initial QTL mapping based on 6
Chr Marker map Markers flathe QTL angenomic p
7 MCW361-(1)- ADL326-(54)-MCW183-(31)-MCW236-(10)-ADL0315
MCW183-M(24.25-29.72
26 MCW355-(13)-MCW285-(35)-ADL885 MCW285-A(2.50-4.91 M
4 MCW47-(43)-MCW5-(37)-ADL266-(15)-LEI94-(6)-MCW284-(12)-ADL331-(11)-MCW170-(5)-MCW180-(12)-MCW122-(6)-LEI119-(15)-MCW99-(9)-LEI73
MCW122-LE(76.43-80.94
Z ADL117-(22)-MCW331-(12)-MCW55-(6)-MCW258-(28)-LEI171-(4)-ADL201-(6)-MCW241-(5)-LEI229-(1)-MCW154-(1)-MCW246-(5)-LEI254-(1)-MCW294-(3)-ROS117-(3)-LEI111-(1)-LEI144-(1)-LEI121-(28)-LEI75-(5)-MCW269
MCW258-M(21.40-34.26
Chr chromosome number; distances between markers (in parentheses) are based oindicated in bold; the markers flanking the QTL and their locations are indicated invalues, where T0001 to T10 represent p-level thresholds from 0.0001 to 0.05 (boundinterval, SE standard error; R2 = proportion of phenotypic variance explained by QT
QTL analyses were performed using the least squaresmethod via the web-based GridQTL software [24].Significance thresholds for QTL analysis were determinedempirically by permutation, and confidence intervals werebased on bootstrapping. The length of the chromosomeswas taken into account when defining the significancethresholds. More information on the models used andhow the significance levels and confidence intervals werederived is available in [19]. Fine-mapping in the F2population used the same software for the chromosome 7data, whereas a custom-made regression program [22]was applied to the chromosome Z data. The significancelevels for the linkage analysis were obtained using apermutation procedure as explained in [19].For the commercial Hy-Line, microsatellite marker as-
sociations were tested with a non-parametric Kruskal–Wallis test, because the genotyping data comprised asingle generation and linkage analysis could not be ap-plied. Let μij be the trait mean for genotype j in markeri, and i = 1,…,3. The total amount of different genotypegroups per marker is Ni and depends on the marker, sothat j = 1,…,Ni. The null hypothesis to be tested is thenH0i: μi1 = μi2 =…= μiNi versus: H1i: μik ≠ μil for at leastone pair of genotypes k ≠ l and k, l ≤ Ni.
68 F2 individuals and HU
nkingd theirositions
F-ratios and correspondingboundaries for p-level(CI length in brackets)
Additiveeffect (SE)
Dominanceeffect (SE)
R2
CW236Mb)
F = 8.32 (T01 8.76; T05 7.17)(CI = 57 cM)
14.0 (3.45) 1.83 (5.32) 0.04
DL285b)
F = 6.04 (T05 7.01; T10 4.61)(CI = 49 cM)
12.51 (5.24) 27.22 (11.70) 0.02
I119Mb)
F = 6.49 (T05 8.02; T10 5.02)(CI = 146 cM)
12.83 (3.66) 4.84 (5.74) 0.02
CW241Mb)
F = 39.20 (T0001 19.03;T00119.98; T01 9.55;T05 6.52)
15.28 (2.44) NA 0.02
n Haldane’s mapping function; markers genotyped in the commercial line areMb (WASHUC2), followed by F-ratios and corresponding boundaries for p-ary for genome-wide mapping, T10 is a suggestive level QTL ); CI confidenceL for the additive effect.
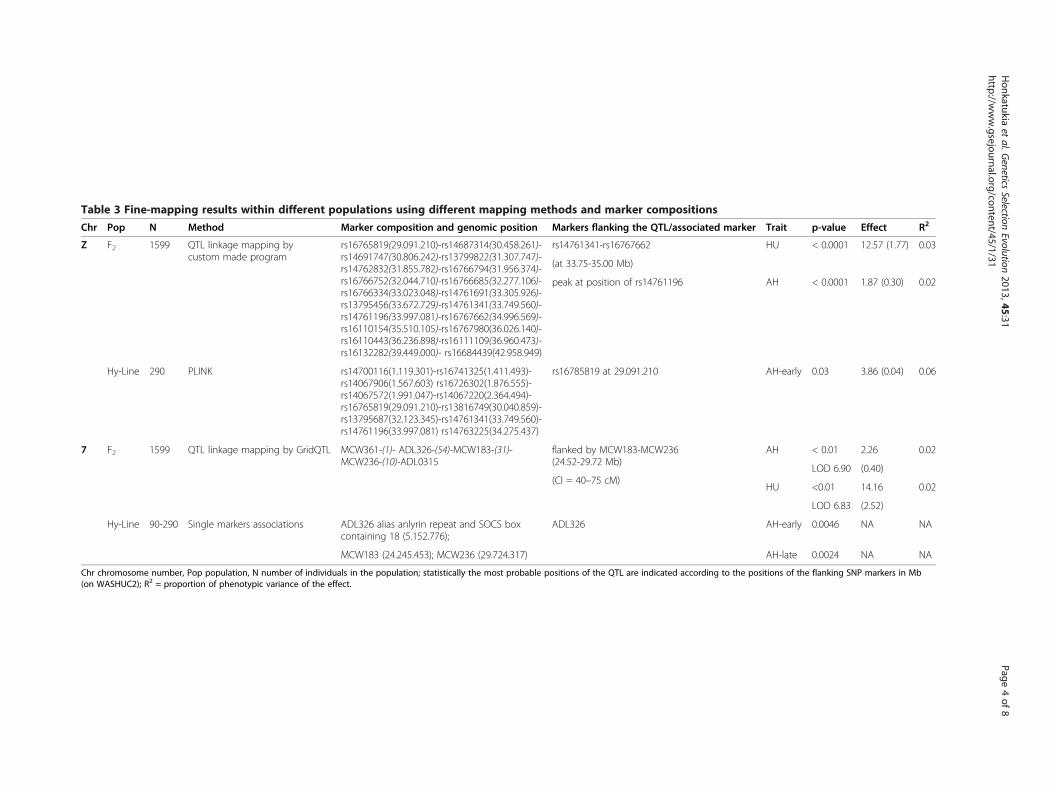
Table 3 Fine-mapping results within different populations using different mapping methods and marker compositions
Chr Pop N Method Marker composition and genomic position Markers flanking the QTL/associated marker Trait p-value Effect R2
Z F2 1599 QTL linkage mapping bycustom made program
rs16765819(29.091.210)-rs14687314(30.458.261)-rs14691747(30.806.242)-rs13799822(31.307.747)-rs14762832(31.855.782)-rs16766794(31.956.374)-rs16766752(32.044.710)-rs16766685(32.277.106)-rs16766334(33.023.048)-rs14761691(33.305.926)-rs13795456(33.672.729)-rs14761341(33.749.560)-rs14761196(33.997.081)-rs16767662(34.996.569)-rs16110154(35.510.105)-rs16767980(36.026.140)-rs16110443(36.236.898)-rs16111109(36.960.473)-rs16132282(39.449.000)- rs16684439(42.958.949)
rs14761341-rs16767662 HU < 0.0001 12.57 (1.77) 0.03
(at 33.75-35.00 Mb)
peak at position of rs14761196 AH < 0.0001 1.87 (0.30) 0.02
Hy-Line 290 PLINK rs14700116(1.119.301)-rs16741325(1.411.493)-rs14067906(1.567.603) rs16726302(1.876.555)-rs14067572(1.991.047)-rs14067220(2.364.494)-rs16765819(29.091.210)-rs13816749(30.040.859)-rs13795687(32.123.345)-rs14761341(33.749.560)-rs14761196(33.997.081) rs14763225(34.275.437)
rs16785819 at 29.091.210 AH-early 0.03 3.86 (0.04) 0.06
7 F2 1599 QTL linkage mapping by GridQTL MCW361-(1)- ADL326-(54)-MCW183-(31)-MCW236-(10)-ADL0315
flanked by MCW183-MCW236(24.52-29.72 Mb)
AH < 0.01 2.26 0.02
LOD 6.90 (0.40)(CI = 40–75 cM)
HU <0.01 14.16 0.02
LOD 6.83 (2.52)
Hy-Line 90-290 Single markers associations ADL326 alias anlyrin repeat and SOCS boxcontaining 18 (5.152.776);
ADL326 AH-early 0.0046 NA NA
MCW183 (24.245.453); MCW236 (29.724.317) AH-late 0.0024 NA NA
Chr chromosome number, Pop population, N number of individuals in the population; statistically the most probable positions of the QTL are indicated according to the positions of the flanking SNP markers in Mb(on WASHUC2); R2 = proportion of phenotypic variance of the effect.
Honkatukia
etal.G
eneticsSelection
Evolution2013,45:31
Page4of
8http://w
ww.gsejournal.org/content/45/1/31
Honkatukia et al. Genetics Selection Evolution 2013, 45:31 Page 5 of 8http://www.gsejournal.org/content/45/1/31
Chromosome Z was analyzed with PLINK [25]. Datawere checked for genotyping quality and Hardy-Weinbergequilibrium (none of the markers were excluded) beforeanalysis. Basic association testing for quantitative traitsand adjustment for multiple comparisons were used.
ResultsThe whole-genome scan using low-density markermaps and seven half-sib families from the mappingpopulation (668 of 1599 F2 individuals) detected fourQTL regions that affect egg white quality (HU) (Table 2).A genome-wide significant QTL (p < 0.05) was found onchromosome 7 between microsatellite markers MCW183and MCW236 (at the genomic positions 24.24 Mb and29.72 Mb, respectively). The additive effect of the locuswas 14.0 HU and accounted for 2% of the phenotypicvariance. A highly significant QTL (p < 0.0001) wasdetected on chromosome Z between microsatellite markersMCW258 and MCW241 (at 21.40 Mb and 34.26 Mb,respectively) [see Additional file 1].The effect of thislocus was 15.28 HU. A suggestive (5% chromosome-wide)QTL was found on chromosome 4, between markersMCW122 and LEI119 (76.43 and 80.94 Mb, respectively),which explained 2% of the trait variation, the effect being12.83 HU. Similarly, a putative QTL was detected onchromosome 26 between markers MCW285 and ADL285(2.50 and 4.91 Mb, respectively). In contrast to theother identified QTL, this QTL displayed a largedominance effect.Various strategies were used to explore the data in
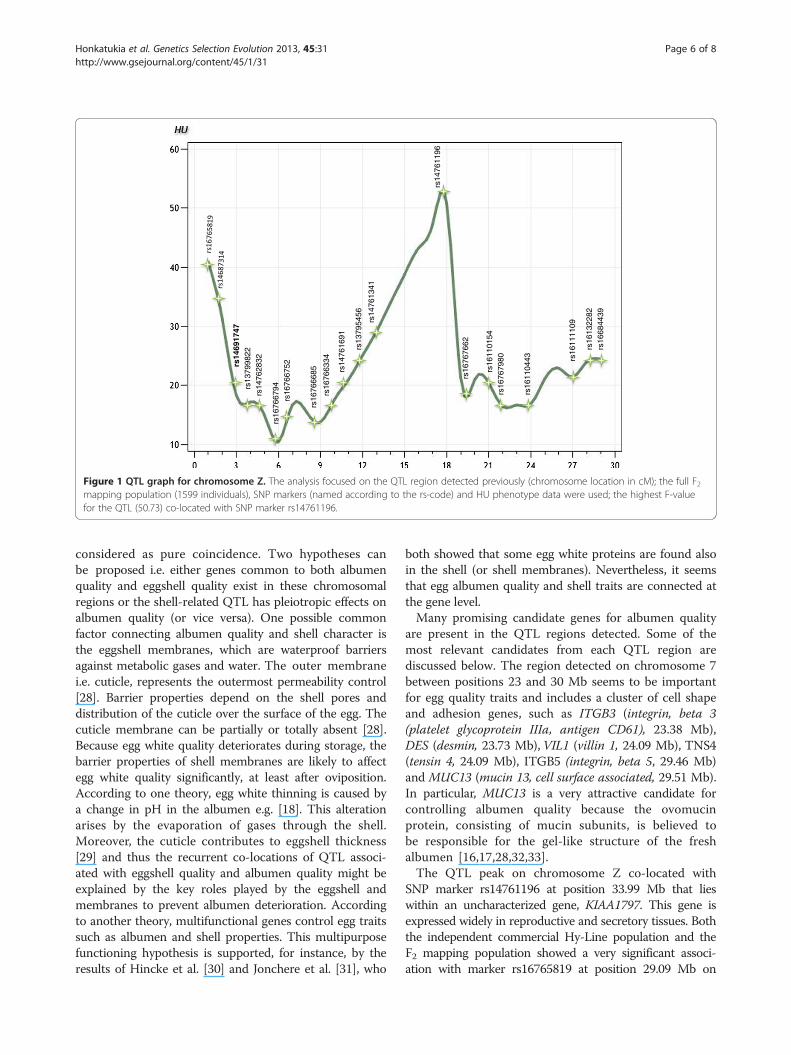
greater detail. Both AH and HU measurements wereused in order to eliminate contribution of the egg weightto the phenotype and to allow comparison of differentdatasets. All 16 half-sib families were genotyped withfive microsatellite markers on chromosome 7. Linkageanalysis of this full F2 mapping population increased theresolution and significance of the QTL, reaching the 1%genome-wide significance level (Table 3). However,the confidence intervals remained large because ofthe low-coverage map. The QTL on chromosome Zwas fine-mapped using the F2 population and linkagemapping with 20 SNP markers covering the QTL region.The microsatellite markers originally used were excludedfrom the analysis in order to avoid bias from heterogeneousinformation content arising from the two types of markers.Increasing the sample size (to the full mapping population)made it possible to focus on the region containing the QTLin the SNP analysis. The QTL affecting both AH and HUwas located in a region between 33.75 and 34.99 Mb,flanked by the markers rs14761341 and rs16767662(Figure 1). The QTL peak co-located with the SNP markerrs14761196. Results for AH and HU were consistent, theonly difference being that the result for HU was moresignificant than for AH (F = 50.73 vs. F = 40.11). We did
not find any evidence for a QTL involved in egg weight butthe results suggested the presence of QTL that affecteggshell strength (data not shown).The commercial Hy-Line population was used to confirm
the most promising QTL regions, on chromosomes 7 andZ. On chromosome 7, microsatellite ADL326 at position5.15 Mb was significantly associated with both early andlate AH (p = 0.0046 and 0.0024, respectively) betweendifferent genotypes [see Additional file 2]. Three segregatingalleles formed seven genotype classes in the Hy-Linepopulation, with on average 11.5 individuals in eachgroup. On chromosome Z, marker rs16765819 at position29.09 Mb was significantly associated with early and lateAH (p = 0.0003 and 0.004, respectively). This locus waslocated at the distal end of the QTL region identified withthe F2 population. Although rs16765819 was the outermoststudied marker, it was significant in both populations.
DiscussionWe used an F2 intercross between the two egg-layer lines,White Rock and Rhode Island Red, to identify QTLassociated with albumen quality and detected fourgenomic regions on chromosomes 4, 7, 26 and Z.The QTL on chromosome 26 has not been reportedbefore. Evidence for the QTL on chromosome 4 (betweenpositions 76.43 and 80.94 Mb) is indirectly supported bythe QTL reported for albumen weight in two otherstudies, respectively between positions 62.18 and75.89 Mb in [12] and at 80 Mb in [11].The QTL on chromosome 7 between positions 24.24 Mb
and 29.72 Mb co-located with the HU40 associationreported by Liu et al. [14], using two experimental egg-typelines, White Leghorn and dwarf brown layers. This sameregion overlapped with a QTL that affects eggshell strengthbetween positions 24.25 and 31.83 Mb identified by Sasakiet al. [26]. In addition to these, Abasht et al. [13] detected asignificant 3-SNP window for early shell quality at aposition between 25.1 and 26.2 Mb. Furthermore, Liu et al.[14] identified putative associations with eggshell thickness(EST40) between 27.47 and 29.06 Mb. It should be notedthat all these studies used brown layer lines but belongingto different breeds [13,14,26].Previously, it was shown that the QTL for eggshell
thickness [26] and shell strength [19] at position 35 Mboverlapped on chromosome Z. Our results reveal thatthe genomic region, around 29–35 Mb, also influencesalbumen quality. The fact that this region is on chickenchromosome Z agrees with the traditional knowledgethat sires have a larger effect than dams on albumenquality [27].A positive correlation between albumen and eggshell
qualities has been reported [4]. In addition, severalstudies have suggested that QTL associated with albumenquality overlap with a shell-related QTL, which cannot be
rs13
7998
22rs
1469
1747
rs14
7628
32
rs16
7667
94rs
1676
6752
rs16
7663
34
rs14
7616
91
rs13
7954
56
rs14
7613
41
rs14
7611
96
rs16
7676
62
rs16
1101
54rs
1676
7980
rs16
1104
43 rs16
1111
09
rs16
6844
39
rs16
7666
85
rs16
1322
82
Figure 1 QTL graph for chromosome Z. The analysis focused on the QTL region detected previously (chromosome location in cM); the full F2mapping population (1599 individuals), SNP markers (named according to the rs-code) and HU phenotype data were used; the highest F-valuefor the QTL (50.73) co-located with SNP marker rs14761196.
Honkatukia et al. Genetics Selection Evolution 2013, 45:31 Page 6 of 8http://www.gsejournal.org/content/45/1/31
considered as pure coincidence. Two hypotheses canbe proposed i.e. either genes common to both albumenquality and eggshell quality exist in these chromosomalregions or the shell-related QTL has pleiotropic effects onalbumen quality (or vice versa). One possible commonfactor connecting albumen quality and shell character isthe eggshell membranes, which are waterproof barriersagainst metabolic gases and water. The outer membranei.e. cuticle, represents the outermost permeability control[28]. Barrier properties depend on the shell pores anddistribution of the cuticle over the surface of the egg. Thecuticle membrane can be partially or totally absent [28].Because egg white quality deteriorates during storage, thebarrier properties of shell membranes are likely to affectegg white quality significantly, at least after oviposition.According to one theory, egg white thinning is caused bya change in pH in the albumen e.g. [18]. This alterationarises by the evaporation of gases through the shell.Moreover, the cuticle contributes to eggshell thickness[29] and thus the recurrent co-locations of QTL associ-ated with eggshell quality and albumen quality might beexplained by the key roles played by the eggshell andmembranes to prevent albumen deterioration. Accordingto another theory, multifunctional genes control egg traitssuch as albumen and shell properties. This multipurposefunctioning hypothesis is supported, for instance, by theresults of Hincke et al. [30] and Jonchere et al. [31], who
both showed that some egg white proteins are found alsoin the shell (or shell membranes). Nevertheless, it seemsthat egg albumen quality and shell traits are connected atthe gene level.Many promising candidate genes for albumen quality
are present in the QTL regions detected. Some of themost relevant candidates from each QTL region arediscussed below. The region detected on chromosome 7between positions 23 and 30 Mb seems to be importantfor egg quality traits and includes a cluster of cell shapeand adhesion genes, such as ITGB3 (integrin, beta 3(platelet glycoprotein IIIa, antigen CD61), 23.38 Mb),DES (desmin, 23.73 Mb),VIL1 (villin 1, 24.09 Mb), TNS4(tensin 4, 24.09 Mb), ITGB5 (integrin, beta 5, 29.46 Mb)and MUC13 (mucin 13, cell surface associated, 29.51 Mb).In particular, MUC13 is a very attractive candidate forcontrolling albumen quality because the ovomucinprotein, consisting of mucin subunits, is believed tobe responsible for the gel-like structure of the freshalbumen [16,17,28,32,33].The QTL peak on chromosome Z co-located with
SNP marker rs14761196 at position 33.99 Mb that lieswithin an uncharacterized gene, KIAA1797. This gene isexpressed widely in reproductive and secretory tissues. Boththe independent commercial Hy-Line population and theF2 mapping population showed a very significant associ-ation with marker rs16765819 at position 29.09 Mb on
Honkatukia et al. Genetics Selection Evolution 2013, 45:31 Page 7 of 8http://www.gsejournal.org/content/45/1/31
chromosome Z that is located in the border region of theQTL. Marker rs16765819 is located near to the PTPRD(protein tyrosine phosphatase, receptor type, D). Otherputative candidate genes near the QTL peak are, forinstance, GCNT1 (glucosaminyl (N-acetyl) transferase 1,core 2 36.9 Mb), which plays a role in mucin biosynthesis(KEGG entry 427260) and UBQLN1 (ubiquilin 1, 39.4 Mb),which is required during protein degradation.The number of SNP on chromosome Z differed between
the populations studied. Within the QTL region fine-mapped on chromosome Z, six SNP were informative inthe Hy-Line population, but only three of these werecommon in the two mapping populations. Althoughthis complicates comparisons and interpretation of theresults between the populations, our results were in lineand were unambiguous for the commercial line.Clusters of significantly associated markers, as on chro-
mosomes 7 and Z, could be due either to a high number ofcausative polymorphisms or to a single causative poly-morphism in the region with a high level of LD [33]. Theeffect of each associated SNP in the cluster might have asmall effect, but within the region, the haplotypes couldhave a large overall effect on the trait studied. Many resultssuggest that accumulation of variations at the same locusis a relatively common mechanism [33].
ConclusionsWe identified four genomic regions that affect albumenquality in chicken of which those on chromosomes 4and 26 are novel. The QTL on chromosomes 7 and Zoverlapped with previously identified QTL for shell qual-ity, which suggests the existence of possible commonfactors for both albumen and shell quality. The resultsof this study are congruent with the general assumptionthat multi-factorial causes are involved in egg albumenthinning. The genes that control albumen quality arediverse and act either directly or indirectly via differentmechanisms. Egg white thinning is an intricate processthat can take place anywhere during the process, startingfrom albumen formation in the magnum to egg storageafter oviposition.
Additional files
Additional file 1: HU QTL results within 668 F2 on chromosome 7and Z during the initial scan with the low-coverage marker map.Short description: QTL on chromosomes 7 and Z derived by a multi-markerregression method (Y-axis = F-ratio, X-axis = location in cM).
Additional file 2: Significant genotype-trait association plotsobtained from the commercial line (Hy-Line) with different markersand phenotypes. Short description: Marker association test incommercial line with a non-parametric Kruskal-Wallis test.
Competing interestsThe authors declare that they have no competing interests.
Authors’ contributionsMH designed the genotyping work, participated in the statistical analysis(QTL mapping and association analyses) and wrote the manuscript. JTperformed the genotyping. MT-H contributed to the design of the study andto data collection and analyses. JA, MS and RP contributed to the design ofthe study, provided phenotypic data and animal samples. JV supervised thestudy and edited the manuscript. All authors read and approved the finalmanuscript.
AcknowledgementsThis project was funded by Lohmann Tierzucht GmbH. We are grateful toLaura Lauttamäki for running the experiments in the poultry house. Thememory of Laura is deeply revered. We are thankful to Anneli Virta formanaging the laboratory, Tiina Jaakkola for precise technical assistance andDaniel Fischer for guidance in statistical analysis.
Author details1MTT Biotechnology and Food Research, Jokioinen 31600, Finland. 2LohmannTierzucht GmbH, Cuxhaven, Germany. 3Hy-Line International, P.O. Box 310,Dallas Center, IA 50063, USA.
Received: 16 November 2012 Accepted: 13 July 2013Published: 16 August 2013
References1. Haugh RR: The Haugh unit or measuring egg quality. U.S. Egg and Poultry
Magazine 1937, 43:552–573.2. Silversides FG, Budgell K: The relationships among measures of egg
albumen height, pH, and whipping volume. Poult Sci 2004, 83:1619–1623.3. Scott TA, Silversides FG: The effect of storage and strain of hen on egg
quality. Poult Sci 2000, 79:1725–1729.4. Poggenpoel DG: Correlated response in shell and albumen quality with
selection for increased egg production. Poult Sci 1986, 65:1633–1641.5. Hunton P: Poultry production. World Animal Science C9. London: Elsevier; 1995.6. Jin YH, Lee KT, Lee WI, Han YK: Effects of storage temperature and time
on the quality of eggs from laying hens at peak production. Asian-Aust JAnim Sci 2011, 24:279–284.
7. Hu ZL, Park CA, Fritz ER, Reecy JM: QTLdb: A comprehensive database toolbuilding bridges between genotypes and phenotypes. In Proceedings ofthe 9th World Congress on Genetics Applied to Livestock Production: 1–6August 2010. Leipzig; 2010 [http://www.kongressband.de/wcgalp2010/assets/html/0017.htm]
8. Tuiskula-Haavisto M, de Koning DJ, Honkatukia M, Schulman NF, Maki-TanilaA, Vilkki J: Quantitative trait loci with parent-of-origin effects in chicken.Genet Res 2004, 84:57–66.
9. Hansen C, Yi N, Zhang YM, Xu S, Gavora J, Cheng HH: Identification of QTLfor production traits in chickens. Anim Biotechnol 2005, 16:67–79.
10. Honkatukia M, Tuiskula-Haavisto M, de Koning DJ, Virta A, Maki-Tanila A,Vilkki J: A region on chicken chromosome 2 affects both egg whitethinning and egg weight. Genet Sel Evol 2005, 37:563–577.
11. Wardecka B, Olszewski R, Jaszczak K, Zieba G, Pierzchala M, Wicinska K:Relationship between microsatellite marker alleles on chromosomes 1–5originating from the Rhode Island Red and Green-legged Partrigenousbreeds and egg production and quality traits in F(2) mappingpopulation. J Appl Genet 2002, 43:319–329.
12. Schreiweis MA, Hester PY, Settar P, Moody DE: Identification ofquantitative trait loci associated with egg quality, egg production, andbody weight in an F2 resource population of chickens. Anim Genet 2006,37:106–112.
13. Abasht B, Sandford E, Arango J, Settar P, Fulton JE, O'Sullivan NP, Hassen A,Habier D, Fernando RL, Dekkers JCM, Lamont SJ: Extent and consistency oflinkage disequilibrium and identification of DNA markers for productionand egg quality traits in commercial layer chicken populations.BMC Genomics 2009, 10:S2.
14. Liu W, Li D, Liu J, Chen S, Qu L, Zheng J, Xu G, Yang N: A genome-wideSNP scan reveals novel loci for egg production and quality traits inwhite leghorn and brown-egg dwarf layers. PLoS One 2011, 6:e28600.
15. The National Center for Biotechnology Information, GENE: [http://www.ncbi.nlm.nih.gov/gene]
16. Mann K: The chicken egg white proteome. Proteomics 2007, 7:3558–3568.
Honkatukia et al. Genetics Selection Evolution 2013, 45:31 Page 8 of 8http://www.gsejournal.org/content/45/1/31
17. Mann K, Mann M: In-depth analysis of the chicken egg white proteomeusing an LTQ Orbitrap Velos. Proteome Sci 2011, 9:7.
18. Omana DA, Liang Y, Kav NNV, Wu J: Proteomic analysis of egg whiteproteins during storage. Proteomics 2011, 11:144–153.
19. Tuiskula‐Haavisto M, Honkatukia M, Preisinger R, Schmutz M, De Koning DJ,Wei WH, Vilkki J: Quantitative trait loci affecting eggshell traits in an F2population. Anim Genet 2011, 42:293–299.
20. Tuiskula-Haavisto M, Honkatukia M, Vilkki J, de Koning DJ, Schulman NF,Mäki-Tanila A: Mapping of quantitative trait loci affecting quality andproduction traits in egg layers. Poult Sci 2002, 81:919–927.
21. Illumina: [http://www.illumina.com]22. Honkatukia M, Tuiskula-Haavisto M, Ahola V, Uimari P, Schmutz M, Preisinger
R, Cavero D, Vennerström P, Arango J, O'Sullivan N, Fulton J, Vilkki J:Mapping of QTL affecting incidence of blood and meat inclusions in egglayers. BMC Genet 2011, 12:55.
23. Green P, Falls K, Crooks S: CRI-MAP Documentation. version 2.4. ; 1990 [http://saf.bio.caltech.edu/saf_manuals/crimap-doc.html]
24. QTL Analysis using Grid Technology: [http://www.gridqtl.org.uk/]25. Sasaki O, Odawara S, Takahashi H, Nirasawa K, Oyamada Y, Yamamoto R,
Ishii K, Nagamine Y, Takeda H, Kobayashi E, Furukawa T: Genetic mappingof quantitative trait loci affecting body weight, egg character and eggproduction in F2 intercross chickens. Anim Genet 2004, 35:188–194.
26. Lorenz FW, Taylor LW: The inheritance of an albumen qualitycharacteristic of chicken eggs. J Agric Res 1940, 61:293–301.
27. Rose-Martel M, Du J, Hincke MT: Proteomic analysis provides new insightinto the chicken eggshell cuticle. J Proteomics 2012, 75:2697–2706.
28. Kusuda S, Iwasawa A, Doi O, Ohya Y, Yoshizaki N: Diversity of the cuticlelayer of avian eggshells. J Poult Sci 2011, 48:119–124.
29. Hincke MT, Nys Y, Gautron J: The role of matrix proteins in eggshellformation. J Poult Sci 2010, 47:208–219.
30. Jonchère V, Réhault-Godbert S, Hennequet-Antier C, Cabau C, Sibut V,Cogburn LA, Nys Y, Gautron J: Gene expression profiling to identifyeggshell proteins involved in physical defense of the chicken egg.BMC Genomics 2010, 11:57.
31. Hiidenhovi J: Ovomucin. In Bioactive Egg Compounds. Edited by HuopalahtiR, Lopez-Fandino R, Anton M, Schade R. Heidelberg: Springer-Verlag Berlin;2007:61–68.
32. Offengenden M, Fentabil MA, Wu J: N-glycosylation of ovomucin fromhen egg white. Glycoconj J 2011, 28:113–123.
33. Bickel RD, Kopp A, Nuzhdin SV: Composite effects of polymorphisms nearmultiple regulatory elements create a major-effect QTL. PLoS Genet 2011,7:e1001275.
doi:10.1186/1297-9686-45-31Cite this article as: Honkatukia et al.: QTL mapping of egg albumenquality in egg layers. Genetics Selection Evolution 2013 45:31.
Submit your next manuscript to BioMed Centraland take full advantage of:
• Convenient online submission
• Thorough peer review
• No space constraints or color figure charges
• Immediate publication on acceptance
• Inclusion in PubMed, CAS, Scopus and Google Scholar
• Research which is freely available for redistribution
Submit your manuscript at www.biomedcentral.com/submit