implementasi digital inter-clustering linkage agroindustry ...
Upload
independentCategory
view
1download
0
1Institute of Animal Physiology and Genetics, Academy of Sciences of the Czech Republic, Libechov,Czech Republic; 2DIPROVAL, Sezione di Allevamenti Zootecnici, University of Bologna, Italy and3Department of Animal Breeding and Biotechnology, University of Hohenheim, Stuttgart, Germany
Linkage and QTL mapping for Sus scrofa chromosome 4
By S. Cepica1, A. Stratil
1, M. Kopecny1, P. Blazkova
1, J. Schroffel Jr1, R. Davoli
2,L. Fontanesi
2, G. Reiner3, H. Bartenschlager
3, G. Moser3 and H. Geldermann
3
SummaryLinkage maps of Sus scrofa chromosome 4 (SSC4) based on 19 markers were similar in lengths for threeF2-families [Wild Boar (W), Meishan (M) and Pietrain (P) crosses] and in agreement with thepreviously published maps. Quantitative trait loci (QTLs) on SSC4 affect mainly muscle and fat mass.Compared with others, Pietrain alleles were associated with longer carcass, higher body weight andhigher meat content. In all three families, the profiles of F ratio values for these traits showed peaksclose to the positions of candidate genes V-ATPase, ATP1A2 and ATP1B1. Additional moreproximally mapped QTLs, significant at the p < 0.05 chromosome-wide level, were found in theM · P and W · P families. The W · M family revealed highly significant QTLs located in the vicinityof AMPD1 and NGFB. The SSC4 QTLs explained up to 12% of F2 phenotypic variance.
ZusammenfassungDie Kopplungskarten fur Chromosom 4 (SSC4) mit 19 Markern zeigten eine gute Ubereinstimmungzwischen drei F2-Familien, die auf Kreuzungen mit Wildschwein, Meishan und Pietrain basierten, undebenso zu den Werten bereits publizierter Karten. Die QTL-Effekte auf SSC4 beeinflusstenhauptsachlich Merkmale der Muskel- und Fettmasse. An den QTL-Positionen traten Pietrainallelemit langeren Schlachtkorpern, hoheren Korpergewichten und hoheren Fleischanteilen assoziiert auf alsandere Allele. In allen drei Familien zeigten die Profile der F-Ratio-Werte Ahnlichkeiten und Maximanahe den Kandidatengenen V-ATPase, ATP1A2 und ATP1B1. Zusatzlich wurden proximal lokali-sierte, kleinere QTLs in den Familien M · P und W · P gefunden, wahrend in der Familie W · Mhochsignifikante QTLs an den Positionen der Loci AMPD1 und NGFB auftraten. QTL-Effekte aufSSC4 erklarten bis zu 12% der phanotypischen Varianz in der F2-Generation.
Introduction
Linkage maps of Sus scrofa chromosome 4 (SSC4) (http://www.thearkdb.org) rangebetween 130.1 (USDA-MARC.2; Rohrer et al. 1996) and 165.0 cM (PiGMaP.1; Archi-
bald et al. 1995), with up to 70 loci mapped (USDA-MARC.2). SSC4 was the first porcinechromosome analysed for quantitative trait loci (QTLs), with growth and fat depositionQTLs detected (Andersson et al. 1994). Subsequently, QTLs on SSC4 have beendescribed for ovulation rate (Rathje et al. 1997), number of stillborn piglets (Wilkie et al.1999), growth (Knott et al. 1998; Walling et al. 1998; Wang et al. 1998; Marklund
et al. 1999; Paszek et al. 1999; Bidanel et al. 2001; De Koning et al. 2001a; Malek et al.2001a; Knott et al. 2002), length of small intestine (Knott et al. 1998), carcasscomposition (Andersson-Eklund et al. 1998; Malek et al. 2001a), carcass length(Rohrer and Keele 1998; Marklund et al. 1999; Knott et al. 2002), fat depositiontraits (Knott et al. 1998, 2002; Marklund et al. 1999; Perez-Enciso et al. 2000; Bidanel
et al. 2001; Grindflek et al. 2001; Malek et al. 2001a), muscling traits (Andersson-
Eklund et al. 1998; Perez-Enciso et al. 2000; Malek et al. 2001a), meat quality and stressresistance (De Koning et al. 1999, 2001b; Perez-Enciso et al. 2000; Rattink et al. 2000;
J. Anim. Breed. Genet. 120 (Suppl. 1) 2003; 28–37� 2003 Blackwell Verlag, Berlin
U.S. Copyright Clearance Center Code Statement: 1742–4488/2003/S2001–0028 $15.00/0 www.blackwell.de/synergy

Grindflek et al. 2001; Malek et al. 2001b). A preliminary report on the data for SSC4from the Hohenheim F2 families has been provided by Geldermann et al. (1999). TheHohenheim SSC4 genotype and performance data for growth and fatness traits have alsobeen included in a combined analysis published by Walling et al. (2000).
Materials and methods
F2 families were produced based on crosses of Meishan (M), European Wild Boar (W) andPietrain (P). Family structure, housing, selection of quantitative traits and marker loci aswell as statistical analysis are described elsewhere (Geldermann et al. 2003). SSC4 hasbeen genotyped for 19 markers (Table 1); 12 markers have been tested in all three pedigrees.
Results and discussion
Marker characterization and linkage maps
Table 2a shows that the founder groups averaged about three alleles at the SSC4 markerloci. For the blood group erythrocyte antigen L (EAL) and most of the microsatellite loci,three or more alleles were observed per locus. Numbers of informative meioses differedbetween loci and were on average about 30% lower in the W · P family than in the other
Table 1. Markers used for linkage analysis on SSC4
Marker locus Type Reference Genotyping
S0073 MS Fredholm et al. (1993) Libechov1
S0097 MS Ellegren et al. (1993) Libechov1
S0145 MS Wilke et al. (1994) Libechov1
SW489 MS Rohrer et al. (1994) Libechov1
SW835 MS Rohrer et al. (1994) Libechov1
SW1073 MS Rohrer et al. (1994) Libechov1
SW1089 MS Rohrer et al. (1994) Libechov1
SW2128 MS Alexander et al. (1996a) Libechov1
SW2435 MS Alexander et al. (1996b) Libechov1
SWR73 MS Alexander et al. (1996a) Libechov1
AMPD1 RFLP Stratil et al. (2000) Libechov1
ATP1A2 SSCP Blazkova et al. (2000) Bologna2
ATP1B1 RFLP Blazkova et al. (2000) Libechov1
EAL BG Hojny et al. (1967), Linhart (1971) Libechov1
MYC RFLP Reiner et al. (2000) Gießen3
NGFB DGGE Kopecny et al. (2000) Libechov1
PKLR RFLP Knoll et al. (2000a) Libechov1
TSHB RFLP Knoll et al. (2000b) Libechov1
V-ATPase RFLP Blazkova et al. (2000) Libechov1
MS, microsatellite; RFLP, restriction fragment length polymorphism; SSCP, single strand conformation poly-morphism; BG, blood group; DGGE, denaturant gradient gel electrophoresis; AMPD1, adenosine monophos-phate deaminase 1 (RsaI-RFLP); ATP1A2, Na+-K+-ATPase, subunit a2; ATP1B1, Na+-K+-ATPase, b-subunit(HpaII-RFLP); EAL, erythrocyte antigen L; MYC, c-myc protooncogene protein (HpaII-RFLP); NGFB, nervegrowth factor b; PKLR, pyruvate kinase (liver and red blood cell; MvaI-RFLP); TSHB, thyroid stimulatinghormone, b-subunit (MnlI-RFLP); V-ATPase, vacuolar H(+) ATPase subunit gene (DraI-RFLP).1Institute of Animal Physiology and Genetics, Academy of Sciences of the Czech Republic, Libechov, CzechRepublic.2DIPROVAL, Sezione di Allevamenti Zootecnici, University of Bologna, Reggio Emilia, Italy.3Institute of Animal Breeding and Genetics, University of Gießen, Germany.
29Linkage and QTL mapping for Sus scrofa chromosome 4

Table 2. Properties of marker alleles
(a) Alleles in the founder generation
Marker locus
Alleles in
M P W
m (1) f (4) f (14) m (1)
S0073 5 1, 3, 4 1, 3, 4, 5, 6 2, 3S0097 2, 3 2, 3, 4 1, 2, 3, 4 1, 5S0145 1, 4 1, 2, 3, 4, 5 2, 3 3, 4SW489 4, 5 1, 3, 4 1, 2, 3, 4, 5 2, 4SW835 3 2, 3 1, 2, 3 1, 2SW1073 1, 3 1, 2, 3, 4 2, 4, 5 2, 4SW1089 2, 3 3, 4 1 1, 2SW2128 – – 1, 2 1, 2SW2435 3 3, 4, 5 1, 2 1, 2SWR73 3 1, 2 1, 2 1, 2AMPD1 B A, B A AATP1A2 1 1, 2 1, 2 1, 2ATP1B1 A A, B B BEAL adhi, adhjk adhi, adhjk bcgi, agim, adhjk, adhjl1 bcgiMYC 1, 2 1, 2 1, 2 1, 2NGFB B B A, B A, BPKLR B B A, B ATSHB A, B – B –V-ATPase B – A, B B
(b) Number of alleles, heterozygosity and number of informative meioses
Marker locus
Family
M · P W · P W · M
n h IM n h IM n h IM
S0073 4 0.82 432 5 0.72 337 4 0.91 533S0097 4 0.91 664 3 0.64 595 5 1.00 726S0145 4 1.00 698 – – – 5 0.78 652SW489 4 0.96 685 5 0.68 438 4 0.61 593SW835 3 1.00 632 3 1.00 686 3 0.48 515SW1073 5 1.00 700 3 0.42 284 4 0.82 663SW1089 3 1.00 700 2 0.52 387 4 1.00 728SW2128 – – – 2 0.50 416 – – –SW2435 3 1.00 630 2 0.39 336 5 1.00 728SWR73 3 1.00 632 – – – 2 0.70 630AMPD1 2 1.00 632 – – – 2 0.78 568ATP1A2 2 0.64 382 2 0.57 275 2 0.57 266ATP1B1 2 1.00 630 – – – 2 0.43 341EAL 4 1.00 696 3 0.21 64 3 1.00 656MYC 2 0.77 610 2 0.50 503 2 0.61 427NGFB 2 0.27 103 2 0.64 308 2 0.56 273PKLR 2 0.68 379 2 0.25 466 2 1.00 662TSHB 2 0.50 257 – – – – – –V-ATPase 2 0.27 101 2 0.18 197 – – –Average 2.9 0.82 531 2.7 0.52 378 3.2 0.77 560
M, Meishan; P, Pietrain; W, Wild Boar; m, male; f, female; n, number of alleles observed in F1 generation; h,heterozygosity observed in F1 generation; IM, number of informative meioses; –, not tested. For informationcontent of F2 generation see Fig. 1.The numbers of founder animals used to generate the F1 animals are given in parentheses.1Allele occurring in the W · P family, but not in the M · P family.
30 S. Cepica et al.

two families (Table 2b). Information content across SSC4 was mostly higher than 0.6(Fig. 1).
The linkage maps presented in Fig. 2 for the M · P, W · P and W · M families showaverage marker spacing of 7.9, 10.1 and 8.5 cM, respectively. The maps covered almost allof SSC4, with the most proximal marker SW489 mapping to position 8 cM and the mostdistal marker S0097 to position 120 cM on USDA-MARC.2 map. Recombination rates andthe order of loci were similar for the three families and in agreement with published maps.The map position of EAL was in agreement with Marklund et al. (1993) and Rohrer
et al. (1997). For the intervals which could be compared, the lengths of our SSC4 mapswere on average about 17% longer than the USDA-MARC.2 map, but about 15% shorterthan the PiGMaP.1 map. As expected for mammals, maternal recombination ratios werehigher than paternal ones, with ratios of 1.63, 1.42 and 1.26 in the M · P, W · P andW · M families, respectively. In all families, no sex difference in recombination frequency
Fig. 1. Information content for SSC4. For individual marker loci, the polymorphism informationcontent (PIC) values are shown as crosses. The cumulative information content across the
chromosome is indicated by the solid line. Distances between loci are given in sex-averaged cM
31Linkage and QTL mapping for Sus scrofa chromosome 4

was observed in the interval SW2435 to S0097, whereas major sex differences wereobserved for the interval SW1089 to SW2435.
Map positions and effects of QTLs
In the M · P family (Table 3a), QTLs for carcass traits were found mainly in the interval60–80 cM which includes the type I genes V-ATPase, ATP1B1 and ATP1A2 (Fig. 3a).QTLs significant at the genome-wide level were found for carcass length and muscle massand were mapped between the genes ATP1B1 and ATP1A2, which code for the twosubunits of the Na+, K+–ATPase transmembrane enzyme complex. A further QTL at23 cM for fat cuts percentage mapped to a similar position as the MYC locus. This locusencodes for the muscle influencing c-myc protooncogene protein, for which an associationwith hyperplasia has been described (Kipshidze et al. 2002). A QTL for food consumptionand fatness was found in the interval SW835 to SWR73 at about 36 cM.
In the W · P family (Table 3b, Fig. 3b), QTLs for fat and lean cuts were mappedbetween V-ATPase and ATP1A2. A further QTL for shoulder meat weight was mappedbetween SW2435 and S0097, whereas smaller QTLs were mapped elsewhere on SSC4. Thepositions of the QTLs for muscle and fat in carcass detected in the W · P as well as theM · P family were consistent with the positions of the closely linked loci V-ATPase,ATP1B1 and ATP1A2 and thus make them candidates for further investigation.
For the W · M family (Table 3c, Fig. 3c) most QTLs mapped around 90 cM, in thevicinity of EAL, adenosine monophosphate deaminase 1 (AMPD1) and nerve growthfactor b (NGFB). Minor QTLs for fat cuts percentage, meat area and ham weight weremapped in the W · M family at about 70 cM close to the ATP1B1 locus.
As shown in Table 3, in the M · P and W · P families most SSC4 QTLs wereadditive. Negative dominance effects were mostly significant, especially in the M · P andW · M families. Alleles originating from Pietrain were superior in their effects on theamount of meat and growth over alleles from Meishan or Wild Boar. In the W · M
Fig. 2. Genetic linkage maps of SSC4. For each family the sex-averaged (left), maternal (middle) andpaternal (right) maps are shown with the estimated Kosambi map distances (cM) between loci(numbers at right hand side of the maps). To the left hand side of the sex-averaged maps the statisticalsupports for the pair-wise order of markers are given. The total lengths of the maps are indicated at the
bottom of each bar
32 S. Cepica et al.
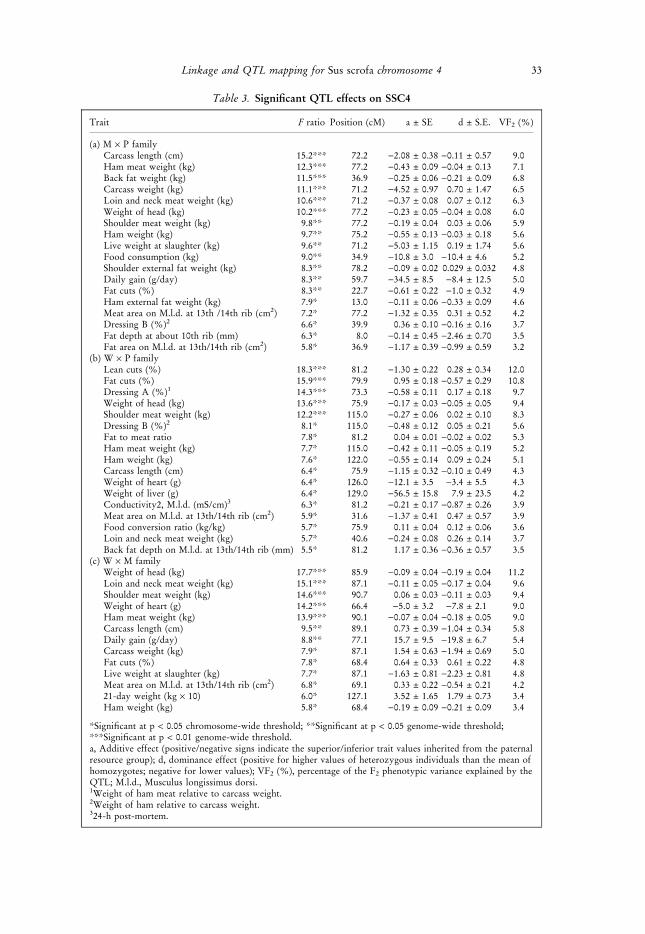
Table 3. Significant QTL effects on SSC4
Trait F ratio Position (cM) a ± SE d ± S.E. VF2 (%)
(a) M · P familyCarcass length (cm) 15.2*** 72.2 )2.08 ± 0.38 )0.11 ± 0.57 9.0Ham meat weight (kg) 12.3*** 77.2 )0.43 ± 0.09 )0.04 ± 0.13 7.1Back fat weight (kg) 11.5*** 36.9 )0.25 ± 0.06 )0.21 ± 0.09 6.8Carcass weight (kg) 11.1*** 71.2 )4.52 ± 0.97 0.70 ± 1.47 6.5Loin and neck meat weight (kg) 10.6*** 71.2 )0.37 ± 0.08 0.07 ± 0.12 6.3Weight of head (kg) 10.2*** 77.2 )0.23 ± 0.05 )0.04 ± 0.08 6.0Shoulder meat weight (kg) 9.8** 77.2 )0.19 ± 0.04 0.03 ± 0.06 5.9Ham weight (kg) 9.7** 75.2 )0.55 ± 0.13 )0.03 ± 0.18 5.6Live weight at slaughter (kg) 9.6** 71.2 )5.03 ± 1.15 0.19 ± 1.74 5.6Food consumption (kg) 9.0** 34.9 )10.8 ± 3.0 )10.4 ± 4.6 5.2Shoulder external fat weight (kg) 8.3** 78.2 )0.09 ± 0.02 0.029 ± 0.032 4.8Daily gain (g/day) 8.3** 59.7 )34.5 ± 8.5 )8.4 ± 12.5 5.0Fat cuts (%) 8.3** 22.7 )0.61 ± 0.22 )1.0 ± 0.32 4.9Ham external fat weight (kg) 7.9* 13.0 )0.11 ± 0.06 )0.33 ± 0.09 4.6Meat area on M.l.d. at 13th /14th rib (cm2) 7.2* 77.2 )1.32 ± 0.35 0.31 ± 0.52 4.2Dressing B (%)2 6.6* 39.9 0.36 ± 0.10 )0.16 ± 0.16 3.7Fat depth at about 10th rib (mm) 6.3* 8.0 )0.14 ± 0.45 )2.46 ± 0.70 3.5Fat area on M.l.d. at 13th/14th rib (cm2) 5.8* 36.9 )1.17 ± 0.39 )0.99 ± 0.59 3.2
(b) W · P familyLean cuts (%) 18.3*** 81.2 )1.30 ± 0.22 0.28 ± 0.34 12.0Fat cuts (%) 15.9*** 79.9 0.95 ± 0.18 )0.57 ± 0.29 10.8Dressing A (%)1 14.3*** 73.3 )0.58 ± 0.11 0.17 ± 0.18 9.7Weight of head (kg) 13.6*** 75.9 )0.17 ± 0.03 )0.05 ± 0.05 9.4Shoulder meat weight (kg) 12.2*** 115.0 )0.27 ± 0.06 0.02 ± 0.10 8.3Dressing B (%)2 8.1* 115.0 )0.48 ± 0.12 0.05 ± 0.21 5.6Fat to meat ratio 7.8* 81.2 0.04 ± 0.01 )0.02 ± 0.02 5.3Ham meat weight (kg) 7.7* 115.0 )0.42 ± 0.11 )0.05 ± 0.19 5.2Ham weight (kg) 7.6* 122.0 )0.55 ± 0.14 0.09 ± 0.24 5.1Carcass length (cm) 6.4* 75.9 )1.15 ± 0.32 )0.10 ± 0.49 4.3Weight of heart (g) 6.4* 126.0 )12.1 ± 3.5 )3.4 ± 5.5 4.3Weight of liver (g) 6.4* 129.0 )56.5 ± 15.8 7.9 ± 23.5 4.2Conductivity2, M.l.d. (mS/cm)3 6.3* 81.2 )0.21 ± 0.17 )0.87 ± 0.26 3.9Meat area on M.l.d. at 13th/14th rib (cm2) 5.9* 31.6 )1.37 ± 0.41 0.47 ± 0.57 3.9Food conversion ratio (kg/kg) 5.7* 75.9 0.11 ± 0.04 0.12 ± 0.06 3.6Loin and neck meat weight (kg) 5.7* 40.6 )0.24 ± 0.08 0.26 ± 0.14 3.7Back fat depth on M.l.d. at 13th/14th rib (mm) 5.5* 81.2 1.17 ± 0.36 )0.36 ± 0.57 3.5
(c) W · M familyWeight of head (kg) 17.7*** 85.9 )0.09 ± 0.04 )0.19 ± 0.04 11.2Loin and neck meat weight (kg) 15.1*** 87.1 )0.11 ± 0.05 )0.17 ± 0.04 9.6Shoulder meat weight (kg) 14.6*** 90.7 0.06 ± 0.03 )0.11 ± 0.03 9.4Weight of heart (g) 14.2*** 66.4 )5.0 ± 3.2 )7.8 ± 2.1 9.0Ham meat weight (kg) 13.9*** 90.1 )0.07 ± 0.04 )0.18 ± 0.05 9.0Carcass length (cm) 9.5** 89.1 0.73 ± 0.39 )1.04 ± 0.34 5.8Daily gain (g/day) 8.8** 77.1 15.7 ± 9.5 )19.8 ± 6.7 5.4Carcass weight (kg) 7.9* 87.1 1.54 ± 0.63 )1.94 ± 0.69 5.0Fat cuts (%) 7.8* 68.4 0.64 ± 0.33 0.61 ± 0.22 4.8Live weight at slaughter (kg) 7.7* 87.1 )1.63 ± 0.81 )2.23 ± 0.81 4.8Meat area on M.l.d. at 13th/14th rib (cm2) 6.8* 69.1 0.33 ± 0.22 )0.54 ± 0.21 4.221-day weight (kg · 10) 6.0* 127.1 3.52 ± 1.65 1.79 ± 0.73 3.4Ham weight (kg) 5.8* 68.4 )0.19 ± 0.09 )0.21 ± 0.09 3.4
*Significant at p < 0.05 chromosome-wide threshold; **Significant at p < 0.05 genome-wide threshold;***Significant at p < 0.01 genome-wide threshold.a, Additive effect (positive/negative signs indicate the superior/inferior trait values inherited from the paternalresource group); d, dominance effect (positive for higher values of heterozygous individuals than the mean ofhomozygotes; negative for lower values); VF2 (%), percentage of the F2 phenotypic variance explained by theQTL; M.l.d., Musculus longissimus dorsi.1Weight of ham meat relative to carcass weight.2Weight of ham relative to carcass weight.324-h post-mortem.
33Linkage and QTL mapping for Sus scrofa chromosome 4
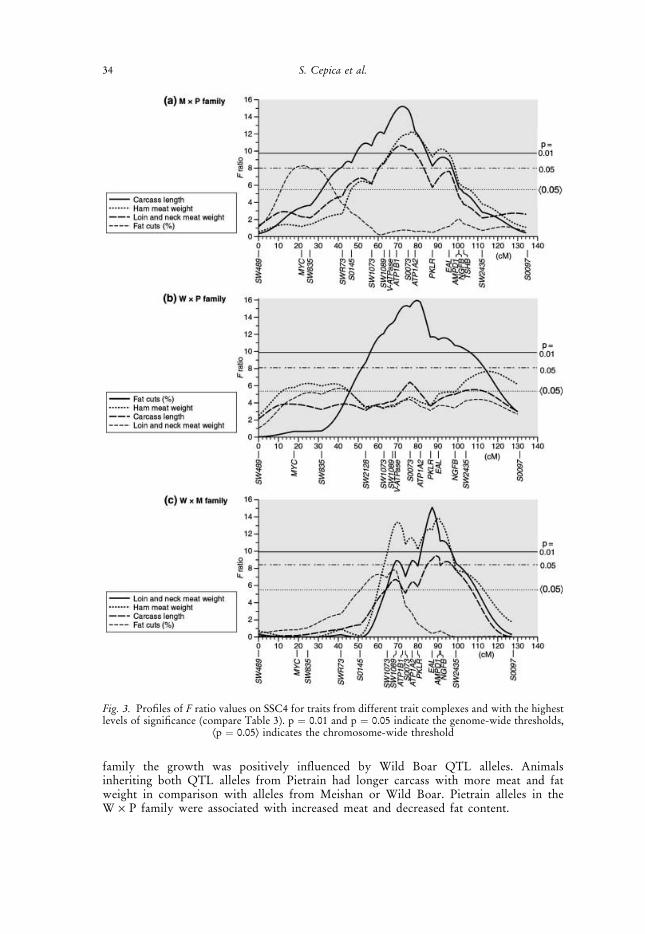
family the growth was positively influenced by Wild Boar QTL alleles. Animalsinheriting both QTL alleles from Pietrain had longer carcass with more meat and fatweight in comparison with alleles from Meishan or Wild Boar. Pietrain alleles in theW · P family were associated with increased meat and decreased fat content.
Fig. 3. Profiles of F ratio values on SSC4 for traits from different trait complexes and with the highestlevels of significance (compare Table 3). p ¼ 0.01 and p ¼ 0.05 indicate the genome-wide thresholds,
Æp ¼ 0.05æ indicates the chromosome-wide threshold
34 S. Cepica et al.
Overall, QTLs on SSC4 affected mainly muscle mass and were similar in all F2
families (Table 3). The QTL profiles for these traits (Fig. 3) were similar and mappednear the candidate genes V-ATPase, ATP1A2 and ATP1B1. Additionally, moreproximally located and smaller QTLs were found in the M · P and W · P families,whereas QTLs in the W · M family were found more distally at the position of theloci AMPD1 and NGFB. The QTLs on SSC4 explained up to 12% of the F2
phenotypic variance. Our results agree with previous studies performed with WildBoar · Large White crosses (Andersson et al. 1994; Knott et al. 1998, 2002;Marklund et al. 1999), where QTLs on SSC4 were mapped for growth and fatdeposition. Likewise our SSC4 QTLs for growth and/or fat deposition were alsodetected in crosses of Meishan · Large White (Walling et al. 1998; Rattink et al.2000; Bidanel et al. 2001), Meishan · Dutch commercial lines (De Koning et al. 1999,2001a), Iberian · Landrace (Perez-Enciso et al. 2000), Berkshire · Yorkshire (Malek
et al. 2001a), and Meishan · Yorkshire (Paszek et al. 1999). A joint analysis of datafrom different SSC4 studies (Walling et al. 2000) confirmed QTLs for growth rate(birth weight, daily weight gain) and back fat thickness in the interval V-ATPase toATP1A2 (63 and 97 cM). In agreement with our findings, SSC4 QTLs for carcasslength were also detected by Rohrer and Keele (1998) in Meishan · White compositeanimals, and by Marklund et al. (1999) and Knott et al. (2002) in Wild Boar · LargeWhite crosses. Perez-Enciso et al. (2000) and Grindflek et al. (2001) described SSC4QTLs for fatty acid metabolism in Iberian · Landrace and Duroc · NorwegianLandrace crosses, respectively. SSC4 QTLs for meat quality were reported byGrindflek et al. (2001) and De Koning et al. (2001b) in Duroc · NorwegianLandrace and Meishan · Dutch commercial crosses, respectively. Literature data andour results confirm that different crosses consistently show SSC4 QTLs which could beimportant for the pig industry. However, some QTLs affecting the same traits weremapped at different positions. These results are partly due to the fact that markers,families, trait recording as well as the statistical power of QTL mapping were differentbetween the studies. Therefore additional studies involving fine mapping of candidategenes may help to reveal the genes underlying the SSC4 QTLs.
Acknowledgements
The investigation was supported by the German Research Foundation (DFG, grant nos. Mu616/6 andGe291/20), the EC programmes BRIDGE and INCO-Copernicus, the Grant Agency of the CzechRepublic (Grant nos. 523/96/0597, 523/97/1305, 523/99/0842, 523/00/0669) and GA CSAV 54553. TheMeishan pigs used in the experiments were from a population provided from the WageningenAgricultural University and Euribrid, BV Boxmeer, The Netherlands.
References
Alexander, L. J.; Rohrer, G. A.; Beattie, C. W., 1996a: Cloning and characterization of 414polymorphic porcine microsatellites. Anim. Genet. 27: 137–148.
Alexander, L. J.; Troyer, D. L.; Rohrer, G. A.; Smith, T. P. L.; Schook, L. B.; Beattie, C. W.,1996b: Physical assignments of 68 porcine cosmids and lambda clones containing polymorphicmicrosatellites. Mamm. Genome. 7: 368–372.
Andersson, L.; Haley, C. S.; Ellegren, H.; Knott, S. A.; Johansson, M.; Andersson, K.;Andersson-Eklund, L.; Edfors-Lilja, I.; Fredholm, M.; Hansson, I.; Hakansson, J.;Lundstrøm, K., 1994: Genetic mapping of quantitative trait loci for growth and fatness in pigs.Science 263:1771–1774.
Andersson-Eklund, L.; Marklund, L.; Lundstrøm, K.; Haley, C. S.; Andersson, K.; Hansson, I.;Moller, M.; Andersson, L., 1998: Mapping quantitative trait loci for carcass and meat qualitytraits in a Wild Boar · Large White intercross. J. Anim. Sci. 76: 694–700.
Archibald, A. L.; Haley, C. S.; Brown, J. F.; Couperwhite, S.; McQueen, H. A.; Nicholson, D.;Coppieters, W.; Van de Weghe, A.; Stratil, A.; Winterø, A. K.; Fredholm, M.; Larsen, N. J.;Nielsen, V. H.; Milan, D.; Woloszyn, N.; Robic, A.; Dalens, M.; Riquet, J.; Gellin, J;
35Linkage and QTL mapping for Sus scrofa chromosome 4

Caritez, J.-C.; Burgaud, G.; Ollivier, L.; Bidanel, J.-P.; Vaiman, M.; Renard, C.;Geldermann, H.; Davoli, R.; Ruyter, D.; Verstege, E. J. M.; Groenen, M. A. M.; Davies,
W.; Høyheim, B.; Keiserud, A.; Andersson, L.; Ellegren, H.; Johansson, M.; Marklund, L.;Miller, J. R.; Anderson Dear, D. V.; Signer, E.; Jeffreys, A. J.; Moran, C.; Le Tissier, P.;Muladno; Rothschild, M. F.; Tuggle, C.K.; Vaske, D.; Helm, J.; Liu, H.-C.; Rahman, A.;Yu, T.P.; Larson, R. G.; Schmitz, C. B., 1995: The PiGMaP consortium linkage map of the pig(Sus scrofa). Mamm. Genome 6: 157–175.
Bidanel, J.-P.; Milan, D.; Iannucelli, N.; Amigues, Y.; Boscher, M. Y.; Bourgeois, F.; Caritez,J. C.; Gruand, J.; Le Roy, P.; Lagant, H.; Quintanilla, R.; Renard, C.; Gellin, J.; Ollivier,L.; Chevalet, C., 2001: Detection of quantitative trait loci for growth and fatness in pigs. Genet.Sel. Evol. 33: 289–309.
Blazkova, P.; Kopecny, M.; Fontanesi, L.; Stratil, A.; Davoli, R.; Reiner, G.; Geldermann, H.,2000: Linkage assignments of the porcine ATP1A2, ATP1B1 and V-ATPase (CGI-11) genes tochromosome 4. Anim. Genet. 31: 416–418.
De Koning, D. J.; Janss, L. L.; Rattink, A. P.; Van Oers, P. A.; De Vries, B. J.; Groenen, M. A. M.;Van Der Poel, J. J.; De Groot, P. N.; Brascamp, E. W.; Van Arendonk, J. A. M., 1999:Detection of quantitative trait loci for backfat thickness and intramuscular fat content in pigs (Susscrofa). Genetics 152: 1679–1690.
De Koning, D. J.; Rattink, A. P.; Harlizius, B.; Groenen, M. A. M.; Brascamp, E. W.; Van
Arendonk, J. A. M., 2001a: Detection and characterization of quantitative trait loci for growthand reproduction traits in pigs. Livest. Prod. Sci. 72: 185–198.
De Koning, D. J.; Harlizius, B.; Rattink, A. P.; Groenen, M. A. M.; Brascamp, E. W.; Van
Arendonk, J. A. M., 2001b: Detection and characterization of quantitative trait loci for meatquality traits in pigs. J. Anim. Sci. 79: 2812–2819.
Ellegren, H.; Johansson, M.; Chowdhary, B. P.; Marklund, S.; Ruyter, D.; Marklund, L.;Brauner-Nielsen, P.; Edfors-Lilja, I.; Gustavsson, I.; Juneja, R. K.; Andersson, L., 1993:Assignment of 20 microsatellite markers to the porcine linkage map. Genomics 16: 431–439.
Fredholm, M.; Winterø, A. K.; Christensen, K.; Kristensen, B.; Nielsen, P. B.; Davies, W.;Archibald, A. L., 1993: Characterization of 24 porcine (dA-dC)n-(dT-dG)n microsatellites:Genotyping of unrelated animals from four breeds and linkage studies. Mamm. Genome 4: 187–192.
Geldermann, H.; Moser, G.; Muller, E.; Beeckmann, P.; Yue, G.; Dragos, M.; Bartenschlager,H.; Cepica, S.; Stratil, A.; Schroffel, J., 1999: Status of genome and QTL mapping in pigs –data of Hohenheim F2 families. Arch. Tierzucht 42: 67–81.
Geldermann, H.; Muller, E.; Moser, G.; Reiner, G.; Bartenschlager, H.; Cepica, S.; Stratil,A.; Kuryl, J.; Moran, C.; Davoli, R.; Brunsch, C., 2003: Genome-wide linkage and QTLmapping in porcine F2 families generated from Pietrain, Meishan and Wild Boar crosses. J. Anim.Breed. Genet 120: 363–393.
Grindflek, E.; Szyda, J.; Liu, Z.; Lien, S., 2001: Detection of quantitative trait loci for meat quality ina commercial slaughter pig cross. Mamm. Genome 12: 299–304.
Hojny, J., Gavalier, M., Hradecky, J., Linhart, J., 1967: New blood factors in pigs. In: Proc. 10thEurop. Conf. Anim. Blood Grps Biochem. Polymorph., Paris, 1966, pp. 151–158.
Kipshidze, N. N.; Kim, H. S.; Iversen, P.; Yazdi, H. A.; Bhargava, B.; New, G.; Mehran, R.; Tio,F.; Haudenschild, C.; Dangas, G.; Stone, G. W.; Iyer, S.; Roubin, G. S.; Leon, M. B.; Moses,J. W., 2002: Intramural coronary delivery of advanced antisense oligonucleotides reducesneointimal formation in the porcine stent restenosis model. J. Am. Coll. Cardiol. 39: 1686–1691.
Knoll, A.; Stratil, A.; Moser, G.; Geldermann, H., 2000a: Characterization of three PCR-RFLPsin an intron of the porcine liver- and red cell-type pyruvate kinase (PKLR) gene. Anim. Genet. 31:234.
Knoll, A.; Stratil, A.; Schroffel, J.; Moser, G.; Dvorak, J.; Cepica, S., 2000b: A rare PCR-RFLPwithin intron 2 of the porcine TSHB gene. Czech. J. Anim. Sci. 45: 237–239.
Knott, S. A.; Marklund, L.; Haley, C. S.; Andersson, K.; Davies, W.; Ellegren, H.; Fredholm,M.; Hansson, I.; Hoyheim, B.; Lundstrom, K.; Moller, M.; Andersson, L., 1998: Multiplemarker mapping of quantitative trait loci in a cross between outbred Wild Boar and Large Whitepigs. Genetics 149: 1069–1080.
Knott, S. A.; Nystrøm, P. E.; Andersson-Eklund, L.; Stern, S.; Marklund, L.; Andersson, L.;Haley, C. S., 2002: Approaches to interval mapping of QTL in a multigeneration pedigree: theexample of porcine chromosome 4. Anim. Genet. 33: 26–32.
Kopecny, M.; Stratil, A.; Cepica, S.; Moser, G., 2000: Polymorphism in the porcine NGFB genedetected by DGGE and its linkage mapping. Czech. J. Anim. Sci. 45: 189–192.
Linhart, J., 1971: Lm, a new blood factor of the L system in pigs. Anim. Blood Grps Biochem. Genet.2: 243–245.
Malek, M.; Dekkers, J. C.; Lee, H. K.; Baas, T. J.; Rothschild, M. F., 2001a: A molecular genomescan analysis to identify chromosomal regions influencing economic traits in the pig. I. Growthand body composition. Mamm. Genome 12: 630–636.
36 S. Cepica et al.

Malek, M.; Dekkers, J. C.; Lee, H. K.; Baas, T. J.; Prusa, K.; Huff-Lonergan, E.; Rothschild, M.
F., 2001b: A molecular genome scan analysis to identify chromosomal regions influencingeconomic traits in the pig. II. Meat and muscle composition. Mamm. Genome 12: 637–645.
Marklund, L.; Winterø, A. K.; Thomsen, P. D.; Johansson, M.; Fredholm, M.; Gustafsson, U.;Andersson, L., 1993: A linkage group on pig chromosome 4 comprising the loci for blood groupL, GBA, ATP1B1 and three microsatellites. Anim. Genet. 24: 333–338.
Marklund, L.; Nystrøm, P. E.; Stern, S.; Andersson-Eklund, L.; Andersson, L., 1999: Confirmedquantitative trait loci for fatness and growth on pig chromosome 4. Heredity 82: 134–141.
Paszek, A. A.; Wilkie, P. J.; Flickinger, G. H.; Rohrer, G. A.; Alexander, L. J.; Beattie, C. W.;Schook, L. B., 1999: Interval mapping of growth in divergent swine cross. Mamm. Genome 10:117–122.
Perez-Enciso, M.; Clop, A.; Noguera, J. L.; Ovilo, C.; Coll, A.; Folch, J. M.; Babot, D.;Estany, J.; Oliver, M. A.; Diaz, I.; Sanchez, A., 2000: A QTL on pig chromosome 4 affects fattyacid metabolism: Evidence from an Iberian by Landrace intercross. J. Anim. Sci. 78: 2525–2531.
Rathje, T. A.; Rohrer, G. A.; Johnson, R. K., 1997: Evidence for quantitative trait loci affectingovulation rate in pigs. J. Anim. Sci. 75: 1486–1494.
Rattink, A. P.; De Koning, D. J.; Faivre, M.; Harlizius, B.; Van Arendonk, J. A. M.; Groenen,M. A. M., 2000: Fine mapping and imprinting analysis for fatness trait QTLs in pigs. Mamm.Genome 11: 656–661.
Reiner, G.; Willems, H.; Geldermann, H.; Dzapo, V., 2000: Four PCR-RFLPs and a sequencepolymorphism in the porcine c-myc proto-oncogene and confirmation of the chromosomallocalisation on SSC4 by linkage mapping. Anim. Genet. 31: 155–156.
Rohrer, G. A.; Keele, J. W., 1998: Identification of quantitative trait loci affecting carcasscomposition in swine: II. Muscling and wholesale product yield traits. J. Anim. Sci. 76: 2255–2262.
Rohrer, G. A.; Alexander, L. J.; Keele, J. W.; Smith, T. P.; Beattie, C. W., 1994: A microsatellitelinkage map of the porcine genome. Genetics 136: 231–245.
Rohrer, G. A.; Alexander, L. J.; Hu, Z.; Smith, T. P.; Keele, J. W.; Beattie, C. W., 1996: Acomprehensive map of the porcine genome. Genome Res. 6: 371–391.
Rohrer, G. A.; Vogeli, P.; Stranzinger, G.; Alexander, L. J.; Beattie, C. W., 1997: Mapping 28erythrocyte antigen, plasma protein and enzyme polymorphisms using an efficient genomic scanof the porcine genome. Anim. Genet. 28: 323–330.
Stratil, A.; Knoll, A.; Moser, G.; Kopecny, M.; Geldermann, H., 2000: The porcine adenosinemonophosphate deaminase 1 (AMPD1) gene maps to chromosome 4. Anim. Genet. 31: 147–148.
Walling, G. A.; Archibald, A. L.; Cattermole, J. A.; Downing, A. C.; Finlayson, H. A.;Nicholson, D.; Visscher, P. M.; Walker, C. A.; Haley, C. S., 1998: Mapping of quantitativetrait loci on porcine chromosome 4. Anim. Genet. 29: 415–424.
Walling, G. A.; Visscher, P. M.; Andersson, L.; Rothschild, M. F.; Wang, L. Z.; Moser, G.;Groenen, M. A. M.; Bidanel, J.-P.; Cepica, S.; Archibald, A. L.; Geldermann, H.; De
Koning, D. J.; Milan, D.; Haley, C. S., 2000: Combined analyses of data from quantitative traitloci mapping studies: chromosome 4 effects on porcine growth and fatness. Genetics 155: 1369–1378.
Wang, L.; Yu, T. P.; Tuggle, C. K.; Liu, H. C.; Rothschild, M. F., 1998: A directed search forquantitative trait loci on chromosomes 4 and 7 in pigs. J. Anim. Sci. 76: 2560–2567.
Wilke, K.; Jung, M.; Chen, Y.; Geldermann, H., 1994: Porcine (GT)n sequences: structure andassociation with dispersed and tandem repeats. Genomics 21: 63–70.
Wilkie, P. J.; Paszek, A. A.; Beattie, C. W.; Alexander, L. J.; Wheeler, M. B.; Schook, L. B., 1999:A genomic scan of porcine reproductive traits reveals possible quantitative trait loci (QTLs) fornumber of corpora lutea. Mamm. Genome 10: 573–578.
Authors’ addresses: S. Cepica, A. Stratil, M. Kopecny, P. Blazkova, J. Schroffel Jr. Academy ofSciences, Institute of Animal Physiology and Genetics, 27721 Libechov, CzechRepublic. R. Davoli, L. Fontanesi, University of Bologna, Via Fratelli Rosselli107, 42100 Reggio Emilia, Italy. G. Reiner (present address), Universitat Gießen,Fachgebiet Veterinarmedizin, Klinik fur Schweinekrankheiten, Frankfurter Straße112, 35392 Gießen, Germany. G. Moser (present address), Genetic Solutions Pty.Ltd., 31 Dover Street, Albion QLD 4010, Australia. H. Geldermann (forcorrespondence), H. Bartenschlager, Universitat Hohenheim, FachgebietTierzuchtung und Biotechnologie, Garbenstraße 17, 70599 Stuttgart, Germany.Tel.: +49 711 4593570; Fax: +49 711 4593101; E-mail: [email protected]
37Linkage and QTL mapping for Sus scrofa chromosome 4
Copyright © 2022 FDOKUMEN