Population structure and demographic history of Genypterus blacodes using microsatellite loci
Upload
independentCategory
view
4download
0
Introduction
The Eurasian wild boar Sus scrofa Linnaeus,1758 is one of the most widely distributed terres-trial mammals (Lucchini et al. 2005). After WorldWar II, the density and geographical distribu-
tion of wild boar increased almost everywherein Europe (Sáez-Royuela and Tellería 1986,Feichtner 1998, Danilkin 2001).
In Bulgaria, the present total population sizeof wild boar is estimated to be in the range of ap-proximately 40 000 individuals according to
[193]
Acta Theriologica 54 (3): 193–205, 2009.
PL ISSN 0001–7051 DOI: 10.4098/j.at.0001–7051.049.2008
Population genetic structure of wild boar Sus scrofa in Bulgaria
as revealed by microsatellite analysis
Ivan Stojanov NIKOLOV, Bernhard GUM, Georgi MARKOV and Ralph KUEHN*
Nikolov I. S., Gum B., Markov G. and Kuehn R. 2009. Population geneticstructure of wild boar Sus scrofa in Bulgaria as revealed by microsatelliteanalysis. Acta Theriologica 54: 193–205.
Over the last two decades wild boar Sus scrofa Linnaeus, 1758 became themost intensively managed game species in Bulgaria. In order to delineatethe population genetic structure, which is essential for sustainable wildlifemanagement, we screened 10 porcine microsatellites across 289 wild boarsamples originating from all relevant bioregions of the country. Results basedon FST values, Bayesian clustering methods and a multi-dimensional scalinganalysis can be summarised as follows: (1) two main genetic groups wererevealed for the Bulgarian data set: the first one included individuals col-lected from the Balkan Range Mountain and the northern part of the countryand the second one comprised individuals from the Rhodope, Osogovo, IskurRange and Rila mountains in southern and south-western Bulgaria; (2) allBulgarian wild boar populations showed a higher level of genetic diversitycompared to four populations from Germany which were included for out-group comparison, and (3) wild boar sampled from a game enclosure werefound to be genetically divergent from the other Bulgarian populations,indicating human impact on population genetic structure most likely resultedfrom fencing and former translocation actions. The evolutionary backgroundleading to the two defined management units as well as conservation andmanagement strategies are discussed.
Molecular Zoology, Institute of Zoology, Technische Universität München, Am Hochanger 13,D-85354 Freising, Germany, e-mail: [email protected] (ISN, RK); Funktionelle AquatischeÖkologie & Fischbiologie, Technische Universität München-Weihenstephan, D-85350 Freising,Germany (BG); Institute of Zoology, Bulgarian Academy of Sciences, 1000 Sofia, Bulgaria (GM)
Key words: genetic diversity, landscape genetics, wild boar, microsatellites
*Corresponding author
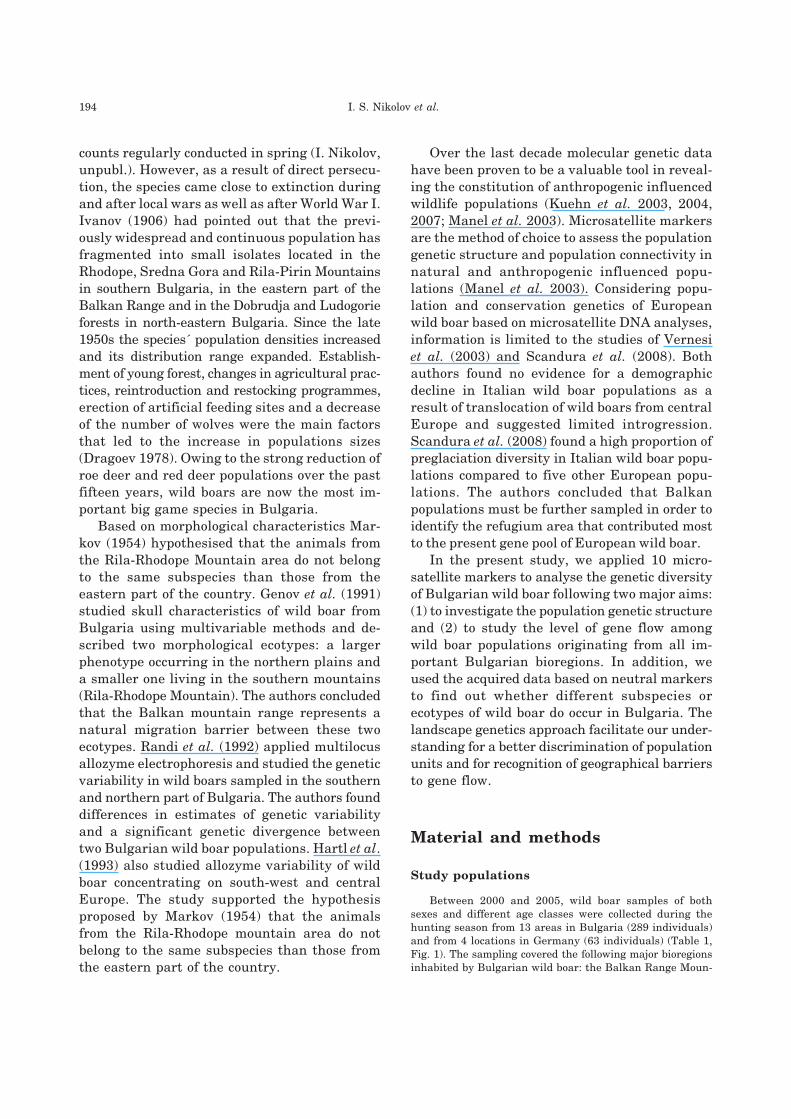
counts regularly conducted in spring (I. Nikolov,unpubl.). However, as a result of direct persecu-tion, the species came close to extinction duringand after local wars as well as after World War I.Ivanov (1906) had pointed out that the previ-ously widespread and continuous population hasfragmented into small isolates located in theRhodope, Sredna Gora and Rila-Pirin Mountainsin southern Bulgaria, in the eastern part of theBalkan Range and in the Dobrudja and Ludogorieforests in north-eastern Bulgaria. Since the late1950s the species´ population densities increasedand its distribution range expanded. Establish-ment of young forest, changes in agricultural prac-tices, reintroduction and restocking programmes,erection of artificial feeding sites and a decreaseof the number of wolves were the main factorsthat led to the increase in populations sizes(Dragoev 1978). Owing to the strong reduction ofroe deer and red deer populations over the pastfifteen years, wild boars are now the most im-portant big game species in Bulgaria.
Based on morphological characteristics Mar-kov (1954) hypothesised that the animals fromthe Rila-Rhodope Mountain area do not belongto the same subspecies than those from theeastern part of the country. Genov et al. (1991)studied skull characteristics of wild boar fromBulgaria using multivariable methods and de-scribed two morphological ecotypes: a largerphenotype occurring in the northern plains anda smaller one living in the southern mountains(Rila-Rhodope Mountain). The authors concludedthat the Balkan mountain range represents anatural migration barrier between these twoecotypes. Randi et al. (1992) applied multilocusallozyme electrophoresis and studied the geneticvariability in wild boars sampled in the southernand northern part of Bulgaria. The authors founddifferences in estimates of genetic variabilityand a significant genetic divergence betweentwo Bulgarian wild boar populations. Hartl et al.(1993) also studied allozyme variability of wildboar concentrating on south-west and centralEurope. The study supported the hypothesisproposed by Markov (1954) that the animalsfrom the Rila-Rhodope mountain area do notbelong to the same subspecies than those fromthe eastern part of the country.
Over the last decade molecular genetic datahave been proven to be a valuable tool in reveal-ing the constitution of anthropogenic influencedwildlife populations (Kuehn et al. 2003, 2004,2007; Manel et al. 2003). Microsatellite markersare the method of choice to assess the populationgenetic structure and population connectivity innatural and anthropogenic influenced popu-lations (Manel et al. 2003). Considering popu-lation and conservation genetics of Europeanwild boar based on microsatellite DNA analyses,information is limited to the studies of Vernesiet al. (2003) and Scandura et al. (2008). Bothauthors found no evidence for a demographicdecline in Italian wild boar populations as aresult of translocation of wild boars from centralEurope and suggested limited introgression.Scandura et al. (2008) found a high proportion ofpreglaciation diversity in Italian wild boar popu-lations compared to five other European popu-lations. The authors concluded that Balkanpopulations must be further sampled in order toidentify the refugium area that contributed mostto the present gene pool of European wild boar.
In the present study, we applied 10 micro-satellite markers to analyse the genetic diversityof Bulgarian wild boar following two major aims:(1) to investigate the population genetic structureand (2) to study the level of gene flow amongwild boar populations originating from all im-portant Bulgarian bioregions. In addition, weused the acquired data based on neutral markersto find out whether different subspecies orecotypes of wild boar do occur in Bulgaria. Thelandscape genetics approach facilitate our under-standing for a better discrimination of populationunits and for recognition of geographical barriersto gene flow.
Material and methods
Study populations
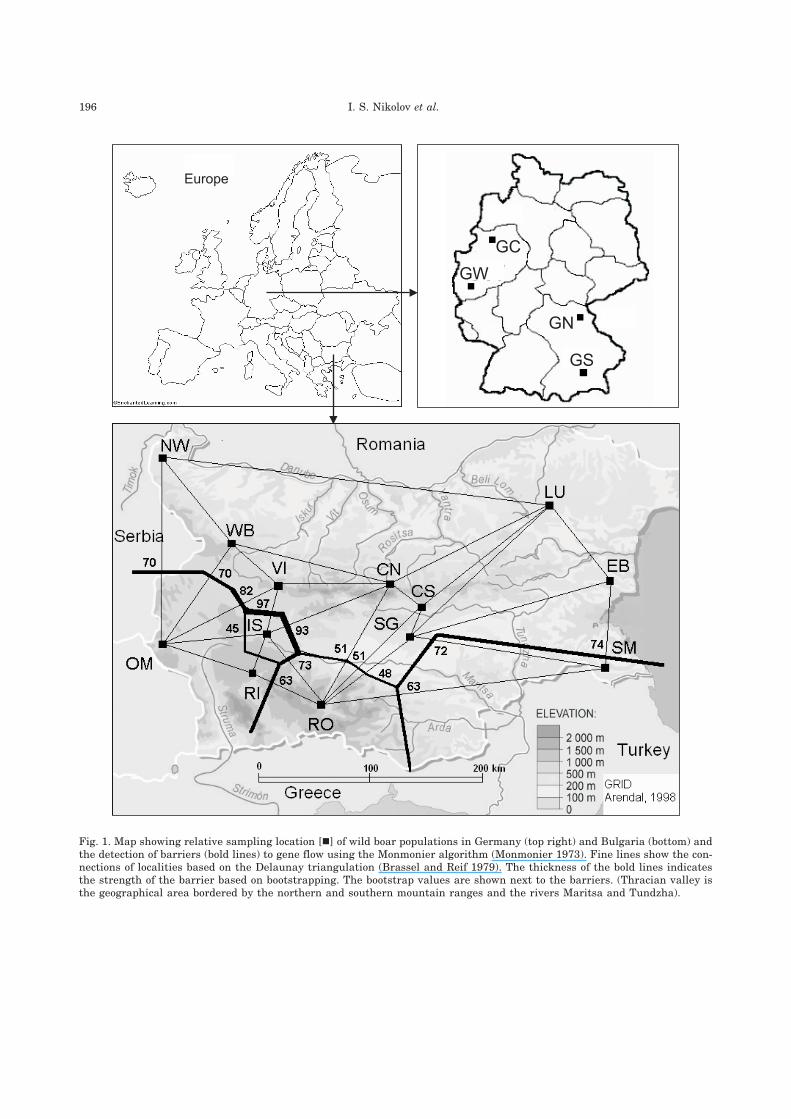
Between 2000 and 2005, wild boar samples of bothsexes and different age classes were collected during thehunting season from 13 areas in Bulgaria (289 individuals)and from 4 locations in Germany (63 individuals) (Table 1,Fig. 1). The sampling covered the following major bioregionsinhabited by Bulgarian wild boar: the Balkan Range Moun-
194 I. S. Nikolov et al.

tain comprising a western part (WB and VI populations), acentral part (CS and CN) and an eastern part (EB), theRhodope Mountain (RO), the Rila Mountain (RI), the OsogovoMountain (OM), Ludogorie (LU), the north-western region(NW), the Strandja Mountain (SM), the Sredna Gora Moun-tain with two populations: Iskur range (IS) in the verywestern part and Sredna Gora (SG) in the central part ofthe mountain area.
Seasonal migrations in spring and autumn along therange and towards agricultural regions across the divide ofthe Balkan Range Mountain were reported (N. Ninov, pers.comm.). The Iskur range population was established in 1970by fencing off an area of 4300 ha, accommodating about 600wild boars. Over the years, the population size ranged be-tween 300 and 600 intensively hunted individuals. Sincethe fences are regularly damaged, an exchange of individu-als to adjacent populations cannot be excluded.
As an out-group comparison, samples from four Germanpopulations were collected in the western and northernparts of North Rhine-Westphalia and Bavaria (Table 1, Fig. 1).
DNA isolation and microsatellite analysis
Total genomic DNA was isolated from wild boar sam-ples according to Hogan et al. (1986) following standardphenol-chlorophorm extraction.
Ten polymorphic microsatellites previously tested forSus scrofa (Rohrer et al. 1994, Lowden et al. 2002) werescreened across all samples. To avoid physical linkage,microsatellite loci from different chromosomes were chosen(see Table 2). The PCR reactions were performed in a 15 µlreaction volume containing 1� PCR buffer (10 mM Tris-HCl,pH 8.3, 50 mM KCl), 1.5 mM MgCl2, 0.1 mM dNTPs, 0.2 µMof each primer (forward primer fluorescently labelled withCy 5) and 0.3 units of Taq DNA polymerase (Q-Biogene).The following PCR profile was used: initial denaturation at94°C for 3 min, 35 cycles of 30 s at 94°C, 30 s at annealingtemperature (see Table 2), 30 s at 72°C and a final extensionat 72°C for 3 min. Thermal cycling was performed in aMastercycler gradient (Eppendorf). The length of the micro-satellite alleles were determined by an ALF Express IIDNA Analyser (Amersham Pharmacia Biotech) and AlleleLinks version 1.02 software (Amersham Pharmacia Biotech).Reference samples with known genotypes were included oneach gel and internal standards were included in each laneto ensure consistent scoring of genotypes across all gels.
Measures of genetic variation
The FSTAT v. 2.9.3. program (Goudet 2001) was used tocalculate the expected and observed heterozygosities (He,
Ho), average number of alleles per population (NA) and per
Microsatellite variation in wild boar 195
Table 1. Origin, code, number of sampled animals from Bulgaria and Germany (n), average number of alleles per locus (NA),mean allelic richness per population (AR), expected (He) and observed (Ho) heterozygosities, results of probability tests for de-viation from expected Hardy-Weinberg expectations (PHW) and results from linkage disequilibrium (LD) test given as numberof significant values. Bulgarian populations are ordered geographically on a north-south basis (see Fig. 1).
Group Populations Code n NA AR He Ho PHW LD
Bulgaria1. North West NW 19 6.2 5.5 0.70 0.64 2 –2. Ludogorie LU 24 5.8 4.9 0.63 0.60 1 13.West Balkan WB 20 6.5 5.8 0.71 0.59 1 54. Vitinja range VI 16 5.8 5.3 0.67 0.67 ns –5. Central Balkan – North part CN 20 6.4 5.6 0.69 0.68 1 116. Central Balkan – South part CS 29 6.9 5.3 0.63 0.58 1 –7. East Balkan EB 24 6.6 6.6 0.68 0.67 ns 68. Sredna Gora SG 25 6.8 5.2 0.63 0.61 ns –9. Iskur range IS 27 6.1 5.2 0.67 0.63 1 1
10. Osogovo Mountain OM 23 6.5 5.6 0.67 0.61 1 111. Rila Mountain RI 12 6.2 5.8 0.68 0.65 ns –12. Strandja Mountain SM 28 6.6 5.4 0.66 0.57 1 –13. Rhodope Mountain RO 22 6.6 5.3 0.70 0.63 ns –Total number of sampled Bulgarian wild boar 289Average 6.7 5.4 0.67 0.62
Germany1. North Rhine-Westphalia – western part GW 14 3.9 3.6 0.48 0.39 1 -2. West Bavaria GS 19 5.5 4.2 0.56 0.42 2 -3. North Bavaria GN 10 4.3 4.3 0.56 0.45 ns4. North Rhine-Westphalia northern part GC 20 4.7 4.6 0.61 0.56 1 -Total number of sampled German wild boar 63Average 4.6 4.2 0.55 0.46
196 I. S. Nikolov et al.
Europe
GC
GN
GW
GS
Fig. 1. Map showing relative sampling location [�] of wild boar populations in Germany (top right) and Bulgaria (bottom) andthe detection of barriers (bold lines) to gene flow using the Monmonier algorithm (Monmonier 1973). Fine lines show the con-nections of localities based on the Delaunay triangulation (Brassel and Reif 1979). The thickness of the bold lines indicatesthe strength of the barrier based on bootstrapping. The bootstrap values are shown next to the barriers. (Thracian valley isthe geographical area bordered by the northern and southern mountain ranges and the rivers Maritsa and Tundzha).
locus (NAL) as well as the allelic richness (AR). Deviationsfrom Hardy-Weinberg equilibrium and linkage disequilib-rium were estimated using GENEPOP version 3.3 (Raymondand Rousset 1995a) with probability tests carried out usingthe Marcov chain method with 100 000 iterations and 1000de-memorisation steps (Guo and Thompson 1992). Geneticdifferentiation between pairs of populations was estimatedby FST (Weir and Cockerham 1984). Tests for significantpopulation differentiation among all pairs of populationswere performed with GENEPOP using 100 000 iterationsand 1000 de-memorisation steps (Raymond and Rousset1995b). The sequential Bonferroni adjustments (Rice 1989)were applied to correct for the effect of multiple tests.
In order to assess the possible impact of demographicchanges on genetic diversity, we used the heterozygosityexcess test, estimated and tested by the Wilcoxon sign-ranktest as implemented in the BOTTLENECK computer program(Cornuet and Luikart 1996), assuming one step and multi-step mutation models. In addition, we assigned individual’smultilocus genotype of each Bulgarian population to acombined Bulgarian (individuals of remaining populationswere pooled: “Bulgarian reference”) and German referencepopulation. The Bayesian approach of population assignmenttest (Rannalla and Mountain 1997) implemented in theGENECLASS v. 2.0. program (Piry et al. 2004) was per-formed by simulating 10 000 multilocus genotypes.
Population structure and spatial analyses
In order to partition the total genetic variance intocovariance components at different hierarchical levels, weperformed two analyses of molecular variance (AMOVA)with ARLEQUIN v. 2.0 (Schneider et al. 2000). One withthe hierarchical levels: (1) within individuals, (2) among in-dividuals within populations, (3) among populations andthe other with the additional level: (4) among defined groups.Based on the covariance components, the fixation indicesFIS, FIT, and FST as well as FCT and FSC were calculated andtested for their significance.
The Bayesian clustering method as proposed by Prit-chard et al. (2000) was carried out using STRUCTURE v.2.2. The population admixture without sampling informa-tion and correlated allele frequencies models was chosen inorder to reveal the number of distinct genetic clusters (K)present in the Bulgarian data set. We tested K from one to14 with 10 iterations (50 000 burn-in, 500 000 Markov chainMonte Carlo replicates in each run) to assess convergence ofln Pr(X|K). The number of clusters present was then deter-mined from posterior probabilities of K and additionally byan ad hoc statistic �K based on the rate of change in the logprobability of data (Evanno et al. 2005). For the selectedvalues of K, we assessed the average proportion of member-ship of the samples to the inferred clusters by combiningthe 10 replications using CLUMPP (Jakobsson and Rosenberg2007), applying the LargeKGreedy algorithm.
Mantel’s test (Mantel 1967) was performed to evaluatethe effect of geographical distance on the level of geneticdifferentiation. Geographical distances between sampling
sites were calculated based on the co-ordinates of the ap-proximate centre of the sampling areas. Correlations betweengeographical distances and genetic distances [FST/(1–FST)](Rousset 1997) were calculated with the R-PACKAGE-moduleMantel (Casgrain 2001). The statistical significance of therelationships was determined by 100 000 randomisations.
In order to combine geographical and genetic data, wegenerated a synthesis map with the first principal compo-nent (PC) scores obtained from a PC analysis using allelefrequencies of each locus and each population as variables.PC1 scores were interpolated within space by the Kriginginterpolation procedure (Journel and Huijbregts 1978). Theinterpolated lines represent zones of equal genetic diver-gence (isogene). The number of isogenes between two sam-pling sites shows the degree of their genetic differentiation.This approach allows zones of reduced gene flow to be iden-tified. The analyses were carried out with STATISTICA 6.0and SURFACE III software (Kansas Geological Survey) ac-cording to Piertney et al. (1998).
We applied the Monmonier algorithm (Monmonier 1973)to identify genetic boundaries – zones where genetic differ-ences between pairs of populations are highest. This ap-proach is suitable to detect abrupt genetic changes. UsingBARRIER version 2.2 (Manni et al. 2004), all populationswere connected by a Delaunay triangulation (Brassel andReif 1979), followed by the application of the Monmonier’smaximum difference algorithm. To assess the robustness ofthe computed barriers, 100 bootstrap FST matrices over allpairs of Bulgarian populations were calculated.
Results
Genetic diversity
Genotyping of 10 microsatellite loci across allexamined wild boars revealed a total of 131 dif-ferent alleles. All loci were polymorphic rangingfrom five alleles at SW72 to 31 alleles at CGA(Table 2). Altogether five alleles were specific forthe German populations (loci: TNFB, CGA andIGFI) and 11 alleles occurred only in Bulgarianpopulations (loci: TNFB, SW936, CGA, SW24,IGF1, SWr 17 and SW949). Among Bulgarianpopulations, the mean number of alleles per lo-cus (NA) ranged from 5.8 to 6.9 and allelic rich-ness (AR) from 4.9 to 6.6 (Table 1). Ho rangedfrom 0.57 to 0.68 and He from 0.63 to 0.71 (Table 1).
The examined German populations had sig-nificantly lower allele numbers and values of ge-netic diversity based on NA, AR, Ho and He
compared to the Bulgarian samples (all: Mann-Withney U-test p < 0.001; Table 1).
Microsatellite variation in wild boar 197

Linkage and Hardy-Weinberg (HW)
equilibrium and population substructure
Although physical linkage can be excluded,the linkage disequilibrium tests for Bulgarianand German groups revealed 25 cases of linkagedisequilibrium after Bonferroni correction (p <0.001) (Table 1). Higher values of disequilibriumwere observed for the sampling locations: CN(11), EB (6) and WB (5). Within German popula-tions, no significant values were obtained.
Concerning HW equilibrium, 13 out of theconducted 170 tests were rejected in both groupsafter sequential Bonferroni correction. Mainlyone or at a maximum two deviations from HWequilibrium were found per population and gen-erally not the same loci were involved (Table 1).
Genetic differentiation and relationship
among populations
The AMOVA analysis with three hierarchicallevels was conducted separately for the Bulgar-ian and the German group. As much as 86.1% ofthe variance is explained by within individualvariation, 5.75% by variation among individualswithin populations and 8.15% by variation be-tween populations of the Bulgarian group. Theoverall F-statistics revealed significant valuesfor FIS = 0.0626 (p < 0.0001), FIT = 0.1390 (p <0.0001) and FST = 0.0816 (p < 0.0001).
For the German group 72.8% of the varianceis explained by within individual variation,13.9% by variation among individuals withinpopulations and 13.3% by variation between
198 I. S. Nikolov et al.
Table 2. Characterisation of 10 microsatellite loci used for the study of 289 Bulgarian and 63 German wild boars: locus,primer sequences, annealing temperature (Ta), range of allele sizes, chromosomal location (Chr. loc), expected (He) and ob-served (Ho) heterozygosity and total number of alleles found (NAL). (a) Lowden et al. 2002, (b) Rohrer et al. 1994
Locus Primer sequence Ta (°C)Size
range(bp)
Chr. locBulgarian wild boar German wild boar
He Ho NAL He Ho NAL
TNFBa F ctggtcagccaccaagattt 55 144–213 7 0.67 0.67 12 0.82 0.73 9R ggaaatgagaagtgtggagacc
SW936a F tctggagctagcataagtgcc 58 80–117 15 0.81 0.78 11 0.76 0.55 9R gtgcaagtacacatgcaggg
CGAa F atagacattatgtaagttgctgat 55 250–320 1 0.94 0.85 31 0.90 0.63 17R gaactttcacatccctaaggtcgt
Sw72a F atcagaacagtgcgccgt 58 100–116 3 0.66 0.52 5 0.48 0.29 3R tttgaaaatggggtgtttcc
Sw24a F ctttgggtggagtgtgtgc 58 96–121 17 0.76 0.65 11 0.58 0.53 5R atccaaatgctgcaagcg
IGF1a F acccttgagagggtattgctaggc 60 197–209 5 0.78 0.61 10 0.84 0.59 11R gggcaaagattctgctgagctg
SWr17b F gtttaagccacctggtctatgg 58 143–155 4 0.43 0.36 8 0.16 0.17 3R atcctgacttgcttatggctg
SW949b F tgagcaatgagttcaatgcc 58 178–204 24 0.86 0.69 16 0.73 0.37 7R tcgttggtgaaggcatcc
S0090a F ccaagactgccttgtaggtgaata 55 244–251 12 0.80 0.64 9 0.79 0.57 4R gctatcaagtattgtaccattagg
S0215a F taggctcagaccctgctgcat 55 135–169 13 0.48 0.46 9 0.20 0.22 7R tgggaggctgaaggattgggt
Average 0.72 0.63 12 0.63 0.46 7.5

Microsatellite variation in wild boar 199
Ta
ble
3.P
air
wis
ees
tim
ate
sof
FS
T-v
alu
es(a
llsi
gnif
ican
t,p
<0.
001,
Bon
ferr
oni
corr
ecti
on)
acco
rdin
gto
Wei
ran
dC
ock
erh
am(1
984)
(bel
owd
iago
nal
)an
dth
eap
pro
xi-
mat
ege
ogra
ph
ical
dis
tan
ces
(km
)(a
bove
dia
gon
al)
betw
een
exa
min
edw
ild
boa
rp
opu
lati
ons.
Bio
regi
ons
NW
LU
WB
VI
CN
CS
EB
SG
ISO
MR
IS
MR
OG
WG
CG
NG
S
NW
148
244
214
318
365
497
395
230
158
247
595
375
2030
2230
1830
1730
LU
0.02
840
736
525
021
515
621
040
049
039
516
029
021
8823
8119
8018
81W
B0.
069
0.02
971
171
218
452
297
9811
312
449
723
318
9020
9016
9015
90V
I0.
074
0.06
00.
052
115
160
396
155
4512
568
388
162
1840
2040
1635
1540
CN
0.05
40.
033
0.02
00.
052
4728
279
190
238
144
277
108
1928
2128
1728
1629
CS
0.06
40.
023
0.03
60.
045
0.02
223
635
180
281
179
299
9919
6021
7017
7016
50E
B0.
053
0.04
90.
038
0.08
60.
034
0.05
921
340
151
440
650
279
2200
2400
2000
1900
SG
0.09
30.
066
0.04
80.
058
0.03
70.
042
0.06
216
030
119
420
386
1990
2187
1780
1680
IS0.
095
0.14
70.
070
0.12
00.
103
0.15
00.
132
0.13
211
345
290
147
1800
2000
1600
1500
OM
0.09
70.
118
0.07
10.
103
0.10
10.
129
0.09
80.
104
0.08
811
540
325
317
0019
0015
0014
00R
I0.
093
0.08
70.
037
0.08
60.
064
0.10
50.
086
0.10
90.
059
0.06
539
314
018
3020
3016
3015
30S
M0.
051
0.08
40.
055
0.08
10.
068
0.10
70.
105
0.11
50.
085
0.10
70.
064
261
2190
2390
1990
1890
RO
0.03
80.
106
0.05
60.
072
0.06
40.
104
0.06
00.
075
0.08
50.
075
0.06
70.
083
1947
2147
1747
1647
GW
0.23
40.
255
0.19
20.
259
0.19
70.
265
0.24
90.
218
0.18
40.
164
0.21
00.
242
0.22
720
037
053
0G
C0.
111
0.15
00.
101
0.14
60.
126
0.15
50.
136
0.12
20.
142
0.09
70.
118
0.15
00.
111
0.16
340
058
0G
N0.
179
0.20
00.
158
0.22
10.
174
0.22
60.
223
0.20
90.
162
0.12
80.
176
0.19
40.
198
0.15
00.
145
230
GS
0.14
60.
163
0.11
20.
194
0.12
50.
176
0.18
20.
132
0.14
10.
125
0.16
80.
158
0.16
90.
100
0.12
40.
120
populations. A considerable level of differentia-tion was observed based on the F-values withFIS = 0.1612 (p < 0.0001), FIT = 0.2724 (p <0.0001) and FST = 0.1326 (p < 0.0001).
All of the pairwise estimates of FST were sig-nificant (p < 0.001) (Table 3) with highest FST
values between the Bulgarian and German pop-ulations (average FST = 0.172). The FST valuespoint to a higher degree of differentiation amongpopulations of the mountain area south of theThracian valley (RO, IS, OM and RI; averageFST = 0.073) than among bioregions from thenorthern group (CS, CN, SG, LU, EB, NW andVI; average FST = 0.054). The population ISshowed the highest pairwise FST values withinthe Bulgarian group. In some cases FST differen-tiation was higher between Bulgarian popula-tions (eg populations IS-CS and OM-CS) thanbetween Bulgarian and German populations (egpopulations IS-GS and OM-GC; Table 3).
There was no evidence for an isolation-by-distance effect when analysing the Bulgarianpopulations exclusively (R2 = 0.007, p = 0.255)also by excluding the IS population (R2 = 0.012,p = 0.225). By contrast, when including all 17populations in the Mantel analysis, a significantcorrelation between genetic and geographicaldistances was observed (R2 = 0.576, p = 0.01)caused by the long distance effect of the Germanpopulations.
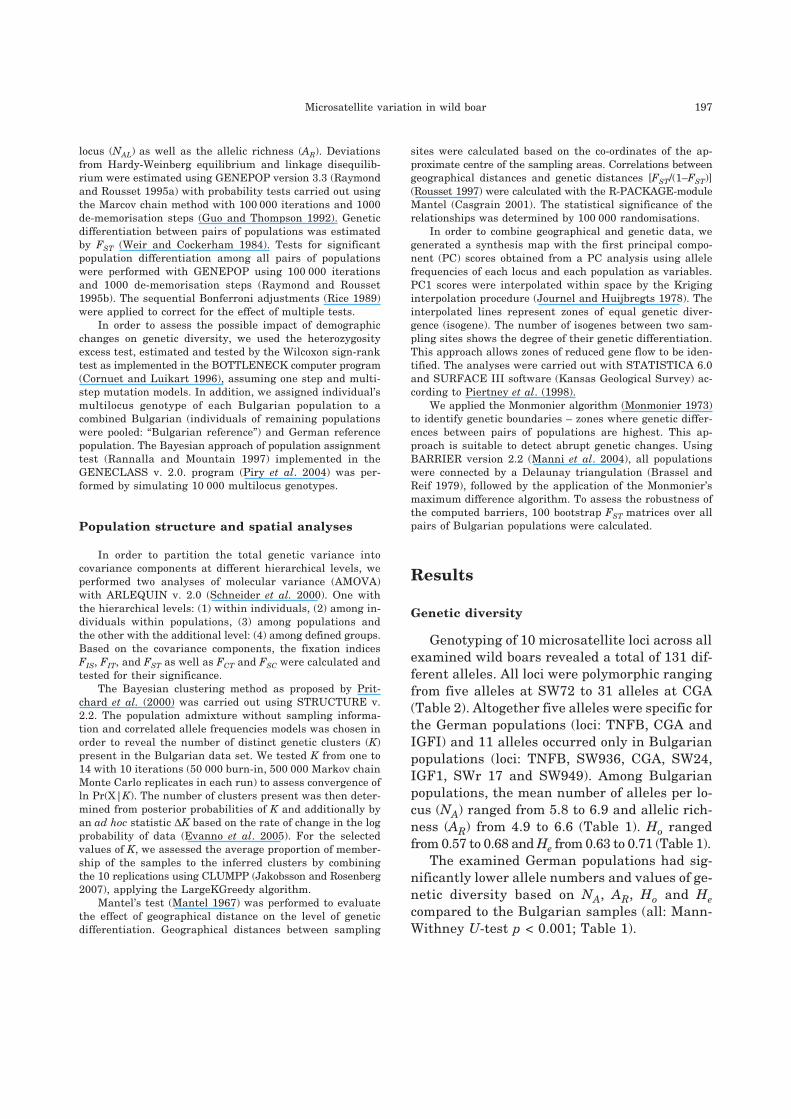
Application of the Bayesian clustering methodusing STRUCTURE for the Bulgarian group re-vealed eight (posterior probabilities of K) andtwo (ad hoc statistic �K) clusters (Fig. 2). Theproportion of membership of the samples to theinferred clusters is shown in Table 4.
Presuming two clusters, the proportion ofmembership of the samples is classifying thepopulations north (LU, VI, SG, SN, NW, EB SG)and south-west (IS, RI, OM, RO) of the Thracianvalley into two distinct groups. The gene pools ofSM and WB were portioned almost equally amongthese two groups. The AMOVA analysis includ-ing the covariance component of groups definedby STRUCTURE analysis revealed 85.35% withinindividual variation, 4.65% by variation amongindividuals within populations, 5.68% by varia-tion among populations within groups and 4.33%among groups. The overall F-statistics revealedsignificant values for FIS = 0.0517 (p < 0.0001),FIT = 0.1465 (p < 0.0001), FCT = 0.0433 (p <0.001) and FSC = 0.0593 (p < 0.0001).
In order to identify the exact locations wherepopulation subdivision occurs, we used twoanalytical approaches. Using the Monmonieralgorithm, we identified barriers dividing thepopulations north and south of the Thracianvalley into two major groups (Fig. 1). In addition,the analysis outlined the isolated status of the ISpopulation. The Monmonier algorithm revealed
200 I. S. Nikolov et al.
0
10
20
30
40
50
60
70
80
90
100
1 2 3 4 5 6 7 8 9 10 11 12 13 14 15
K
-10 000
-9800
-9600
-9400
-9200
-9000
-8800
-8600
K�
ln(X
/)
K
Fig. 2. Mean (± standard deviation) of log likelihood values (14 independent runs), ln(X|K), [�] and rate of change in the logprobability of data between successive values of K, �K, [�] for the entire Bulgarian wild boar dataset (n = 289).

a sub-structuring of the southern group and a more“admixed“ composition of the northern group.
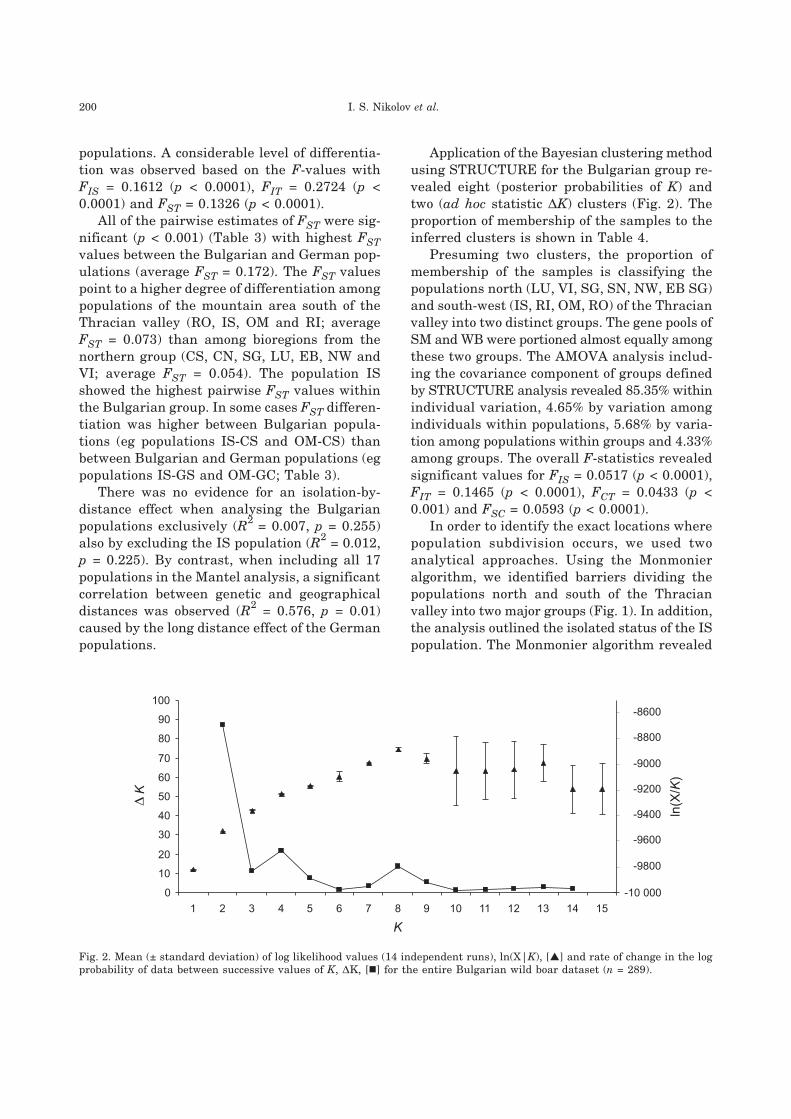
In our second approach we used the contoursof the first-axis principle component scores plot-ted on the population centres and interpolatedon the area (Fig. 3). In general the results weresimilar to those based on the Bayesian cluster-
ing and the Monmonier algorithm. The synthe-sis map also identified significant barriers togene flow such as the mountain ranges in thesouth. The map points to the isolated structureof IS and shows a considerable genetic diver-gence between populations from the north andthe south of the Thracian valley.
Microsatellite variation in wild boar 201
Fig. 3. Synthesis map showing the hypothetical first-axis principal-component (PC1) scores derived from the Kriging proce-dure for the Bulgarian wild boar populations. The lines connect points of equal PC1 scores (isogene). Pluses indicate the geo-graphical localities of the populations.
Table 4. Assignment for Bulgarian wild boar populations to two and eight possible inferred clusters (IC) based on STRUCTURE(Pritchard et al. 2000) and CLUMPP (Jakobsson and Rosenberg 2007) analyses.
PopulationsK = 2 K = 8
IC1 IC2 IC1 IC2 IC3 IC4 IC5 IC6 IC7 IC8
NW 0.28 0.72 0.04 0.05 0.12 0.32 0.17 0.08 0.02 0.20LU 0.11 0.89 0.03 0.02 0.02 0.34 0.08 0.07 0.09 0.33WB 0.48 0.52 0.07 0.05 0.08 0.13 0.19 0.14 0.18 0.17VI 0.37 0.63 0.05 0.06 0.10 0.21 0.02 0.10 0.12 0.33CN 0.15 0.85 0.03 0.03 0.03 0.24 0.29 0.05 0.15 0.17CS 0.12 0.88 0.02 0.03 0.02 0.26 0.20 0.04 0.17 0.26EB 0.22 0.78 0.03 0.02 0.11 0.08 0.47 0.07 0.06 0.15SG 0.19 0.81 0.03 0.03 0.04 0.11 0.06 0.07 0.55 0.11IS 0.94 0.06 0.02 0.86 0.02 0.02 0.01 0.02 0.02 0.02OM 0.94 0.06 0.78 0.06 0.04 0.02 0.01 0.05 0.02 0.01RI 0.81 0.19 0.21 0.19 0.19 0.10 0.10 0.12 0.04 0.05SM 0.49 0.51 0.03 0.03 0.08 0.13 0.03 0.51 0.04 0.16RO 0.80 0.20 0.07 0.03 0.71 0.04 0.04 0.03 0.05 0.04
43.50
43.00
42.50
42.00
22.00 23.00 24.00 25.00 26.00 27.00
Results based on the Wilcoxon size-rank test(BOTTLENECK program) showed no indica-tions for a reduction of the effective populationsize in any Bulgarian population.
Assignment tests using GENECLASS showedthat 68% of all individuals from the enclosed ISpopulation were assigned to the “Bulgarian ref-erence” and 32% to the non-Bulgarian referencegroup from Germany. However, individuals ofall other Bulgarian populations were correctlyassigned to the Bulgarian “reference” group.This result together with the cluster analysisdescribed above, indicate that the populationstructure of IS is likely to be caused by trans-locations of animals carried out in the past.
Discussion
The overall results of our study suggest thatBulgarian wild boar can be divided into twomajor groups: one located north and a secondone south of the Thracian valley. Interestingly,our study showed that the Thracian valley actsas a significant barrier to gene flow among wildboar populations. This finding contrasts withthe studies by Genov et al. (1991) and Randi et
al. (1992), which suggested the watershed of theBalkan Range Mountain to represent a majormigration barrier. Populations belonging to the“south” group were found to be genetically moredistinct than those from the “north” group andtheir gene pools were also found to be morehomogenous. In the case of the IS population,the analyses revealed strong signs of human-caused fencing and isolation as well as possibletranslocations conducted in the past. A furtherimportant finding from the management per-spective is that the examined Bulgarian popu-lations exhibit a similar level of genetic variationamong each other, within the range observed inother European wild boar populations.
Genetic diversity
In our study Bulgarian wild boar showed ahigher genetic variability than German popula-
tions. However, the revealed level of genetic di-versity of the analysed Bulgarian populations issimilar to those reported in other genetic studiesof wild boar in Europe ie Italian populations (Ho
= 0.63) and Hungarian wild boar populations(Ho = 0.75) (Vernesi et al. 2003), France (He =
0.58), Austria (He = 0.62), Poland (He = 0.61),Spain (He = 0.60) and Hungary (He = 0.61)(Scandura et al. 2008).
In the beginning of 1930s, game reserves(eg Sherba and Palamara) were established innorth-eastern Bulgaria using captive-reared localanimals as well as individuals from the RO bio-region. In the middle of the 1950s, reintroductionand restocking programmes were carried outand animals from these game reserves werefurther relocated to restock a local wild boarpopulation in northern Bulgaria. It is interestingto note that the EB population is located next tothe Sherba game reserve, to which hundreds ofwild boars from the RO population were relocated.This might have contributed to the phenomenonthat 11% of the EB samples were clusteredtogether with RO samples. Therefore, it can beassumed that in our case direct translocationof animals increased the genetic variability.However, any translocation measurement as awildlife management strategy should take intoaccount the genetic (eg ESU) and physiological(eg health status) constitution as well as theecology of the species. Furthermore, wild boarsin Bulgaria are harvested primarily by drivenhunts involving packs of hounds. The escapingindividuals are often followed by the dogs forhours, forcing them kilometres away from theirresting sites, as described also by Sodeikat andPohlmeyer (2003). These forced migrations mayalso artificially increase the level of gene flowbetween neighbouring “north” populations.
Genetic differentiation and relationship
among populations
Our study revealed significant pairwise dif-ferentiation (FST ranging from 0.020 to 0.150)between all population pairs. The higher level ofgene flow in the northern group can be explainedby reported northbound and southbound migra-
202 I. S. Nikolov et al.

tion from the Balkan Range Mountain facilitatedby “stepping-stone” patterns of the woodlandhabitat of this area serving as migration corri-dors.
In addition, it has to be mentioned that possi-ble introgression of the free-ranging local do-mestic pig breed, termed “East-Balkan pig”,with wild boar could have led to the revealed ge-netic constitution of the northern group as al-ready described by Randi et al. (1992). Forcenturies, East-Balkan pigs were maintained inlarge grazing herds in oak woodlands east andnorth-east of the Thracian valley. Interestingly,in the case of the Bulgarian samples eight (out of11) private alleles and 23 (out of 25) deviationfrom linkage disequilibrium were found in thenorthern populations, which could be a conse-quence of possible introgression. Genov et al.
(1991), reported that the traditional Bulgarianpractice of rearing “East-Balkan pigs” undersemi-wild conditions has resulted in hybridisa-tion with the wild boar populations in easternand north-eastern Bulgaria. However, to con-firm this hybridisation theory, further molecu-lar genetic studies specifically addressing thisquestion are needed.
Most of the wild boar individuals from thesouthern group formed clear and distinct genepools corresponding mainly to the bioregionfrom where they had been sampled. This is con-sistent with the geographical relief of this regionfeaturing four well-separated high mountains(up to 3 000 m high), limiting natural gene flow.This geographical situation is completely differ-ent to the 600 km continuously expanded Bal-kan Range Mountain supporting migration asdescribed before.
Particularly noteworthy is the isolated popu-lation structure of IS exhibiting the lowest ge-netic variability compared to the other southernpopulations. The assignment test suggested thatthe gene pool of the IS population is likely tohave been affected by human activities.
Two subspecies or two management units?
The differences in the genetic structure wefound are comparable with previously published
data by Markov (1954), Genov et al. (1991), Randiet al. (1992), and Hartl et al. (1993) suggestingthat two genetically distinct Bulgarian wild boarsubunits do exist. In contrast to the study ofGenov et al. (1991), our results showed that theBalkan Mountain Range does not act as an effec-tive barrier for gene flow between the southernand northern wild boar ecotypes. Individualsfrom the CS, SG and VI populations shared al-most the same ancestry as individuals north ofthe Balkan Mountain Range (CN, LU, NW andWB). Therefore, it seems more likely that theThracian valley forms the border between thetwo pre-defined ecotypes.
Adaptation to the local ecological conditionslike food availability and winter climate couldexplain most of the morphometric variation andalso the genetic structure revealed in this studywith the Thracian valley representing a geneticbarrier. Wild boars from the northern grouphave access to agricultural regions, resulting instrong and big individuals (Markov 1954). Wildboars from the southern group are all restrictedto mountain areas characterised by low agricul-tural utilisation, giving rise to small and lightindividuals (Markov 1954). This body size dis-crepancy could represent a population geneticfactor leading to the observed differentiation.During the breeding season, the smaller “south”males have limited chance to mate in contactzones as they will be chased away by the stronger“north” ones. On the other hand, larger indi-viduals from the north have a lower chance tosurvive in the rough climatic conditions pre-vailing in the southern mountainous regions.The absence of a continuous forest complex inthe Thracian valley and the existence of ahighway running through half of the valley canadditionally strengthen the north-south popu-lation structuring.
Our results are based on microsatellite data.Thus, defining subspecies or even EvolutionarySignificant Units (ESU) is controversial. Thepresent study revealed a clear differentiationinto two management units (MUs) supporting insome respects the ecotypes and subspecies hy-potheses postulated by Markov (1954) and Genovet al. (1991).
Microsatellite variation in wild boar 203
Conservation and management implications
The major aim of this study was to character-ise the genetic structure of wild boar popula-tions from different bioregions of the species inBulgaria. The revealed genetic structure andthe extent of gene flow detected among the stud-ied populations provide essential informationfor conservation measures and the developmentof appropriate management guidelines. A majorfirst step is to evaluate the genetic resourcesand to select priority populations for conserva-tion. A strategy that will maintain the highestpossible level of genetic variation across the spe-cies is required (FAO 1996). In most species themajor component of genetic variation is foundamong populations. To conserve the geneticvariation in a species, at least several differentpopulations, based on delineated MUs, shouldbe saved (Avise 1994).
Despite the fact of an accumulated inbreed-ing expressed by the significant positive FIT
value there is no immediate reason for concernabout inbreeding as there is no indication of in-breeding depression such as reduced fertility inthe Bulgarian wild boar. None of the popula-tions analysed showed genetic evidence of a de-mographic decline. In fact, our data – whencompared to other genetic studies on Europeanwild boar – even points to a high level of geneticdiversity in Bulgarian wild boar populations.
Further management measures should sup-port the well-defined two management units.These groups should be managed separately inorder to preserve their evolutionary potentialand to secure the long-term stability of wild re-sources.
Acknowledgements: We would like to thank the followingcolleagues for providing wild boar samples and/or technicalassistance: I. Staneva, V. Petrova, D. Rusev, D. Stojnov, E.Komitov, I. Javrichev, I. Bachev, I. Gluharev, I. Petkov,I. Petrov, K. Dzhambazki, K. Georgiev, M. Schaller, M.Blumenröther, R. Andreev, S. Petrov and S. Stojanov.
References
Avise J. C. 1994. Molecular Markers, Natural History andEvolution. New York: Chapman & Hall: 1–541.
Brassel K. and Reif D. 1979. A procedure to generateThiessen polygons. Geographical Analysis 325: 31–36.
Casgrain P. 2001. Development release of the R-package4.0. University of Montreal, Montreal, Quebec.http://www.bio.umontreal.ca/Casgrain/en/labo/R/v4/telecharger.html
Cornuet J. M. and Luikart G. 1996. Description and poweranalysis of two tests for detecting recent populationbottleneck from allele frequency data. Genetics 144:2001–2014.
Danilkin A. A. 2001. The wild boar: an unprecedentedspread or restoration of the species range? Doklady Bio-logical Sciences 380: 457–460.
Dragoev P. 1978. Enriching Bulgaria’s game fauna. Zemizdat:1–101. [In Bulgarian]
Evanno G., Regnaut S. and Goudet J. 2005. Detecting thenumber of clusters of individuals using the softwareSTRUCTURE: a simulation study. Molecular Ecology14: 2611–2620.
Feichtner B. 1998. Ursachen der Streckenschwankungenbeim Schwarzwild im Saarland. Zeitschrift für Jagd-wissenschaft 44: 140–150.
Food and Agricultural Organisation of the United Nations(FAO) 1996. Global project for the maintenance of do-mestic animal genetic diversity. Available at:http://www.fao.org/dad-is.
Genov P., Nikolov H., Massei G. and Gerasimov S. 1991.Craniometrical analyses of Bulgarian wild boar. Jour-nal of Zoology, London 225: 309–325.
Goudet J. 2001. FSTAT, a program to estimate and testgene diversities and fixation indices. Version 2.9.3.Available at: http://www.unil.ch/softwares/fstat.html.
Guo S. W. and Thompson E. A. 1992. Performing The exacttest of Hardy-Weinberg proportion for multiple alleles.Biometrics 48: 361–372.
Hartl G. B., Markov G., Rubin A., Findo S., Lang G. andWilling R. 1993. Allozyme diversity within and amongpopulations of three ungulate species (Cervus elaphus, Ca-preolus capreolus, Sus scrofa) of South-eastern and Cen-tral Europe. Zeitschrift für Säugetierkunde 58: 352–361.
Hogan B., Constantini F. and Lacey E. 1986. Manipulatingthe mouse embryo: A laboratory manual. Cold SpringHarbor, New York: Cold Spring Harbour LaboratoryPress: 188–196.
Ivanov H. 1906. [Wild boar]. Bulgarian Hunter 8: 49–50. [InBulgarian]
Jakobsson M. and Rosenberg N. A. 2007. CLUMPP: a clus-ter matching and permutationprogram for dealing withlabel switching and multimodality in analysis of popula-tion structure. Bioinformatics 23: 1801–1806.
Journel A. and Huijbregts C. 1978. Mining geostatistics. Ac-ademic Press, London: 1–600.
Kuehn R., Schroeder W., Pirchner F. and Rottmann O.2003. Genetic diversity, gene flow and drift in Bavarianred deer populations (Cervus elaphus). Conservation Ge-netics 4: 157–166.
Kuehn R., Haller H., Schroeder W. and Rottmann O. 2004.Genetic roots of eastern Swiss red deer (Cervus ela-phus). Journal of Heredity 95: 136–143.
Kuehn R., Hindenlang K., Holzgang O., Senn J., Stoeckle B.and Sperisen C. 2007. Genetic effect of Transportation
204 I. S. Nikolov et al.
Infrastructure on roe deer population (Capreolus cap-reolus). Journal of Heredity 98: 13–22.
Lowden S., Finlayson H. A., Macdonald A. A., Downing A.C., Goodman S. J., Leus K., Kaspe L., Wahyuni E.and Archibald A. L. 2002. Application of Sus scrofa
microsatellite markers to wild Suiformes. ConservationGenetics 3: 347–350.
Lucchini V., Meijaard E., Diong C. H., Groves C. P. andRandi E. 2005. New phylogenetic perspectives amongspecies of South-East Asian wild pigs (Sus sp.) based onmtDNA sequences and morphometric data. Journal ofZoology, London 266: 25–35.
Manel S., Schwartz M. K., Luikart G. and Taberlet P. 2003.Landscape genetics: combining landscape ecology andpopulation genetics. Trends in Ecology and Evolution18: 189–197.
Manni F., Guerard E. and Heyer E. 2004. Geographicpatterns of (genetic, morphologic, linguistic) variation:how barriers can be detected by using Monmonier’salgorithm. Human Biology 76: 173–190.
Mantel N. 1967. The detection of disease clustering and ageneralized regression 16 approach. Cancer Research27: 209–220.
Markov G. 1954. On the systematic of the wild boar inBulgaria. Bulletin de l’ Institut Zoologique de l’AcademieBulgare des Sciences 3: 221–223. [In Bulgarian withEnglish summary]
Monmonier M. 1973. Maximum-difference barriers: an al-ternative numerical regionalization method. Geograph-ical Analysis 3: 245–261.
Piertney S. B., MacColl A. D. C., Bacon P. J. and Dallas J.F. 1998. Local genetic structure in red grouse (Lagopus
lagopus scoticus): evidence from microsatellite DNAmarkers. Molecular Ecology 7: 1645–1654.
Piry S., Alapetite A., Cornuet J. M., Paetkau D., BaudouinL. and Estoup A. 2004. GENECLASS2: A software forgenetic assignment and first-generation migrant detec-tion. Journal of Heredity 6: 536–539.
Pritchard J. K., Stephens M. and Donnelly P. 2000. Infer-ence of population structure using multilocus genotypedata. Genetics 155: 945–959.
Rannala B. and Mountain J. L. 1997. Detecting immigra-tion by using multilocus genotypes. Proceedings of theNational Academy of Science of the USA 94: 9197–9201.
Randi E., Massei G. and Genov P. 1992. Allozyme variabil-ity in Bulgarian wild boar populations. Acta Theriologica37: 271–278.
Raymond M. and Rousset F. 1995a. Genepop (Version-1.2) –Population-genetics software for exact tests and ecu-menicism. Journal of Heredity 86: 248–249.
Raymond M. and Rousset F. 1995b. An exact test for popu-lation differentiation. Evolution 49: 1280–1283.
Rice W. 1989. Analyzing tables of statistical tests. Evolu-tion 43: 223–225.
Rohrer G. A., Alexander L. J., Keele J. W., Smith T. P. andBeattie C. W. 1994. A microsatellite linkage map of theporcine genome. Genetics 136: 231–245.
Rousset F. 1997. Genetic differentiation and estimation ofgene flow from F-statistics under isolation by distance.Genetics 145: 1219–1228.
Sáez-Royuela C. and Tellería J. L. 1986. The increased pop-ulation of the wild boar (Sus scropha) in Europe. Mam-mal Review 16: 97–101.
Scandura M., Iacolina L., Crestanello B., Peccholi E.,Benedetto M. F., Di Russo V., Davoli R., Apollonio M.and Bertorelle G. 2008. Ancient vs. recent processes asfactors shaping the genetic variation of the Europeanwild boar: are the effects of the last glaciation still de-tectable? Molecular Ecology 17: 1745–1762.
Schneider S., Roessli D. and Excoffier L. 2000. Arlequin: Asoftware for population genetic data analysis. User man-ual version 2000. Genetics and Biometry Laboratory,University of Geneva, Switzerland, Geneva: 2000.
Sodeikat G. and Pohlmeyer K. 2003. Escape movements offamily groups of wild boar Sus scrofa influenced bydrive hunts in Lower Saxony, Germany. Wildlife Biol-ogy 9: 43–49.
Vernesi C., Crestanello B., Pecchioli E., Tartari D., CaramelliD., Hauffe H. and Bertorelle G. 2003. The genetic im-pact of demographic decline and reintroduction in thewild boar (Sus scrofa): A microsatellite analysis. Molec-ular Ecology 12: 585–595.
Weir B. S. and Cockerham C. C. 1984. Estimating F-statis-tics for the analysis of population structure. Evolution38: 1358–1370.
Received 20 June 2008, accepted 23 January 2009.
Associate editor was Magdalena Niedzia³kowska.
Microsatellite variation in wild boar 205
Copyright © 2022 FDOKUMEN