table of contents - Philippine Drone Network
104
-
Upload
khangminh22 -
Category
Documents
-
view
6 -
download
0
Transcript of table of contents - Philippine Drone Network
TABLE OF CONTENTS
Chapter 1: Forest Resources and Forest Activities
1.01 Land Classification: 1999-2019
1.02 Status of Land Classification by Province: 2019
1.03 Forest Cover of the Philippines: 2015
1.04 Proclaimed Watershed Forest Reserve by Province: 2019
1.05 Priority Critical Watersheds Supporting National Irrigation System (NIS) by Region: 2019
1.06 Area Reforested by Sector: 1999-2019
1.07 National Greening Program (NGP) Accomplishment: 2019
Chapter 2: Forest Resources Allocation
2.01 Tenure Instruments: 1999-2019
2.02 Timber License Agreement Holders: 2019
2.03 Community-Based Forest Management Agreements (CBFMA): 2019
2.04 Integrated Forest Management Agreement (IFMA) Holders: 2019
2.05 Tree Farm Lease Agreement (TFLA) Holders: 2019
2.06 Socialized Industrial Forest Management Agreements (SIFMA): 2019
2.07 Private Forest Development Agreement (PFDA) Holders: 2019
2.08 Forest Land Grazing Management Agreements (FLGMA) by Province: 2019
2.09 Special Land Use Permit (SLUP) Holders by Province: 2019
2.10 Special Land Use Lease Agreement (SPLULA) Holders by Province: 2019
2.11 Forest land Use Agreement for Tourism Purposes (FLAgT) Holders by Province: 2019
2.12 Forest Land Use Agreement (FLAg) Holders: 2019
2.13 Rattan Cutting Contracts by Province: 2019
2.14 Wood Processing Plants: 2019

Chapter 3: Forest Resources Utilization
3.01 Roundwood Production: 1999-2019
3.02 Monthly Log Production by Province: 2019
3.03 Log Production by Type of Timber License/Permit: 2019
3.04 Production of Naturally Grown and Planted Logs by Region by End Use: 2019
3.05 Log Production by Species: 2019
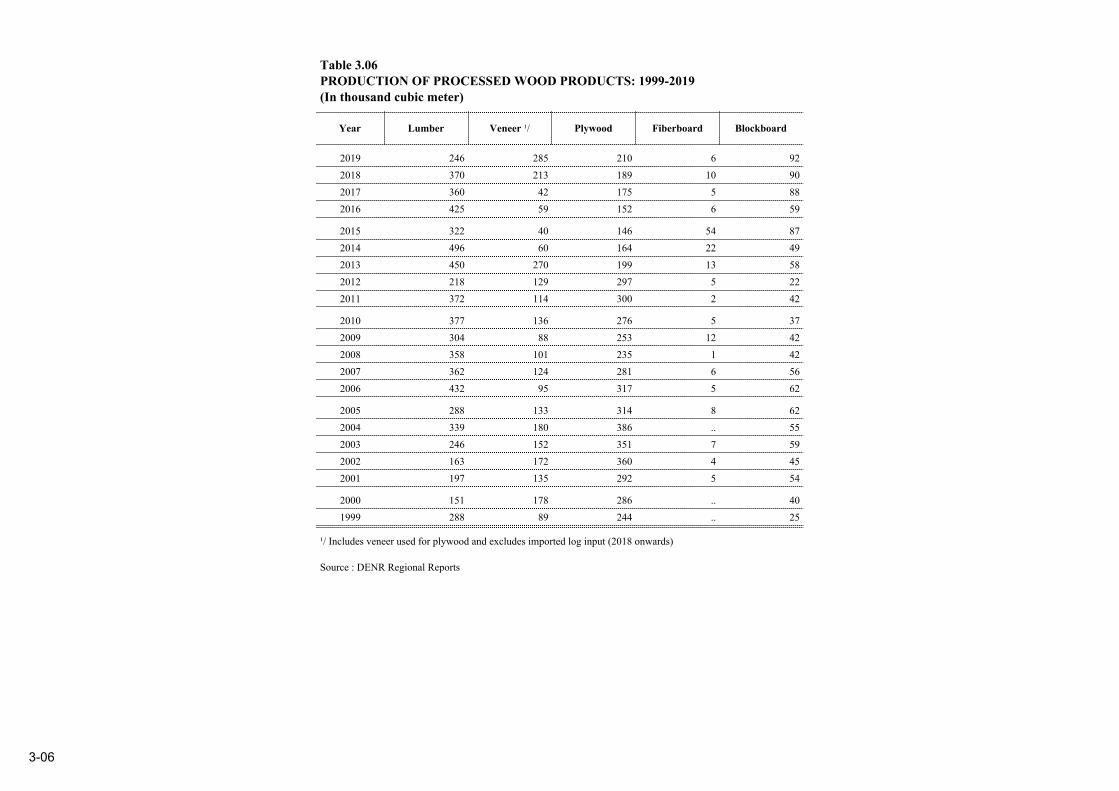
3.06 Production of Processed Wood Products: 1999-2019
3.07 Monthly Lumber Production by Province: 2019
3.08 Lumber Production by Type of Sawmill and by Province: 2019
3.09 Monthly Veneer Production by Region: 2019
3.10 Monthly Plywood Production by Region: 2019
3.11 Production of Non-Timber Forest Products: 1999-2019
3.12 Production of Selected Non-Timber Forest Products by Region: 2019
Chapter 4: Forest Products Trade
4.01 Roundwood Exports: 1999-2019
4.02 Exports of Processed Wood Products: 1999-2019
4.03 Selected Non-Timber Forest Products Exports: 1999-2019
4.04 Forest-Based Products Exports Summary: 2019
4.05 Imports of Log and Processed Forest Products: 1999-2019
4.06 Top Forest-Based Products Exports: 2019
4.06 Forest-Based Products Import Summary: 2019

Chapter 5: Forest Products Price
5.01 Monthly Domestic Prices of Locally Produced Logs: 2019
5.02 Monthly Retail Prices of Locally Produced Lumber: 2019
5.03 Monthly Retail Prices of Imported Lumber: 2019
5.04 Monthly Retail Prices of Ordinary Plywood: 2019
5.05 Monthly Retail Prices of Marine Plywood: 2019
5.06 Monthly Retail Prices of Lawanit: 2019
5.07 Monthly Retail Prices of Plyboard: 2019
5.08 Monthly Retail Prices of Fuelwood and Charcoal: 2019
5.09 Monthly Retail Prices of Selected Non-Timber Forest Products: 2019
5.10 Monthly Retail Prices of Unsplit Rattan: 2019
5.11 Monthly Retail Prices of Bamboo: 2019
Chapter 6: Forest Revenues
6.01 Forest Charges on Roundwood Harvested and Non-Timber Forest Products: 1999-2019
6.02 Forest Charges on Roundwood Harvested: 2019
6.03 Forest Charges on Non-Timber Forest Products: 2019
Chapter 7: Other Forestry-related Statistics
7.01 Summary Statistics for Forestry Establishments by Industry Sub-class: 2017
7.02 Summary Statistics for Manufacturing Establishments for All Employment Sizes by Industries Sub-class: 2017
7.03 Gross Domestic Product (GDP) and Gross Value Added (GVA) in Forestry: 1999-2019
7.04 Number of Schools, Enrollment and Graduates in Forestry and Other Related Courses: SY 1999-2019
7.05 Enrollment and Graduates by Program Level in Forestry Related Courses: SY 2010-2019


1-01
Table 1.01LAND CLASSIFICATION: 1992-2019(In hectares)
Year Total AreaCertified
Alienable and Disposable Land
Forestland
Total Forestland
Unclassified Forestland
Classified Forestland
Total Classified Forestland
Established Forest Reserves
Established Timberland
National Parks and GRBS/WA
Military and Naval
Reservations
Civil Reservations Fishpond
2006-2019 ( 30,000,000) ( 14,194,675) ( 15,805,325) ( 755,009) ( 15,050,316) ( 3,270,146) ( 10,056,020) ( 1,340,997) ( 126,130) ( 165,946) ( 91,077) 2005 ( 30,000,000) ( 14,207,582) ( 15,792,418) ( 753,427) ( 15,038,991) ( 3,222,360) ( 10,090,899) ( 1,342,579) ( 126,130) ( 165,946) ( 91,077) 2004 ( 30,000,000) ( 14,207,582) ( 15,792,418) ( 755,009) ( 15,037,409) ( 3,222,360) ( 10,090,899) ( 1,340,997) ( 126,130) ( 165,946) ( 91,077)
2000-2003 ( 30,000,000) ( 14,145,078) ( 15,854,922) ( 1,089,118) ( 14,765,804) ( 3,272,912) ( 10,227,847) ( 893,221) ( 130,330) ( 165,946) ( 75,548) 1998-1999 1/ ( 30,000,000) ( 14,145,078) ( 15,854,922) ( 1,089,118) ( 14,765,804) ( 3,272,912) ( 10,227,847) ( 893,221) ( 130,330) ( 165,946) ( 75,548) 1992-1997 ( 30,000,000) ( 14,117,244) ( 15,882,756) ( 881,157) ( 15,001,599) ( 3,272,912) ( 10,015,866) ( 1,340,997) ( 130,330) ( 165,946) ( 75,548)
1/ Adjusted figures - details are found in 2000 Philippine Forestry Statistics - Table 1.02-2.GRBS/ WA - Game Refuge and Bird Sanctuaries/ Wilderness Area
Note: The National Mapping and Resource Information Authority (NAMRIA) advises to maintain the 2006 Land Classification data while waiting for the results of on-going initiatives of the Department of Environment and Natural Resources (DENR) particularly on the enactment by Congress of the law fixing the final forest land limits of the country and completion of the Land Management Bureau's Cadastral Project to determine the administrative boundary of Local Government Units nationwide.
Source : National Mapping and Resource Information Authority (NAMRIA)

1-02
Table 1.02STATUS OF LAND CLASSIFICATION BY PROVINCE: 2019(In hectares)
Region / Province Total AreaCertified
Alienable and Disposable Land
Forestland
Total Forestland
Unclassified Forestland
Classified Forestland
Total Classified Forestland
Established Forest Reserves
Established Timberland
National Parks and GRBS/WA
Military and Naval
Reservations
Civil Reservations Fishpond
PHILIPPINES ( 30,000,000) ( 14,194,675) ( 15,805,325) ( 755,009) ( 15,050,316) ( 3,270,146) ( 10,056,020) ( 1,340,997) ( 126,130) ( 165,946) ( 91,077)
CAR ( 1,829,368) ( 342,345) ( 1,487,023) ( 8,548) ( 1,478,475) ( 804,795) ( 666,219) ( 6,907) ( 554) ( -) ( -) Abra ( 397,555) ( 98,420) ( 299,135) ( 8,105) ( 291,030) ( 258,743) ( 32,230) ( 57) ( -) ( -) ( -) Apayao and Kalinga ( 704,764) ( 80,679) ( 624,085) ( -) ( 624,085) ( 374,997) ( 247,750) ( 1,338) ( -) ( -) ( -) Benguet ( 265,538) ( 89,586) ( 175,952) ( 443) ( 175,509) ( 19,735) ( 149,708) ( 5,512) ( 554) ( -) ( -) Ifugao ( 251,778) ( 25,409) ( 226,369) ( -) ( 226,369) ( 28,467) ( 197,902) ( -) ( -) ( -) ( -) Mountain Province ( 209,733) ( 48,251) ( 161,482) ( -) ( 161,482) ( 122,853) ( 38,629) ( -) ( -) ( -) ( -)
Region 1 ( 1,284,019) ( 810,922) ( 473,097) ( 30,271) ( 442,826) ( 226,846) ( 201,164) ( 12,999) ( 288) ( 923) ( 606) Ilocos Norte ( 339,934) ( 144,948) ( 194,986) ( -) ( 194,986) ( 193,272) ( 1,374) ( 340) ( -) ( -) ( -) Ilocos Sur ( 257,958) ( 138,412) ( 119,546) ( 26,176) ( 93,370) ( 10,609) ( 81,141) ( 1,620) ( -) ( -) ( -) La Union ( 149,309) ( 120,443) ( 28,866) ( 2,513) ( 26,353) ( 90) ( 15,316) ( 10,947) ( -) ( -) ( -) Pangasinan ( 536,818) ( 407,119) ( 129,699) ( 1,582) ( 128,117) ( 22,875) ( 103,333) ( 92) ( 288) ( 923) ( 606)
Region 2 ( 2,687,517) ( 972,822) ( 1,714,695) ( 45,105) ( 1,669,590) ( 209,288) ( 1,423,482) ( 26,388) ( 412) ( 8,931) ( 1,089) Batanes ( 20,928) ( 7,432) ( 13,496) ( -) ( 13,496) ( -) ( 13,496) ( -) ( -) ( -) ( -) Cagayan ( 904,026) ( 360,050) ( 543,976) ( -) ( 543,976) ( 39,378) ( 497,314) ( 6,195) ( -) ( -) ( 1,089) Isabela ( 1,066,456) ( 459,666) ( 606,790) ( -) ( 606,790) ( 31,260) ( 546,005) ( 20,193) ( 412) ( 8,920) ( -) Nueva Vizcaya ( 390,387) ( 88,921) ( 301,466) ( 45,105) ( 256,361) ( 95,838) ( 160,512) ( -) ( -) ( 11) ( -) Quirino ( 305,720) ( 56,753) ( 248,967) ( -) ( 248,967) ( 42,812) ( 206,155) ( -) ( -) ( -) ( -)
Region 3 ( 2,147,036) ( 1,204,649) ( 942,387) ( 27,268) ( 915,119) ( 250,902) ( 493,882) ( 36,970) ( 112,819) ( 804) ( 19,742) Aurora ( 323,954) ( 132,008) ( 191,946) ( 26,638) ( 165,308) ( 84,803) ( 76,315) ( 4,190) ( -) ( -) ( -) Bataan ( 137,291) ( 69,975) ( 67,316) ( -) ( 67,316) ( 9,279) ( 32,370) ( 25,188) ( 479) ( -) ( -) Bulacan ( 262,505) ( 185,333) ( 77,172) ( 630) ( 76,542) ( 8,019) ( 64,679) ( 368) ( -) ( -) ( 3,476) Nueva Ecija ( 528,433) ( 343,257) ( 185,176) ( -) ( 185,176) ( 84,500) ( 37,333) ( 3,504) ( 59,700) ( 139) ( -) Pampanga ( 218,068) ( 172,616) ( 45,452) ( -) ( 45,452) ( 12,484) ( 6,929) ( 3,709) ( 7,452) ( -) ( 14,878) Tarlac ( 305,345) ( 184,975) ( 120,370) ( -) ( 120,370) ( -) ( 83,115) ( 2) ( 36,588) ( 665) ( -) Zambales ( 371,440) ( 116,485) ( 254,955) ( -) ( 254,955) ( 51,817) ( 193,141) ( 9) ( 8,600) ( -) ( 1,388)
NCR ( 63,600) ( 48,232) ( 15,368) ( 14,740) ( 628) ( -) ( 237) ( 59) ( -) ( -) ( 332) Metro Manila ( 63,600) ( 48,232) ( 15,368) ( 14,740) ( 628) ( -) ( 237) ( 59) ( -) ( -) ( 332)

1-02
Table 1.02 (continued)STATUS OF LAND CLASSIFICATION BY PROVINCE: 2019(In hectares)
Region / Province Total AreaCertified
Alienable and Disposable Land
Forestland
Total Forestland
Unclassified Forestland
Classified Forestland
Total Classified Forestland
Established Forest Reserves
Established Timberland
National Parks and GRBS/WA
Military and Naval
Reservations
Civil Reservations Fishpond
Region 4A ( 1,622,861) ( 1,051,948) ( 570,913) ( 21,032) ( 549,881) ( 98,825) ( 424,751) ( 20,832) ( 3,688) ( 28) ( 1,757) Batangas ( 316,581) ( 271,167) ( 45,414) ( 7,723) ( 37,691) ( -) ( 28,784) ( 8,537) ( 51) ( -) ( 319) Cavite ( 128,755) ( 107,733) ( 21,022) ( 4,147) ( 16,875) ( -) ( 14,076) ( -) ( 2,799) ( -) ( -) Laguna ( 175,973) ( 134,720) ( 41,253) ( 2,275) ( 38,978) ( 3,637) ( 32,313) ( 2,754) ( 274) ( -) ( -) Quezon ( 870,660) ( 474,439) ( 396,221) ( 6,887) ( 389,334) ( 72,606) ( 305,721) ( 9,541) ( -) ( 28) ( 1,438) Rizal ( 130,892) ( 63,889) ( 67,003) ( -) ( 67,003) ( 22,582) ( 43,857) ( -) ( 564) ( -) ( -)
MIMAROPA ( 2,745,601) ( 998,563) ( 1,747,038) ( 55,139) ( 1,691,899) ( 268,894) ( 369,269) ( 1,004,420) ( 147) ( 45,250) ( 3,919) Marinduque ( 95,925) ( 73,720) ( 22,205) ( -) ( 22,205) ( 17,901) ( 4,304) ( -) ( -) ( -) ( -) Occidental Mindoro ( 587,985) ( 156,004) ( 431,981) ( 26,949) ( 405,032) ( 91,270) ( 101,365) ( 192,811) ( 147) ( 16,190) ( 3,249) Oriental Mindoro ( 436,472) ( 222,895) ( 213,577) ( 148) ( 213,429) ( 85,659) ( 79,299) ( 44,289) ( -) ( 3,680) ( 502) Palawan ( 1,489,626) ( 453,700) ( 1,035,926) ( -) ( 1,035,926) ( 71,394) ( 171,832) ( 767,320) ( -) ( 25,380) ( -) Romblon ( 135,593) ( 92,244) ( 43,349) ( 28,042) ( 15,307) ( 2,670) ( 12,469) ( -) ( -) ( -) ( 168)
Region 5 ( 1,763,249) ( 1,222,060) ( 541,189) ( 29,873) ( 511,316) ( 69,939) ( 412,996) ( 25,276) ( -) ( 63) ( 3,042) Albay ( 255,257) ( 206,205) ( 49,052) ( -) ( 49,052) ( 5,026) ( 38,517) ( 5,459) ( -) ( -) ( 50) Camarines Norte ( 211,249) ( 140,030) ( 71,219) ( 12,872) ( 58,347) ( 796) ( 54,638) ( 2,840) ( -) ( -) ( 73) Camarines Sur ( 526,682) ( 365,551) ( 161,131) ( 4,354) ( 156,777) ( 15,027) ( 127,471) ( 13,145) ( -) ( -) ( 1,134) Catanduanes ( 151,148) ( 73,325) ( 77,823) ( 549) ( 77,274) ( 6,725) ( 70,486) ( -) ( -) ( 63) ( -) Masbate ( 404,769) ( 263,384) ( 141,385) ( 1,846) ( 139,539) ( 34,298) ( 104,121) ( 159) ( -) ( -) ( 961) Sorsogon ( 214,144) ( 173,565) ( 40,579) ( 10,252) ( 30,327) ( 8,067) ( 17,763) ( 3,673) ( -) ( -) ( 824)
Region 6 ( 2,022,311) ( 1,417,978) ( 604,333) ( 1,520) ( 602,813) ( 135,344) ( 419,171) ( 23,505) ( -) ( 235) ( 24,558) Aklan ( 181,789) ( 102,799) ( 78,990) ( 692) ( 78,298) ( -) ( 74,428) ( -) ( -) ( -) ( 3,870) Antique ( 252,201) ( 144,728) ( 107,473) ( -) ( 107,473) ( 24,593) ( 82,880) ( -) ( -) ( -) ( -) Capiz ( 263,317) ( 178,711) ( 84,606) ( -) ( 84,606) ( -) ( 78,798) ( -) ( -) ( -) ( 5,808) Iloilo and Guimaras ( 532,397) ( 396,149) ( 136,248) ( -) ( 136,248) ( 41,836) ( 85,496) ( 854) ( -) ( -) ( 8,062) Negros Occidental ( 792,607) ( 595,591) ( 197,016) ( 828) ( 196,188) ( 68,915) ( 97,569) ( 22,651) ( -) ( 235) ( 6,818)
Region 7 ( 1,489,077) ( 964,169) ( 524,908) ( 65,638) ( 459,270) ( 49,619) ( 390,151) ( 15,054) ( 4) ( 114) ( 4,328) Bohol ( 411,726) ( 310,455) ( 101,271) ( -) ( 101,271) ( 19,410) ( 78,454) ( -) ( -) ( -) ( 3,407) Cebu ( 509,237) ( 368,146) ( 141,091) ( -) ( 141,091) ( 21,427) ( 105,578) ( 13,148) ( 4) ( 114) ( 820) Negros Oriental ( 540,227) ( 258,841) ( 281,386) ( 65,638) ( 215,748) ( 8,570) ( 205,171) ( 1,906) ( -) ( -) ( 101) Siquijor ( 27,887) ( 26,727) ( 1,160) ( -) ( 1,160) ( 212) ( 948) ( -) ( -) ( -) ( -)

1-02
Table 1.02 (continued)STATUS OF LAND CLASSIFICATION BY PROVINCE: 2019(In hectares)
Region / Province Total AreaCertified
Alienable and Disposable Land
Forestland
Total Forestland
Unclassified Forestland
Classified Forestland
Total Classified Forestland
Established Forest Reserves
Established Timberland
National Parks and GRBS/WA
Military and Naval
Reservations
Civil Reservations Fishpond
Region 8 ( 2,143,169) ( 1,024,955) ( 1,118,214) ( 41,772) ( 1,076,442) ( 51,508) ( 1,014,151) ( 4,108) ( 176) ( 862) ( 5,637) Eastern Samar ( 433,965) ( 144,222) ( 289,743) ( -) ( 289,743) ( 1,890) ( 287,227) ( -) ( -) ( -) ( 626) Leyte and Biliran ( 626,826) ( 410,182) ( 216,644) ( 22,197) ( 194,447) ( 19,782) ( 170,400) ( 3,268) ( 48) ( 862) ( 87) Northern Samar ( 349,798) ( 148,134) ( 201,664) ( -) ( 201,664) ( 11,864) ( 188,160) ( -) ( 128) ( -) ( 1,512) Samar ( 559,100) ( 196,456) ( 362,644) ( -) ( 362,644) ( 168) ( 358,224) ( 840) ( -) ( -) ( 3,412) Southern Leyte ( 173,480) ( 125,961) ( 47,519) ( 19,575) ( 27,944) ( 17,804) ( 10,140) ( -) ( -) ( -) ( -)
Region 9 ( 1,467,011) ( 676,886) ( 790,125) ( 20,710) ( 769,415) ( 406,527) ( 352,135) ( 10) ( 46) ( 2,611) ( 8,086) Zamboanga del Norte ( 661,811) ( 262,592) ( 399,219) ( 4,617) ( 394,602) ( 230,348) ( 164,066) ( 10) ( 46) ( 12) ( 120) Zamboanga del Sur and ( 805,200) ( 414,294) ( 390,906) ( 16,093) ( 374,813) ( 176,179) ( 188,069) ( -) ( -) ( 2,599) ( 7,966) Zamboanga Sibugay
Region 10 ( 1,714,803) ( 817,669) ( 897,134) ( 52,602) ( 844,532) ( 85,140) ( 687,444) ( 53,319) ( 7,996) ( 3) ( 10,630) Bukidnon ( 829,378) ( 337,799) ( 491,579) ( 52,602) ( 438,977) ( 50,636) ( 379,589) ( -) ( -) ( -) ( 8,752) Camiguin ( 25,286) ( 21,063) ( 4,223) ( -) ( 4,223) ( -) ( 4,223) ( -) ( -) ( -) ( -) Lanao del Norte ( 309,204) ( 158,473) ( 150,731) ( -) ( 150,731) ( 26,388) ( 116,347) ( -) ( 7,996) ( -) ( -) Misamis Occidental ( 193,932) ( 125,375) ( 68,557) ( -) ( 68,557) ( 280) ( 13,137) ( 53,262) ( -) ( -) ( 1,878) Misamis Oriental ( 357,003) ( 174,959) ( 182,044) ( -) ( 182,044) ( 7,836) ( 174,148) ( 57) ( -) ( 3) ( -)
Region 11 ( 1,967,183) ( 737,633) ( 1,229,550) ( 14,376) ( 1,215,174) ( 111,595) ( 1,040,220) ( 53,643) ( -) ( 8,880) ( 836) Davao del Norte and ( 812,975) ( 297,674) ( 515,301) ( 2,188) ( 513,113) ( 31,221) ( 473,012) ( -) ( -) ( 8,880) ( -) Compostela ValleyDavao del Sur and ( 637,762) ( 239,015) ( 398,747) ( -) ( 398,747) ( 55,733) ( 290,490) ( 52,262) ( -) ( -) ( 262) Davao OccidentalDavao Oriental ( 516,446) ( 200,944) ( 315,502) ( 12,188) ( 303,314) ( 24,641) ( 276,718) ( 1,381) ( -) ( -) ( 574)
Region 12 ( 1,874,946) ( 730,546) ( 1,144,400) ( 218,000) ( 926,400) ( 129,146) ( 684,780) ( 20,552) ( -) ( 91,036) ( 886) Cotabato ( 656,590) ( 149,972) ( 506,618) ( 3,825) ( 502,793) ( 55,852) ( 345,600) ( 20,552) - ( 80,789) - South Cotabato and Sarangani ( 746,876) ( 342,191) ( 404,685) ( 168,369) ( 236,316) ( 33,188) ( 192,453) - - ( 10,247) ( 428) Sultan Kudarat ( 471,480) ( 238,383) ( 233,097) ( 45,806) ( 187,291) ( 40,106) ( 146,727) - - - ( 458)

1-02
Table 1.02 (concluded)STATUS OF LAND CLASSIFICATION BY PROVINCE: 2019(In hectares)
Region / Province Total AreaCertified
Alienable and Disposable Land
Forestland
Total Forestland
Unclassified Forestland
Classified Forestland
Total Classified Forestland
Established Forest Reserves
Established Timberland
National Parks and GRBS/WA
Military and Naval
Reservations
Civil Reservations Fishpond
Region 13 ( 1,884,697) ( 544,897) ( 1,339,800) ( 7,789) ( 1,332,011) ( 329,022) ( 992,131) ( 2,415) ( -) ( 6,206) ( 2,237) Agusan del Norte ( 259,029) ( 66,630) ( 192,399) ( -) ( 192,399) ( 47,595) ( 143,792) ( -) ( -) ( 1,012) ( -) Agusan del Sur ( 896,550) ( 221,628) ( 674,922) ( 1,125) ( 673,797) ( 164,794) ( 503,809) ( -) ( -) ( 5,194) ( -) Surigao del Norte and ( 273,902) ( 121,573) ( 152,329) ( 6,664) ( 145,665) ( 43,675) ( 98,818) ( 2,415) ( -) ( -) ( 757) Dinagat IslandsSurigao del Sur ( 455,216) ( 135,066) ( 320,150) ( -) ( 320,150) ( 72,958) ( 245,712) ( -) ( -) ( -) ( 1,480)
ARMM ( 1,293,552) ( 628,401) ( 665,151) ( 100,626) ( 564,525) ( 42,756) ( 483,837) ( 34,540) ( -) ( -) ( 3,392) Basilan ( 132,723) ( 85,574) ( 47,149) ( 5,953) ( 41,196) ( 18,397) ( 18,153) ( 2,597) ( -) ( -) ( 2,049) Lanao del Sur ( 387,289) ( 133,135) ( 254,154) ( -) ( 254,154) ( 11,844) ( 240,628) ( 1,682) ( -) ( -) ( -) Maguindanao ( 504,760) ( 306,622) ( 198,138) ( 3,525) ( 194,613) ( 12,515) ( 152,050) ( 30,048) ( -) ( -) ( -) Sulu ( 160,040) ( 47,687) ( 112,353) ( 66,284) ( 46,069) ( -) ( 44,898) ( 213) ( -) ( -) ( 958) Tawi-tawi ( 108,740) ( 55,383) ( 53,357) ( 24,864) ( 28,493) ( -) ( 28,108) ( -) ( -) ( -) ( 385)
GRBS/ WA - Game Refuge and Bird Sanctuaries/ Wilderness Area
Note: The National Mapping and Resource Information Authority (NAMRIA) advises to maintain the 2006 Land Classification data since there is no new land classification project approved in 2019.
Source : National Mapping and Resource Information Authority (NAMRIA)

1-03
Table 1.03FOREST COVER OF THE PHILIPPINES: 2015(In hectares)
Region / Province Total Area Closed Forest Open Forest Mangrove Forest
PHILIPPINES ( 7,014,152) ( 2,028,015) ( 4,682,764) ( 303,373)
CAR ( 807,220) ( 250,545) ( 556,675) ( -) Abra ( 162,931) ( 44,798) ( 118,133) ( -) Apayao ( 236,353) ( 102,084) ( 134,270) ( -) Benguet ( 109,470) ( 3,084) ( 106,385) ( -) Ifugao ( 90,578) ( 19,045) ( 71,533) ( -) Kalinga ( 113,880) ( 53,225) ( 60,654) ( -) Mountain Province ( 94,008) ( 28,309) ( 65,699) ( -)
Region 1 ( 147,602) ( 24,163) ( 122,061) ( 1,378) Ilocos Norte ( 76,053) ( 19,825) ( 56,192) ( 36) Ilocos Sur ( 37,006) ( 27) ( 36,931) ( 49) La Union ( 7,923) ( -) ( 7,771) ( 152) Pangasinan ( 26,620) ( 4,312) ( 21,168) ( 1,141)
Region 2 ( 1,050,963) ( 488,033) ( 557,188) ( 5,743) Batanes ( 2,485) ( -) ( 2,485) ( -) Cagayan ( 348,478) ( 207,229) ( 136,165) ( 5,083) Isabela ( 391,256) ( 90,076) ( 300,521) ( 659) Nueva Vizcaya ( 182,230) ( 98,229) ( 84,001) ( -) Quirino ( 126,515) ( 92,499) ( 34,016) ( -)
Region 3 ( 536,565) ( 234,839) ( 299,826) ( 1,900) Aurora ( 220,295) ( 126,883) ( 92,933) ( 479) Bataan ( 34,461) ( 10,793) ( 23,326) ( 343) Bulacan ( 63,189) ( 41,654) ( 21,099) ( 436) Nueva Ecija ( 76,012) ( 14,109) ( 61,903) ( -) Pampanga ( 7,255) ( 649) ( 6,516) ( 89) Tarlac ( 32,777) ( 6,298) ( 26,479) ( -) Zambales ( 102,577) ( 34,453) ( 67,571) ( 553)
NCR ( 2,106) ( -) ( 2,000) ( 106) Metro Manila ( 2,106) ( -) ( 2,000) ( 106)

1-03
Table 1.03 (continued)FOREST COVER OF THE PHILIPPINES: 2015(In hectares)
Region / Province Total Area Closed Forest Open Forest Mangrove Forest
Region 4A ( 271,512) ( 107,044) ( 145,165) ( 19,303) Batangas ( 9,249) ( 134) ( 8,435) ( 680) Cavite ( 4,061) ( -) ( 3,887) ( 175) Laguna ( 13,288) ( 3,271) ( 10,018) ( -) Quezon ( 228,024) ( 96,417) ( 113,159) ( 18,448) Rizal ( 16,889) ( 7,223) ( 9,667) ( -)
MIMAROPA ( 947,794) ( 110,161) ( 769,217) ( 68,416) Marinduque ( 13,904) ( -) ( 10,893) ( 3,012) Occidental Mindoro ( 118,451) ( 8,937) ( 107,677) ( 1,838) Oriental Mindoro ( 97,227) ( 5,906) ( 88,233) ( 3,088) Palawan ( 694,459) ( 91,541) ( 543,496) ( 59,421) Romblon ( 23,753) ( 3,777) ( 18,918) ( 1,058)
Region 5 ( 199,379) ( 41,149) ( 133,826) ( 24,404) Albay ( 30,795) ( 9,144) ( 20,326) ( 1,325) Camarines Norte ( 28,877) ( 9,607) ( 14,675) ( 4,596) Camarines Sur ( 62,818) ( 11,556) ( 43,913) ( 7,349) Catanduanes ( 46,445) ( 7,733) ( 36,897) ( 1,815) Masbate ( 5,529) ( -) ( 92) ( 5,437) Sorsogon ( 24,914) ( 3,109) ( 17,922) ( 3,883)
Region 6 ( 203,789) ( 62,025) ( 127,365) ( 14,400) Aklan ( 37,990) ( 9,849) ( 26,556) ( 1,584) Antique ( 61,535) ( 20,419) ( 40,211) ( 905) Capiz ( 27,611) ( 11,690) ( 12,552) ( 3,369) Guimaras ( 817) ( -) ( -) ( 817) Iloilo ( 23,163) ( 1,385) ( 19,550) ( 2,228) Negros Occidental ( 52,673) ( 18,681) ( 28,496) ( 5,497)
Region 7 ( 79,487) ( 4,226) ( 56,224) ( 19,037) Bohol ( 32,826) ( -) ( 19,884) ( 12,942) Cebu ( 8,013) ( -) ( 3,560) ( 4,453) Negros Oriental ( 37,708) ( 4,226) ( 31,972) ( 1,510) Siquijor ( 940) ( -) ( 808) ( 132)

1-03
Table 1.03 (continued)FOREST COVER OF THE PHILIPPINES: 2015(In hectares)
Region / Province Total Area Closed Forest Open Forest Mangrove Forest
Region 8 ( 511,962) ( 42,667) ( 435,243) ( 34,052) Biliran ( 9,448) ( -) ( 9,049) ( 399) Eastern Samar ( 182,739) ( 20,433) ( 154,246) ( 8,060) Leyte ( 74,922) ( 14,179) ( 54,394) ( 6,348) Northern Samar ( 48,511) ( -) ( 39,372) ( 9,139) Southern Leyte ( 29,997) ( 4,257) ( 25,302) ( 437) Western Samar ( 166,346) ( 3,798) ( 152,879) ( 9,668)
Region 9 ( 170,970) ( 28,775) ( 116,920) ( 25,275) Isabela City ( 2,334) ( 1,092) ( 489) ( 753) Zamboanga City ( 28,372) ( 14,612) ( 8,111) ( 5,649) Zamboanga del Norte ( 82,252) ( 8,882) ( 72,370) ( 999) Zamboanga del Sur ( 18,690) ( 1,520) ( 10,700) ( 6,470) Zamboanga Sibugay ( 39,323) ( 2,669) ( 25,250) ( 11,404)
Region 10 ( 382,357) ( 179,007) ( 198,132) ( 5,217) Bukidnon ( 202,448) ( 126,626) ( 75,822) ( -) Camiguin ( 5,530) ( 3,486) ( 2,026) ( 19) Lanao del Norte ( 73,278) ( 15,129) ( 55,711) ( 2,439) Misamis Occidental ( 40,472) ( 23,274) ( 14,726) ( 2,473) Misamis Oriental ( 60,628) ( 10,493) ( 49,848) ( 287)
Region 11 ( 400,613) ( 151,822) ( 245,290) ( 3,501) Compostela Valley ( 123,525) ( 50,886) ( 72,468) ( 171) Davao del Norte ( 53,636) ( 11,422) ( 41,651) ( 563) Davao del Sur ( 32,502) ( 6,037) ( 26,244) ( 221) Davao Occidental ( 34,455) ( 14,518) ( 19,710) ( 227) Davao Oriental ( 156,496) ( 68,958) ( 85,218) ( 2,319)
Region 12 ( 277,891) ( 93,153) ( 182,889) ( 1,849) Cotabato City ( 848) ( -) ( 190) ( 658) North Cotabato ( 45,309) ( 18,418) ( 26,891) ( -) Sarangani ( 53,826) ( 14,995) ( 38,588) ( 242) South Cotabato ( 74,943) ( 37,978) ( 36,933) ( 32) Sultan Kudarat ( 102,966) ( 21,762) ( 80,287) ( 916)

1-03
Table 1.03 (concluded)FOREST COVER OF THE PHILIPPINES: 2015(In hectares)
Region / Province Total Area Closed Forest Open Forest Mangrove Forest
Region 13 ( 724,772) ( 125,937) ( 571,786) ( 27,050) Agusan del Norte ( 73,581) ( 3,469) ( 68,890) ( 1,222) Agusan del Sur ( 356,656) ( 47,453) ( 309,203) ( -) Dinagat Island ( 29,378) ( 6,373) ( 20,775) ( 2,230) Surigao del Norte ( 36,222) ( 7,931) ( 14,377) ( 13,913) Surigao del Sur ( 228,936) ( 60,710) ( 158,541) ( 9,684)
ARMM ( 299,168) ( 84,468) ( 162,958) ( 51,742) Basilan ( 21,051) ( 9,754) ( 2,341) ( 8,956) Lanao del Sur ( 153,390) ( 63,270) ( 89,659) ( 461) Maguindanao ( 54,138) ( 11,445) ( 41,184) ( 1,509) Sulu ( 28,740) ( -) ( 2,209) ( 26,531) Tawi-tawi ( 41,850) ( -) ( 27,565) ( 14,285)
Details may not add up to total due to rounding.
Generated from 2015 Land Cover Maps based on digitally classified LANDSAT 8 imageries with 30m resolution taken in 2014-2016 with ground validation. The datasets are projected in UTM Zone 51N except Palawan (Zone 50N), w/ PRS 92 horizontal datum. Administrative boundaries used to generate the provincial statistics are approximate in the absence of the official administrative boundary from the Land Management Bureau (LMB).
Note: Disaggregation of Forest Cover by legal status (Forestland and Alieanable and Disposable Land) is not yet available.
Source : National Mapping and Resource Information Authority (NAMRIA) Data as of November 2018.

1-04
Table 1.04PROCLAIMED WATERSHED FOREST RESERVE BY REGION: 2019(Area in hectares)
Region Name of Watershed Province City/Municipality No. Area Proclamation No. Proclamation Date (mm/dd/yyy)
PHILIPPINES 113) ( 2,464,891.10)
CAR Subtotal ( 9) ( 398,191.02) Ambuklao Watershed Forest Reserve (Pilot) Benguet Atok, Bokod, La Trinidad, Tublay ( 9,700.00) 120 11/25/1966 Busol Forest Reservation Benguet Baguio City, La Trinidad ( 329.00) 15
(Amd. by 202)(Sus. 239)
04/27/1922(12/21/1987)(04/05/1988)
Buyog Watershed Forest Reserve Benguet Baguio City ( 19.88) 93 11/05/1992 Chico River Forest Reserve Mt. Province
IfugaoKalinga
Apayao
Bauko, Sabangan, Bontoc, Sagada, Sandangan, Barlig, Hugduan,Tanudan, Lubuagan, Tinglayan, Pinukpuk, Tabuk, Balbalan, Pasil Conner
( 333,176.20) 573 - parcel no. 2 06/26/1969
Lower Agno Watershed Forest Reserve BenguetPangasinan
Tuba, Itogon, Baguio City San Nicolas, San Manuel
( 39,304.00) 2320 11/22/1983
Lucnab Watershed Forest Reserve Benguet Baguio City ( 5.98) 178 05/12/1993 Marcos Highway Watershed Forest Reserve La Union
Benguet Agoo, Tubao, Rosario, Pugo, Santo Tomas, Aringay Baguio City
( 6,105.00) 1754 06/22/1978
Pucsusan Watershed Reservation Benguet Baguio City ( 0.96) 2035 04/06/2010 San Roque Watershed Reservation Benguet
Pangasinan Tuba, Itogon, Baguio City San Nicolas, San Manuel
( 9,550.00) 2320 11/22/1983
Region 1 Subtotal ( 7) ( 38,270.44) Ambayawan River Forest Reserve Pangasinan Not indicated ( 33,687.89) 573 - parcel no. 6 06/26/1969 Ilocos Norte Metropolitan Watershed Forest Reserve Ilocos Norte Pasuquin ( 2,815.00) 731
(Amd. 218)09/27/1934
(06/23/1967) Lon-oy Watershed Forest Reserve La Union San Gabriel, Santol ( 1,460.00) 378 05/11/1994 Magnuang Watershed Forest Reserve Ilocos Norte Batac ( 151.60) 220 07/02/1967 Naguilian Watershed Reservation La Union Naguilian ( 89.95) 52 04/11/1936 Santa Watershed Forest Reserve Ilocos Sur Santa ( 25.00) 844 09/26/1935 Tanap Watershed Forest Reserve Ilocos Norte Burgos ( 41.00) 803 02/01/1971

1-04
Table 1.04 (continued)PROCLAIMED WATERSHED FOREST RESERVE BY REGION: 2019(Area in hectares)
Region Name of Watershed Province City/Municipality No. Area Proclamation No. Proclamation Date (mm/dd/yyy)
Region 2 Subtotal ( 6) ( 455,677.16) Abulug River Forest Reserve Cagayan Not indicated ( 195.66) 573 - parcel no. 3 06/26/1969 Bawa Watershed Forest Reserve Cagayan Gonzaga, Lal-lo ( 8,955.00) 108 05/13/1987 Dupax Watershed Forest Reserve Nueva Vizcaya Dupax ( 425.00) 720 08/08/1934 Enrile-Solana-Amulong Forest Reserve Cagayan Enrile, Solana, and Amulong ( 8,249.00) 159 02/13/1967 Magat Watershed Reservation Ifugao
Nueva Vizcaya Isabela
Aguinaldo, Alfonso Lista, Lagawe, Mayoyao Diadi Santiago, Ramon
( 430,860.50) 573 - parcel no. 1 06/26/1969
Wangag Watershed Forest Reserve Cagayan Gonzaga, Lal-lo ( 6,992.00) 107 05/13/1987
Region 3 Subtotal ( 23) ( 308,999.74) Angat River-Bustos Dam Forest Reserve Bulacan Norzagaray ( 28,550.00) 573 - parcel no. 5 06/27/1969 Angat Watershed Forest Reserve Rizal
Bulacan Nueva Ecija Quezon
Montalban San Juan Del Monte, Norzagaray, Angat, San Rafael Peñaranda Infanta
( 55,709.10) 71(Amd. 505)
03/10/1927(12/04/1965)
Angat Watershed and Forest, Forest Range and Watershed Pilot Project Reserve
Bulacan Rizal
Norzagaray, San Jose Montalban
( 6,600.00) 391 04/30/1968
Aurora Watershed Forest Reserve Tayabas Baler ( 430.00) 34 02/04/1936 Bazal River Watershed Forest Reserve Aurora Maria Aurora ( 4,403.00) 402 05/02/1994 Bulawan Falls Watershed Forest Reserve Aurora Dinalungan ( 986.00) 395 05/30/1994 Calabgan Watershed Forest Reserve Aurora Casiguran ( 4,803.44) 915 06/01/1992 Diaat River Watershed Forest Reserve Aurora
Nueva Vizcaya Maria Aurora Dupax
( 3,219.14) 399 05/24/1994
Dibalo-Pingit-Zabali-Malayat River Watershed Forest Reserve Aurora Baler, San Luis ( 4,528.00) 908 05/25/1992 Dingalan River Watershed Forest Reserve Reserve Aurora Dingalan ( 1,788.00) 23 08/24/1992 Dipaculao Watershed Forest Reserve Aurora Dipaculao ( 1,786.00) 116 06/10/1987 Diteki River Watershed Forest Reserve Aurora Maria Aurora, San Luis ( 12,970.00) 20 08/24/1992

1-04
Table 1.04 (continued)PROCLAIMED WATERSHED FOREST RESERVE BY REGION: 2019(Area in hectares)
Region Name of Watershed Province City/Municipality No. Area Proclamation No. Proclamation Date (mm/dd/yyy)
Doña Remedios Trinidad-General Tinio Watershed Forest Reserve Bulacan Nueva Ecija
Doña Remedios Trinidad General Tinio
( 20,760.00) 230 03/23/1988
Mangan Vaca Watershed Forest Reserve Zambales Subic ( 300.00) 245(Mod. 1607)
01/18/1956(08/29/2008)
Olongapo Watershed Forest Reserve Zambales Olongapo ( 6,335.00) 238(Amd. 66)
04/30/1964(02/20/1987)
Pacugao River Watershed Forest Aurora Nueva Vizcaya
Maria Aurora Dupax
( 3,247.00) 110 11/23/1992
Pantabangan-Carranglan Watershed Reserve Nueva Ecija Nueva Vizcaya Aurora (Quezon)
Pantabangan, Carranglan Dupax Maria Aurora
( 84,500.00) 561 05/21/1969
Peñaranda River Forest Reserve Nueva Ecija General Tinio (Papaya) ( 14,887.70) 573 - parcel no. 4 06/26/1969 Pinamacan River Watershed Forest Reserve Aurora Dilasag ( 2,904.90) 236 08/23/1993 San Luis Watershed Forest Reserve Aurora San Luis ( 2,789.37) 109 11/23/1992 Subic Watershed Forest Reserve Bataan Not indicated ( 10,000.00) 926
(353) 06/25/1992
(03/31/2003) Talavera Watershed Reservation Nueva Vizcaya
Nueva Ecija Santa Fe Carranglan, Lupao, San Jose, Pantabangan
( 37,156.00) 47(Revoked 350)
(Amd. 244)
1923(12/12/1938)(01/17/1956)
Watershed Purposes of Mariveles (Palanas) Bataan Mariveles ( 347.09) EO 20 02/25/1919
NCR Subtotal ( 1) ( 2,659.00) La Mesa Watershed Forest Reserve Metro Manila
Rizal Quezon City, Caloocan City Rodriguez
( 2,659.00) 1336 07/25/2007
Region 4A Subtotal ( 12) ( 58,003.60) Alabat Watershed Forest Reserve Quezon Alabat ( 688.00) 156 09/18/1987 Binahaan River Watershed Forest Reserve Quezon Pagbilao, Mauban ( 465.00) 735 05/29/1991 Calauag Watershed Forest Reserve Tayabas Calauag ( 327.86) 367 01/02/1939 Caliraya-Lumot Rivers Forest Reserve Laguna Lumban, Kalayaan, Cavinti, Paete ( 10,770.71) 573 - parcel no. 9 06/26/1969 Infanta Watershed Forest Reserve Quezon Infanta ( 384.00) 158 02/13/1967 Kaliwa River Forest Reserve Quezon General Nakar, Infanta ( 27,613.00) 573 - parcel no. 8 06/26/1969 Lopez Watershed Forest Resereve Quezon (Tayabas) Calauag, Guinayangan ( 418.00) 566 06/22/1940

1-04
Table 1.04 (continued)PROCLAIMED WATERSHED FOREST RESERVE BY REGION: 2019(Area in hectares)
Region Name of Watershed Province City/Municipality No. Area Proclamation No. Proclamation Date (mm/dd/yyy)
Mulanay Watershed Forest Reserve Quezon Mulanay ( 25.60) 296 07/21/1938 Panukulan Watershed Forest Reserve Quezon Panukulan ( 178.68) 290 11/06/1993 Polilio Watershed Forest Reserve Quezon Polilio ( 130.00) 72 08/09/1966 Tibiang-Domagondong Watershed Forest Reserve Quezon (Tayabas) Guinayangan ( 280.00) 295 07/21/1938 Umiray River Watershed Reservation Quezon
Bulacan Rizal
General Nakar Norzagaray Montalban
( 16,722.75) 264 09/28/1993
MIMAROPA Subtotal ( 5) ( 8,653.75) Calatrava-San Andres-San Agustin Watershed Forest Reserve Romblon Calatrava, San Andres, San Agustin, Tablas Island ( 2,670.00) 2186 04/29/1982 Ipil River Watershed Forest Reserve Romblon San Fernando ( 685.75) 394 05/30/1994 Naampias River Watershed Forest Reserve Marinduque Torrijos ( 417.00) 357 04/20/1994 Palawan Flora, Fauna and Watershed Reserve Palawan Puerto Princesa ( 4,776.00) EO 67
(Amd. 2221)08/21/1912
(07/14/1982) Torrijos Watershed Forest Reserve Marinduque Torrijos ( 105.00) 463 04/06/1932
Region 5 Subtotal ( 11) ( 66,740.75) Bacon-Manito Watershed Geothermal Reservation Albay
Sorsogon Manito Bacon, Sorsogon, Castilla
( 25,000.00) 2036 A(Amd. EO 837)
11/11/1980(10/14/1982)
Barit River-Lake Buhi Forest Reserve Camarines Sur Buhi, Sagñay and Iriga ( 18,379.80) 573 06/26/1969 Capalonga Watershed Forest Reserve Camarines Norte Capalonga ( 752.00) 128 11/25/1966 Dahican Watershed Forest Reserve Camarines Norte Mambulao ( 44.00) 592 06/23/1933 Diwata Watershed Forest Reserve Masbate San Fernando ( 350.00) 370 05/02/1994 Jose Panganiban Watershed Forest Reserve Camarines Norte Jose Panganiban ( 1,160.00) 1151 01/09/1998 Magallanes and Juban Watershed Forest Reserve Sorsogon Magallanes, Juban ( 1,032.00) 108 11/23/1992 Matang-Tubig Watershed Forest Reserve Masbate Monreal ( 1,305.00) 368 05/02/1994 Mt. Masaraga Watershed Forest Reserve Albay Polangui, Oas, Ligao, Tabaco ( 810.00) 84 10/27/1992 Tiwi Watershed Reservation Albay Malinao, Tiwi ( 17,661.00) 739 08/14/1970 Tugbo Watershed Forest Reserve Masbate Mobo, Masbate ( 246.95) 369 05/02/1994

1-04
Table 1.04 (continued)PROCLAIMED WATERSHED FOREST RESERVE BY REGION: 2019(Area in hectares)
Region Name of Watershed Province City/Municipality No. Area Proclamation No. Proclamation Date (mm/dd/yyy)
Region 6 Subtotal ( 7) ( 62,113.63) Aklan River Watershed Forest Reserve Aklan Madalag, Libacao ( 23,185.00) 600 06/28/1990 Dalanas River Watershed Forest Reserve Antique Barbaza ( 8,558.00) 603 06/28/1990 Ilog-Hilabangan Watershed Forest Reserve Negros Occidental Himamaylan, Kabankalan ( 10,211.00) 602 06/28/1990 Jalaur River Watershed Forest Reserve Iloilo Calinog ( 9,227.60) 601 06/28/1990 Kabankalan Watershed Forest Reserve Negros Occidental Kabankalan ( 432.00) 820 10/25/1991 Maasin Watershed Forest Reserve Iloilo Maasin ( 6,150.03) 16 02/12/1923 Pan-ay River Watershed Forest Reserve Capiz Tapaz ( 4,350.00) 599 06/28/1990
Region 7 Subtotal ( 6) ( 229,927.00) Alijawan-Cansujay-Anibongan River Watershed Forest Reserve Bohol Duero, Jagna ( 3,630.00) 881 03/20/1992 Argao River Watershed Forest Reserve Cebu Argao, Dalaguete ( 7,250.00) 414 06/29/1994 Kotkot and Lusaran River Watershed Forest Reserve Cebu Cebu City, Danao City, Balamban, Compostela,
Consolacion, Lilo-an ( 14,121.00) 932
(Amd. 1074)06/29/1992
(09/02/1997) Loboc Watershed Forest Reserve Bohol Balilihan, Bilar, Batuan, Carmen, Clarin, Garcia
Hernandez, Jagna, Lila, Loboc, Sevilla, Sierra Bullones, Valencia
( 19,410.00) 450 12/23/1953
Palinpinon Geothermal Watershed Reservation Negros Oriental Dumaguete, Siaton, Tanjay ( 133,000.00) 1413(Amd. EO 223)
04/08/1975(07/16/1987)
Wahig-Inabanga River Watershed Forest Reserve Bohol Pilar, Candijay, Alicia, Duero, Sierra, Bullones, Carmen, Dago- hoy, Danao, Inabanga, Buenavista, Jetafe
( 52,516.00) 468 09/26/1994
Region 8 Subtotal ( 7) ( 15,378.46) Anas Watershed Forest Reserve Biliran Naval, Almeria, Culaba ( 1,142.25) 763 03/19/1996 Bulosao Watershed Forest Reserve Eastern Samar
Western Samar Lawa-an Marabut
( 4,055.00) 106 12/10/1992
Catbalogan Watershed Forest Reserve Western Samar Catbalogan, Jiabong ( 804.90) 413 06/29/1994 Hinabian-Lawigan Watershed Reservation Southern Leyte Libagon, Hinunangan, Saint Bernard, Silago ( 4,536.32) 107 11/23/1992 Loog Watershed Forest Reserve Western Samar Basey ( 1,865.99) 703 11/28/1995 Palompon Watershed Forest Reserve Leyte Palompon, Villaba ( 2,392.00) 212 01/29/1988
Patag-Gabas Watershed Forest Reserve Leyte Baybay ( 582.00) 1202 04/20/1998

1-04
Table 1.04 (continued)PROCLAIMED WATERSHED FOREST RESERVE BY REGION: 2019(Area in hectares)
Region Name of Watershed Province City/Municipality No. Area Proclamation No. Proclamation Date (mm/dd/yyy)
Region 9 Subtotal ( 1) ( 176.00) Ambogoc Watershed Forest Reserve Zamboanga del Norte Dapitan City ( 176.00) 611 06/23/1995
Region 10 Subtotal ( 2) ( 309,886.00) Mahoganao Watershed Forest Reserve Misamis Oriental Cagayan ( 136.00) 470 04/29/1932 Pulangi Watershed Reservation Bukidnon Part of Impasugong, Cabanglasan, San Fernando, Lantapan,
Maramag, Part of Quezon, Valencia City, Malaybalay City ( 309,750.00) EO 871
Region 11 Subtotal ( 2) ( 6,960.00) Andap Watershed Forest Reserve Davao del Norte New Bataan ( 6,725.00) 329 02/14/1994
Malagos Watershed Reservation Davao del Sur Davao City ( 235.00) 612 08/31/1933
Region 12 Subtotal ( 5) ( 282,659.12) Allah Watershed Forest Reserve South Cotabato
Sultan Kudarat Sarangani
Banga, Surallah Isulan Kiamba
( 102,350.00) 2455 09/24/1985
Kabulnan River Watershed Forest Reserve Sultan Kudarat Maguindanao South Cotabato
Esperanza, Isulan, Bagumbayan, Sen. Ninoy Aquino, Kalamansig, Palembang Ampatuan Lake Sebu
( 116,451.83) 241 02/08/2000
Koronadal Watershed Forest Reserve South Cotabato City of Koronadal (Marbel) ( 1,137.29) 607 06/23/1995 Libungan River Watershed Forest Reserve North Cotabato Libungan, Alamada ( 52,820.00) 563 05/03/1990 Sebu Watershed Forest Reserve South Cotabato
Sarangani Banga Kiamba
( 9,900.00) 65 04/08/1966

1-04
Table 1.04 (concluded)PROCLAIMED WATERSHED FOREST RESERVE BY REGION: 2019(Area in hectares)
Region Name of Watershed Province City/Municipality No. Area Proclamation No. Proclamation Date (mm/dd/yyy)
Region 13 Subtotal ( 7) ( 38,241.44) Adlay Watershed Forest Reserve Surigao del Sur Carrascal ( 27.00) 291 11/08/1993
Alfred Spring Watershed Forest Reserve Agusan del Sur Bunawan ( 100.00) 1236 05/29/1998
Andanan River Watershed Forest Reserve Agusan del Sur Sibagat, Bayugan ( 15,097.00) 734 05/29/1991
Cabadbaran River Watershed Forest Reserve Agusan del Norte Jabonga, Cabadbaran, Santiago ( 16,025.00) 834 11/13/1991
Mt. Magdiwata Watershed Forest Reserve Agusan del Sur San Francisco ( 1,658.00) 1939
(Amd. 282-parcel II)01/22/1980
(10/25/1993)
Surigao Watershed Forest Reserve Surigao del Norte Sison, Malimono, San Francisco, Surigao City ( 967.00) 635 08/29/1990
Taguibo River Watershed Forest Reserve Agusan del Norte Butuan City, Remedios Trinidad Romualdez, Cabadbaran ( 4,367.44) 1076 09/04/1997
ARMM Subtotal ( 2) ( 182,354.00) Lake Lanao Watershed Reservation Lanao del Sur Ditsaan-Ramain, Bubong, Buadipuso-Buntong, Molundo,
Taraka, Maguing, Tamparan, Lumba-Bayabao, Poona-Bayabao, Masiu, Buteg, Lumbatan, Lumbayanagui, Bayang, Binidayan, Ganassi, Pualas, Madalum, Madamba, Bacolod Grande, Tugaya, Balindong, Marantao, Piagapo, Saguiaran, Marawi City
( 180,460.00) 871 02/26/1992
South Upi Watershed Forest Reserve Maguindanao South Upi ( 1,894.00) 65 02/20/1987
Note: Only those watersheds that are not under NIPAS and e-NIPAS are retained as Proclaimed Watershed Forest Reserve.

1-05
Table 1.05PRIORITY CRITICAL WATERSHEDS SUPPORTING NATIONAL IRRIGATION SYSTEM (NIS) BY REGION: 2019(Area in hectares)
Region Partner Regions Name of Watershed No. Area
PHILIPPINES 131) ( 14,220,829)
CAR ( 3) ( 849,748) Region 1, Region 2 Abulog River Watershed ( 278,652) Region 2 Pamplona River Watershed ( 79,756) Region 1 Abra River Watershed ( 491,341)
Region 1 ( 12) ( 537,630) CAR Bayogao River Watershed ( 128,081) CAR Aringay River Watershed ( 41,370) CAR Bued River Watershed ( 57,632) CAR Laoag River Watershed ( 134,246) Region 3 Gama River Watershed ( 22,331) CAR Sta. Maria River Watershed ( 28,917)
Buaya River Watershed ( 23,999) Bacarra River Watershed ( 59,089) Bulu River Watershed ( 21,917) Cabugao River Watershed ( 7,701) Santo Domingo River Watershed ( 10,244) Bical River Watershed ( 2,102)
Region 2 ( 4) ( 2,839,505) CAR, Region 3 Cagayan River watershed ( 2,807,463)
Baua River Watershed ( 11,106) Palawig River Watershed ( 9,826) Aunugay River Watershed ( 11,110)
Region 3 ( 12) ( 1,784,912) CAR, Region 1, Region 2 Agno River Watershed ( 579,991)
Caulaman River Watershed ( 42,084) Region 4A Angat River Watershed ( 108,335)
Cabaluan River Watershed ( 14,008) Bucao River Watershed ( 65,772) Dingalan Watershed ( 2,686) Porac-Gumain River Watershed ( 30,249) Sto. Tomas River Watershed ( 26,148)
Region 1, Region 2 Guagua\Pasag River Watershed ( 882,805)

1-05
Table 1.05 (continued)PRIORITY CRITICAL WATERSHEDS SUPPORTING NATIONAL IRRIGATION SYSTEM (NIS) BY REGION: 2019(Area in hectares)
Region Partner Regions Name of Watershed No. Area
Suklayin River Watershed ( 12,992) Minangan River Watershed ( 10,189) Bagsit River Watershed ( 9,654)
Region 4A ( 14) ( 717,288) Pasig-Laguna River Watershed ( 395,676) Camachile-Ylang ylang River Watershed ( 12,949) Caisobo River Watershed ( 9,917) Tagabas-Iyam River Watershed ( 24,445) Palico River Watershed ( 22,682) Agos River Watershed ( 93,602) Canas River Watershed ( 11,185) Maragondon River Watershed ( 32,590) Malaquing Ilog River Watershed ( 75,557) Lagnas River Watershed ( 4,025) Imus River Watershed ( 10,171) Zapote River Watershed ( 5,071) Timalan River Watershed ( 4,532) Macelelon River Watershed ( 14,885)
MIMAROPA ( 12) ( 339,207) Malasgao River Watershed ( 19,999) Aborian River Watershed ( 24,258) Cantingos River Watershed ( 5,048) Canudang River Watershed ( 37,747) Lumintao River Watershed ( 37,058) Mongpong River Watershed ( 33,072) Bansud River Watershed ( 8,464) Pula River Watershed ( 20,230) Amnay River Watershed ( 39,052) Magasawang Tubig River Watershed ( 43,794) Pulang Tubig River Watershed ( 43,571) Pagbahan River Watershed ( 26,915)

1-05
Table 1.05 (continued)PRIORITY CRITICAL WATERSHEDS SUPPORTING NATIONAL IRRIGATION SYSTEM (NIS) BY REGION: 2019(Area in hectares)
Region Partner Regions Name of Watershed No. Area
Region 5 ( 12) ( 463,331) Fabrica River Watershed ( 6,765) Banuangdoan River Watershed ( 5,467) Dulangan River Watershed ( 7,006) Prieto Diaz Watershed ( 1,155) Bicol River Watershed ( 301,529) Inagyanan River Watershed ( 2,422) Lagonoy Rier River Watershed ( 23,989) Caaluhan River Watershed ( 3,313) Himoragat River Watershed ( 7,751) Daet River Watershed ( 7,593) Labo River Watershed ( 90,751) Basud River Watershed ( 5,592)
Region 6 ( 12) ( 1,024,213) Bago River Watershed ( 81,118) Tanolo River Watershed ( 110,317) Ibajay River Watershed ( 21,297) Hamulauon River Watershed ( 204,600) Alinsagao River Watershed ( 10,779) Jalatid River Watershed ( 168,923) Lalaud River Watershed ( 41,237) Jaro River Watershed ( 19,189) Sibalom River Watershed ( 62,822) Malogo River Watershed ( 16,001)
Region 7 Bangul River Watershed ( 198,765) Aclan River Watershed ( 89,164)

1-05
Table 1.05 (continued)PRIORITY CRITICAL WATERSHEDS SUPPORTING NATIONAL IRRIGATION SYSTEM (NIS) BY REGION: 2019(Area in hectares)
Region Partner Regions Name of Watershed No. Area
Region 7 ( 10) ( 165,005) Matulid River Watershed ( 25,400) Matutinao River Watershed ( 5,542) Soom River Watershed ( 7,320) Ipil River Watershed ( 27,569) Tipo River Watershed ( 3,405) Lubung River Watershed ( 3,194) Inabangan River Watershed ( 60,992) Mandaug Watershed ( 1,182) Tanjay River Watershed ( 27,008) Amblan River Watershed ( 3,394)
Region 8 ( 19) ( 552,707) Pagsangahan River Watershed ( 54,267) Himonglos River Watershed ( 14,679) Sangputan River Watershed ( 27,744) Palo River Watershed ( 20,931) Binahaan River Watershed ( 35,045) San Joaquin River Watershed ( 9,223) Daguitan River Watershed ( 29,145) Gebogo River Watershed ( 10,337) Ubun Watershed ( 5,748) Bito River Watershed ( 12,774) Salug River Watershed ( 15,173) Bantayan River Watershed ( 9,086) Catubig River Watershed ( 85,782) Sondara River Watershed ( 113,430) Pan-as-Hayiban River Watershed ( 45,151) Calbiga River Watershed ( 30,716) Silaga River Watershed ( 18,712) Ibiwon River Watershed ( 6,385)
Bisay River Watershed ( 8,381)

1-05
Table 1.05 (continued)PRIORITY CRITICAL WATERSHEDS SUPPORTING NATIONAL IRRIGATION SYSTEM (NIS) BY REGION: 2019(Area in hectares)
Region Partner Regions Name of Watershed No. Area
Region 9 ( 3) ( 221,059) Region 10 Salug Daku River Watershed ( 89,908)
Labangan River Watershed ( 48,112) Sibuguey River Watershed ( 83,038)
Region 10 ( 2) ( 180,793) ARMM Daromaoang River Watershed ( 45,235)
Cagayan River Watershed ( 135,558)
Region 11 ( 4) ( 533,559) Region 10, Region 13 Tagum Libuganon River Watershed ( 316,857)
Region 12 Padada River Watershed ( 118,860)
Lasang River Watershed ( 43,529)
Sumlog-Cuabo River Watershed ( 54,314)
Region 12 ( 4) ( 2,277,841) Region 10, ARMM, Region 11, Region 13 Tamontaca River Watershed ( 1,861,419)
Region 11 Buayan-Malungon Watershed ( 140,372)
ARMM Mindanao-Simuay River Watershed ( 213,002)
Matinao River Watershed ( 63,048)
Region 13 ( 7) ( 1,544,630) Magallanes River Watershed ( 29,624)
Region 11, Region 10 Agusan-Agusan del Norte River Watershed ( 1,160,552)
Cabadbaran River Watershed ( 20,501)
Tago River Watershed ( 144,342)
Tarac-an River Watershed ( 43,119)
Tubay River Watershed ( 99,232)
Bislig River Watershed ( 47,261)
ARMM ( 1) ( 189,400) Region 12, Region 10 Maria Cristina River Watershed ( 189,400)

1-06
Table 1.06AREA REFORESTED BY SECTOR: 1999-2019(In hectares)
Year Grand Total
Government Sector Non-Government Sector
Total DENROther
Government Agencies
Total Timber Licenses
IFMA/ SIFMA/ CBFMA/
TFLA/ PLA/ ITPLA
Others
2019 ( 21,925) ( 21,901) ( 21,901) - ( 24) - - ( 24) 2018 ( 141,310) ( 141,148) ( 141,148) - ( 162) - - ( 162) 2017 ( 206,136) ( 206,136) ( 206,136) - ( -) - - - 2016 ( 284,089) ( 284,089) ( 284,089) - ( -) - - - 2015 ( 360,357) ( 360,357) ( 360,070) ( 287) ( -) - - - 2014 ( 315,278) ( 315,278) ( 306,468) ( 8,810) ( -) - - - 2013 ( 345,130) ( 326,106) ( 273,971) ( 52,135) ( 19,024) - - ( 19,024) 2012 ( 214,098) ( 207,044) ( 132,710) ( 74,334) ( 7,054) - - ( 7,054) 2011 ( 117,603) ( 102,884) ( 82,163) ( 20,721) ( 14,719) - ( 5) ( 14,714) 2010 ( 61,795) ( 32,384) ( 32,384) - ( 29,411) ( 3,737) - ( 25,674) 2009 ( 54,598) ( 53,842) ( 53,842) - ( 756) - ( 756) - 2008 ( 28,884) ( 27,752) ( 27,752) - ( 1,132) ( 182) ( 950) - 2007 ( 40,699) ( 25,024) ( 25,024) - ( 15,675) - ( 928) ( 14,747) 2006 ( 7,289) ( 4,476) ( 4,476) - ( 2,813) - - ( 2,813) 2005 ( 10,275) ( 7,187) ( 7,187) - ( 3,088) ( 341) - ( 2,747) 2004 ( 24,242) ( 12,436) ( 12,436) - ( 11,806) ( 2,836) ( 6,337) ( 2,633) 2003 ( 19,103) ( 13,195) ( 6,565) ( 6,630) ( 5,908) ( 842) ( 4,431) ( 635) 2002 ( 22,296) ( 20,681) ( 9,111) ( 11,570) ( 1,615) ( 564) ( 1,034) ( 17) 2001 ( 32,309) ( 26,524) ( 26,484) ( 40) ( 5,785) ( 1,410) ( 3,850) ( 525) 2000 ( 27,239) ( 21,740) ( 19,059) ( 2,681) ( 5,499) ( 1,989) ( 2,721) ( 789) 1999 ( 41,991) ( 31,184) ( 30,831) ( 353) ( 10,807) ( 6,904) ( 3,421) ( 482)
Note: Area reforested from National Greening Program (NGP) Accomplishment involving DENR and other partners from 2011 onwards.
IFMA - Integrated Forest Management Agreement TFLA - Tree Farm Lease AgreementSIFMA - Socialized Industrial Forest Management Agreement PLA - Pasture Lease AgreementCBFMA - Community-Based Forest Management Agreement ITPLA - Industrial Tree Plantation Lease Agreement

1-07
Table 1.07NATIONAL GREENING PROGRAM (NGP) ACCOMPLISHMENT: 2019(Area in hectares)
Sector/Agency Area Seedlings Planted (no.)
PHILIPPINES 21,925 25,848,659
DENR Regular 21,901 25,825,609 Region 1 1,152 404,567 Region 2 1,008 1,619,131 Region 3 20 50,000 Region 4A 1,556 2,229,569 MIMAROPA 697 790,800 Region 5 3,757 3,557,097 Region 6 1,948 3,048,415 Region 7 1,941 4,040,295 Region 8 2,412 1,577,888 Region 9 2,537 2,197,433 Region 10 111 166,646 Region 11 271 194,832 Region 12 2 5,375 Region 13 4,490 5,943,561
Other Initiatives 24 23,050 SM Foundation 24 21,400 DENR NCR Philippine Arbor Day 2019* 1,650
* area planted not mentioned in the submitted report
Source: National Greening Program Coordinating Office


2-01
Table 2.01TENURE INSTRUMENTS: 1999-2019(Area in thousand hectares)
YearTotal TLA ¹/ CBFMA IFMA TFLA AFFLA SIFMA PFDA ²/ FLGMA SLUP SPLULA FLAgT FLAg
No. Area No. Area No. Area No. Area No. Area No. Area No. Area No. Area No. Area No. Area No. Area No. Area No. Area
2019 4,091 2,534 2 120 1,953 1,650 72 667 47 5 - - 1,519 30 121 6 169 50 104 1 15 a 34 a 55 52018 4,011 2,493 2 120 1,884 1,616 79 663 48 5 - - 1,535 30 114 3 168 50 81 a 16 a 33 a 51 52017 3,952 2,558 2 120 1,884 1,616 102 728 53 6 2 a 1,511 32 114 3 171 49 27 a 14 a 33 a 39 42016 4,106 2,799 2 120 1,884 1,616 127 962 53 6 2 a 1,530 32 115 5 186 54 126 a 14 a 32 a 35 4
2015 4,035 2,804 2 120 1,884 1,616 128 962 58 6 2 a 1,529 32 115 5 195 59 44 a 15 a 31 a 32 42014 3,986 2,849 2 120 1,884 1,615 140 1,006 61 6 2 a 1,529 32 7 2 217 63 73 a 16 a 29 a 26 32013 3,794 2,914 3 177 1,884 1,615 140 1,006 61 6 3 a 1,267 29 7 2 259 73 99 a 17 a 31 a 23 32012 4,307 2,925 3 177 1,888 1,615 140 1,006 63 6 6 a 1,551 33 91 5 290 79 222 1 17 a 33 1 3 a2011 4,549 2,988 3 177 1,790 1,634 146 1,034 75 7 8 1 1,872 36 91 5 325 90 175 a 17 a 32 a 15 3
2010 4,318 3,028 4 253 1,815 1,605 145 1,019 87 7 13 3 1,813 36 91 5 350 100 - - - - - - - -2009 4,338 2,966 4 253 1,790 1,634 154 867 94 10 42 64 1,813 36 91 5 350 97 - - - - - - - -2008 4,349 3,193 13 587 1,783 1,622 146 767 101 11 42 64 1,803 36 91 5 370 101 - - - - - - - -2007 4,436 3,391 15 691 1,783 1,622 153 833 125 14 59 78 1,805 35 91 5 405 113 - - - - - - - -2006 4,437 3,335 15 691 1,781 1,622 154 771 127 16 71 84 1,803 35 91 5 395 111 - - - - - - - -
2005 4,522 3,423 18 825 1,781 1,622 178 714 142 17 80 90 1,837 40 91 5 395 109 - - - - - - - -2004 8,095 6,472 15 584 5,503 4,904 192 710 151 20 84 94 1,660 43 91 5 399 112 - - - - - - - -2003 8,056 6,554 16 663 5,503 4,904 201 714 167 20 84 94 1,591 36 92 9 402 114 - - - - - - - -2002 6,929 6,140 18 787 4,956 4,396 193 697 166 20 80 91 1,026 30 90 5 400 115 - - - - - - - -2001 6,848 6,182 20 910 4,956 4,396 186 615 165 20 79 90 947 28 88 4 407 119 - - - - - - - -2000 6,585 5,992 20 910 4,885 4,276 184 548 155 19 80 91 756 22 86 4 419 122 - - - - - - - -
1999 6,277 5,706 20 905 4,659 4,011 188 508 147 18 80 91 604 15 83 4 496 153 - - - - - - - -
¹/ - not operational²/ - 115 Inactive PFDAs (5,615 ha)a - less than one thousand hectareDetails may not add up to total due to rounding.
TLA Timber License Agreement PFDA Private Forest Development AgreementCBFMA Community-Based Forest Management Agreement FLGMA Forest Land Grazing Management AgreementIFMA Integrated Forest Management Agreement SLUP Special Land Use PermitTFLA Tree Farm Lease Agreement SPLULA Special Land Use Lease AgreementAFFLA Agro-Forestry Farm Lease Agreement FLAgT Forest Land Use Agreement for Tourism PurposesSIFMA Socialized Industrial Forest Management Agreement FLAg Forest Land Use Agreement

2-02
Table 2.02TIMBER LICENSE AGREEMENTS (TLA): 2019 ¹/(Area in hectares)
Region Province No. of Agreements Area
PHILIPPINES 2 119,560
Region 8 Samar 1 95,770
Region 9 Zamboanga del Norte 1 23,790
¹/ Not operational

2-03
Table 2.03COMMUNITY-BASED FOREST MANAGEMENT AGREEMENTS (CBFMA): 2019(Area in hectares)
Region No. Issued Tenured AreaBeneficiaries
No. of Members No. of People's OrganizationTotal Male Female
PHILIPPINES 1,953 1,649,742 169,159 112,936 56,223 1,953
CAR 84 61,949 10,060 6,631 3,429 84Region 1 138 40,245 10,355 6,797 3,558 138Region 2 104 266,169 9,235 6,988 2,247 104Region 3 118 65,858 10,043 7,550 2,493 118Region 4A 46 18,170 3,834 2,444 1,390 46MIMAROPA 76 83,148 6,878 4,661 2,217 76Region 5 118 49,267 5,135 3,208 1,927 118Region 6 121 38,592 9,008 5,577 3,431 121Region 7 244 77,546 19,580 10,933 8,647 244Region 8 158 119,427 8,418 5,047 3,371 158Region 9 173 102,118 13,504 9,171 4,333 173Region 10 294 211,919 22,253 14,925 7,328 294Region 11 101 209,320 13,836 10,318 3,518 101Region 12 51 94,550 8,947 6,808 2,139 51Region 13 127 211,463 18,073 11,878 6,195 127

2-04
Table 2.04INTEGRATED FOREST MANAGEMENT AGREEMENTS (IFMA): 2019(Area in hectares)
Region Province No. of Agreements Area
PHILIPPINES 72 667,118
CAR Apayao 4 43,476
Region 1 4 13,380Ilocos Sur 1 995Pangasinan 3 12,385
Region 2 6 67,432Isabela 5 41,545Isabela and Quirino 1 25,887
Region 2 and 3 2 83,696Isabela and Aurora 1 33,454Aurora and Quirino 1 50,242
Region 3 17 83,916Aurora 3 66,301Bataan 3 2,791Bulacan 2 1,677Nueva Ecija 1 877Tarlac 1 1,626Zambales 7 10,643
Region 4A Quezon 2 14,527
Region 6 4 17,332Iloilo 1 541Negros Occidental 3 16,791
Region 7 5 7,086Cebu 1 232Negros Oriental 4 6,854
Region 8 Samar 1 4,693
Region 9 7 71,744Zamboanga Del Norte 5 36,814Zamboanga del Norte & Zamboanga Sibugay 1 34,425Zamboanga Del Sur 1 505

2-04
Table 2.04 (concluded)INTEGRATED FOREST MANAGEMENT AGREEMENTS (IFMA): 2019(Area in hectares)
Region Province No. of Agreements Area
Region 10 2 12,034Misamis Oriental 2 12,034
Region 11 10 61,359Davao del Sur 1 1,000Davao Oriental 9 60,359
Region 12 2 29,869South Cotabato 1 784Sultan Kudarat 1 29,085
Region 13 6 156,574Agusan del Sur 2 25,939Surigao del Sur 2 86,703Surigao del Sur & Agusan del Norte 1 7,363Surigao del Sur, Agusan del Norte, & Surigao del Norte 1 36,569

2-05
Table 2.05TREE FARM LEASE AGREEMENTS (TFLA): 2019(Area in hectares)
Region Province No. of Agreements Area
PHILIPPINES 47 5,021
CAR Ifugao 1 4
Region 2 20 1,995Cagayan 6 362Isabela 4 753Nueva Vizcaya 9 838Quirino 1 42
Region 3 21 2,128Bulacan 5 1,000Nueva Ecija 3 409Zambales 13 719
Region 6 3 359Iloilo 2 229Negros Occidental 1 130
Region 10 Bukidnon 1 235
Region 11 Davao del Sur 1 300

2-06
Table 2.06SOCIALIZED INDUSTRIAL FOREST MANAGEMENT AGREEMENTS (SIFMA): 2019(Area in hectares)
Region Province No. of Agreements Area
PHILIPPINES 1,519 30,210
CAR 11 631Ifugao 1 302Kalinga 10 328
Region 1 51 3,027Ilocos Norte 9 100La Union 1 2Pangasinan 41 2,925
Region 2 988 6,445Cagayan 415 3,126Isabela 518 2,976Quirino 55 343
Region 3 326 8,369Aurora 2 30Bataan 23 682Bulacan 235 1,911Nueva Ecija 23 120Tarlac 14 4,358Zambales 29 1,269
MIMAROPA 53 1,660Marinduque 14 399Occidental Mindoro 16 680Palawan 23 580
Region 6 3 820Iloilo 1 265Negros Occidental 2 555
Region 7 11 386Cebu 9 359Negros Oriental 2 26

2-06
Table 2.06 (concluded)SOCIALIZED INDUSTRIAL FOREST MANAGEMENT AGREEMENTS (SIFMA): 2019(Area in hectares)
Region Province No. of Agreements Area
Region 8 3 751Biliran 1 20Leyte 2 731
Region 9 15 6,806Zamboanga del Norte 3 1,500Zamboanga del Sur 1 59Zamboanga Sibugay 11 5,247
Region 10 Bukidnon 4 525
Region 11 19 391Davao del Sur 14 366Davao Oriental 5 26
Region 12 Cotabato 34 181
Region 13 Agusan del Sur 1 220

2-07
Table 2.07PRIVATE FOREST DEVELOPMENT AGREEMENT (PFDA): 2019(Area in hectares)
Region Province No. of Agreements Area
PHILIPPINES 121 6,291
Region 3 Nueva Ecija 2 660
Region 4A* Quezon 1 1,843
Region 6* 2 265Capiz 1 19Negros Occidental 1 246
Region 8* 3 26Eastern Samar 1 2Leyte 2 23
Region 10 4 16Bukidnon 1 2Misamis Occidental 1 6Misamis Oriental 2 7
Region 12* Sultan Kudarat 1 724
Region 13* 108 2,758Agusan del Norte 2 14Agusan del Sur 80 2,499Surigao del Sur 26 246
* Inactive PFDAs

2-08
Table 2.08FOREST LAND GRAZING MANAGEMENT AGREEMENTS (FLGMA): 2019(Area in hectares)
Region Province No. of Agreements Area
PHILIPPINES 169 50,079
CAR 13 3,111Abra 4 921Ifugao 4 534Kalinga 2 237Mountain Province 3 1,419
Region 1 Pangasinan 9 1,250
Region 2 67 11,526Cagayan 36 5,525Isabela 31 6,002
Region 3 23 6,902Aurora 1 110Bataan 2 729Nueva Ecija 3 1,300Tarlac 1 80Zambales 16 4,683
Region 4A 4 985Batangas 3 891Quezon 1 94
MIMAROPA 5 4,002Occidental Mindoro 4 3,863Palawan 1 139
Region 5 Masbate 19 7,079
Region 10 19 9,549Bukidnon 12 6,306Misamis Oriental 7 3,242
Region 12 South Cotabato 10 5,676

2-09
Table 2.09SPECIAL LAND USE PERMITS (SLUP): 2019(Area in hectares)
Region Province No. of Permits Area
PHILIPPINES 104 1,047
Region 1 10 125Ilocos Norte 3 14Ilocos Sur 3 9La Union 1 2Pangasinan 3 101
Region 2 11 129Cagayan 6 6Isabela 5 123
Region 3 7 185Aurora 1 aBataan 3 52Nueva Ecija 1 129Zambales 2 4
Region 4A 4 206Quezon 4 206
MIMAROPA 1 9Palawan 1 9
Region 5 3 36Masbate 2 34Camarines Norte 1 2
Region 6 4 4Aklan 1 aAntique 2 3Guimaras 1 a

2-09
Table 2.09 (concluded)SPECIAL LAND USE PERMITS (SLUP): 2019(Area in hectares)
Region Province No. of Permits Area
Region 7 38 299Bohol 8 3Cebu 26 293Negros Oriental 4 3
Region 8 15 28Leyte 12 27Northern Samar 3 a
Region 9 6 11Zamboanga del Norte 1 1Zamboanga Sibugay 2 1Zamboanga del Sur 3 9
Region 12 1 2Kidapawan 1 2
Region 13 4 12Dinagat Island 2 10Agusan del Norte 1 aSurigao del Sur 1 1
a - less than 1 hectare

2-10
Table 2.10SPECIAL LAND USE LEASE AGREEMENTS (SPLULA): 2019(Area in hectares)
Region Province No. of Agreements Area
PHILIPPINES 15 68
Region 5 Camarines Norte 1 3
Region 7 Cebu 11 62
Region 8 Leyte 1 1
Region 13 2 2Agusan del Sur 1 aSurigao del Sur 1 2
a - less than 1 hectare

2-11
Table 2.11FOREST LAND USE AGREEMENT FOR TOURISM PURPOSES (FLAgT): 2019(Area in hectares)
Region Province No. of Agreements Area
PHILIPPINES 34 317
Region 2 Cagayan 1 a
Region 3 Bataan 1 3
MIMAROPA 29 276Palawan 23 261Marinduque 1 10Occidental Mindoro 5 5
Region 5 Masbate 1 2
Region 7 2 36Cebu 1 12Siquijor 1 24
a - less than 1 hectare

2-12
Table 2.12FOREST LAND USE AGREEMENTS (FLAg): 2019(Area in hectares)
Region Province No. of Agreements Area
PHILIPPINES 55 4,918
CAR Benguet 1 16
Region 1 15 2,528La Union 1 20Ilocos Norte 12 2,503Ilocos Sur 2 5
Region 2 Isabela 1 625
Region 3 3 36Bataan 1 aTarlac 1 1Zambales 1 35
MIMAROPA 7 90Oriental Mindoro 3 56Palawan 3 27Romblon 1 7
Region 5 Sorsogon 4 626Camarines Sur 1 622Sorsogon 3 4
Region 6 6 157Aklan 5 18Iloilo 1 139
Region 7 6 356Bohol 1 aCebu 1 6Negros Oriental 4 350
2-12
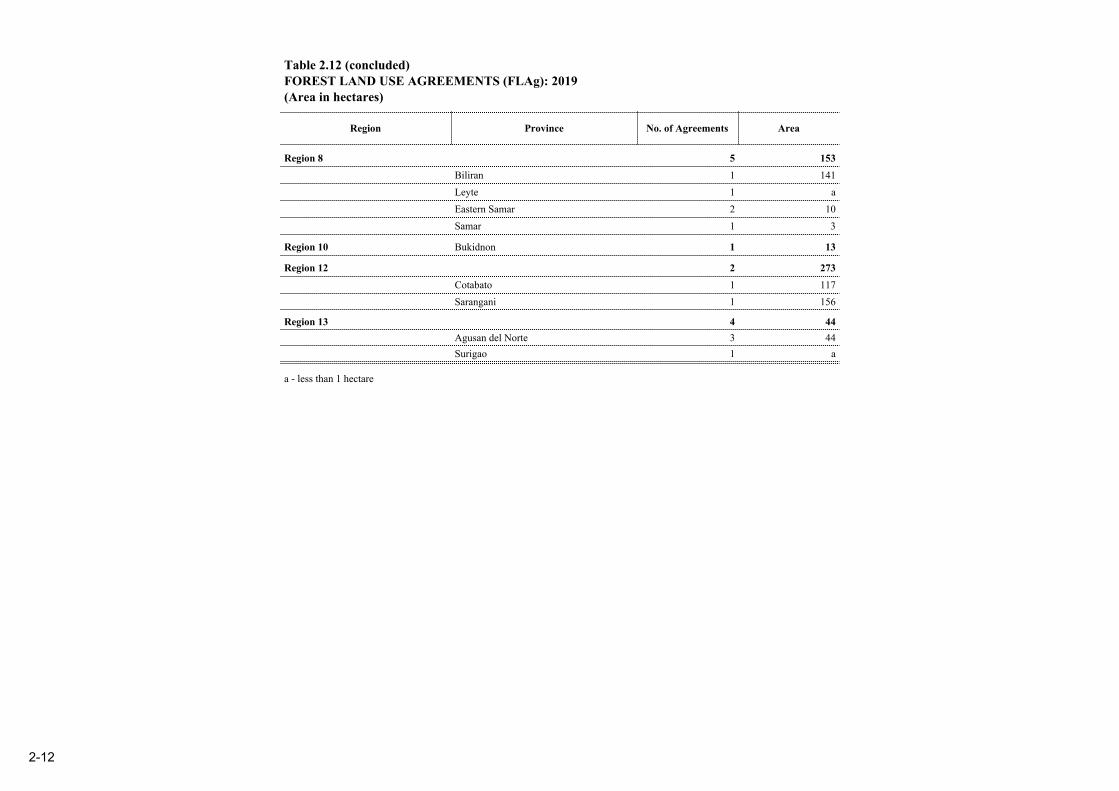
Table 2.12 (concluded)FOREST LAND USE AGREEMENTS (FLAg): 2019(Area in hectares)
Region Province No. of Agreements Area
Region 8 5 153Biliran 1 141Leyte 1 aEastern Samar 2 10Samar 1 3
Region 10 Bukidnon 1 13
Region 12 2 273Cotabato 1 117Sarangani 1 156
Region 13 4 44Agusan del Norte 3 44Surigao 1 a
a - less than 1 hectare

2-13
Table 2.13RATTAN CUTTING CONTRACTS: 2019(Area in hectares, Allowable Cut in lineal meter)
Region Province No. of RCC Area Allowable Cut
PHILIPPINES 27 247,413 15,199,550
Region 2 Isabela 1 30,000 250,480
Region 3 4 22,780 1,745,748Aurora 2 15,000 850,652Bataan 1 2,780 529,829Tarlac 1 5,000 365,267
Region 4A Quezon 1 24,000 300,000
Region 4B Palawan 2 13,450 480,999
Region 5 Catanduanes 1 70 307,823
Region 8 Western Samar 1 5,000 268,778
Region 9 Zamboanga del Norte 1 12,200 352,676
Region 10 2 17,310 1,479,159Bukidnon 1 13,050 1,048,412Misamis Oriental 1 4,260 430,747
Region 11 2 33,575 1,894,968Davao del Norte 1 15,575 617,826Davao Oriental 1 18,000 1,277,142
Region 12 2 7,600 1,442,471Sultan Kudarat 1 5,000 804,950Cotabato 1 2,600 637,521
Region 13 10 81,428 6,676,447Agusan del Sur 9 58,301 5,792,534Surigao del Sur 1 23,127 883,913

2-14
Table 2.14WOOD PROCESSING PLANT (WPP): 2019(DRC and ALR in cubic meter)
Region Type of Permit No. of WPP Daily Rated Capacity(DRC)
Annual Log Requirement (ALR)
PHILIPPINES 192 12,971 2,676,613
CAR Resawmill 1 640Region 1 3 22 258,246
Sawmill 1 4 10,333Mini-sawmill 2 18 247,913
Region 2 2 37 13,387Sawmill1 1 35 7,500
Mini-sawmill 1 2 5,887Region 3 3 125 336,054
Sawmill 2 106 320,000Mini-sawmill 1 19 16,054
NCR 6 215 52,565Sawmill 1 17 5,503Resawmill 1 2 472Veneer/Plywood/Plyboard 4 196 46,590
Region 4A 2 25 9,906Mini-sawmill 1 5 1,573Veneer/Plywood 1 20 8,333
Region 6 2 9,035 38,159Mini-sawmill 1 2 4,112Wood chipper and Mini-sawmill 1 9,033 34,047
Region 7 9 64 21,051Mini-sawmill 1 5 1,573Resawmill 7 59 19,426Mobile wood chipper and Mini-sawmill 1 0 52
Region 8 Mini-sawmill 1 1 1,997
Region 9 19 270 220,866Mini-sawmill 15 21 10,205Veneer/Plywood 1 110 43,575Sawmill 1 47 94,013Re-sawmill, Mini-sawmill, Veneer/Plywood 2 91 73,073

2-14
Table 2.14 (concluded)WOOD PROCESSING PLANT (WPP): 2019(DRC and ALR in cubic meter)
Region Type of Permit No. of WPP Daily Rated Capacity(DRC)
Annual Log Requirement (ALR)
Region 10 58 551 167,591Sawmill 1 24 9,432Mini-sawmill 54 386 115,724Mini-sawmill, Resawmill and Veneering 1 113 33,960Mini-sawmill, Veneer/Plywood 1 8 2,475Integrated 1 20 6,000
Region 11 35 434 230,582Sawmill 1 28 18,800Mini-sawmill 22 95 39,544Veneer/Plywood 9 276 159,738Wood Treating Plant 2 15Mini-sawmill, Veneer 1 20 12,500
Region 12 9 60 23,820Mini-sawmill 7 46 18,404Wood Treating Plant 1 4 1,416Veneering 1 10 4,000
Region 13 45 1,514 1,560,635Match Factory 1 91 36,399Mini-sawmill 7 161 79,178Veneer/Plywood/Blockboard 3 151 74,019Veneer/Plywood/Blockboard?Fiberboard, Sawmill/Mini-sawmill 25 585 1,040,812Wood Treating Plant 2 12,680Integrated 7 526 317,547
1/ No operationa - less than one hectareNote: The table does not include resawmill permits and wood treating plants.


3-01
Table 3.01ROUNDWOOD PRODUCTION: 1999-2019(In thousand cubic meter)
Year Grand TotalLog Fuelwood/Firewood
Total Sawlog/Veneer Log Pulpwood Poles & Piles Total Upland Charcoal
2019 1,272 948 736 208 4 324 35 2892018 1,264 884 672 206 6 380 32 3482017 999 733 465 264 4 266 27 2392016 1,134 790 440 347 3 344 42 302
2015 1,317 842 443 395 4 475 49 4262014 1,551 1,102 631 465 6 449 42 4072013 1,616 1,166 641 518 7 450 40 4102012 1,354 862 742 116 4 492 59 4332011 1,485 871 780 87 4 614 97 517
2010 982 557 518 35 4 425 66 3592009 1,401 801 689 109 3 600 136 4642008 1,510 815 474 338 3 695 85 6102007 1,569 881 648 227 6 688 80 6082006 1,562 1,035 538 472 25 527 77 450
2005 1,110 841 345 489 7 269 54 2152004 934 768 410 355 3 166 38 1282003 689 506 349 151 6 183 39 1442002 541 403 288 106 9 138 28 1102001 713 571 319 241 11 142 58 84
2000 912 800 384 400 16 112 33 791999 860 730 568 160 2 130 49 81

3-02
Table 3.02MONTHLY LOG PRODUCTION BY PROVINCE: 2019(In cubic meter)
Region/Province Total Jan Feb Mar Apr May Jun Jul Aug Sept Oct Nov Dec
PHILIPPINES ( 948,104) ( 78,706) ( 83,981) ( 64,059) ( 95,843) ( 73,801) ( 73,546) ( 99,361) ( 88,658) ( 69,190) ( 99,981) ( 73,121) ( 47,855)
CAR ( 1,202) ( 17) ( 72) ( 122) ( 171) ( 157) ( 102) ( 52) ( 103) ( 211) ( 100) ( 79) ( 16) Abra ( 169) - - - ( 6) - a ( 4) ( 159) - - - Apayao ( 30) - - - - - - - ( 30) - - - - Benguet ( 423) ( 5) ( 7) ( 76) ( 40) ( 8) ( 50) ( 31) ( 38) ( 30) ( 64) ( 58) ( 16) Ifugao ( 571) ( 12) ( 64) ( 47) ( 119) ( 149) ( 50) ( 20) ( 31) ( 22) ( 37) ( 20) - Kalinga ( 2) - - - - - ( 2) - - - - - - Mt. Province ( 7) - - - ( 7) - - - - - - - -
Region 1 ( 7,869) ( 752) ( 1,069) ( 735) ( 602) ( 568) ( 471) ( 817) ( 523) ( 542) ( 655) ( 434) ( 702) Ilocos Norte ( 2,210) ( 228) ( 382) ( 137) ( 241) ( 282) ( 122) ( 298) ( 19) ( 73) ( 168) ( 84) ( 176) Ilocos Sur ( 2,232) ( 237) ( 280) ( 242) ( 70) ( 143) ( 75) ( 187) ( 166) ( 207) ( 217) ( 203) ( 204) La Union ( 797) a ( 139) ( 78) ( 88) ( 33) ( 53) ( 92) ( 115) ( 42) ( 59) ( 64) ( 33) Pangasinan ( 2,630) ( 287) ( 268) ( 278) ( 203) ( 110) ( 221) ( 240) ( 222) ( 219) ( 211) ( 82) ( 289)
Region 2 ( 1,458) ( - ) ( 37) ( 17) ( 116) ( 296) ( 108) ( 460) ( 145) ( 137) ( 73) ( 69) ( - ) Isabela ( 34) - - - - - - - - - ( 34) - - Nueva Vizcaya ( 707) - - - ( 71) ( 236) ( 14) ( 312) ( 73) - - - - Quirino ( 717) - ( 37) ( 17) ( 45) ( 60) ( 94) ( 147) ( 72) ( 137) ( 39) ( 69) -
Region 3 ( 2,089) ( 19) ( 17) ( 382) ( 14) ( 73) ( 500) ( - ) ( - ) ( 1,003) ( 31) ( 34) ( 16) Bataan ( 1,504) - - ( 326) - - ( 288) - - ( 890) - - - Nueva Ecija ( 181) - - ( 18) - - ( 129) - - ( 35) - - - Tarlac ( 403) ( 19) ( 17) ( 37) ( 14) ( 73) ( 84) - ( 78) ( 31) ( 34) ( 16)
Region 4A ( 42,757) ( 5,763) ( 919) ( 5,300) ( 5,573) ( 5,275) ( 6,042) ( 859) ( 7,242) ( 763) ( 1,596) ( 942) ( 2,482) Batangas ( 427) ( 10) ( 43) ( 26) ( 13) ( 62) ( 29) ( 59) ( 43) ( 143) - - - Laguna ( 4,505) ( 491) ( 837) - ( 8) - - - ( 1,402) - ( 842) - ( 926) Quezon ( 37,824) ( 5,263) ( 40) ( 5,274) ( 5,552) ( 5,213) ( 6,013) ( 799) ( 5,797) ( 620) ( 754) ( 942) ( 1,556)
MIMAROPA ( 10,706) ( 805) ( 1,313) ( 1,067) ( 1,204) ( 997) ( 934) ( 645) ( 618) ( 768) ( 736) ( 638) ( 981) Marinduque ( 81) - - - - - - - - - - - ( 81) Oriental Mindoro ( 741) ( 70) ( 120) ( 75) ( 139) ( 55) ( 71) ( 55) ( 47) ( 103) ( 5) - - Palawan ( 9,821) ( 735) ( 1,192) ( 992) ( 1,065) ( 942) ( 822) ( 590) ( 571) ( 665) ( 731) ( 638) ( 879) Romblon ( 62) - - - - - ( 41) - - - - - ( 21)

3-02
Table 3.02 (continued)MONTHLY LOG PRODUCTION BY PROVINCE: 2019(In cubic meter)
Region/Province Total Jan Feb Mar Apr May Jun Jul Aug Sept Oct Nov Dec
Region 5 ( 784) ( 144) ( 103) ( 28) ( 94) ( 91) ( 36) ( 33) ( 97) ( 16) ( 49) ( 66) ( 27) Albay ( 173) - - ( 25) ( 15) ( 10) ( 23) ( 14) ( 9) - ( 45) ( 29) ( 2) Camarines Norte ( 215) ( 20) ( 11) - ( 72) ( 50) - - ( 32) ( 3) - ( 17) ( 10) Camarines Sur a - - - - - - - a - - - - Sorsogon ( 396) ( 124) ( 92) ( 2) ( 8) ( 31) ( 13) ( 19) ( 55) ( 13) ( 4) ( 20) ( 16)
Region 6 ( 20,555) ( 1,627) ( 1,866) ( 1,432) ( 1,617) ( 1,523) ( 2,374) ( 2,331) ( 1,978) ( 1,791) ( 1,356) ( 1,261) ( 1,398) Aklan ( 496) ( 40) ( 27) ( 106) ( 20) ( 21) ( 39) ( 105) ( 52) ( 33) ( 42) ( 4) ( 6) Antique ( 1,718) ( 38) ( 124) ( 206) ( 154) ( 104) ( 112) ( 230) ( 130) ( 109) ( 77) ( 286) ( 148) Capiz ( 710) ( 4) ( 162) ( 46) ( 47) ( 50) ( 41) ( 80) ( 40) ( 71) ( 52) ( 40) ( 78) Guimaras ( 5,942) ( 588) ( 274) ( 787) ( 304) ( 243) ( 791) ( 560) ( 368) ( 495) ( 348) ( 421) ( 763) Iloilo ( 6,816) ( 648) ( 1,008) ( 82) ( 843) ( 926) ( 743) ( 532) ( 664) ( 543) ( 565) ( 160) ( 101) Negros Occidental ( 4,873) ( 309) ( 272) ( 205) ( 249) ( 178) ( 647) ( 825) ( 724) ( 539) ( 272) ( 350) ( 302)
Region 7 ( 17,050) ( 1,315) ( 1,485) ( 1,670) ( 1,097) ( 1,043) ( 799) ( 1,234) ( 1,510) ( 1,458) ( 1,520) ( 1,998) ( 1,921) Bohol ( 15,826) ( 1,283) ( 1,394) ( 1,555) ( 986) ( 947) ( 678) ( 1,123) ( 1,400) ( 1,387) ( 1,244) ( 1,950) ( 1,879) Cebu ( 235) ( 15) ( 3) ( 20) ( 22) ( 18) ( 23) ( 16) ( 22) ( 18) ( 35) ( 16) ( 26) Negros Oriental ( 700) ( 15) ( 72) ( 85) ( 62) ( 54) ( 33) ( 35) ( 24) ( 31) ( 241) ( 32) ( 16) Siquijor ( 289) ( 1) ( 17) ( 10) ( 28) ( 23) ( 65) ( 60) ( 63) ( 22) - - -
Region 8 ( 5,737) ( 342) ( 475) ( 418) ( 581) ( 410) ( 274) ( 604) ( 463) ( 759) ( 473) ( 531) ( 405) Biliran ( 424) ( 34) ( 50) ( 38) ( 24) ( 45) ( 31) ( 34) ( 21) ( 7) ( 109) ( 24) ( 8) Leyte ( 466) ( 30) ( 14) ( 12) ( 32) ( 13) ( 128) ( 125) ( 10) ( 19) ( 7) ( 13) ( 63) Southern Leyte ( 4,847) ( 278) ( 411) ( 367) ( 525) ( 353) ( 115) ( 446) ( 433) ( 733) ( 357) ( 495) ( 334)
Region 9 ( 97,706) ( 12,124) ( 11,890) ( 8,061) ( 9,126) ( 9,608) ( 7,331) ( 7,369) ( 8,719) ( 9,526) ( 7,436) ( 2,891) ( 3,625) Zamboanga del Norte ( 94,160) ( 11,547) ( 11,418) ( 7,406) ( 8,280) ( 8,968) ( 6,975) ( 7,369) ( 8,719) ( 9,526) ( 7,436) ( 2,891) ( 3,625) Zamboanga Sibugay ( 3,546) ( 577) ( 471) ( 655) ( 846) ( 640) ( 356) - - - - - -
Region 10 ( 92,202) ( 7,700) ( 9,072) ( 9,994) ( 7,415) ( 11,468) ( 9,160) ( 5,974) ( 7,407) ( 3,301) ( 10,208) ( 6,503) ( 4,002) Bukidnon ( 40,268) ( 5,390) ( 6,366) ( 7,425) ( 3,219) ( 2,135) ( 1,536) ( 2,778) ( 4,814) ( 1,644) ( 1,809) ( 2,125) ( 1,026) Camiguin ( 266) ( 10) ( 29) ( 21) ( 30) ( 9) ( 39) ( 7) ( 32) ( 7) ( 17) ( 56) ( 11) Lanao del Norte ( 3,711) ( 243) ( 285) ( 248) ( 284) ( 280) ( 273) ( 171) ( 269) ( 325) ( 507) ( 521) ( 306) Misamis Occidental ( 40,591) ( 1,479) ( 1,644) ( 1,520) ( 3,882) ( 9,044) ( 7,311) ( 1,255) ( 1,302) ( 892) ( 6,770) ( 3,280) ( 2,211) Misamis Oriental ( 7,366) ( 579) ( 748) ( 780) - - - ( 1,764) ( 989) ( 433) ( 1,105) ( 522) ( 447)
3-02
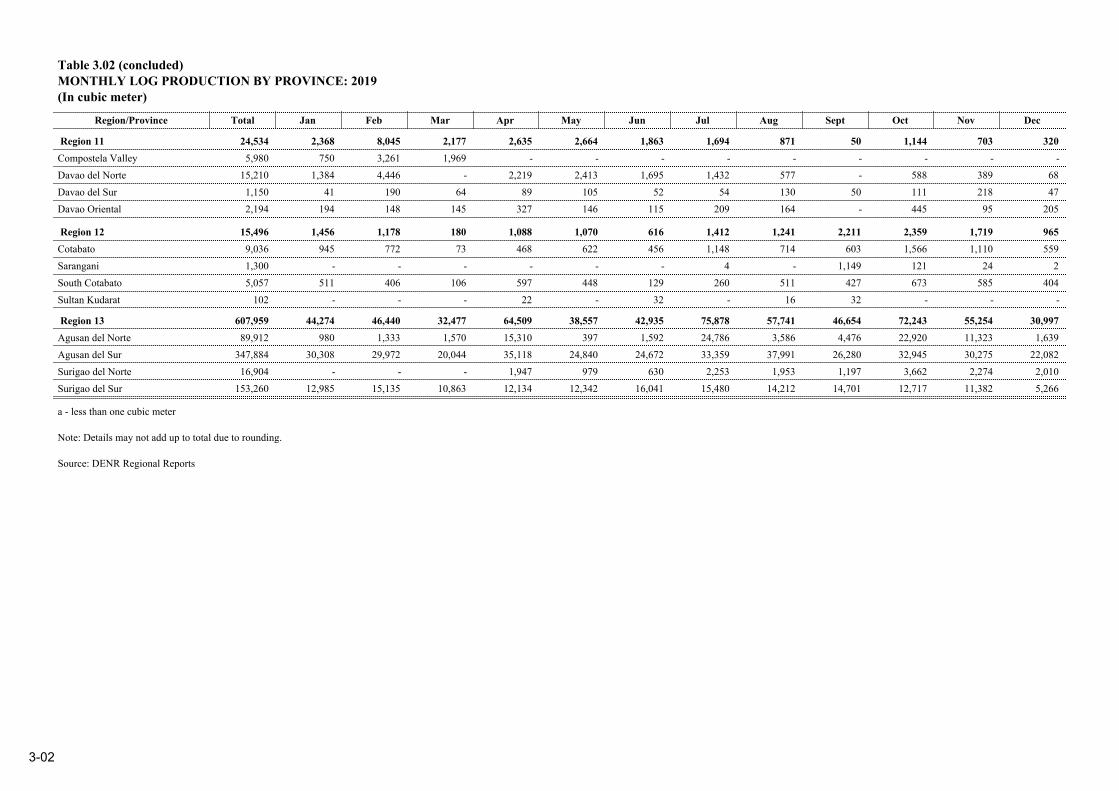
Table 3.02 (concluded)MONTHLY LOG PRODUCTION BY PROVINCE: 2019(In cubic meter)
Region/Province Total Jan Feb Mar Apr May Jun Jul Aug Sept Oct Nov Dec
Region 11 ( 24,534) ( 2,368) ( 8,045) ( 2,177) ( 2,635) ( 2,664) ( 1,863) ( 1,694) ( 871) ( 50) ( 1,144) ( 703) ( 320) Compostela Valley ( 5,980) ( 750) ( 3,261) ( 1,969) - - - - - - - - - Davao del Norte ( 15,210) ( 1,384) ( 4,446) - ( 2,219) ( 2,413) ( 1,695) ( 1,432) ( 577) - ( 588) ( 389) ( 68) Davao del Sur ( 1,150) ( 41) ( 190) ( 64) ( 89) ( 105) ( 52) ( 54) ( 130) ( 50) ( 111) ( 218) ( 47) Davao Oriental ( 2,194) ( 194) ( 148) ( 145) ( 327) ( 146) ( 115) ( 209) ( 164) - ( 445) ( 95) ( 205)
Region 12 ( 15,496) ( 1,456) ( 1,178) ( 180) ( 1,088) ( 1,070) ( 616) ( 1,412) ( 1,241) ( 2,211) ( 2,359) ( 1,719) ( 965) Cotabato ( 9,036) ( 945) ( 772) ( 73) ( 468) ( 622) ( 456) ( 1,148) ( 714) ( 603) ( 1,566) ( 1,110) ( 559) Sarangani ( 1,300) - - - - - - ( 4) - ( 1,149) ( 121) ( 24) ( 2) South Cotabato ( 5,057) ( 511) ( 406) ( 106) ( 597) ( 448) ( 129) ( 260) ( 511) ( 427) ( 673) ( 585) ( 404) Sultan Kudarat ( 102) - - - ( 22) - ( 32) - ( 16) ( 32) - - -
Region 13 ( 607,959) ( 44,274) ( 46,440) ( 32,477) ( 64,509) ( 38,557) ( 42,935) ( 75,878) ( 57,741) ( 46,654) ( 72,243) ( 55,254) ( 30,997) Agusan del Norte ( 89,912) ( 980) ( 1,333) ( 1,570) ( 15,310) ( 397) ( 1,592) ( 24,786) ( 3,586) ( 4,476) ( 22,920) ( 11,323) ( 1,639) Agusan del Sur ( 347,884) ( 30,308) ( 29,972) ( 20,044) ( 35,118) ( 24,840) ( 24,672) ( 33,359) ( 37,991) ( 26,280) ( 32,945) ( 30,275) ( 22,082) Surigao del Norte ( 16,904) - - - ( 1,947) ( 979) ( 630) ( 2,253) ( 1,953) ( 1,197) ( 3,662) ( 2,274) ( 2,010) Surigao del Sur ( 153,260) ( 12,985) ( 15,135) ( 10,863) ( 12,134) ( 12,342) ( 16,041) ( 15,480) ( 14,212) ( 14,701) ( 12,717) ( 11,382) ( 5,266)
a - less than one cubic meter
Note: Details may not add up to total due to rounding.
Source: DENR Regional Reports

3-03
Table 3.03LOG PRODUCTION BY TYPE OF PERMIT: 2019(In cubic meter)
Region Total IFMA CTPO/SMF/CV CSC/ISF PLTP/SPLTP TCP/STCP MRP
Total Naturally Grown Planted Planted Total Naturally
Grown Planted Planted Total Naturally Grown Planted Total Naturally
Grown Planted Planted
PHILIPPINES ( 948,104) ( 868) ( 947,236) ( 122,498) ( 818,427) ( 5) ( 818,423) ( 423) ( 781) ( 390) ( 392) ( 5,607) ( 474) ( 5,133) ( 368)
CAR ( 1,202) ( 419) ( 783) ( -) ( 97) ( -) ( 97) ( -) ( 23) ( 23) ( -) ( 714) ( 397) ( 318) ( 368) Region 1 ( 7,869) ( -) ( 7,869) ( -) ( 7,869) ( -) ( 7,869) ( -) ( -) ( -) ( -) ( -) ( -) ( -) Region 2 ( 1,458) ( 54) ( 1,404) ( -) ( -) ( -) ( -) ( -) ( -) ( -) ( -) ( 1,458) ( 54) ( 1,404) ( -) Region 3 ( 2,089) ( -) ( 2,089) ( -) ( 669) ( -) ( 669) ( -) ( -) ( -) ( -) ( 1,420) ( -) ( 1,420) ( -) Region 4A ( 42,757) ( -) ( 42,757) ( 31,350) ( 10,912) ( -) ( 10,912) ( -) ( -) ( -) ( -) ( 495) ( -) ( 495) ( -) MIMAROPA ( 10,706) ( 41) ( 10,664) ( -) ( 10,666) ( 3) ( 10,663) ( -) ( 36) ( 36) ( -) ( 4) ( 3) ( 1) ( -) Region 5 ( 784) ( 31) ( 753) ( -) ( 266) ( 266) ( -) ( 48) ( 28) ( 20) ( 470) ( 3) ( 467) ( -) Region 6 ( 20,555) a ( 20,555) ( 20,555) ( -) ( 20,555) ( -) a a ( -) ( -) ( -) ( -) ( -) Region 7 ( 17,050) ( -) ( 17,050) ( 17,049) ( -) ( 17,049) ( 1) ( -) ( -) ( -) ( -) ( -) ( -) Region 8 ( 5,737) ( 19) ( 5,718) ( -) ( 4,680) ( 2) ( 4,679) ( 5) ( 5) ( -) ( 5) ( 1,046) ( 17) ( 1,029) ( -) Region 9 ( 97,706) ( -) ( 97,706) ( 86,656) ( 11,027) ( -) ( 11,027) ( 23) ( -) ( -) ( -) ( -) ( -) ( -) ( -) Region 10 ( 92,202) ( -) ( 92,202) ( 92,202) ( -) ( 92,202) ( -) ( -) ( -) ( -) ( -) ( -) ( -) ( -) Region 11 ( 24,534) ( -) ( 24,534) ( -) ( 24,534) ( -) ( 24,534) ( -) ( -) ( -) ( -) ( -) ( -) ( -) ( -) Region 12 ( 15,496) ( -) ( 15,496) ( -) ( 15,496) ( -) ( 15,496) ( -) ( -) ( -) ( -) ( -) ( -) ( -) ( -) Region 13 ( 607,959) ( 303) ( 607,656) ( 4,492) ( 602,404) ( -) ( 602,404) ( 393) ( 670) ( 303) ( 367) ( -) ( -) ( -)
a - less than one cubic meter IFMA - Integrated Forest Management Agreement TCP/STCP -Tree Cutting Permit/ Special Tree Cutting PermitNote: Details may not add up to total due to rounding. CTPO - Certificate of Tree Plantation Ownership MRP - Muyong Resource Permit
CSC/ISF - Certificate of Stewardship Contract/Integrated Social ForestrySource: DENR Regional Reports PLTP/SPLTP - Private Land Timber Permit/ Special Private Land Timber Permit

3-04
Table 3.04LOG PRODUCTION BY END USE: 2019(In cubic meter)
Region Grand Total Total Sawlog/ Veneer Log Pulpwood Poles & Piles
Naturally Grown Planted Total Naturally
Grown Planted Planted Planted
PHILIPPINES ( 948,104) ( 868) ( 947,236) ( 736,377) ( 868) ( 735,509) ( 208,021) ( 3,706)
CAR ( 1,202) 419 ( 783) ( 1,202) ( 419) ¹/ ( 783) ( -) ( -) Region 1 ( 7,869) ( -) ( 7,869) ( 7,869) ( -) ( 7,869) ( -) ( -) Region 2 ( 1,458) ( 54) ( 1,404) ( 1,458) ( 54) ( 1,404) ( -) ( -) Region 3 ( 2,089) ( -) ( 2,089) ( 2,089) ( -) ( 2,089) ( -) ( -) Region 4A ( 42,757) ( -) ( 42,757) ( 42,757) ( -) ( 42,757) ( -) ( -) MIMAROPA ( 10,706) ( 41) ( 10,664) ( 10,706) ( 41) ²/ ( 10,664) ( -) ( -) Region 5 ( 784) ( 31) ( 753) ( 757) ( 31) ²/ ( 726) ( -) ( 27) Region 6 ( 20,555) ( -) ( 20,555) ( 18,681) ( -) ( 18,681) ( -) ( 1,873) Region 7 ( 17,050) ( -) ( 17,050) ( 16,233) ( -) ( 16,233) ( -) ( 817) Region 8 ( 5,737) ( 19) ( 5,718) ( 5,737) ( 19) ²/ ( 5,718) ( -) ( -) Region 9 ( 97,706) ( -) ( 97,706) ( 97,678) ( -) ( 97,678) ( -) ( 28) Region 10 ( 92,202) ( -) ( 92,202) ( 91,424) ( -) ( 91,424) ( 778) ( -) Region 11 ( 24,534) ( -) ( 24,534) ( 23,630) ( -) ( 23,630) ( 904) Region 12 ( 15,496) ( -) ( 15,496) ( 15,439) ( -) ( 15,439) ( -) ( 56) Region 13 ( 607,959) 303 ( 607,656) ( 400,717) ( 303) ²/ ( 400,413) ( 207,243) ( -)
¹/ coniferous species²/ cut within private lands and subjected to clearance/permit issued by the Office of the Undersecretary for Field Operations.
Note: Details may not add up to total due to rounding.
Source: DENR Regional Reports

3.05
Table 3.05LOG PRODUCTION BY SPECIES: 2019(In cubic meter)
Region Total Falcata Mangium Mahogany Yemane Bagras Para Rubber Acacia Ipil-ipil
Others (Paraserianthes falcataria)
(Acacia mangium)
(Swietenia macrophylla)
(Gmelina arborea)
(Eucalyptus deglupta)
(Hevea brasiliensis)
(Samanea saman)
(Leucaena leucocephala)
PHILIPPINES ( 948,104) ( 632,574) ( 118,758) ( 76,891) ( 62,279) ( 16,354) ( 11,928) ( 3,436) ( 2,507) ( 23,376)
CAR ( 1,202) ( 9) - ( 48) ( 361) - - ( 40) ( 7) ( 737) Region 1 ( 7,869) - - ( 2,395) ( 1,963) - - ( 1,641) ( 10) ( 1,860) Region 2 ( 1,458) - ( 65) ( 1) ( 1,323) - - ( 43) ( 7) ( 19) Region 3 ( 2,089) - - ( 62) ( 80) - - ( 144) ( 30) ( 1,772) Region 4A ( 42,757) - ( 15,675) ( 6,891) ( 2,455) ( 15,675) - ( 374) ( 351) ( 1,336) MIMAROPA ( 10,706) ( 891) ( 5,835) ( 1,600) ( 1,997) - - ( 86) ( 34) ( 264) Region 5 ( 784) - - ( 196) ( 54) - - ( 8) ( 526) Region 6 ( 20,555) - ( 4,580) ( 12,209) ( 2,682) - - ( 140) ( 31) ( 912) Region 7 ( 17,050) ( 56) ( 254) ( 15,356) ( 1,188) ( 50) - ( 7) ( 10) ( 130) Region 8 ( 5,737) ( 21) ( 140) ( 2,687) ( 1,507) ( 17) - ( 238) ( 93) ( 1,035) Region 9 ( 97,706) ( 1,667) ( 60,471) ( 9,041) ( 19,862) ( 430) ( 5,614) - - ( 621) Region 10 ( 92,202) ( 52,409) ( 2,815) ( 20,953) ( 3,362) ( 83) ( 4,618) ( 45) ( 7,917) Region 11 ( 24,534) ( 18,057) ( 1,482) ( 262) ( 2,655) ( 36) - ( 12) ( 276) ( 1,754) Region 12 ( 15,496) ( 3,499) ( 23) ( 960) ( 7,541) ( 3) ( 254) ( 657) ( 1,658) ( 900) Region 13 ( 607,959) ( 555,966) ( 27,417) ( 4,230) ( 15,250) ( 60) ( 1,443) - - ( 3,594)
Note: Details may not add up to total due to rounding.
Source: DENR Regional Reports
3-06
Table 3.06PRODUCTION OF PROCESSED WOOD PRODUCTS: 1999-2019(In thousand cubic meter)
Year Lumber Veneer ¹/ Plywood Fiberboard Blockboard
2019 246 285 210 6 922018 370 213 189 10 902017 360 42 175 5 882016 425 59 152 6 59
2015 322 40 146 54 872014 496 60 164 22 492013 450 270 199 13 582012 218 129 297 5 222011 372 114 300 2 42
2010 377 136 276 5 372009 304 88 253 12 422008 358 101 235 1 422007 362 124 281 6 562006 432 95 317 5 62
2005 288 133 314 8 622004 339 180 386 .. 552003 246 152 351 7 592002 163 172 360 4 452001 197 135 292 5 54
2000 151 178 286 .. 401999 288 89 244 .. 25
¹/ Includes veneer used for plywood and excludes imported log input (2018 onwards)
Source : DENR Regional Reports

3-07
Table 3.07MONTHLY LUMBER PRODUCTION BY PROVINCE: 2019(In cubic meter)
Region/Province Total Jan Feb Mar Apr May Jun Jul Aug Sept Oct Nov Dec
PHILIPPINES ( 246,293) ( 24,714) ( 14,683) ( 13,781) ( 12,745) ( 11,291) ( 12,458) ( 35,174) ( 27,258) ( 23,291) ( 30,250) ( 29,197) ( 11,451)
CAR ( 677) ( 13) ( 34) ( 90) ( 24) ( 79) ( 10) ( 40) ( 39) ( 180) ( 46) ( 92) ( 29) Abra ( 148) ( -) ( -) ( -) ( -) ( -) ( -) a ( 3) ( 127) ( 7) ( 6) ( 4) Apayao ( 6) ( -) ( -) ( -) ( -) ( -) ( -) ( -) ( 6) ( -) ( -) ( -) ( -) Benguet ( 256) ( 5) ( 7) ( 76) ( 7) ( 20) ( 2) ( 25) ( 26) ( 19) ( 17) ( 41) ( 12) Ifugao ( 267) ( 8) ( 27) ( 14) ( 17) ( 59) ( 8) ( 15) ( 5) ( 34) ( 23) ( 45) ( 13)
Region 1 ( 2,478) ( 237) ( 257) ( 258) ( 177) ( 93) ( 184) ( 254) ( 245) ( 197) ( 209) ( 107) ( 261) La Union ( 371) a ( 84) ( 47) ( -) ( -) ( -) ( 55) ( 66) ( 25) ( 35) ( 39) ( 19) Pangasinan ( 2,107) ( 237) ( 173) ( 211) ( 177) ( 93) ( 184) ( 199) ( 178) ( 171) ( 174) ( 69) ( 242)
Region 2 ( 192) ( - ) ( - ) ( - ) ( 53) ( - ) ( 1) ( 113) ( 4) ( - ) ( 18) ( 2) a Cagayan ( 6) ( -) ( -) ( -) ( 3) ( -) ( 3) ( -) ( -) ( -) ( -) ( -) Isabela ( 21) ( -) ( -) ( -) ( -) ( -) ( -) ( -) ( -) ( -) ( 18) ( 2) a Nueva Vizcaya ( 165) ( -) ( -) ( -) ( 50) ( -) ( 1) ( 110) ( 4) ( -) ( -) ( -) ( -)
MIMAROPA ( 59) ( 6) ( 6) ( - ) ( - ) ( 4) ( 29) ( - ) ( - ) ( - ) ( - ) ( - ) ( 15) Palawan ( 16) ( 6) ( 6) ( -) ( -) ( 4) ( -) ( -) ( -) ( -) ( -) ( -) ( -) Romblon ( 44) ( -) ( -) ( -) ( -) ( -) ( 29) ( -) ( -) ( -) ( -) ( -) ( 15)
Region 5 ( 2,590) ( 233) ( 267) ( 70) ( 175) ( 216) ( 127) ( 375) ( 283) ( 324) ( 196) ( 154) ( 171) Albay ( 75) ( 1) ( 5) a ( 1) ( 4) ( 18) ( 17) ( 7) ( 9) a ( 11) ( 1) Camarines Norte ( 1,760) ( 108) ( 150) ( -) ( 135) ( 188) ( 64) ( 295) ( 205) ( 238) ( 151) ( 123) ( 102) Camarines Sur ( 336) ( -) ( 20) ( 68) ( 30) ( 23) ( 35) ( 48) ( 22) ( 29) ( 39) ( 1) ( 19) Masbate ( 52) ( -) ( 2) ( -) ( -) ( 1) ( -) a a ( 35) ( 3) ( -) ( 11) Sorsogon ( 344) ( 124) ( 91) ( 1) ( 8) ( -) ( 9) ( 15) ( 48) ( 13) ( 3) ( 19) ( 14) Catanduanes ( 23) ( -) ( -) ( -) ( -) ( -) ( -) ( -) ( -) ( -) ( -) ( -) ( 23)
Region 6 ( 11,247) ( 882) ( 896) ( 862) ( 844) ( 694) ( 1,308) ( 1,317) ( 1,091) ( 1,002) ( 745) ( 764) ( 842) Aklan ( 290) ( 24) ( 16) ( 56) ( 12) ( 13) ( 24) ( 63) ( 31) ( 20) ( 25) ( 3) ( 4) Antique ( 1,061) ( 29) ( 73) ( 134) ( 94) ( 63) ( 68) ( 138) ( 78) ( 65) ( 48) ( 179) ( 92) Capiz ( 428) ( 2) ( 97) ( 28) ( 28) ( 30) ( 25) ( 48) ( 24) ( 43) ( 32) ( 24) ( 47) Guimaras ( 3,565) ( 353) ( 164) ( 472) ( 182) ( 146) ( 475) ( 336) ( 221) ( 297) ( 209) ( 252) ( 458) Iloilo ( 2,980) ( 289) ( 382) ( 49) ( 378) ( 335) ( 328) ( 238) ( 303) ( 253) ( 269) ( 96) ( 60) Negros Occidental ( 2,924) ( 185) ( 163) ( 123) ( 150) ( 107) ( 388) ( 495) ( 435) ( 324) ( 163) ( 210) ( 181)

3-07
Table 3.07 (concluded)MONTHLY LUMBER PRODUCTION BY PROVINCE: 2019(In cubic meter)
Region/Province Total Jan Feb Mar Apr May Jun Jul Aug Sept Oct Nov Dec
Region 7 ( 18,856) ( 1,244) ( 1,543) ( 1,689) ( 1,525) ( 1,427) ( 1,073) ( 1,471) ( 1,556) ( 2,089) ( 1,609) ( 2,056) ( 1,575) Bohol ( 9,834) ( 773) ( 834) ( 958) ( 621) ( 614) ( 426) ( 696) ( 869) ( 866) ( 805) ( 1,206) ( 1,166) Cebu ( 2,462) ( 136) ( 150) ( 189) ( 210) ( 190) ( 162) ( 206) ( 297) ( 196) ( 228) ( 300) ( 198) Negros Oriental ( 6,185) ( 333) ( 542) ( 532) ( 666) ( 600) ( 409) ( 510) ( 326) ( 1,005) ( 542) ( 520) ( 199) Siquijor ( 375) ( 1) ( 17) ( 10) ( 28) ( 23) ( 76) ( 60) ( 63) ( 22) ( 34) ( 30) ( 12)
Region 9 ( 4,515) ( 330) ( 483) ( 147) ( 305) ( 499) ( 396) ( 634) ( 524) ( 372) ( 446) ( 100) ( 278) Zamboanga del Norte ( 4,002) ( 330) ( 483) ( 147) ( 230) ( 437) ( 20) ( 634) ( 524) ( 372) ( 446) ( 100) ( 278) Zamboanga City ( 513) ( -) ( -) ( -) ( 75) ( 62) ( 377) ( -) ( -) ( -) ( -) ( -) ( -)
Region 10 ( 115,503) ( 12,268) ( 5,107) ( 3,002) ( 843) ( 759) ( 803) ( 23,008) ( 15,036) ( 12,370) ( 18,796) ( 19,152) ( 4,358) Bukidnon ( 2,992) ( -) ( -) ( -) ( 299) ( 472) ( 384) ( 401) ( 370) ( 236) ( 375) ( 251) ( 204) Lanao del Norte ( 253) ( 46) ( 42) ( 48) ( 51) ( 24) ( -) ( 42) ( -) ( -) ( -) ( -) ( -) Misamis Occidental ( 5,286) ( 484) ( 519) ( 646) ( 493) ( 263) ( 420) ( 490) ( 490) ( 366) ( 413) ( 416) ( 285) Misamis Oriental ( 106,972) ( 11,737) ( 4,546) ( 2,307) ( -) ( -) ( -) ( 22,075) ( 14,177) ( 11,768) ( 18,009) ( 18,485) ( 3,868)
Region 11 ( 12,982) ( 1,176) ( 1,946) ( 575) ( 946) ( 1,174) ( 1,157) ( 503) ( 655) ( 796) ( 907) ( 1,346) ( 1,802) Compostela Valley ( 8,284) ( 854) ( 1,613) ( 188) ( 296) ( 702) ( 734) ( -) ( 490) ( 586) ( 556) ( 751) ( 1,515) Davao del Norte ( 2,756) ( 221) ( 246) ( 336) ( 384) ( 262) ( 250) ( 413) ( 165) ( -) ( 237) ( 206) ( 37) Davao del Sur ( 1,847) ( 90) ( 62) ( 39) ( 241) ( 210) ( 174) ( 68) ( -) ( 211) ( 114) ( 390) ( 250) Davao Oriental ( 94) ( 11) ( 25) ( 13) ( 25) ( -) ( -) ( 22) ( -) ( -) ( -) ( -) ( -)
Region 12 ( 3,330) ( 418) ( 260) ( 194) ( 463) ( 178) ( 247) ( 424) ( 296) ( 93) ( 464) ( 192) ( 101) Cotabato ( 3,081) ( 377) ( 229) ( 184) ( 435) ( 174) ( 227) ( 410) ( 272) ( 70) ( 450) ( 173) ( 81) Sarangani ( 104) ( 4) ( 31) ( 10) ( 6) ( 4) ( 6) ( 10) ( 6) ( -) ( -) ( 11) ( 17) Sultan Kudarat ( 144) ( 37) ( -) ( -) ( 23) ( -) ( 14) ( 5) ( 17) ( 23) ( 14) ( 8) ( 3)
Region 13 ( 73,863) ( 7,907) ( 3,884) ( 6,895) ( 7,389) ( 6,169) ( 7,123) ( 7,035) ( 7,529) ( 5,868) ( 6,813) ( 5,231) ( 2,019) Agusan del Norte ( 64,160) ( 6,989) ( 3,209) ( 6,252) ( 6,551) ( 5,208) ( 6,542) ( 6,245) ( 6,527) ( 4,977) ( 5,818) ( 4,236) ( 1,605) Agusan del Sur ( 8,893) ( 823) ( 593) ( 608) ( 718) ( 905) ( 491) ( 707) ( 930) ( 890) ( 877) ( 950) ( 399) Surigao del Sur ( 811) ( 95) ( 82) ( 35) ( 120) ( 55) ( 90) ( 83) ( 73) ( -) ( 117) ( 45) ( 15)
a - less than one cubic meter
Note: Details may not add up to total due to rounding.
Source: DENR Regional Reports

3-08
Table 3.08LUMBER PRODUCTION BY TYPE OF SAMILL AND BY PROVINCE: 2019(In cubic meter)
Region/Province Total Type of Sawmil
Regular Mini Others ¹/
PHILIPPINES ( 246,293) ( 1,852) ( 92,069) ( 152,372)
CAR ( 677) ( -) ( -) ( 677) Abra ( 148) ( -) ( -) ( 148) Apayao ( 6) ( -) ( -) ( 6) Benguet ( 256) ( -) ( -) ( 256) Ifugao ( 267) ( -) ( -) ( 267)
Region 1 ( 2,478) ( -) ( -) ( 2,478) La Union ( 371) ( -) ( -) ( 371) Pangasinan ( 2,107) ( -) ( -) ( 2,107)
Region 2 ( 192) ( -) ( -) ( 192) Cagayan ( 6) ( -) ( -) ( 6) Isabela ( 21) ( -) ( -) ( 21) Nueva Vizcaya ( 165) ( -) ( -) ( 165)
MIMAROPA ( 59) ( -) ( -) ( 59) Palawan ( 16) ( -) ( -) ( 16) Romblon ( 44) ( -) ( -) ( 44)
Region 5 ( 2,590) ( -) ( -) ( 2,590) Albay ( 75) ( -) ( -) ( 75) Camarines Norte ( 1,760) ( -) ( -) ( 1,760) Camarines Sur ( 336) ( -) ( -) ( 336) Masbate ( 52) ( -) ( -) ( 52) Sorsogon ( 344) ( -) ( -) ( 344) Catanduanes ( 23) ( -) ( -) ( 23)
Region 6 ( 11,247) ( -) ( -) ( 11,247) Aklan ( 290) ( -) ( -) ( 290) Antique ( 1,061) ( -) ( -) ( 1,061) Capiz ( 428) ( -) ( -) ( 428) Guimaras ( 3,565) ( -) ( -) ( 3,565) Iloilo ( 2,980) ( -) ( -) ( 2,980) Negros Occidental ( 2,924) ( -) ( -) ( 2,924)

3-08
Table 3.08 (concluded)LUMBER PRODUCTION BY TYPE OF SAWMILL AND BY PROVINCE: 2019(In cubic meter)
Region/Province Total Type of Sawmil
Regular Mini Others ¹/
Region 7 ( 18,856) ( -) ( -) ( 18,856) Bohol ( 9,834) ( -) ( -) ( 9,834) Cebu ( 2,462) ( -) ( -) ( 2,462) Negros Oriental ( 6,185) ( -) ( -) ( 6,185) Siquijor ( 375) ( -) ( -) ( 375)
Region 9 ( 4,515) ( 874) ( 2,017) ( 1,623) Zamboanga del Norte ( 4,002) ( 874) ( 2,017) ( 1,110) Zamboanga City ( 513) ( -) ( -) ( 513)
Region 10 ( 115,503) ( -) ( 71,858) ( 43,645) Bukidnon ( 2,992) - - ( 2,992) Lanao del Norte ( 253) - - ( 253) Misamis Occidental ( 5,286) - ( 2,836) ( 2,449) Misamis Oriental ( 106,972) - ( 69,022) ( 37,950)
Region 11 ( 12,982) ( -) ( 7,907) ( 5,075) Compostela Valley ( 8,284) ( -) ( 4,497) ( 3,787) Davao del Norte ( 2,756) ( -) ( 2,289) ( 467) Davao del Sur ( 1,847) ( -) ( 1,026) ( 821) Davao Oriental ( 94) ( -) ( 94) ( - )
Region 12 ( 3,330) ( -) ( 1,430) ( 1,900) Cotabato ( 3,081) ( -) ( 1,430) ( 1,651) Sarangani ( 104) ( -) - ( 104) Sultan Kudarat ( 144) ( -) ( 144)
Region 13 ( 73,863) ( 978) ( 8,856) ( 64,029) Agusan del Norte ( 64,160) ( -) ( 6,068) ( 58,092) Agusan del Sur ( 8,893) ( 978) ( 2,788) ( 5,126) Surigao del Sur ( 811) ( -) ( -) ( 811)
¹/ Individual PermitteeNote: Details may not add up to total due to rounding.
Source: DENR Regional Reports

3-09
Table 3.09MONTHLY VENEER PRODUCTION BY PROVINCE: 2019(In cubic meter)
Region/Province Total Jan Feb Mar Apr May Jun Jul Aug Sept Oct Nov Dec
PHILIPPINES ( 284,701) ( 31,117) ( 24,244) ( 26,199) ( 24,627) ( 24,153) ( 22,000) ( 25,051) ( 28,234) ( 20,723) ( 27,797) ( 18,437) ( 12,119)
Region 9 ( 39,726) ( 8,984) ( 4,447) ( 4,295) ( 3,935) ( 1,838) ( 2,749) ( 2,310) ( 1,793) ( 2,625) ( 4,866) ( -) ( 1,884) Zamboanga Sibugay ( 39,726) ( 8,984) ( 4,447) ( 4,295) ( 3,935) ( 1,838) ( 2,749) ( 2,310) ( 1,793) ( 2,625) ( 4,866) - ( 1,884)
Region 10 ( 16,161) ( 2,051) ( 916) ( 1,070) ( 1,171) ( 1,247) ( 880) ( 1,572) ( 1,697) ( 1,646) ( 1,649) ( 1,224) ( 1,038) Lanao del Norte ( 2,196) - - - ( 318) ( 251) - ( 266) ( 298) ( 349) ( 301) ( 183) ( 230) Misamis Occidental ( 13,258) ( 1,344) ( 916) ( 1,070) ( 854) ( 996) ( 880) ( 1,306) ( 1,399) ( 1,298) ( 1,348) ( 1,040) ( 808) Misamis Oriental ( 707) ( 707) - - - - - - - - - - -
Region 11 ( 9,709) ( 672) ( 1,238) ( 1,806) ( 1,476) ( 1,594) ( 1,144) ( 795) ( 345) ( 281) ( 248) ( 90) ( 18) Compostela Valley ( 94) ( 31) ( 31) ( 31) - - - - - - - - - Davao del Norte ( 9,615) ( 641) ( 1,207) ( 1,775) ( 1,476) ( 1,594) ( 1,144) ( 795) ( 345) ( 281) ( 248) ( 90) ( 18)
Region 12 ( 1,531) ( 201) ( 125) ( 99) ( 75) ( 280) ( 47) ( 75) ( 160) ( 75) ( 124) ( 272) ( -) Cotabato ( 1,531) ( 201) ( 125) ( 99) ( 75) ( 280) ( 47) ( 75) ( 160) ( 75) ( 124) ( 272) -
Region 13 ( 217,575) ( 19,208) ( 17,518) ( 18,929) ( 17,970) ( 19,193) ( 17,180) ( 20,299) ( 24,240) ( 16,095) ( 20,911) ( 16,852) ( 9,179) Agusan del Norte ( 180,758) ( 16,534) ( 13,857) ( 15,611) ( 15,618) ( 16,732) ( 14,652) ( 16,409) ( 19,842) ( 12,870) ( 17,190) ( 14,170) ( 7,273) Agusan del Sur ( 32,114) ( 2,139) ( 3,048) ( 2,818) ( 2,059) ( 2,203) ( 1,999) ( 2,863) ( 3,463) ( 3,212) ( 3,721) ( 2,682) ( 1,905) Surigao del Sur ( 4,703) ( 535) ( 614) ( 500) ( 293) ( 259) ( 529) ( 1,026) ( 934) ( 14) - - -
Note: Volume of actual veneer production (including veneer sheets used for plywood) except for imported log input. Details may not add up to total due to rounding.
Source: DENR Regional Reports

3-10
Table 3.10MONTHLY PLYWOOD PRODUCTION BY PROVINCE: 2019(In cubic meter)
Region/Province Total Jan Feb Mar Apr May Jun Jul Aug Sept Oct Nov Dec
PHILIPPINES ( 209,563) ( 21,604) ( 20,138) ( 20,906) ( 17,913) ( 17,428) ( 16,242) ( 17,722) ( 18,391) ( 13,308) ( 17,634) ( 14,774) ( 13,505)
Region 9 ( 31,218) ( 4,066) ( 673) ( 3,200) ( 2,077) ( 2,319) ( 2,140) ( 1,631) ( 1,879) ( 1,489) ( 3,589) ( 670) ( 7,486) Zamboanga Sibugay ( 31,218) ( 4,066) ( 673) ( 3,200) ( 2,077) ( 2,319) ( 2,140) ( 1,631) ( 1,879) ( 1,489) ( 3,589) ( 670) ( 7,486)
Region 10 ( 11,603) ( 1,877) ( 1,133) ( 1,253) ( 709) ( 783) ( 675) ( 926) ( 970) ( 1,001) ( 475) ( 1,019) ( 781) Bukidnon ( 238) - - - - - - ( 90) ( 58) ( 90) - - - Misamis Occidental ( 9,470) ( 885) ( 609) ( 874) ( 709) ( 783) ( 675) ( 836) ( 912) ( 912) ( 475) ( 1,019) ( 781) Misamis Oriental ( 1,895) ( 992) ( 524) ( 379) - - - - - - - - -
Region 11 ( 8,477) ( 428) ( 742) ( 1,322) ( 1,341) ( 1,450) ( 996) ( 1,366) ( 328) ( 269) ( 235) ( -) ( -) Davao del Norte ( 8,477) ( 428) ( 742) ( 1,322) ( 1,341) ( 1,450) ( 996) ( 1,366) ( 328) ( 269) ( 235) - -
Region 13 ( 158,265) ( 15,232) ( 17,590) ( 15,131) ( 13,785) ( 12,876) ( 12,431) ( 13,799) ( 15,215) ( 10,548) ( 13,335) ( 13,085) ( 5,238) Agusan del Norte ( 153,632) ( 13,957) ( 16,656) ( 14,701) ( 13,490) ( 12,617) ( 11,986) ( 13,285) ( 14,764) ( 10,519) ( 13,335) ( 13,085) ( 5,238) Agusan del Sur ( 974) ( 520) ( 266) ( 188) - - - - - - - - - Surigao del Sur ( 3,659) ( 756) ( 669) ( 243) ( 295) ( 259) ( 445) ( 513) ( 451) ( 29) - - -
Note: Excluding imported veneer input. Details may not add up to total due to rounding.
Source: DENR Regional Reports

3-11
Table 3.11PRODUCTION OF NON-TIMBER FOREST PRODUCTS: 1999-2019(In thousands)
YearAlmaciga
Resin(kilogram)
Anahaw Leaves(piece)
Anahaw Poles(piece)
BambooPoles
(piece)
Buri Midribs
(kilogram)
Hingiw(kilogram)
Nipa Leaves(piece)
Nipa Shingles(piece)
Diliman & Other Vines
(piece)
Salago Fiber
(kilogram)
Split Rattan
(kilogram)
Unsplit Rattan
(lineal meter)
2019 740 70 27 1,637 80 - - 3,249 - 259 414 3,2292018 204 48 18 1,195 40 - - 7,186 - 288 170 3,8352017 205 166 13 998 60 - - 7,846 - 349 123 1,7682016 686 71 23 883 60 - - 7,722 - 382 188 2,381
2015 445 118 35 1,097 - - - 6,330 - 513 57 3,5122014 407 171 32 1,136 - - 64 4,341 - 496 129 2,4652013 509 37 17 1,428 - - 37 8,317 - 503 141 2,5242012 672 49 26 1,143 15 - 60 11,224 - 479 182 2,7112011 678 146 25 1,101 23 - 377 14,248 2 664 35 4,515
2010 599 372 30 929 31 - 509 13,276 1 323 3 3,7572009 525 153 29 988 8 - 596 15,938 39 457 34 3,1022008 248 196 34 872 10 - 672 13,161 3 489 18 5,1512007 255 303 41 1,528 - - 560 17,150 65 530 14 4,8862006 168 155 21 979 3 - 248 11,869 40 531 5 9,773
2005 51 133 306 865 1 - 4 10,340 56 495 13 12,9702004 368 100 43 204 - 1,872 - 10,036 2 721 17 16,0742003 292 54 16 293 12 4 - 11,880 46 592 1 9,0792002 521 94 4 417 48 - - 11,099 68 663 - 6,6412001 520 121 8 537 78 - - 12,093 64 788 25 8,767
2000 518 29 17 2,335 11 - - 11,065 54 695 97 32,3361999 298 293 - 985 - - - 12,745 48 749 48 15,552
Source: DENR Regional Reports; Philippine Fiber Industry Development Authority (PhilFIDA)/ Salago Fiber

3-12
Table 3.12PRODUCTION OF SELECTED NON-TIMBER FOREST PRODUCTS BY REGION: 2019
Region/Province Almaciga Resin(kilogram)
Anahaw Leaves(piece)
Anahaw Poles(piece)
Bamboo Poles(piece)
Buri Midribs(kilogram)
Nipa Shingles(piece)
Salago Fiber(kilogram)
Split Rattan(kilogram)
Unsplit Rattan(lineal meter)
PHILIPPINES ( 739,963) ( 69,800) ( 27,453) ( 1,636,978) ( 80,000) ( 3,249,450) ( 259,100) ( 414,146) ( 3,228,824)
CAR ( -) ( -) ( -) ( 15,609) ( -) ( -) ( -) ( -) ( -) Abra ( -) ( -) ( -) ( 7,743) ( -) ( -) ( -) ( -) ( -) Benguet ( -) ( -) ( -) ( 3,067) ( -) ( -) ( -) ( -) ( -) Ifugao ( -) ( -) ( -) ( 3,904) ( -) ( -) ( -) ( -) ( -) Kalinga ( -) ( -) ( -) ( 895) ( -) ( -) ( -) ( -) ( -)
Region 1 ( -) ( -) ( 4) ( 1,138,474) ( -) ( -) ( -) ( -) ( -) Ilocos Norte ( -) ( -) ( -) ( 283) ( -) ( -) ( -) ( -) ( -) Ilocos Sur ( -) ( -) ( -) ( 1,263) ( -) ( -) ( -) ( -) ( -) La Union ( -) ( -) ( 4) ( 53,968) ( -) ( -) ( -) ( -) ( -) Pangasinan ( -) ( -) - ( 1,082,960) ( -) ( -) ( -) ( -) ( -)
Region 2 ( -) ( -) ( -) ( 850) ( -) ( 115,000) ( -) ( -) ( 107,500) Cagayan ( -) ( -) ( -) ( -) ( -) ( 115,000) ( -) ( -) ( 100,000) Isabela - - - ( 500) - - - - - Nueva Vizcaya ( -) ( -) ( -) ( 350) ( -) ( -) ( -) ( -) ( 7,500)
Region 3 ( -) ( -) ( -) ( 204,307) ( -) ( -) ( -) ( -) ( -) Tarlac ( -) ( -) ( -) ( 204,307) ( -) ( -) ( -) ( -) ( -)
Region 4A ( -) ( 16,000) ( 13,780) ( 78,780) ( -) ( 532,000) ( -) ( -) ( 103,000) Batangas ( -) ( -) ( -) ( 7,930) ( -) ( -) ( -) ( -) ( -) Laguna ( -) ( -) ( 8,440) ( 18,730) ( -) ( -) ( -) ( -) ( -) Quezon ( -) ( 16,000) ( 5,340) ( 43,770) ( -) ( 532,000) ( -) ( -) ( 103,000) Rizal ( -) ( -) ( -) ( 8,350) ( -) ( -) ( -) ( -) ( -)
MIMAROPA ( 739,963) ( -) ( -) ( 20,420) ( 80,000) ( -) ( -) ( -) ( 2,120,133) Oriental Mindoro ( -) ( -) ( -) ( 20,240) ( 80,000) ( -) ( -) ( -) ( 72,300) Palawan ( 739,963) ( -) ( -) ( 180) ( -) ( -) ( -) ( -) ( 2,047,833)
Region 5 ( -) ( 53,800) ( 13,669) ( 16,609) ( -) ( 477,000) ( -) ( -) ( 47,100) Albay ( -) - ( -) ( 1,598) ( -) ( -) ( -) ( -) ( -) Camarines Norte ( -) ( 12,500) ( 13,055) ( 3,419) ( -) ( -) ( -) ( -) ( 34,600) Camarines Sur ( -) ( 5,000) ( 350) ( 11,592) ( -) ( 138,000) ( -) ( -) ( -) Catanduanes ( -) ( -) ( -) ( -) ( -) ( -) ( -) ( -) ( 12,500) Masbate ( -) ( 31,300) ( -) ( -) ( -) ( -) ( -) ( -) ( -) Sorsogon ( -) ( 5,000) ( 264) - ( -) ( 339,000) ( -) ( -) ( -)

3-12
Table 3.12 (concluded)PRODUCTION OF SELECTED NON-TIMBER FOREST PRODUCTS BY REGION: 2019
Region/Province Almaciga Resin(kilogram)
Anahaw Leaves(piece)
Anahaw Poles(piece)
Bamboo Poles(piece)
Buri Midribs(kilogram)
Nipa Shingles(piece)
Salago Fiber(kilogram)
Split Rattan(kilogram)
Unsplit Rattan(lineal meter)
Region 6 ( -) ( -) ( -) ( -) ( -) ( 1,800,700) ( 60,420) ( -) ( -) Aklan ( -) ( -) ( -) ( -) ( -) ( 9,700) - ( -) ( -) Capiz ( -) ( -) ( -) ( -) ( -) ( 1,791,000) - ( -) ( -) Negros Occidental ( -) ( -) ( -) ( -) ( -) - ( 60,420) ( -) ( -)
Region 7 ( -) ( -) ( -) ( 39,670) ( -) ( -) ( 198,680) ( -) ( -) Bohol ( -) ( -) ( -) ( 16,858) ( -) - - ( -) ( -) Cebu ( -) ( -) ( -) ( 22,812) ( -) - ( 111,530) ( -) ( -) Negros Oriental - - - - - - ( 83,520) - ( -) Siquijor - ( -) ( -) - ( -) - ( 3,630) ( -) ( -)
Region 9 ( -) ( -) ( -) ( -) ( -) ( 324,750) ( -) ( -) ( -) Zamboanga Peninsula ( -) ( -) ( -) - ( -) ( 324,750) ( -) ( -) ( -)
Region 10 ( -) ( -) ( -) ( 32,260) ( -) ( -) ( -) ( -) ( 116,900) Bukidnon ( -) ( -) ( -) ( 32,260) ( -) ( -) ( -) ( -) ( -) Lanao del Norte ( -) ( -) ( -) ( -) ( -) ( -) ( -) ( -) ( 77,200) Misamis Oriental ( -) ( -) ( -) ( -) ( -) ( -) ( -) ( -) ( 39,700)
Region 11 ( -) ( -) ( -) ( 9,300) ( -) ( -) ( -) ( -) ( 100,566) Compostela Valley ( -) ( -) ( -) ( 8,100) ( -) ( -) ( -) ( -) ( -) Davao del Norte ( -) ( -) ( -) ( -) ( -) ( -) ( -) ( -) ( 100,566) Davao del Sur ( -) ( -) ( -) ( 1,200) ( -) ( -) ( -) ( -) -
Region 12 ( -) ( -) ( -) ( 80,699) ( -) ( -) ( -) ( -) ( -) Cotabato ( -) ( -) ( -) ( 7,300) ( -) ( -) ( -) ( -) ( -) Sarangani ( -) ( -) ( -) ( 454) ( -) - ( -) ( -) ( -) South Cotabato ( -) ( -) ( -) ( 71,605) ( -) ( -) ( -) ( -) ( -) Sultan Kudarat ( -) ( -) ( -) ( 1,340) ( -) ( -) ( -) ( -) ( -)
Region 13 ( -) ( -) ( -) ( -) ( -) ( -) ( -) ( 414,146) ( 633,625) Agusan del Sur ( -) ( -) ( -) ( -) ( -) ( -) ( -) ( 414,146) ( 633,625)
Source: DENR Regional Reports

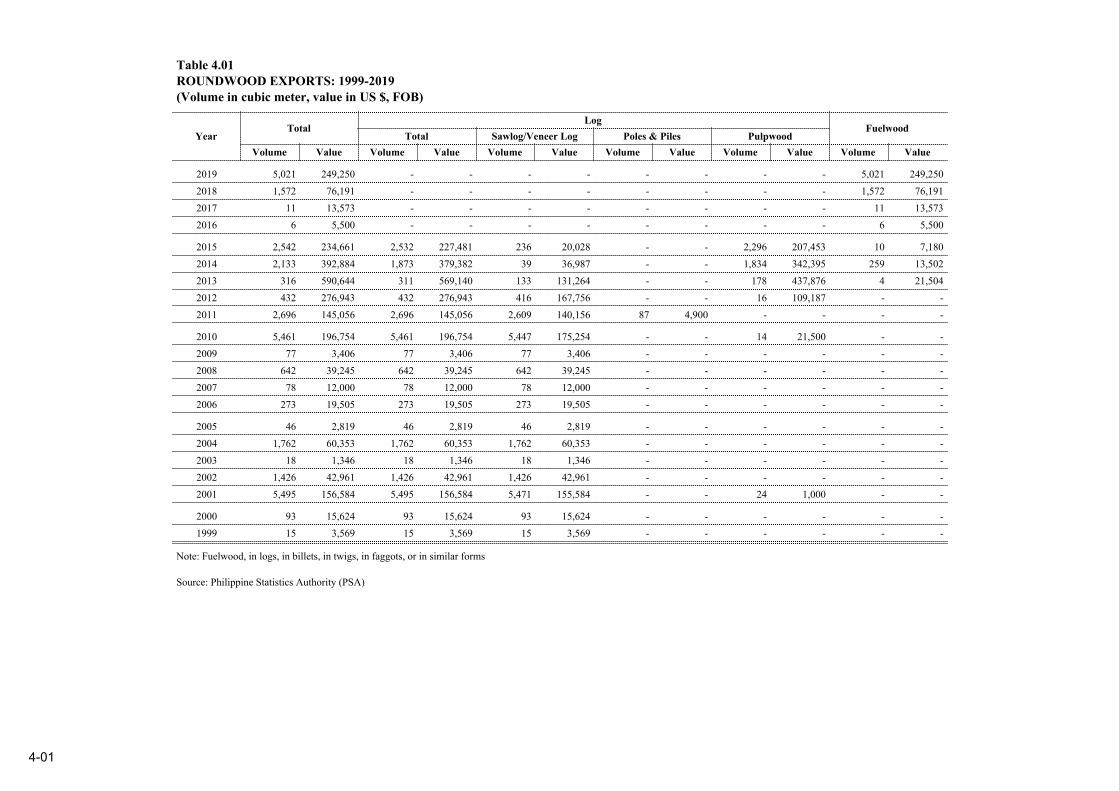
4-01
Table 4.01ROUNDWOOD EXPORTS: 1999-2019(Volume in cubic meter, value in US $, FOB)
YearTotal
LogFuelwood
Total Sawlog/Veneer Log Poles & Piles PulpwoodVolume Value Volume Value Volume Value Volume Value Volume Value Volume Value
2019 5,021 249,250 - - - - - - - - 5,021 249,2502018 1,572 76,191 - - - - - - - - 1,572 76,1912017 11 13,573 - - - - - - - - 11 13,5732016 6 5,500 - - - - - - - - 6 5,500
2015 2,542 234,661 2,532 227,481 236 20,028 - - 2,296 207,453 10 7,1802014 2,133 392,884 1,873 379,382 39 36,987 - - 1,834 342,395 259 13,5022013 316 590,644 311 569,140 133 131,264 - - 178 437,876 4 21,5042012 432 276,943 432 276,943 416 167,756 - - 16 109,187 - -2011 2,696 145,056 2,696 145,056 2,609 140,156 87 4,900 - - - -
2010 5,461 196,754 5,461 196,754 5,447 175,254 - - 14 21,500 - -2009 77 3,406 77 3,406 77 3,406 - - - - - -2008 642 39,245 642 39,245 642 39,245 - - - - - -2007 78 12,000 78 12,000 78 12,000 - - - - - -2006 273 19,505 273 19,505 273 19,505 - - - - - -
2005 46 2,819 46 2,819 46 2,819 - - - - - -2004 1,762 60,353 1,762 60,353 1,762 60,353 - - - - - -2003 18 1,346 18 1,346 18 1,346 - - - - - -2002 1,426 42,961 1,426 42,961 1,426 42,961 - - - - - -2001 5,495 156,584 5,495 156,584 5,471 155,584 - - 24 1,000 - -
2000 93 15,624 93 15,624 93 15,624 - - - - - -1999 15 3,569 15 3,569 15 3,569 - - - - - -
Note: Fuelwood, in logs, in billets, in twigs, in faggots, or in similar forms
Source: Philippine Statistics Authority (PSA)

4-02
Table 4.02EXPORTS OF PROCESSED WOOD PRODUCTS: 1999-2019(Volume in thousand cubic meter, value in thousand US $, FOB)
YearLumber Plywood Veneer
Volume Value Volume Value Volume Value
2019 89 177,295 ( - ) ( - ) 15 11,1482018 61 120,506 a 23 2 1,1302017 249 94,485 26 54,466 1 5562016 189 25,931 a 418 a 242
2015 267 37,346 a 401 1 8082014 310 69,420 2 1,819 4 3,2692013 240 74,132 4 3,773 3 3,0782012 392 28,046 13 10,986 32 13,4752011 405 24,377 40 24,336 15 1,347
2010 377 10,587 24 14,963 3 2,0572009 293 9,629 33 21,921 4 1,3012008 215 11,602 39 19,237 4 2,0032007 208 14,342 37 14,810 6 3,5702006 184 13,198 20 9,619 6 4,019
2005 130 8,487 17 7,734 6 3,5962004 125 9,737 42 15,466 7 3,2252003 119 12,120 10 3,287 4 2,3822002 91 10,267 7 3,029 6 3,0892001 105 15,959 a 200 3 1,547
2000 120 20,457 2 2,056 5 2,9621999 69 8,739 a 343 5 2,890
a - less than one thousand cubic meter
Source: Philippine Statistics Authority (PSA)

4-03
Table 4.03EXPORTS OF SELECTED NON-TIMBER FOREST PRODUCTS: 1999-2019(Quantity in thousand kilograms, value in thousand US $, FOB)
YearTotal Almaciga Resin Elemi Gum Bamboo Rattan Poles Salago Fiber
Quantity Value Quantity Value Quantity Value Quantity Value Quantity Value Quantity Value
2019 531 1,075 72 114 253 816 12 5 - - 193 1402018 348 477 85 139 21 96 8 4 - - 234 2382017 984 1,348 192 269 224 636 39 13 240 227 290 2032016 875 1,505 184 152 370 1,054 23 67 46 58 252 174
2015 2,106 2,596 90 83 214 621 35 15 1,349 1,560 418 3172014 986 1,185 49 40 87 174 62 14 345 634 443 3232013 801 806 74 96 49 119 24 11 236 278 417 3022012 782 694 45 79 89 193 106 31 111 95 432 2972011 1,120 1,622 123 226 372 977 6 6 a 6 619 407
2010 518 698 65 90 162 388 30 26 16 25 244 1682009 595 760 128 171 79 173 45 17 4 1 340 3972008 877 1,270 122 172 262 616 47 72 25 13 421 3962007 665 769 261 306 146 279 47 25 7 16 203 1432006 914 923 163 136 181 298 66 129 14 50 491 311
2005 855 746 191 154 165 237 75 73 4 9 421 2722004 1,041 845 230 222 144 193 39 24 a a 627 4072003 1,063 1,101 199 175 361 528 54 113 1 4 447 2812002 1,120 1,013 209 150 272 482 65 28 a a 574 3542001 1,194 1,168 204 161 296 528 30 36 17 18 648 424
2000 1,354 1,417 319 242 377 696 19 39 - - 638 4411999 1,174 1,119 336 247 245 464 5 6 - - 589 402
a - less than one thousand kilogram2019 Salago Fiber - preliminary data
Sources: Philippine Statistics Authority (PSA), Philippine Fiber Industry Development Authority (for Salago Fiber)

4-04
Table 4.04EXPORT SUMMARY OF FOREST-BASED PRODUCTS: 2019(Value in thousand US $, FOB)
Forest-Based Products Unit Quantity Value
Lumber cubic meter 89,352 177,295Pulp and Waste Paper net kilogram 102,022,380 136,175Paper and Articles of Paper and Paperboard net kilogram 156,283,000 120,863Forest-Based Furniture gross kilogram 15,362,143 71,130Other Wood-Based Manufactured Articles gross kilogram 21,743,515 62,769Fiberboard net kilogram 10,319,401 21,772Veneer and Other Wood Worked cubic meter 14,700 11,148Selected Non-Timber Manufactured Articles gross kilogram 3,089,345 10,631Non-Timber Forest Productsr net kilogram 338,509 940Roundwood cubic meter 5,021 249Wood Charcoal net kilogram 533,543 242Wood Continuously Shaped gross kilogram 48,615 210Particleboard gross kilogram 79,232 173Wood Pellets net kilogram 1,339,281 122Wood Chips and Particles gross kilogram 1,222,030 86Densified Wood and Reconstituted Wood cubic meter 2 5
Total Exports of Forest-Based Products 613,814
Total Philippine Exports p 70,325,604
Forest Products Exports as % of the Total Exports (in terms of value) 0.87%
p - preliminary
Source: Philippine Statistics Authority (PSA)

4-05
Table 4.05 IMPORTS OF LOG AND PROCESSED FOREST PRODUCTS: 1999-2019(Volume in cubic meter, value in US $, CIF)
YearLog Lumber Plywood Veneer
Volume Value Volume Value Volume Value Volume Value
2019 38,338 10,759,283 110,508 45,653,255 1,413 1,244,278 72,154 23,704,1022018 151,811 17,215,198 r 73,522 28,145,431 3,048 2,749,662 74,827 25,201,7122017 67,331 10,492,816 254,200 57,908,305 596,543 223,118,928 60,309 20,056,4862016 113,496 25,588,806 326,799 119,764,380 517,702 209,058,417 25,252 11,738,617
2015 98,143 15,328,658 1,144,691 80,883,393 292,127 149,922,423 23,732 9,201,6662014 50,685 8,338,568 207,362 108,932,244 411,269 167,080,385 14,826 9,517,8502013 118,988 20,772,261 240,197 123,074,085 195,037 107,813,877 30,642 12,628,2142012 107,334 23,671,598 218,607 98,925,060 95,183 72,146,314 59,507 22,048,7722011 87,240 18,318,556 159,974 77,311,893 94,231 76,711,777 38,011 12,672,509
2010 27,737 6,600,612 136,574 55,196,603 61,163 39,558,652 25,683 6,821,3272009 35,349 6,972,798 128,754 47,702,732 3,886 1,485,791 22,875 5,486,3612008 72,918 16,728,539 134,846 52,019,144 1,523 526,994 27,262 9,265,2762007 88,735 22,490,333 174,456 90,702,741 4,348 2,355,433 18,101 4,719,6082006 65,185 19,742,069 261,193 95,719,492 6,207 4,067,817 26,602 7,335,531
2005 164,959 23,867,765 362,509 117,742,543 3,959 1,473,557 64,426 16,712,7552004 177,107 17,877,077 246,685 88,400,636 1,963 1,086,528 51,232 12,293,9772003 355,787 33,107,917 338,064 105,403,457 5,091 2,120,825 91,143 22,354,1322002 434,175 40,613,551 401,086 103,885,902 650 198,625 74,505 17,915,3492001 551,327 44,707,227 370,809 86,270,886 402 201,067 105,427 26,370,676
2000 584,759 54,340,693 358,514 79,810,286 1,015 638,864 119,337 31,521,9471999 583,643 69,450,136 381,235 116,771,575 1,019 551,638 138,248 40,248,741
r - revised
Source: Philippine Statistics Authority (PSA)

4-06
Table 4.06IMPORT SUMMARY OF FOREST-BASED PRODUCTS: 2019(Value in thousand US $, FOB)
Forest-Based Products Unit Quantity Value
Paper and Articles of Paper and Paperboard net kilogram 1,094,487,213 966,160Forest-Based Furniture gross kilogram 178,097,697 232,905Pulp and Waste Paper net kilogram 216,348,344 90,774Other Wood-Based Manufactured Articles gross kilogram 65,506,572 56,664Lumber cubic meter 110,508 41,736Particleboard gross kilogram 58,288,048 26,006Veneer and Other Wood Worked cubic meter 72,154 22,259Roundwood cubic meter 38,364 9,416Fiberboard net kilogram 13,785,597 8,491Wood Continuously Shaped gross kilogram 3,723,164 4,550Plywood and Plywood Veneered Panels cubic meter 1,413 1,154Wood Simply Shaped gross kilogram 195,028 487Densified Wood and Reconstituted Wood cubic meter 610 282Selected Non-Timber Manufactured Articles gross kilogram 98,044 218Wood Chips and Particles gross kilogram 678,999 211Wood Pellets net kilogram 67,944 26Non-Timber Forest Products net kilogram 63 a
Total Imports of Forest-Based Products 1,461,339
Total Philippine Imports p 107,374,743
Forest Products Imports as % of the Total Imports (in terms of value) 1.36%
p - preliminarya - less than 1,000 US $ FOBSource: Philippine Statistics Authority (PSA)

5-01
Table 5.01MONTHLY FOB MARKET PRICE OF LOCALLY PRODUCED LOGS: 2019(Php/cubic meter)
Species/Region Log Grade Diameter(in cm)
Average Jan Feb Mar Apr May Jun Jul Aug Sept Oct Nov Dec
Acacia MangiumRegion 10 Sawlog Below 30 ( 2,030.36) - - - - - - ( 2,175.00) - - - ( 1,885.71) -
30-38 ( 2,026.67) - - - - - - ( 2,033.33) - - - ( 2,020.00) - 40-48 ( 3,066.67) - - - - - - ( 3,233.33) - - - ( 2,900.00) - 50-58 ( 3,700.00) - - - - - - ( 3,900.00) - - - ( 3,500.00) - 60 & Above ( 2,900.00) - - - - - - - - - - ( 2,900.00) -
Region 13 Non-peelable Below 30 ( 1,853.33) ( 1,933.33) ( 1,800.00) ( 1,800.00) ( 1,933.33) - - - ( 1,800.00) - - - - Peeler/ Veneer Log Below 30 ( 2,553.33) ( 2,333.33) ( 2,500.00) ( 2,500.00) ( 2,666.67) - - - ( 2,766.67) - - - -
30-38 ( 2,553.33) ( 2,333.33) ( 2,500.00) ( 2,500.00) ( 2,666.67) - - - ( 2,766.67) - - - - 40-48 ( 2,553.33) ( 2,333.33) ( 2,500.00) ( 2,500.00) ( 2,666.67) - - - ( 2,766.67) - - - - 50-58 ( 2,553.33) ( 2,333.33) ( 2,500.00) ( 2,500.00) ( 2,666.67) - - - ( 2,766.67) - - - - 60 & Above ( 2,553.33) ( 2,333.33) ( 2,500.00) ( 2,500.00) ( 2,666.67) - - - ( 2,766.67) - - - -
Pulpwood Below 30 ( 1,853.33) ( 1,933.33) ( 1,800.00) ( 1,800.00) ( 1,933.33) - - - ( 1,800.00) - - - -
BagrasRegion 10 Sawlog Below 30 ( 4,500.00) - - - - - - ( 4,500.00) - - - ( 4,500.00) -
DurianRegion 10 Sawlog Below 30 ( 2,033.33) - - - - - - - - - - ( 2,033.33) -
30-38 ( 2,850.00) - - - - - - - - - - ( 2,850.00) - 40-48 ( 3,300.00) - - - - - - - - - - ( 3,300.00) - 50-58 ( 3,600.00) - - - - - - - - - - ( 3,600.00) - 60 & Above ( 3,800.00) - - - - - - - - - - ( 3,800.00) -
Region 11 Peeler/ Veneer Log Below 30 ( 1,380.00) ( 1,340.00) - - - ( 1,340.00) ( 1,340.00) - - ( 1,500.00) - - - 30-38 ( 2,275.00) ( 2,100.00) - - - ( 2,100.00) ( 2,100.00) - - ( 2,800.00) - - - 40-48 ( 2,825.00) ( 2,700.00) - - - ( 2,700.00) ( 2,700.00) - - ( 3,200.00) - - - 50-58 ( 2,825.00) ( 2,700.00) - - - ( 2,700.00) ( 2,700.00) - - ( 3,200.00) - - - 60 & Above ( 2,825.00) ( 2,700.00) - - - ( 2,700.00) ( 2,700.00) - - ( 3,200.00) - - -
FalcataRegion 10 Peeler/ Veneer Log Below 30 ( 2,356.25) - - - - - - ( 2,475.00) - - - ( 2,237.50) -
30-38 ( 3,473.33) - - - - - - ( 3,466.67) - - - ( 3,480.00) - 40-48 ( 3,800.00) - - - - - - ( 3,850.00) - - - ( 3,750.00) - 50-58 ( 3,887.50) - - - - - - ( 3,850.00) - - - ( 3,925.00) - 60 & Above ( 3,887.50) - - - - - - ( 3,850.00) - - - ( 3,925.00) -
Sawlog Below 30 ( 1,583.75) - - - - - - ( 1,480.00) - - - ( 1,687.50) - 30-38 ( 1,915.71) - - - - - - ( 1,760.00) - - - ( 2,071.43) - 40-48 ( 2,202.86) - - - - - - ( 2,020.00) - - - ( 2,385.71) - 50-58 ( 4,516.67) - - - - - - ( 4,700.00) - - - ( 4,333.33) - 60 & Above ( 5,008.33) - - - - - - ( 5,250.00) - - - ( 4,766.67) -

5-01
Table 5.01 (continued)MONTHLY FOB MARKET PRICE OF LOCALLY PRODUCED LOGS: 2019(Php/cubic meter)
Species/Region Log Grade Diameter(in cm)
Average Jan Feb Mar Apr May Jun Jul Aug Sept Oct Nov Dec
Falcata (continued)Region 11 Peeler/ Veneer Log Below 30 ( 1,948.00) ( 1,340.00) - - ( 3,500.00) ( 2,220.00) ( 1,340.00) - - ( 1,340.00) - - -
30-38 ( 2,585.00) ( 2,100.00) - - ( 3,750.00) ( 2,875.00) ( 2,100.00) - - ( 2,100.00) - - - 40-48 ( 3,065.00) ( 2,700.00) - - ( 3,950.00) ( 3,275.00) ( 2,700.00) - - ( 2,700.00) - - - 50-58 ( 3,080.00) ( 2,700.00) - - ( 4,100.00) ( 3,200.00) ( 2,700.00) - - ( 2,700.00) - - - 60 & Above ( 3,185.00) ( 2,700.00) - - ( 4,250.00) ( 3,575.00) ( 2,700.00) - - ( 2,700.00) - - -
Region 13 Non-peelable Below 30 ( 2,268.20) ( 2,311.76) ( 2,441.67) ( 2,325.00) ( 2,186.67) - - - ( 2,141.18) - - ( 2,202.94) - 30-38 ( 2,833.33) - ( 2,950.00) ( 2,950.00) - - - - - - - ( 2,600.00) - 40-48 ( 2,833.33) - ( 2,950.00) ( 2,950.00) - - - - - - - ( 2,600.00) - 50-58 ( 2,833.33) - ( 2,950.00) ( 2,950.00) - - - - - - - ( 2,600.00) - 60 & Above ( 2,833.33) - ( 2,950.00) ( 2,950.00) - - - - - - - ( 2,600.00) -
Peeler/ Veneer Log Below 30 ( 3,590.41) ( 3,745.65) ( 3,884.09) ( 3,852.00) ( 3,525.00) - - - ( 3,207.14) - - ( 3,328.57) - 30-38 ( 3,981.36) ( 4,290.48) ( 4,283.33) ( 4,264.58) ( 3,840.00) - - - ( 3,555.00) - - ( 3,654.76) - 40-48 ( 4,351.08) ( 4,675.93) ( 4,770.83) ( 4,748.15) ( 4,140.00) - - - ( 3,852.50) - - ( 3,919.05) - 50-58 ( 4,495.59) ( 4,869.23) ( 4,902.17) ( 4,926.92) ( 4,285.71) - - - ( 3,989.47) - - ( 4,000.00) - 60 & Above ( 4,512.92) ( 4,873.08) ( 4,915.22) ( 4,938.46) ( 4,292.86) - - - ( 4,021.05) - - ( 4,036.84) -
Pulpwood Below 30 ( 2,245.63) ( 2,114.29) ( 2,316.67) ( 2,220.00) ( 2,242.86) - - - ( 2,200.00) - - ( 2,380.00) - Sawlog Below 30 ( 3,166.67) ( 2,500.00) ( 3,300.00) ( 3,300.00) ( 3,300.00) - - - ( 3,300.00) - - ( 3,300.00) -
30-38 ( 3,394.44) ( 2,700.00) ( 3,466.67) ( 3,466.67) ( 3,550.00) - - - ( 3,550.00) - - ( 3,633.33) - 40-48 ( 4,333.33) ( 3,500.00) ( 4,500.00) ( 4,500.00) ( 4,500.00) - - - ( 4,500.00) - - ( 4,500.00) - 50-58 ( 4,616.67) ( 4,400.00) ( 4,700.00) ( 4,700.00) ( 4,700.00) - - - ( 4,500.00) - - ( 4,700.00) - 60 & Above ( 4,650.00) ( 4,400.00) ( 4,700.00) ( 4,700.00) ( 4,700.00) - - - ( 4,700.00) - - ( 4,700.00) -
- - - - - - - - - - - - GubasRegion 13 Non-peelable Below 30 ( 1,200.00) ( 1,200.00) ( 1,200.00) ( 1,200.00) ( 1,200.00) - - - ( 1,200.00) - - ( 1,200.00) -
Peeler/ Veneer Log Below 30 ( 1,500.00) ( 1,500.00) ( 1,500.00) ( 1,500.00) ( 1,500.00) - - - ( 1,500.00) - - ( 1,500.00) - 30-38 ( 1,500.00) ( 1,500.00) ( 1,500.00) ( 1,500.00) ( 1,500.00) - - - ( 1,500.00) - - ( 1,500.00) - 40-48 ( 1,500.00) ( 1,500.00) ( 1,500.00) ( 1,500.00) ( 1,500.00) - - - ( 1,500.00) - - ( 1,500.00) - 50-58 ( 1,500.00) ( 1,500.00) ( 1,500.00) ( 1,500.00) ( 1,500.00) - - - ( 1,500.00) - - ( 1,500.00) - 60 & Above ( 1,500.00) ( 1,500.00) ( 1,500.00) ( 1,500.00) ( 1,500.00) - - - ( 1,500.00) - - ( 1,500.00) -
- - - - - - - - - - - - MahoganyRegion 8 Sawlog Below 30 ( 1,700.00) ( 1,700.00) ( 1,700.00) ( 1,700.00) ( 1,700.00) ( 1,700.00) ( 1,700.00) ( 1,700.00) ( 1,700.00) ( 1,700.00) ( 1,700.00) ( 1,700.00) ( 1,700.00)
30-38 ( 2,800.00) ( 2,800.00) ( 2,800.00) ( 2,800.00) ( 2,800.00) ( 2,800.00) ( 2,800.00) ( 2,800.00) ( 2,800.00) ( 2,800.00) ( 2,800.00) ( 2,800.00) ( 2,800.00) 40-48 ( 3,500.00) ( 3,500.00) ( 3,500.00) ( 3,500.00) ( 3,500.00) ( 3,500.00) ( 3,500.00) ( 3,500.00) ( 3,500.00) ( 3,500.00) ( 3,500.00) ( 3,500.00) ( 3,500.00) 50-58 ( 3,900.00) ( 3,900.00) ( 3,900.00) ( 3,900.00) ( 3,900.00) ( 3,900.00) ( 3,900.00) ( 3,900.00) ( 3,900.00) ( 3,900.00) ( 3,900.00) ( 3,900.00) ( 3,900.00) 60 & Above ( 4,300.00) ( 4,300.00) ( 4,300.00) ( 4,300.00) ( 4,300.00) ( 4,300.00) ( 4,300.00) ( 4,300.00) ( 4,300.00) ( 4,300.00) ( 4,300.00) ( 4,300.00) ( 4,300.00)

5-01
Table 5.01 (continued)MONTHLY FOB MARKET PRICE OF LOCALLY PRODUCED LOGS: 2019(Php/cubic meter)
Species/Region Log Grade Diameter(in cm)
Average Jan Feb Mar Apr May Jun Jul Aug Sept Oct Nov Dec
Mahogany (continued)Region 10 Sawlog Below 30 ( 2,714.29) - - - - - - ( 2,900.00) - - - ( 2,528.57) -
30-38 ( 3,316.67) - - - - - - ( 3,433.33) - - - ( 3,200.00) - 40-48 ( 4,350.00) - - - - - - ( 4,700.00) - - - ( 4,000.00) - 50-58 ( 5,183.33) - - - - - - ( 5,500.00) - - - ( 4,866.67) - 60 & Above ( 5,945.83) - - - - - - ( 6,375.00) - - - ( 5,516.67) -
Region 13 Non-peelable Below 30 ( 1,400.00) ( 1,300.00) - - - - - - ( 1,500.00) - - - - Peeler/ Veneer Log Below 30 ( 2,400.00) ( 2,000.00) - - - - - - ( 2,800.00) - - - -
30-38 ( 2,400.00) ( 2,000.00) - - - - - - ( 2,800.00) - - - - 40-48 ( 2,400.00) ( 2,000.00) - - - - - - ( 2,800.00) - - - - 50-58 ( 2,400.00) ( 2,000.00) - - - - - - ( 2,800.00) - - - - 60 & Above ( 2,400.00) ( 2,000.00) - - - - - - ( 2,800.00) - - - -
Pulpwood 60 & Above ( 1,400.00) ( 1,300.00) - - - - - - ( 1,500.00) - - - -
MangoRegion 11 Peeler/ Veneer Log Below 30 ( 1,340.00) ( 1,340.00) - - - ( 1,340.00) ( 1,340.00) - - ( 1,340.00) - - -
30-38 ( 2,100.00) ( 2,100.00) - - - ( 2,100.00) ( 2,100.00) - - ( 2,100.00) - - - 40-48 ( 2,700.00) ( 2,700.00) - - - ( 2,700.00) ( 2,700.00) - - ( 2,700.00) - - - 50-58 ( 2,700.00) ( 2,700.00) - - - ( 2,700.00) ( 2,700.00) - - ( 2,700.00) - - - 60 & Above ( 2,700.00) ( 2,700.00) - - - ( 2,700.00) ( 2,700.00) - - ( 2,700.00) - - -
MarangRegion 11 Peeler/ Veneer Log Below 30 ( 1,340.00) ( 1,340.00) - - - ( 1,340.00) ( 1,340.00) - - ( 1,340.00) - - -
30-38 ( 2,100.00) ( 2,100.00) - - - ( 2,100.00) ( 2,100.00) - - ( 2,100.00) - - - 40-48 ( 2,700.00) ( 2,700.00) - - - ( 2,700.00) ( 2,700.00) - - ( 2,700.00) - - - 50-58 ( 2,700.00) ( 2,700.00) - - - ( 2,700.00) ( 2,700.00) - - ( 2,700.00) - - - 60 & Above ( 2,700.00) ( 2,700.00) - - - ( 2,700.00) ( 2,700.00) - - ( 2,700.00) - - -
RubberRegion 10 Sawlog Below 30 ( 2,033.33) - - - - - - - - - - ( 2,033.33) -
30-38 ( 2,850.00) - - - - - - - - - - ( 2,850.00) - 40-48 ( 3,300.00) - - - - - - - - - - ( 3,300.00) - 50-58 ( 3,600.00) - - - - - - - - - - ( 3,600.00) - 60 & Above ( 3,800.00) - - - - - - - - - - ( 3,800.00) -
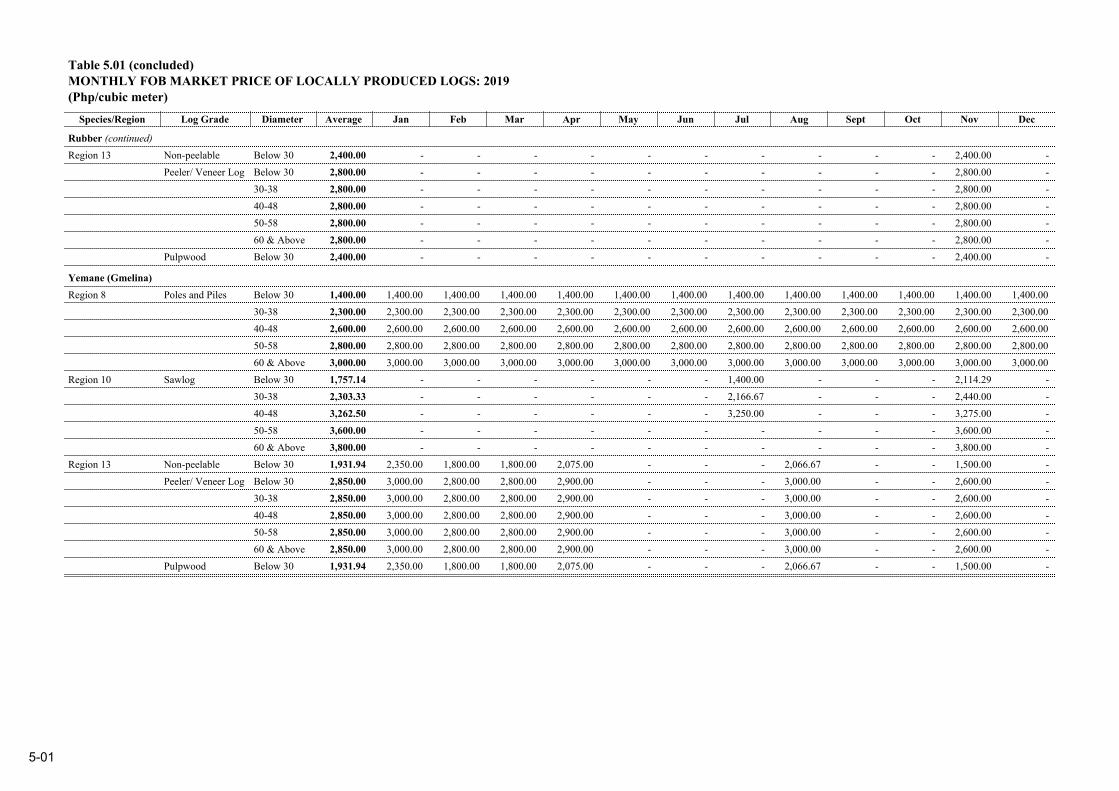
5-01
Table 5.01 (concluded)MONTHLY FOB MARKET PRICE OF LOCALLY PRODUCED LOGS: 2019(Php/cubic meter)
Species/Region Log Grade Diameter(in cm)
Average Jan Feb Mar Apr May Jun Jul Aug Sept Oct Nov Dec
Rubber (continued)Region 13 Non-peelable Below 30 ( 2,400.00) - - - - - - - - - - ( 2,400.00) -
Peeler/ Veneer Log Below 30 ( 2,800.00) - - - - - - - - - - ( 2,800.00) - 30-38 ( 2,800.00) - - - - - - - - - - ( 2,800.00) - 40-48 ( 2,800.00) - - - - - - - - - - ( 2,800.00) - 50-58 ( 2,800.00) - - - - - - - - - - ( 2,800.00) - 60 & Above ( 2,800.00) - - - - - - - - - - ( 2,800.00) -
Pulpwood Below 30 ( 2,400.00) - - - - - - - - - - ( 2,400.00) -
Yemane (Gmelina)Region 8 Poles and Piles Below 30 ( 1,400.00) ( 1,400.00) ( 1,400.00) ( 1,400.00) ( 1,400.00) ( 1,400.00) ( 1,400.00) ( 1,400.00) ( 1,400.00) ( 1,400.00) ( 1,400.00) ( 1,400.00) ( 1,400.00)
30-38 ( 2,300.00) ( 2,300.00) ( 2,300.00) ( 2,300.00) ( 2,300.00) ( 2,300.00) ( 2,300.00) ( 2,300.00) ( 2,300.00) ( 2,300.00) ( 2,300.00) ( 2,300.00) ( 2,300.00) 40-48 ( 2,600.00) ( 2,600.00) ( 2,600.00) ( 2,600.00) ( 2,600.00) ( 2,600.00) ( 2,600.00) ( 2,600.00) ( 2,600.00) ( 2,600.00) ( 2,600.00) ( 2,600.00) ( 2,600.00) 50-58 ( 2,800.00) ( 2,800.00) ( 2,800.00) ( 2,800.00) ( 2,800.00) ( 2,800.00) ( 2,800.00) ( 2,800.00) ( 2,800.00) ( 2,800.00) ( 2,800.00) ( 2,800.00) ( 2,800.00) 60 & Above ( 3,000.00) ( 3,000.00) ( 3,000.00) ( 3,000.00) ( 3,000.00) ( 3,000.00) ( 3,000.00) ( 3,000.00) ( 3,000.00) ( 3,000.00) ( 3,000.00) ( 3,000.00) ( 3,000.00)
Region 10 Sawlog Below 30 ( 1,757.14) - - - - - - ( 1,400.00) - - - ( 2,114.29) - 30-38 ( 2,303.33) - - - - - - ( 2,166.67) - - - ( 2,440.00) - 40-48 ( 3,262.50) - - - - - - ( 3,250.00) - - - ( 3,275.00) - 50-58 ( 3,600.00) - - - - - - - - - - ( 3,600.00) - 60 & Above ( 3,800.00) - - - - - - - - - - ( 3,800.00) -
Region 13 Non-peelable Below 30 ( 1,931.94) ( 2,350.00) ( 1,800.00) ( 1,800.00) ( 2,075.00) - - - ( 2,066.67) - - ( 1,500.00) - Peeler/ Veneer Log Below 30 ( 2,850.00) ( 3,000.00) ( 2,800.00) ( 2,800.00) ( 2,900.00) - - - ( 3,000.00) - - ( 2,600.00) -
30-38 ( 2,850.00) ( 3,000.00) ( 2,800.00) ( 2,800.00) ( 2,900.00) - - - ( 3,000.00) - - ( 2,600.00) - 40-48 ( 2,850.00) ( 3,000.00) ( 2,800.00) ( 2,800.00) ( 2,900.00) - - - ( 3,000.00) - - ( 2,600.00) - 50-58 ( 2,850.00) ( 3,000.00) ( 2,800.00) ( 2,800.00) ( 2,900.00) - - - ( 3,000.00) - - ( 2,600.00) - 60 & Above ( 2,850.00) ( 3,000.00) ( 2,800.00) ( 2,800.00) ( 2,900.00) - - - ( 3,000.00) - - ( 2,600.00) -
Pulpwood Below 30 ( 1,931.94) ( 2,350.00) ( 1,800.00) ( 1,800.00) ( 2,075.00) - - - ( 2,066.67) - - ( 1,500.00) - - - - - - - - - - - - -

5-02
Table 5.02 MONTHLY RETAIL PRICES OF LOCALLY PRODUCED LUMBER: 2019(Board Foot, 2"x4"x8', in Php)
Species/Region Average Jan Feb Mar Apr May Jun Jul Aug Sept Oct Nov Dec
Acacia MangiumNCR ( 55.50) - - - - - - - ( 55.00) - ( 55.00) ( 56.00) ( 56.00) CAR ( 50.00) ( 50.00) - - - - - - - - - - - Region 3 ( 39.00) ( 39.00) ( 39.00) - ( 39.00) ( 39.00) ( 39.00) ( 39.00) ( 39.00) ( 39.00) ( 39.00) ( 39.00) - MIMAROPA ( 40.02) ( 49.55) ( 49.55) ( 49.55) ( 49.55) ( 28.00) - ( 28.00) - ( 28.00) ( 39.00) ( 39.00) - Region 5 ( 45.00) - - - - - - - - ( 45.00) - - - Region 6 ( 34.50) ( 32.00) ( 32.00) ( 32.00) ( 37.00) - ( 32.00) - - - - - ( 42.00) Region 7 ( 31.67) ( 25.00) - ( 25.00) ( 25.00) - ( 35.00) - ( 35.00) ( 35.00) ( 35.00) ( 35.00) ( 35.00) Region 10 ( 32.35) - - - - - - ( 31.75) ( 32.50) - ( 32.50) ( 32.50) ( 32.50) Region 13 ( 27.09) ( 26.50) ( 28.00) ( 34.58) ( 32.25) - - - ( 23.00) ( 23.00) ( 22.50) ( 27.00) ( 27.00)
AcaciaRegion 2 ( 28.33) - ( 28.00) - - ( 28.00) ( 28.00) - ( 28.00) ( 28.00) - - ( 30.00) Region 4A ( 50.00) - ( 50.00) ( 50.00) ( 50.00) - - - - - - - - Region 5 ( 40.00) - - - - - - - - ( 40.00) - - -
- - - - - - - - - - - - BagrasNCR ( 58.33) ( 60.00) ( 60.00) ( 60.00) ( 60.00) ( 55.00) ( 55.00) - - - - - - CAR ( 50.00) ( 50.00) - - - - - - - - - - - Region 12 ( 33.67) - - - - - - - - ( 33.67) - - - Region 13 ( 36.63) - - ( 36.63) - - - - - - - - -
Caribbean PineCAR ( 50.00) ( 50.00) - - - - - - - - - - -
DurianRegion 11 ( 30.50) - - - - - ( 26.00) - - - - - ( 35.00) Region 13 ( 37.50) ( 37.50) ( 37.50) ( 37.50) - - - - - - - - -
FalcataRegion 3 ( 20.00) ( 20.00) ( 20.00) - ( 20.00) - - ( 20.00) ( 20.00) ( 20.00) ( 20.00) ( 20.00) - MIMAROPA ( 13.29) ( 12.33) ( 12.33) ( 12.33) ( 12.33) ( 12.33) - ( 12.33) - ( 12.33) ( 16.67) ( 16.67) - Region 10 ( 24.79) - - - - - - ( 25.75) ( 25.00) - ( 24.40) ( 24.40) ( 24.40) Region 12 ( 26.00) - - - - - - - - ( 26.00) ( 26.00) - - Region 13 ( 17.94) ( 28.00) ( 28.00) ( 17.00) ( 17.00) - - - ( 15.50) ( 15.50) ( 15.50) ( 12.50) ( 12.50)

5-02
Table 5.02 (concluded)MONTHLY RETAIL PRICES OF LOCALLY PRODUCED LUMBER: 2019(Board Foot, 2"x4"x8', in Php)
Species/Region Average Jan Feb Mar Apr May Jun Jul Aug Sept Oct Nov Dec
MahoganyNCR ( 54.42) ( 53.75) ( 53.75) ( 53.75) ( 53.75) ( 51.67) ( 55.00) ( 55.00) ( 55.00) - ( 55.00) ( 56.00) ( 56.00) CAR ( 50.00) ( 50.00) - - - - - - - - - - - Region 2 ( 33.88) - ( 38.25) - - ( 30.00) ( 35.00) - ( 35.00) ( 35.00) - - ( 30.00) Region 3 ( 39.02) ( 37.72) ( 37.72) - ( 37.72) ( 44.08) ( 37.72) ( 37.72) ( 37.72) ( 44.33) ( 37.72) ( 37.72) - Region 4A ( 61.75) - ( 70.00) ( 70.00) ( 70.00) - - - ( 53.50) ( 53.50) ( 53.50) - - MIMAROPA ( 37.63) ( 33.67) ( 68.67) ( 34.34) ( 34.34) ( 34.34) - ( 33.67) - ( 33.67) ( 33.00) ( 33.00) - Region 5 ( 54.92) - ( 50.17) - - - - - - ( 59.67) - - - Region 6 ( 39.97) ( 38.64) ( 39.89) ( 38.53) ( 40.28) - ( 40.73) - - - - - ( 41.72) Region 7 ( 47.44) ( 41.33) - ( 44.17) ( 51.28) - ( 49.33) - ( 48.50) ( 49.00) ( 46.83) ( 48.61) ( 47.92) Region 9 ( 38.00) - - - ( 37.49) ( 37.49) - - - - ( 38.33) ( 38.33) ( 38.33) Region 10 ( 36.69) - - - - - - ( 41.25) ( 30.00) - ( 37.40) ( 37.40) ( 37.40) Region 11 ( 37.42) ( 38.00) ( 38.00) - - ( 38.00) ( 38.00) - - ( 32.50) - - ( 40.00) Region 12 ( 35.54) ( 40.00) ( 32.67) ( 38.33) - ( 35.00) ( 38.67) - ( 28.33) ( 25.33) ( 46.00) - - Region 13 ( 25.55) ( 22.00) ( 28.00) ( 29.81) ( 23.00) - - - ( 25.33) ( 25.33) ( 22.50) ( 27.00) ( 27.00)
MarangRegion 11 ( 30.00) - - - - - - - - - ( 30.00) - ( 30.00)
PiliRegion 5 ( 40.00) - ( 40.00) - - - - - - - - - -
Yemane (Gmelina)NCR ( 60.00) 60.00 60.00 60.00 60.00 - - - - - - - -CAR ( 18.00) 18.00 - - - - - - - - 18.00 - -Region 2 ( 38.25) 36.75 38.25 - - 39.00 38.25 - 38.25 38.25 - - 39.00Region 3 ( 33.22) 32.11 32.11 - 34.58 35.67 32.11 32.11 32.11 37.21 32.11 32.11 -Region 4A ( 50.00) - 50.00 50.00 50.00 - - - - - - - -MIMAROPA ( 33.52) 33.67 33.67 33.67 33.67 33.67 - 33.67 - 33.67 33.00 33.00 -Region 5 ( 50.77) - 45.53 - - - - - - 56.00 - - -Region 6 ( 38.64) 37.76 38.47 37.40 38.54 - 39.48 - - - - - 40.16Region 7 ( 43.36) 39.99 - 42.30 42.77 - 44.62 - 43.91 44.41 42.22 44.62 45.38Region 9 ( 35.61) - - - 36.20 36.20 - - - - 35.22 35.22 35.22Region 10 ( 30.51) - - - - - - 39.17 30.00 - 27.80 27.80 27.80Region 11 ( 25.86) 26.00 25.50 - 20.05 30.00 27.50 - - 32.50 - - 19.50Region 12 ( 35.74) 40.67 28.00 35.83 - 30.33 29.78 - 39.00 40.17 42.17 - -Region 13 ( 26.65) 28.00 28.00 35.04 23.50 - - - 24.17 24.17 23.00 27.00 27.00

5-03
Table 5.03 MONTHLY RETAIL PRICES OF IMPORTED LUMBER: 2019(Board Foot, 2"x4"x8', in Php)
Country of Origin/Region Average Jan Feb Mar Apr May Jun Jul Aug Sept Oct Nov Dec
BrazilRegion 3 ( 48.00) - - - ( 48.00) - - - - - - - -
MalaysiaNCR ( 56.52) ( 54.85) ( 55.96) ( 56.32) ( 56.32) ( 56.69) ( 56.69) ( 56.88) ( 56.88) - ( 56.88) ( 57.15) ( 57.15) CAR ( 66.20) ( 66.20) - - - - - - - - - - - Region 1 ( 51.83) ( 52.09) ( 48.83) ( 52.24) ( 52.25) ( 52.37) ( 52.33) ( 52.37) ( 52.01) ( 52.84) ( 51.78) - ( 51.00) Region 2 ( 51.80) ( 47.50) ( 54.75) - - ( 53.70) ( 51.65) - ( 51.65) ( 51.50) - - ( 51.85) Region 3 ( 50.39) ( 49.56) ( 49.56) - ( 49.25) ( 49.37) ( 48.40) ( 52.15) ( 52.81) ( 53.25) ( 52.38) ( 47.19) - Region 4A ( 53.85) - ( 50.00) ( 54.00) ( 58.60) - - - ( 53.50) ( 53.50) ( 53.50) - - MIMAROPA ( 50.00) - - ( 50.00) ( 50.00) ( 50.00) - - - - - - - Region 5 ( 64.38) - ( 68.00) - - - - - - ( 60.77) - - - Region 7 ( 45.00) - - ( 45.00) ( 45.00) - ( 45.00) - ( 45.00) ( 45.00) ( 45.00) ( 45.00) ( 45.00) Region 10 ( 47.00) - - - - - - ( 47.00) ( 47.00) - ( 47.00) ( 47.00) ( 47.00)
New ZealandRegion 7 ( 56.58) ( 51.92) - ( 58.94) ( 57.04) - ( 56.88) - ( 56.88) ( 56.88) ( 56.88) ( 56.88) ( 56.88)
- - - - - - - - - - - - Papua New Guinea - - - - - - - - - - - - Region 1 ( 47.89) ( 48.00) ( 46.00) ( 48.00) ( 48.00) ( 48.00) ( 48.00) ( 48.00) - - ( 48.00) - ( 49.00) Region 3 ( 59.00) ( 59.00) ( 59.00) - ( 59.00) ( 59.00) ( 59.00) ( 59.00) ( 59.00) ( 59.00) ( 59.00) - -
Solomon IslandsRegion 1 ( 53.00) - - - - - - - ( 53.00) ( 53.00) ( 53.00) - - Region 3 ( 49.60) ( 44.00) ( 44.00) - ( 51.00) ( 51.00) ( 51.00) ( 51.00) ( 51.00) ( 51.00) ( 51.00) ( 51.00) - Region 4A ( 59.21) - ( 61.00) ( 61.00) ( 59.50) - - - ( 58.25) ( 58.25) ( 57.25) - -
USARegion 10 ( 45.00) - - - - - - ( 47.00) ( 37.00) - ( 47.00) ( 47.00) ( 47.00)

5-04
Table 5.04 MONTHLY RETAIL PRICES OF ORDINARY PLYWOOD: 2019(Php/Panel(4'x8'))
Thicknessinch (mm) Region Average Jan Feb Mar Apr May Jun Jul Aug Sept Oct Nov Dec
1/8 (3.175)NCR ( 290.30) ( 291.63) ( 291.63) ( 291.63) ( 291.63) ( 291.63) ( 291.63) ( 288.14) ( 288.14) - ( 288.14) ( 289.57) ( 289.57) CAR ( 206.25) ( 205.00) - - - - - - - - ( 207.50) - - Region 1 ( 235.50) ( 236.00) ( 226.00) ( 240.00) ( 240.00) ( 233.00) ( 236.00) ( 236.00) ( 236.00) ( 236.00) ( 236.00) - - Region 2 ( 225.14) ( 243.33) ( 234.58) - ( 220.45) ( 216.11) ( 217.78) - ( 220.28) ( 223.61) - - ( 225.00) Region 3 ( 251.83) ( 278.00) ( 260.00) - ( 247.00) ( 238.00) ( 230.33) ( 265.00) ( 281.25) ( 281.25) ( 220.00) ( 217.50) - Region 4A ( 376.04) - ( 360.00) ( 360.00) ( 360.00) - - - ( 348.75) ( 412.50) ( 415.00) - - MIMAROPA ( 314.03) - ( 316.67) ( 316.67) ( 316.67) ( 316.67) - ( 316.67) - ( 316.67) ( 306.67) ( 305.55) - Region 5 ( 242.63) - ( 247.77) - - - - - - ( 237.50) - - - Region 6 ( 264.34) ( 272.27) ( 272.43) ( 226.27) ( 275.26) - ( 272.73) - - - - - ( 267.07) Region 7 ( 283.03) ( 247.22) - ( 266.75) ( 266.75) - ( 308.00) - ( 308.00) ( 308.00) ( 308.00) - ( 251.50) Region 8 ( 260.00) ( 260.00) - - - - - - - - - - - Region 9 ( 310.10) ( 296.27) ( 296.93) - ( 321.67) ( 321.67) - - - - ( 311.39) ( 311.39) ( 311.39) Region 10 ( 248.50) - - - - - - ( 250.00) ( 247.50) - ( 247.50) ( 247.50) ( 250.00) Region 11 ( 325.43) ( 325.00) ( 325.00) - ( 376.00) ( 376.00) ( 376.00) - - - ( 250.00) - ( 250.00) Region 12 ( 265.00) ( 265.00) ( 265.00) ( 265.00) - - - - - - - - - Region 13 ( 244.69) ( 245.00) ( 230.00) ( 232.50) - - - - ( 227.50) ( 227.50) ( 265.00) ( 265.00) ( 265.00)
3/16 (4.7625)CAR ( 260.00) ( 260.00) - - - - - - - - - - - Region 1 ( 323.00) ( 320.00) ( 304.00) ( 320.00) ( 320.00) ( 340.00) ( 333.00) ( 333.00) ( 320.00) ( 320.00) ( 320.00) - - Region 2 ( 308.00) ( 316.00) ( 283.33) - ( 376.67) ( 285.00) ( 277.89) - ( 321.22) ( 286.67) - - ( 317.22) Region 3 ( 306.76) ( 310.00) ( 307.50) - ( 307.50) ( 325.00) - ( 293.33) ( 305.00) ( 305.00) ( 307.50) ( 300.00) - Region 4A ( 375.63) - ( 380.00) ( 380.00) ( 380.00) - - - ( 353.75) ( 380.00) ( 380.00) - - MIMAROPA ( 388.27) - ( 387.42) ( 387.42) ( 387.42) ( 387.42) - ( 387.42) - ( 387.42) ( 391.67) ( 390.00) - Region 5 ( 320.00) - ( 320.00) - - - - - - ( 320.00) - - - Region 6 ( 318.81) ( 318.60) ( 318.47) ( 318.47) ( 319.40) - ( 319.30) - - - - - ( 318.60) Region 7 ( 326.77) ( 302.30) - ( 320.96) ( 320.96) - ( 369.00) - ( 324.92) ( 324.92) ( 325.00) - ( 326.09) Region 8 ( 375.00) ( 375.00) - - - - - - - - - - - Region 9 ( 360.27) ( 356.17) ( 354.50) - ( 350.14) ( 350.14) - - - - ( 370.30) ( 370.30) ( 370.30) Region 10 ( 337.50) - - - - - - ( 337.50) - - - - - Region 11 ( 318.96) ( 315.50) ( 345.00) - ( 392.50) ( 356.25) ( 392.50) - - ( 241.68) ( 248.75) - ( 259.50) Region 12 ( 278.52) ( 286.71) ( 289.63) ( 289.63) - ( 288.17) ( 268.00) - ( 271.33) ( 276.33) ( 258.33) - - Region 13 ( 298.03) ( 314.17) ( 287.50) ( 278.50) ( 292.50) - - - ( 283.33) ( 304.17) ( 300.00) ( 313.25) ( 308.83)

5-04
Table 5.04 (continued) MONTHLY RETAIL PRICES OF ORDINARY PLYWOOD: 2019(Php/Panel(4'x8'))
Thicknessinch (mm) Region Average Jan Feb Mar Apr May Jun Jul Aug Sept Oct Nov Dec
1/4 (6.35)NCR ( 396.52) ( 389.39) ( 385.50) ( 385.50) ( 385.50) ( 392.44) ( 392.44) ( 406.19) ( 406.19) - ( 406.19) ( 406.19) ( 406.19) CAR ( 355.73) ( 338.33) - - - - - - - - ( 373.13) - - Region 1 ( 360.13) ( 362.66) ( 344.33) ( 363.00) ( 362.58) ( 362.58) ( 363.41) ( 357.68) ( 365.75) ( 365.75) ( 358.33) - ( 355.33) Region 2 ( 312.88) ( 316.75) ( 366.67) - ( 304.93) ( 298.20) ( 297.39) - ( 300.88) ( 315.74) - - ( 302.44) Region 3 ( 339.52) ( 336.43) ( 336.02) - ( 341.78) ( 346.00) ( 343.17) ( 324.00) ( 329.50) ( 353.75) ( 345.80) ( 338.75) - Region 4A ( 365.83) - ( 360.00) ( 360.00) ( 366.67) - - - - ( 375.00) ( 367.50) - - MIMAROPA ( 448.95) ( 453.66) ( 386.33) ( 452.66) ( 445.42) ( 447.08) - ( 445.42) - ( 445.42) ( 482.92) ( 481.66) - Region 5 ( 342.07) - ( 352.57) - - - - - - ( 331.57) - - - Region 6 ( 352.49) ( 356.58) ( 357.37) ( 345.91) ( 346.59) - ( 354.83) - - - - - ( 353.64) Region 7 ( 378.82) ( 371.67) - ( 385.32) ( 381.00) - ( 416.00) - ( 363.29) ( 372.63) ( 365.00) - ( 375.68) Region 8 ( 334.50) ( 334.50) - - - - - - - - - - - Region 9 ( 386.77) ( 374.29) ( 400.96) - ( 393.00) ( 393.00) - - - - ( 382.05) ( 382.05) ( 382.05) Region 10 ( 399.60) - - - - - - ( 428.00) ( 415.00) - ( 385.00) ( 385.00) ( 385.00) Region 11 ( 308.60) ( 423.75) - - - - ( 300.00) - - ( 262.50) ( 273.00) - ( 283.75) Region 12 ( 291.46) ( 300.00) ( 285.00) ( 288.33) - ( 290.00) ( 297.50) - ( 292.50) ( 303.33) ( 275.00) - - Region 13 ( 342.64) ( 350.00) ( 345.00) ( 347.50) ( 332.50) - - - ( 304.17) ( 314.17) ( 415.00) ( 333.75) ( 341.67)
1/2 (12.7)NCR ( 702.39) ( 699.94) ( 702.17) ( 702.17) ( 702.17) ( 702.29) ( 702.29) ( 703.06) ( 703.06) - ( 703.06) ( 703.06) ( 703.06) CAR ( 640.31) ( 621.33) - - - - - - - - ( 659.28) - - Region 1 ( 716.62) ( 691.00) ( 674.00) ( 707.66) ( 712.22) ( 942.69) ( 716.66) ( 701.00) ( 699.75) ( 699.75) ( 696.44) - ( 641.66) Region 2 ( 570.78) ( 559.80) ( 564.85) - ( 579.59) ( 565.06) ( 569.60) - ( 537.19) ( 610.24) - - ( 579.93) Region 3 ( 664.30) ( 658.80) ( 651.40) - ( 657.33) ( 669.50) ( 678.00) ( 631.50) ( 652.00) ( 692.83) ( 666.60) ( 685.00) - Region 4A ( 635.33) - ( 626.50) ( 626.50) ( 626.50) - - - ( 612.50) ( 660.00) ( 660.00) - - MIMAROPA ( 805.56) ( 790.00) ( 765.00) ( 790.00) ( 774.17) ( 774.17) - ( 774.17) - ( 774.17) ( 904.17) ( 904.17) - Region 5 ( 707.26) - ( 682.67) - - - - - - ( 731.85) - - - Region 6 ( 679.89) ( 680.63) ( 677.90) ( 673.03) ( 676.58) - ( 683.58) - - - - - ( 687.61) Region 7 ( 654.35) ( 664.06) - ( 637.41) ( 652.62) - ( 688.00) - ( 698.45) ( 663.04) ( 678.00) - ( 553.24) Region 8 ( 677.00) ( 677.00) - - - - - - - - - - - Region 9 ( 738.00) ( 949.33) ( 949.33) - ( 673.33) ( 673.33) - - - - ( 640.23) ( 640.23) ( 640.23) Region 10 ( 643.37) - - - - - - ( 671.00) ( 630.60) - ( 632.53) ( 632.53) ( 650.20) Region 11 ( 647.56) ( 901.25) - - - - - - - ( 527.50) ( 637.50) - ( 524.00) Region 12 ( 547.50) ( 560.00) ( 545.00) ( 545.83) - ( 545.83) ( 548.34) - ( 538.33) ( 551.67) ( 545.00) - - Region 13 ( 637.64) ( 720.00) ( 610.00) ( 603.75) ( 657.50) - - - ( 782.50) ( 652.50) ( 542.50) ( 585.00) ( 585.00)

5-04
Table 5.04 (concluded) MONTHLY RETAIL PRICES OF ORDINARY PLYWOOD: 2019(Php/Panel(4'x8'))
Thicknessinch (mm) Region Average Jan Feb Mar Apr May Jun Jul Aug Sept Oct Nov Dec
3/4 (19.05)NCR ( 1,150.61) ( 1,141.67) ( 1,141.67) ( 1,141.67) ( 1,141.67) ( 1,154.88) ( 1,154.88) ( 1,156.06) ( 1,156.06) - ( 1,156.06) ( 1,156.06) ( 1,156.06) CAR ( 1,036.50) ( 1,092.50) - - - - - - - - ( 980.50) - - Region 1 ( 1,176.95) ( 1,332.50) ( 1,033.00) ( 1,127.00) ( 1,164.50) - ( 1,166.50) ( 1,334.50) ( 1,204.50) ( 1,204.50) ( 991.50) - ( 1,211.00) Region 2 ( 1,044.36) ( 1,074.90) ( 1,006.61) - ( 1,078.30) ( 994.30) ( 1,024.56) - ( 1,032.09) ( 1,098.20) - - ( 1,045.93) Region 3 ( 1,068.75) ( 1,082.53) ( 1,071.40) - ( 1,061.28) ( 1,069.75) ( 1,111.50) ( 1,011.20) ( 1,065.60) ( 1,088.75) ( 1,062.50) ( 1,063.00) - Region 4A ( 1,082.71) - ( 1,120.00) ( 1,120.00) ( 1,120.00) - - - ( 1,021.25) ( 1,057.50) ( 1,057.50) - - MIMAROPA ( 1,244.59) ( 1,206.22) ( 1,206.22) ( 1,194.00) ( 1,194.00) ( 1,206.22) - ( 1,209.56) - ( 1,209.56) ( 1,387.78) ( 1,387.78) - Region 5 ( 1,104.89) - ( 1,078.40) - - - - - - ( 1,131.37) - - - Region 6 ( 1,075.82) ( 1,077.84) ( 1,072.91) ( 1,059.81) ( 1,067.41) - ( 1,098.68) - - - - - ( 1,078.26) Region 7 ( 1,088.47) ( 1,080.23) - ( 1,098.17) ( 1,092.42) - ( 1,110.00) - ( 1,165.81) ( 1,086.18) ( 955.00) - ( 1,119.93) Region 8 ( 1,085.00) ( 1,085.00) - - - - - - - - - - - Region 9 ( 1,064.86) ( 1,045.89) ( 1,189.22) - ( 1,032.50) ( 1,032.50) - - - - ( 1,051.30) ( 1,051.30) ( 1,051.30) Region 10 ( 981.23) - - - - - - ( 1,036.66) ( 996.33) - ( 976.57) ( 976.57) ( 920.00) Region 11 ( 847.50) ( 955.00) - - - - - - - - ( 775.00) - ( 812.50) Region 12 ( 1,034.33) - - - - ( 1,045.00) ( 1,045.00) - ( 1,045.00) ( 1,045.00) ( 991.67) - - Region 13 ( 916.57) ( 921.17) ( 910.00) ( 920.00) ( 913.75) - - - ( 949.17) ( 920.00) ( 885.00) ( 915.00) ( 915.00)

5-05
Table 5.05 MONTHLY RETAIL PRICES OF MARINE PLYWOOD: 2019(Php/Panel(4'x8'))
Thicknessinch (mm) Region Average Jan Feb Mar Apr May Jun Jul Aug Sept Oct Nov Dec
1/4 (6.35)NCR ( 459.70) ( 457.33) ( 459.69) ( 459.69) ( 459.69) ( 459.00) ( 459.00) ( 460.47) ( 460.47) - ( 460.47) ( 460.47) ( 460.47) CAR ( 393.58) ( 386.89) - - - - - - - - ( 400.27) - - Region 1 ( 403.91) ( 414.63) ( 387.00) ( 400.33) ( 402.81) ( 404.06) ( 404.18) ( 403.66) ( 407.22) ( 434.11) ( 401.15) - ( 383.83) Region 2 ( 372.16) ( 364.39) ( 368.75) - ( 377.90) ( 364.30) ( 388.72) - ( 375.18) ( 376.29) - - ( 361.75) Region 3 ( 388.78) ( 403.00) ( 395.63) - ( 389.33) ( 391.13) ( 384.90) ( 385.72) ( 378.56) ( 398.13) ( 384.14) ( 377.29) - Region 4A ( 431.77) - ( 430.83) ( 430.83) ( 431.46) - - - ( 432.50) ( 432.50) ( 432.50) - - MIMAROPA ( 547.50) ( 547.50) ( 547.50) ( 547.50) ( 547.50) ( 547.50) - ( 547.50) - ( 547.50) ( 547.50) ( 547.50) - Region 5 ( 429.46) - ( 434.52) - - - - - - ( 424.40) - - - Region 6 ( 382.02) ( 384.15) ( 385.96) ( 368.63) ( 370.55) - ( 399.80) - - - - - ( 383.02) Region 7 ( 483.83) ( 441.24) - ( 445.94) ( 457.81) - ( 532.00) - ( 502.54) ( 492.92) ( 503.00) - ( 495.17) Region 8 ( 382.50) ( 382.50) - - - - - - - - - - - Region 9 ( 458.31) ( 440.35) ( 433.69) - ( 416.91) ( 416.91) - - - - ( 500.10) ( 500.10) ( 500.10) Region 10 ( 456.72) - - - - - - ( 388.33) ( 432.10) - ( 486.84) ( 486.84) ( 489.51) Region 11 ( 387.86) ( 280.00) - - ( 420.00) ( 280.00) ( 452.50) - - ( 411.25) ( 580.00) - ( 291.25) Region 12 ( 375.08) ( 510.00) ( 510.00) ( 320.00) - ( 321.67) ( 337.09) - ( 329.58) ( 329.58) ( 342.75) - - Region 13 ( 380.97) ( 365.00) ( 368.00) ( 363.25) ( 360.00) - - - ( 380.00) ( 366.25) ( 415.00) ( 437.50) ( 373.75)
1/2 (12.7)NCR ( 843.16) ( 832.81) ( 837.19) ( 837.19) ( 837.19) ( 846.00) ( 846.00) ( 847.67) ( 847.67) - ( 847.67) ( 847.67) ( 847.67) CAR ( 709.05) ( 706.94) - - - - - - - - ( 711.15) - - Region 1 ( 754.32) ( 792.38) ( 758.00) ( 756.09) ( 752.06) ( 754.81) ( 703.50) ( 755.67) ( 749.89) ( 812.45) ( 748.22) - ( 714.41) Region 2 ( 696.13) ( 648.12) ( 692.20) - ( 715.14) ( 680.00) ( 696.80) - ( 724.17) ( 717.64) - - ( 694.99) Region 3 ( 751.35) ( 754.64) ( 755.35) - ( 754.61) ( 752.06) ( 749.15) ( 731.89) ( 751.05) ( 773.65) ( 755.83) ( 735.27) - Region 4A ( 990.06) - ( 953.33) ( 953.33) ( 961.67) - - - ( 1,024.00) ( 1,024.00) ( 1,024.00) - - MIMAROPA ( 1,449.17) ( 1,551.67) ( 1,428.34) ( 1,428.34) ( 1,428.34) ( 1,428.34) - ( 1,480.00) - ( 1,480.00) ( 1,400.00) ( 1,417.50) - Region 5 ( 1,018.27) - ( 1,150.92) - - - - - - ( 885.62) - - - Region 6 ( 775.74) ( 795.40) ( 785.37) ( 761.74) ( 763.17) - ( 769.10) - - - - - ( 779.66) Region 7 ( 796.56) ( 760.63) - ( 762.03) ( 776.08) - ( 892.00) - ( 789.75) ( 798.63) ( 807.00) - ( 786.41) Region 8 ( 777.00) ( 777.00) - - - - - - - - - - - Region 9 ( 858.94) ( 911.01) ( 914.34) - ( 751.94) ( 751.94) - - - - ( 894.46) ( 894.46) ( 894.46) Region 10 ( 689.43) - - - - - - ( 717.50) ( 736.67) - ( 664.33) ( 664.33) ( 664.33) Region 11 ( 556.43) ( 527.50) - - ( 527.50) ( 527.50) ( 527.50) - - ( 620.00) ( 582.50) - ( 582.50) Region 12 ( 748.88) ( 1,000.28) ( 1,000.28) ( 787.17) - ( 690.00) ( 643.33) - ( 627.50) ( 627.50) ( 615.00) - - Region 13 ( 702.92) ( 848.75) ( 717.50) ( 696.25) ( 623.75) - - - ( 860.00) ( 610.00) ( 610.00) ( 750.00) ( 610.00)

5-05
Table 5.05 (concluded) MONTHLY RETAIL PRICES OF MARINE PLYWOOD: 2019(Php/Panel(4'x8'))
Thicknessinch (mm) Region Average Jan Feb Mar Apr May Jun Jul Aug Sept Oct Nov Dec
3/4 (19.05)NCR ( 1,308.21) ( 1,300.63) ( 1,301.88) ( 1,301.88) ( 1,301.88) ( 1,312.00) ( 1,312.00) ( 1,312.00) ( 1,312.00) - ( 1,312.00) ( 1,312.00) ( 1,312.00) CAR ( 1,262.39) ( 1,238.61) - - - - - - - - ( 1,286.17) - - Region 1 ( 1,326.74) ( 1,369.71) ( 1,331.41) ( 1,321.59) ( 1,322.31) ( 1,322.31) ( 1,314.25) ( 1,315.50) ( 1,311.66) ( 1,394.33) ( 1,321.06) - ( 1,270.00) Region 2 ( 1,216.87) ( 1,289.80) ( 1,217.48) - ( 1,299.60) ( 1,267.40) ( 1,263.69) - ( 1,273.99) ( 943.84) - - ( 1,179.14) Region 3 ( 1,227.65) ( 1,279.47) ( 1,277.35) - ( 1,214.83) ( 1,217.31) ( 1,236.35) ( 1,197.67) ( 1,217.09) ( 1,217.65) ( 1,222.39) ( 1,196.42) - Region 4A ( 1,537.50) - ( 1,543.33) ( 1,543.33) ( 1,563.33) - - - ( 1,525.00) ( 1,525.00) ( 1,525.00) - - MIMAROPA ( 2,320.00) ( 2,320.00) ( 2,320.00) ( 2,320.00) ( 2,320.00) ( 2,320.00) - ( 2,320.00) - ( 2,320.00) ( 2,320.00) ( 2,320.00) - Region 5 ( 1,605.54) - ( 1,710.50) - - - - - - ( 1,500.58) - - - Region 6 ( 1,232.94) ( 1,272.41) ( 1,262.30) ( 1,196.10) ( 1,199.29) - ( 1,245.24) - - - - - ( 1,222.28) Region 7 ( 1,289.35) ( 1,237.96) - ( 1,268.26) ( 1,245.35) - ( 1,312.00) - ( 1,303.35) ( 1,317.00) ( 1,325.00) - ( 1,305.87) Region 8 ( 1,110.00) ( 1,110.00) - - - - - - - - - - - Region 9 ( 1,305.46) ( 1,330.09) ( 1,330.09) - ( 1,212.82) ( 1,212.82) - - - - ( 1,350.80) ( 1,350.80) ( 1,350.80) Region 10 ( 1,196.37) - - - - - - ( 1,180.00) ( 1,142.19) - ( 1,223.89) ( 1,211.89) ( 1,223.89) Region 11 ( 828.57) ( 805.00) - - ( 805.00) ( 805.00) ( 875.00) - - ( 900.00) ( 805.00) - ( 805.00) Region 12 ( 1,164.67) ( 1,509.44) ( 1,535.00) ( 1,096.67) - ( 1,041.67) ( 1,030.83) - ( 1,041.67) ( 1,041.67) ( 1,020.42) - - Region 13 ( 1,067.85) ( 1,037.50) ( 1,036.25) ( 1,059.17) ( 1,085.00) - - - ( 1,062.50) ( 1,064.00) ( 1,115.00) ( 1,066.25) ( 1,085.00)

5-06
Table 5.06MONTHLY RETAIL PRICES OF STANDARD LAWANIT: 2019(Php/Panel(4'x8'))
Thicknessinch (mm) Region Average Jan Feb Mar Apr May Jun Jul Aug Sept Oct Nov Dec
1/8 (3.175)NCR ( 277.57) ( 250.00) ( 250.00) ( 250.00) ( 250.00) ( 293.33) ( 293.33) ( 293.33) ( 293.33) - ( 293.33) ( 293.33) ( 293.33) CAR ( 298.61) ( 302.22) - - - - - - - - ( 295.00) - - Region 1 ( 354.96) ( 239.33) ( 212.00) ( 243.66) ( 247.33) ( 256.33) ( 345.62) ( 255.33) ( 234.50) ( 1,359.50) ( 247.00) - ( 264.00) Region 2 ( 207.91) ( 220.83) ( 183.39) - ( 203.89) ( 200.60) ( 202.29) - ( 202.92) ( 207.71) - - ( 241.67) Region 3 ( 215.10) ( 240.50) ( 240.50) - ( 212.13) ( 189.50) ( 222.88) ( 212.83) ( 212.13) ( 215.70) ( 213.92) ( 190.88) - Region 4A ( 252.64) - ( 251.67) ( 251.67) ( 255.00) - - - ( 252.50) ( 252.50) ( 252.50) - - MIMAROPA ( 273.52) ( 270.00) ( 270.00) ( 270.00) ( 270.00) ( 270.00) - ( 270.00) - ( 270.00) ( 281.67) ( 290.00) - Region 5 ( 258.16) - ( 278.43) - - - - - - ( 237.88) - - - Region 6 ( 257.12) ( 210.00) ( 281.75) ( 253.17) ( 266.39) - ( 259.38) - - - - - ( 272.04) Region 7 ( 283.53) ( 243.75) - ( 240.00) ( 239.50) - ( 235.00) - ( 305.00) ( 375.00) ( 305.00) - ( 325.00) Region 8 ( 315.00) ( 315.00) - - - - - - - - - - - Region 9 ( 273.45) ( 273.33) ( 280.00) - ( 261.67) ( 261.67) - - - - ( 279.17) ( 279.17) ( 279.17) Region 11 ( 229.38) ( 242.50) - - ( 235.00) - - - - ( 210.00) - - ( 230.00) Region 12 ( 233.75) - - - - ( 238.33) ( 232.22) - ( 232.22) ( 232.22) - - - Region 13 ( 224.38) ( 252.50) ( 250.00) ( 237.50) ( 125.00) - - - ( 243.75) ( 237.50) - - -
3/16 (4.7625)CAR ( 382.50) ( 445.00) - - - - - - - - ( 320.00) - - Region 1 ( 326.00) ( 325.00) ( 292.00) ( 321.00) ( 321.00) ( 316.00) ( 307.50) ( 395.00) - - ( 390.00) - ( 266.50) Region 2 ( 304.47) ( 316.25) ( 305.83) - ( 307.50) ( 307.50) ( 305.63) - ( 299.17) ( 294.16) - - ( 299.72) Region 3 ( 275.85) ( 340.00) ( 340.00) - ( 266.50) ( 266.50) ( 250.17) ( 203.00) ( 270.00) ( 270.00) ( 276.50) - - Region 4A ( 353.75) - ( 352.50) ( 352.50) ( 352.50) - - - ( 355.00) ( 355.00) ( 355.00) - - MIMAROPA ( 380.37) ( 370.84) ( 370.84) ( 370.00) ( 370.00) ( 370.84) - ( 370.84) - ( 370.84) ( 394.17) ( 435.00) - Region 6 ( 327.50) ( 327.50) ( 327.50) ( 330.00) ( 330.00) - ( 330.00) - - - - - ( 320.00) Region 8 ( 335.00) ( 335.00) - - - - - - - - - - - Region 9 ( 343.29) ( 561.17) ( 547.83) - ( 262.00) ( 262.00) - - - - ( 256.67) ( 256.67) ( 256.67) Region 10 ( 223.53) - - - - - - ( 216.00) ( 215.00) - ( 228.33) ( 229.17) ( 229.17) Region 11 ( 207.50) - - - - - - - - - ( 207.50) - ( 207.50) Region 12 ( 250.00) - - - - ( 250.00) - - - - - - - Region 13 ( 232.25) ( 290.00) ( 198.00) ( 198.00) ( 263.50) - - - ( 263.50) ( 245.00) - ( 200.00) ( 200.00)

5-06
Table 5.06 (concluded) MONTHLY RETAIL PRICES OF STANDARD LAWANIT: 2019(Php/Panel(4'x8'))
Thicknessinch (mm) Region Average Jan Feb Mar Apr May Jun Jul Aug Sept Oct Nov Dec
1/4 (6.35)CAR ( 270.00) ( 270.00) - - - - - - - - - - - Region 1 ( 360.00) - ( 360.00) - - - - - - - - - - Region 2 ( 352.50) ( 372.50) ( 320.00) - - - ( 373.75) - ( 341.25) ( 353.75) - - ( 353.75) Region 3 ( 287.67) ( 330.00) ( 330.00) - - - - - - - - ( 203.00) - MIMAROPA ( 364.58) ( 353.33) ( 353.33) ( 350.00) ( 350.00) ( 353.33) - ( 353.33) - ( 353.33) ( 450.00) - - Region 6 ( 320.00) ( 320.00) ( 320.00) - - - - - - - - - - Region 7 ( 301.80) ( 235.00) - - - - - - ( 255.00) ( 255.00) ( 344.00) - ( 420.00) Region 10 ( 250.00) - - - - - - - - - - ( 250.00) ( 250.00) Region 12 ( 233.33) - - - - - ( 233.33) - - - - - - Region 13 ( 271.88) ( 265.00) ( 280.00) - ( 262.50) - - - - - ( 280.00) - -

5-07
Table 5.07MONTHLY RETAIL PRICES OF PLYBOARD: 2019(Php/Panel (4'x8'))
Thicknessinch (mm) Region Average Jan Feb Mar Apr May Jun Jul Aug Sept Oct Nov Dec
3/4 (19.05)NCR ( 1,023.96) ( 1,021.20) ( 1,021.87) ( 1,024.14) ( 1,024.14) ( 1,024.86) ( 1,024.86) ( 1,024.50) ( 1,024.50) - ( 1,024.50) ( 1,024.50) ( 1,024.50) CAR ( 1,038.69) ( 1,016.67) - - - - - - - - ( 1,060.71) - - Region 1 ( 1,083.30) ( 1,108.41) ( 1,064.75) ( 1,059.12) ( 1,068.18) ( 1,075.68) ( 1,083.50) ( 1,094.44) ( 1,101.22) ( 1,100.00) ( 1,088.50) - ( 1,072.50) Region 2 ( 1,039.93) ( 1,011.90) ( 1,065.84) - ( 1,037.96) ( 1,047.80) ( 1,048.47) - ( 1,005.21) ( 1,057.85) - - ( 1,044.44) Region 3 ( 1,040.59) ( 1,019.31) ( 1,081.07) - ( 1,018.85) ( 1,016.47) ( 1,018.85) ( 1,022.04) ( 1,042.04) ( 1,046.10) ( 1,057.35) ( 1,083.86) - Region 4A ( 975.56) - ( 969.17) ( 969.17) ( 982.50) - - - ( 977.50) ( 977.50) ( 977.50) - - MIMAROPA ( 1,322.80) ( 1,168.66) ( 1,283.17) ( 1,283.17) ( 1,310.88) ( 1,310.88) - ( 1,310.88) - ( 1,310.88) ( 1,463.33) ( 1,463.33) - Region 5 ( 1,060.13) - ( 1,066.25) - - - - - - ( 1,054.00) - - - Region 6 ( 999.99) ( 1,048.58) ( 1,034.00) ( 852.39) ( 990.14) - ( 1,036.86) - - - - - ( 1,037.97) Region 7 ( 1,017.14) ( 970.88) - ( 1,023.21) ( 989.46) - ( 1,033.00) - ( 993.88) ( 1,001.38) ( 1,041.00) - ( 1,084.33) Region 8 ( 996.00) ( 996.00) - - - - - - - - - - - Region 9 ( 970.30) ( 851.67) ( 1,008.33) - ( 1,019.17) ( 1,019.17) - - - - ( 964.58) ( 964.58) ( 964.58) Region 10 ( 956.11) - - - - - - ( 921.67) ( 990.00) - ( 927.50) ( 969.17) ( 972.22) Region 11 ( 987.50) ( 1,173.50) - - ( 980.50) ( 980.50) ( 980.50) - - ( 1,000.00) ( 807.50) - ( 990.00) Region 12 ( 923.12) ( 1,095.00) ( 1,060.83) ( 846.67) - ( 889.56) ( 891.78) - ( 873.33) ( 873.33) ( 854.44) - - Region 13 ( 917.48) ( 944.25) ( 897.50) ( 931.83) ( 930.25) - - - ( 951.00) ( 907.50) ( 950.00) ( 860.00) ( 885.00)
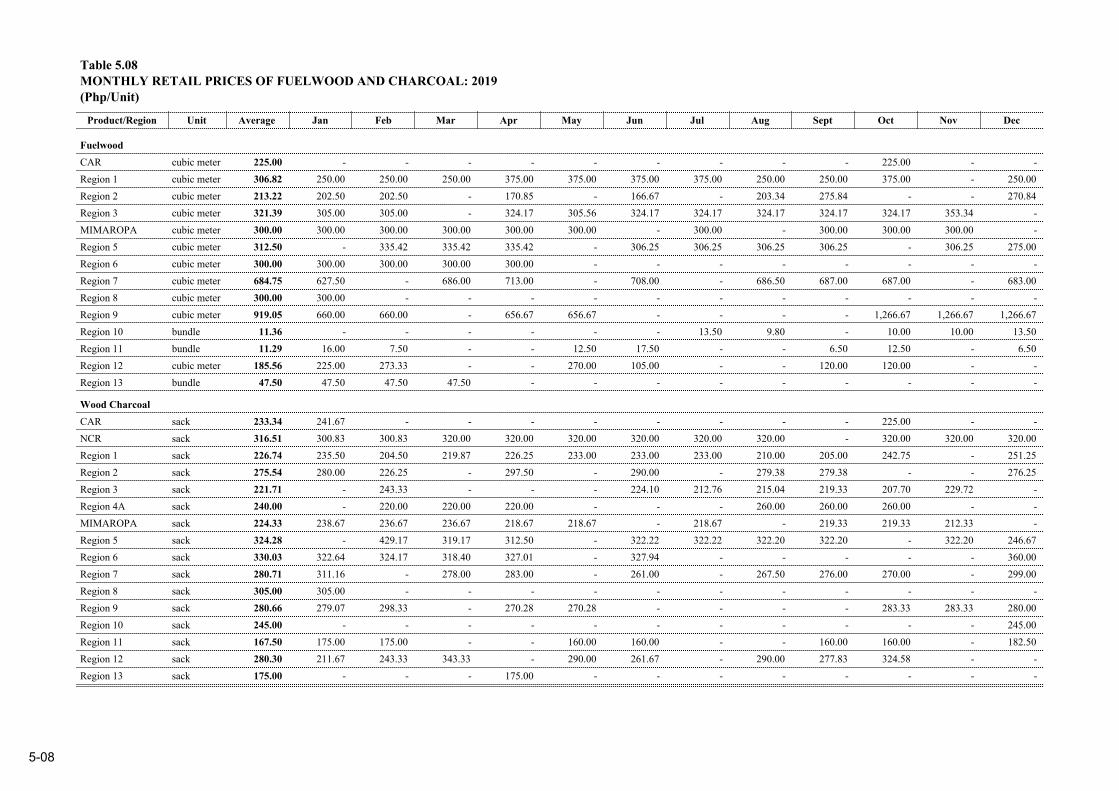
5-08
Table 5.08MONTHLY RETAIL PRICES OF FUELWOOD AND CHARCOAL: 2019(Php/Unit)
Product/Region Unit Average Jan Feb Mar Apr May Jun Jul Aug Sept Oct Nov Dec
FuelwoodCAR cubic meter ( 225.00) - - - - - - - - - ( 225.00) - - Region 1 cubic meter ( 306.82) ( 250.00) ( 250.00) ( 250.00) ( 375.00) ( 375.00) ( 375.00) ( 375.00) ( 250.00) ( 250.00) ( 375.00) - ( 250.00) Region 2 cubic meter ( 213.22) ( 202.50) ( 202.50) - ( 170.85) - ( 166.67) - ( 203.34) ( 275.84) - - ( 270.84) Region 3 cubic meter ( 321.39) ( 305.00) ( 305.00) - ( 324.17) ( 305.56) ( 324.17) ( 324.17) ( 324.17) ( 324.17) ( 324.17) ( 353.34) - MIMAROPA cubic meter ( 300.00) ( 300.00) ( 300.00) ( 300.00) ( 300.00) ( 300.00) - ( 300.00) - ( 300.00) ( 300.00) ( 300.00) - Region 5 cubic meter ( 312.50) - ( 335.42) ( 335.42) ( 335.42) - ( 306.25) ( 306.25) ( 306.25) ( 306.25) - ( 306.25) ( 275.00) Region 6 cubic meter ( 300.00) ( 300.00) ( 300.00) ( 300.00) ( 300.00) - - - - - - - - Region 7 cubic meter ( 684.75) ( 627.50) - ( 686.00) ( 713.00) - ( 708.00) - ( 686.50) ( 687.00) ( 687.00) - ( 683.00) Region 8 cubic meter ( 300.00) ( 300.00) - - - - - - - - - - - Region 9 cubic meter ( 919.05) ( 660.00) ( 660.00) - ( 656.67) ( 656.67) - - - - ( 1,266.67) ( 1,266.67) ( 1,266.67) Region 10 bundle ( 11.36) - - - - - - ( 13.50) ( 9.80) - ( 10.00) ( 10.00) ( 13.50) Region 11 bundle ( 11.29) ( 16.00) ( 7.50) - - ( 12.50) ( 17.50) - - ( 6.50) ( 12.50) - ( 6.50) Region 12 cubic meter ( 185.56) ( 225.00) ( 273.33) - - ( 270.00) ( 105.00) - - ( 120.00) ( 120.00) - - Region 13 bundle ( 47.50) ( 47.50) ( 47.50) ( 47.50) - - - - - - - - -
Wood CharcoalCAR sack ( 233.34) ( 241.67) - - - - - - - - ( 225.00) - - NCR sack ( 316.51) ( 300.83) ( 300.83) ( 320.00) ( 320.00) ( 320.00) ( 320.00) ( 320.00) ( 320.00) - ( 320.00) ( 320.00) ( 320.00) Region 1 sack ( 226.74) ( 235.50) ( 204.50) ( 219.87) ( 226.25) ( 233.00) ( 233.00) ( 233.00) ( 210.00) ( 205.00) ( 242.75) - ( 251.25) Region 2 sack ( 275.54) ( 280.00) ( 226.25) - ( 297.50) - ( 290.00) - ( 279.38) ( 279.38) - - ( 276.25) Region 3 sack ( 221.71) - ( 243.33) - - - ( 224.10) ( 212.76) ( 215.04) ( 219.33) ( 207.70) ( 229.72) - Region 4A sack ( 240.00) - ( 220.00) ( 220.00) ( 220.00) - - - ( 260.00) ( 260.00) ( 260.00) - - MIMAROPA sack ( 224.33) ( 238.67) ( 236.67) ( 236.67) ( 218.67) ( 218.67) - ( 218.67) - ( 219.33) ( 219.33) ( 212.33) - Region 5 sack ( 324.28) - ( 429.17) ( 319.17) ( 312.50) - ( 322.22) ( 322.22) ( 322.20) ( 322.20) - ( 322.20) ( 246.67) Region 6 sack ( 330.03) ( 322.64) ( 324.17) ( 318.40) ( 327.01) - ( 327.94) - - - - - ( 360.00) Region 7 sack ( 280.71) ( 311.16) - ( 278.00) ( 283.00) - ( 261.00) - ( 267.50) ( 276.00) ( 270.00) - ( 299.00) Region 8 sack ( 305.00) ( 305.00) - - - - - - - - - - - Region 9 sack ( 280.66) ( 279.07) ( 298.33) - ( 270.28) ( 270.28) - - - - ( 283.33) ( 283.33) ( 280.00) Region 10 sack ( 245.00) - - - - - - - - - - - ( 245.00) Region 11 sack ( 167.50) ( 175.00) ( 175.00) - - ( 160.00) ( 160.00) - - ( 160.00) ( 160.00) - ( 182.50) Region 12 sack ( 280.30) ( 211.67) ( 243.33) ( 343.33) - ( 290.00) ( 261.67) - ( 290.00) ( 277.83) ( 324.58) - - Region 13 sack ( 175.00) - - - ( 175.00) - - - - - - - -

5-09
Table 5.09MONTHLY RETAIL PRICES OF SELECTED NON-TIMBER FOREST PRODUCTS: 2019(Php/Unit)
Product/Region Unit Average Jan Feb Mar Apr May Jun Jul Aug Sept Oct Nov Dec
Almaciga ResinNCR kilogram ( 60.00) ( 60.00) ( 60.00) ( 60.00) ( 60.00) ( 60.00) ( 60.00) ( 60.00) ( 60.00) - ( 60.00) ( 60.00) ( 60.00) MIMAROPA kilogram ( 18.00) ( 18.00) ( 18.00) ( 18.00) ( 18.00) ( 18.00) - ( 18.00) - ( 18.00) ( 18.00) ( 18.00) ( 18.00)
Anahaw LeavesRegion 1 piece ( 5.31) ( 4.93) ( 5.46) ( 5.47) ( 5.49) ( 5.49) ( 4.98) ( 4.98) ( 5.46) ( 5.46) ( 5.69) - ( 5.00) Region 4A piece ( 4.13) - ( 4.25) ( 4.25) ( 4.25) - - - ( 4.00) ( 4.00) ( 4.00) - - Region 5 piece ( 2.99) - ( 2.15) ( 2.15) ( 3.67) - ( 3.93) ( 3.00) ( 3.00) ( 3.00) - ( 3.00) ( 3.00) Region 8 piece ( 6.00) ( 6.00) - - - - - - - - - - -
Buri LeavesRegion 8 piece ( 55.00) ( 55.00) - - - - - - - - - - - Region 12 piece ( 20.00) ( 20.00) ( 20.00) ( 20.00) - ( 20.00) ( 20.00) - ( 20.00) ( 20.00) ( 20.00) - -
HoneyCAR bottle ( 375.00) - - - - - - - - - ( 375.00) - - Region 1 liter ( 281.82) ( 250.00) ( 250.00) ( 300.00) ( 300.00) ( 300.00) ( 300.00) ( 300.00) ( 250.00) ( 250.00) ( 300.00) - ( 300.00) Region 3 liter ( 496.67) - - - ( 496.67) ( 496.67) - ( 496.67) ( 496.67) ( 496.67) ( 496.67) ( 496.67) - MIMAROPA liter ( 510.00) ( 510.00) ( 510.00) ( 510.00) ( 510.00) ( 510.00) - ( 510.00) - ( 510.00) ( 510.00) ( 510.00) - Region 5 bottle ( 190.39) - ( 200.00) ( 200.00) ( 250.00) - ( 250.00) ( 147.50) ( 168.00) ( 166.00) - ( 166.00) ( 166.00) Region 8 liter ( 525.00) ( 525.00) - - - - - - - - - - - Region 10 liter ( 360.00) - - - - - - ( 360.00) - - - - ( 360.00) Region 11 liter ( 397.62) ( 300.00) ( 533.33) - ( 300.00) ( 525.00) ( 300.00) - - ( 300.00) ( 525.00) - -
Nipa ShinglesRegion 1 piece ( 4.50) ( 4.50) ( 4.50) ( 4.50) ( 4.50) ( 4.50) ( 4.50) ( 4.50) ( 4.50) ( 4.50) ( 4.50) - ( 4.50) Region 2 piece ( 3.29) ( 2.75) ( 3.00) - ( 3.75) - ( 3.00) - ( 3.75) ( 3.25) - - ( 3.50) Region 3 piece ( 9.16) ( 5.63) ( 6.28) - ( 9.45) ( 9.45) ( 9.86) ( 9.64) ( 10.22) ( 9.84) ( 9.72) ( 11.48) - Region 4A piece ( 8.28) - ( 9.30) ( 9.30) ( 9.30) - - - ( 7.25) ( 7.25) ( 7.25) - - MIMAROPA piece ( 8.87) ( 8.53) ( 8.78) ( 8.78) ( 9.13) ( 9.13) - ( 9.81) - ( 9.22) ( 8.22) ( 8.22) - Region 5 piece ( 6.40) - ( 6.42) ( 6.50) ( 6.92) - ( 6.57) ( 6.14) ( 6.15) ( 6.13) - ( 6.13) ( 6.68) Region 6 piece ( 5.82) ( 5.84) ( 5.85) ( 5.70) ( 5.70) - ( 5.92) - - - - - ( 5.89) Region 7 piece ( 5.06) ( 5.00) - ( 5.00) ( 5.00) - ( 5.00) - ( 5.50) ( 5.00) ( 5.00) - ( 5.00) Region 8 piece ( 9.00) ( 9.00) - - - - - - - - - - - Region 9 piece ( 15.06) ( 16.06) ( 16.52) - ( 12.90) ( 12.90) - - - - ( 15.69) ( 15.69) ( 15.69) Region 10 piece ( 7.80) - - - - - - ( 8.00) ( 7.90) - ( 7.10) ( 8.00) ( 8.00) Region 11 piece ( 8.38) ( 8.00) ( 11.00) - ( 9.50) ( 8.00) ( 7.50) - - ( 8.00) ( 8.00) - ( 7.00) Region 12 piece ( 3.86) ( 3.53) ( 3.57) ( 3.57) - ( 3.73) ( 3.57) - ( 3.57) ( 5.72) ( 3.63) - - Region 13 piece ( 6.50) ( 6.50) ( 6.50) ( 5.50) ( 7.50) - - - - - - - -

5-09
Table 5.09 (concluded)MONTHLY RETAIL PRICES OF SELECTED NON-TIMBER FOREST PRODUCTS: 2019(Php/Unit)
Product/Region Unit Average Jan Feb Mar Apr May Jun Jul Aug Sept Oct Nov Dec
Salago BarkRegion 13 kilogram ( 19.00) - - - ( 19.00) - - - - - - - -
SawaliRegion 1 square foot ( 4.25) ( 4.14) - - ( 4.29) ( 4.29) ( 4.23) ( 4.23) ( 4.29) ( 4.29) ( 4.23) - ( 4.23) Region 2 square foot ( 3.09) ( 3.11) ( 3.00) - ( 3.11) - ( 3.11) - ( 3.11) ( 3.11) - - ( 3.11) Region 3 square foot ( 15.63) ( 10.18) ( 10.39) - ( 34.79) ( 9.39) ( 9.57) ( 10.09) ( 34.88) ( 11.15) ( 11.79) ( 14.03) - Region 4A sheet ( 237.50) - ( 210.00) ( 210.00) ( 210.00) - - - ( 265.00) ( 265.00) ( 265.00) - - MIMAROPA square foot ( 26.77) ( 18.89) ( 18.89) ( 18.89) ( 30.66) ( 30.66) - ( 30.66) - ( 32.83) ( 29.73) ( 29.73) - Region 5 square foot ( 11.17) - ( 10.42) ( 10.43) ( 10.92) - ( 11.91) ( 10.97) ( 10.85) ( 11.48) - ( 11.48) ( 12.10) Region 6 square foot ( 4.58) ( 4.42) ( 4.42) ( 4.42) ( 4.71) - ( 4.71) - - - - - ( 4.83) Region 7 square foot ( 6.71) ( 5.92) - ( 7.00) ( 7.00) - ( 7.00) - ( 5.78) ( 7.00) ( 7.00) - ( 7.00) Region 8 square foot ( 8.00) ( 8.00) - - - - - - - - - - - Region 9 square foot ( 5.39) ( 4.69) ( 4.69) - ( 5.67) ( 5.67) - - - - ( 5.67) ( 5.67) ( 5.67) Region 10 sheet ( 190.83) - - - - - - - ( 183.33) - ( 180.00) ( 200.00) ( 200.00) Region 11 sheet ( 168.67) ( 173.33) - - - - ( 167.50) - - ( 167.50) ( 167.50) - ( 167.50) Region 12 sheet ( 159.42) ( 170.00) ( 167.50) - - ( 167.50) - - ( 132.67) - - - - Region 13 square foot ( 5.23) ( 5.16) ( 5.16) ( 5.31) ( 5.31) - - - - - - - -
Split RattanNCR bundle ( 22.00) ( 22.00) ( 22.00) ( 22.00) ( 22.00) - - - - - - - - Region 1 piece ( 2.65) ( 2.65) ( 2.65) ( 2.65) ( 2.65) ( 2.65) ( 2.65) ( 2.65) ( 2.65) ( 2.65) ( 2.65) - ( 2.65) Region 3 piece ( 3.07) ( 2.00) - - ( 3.20) ( 3.20) ( 3.20) ( 3.20) ( 3.20) ( 3.20) ( 3.20) ( 3.20) - MIMAROPA kilogram ( 15.00) ( 15.00) ( 15.00) ( 15.00) ( 15.00) ( 15.00) - ( 15.00) - ( 15.00) ( 15.00) ( 15.00) - Region 5 piece ( 3.00) - - - - - - - - ( 3.00) - - - Region 9 bundle ( 132.00) - - - ( 140.00) ( 140.00) - - - - ( 120.00) ( 120.00) ( 140.00) Region 10 bundle ( 128.50) - - - - - - ( 130.00) ( 127.50) - ( 130.00) ( 127.50) ( 127.50) Region 11 piece ( 2.25) ( 2.25) - ( 2.25) ( 2.25) ( 2.25) - - - - - - - Region 12 kilogram ( 40.00) ( 40.00) ( 40.00) ( 40.00) - ( 40.00) - - - - - - - Region 13 bundle ( 150.00) ( 150.00) ( 150.00) - - - - - - - - - -

5-10
Table 5.10MONTHLY RETAIL PRICES OF UNSPLIT RATTAN: 2019(Php/Pole or Lineal meter)
Species Region Average Jan Feb Mar Apr May Jun Jul Aug Sept Oct Nov Dec
Kalapi2 cm & above NCR ( 27.09) ( 24.67) ( 24.67) ( 24.67) ( 28.00) ( 28.00) ( 28.00) ( 28.00) ( 28.00) - ( 28.00) ( 28.00) ( 28.00)
Region 13 ( 16.00) ( 16.00) ( 16.00) ( 16.00) ( 16.00) - - - - - - - - below 2 cm NCR ( 22.73) ( 14.00) ( 14.00) ( 14.00) ( 26.00) ( 26.00) ( 26.00) ( 26.00) ( 26.00) - ( 26.00) ( 26.00) ( 26.00)
Region 13 ( 7.63) ( 7.63) ( 7.63) ( 7.63) ( 7.63) - - - - - - - -
Limuran2 cm & above Region 2 ( 5.80) ( 9.00) ( 10.00) - ( 9.00) ( 1.20) - - ( 1.20) ( 1.20) - - ( 9.00)
Region 3 ( 33.70) ( 25.70) ( 25.70) - ( 35.70) ( 35.70) ( 35.70) ( 35.70) ( 35.70) ( 35.70) ( 35.70) ( 35.70) - MIMAROPA ( 18.00) ( 18.00) ( 18.00) ( 18.00) ( 18.00) ( 18.00) - ( 18.00) - ( 18.00) ( 18.00) ( 18.00) -
below 2 cm Region 2 ( 2.40) ( 4.00) ( 4.00) - - ( 0.80) - - ( 0.80) ( 0.80) - - ( 4.00) Region 3 ( 14.40) ( 10.40) ( 10.40) - ( 15.40) ( 15.40) ( 15.40) ( 15.40) ( 15.40) ( 15.40) ( 15.40) ( 15.40) - MIMAROPA ( 4.00) ( 4.00) ( 4.00) ( 4.00) ( 4.00) ( 4.00) - ( 4.00) - ( 4.00) ( 4.00) ( 4.00) -
Palasan2 cm & above Region 3 ( 33.70) ( 25.70) ( 25.70) - ( 35.70) ( 35.70) ( 35.70) ( 35.70) ( 35.70) ( 35.70) ( 35.70) ( 35.70) -
MIMAROPA ( 14.00) ( 14.00) ( 14.00) ( 14.00) ( 14.00) ( 14.00) - ( 14.00) - ( 14.00) ( 14.00) ( 14.00) - Region 13 ( 15.33) ( 15.33) ( 15.33) ( 15.33) ( 15.33) - - - - - - - -
below 2 cm Region 3 ( 14.40) ( 10.40) ( 10.40) - ( 15.40) ( 15.40) ( 15.40) ( 15.40) ( 15.40) ( 15.40) ( 15.40) ( 15.40) - MIMAROPA ( 4.00) ( 4.00) ( 4.00) ( 4.00) ( 4.00) ( 4.00) - ( 4.00) - ( 4.00) ( 4.00) ( 4.00) - Region 13 ( 7.38) ( 7.38) ( 7.38) ( 7.38) ( 7.38) - - - - - - - -
Tumalim2 cm & above NCR ( 27.09) ( 24.67) ( 24.67) ( 24.67) ( 28.00) ( 28.00) ( 28.00) ( 28.00) ( 28.00) - ( 28.00) ( 28.00) ( 28.00)
Region 2 ( 5.80) ( 9.00) ( 10.00) - ( 9.00) ( 1.20) - - ( 1.20) ( 1.20) - - ( 9.00) MIMAROPA ( 18.00) ( 18.00) ( 18.00) ( 18.00) ( 18.00) ( 18.00) - ( 18.00) - ( 18.00) ( 18.00) ( 18.00) - Region 13 ( 15.33) ( 15.33) ( 15.33) ( 15.33) ( 15.33) - - - - - - - -
below 2 cm NCR ( 22.73) ( 14.00) ( 14.00) ( 14.00) ( 26.00) ( 26.00) ( 26.00) ( 26.00) ( 26.00) - ( 26.00) ( 26.00) ( 26.00) Region 2 ( 2.40) ( 4.00) ( 4.00) - - ( 0.80) - - ( 0.80) ( 0.80) - - ( 4.00) MIMAROPA ( 4.00) ( 4.00) ( 4.00) ( 4.00) ( 4.00) ( 4.00) - ( 4.00) - ( 4.00) ( 4.00) ( 4.00) - Region 13 ( 5.33) ( 5.33) ( 5.33) ( 5.33) ( 5.33) - - - - - - - -

5-11
Table 5.11MONTHLY RETAIL PRICES OF BAMBOO: 2019(Php/Piece)
Species Region Average Jan Feb Mar Apr May Jun Jul Aug Sept Oct Nov Dec
AfusRegion 12 ( 59.50) - - - - - ( 60.00) - ( 58.00) ( 60.00) ( 60.00) - -
BayogCAR ( 60.00) ( 40.00) - - - - - - - - ( 80.00) - - Region 3 ( 79.00) ( 72.50) ( 72.50) - ( 80.00) ( 80.00) ( 80.00) ( 80.00) ( 80.00) ( 82.50) ( 80.00) ( 82.50) - Region 9 ( 60.00) - - - ( 60.00) ( 60.00) - - - - ( 60.00) ( 60.00) ( 60.00) Region 11 ( 80.00) ( 80.00) - - - ( 80.00) ( 80.00) - - ( 80.00) - - - Region 12 ( 120.00) - - - - - - - - ( 120.00) ( 120.00) - -
BoloCAR ( 60.00) ( 40.00) - - - - - - - - ( 80.00) - - Region 3 ( 24.00) ( 20.00) ( 20.00) - ( 25.00) ( 25.00) ( 25.00) ( 25.00) ( 25.00) ( 25.00) ( 25.00) ( 25.00) - Region 9 ( 60.00) - - - ( 60.00) ( 60.00) - - - - ( 60.00) ( 60.00) ( 60.00) Region 11 ( 80.00) ( 80.00) - - - ( 80.00) ( 80.00) - - ( 80.00) - - - Region 12 ( 93.33) - - - - - - - - ( 93.33) ( 93.33) - -
BuhoCAR ( 60.00) ( 40.00) - - - - - - - - ( 80.00) - - Region 3 ( 17.37) ( 16.17) ( 16.17) - ( 17.67) ( 17.67) ( 17.67) ( 17.67) ( 17.67) ( 17.67) ( 17.67) ( 17.67) - Region 5 ( 136.25) - ( 80.00) ( 80.00) ( 120.00) - ( 120.00) ( 120.00) ( 190.00) ( 190.00) - ( 190.00) - Region 9 ( 180.00) - - - ( 180.00) ( 180.00) - - - - ( 180.00) ( 180.00) ( 180.00) Region 11 ( 65.00) ( 65.00) - - - ( 65.00) ( 65.00) - - ( 65.00) - - -
Kawayan KilingRegion 3 ( 108.50) ( 100.00) ( 185.00) - ( 100.00) ( 100.00) ( 100.00) ( 100.00) ( 100.00) ( 100.00) ( 100.00) ( 100.00) - Region 5 ( 146.67) - ( 135.00) ( 135.00) ( 150.00) - ( 150.00) ( 150.00) ( 150.00) ( 150.00) - ( 150.00) ( 150.00)
Kawayan TinikCAR ( 50.00) ( 50.00) - - - - - - - - ( 50.00) - - Region 3 ( 184.84) ( 173.00) ( 171.25) - ( 181.25) ( 181.25) ( 181.25) ( 181.25) ( 181.25) ( 208.33) ( 181.25) ( 208.33) - Region 5 ( 150.00) - ( 150.00) ( 150.00) - - - - - - - - - Region 9 ( 250.00) - - - ( 250.00) ( 250.00) - - - - ( 250.00) ( 250.00) ( 250.00) Region 11 ( 80.00) ( 80.00) - - - ( 80.00) ( 80.00) - - ( 80.00) - - - Region 12 ( 47.08) ( 43.50) ( 43.50) ( 43.50) - ( 37.00) ( 55.00) - ( 57.50) ( 48.33) ( 48.33) - -


6-01
Table 6.01FOREST CHARGES BY PRODUCT: 1999-2019(In pesos)
Year Roundwood Non-Timber Forest Products
2019 569,311 3,768,2702018 375,549 2,292,8832017 1,801,570 2,048,6682016 7,616,349 3,384,971
2015 8,845,121 2,404,2102014 1,610,442 3,042,8872013 195,753 3,513,0272012 2,484,567 4,272,9822011 24,027,469 3,647,377
2010 153,664,182 3,197,3262009 105,867,049 2,918,4462008 162,372,399 3,605,9742007 172,588,815 3,902,8392006 191,878,480 6,386,415
2005 127,183,532 9,194,2002004 229,255,641 11,522,9162003 215,109,826 7,441,0172002 106,421,412 5,221,2802001 164,300,634 9,307,995
2000 135,100,411 9,153,5411999 165,200,309 8,898,043
Source: DENR Regional Reports

6-02
Table 6.02FOREST CHARGES ON ROUNDWOOD HARVESTED BY REGION: 2019(In pesos)
Region Sawlog/Veneer Log
PHILIPPINES 569,311
CAR 96,217MIMAROPA 38,272Region 5 1,948Region 8 8,810Region 13 424,064
Note: No forest charges for Pulpwood, Poles & Piles and Fuelwood/Charcoal.
Source: DENR Regional Reports

6-03
Table 6.03FOREST CHARGES ON NON-TIMBER FOREST PRODUCTS BY REGION: 2019(In pesos)
Region TotalNon-Timber Forest Products
Almaciga Resin Anahaw Poles Bamboo Poles Split Rattan Unsplit Rattan
PHILIPPINES 3,768,270 758,250 2,230 27,441 1,038,067 1,942,283
CAR 5,999 - 5,999 - - Region 2 86,000 - - - - 86,000Region 3 5,246 - - 5,246 - -Region 4A 114,521 - 2,230 13,294 - 98,997MIMAROPA 2,047,317 758,250 - - - 1,289,067Region 5 15,250 - - - - 15,250Region 10 64,402 - - 2,102 - 62,300Region 11 400 - - 400 - -Region 12 400 - - 400 - -Region 13 1,428,735 - - - 1,038,067 390,669
Source: DENR Regional Reports


7-01
Table 7.01SUMMARY STATISTICS FOR FORESTRY ESTABLISHMENTS BY INDUSTRY GROUP: 2017(Values are in thousand pesos, except for number of establishments and employment)
Statistics Total
Industries
Silviculture and other forestry activities Logging Support services to forestry
Number of Establishents 15 9 s 6Employment as of November 15Total 246 175 s 71Paid Employees 178 125 s 53
Total Income 98,623 17,618 s 81,005Total Expense 98,899 19,567 s 79,332Compensation 9,302 6,560 s 2,742Other Expense 89,597 13,007 s 76,590
Value of Output 92,328 13,354 s 78,974Intermediate Expense 75,005 5,818 s 69,187Value Added 10,563 6,497 s 4,066Gross Addition to Tangible Fixed Assets 948 943 - 5Change in Inventories -5,098 -4,664 s -434Subsidies 1,450 1,450 - -
- indicates zero valuess - suppressed data to avoid disclosure of individual establishment's dataNote: Details may not add-up to total due to rounding and/or statistical disclosure control.
Source: 2017 Annual Survey of Philippine Business and Industry (ASPBI)- Agriculture, Forestry and Fishing (Final Results), Philippine Statistics Authority (PSA)

7-02
Table 7.02SUMMARY STATISTICS FOR MANUFACTURING ESTABLISHMENTS FOR ALL MANUFACTURING ESTABLISHMENTS BY INDUSTRY GROUP: 2017(Values are in thousand pesos, except for number of establishments and employment)
Statistics Total
Industries
Sawmilling and planing of wood Manufacture of products of wood, cork, straw and plaiting materials
Manufacture of paper and paper products Manufacture of furniture ¹/
Number of Establishents 1,771 93 386 347 945Employment as of November 15Total 65,808 2,013 16,566 21,855 25,374Paid Employees 65,135 1,950 16,384 21,759 25,042
Total Income 172,944,213 2,523,759 44,908,518 92,540,358 32,971,578Total Expense 153,768,450 2,083,811 40,479,789 81,199,991 30,004,859Compensation 12,545,243 211,135 2,451,748 5,258,903 4,623,457Other Expense 141,223,206 1,872,675 38,028,041 75,941,088 25,381,402
Value of Output 170,548,328 2,396,491 44,982,107 91,248,587 31,921,143Intermediate Expense 126,133,974 1,525,749 34,925,378 67,734,419 21,948,428Value Added 36,957,846 772,563 8,058,750 19,683,303 8,443,230Gross Addition to Tangible Fixed Assets 2,012,719 124,947 438,925 896,892 551,955Change in Inventories 5,063,998 4,858 1,218,029 2,773,308 1,067,803Subsidies 96,239 - 685 95,554 -E-Commerce Sales 103,984 - 36,241 67,743 -
- indicates zero values¹/ may include products other than wood-based products
Note: Details may not add-up to total due to rounding and/or statistical disclosure control.
Source: 2017 Annual Survey of Philippine Business and Industry - Manufacturing Sector (Final Results), Philippine Statistics Authority (PSA)

7-03
Table 7.03GROSS DOMESTIC PRODUCT (GDP) AND GROSS VALUE ADDED (GVA) IN FORESTRY: 1999-2019(In million pesos)
YearAt Constant 2000 Prices At Current Prices
GDP GVA in Forestry % Share to GDP GDP GVA in Forestry % Share to GDP
2019 9,750,598 4,432 0.05 18,613,044 2,367 0.012018 9,206,889 4,221 0.05 17,426,202 2,650 0.022017 8,665,818 3,547 0.04 15,807,596 2,422 0.022016 8,123,375 3,722 0.05 14,480,349 2,485 0.02
2015 7,600,175 4,027 0.05 13,322,041 2,832 0.022014 7,165,478 5,521 0.08 12,634,187 4,729 0.042013 6,750,631 5,380 0.08 11,538,410 4,657 0.042012 6,305,229 3,848 0.06 10,561,089 3,238 0.032011 5,910,201 3,761 0.06 9,708,332 3,871 0.04
2010 5,701,539 2,676 0.05 9,003,480 2,435 0.032009 5,297,240 3,896 0.07 8,026,143 3,758 0.052008 5,237,101 3,977 0.08 7,720,903 3,574 0.052007 5,028,288 3,894 0.08 6,892,721 4,155 0.062006 4,716,231 5,159 0.11 6,271,157 5,126 0.08
2005 4,481,279 4,396 0.10 5,677,750 4,537 0.082004 4,276,941 4,275 0.10 5,120,435 4,330 0.082003 4,008,469 2,759 0.07 4,548,102 2,123 0.052002 3,818,667 2,151 0.06 4,198,345 1,758 0.042001 3,684,340 3,016 0.08 3,888,801 2,741 0.07
2000 3,580,714 5,206 0.15 3,580,714 5,206 0.151999 3,429,434 3,983 0.12 3,244,197 3,325 0.10
Note: The PSA revises the GDP estimates based on an approved revision policy which is consistent with international standard practices on national accounts revisions. Data as of January 2020
Source: Philippine Statistics Authority (PSA)

7-04
Table 7.04NUMBER OF SCHOOLS, ENROLLMENT AND GRADUATES IN FORESTRYAND OTHER RELATED COURSES: SY 1999 - 2019
School Year School(No.)
Enrollment GraduatesTotal Male Female Total Male Female
2018-2019 76 9,033 4,323 4,710 1,726 758 9682017-2018 74 8,517 4,046 4,471 1,743 766 9772016-2017 74 9,687 4,529 5,158 1,321 568 753
2015-2016 75 10,682 5,086 5,596 1,119 519 6002014-2015 75 9,357 4,408 4,949 1,039 464 5752013-2014 82 8,203 3,921 4,282 1,006 459 5472012-2013 85 r 6,625 r 3,278 3,347 957 424 5332011-2012 80 r 5,267 r 2,730 2,537 661 r 333 328
2010-2011 82 r 6,572 r 3,343 3,229 571 r 316 2552009-2010 76 r 5,472 r 3,046 2,426 820 r 423 3972008-2009 70 r 5,864 r 3,450 2,414 779 r 446 3332007-2008 81 r 5,754 r 3,278 2,476 1,019 r 568 4512006-2007 73 r 6,334 r 3,633 2,701 994 r 565 429
2005-2006 76 r 6,773 r 3,907 2,866 1,100 r 641 4592004-2005 72 8,259 4,787 3,472 1,233 … …2003-2004 64 8,457 ... ... 1,388 r 813 5752002-2003 64 8,170 4,822 3,348 1,497 … …2001-2002 65 9,056 5,225 3,831 1,271 717 554
2000-2001 54 9,037 5,432 3,605 1,298 711 5871999-2000 30 3,731 2,297 1,434 1,209 739 470
Note: From 2005 onwards- courses include: Forestry, Agro-forestry, Forest Ranger, Forest Biological Science, Forest Resource Management, and Forest Technologyr - revised… - data not available
Source: Commission on Higher Education (CHED)

7-05
Table 7.05ENROLLMENT AND GRADUATES BY PROGRAM LEVEL IN FORESTRY RELATED COURSES ¹/:SY 2009-2010 to SY 2017-2018
Program LevelSchool Year
2009-2010 2010-2011 2011-2012 2012-2013 2013-2014 2014-2015 2015-2016 2016-2017 2017-2018 2018-2019
EnrolleesTotal 5,472 6,572 r 5,267 r 6,625 8,203 9,357 10,682 9,687 8,517 9,033
Pre-Baccalaureate 783 740 216 724 872 766 852 836 697 414Baccalaureate 4,625 5,752 4,959 5,813 7,098 8,323 9,575 8,501 7,455 8,227Masters 53 67 79 87 221 256 243 335 335 362Doctorate 11 13 13 1 12 12 12 15 30 30
GraduatesTotal 820 571 r 661 r 957 1,006 1,039 1,119 1,321 1,743 1,726
Pre-Baccalaureate 124 100 132 286 196 200 179 191 106 112Baccalaureate 671 440 499 611 746 773 871 1,069 1,568 1,554Masters 23 28 27 54 58 60 63 54 63 54Doctorate 2 3 3 6 6 6 6 7 6 6
¹/ - Courses include: Forestry, Agro-forestry, Forest Ranger, Forest Biological Science, Forest Resource Management and Forest Technologyr - revised... - Data not available
Source: Commission on Higher Education (CHED)