
Regulation of pri-miRNA processing by a long noncoding RNA transcribed from an ultraconserved region
Upload
independentCategory
view
0download
0
Comparative Expression Profile of miRNA and mRNA inPrimary Peripheral Blood Mononuclear Cells Infectedwith Human Immunodeficiency Virus (HIV-1)Ankit Gupta1., Pruthvi Nagilla1., Hai-Son Le2, Coulton Bunney1, Courtney Zych1, Anbupalam
Thalamuthu3, Ziv Bar-Joseph2, Sinnakaruppan Mathavan3, Velpandi Ayyavoo1*
1 Department of Infectious Diseases and Microbiology, Graduate School of Public Health, University of Pittsburgh, Pittsburgh, Pennsylvania, United States of America,
2 Department of Machine Learning, Carnegie Mellon University, Pittsburgh, Pennsylvania, United States of America, 3 Human Genetics, Genome Institute of Singapore,
Singapore
Abstract
Host cells respond to exogenous infectious agents such as viruses, including HIV-1. Studies have evaluated the changesassociated with virus infection at the transcriptional and translational levels of the cellular genes involved in specificpathways. While this approach is useful, in our view it provides only a partial view of genome-wide changes. Recently,technological advances in the expression profiling at the microRNA (miRNA) and mRNA levels have made it possible toevaluate the changes in the components of multiple pathways. To understand the role of miRNA and its interplay with hostcellular gene expression (mRNA) during HIV-1 infection, we performed a comparative global miRNA and mRNA microarrayusing human PBMCs infected with HIV-1. The PBMCs were derived from multiple donors and were infected with virusgenerated from the molecular clone pNL4-3. The results showed that HIV-1 infection led to altered regulation of 21 miRNAsand 444 mRNA more than 2-fold, with a statistical significance of p,0.05. Furthermore, the differentially regulated miRNAand mRNA were shown to be associated with host cellular pathways involved in cell cycle/proliferation, apoptosis, T-cellsignaling, and immune activation. We also observed a number of inverse correlations of miRNA and mRNA expression ininfected PBMCs, further confirming the interrelationship between miRNA and mRNA regulation during HIV-1 infection.These results for the first time provide evidence that the miRNA profile could be an early indicator of host cellulardysfunction induced by HIV-1.
Citation: Gupta A, Nagilla P, Le H-S, Bunney C, Zych C, et al. (2011) Comparative Expression Profile of miRNA and mRNA in Primary Peripheral Blood MononuclearCells Infected with Human Immunodeficiency Virus (HIV-1). PLoS ONE 6(7): e22730. doi:10.1371/journal.pone.0022730
Editor: Fabrizio Mammano, INSERM, France
Received April 11, 2011; Accepted June 29, 2011; Published July 28, 2011
Copyright: � 2011 Gupta et al. This is an open-access article distributed under the terms of the Creative Commons Attribution License, which permitsunrestricted use, distribution, and reproduction in any medium, provided the original author and source are credited.
Funding: This work was supported by ARRA supplement to U01 U0-AI35041 by the NIAID/NIH to VA. The funders had no role in study design, data collection andanalysis, decision to publish, or preparation of the manuscript.
Competing Interests: The authors have declared that no competing interests exist.
* E-mail: [email protected]
. These authors contributed equally to this work.
Introduction
There is remarkable variation in the onset of disease in HIV-1
infected individuals. The replication, spread, and immune
evasion of the virus and the progression of disease depend on
host cellular transcription and gene regulation in virus-specific
target cells and immune cells [1,2,3]. Both viral and host cellular
factors have been shown to contribute to infection, virus
replication, and disease progression. Viral factors include free-
extracellular (cell- and virus-free), virion-associated, and infected
cell-associated viral antigens, as well as infectious and noninfec-
tious virus particles. HIV-1 virus with defective expression of viral
proteins such as Nef, Vpr, Gag, and Pol are shown to induce
differential gene expression [4,5,6]. Host factors include host
genetics (determined by HLA alleles), polymorphisms in HIV
receptors and coreceptors, and genes involved in innate and
adaptive immune responses [7,8,9,10]. Following the landmark
discovery of the CCR5-D32 mutation that protects against HIV
infection [11,12,13], many other genetic variants have been
shown to affect HIV infection and AIDS pathogenesis [7,14,15].
It is likely that, in addition to incomplete immunological control,
host genetic variation and differences in gene expression in the
infected host cells may also contribute to the differential disease
pattern [16,17,18]. Along these lines, attempts were made to
identify host cellular proteins associated with HIV-1 infection
[19,20,21,22]. There is limited information, however, regarding
the regulation of host cellular genes at the transcriptional, post-
transcriptional, and translational levels.
Several studies have shown that HIV-1 infection differentially
regulates host cellular genes and pathways, suggesting that
differential gene expression in infected individuals either acceler-
ates disease progression or enhances resistance to the development
of disease [23,24,25]. Genome-wide association studies have not
fully defined the resistance in exposed uninfected sex workers or
elite controllers, indicating a role for other host cellular factors
[26]. Studies delineating the cellular factors in individuals who
remain uninfected despite repeated exposures to the virus have
found that they over-express anti-viral innate factors, such as
RANTES, SLPI, and other chemokines [27]. It is important to
note that the differential expression of host cellular genes is not
PLoS ONE | www.plosone.org 1 July 2011 | Volume 6 | Issue 7 | e22730

universal, resulting in disease progression at variable rates in
infected individuals [28,29,30].
Gene expression in general is regulated at transcriptional, post-
transcriptional, and translational levels. Recent discoveries have
emphasized a central role for the new class of small non-coding
RNA in gene expression controlling growth, development, and
immune response in vivo [31,32,33]. These non-coding RNAs,
which include microRNA (miRNA), partition function for
interacting RNA (piRNA), and small interfering RNA (siRNA),
are emerging as a major component of the cellular regulatory
pathways that underlie the development and physiology of
complex organisms [34,35,36]. Regulation of gene expression by
miRNA occurs primarily at the post-transcriptional level [37,38].
Recent studies have shown that miRNA have a unique expression
profile in cells of the innate and adaptive immune systems, CNS,
and cancers [39,40,41,42]. Based on these observations, we
suggest that pathogens including viruses could potentially
modulate host cellular transcription at multiple levels by targeting
various factors including miRNAs.
Studies previously have evaluated the expression of either
miRNA or mRNA in cells isolated from HIV-1 infected subjects
[43,44,45,46]. Their results are likely to be influenced by
variabilities in host genetics and viral heterogeneity in addition
to other factors including viral burden. In an effort to understand
host cellular gene regulation during HIV-1 infection, we
performed a comparative global miRNA and mRNA microarray
profiling in PBMCs derived from multiple donors upon infection
with HIV-1. Our results indicate that HIV-1 infection differen-
tially regulated several miRNAs that could potentially regulate
host cellular pathways such as cell cycle, apoptosis, T cell signaling
and cytokine/chemokine responses. Taken together, these results
for the first time provide evidence that the miRNA profile could be
an early indicator of HIV-1 induced host cellular dysfunction.
Materials and Methods
Generation of infectious HIV-1The infectious HIV-1 particles were generated by using the
proviral DNA construct pNL4-3 obtained from the National
Institutes of Health AIDS Research and Reference Reagent
Program (NIH AIDS RRRP). Two million HEK293T cells (a kind
gift from Dr. Michelle Calos, Stanford University) were transfected
with 5 mg of proviral DNA using Polyjet (SignaGen) as suggested
by the manufacturer. Virus titer was measured by p24 antigen
ELISA, and infectivity was assessed by determining multiplicity of
infection (MOI) using the HIV-1 reporter cell line TZM-bl (NIH
AIDS RRRP) as described earlier [47].
Isolation and infection of PBMCs with HIV-1 virusWe purchased normal donor blood from the American Red
Cross Blood Bank in Pittsburgh using appropriate IRB approval
forms from the University of Pittsburgh. PBMCs were isolated by
Ficoll-Hypaque gradient centrifugation. Freshly isolated normal
donor PBMCs (56106/mL) were stimulated with 5 mg/ml PHA-P
(Sigma, St. Louis, MO) for three days. Cells were washed, divided
into two parts and cultured in RPMI medium (GIBCO, CA)
containing 10% FBS (Hyclone, Logan, UT), 1% L-glutamine
(Cambrex, MD), 1% penicillin-streptomycin (GIBCO, CA), and
IL-2 (200 U/mL, Chiron, Emoryville, CA). One half of the cells
were subsequently infected with 0.1 MOI of virus particles using
standard protocols as described [48] and the remaining half of the
culture is maintained under similar conditions and used as control.
Seven days post infection (pi), culture supernatants were assessed
by p24 ELISA for infection and virus replication [47]. Cells were
collected and frozen for miRNA and mRNA isolation. We
performed a total of 16 independent experiments using donor
PBMCs (n = 16).
Total and miRNA isolationPBMCs (both infected and control) were collected, washed with
PBS, and lysed for RNA isolation. Total RNA was isolated using
the TRIzol method (InVitrogen) as suggested by the manufacturer.
Next, to enhance the sensitivity and detection, we enriched the
small RNA using a microRNA isolation kit (SABiosciences) with
two separating columns as per the manufacturer’s instructions.
This allowed us to isolate both miRNA and mRNA, which were
used in the miRNA array and gene expression arrays, respectively.
RNA quality was determined by chip-based capillary electropho-
resis using Agilent Bioanalyzer 2100 (Agilent, CA), according to
the manufacturer’s instructions.
MiRNA profiling using RT2 MicroRNA PCR ArrayFor miRNA profiling studies, we used the SABiosciences RT2
MicroRNA PCR Array system, an optimized real-time PCR assay,
which allows the simultaneous detection of 704 miRNAs,
representing most functional miRNAs, as well as appropriate
housekeeping assays and RNA quality controls. We performed the
assay according to the manufacturer’s protocol. Enriched miRNA
was converted to cDNA using an miRNA first strand synthesis kit.
First strand was used to perform the miRNA PCR array using a
Taqman 7900HT machine. Equal amounts of RNA from both
infected and uninfected cells were used for the first strand and
assayed as per the manufacturer’s protocol.
Gene expression profilingFor total mRNA profiling, we used the Illumina HT-12 array,
which targets more than 25,000 annotated genes with more than
48,000 probes covering well-characterized genes, gene candidates,
and splice variants. One mg of high-quality total RNA from each
sample was used to generate cDNA. Sample labeling, hybridiza-
tion, and scanning were performed according to the manufactur-
er’s protocols as well as standardized protocols developed by the
core laboratory at the University of Pittsburgh. Data analysis was
performed using the Illumina software to delineate the false
discovery rate (FDR) and differences with statistical significance
(p,0.05).
Microarray data analysisWe analyzed the expression of individual miRNA using CT
values obtained with a threshold of 0.2. Endogenous controls, RT
negative controls, and genomic DNA contamination controls were
tested for each array. If a particular miRNA in either the control
or the experiment samples showed expression at least three times
with a value of 35 or greater, it was excluded from the analysis as
undetectable or undetermined. We uploaded values (CT) that
passed through these stringent criteria into the SABiosciences
software (RT2 Profiler PCR Array Data Analysis) and calculated
fold change for each miRNA. Data were further subjected to
statistical analysis using the manufacturer’s web-based software to
define the difference with significant p value (p, = 0.05) between
the two groups.
Validation of differentially regulated miRNA and mRNAfrom the genome-wide array
Based on the data analyses, selected miRNA and mRNA targets
were verified by qRT-PCR using specific primers and probes
(Applied Biosystems). We used RNA samples (n = 6) from the
miRNA and mRNA Regulation during HIV-1 Infection
PLoS ONE | www.plosone.org 2 July 2011 | Volume 6 | Issue 7 | e22730

miRNA microarray profiling to validate the high throughput
microarray results. Additional validation was performed by
infecting under similar conditions normal donor PBMCs (n = 10)
that were not part of the miRNA microarray.
Computational analysis validating the miRNA targets andmRNAs
To identify mRNA targets of miRNAs in the samples, we used
GenMIR++ [49], a novel regression-based Bayesian method
developed to identify targets of miRNAs by integrating the
measured expression data for miRNAs and mRNAs with a
database of a potential set of mRNA targets for each miRNA.
GenMIR++ takes into account the downregulation of target
mRNAs by modeling the expression of each targeted mRNA as a
negatively weighted sum of the expressions of multiple miRNAs
with some additional Gaussian noise. The method restricts the set
of possible targets for each miRNA to a set of candidate mRNAs
given a priori. This potential set of targets for each miRNA is
derived based on sequence analysis. For this paper, we used
predictions from the MicroCosm Targets database [50] to
determine this set. For the GenMIR++ analysis, we first used
the R package samr [51] to detect differentially expressed mRNAs
by using an FDR cutoff of 10%. We next combined these mRNAs
with the differentially expressed miRNAs, leading to 2,941
mRNAs and 327 miRNAs that were used as input to GenMIR++.
The plots show the top 10% of interactions predicted by
GenMIR++ ranked by their p-values.
Pathway analysisTo determine gene interactions and correlation networks, we
used Ingenuity Pathway Analysis, STRING, and KEGG. The
cutoff values for inclusion in these analyses were differential gene
expression, with p-value ,0.05 and 2.0 in fold change (based on
SAM). Genes identified from miRNA-based predicted targets
(score of .70) were also assessed to define the potential networks
and pathways.
Results
Infection and miRNA and mRNA quality from PBMC frommultiple donors
The goal of our study was to analyze the potential link between
miRNA and mRNA in HIV-1 infected cells. We hypothesized that
infection of target cells such as PBMCs by HIV-1 may lead to the
following scenarios: i) The infection may regulate an identical
subset of miRNA in cells derived from genetically diverse
individuals, and ii) The changes in miRNA may have an impact
on mRNA in genes associated with distinct cellular pathways.
We used PBMCs from multiple donors to validate the
differential regulation of miRNA and mRNA profiles by HIV-1
infection. All the donors were healthy and seronegative for HIV-1.
To eliminate variability with regard to the virus, we used a well-
characterized virus derived from a molecular clone. Infectivity was
assessed by qRT-PCR using HIV-1 Gag-specific primers and
probes as described [52] employing an equal amount of RNA. The
presence of Gag was determined by normalizing with endogenous
control and presented as CT values (Figure 1A). Samples with low
and high CT values (,12 or .30) were eliminated from further
profiling studies (Higher CT value (.30) indicate inefficient virus
replication and lower CT value (,12) indicate high infectivity and
infection induced cell death). Results indicate that infected cultures
of PBMCs showed the presence of Gag with an average CT value
of 21.8861.12, indicating virus replication. Gag CT value was
below the level of detection in the uninfected control. Cell death
was assessed in the infected and uninfected cultures before RNA
isolation (Figure 1B). Cell death in uninfected cultures ranged from
0 to 27% (an average of 8.462.2%), whereas infected cultures
showed a higher percentage (16–50%, with an average of
29.3362.4%). To ensure RNA quality, infected cultures with
high cell death (.50%) were not included in microarray analysis.
RNA isolated from these cultures was tested for quality by
spectrophotometry and by Taqman assays for endogenous control
miRNAs and mRNA species. Each sample was tested for two
miRNA and two small RNA controls (Table 1). All but two donors
showed CT values (.30) for endogenous controls. These two
donors were eliminated from further analyses to avoid bias
because the quality of RNA in these samples may not have been
ideal for qRT-PCR profiling.
HIV infection differentially regulated expression ofmultiple miRNAs
The expression profile of 704 host cellular miRNAs was assessed
in infected and uninfected PBMCs from multiple donors (n = 6).
Results revealed that HIV-1 infection differentially regulated
expression of several miRNAs (Tables S1 and S2). The level of
expression in infected cells was compared with that in uninfected
cells, and fold differences were calculated based on normalization
with internal controls. The fold differences ranged between 2- and
88-fold for different miRNAs. Among the total 704 miRNAs
tested, 208 were upregulated (Table S1) by more than 2-fold
compared to controls, and 14 were downregulated (Table S2)
compared to controls. Further analyses indicated that among these
222 miRNAs, 41 were upregulated (.4-fold) and five were
downregulated (.4-fold).
To further assess the significance of our data, we performed
statistical analyses to identify the regulated miRNA in the infected
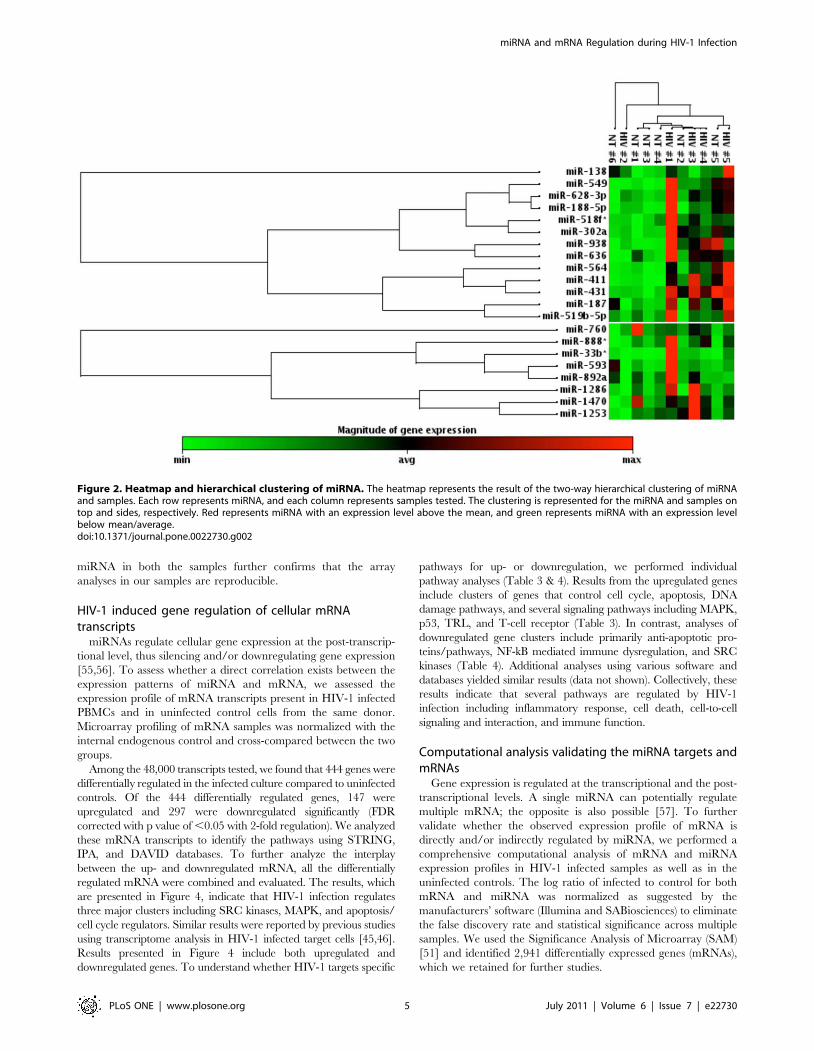
and the uninfected groups, using 2-fold as the cutoff (Figure 2;
Table 2). Results indicate that among the 208 upregulated
miRNAs, 21 exhibited significant changes across multiple donors
(p value of ,0.05). It is interesting to note that none of the 14
miRNAs that showed downregulation exhibited significant p
value. Heatmap analyses further cluster the miRNA species
between the test groups (Figure 2). Together these results indicate
that fold differences did not necessarily correlate with the
differential regulation of miRNAs in multiple donors.
Based on these analyses, we selected the differentially regulated
miRNAs with significant p value (,0.05) for further analyses. To
understand the significance of these miRNAs in host cellular
functions, we identified target genes using TargetScan followed by
IPA analysis (Table 2). Our results indicate that HIV-1 infection
targets cellular genes primarily involved in cell cycle, proliferation,
cellular movement and migration, and cell signaling. Previous
studies have reported findings that virus infection and viral
antigens modulate these host cellular pathways [53,54].
Validation of miRNA expression by qRT-PCRTo validate the differentially regulated miRNAs from the
microarray results, we randomly selected the nine miRNAs from
Table 2 (miRNA with 2-fold change and p,0.05) and the five
miRNAs from Tables S1 and S2 (miRNA with 2-fold increase but
p.0.05). We tested RNA from the infected and uninfected control
pair from multiple donor PBMCs for specific miRNA along with
endogenous controls using miRNA specific primers and probes by
qRT-PCR (Figure 3). Results indicate that among the nine
upregulated miRNAs tested from Table 2, all except miR-628-3p
showed upregulation by independent qRT-PCR assay. Although
miR-628-3p showed upregulation in miRNA profiling, all donors
used in independent validation did not show significant upregula-
miRNA and mRNA Regulation during HIV-1 Infection
PLoS ONE | www.plosone.org 3 July 2011 | Volume 6 | Issue 7 | e22730

tion, thus resulting in no change. This could be due to variations
within donors or due to design of primer/probes used in qRT-
PCR. Similarly, the single downregulated miRNA, miR-120,
showed downregulation in most of the tested samples. This was
validated in both the samples that were used to perform the
genome-wide microarray (n = 6) and additional PBMCs (n = 10)
infected in a similar manner, suggesting that these miRNAs are
consistently regulated across multiple donors. Validation of
Figure 1. Infectivity in and cell death in PBMCs used for analyses. (A) Normal donor PBMCs were infected with HIV-1 or mock infected forseven days. RNA was isolated and tested for Gag by RT-PCR. Gag CT values were obtained by using the endogenous control for normalization. Figureshows average CT value from 16 independent donors. (B) After seven days, post-infection cell death was assessed by trypan blue dye exclusionmethod. Dot blot represents percentage of cell death in uninfected (NT) and infected (HIV-1) PBMCs from 16 independent donors.doi:10.1371/journal.pone.0022730.g001
Table 1. Selected endogenous controls and their Ct values.
Endogenous controls Control #1 Control #2 Control #3 Control #4 Control #5 Average
SNORD48/RNU48/U48 25.49 25.07 26.8 25.8 24.65 25.56
SNORD47/U47 19.27 21.37 19.52 21.32 22.47 20.79
SNORD44/U44 17 18.9 17.64 19.77 22.69 19.2
RNU6-2/U6-2 20.82 22.35 20.84 21.16 23.35 21.70
Endogenous controls HIV-1#1 HIV-1 #2 HIV-1 #3 HIV-1 #4 HIV-1 #5 Average
SNORD48/RNU48/U48 20.31 24.46 27.57 23.16 25.49 24.198
SNORD47/U47 19.48 17.83 20.72 19.45 24.7 20.436
SNORD44/U44 18.97 15.69 18.53 19.17 21.67 18.806
RNU6-2/U6-2 17.82 18.35 21.35 19.57 24.37 20.292
RNA isolated from infected and uninfected PBMCs was evaluated first for the level of endogenous controls by RT-PCR using specific primers and probes as a measure ofRNA quality and quantity before microarray analysis. Five representative donors out of 16 donors are presented here.doi:10.1371/journal.pone.0022730.t001
miRNA and mRNA Regulation during HIV-1 Infection
PLoS ONE | www.plosone.org 4 July 2011 | Volume 6 | Issue 7 | e22730
miRNA in both the samples further confirms that the array
analyses in our samples are reproducible.
HIV-1 induced gene regulation of cellular mRNAtranscripts
miRNAs regulate cellular gene expression at the post-transcrip-
tional level, thus silencing and/or downregulating gene expression
[55,56]. To assess whether a direct correlation exists between the
expression patterns of miRNA and mRNA, we assessed the
expression profile of mRNA transcripts present in HIV-1 infected
PBMCs and in uninfected control cells from the same donor.
Microarray profiling of mRNA samples was normalized with the
internal endogenous control and cross-compared between the two
groups.
Among the 48,000 transcripts tested, we found that 444 genes were
differentially regulated in the infected culture compared to uninfected
controls. Of the 444 differentially regulated genes, 147 were
upregulated and 297 were downregulated significantly (FDR
corrected with p value of ,0.05 with 2-fold regulation). We analyzed
these mRNA transcripts to identify the pathways using STRING,
IPA, and DAVID databases. To further analyze the interplay
between the up- and downregulated mRNA, all the differentially
regulated mRNA were combined and evaluated. The results, which
are presented in Figure 4, indicate that HIV-1 infection regulates
three major clusters including SRC kinases, MAPK, and apoptosis/
cell cycle regulators. Similar results were reported by previous studies
using transcriptome analysis in HIV-1 infected target cells [45,46].
Results presented in Figure 4 include both upregulated and
downregulated genes. To understand whether HIV-1 targets specific
pathways for up- or downregulation, we performed individual
pathway analyses (Table 3 & 4). Results from the upregulated genes
include clusters of genes that control cell cycle, apoptosis, DNA
damage pathways, and several signaling pathways including MAPK,
p53, TRL, and T-cell receptor (Table 3). In contrast, analyses of
downregulated gene clusters include primarily anti-apoptotic pro-
teins/pathways, NF-kB mediated immune dysregulation, and SRC
kinases (Table 4). Additional analyses using various software and
databases yielded similar results (data not shown). Collectively, these
results indicate that several pathways are regulated by HIV-1
infection including inflammatory response, cell death, cell-to-cell
signaling and interaction, and immune function.
Computational analysis validating the miRNA targets andmRNAs
Gene expression is regulated at the transcriptional and the post-
transcriptional levels. A single miRNA can potentially regulate
multiple mRNA; the opposite is also possible [57]. To further
validate whether the observed expression profile of mRNA is
directly and/or indirectly regulated by miRNA, we performed a
comprehensive computational analysis of mRNA and miRNA
expression profiles in HIV-1 infected samples as well as in the
uninfected controls. The log ratio of infected to control for both
mRNA and miRNA was normalized as suggested by the
manufacturers’ software (Illumina and SABiosciences) to eliminate
the false discovery rate and statistical significance across multiple
samples. We used the Significance Analysis of Microarray (SAM)
[51] and identified 2,941 differentially expressed genes (mRNAs),
which we retained for further studies.
Figure 2. Heatmap and hierarchical clustering of miRNA. The heatmap represents the result of the two-way hierarchical clustering of miRNAand samples. Each row represents miRNA, and each column represents samples tested. The clustering is represented for the miRNA and samples ontop and sides, respectively. Red represents miRNA with an expression level above the mean, and green represents miRNA with an expression levelbelow mean/average.doi:10.1371/journal.pone.0022730.g002
miRNA and mRNA Regulation during HIV-1 Infection
PLoS ONE | www.plosone.org 5 July 2011 | Volume 6 | Issue 7 | e22730

Table 2. Significantly regulated miRNAs in HIV-1 infected cultures compared to uninfected control cells.
Mature ID Fold change p value #Predicted targetsCellular function based on predicted targetsthrough TargetScan and IPA analysis
miR-593 2.3247 0.0010 67 Amino acid Metabolism
miR-431 4.2845 0.009372 25 Cell growth and proliferation
miR-892a 2.4136 0.013 122 Cellular function and Maintenance
miR-138 2.1364 0.013 44 Cell Morphology
miR-564 4.8795 0.0130 79 7 N/A
miR-628-3p 4.6012 0.017119 60 Cell Signaling
miR-411 8.2454 0.018815 29 Cell Cycle
miR-518f* 3.3215 0.0308 10 DNA Replication, Recombination and Repair
miR-187 2.0631 0.035 4 N/A
miR-188-5p 6.1813 0.037526 72 Cell Cycle
miR-938 3.6903 0.0399 15 Cellular Development
miR-1253 3.1465 0.0419 106 Cellular function and Maintenance
miR-1470 3.317 0.0425 2 N/A
miR-549 5.3005 0.04538 60 Cell Cycle
miR-888* 4.8503 0.0469 153 Cellular function and Maintenance
miR-33b* 2.9726 0.0484 79 Cellular Assembly and Organization
miR-519b-5p 2.8366 0.050 50 Nucleic acid Metabolism
miR-302a 3.6139 0.050 164 DNA Replication, Recombination and Repair
miR-1286 3.3554 0.0523 34 Carbohydrate Metabolism
miR-636 2.5808 0.0548 47 Cell Cycle
miR-760 2.9002 0.0575 42 Cell Signaling
This table lists miRNAs that are significantly regulated (over expressed) with a significance of p,0.05 in HIV-1 infected cultures compared to uninfected control cells.# Column represents targets identified through miRDB having a target score $70.doi:10.1371/journal.pone.0022730.t002
Figure 3. Quantitative real time RCR (qRT-PCR) confirmation of randomly selected miRNAs from the microarray analysis. Theexpression of selected miRNAs in PBMCs infected with HIV-1 along with the expression of uninfected controls were tested for validation by qRT-PCRusing a specific primer and probe for each miRNA. Fold increase/decrease was calculated based on endogenous control normalization. Average foldchange for each miRNA represents fold change obtained from 10 independent donors.doi:10.1371/journal.pone.0022730.g003
miRNA and mRNA Regulation during HIV-1 Infection
PLoS ONE | www.plosone.org 6 July 2011 | Volume 6 | Issue 7 | e22730

Figure 4. Predicted interaction networks of genes regulated during HIV-1 infection. Differentially regulated genes are represented in thelinks predicted using STRING (http://string.embl.de/). Predicted interactions represent both direct and indirect associations that are derived from fourdifferent sources: genomic context, high throughput experiments, conserved co-expression, and previous findings from the literature. The nature ofthe supporting evidence is indicated by the color lines: green represents neighborhood; red, gene fusion; blue, co-occurrence; black, co-expression;purple, previous experiments; turquoise, database; yellow, text mining; and aqua, homology.doi:10.1371/journal.pone.0022730.g004
Table 3. Genes upregulated in the HIV-1 infected culture compared to uninfected control cells, determined by transcriptomeanalysis.
Canonical Pathways Count p Value Genes
MAPK signaling 6 1.30E-05 PPP3CC; CACNA1I; PPP3CB; PRKCA; TGFBR2; CDC25B
T-cell receptor signaling 4 5.29E-05 MALT1; PPP3CC; PPP3CB; PRKCQ
Natural killer cell mediated cytotoxicity 4 1.32E-04 PPP3CC; PPP3CB; PRKCA; HCST
Wnt signaling 4 1.91E-04 WNT7A; PPP3CC; PPP3CB; PRKCA
Calcium signaling 4 3.96E-04 PPP3CC; CACNA1I; PPP3CB; PRKCA
B-cell receptor signaling 3 3.78E-04 MALT1; PPP3CC; PPP3CB
Long-term potentiation 3 3.78E-04 PPP3CC; PPP3CB; PRKCA
VEGF signaling 3 3.93E-04 PPP3CC; PPP3CB; PRKCA
Apoptosis 3 6.24E-04 PPP3CC; PPP3CB; ATM
Cell cycle 3 0.00144 CDC14B; ATM; CDC25B
Tight junction 3 0.00211 CLDN18; PRKCA; PRKCQ
doi:10.1371/journal.pone.0022730.t003
miRNA and mRNA Regulation during HIV-1 Infection
PLoS ONE | www.plosone.org 7 July 2011 | Volume 6 | Issue 7 | e22730

Next, we used GenMIR++ [49] to integrate mRNA, miRNA,
and sequence-based predictions into an miRNA-mRNA interac-
tion graph (Figure 5A). GenMIR++ uses predicted miRNA targets
(Methods) to generate an initial binary interaction matrix for
interactions between miRNA and mRNA (Table 5). Based on this
table, a linear Gaussian regression model is created for each
mRNA by regressing it on the best subset of miRNAs that can
potentially interact with it. Coefficients are constrained to be
negative to indicate the anti-correlation between miRNAs and
their targets. Using this method, we identified the top 275
interactions involving 196 mRNAs and 118 miRNAs and
organized them to represent the set of interactions predicted in
this dataset (Figure 5A). The results show several clusters of
miRNA-mRNA regulation. For example, miR-144, miR-937,
Table 4. Genes downregulated in the HIV-1 infected culture compared to uninfected control cells determined by transcriptomeanalysis.
Pathways # p Value Gene
Cell cycle 10 1.80E-10 MCM2; MCM7; PKMYT1; CDK2; GADD45B; MAD2L2; TFDP1; GADD45A;PCNA; ORC1L
Apoptosis 8 7.26E-09 IRAK2; NFKBIA; BCL2L1; TNFRSF10B; BAX; DFFA; EXOG; TNF
Purine metabolism 8 4.74E-07 ADA; ADCY3; ADCY8; POLA1; POLR3K; POLE2; GART; DGUOK
MAPK signaling 8 3.71E-05 MAP3K8; GADD45B; DUSP2; ATF4; GADD45A; DUSP5; TNF; DUSP10
Cytokine-cytokine receptor interaction 7 1.92E-04 TNFSF9; TNFRSF10B; CD70; IL8; TNF; TNFRSF18; TNFSF13B
DNA polymerase 5 5.76E-07 MCM2; MCM7; POLA1; PCNA; POLE2
Base excision repair 5 5.76E-07 PARP2; PCNA; POLE2; APEX2; POLB
Adipocytokine signaling 5 1.32E-05 SOCS3; NFKBIA; TNF; NFKBIE; CPT1A
p53 signaling 5 1.52E-05 CDK2; GADD45B; TNFRSF10B; BAX; GADD45A
Epithelial cell signaling in H.pylori infection 5 1.63E-05 NFKBIA; LYN; IL8; JAM2; SRC
Small cell lung cancer 5 4.44E-05 NFKBIA; BCL2L1; CDK2; TRAF3; TRAF4
Toll-like receptor signaling 5 1.00E-04 NFKBIA; MAP3K8; IL8; TNF; TRAF3
One carbon pool by folate 4 6.80E-07 SHMT2; GART; MTHFS; MTHFD1L
Urea cycle andmetabolism of amino groups 4 7.33E-06 ASS1; ACY1; ALDH7A1; SMS
Aminoacyl-tRNA biosynthesis 4 3.46E-05 WARS; YARS; GARS; RARS
Glycine, serine and threonine metabolism 4 4.19E-05 CBS; PHGDH; SHMT2; GARS
Gap junction 4 8.33E-04 ADCY3; ADCY8; CSNK1D; SRC
Pyrimidine metabolism 4 8.33E-04 UPP1; POLA1; POLR3K; POLE2
GnRH signaling 4 0.00140 ADCY3; ADCY8; ATF4; SRC
T cell receptor signaling 4 0.00150 NFKBIA; MAP3K8; TNF; NFKBIE
Tight junction 4 0.00335 CGN; MYL2; JAM2; SRC
Insulin signaling 4 0.00353 TRIP10; SOCS3; PFKM; PTPN1
Mismatch repair 3 1.46E-04 MSH6; PCNA; EXO1
Arginine and proline metabolism 3 5.66E-04 ASS1; PYCR1; RARS
Nucleotide excision repair 3 0.00102 ERCC1; PCNA; POLE2
Fatty acid metabolism 3 0.00109 ACADVL; ALDH7A1; CPT1A
Glutathione metabolism 3 0.00148 GSTA4; GGCT; SMS
Inositol phosphate metabolism 3 0.001952 IMPA2; INPP1; ITPKA
Amyotrophic lateral sclerosis 3 0.002056 BCL2L1; BAX; TNF
Hedgehog signaling 3 0.002163 CSNK1E; CSNK1D; RAB23
Glycolysis/Gluconeogenesis 3 0.003010 ALDH7A1; PFKM; GCK
Drug metabolism cytochrom.p450 3 0.00419 GSTA4; FMO4; CYP3A5
B-cell receptor signaling 3 0.0047 NFKBIA; LYN; NFKBIE
Chronic myeloid leukemia 3 0.0047 NFKBIA; BCL2L1; STAT5A
Phosphatidylinositol signaling 3 0.0048 IMPA2; INPP1; ITPKA
Prostate cancer 3 0.0073 NFKBIA; CDK2; ATF4
NK cell mediated cytotoxicity 3 0.0243 TNFRSF10B; ULBP1; TNF
Jak-STAT signaling 3 0.0327 SOCS3; BCL2L1; STAT5A
Calcium signaling 3 0.0501 ADCY3; ADCY8; ITPKA
Focal adhesion 3 0.0649 MYL2; SRC; PARVB
doi:10.1371/journal.pone.0022730.t004
miRNA and mRNA Regulation during HIV-1 Infection
PLoS ONE | www.plosone.org 8 July 2011 | Volume 6 | Issue 7 | e22730
miR-376, miR-519, and miR-548A-3P are shown to regulate a
number of mRNAs, and HCK, NFKBIE, IL6, SHMT2, and
MCM4 are regulated by several miRNAs.
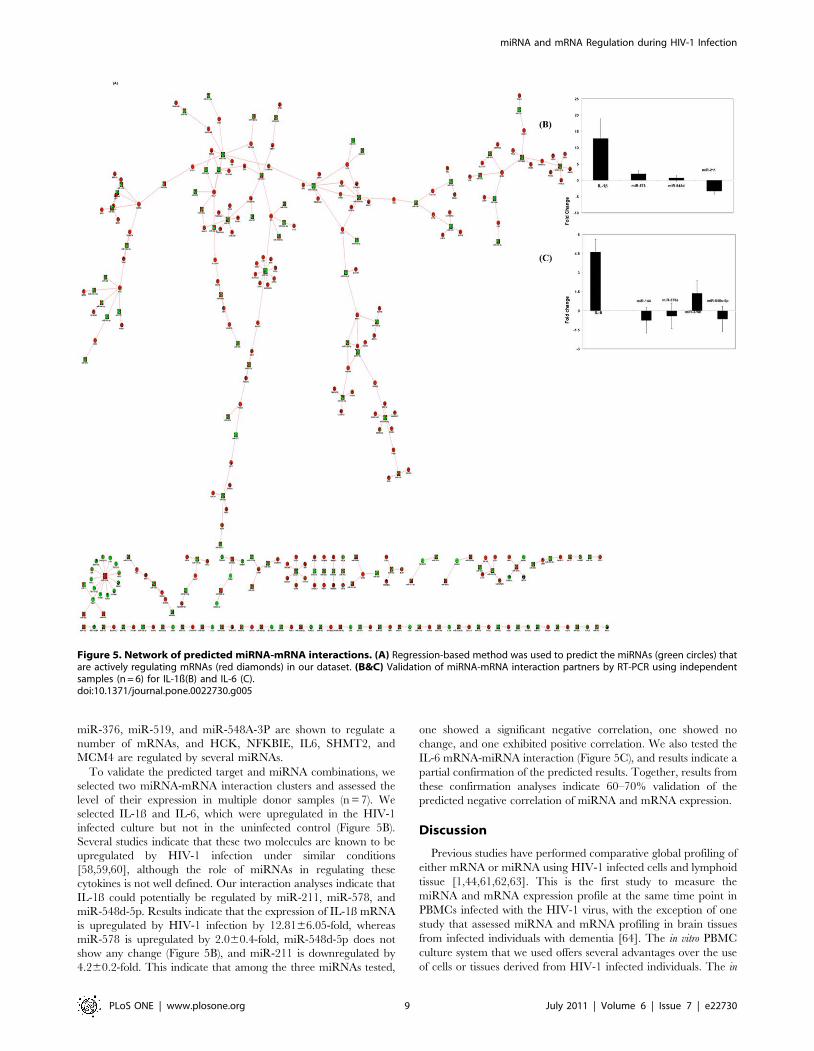
To validate the predicted target and miRNA combinations, we
selected two miRNA-mRNA interaction clusters and assessed the
level of their expression in multiple donor samples (n = 7). We
selected IL-1ß and IL-6, which were upregulated in the HIV-1
infected culture but not in the uninfected control (Figure 5B).
Several studies indicate that these two molecules are known to be
upregulated by HIV-1 infection under similar conditions
[58,59,60], although the role of miRNAs in regulating these
cytokines is not well defined. Our interaction analyses indicate that
IL-1ß could potentially be regulated by miR-211, miR-578, and
miR-548d-5p. Results indicate that the expression of IL-1ß mRNA
is upregulated by HIV-1 infection by 12.8166.05-fold, whereas
miR-578 is upregulated by 2.060.4-fold, miR-548d-5p does not
show any change (Figure 5B), and miR-211 is downregulated by
4.260.2-fold. This indicate that among the three miRNAs tested,
one showed a significant negative correlation, one showed no
change, and one exhibited positive correlation. We also tested the
IL-6 mRNA-miRNA interaction (Figure 5C), and results indicate a
partial confirmation of the predicted results. Together, results from
these confirmation analyses indicate 60–70% validation of the
predicted negative correlation of miRNA and mRNA expression.
Discussion
Previous studies have performed comparative global profiling of
either mRNA or miRNA using HIV-1 infected cells and lymphoid
tissue [1,44,61,62,63]. This is the first study to measure the
miRNA and mRNA expression profile at the same time point in
PBMCs infected with the HIV-1 virus, with the exception of one
study that assessed miRNA and mRNA profiling in brain tissues
from infected individuals with dementia [64]. The in vitro PBMC
culture system that we used offers several advantages over the use
of cells or tissues derived from HIV-1 infected individuals. The in
Figure 5. Network of predicted miRNA-mRNA interactions. (A) Regression-based method was used to predict the miRNAs (green circles) thatare actively regulating mRNAs (red diamonds) in our dataset. (B&C) Validation of miRNA-mRNA interaction partners by RT-PCR using independentsamples (n = 6) for IL-1ß(B) and IL-6 (C).doi:10.1371/journal.pone.0022730.g005
miRNA and mRNA Regulation during HIV-1 Infection
PLoS ONE | www.plosone.org 9 July 2011 | Volume 6 | Issue 7 | e22730

vitro system allows analysis of miRNA and mRNA at precise points
after virus infection. It also enables the use of a virus derived from
proviral DNA. In combination with the ability to carry out studies
using cells from multiple donors, these features may help to
identify potential signature patterns with respect to the regulation
of gene expression associated with virus infection.
We identified a number of significantly regulated miRNAs and
mRNAs in infected PBMCs compared to uninfected control cells.
Among the 704 miRNAs tested, 21 are differentially regulated
with statistical significance of ,0.05 p value, suggesting that virus
infection does alter the miRNA expression profile. It is important
to note that the significantly regulated miRNAs showed upregula-
tion ranging from 2.1- to 8.2-fold. Although HIV-1 infection
differentially regulated certain miRNAs to a higher degree (.22–
88-fold), they did not show statistical significance across multiple
donors.
It is worth noting that we did not observe any miRNA that is
significantly downregulated by virus infection, whereas Houzet et
al. [44] reported downregulation of a number of miRNAs in HIV-
1 infected PBMCs obtained from HIV-1 positive subjects. It is not
clear whether this difference is due to the assay platforms used, the
number of miRNAs assessed, or the methodologies used to
evaluate the statistical significance. It is also possible that infection
level or viral load/burden could influence the level of miRNA
expression. The patient population in the Houzet et al. study had
relatively low viral loads compared to the in vitro infected cultures.
Our results are in line with those from the study by Tatro et al.
[64], which reported the dysregulation of miRNA in brain tissue
from HIV-1 positive patients compared to that in uninfected
control brain tissue. The authors reported that, of the 19 miRNAs
that were dysregulated in HIV-1 positive brain tissue compared to
uninfected brain tissue, six were also dysregulated in HIV-1
infected PBMCs compared to uninfected cells. They also identified
brain-tissue-specific miRNAs, suggesting that their levels in
PBMCs may be undetectable or tissue specific as reported before
[65,66].
Given that many pathogens including viruses depend on host
cellular machinery for their replication, survival, and immune
evasion, the hypothesis that particular viruses alter cellular
miRNAs may not come as a surprise. Many viruses including
herpes virus, Epstein-Barr virus, HCV, HHV-8, and retroviruses
are known to affect host cellular miRNAs [67,68,69]. It is not
clear, however, whether all these viruses regulate specific miRNAs
for replication, immune evasion, and/or immortalization. Search-
ing the literature to identify the miRNAs that are differentially
regulated by HCV, HBV, EVB, and herpes viruses, we found a
partial overlap among these viruses. For instance, Li et al. [70]
performed miRNA profiling during HBV infection and identified
13 miRNAs that are differentially regulated. When we compared
these to HIV-1 mediated miRNA regulation, we found that four
miRNAs were similarly altered during HIV-1 infection. We also
compared the miRNA profiles in two HCV-infected hepatocyte
studies [67,70] with our results from HIV-1 infected PBMCs. We
observed 33% and 40% similarity, respectively, in upregulated
miRNAs between our results and those of the two studies.
However, we did not observe miRNAs that were similarly
downregulated in HBV, HCV, or HIV infection.
It is important to keep in mind that the expression profiles were
generated by using PMBCs comprising different cell types in our
study. On the other hand, the HCV-mediated miRNA profiling
was assessed in hepatoma cell lines, and that for EBV-induced
miRNA was performed in transformed BLCL cells [67,68]. There
might be cell-type-specific miRNA and/or altered expression level
of miRNAs in different cells that could contribute to the observed
differences in miRNA profiling during HCV, HIV, or EBV
infection. A recent report by Wu et al. [71] provides further
support that the level of miRNA expression might vary among
different cell types. Collectively, these studies indicate that host
cells might respond to pathogens using similar miRNAs as part of
the interactions between the pathogen and the host. Conversely, it
is also possible to hypothesize that viruses might target certain
miRNAs as part of a general virus-host interaction to aid
Table 5. Interplay between miRNA and mRNA based onGenMIR ++ analysis.
miRNA Potential targets (mRNA)
let-7d* APP, CKS1B, DDIT4, IL3RA, NFKBIA, PLSCR1
miR-129-3p KIFC1, NAPSB, ORC1L
miR-130a C13ORF18, DLL1, G0S2, GADD45B, STX11, TNF, TNFAIP6
miR-139-5p BATF, KIF1A, RFC3
miR-144 BARD1, BTG3, CEP55, IDH2, IL6, KHDRBS3, LYN, SGOL1,TRIP6, ZC3H12A
miR-193a-5p ERN1, HCK, SEMA7A, SHMT2
miR-196b ADFP, LOR, MCM4
miR-198 CBS, COL9A2, DYSF
miR-214 MCM4, SLC11A1, TMPRSS6
miR-301b DLL1, RAB34, SLC43A2, TFP1
miR-302c FAIM3, IGF1R, PPA1, RSBN1L
miR-33a ABCA1, INDO, PLTP, RAB9A, SAT1
miR-376a C15ORF48, IL6, MMP7, TFP1, TNFAIP6
miR-501-3p C1ORF57, NFKBIE, SASH1, TIMELESS
miR-502-3p CATSPER1, DTX1, IL17F, SP140
miR-515-5p ENPP3, EXO1, FANCG, HES1, MTHFD1L, POLA2
miR-517a BARD1, GNL3, PTGES, RAD54L
miR-518c KIFC1, NFKBIE, RBBP8, WARS
miR-518d-3p KIFC1, MCM2, NFKBIE
miR-519e CD9, CDC2L5, CYB561D2, EBI2, FBP1, MGAT4A,NINJ2, NPL, PYHIN1, RBL2, SORL1, TBC1D10C, TREM2
miR-520g MCM3, MCM4, MTHFD1L, POLQ, UHRF1
miR-526b ACADVL, OIP5, OXCT2, SLC43A3
miR-532-3p CD70, KIFC1, SLC1A5
miR-548a-3p ANKRD57, MEP1A, POLE2, RAD51AP1, RBBP8,SMPDL3A, TYMS
miR-548b-3p C13ORF18, CD70, DUSP5, IER5, IL1B, KYNU,TMEM106C, WBP5
miR-548d-3p CBS, CD70, DUSP5, GNA11, IL1B, KYNU, L2HGDH,PRPF19, IL6
miR-627 TEX264, TRIM47, TXNIP
miR-632 ASF1B, C17ORF53, DOK3, DYSF,
miR-648 AHI1, BCAR3, HELLS, TK1
miR-659 CXXC5, SHMT2, TRO
miR-744 BID, BRSK1, COL9A2
miR-920 BLR1, CDH1, RBPMS2
miR-935 IER3, MND1, PIF1, SHMT2
miR-937 C15ORF48, CABLES1, FHOD1, GADD45G, GNA15,NEU4, PLEKHA4
miR-938 CDCA5, IRF8, TYMS
These miRNAs were selected on the basis that they target at least three mRNAswith the score of .0.50001.doi:10.1371/journal.pone.0022730.t005
miRNA and mRNA Regulation during HIV-1 Infection
PLoS ONE | www.plosone.org 10 July 2011 | Volume 6 | Issue 7 | e22730

replication and survival. A well-defined comparative analysis is
required to address this. Though this manuscript focuses on HIV-1
induced host cellular miRNAs dysregulation, HIV-1 also codes for
viral miRNAs that are known to modulate host cell functions and
viral transcription [72,73,74]. However, the interplay between the
viral and host miRNAs is not well defined.
miRNAs regulate the expression of target mRNAs at the post-
transcriptional level [75,76,77]. It is now well established that a
cluster of miRNAs could regulate a single mRNA and vice versa
[78,79]. Our evaluation of the miRNA and mRNA profile (44,000
probes) from RNA isolated at the same time indicates differential
regulation of a number of host cellular genes (444) with the FDR-
adjusted p value of ,0.05. The differentially regulated genes
represent pathways including cell cycle, apoptosis, T-cell receptor
signaling, DNA repair, and MAPK signaling. These results are in
agreement with previously published studies using CD4+ T cells,
monocytes, or macrophages infected with HIV-1 [45,46].
Although these studies used purified specific cell types, their
results indicate similar pathways, suggesting that the interaction
between the virus and the target cell might trigger similar gene
regulation. It is not clear whether similar genes are targeted by
HIV-1 in each cell type or whether similar pathways are targeted
using cell-type-specific genes. Collective information from the
published studies as well as our results support the latter possibility.
A recent transcriptome-analysis study using monocytes isolated
from HIV-1 patients (ART naı̈ve and post-ART therapy)
identified several innate factors as upregulated [45]; these factors
were in addition to the cell proliferation, apoptotic, and signaling
genes, and they were not found in our study. This discrepancy
could be due to the use of different viruses. In our study, we used a
CXCR4-receptor-utilizing virus (NL4-3), which primarily targets
T cells. Different target cells might respond differently to the
interaction between the virus and the host cell, although miRNAs
that are known to regulate virus replication (e.g., miRNA-198)
have been found to be commonly regulated by HIV-1 in both T
and monocyte/macrophage targets [80].
In this study, to gain insight into the regulation of mRNA by
miRNAs, we performed the combined miRNA and mRNA profile
in HIV-1 infected PBMCs. Although previous studies have
identified similar host cellular pathways regulated by HIV-1, our
approach provides new information regarding their regulation at
the post-transcriptional level. We observed a negative correlation
between the miRNA and mRNA expression profiles, similar to the
observations noted with other viral infections [81]. In conclusion,
our results suggest that miRNAs play a role in regulating several
host cellular genes during HIV-1 infection, altering the host cell
response to the virus. Similar approaches including the role of viral
load, immune activation, and HAART will provide useful
information regarding biomarkers to predict disease development
and the effect of HAART during early stages of the disease.
Supporting Information
Table S1 MicroRNAs over expressed in HIV-1 NL43infected cultures compared to uninfected control cells.Cut-off was 2 fold change.
(DOCX)
Table S2 MicroRNAs under expressed in HIV-1 NL43infected cultures compared to uninfected control cells.Cut-off was 2-fold change.
(DOCX)
Acknowledgments
We would also like to thank Dr. Alagarsamy Srinivasan for his critical
comments and suggestions.
Author Contributions
Conceived and designed the experiments: AG VA. Performed the
experiments: AG PN CB CZ. Analyzed the data: AG PN H-SL CB AT
ZB-J SM VA. Wrote the paper: AG CZ ZB-J VA.
References
1. Li Q, Smith AJ, Schacker TW, Carlis JV, Duan L, et al. (2009) Microarray
analysis of lymphatic tissue reveals stage-specific, gene expression signatures in
HIV-1 infection. J Immunol 183: 1975–1982.
2. Wu JQ, Dwyer DE, Dyer WB, Yang YH, Wang B, et al. (2008) Transcriptional
profiles in CD8+ T cells from HIV+ progressors on HAART are characterized
by coordinated up-regulation of oxidative phosphorylation enzymes and
interferon responses. Virology 380: 124–135.
3. van ’t Wout AB, Lehrman GK, Mikheeva SA, O’Keeffe GC, Katze MG, et al.
(2003) Cellular gene expression upon human immunodeficiency virus type 1
infection of CD4(+)-T-cell lines. J Virol 77: 1392–1402.
4. Garcia-Arriaza J, Najera JL, Gomez CE, Sorzano CO, Esteban M (2010)
Immunogenic profiling in mice of a HIV/AIDS vaccine candidate (MVA-B)
expressing four HIV-1 antigens and potentiation by specific gene deletions.
PLoS One 5: e12395.
5. van ’t Wout AB, Swain JV, Schindler M, Rao U, Pathmajeyan MS, et al. (2005)
Nef induces multiple genes involved in cholesterol synthesis and uptake in
human immunodeficiency virus type 1-infected T cells. J Virol 79:
10053–10058.
6. Zaunders J, Dyer WB, Churchill M (2011) The Sydney Blood Bank Cohort:
implications for viral fitness as a cause of elite control. Curr Opin HIV AIDS 6:
151–156.
7. Herbeck JT, Gottlieb GS, Winkler CA, Nelson GW, An P, et al. (2010)
Multistage genomewide association study identifies a locus at 1q41 associated
with rate of HIV-1 disease progression to clinical AIDS. J Infect Dis 201:
618–626.
8. McMichael AJ, Jones EY (2010) Genetics. First-class control of HIV-1. Science
330: 1488–1490.
9. Limou S, Le Clerc S, Coulonges C, Carpentier W, Dina C, et al. (2009)
Genomewide association study of an AIDS-nonprogression cohort emphasizes
the role played by HLA genes (ANRS Genomewide Association Study 02).
J Infect Dis 199: 419–426.
10. Smith MW, Dean M, Carrington M, Winkler C, Huttley GA, et al. (1997)
Contrasting genetic influence of CCR2 and CCR5 variants on HIV-1 infection
and disease progression. Hemophilia Growth and Development Study (HGDS),
Multicenter AIDS Cohort Study (MACS), Multicenter Hemophilia Cohort
Study (MHCS), San Francisco City Cohort (SFCC), ALIVE Study. Science 277:
959–965.
11. Dragic T, Litwin V, Allaway GP, Martin SR, Huang Y, et al. (1996) HIV-1
entry into CD4+ cells is mediated by the chemokine receptor CC-CKR-5.
Nature 381: 667–673.
12. Hladik F, Liu H, Speelmon E, Livingston-Rosanoff D, Wilson S, et al. (2005)
Combined effect of CCR5-Delta32 heterozygosity and the CCR5 promoter
polymorphism -2459 A/G on CCR5 expression and resistance to human
immunodeficiency virus type 1 transmission. J Virol 79: 11677–11684.
13. Mummidi S, Ahuja SS, Gonzalez E, Anderson SA, Santiago EN, et al. (1998)
Genealogy of the CCR5 locus and chemokine system gene variants associated
with altered rates of HIV-1 disease progression. Nat Med 4: 786–793.
14. O’Brien SJ, Nelson GW (2004) Human genes that limit AIDS. Nature Genetics
36: 565–574.
15. Jeannet M, Sztajzel R, Carpentier N, Hirschel B, Tiercy JM (1989) HLA
antigens are risk factors for development of AIDS. J Acquir Immune Defic Syndr
2: 28–32.
16. Nieto G, Barber Y, Rubio MC, Rubio M, Fibla J (2004) Association between
AIDS disease progression rates and the Fok-I polymorphism of the VDR gene in
a cohort of HIV-1 seropositive patients. J Steroid Biochem Mol Biol 89-90:
199–207.
17. Paxton WA, Kang S (1998) Chemokine receptor allelic polymorphisms:
relationships to HIV resistance and disease progression. Semin Immunol 10:
187–194.
18. Ballana E, Senserrich J, Pauls E, Faner R, Mercader JM, et al. (2010) ZNRD1
(zinc ribbon domain-containing 1) is a host cellular factor that influences HIV-1
replication and disease progression. Clin Infect Dis 50: 1022–1032.
19. Ciccosanti F, Corazzari M, Soldani F, Matarrese P, Pagliarini V, et al.
Proteomic analysis identifies prohibitin down-regulation as a crucial event in the
mitochondrial damage observed in HIV-infected patients. Antivir Ther 15:
377–390.
miRNA and mRNA Regulation during HIV-1 Infection
PLoS ONE | www.plosone.org 11 July 2011 | Volume 6 | Issue 7 | e22730

20. Melendez LM, Colon K, Rivera L, Rodriguez-Franco E, Toro-Nieves D (2008)
Proteomic analysis of HIV-infected macrophages. J Neuroimmune Pharmacol 6:89–106.
21. Ringrose JH, Jeeninga RE, Berkhout B, Speijer D (2008) Proteomic studiesreveal coordinated changes in T-cell expression patterns upon infection with
human immunodeficiency virus type 1. J Virol 82: 4320–4330.
22. Zhang L, Jia X, Zhang X, Sun J, Peng X, et al. Proteomic analysis of PBMCs:
characterization of potential HIV-associated proteins. Proteome Sci 8: 12.
23. Geiss GK, Bumgarner RE, An MC, Agy MB, van ’t Wout AB, et al. (2000)
Large-scale monitoring of host cell gene expression during HIV-1 infection usingcDNA microarrays. Virology 266: 8–16.
24. Ryo A, Suzuki Y, Arai M, Kondoh N, Wakatsuki T, et al. (2000) Identification
and characterization of differentially expressed mRNAs in HIV type 1-infected
human T cells. AIDS Res Hum Retroviruses 16: 995–1005.
25. Vahey MT, Nau ME, Jagodzinski LL, Yalley-Ogunro J, Taubman M, et al.(2002) Impact of viral infection on the gene expression profiles of proliferating
normal human peripheral blood mononuclear cells infected with HIV type 1
RF. AIDS Res Hum Retroviruses 18: 179–192.
26. Burgener A, Sainsbury J, Plummer FA, Ball TB Systems biology-basedapproaches to understand HIV-exposed uninfected women. Curr HIV/AIDS
Rep 7: 53–59.
27. Hirbod T, Nilsson J, Andersson S, Uberti-Foppa C, Ferrari D, et al. (2006)
Upregulation of interferon-alpha and RANTES in the cervix of HIV-1-seronegative women with high-risk behavior. J Acquir Immune Defic Syndr 43:
137–143.
28. Mothe B, Ibarrondo J, Llano A, Brander C (2009) Virological, immune and host
genetics markers in the control of HIV infection. Dis Markers 27: 105–120.
29. Charurat M, Blattner W, Hershow R, Buck A, Zorrilla CD, et al. (2004)
Changing trends in clinical AIDS presentations and survival among HIV-1-infected women. J Womens Health (Larchmt) 13: 719–730.
30. Poropatich K, Sullivan DJ, Jr. (2011) Human immunodeficiency virus type 1long-term non-progressors: the viral, genetic and immunological basis for disease
non-progression. J Gen Virol 92: 247–268.
31. Barnes MR, Deharo S, Grocock RJ, Brown JR, Sanseau P (2007) The micro
RNA target paradigm: a fundamental and polymorphic control layer of cellularexpression. Expert Opin Biol Ther 7: 1387–1399.
32. Carthew RW, Sontheimer EJ (2009) Origins and Mechanisms of miRNAs and
siRNAs. Cell 136: 642–655.
33. Chua JH, Armugam A, Jeyaseelan K (2009) MicroRNAs: biogenesis, function
and applications. Curr Opin Mol Ther 11: 189–199.
34. Alvarez-Garcia I, Miska EA (2005) MicroRNA functions in animal development
and human disease. Development 132: 4653–4662.
35. Chang TC, Mendell JT (2007) microRNAs in vertebrate physiology and human
disease. Annu Rev Genomics Hum Genet 8: 215–239.
36. Baltimore D, Boldin MP, O’Connell RM, Rao DS, Taganov KD (2008)MicroRNAs: new regulators of immune cell development and function. Nat
Immunol 9: 839–845.
37. Barik S (2005) Silence of the transcripts: RNA interference in medicine. J Mol
Med 83: 764–773.
38. Amariglio N, Rechavi G (2007) A-to-I RNA editing: a new regulatory
mechanism of global gene expression. Blood Cells Mol Dis 39: 151–155.
39. Gomase VS, Parundekar AN (2009) microRNA: human disease and
development. Int J Bioinform Res Appl 5: 479–500.
40. Fritz JH, Girardin SE, Philpott DJ (2006) Innate immune defense through RNAinterference. Sci STKE. 2006: pe27.
41. Carissimi C, Fulci V, Macino G (2009) MicroRNAs: novel regulators ofimmunity. Autoimmun Rev 8: 520–524.
42. O’Connell RM, Rao DS, Chaudhuri AA, Baltimore D (2010) Physiological andpathological roles for microRNAs in the immune system. Nat Rev Immunol 10:
111–122.
43. Wang X, Ye L, Hou W, Zhou Y, Wang YJ, et al. (2009) Cellular microRNA
expression correlates with susceptibility of monocytes/macrophages to HIV-1infection. Blood 113: 671–674.
44. Houzet L, Yeung ML, de Lame V, Desai D, Smith SM, et al. (2008) MicroRNA
profile changes in human immunodeficiency virus type 1 (HIV-1) seropositive
individuals. Retrovirology 5: 118.
45. Van den Bergh R, Florence E, Vlieghe E, Boonefaes T, Grooten J, et al. (2010)Transcriptome analysis of monocyte-HIV interactions. Retrovirology 7: 53.
46. Rotger M, Dang KK, Fellay J, Heinzen EL, Feng S, et al. (2010) Genome-widemRNA expression correlates of viral control in CD4+ T-cells from HIV-1-
infected individuals. PLoS Pathog 6: e1000781.
47. Majumder B, Janket ML, Schafer EA, Schaubert K, Huang XL, et al. (2005)
Human immunodeficiency virus type 1 Vpr impairs dendritic cell maturationand T-cell activation: implications for viral immune escape. J Virol 79:
7990–8003.
48. Venkatachari NJ, Buchanan WG, Ayyavoo V (2008) Human immunodeficiency
virus (HIV-1) infection selectively downregulates PD-1 expression in infectedcells and protects the cells from early apoptosis in vitro and in vivo. Virology
376: 140–153.
49. Huang JC, Morris QD, Frey BJ (2007) Bayesian inference of MicroRNA targets
from sequence and expression data. J Comput Biol 14: 550–563.
50. Griffiths-Jones S, Saini HK, van Dongen S, Enright AJ (2008) miRBase: tools for
microRNA genomics. Nucleic Acids Res 36: D154–158.
51. Tusher VG, Tibshirani R, Chu G (2001) Significance analysis of microarrays
applied to the ionizing radiation response. Proc Natl Acad Sci U S A 98:5116–5121.
52. Weber J, Rangel HR, Chakraborty B, Tadele M, Martinez MA, et al. (2003) A
novel TaqMan real-time PCR assay to estimate ex vivo human immunodefi-ciency virus type 1 fitness in the era of multi-target (pol and env) antiretroviral
therapy. J Gen Virol 84: 2217–2228.53. Asmuth DM, Wang N, Lu Y, Li XD, Reece L, et al. (2005) Cell cycle kinetic
dysregulation in HIV-infected normal lymphocytes. Cytometry A 66: 41–51.
54. Chan EY, Qian WJ, Diamond DL, Liu T, Gritsenko MA, et al. (2007)Quantitative analysis of human immunodeficiency virus type 1-infected CD4+cell proteome: dysregulated cell cycle progression and nuclear transport coincidewith robust virus production. J Virol 81: 7571–7583.
55. Backes C, Meese E, Lenhof HP, Keller A (2010) A dictionary on microRNAsand their putative target pathways. Nucleic Acids Res 38: 4476–4486.
56. Bartel DP (2009) MicroRNAs: target recognition and regulatory functions. Cell
136: 215–233.57. Shalgi R, Lieber D, Oren M, Pilpel Y (2007) Global and local architecture of the
mammalian microRNA-transcription factor regulatory network. PLoS ComputBiol 3: e131.
58. Sundaravaradan V, Mehta R, Harris DT, Zack JA, Ahmad N Differential
expression and interaction of host factors augment HIV-1 gene expression inneonatal mononuclear cells. Virology 400: 32–43.
59. Brown JN, Kohler JJ, Coberley CR, Sleasman JW, Goodenow MM (2008) HIV-1 activates macrophages independent of Toll-like receptors. PLoS One 3: e3664.
60. Xing HQ, Hayakawa H, Izumo K, Kubota R, Gelpi E, et al. (2009) In vivoexpression of proinflammatory cytokines in HIV encephalitis: an analysis of 11
autopsy cases. Neuropathology 29: 433–442.
61. Borjabad A, Brooks AI, Volsky DJ (2009) Gene expression profiles of HIV-1-infected glia and brain: toward better understanding of the role of astrocytes in
HIV-1-associated neurocognitive disorders. J Neuroimmune Pharmacol 5:44–62.
62. Li Y, Chan EY, Katze MG (2007) Functional genomics analyses of differential
macaque peripheral blood mononuclear cell infections by human immunode-ficiency virus-1 and simian immunodeficiency virus. Virology 366: 137–149.
63. Noorbakhsh F, Ramachandran R, Barsby N, Ellestad KK, LeBlanc A, et al.(2010) MicroRNA profiling reveals new aspects of HIV neurodegeneration:
caspase-6 regulates astrocyte survival. FASEB J 24: 1799–1812.64. Tatro ET, Scott ER, Nguyen TB, Salaria S, Banerjee S, et al. Evidence for
Alteration of Gene Regulatory Networks through MicroRNAs of the HIV-
infected brain: novel analysis of retrospective cases. PLoS One 5: e10337.65. Zhao X, He X, Han X, Yu Y, Ye F, et al. (2010) MicroRNA-mediated control of
oligodendrocyte differentiation. Neuron 65: 612–626.66. Lagos-Quintana M, Rauhut R, Yalcin A, Meyer J, Lendeckel W, et al. (2002)
Identification of tissue-specific microRNAs from mouse. Curr Biol 12: 735–739.
67. Liu X, Wang T, Wakita T, Yang W (2010) Systematic identification ofmicroRNA and messenger RNA profiles in hepatitis C virus-infected human
hepatoma cells. Virology 398: 57–67.68. Lee JE, Nam HY, Shim SM, Bae GR, Han BG, et al. (2010) Expression
phenotype changes of EBV-transformed lymphoblastoid cell lines during long-term subculture and its clinical significance. Cell Prolif 43: 378–384.
69. Imig J, Motsch N, Zhu JY, Barth S, Okoniewski M, et al. (2010) microRNA
profiling in Epstein-Barr virus-associated B-cell lymphoma. Nucleic Acids Res39: 1880–1893.
70. Li LM, Hu ZB, Zhou ZX, Chen X, Liu FY, et al. (2010) Serum microRNAprofiles serve as novel biomarkers for HBV infection and diagnosis of HBV-
positive hepatocarcinoma. Cancer Res 70: 9798–9807.
71. Wu H, Neilson JR, Kumar P, Manocha M, Shankar P, et al. (2007) miRNAprofiling of naive, effector and memory CD8 T cells. PLoS One 2: e1020.
72. Kaul D, Ahlawat A, Gupta SD (2009) HIV-1 genome-encoded hiv1-mir-H1impairs cellular responses to infection. Mol Cell Biochem 323: 143–148.
73. Klase Z, Winograd R, Davis J, Carpio L, Hildreth R, et al. (2009) HIV-1 TAR
miRNA protects against apoptosis by altering cellular gene expression.Retrovirology 6: 18.
74. Narayanan A, Kehn-Hall K, Bailey C, Kashanchi F (2010) Analysis of the rolesof HIV-derived microRNAs. Expert Opin Biol Ther 11: 17–29.
75. Zhang C (2009) Novel functions for small RNA molecules. Curr Opin Mol Ther11: 641–651.
76. Fabian MR, Sundermeier TR, Sonenberg N (2009) Understanding how
miRNAs post-transcriptionally regulate gene expression. Prog Mol Subcell Biol50: 1–20.
77. Fabian MR, Sonenberg N, Filipowicz W (2010) Regulation of mRNAtranslation and stability by microRNAs. Annu Rev Biochem 79: 351–379.
78. Huang J, Liang Z, Yang B, Tian H, Ma J, et al. (2007) Derepression of
microRNA-mediated protein translation inhibition by apolipoprotein B mRNA-editing enzyme catalytic polypeptide-like 3G (APOBEC3G) and its family
members. J Biol Chem 282: 33632–33640.79. Huntzinger E, Izaurralde E Gene silencing by microRNAs: contributions of
translational repression and mRNA decay. Nat Rev Genet 12: 99–110.80. Sung TL, Rice AP (2009) miR-198 inhibits HIV-1 gene expression and
replication in monocytes and its mechanism of action appears to involve
repression of cyclin T1. PLoS Pathog 5: e1000263.81. Imig J, Motsch N, Zhu JY, Barth S, Okoniewski M, et al. (2010) microRNA
profiling in Epstein-Barr virus-associated B-cell lymphoma. Nucleic Acids Res.
miRNA and mRNA Regulation during HIV-1 Infection
PLoS ONE | www.plosone.org 12 July 2011 | Volume 6 | Issue 7 | e22730
Copyright © 2022 FDOKUMEN