Mirna Expression Profiles Identify Drivers in Colorectal and Pancreatic Cancers
11
Mirna Expression Profiles Identify Drivers in Colorectal and Pancreatic Cancers Ada Piepoli 1 *, Francesca Tavano 2 , Massimiliano Copetti 3 , Tommaso Mazza 4 , Orazio Palumbo 5 , Anna Panza 1 , Francesco Fabio di Mola 2 , Valerio Pazienza 1 , Gianluigi Mazzoccoli 6 , Giuseppe Biscaglia 1 , Annamaria Gentile 1 , Nicola Mastrodonato 2 , Massimo Carella 5 , Fabio Pellegrini 3,4,5,6,7 , Pierluigi di Sebastiano 2. , Angelo Andriulli 1. 1 Department and Laboratory of Gastroenterology, IRCCS ‘‘Casa Sollievo della Sofferenza’’, Research Hospital, San Giovanni Rotondo, Italy, 2 Department of Surgery, IRCCS ‘‘Casa Sollievo della Sofferenza’’, Research Hospital, San Giovanni Rotondo, Italy, 3 Unit of Biostatistics, IRCCS ‘‘Casa Sollievo della Sofferenza’’, Research Hospital, San Giovanni Rotondo, Italy, 4 Unit of Bioinformatics, IRCCS ‘‘Casa Sollievo della Sofferenza’’, Research Hospital, San Giovanni Rotondo, Italy, 5 Medical Genetics Unit, IRCCS ‘‘Casa Sollievo della Sofferenza’’, Research Hospital, San Giovanni Rotondo, Italy, 6 Department of Internal Medicine and Chronobiology Unit, IRCCS ‘‘Casa Sollievo della Sofferenza’’, Research Hospital, San Giovanni Rotondo, Italy, 7 Unit of Biostatistics, DCPE Consorzio Mario Negri Sud, Santa Maria Imbaro, Italy Abstract Background and Aim: Altered expression of microRNAs (miRNAs) hallmarks many cancer types. The study of the associations of miRNA expression profile and cancer phenotype could help identify the links between deregulation of miRNA expression and oncogenic pathways. Methods: Expression profiling of 866 human miRNAs in 19 colorectal and 17 pancreatic cancers and in matched adjacent normal tissues was investigated. Classical paired t-test and random forest analyses were applied to identify miRNAs associated with tissue-specific tumors. Network analysis based on a computational approach to mine associations between cancer types and miRNAs was performed. Results: The merge between the two statistical methods used to intersect the miRNAs differentially expressed in colon and pancreatic cancers allowed the identification of cancer-specific miRNA alterations. By miRNA-network analysis, tissue- specific patterns of miRNA deregulation were traced: the driving miRNAs were miR-195, miR-1280, miR-140-3p and miR-1246 in colorectal tumors, and miR-103, miR-23a and miR-15b in pancreatic cancers. Conclusion: MiRNA expression profiles may identify cancer-specific signatures and potentially useful biomarkers for the diagnosis of tissue specific cancers. miRNA-network analysis help identify altered miRNA regulatory networks that could play a role in tumor pathogenesis. Citation: Piepoli A, Tavano F, Copetti M, Mazza T, Palumbo O, et al. (2012) Mirna Expression Profiles Identify Drivers in Colorectal and Pancreatic Cancers. PLoS ONE 7(3): e33663. doi:10.1371/journal.pone.0033663 Editor: Alfons Navarro, University of Barcelona, Spain Received November 17, 2011; Accepted February 14, 2012; Published March 30, 2012 Copyright: ß 2012 Piepoli et al. This is an open-access article distributed under the terms of the Creative Commons Attribution License, which permits unrestricted use, distribution, and reproduction in any medium, provided the original author and source are credited. Funding: This work was supported by the Ministry of Italian Health grants RC0903GA51, RC1003GA52, RC1103GA47, RC0903CH47, RC1003CH50, RC1103CH46, RC1003BS14 and RC1102BS45 through Research Unit of Gastroenterology, Research Unit of Surgery, and Unit of Biostatistics; and Casa Sollievo della Sofferenza (IRCCS), San Giovanni Rotondo (FG), Italy. The funders had no role in study design, data collection and analysis, decision to publish, or preparation of the manuscript. Competing Interests: The authors have declared that no competing interests exist. * E-mail: [email protected] . These authors contributed equally to this work. Introduction MicroRNAs (miRNAs) are small non-protein coding RNA molecules that regulate gene expression mainly at the level of protein synthesis [1]. They represent an evolutionary highly conserved system that controls crucial cellular processes, such as development, differentiation, proliferation, apoptosis, and metab- olism [2]. Aberrant expression of miRNAs can arise from deletion, mutation, and methylation of miRNA-encoding genes, many of which located at genomic fragile sites or regions frequently deleted or amplified in cancer [3]. Based on these premises, they have been proven to interact with potential oncogenes or tumor suppressors [4]. Many miRNAs are expressed in a tissue-specific manner, with profiles differentially expressed in either normal and neoplastic tissues, and in tumors with distinct biological properties. In addition, some evidences indicate miRNA profiles to allow reliable identification of the cell-of-origin of tumors [5]. Classically, differential expression of miRNAs has been evaluated either as single contribution or as predictive signature [6,7]. However, much of scientific effort is spent currently to elucidate their functions: most miRNAs control at least one mRNA, and most mRNAs are controlled by more than one miRNA [8]. The complexity behind this sophisticated mechanism can be partly alleviated by the knowledge of the conservation levels of each miRNA. Indeed, high conservation across wide phyloge- netic distances helps restricting the range of functions that a PLoS ONE | www.plosone.org 1 March 2012 | Volume 7 | Issue 3 | e33663
Transcript of Mirna Expression Profiles Identify Drivers in Colorectal and Pancreatic Cancers
Mirna Expression Profiles Identify Drivers in Colorectaland Pancreatic CancersAda Piepoli1*, Francesca Tavano2, Massimiliano Copetti3, Tommaso Mazza4, Orazio Palumbo5,
Anna Panza1, Francesco Fabio di Mola2, Valerio Pazienza1, Gianluigi Mazzoccoli6, Giuseppe Biscaglia1,
Annamaria Gentile1, Nicola Mastrodonato2, Massimo Carella5, Fabio Pellegrini3,4,5,6,7, Pierluigi di
Sebastiano2., Angelo Andriulli1.
1 Department and Laboratory of Gastroenterology, IRCCS ‘‘Casa Sollievo della Sofferenza’’, Research Hospital, San Giovanni Rotondo, Italy, 2 Department of Surgery, IRCCS
‘‘Casa Sollievo della Sofferenza’’, Research Hospital, San Giovanni Rotondo, Italy, 3 Unit of Biostatistics, IRCCS ‘‘Casa Sollievo della Sofferenza’’, Research Hospital, San
Giovanni Rotondo, Italy, 4 Unit of Bioinformatics, IRCCS ‘‘Casa Sollievo della Sofferenza’’, Research Hospital, San Giovanni Rotondo, Italy, 5 Medical Genetics Unit, IRCCS
‘‘Casa Sollievo della Sofferenza’’, Research Hospital, San Giovanni Rotondo, Italy, 6 Department of Internal Medicine and Chronobiology Unit, IRCCS ‘‘Casa Sollievo della
Sofferenza’’, Research Hospital, San Giovanni Rotondo, Italy, 7 Unit of Biostatistics, DCPE Consorzio Mario Negri Sud, Santa Maria Imbaro, Italy
Abstract
Background and Aim: Altered expression of microRNAs (miRNAs) hallmarks many cancer types. The study of theassociations of miRNA expression profile and cancer phenotype could help identify the links between deregulation ofmiRNA expression and oncogenic pathways.
Methods: Expression profiling of 866 human miRNAs in 19 colorectal and 17 pancreatic cancers and in matched adjacentnormal tissues was investigated. Classical paired t-test and random forest analyses were applied to identify miRNAsassociated with tissue-specific tumors. Network analysis based on a computational approach to mine associations betweencancer types and miRNAs was performed.
Results: The merge between the two statistical methods used to intersect the miRNAs differentially expressed in colon andpancreatic cancers allowed the identification of cancer-specific miRNA alterations. By miRNA-network analysis, tissue-specific patterns of miRNA deregulation were traced: the driving miRNAs were miR-195, miR-1280, miR-140-3p and miR-1246in colorectal tumors, and miR-103, miR-23a and miR-15b in pancreatic cancers.
Conclusion: MiRNA expression profiles may identify cancer-specific signatures and potentially useful biomarkers for thediagnosis of tissue specific cancers. miRNA-network analysis help identify altered miRNA regulatory networks that couldplay a role in tumor pathogenesis.
Citation: Piepoli A, Tavano F, Copetti M, Mazza T, Palumbo O, et al. (2012) Mirna Expression Profiles Identify Drivers in Colorectal and Pancreatic Cancers. PLoSONE 7(3): e33663. doi:10.1371/journal.pone.0033663
Editor: Alfons Navarro, University of Barcelona, Spain
Received November 17, 2011; Accepted February 14, 2012; Published March 30, 2012
Copyright: � 2012 Piepoli et al. This is an open-access article distributed under the terms of the Creative Commons Attribution License, which permitsunrestricted use, distribution, and reproduction in any medium, provided the original author and source are credited.
Funding: This work was supported by the Ministry of Italian Health grants RC0903GA51, RC1003GA52, RC1103GA47, RC0903CH47, RC1003CH50, RC1103CH46,RC1003BS14 and RC1102BS45 through Research Unit of Gastroenterology, Research Unit of Surgery, and Unit of Biostatistics; and Casa Sollievo della Sofferenza(IRCCS), San Giovanni Rotondo (FG), Italy. The funders had no role in study design, data collection and analysis, decision to publish, or preparation of themanuscript.
Competing Interests: The authors have declared that no competing interests exist.
* E-mail: [email protected]
. These authors contributed equally to this work.
Introduction
MicroRNAs (miRNAs) are small non-protein coding RNA
molecules that regulate gene expression mainly at the level of
protein synthesis [1]. They represent an evolutionary highly
conserved system that controls crucial cellular processes, such as
development, differentiation, proliferation, apoptosis, and metab-
olism [2]. Aberrant expression of miRNAs can arise from deletion,
mutation, and methylation of miRNA-encoding genes, many of
which located at genomic fragile sites or regions frequently deleted
or amplified in cancer [3]. Based on these premises, they have
been proven to interact with potential oncogenes or tumor
suppressors [4]. Many miRNAs are expressed in a tissue-specific
manner, with profiles differentially expressed in either normal and
neoplastic tissues, and in tumors with distinct biological properties.
In addition, some evidences indicate miRNA profiles to allow
reliable identification of the cell-of-origin of tumors [5].
Classically, differential expression of miRNAs has been
evaluated either as single contribution or as predictive signature
[6,7]. However, much of scientific effort is spent currently to
elucidate their functions: most miRNAs control at least one
mRNA, and most mRNAs are controlled by more than one
miRNA [8]. The complexity behind this sophisticated mechanism
can be partly alleviated by the knowledge of the conservation levels
of each miRNA. Indeed, high conservation across wide phyloge-
netic distances helps restricting the range of functions that a
PLoS ONE | www.plosone.org 1 March 2012 | Volume 7 | Issue 3 | e33663

miRNA can play to regulate the control of species development
and physiology.
In this study, we investigated expression patterns of miRNAs in
colorectal (CRC) and pancreatic cancer (PC) with the intent to
identify miRNA regulatory networks likely involved in oncogenic
pathways by evaluating cancer-specific signatures through the
analysis of the relationship between miRNA expression profile and
cancer lineages.
Materials and Methods
Samples Selection and RNA ExtractionPrimary tumor and neighbouring non-tumorous tissues were
obtained from two training cohorts of 19 CRC patients and 17
PC patients, and from two validation cohorts of 14 CRC and 21
PC patients.. The study was performed with the approval of the
Scientific and Ethic committees of the IRCCS ‘‘Casa Sollievo
della Sofferenza’’ Institute, San Giovanni Rotondo, FG (Italy).
The patients gave informed written consent according to the
Italian law on privacy (providing for the protection of personal
data), so individuals can not be identified from data or images
included in this publication, and approved by the Scientific and
Ethic committees of the IRCCS ‘‘Casa Sollievo della Soffer-
enza’’ Institute. All clinical investigations have been conducted
according to the principles expressed in the Declaration of
Helsinki.
Patient clinical data, tumor location, and staging are shown in
Table S1. Tissue samples were flash frozen in liquid nitrogen and
stored at 280uC until nucleic acids extraction. About 150–200 mg
fresh frozen tissues were used to isolate total RNA by phenol
extraction (TRIzol Reagent, Invitrogen Corporation, Carlsbad,
CA, USA). RNA concentration and purity were controlled by
Nano Drop Specthophotometer. The Agilent 2100 Bioanalyzer
was used to measure the quantity, integrity and purity of small
RNAs and total RNA, and only non degraded RNA characterized
by an RNA integrity number .7 with no DNA contamination
signs was processed.
MiRNA MicroarraysMiRNA expression profile was determined by using Gene-
ChipH miRNA Array (www.affymetrix.com). This array contains
46,228 probes comprising 7,815 probe sets, including controls,
and covers 71 organisms such as human, mouse, rat and dog.
Content is derived from the Sanger miRBase miRNA database
v.11 (April 15, 2008, http://microrna.sanger.ac.uk). Probe sets
targeting human snoRNAs and scaRNAs are derived from the
snoRNABase (www.snorna.biotoul.fr/coordinates.php) and the
Ensembl (www.ensembl.org/biomart/martview) archives, Briefly,
1.5 mg of total RNA was labeled using the 3DNA Array
Detection FlashTagTM RNA Labeling Kit (http://www.
genisphere.com), according to manufacturer’s recommendations.
First, poly (A) tailing was carried out at 37uC for 15 min in a
volume of 15 ml reaction mix, which contained 1X Reaction
Buffer, 1.5 ml MgCl2 [25 mM], 1 ml ATP Mix diluted 1:500 and
1 ml PAP enzyme. Second, Flash Tag Ligation was performed at
room temperature for 30 min by adding 4 ml of 5X Flash Tag
Ligation Mix Biotin and 2 ml T4 DNA Ligase into the 15 ml of
reaction mix. To stop the reaction, 2.5 ml of Stop Solution was
added. Samples were hybridized, washed and scanned with an
Affymetrix Scanner.
All microarray data are MIAME compliant and the raw data
has been deposited in ArrayExpress (accession number E-MTAB-
752 for colon cancer miRNA expression profiles and E-MTAB-
753 for pancreatic cancer miRNA expression profiles).
Quantitative estimation of miRNA by reversetranscription Real-Time PCR assay
Quantitative real-time polymerase chain reaction (qPCR) of
miRNAs was performed using TaqMan MicroRNA Assay
(Applied Biosystems, Foster City, CA, USA) with ABI-PRISM
7700 Sequence Detection System. A two-step protocol requires
reverse transcription with a miRNA-specific primer, followed by a
real-time PCR with TaqMan probes. The assays target only
mature miRNAs, not their precursors. In brief, reverse transcrip-
tase reactions contained 10 ng of RNA samples, 50 nM stemloop
RT primer, 10X RT buffer, 0.25 mM each of dNTPs, 3.33 U/ml
MultiScribe RT and 0.25 U/ml RNase inhibitor (all purchased
from cDNA Archive kit of Applied Biosystems) were performed in
final volume of 15 ml and incubated in termal cycler for 30 min at
16uC, 30 min at 42uC, 5 min at 85uC and then held at 4uC. The
20 ml PCR reaction mixture included 1.3 ml RT product (1:15
diluition), 10 ml of TaqMan 2X Universal PCR Master Mix
(NoUmpErase UNG) and 1 ml of TaqMan 20X MicroRNA Assay
(Applied Biosystems, Foster City, CA, USA). Reactions were
incubated in a 96-well optical plate at 95uC for 10 min, followed
by 40 cycles of 95uC for 15 sec and 60uC for 10 min. All assays
were performed in triplicate.
Statistical AnalysisPatients’ baseline characteristics were reported as mean 6
standard deviation (SD) or frequencies and percentages for
continuous and categorical variables, respectively.
For each of the two training cohorts, microRNA chip data were
normalized using Robust Multi-array Average (RMA) algorithm
[9]. In order to identify differentially expressed miRNAs between
paired normal and tumor tissues, two approaches were followed.
Firstly, a classical paired t-test controlling for false discovery rate
(fdr) allowed ranking miRNAs according to their p-values.
Secondly, random forest (RF) analysis [10] was applied to detect
miRNAs with the best capability in discriminating tumor from
paired normal tissues. A RF is a classifier consisting of an ensemble
of tree-structured classifiers. According to this technique, 100,000
trees were built to classify tissues. The learning set used to grow
each tree was a .632+ bootstrap resample of the observations.
Trees were allowed to grow to their full size without pruning. The
best split at each node was selected from a random subset of
miRNAs. The left-out observations (i.e., ‘‘out of bag’’ observations)
were then predicted to obtain the classification error rate of the
considered tree. Predictive ability of the classifier was assessed
aggregating the single tree error rates. Furthermore, the random
forest framework allowed us to estimate the importance of a
variable by looking at how much the classification error increases
when ‘‘out of bag’’ data for that variable are permuted while all
others are left unchanged. The importance metric used was the
Mean Decrease in Accuracy (MDA). The MDA is constructed by
permuting the values of each variable of the test set, recording the
prediction and comparing it with the un-permuted test set
prediction of the variable. Therefore, it is the increase in the
percentage of times a test set is misclassified when the variable is
permuted. We followed Strobl et al. [11] to avoid possible bias in
variable selection: individual classification trees were built using
subsampling without replacement and adopting a conditional
permutation scheme [12]. We obtained a miRNAs ranking in
accordance to the variable importance measure. Finally, the two
miRNA rankings, one from the classical analysis and one from RF
analysis, were merged to obtain a list of differentially expressed
miRNAs. Correlations between miRNA expression were estimated
using Spearman coefficient. A p value,0.05 was considered for
statistical significance. All analyses were performed using SAS
Colon and Pancreatic Cancers: A Network View
PLoS ONE | www.plosone.org 2 March 2012 | Volume 7 | Issue 3 | e33663
Release 9.1 (SAS Institute, Cary, NC, USA) and R for random
forest analyses (randomForest package).
Quantitative real-time PCR (qPCR) assay was used on external
validation cohorts to confirm microRNA array results, which were
assessed using the Comparative Threshold cycle (CT) method and
default threshold settings. Relative expressions of miRNA were
computed by 22DDCt formula [13] using U6 small nuclear RNA
(RNU6B) as normalization control. Since the 22DDCt transformed
values were not normally distributed, comparisons were made
using the non-parametric Wilcoxon signed rank test in order to
assess the statistical significance of the up or down regulation. For
the qPCR validation analyses, we considered a sample size of 14
subjects to provide a 90% power (with a two-sided alpha = 0.05) to
detect an up-regulation of at least 2 or a down-regulation of at
most 0.5 of each miRNA’s expression in terms of 22DDCt using the
non-parametric Wilcoxon signed rank test and 1 as the null
hypothesis.
Network analysisFor each of the two training cohorts an undirected and weighted
network was built, where nodes and edges represent miRNAs and
their correlations (when significant), respectively. Thus, edges are
not oriented since correlation is symmetric, and weighted with the
Spearman coefficient. The thickness of edges mirrors the
magnitude of the weights. In order to dig critical nodes out of
both CRC and PC networks, we borrowed some methods from
the social sciences, and evaluated the following centrality measures:
degree, betweenness and clustering coefficient [14,15] for each network.
Finally, miRNAs have been ranked accordingly.
All these measures (or metrics) are based on enumeration of
links or shortest paths. In details, let us define a path from s [V to
t [V , with V the set of nodes, as an alternating sequence of nodes
and edges, beginning with s and ending with t, such that each edge
connects its preceding with its succeeding vertex. We set the length
of a path as to be the sum of the inverse weights of its edges. The
idea is that highly correlated miRNAs minimize the distance
between nodes or, from another perspective, the closer two nodes
are the more they are correlated. Therefore, we compute the
distance between two nodes s and t, written dG(s,t), as the
minimum length of any path connecting s and t in G. By
definition, dG(s,s)~0 for every s [V .
Degree centrality is based on the idea that important nodes are
those with the largest number of ties to other nodes in the graph. It
is often interpreted in terms of the immediate involvement of
nodes in relationships established through the network. Let wus be
the weight of the edge, which connects the node u with the node s,
the degree centrality of a node u is Cd (u)~P
u,s[E
wus, with E the set
of edges, according to which the higher is the degree value, the
more important (globally correlated) is the node.
Betweenness centrality measures the influence a node has over the
indirect correlation between not neighbor nodes. Betweenness, in its
basic version, is computed as the fraction of shortest paths between
node pairs that pass through the node of interest. Its mathematical
expression is Cb(u)~P
s=u=t[V
ss,t(u)
ss,t, where ss,t is the number of
shortest paths from s to t, and ss,t(u) is the number of shortest paths
from s to t that pass through a vertex u. Vertices that occur on many
shortest paths between other vertices have higher betweenness, and
then higher relevance in indirect correlations.
The Clustering coefficient is a measure of degree to which nodes in
a graph tend to cluster together, or in other terms, it quantifies
nodes because of the extent to which their neighbors are to being a
clique (complete graph) with it. The clustering coefficient of a node
is then given by the proportion of links between the nodes within
its neighbourhood divided by the number of links that
could possibly exist between them. Succinctly, it is expressed
as C(u)~2 ejk
� ��� ��ku(ku{1)
: vj ,vk [Nu,ejk [E, where Nu defines the
immediately connected neighbours set of u and ku~ Nuj j. Its
‘weighted’ formulation builds on the weights of the triangles centered
on the nodes of a network. It is defined by Horvath and Zhang [16]
as CHZ(u)~
Pi=u
Pj=i,j=u
wuiwijwju
Pi=u
wui
� �2
{P
i=uw2
ui
: where wij is the weight over
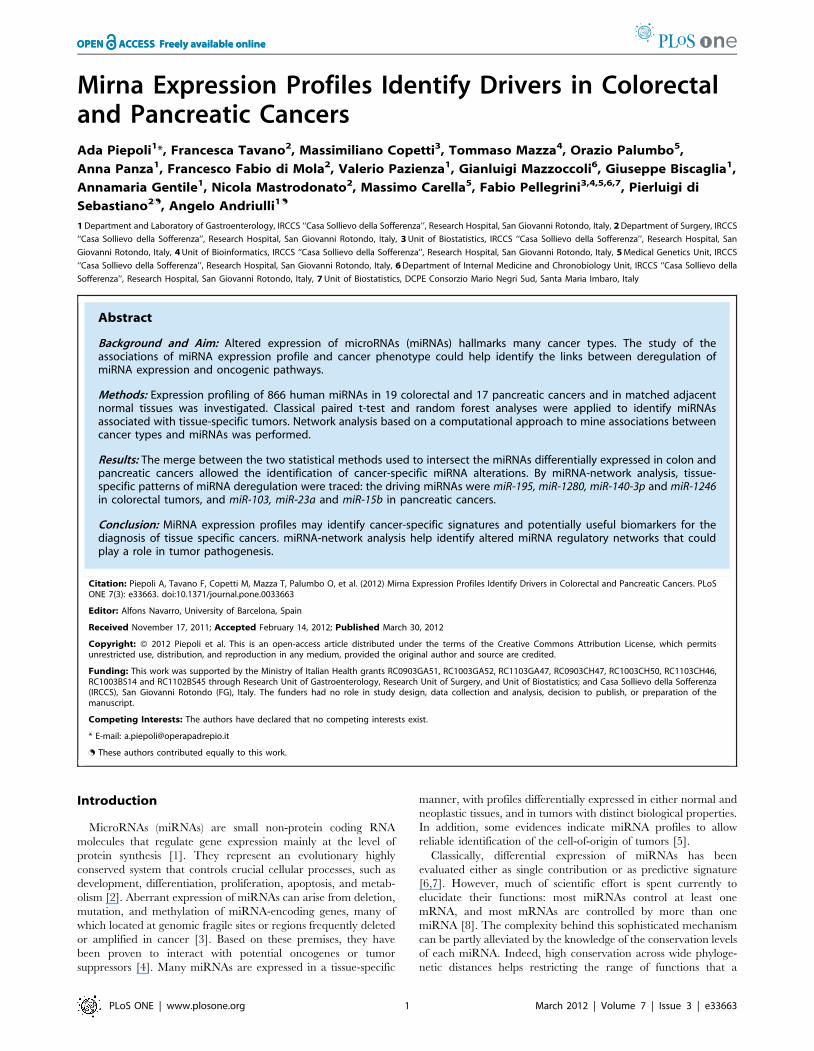
Figure 1. Hierarchical clustering of miRNA expression. miRNA profiles of 36 paired tissue specimens from 19 colorectal cancer (orange box)and 17 pancreatic cancer (green box) patients were clustered. The 36 paired specimens are in rows (coloured bars) and the 866 miRNAs are incolumns. T, tumor tissue; N, adjacent normal tissue.doi:10.1371/journal.pone.0033663.g001
Colon and Pancreatic Cancers: A Network View
PLoS ONE | www.plosone.org 3 March 2012 | Volume 7 | Issue 3 | e33663

the edge eij , and thus wuiwijwju the product of the weights of the
edges which form a closed triangle (u?i?j?u) of nodes. Starting
from the local definition of the clustering coefficient, we report its
averaged formulation by Schank and Wagner [17] for the whole
network as the ratio between the sum of the products of the clustering
coefficients and a general weight function, and the weight function
itself, namely CSW~
Pv
w vð Þc vð ÞPv
w(v),where w(v) is the general weight
function. The weight function is usually chosen among the metrics
that better capture the topology of the network under examination. A
lower Average Weighted Clustering Coefficient measure indicates a more
important node in relationship to the network robustness.
Networks have been drawn and analyzed by a custom
standalone tool written in C# and built over the library NodeXL
1.0.1.174 [18].
Table 1. MicroRNAs selected by t-test in CRC.
MiRNA p-value Ratio1 Fold-Change
hsa-miR-1246 6.90E-13 12.019 12.0189
hsa-miR-378 4.16E-09 0.320 23.12036
hsa-miR-28-3p 1.48E-07 0.361 22.7707
hsa-miR-139-5p 5.74E-07 0.154 26.50147
hsa-miR-21* 1.10E-06 3.363 3.36277
hsa-miR-140-3p 2.04E-06 0.475 22.10544
hsa-miR-21 1.38E-05 3.440 3.43984
hsa-miR-145 1.48E-05 0.449 22.22598
hsa-miR-30c 2.02E-05 0.599 21.67026
hsa-miR-106a 2.38E-05 1.622 1.62216
hsa-miR-17 2.42E-05 1.733 1.73316
hsa-miR-30d 2.53E-05 0.717 21.39392
hsa-miR-486-5p 2.58E-05 0.224 24.46696
hsa-miR-503 2.84E-05 3.357 3.35674
hsa-miR-1290t 5.52E-05 2.296 2.29618
hsa-miR-31 5.58E-05 11.485 11.4851
hsa-miR-342-3p 5.89E-05 0.591 21.69151
hsa-miR-1826 7.99E-05 2.478 2.47797
hsa-miR-182 8.38E-05 3.694 3.69436
hsa-miR-28-5p 0.000122245 0.487 22.05143
hsa-miR-429 0.000163538 2.012 2.0116
hsa-miR-10b 0.000179917 0.358 22.79048
hsa-miR-196b 0.000254369 2.119 2.11937
hsa-miR-1280 0.000286619 2.145 2.14475
hsa-miR-18a 0.000294119 3.826 3.82618
hsa-miR-720 0.000300471 4.459 4.45944
hsa-miR-708 0.000311099 3.459 3.45926
hsa-miR-224 0.000329656 2.320 2.3199
hsa-miR-143 0.000408223 0.512 21.95475
hsa-miR-183 0.000474118 3.064 3.06428
hsa-miR-138 0.000528794 0.302 23.31458
hsa-miR-422a 0.000533316 0.306 23.26738
hsa-miR-99 a 0.000577088 0.340 22.94193
hsa-miR-18b 0.000690552 2.521 2.52109
hsa-miR-195 0.000701403 0.436 22.2921
hsa-miR-149 0.000758911 0.494 22.02318
hsa-miR-92a-1* 0.000766587 1.905 1.90481
hsa-miR-339-5p 0.000883788 3.056 3.0557
hsa-miR-19a 0.0009656 2.268 2.26773
hsa-miR-19b 0.00103109 1.914 1.91352
hsa-miR-130b 0.00104793 2.053 2.05348
hsa-miR-92a 0.00105709 2.322 2.32229
Forty-two miRs deregulated in tumoral compared to matched normal tissueand selected by p,0.001. Twenty-five overexpressed miRs in cancer areindicated by positive fold-change; seventeen down-regulated miRs areindicated by negative fold-change.1: Tumour vs Normal tissue.doi:10.1371/journal.pone.0033663.t001
Table 2. MicroRNAs selected by t-test in PC.
MiRNA p-value Ratio1 Fold-Change
hsa-miR-23a 0.000215491 9.37178 9.37178
hsa-miR-1254 0.000567431 0.578601 21.72831
hsa-miR-103 0.00116796 5.22503 5.22503
hsa-miR-107 0.0015613 6.83561 6.83561
hsa-miR-1207-5p 0.00156319 2.27566 2.27566
hsa-miR-125a-5p 0.00173021 6.55499 6.55499
hsa-miR-221 0.00175528 3.74587 3.74587
hsa-miR-140-5p 0.00181141 1.47229 1.47229
hsa-miR-143 0.00201799 6.38038 6.38038
hsa-let-7d 0.00221191 5.26385 5.26385
hsa-miR-146u 0.00221576 3.06742 3.06742
hsa-miR-145 0.00236652 5.76811 5.76811
hsa-let-7e 0.00265301 7.05982 7.05982
hsa-miR-199b-3p 0.00275494 4.79528 4.79528
hsa-miR-138-1* 0.00294212 1.71977 1.71977
hsa-miR-92b 0.00306909 1.75529 1.75529
hsa-miR-199a-3p 0.00333868 4.63266 4.63266
hsa-miR-29b-1* 0.00372484 1.34857 1.34857
hsa-miR-92u 0.00391816 5.19232 5.19232
hsa-let-7f-1* 0.00402756 0.669364 21.49396
hsa-miR-559 0.00419118 0.499458 22.00217
hsa-miR-181u 0.00473953 4.4176 4.4176
hsa-miR-1246 0.00499233 2.37905 2.37905
hsa-miR-31 0.00534964 4.1793 4.1793
hsa-let-7u 0.0057542 5.60946 5.60946
hsa-miR-331-3p 0.00587375 1.91755 1.91755
hsa-miR-155 0.00659337 3.93778 3.93778
hsa-miR-1274a 0.0072345 0.74278 21.34629
hsa-miR-26a 0.0075564 5.1572 5.1572
hsa-miR-17 0.00851766 3.07585 3.07585
hsa-miR-23b 0.00916704 5.8671 5.8671
hsa-miR-24 0.00928757 4.58821 4.58821
hsa-miR-939 0.0093498 1.52377 1.52377
hsa-miR-500* 0.00996664 2.34195 2.34195
Thirty-four miRs deregulated in tumoral compared to matched normal tissueand selected by p,0.01. Thirty overexpressed miRNAs in cancer are indicatedby positive fold-change; four down-regulated miRNAs are indicated by negativefold-change.1: Tumour vs Normal tissue.doi:10.1371/journal.pone.0033663.t002
Colon and Pancreatic Cancers: A Network View
PLoS ONE | www.plosone.org 4 March 2012 | Volume 7 | Issue 3 | e33663
Results
Altered miRNA expression in patients with CRC and PCWe compared miRNA profiles of 36 pairs of solid tumors and
adjacent nontumorous tissues in the training cohorts (19 CRC and
17 PC) by means of microRNA microarrays. Human miRNAs
(has-miR-) and tissues were grouped by a hierarchical clustering
analysis (Figure 1). Each plotted probe was color-coded to equate
the level of expression of the miRNA relative to its median
expression level across the entire tissue samples set (blue, low; red,
high) (Figure 1).
Differentially expressed miRNA in CRC and PCIn order to identify miRNAs differentially expressed in
paired normal and tumor tissues, two approaches were
followed: a classical paired t-test controlling for false discovery
rate (fdr) and a RF analysis. By the first analysis, 42 miRNAs
were differentially expressed in CRC (Table 1). Twenty-five of
them were overexpressed, with hsa-miR1246 showing the
highest fold-change value (12.0-fold). In PC, 128 miRNAs
were differentially expressed (see Table S2). In particular, of 34
miRNAs with a p,0.01, 30 showed higher expression levels in
tumor tissue, with hsa-miR-23a displaying the highest fold-
change value (9.3-fold), whereas 4 more miRNAs were down-
regulated (Table 2).
To ascertain the eventual existence of orthologues in other
species, and to use them as internal methodological control, the
human miRNAs found altered in the two solid tumors were
checked in 71 other organisms present in the array: all de-
regulated orthologues of human miRNAs (from now on, has-
miR- will be referred to as miR-) showed a significant differential
expression with similar fold-change in these organisms (Table
S3).
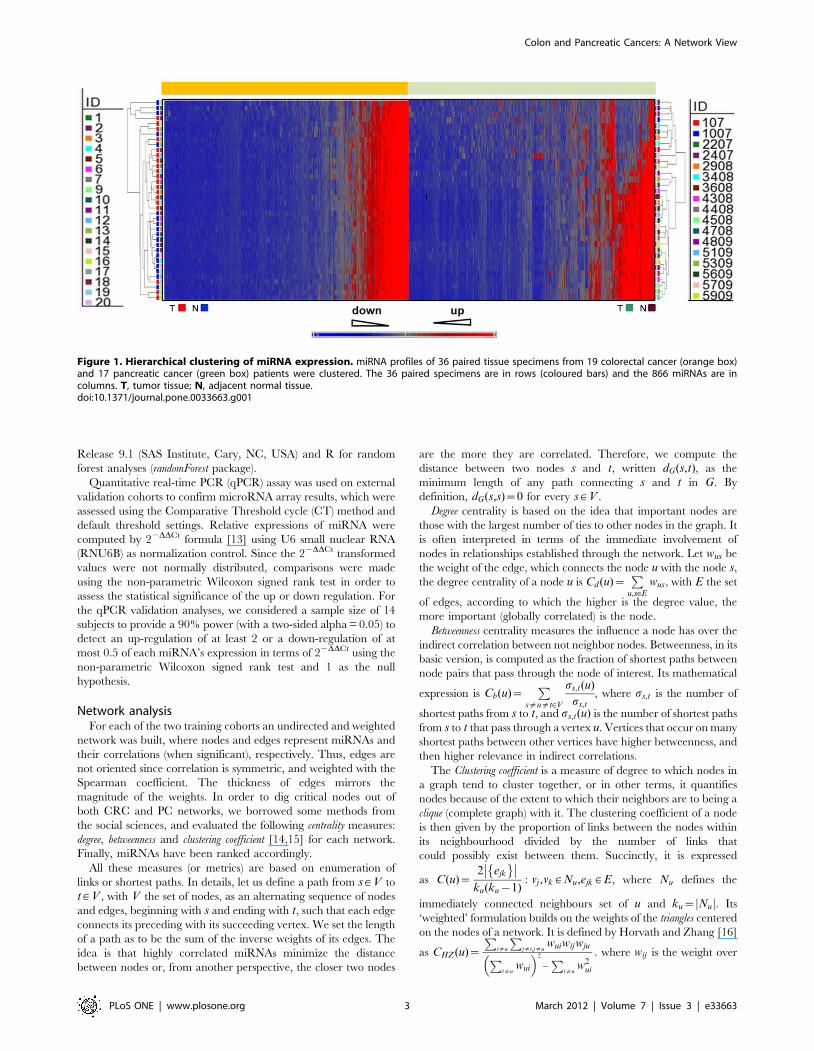
To check the accuracy of the RF, classification performances in
discriminating tumor from normal tissue were reported in
multidimensional scaling of the estimated proximity matrix plots
(Figure 2) displaying similarities or dissimilarities in data. For each
tumor type, the ranks of the most important miRNAs, according
to MDA, were derived (Figure 3, panels A and B).
Comparison of miRNA signature detection methodsWhen the results with the t-test and RF were merged, a
significant overlap among miRNAs detected in either CRC and
PC tissues was found. By intersecting the miRNAs with p,0.001
at t-test analysis (Table 1) with those with the highest MDA at RF
analysis (Figure 3A), the expression of 24 miRNAs was
significantly altered in CRC (Figure 4). By a similar analytical
approach (Table S2, and Figure 3B), 23 miRNAs were
significantly altered in PC (Figure 4).
As shown in Figure 4, miRNA expression was heavily tissue
specific; indeed, most miRNAs with altered expression in CRC
were not differentiallly expressed in pancreatic tumoral tissue. The
altered expression of only two miRNA was shared by CRC and
PC: miR-145 appeared 2.2-fold down-regulated (p,0.001) in
CRC, and 5.7-fold up-regulated (p,0.01) in PC, while miR-1280
was 2.1-fold up-regulated (p,0.001) and 2.3-fold down-regulated
(p,0.05) in the former and latter cancers, respectively (see Table 1,
Table 2 and Table S2).
miRNA correlations and cancer-miR networkNext we tried to verify the inter-relationship of previously
selected miRNAs expressed in either CRC and PC tissues by
means of the Spearman correlation coefficient method.
For CRC, different degrees of correlation were found for the
24 miRNAs exhibiting altered expression: miR-106a was not
Figure 2. Multidimensional scaling plot. Proximity matrices from random forest analysis, where x- and y- axes are the multidimensional scalingcoordinates. Subjects with similar miRNA expressions are represented by points close one to the other, whereas subjects with dissimilar miRNAexpressions are represented by separated points. Red = tumor tissue, Black = adjacent normal tissue.doi:10.1371/journal.pone.0033663.g002
Colon and Pancreatic Cancers: A Network View
PLoS ONE | www.plosone.org 5 March 2012 | Volume 7 | Issue 3 | e33663

Colon and Pancreatic Cancers: A Network View
PLoS ONE | www.plosone.org 6 March 2012 | Volume 7 | Issue 3 | e33663

correlated at all, while miR-195 exhibited the largest number of ties
and was taken as a root node with 9 edges (degree 15.86); 8 links were
detected for miR-28-3p (degree 15.66), and 7 links for miR-1280 (degree
13.79), miR-1246 (degree 13.05), and miR-140-3p (degree 12.12)
(Figure 5, panel A). The latter 3 nodes were also interconnected
with miR-28-3p, which showed a high betweenness value. For this
last measure, the highest value was observed for miR-1246 node on
which many shortest paths between other vertices occur (Table S4).
Another important node was represented by miR-18a with 6
relationships, 3 of them established with several miRNAs belonging
to the miRNA 17-92a cluster. When we measured the degree of
nodal clustering (clustering coefficient), the miR-378, miR-10b and miR-
31 appeared to be a clique with vertice in miR-28-3p. To verify the
robustness of the network, we calculated the average weighted clustering
coefficient, and evaluated the contribution of a miRNA to the overall
compactness of the network. The lowest scores were observed for
miR-1280, miR-195 and miR-140-3p which were the vertices of
complete graph (Figures 5, panel A and Table S4).
Twenty out of 23 miRNAs with a significant deregulation in PC
tissues were linked to others vertices of the network by a number of
edges varying from one to five (degree: from 8.88 to 1.92); for only 3
miRNAs (i.e. miR-30d*, miR-1280 and miR-493*) no significant
correlation was observed (degree: 0), (Figure 5, panel B). In
particular, the maximum number of ties was found for miR-103
(degree: 8.88), miR-23a (degree: 8.84) and miR-15b (degree: 8.38). These
3 main nodes were all linked to miR-199a-3p (degree: 6.03) and
these four miRNA appeared inter-crossed to constitute a four-
node clique. The highest betweenness centrality measure was
observed for miR-384 (betweenness: 0.31), found to be critically
positioned in between (thus, responsible of many) medium-range
correlations. We verified the essentiality of the four-node clique by
measuring the overall robustness of the network (in terms of paths
redundancy) after removing it. We computed the average weighted
clustering coefficient for the whole network by removing in turn a
node. In particular, after excluding the nodes of the clique (miR-
103, miR-15b, miR-199a-3p and miR-23a) the lowest ranks, namely
Figure 3. Variable Importance table. Mean Decrease in Accuracy (MDA) as a measure of miRNA importance in classifying tumor tissues fromnormal ones estimated by random forest analysis. The first 42 most important miRNAs in colorectal cancer (panel A) and 50 miRNAs in pancreaticcancer (panel B) are shown.doi:10.1371/journal.pone.0033663.g003
Figure 4. Merged results. For both tissues a significant overlap among detected miRNAs was found by merging t-test and RF results. A group of 24miRNAs, whose expression was significantly altered in colorectal tumors, were obtained intersecting the list of first 42 miRNAs with best p-values,from t-test analysis, with those at highest MDA, from RF analysis. In the same fashion, 23 miRNAs with altered expression were selected in pancreatictumors. * p,0.001; 1 RF.4.3; **p,0.05; # RF.0.94.doi:10.1371/journal.pone.0033663.g004
Colon and Pancreatic Cancers: A Network View
PLoS ONE | www.plosone.org 7 March 2012 | Volume 7 | Issue 3 | e33663

Colon and Pancreatic Cancers: A Network View
PLoS ONE | www.plosone.org 8 March 2012 | Volume 7 | Issue 3 | e33663

5.78, 5.85, 6.05 and 6.14 were obtained, respectively. This finding
pinpoints to these nodes as functionally relevant and as
considerable constituent of the cohesiveness of the network
(Figure 5, panel B and in Table S4).
Validation qPCRAmong significantly deregulated miRNAs in the microarray
study, 18 were selected for further validation by quantitative real-
time PCR (qPCR). Selection of these miRNAs was based on two
criteria: the outcome of the previously described intersection
analysis, and/or their involvement in colon or pancreas tumor-
igenesis (according to literature data). Quantitative PCR was
applied to analyse altered expression of the selected miRNAs, as
well as that of the RNAU6 control, in the tumor and normal
tissues taken from a new validation cohorts of 14 patients with
CRC and 21 PC patients.
Compared to normal tissue with an expression profile
normalized to 1, in tumor samples of the 14 CRC patients we
observed a significant up-regulation for 3 miRNAs (miR-31,
miR-21 and miR-708), and under expression in 7 others (miR-145,
miR-139-5p, miR-486-5p, miR-378, miR-140-3p, miR-143 and miR-
30c) (Table 3). The remaining 8 miRNAs (miR-151-5p, miR-155*,
miR-17, miR-199a-5p, miR-23a, miR-30a-5p, miR-455-3p, and miR-
let-7i) did not exhibit significantly altered expression.
In the cohort of 21 PC patients, 13 out of 18 miRNAs were
analyzed by qPCR in tumoral tissue compared to normal samples.
Down-expression was observed only for miR-21, whereas over-
expression was observed in 12 miRNA (miR-143, miR-145, miR-
151-5p, miR-155*, miR-199a-5p, miR-23a, miR-30a, miR,30c,
miR-21, miR-455-3p, miR-708 and miR-let-7i) and only two were
not deregulated in a statistically significant way (miR-30a and miR-
30c) (Table 3).
Discussion
MiRNAs that are differentially expressed in various cancers
may participate in common altered regulatory pathways [19].
Thus, the knowledge of their interacting network can provide a
perspective of altered miRNAs and their pattern of deregulation
(i.e., up- or down-regulation). In this study, we profiled miRNAs in
two different solid cancer tissues, the CRC and PC, to test whether
any plausible ‘‘signatures’’ was detectable. To this purpose, we
initially looked for miRNAs differentially expressed in tumors and
normal tissue of the two different lineages, and subsequently
identified ‘‘tissue-specific’’ miRNAs by using a novel statistical
approach, i.e. the RF classifier. For each cancer tissue we were
able to generate a list of the most specific and significantly
deregulated miRNAs. Interestingly, in the two lists only two
miRNAs recurred but with opposite patterns of expression: miR-
145 and miR-1280. However, while different patterns of the
expression of miR-145 are recognized [20], nothing is known about
miR-1280 and its behavior in solid tumor.
A comprehensive analysis of interactive networks of these
miRNAs showed that their deregulation patterns are tissue
specific, as dissimilar connections (i.e., different correlation
patterns) were observed between them in the two lineages.
Moreover, we determined the most critical miRNAs and verified
that they were different in CRC and in PC networks.
To understand the regulatory mechanisms of the miRNAs
linked with significant connections in both networks, we conducted
a three-step in-silico analysis. First, we ranked nodes by means of
well-known centrality indices: weighted degree and betweenness.
While the former index provided insights of the direct effect
exerted by each node to its neighborhood (in our case, their
correlation), the latter identified nodes essential for indirect
Figure 5. CRC and PC network. Green points depict the nodes corresponding to 24 miRNAs of CRC network and 23 miRNAs of PC network. Theedges characterize the significant correlations, whose thickness reflects Spearman Correlation Coefficients (blue and green edges are used forpositive and negative correlations respectively). In CRC network, as shown in panel A, miR-195, miR-28-3p, miR-1280, miR-18a and miR-1246 exhibitthe highest weighted degree rank. No correlation is found for miR-106a. MiR-1246 has also the highest betweenness rank. In PC network, as shown inpanel B, miR-103, miR-23a and miR-15b have the highest degrees and are all linked to miR-199a-3p as well as to each other forming a four nodesclique. In addition, the removal of these nodes causes the deepest drop of the average clustering coefficient rank. MiR-384 exhibits the highestbetweenness centrality measure.doi:10.1371/journal.pone.0033663.g005
Table 3. Differentially regulated miRs in CRC and in PC vs.matched respective normal tissues.
Variable mean fold-change (Q1-Q3) P value Cancer type
miR-31 28.01 (5.75–68.59) ,0.0001 Colon
12.29 (3.03–29.14) ,0.0001 Pancreas
miR-21 2.88 (1.20–4.70) ,0.05 Colon
0.80 (0.19–2.94) ns Pancreas
miR-708 1.93 (0.65–3.53) ,0.05 Colon
3.62 (1.16–11.24) ,0.05 Pancreas
miR-143 0.30 (0.18–1.18) ,0.05 Colon
3.52 (0.95–9.55) ,0.0001 Pancreas
miR-30c 0.36 (0.14–0.77) ,0.05 Colon
1.36 (0.38–3.44) ns Pancreas
miR-151-5p 0.77 (0.41–1.58) ns Colon
1.12 (0.76–2.68) ,0.05 Pancreas
miR-155* 1.34 (0.46–3.91) ns Colon
4.07 (1.15–38.17) ,0.05 Pancreas
miR-199a-5p 0.65 (0.30–1.34) ns Colon
2.14 (0.34–15.13) ,0.05 Pancreas
miR-23a 1.44 (0.88–2.26) ns Colon
2.91 (0.81–13.63) ,0.05 Pancreas
miR-455-3p 1.03 (0.65–2.47) ns Colon
1.62 (0.69–4.95) ns Pancreas
miR-30a-5p 0.71 (0.29–1.34) ns Colon
1.24 (0.07–2.26) ns Pancreas
Let-7i 1.07 (1.03–1.86) ns Colon
1.77 (0.68–7.07) ,0.05 Pancreas
miR-145 0.20 (0.08–0.26) 0.0001 Colon
2.72 (0.64–6.89) ,0.05 Pancreas
miR-486-5p* 0.43 (0.25–0.83) ,0.0001 Colon
miR-378 0.23 (0.11–0.60) ,0.05 Colon
miR-140-3p 0.46 (0.14–0.96) ,0.05 Colon
miR-139-5p 0.10 (0.04–0.14) ,0.05 Colon
miR-17 0.97 (0.36–2.13) ns Colon
doi:10.1371/journal.pone.0033663.t003
Colon and Pancreatic Cancers: A Network View
PLoS ONE | www.plosone.org 9 March 2012 | Volume 7 | Issue 3 | e33663

correlations, namely nodes that lie in paths of correlation and that
somehow contributes to long range correlations. Consequently, we
ranked nodes with the clustering coefficient index, in order to measure
their degree of cohesiveness with the immediate neighbors. The
aim was to quantify the robustness of the networks, by looking for
the nodes that would otherwise disrupt the networks architecture
when not taken into account. To this purpose, we computed the
cluster coefficient for the whole networks by cyclically removing
one node with corresponding edges, and by employing the weighted
degree as weight function. Generally, networks lacking nodes
essential to the overall robustness exhibited lower scores.
As last step, we validated our in-silico estimations by manually
inspecting target genes and their signaling pathways. With these
approaches, we observed that the majority of miRNAs with similar
deregulation patterns were associated with common target genes
and/or regulatory pathways (see Table S5). In particular, in CRC
three principal nodes were found: miR-195, miR-18a, and miR-
1246. The first node had a high relationship with miRNAs
involved in MAPK signaling pathway, as shown in-silico analysis by
using DIANA-mirPath (http://diana.cslab.ece.ntua.gr/pathways/
index_multiple.php), except miR-31 and miR-28-3p, which belong
to the EGF pathway. The second node, the miR-18a, included
several miRNAs (miR-17, miR-19b, miR-92a) belonging to the same
cluster: the miRNA 17-92a. This cluster plays an important role in
carcinogenesis and embryogenesis by regulating the proliferation
process through E2F1 gene under-expression [21]. The other
three correlations (miR-145, miR-21 and miR-182) were found
associated with IGF1R [22], EGFR [23] and AKT [24] signaling
pathway. The last relationship has miR-1246 as principal node.
Recently, Zhang et al. [25] have shown that miR-1246 is a new
target of p53 family members. TP53 induces the expression of
miR-1246 which, in turn, reduces the level of DYRK1A, a Down
syndrome-associated protein kinase. Overexpression of miR-1246
reduces DYRK1A levels and decreases the induction of apoptosis
[25].
Focusing on the principal nodes detected in PC network, miR-
103 was associated with alteration of TGF-b signaling pathway,
and miR-23a with KRAS-mediated signaling pathway, while for
miR-15b a number of biological relevant associations with cellular
signaling pathways were observed [26]. On the other hand, the
commonly correlated node miR-199a-3p, which form a complete
graph with the three main vertices of the network, was associated
with MAPK signaling pathway. It is to note that both TFG-b and
KRAS pathways belong to the ‘‘core signaling pathways’’ and
processes reported to be altered in many PC [26]. In addition,
considering that a lower Average Weighted Clustering Coefficient
measure indicates a more important node in relationship to the
network robustness, the low value obtained for miR-103 underlines
the central role for TGF-b signaling in PC, in agreement with
previous observations [27]. Moreover, when we performed in-silico
analysis of these four miRNAs inter-crossed to form a clique by
using DIANA-mirPath, (http://diana.cslab.ece.ntua.gr/pathways/
index_multiple.php), a previously undescribed link with Focal
Adhesion pathway was put in evidence.
The approaches used in this study allowed us to connect
deregulation of miRNA expression to oncogenic pathways and
identify links undescribed up until now between altered specific
miRNA expression and pathways involved in organ-specific
cancer: even though the oncogenic pathways identified in both
cancers were similar, the miRNAs linked to them were specific for
CRC or PC highlighting the organ-specificity of miRNA networks.
In conclusion, our observations highlight network connections
between miRNAs in CRC and PC, and suggest that the regulatory
miRNAs, as network nodes, might have combinatorial effects on
driving specific cellular regulatory pathways involved in cancer
development and progression. Data obtained in our study
encourage to further investigate details of miRNA involvement
in signaling pathways deregulated in CRC and PC, and to
understand whether correlations between specific miRNAs might
be in turn accompanied by connections between the respective
influenced signaling pathways.
Supporting Information
Table S1 Clinical and pathological features of colorec-tal cancer and pancreatic cancer patients.
(DOC)
Table S2 miRNAs differentially expressed in pancreaticcancer (PC) by t-test analysis.
(XLS)
Table S3 Altered human miRNAs in solid tumors inother organisms.
(XLS)
Table S4 Centrality Measures For CRC-specific andPC-specific Network.
(XLS)
Table S5 Signaling Pathways of miRNA target incolorectal and pancreatic cancer.
(DOC)
Author Contributions
Conceived and designed the experiments: A. Piepoli. Performed the
experiments: A. Panza OP M. Carella VP AG FT. Analyzed the data:
M. Copetti TM FP. Contributed reagents/materials/analysis tools: GB
FFdM PdS NM. Wrote the paper: A. Piepoli GM AA.
References
1. Kim VN, Nam JW (2006) Genomics of microRNA. Trends Genet 22: 165–173.
2. Perera RJ, Ray A (2007) MicroRNAs in the search for understanding human
diseases. Bio Drugs 21: 97–104.
3. Calin GA, Sevignani C, Dumitru CD, Hyslop T, Noch E, et al. (2004) Human
microRNA genes are frequently located at fragile sites and genomic regions
involved in cancers. Proc Natl Acad Sci U S A 101: 2999–3004.
4. Caldas C, Brenton JD (2005) Sizing up miRNAs as cancer genes. Nat Med 11:
712–714.
5. Lu J, Getz G, Miska EA, Alvarez-Saavedra E, Lamb J, et al. (2005) MicroRNA
expression profiles classify human cancers. Nature 435: 834–838.
6. Liu A, Tetzlaff MT, Vanbelle P, Elder D, Feldman M, et al. (2009) MicroRNA
expression profiling outperforms mRNA expression profiling in formalin-fixed
paraffin-embedded tissues. Int J Clin Exp Pathol 2: 519–527.
7. Esquela-Kerscher A, Slack FJ (2004) The age of high-throughput microRNA
profiling. Nat Methods 1: 106–107.
8. Volinia S, Galasso M, Costinean S, Tagliavini L, Gamberoni G, et al. (2010)
Reprogramming of miRNA networks in cancer and leukemia. Genome Res 20: 589–599.
9. Irizarry RA, Hobbs B, Collin F, Beazer-Barclay YD, Antonellis KJ, et al. (2003)
Exploration, Normalization, and Summaries of High Density Oligonucleotide
Array Probe Level Data. Biostatistics 4: 249–264.
10. Breiman L (2001) Random Forests. Mach Learn 45: 5–32.
11. Strobl C, Boulesteix AL, Zeileis A, Hothorn T (2007) Bias in random forest
variable importance measures: illustrations, sources and a solution. BMC
Bioinformatics 8: 25.
12. Strobl C, Boulesteix AL, Kneib T, Augustin T, Zeileis A (2008) Conditional
variable importance for random forests. BMC Bioinformatics 9: 307.
13. Livak KJ, Schmittgen TD (2001) Analysis of relative gene expression data using
real-time quantitative PCR and the 2(-Delta Delta C(T)) Method. Methods 25:
402–408.
14. Sabidussi G (1966) The centrality index of a graph. Psychometrika 31: 581.
Colon and Pancreatic Cancers: A Network View
PLoS ONE | www.plosone.org 10 March 2012 | Volume 7 | Issue 3 | e33663

15. Newman M (2007) The mathematics of networks. The New Palgrave
Encyclopedia of Economics,. pp 1–12.16. Zhang B, Horvath S (2005) A general framework for weighted gene co-
expression network analysis. Statistical Applications in Genetics and Molecular
Biology 4.17. Schank T, Wagner D (2005) Approximating clustering coefficient and
transitivity. J Graph Algorithms and Applications 9: 265–275.18. Smith M, Milic-Frayling N, Shneiderman B, Mendes Rodrigues E,
Leskovec J, et al. (2010) NodeXL: a free and open network overview,
discovery and exploration add-in for Excel 2007/2010, http://nodexl.codeplex.com/ from the Social Media Research Foundation, http://www.
smrfoundation.org. Available: http://nodexl.codeplex.com/documentation.Accessed 2012 Feb 20.
19. Bandyopadhyay S, Mitra R, Maulik U, Zhang MQ (2010) Development of thehuman cancer microRNA network. Silence 1: 6.
20. Szafranska AE, Doleshal M, Edmunds HS, Gordon S, Luttges J, et al. (2008)
Analysis of microRNAs in pancreatic fine-needle aspirates can classify benignand malignant tissues. Clin Chem 54: 1716–1724.
21. Negrini M, Nicoloso MS, Calin GA (2009) MicroRNAs and cancer—new
paradigms in molecular oncology. Curr Opin Cell Biol 21: 470–479.22. La Rocca G, Badin M, Shi B, Xu SQ, Deangelis T, et al. (2009) Mechanism of
growth inhibition by microRNA 145: the role of the IGF-I receptor signaling
pathway. J Cell Physiol 220: 485–491.23. Seike M, Goto A, Okano T, Bowman ED, Schetter AJ, et al. (2009) miR-21 is an
EGFR-regulated anti-apoptotic factor in lung cancer in never-smokers. ProcNatl Acad Sci U S A 106: 12085–12090.
24. Segura MF, Hanniford D, Menendez S, Reavie L, Zou X, et al. (2009) Aberrant miR-
182 expression promotes melanoma metastasis by repressing FOXO3 and microph-thalmia-associated transcription factor. Proc Natl Acad Sci U S A 106: 1814–1819.
25. Zhang Y, Liao JM, Zeng SX, Lu H (2011) p53 downregulates Down syndrome-associated DYRK1A through miR-1246. EMBO Rep 12: 811–817.
26. Jnes S, Zhang X, Parsons DW, Lin JC, Leary RJ, et al. (2008) Core signalingpathways in human pancreatic cancers revealed by global genomic analyses.
Science 321: 1801–1806.
27. Hruban RH, Adsay NV (2009) Molecular classification of neoplasms of thepancreas. Hum Pathol 40: 612–623.
Colon and Pancreatic Cancers: A Network View
PLoS ONE | www.plosone.org 11 March 2012 | Volume 7 | Issue 3 | e33663