
miRNA-Mediated Relationships between Cis-SNP Genotypes and Transcript Intensities in Lymphocyte Cell...
13
miRNA-Mediated Relationships between Cis-SNP Genotypes and Transcript Intensities in Lymphocyte Cell Lines Wensheng Zhang 1 , Andrea Edwards 1 , Dongxiao Zhu 2 , Erik K. Flemington 3 , Prescott Deininger 4 , Kun Zhang 1 * 1 Department of Computer Science, Xavier University of Louisiana, New Orleans, Louisiana, United States of America, 2 Department of Computer Science, Wayne State University, Detroit, Michigan, United States of America, 3 Department of Pathology, Tulane University Health Sciences Center and Tulane Cancer Center, New Orleans, Louisiana, United States of America, 4 Tulane Cancer Center, Tulane School of Public Health and Tropical Medicine, New Orleans, Louisiana, United States of America Abstract In metazoans, miRNAs regulate gene expression primarily through binding to target sites in the 39 UTRs (untranslated regions) of messenger RNAs (mRNAs). Cis-acting variants within, or close to, a gene are crucial in explaining the variability of gene expression measures. Single nucleotide polymorphisms (SNPs) in the 39 UTRs of genes can affect the base-pairing between miRNAs and mRNAs, and hence disrupt existing target sites (in the reference sequence) or create novel target sites, suggesting a possible mechanism for cis regulation of gene expression. Moreover, because the alleles of different SNPs within a DNA sequence of limited length tend to be in strong linkage disequilibrium (LD), we hypothesize the variants of miRNA target sites caused by SNPs potentially function as bridges linking the documented cis-SNP markers to the expression of the associated genes. A large-scale analysis was herein performed to test this hypothesis. By systematically integrating multiple latest information sources, we found 21 significant gene-level SNP-involved miRNA-mediated post- transcriptional regulation modules (SNP-MPRMs) in the form of SNP-miRNA-mRNA triplets in lymphocyte cell lines for the CEU and YRI populations. Among the cognate genes, six including ALG8, DGKE, GNA12, KLF11, LRPAP1, and MMAB are related to multiple genetic diseases such as depressive disorder and Type-II diabetes. Furthermore, we found that ,35% of the documented transcript intensity-related cis-SNPs (,950) in a recent publication are identical to, or in significant linkage disequilibrium (LD) (p,0.01) with, one or multiple SNPs located in miRNA target sites. Based on these associations (or identities), 69 significant exon-level SNP-MPRMs and 12 disease genes were further determined for two populations. These results provide concrete in silico evidence for the proposed hypothesis. The discovered modules warrant additional follow- up in independent laboratory studies. Citation: Zhang W, Edwards A, Zhu D, Flemington EK, Deininger P, et al. (2012) miRNA-Mediated Relationships between Cis-SNP Genotypes and Transcript Intensities in Lymphocyte Cell Lines. PLoS ONE 7(2): e31429. doi:10.1371/journal.pone.0031429 Editor: Lluis Quintana-Murci, Institut Pasteur, France Received September 1, 2011; Accepted January 7, 2012; Published February 14, 2012 Copyright: ß 2012 Zhang et al. This is an open-access article distributed under the terms of the Creative Commons Attribution License, which permits unrestricted use, distribution, and reproduction in any medium, provided the original author and source are credited. Funding: This work was supported by NIH grants (NCRR P20RR016456, RCMI 5G12RR026260-03, R21LM010137S1 to DZ), a Louisiana BOR award to ZK (LEQSF(2008-11)-RD-A-32) and an NSF grant EPS-1006891). The funders had no role in study design, data collection and analysis, decision to publish, or preparation of the manuscript. Competing Interests: The authors have declared that no competing interests exist. * E-mail: [email protected] Introduction MicroRNAs (miRNAs) are short (,22 nt), non-coding RNAs derived from genome-encoded stem loop precursors. As the post- transcriptional regulators of gene expression in metazoans, miRNAs primarily bind to the 39 UTR sequences of messenger RNAs (mRNAs), usually resulting in translational repression or mRNA degradation [1,2]. A highly confident canonical target site on a mRNA for miRNA binding typically holds a perfect Watson- Crick complementarity to the critical ‘‘seed region’’ (nucleotides 2–7 at the 59-end) of miRNA(s), and may include an extension of one base at position 1 or 8 where either an adenine is paired to nucleotide 1 (7mer-A1 site) or a matching base is present for nucleotide 8 (7 mer-m8 site) of the miRNA seed. An 8-mer site can also be formed if the target site flanked by both the adenine at position 1 and the match at position 8 [3]. It is estimated that ,30% of human protein-coding genes are regulated by miRNAs, where each miRNA can target approximately 200 transcripts and more than one miRNA can converge onto a single mRNA target [2,4]. Numerous studies have shown that miRNAs can play fundamentally crucial roles in various biological functions, including animal and plant development as well as progression of human diseases [1,2,5,6]. Single-nucleotide polymorphisms (SNPs) are the most abundant form (,90%) of variation in the human genome. Basically, they occur when a single nucleotide in the genome (or other shared sequence) differs between members of a species or paired chromosomes in an individual. The recently released ‘‘NCBI dbSNP Build 135’’ database contains about 54 million SNPs from the human genome [7]. As the molecular markers of complex traits, SNPs have been widely investigated in humans, animals and plants [8,9,10,11,12,13,14,15,16]. Recent studies showed that cis- acting SNPs (cis-SNP markers), within or close to a gene itself, are predominant compared to copy number variations (CNV) in PLoS ONE | www.plosone.org 1 February 2012 | Volume 7 | Issue 2 | e31429
-
Upload
independent -
Category
Documents
-
view
1 -
download
0
Transcript of miRNA-Mediated Relationships between Cis-SNP Genotypes and Transcript Intensities in Lymphocyte Cell...

miRNA-Mediated Relationships between Cis-SNPGenotypes and Transcript Intensities in Lymphocyte CellLinesWensheng Zhang1, Andrea Edwards1, Dongxiao Zhu2, Erik K. Flemington3, Prescott Deininger4, Kun
Zhang1*
1 Department of Computer Science, Xavier University of Louisiana, New Orleans, Louisiana, United States of America, 2 Department of Computer Science, Wayne State
University, Detroit, Michigan, United States of America, 3 Department of Pathology, Tulane University Health Sciences Center and Tulane Cancer Center, New Orleans,
Louisiana, United States of America, 4 Tulane Cancer Center, Tulane School of Public Health and Tropical Medicine, New Orleans, Louisiana, United States of America
Abstract
In metazoans, miRNAs regulate gene expression primarily through binding to target sites in the 39 UTRs (untranslatedregions) of messenger RNAs (mRNAs). Cis-acting variants within, or close to, a gene are crucial in explaining the variability ofgene expression measures. Single nucleotide polymorphisms (SNPs) in the 39 UTRs of genes can affect the base-pairingbetween miRNAs and mRNAs, and hence disrupt existing target sites (in the reference sequence) or create novel target sites,suggesting a possible mechanism for cis regulation of gene expression. Moreover, because the alleles of different SNPswithin a DNA sequence of limited length tend to be in strong linkage disequilibrium (LD), we hypothesize the variants ofmiRNA target sites caused by SNPs potentially function as bridges linking the documented cis-SNP markers to theexpression of the associated genes. A large-scale analysis was herein performed to test this hypothesis. By systematicallyintegrating multiple latest information sources, we found 21 significant gene-level SNP-involved miRNA-mediated post-transcriptional regulation modules (SNP-MPRMs) in the form of SNP-miRNA-mRNA triplets in lymphocyte cell lines for theCEU and YRI populations. Among the cognate genes, six including ALG8, DGKE, GNA12, KLF11, LRPAP1, and MMAB arerelated to multiple genetic diseases such as depressive disorder and Type-II diabetes. Furthermore, we found that ,35% ofthe documented transcript intensity-related cis-SNPs (,950) in a recent publication are identical to, or in significant linkagedisequilibrium (LD) (p,0.01) with, one or multiple SNPs located in miRNA target sites. Based on these associations (oridentities), 69 significant exon-level SNP-MPRMs and 12 disease genes were further determined for two populations. Theseresults provide concrete in silico evidence for the proposed hypothesis. The discovered modules warrant additional follow-up in independent laboratory studies.
Citation: Zhang W, Edwards A, Zhu D, Flemington EK, Deininger P, et al. (2012) miRNA-Mediated Relationships between Cis-SNP Genotypes and TranscriptIntensities in Lymphocyte Cell Lines. PLoS ONE 7(2): e31429. doi:10.1371/journal.pone.0031429
Editor: Lluis Quintana-Murci, Institut Pasteur, France
Received September 1, 2011; Accepted January 7, 2012; Published February 14, 2012
Copyright: � 2012 Zhang et al. This is an open-access article distributed under the terms of the Creative Commons Attribution License, which permitsunrestricted use, distribution, and reproduction in any medium, provided the original author and source are credited.
Funding: This work was supported by NIH grants (NCRR P20RR016456, RCMI 5G12RR026260-03, R21LM010137S1 to DZ), a Louisiana BOR award to ZK(LEQSF(2008-11)-RD-A-32) and an NSF grant EPS-1006891). The funders had no role in study design, data collection and analysis, decision to publish, orpreparation of the manuscript.
Competing Interests: The authors have declared that no competing interests exist.
* E-mail: [email protected]
Introduction
MicroRNAs (miRNAs) are short (,22 nt), non-coding RNAs
derived from genome-encoded stem loop precursors. As the post-
transcriptional regulators of gene expression in metazoans,
miRNAs primarily bind to the 39 UTR sequences of messenger
RNAs (mRNAs), usually resulting in translational repression or
mRNA degradation [1,2]. A highly confident canonical target site
on a mRNA for miRNA binding typically holds a perfect Watson-
Crick complementarity to the critical ‘‘seed region’’ (nucleotides
2–7 at the 59-end) of miRNA(s), and may include an extension of
one base at position 1 or 8 where either an adenine is paired to
nucleotide 1 (7mer-A1 site) or a matching base is present for
nucleotide 8 (7 mer-m8 site) of the miRNA seed. An 8-mer site can
also be formed if the target site flanked by both the adenine at
position 1 and the match at position 8 [3]. It is estimated that
,30% of human protein-coding genes are regulated by miRNAs,
where each miRNA can target approximately 200 transcripts and
more than one miRNA can converge onto a single mRNA target
[2,4]. Numerous studies have shown that miRNAs can play
fundamentally crucial roles in various biological functions,
including animal and plant development as well as progression
of human diseases [1,2,5,6].
Single-nucleotide polymorphisms (SNPs) are the most abundant
form (,90%) of variation in the human genome. Basically, they
occur when a single nucleotide in the genome (or other shared
sequence) differs between members of a species or paired
chromosomes in an individual. The recently released ‘‘NCBI
dbSNP Build 135’’ database contains about 54 million SNPs from
the human genome [7]. As the molecular markers of complex
traits, SNPs have been widely investigated in humans, animals and
plants [8,9,10,11,12,13,14,15,16]. Recent studies showed that cis-
acting SNPs (cis-SNP markers), within or close to a gene itself, are
predominant compared to copy number variations (CNV) in
PLoS ONE | www.plosone.org 1 February 2012 | Volume 7 | Issue 2 | e31429

explaining the genetic variations of gene expression measures; and
many of them are related to human diseases [17,18,19]. These
associations are important in the prediction of individual
predisposition to diseases in humans and the genetic evaluation
of economic traits in crops and domestic animal species.
Nevertheless, while the SNPs in protein-coding regions may
directly determine the genetic variance of phenotype measures,
most SNP markers identified in other regions are likely coincident
with the actually recognized or unknown causal functional variants
[20,21,22]. This implies that the mechanisms behind the genetic
variations of many complex traits are still not clear, and remain an
elusive challenge in genetics and related fields.
Compared to ORFs, the 39 UTRs of human genes have higher
SNP density [23]. According to the dbSNP database (Build 135)
[7], over 334000 39-UTR SNPs have been validated by at least
one method or are included in the submission of the 1000 Genome
Project [24]. This suggests a promising way to open these black
boxes. This perception can be scrutinized from two aspects. First,
it is well known that miRNAs regulate gene expression by binding
to cis-regulatory regions of 39-UTRs of genes. A nucleotide
variation in 39UTR sequences can alter the complementarity
between a miRNA and the matched region in its target mRNA(s),
thereby influencing the accessibility for miRNA binding. In this
regard, those 39UTR-SNPs may function as the causal elements
for the variance of the expression of the target genes [25]. Second,
because the alleles of different SNPs within a DNA sequence of
limited length tend to be in strong linkage disequilibrium (LD)
[26], the variants of miRNA target sites potentially serve as bridges
linking the cis-SNP markers documented in the literature to the
expression of the associated genes.
To date, several attempts have been made to explore the
biological implications of miRNA target site polymorphism caused
by SNPs [27]. Most efforts, using either in vitro or small-scale in
silico methods, primarily focused on studying the targeted
association between a specific genetic variant in miRNA target
site(s) and a particular human disease. However, understanding
the general regulatory mechanism of miRNAs in the overall gene
regulation, especially when SNPs residing on miRNA-binding sites
adds another layer of complexity, is also essential to the discovery
of SNPs and miRNAs’ interlacing functions in complex trait
formations and gene regulation system.
In order to understand the regulatory mechanisms between
SNPs, miRNAs and their target genes, we need to identify the
functional modules and important patterns hidden in this
complicated interactions. Two earlier studies, though not directly
related to our work, are worth mentioning here. Bao et al.
established a database of polymorphism (SNPs) in putative
microRNA Target Site (PolymiRTS) and proposed a simple
conceptual model to tie PolymiRTS to complex traits via cis-acting
eQTL (the genetic loci regulating gene expression traits) [28]. The
main limitation of their work is that miRNA gene expression
profiles were not taken into account due to the lack of large-scale
miRNA expression data at that time. Another study, conducted by
Saunders et al., incorporated miRNA and mRNA expression data
to identify novel biologically (especially evolutionarily) relevant
miRNA target sites [29]. This work, however, relies on the co-
expression of miRNA(s) and gene(s) in at least one of the five
distinct tissues. Therefore, their findings cannot truly reflect the
fundamental miRNA and mRNA interaction which can only be
revealed through miRNA and mRNA expression quantities
obtained from a specific biological process in the same or
comparable cells or tissues.
In this paper, following our preceding scrutinization, we
provided the first piece of in silico evidence for the potential novel
regulatory role of miRNA-target-site SNPs in associating the
documented cis-SNP markers with the expression of miRNA
target gene(s). By integrating multiple latest information sources,
including SNP genotype data, human miRNA family information,
gene expression and miRNA expression profiles on similar cell
lines, we first identified 21 significant gene-level SNP-involved,
miRNA-mediated post-transcriptional regulation modules (SNP-
MPRMs) in the CEU (US residents of Northern and Western
European descent) and YRI (Ibadan, Nigeria) populations. A
linear model was proposed to estimate the statistically significant
miRNA target site effect (TSE) on the target gene(s). Moreover, by
calculating the pair-wise LDs, we related the SNPs located in the
miRNA target sites to the documented cis-acting SNPs for the
same LCL (lymphocyte cell line) samples [13], resulting in 69
significant exon-level SNP-MPRMs. Evaluating the discovered
modules by using the literature and functional annotation tool
DAVID suggests that some genes in the modules are involved in
several types of human diseases. These modules are worthy of
further laboratory testing due to their biomedical implications.
Figure 1 summarizes the scheme of our study flow, and the
details of each step are described in the Results and Method
sections.
Results
IN-SNPs involved miRNA target site prediction and siteverification
The total number of documented single nucleotide polymor-
phisms in the human genome now totals 54 million. In this study,
we focused on the ,4-million SNPs present in the CEU or YRI
population genotyped in the international HapMap project. This
restricted SNP set was further refined according to the minor allele
frequencies (MAF), and only those SNPs with MAFs over 0.1,
called informative SNPs (IN-SNPs) hereafter, were kept for further
analysis. Such selection is based on our preliminary evaluation of
the available resources for detecting biologically significant SNPs
located in miRNA target sites. More specifically, the data
preprocessing was determined by two factors. First, the microarray
datasets [8] analyzed in this study are limited in sample size.
Second, in such cases, if the MAF of a SNP is below 0.1, the
statistical power and reliability will be low in the subsequent
genetic association analysis [13].
Using the procedure presented in the Material and Methods
section, we identified the miRNA target sites affected by all IN-
SNPs. These SNP-involved target sites were further categorized
according to the three canonical site types (i.e. 7mer-A1, 7mer-m8
or 8mer) and the two site mutations - disrupted or created sites as
defined in the Methods section. As shown in Figure 2A, among
the ,15400 IN-SNPs-involved miRNA target sites, more than half
of them occur in both CEU and YRI sample sets. These target
sites are located in the 39UTR regions of the transcripts of 7400
genes, two thirds of which are shared by the two populations
(Figure 2B). Functional enrichment analysis using the DAVID
tool [30,31] showed that four genetic disease classes, i.e. colorectal
cancer (n = 106, FDR = 3.0%), blood pressure & arterial (n = 35,
FDR = 6.3%), schizophrenia (n = 143, FDR = 9.6%), and athero-
sclerosis & coronary (n = 80, FDR = 22%), are over represented by
these genes.
A closer examination of the site distribution with respect to
population and site mutation type (Figure 2C) shows that 7mer-
m8 target sites are a little more prevalent than 7mer-A1 sites. The
8mer target sites only account for 13–15% of the entire identified
sites, much lower than the ratio (,25%) calculated for the
conserved target sites as reported by TargetScan [32]. According
SNP-Involved, miRNA-Mediated Relationships
PLoS ONE | www.plosone.org 2 February 2012 | Volume 7 | Issue 2 | e31429

to [3], for the same miRNA-mRNA pair, 8mer sites tend to have
higher mean efficiency in post-transcriptional regulation than
7mer target sites. Although the proportion of more biologically
relevant 8mer sites in the non-conserved IN-SNP-involved target
sites is much lower than that from the conserved target sites, these
non-conserved SNP-present sites, once confirmed by biological
experiments, will be more significant and informative than the
validated conserved sites since they can potentially explain the
genetic variance of some complex traits and even disease
predispositions between and within populations.
It has been recognized that the mechanism for a miRNA
recognizing its target transcript(s) is far more complicated than
the simple seed match rule, implying that some target sites
preliminarily identified in this way can be spurious [2].
Therefore, nearly all of the published miRNA target prediction
tools employed additional biological information beyond the
miRNA and mRNA sequences to generate confidence scores and
rank the candidate target sites accordingly [4,6,33,34,35,36,37].
Grimson et al. [3] proposed three biological-experiment-based
context scores that have been integrated into TargetScan. Those
scores are 39 paring contribution, local AU contribution and
position contribution. According to their definitions, a small
negative value indicates high confidence. Using the released Perl
program, we first calculated the three scores for ,6000 predicted
miRNA target sites created by substituting reference alleles with
‘‘other alleles’’ in CEU population, and then compared the scores
with those calculated from the conserved target sites. Figure 3presents the density distributions of the two score sets. Statistical
analysis using Wilcoxon rank-sum test demonstrated that the
difference between these two site categories was not significant
(p.0.05) in 39 pairing contribution, but were extremely
significant (p,2.2e-16) in local AU and position contributions.
The SNP-involved target sites had higher means for the latter two
contributions. This result is expected due to the following two
reasons. First, we used the stringent seed match rule as the only
criterion to identify the pool of potential miRNA target sites for
the studied miRNA families. Second, different from those
conserved target sites, the sites under investigation are no longer
conserved because of the involvement of SNPs. Nevertheless, the
substantial existence of IN-SNP-involved target sites with very
low context scores also demonstrated that some predicted sites
were of high confidence.
Candidate IN-SNP-involved miRNA post-transcriptionalregulation modules in LCLs
To gain more biological insight from the discovered SNP-
miRNA target sites, we further characterized the potential SNP-
involved miRNA-mediated post-transcriptional regulation mod-
ules (SNP-MPRMs). Such a module can reflect the modification of
the transcript intensity of a target gene due to the SNP presence in
the miRNA binding site, and could be formulated as a SNP-
miRNA-mRNA triplet. Moreover, the module of this type can
presumably reveal the SNP-involved, miRNA-mediated causative
relationship between the documented cis-SNP markers and the
differential expression of the target genes.
This work was achieved through the integration of genomic and
transcriptomic information by defining and calculating the target
site effects (TSEs) of expressed miRNA genes on the transcript
intensities of their target genes. Specifically, TSE was estimated
with a linear model as defined in the Material and Methods
section. We obtained the gene expression data of 176 lymphocyte
cell lines (LCL) for CEU and YRI populations from GEO
(GSE7792) [8], and preprocessed them through the method
described in [13]. The genotype data was downloaded from the
database of International HapMap Projects (Phase II+Phase III)
[38]. The evidence for the existence of miRNAs in lymphocyte cell
were extracted from another GEO dataset (GSE14794) in which
EBV transformed lymphoblastoid cell lines were measured from
the peripheral blood lymphocytes of Caucasian men [39]. Details
on the definition and calculation of TSE, the employed gene
expression data, and the identification of expressed miRNAs are
described in the Material and Methods section.
Each SNP-involved miRNA target site corresponds to a unique
SNP, one or multiple mRNA(s) and one miRNA family. Using the
above genotype and transcript intensity information, we scanned all
of the predicted SNP-involved miRNA target sites (,15000) and
calculated their corresponding TSEs. 17 and 9 candidate SNP-
MPRMs were identified in CEU and YRI populations, respectively
(Tables 1, 2). The module determination was principally based on
the widely-accepted miRNA post-transcriptional regulation theory
[2]. First, for each module, the miRNA gene(s) should be expressed
in lymphoblastoid cell lines and the target gene should be expressed
in LCL samples. Second, the estimated TSE is negative with the
adjusted p-value ,0.05. Finally, the TSE should well reflect an
additive pattern for the post-transcriptional regulation of a target
gene by the cognate miRNA, which was illustrated in Figure 4 on
genes LRPAP1 and THEM4 but also largely hold on the other 18
genes (Tables 1, 2).
Among the discovered modules, five SNP-MPRMs were present
in both populations with some differences in the TSE estimates.
The target genes cognate to these modules include GNA12,
LRPAP1, NSM4, TOMM22 and THEM4. Based on DAVID
database [30,31], of the total 20 genes in the two significant lists,
six genes are related to human genetic diseases or biologically
important quantitative traits. They are ALG8 related to congenital
disorder of glycosylation, DGKE related to diversity of adult
human height, GNA12 related to major depressive disorder,
KLF11 related to type-II diabetes, MMAB related to dyslipidemia
and coronary artery disease, and LRPAP1 related to Alzheimer’s
Disease and many other diseases. Besides the study of disease gene
involvement in the discovered modules, we also studied the
presence of disease-related miRNAs. According to [40,41], 29
disease-related miRNAs were contained in the found modules, and
15 of them are associated with cancers (see Table S1).
It is worthy of note that some ambiguity exists in the discovered
SNP-MPRMs. For instance, the module of gene DGKE, which
plays an important role in signal transduction [42], is related to
four human miRNAs within the same family, i.e. hsa-Mir- 15a, -
15b, -16, -195, -424, and -497; Two SNP-MPRMs, one involving
hsa-mir-643 and the other related to hsa-mir-148a, -148b and -
152, were identified for gene CTTNBP2NL with almost
equivalent TSEs but different SNPs. This ambiguity may generally
be ascribed to two reasons. First, the same miRNA family shares a
common seed sequence and our target prediction algorithm is
primarily based on the seed match criterion. Second, more than
one SNP-involved miRNA target sites could exist in the 39UTR
region of the same gene. At the expense of the potential false
determination, such multifaceted modules could be further refined
according to the 39 pairing score or other related criteria, which
are sometimes differentiated across individual miRNAs even in the
same family.
Variants of IN-SNP-involved target sites as bridges linkingdocumented cis-SNP markers to transcript intensity
The associations between SNPs and the expression of the genes
which those SNPs are located in or close to have been frequently
reported over the past years [9,13,17]. However, the identified cis-
acting SNPs, especially those obtained from the genome-wide
SNP-Involved, miRNA-Mediated Relationships
PLoS ONE | www.plosone.org 3 February 2012 | Volume 7 | Issue 2 | e31429

scan, are not always the real causal regulators [20,21]. In other
words, the reported associations may be due to the coincidence of
the molecular markers with other known or unknown genomic
variants. In a study on the effects of single nucleotide substitutions
on the alternative splicing of mRNA transcripts, Fraser and Xie
[13] showed that over half of statistically significant SNPs are
located within 30 kilo-bases from the affected transcript probe-sets
(exons). Furthermore, they found that, among the top 20 exons
(ranked by p-values), 14 are located in the 39 UTR regions of the
cognate genes. As they pointed out, these results suggested the
participation of miRNA-binding related genomic variants in
determining exon-level transcript intensity or mRNA splicing.
However, the underlying mechanism still remains to be clarified. A
further logical hypothesis would be that, for an association with
such characteristics, the SNP marker may be either located in the
binding site(s) of an expressed miRNA in the 39 UTR of the target
gene, or in strong linkage disequilibrium (LD) with one or multiple
miRNA-target-site SNPs.
Using the proposed technique presented in the Material and
Methods section, we recoded the genotypes of the miRNA-target-
site SNPs of the addressed HapMap LCLs. The identity (or
association) between the documented cis-SNP markers [13] and
the miRNA-target-site SNPs identified in our study was illustrated
in Figure 5. The LDs were first calculated as the squares of the
Pearson correlation coefficients between SNPs, and then tested
with the Chi square analysis. Among the 951 cis-acting SNPs, 41
(4.3%) were located in miRNA target sites of the cognate genes,
and 287 (30.2%) were in significant linkage disequilibrium
(p,0.01) with one or multiple target-site SNPs. Similar to the
previous section, we first computed the target site effects of the
expressed miRNAs on the transcript measures. Then, we selected
the SNP-miRNA-exon triplets according to the signs and
significance levels of the TSEs. With a ,40% overlap, 57 and
56 significant (adj.p,0.05) exon-level SNP-MPRMs with negative
TSEs were obtained for the CEU and YRI populations,
respectively. In sum, 69 exons (of 67 genes) were involved in the
two sets of SNP-MPRMs, where the reference alleles of each SNP
pair are linked in coupling phase except for SNPs rs226201 and
rs3738 (on gene RPS23) linked in repulsion phase. Ranked by the
statistical significance, the top 20 modules for each population
were summarized in Tables 3 and 4, and the entire module sets
were presented in Tables S2 and S3. These modules not only
provide solid in silico evidence for the hypothesis tested in this
study, but also suggest that the miRNA-mediated post-transcrip-
tional regulation mechanism may permit the partial degradation,
starting from the target site, of a target mRNA sequence. In other
words, miRNAs may only lead to the degradation of the individual
exon (of a gene) close to their target site.
Using the DAVID tool [31], we identified 12 genes that are
individually associated with one or multiple genetic disease(s) from
these exon-level SNP-MPRMs. They are KYNU related to
hypertension, HLA-DPA1 related to berylliosis and another 18
diseases, HLA-DQA2 related to rheumatoid arthritis, P2RY11
related to myocardial infarct, SYNGR1 related to schizophrenia
and bipolar disorder, FIG. 4 related to amyotrophic lateral
sclerosis 11 and Charcot-Marie-Tooth disease (type 4J), RTF1
related to congenital disorder of glycosylation (type In), CCT2
related to diversity of adult human height, CCT5 related to
neuropathy and hereditary sensory; C5orf15 and PITRM1 related
to conduct disorder and ADHD, and TMEM43 related to
arrhythmogenic right ventricular dysplasia-5 (AVRD). Similarly,
as summarized in Table S1, we identified 58 disease-related
miRNAs were contained in the discovered exon-level modules,
and 22 of them were associated with cancers.
Figure 1. The schematic presentation of the study flow.doi:10.1371/journal.pone.0031429.g001
SNP-Involved, miRNA-Mediated Relationships
PLoS ONE | www.plosone.org 4 February 2012 | Volume 7 | Issue 2 | e31429

Discussion
In humans, miRNA target sites are mainly located in 39 UTRs
of the transcripts. Single nucleotide polymorphisms in 39UTRs
can alter the sequence complementarity between the miRNA(s)
and mRNA(s), and hence eliminate existing target sites or generate
novel target sites, suggesting an important mechanism for cis-
regulation of gene expression. By integrating multiple recently
published genomic and transcriptomic datasets for the samples of
the HapMap projects, we evaluated the target site effects (TSEs) of
expressed miRNAs on the transcript intensities of protein-coding
genes in human lymphocyte cells. As a result, 21 gene-level and 69
exon-level SNP-MPRM modules were established for the CEU
and YRI populations. To our knowledge, the collection of these
modules forms the first bioinformatics knowledge basis for the
further elucidation of the role of miRNA-target-site polymor-
phisms in target gene regulation. More specifically, the biological
importance carried by these findings can be illustrated from the
following aspects. (1) Most of the modules (.60%) contain created
(CR) target sites which can’t be identified if the polymorphisms are
not taken into account; (2) More than a dozen of disease-related
genes are involved in the discovered modules; (3) A substantial
proportion (,25%) of these modules are shared by the two
populations, implicating a rather high level of confidence. For the
time being, we don’t find strong experimental evidence in the
literature for these modules. This is no wonder because the study
of miRNA polymorphisms is still in its infancy, and the published
biologically confirmed SNP-involved miRNA-medicated relation-
ships have yet been very scarce [43]. Therefore, the gene-level and
exon-level modules discovered in this study can be treated as
potential directional hypotheses that warrant further independent
laboratory investigation. It is also worth noting that the absolute
values of TSE for the discovered modules are relatively small,
approximately less than one unit (fold change) in general. This
implies that individual miRNA regulates the expression of the
target genes in a tuning way. The observation also suggests that
the modifications of miRNA target sites mainly contribute to the
genetic variability of polygenic quantitative traits rather than
individually result in dramatic physiological disorders.
After reviewing a few frequently cited miRNA-mediated
associations primarily regarding polymorphisms and disorders
[43,44], we noted that this currently-completed work can be
furthered consolidated by integrating more–omic information and
other statistical measurements. First, while the analysis was based
on the data of Human HapMap Project (phase II+III) in which the
two populations each have ,4 million SNPs, the recorded
polymorphisms in human genome have accounted over 54
million. Furthermore, by considering the reliability of the statistical
analysis, we studied only the SNPs with the MAFs over 0.1. As a
result, it is very likely that some truly functional SNPs were left out
due to the above two reasons. For example, SNP rs5186, which
disrupted a target site of mir-155 on the transcript of gene AGTR
[43], was not present in the analyzed LCL samples. The same
situation was also observed in the case of SNP rs34764978, gene
DHFR and mir-148a/-148b/-152 [45]. Second, we only consid-
ered the SNPs inside the canonical target sites recognized by the
Figure 2. The summary of the predicted SNP-involved canonical miRNA target sites. A: Venn diagram comparing the distribution of thepredicted SNP-involved miRNA target sites between CEU and YRI populations. B: Venn diagram comparing the distribution of genes, each of whichcontains at least one SNP-involved miRNA target sites, between CEU and YRI populations. C: The distribution of the predicted SNP-involved miRNAtarget sites with respect to population (CEU and YRI) and site mutation type (DS: disrupted sites and CR: created sites).doi:10.1371/journal.pone.0031429.g002
SNP-Involved, miRNA-Mediated Relationships
PLoS ONE | www.plosone.org 5 February 2012 | Volume 7 | Issue 2 | e31429

stringent seed match criterion without taking into account the
SNPs within the atypical target sites or in other genomic regions.
For example, on the 39 UTR of cancer gene KIT, there is an
atypical binding domain for miRNA-221. This target site sequence
complements the nucleotides 2–5 and 7–8 of the miRNA. He et al.
showed that SNP rs17084733 could disrupt this binding domain
and resulted in a significant change of the transcript level [44].
Finally, as we did in this study, genome-wide association studies
usually require the ordinary p-values to be adjusted in order to
control the family wide error (FWE) or false discovery rate (FDR).
This statistical correction will exclude some discovered modules
with marginal significance from the reported list. For example,
Wang et al. [46] demonstrated a direct association between miR-
433 and SNP rs12720208 located in the 39 UTR of gene FGF20 (a
gene associated with an increased risk for Parkinson’s disease). In
our study, this SNP-miRNA-gene triplet was recognized but it
wasn’t selected into the module set since the corresponding TSE in
CEU population was marginally significant (p = 0.055) as
indicated by the ordinary p-value.
A serious challenge in analyzing the target site effects (TSEs), on
which significant SNP-MPRMs were determined, is how to pre-
process the microarray gene expression data. Because a SNP in a
gene fragment can disrupt the hybridization of those probe(s) in
the array and lead to false estimation of the expression level, we
used the pre-processed data sets in [13] where probes containing
double-documented SNPs were removed before the normalization
and summarization. However, potential information loss due to
such a preprocessing procedure is unavoidable. In fact, we noted
its influence on the final results. For example, by analyzing the
original data published at GEO, we could identify three SNP-
Figure 3. The density distribution comparisons of the context scores for the predicted SNP-involved miRNA target sites (non-conserved) and the conserved target sites reported by TargetScan. A target site with the score(s) deviating from zero to the negativedirection is considered to be highly confident.doi:10.1371/journal.pone.0031429.g003
SNP-Involved, miRNA-Mediated Relationships
PLoS ONE | www.plosone.org 6 February 2012 | Volume 7 | Issue 2 | e31429

MPRMs (adj. p,0.001) consisting of gene HLA-DPA1 (major
histocompatibility complex, class II, DP alpha 1), a set of genotype
consistent SNPs (rs9469332, rs3180554, rs7905) and three
miRNAs (mir-448, -202, -522) in both CEU and YRI populations.
However, when the same analysis was conducted on the
preprocessed dataset, the three modules were no longer statistically
significant (adj.p.0.05). Instead, the linkage disequilibrium
analysis showed that the target sites containing these SNPs
significantly (adj.p,1.0-e10) affected the transcript splicing of the
gene (Tables 3, 4). Therefore, there is a dilemma on using the
pre-processed data and we will continue to investigate this
problem.
Recently, RNA-seq data of HapMap LCL samples for the CEU
and YRI populations have been generated and used to identify cis
eQTLs [47,48]. In particular, the authors in [48] found that many
array-based eQTLs near the 39 end of a gene are not present in
the RNA-seq data. We herein repeated the SNP-MPRM scanning
on these two digital gene expression datasets. As a result, 23 SNP-
MPRMs were identified with an adjusted p-value ,.05 (Table
S4). Among them, 7 (,30%) have counterparts in the array-based
gene- or exon-level modules presented in the Result section. This
indicates that our analysis is moderately robust to the technologies
by which the gene expression levels are measured. However, we
believe that the array datasets [8] analyzed in this paper are more
appropriate for achieving our research objectives, i.e. to identify
SNP-MPRMs and compare the two populations. Firstly, the array
data have relatively larger sample sizes compared to the RNA-seq
datasets (87 versus 60 for CEU, 89 versus 69 for YRI). This is
extremely important in inferring the effects of SNPs with low
minor allele frequencies. Second, the samples in the array data for
the two populations were measured by the same authors on the
identical technical platform following the same experimental
protocols; therefore, the related batch effects could be greatly
attenuated.
It is well known that the documented cis-SNP markers are not
always the true causal factors to the variability of the associated
Table 1. The SNP-involved, miRNA-mediated post-transcriptional regulation modules (SNP-MPRMs) in the CEU population.
Gene Chr Mutation SNP TSE Adj.p miRNA
BTN3A2 chr6 CR rs2073531 20.872 8.15E-15 326, 9
C17orf68 chr17 CR rs3027246 20.145 2.26E-03 542-3p
DGKE* chr17 CR rs1992554 20.230 3.09E-02 545, 15a, 15b, 16, 195, 424, 497
GNA12* chr7 CR rs11354 20.223 1.64E-02 596
KLF11* chr2 CR rs7632 20.329 3.95E-02 512-5p
LRPAP1* chr4 CR rs1049574 20.599 1.81E-13 592
MLF1IP chr4 CR rs3184982 20.356 4.03E-02 18a, 18b
MMAB* chr12 CR rs877710 20.137 4.39E-02 564
NDUFA10 chr2 CR rs8369 20.187 1.22E-02 15a, 15b, 16, 195, 424, 497
NSUN4 chr1 CR rs41534051 20.153 2.77E-02 7
TOMM22 chr22 CR rs1056610 20.316 3.06E-05 451
CTTNBP2NL chr1 DS rs3762332 20.259 2.71E-02 148a, 148b, 152
CTTNBP2NL chr1 DS rs3795821 20.248 4.39E-02 643
EMB chr5 DS rs2883164 20.231 4.63E-02 21
ENTPD1 chr10 DS rs2226163 20.162 7.85E-03 617
RCBTB1 chr13 DS rs1046028 20.215 2.13E-02 643
THEM4 chr1 DS rs13320 20.465 3.13E-08 101
SNP: The SNP located in a predicted miRNA targets site in the 39 UTR region of the corresponding gene; Mutation: DS indicates that the target site predicted from thereference sequence (hg18) is disrupted due to the nucleotide substitution, and CR indicates that a novel target site is created due to the substitution; TSE: miRNAtarget site effect on gene expression level; adj.p: FDR corrected p-value for TSE; miRNA: MiRBase ID of a human miRNA with the corresponding SNP in the predictedtarget site. The common prefix ‘‘hsa-mir(let)-’’ in the IDs is omitted. The rows in bold indicate the regulation modules shared in both CEU and YRI populations. See themethod section for the calculation of TSE. Disease genes are indicated by asterisks (*).doi:10.1371/journal.pone.0031429.t001
Table 2. The SNP-involved, miRNA mediated, post-transcriptional regulation modules (SNP-MPRMs) in the YRIpopulation.
Gene Chr Mutation SNP TSE adj.p. miRNA
CHI3L2 chr1 CR rs1077059 21.407 1.54E-05 591
GNA12* chr7 CR rs11354 20.203 1.18E-02 596
LRPAP1* chr4 CR rs1049574 20.411 7.79E-04 592
NSUN4 chr1 CR rs41534051 20.175 2.90E-02 7
TOMM22 chr22 CR rs1056610 20.286 1.33E-05 451
ZSWIM7 chr17 CR rs11654 20.182 8.92E-03 580
ALG8* chr11 DS rs616892 20.148 4.40E-02 583
THEM4 chr1 DS rs13320 20.437 1.97E-06 101
VRK3 chr19 DS rs16981592 20.185 1.41E-02 365
SNP: The SNP located in a predicted miRNA targets site in the 39 UTR region ofthe corresponding gene; Mutation: DS indicates that the target site predictedfrom the reference sequence (hg18) is disrupted due to the nucleotidesubstitution, and CR indicates that a novel target site is created due to thesubstitution; TSE: miRNA target site effect on gene expression level; adj.p: FDRcorrected p-value for TSE; miRNA: the MiRBase ID of a human miRNA with thecorresponding SNP in the predicted target site. The common prefix ‘‘hsa-mir(let)-’’ in the IDs is omitted. The rows in bold indicate the regulation modulesshared by both CEU and YRI populations. See method section for thecalculation of TSE. Disease genes are indicated by asterisks (*).doi:10.1371/journal.pone.0031429.t002
SNP-Involved, miRNA-Mediated Relationships
PLoS ONE | www.plosone.org 7 February 2012 | Volume 7 | Issue 2 | e31429

phenotypes, including gene expression. In this regard, we
hypothesized that some of them may function via linkage
disequilibrium with SNPs in the miRNA target sites. Through
further analyzing the results in [13], we found solid evidence for
this hypothesis. This finding is important not only in comprehen-
sively modeling the miRNA post-transcriptional regulation on the
target genes, but also in deeply unraveling the genetic architecture
and molecular mechanism of polygenic complex traits. In
addition, different from the methods for selecting the most
statistically informative SNPs [20,21,49], our result also suggests
a novel strategy for the SNP association study. That is, when
multiple SNP markers are synonymously related to the same trait,
we can check if any of them is inside a miRNA target site in order
to determine the true causal variant(s). For this purpose, we
proposed a simple genotype recoding method to visualize the
association between the SNPs of interest. A problem worthy of
further note relates to the calculation of LD. For un-phased data,
the required probability of haplotype AB of a pair of linked loci
(suppose their bi-alleles are A/a and B/b, respectively) is usually
estimated by one of the two iterative techniques, i.e. implementing
an EM algorithm [50] or solving a cubic equation [49,51,52]. The
first is theoretically attractive but cannot be guaranteed to
converge to the global optimum [53]. In this study, we employed
the second method but introduced a constraint on the interim
estimate in the computation to avoid undesired results. An
alternative approximation method we proposed here is that,
without calculating the haplotype frequency, LD can be tested via
evaluating genotype correlation. More precisely, for each locus,
Figure 4. Box plots illustrating the additive pattern of miRNA target site effect (TSE) on gene expression. The upper plots A and B:Gene LRPAP1 has SNP rs1049574 in the 39 UTR region. Based on the reference sequence hg18, the original nucleotide guanine (G) is not involved in anymiRNA target site. The alternative nucleotide adenine (A) leads to the creation of a novel target site for miR-592. As a result, a sample of genotype GG, GAor AA has zero, one or two miRNA target sites due to this SNP, respectively. As shown in these two plots, the TSE in this created-target-site example wellreflects an additive pattern for the post-transcriptional regulation of the target gene by the cognate miRNA in both populations. The lower plots C andD: gene THEM4 has SNP rs13320 in the 39 UTR region. Based on the reference sequence hg18, the original nucleotide cytosine (C) is involved in a targetsite of miR-101. The alternative nucleotide thymine (T) leads to the disruption of the target site. As a result, a sample of genotype CC, CT or TT has two,one or zero miRNA target site due to this SNP, respectively. As shown in these two plots, the TSE in this disrupted-target-site example also well reflects anadditive pattern for the post-transcriptional regulation of the target gene by the cognate miRNA in both populations.doi:10.1371/journal.pone.0031429.g004
SNP-Involved, miRNA-Mediated Relationships
PLoS ONE | www.plosone.org 8 February 2012 | Volume 7 | Issue 2 | e31429
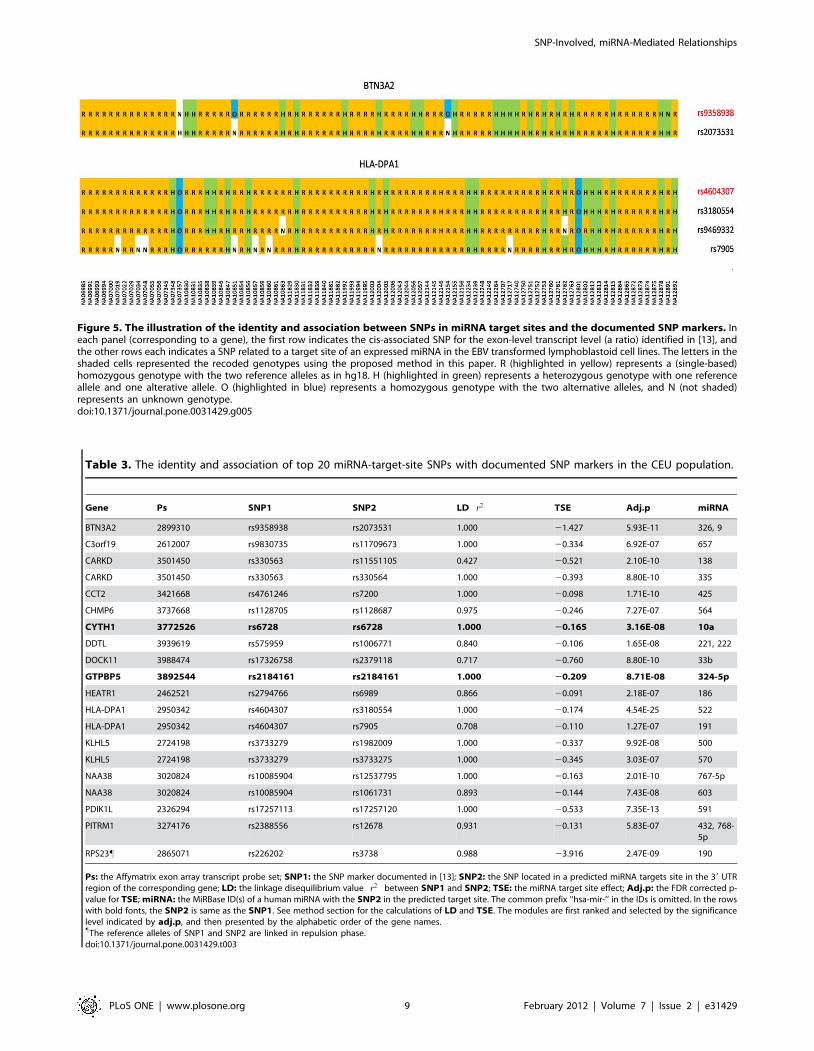
Figure 5. The illustration of the identity and association between SNPs in miRNA target sites and the documented SNP markers. Ineach panel (corresponding to a gene), the first row indicates the cis-associated SNP for the exon-level transcript level (a ratio) identified in [13], andthe other rows each indicates a SNP related to a target site of an expressed miRNA in the EBV transformed lymphoblastoid cell lines. The letters in theshaded cells represented the recoded genotypes using the proposed method in this paper. R (highlighted in yellow) represents a (single-based)homozygous genotype with the two reference alleles as in hg18. H (highlighted in green) represents a heterozygous genotype with one referenceallele and one alterative allele. O (highlighted in blue) represents a homozygous genotype with the two alternative alleles, and N (not shaded)represents an unknown genotype.doi:10.1371/journal.pone.0031429.g005
Table 3. The identity and association of top 20 miRNA-target-site SNPs with documented SNP markers in the CEU population.
Gene Ps SNP1 SNP2 LD r2� �
TSE Adj.p miRNA
BTN3A2 2899310 rs9358938 rs2073531 1.000 21.427 5.93E-11 326, 9
C3orf19 2612007 rs9830735 rs11709673 1.000 20.334 6.92E-07 657
CARKD 3501450 rs330563 rs11551105 0.427 20.521 2.10E-10 138
CARKD 3501450 rs330563 rs330564 1.000 20.393 8.80E-10 335
CCT2 3421668 rs4761246 rs7200 1.000 20.098 1.71E-10 425
CHMP6 3737668 rs1128705 rs1128687 0.975 20.246 7.27E-07 564
CYTH1 3772526 rs6728 rs6728 1.000 20.165 3.16E-08 10a
DDTL 3939619 rs575959 rs1006771 0.840 20.106 1.65E-08 221, 222
DOCK11 3988474 rs17326758 rs2379118 0.717 20.760 8.80E-10 33b
GTPBP5 3892544 rs2184161 rs2184161 1.000 20.209 8.71E-08 324-5p
HEATR1 2462521 rs2794766 rs6989 0.866 20.091 2.18E-07 186
HLA-DPA1 2950342 rs4604307 rs3180554 1.000 20.174 4.54E-25 522
HLA-DPA1 2950342 rs4604307 rs7905 0.708 20.110 1.27E-07 191
KLHL5 2724198 rs3733279 rs1982009 1.000 20.337 9.92E-08 500
KLHL5 2724198 rs3733279 rs3733275 1.000 20.345 3.03E-07 570
NAA38 3020824 rs10085904 rs12537795 1.000 20.163 2.01E-10 767-5p
NAA38 3020824 rs10085904 rs1061731 0.893 20.144 7.43E-08 603
PDIK1L 2326294 rs17257113 rs17257120 1.000 20.533 7.35E-13 591
PITRM1 3274176 rs2388556 rs12678 0.931 20.131 5.83E-07 432, 768-5p
RPS23" 2865071 rs226202 rs3738 0.988 23.916 2.47E-09 190
Ps: the Affymatrix exon array transcript probe set; SNP1: the SNP marker documented in [13]; SNP2: the SNP located in a predicted miRNA targets site in the 39 UTRregion of the corresponding gene; LD: the linkage disequilibrium value r2
� �between SNP1 and SNP2; TSE: the miRNA target site effect; Adj.p: the FDR corrected p-
value for TSE; miRNA: the MiRBase ID(s) of a human miRNA with the SNP2 in the predicted target site. The common prefix ‘‘hsa-mir-’’ in the IDs is omitted. In the rowswith bold fonts, the SNP2 is same as the SNP1. See method section for the calculations of LD and TSE. The modules are first ranked and selected by the significancelevel indicated by adj.p, and then presented by the alphabetic order of the gene names."The reference alleles of SNP1 and SNP2 are linked in repulsion phase.doi:10.1371/journal.pone.0031429.t003
SNP-Involved, miRNA-Mediated Relationships
PLoS ONE | www.plosone.org 9 February 2012 | Volume 7 | Issue 2 | e31429

the three recoded genotypes R, H and O are first numbered as 1, 0
and 21, respectively. Then, Pearson correlation between the two
loci is calculated as a pseudo LD measure and the significance is
tested with Fisher’ method or by an empirical distribution of the
statistic established from the information of randomly sampled
locus pairs. We tried this approximate method on the analyzed
data and obtained similar results as those calculated using the
algorithm described in the Material and Methods section. Due to
its simplicity and no need for any prior parameters, the proposed
method is worthy to be advocated in our opinion.
Great efforts have proven the influential role of Cis-acting
variants in the expression of the host or adjacent genes. Various
miRNA studies, on the other hand, have shown that accessibility
of miRNA binding site is a crucial factor that controls the miRNA
mediated regulation. SNPs that can contribute to alterations in the
structure of miRNA binding site can thus influence the miRNA
mediated regulation on target genes. In this study, by hypothe-
sizing that miRNA-target-site polymorphism may represent a
main mechanism for the individual and population variability of
gene expression measures, and these site variants potentially link
the documented cis-SNP markers to the expression of the
associated genes, we performed a rigorous analysis to characterize
genome-wide, SNP-involved, miRNA-mediated post-transcrip-
tional regulation modules in lymphocyte cell lines. Our findings
provided not only solid bioinformatic evidence for this hypothesis,
but also two sets of statistically significant miRNA-SNP(s)-gene
functional modules that will enable the targeted experimental
studies.
Materials and Methods
Microarray gene expression data and its preprocessingThe raw data of gene expression profile of human lymphocyte
cell lines (LCL) was deposited in the Gene Expression Omnibus
repository (GEO, a MIAME compliant database) with the
accession number GSE7792 [8]. This data, using Affymetrix
Human Exon 1.0 ST arrays, measured 87 CEU and 89 YRI
samples genotyped in International HapMap project. In the
statistical analysis, we used a preprocessed dataset provided by
Fraser and Xie [13]. The preprocess procedure was conducted as
follows. First, the probes overlapping SNPs which had at least two-
hit in the dbSNP database (release 126) [7,54] were removed
before analysis. Then, the probes in different arrays were
normalized with the quantile method [55]. After that, the
expression levels of probe sets and genes were summarized
independently using the PLIER (probe logarithmic intensity error)
algorithm implemented in the Affymetrix Power Tools (APT)
software package. Finally, the normalized expression quantity of a
probe set was determined by dividing the expression intensity with
the intensity of the gene it belongs to. The detailed list of cis-SNP
markers and the target probe-set (exons) within 100 kilo-bases
were generated by editing the Supplemental Tables 3 and 4 in
[13].
Evidences for the existence of miRNAs in LCL samplesTo our knowledge, no high-throughput miRNA expression
profiling for the HapMap LCL samples has been published yet,
Table 4. The identity and association of top 20 miRNA-target-site SNPs with documented SNP markers in the YRI population.
Gene Ps SNP1 SNP2 LD TSE Adj.p miRNA
ARID5A 2494577 rs6576973 rs6576973 1.000 20.186 9.69E-13 377
C3orf19 2612007 rs9830735 rs11709673 1.000 20.194 9.55E-05 657
C5orf15 2875930 rs10123 rs10123 1.000 20.371 6.20E-10 642
CCT5 2801555 rs2578645 rs699113 1.000 20.102 6.20E-10 143
CEACAM21 3834288 rs3745936 rs3745936 1.000 20.580 2.68E-05 145
CHRAC1 3118459 rs10216653 rs10216653 1.000 20.121 3.06E-06 328
CYTH1 3772526 rs6728 rs6728 1.000 20.180 2.84E-05 10a
GTPBP5 3892544 rs2184161 rs2184161 1.000 20.236 3.61E-09 324-5p
HLA-DPA1 2950342 rs4604307 rs3180554 0.571 20.205 8.88E-12 522
INO80C 3804023 rs3786394 rs11659769 1.000 20.641 4.28E-12 570
KLHL5 2724198 rs3733279 rs1982009 0.918 20.400 2.14E-05 500
KLHL5 2724198 rs3733279 rs3733275 1.000 20.406 3.53E-05 570
KYNU 2508576 rs1050950 rs1050950 1.000 20.079 5.12E-05 432
NAA38 3020824 rs10085904 rs12537795 1.000 20.098 1.81E-06 767-5p
PDIK1L 2326294 rs17257113 rs17257120 1.000 20.547 4.81E-07 591
PYGB 3880812 rs6083805 rs7020 1.000 20.146 9.55E-05 196b, 624
TRUB1 3265505 rs11197010 rs7071789 1.000 20.316 1.26E-08 495
VRK3 3868286 rs2304113 rs16981592 0.545 20.095 1.13E-06 365
ZNF117 3004842 rs1524821 rs9638416 0.810 27.303 1.41E-08 381
ZNF117 3004842 rs1524821 rs9638214 0.810 26.807 7.09E-07 381
Ps: the Affymatrix exon array transcript probe set; SNP1: the SNP marker documented in [13]; SNP2: the SNP located in a predicted miRNA target site in the 39 UTRregion of the corresponding gene; LD: the linkage disequilibrium value r2
� �between SNP1 and SNP2; TSE: the miRNA target site effect; Adj.p: the FDR corrected p-
value for TSE; miRNA: the MiRBase ID(s) of a human miRNA with the SNP2 in the predicted target site. The common prefix ‘‘hsa-mir-’’ in the IDs is omitted. In rowswith bold fonts, the SNP2 is same as the SNP1. See the method section for the calculations of LD and TSE. The modules are first ranked and selected by thesignificance level indicated by adj.p, and then presented by the alphabetic order of the gene names.doi:10.1371/journal.pone.0031429.t004
SNP-Involved, miRNA-Mediated Relationships
PLoS ONE | www.plosone.org 10 February 2012 | Volume 7 | Issue 2 | e31429

though a recent publication reported that 58 LCL samples of CEU
population had been measured with LNA microRNA Arrays [36].
In preparing this paper, we extracted the evidences for the
existence (expression) of miRNAs in this type of cells from another
GEO dataset (GSE14794) [39]. In this dataset, miRNA expression
of 192 samples (including replicates) of 90 Epstein Barr virus
(EBV)-transformed lymphoblastoid cell lines was measured with
Illumina Human v1 MicroRNA expression beadchips. Since those
lymphoblastoid cell lines are collected from the peripheral blood
lymphocytes of Caucasian men, they are the closest substitute
samples we can locate for the CEU population. To filter the
miRNAs on the array, we employed a similar method as described
in [39]. That is, based on the gene-level results generated from
BeadStudio software, we first obtained the median detection p-
values of the 736 miRNAs, and then corrected them with BH
method [56]. After that, we selected 388 ‘‘expressed’’ miRNA
genes with adj.p,0.05. Among them, 201 in the entire analyzed
human miRNA set (N = 677) were kept for the subsequent study.
Identification of SNP-involved miRNA target sitesMany computationally determined sets of miRNA target sites
have been published on line [4,32,57]. In the employed prediction
algorithm, the step of evaluating miRNA-target complementarity
was generally included. To establish a large but relatively reliable
pool of potential miRNA target sites, we implemented our lab-
owned R program solely based on the criterion of stringent seed
matching [2]. In particular, the canonical site motif on the 39
UTR reverse complementary to the seed region (nucleotides 2–
7(8)) of a miRNA was recognized by the matchPattern function
contained in the Bioconductor Biostrings package [58]. We used
three data sets at this step. They are (1) 545 human miRNA family
sequences obtained from TargetScan website; (2) the allele
frequency tables (Phase II+Phase III) downloaded from HapMap;
and (3) 39 UTR sequences of mRNAs retrieved from human
genome assembly-18 (NCBI36). Using these data sets and the
developed R codes, we predicted miRNA target sites containing
the IN-SNPs through the following procedure. Two sequences,
one centered on the reference allele and the other centered on the
variant or other allele, were maintained for each IN-SNP. A site
identified on the reference-allele sequence but not on the variant-
allele sequence was marked as a disrupted (DS) target site, and a
site predicted on the variant-allele sequence but not on the
reference-allele sequence was marked as ‘‘created’’ (CR) target
site. It should be noted that, only the SNPs with the MAF over 0.1
in CEU or YRI population were reserved in this study as IN-SNPs.
Furthermore, the SNPs (accounting for ,0.7% of the entire set of
analyzed IN-SNPs) which followed the immediately preceding
SNP with the distance less than 10 nt were also excluded from
further analysis.
Recoding SNP GenotypesIn the HapMap data (release 27), SNP genotypes are expressed
in the bi-allelic form, such as A/C. In order to effectively estimate
SNP-involved miRNA target site effect (TSE) on transcript
intensity, and visualize the genotype correlation between two
SNPs, we recoded the bi-allelic SNP genotype with a single capital
letter. More specifically, ‘‘H’’ represents a heterozygous genotype
with one reference allele and one alterative allele. ‘‘R’’ or ‘‘O’’
respectively denotes a homozygous (single-locus) genotype con-
sisting of two reference or alternative alleles. According to this
coding scheme, for instance, the genotypes of two loci or multi-loci
can be expressed as RR, RRH, RHOR, and so on (see Figure 5).
For convenience of writing, we call two SNPs ‘‘genotype consistent
SNPs’’ if they have the recoded genotypes overlapped across all
the individuals.
Estimating SNP-involved miRNA target site effects (TSE)The target site effect was estimated by a linear model as defined
below.
yij~mzsizbxjzeij ð1Þ
where yij is the log2 transformed transcript intensity (or ratio) of
sample j, m is the grand mean of all observations, si (i = 1, 2) is the
sex effect, b is the TSE, xj is the number of ‘‘consistent allele(s)’’
(CA) of individual j at a specific target site, and eij is the random
noise. For a disrupted target site, R genotype has two CAs, H
genotype has one CA and O genotype has zero CA. On the other
hand, for a created target site, R, H and O genotypes have zero,
one and two CA(s), respectively. The calculated p-value for a TSE
was corrected with the BH method.
Linkage disequilibrium (LD) calculationLD was measured as the square of the correlation (r) between
two SNP loci [59],
r2~(P11{pApB)2
pApB(1{pA)(1{pB)ð2Þ
where pA and pB are the probabilities of the reference alleles at the
two loci, and can be directly estimated by their frequencies in the
sample set; P11 is the probability of the haplotype with two
reference alleles. The statistic x2~2Nr2 follows the Chi-square
distribution with df = 1 under the null hypothesis of r2 = 0 [60].
The maximum likelihood (ML) estimation of P11 was obtained
through solving a cubic equation iteratively [51,52]. That is,
P11~2N11zN12zN21zN22P11(1{pA{pB{P11)
2N½P11(1{pA{pB{P11)z(pA{P11)(pB{P11)� ð3Þ
In (3), N represents the total number of individuals. Based on the
proposed genotype recoding scheme, N11, N12, N21, and N22
represent the numbers of RR individuals, RH individuals, HR
individuals and HH individuals, respectively. In the calculation,
we also introduced a counting-based constraint defined as follows.
(2N11zN12zN21)=2NƒP(i)11ƒ(2N11zN12zN21zN22)=2N ð4Þ
where P(i)11 is the interim estimate in the ith iteration. The
constraint is stricter than the limiting condition for valid roots
described in [61], thus it can further alleviate the problem of
convergence to a false optimum. Accordingly, the resulting LD (r2)
can be guaranteed to be within the [0, 1] interval (see Text S1).
Supporting Information
Table S1 The disease involvement annotation to the miRNAs in
the predicted SNP-involved, miRNA-mediated post-transcription-
al regulation modules listed in Tables 1–2 and Additional files 2–3.
(XLS)
Table S2 The identity and association of miRNA target site
SNPs with documented cis SNP markers in the CEU population.
(XLS)
SNP-Involved, miRNA-Mediated Relationships
PLoS ONE | www.plosone.org 11 February 2012 | Volume 7 | Issue 2 | e31429
Table S3 The identity and association of miRNA target site
SNPs with documented cis SNP markers in the YRI population.
(XLS)
Table S4 The RNA-seq data based prediction for SNP-
involved, miRNA mediated, post-transcriptional regulation mod-
ules (SNP-MPRMs) in the CEU and YRI populations.
(DOC)
Text S1 The proof for the interval of the LD measure (r2) based
on the haplotype probability estimated under the proposed
constraint.
(DOC)
Acknowledgments
We thank Dr. Hunter B. Fraser in Stanford University for providing the
SNP-free LCL gene expression dataset. We are grateful to the reviewers for
the insightful comments.
Author Contributions
Conceived and designed the experiments: WZ KZ. Performed the
experiments: WZ. Analyzed the data: WZ KZ. Wrote the paper: WZ
KZ. Helped with the experimental design and justification, provided
editorial comments, and participated in manuscript and figure preparation:
AE DZ EKF PD.
References
1. Filipowicz W, Bhattacharyya SN, Sonenberg N (2008) Mechanisms of post-
transcriptional regulation by microRNAs: are the answers in sight? Nat Rev
Genet 9: 102–114.
2. Bartel DP (2009) MicroRNAs: target recognition and regulatory functions. Cell
136: 215–233.
3. Grimson A, Farh KK, Johnston WK, Garrett-Engele P, Lim LP, et al. (2007)
MicroRNA targeting specificity in mammals: determinants beyond seed pairing.
Mol Cell 27: 91–105.
4. Griffiths-Jones S, Saini HK, van Dongen S, Enright AJ (2008) miRBase: tools for
microRNA genomics. Nucleic Acids Res 36: D154–158.
5. Papadopoulos GL, Reczko M, Simossis VA, Sethupathy P, Hatzigeorgiou AG
(2009) The database of experimentally supported targets: a functional update of
TarBase. Nucleic Acids Res 37: D155–158.
6. Stark A, Brennecke J, Bushati N, Russell RB, Cohen SM (2005) Animal
MicroRNAs confer robustness to gene expression and have a significant impact
on 39UTR evolution. Cell 123: 1133–1146.
7. UCSC Genome Browser website. Available: http://genome.ucsc.edu/. Ac-
cessed 2011 Dec 22.
8. Huang RS, Duan S, Bleibel WK, Kistner EO, Zhang W, et al. (2007) A genome-
wide approach to identify genetic variants that contribute to etoposide-induced
cytotoxicity. Proc Natl Acad Sci U S A 104: 9758–9763.
9. Stranger BE, Forrest MS, Clark AG, Minichiello MJ, Deutsch S, et al. (2005)
Genome-wide associations of gene expression variation in humans. PLoS Genet
1: e78.
10. Li Y, Rowland C, Schrodi S, Laird W, Tacey K, et al. (2006) A case-control
association study of the 12 single-nucleotide polymorphisms implicated in
Parkinson disease by a recent genome scan. Am J Hum Genet 78: 1090–1092.
author reply 1092–1094.
11. Gan SQ, Du Z, Liu SR, Yang YL, Shen M, et al. (2008) Association of SNP
haplotypes at the myostatin gene with muscular hypertrophy in sheep. Asian -
Australasian Journal of Animal Sciences 21: 928–935.
12. Simko I, Pechenick DA, McHale LK, Truco MJ, Ochoa OE, et al. (2009)
Association mapping and marker-assisted selection of the lettuce dieback
resistance gene Tvr1. BMC Plant Biol 9: 135.
13. Fraser HB, Xie X (2009) Common polymorphic transcript variation in human
disease. Genome Res 19: 567–575.
14. Smith WJ, Li Y, Ingham A, Collis E, McWilliam SM, et al. (2010) A genomics-
informed, SNP association study reveals FBLN1 and FABP4 as contributing to
resistance to fleece rot in Australian Merino sheep. BMC Vet Res 6:
27.
15. Shu Y, Li Y, Zhu Z, Bai X, Cai H, et al. (2010) SNPs discovery and CAPS
marker conversion in soybean. Mol Biol Rep.
16. Zhang W, Duan S, Bleibel WK, Wisel SA, Huang RS, et al. (2009) Identification
of common genetic variants that account for transcript isoform variation
between human populations. Hum Genet 125: 81–93.
17. Stranger BE, Forrest MS, Dunning M, Ingle CE, Beazley C, et al. (2007)
Relative impact of nucleotide and copy number variation on gene expression
phenotypes. Science 315: 848–853.
18. Myles S, Davison D, Barrett J, Stoneking M, Timpson N (2008) Worldwide
population differentiation at disease-associated SNPs. BMC Med Genomics 1:
22.
19. Amato R, Pinelli M, Monticelli A, Marino D, Miele G, et al. (2009) Genome-
wide scan for signatures of human population differentiation and their
relationship with natural selection, functional pathways and diseases. PLoS
One 4: e7927.
20. Nica AC, Montgomery SB, Dimas AS, Stranger BE, Beazley C, et al. (2010)
Candidate causal regulatory effects by integration of expression QTLs with
complex trait genetic associations. PLoS Genet 6: e1000895.
21. Brown EM, Barrat BJ (2007) The HapMap -A haplotype map of human
genome. Bioinformatics for geneticists: a bioinformatics primer for the analysis of
genetic data. 2 ed. West Sussex: John Wiley & Sons, Ltd. pp 35–54.
22. Plagnol V, Smyth DJ, Todd JA, Clayton DG (2009) Statistical independence of
the colocalized association signals for type 1 diabetes and RPS26 gene expression
on chromosome 12q13. Biostatistics 10: 327–334.
23. Yamaguchi-Kabata Y, Shimada MK, Hayakawa Y, Minoshima S,
Chakraborty R, et al. (2008) Distribution and effects of nonsense polymorphisms
in human genes. PLoS One 3: e3393.
24. The GPC (2010) A map of human genome variation from population-scale
sequencing. Nature 467: 1061–1073.
25. Kim J, Bartel DP (2009) Allelic imbalance sequencing reveals that single-
nucleotide polymorphisms frequently alter microRNA-directed repression. Nat
Biotechnol 27: 472–477.
26. Brown EM, Barrat BJ, eds. The HapMap - A Haplotype Map of Human
Genome. 2 ed Wiley. pp 35–58.
27. Sethupathy P, Collins FS (2008) MicroRNA target site polymorphisms and
human disease. Trends Genet 24: 489–497.
28. Bao L, Zhou M, Wu L, Lu L, Goldowitz D, et al. (2007) PolymiRTS Database:
linking polymorphisms in microRNA target sites with complex traits. Nucleic
Acids Res 35: D51–54.
29. Saunders MA, Liang H, Li WH (2007) Human polymorphism at microRNAs
and microRNA target sites. Proc Natl Acad Sci U S A 104: 3300–3305.
30. Huang DW, Sherman BT, Lempicki RA (2009) Systematic and integrative
analysis of large gene lists using DAVID Bioinformatics Resources. Nature
Protoc 4: 44–57.
31. DAVID website. Available: http://david.abcc.ncifcrf.gov/. Accessed 2010 Dec
15.
32. TargetScan website. Available: http://www.targetscan.org/. Accessed 2010 Jul
20.
33. Lall S, Grun D, Krek A, Chen K, Wang YL, et al. (2006) A genome-wide map of
conserved microRNA targets in C. elegans. Curr Biol 16: 460–471.
34. Betel D, Wilson M, Gabow A, Marks DS, Sander C (2008) The microRNA.org
resource: targets and expression. Nucleic Acids Res 36: D149–153.
35. Friedman RC, Farh KK, Burge CB, Bartel DP (2009) Most mammalian
mRNAs are conserved targets of microRNAs. Genome Res 19: 92–105.
36. Gamazon ER, Im HK, Duan S, Lussier YA, Cox NJ, et al. (2010) Exprtarget: an
integrative approach to predicting human microRNA targets. PLoS One 5:
e13534.
37. Sturm M, Hackenberg M, Langenberger D, Frishman D (2010) TargetSpy: a
supervised machine learning approach for microRNA target prediction. BMC
Bioinformatics 11: 292.
38. HapMap website. Available: http://hapmap.ncbi.nlm.nih.gov/. Accessed 2010
Jul 25.
39. Wang L, Oberg AL, Asmann YW, Sicotte H, McDonnell SK, et al. (2009)
Genome-wide transcriptional profiling reveals microRNA-correlated genes and
biological processes in human lymphoblastoid cell lines. PLoS One 4: e5878.
40. Jiang Q, Wang Y, Hao Y, Juan L, Teng M, et al. (2009) miR2Disease: a
manually curated database for microRNA deregulation in human disease.
Nucleic Acids Res 37: D98–104.
41. Wang D, Qiu C, Zhang H, Wang J, Cui Q, et al. (2010) Human microRNA
oncogenes and tumor suppressors show significantly different biological patterns:
from functions to targets. PLoS One 5.
42. Imai S, Kai M, Yasuda S, Kanoh H, Sakane F (2005) Identification and
characterization of a novel human type II diacylglycerol kinase, DGK kappa.
J Biol Chem 280: 39870–39881.
43. Borel C, Antonarakis SE (2008) Functional genetic variation of human miRNAs
and phenotypic consequences. Mamm Genome 19: 503–509.
44. He H, Jazdzewski K, Li W, Liyanarachchi S, Nagy R, et al. (2005) The role of
microRNA genes in papillary thyroid carcinoma. Proc Natl Acad Sci U S A 102:19075–19080.
45. Mishra PJ, Humeniuk R, Longo-Sorbello GS, Banerjee D, Bertino JR (2007) A
miR-24 microRNA binding-site polymorphism in dihydrofolate reductase gene
leads to methotrexate resistance. Proc Natl Acad Sci U S A 104: 13513–13518.
46. Wang G, van der Walt JM, Mayhew G, Li YJ, Zuchner S, et al. (2008) Variation
in the miRNA-433 binding site of FGF20 confers risk for Parkinson disease by
overexpression of alpha-synuclein. Am J Hum Genet 82: 283–289.
47. Montgomery SB, Sammeth M, Gutierrez-Arcelus M, Lach RP, Ingle C, et al.
(2010) Transcriptome genetics using second generation sequencing in a
Caucasian population. Nature 464: 773–777.
SNP-Involved, miRNA-Mediated Relationships
PLoS ONE | www.plosone.org 12 February 2012 | Volume 7 | Issue 2 | e31429

48. Pickrell JK, Marioni JC, Pai AA, Degner JF, Engelhardt BE, et al. (2010)
Understanding mechanisms underlying human gene expression variation withRNA sequencing. Nature 464: 768–772.
49. Carlson CS, Eberle MA, Rieder MJ, Yi Q, Kruglyak L, et al. (2004) Selecting a
maximally informative set of single-nucleotide polymorphisms for associationanalyses using linkage disequilibrium. Am J Hum Genet 74: 106–120.
50. Hawley ME, Kidd KK (1995) HAPLO: a program using the EM algorithm toestimate the frequencies of multi-site haplotypes. J Hered 86: 409–411.
51. Hill WG (1974) Estimation of linkage disequilibrium in randomly mating
populations. Heredity 33: 229–239.52. Hartl DL, Clark AG (1989) Principles of population genetics. SunderlandMass.:
Sinauer Associates.53. Bansal A, Vignal C, McGinnis R (2007) Tools for statistical genetics. In:
Barnes MR, ed. Bioinformatics for geneticists: a bioinformatics primer for theanalysis of genetic data. 2 ed. West Sussex: John Wiley & Sons, Ltd.
54. dbSNP website. Available: http://www.ncbi.nlm.nih.gov/projects/SNP/. Ac-
cessed 2010 Sep 20.
55. Bolstad BM, Irizarry RA, Astrand M, Speed TP (2003) A comparison of
normalization methods for high density oligonucleotide array data based on
variance and bias. Bioinformatics 19: 185–193.
56. Benjamini Y, Hochberg Y (1995) Controlling the false discover rate – A practical
and powerful approach to multiple testing. J ROY STAT SOC B MET 75:
289–300.
57. Diana website. Available: http://diana.cslab.ece.ntua.gr/?sec = home. Accessed
2010 Aug 1.
58. Biostrings website. Available: http://www.bioconductor.org/packages/2.2/
bioc/html/Biostrings.html. Accessed 2010 Mar 10.
59. Pritchard JK, Przeworski M (2001) Linkage disequilibrium in humans: models
and data. Am J Hum Genet 69: 1–14.
60. Weir BS (1996) Genetic data analysis II: methods for discrete population genetic
data. SunderlandMass.: Sinauer Associates. pp xii,445.
61. Weir BS, Cockerham CC (1979) Estimation of linkage disequilibrium in
randomly mating population. Heredity 42: 105–111.
SNP-Involved, miRNA-Mediated Relationships
PLoS ONE | www.plosone.org 13 February 2012 | Volume 7 | Issue 2 | e31429