A new chicken 55K SNP genotyping array - BMC Genomics
12
METHODOLOGY ARTICLE Open Access A new chicken 55K SNP genotyping array Ranran Liu 1† , Siyuan Xing 1,2† , Jie Wang 1 , Maiqing Zheng 1 , Huanxian Cui 1 , Richard P. M. A. Crooijmans 2 , Qinghe Li 1 , Guiping Zhao 1,3,4* and Jie Wen 1,3,4* Abstract Background: China has the richest local chicken breeding resources in the world and is the world’s second largest producer of meat-type chickens. Development of a moderate-density SNP array for genetic analysis of chickens and breeding of meat-type chickens taking utility of those resources is urgently needed for conventional farms, breeding industry, and research areas. Results: Eight representative local breeds or commercial broiler lines with 3 pools of 48 individuals within each breed/ line were sequenced and supplied the major SNPs resource. There were 7.09 million - 9.41 million SNPs detected in each breed/line. After filtering using multiple criteria such as preferred incorporation of trait-related SNPs and uniformity of distribution across the genome, 52.18 K SNPs were selected in the final array. It consists of: (i) 19.22 K SNPs from the genomes of yellow-feathered, cyan-shank partridge and white-feathered chickens; (ii) 5.98 K SNPs related to economic traits from the Illumina 60 K SNP Bead Chip, which were found as significant associated SNPs with 15 traits in a Beijing-You crossed Cobb F2 resource population by genome-wide association study analysis; (iii) 7.63 K SNPs from 861 candidate genes of economic traits; (iv) the 0.94 K SNPs related to residual feed intake; and (v) 18.41 K from chicken SNPdb. The polymorphisms of 9 extra local breeds and 3 commercial lines were examined with this array, and 40 K - 47 K SNPs were polymorphic (with minor allele frequency > 0.05) in those breeds. The MDS result showed that those breeds can be clearly distinguished by this newly developed genotyping array. Conclusions: We successfully developed a 55K genotyping array by using SNPs segregated from typical local breeds and commercial lines. Compared to the existing Affy 600 K and Illumina 60 K arrays, there were 21,41 K new SNPs included on our Affy 55K array. The results of the 55K genotyping data can therefore be imputed to high-density SNPs genotyping data. The array offers a wide range of potential applications such as genomic selection breeding, GWAS of interested traits, and investigation of diversity of different chicken breeds. Keywords: Chicken, Commercial line, Genotyping array, SNP Background With a total of 107 chicken breeds, China has one of the richest local breed resources [1]. This diverse chicken genetic resource is a vital part of the diversity of bio- logical genetic resources around the world and provides excellent material for breeding new varieties or to genet- ically improve breed. China is the second-largest broiler producer and con- sumer all over the world, which accounts for approxi- mately 11% of the chicken production across the globe (FAOSTAT, 2017). In China, chicken is the second largest meat product after pork, making up to 17% of the total meat production. Chicken meat is mainly obtained from the introduced white feather broilers and domestic yellow-feathered meat-type chickens (meat-type local chicken breed, meat-type bred variety and a relevant strain containing the consanguinity of Chinese indigenous chicken), each accounting for half of the consumption. However, the current challenge is how to effectively pro- tect and maintain the existing local varieties. On the other hand, if breeding efficiency is promoted, new chicken lines breeding would be accelerated. The genome-wide SNP chip, also known as SNP array, arranges up to 25 million of DNA marker flanks on glass or special silicon chip to form the SNP probe array. It functions by means of the re- action of base pairing between the chip fixed DNA marker © The Author(s). 2019 Open Access This article is distributed under the terms of the Creative Commons Attribution 4.0 International License (http://creativecommons.org/licenses/by/4.0/), which permits unrestricted use, distribution, and reproduction in any medium, provided you give appropriate credit to the original author(s) and the source, provide a link to the Creative Commons license, and indicate if changes were made. The Creative Commons Public Domain Dedication waiver (http://creativecommons.org/publicdomain/zero/1.0/) applies to the data made available in this article, unless otherwise stated. * Correspondence: [email protected]; [email protected] † Ranran Liu and Siyuan Xing contributed equally to this work. 1 Institute of Animal Sciences, Chinese Academy of Agricultural Sciences, No. 2 Yuanmingyuan West Road, Beijing 100193, People’s Republic of China Full list of author information is available at the end of the article Liu et al. BMC Genomics (2019) 20:410 https://doi.org/10.1186/s12864-019-5736-8
-
Upload
khangminh22 -
Category
Documents
-
view
0 -
download
0
Transcript of A new chicken 55K SNP genotyping array - BMC Genomics

METHODOLOGY ARTICLE Open Access
A new chicken 55K SNP genotyping arrayRanran Liu1†, Siyuan Xing1,2†, Jie Wang1, Maiqing Zheng1, Huanxian Cui1, Richard P. M. A. Crooijmans2,Qinghe Li1, Guiping Zhao1,3,4* and Jie Wen1,3,4*
Abstract
Background: China has the richest local chicken breeding resources in the world and is the world’s second largestproducer of meat-type chickens. Development of a moderate-density SNP array for genetic analysis of chickens andbreeding of meat-type chickens taking utility of those resources is urgently needed for conventional farms,breeding industry, and research areas.
Results: Eight representative local breeds or commercial broiler lines with 3 pools of 48 individuals within each breed/line were sequenced and supplied the major SNPs resource. There were 7.09 million - 9.41 million SNPs detected ineach breed/line. After filtering using multiple criteria such as preferred incorporation of trait-related SNPs anduniformity of distribution across the genome, 52.18 K SNPs were selected in the final array. It consists of: (i) 19.22 K SNPsfrom the genomes of yellow-feathered, cyan-shank partridge and white-feathered chickens; (ii) 5.98 K SNPs related toeconomic traits from the Illumina 60 K SNP Bead Chip, which were found as significant associated SNPs with 15 traits ina Beijing-You crossed Cobb F2 resource population by genome-wide association study analysis; (iii) 7.63 K SNPs from861 candidate genes of economic traits; (iv) the 0.94 K SNPs related to residual feed intake; and (v) 18.41 K from chickenSNPdb. The polymorphisms of 9 extra local breeds and 3 commercial lines were examined with this array, and 40 K -47 K SNPs were polymorphic (with minor allele frequency > 0.05) in those breeds. The MDS result showed that thosebreeds can be clearly distinguished by this newly developed genotyping array.
Conclusions: We successfully developed a 55K genotyping array by using SNPs segregated from typical local breedsand commercial lines. Compared to the existing Affy 600 K and Illumina 60 K arrays, there were 21,41 K new SNPsincluded on our Affy 55K array. The results of the 55K genotyping data can therefore be imputed to high-density SNPsgenotyping data. The array offers a wide range of potential applications such as genomic selection breeding, GWAS ofinterested traits, and investigation of diversity of different chicken breeds.
Keywords: Chicken, Commercial line, Genotyping array, SNP
BackgroundWith a total of 107 chicken breeds, China has one of therichest local breed resources [1]. This diverse chickengenetic resource is a vital part of the diversity of bio-logical genetic resources around the world and providesexcellent material for breeding new varieties or to genet-ically improve breed.China is the second-largest broiler producer and con-
sumer all over the world, which accounts for approxi-mately 11% of the chicken production across the globe(FAOSTAT, 2017). In China, chicken is the second largest
meat product after pork, making up to 17% of the totalmeat production. Chicken meat is mainly obtained fromthe introduced white feather broilers and domesticyellow-feathered meat-type chickens (meat-type localchicken breed, meat-type bred variety and a relevant straincontaining the consanguinity of Chinese indigenouschicken), each accounting for half of the consumption.However, the current challenge is how to effectively pro-tect and maintain the existing local varieties. On the otherhand, if breeding efficiency is promoted, new chicken linesbreeding would be accelerated. The genome-wide SNPchip, also known as SNP array, arranges up to 25 millionof DNA marker flanks on glass or special silicon chip toform the SNP probe array. It functions by means of the re-action of base pairing between the chip fixed DNA marker
© The Author(s). 2019 Open Access This article is distributed under the terms of the Creative Commons Attribution 4.0International License (http://creativecommons.org/licenses/by/4.0/), which permits unrestricted use, distribution, andreproduction in any medium, provided you give appropriate credit to the original author(s) and the source, provide a link tothe Creative Commons license, and indicate if changes were made. The Creative Commons Public Domain Dedication waiver(http://creativecommons.org/publicdomain/zero/1.0/) applies to the data made available in this article, unless otherwise stated.
* Correspondence: [email protected]; [email protected]†Ranran Liu and Siyuan Xing contributed equally to this work.1Institute of Animal Sciences, Chinese Academy of Agricultural Sciences, No.2 Yuanmingyuan West Road, Beijing 100193, People’s Republic of ChinaFull list of author information is available at the end of the article
Liu et al. BMC Genomics (2019) 20:410 https://doi.org/10.1186/s12864-019-5736-8

flanks with the target genome, so as to accurately identifythe genetic information.The genotyping arrays have been developed for pig [2],
cow [3], dairy cattle [4], sheep [5], salmon [6], and buf-falo [7] et al. In chicken, the first 3 K genotyping arraywas developed in 2005 with 3072 SNPs [8]. After that, in2008, Groenen et al. did develop a 60 K bead chip forchicken which evenly covered the whole genome [9]. Todate, the only available commercial arrays for chicken isChicken the Affy 600 K SNP Array (AxiomGenome-Wide Chicken Genotyping Array), which wasdeveloped by Kranis et al [10]. The other arrays are pri-vately owned by commercial companies. The array sup-plied an important tool for the genetic diversity analysis,breeds relationship analysis, GWAS, quantitative charac-ter positioning analysis of QTL, selective evolution in-vestigation, and Genomic Selection [11]. Up till now themost efficient ways for SNP genotyping, biodiversitymeasuring, QTL mapping and genomic selection isusing SNP arrays. These applications provide improvedtechnical support for the conservation of indigenousbreeds and development of new genetic lines/breeds.One pitfall of all current chicken SNP arrays is the
bias towards western commercial lines. The currentchicken arrays, however, lack the genomic variationinformation of Chinese indigenous breeds. Therefore,it is imperative to develop a new type ofgenome-wide SNP chip with moderate flux in thechicken breeding industry, and also contains the gen-etic variation information specific to Chinese indigen-ous breeds. Overlap with the current arrays of the
different platforms (Axiom and Illumina) is essentialto link the commercial SNP arrays.Through whole genome re-sequencing of a variety of
Chinese native breeds and commercial chicken lines, in-tegrating SNPs associated with economic traits detectedin a crossing breed (either indigenous and commercial),a new public available moderate density (55 K) chickenarray (IASCHICK) has been developed.
ResultsThe SNPs selection was performed in four groups. Theroadmap is shown in Fig. 1, and the establishment of thefour groups are indicated in the following paragraphs.
Genome re-sequencing of chickens supplying the firstSNP groupEight Chinese local chicken breeds or inbred lines wereselected for whole genome sequencing. Each breed/lineholds 3 pools of 16 individuals per library without indi-vidual barcodes (Table 1). The data summary of each li-brary is provided in the Additional file 1. The number ofSNPs per breed/line varied from 7.09 million to 9.41million SNPs. The average number of detected SNPswas 8.61M in the local lines, and 7.73M in the commer-cial broilers. The total number of SNPs detected overall8 breeds/lines was 15.2 M. The SNPs with minor allelefrequency (MAF) < 0.05 and with low ΔF were excludedfor further steps. The 140 K SNPs, which allelic frequen-cies distinct to the control breeds, were subsequentlyused as the first group of candidate SNPs.
Fig. 1 The roadmap for the design of the new chicken 55K SNP array
Liu et al. BMC Genomics (2019) 20:410 Page 2 of 12
Selection of the second group of candidate SNPs basedon the GWAS of 15 traitsThe 7.42 K SNPs were demonstrated to have the top 1%genome-wide significance in 15 traits and were selectedas the second group of SNPs. The details are shown inAdditional file 2.
Selection of the third group of candidate SNPs based onthe genes associated with economic traitsSNPs in the regions of 861 candidate genes related toeconomic traits were used according to previous stud-ies of gene/protein expression profiles. A total of66.37 K SNPs in 383 genes for breast muscle andintramuscular fat development in embryonic andpost-hatching periods [12], 24.69 K SNPs in 286 genesfor body fat metabolism [13], 32.59 K SNPs in 146genes for disease resistance [14], and 7.24 K SNPs in46 genes that exhibited possible influence on otherchicken economic traits [15] were selected (Add-itional file 3). The SNPs located in the 5 Kb of eitherside of the genes’ up- and down-stream were alsoconsidered.According to the SNPs detected by the genome rese-
quencing of the previously mentioned 8 breeds, 15.18 Kcandidate SNPs were selected from 118.47 K SNPs on allthose genes, which had priority with mutations in exons,splicing regions, promotors, and the 3′ and 5′ untranslatedregions (UTRs).In addition, a batch of 798 SNPs from an unpub-
lished capture sequencing of chicken chromosomes11, 16, and 19 were included in the third candidategroup (Additional file 4). The SNPs were significantlyrelated to high IgY levels in Beijing-You and WhiteLeghorn chickens.There were 15.98 K candidate SNPs that were selected
for the design of the final genotyping array.
The fourth group of candidate SNPs are derived fromwhole genome sequences of low- and high-RFI chickensWhole genome sequencing of low- and high-RFI chick-ens were performed to locate the genomic variants forRFI based on differences in allelic frequency betweenhigh- and low-RFI chickens as described in our previousstudy [16]. The selected 4.32 K SNPs (3.74 K RFI relatedSNP in Beijing-You chickens and 0.58 K RFI relatedSNPs in Cobb chickens) were used as the candidateSNPs for the design of the final genotyping array in thenext step.
Designing the Affy 55K genotyping arrayBased on the above four groups of candidate SNPs, acustom-made algorithm was used to fix the final array.Finally, 52,184 SNPs were selected for the final array.The mean physical distance of SNPs in each involvedchromosome shows in Table 2. The priority 1 SNPs (theSNPs in group 2, 3 and 4) and 25 INDELs were firstplaced on the final SNP panel. The next step wasaddition of the priority 2 SNPs (the SNPs in group 1).The remaining 18.41 K SNPs was selected for the blankwindows in the whole chicken genome which the SNPsin the four groups cannot be covered.The SNPs positions of 55K array were given in Add-
itional file 5. The selected SNPs were derived from thefollowing five groups (Table 3): (i) 19.2 K SNPs fromwhole genome sequencing of the eight chicken breeds/lines; (ii) 7.42 K trait-related SNPs from the Illumina 60K SNP Bead Chip, which were found as SNPs signifi-cantly associated with 15 economic traits; (iii) 15.98 KSNPs from 861 candidate genes of target traits and highIgY level related region; (iv) 4.32 K SNPs related tochicken RFI; and (v) 18.41 K from chicken SNPdb. In thefinal genotyping array, 99.85% of SNPs could be anno-tated (Table 4). The distribution of SNPs on the chro-mosomes is shown in Fig. 2.
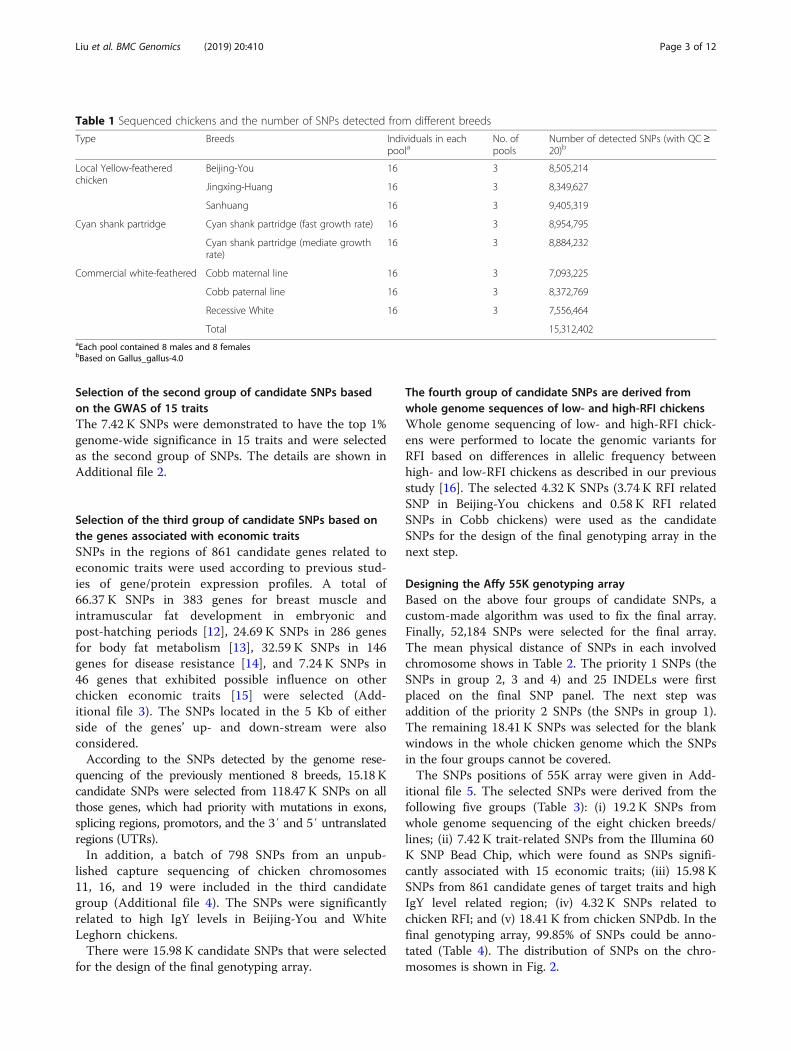
Table 1 Sequenced chickens and the number of SNPs detected from different breeds
Type Breeds Individuals in eachpoola
No. ofpools
Number of detected SNPs (with QC≥20)b
Local Yellow-featheredchicken
Beijing-You 16 3 8,505,214
Jingxing-Huang 16 3 8,349,627
Sanhuang 16 3 9,405,319
Cyan shank partridge Cyan shank partridge (fast growth rate) 16 3 8,954,795
Cyan shank partridge (mediate growthrate)
16 3 8,884,232
Commercial white-feathered Cobb maternal line 16 3 7,093,225
Cobb paternal line 16 3 8,372,769
Recessive White 16 3 7,556,464
Total 15,312,402aEach pool contained 8 males and 8 femalesbBased on Gallus_gallus-4.0
Liu et al. BMC Genomics (2019) 20:410 Page 3 of 12

The comparisons of the Affy 55K array with the existingchicken arrays (Affy 600 K array, and Illumina 60 K)All the SNPs of this 55K array, Affy 600 K array [10],and Illumina 60 K array [9] were mapped to the latestchicken genome (GRCg6a). The overlap of the 3 arraysis shown in Fig. 3. There are 6740 SNPs (13%) whichoverlap between the Affy 55K array and the Illumina 60K array. When comparing to the Affy 600 K array, thereare 24,227 SNPs that overlap between the 55K arraywhich accounts for 46%. There were 21,412 new SNPsincluded in 55K array compared to the existing arrays.
Validation of the 55K array in 13 chicken breeds/linesAll samples from 10 Chinese local breeds (Chahua,Dagu, Liyang, Luhua, Qingyuan, Silkie, Wenchang,Bai’er, Xianju, and Jingxing-Huang) and 3 commerciallines (Hubbard, Cobb, and White Leghorn) weregenotyped.The average call rate for each breed ranged from 97.0%
(Qingyuan) to 98.7% (Cobb). Across all populations, 76.7to 88.0% of the 52.18 K SNPs were polymorphic, withMAF ≥ 0.05. The average MAF ranged from 0.22 (Bai’erchicken) to 0.27 (Wenchang chicken) (Table 5).An MDS analysis was performed using the genotyped
data to investigate the ability of the 55K panel to detectpopulation stratification in the validated samples. Fig-ure 4 shows the relative coordinates of individuals whenplotted using the two largest principal components. Indi-viduals originating from the commercial broilers, Hub-bard and Cobb tightly clustered. The Chineseindigenous meat-type breeds clustered together. The twoChinese indigenous egg-type breeds, Xianju and Bai’er,clustered together. The remaining local breeds (mainly
Table 2 The number of SNPs of the 55K array on eachchromosome and their distancea
Chromosome Number of SNPs Mean Distance (K bp)
1 10,228 19.21
2 7077 21.14
3 5196 21.44
4 4589 19.91
5 2705 22.10
6 1750 20.36
7 1684 21.63
8 1314 22.81
9 1236 18.98
10 1399 14.59
11 1373 14.67
12 1389 14.34
13 1041 17.67
14 1118 14.43
15 761 16.71
16 81 7.37
17 724 14.31
18 736 14.94
19 725 13.74
20 867 16.04
21 503 13.53
22 153 30.00
23 321 17.76
24 390 15.98
25 106 26.67
26 339 15.36
27 277 20.22
28 317 15.91
Z 3785 21.67
Summary 52,184a The distance between SNPs based on Gallus_gallus-5.0
Table 3 The number of SNPs from five candidate groups in thefinal 55K array
Resource Category Number of SNPs in 55K array
I. Genome Re-sequencing of eight breeds
White-feathered 12,555
Yellow-feathered 3940
Cyan-shank Partridge Chicken 2724
II. SNPs based on GWAS of 15 traits 5980
III. SNPs on the candidate genes 7630
IV. SNPs related to RFI 943
V. SNPs from chicken SNPdb 18,412
Total 52,184
Table 4 Summary of the SNPs effect prediction in 55K array
Item Count Percent (%)
Total number of SNPs in the panel 52,184
Annotation possible 52,108 99.85
intergenic variant 16,106 30.86
intron variant 25,275 48.43
intron variant & noncoding transcript variant 3981 7.63
missense variant 590 1.13
missense variant & splice region variant 13 0.02
synonymous variant 1601 3.07
Splicing 187 0.36
start/stop gained/lost/retained 12 0.02
3 prime UTR variant 1358 2.60
5 prime UTR variant 229 0.44
upstream gene variant (1 kb) 871 1.67
downstream gene variant (1 kb) 1014 1.94
noncoding transcript exon variant 871 1.67
Liu et al. BMC Genomics (2019) 20:410 Page 4 of 12

characteristic of meat-types) were located relatively closeto each other compared to egg-type breeds and commer-cial broilers. The commercial layer White Leghornchickens were placed relative far away from to the Chin-ese local breeds and commercial broilers in Fig. 4.The linkage disequilibrium (LD) in Jingxing-Huang
chicken and Cobb paternal line chicken were calculated,respectively. Figure 5 a and b shows the LD decay of theJingxing-Huang and Cobb paternal lines for chromo-some 1 and 2, respectively. The average levels of LD
between adjacent SNPs in Jingxing-Huang breeds ofchromosome 1 is 0.61 and for chromosome 2 is 0.58,whereas in the Cobb line these LD levels are 0.56 and0.46, respectively. The mean LD level decay is around0.22 in 40 Kb. The r2 of LD in the Jingxing-Huangchickens are larger than that in Cobb paternal line. Add-itional file 6 and Additional file 7 showed the r2 of LDdecreasing with the increased SNPs distance in the twopopulations in whole genome level.
DiscussionThe 52.18 K SNPs selection was performed in fourgroups and NCBI SNPdb using several criteria. The first
Fig. 2 The chromosome-wise SNP density of the 55K SNP array. Chromosome length shows in left axis (based on galGal-5) and SNP densityshows in right axis
Fig. 3 The comparison of the overlap of the SNP positions amongAffy 55K array, Affy 600 K array and Illumina 60 K array
Table 5 Number of polymorphic loci in local breeds andintroduced lines
Breeds Average Call Rate (%) Polymorphic locia Mean MAFb
Chahua 97.56 42.3 K 0.242
Qingyuan 97.00 45.2 K 0.267
Wenchang 97.10 46.5 K 0.277
Luhua 97.21 44.4 K 0.261
Liyang 97.23 40.4 K 0.229
Dagu 97.46 43.7 K 0.253
Bai’er 97.36 40.0 K 0.222
Xianju 97.13 40.1 K 0.235
Silkie 97.03 45.0 K 0.258
Hubbard 97.88 46.1 K 0.269
Cobb 98.70 45.2 K 0.237
White Leghorn 97.99 43.5 K 0.249aMAF > 0.05,bAcross all 52.2 K loci
Liu et al. BMC Genomics (2019) 20:410 Page 5 of 12

Fig. 4 Results of multidimensional scaling analysis of 12 breeds/lines. The scatters show the individuals’ position in the MDS plot, different colorsrepresent different breeds/lines
Fig. 5 The LD decay plots. (a). from the Cobb and Jingxing-Huang (JXH) chickens in chromosome 1; (b). from Cobb and JXH chickens inchromosome 2
Liu et al. BMC Genomics (2019) 20:410 Page 6 of 12

group includes 140 K SNPs screened in genome se-quences of eight Chinese local and commercial chickens.The Beijing-You chicken and Guangxi Sanhuang chickenare representative of Chinese yellow-feathered chickens,which possess excellent meat quality and flavor [17].Two Cyan-shank partridge lines possess meat flavor andappearance that are usually chosen by consumers. TheJingxing-Huang line is widely used in local breeding pro-grams because of its dwarfism, feed-saving andspace-saving characteristics [18]. The Cobb paternal lineis a type of fast-growing line. The Recessive Whitechicken is a fast-growing line, which is popular in Chin-ese breeding programs because it can improve thegrowth rate of commercial generations without changingthe appearance of offspring, when crossed with local col-orful breeds. The SNPs with high ΔF between the localbreeds and the commercial lines were used to determinethe polymorphisms that have a larger difference in allelicfrequency between breeds/lines. The main aim ofwhole-genome sequencing of different chicken breeds isto detect SNPs, although the pooled sequencing mightgenerate potential bias.The second, third and fourth groups are those poten-
tially associated with economic traits, including 7.42 KSNPs associated with weight, carcass, immune and meatquality traits, 15.98 K SNPs for breast muscle, body fat,reproduction etc. Improving feed efficiency is an import-ant goal in poultry industry to reduce costs. RFI wasconsidered independent of body weight and weight gain,selection for RFI would improve the feed efficiency with-out changing the economic traits [19]. For special inter-ests, 4.32 K SNPs were selected from a whole genomicsequencing research of low- and high- RFI Cobb andBeijing-You chickens. The strategy for the first selectionof SNPs in candidate genes for the array is that theseSNPs have a higher potential to be in LD to the causa-tive SNPs for the target traits. Finally, the last 18.41 KSNPs were selected from chicken SNPs database tomake all SNPs cover the whole genome evenly. Theaverage distance among SNPs are 22 kb generally (Fig.2). Due to specific selection on immune related genes, ahigh SNP density in chromosome 16 is observed. Basedon the limited known information and substandard as-sembly (galGal-5.0) of the micro-chromosomes, wewould not obtain SNPs of insufficient quality in themicro-chromosomes. In summary, the setting of the al-gorithm was to select SNPs with relevant function andeven distribution across the genome in terms of physicaldistance and obtained the representation of SNPs inlocal or commercial breeds.When comparing to the Affy 600 K array, there are
24,227 SNPs that do overlap with the 55K array whichaccounts for 46%. The reason for this high percentage ofoverlap is that the 18.41 K SNPs for filling the gaps in
the whole chicken genome were selected from chickenSNPdb, and the probe validated SNPs hold a high prior-ity. This result showed that there were 21,41 K newSNPs included on the Affy 55K array compared to thetwo existing arrays. The results indicate that imputationof the 55K genotyping data to the high-density SNPsgenotyping data is possible. In the new 55K genotypingarray, 69% of SNPs are within genes (non-intergenicvariant), the proportion is higher than the proportion inthe Affy 600 K array (54%), and lower than the propor-tion in Illumina 60 K array (86%).To investigate the ability of our 55K panel to detect
polymorphisms and population structure in local orcommercial breeds/lines. Nine Chinese local breeds(Chahua, Dagu, Liyang, Luhua, Qingyuan, Silkie,Wenchang, Bai’er, and Xianju) and 3 commercial lines(Hubbard, Cobb, and White Leghorn) were tested. Theaverage call rate for each breed ranged from 97.0% to98.7%. Across all populations, 76.7% to 88.0% SNPs werepolymorphic (Table 5), which indicates that the 55Kgenotyping array can be used to determine genetic vari-ation both in various local Chinese breeds and in com-mercial meat-type and egg-type breeds.According to the results of MDS analysis (Fig. 4), indi-
viduals originating from the commercial broilers, Hub-bard and Cobb clustered together tightly and the twoChinese indigenous egg-type breeds, Xianju and Bai’er,clustered together. It might be due to the fact that thetwo breeds were selected in the same direction [1]. Thisresult was supported by the previous study on the gen-etic diversity of Chinese domestic fowls by mtDNA ana-lyzing: the inter-population net nucleotide divergence(Da) between Xianju and Bai’er was 1.006, which waslower than the Da (1.115) between Xianju and Daguchickens [20]. The remaining local breeds (mainly char-acteristic of meat-types) were located relatively close toeach other compared to egg-type breeds and commercialbroilers. The commercial layer White Leghorn chickenswere placed relative far away from to the Chinese localbreeds and commercial broilers. The relative proximityof Chinese local meat-type chicken and Chineseegg-type chicken in the MDS plot might be due to theirshared region and ancestry. Thus, the MDS results werein agreement with the existing knowledge of the lines/breeds and were also in similar to the previous studies,which showed phylogenetic relationships among differ-ent chicken breeds [1].The linkage disequilibrium (LD) in the
Jingxing-Huang breeds and Cobb paternal line were cal-culated and compared. The mean LD level decay toaround 0.22 in 40 Kb. This result is similar with the re-sult of Fu et al. in 2015 [21]. The r2 of LD in theJingxing-Huang breed is larger than that in Cobb pater-nal line. The Jingxing-Huang is an inbred line has a
Liu et al. BMC Genomics (2019) 20:410 Page 7 of 12

relatively small effective population size whereas theCobb paternal line is three to four times larger.In China, indigenous yellow-feathered chickens are
highly diverse (more than 100 local breeds and 70crosses). The major obstacle in applying genomic selec-tion for improvement of local breeds is the cost of geno-typing array. The 55K array has a medium SNPs density,cost-efficient, and optimal for Chinese local breeds com-pared with the existing 600 K commercial array. Further-more, the 55K genotyping array incorporated knownSNPs loci that possess a high potential for associationwith economic traits and traits that are expensive anddifficult to measure, which will be interesting for bothGWAS and genomic selection (GS) projects.With the rapid development of next-generation se-
quencing technologies and reduction of the costs, geno-typing with re-sequencing (IBS) will be the focus offuture research. In the current phase, however, the IBSsystem is more complex and not as solid as the SNParray. The array genotyped data can be easily analyzedand standardized according to constant array SNP posi-tions. The batch effect can be excluded by different la-boratories and companies.
ConclusionsIn conclusion, we developed Affy 55K genotyping arraythat was designed to use SNPs that are segregated inChines local chicken breeds and commercial lines/breeds, and where large number of SNPs are associatedwith economic traits. Compared to the existing Affy 600K and Illumina 60 K arrays, 21,41 K new SNPs were in-cluded in the 55K SNP array. The results from the ourAffy 55K genotyping array can be imputed to thehigh-density SNPs genotyping data. This array offerswide range of potential applications, such as the evalu-ation of germplasm resources of chicken breeds, investi-gation of diversity of different chicken breeds,implementation of genome-wide association studies andgenomic selection.
MethodsAnimalsFor whole genome sequencing, the 384 chickens weresampled from eight local breeds or inbred lines (Table1). Chickens were supplied by Institute of Animal Sci-ences in CAAS (local breed Beijing-You, inbredJingxing-Huang line), Jiangsu Lihua Co. Ltd. (Cyan--shank Partridge lines with fast and mediate growth rates,respectively), Institute of Poultry Sciences of CAAS(Sanhuang chicken and Recessive White chicken), Xin-guang Nongmu Co. Ltd. (paternal and maternal line ofCobb in parental generation). In addition, a set of 15 to21 chickens in each breed/line were used for SNP arrayevaluation, which were sampled from 9 local breeds and
3 commercial lines. Chickens were supplied by the Insti-tute of Poultry Sciences of CAAS (Bai’er chicken, Cha-hua chicken, Dagu chicken, Liyang chicken, Qingyuanchicken, Silkie, Wenchang chicken, Luhua chicken andXianju chicken), Xinguang Nongmu Co. Ltd. (paternallines in parent generation from Cobb and Hubbard), theInstitute of Animal Sciences of CAAS (White Leghorn).Two groups with 87 and 100 chickens fromJingxing-Huang and Cobb were also used for SNP arrayevaluation. The blood samples used in this study wereall collected from chickens under the veterinary supervi-sion and the Guidelines for Experimental Animals estab-lished by the Ministry of Science and Technology(Beijing, China), and with the approval of Animal EthicsCommittee of the Institute of Animal Sciences. No an-aesthesia or euthanasia methods were used. There wasno evidence at health examination that any of the in-volved chickens had clinical diseases caused by thesampling.
Whole genome re-sequencingGenomic DNA was isolated from blood samples by thephenol-chloroform method. Samples DNA quality werevalidated by gel electrophoresis and Nanophotometer.The individual DNA samples (48 from each breed/line)were pooled to construct three libraries, with each li-brary containing 8 males and 8 females. The librarieswere constructed using the Nextera DNA Library Prep-aration Kit (Illumina Inc., San Diego, CA) according tothe manufacturer’s standard protocol. All libraries weresequenced on the Illumina Hiseq2500 (2 × 125 bp).
Genome sequence alignment and detection of the firstgroup of candidate SNPsReads were filtered for low quality (> 10 consecutive nu-cleotides with Phred scores < 10), adaptor sequences,and sequences without a quality control-passed pairedread using NGSQC toolkit (v2.3.3) [22]. Each trimmedpool sequencing coverage are shown in Table S5. Fil-tered sequenced reads were mapped to the referencegenome (Gallus_gallus_4.0) by BWA software (v0.7.10)[23]. PCR duplications were removed with -rmdup argu-ment in Samtools (version 0.1.1.18) [24]. SNPs wereidentified and genotyped for each data set with mpileupfunction in Samtools, then called by VarScan [25]. Onlythose highly confident variants supported by bothmethods were kept for downstream analyses. The SNPscalling details parameter were described by Liu et al[16]. The SNPs with MAF < 0.05 and the INDELs ineach breed/line were filtered by vcftools [26]. InBeijing-you chicken, Jingxing-Huang chicken, Sanhuangchicken, and the two lines of cyan-shank partridgesminus the MAFs of Cobb paternal line, as well as theMAFs of Recessive White chicken, and the paternal and
Liu et al. BMC Genomics (2019) 20:410 Page 8 of 12

maternal generation of Cobb minus the MAFs ofBeijing-You chicken, respectively. The SNPs with low ΔFwere excluded. The value of ΔF was adjusted for 140 KSNPs reserved in local breeds and commercial lines togenerate the first group of candidate SNPs. The thresh-old of △F in local breeds and commercial lines are 0.609and 0.731, respectively. The SNPs acquired through gen-ome re-sequencing of eight breeds/lines supplied themajor data for the first group of SNPs in the array. SNPsspecific for chromosome W were removed and were notconsidered in current designing. There are also 25INDELs for special interest, which were defined as pri-ory 1.
Selection of the second group of candidate SNPs basedon GWAS analysis of 15 traitsThe second group of candidate SNPs was selected ac-cording to a GWAS analysis of 15 traits. Phenotype andgenotype data were generated from the CAAS chickenF2 resource population as described in Sun’s report [27].Briefly, the population was derived from a cross betweenlocal Beijing-You chickens and commercial Cobbbroilers (Cobb-Vantress, Inc.). The weight, carcass, im-mune and meat quality traits were measured from 367F2 chickens. The 15 traits were as follows, (a.) bodyweight of day 28 and day 42, (b.) carcass traits includingtotal weight percentage after slaughtering, breast muscleweight percentage, leg muscle weight percentage, ab-dominal fat percentage, (c.) meat quality traits includingthe breast muscle intramuscular fat ratio, ultimate pH(24 h), meat lightness, redness value and yellownessvalue of breast muscle, (d.) immune traits including IgYlevel to sheep red blood cell, the heterophil and lympho-cyte ratio, IgY level in serum, and the average red bloodcell backlog.SNPs were genotyped by using Illumina 60 K SNP
Bead chip for chicken [9]. All description of the pheno-types had been reported by Sun et al. in 2013 [27]. Tomaximize the polymorphism resources for SNP array,the GLM procedures were used for the GWAS analysisand was performed by PLINK software (version 1.07)[28] with 42,585 SNPs passed quality control. The detailswere described by Sun et al. [27]. The SNPs with top 1%lowest p-values were used in the following procedures.
Selection of the third group of candidate SNP based onthe associated genes for target traitsKnown candidate genes for economic traits were col-lected and used for the SNP array design. All genes wereidentified through previous researches by our group [12,13, 29, 30]. We retrieved total 861 genes related to skel-etal muscle and intramuscular fat development, chickenfat metabolism, salmonella enteritidis resistance etc.(Additional file 2). The SNPs were annotated by the
Ensembl tool VEP [31]. Mutations and the SNPs in theexons, splicing region, and UTRs were firstly selectedout. A maximum of 5 candidate SNPs were selected outfor each gene.In addition, the SNPs in this group also included a
batch SNPs detected from a set of capture sequencing ofChr. 11, Chr. 16, and Chr. 19 of White Leghorns andBeijing-You chickens with low or high serum IgY (Liu etal., unpublished, Supplement Table S3).
Selection of the fourth group of candidate SNPs for RFIThe fourth group candidate SNPs were selected from awhole genomic re-sequencing research of low- and high-RFI Cobb and Beijing-You chickens. SNPs calling resultsshowed that 8,505,214 and 8,479,041 single nucleotidepolymorphisms (SNPs) were detected in low- andhigh-RFI Beijing-You chickens, respectively; 8,352,008and 8,372,769 SNPs were detected in low- and high-RFICobb chickens, respectively. The SNPs with Fst value <5% in each breed were excluded followed by SNPs withmean ΔF < 0.35 between low- and high-RFI chickens.Through the above filtering processes, 3.74 K SNPsassigned to 1137 candidate genes in Beijing-You chick-ens and 0.58 K SNPs (448 genes) in Cobb chickens werereserved [16].
Selection of the SNPs from chicken SNPs databaseThe first four groups cannot cover the whole genomeevenly. In the fifth group, SNPs were selected fromchicken SNPs database from NCBI (ftp://ftp.ncbi.nih.gov/snp/organisms/archive/chicken_9031/).
SNP screening according to the scoring of probesAll the SNPs’ positions were transformed fromWASHUC2.1 (Illumina 60 K), and Gallus_gallus-4.0(Affy 600 K) to Gallus_gallus-5.0 (Affy 55 K) by the Lift-Over tool on UCSC Genome Browser. Take utility of allSNPs from the five candidate groups above, in silico val-idation, was performed using the AxiomGTv1 algorithmof APT, which generated an output score file containingp-convert values, signifying the SNP array quality andlist of recommended and non-recommended SNPprobes. For a high-quality SNP array design,non-recommended SNP probes were all excluded in thefollowing procedure.
SNPs selection procedure for the final 55K arrayThe final SNPs selection was done in multiple stepsusing several criteria. The roadmap is shown in Fig. 1.A custom-made algorithm was applied as described
below. According to the Gallus_gallus-5.0, the chickengenome length is about 1.2 Gb. To ensure the probeposition evenly distributed in the chicken genome, thewhole genome was distributed by windows with 22 Kb
Liu et al. BMC Genomics (2019) 20:410 Page 9 of 12

length. The backward window started from the probeposition of the forward probe position. The selection ofthe final array was performed on each chromosome sep-arately. The first four groups SNPs were divided as 2 pri-orities. The SNPs in group 2, group 3, group 4, and theINDELs in group 1 were defined as priority 1, and theSNPs in group 1 were defined as priority 2.
1. a) The selection of the SNPs in priority 1. If there isno SNP in a 22 kb window, the window will bereserved. b) If there are one or two SNPs in thewindow, the SNP(s) was reserved. c) If there are 3or more SNPs in a window, only 2 SNPs in thiswindow will be reserved, which can make the SNPseven distributed in this window according to thefollowing formula. SD2=ðS−xÞ2þðNi−xÞ2þðN j−xÞ2þðE−xÞ2
4 . In the formula above,the S and E are the start position and the endposition of the window respectively; and Ni and Nj
are the target SNPs position in the window. TheSNPs Ni and Nj which can minimum the SD2, willbe reserved.
2. The selection of priority 2 SNPs. The windowsreserved 1 or 2 SNPs will be skipped. The windowswithout SNP will be filled by one SNP of priority 2according to the formula described above.
3. The windows without any SNP will be filled by 1SNP from the NCBI SNPdb of chicken, while thevalidated SNPs will have a priority for filling.
The final array contains 55K probes for 52 K SNPs,which were manufactured by Affymetrix® using photo-lithography. The redundant probes are used for interro-gating each SNPs [32, 33]. The final 52 K SNPs wereannotated by the online tool Ensembl VEP [34].
The comparisons of the 55K Affy array with the existingarrays (Affy 600 K array, and Illumina 60 K)All the SNPs’ positions were transformed fromWASHUC2.1 (Illumina 60 K), Gallus_gallus-4.0 (Affy600 K) and Gallus_gallus-5.0 (Affy 55 K) to GRCg6a bythe LiftOver tool on UCSC Genome Browser. All theSNP positions of the three genotyping arrays were com-pared. The SNPs on 600 K array and 60 K array werealso performed by Ensembl VEP [31]. Overlapping Vennplot was performed by the Calculate and draw customVenn diagrams website (http://bioinformatics.psb.ugent.be/webtools/Venn/).
Validation of the 55K array in 13 chicken breeds/linesThe genomic DNA from 12 breeds/lines (Chahua, Dagu,Liyang, Luhua, Qingyuan, Silkie, Wenchang, Bai’er, andXianju, Hubbard, Cobb, and White Leghorn) and two lines
with larger populations (Jingxing-Huang and Cobb) wereisolated as mentioned above. The genotyping was done onAxiom® arrays using the Affymetrix® GeneTitan® system ac-cording to the procedure described by Affymetrix (https://assets.thermofisher.com/TFS-Assets/LSG/manuals/702899_PI.pdf) in the Beijing Compass Biotechnology Co., Ltd.(Beijing, China).Basic genotype statistics for each marker, including call
rate, MAF, Hardy-Weinberg Equilibrium (HWE), alleleand genotype counts were calculated using the QualityAssurance Module from the SNP Variation Suite version7 (SVS; Golden Helix Inc., Bozeman, Montana: www.goldenhelix.com). The following quality control criteria(filtering) were used to remove SNPs with less than 95%call rate for further analysis. The SNPs with less than0.05 MAF. SNPs were tested for HWE (P < 0.001) toidentify possible typing error. Samples with more than10% missing genotypes were removed from the study.The MDS was performed using the genotype data of
the SNPs from the 55K panel on all the breeds samples(n = 226) to assess the utility of the panel in detectingpopulation structure. Population structure between 12breeds was carried out using PLINK software (version1.90b3) [28] with the MDS method on, and the plot wasperformed by ggplot2 [35]. The linkage disequilibrium in2 populations were performed by the GAPIT [36]. TheLD decay plot performed by PopLDdecay software arepresented as whole genome levels and as chromosomelevels with the parameter of smaller break point size of 5Kb and bigger break point size of 40 Kb [37].
Additional files
Additional file 1: The summary of each sequencing pools. The raw readsnumber, clean reads number, sequencing depth, Q30 percentage, andcoverage et al. for each sequencing library were provided. (XLSX 14 kb)
Additional file 2: The second group of SNPs which related to theeconomic traits. The locus and the p-value of SNPs which related to 15economic traits were provided. (XLSX 998 kb)
Additional file 3: The third group of SNPs which related to 861candidate genes. The information of 861 candidate genes and 118.4 KSNPs selected were provided. (XLSX 6645 kb)
Additional file 4: The third group of SNPs which related to serum IgY.The loci and allele information of 0.8 K SNPs related to serum IgY wereprovided. (XLSX 32 kb)
Additional file 5: The loci information for the 55K array. The loci, alleleinformation, SNPs frequencies in each breed/line, and overlapinformation were provided. (XLSX 7761 kb)
Additional file 6: The LD decay in whole genome level in Cobbpopulation. (JPEG 653 kb)
Additional file 7: The LD decay in whole genome level in Jingxing-Huang population. (JPEG 578 kb)
AbbreviationsCAAS: Chinese Academy of Agricultural Sciences; Chr: Chromosome;Da: inter-population net nucleotide divergence; GLM: general liner model;GWAS: Genome-Wide Association Study; HWE: Hardy-Weinberg Equilibrium;INDEL: insert/deletion.; LD: Linkage Disequilibrium; MAF: Minor Allele
Liu et al. BMC Genomics (2019) 20:410 Page 10 of 12

Frequency; MDS: Multidimensional Scaling; QTL: Quantitative Traits Loci;RFI: Residual Feed Intake; SNP: Single Nucleotide Polymorphism;UTRs: Untranslated Regions; VEP: Variant Effect Predictor
AcknowledgmentsWe would like to thank the Institute of Poultry Sciences of Chinese Academyof Agriculture Sciences, Jiangsu Lihua Co. Ltd. and Xinguang Nongmu Co.Ltd. for the provision of chicken samples. We would like to thank Prof.Jianfeng Liu (China Agricultural University) and Dr. Huamiao Liu (Institute ofSpecial Animal and Plant Sciences of CAAS) for their help on the SNPselection work, and Prof. Martien AM Groenen (Wageningen University &Research) for his good comments and suggestions on the manuscript.
FundingThe design of the study and collection of data were supported by theNational Key Technology R&D Program (2015BAD03B03); the collection,analysis and interpretation of data were supported by the earmarked fundfor the modern agro-industry technology research system (CARS-41) andAgricultural Science and Technology Innovation Program (ASTIP-IAS04;ASTIP-IAS-TS-15); the interpretation of data and writing the manuscript weresupported by the National Nonprofit Institute Research Grant (2017ywf-zd-2).
Availability of data and materialsThe whole genome sequencing clean data reported in this paper have beendeposited in the Genome Sequence Archive [38] in BIG Data Center [39]under accession number CRA001289 which can be publicly accessed athttp://bigd.big.ac.cn/gsa.
Authors’ contributionsRRL contributed to the design and performing of the study, the analysis andinterpretation of data and writing of the manuscript. SX contributed to thedata analysis, SNPs selection, and manuscript writing. JW contributed to thedata analysis. RC contributed to the manuscript writing. MQZ, HXC, and QHLcontributed to the sample and data collection. GPZ and JW contributed tothe design of the study and interpretation of data. All authors submittedcomments on the draft, read, and approved the final manuscript.
Ethics approval and consent to participateAll experimental procedures with chickens were performed according to theGuidelines for Experimental Animals established by the Ministry of Scienceand Technology (Beijing, China). Ethical approval on animal survival wasgiven by the animal ethics committee of the Institute of Animal Sciences(IAS), Chinese Academy of Agricultural Sciences (CAAS, Beijing, China) withthe following reference number: IASCAAS-AE-03.
Consent for publicationNot applicable.
Competing interestsThe authors declare that they have no competing interests.
Publisher’s NoteSpringer Nature remains neutral with regard to jurisdictional claims inpublished maps and institutional affiliations.
Author details1Institute of Animal Sciences, Chinese Academy of Agricultural Sciences, No.2 Yuanmingyuan West Road, Beijing 100193, People’s Republic of China.2Animal Breeding and Genomics, Wageningen University & Research,Wageningen, The Netherlands. 3State Key Laboratory of Animal Nutrition,Ministry of Agriculture and Rural Affairs, Beijing 100193, People’s Republic ofChina. 4Key Laboratory of Animal (Poultry) Genetics Breeding andReproduction, Ministry of Agriculture and Rural Affairs, Beijing 100193,People’s Republic of China.
Received: 21 July 2018 Accepted: 25 April 2019
References1. Resources CNCoAG: animal genetic resources in China: poultry: China
agriculture press; 2011.
2. Ramos AM, Crooijmans RP, Affara NA, Amaral AJ, Archibald AL, Beever JE,Bendixen C, Churcher C, Clark R, Dehais P. Design of a high density SNPgenotyping assay in the pig using SNPs identified and characterized bynext generation sequencing technology. PLoS One. 2009;4(8):e6524.
3. Matukumalli LK, Lawley CT, Schnabel RD, Taylor JF, Allan MF, Heaton MP,O'Connell J, Moore SS, Smith TP, Sonstegard TS. Development andcharacterization of a high density SNP genotyping assay for cattle. PLoSOne. 2009;4(4):e5350.
4. Dash S, Singh A, Bhatia A, Jayakumar S, Sharma A, Singh S, Ganguly I, DixitS. Evaluation of bovine high-density SNP genotyping Array in indigenousdairy cattle breeds. Anim Biotechnol. 2017:1–7.
5. Anderson R. Development of a high density (600K) Illumina ovine SNP Chipand its use to fine map the yellow fat locus. Plant & Animal Genome. 2014.
6. Houston RD, Taggart JB, Cézard T, Bekaert M, Lowe NR, Downing A, TalbotR, Bishop SC, Archibald AL, Bron JE. Development and validation of a highdensity SNP genotyping array for Atlantic salmon ( Salmo salar ). BMCGenomics,15,1(2014-02-14). 2014;15(1):90.
7. Iamartino D, Nicolazzi EL, Van Tassell CP, Reecy JM, Fritz-Waters ER, Koltes JE,Biffani S, Sonstegard TS, Schroeder SG, Ajmone-Marsan P. Design andvalidation of a 90K SNP genotyping assay for the water buffalo (Bubalusbubalis). PLoS One. 2017;12(10):e0185220.
8. Muir WM, Wong GK, Zhang Y, Wang J, Groenen MAM, Crooijmans RPMA,Megens HJ, Zhang HM, Mckay JC, Mcleod S. Review of the initial validationand characterization of a 3K chicken SNP array. Worlds Poultry ScienceJournal. 2008;64(2):219–26.
9. Groenen MA, Megens HJ, Zare Y, Warren WC, Hillier LW, Crooijmans RP,Vereijken A, Okimoto R, Muir WM, Cheng HH. The development andcharacterization of a 60K SNP chip for chicken. BMC Genomics. 2011;12(1):274.
10. Kranis A, Gheyas AA, Boschiero C, Turner F, Le Y, Smith S, Talbot R, Pirani A,Brew F, Kaiser P. Development of a high density 600K SNP genotyping arrayfor chicken. BMC Genomics. 2013;14(1):59.
11. Derks MFL, Megens HJ, Bosse M, Visscher J, Peeters K, Bink MCAM, VereijkenA, Gross C, Ridder DD, Reinders MJT. A survey of functional genomicvariation in domesticated chickens. Genet Sel Evol. 2018;50(1):17.
12. Liu R, Wang H, Jie L, Jie W, Zheng M, Tan X, Xing S, Cui H, Li Q, Zhao G.Uncovering the embryonic development-related proteome andmetabolome signatures in breast muscle and intramuscular fat of fast-andslow-growing chickens. BMC Genomics. 2017;18(1):816.
13. Huang HY, Zhao GP, Liu RR, Li SF, Zhao ZH, Li QH, Zheng MQ, Wen J:Expression profiles of novel genes and microRNAs involved in lipiddeposition in chicken’s adipocyte. 2017:1–6.
14. Li P, Fan W, Everaert N, Liu R, Li Q, Zheng M, Cui H, Zhao G, Wen J.Messenger RNA sequencing and pathway analysis provide novel insightsinto the susceptibility to Salmonella enteritidis infection in chickens. FrontGenet. 2018;9:256.
15. Fan W, Liu H, Zheng M, Liu R, Li Q, Wen J, Zhao G. Association of BMP15gene polymorphisms with egg laying in Wuxing-yellow chicken. ChineseJournal of Animal Science. 2015;51(11):13–8.
16. Liu J, Liu R, Wang J, Zhang Y, Xing S, Zheng M, Cui H, Li Q, Li P, Cui X, et al.Exploring genomic variants related to residual feed intake in local andcommercial chickens by whole genomic resequencing. Genes (Basel). 2018;9(2).
17. Qi KK, Chen JL, Zhao GP, Zheng MQ, † JW: Effect of dietary ω6/ω3 on growthperformance, carcass traits, meat quality and fatty acid profiles of Beijing-youchicken. Journal of Animal Physiology & Animal Nutrition 2010, 94(4):474–485.
18. Merat P. The sex-linked dwarf gene in the broiler chicken industry. WorldsPoultry Science Journal. 1984;40(1):10–8.
19. Aggrey SE, Karnuah AB, Sebastian B, Anthony NB. Genetic properties of feedefficiency parameters in meat-type chickens. Genet Sel Evol. 2010;42(1):1–5.
20. Wen-bin SJ-t BAO, Cun-bo WANG, Hong-xia ZHANG, Weigend S, Guo-hongCHEN. Investigation on genetic diversity and systematic Evolut ion inChinese domestic fowls and red jungle fowls by analyzing the mtDNAcontrol region. Acta veterinaria et zootechnica Sinica. 2008;39(11):1449–59.
21. Fu W, Dekkers JC, Lee WR, Abasht B. Linkage disequilibrium in crossbredand pure line chickens. Genet Sel Evol. 2015;47(1):11.
22. Patel RK, Jain M. NGS QC toolkit: a toolkit for quality control of nextgeneration sequencing data. PLoS One. 2012;7(2):e30619.
23. Li H, Durbin R. Fast and accurate short read alignment with burrows-wheeler transform. Bioinformatics. 2009;25(14):1754–60.
24. Li H, Handsaker B, Wysoker A, Fennell T, Ruan J, Homer N, Marth G, AbecasisG, Durbin R. The sequence alignment/map (SAM) format and SAMtools.Transplant Proc. 2009;25(1 Pt 2):1653–4.
Liu et al. BMC Genomics (2019) 20:410 Page 11 of 12

25. Koboldt DC, Chen K, Wylie T, Larson DE, Mclellan MD, Mardis ER, WeinstockGM, Wilson RK, Li D. VarScan: variant detection in massively parallel sequencingof individual and pooled samples. Bioinformatics. 2009;25(17):2283.
26. Petr D, Adam A, Goncalo A, Albers CA, Eric B, Depristo MA, Handsaker RE,Gerton L, Marth GT, Sherry ST. The variant call format and VCFtools.Bioinformatics. 2011;27(15):2156–8.
27. Sun Y, Zhao G, Liu R, Zheng M, Hu Y, Wu D, Zhang L, Li P, Wen J. Theidentification of 14 new genes for meat quality traits in chicken using agenome-wide association study. BMC Genomics. 2013;14(1):458.
28. Purcell S, Neale B, Todd-Brown K, Thomas L, Ferreira MAR, Bender D, MallerJ, Sklar P, Bakker PIWD, Daly MJ. PLINK: a tool set for whole-genomeassociation and population-based linkage analyses. Am J Hum Genet. 2007;81(3):559–75.
29. Liu J, Fu R, Liu R, Zhao G, Zheng M, Cui H, Li Q, Song J, Wang J, Wen J.Protein profiles for muscle development and intramuscular fat accumulationat different post-hatching ages in chickens. PLoS One. 2016;11(8):e0159722.
30. Cui HX, Liu RR, Zhao GP, Zheng MQ, Chen JL, Wen J. Identification ofdifferentially expressed genes and pathways for intramuscular fat depositionin pectoralis major tissues of fast-and slow-growing chickens. BMCGenomics. 2012;13(1):213.
31. Mclaren W, Gil L, Hunt SE, Riat HS, Ritchie GRS, Thormann A, Flicek P, CunninghamF. The Ensembl variant effect predictor. Genome Biol. 2016;17(1):122.
32. Gunderson K, Steemers F, G, Mendoza L, Chee M: A genome-wide scalableSNP genotyping assay using microarray technology. Nat Genet 2005, 37(5):549–554.
33. Syv, Auml AC, nen. Toward genome-wide SNP genotyping. Nat Genet. 2005;37 Suppl(37 Suppl:S5.
34. Zerbino DR, Achuthan P, Akanni W, Amode MR, Barrell D, Bhai J, Billis K,Cummins C, Gall A, Giron CG, et al. Ensembl 2018. Nucleic Acids Res. 2018;46(D1):D754–61.
35. Wickham H. ggplot2: Elegant Graphics for Data Analysis: Springer PublishingCompany, Incorporated; 2009.
36. Alexander EL, Feng T, Qishan W, Jason P, Meng L, Peter JB, Michael AG,Edward SB, Zhiwu Z. GAPIT: genome association and prediction integratedtool. Bioinformatics. 2012;28(18):2397.
37. Zhang C, Dong SS, Xu JY, He WM, Yang TL. PopLDdecay: a fast andeffective tool for linkage disequilibrium decay analysis based on variant callformat files. Bioinformatics. .
38. Wang Y, Song F, Zhu J, Zhang S, Yang Y, Chen T, Tang B, Dong L, Nan D,Qian Z. GSA: genome sequence archive. Genomics Proteomics &Bioinformatics. 2017;15(1):14–8.
39. Members BDC. Database resources of the BIG data center in 2018. NucleicAcids Res. 2018;46(Database issue):D14–20.
Liu et al. BMC Genomics (2019) 20:410 Page 12 of 12