Laenger et al., BMC System Biology 2012
14
RESEARCH ARTICLE Open Access Modeling of leishmaniasis infection dynamics: novel application to the design of effective therapies Bettina M Länger 1 , Cristina Pou-Barreto 2 , Carlos González-Alcón 3 , Basilio Valladares 2 , Bettina Wimmer 1 and Néstor V Torres 1* Abstract Background: The WHO considers leishmaniasis as one of the six most important tropical diseases worldwide. It is caused by parasites of the genus Leishmania that are passed on to humans and animals by the phlebotomine sandfly. Despite all of the research, there is still a lack of understanding on the metabolism of the parasite and the progression of the disease. In this study, a mathematical model of disease progression was developed based on experimental data of clinical symptoms, immunological responses, and parasite load for Leishmania amazonensis in BALB/c mice. Results: Four biologically significant variables were chosen to develop a differential equation model based on the GMA power-law formalism. Parameters were determined to minimize error in the model dynamics and time series experimental data. Subsequently, the model robustness was tested and the model predictions were verified by comparing them with experimental observations made in different experimental conditions. The model obtained helps to quantify relationships between the selected variables, leads to a better understanding of disease progression, and aids in the identification of crucial points for introducing therapeutic methods. Conclusions: Our model can be used to identify the biological factors that must be changed to minimize parasite load in the host body, and contributes to the design of effective therapies. Background The WHO considers leishmaniasis as one of the six most important tropical diseases worldwide [1]. It is caused by parasites of the genus Leishmania that are passed to humans and animals by sandflies of the sub- family Phlebotominae [2]. Leishmaniasis, which is ende- mic in 88 countries, has an annual incidence of two million cases and is estimated to cause over 50,000 deaths per year [3]. The disease has three main forms: cutaneous leishmaniasis, mucocutaneous leishmaniasis and visceral leishmaniasis. Visceral leishmaniasis, the most severe form of the disease, is also known as “kala azar” , “ black fever ” or “ dumdum fever ” . It especially affects hosts with weak immune systems, such as children or adults suffering from malnutrition or HIV. The human immune response that limits leishmaniasis is mediated by Th1 cells that activate macrophages to kill the parasite (cellular immunity). When cellular immunity is deficient, an expansion of Th2 cells occurs which allows the parasite to survive within the mono- cytes and fosters disease development [4]. After an incu- bation period that varies from ten days to two years [3], typical symptoms are fever, diarrhea, body weight loss, lymphadenopathy, hepatomegaly and splenomegaly. Despite all of the current research, there is still a lack of understanding about the metabolism of the parasite and disease progression. Mathematical modeling of the processes involved in parasite-host interactions has become a necessary tool in the study of diseases, leishmaniasis being no excep- tion. A significant part of the modeling work in this field is epidemiological [5-7]. In addition, models have also been used to study regulation of gene expression, * Correspondence: [email protected] 1 Grupo de Tecnología Bioquímica. Departamento de Bioquímica y Biología Molecular. Universidad de La Laguna. 38206. San Cristóbal de La Laguna. Tenerife. Spain Full list of author information is available at the end of the article Länger et al. BMC Systems Biology 2012, 6:1 http://www.biomedcentral.com/1752-0509/6/1 © 2012 Länger et al; licensee BioMed Central Ltd. This is an Open Access article distributed under the terms of the Creative Commons Attribution License (http://creativecommons.org/licenses/by/2.0), which permits unrestricted use, distribution, and reproduction in any medium, provided the original work is properly cited.
Transcript of Laenger et al., BMC System Biology 2012
RESEARCH ARTICLE Open Access
Modeling of leishmaniasis infection dynamics:novel application to the design of effectivetherapiesBettina M Länger1, Cristina Pou-Barreto2, Carlos González-Alcón3, Basilio Valladares2, Bettina Wimmer1 andNéstor V Torres1*
Abstract
Background: The WHO considers leishmaniasis as one of the six most important tropical diseases worldwide. It iscaused by parasites of the genus Leishmania that are passed on to humans and animals by the phlebotominesandfly. Despite all of the research, there is still a lack of understanding on the metabolism of the parasite and theprogression of the disease. In this study, a mathematical model of disease progression was developed based onexperimental data of clinical symptoms, immunological responses, and parasite load for Leishmania amazonensis inBALB/c mice.
Results: Four biologically significant variables were chosen to develop a differential equation model based on theGMA power-law formalism. Parameters were determined to minimize error in the model dynamics and time seriesexperimental data. Subsequently, the model robustness was tested and the model predictions were verified bycomparing them with experimental observations made in different experimental conditions. The model obtainedhelps to quantify relationships between the selected variables, leads to a better understanding of diseaseprogression, and aids in the identification of crucial points for introducing therapeutic methods.
Conclusions: Our model can be used to identify the biological factors that must be changed to minimize parasiteload in the host body, and contributes to the design of effective therapies.
BackgroundThe WHO considers leishmaniasis as one of the sixmost important tropical diseases worldwide [1]. It iscaused by parasites of the genus Leishmania that arepassed to humans and animals by sandflies of the sub-family Phlebotominae [2]. Leishmaniasis, which is ende-mic in 88 countries, has an annual incidence of twomillion cases and is estimated to cause over 50,000deaths per year [3]. The disease has three main forms:cutaneous leishmaniasis, mucocutaneous leishmaniasisand visceral leishmaniasis. Visceral leishmaniasis, themost severe form of the disease, is also known as “kalaazar”, “black fever” or “dumdum fever”. It especiallyaffects hosts with weak immune systems, such as
children or adults suffering from malnutrition or HIV.The human immune response that limits leishmaniasisis mediated by Th1 cells that activate macrophages tokill the parasite (cellular immunity). When cellularimmunity is deficient, an expansion of Th2 cells occurswhich allows the parasite to survive within the mono-cytes and fosters disease development [4]. After an incu-bation period that varies from ten days to two years [3],typical symptoms are fever, diarrhea, body weight loss,lymphadenopathy, hepatomegaly and splenomegaly.Despite all of the current research, there is still a lack ofunderstanding about the metabolism of the parasite anddisease progression.Mathematical modeling of the processes involved in
parasite-host interactions has become a necessary toolin the study of diseases, leishmaniasis being no excep-tion. A significant part of the modeling work in thisfield is epidemiological [5-7]. In addition, models havealso been used to study regulation of gene expression,
* Correspondence: [email protected] de Tecnología Bioquímica. Departamento de Bioquímica y BiologíaMolecular. Universidad de La Laguna. 38206. San Cristóbal de La Laguna.Tenerife. SpainFull list of author information is available at the end of the article
Länger et al. BMC Systems Biology 2012, 6:1http://www.biomedcentral.com/1752-0509/6/1
© 2012 Länger et al; licensee BioMed Central Ltd. This is an Open Access article distributed under the terms of the Creative CommonsAttribution License (http://creativecommons.org/licenses/by/2.0), which permits unrestricted use, distribution, and reproduction inany medium, provided the original work is properly cited.
protein synthesis, and metabolism of the parasite at thegenome-wide level [8-10]. The dynamics of parasite-hostinteractions in the infection process has also been stu-died using agent-based modeling approaches [11-13].For example, Dancik et al. [13] used an agent-based sto-chastic model of the immune response of mice to L.major infection to identify parameters that are impor-tant in changing the dynamics of the infection process,and to quantify the influence of those parameters. Theauthors showed that increasing parasite growth ratedecreases pathogen load in some circumstances.There are many studies regarding the biology, epide-
miology and immunology of leishmaniasis [5,6,14,7,15],yet there are fewer studies related to the evolution ofthe infection in animal models. A significant referencefor the latter is the work of Courret et al. [16] wherelesion development, cellular response, expression ofcytokines, as well as parasite load in the spleen ofBALB/c mice infected with L. amazonensis is described.In this vein there are also the works of Arrais-Silva etal. [17] on the hypoxia-inducible factor-1 from L. ama-zonensis infection; of Lira et al. [18] on BALB/c micesymptoms, parasite load and immune response inC57BL/6 mice infected with L. major; and the work ofRequena et al. [19] and of Dea-Ayuela et al. [20] thatexplores the clinical symptoms, parasite loads and anti-body levels in susceptible, oligosymptomatic and resis-tant hamsters. The study of Requena et al. [19]compared these parameters together with lymphocytepopulation and proliferation, in two groups infectedwith different amounts of parasites and a control group.In the present work we adopted a systems biology
approach for understanding disease evolution, host-pathogen interactions, and immune response function.We performed this task by using experimental time ser-ies measurements in BALB/c mice infected with L. ama-zonensis to parameterize a mathematical model thataccounts for immune response and parasite load. Basedon this model we were able to quantify the biologicalinterrelations between variables, perform predictivesimulations, carry out sensitivity analysis to evaluate thesignificance of the system parameters, and solve an opti-mization problem for minimizing the parasite load. Thisanalysis contributes valuable information to the drugdiscovery pipeline for developing effective therapeuticmethods against leishmaniasis.
ResultsMathematical ModelExperimental measurements obtained in BALB/c micewere used to fit the parameters of the mathematicalmodel shown in Figure 1 that accounts for the progres-sion of Leishmaniasis (see Methods for details). In thepresent work we used a general power-law formulation,
the General Mass Action Power Law formalism (GMA-PL) that allows for non-integer kinetic orders [21,22]with the following structure:
vi =dXi
dt=
∑j
σijγj
∏k
Xkgjk (1)
In the above expression, Xi, sij, gj and gjk represent thenormalized variable set, the stoichiometric matrix, therate constants, and the kinetic orders, respectively. Thevariables lymphocytes proliferation (X2), IgG1 (X3) andIgG2a (X4) were normalized with respect to the respec-tive value in the control group of mice. Because thecontrol group is parasite-free, the same approach couldnot be used to normalize parasite load. In this case thevariable was normalized with respect to its own meanvalue. This standardization reduces the range of varia-tion of the parameters and computation time, and alsoexploits various properties of the GMA-PL formalismon the behavior of variables and parameters. The speci-fic numerical values for the parameters sij, gj and gjk aredetermined using prior biological knowledge, informa-tion about the basal steady-states of the system [21],and/or dynamical experimental data [22,23]. In power-law models, kinetic orders can have non-integer values.One of the main advantages of power-law models is thatthey allow for the condensation of several steps intosimplified representations [21,24,25]. The parameters ofthe model are kinetic orders and rate constants. Nega-tive values for the kinetic order represent inhibition,that is, an increase in its variable leads to a diminutionof the rate involved, while a zero indicates that the vari-able does not affect the described process. When posi-tive values are considered for a kinetic order, severalalternatives are possible: values between zero and oneimply a flux that depends on the variable in a saturat-ing-like manner. Values equal to one imply a flux thatdepends linearly on the variable or, in chemical terms, afirst order reaction. By allowing non-integer, positive ornegative, kinetic orders, we are able to consider a largerclass of kinetic models from which we can select a suita-ble candidate without changing the (original) modelstructure.Figure 1 shows the model scheme of the chosen vari-
ables and the influences among them denoted by arrowsand parameters. g1, ... , g14 stand for kinetic ordersrepresenting influences on the creation or degradationfluxes (Vi) of the four variables.The total parasite load in the host (X1) stimulates its
immune response. The parasites multiply in macro-phages by binary division. The parasite load growth (V1)has a nonlinear dependence on the parasite loadthrough the kinetic order g1. Increased parasite loadleads to a decrease in the proliferation rate of
Länger et al. BMC Systems Biology 2012, 6:1http://www.biomedcentral.com/1752-0509/6/1
Page 2 of 14
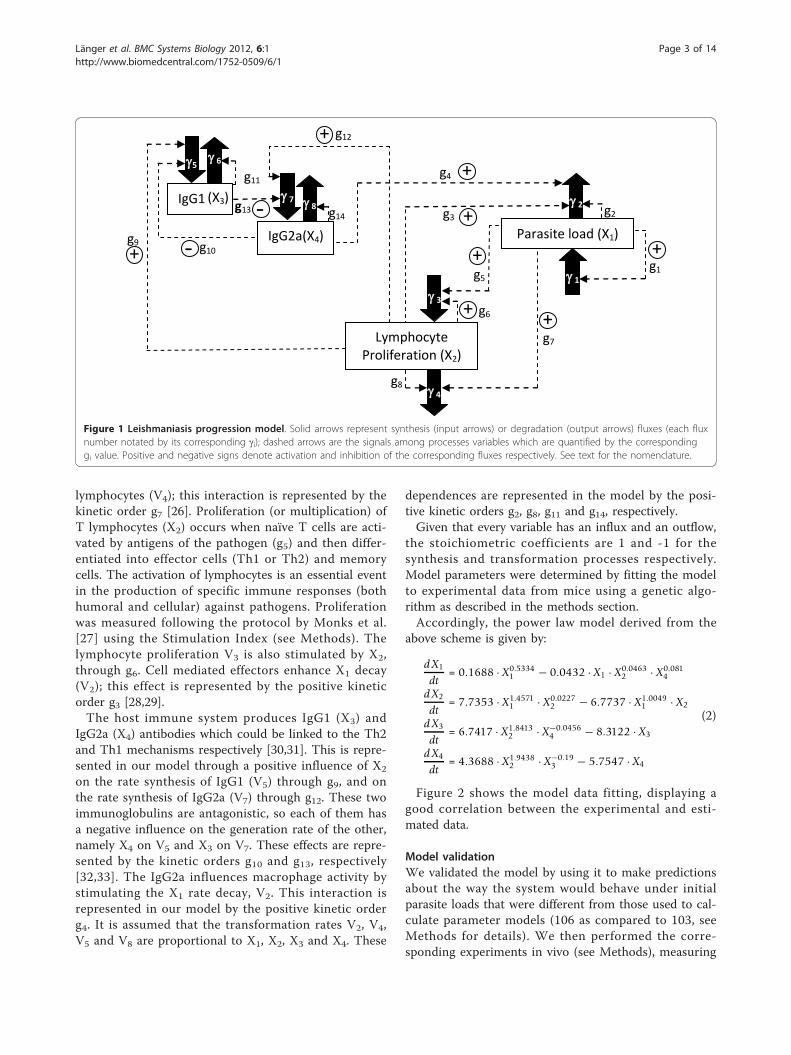
lymphocytes (V4); this interaction is represented by thekinetic order g7 [26]. Proliferation (or multiplication) ofT lymphocytes (X2) occurs when naïve T cells are acti-vated by antigens of the pathogen (g5) and then differ-entiated into effector cells (Th1 or Th2) and memorycells. The activation of lymphocytes is an essential eventin the production of specific immune responses (bothhumoral and cellular) against pathogens. Proliferationwas measured following the protocol by Monks et al.[27] using the Stimulation Index (see Methods). Thelymphocyte proliferation V3 is also stimulated by X2,through g6. Cell mediated effectors enhance X1 decay(V2); this effect is represented by the positive kineticorder g3 [28,29].The host immune system produces IgG1 (X3) and
IgG2a (X4) antibodies which could be linked to the Th2and Th1 mechanisms respectively [30,31]. This is repre-sented in our model through a positive influence of X2
on the rate synthesis of IgG1 (V5) through g9, and onthe rate synthesis of IgG2a (V7) through g12. These twoimmunoglobulins are antagonistic, so each of them hasa negative influence on the generation rate of the other,namely X4 on V5 and X3 on V7. These effects are repre-sented by the kinetic orders g10 and g13, respectively[32,33]. The IgG2a influences macrophage activity bystimulating the X1 rate decay, V2. This interaction isrepresented in our model by the positive kinetic orderg4. It is assumed that the transformation rates V2, V4,V5 and V8 are proportional to X1, X2, X3 and X4. These
dependences are represented in the model by the posi-tive kinetic orders g2, g8, g11 and g14, respectively.Given that every variable has an influx and an outflow,
the stoichiometric coefficients are 1 and -1 for thesynthesis and transformation processes respectively.Model parameters were determined by fitting the modelto experimental data from mice using a genetic algo-rithm as described in the methods section.Accordingly, the power law model derived from the
above scheme is given by:
d X1
dt= 0.1688 · X0.5334
1 − 0.0432 · X1 · X0.04632 · X0.081
4
d X2
dt= 7.7353 · X1.4571
1 · X0.02272 − 6.7737 · X1.0049
1 · X2
d X3
dt= 6.7417 · X1.8413
2 · X−0.04564 − 8.3122 · X3
d X4
dt= 4.3688 · X1.9438
2 · X−0.193 − 5.7547 · X4
(2)
Figure 2 shows the model data fitting, displaying agood correlation between the experimental and esti-mated data.
Model validationWe validated the model by using it to make predictionsabout the way the system would behave under initialparasite loads that were different from those used to cal-culate parameter models (106 as compared to 103, seeMethods for details). We then performed the corre-sponding experiments in vivo (see Methods), measuring
v6 g11
+
+
IgG1
+
+
+
+
+
-
- IgG2a(X4)
+
Lymphocyte Proliferation (X2)
Parasite load (X1)
g1
g2 g3
g4
g5
g6
g7
g8
g9 g10
g12
g13 g14 8
4
2
5
7
1
3
6
(X3)
Figure 1 Leishmaniasis progression model. Solid arrows represent synthesis (input arrows) or degradation (output arrows) fluxes (each fluxnumber notated by its corresponding gi); dashed arrows are the signals among processes variables which are quantified by the correspondinggi value. Positive and negative signs denote activation and inhibition of the corresponding fluxes respectively. See text for the nomenclature.
Länger et al. BMC Systems Biology 2012, 6:1http://www.biomedcentral.com/1752-0509/6/1
Page 3 of 14

Figure 2 Data fit and predicted model dynamics of the four model variables. The panels under Model Data Fitting shows the data fit forthe time series data of the four model variables. Panels under Predicted Model dynamics show the comparison of predicted and measuredsystem variable dynamics for an initial parasite load of 106. The continuous lines indicate the estimated dynamics while the dotted lines indicatethe experimental data. Error bars indicate the standard deviation among mice.
Länger et al. BMC Systems Biology 2012, 6:1http://www.biomedcentral.com/1752-0509/6/1
Page 4 of 14

the four variables described by the model and compar-ing their observed behavior to model predictions. Thisinitial number of parasites (which mimics a severe leish-maniasis condition) was chosen to check the modelcapacity to correctly describe the behavior in extremeand differing conditions of initial parasite load. Since themodel’s main purpose is for the design of therapeuticstrategies, a model able to describe a wide range ofparasite load dynamics is of foremost interest. Figure 2shows the results obtained. There it can be seen thatthe deviation of model prediction from the experimentaldata is reasonably good during the initial 20 weeks afterinfection (which means that new treatments are applic-able in this time period) with a parasite load of 106.Since the model describes the evolution over the first 20weeks after infection, the observed discrepancies in thetwo experimental conditions considered (model fittingand validation) can be deemed as reasonable in light ofthe associated experimental error. In this regard, wewant to stress the fact that in the experimental dataused for model verification, other elements of theimmune system may be playing a significant role notaddressed by the model, but which could be relevant inconditions of massive infection.
Sensitivity AnalysisFigure 3 shows the dynamic sensitivity analysis for thekinetic orders (gi) and rate constants (gj). The SystemParameter Dynamic Sensitivity is noted as Spk
Xi; pk isthe parameter under scrutiny and Xi is the consideredvariable (see equation 6 in Methods). As is shown, all
sensitivities have absolute values between 4·10-5 (S(g10;X2)) and 1.83 (S(g1; X1)). The lower value correspondsto the influence of g10 on the lymphocyte proliferation,and the higher value measures the influence of the rateconstant associated to the parasite multiplication rate onthe parasite load. This range of values, together with theobservation that the median of the absolute values ofsensitivities is 0.067, indicates a robust model.In general, the higher sensitivities correspond to the
variable indicated by the arrow, except for the para-meters directly influencing lymphocyte proliferation (g3,g4, g5, g6, g7 and g8). For the parasite load, sensitivitieswith absolute values greater than 1 are Sg1
X1 and Sg1X.
This implies that the generation rate of parasites, andthe effect of parasites on their own generation, stronglyinfluence parasite load. Sensitivity Sg2
X1 is much lowerthan Sg1
X1. All the other parameters yield sensitivitieswith absolute values of less than 0.1 for parasite load.The sensitivity of IgG1 and IgG2a to most of the para-meters is higher than the sensitivity of lymphocyte pro-liferation or parasite load to the same parameters. Thiscould be a consequence of the fact that most of thevalues for parameters directly influencing the parasiteload (g1, g2, g1, g2, g3, and g4) are small (< 1), as opposedto those directly influencing lymphocyte proliferation.
Systematic search of parameter profiles for theminimization of parasite loadIn order to apply the model for therapeutic purposes,we carried out a systematic search of parameter valuesthat minimize the parasite load. The aim was to discover
Figure 3 Absolute value of the system dynamic sensitivities SpkXi (Xj pk).
Länger et al. BMC Systems Biology 2012, 6:1http://www.biomedcentral.com/1752-0509/6/1
Page 5 of 14

the set of parameter values (kinetic constants, gi andrate constants, gi) that yields a reduced, minimum valueof the parasite load, both during the time of infectionevolution and at the final, 24-week stage.The search program was organized in two phases. In
the first phase, we changed only one of the parametersat a time (gi or gi), with the others maintaining their ori-ginal values. In this case the value of the candidate para-meter is initially set to 10% of the model estimatedparameter, the following to 20%, 30% and so on, untilthe parameter reaches the upper-bound range that wasassumed feasible and physiologically relevant. Then, foreach changing factor, the model solutions were calcu-lated. In order to evaluate the effectiveness of thechange in parameter value, the mean, maximal and finalparasite loads were calculated. The mean parasite loadreflects the average severity of the disease, the maximalvalue accounts for the maximal number of parasitesalong the infection dynamics (which has to be lowerthan the maximum number of parasites the organismcan bear), and the final parasite load represents the finaloutcome of the disease.
Single-parameter search for identification of optimumparameter valuesgi parameter scanningAfter a systematic search among all kinetic constants,we found that g1 and g6 were the most suitable para-meters to be changed for reducing parasite load. g1,describes the influence of parasites on their own prolif-eration and is the most significant in this regard, sincechanges in its value causes the greatest reduction. Thisis achieved by increasing g1 value from 0.53 to 3. Figure4A shows the progression of parasite load during a timeperiod of 24 weeks for values of g1 ranging from 0.01 to
3. Our model suggests that increases in g1 from itsinitial value (0.53) have a therapeutic effect, becausethey lead to a decrease in parasite load and therefore tohealing. It is important to note that for values of g1 <0.5, final parasite load is proportional to g1. However,for values of g1 > 0.5, final parasite load becomes inver-sely proportional to the value of this parameter. Thislatter region includes the actual g1 value. This impliesthat therapeutic strategies should aim to increase g1. Ifdecreases are sought, such decreases must be well below0.5 in order to have a similar effect.Figure 4B shows that the evolution of the parasite load
decreases right from the beginning, almost linearlythrough the 24-week period.At first glance this result could appear paradoxical and
certainly counterintuitive. But, in fact, the sensitivity ofg1 with respect to the parasite load (X1), Sg1
X1, is nega-tive (see Figure 2), therefore an increase in g1 shouldlead to a decrease in parasite load. This prediction holdstrue for the mean parasite load over a time period of 24weeks. However, it has been observed that both themaximum and the final value of parasite load increasein the beginning until they reach a threshold value anddecrease from that point on. Again, such a decrease inparasite load indicates that increasing g1 produces atherapeutic effect. The same result has recently beenobserved by Dancik et al. [13]. Their model showed thatincreasing parasite growth rate (V1 in our model, whichis influenced by g1) impairs the pathogen load in certainstages of the disease. Since the modeling strategy usedby Dancik et al. [13] is different from our approach,there is not a straightforward translation of the para-meters. However, there are some correlations betweentheir findings and our model predictions. In particular,their analysis [13] indicates that increasing growth rate
A B
Figure 4 Evolution of the parasite load over time for different values of g1. A. Final parasite load during a time period of 24 weeks fordifferent values of g1. The dot indicates the position of the original system (g1 = 0.53). B. Parasite load over time for g1 = 3.
Länger et al. BMC Systems Biology 2012, 6:1http://www.biomedcentral.com/1752-0509/6/1
Page 6 of 14
can, in some circumstances, suppress pathogen loads,which is what our model also predicts. Due to the parti-cular formalism we have used, we are able to point tothe increase of g1 as the mechanism that increases para-site growth rate. They reported the same evolution pat-tern in the parasite load that we found: a higher parasitegrowth rate yields a higher increase in pathogen load inthe beginning but also a higher decrease afterwards insuch a way that, as a whole, parasites are eliminated ear-lier. They observed that infection was cleared after eightweeks versus the 17-20 weeks in our model, but thiscan be attributed to the different Leishmania strain andthe lower initial parasite load (1000 versus 50). Theauthors explain this behavior by stating that a pathogenthat proliferates rapidly is more likely to be detected bythe immune system. Therefore, pathogen load decreasesas growth rate increases, with slowly replicating patho-gens persisting longer than fast growing ones.Another gi parameter with similarly minimizing effects
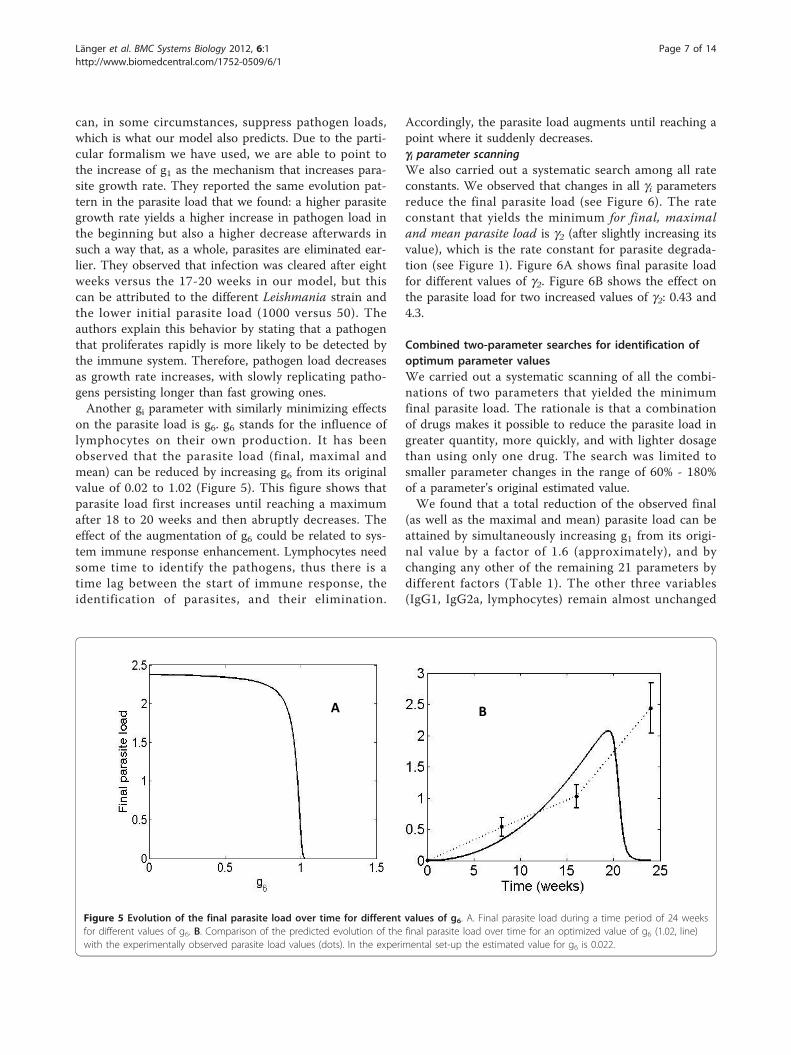
on the parasite load is g6. g6 stands for the influence oflymphocytes on their own production. It has beenobserved that the parasite load (final, maximal andmean) can be reduced by increasing g6 from its originalvalue of 0.02 to 1.02 (Figure 5). This figure shows thatparasite load first increases until reaching a maximumafter 18 to 20 weeks and then abruptly decreases. Theeffect of the augmentation of g6 could be related to sys-tem immune response enhancement. Lymphocytes needsome time to identify the pathogens, thus there is atime lag between the start of immune response, theidentification of parasites, and their elimination.
Accordingly, the parasite load augments until reaching apoint where it suddenly decreases.gi parameter scanningWe also carried out a systematic search among all rateconstants. We observed that changes in all gi parametersreduce the final parasite load (see Figure 6). The rateconstant that yields the minimum for final, maximaland mean parasite load is g2 (after slightly increasing itsvalue), which is the rate constant for parasite degrada-tion (see Figure 1). Figure 6A shows final parasite loadfor different values of g2. Figure 6B shows the effect onthe parasite load for two increased values of g2: 0.43 and4.3.
Combined two-parameter searches for identification ofoptimum parameter valuesWe carried out a systematic scanning of all the combi-nations of two parameters that yielded the minimumfinal parasite load. The rationale is that a combinationof drugs makes it possible to reduce the parasite load ingreater quantity, more quickly, and with lighter dosagethan using only one drug. The search was limited tosmaller parameter changes in the range of 60% - 180%of a parameter’s original estimated value.We found that a total reduction of the observed final
(as well as the maximal and mean) parasite load can beattained by simultaneously increasing g1 from its origi-nal value by a factor of 1.6 (approximately), and bychanging any other of the remaining 21 parameters bydifferent factors (Table 1). The other three variables(IgG1, IgG2a, lymphocytes) remain almost unchanged
A B
Figure 5 Evolution of the final parasite load over time for different values of g6. A. Final parasite load during a time period of 24 weeksfor different values of g6. B. Comparison of the predicted evolution of the final parasite load over time for an optimized value of g6 (1.02, line)with the experimentally observed parasite load values (dots). In the experimental set-up the estimated value for g6 is 0.022.
Länger et al. BMC Systems Biology 2012, 6:1http://www.biomedcentral.com/1752-0509/6/1
Page 7 of 14

(results not shown). Figure 7 shows all possible combi-nations of two parameters and the optimum predictedfinal parasite load. Aside from the best combinations(see Figure 7, black column and file) g1 and g2 are alsogood choices for the minimization of parasite load. Theremaining combinations also produce a reduction ofparasite load, but to a lesser degree, and are consideredto be of minor interest.By way of illustration, Table 1 show the parameter
change factor for the two-parameter combinations invol-ving g1 (black column and file in Figure 7). Interestingly,the solutions that lead to the lowest parasite loads have
values for most parameters that are approximately 80%higher than their basal values. Exceptions include g1, g4,g6, g2, g3, g5, and g14. Their values are reduced by factorsranging from 5 to 85% (see Table 1).
DiscussionThe standard leishmaniasis treatments are chemother-apy based, though some new treatments are based onthe use of immunotherapy. In our model, the che-motherapeutical agents are those that target parasitedestruction (g2) or inhibit proliferation (g1), whereasimmunotherapeutic treatment implies changing para-meters g3, ... g8 and g3, g4, g6, g8, g9, ...g12. In most casesthe exact interaction mechanism of the drug is not yetknown, though it is possible to associate them to thecorresponding parameters that are being influenced. It isimportant to mention that if a given therapeutic agenthas an influence that is not represented by any of ourmodel’s parameters but corresponds with the in- or out-flux of a model variable, the effect of this agent can betranslated in our model by a change in the respectiverate constant gi.Regarding drug therapy, we have found three para-
meters which cause parasite load reduction: g1, whichdescribes the influence of parasites on their own prolif-eration; g6, which represents the influence of lympho-cytes on their own proliferation; and g2, the rateconstant for parasite degradation.Examination of the standard drugs used for leishma-
niasis treatment shows that most are aimed at parasitedestruction. In our model that translates a an increasein g2, the rate of parasite destruction [34], an
A B
Figure 6 Evolution of the parasite load over time for different values of g2. A. Final parasite load during a time period of 24 weeks fordifferent values of g2. B. Parasite load over time for (g2)original (0.043, dotted line); 0.43 (discontinuous line); 4.3 (continuous line) and experimentaldata (dots).
Table 1 Parameter change factors for the two parametercombinations involving g1.Parametercombination
FC(g1)/FCpk
Parametercombination
FC(g1)/FCpk
g1/g1 1.73/0,67 g1/g5 1.77/0,81
g1/g2 1.78/1,60 g1/g6 1.78/1,74
g1/g3 1.79/1,20 g1/g7 1.78/1,49
g1/g4 1.79/0,79 g1/g8 1.76/1,20
g1/g5 1.78/1,26 g1/g9 1.77/1,18
g1/g6 1.79/0,94 g1/g10 1.77/1,76
g1/g7 1.79/1,20 g1/g11 1.79/1,58
g1/g8 1.79/1,53 g1/g12 1.77/1,65
g1/g2 1.77/0,83 g1/g13 1.79/1,54
g1/g3 1.79/0,95 g1/g14 1.74/0,92
g1/g4 1.79/1,21
The Parameter combination columns stand for the combination of parameterwhile the FC(g1)/FCpk columns indicate the ratio between the factor change(FC) of the original value or g1 over the FC of the corresponding parameter(pk)
Länger et al. BMC Systems Biology 2012, 6:1http://www.biomedcentral.com/1752-0509/6/1
Page 8 of 14

observation that is coherent with our model’s predic-tions. This is the case for several standard treatmentssuch as amphotericin B (partially inhibits the completionof the parasite’s membrane), antimonials (decrease bio-synthesis of energy in the amastigote), and itraconazoleand pyrazolopyrimidines (inhibit the parasite growth).Other substances currently under evaluation, such asbetle leaves extract (reduces viability of promastigotes),interferon (actives macrophages that reduce parasiteload), and IL-12 (stimulates Th1) also increase g2. Theseobservations constitute a pragmatic, a posteriori verifica-tion of our model’s predictions.Most of the therapeutic drugs used also seem to
inhibit, albeit through different mechanisms, parasiteproliferation: aminoglycosides alter parasite messengerRNA, pentamidine inhibits polyamine and DNA synth-esis in the parasite, imidazole and itraconazole inhibitdemethylation of membrane, and pyrazolopyrimidinesblock protein synthesis and destroy parasite RNA. Allthese effects can be interpreted, in terms of our model,as a decrease in g1. The discrepancy in our model’spredictions can be explained by several facts. First, inall cases where a decrease in g1 could be assumed,there is also the concomitant effect of increasing g2, asnoted above. Thus, a trade-off of these two actionsshould be previously evaluated in order to have anaccurate account of the whole drug effect. Second, it
should be taken into account that the effect of a g1modulation could be different depending on the stageof the disease. It has also been shown that if parasitesreplicate quickly, the immune system is able to recog-nize them more easily [13]. Parasites use mechanismslike inhibition of antigen presentation to escapeimmune response, however, a high growth rate inducesmassive macrophage recruitment [13]. At this point itshould be stressed that our model considers the infec-tion from the very initial stage. A third explanationcould be that the parasites produce a certain moleculethat stimulates an immune response of the body.(While investigating a model of tuberculosis infection[35], it was also found that the partial rank correlationbetween growth rate and extracellular bacteria is nega-tive in a certain time interval.)The factor that increases the influence of parasites on
their own proliferation (g1) is crucial according to ourmodel’s results; and currently, no pharmaceuticals thatincrease g1 have been tested against Leishmania. Insu-line-like growth factor 1, interferon, and possibly TNF-acytikine could be considered as potential targets for sti-mulating parasite replication inside macrophages, and itwould be of great interest to test their anti-leishmanialeffectiveness. Insuline-like growth factor also increasesthe number of parasites (g1) and reduces parasite-toxicproduction of nitric oxide (g2).
Figure 7 Optimized final parasite load obtained for each possible combination of two parameters of the system. The parasite load ofthe fitted system was 5.5.
Länger et al. BMC Systems Biology 2012, 6:1http://www.biomedcentral.com/1752-0509/6/1
Page 9 of 14

Furthermore, no existing drug is known to have aneffect on g6, which, in our analysis, is also seen as a pos-sible effective pharmaceutical target. This clearly pointsto the new, potential application of existing and currenttherapeutic strategies.The approach used for detecting key processes that
must be regulated in order to reduce parasite load alsoallowed us to identify combinations of two drugs thatwould eventually be more effective than a single drugtreatment. As is showed in Figure 7, combinations ofdrugs able to increase g1 or g2 and simultaneouslychange any other parameter, or, alternatively, combina-tions of drugs that decrease g1 together with thechange in another parameter, would cause significantreduction in the final parasite load. These findingsgreatly amplify the number of therapeutic optionsavailable, although they still remain to be tested. Byway of illustration, we could suggest the combinationof any of the available drugs that increase g2 (ampho-tericin B, aminoglycosides, antimonials, pentamidineimidazole, itraconazole, and pyrazolopyrimidines)together with any of the following: interleukin-5,6,13and MHC class II molecules (both increasing g3),rLmSTI1 (increase in g4), and chemokines (thatincrease g3 and g2 simultaneously). In the same mousemodel we will test the effects on the variables of differ-ent drug combinations to verify the model’s predic-tions and to eventually refine and extend the model byincluding new variables and mechanisms.A limitation of the present approach is that our model
is a simplification and does not include a detaileddescription of all the factors involved in the interactionmechanism of the drug in the body. However, given thatthese mechanisms are often not known, the modelingapproach constitutes an approximation to the under-standing of a complex dynamic system based on avail-able information and informed hypothesis.
ConclusionsIn the present work we have illustrated a novelapproach for the design of effective therapeutic strate-gies for leishmaniasis treatment. The approach isbased on the integration of experimentally availableinformation on infection development in an animalmodel using a mathematical model that describes thesystem dynamics observed. Many of the predictionsconcur with the standard practice, while othersremain to be explored. We are confident that thisrational, model-based approach is of great interestgiven that it overcomes the limitations of a trial anderror strategy, and provides an extra layer of rational-ity in the search for new therapeutic formulas. Thisapproach is also readily applicable to other parasitic-related illnesses.
MethodsMiceBALB/c mice, 6-8 weeks old, were obtained from theanimal breeding facilities of the Universidad de LaLaguna. The experimental protocols used were approvedby the Animal Care and Use Committee of the Univer-sity of La Laguna (Approval ID number 132).
Parasites and experimental infection of miceAmastigotes of MPRO/BR/77/LTB0016 strain of L.amazonensis were prepared from infected BALB/c mice,retaining full virulence. Promastigotes derived from tis-sue amastigotes were then grown in Schneider’s insectmedium, pH 7.2, supplemented with 10% heat-inacti-vated fetal bovine serum, 100 U/ml penicillin and 100μg/ml streptomycin at 26°C.In order to follow up the evolution of the infection,
103 (106 in case of the verification experiments) station-ary phase L. amazonensis promastigotes contained in 30μl of PBS, were injected subcutaneously into the tarsi ofright hind leg of 20 BALB/c. In 8 of the 20 mice theresponse of IgG1 and IgG2a antibodies was evaluatedevery 2 weeks during the 28-week period of study. Thecellular response and parasite load were also measured,for which we had to sacrifice four mice at 8, 16 and 24weeks of infection.
Parasite quantitationEstimates of the parasite number present in infectedorgans were done as described in Buffet et al. [36]which allowed for quantifying the parasite load from tis-sue homogenates.Serial threefold dilutions ranging from 1 to 1/3 × 10-6
were prepared twice for each homogenate in wells of 96-well plates, containing 200 μl of Schneider’s insect medium,pH 7.2, supplemented with 10% heat-inactivated fetalbovine serum, 200 U/ml penicillin and 200 μg/ml strepto-mycin. After 7 and 10 days at 26°C, each well was examinedand defined as positive or negative based on the presence orabsence of viable promastigotes. A limiting dilution analysiswas applied to the data to estimate the number of viableLeishmania expressed as Limiting Dilution Assay Unit. Thetotal number of parasites per gram (parasite load) was cal-culated by equation 4, where D+ is the last dilution positiveand Po is the weight of the piece of tissue.
Parasite load =1/D+
Po(3)
AntigenThe soluble antigen of the parasite (LaAgS) used forenzyme-linked immunosorbent assay (ELISA) determi-nation and splenocytes proliferation assay was obtained
Länger et al. BMC Systems Biology 2012, 6:1http://www.biomedcentral.com/1752-0509/6/1
Page 10 of 14

from stationary phase cultures of MHOM/BR/77/LTB0016 strain promastigotes of L. amazonensis andaccording to Larreta et al. [37].
AntibodiesThe specific antibody response levels of IgG1 and IgG2aagainst LaAgS were determined by indirect ELISA inserum of BALB/c mice. ELISA assays were carried outusing standard conditions. Microtiter plates were coatedwith 0.8 μg per well of the antigen. The sera from themice were assayed at 1:80 dilutions. As secondary anti-body the HRPO-conjugated goat anti-mouse IgG1 andIgG2a were used to 1:8000 and 1:1000, respectively. Weused two groups of 8 mice, one experimental and onecontrol.
LymphoproliferationIn vitro lymphoproliferation assays were carried out tomeasure the capacity of the LaAgS to stimulate the lym-phocyte multiplication or proliferation, as indicative ofthe capacity of the parasite to produce a specificimmune response. The lymphocytes were asepticallyremoved from spleens of experimental and controlBALB/c mice and disrupted in PBS with 1% FCS. Thecells were centrifuged, the erythrocytes were lysed in alysis solution (150 mM NH4Cl, 10 mM KHCO3, 1 mMEDTA, pH 7.4) and remaining cells were finally resus-pended to a density of 2.5 × 10⁶ cells/ml in DMEM con-taining 10% FCS, 2 mM L-glutamine, 0.05 mM 2-mercaptoethanol, 12 mM HEPES, pH 7.1, 100 IU/mlpenicillin and 100 μg/ml streptomycin. Lymphocyteswere divided into 100 μl aliquots (2.5 × 10⁵ cells) in 96-well plates and they were allowed to proliferate for 3days at 37°C in an atmosphere containing 5% CO2 and95% humidity in the presence or absence of LaAgS(final concentration 40 μg/ml).Proliferation was measured by SRB assay, following
the protocol by Monks et al. [27]. Absorbance due tothe incorporation of the SRB coloring to anionic pro-teins of viable lymphocytes, as an index of proliferationstimulation, was measured using a micro plate reader at570 nm (Model 680; BIO-RAD). Stimulation index ofthe lymphocyte proliferation (SI) of experimental micewas calculated according the following equation:
SI =XAbsTw − XAbsCw
Cutoff(4)
where X AbsTw and X AbsCw stand for the averageabsorbance value for the antigen treated wells and theaverage of the average absorbance value for the controlwells (only DMEM), respectively. The Cutoff point wascalculated as the average difference between the treatedwells absorbance minus the control wells absorbance
plus 3 SD (standard deviation) of the absorbance of lym-phocytes of control mice. The Cutoff was established foreach assay. We used two groups of 12 mice, one experi-mental and one control. All assays were performed intriplicate with four mice representing each group.
Parameter estimationIn the power-law model used, the parameters of themodel, kinetic orders (gi) and rate constants (gi) wereestimated from experimental data using a genetic algo-rithm adapted for power-law models [22,38]. The initialpopulation of solutions is generated through a randomexploration of the search space, which is defined usingfeasible intervals of values for the parameters. The bestindividuals of the population are selected in the consid-ered iteration based on the value of the following objec-tive function:
FObj =1
nvar
nvar∑j=1
ntp∑i=1
(Xj (ti) − Xexp
j (ti))2
ntp
(5)
where nvar is the number of variables monitored andntp the number of time points when each variable wasmeasured. In turn, Xj(ti) is the predicted value for the jth
variable at the ith time point obtained after numericalintegration of the solution, while Xj
exp(ti) is the value ofthe jth observable variable at the ith time point measuredin the experiment. This objective function has beentested in other case studies [22,38] showing that it isindependent of time and therefore will not be affectedby the measurements schedule. We consider it to bewell suited for this type of fitting problem. The objectivefunction takes into account the 24-week period forwhich there is available experimental data of all vari-ables; in the fitting process all variables are weightedequally. The fitting process stops if either the objectivefunction converges below a threshold value or the maxi-mum number of iterations is exceeded. The first criter-ion is fulfilled when it reaches objective function valuessmaller than a previously defined one. The secondoccurs when it reaches a certain number of generations.However, it is possible to set up a combination of bothso that parameter estimation stops when a solution withan objective function value below a predetermined para-meter is reached, or a certain number of generationshave been explored. Every few generations a controllablenumber of individuals of the total population areselected, and the objective function-defined surface issubmitted to local scrutiny taking as starting pointsselected individuals. For each starting point, parametersare changed in a small and random amount and thenew objective function is evaluated. If the new value islower than its initial value, the new set of parameters is
Länger et al. BMC Systems Biology 2012, 6:1http://www.biomedcentral.com/1752-0509/6/1
Page 11 of 14

adopted, otherwise the original parameters are kept. Inour present case we used a combination stopping criter-ion, namely 1000 generations, as the maximal numberof iterations, and an objective function value smallerthan 0.2.Parameter estimation was executed from the pre-
viously obtained time series of experimental data afternormalization [39]. All gi were permitted to vary withinthe range [0,10] and the gi within the range [0,3], exceptthe parameters g2, g8, g11 and g14 which were set to 1since they relate variables with their own outflow (V2,V4, V6 and V8, respectively). This model hypothesis is abiologically plausible one that permits reduction interms of the number of parameters. These ranges comefrom physiological as well as kinetic considerations. Pro-cesses in which kinetic orders are greater than 3 arerarely observed since this corresponds to processes orreactions with extreme sensitivity to changes in one ofthe reactants. A similar reasoning applies to higher givalues, although in this case the admissible range iswider. However, in the optimization search we usedgreater ranges. The rationale is that in the optimizationsearch we can assume possible wider ranges as physiolo-gically acceptable because the optimized system wouldcorrespond with altered kinetic behavior with the use ofdrugs or other therapeutic agents.Parameter estimation using 1000 iterations which
required a computation time of 96 hours. The objectivefunction value finally reached was 0.0517, with a maxi-mal absolute error between interpolated data and modelof 0.5828. In accordance with the objective functiondefinition, this measures the average distance betweenthe experimental data and the model. Since the standar-dized experimental variation values range between 0 and2.5, an objective function value of 0.0517 means anaverage relative error lower than 5%, which is less thanthe experimental error and therefore enough to ensurethat the model represents the experimental data.All variables in the model are normalized. Parasite
load is normalized with respect to its proper mean andthe remaining variables are normalized with respect tothe control group of mice. This standardization reducesthe range of variation of the parameters and computa-tion time and also exploits various properties of theGMA-PL formalism concerning the behavior of variablesand parameters. Initial values of parasite load between10-10 and 0.01 were implemented, comparing them interms of the objective function. The smaller the mini-mum of the objective function, the better the model(with the respective initial value) fits the experimentaldata. Of the initial values for which simulations meetthe criterion fobj < 0.2, we found that the best fit andlowest objective function was attained with 10-6 as theinitial value for parasite load in the group infected with
103 parasites. Therefore 10-6 was used as the initialvalue in that group.
Model selection strategiesThe topology of the model is assumed to be as it appearsin Figure 1. There are different models according to thenumber of parameters used; the most general model has22 parameters. In other simplified models the value ofcertain parameters were assumed to be zero or one [21].Among the different strategies of model selection forfinding the one that yielded the “best” fit, we finally choseto specify a fixed value of the objective function and,accordingly, selected models that fell below this value.Out of these, we chose the simplest model, that is, themodel with the least number of parameters.
Dynamic SensitivitiesSensitivity analysis is a tool useful for model robustnessevaluation and system dynamics characterization. Sinceour model studies the system dynamics, this tool enablesus to identify the parameters with major influence onthe transient dynamics. We have used the System Para-meter Dynamic Sensitivity, Spk
Xi, defined in equation 6:
SXipk(Xi, pk) = sgn
(Ak,2 − Ak
pk,2 − pk
)Dk∣∣pk,2 − pk
∣∣pk
(6)
In the above expression, Xi is the considered variable,while pk is the parameter under scrutiny. Ak,2 is thearea below the solution curve after a change of pk topk,2. Ak is the area under the solution curve using theoriginal value pk. Dk is the area between the two solu-tion curves, using pk and pk,2, respectively. In our ana-lysis we have considered changes in the two kinds ofparameters, kinetic orders and rate constants. The Spk
Xi
value corresponds to the variation of the area under thevariable time course after perturbation in parameterspace. For each model variable the absolute values ofthe area Ak between the original curve and the abscissa,the area Ak2 between the new curve and the abscissaand the area Dk between the original and the new curveare calculated using the trapezoidal method. Positivesensitivity means that the area under the “new” curve isgreater than the area under the original curve, i.e., thatthe parameter pk has a positive influence on variable Xi.Negative sensitivity means the opposite. Zero sensitivitymeans that small changes in the parameter have noinfluence on the variable. All sensitivities were com-puted for standardized variables.
AcknowledgementsThe authors gratefully acknowledge Dr Carlos González-Alcón and GuidoSantos and for their helpful observations. This work was funded by research
Länger et al. BMC Systems Biology 2012, 6:1http://www.biomedcentral.com/1752-0509/6/1
Page 12 of 14

Grants from Spanish MICINN (Ref. BIO2011-29233-C02-02, PI081984 andRD06/0021/0005) and from Agencia Canaria de Investigación, Innovación ySociedad de la Información (Ref. Project PIL2070901 and PIL2071001).
Author details1Grupo de Tecnología Bioquímica. Departamento de Bioquímica y BiologíaMolecular. Universidad de La Laguna. 38206. San Cristóbal de La Laguna.Tenerife. Spain. 2Instituto Universitario de Enfermedades Tropicales y SaludPública de Canarias. Universidad de La Laguna. 38206. San Cristóbal de LaLaguna. Tenerife. Spain. 3Grupo de Tecnología Bioquímica. Departamento deEstadística, I.O. y Ciencias de la Computación. Universidad de La Laguna.38206. San Cristóbal de La Laguna. Tenerife. Spain.
Authors’ contributionsBV and NVT proposed the elaboration of a mathematical model based onthe GMA power-law formalism of the progression of the disease and withthe potential to be used for the design of effective therapies. They plannedthe work and coordinated the study. CP-B carried out parasite, antigen,antibodies and lymphoproliferation quantization. BML implemented theGMA-PL model.BML, BW and CG-A performed the optimum parameter searches. NVT, BV,BML and CP-B and CG-A defined the model and obtained the numericalparameters used in the paper. All authors read and approved the finalmanuscript.
Received: 27 August 2011 Accepted: 5 January 2012Published: 5 January 2012
References1. Neghina R, Neghina AM: Leishmaniasis, a global concern for travel
medicine. Scand J Infect Dis 2010, 42:563-570.2. Killick-Kendrick R: The biology and control of phlebotomine sand flies.
Clin Dermatol 1999, 17:279-289.3. World Health Organization: Control of the leishmaniasis: report of a meeting
of the WHO Expert Commitee on the Control of Leishmaniases. Geneva 2010.4. Handman E: Leishmaniasis: current status of vaccine development. Clin
Microbiol Rev 2001, 14:229-243.5. Chaves LF, Hernandez MJ: Mathematical modelling of American
cutaneous leishmaniasis: incidental hosts and threshold conditions forinfection persistence. Acta Trop 2004, 92:245-252.
6. Bacaër N, Guernaoui S: The epidemic threshold of vector-borne diseaseswith seasonality: the case of cutaneous leishmaniasis in Chichaoua,Morocco. J Math Biol 2006, 53:421-436.
7. Carneiro DD, Bavia ME, Rocha WJ, Tavares AC, Cardim LL, Alemayehu B:Application of spatio-temporal scan statistics for the detection of areaswith increased risk for American visceral leishmaniasis in the state ofBahia, Brazil. Geospat Health 2007, 2:113-126.
8. Leifso K, Cohen-Freue G, Dogra N, Murray A, McMaster WR: Genomic andproteomic expression analysis of Leishmania promastigote andamastigote life stages: the Leishmania genome is constitutivelyexpressed. Mol Biochem Parasitol 2007, 152:35-46.
9. Chavali AK, Whittemore JD, Eddy JA, Williams KT, Papin JA: Systemsanalysis of metabolism in the pathogenic trypanosomatid Leishmaniamajor. Mol Syst Biol 2008, 4:177.
10. Rochette A, Raymond F, Ubeda JM, Smith M, Messier N, Boisvert S,Rigault P, Corbeil J, Ouellette M, Papadopoulou B: Genome-wide geneexpression profiling analysis of Leishmania major and Leishmaniainfantum developmental stages reveals substantial differences betweenthe two species. BMC Genomics 2008, 9:255.
11. de Almeida MC, Moreira HN: A mathematical model of immune responsein cutaneous leishmaniasis. Journal of Biological Systems 2007, 3:313-354.
12. Schweitzer N, Swinton J, Anderson R: Dynamic interaction betweenLeishmania infection in mice and Th1-type CD4+ T-cells: complexity inoutcome without a requirement for Th2-type responses. ParasiteImmunol 1993, 15:85-99.
13. Dancik GM, Jones DE, Dorman KS: Parameter estimation and sensitivityanalysis in an agent-based model of Leishmania major infection. J TheorBiol 2010, 262:398-412.
14. Dantas-Torres F, Brandão-Filho SP: Visceral leishmaniasis in Brazil:revisiting paradigms of epidemiology and control. Rev Inst Med Trop SaoPaulo 2006, 48:151-156.
15. Palatnik-de-Sousa CB, Silva-Antunes I, Morgado Ade A, Menz I, Palatnik M,Lavor C: Decrease of the incidence of human and canine visceralleishmaniasis after dog vaccination with Leishmune® in Brazilianendemic areas. Vaccine 2009, 27:3505-3512.
16. Courret N, Lang T, Milon G, Antoine JC: Intradermal inoculations of lowdoses of Leishmania major and Leishmania amazonensis metacyclicpromastigotes induce different immunoparasitic processes and status ofprotection in BALB/c mice. Int J Parasitol 2003, 33:1373-1383.
17. Arrais-Silva WW, Paffaro VA Jr, Yamada AT, Giorgio S: Expression ofhypoxia-inducible factor-1alpha in the cutaneous lesions of BALB/c miceinfected with Leishmania amazonensis. Exp Mol Pathol 2005, 78:49-54.
18. Lira R, Doherty M, Modi G, Sacks D: Evolution of lesion formation,parasitic load, immune response, and reservoir potential in C57BL/6mice following high-and low-dose challenge with Leishmania major.Infect Immun 2000, 68:5176-5182.
19. Requena JM, Soto M, Doria MD, Alonso C: Immune and clinicalparameters associated with Leishmania infantum infection in the goldenhamster model. Vet Immunol Immunopathol 2000, 76:269-281.
20. Dea-Ayuela MA, Rama-Iñiguez S, Alunda JM, Bolás-Fernandez F: Settingnew immunobiological parameters in the hamster model of visceralleishmaniasis for in vivo testing of antileishmanial compounds. Vet ResCommun 2007, 31:703-717.
21. Voit EO: Computational Analysis of Biochemical Sustems. A Practical Guide forBiochemists and Molecular Biologist Cambridge University Press; 2000.
22. Vera J, Bachmann J, Pfeifer AC, Becker V, Hormiga JA, Darias NV, Timmer J,Klingmüller U, Wolkenhauer O: A systems biology approach to analyseamplification in the JAK2-STAT5 signalling pathway. BMC Syst Biol 2008,2:38.
23. Vera J, Curto R, Cascante M, Torres NV: Detection of potential enzymetargets by metabolic modelling and optimization. Application to asimple enzymopathy. Bioinformatics 2007, 23:2281-2289.
24. Guebel DV, Cánovas M, Torres NV: Model Identification in Presence ofIncomplete Information by Generalized Principal Component Analysis:Application to the Common and Differential Responses of Escherichiacoli to Multiple Pulse Perturbations in Continuous, High-Biomass DensityCulture. Biotechnol Bioeng 2009, 104:785-795.
25. Danø S, Madsen MF, Schmidt H, Cedersund G: Reduction of a biochemicalmodel with preservation of its basic dynamic properties. FEBS J 2006,273:4862-4877.
26. Abbas AK, Lichtman AH, Pillai S: Cellular and molecular immunology ElsevierPress; 2010.
27. Monks A, Scudiero D, Skehan P, Shoemaker R, Paull K, Vistica D, Hose C,Langley J, Cronise P, Vaigro-Wolff A: Feasibility of a high-flux anticancerdrug screen using a diverse panel of cultured human tumor cell lines. JNatl Cancer Inst 1991, 83:757-766.
28. Chang KP, McGwire BS: Molecular determinants and regulation ofLeishmania virulence. Kinetoplastid Biol Dis 2002, 1:1-7.
29. Chang KP, Reed SG, McGwire BS, Soong L: Leishmania model for microbialvirulence: the relevance of parasite multiplication and pathoantigenicity.Acta Trop 2003, 85:375-390.
30. Mougneau E, Bihl F, Glaichenhaus N: Cell biology and immunology ofLeishmania. Immunol Rev 2011, 240:286-296.
31. Kaur S, Kaur T, Garg N, Mukherjee S, Raina P, Athokpam V: Effect of doseand route of inoculation on the generation of CD4+ Th1/Th2 type ofimmune response in murine visceral leishmaniasis. Parasitol Res 2008,103:1413-1419.
32. Scott P, Natovitz P, Coffman RL, Pearce E, Sher A: Immunoregulation ofcutaneous leishmaniasis. T cell lines that transfer protective immunity orexacerbation belong to different T helper subsets and respond todistinct parasite antigens. J Exp Med 1988, 168:1675-1684.
33. Duncan DD, Swain SL: Role of antigen-presenting cells in the polarizeddevelopment of helper T cell subsets: evidence for differential cytokineproduction by Th0 cells in response to antigen presentation by B cellsand macrophages. Eur J Immunol 1994, 24:2506-2514.
34. van Griensven J, Balasegaram M, Meheus F, Alvar J, Lynen L, Boelaert M:Combination therapy for visceral leishmaniasis. Lancet Infect Dis 2010,10:184-194.
35. Segovia-Juarez JL, Ganguli S, Kirschner D: Identifying control mechanismsof granuloma formation during M. tuberculosis infection using anagent-based model. J Theor Biol 2004, 231:357-376.
Länger et al. BMC Systems Biology 2012, 6:1http://www.biomedcentral.com/1752-0509/6/1
Page 13 of 14

36. Buffet PA, Sulahian A, Garin YJ, Nassar N, Derouin F: Culture microtitration:a sensitive method for quantifying Leishmania infantum in tissues ofinfected mice. Antimicrob Agents Chemother 1995, 39:2167-2168.
37. Larreta R, Guzman F, Patarroyo ME, Alonso C, Requena JM: Antigenicproperties of the Leishmania infantum GRP94 and mapping of linear B-cell epitopes. Immunol Lett 2002, 80:199-205.
38. Hormiga JA, Vera J, Frías I, Torres Darias NV: Growth and ligninolyticsystem production dynamics of the Phanerochaete chrysosporiumfungus. A modelling and optimization approach. J Biotechnol 2008,137:50-58.
39. Albeck JG, MacBeath G, White FM, Sorger PK, Lauffenburger DA, Gaudet S:Collecting and organizing systematic sets of protein data. Nat Rev MolCell Biol 2006, 7:803-812.
doi:10.1186/1752-0509-6-1Cite this article as: Länger et al.: Modeling of leishmaniasis infectiondynamics: novel application to the design of effective therapies. BMCSystems Biology 2012 6:1.
Submit your next manuscript to BioMed Centraland take full advantage of:
• Convenient online submission
• Thorough peer review
• No space constraints or color figure charges
• Immediate publication on acceptance
• Inclusion in PubMed, CAS, Scopus and Google Scholar
• Research which is freely available for redistribution
Submit your manuscript at www.biomedcentral.com/submit
Länger et al. BMC Systems Biology 2012, 6:1http://www.biomedcentral.com/1752-0509/6/1
Page 14 of 14