BMC Medical Education
22
BioMed Central Page 1 of 22 (page number not for citation purposes) BMC Medical Education Open Access Research article Assessment of examiner leniency and stringency ('hawk-dove effect') in the MRCP(UK) clinical examination (PACES) using multi-facet Rasch modelling IC McManus* 1 , M Thompson 2 and J Mollon 2 Address: 1 Department of Psychology, University College London, Gower Street, London WC1E 6BT, UK and 2 MRCP(UK) Central Office, 11 St Andrews Place, Regents Park, London NW1 4LE, UK Email: IC McManus* - [email protected]; M Thompson - [email protected]; J Mollon - [email protected] * Corresponding author Abstract Background: A potential problem of clinical examinations is known as the hawk-dove problem, some examiners being more stringent and requiring a higher performance than other examiners who are more lenient. Although the problem has been known qualitatively for at least a century, we know of no previous statistical estimation of the size of the effect in a large-scale, high-stakes examination. Here we use FACETS to carry out a multi-facet Rasch modelling of the paired judgements made by examiners in the clinical examination (PACES) of MRCP(UK), where identical candidates were assessed in identical situations, allowing calculation of examiner stringency. Methods: Data were analysed from the first nine diets of PACES, which were taken between June 2001 and March 2004 by 10,145 candidates. Each candidate was assessed by two examiners on each of seven separate tasks. with the candidates assessed by a total of 1,259 examiners, resulting in a total of 142,030 marks. Examiner demographics were described in terms of age, sex, ethnicity, and total number of candidates examined. Results: FACETS suggested that about 87% of main effect variance was due to candidate differences, 1% due to station differences, and 12% due to differences between examiners in leniency-stringency. Multiple regression suggested that greater examiner stringency was associated with greater examiner experience and being from an ethnic minority. Male and female examiners showed no overall difference in stringency. Examination scores were adjusted for examiner stringency and it was shown that for the present pass mark, the outcome for 95.9% of candidates would be unchanged using adjusted marks, whereas 2.6% of candidates would have passed, even though they had failed on the basis of raw marks, and 1.5% of candidates would have failed, despite passing on the basis of raw marks. Conclusion: Examiners do differ in their leniency or stringency, and the effect can be estimated using Rasch modelling. The reasons for differences are not clear, but there are some demographic correlates, and the effects appear to be reliable across time. Account can be taken of differences, either by adjusting marks or, perhaps more effectively and more justifiably, by pairing high and low stringency examiners, so that raw marks can be used in the determination of pass and fail. Published: 18 August 2006 BMC Medical Education 2006, 6:42 doi:10.1186/1472-6920-6-42 Received: 24 March 2006 Accepted: 18 August 2006 This article is available from: http://www.biomedcentral.com/1472-6920/6/42 © 2006 McManus et al; licensee BioMed Central Ltd. This is an Open Access article distributed under the terms of the Creative Commons Attribution License (http://creativecommons.org/licenses/by/2.0 ), which permits unrestricted use, distribution, and reproduction in any medium, provided the original work is properly cited.
-
Upload
khangminh22 -
Category
Documents
-
view
1 -
download
0
Transcript of BMC Medical Education

BioMed CentralBMC Medical Education
ss
Open AcceResearch articleAssessment of examiner leniency and stringency (hawk-dove effect) in the MRCP(UK) clinical examination (PACES) using multi-facet Rasch modellingIC McManus1 M Thompson2 and J Mollon2
Address 1Department of Psychology University College London Gower Street London WC1E 6BT UK and 2MRCP(UK) Central Office 11 St Andrews Place Regents Park London NW1 4LE UK
Email IC McManus - imcmanusuclacuk M Thompson - MargaretThompsonrcplondonacuk J Mollon - JenniferMollonrcplondonacuk
Corresponding author
AbstractBackground A potential problem of clinical examinations is known as the hawk-dove problemsome examiners being more stringent and requiring a higher performance than other examinerswho are more lenient Although the problem has been known qualitatively for at least a centurywe know of no previous statistical estimation of the size of the effect in a large-scale high-stakesexamination Here we use FACETS to carry out a multi-facet Rasch modelling of the pairedjudgements made by examiners in the clinical examination (PACES) of MRCP(UK) where identicalcandidates were assessed in identical situations allowing calculation of examiner stringency
Methods Data were analysed from the first nine diets of PACES which were taken between June2001 and March 2004 by 10145 candidates Each candidate was assessed by two examiners on eachof seven separate tasks with the candidates assessed by a total of 1259 examiners resulting in atotal of 142030 marks Examiner demographics were described in terms of age sex ethnicity andtotal number of candidates examined
Results FACETS suggested that about 87 of main effect variance was due to candidatedifferences 1 due to station differences and 12 due to differences between examiners inleniency-stringency Multiple regression suggested that greater examiner stringency was associatedwith greater examiner experience and being from an ethnic minority Male and female examinersshowed no overall difference in stringency Examination scores were adjusted for examinerstringency and it was shown that for the present pass mark the outcome for 959 of candidateswould be unchanged using adjusted marks whereas 26 of candidates would have passed eventhough they had failed on the basis of raw marks and 15 of candidates would have failed despitepassing on the basis of raw marks
Conclusion Examiners do differ in their leniency or stringency and the effect can be estimatedusing Rasch modelling The reasons for differences are not clear but there are some demographiccorrelates and the effects appear to be reliable across time Account can be taken of differenceseither by adjusting marks or perhaps more effectively and more justifiably by pairing high and lowstringency examiners so that raw marks can be used in the determination of pass and fail
Published 18 August 2006
BMC Medical Education 2006 642 doi1011861472-6920-6-42
Received 24 March 2006Accepted 18 August 2006
This article is available from httpwwwbiomedcentralcom1472-6920642
copy 2006 McManus et al licensee BioMed Central LtdThis is an Open Access article distributed under the terms of the Creative Commons Attribution License (httpcreativecommonsorglicensesby20) which permits unrestricted use distribution and reproduction in any medium provided the original work is properly cited
Page 1 of 22(page number not for citation purposes)
BMC Medical Education 2006 642 httpwwwbiomedcentralcom1472-6920642
BackgroundAn examiner for the MRCP(UK) clinical examinationPACES in an informal personal account of examiningwrote
Outside seagulls starlings and sparrows and the occa-sional blackbird come and go Inside there are hawksand doves [1]
Clinical examinations require to a large extent thatjudgements of candidates are made by experienced exam-iners A potential vulnerability of any clinical examinationis that examiners differ in their relative leniency or strin-gency Traditionally this is known as the hawk-doveeffect hawks tending to fail most candidates because ofhaving very high standards whereas doves tend to passmost candidates Indeed so notorious is the problem thatsome individual examiners such as Professor Jack DMyers (Black Jack Myers) in the United States havebecome famous in their own right as notorious hawks [2]Although the problem of hawks and doves is easy enoughto describe finding an effective statistical technique forassessing it is far from straightforward
The hawk-dove nomenclature has itself been criticised(although it must be said that the terms hawk and doveare well-known in the literature eg [3-10]) Alternativesuggestions have included stringent and lenient andfrom a different perspective there is a suggestion thatexaminers can either be candidate centred (ie their sym-pathies are primarily with the candidates of whom theywish to pass as many as possible) or patient centred (ietheir primary aim is to maintain clinical standards at ahigh level so that patients are protected and provided withcompetent doctors)
A slightly different approach to naming refers to examinerspecificity (eg [11]) a candidates marks depending onthe particular examiner(s) they happen to see The namesuggests that this concept is similar to case specificity inwhich because candidates are not equally proficient at allclinical tasks they have areas of weakness and strengthand hence can get lucky or unlucky in the particular casesthey happen to see sometimes seeing cases with whichthey are familiar and other times seeing cases with whichfor a host of reasons they are unfamiliar Case specificityis said to be found in a wide range of assessment contexts(see eg [11-16]) although an important recent study sug-gests that much case specificity may actually be variancedue to items within cases rather than cases per se [17]However it is not clear that the parallel between case spe-cificity and examiner specificity is in fact appropriate Thekey feature of case specificity is that it is a variation in acandidates ability across different types of case and soexaminer specificity should also refer to a variation in
hawkish-dovishness according to the particular case Thatthough is not what we are referring to here (although itcould be analysed) but are instead only considering anexaminers overall propensity for being strict or lenient (inthe same way as the overall candidate effect looks at theiroverall propensity to be correct or incorrect) We will nottherefore use the term examiner specificity
None of the terms is entirely satisfactory but the hawk-dove nomenclature has the advantage of being in use forat least three decades and being an effective and easy met-aphor (and one which is used in several other areas of sci-ence as well as for instance in games theory andevolutionary biology [18]) Leniency and stringency arehowever somewhat less emotional descriptors and wewill therefore use the terms leniency and stringency whilediscussing statistical results but will also use hawk anddove on occasion when they are useful metaphors in dis-cussion We must emphasise that when we use the latterterms they should be seen as extremes on a continuumrather than as discrete classes of individuals (althoughone does occasionally see comments implying the lattersuch as in a surgery examination where is was suggestedthat the ratio of hawks to doves is said to be 91 or 82so expect at least one examiner of the ten that you meet toappear as smiling death [19] or in the phrase thatcomparing results across examiners shows that we tendto be either hawks (marking hard) or doves (markingeasily) [20]) However just as most people are neitherextraverts nor introverts and are neither tall nor short butinstead are somewhere in the middle of the range so it islikely that most examiners are somewhere between theextremes of being a hawk or dove and hence are in themid-range of stringency-leniency Of course once strin-gency-leniency becomes measurable then the shape of thedistribution becomes an empirical matter and will be dis-cussed below
Although the problem of hawks and doves in medicalexamination is often mentioned there are relatively fewstatistical analyses of the problem (although there is somework within medicine [2122] and elsewhere [23-25]) Anearly example of a statistical analysis looking at hawks anddoves is to be found in a paper from 1974 which describesa previous major revision of the MRCP(UK) [26] It con-sidered 10 examinations taken by 2269 candidates and inwhom the overall pass rate was 628 Each candidatewas seen by two examiners and together the two examin-ers produced an agreed mark Examiner X had examined367 candidates (with 10 different other examiners) andonly 463 of those candidates had passed the exam ahighly significant difference from the 660 pass rate inthe remaining candidates (assuming as the paper saysthat candidates were effectively allocated to examiners atrandom) The paper concludes There can be little doubt
Page 2 of 22(page number not for citation purposes)
BMC Medical Education 2006 642 httpwwwbiomedcentralcom1472-6920642
that X was a hawk whose influence on his colleagues wassuch as to lower the pass rate for the candidates he exam-ined substantially below the expected level
The statistical identification of hawks and doves is notstraightforward At first sight it might seem that examinerscould be compared on the average marks they award withthose giving higher marks being classified as doves andthose giving lower marks being classified as hawks Thathowever assumes that indeed all other things are equalwhich is unlikely to be the case Examiners do not all seethe same candidates (and it is possible that candidates insome centres may be less competent than those in othercentres) Stations can also differ in difficulty and examin-ers not examine an equal numbers of times on each sta-tion so that examining more often on difficult stationsmight artefactually make an examiner appear to be morehawkish In this paper we wish to describe a statisticalanalysis of a large number of candidates who have takenPACES the clinical examination of the MRCP(UK) inwhich we use multi-facet Rasch modelling to identifyexaminer effects
The examination for the Membership of the Royal Col-leges of Physicians of the UK (MRCP(UK)) has alwaysincluded a clinical examination In the past the examina-tion took a very traditional format of one long case sev-eral short cases and an oral examination [27] In June2001 the examination was radically restructured into thePractical Assessment of Clinical Examination Skills(PACES) [28] Before taking the examination candidatesmust have passed the Part 1 and Part 2 written examina-tions which assess clinical knowledge and applied bio-medical science Selection training and monitoring ofexaminers is provided as described in a document pro-vided by the Colleges [see Additional File 1]
Details of the examination are given in the Method sec-tion below but here it will suffice to say that each candi-date receives two separate marks on each of sevendifferent clinical activities The key to understanding theassessment of examiner stringency in the PACES examina-tion is to realise that each candidate on each station isalways seen by two examiners The two examiners observethe identical clinical encounter at the same time candi-date centre patient or simulated patient being seen clin-ical task words spoken by the candidate and theexaminers all being identical The only thing that differsis the two examiners themselves If one examiner is morestringent than the other then they will systematically tendto give a lower mark
If examiners A and B assess together on a number of occa-sions then a comparison of their paired marks gives anindex of their relative stringency If subsequently B exam-
ines with C and then C examines with D then the pairedcomparisons allow each of the four examiners to beplaced in order with estimates of the standard errors oftheir relative stringency This design is in effect an incom-plete paired comparison design and the statistical analy-sis by the Bradley-Terry-Luce model has been explored formany years [29-31] In the context of professional sportsuch models are routinely used for assessing the interna-tional ranking of tennis players and chess players basedon who has played and beaten whom The methods arealso equivalent to the calculations used in the class ofmodels developed by Georg Rasch (1901ndash1980) nowknown as Rasch models [32-34] and which are routinelyused for assessing the performance of questions and can-didates in a wide range of examinations In general Rashmodelling is straightforward because each candidate willanswer every examination question and item and candi-date scores can readily be calculated That feature is nothowever necessarily present for assessing examiner effects
A potential problem for applying Rasch models to exam-iner stringency is the concept of linkage or relatednessIn a particular diet of an exam examiners A B C and Dmay have examined together as described above becausethey were all working together in a particular centre Atanother centre examiners E F G and H may also be work-ing together and hence an estimate of their relative strin-gency can also be calculated However geographicalseparation coupled with the practicalities of a singleexamination at a single point in time means that none ofA B C and D ever examines with any of E F G and H Thetwo sets of results from the different centres are thereforenot linked and no estimates can be calculated of the rela-tive stringencies of the entire set of examiners
A solution to the problem of linkage is found if someexaminers examine on several different diets at differentcentres If on the next diet E travels to the other centre andexamines with examiner A then the minimal condition ismet for all eight examiners being linked and a joint anal-ysis of the two diets can rate the stringency of all examin-ers The analysis described here considers the first ninediets of the PACES examination and it will be shown thatsufficient examiners have examined with enough otherexaminers for there to be linkage
The statistical analysis described here uses the programFACETS [35] which carries out Rasch modelling for con-structing linear measures from qualitatively orderedcounts in multi-facet data To summarise succinctly therelationship between a conventional Rasch model (whichis now commonly used to analyse the results of examina-tions) and FACETS is similar to that of the relationshipbetween simple regression and multiple regression Insimple regression one asks how an outcome variable such
Page 3 of 22(page number not for citation purposes)
BMC Medical Education 2006 642 httpwwwbiomedcentralcom1472-6920642
as blood pressure is related to a background (or inde-pendent) measure such as age whereas multiple regres-sion allows one to see how an outcome measure relates toseveral background variables such as age height serumcholesterol and so on Similarly while a Rasch modelshows how the probability of answering an item correctlyon an examination relates to the difficulty of an item andthe ability of a candidate with FACETS one can assesshow the probability of answering an item not only relatesto item difficulty and candidate ability but also to a rangeof background factors including characteristics of exam-iners and the nature of the assessment FACETS most sim-ply is therefore a multivariate generalisation of Raschmodelling That can be seen more clearly in a formalmathematical model
The Rasch modelThe basic Rasch model considers only a group of n candi-dates who each have an ability Ci (i = 1n) and who eachtakes a set of m tests each of which has a difficulty Tj(j =1m) The probability of candidate i correctly answeringtest j Pij is then estimated as
logit (Pij) = log(Pij(1-Pij)) = Ci - Tj (1)
Given a reasonable number of candidates taking a reason-able number of tests it is then possible to use maximumlikelihood methods to calculate separately an abilitymeasure for each candidate and a difficulty measure foreach test item In addition a standard error can be calcu-lated for each of these measures A practical point to notein equation 1 is that it has used the conventional methodof scoring in which higher candidate scores indicatehigher ability (and hence a greater likelihood of answer-ing the question being answered correctly) and difficulttests also have a higher score (and hence because of thenegative coefficient in equation 1 a lower probability ofbeing answered correctly) Later this can be seen moreclearly in the yardstick output from FACETS where thevarious scores are placed side by side A very competentcandidate climbs high up the diagram and therefore issuccessfully answering more difficult stations and is alsosatisfying the more hawkish examiners Rather like a high-jump exam the better jumpers have a higher chance ofclearing the higher jumps
The partial credit modelThe basic Rasch model considers only items which areanswered correctly or incorrectly However on manyforms of examination the examiners rate candidates on aranking scale (eg as in PACES Clear Fail Fail Passand Clear Pass) Although conventionally scored as 123and 4 there is no statistical basis for treating such judge-ments as being on an equal interval scale Such ratings arereadily incorporated into the Rasch model and the size of
the intervals can be assessed directly Let candidates beassessed on a scale with r categories so that each mark hasits own difficulty Mk (k = 1r) The partial credit modelis then
logit (Pijk) = log(Pijk(1-Pijk)) = Ci - Tj - Mk (2)
where Pijk is the probability of candidate i on test j receiv-ing a mark of k Once again the negative coefficient for Mkmeans that high scores for Mk mean it is more difficult fora candidate to get a higher mark The partial credit modelallows the differences between the various points on amark scale to be assessed (Note although we here refer tothis model as the partial credit model it is in essence iden-tical to the rating-scale model [3637])
The multi-facet Rasch modelA further extension of the Rasch model allows additionalparameters to be estimated which take into account otherfactors in the design of the test and might account for var-iability Although in principle there is no limit to suchadditional FACETS here we will only consider the situa-tion relevant to PACES in which examiners also differ intheir stringencies Let there be p examiners each of whomhas a stringency El (l = 1p) with a high stringency mean-ing that a candidate is less likely to receive a higher markfrom that examiner than they are from a less stringentexaminer The equation then can be expressed as
logit (Pijkl) = log(Pijkl(1-Pijkl)) = Ci - Tj - Mk - El (3)
The probability of a candidate receiving a particular markthen depends on their own ability (Ci) the difficulty ofthe test (Tj) how high the mark is (Mk) and the stringencyof the examiner (El) In this paper we will restrict ourselvesto the model shown in equation 3 Although in theory itis straightforward to include in the model other FACETSwhich might affect the performance of candidates that isnot always easy in practice because the data in complexdesigns are not always linked or connected where con-nected is used in the technical sense used in graph theoryin that there is a path between all possible pairs of verticesFor further discussion of this see the FACETS manual [35]which also refers to the work of Engelhardt [38] and saysthat the algorithm for testing connectedness is an exten-sion of that described by Weeks and Williams [39]
The primary interest of the present paper will be in the dif-ferences which occur between examiners and in howthese may be estimated and in ways in which they may becorrected for in the marking of the examination Examinervariation can reduce the validity of an examination sincethe likelihood of a candidate passing depends not onlyupon the candidates own ability but also upon whetherthey got lucky or unlucky in their particular choice of
Page 4 of 22(page number not for citation purposes)
BMC Medical Education 2006 642 httpwwwbiomedcentralcom1472-6920642
examiners Although examiners are to a first approxima-tion randomly allocated to candidates there can also besystematic biasses (and in the case of the PACES examina-tion it is known that candidates sitting in centres outsidethe UK often have a lower overall pass rate than those tak-ing the examination in UK centres and it is also the casethat the most experienced UK examiners are also the oneswho collaborate with local examiners in examining at cen-tres outside the UK) We will also try and assess whatdemographic factors characterise stringent or lenientexaminers and whether examiners vary in their stringencyin different tests of the examination or with particulartypes of candidate
MethodsThe results of the first nine diets of PACES (2001 to 2004)were analysed In addition and where possible data werecollected on the demography of examiners and candi-dates in order to assess their contribution to variation inexaminer stringency
The PACES examinationThe PACES examination for an individual candidate con-sists of a carousel of five separate stations each lasting
twenty minutes (see figure 1) Two of the stations assessaspects of communications (2 History taking and 4Communication Skills and Ethics) and last 20 minutesTwo of the other stations are each split into two sub-sta-tions lasting ten minutes which are assessed by the samepair of examiners and for which candidates receive a sep-arate mark on each part (1 Respiratory and Abdominal3 Cardiovascular and Neurological) Finally station 5lasts 20 minutes and consists of Skin Locomotor Eyesand Endocrine (Other) and there is a single mark for thewhole station Candidates therefore receive a total of four-teen separate marks from ten different examiners (two ateach of the five stations) As in an OSCE examination acandidate may start at any point on the carousel Animportant difference from a traditional OSCE is thatwithin each station there is a selection of patients and can-didates will differ in which particular patients they hap-pen to see Examiners are however aware of this and arespecifically instructed before the examination begins toassess the difficulty of the particular symptoms and signsin the patients and to adjust their marks in relation to thatdifficulty For further details as well as examples of themark sheets used by examiners are available on the inter-net [40]
The structure of the PACES examination carouselFigure 1The structure of the PACES examination carousel Note that candidates can start at any position in the carousel
Page 5 of 22(page number not for citation purposes)
BMC Medical Education 2006 642 httpwwwbiomedcentralcom1472-6920642
At each station the candidate is assessed by two examinerseach of whom marks entirely independently of the otherexaminer and there is no conferring or discussion afterthe candidate has left the room Marking takes place on aproforma on which examiners indicate the candidatesproficiency on a number of sub-scales and then theymake an overall judgement of the candidate The overalljudgement is implicitly criterion-referenced and has fourcategories (Clear Pass Pass Fail Clear Fail) with anchorstatements describing the performance at each level It isintentional that there is no judgement between the marksof Pass and Fail so that examiners explicitly have to makea decision about each candidate relative to the standardsexpected of a just-passing candidate taking the examina-tion
The four categories of Clear Pass Pass Fail Clear Failreceive numerical marks of 432 and 1 Since each candi-date receives a total of fourteen marks the total mark isbetween 14 and 56 For various historical reasons andafter development and piloting the pass mark at the firstdiet of PACES was set at 41 and has been maintained atthat level for the first nine diets which are reported hereAn additional rule which applies to only a tiny percentageof candidates is that any candidate who receives threeClear Fail marks from three different examiners will auto-matically fail the examination in practice most candi-dates meeting this criterion would have failed theexamination anyway as their total mark is below 41
Statistical analysis used FACETS 3500 [35] for Raschmodelling Xcalibre 110b [41] for fitting two-parameteritem-response theory models and SPSS 115 for all otherstatistical calculations
Meaning of stationsIt should be noted that although there are five physicallyseparate stations in the examination proper for theremainder of this paper the term station will be usedrather more conveniently to refer to each of the seven sep-arate assessments made of a candidate rather than to thefive twenty-minute sessions within which those sevenassessments are made
ResultsCandidate dataThe first nine diets of the PACES examination were takenbetween June 2001 and March 2004 with two diets in2001 three in 2002 and 2003 and one in 2004 The totalnumber of candidates taking the examination was 10145an average of 1127 on each diet (range 784ndash1355)Some candidates took the exam on more than one occa-sion and for the present analysis they have been treated asif at each time they were separate candidates (since it wasto be expected that their performance may have improved
across diets) On each diet the pass mark was set at 41 (forexplanation see Dacre et al [42]) Overall the pass rate was466 (472410145) Overall the analysis considered atotal of 142030 marks
6834 candidates were male (674) and 3311 werefemale (326) 4483 (442) of the candidates weregraduates of UK medical schools and 8916 (879) ofthe candidates were taking the examination in centresbased in the UK
ExaminersOverall 1259 examiners took part in the 9 diets of PACESwith each examiner being paired in every case with a sec-ond examiner Each examiner had assessed an average of113 candidates (SD 83 range 1ndash593 quartiles = 50ndash153median = 96 mode = 40) 1037 examiners (824) onlyexamined candidates in the UK 119 examiners (95)only examined candidates outside the UK and 103 exam-iners (82)examined candidates in both the UK andelsewhere The latter group had more overall experience ofexamining in PACES (mean candidates examined = 238SD = 104) than those examining only in the UK (meancandidates examined = 105 SD = 73) or those examiningonly outside the UK (mean candidates examined = 73 SD= 44) The average year of birth of examiners was 19514(SD = 66 range = 1931 ndash 1968) 1042 examiners wereknown to be male 123 were known to be female and thedatabase did not have information on the other 94 exam-iners (60 of whom examined only outside the UK and 34of whom examined only in the UK)
Multi-facet Rasch modellingSeparating the effects of candidate ability test (station) difficulty examiner stringency and the marking scaleA three-facet Rasch model was run on all 142030 exami-nation marks using the model described in equation 3above Of particular importance was that FACETSreported that subset connection was OK meaning thatthe data were connected and that linkage had occurredsatisfactorily so that examiner stringency could be com-pared on a common scale across all examiners
Since subset connection is so important to FACETS weinvestigated the extent to which it was achieved by smallerdata sets We tried three different sets of just three diets(12 and 3 7 8 and 9 1 4 and 9) and in each case con-nection was OK When however we tried just two diets (8and 9 1 and 9) we found that while the latter was con-nected the former showed 19 disjoint subsets It seemslikely that three diets is necessary for connection to beadequate We also attempted to run a model using datafrom just one station but that analysis failed with multi-ple disjoint subsets showing that although case connec-
Page 6 of 22(page number not for citation purposes)
BMC Medical Education 2006 642 httpwwwbiomedcentralcom1472-6920642
tion is satisfactory for the entire data set it is vulnerable assoon as only a part of the data is used
Figure 2 shows FACETS yardstick display of the logitscores for candidates examiners stations and marks Itshould be emphasised that because all measures are esti-mated through equation 3 then they are all on a commonscale and therefore can be directly compared The reader isalso reminded that high scores correspond to high scoringcandidates stringent examiners difficult stations andhigh marks awarded The analysis also ensures that esti-mates for effects of candidate examiner station and markeach takes into account any effects due to confoundingwith other variables In particular the effects of examinerstake into account whether or not those examiners hadexamined particularly weak or strong candidates or exam-ined on difficult or easy stations Effects shown are there-fore true effects and are not confounded Likewise theeffects for candidates have been disconfounded for differ-ences in examiners (see below for further discussion)
Scale differencesTaking all of the examiners marks together 8 wereClear fail 27 were Fail 40 were Pass and 25 wereClear Pass The rightmost column of figure 2 shows thepositions of the boundaries between these marks on thecommon logit scale of the Rasch model at -139 000and 130 to a good approximation therefore the scale ofmarks is indeed equal interval The numbers 2 and 3 inthe rightmost column of figure 2 indicate the modalpoints of Fail and Pass at -079 logits and 080 logitsFigure 3 shows the conditional probabilities for the threesteps between the four marks and figure 4 shows theprobabilities of the four marks being awarded for candi-dates at different points along the ability scale
Station (test) differencesPrevious analyses of the PACES data have suggested thatthe stations differ to some extent in their difficulty[4243] candidates receiving the highest average mark onthe Communication and Ethics station and the lowest
average mark on the Cardiovascular station Table 1 pro-vides the FACETS analysis of the station differencesranked in order from most difficult to least difficult Thefirst two columns of data show the average mark on eachof the stations and the point-biserial correlation betweenthe mark on each station and on the exam as a whole Thecolumn marked Station effect shows the logit score foreach station and in the next column is shown the stand-ard error of the logit score The standard errors are all ofthe order of 01 Station 3a (Cardiovascular) is the mostdifficult followed by 3b (Neurological) and 1b (Abdom-inal) which are of similar difficulty Stations 2 (Historytaking) and 5 (Other) are easier but of similar difficultyand stations 4 (Comunication Skills and Ethics) and 1a(Respiratory) are the easiest and of equivalent difficultyThe final column of table 1 shows the average mark oneach station adjusted for differences in candidate andexaminer mix These adjusted marks are however verysimilar in pattern to the raw marks FACETS provides anestimate of the reliability of the differences between thelogit scores by comparing the standard deviation of thestation logit scores (010) with the root mean standarderrors for those scores (01) The reliability for station dif-ferences is calculated by FACETS as 099 (ie the differ-ences are highly reliable)
Examiner differencesThe yardstick in Figure 2 shows that examiners are morevariable than are stations the standard deviation being033 for examiners but only 010 for stations However itshould also be noted that the SD for candidates is 087meaning that the spread of candidates is 264 times thatof examiners (and hence the candidate variance is 697times as large as the examiner variance) On the basis ofthose figures 87 of the systematic variance in the marksis due to differences in candidates 12 due to differencesin examiners and 1 due to differences in station type Ininterpreting these results it should be noted that the FAC-ETS analysis cannot take into examiner-by-station andexaminer-by-candidate variance and hence any calcula-tion of reliability or similar figures is likely to be inflated
Table 1 Differences between the seven stations in average mark and effect estimated by FACETS The final column shows the average adjusted mark after taking examiner and candidate differences into account
Station Average (Raw) Point-Biserial Station (test) effect SE of effect Average (adjusted)
3a Cardiovascular 272 030 018 001 2763b Neurological 278 034 007 001 2831b Abdominal 278 030 006 001 2832 History taking 284 033 -005 001 295 Other 284 031 -005 001 294 Communication
and Ethics288 034 -011 001 293
1a Respiratory 288 033 -011 001 293
Page 7 of 22(page number not for citation purposes)
BMC Medical Education 2006 642 httpwwwbiomedcentralcom1472-6920642
Page 8 of 22(page number not for citation purposes)
The yardstick comparing marks on a common logit scale for candidate ability examiner stringency station difficulty and scaled marksFigure 2The yardstick comparing marks on a common logit scale for candidate ability examiner stringency station difficulty and scaled marks
----------------------------------------------------|Measr|+Candidate |-Examiner |-Station |S1 |----------------------------------------------------+ 5 + + + +(4) |rsquoClear passrsquo| | | | | || | | | | || | | | | || | | | | |+ 4 + + + + +| | | | | || | | | | || | Strong | | | || | candidates| | | |+ 3 + + + + +| | | | | || | | | | || | | Stringent | | || | | examiners | | |+ 2 + + (Hawks) + + + [Clear Pass| | | | | --- | Fail]| | | | | || | | | Difficult | || | | | stations | |+ 1 + + + + +| | | | | 3 | lsquoPassrsquo| | | | | || | | | | || | | | 3a | | 0 1b 2 3b 5 --- [PassFail]| | | | 1a 4 | | | | | | | | | | | | | || | | | | 2 | lsquoFailrsquo+ -1 + + + + +| | | | Easy | || | | | stations | || | | | | || | | | | --- | [Fail + -2 + + + + + Clear Fail]| | | | | || | | Lenient | | || | | examiners | | || | | (Doves) | | |+ -3 + + + + +| | | | | || | | | | || | | | | || | | | | |+ -4 + + + + +| | | | | || | | | | || | Weak | | | || | candidates | | | |+ -5 + + + +(1) +lsquoClear failrsquo----------------------------------------------------|Measr| = 103 | = 34 |-Station |S1 |----------------------------------------------------
Mean = 058 Mean = 0 Mean = 0 SD = 087 SD = 033 SD = 010
Note means of examiners stations and marks are fixed at zero
BMC Medical Education 2006 642 httpwwwbiomedcentralcom1472-6920642
relative to the true value However these statistics are notthe main interest of the present paper so that the problemis not a serious one
The yardstick of figure 2 shows that the extremes of exam-iner stringency are of a similar size to the differencebetween the Pass and Fail borderlines The distribution ofexaminer stringency estimates in the yardstick also makesclear that to a good first approximation stringency is nor-mally distributed and refutes any simple differentiationof examiners into two separate classes who can be calledhawks and doves
The accuracy with which examiner stringency is knowndepends for obvious reasons on the number of candi-dates that the examiner has examined Figure 5 shows thestandard error of the stringency effects in relation to thenumber of candidates examined An examiner who hasassessed 50 candidates has a standard error of about 019compared with 13 after examining 100 candidates 09after examining 200 candidates and 07 after examining400 candidates Stringency measures when only smallnumbers of candidates have been examined should betreated with care FACETS allows a calculation of the reli-
ability of examiner stringency effects which it gives as070 That is more than high enough for statistical analysisfor comparison of groups but estimates of the stringencyof individual examiners should also be treated with care
An important question concerns the factors which differ-entiate between stringent and lenient examiners Informa-tion was available on the sex of examiners and their yearof birth the number of candidates they had examinedand the proportion of candidates who were examined inthe UK These will be considered in turn
SexThe 1040 male examiners had a slightly higher stringencyscore (mean = 002 SD = 326) than the 123 female exam-iners (mean = -0537 SD = 359) although the differencewas not statistically significant (t = 1774 1161 df p =076)
Year of birthThere was no significant correlation of stringency withexaminer year of birth (r = -028 n = 1162 p = 336) Scat-tergrams showed no evidence of curvilinearity and nei-ther did quadratic regression show any significant effect
Cumulative probability of a candidate of particular ability crossing each of the scale boundaries between Clear Fail and Fail Fail and Pass and Pass and Clear PassFigure 3Cumulative probability of a candidate of particular ability crossing each of the scale boundaries between Clear Fail and Fail Fail and Pass and Pass and Clear Pass
Pass vs
FailClear Pass
vs Pass
Fail vs
Clear Fail
Ability (logit scale)
Pro
bab
ilit
y
Page 9 of 22(page number not for citation purposes)
BMC Medical Education 2006 642 httpwwwbiomedcentralcom1472-6920642
Number of candidates examinedStringency showed a significant correlation with thenumber of candidates who had been examined (r = 082n = 1259 p = 003) which is shown in figure 6 Examinerswho had examined more candidates tended to be some-what more stringent (more hawkish)
Proportion of candidates examined in the UKOf the 1259 examiners 1037 (824) examined only inthe UK 119 (95) examined only outside the UK (inwhat was usually their home country or a nearby centre)and 103 (82) examined both in and out of the UK usu-ally being the external examiner sent to a non-UK centreto work with the local examiner The correlation betweenstringency and the proportion of candidates examinedoutside the UK is just significant (r = -058 n = 1259 p =039) Figure 7 shows that those examining outside theUK are slightly more hawkish than those examiningwithin the UK although the effect is small
Ethnic origin of examinersSelf-reported ethnic origin was available for 955 examin-ers of whom 84 (88) were non-European and the
remainder were European Ethnic origin was available foronly 5 of the examiners who examined entirely outside ofthe UK and all 5 were non-European The 84 non-Euro-pean examiners had a significantly higher stringency score(mean = 075 SD = 326) compared with the 871 exam-iners of European ethnic origin (mean = -0187 SD =326) the difference being significant (t = 2509 953 df p= 012)
Multiple regressionMany of the background factors describing examinerswere confounded (eg female examiners tended to beyounger and to have examined fewer candidates) Thesimultaneous effects of sex year of birth number of can-didates examined and proportion of candidates exam-ined in the UK were examined by a backwards eliminationmultiple regression Missing values were handled bymean substitution Two effects were independently signif-icant Examiners who had examined more candidateswere more hawkish (beta = 089 p = 005) and examinersof non-European ethnic origin were more hawkish (beta= 079 p = 014) There was no significant sex differencein the multivariate analysis
The probability of a candidate of a particular ability achieving each of the four marks on a station of average difficulty with an average examinerFigure 4The probability of a candidate of a particular ability achieving each of the four marks on a station of average difficulty with an average examiner
Clear Fail Clear Pass
Fail Pass
Ability (logit scale)
Pro
bab
ilit
y
Page 10 of 22(page number not for citation purposes)
BMC Medical Education 2006 642 httpwwwbiomedcentralcom1472-6920642
Candidate differences reliability of candidate marksAs well as scale station and examiner differences theyardstick of figure 2 also shows scores for candidates It isclear that there is a wide variation in candidate ability asmight be expected The standard deviation of the candi-date logit scores is 087 (and the adjusted standard devia-tion is 078) with logit scores in the range of -404 to+510 The average standard error (root mean square) ofthe logit scores is 037 As a result the reliability of the esti-mates of candidate ability is 082 The standard error onthe logit scale for candidates at the pass mark on the rawscale of 41 is about 035 which is equivalent to 3 markson the raw mark scale That means that an individual can-didate scoring 41 has a 95 chance of their true scorebeing two standard errors either side of their actual markin the range 35 to 47 As mentioned above FACETS can-not take into examiner-by-station and examiner-by-candi-date variance and hence estimates of reliability may beinflated relative to the true value
The candidates logit scores can be converted back toscores on the same scale as that used by the examinersand those marks can be adjusted for differences in exam-iner stringency and station difficulty (which FACETS callsfair marks and we will call adjusted marks) Figure 8shows a scattergram of the adjusted mark for each candi-date plotted against the candidates raw mark The corre-lation between the two marks is 0991 Although the rawand adjusted marks are very similar they are not alwaysexactly so some candidates performing better on theadjusted mark which takes into account the differences in
examiner stringency (and these candidates are the oneswho saw more stringent examiners)
The conventional pass mark for the examination based onsummed raw marks is 41 (although it is probably betterdescribed as being 405 since candidates with a mark of 41pass whereas those with a mark of 40 fail and the truepass mark is somewhere between those two bounds) Thevertical and horizontal dashed lines in figure 8 are there-fore set at 405 and indicate those candidates who wouldpass or fail using the raw or the adjusted mark Of the10145 candidates 4568 would pass using either crite-rion and 5158 would fail using either criterion However263 candidates (26) who failed using the raw mark cri-terion would have passed using adjusted marks and 156candidates (15) who currently have passed the exami-nation would have failed using adjusted marks The use ofadjusted marks would therefore have increased the passrate from 466 to 476 a 1 change in the proportionof candidates passing the examination
Testing the assumptions of the modelLike all statistical models the multi-facet Rasch model isa simplification of the subtleties of real data It is useful asa model in so far as a relatively small number of parame-ters can explain most of the variation present in a complexdata In the present case 142030 data points are beingexplained by a total of 11412 parameters (10145 for the10145 candidates 1258 for the 1259 examiners 6 forthe seven stations and 3 for the four scale points) a 92reduction in information (and equivalent to roughly onefourteenth of the total data)
FACETS provides a number of statistics for diagnosing thequality of the fit of the model to the data of which themanual states that If mean-squares indicate only smalldepartures from model-conditions then the data areprobably useful for measurement The manual also saysthat mean-square statistics in the range 05 to 15 aredesirable and that those over 2 should be treated withcare There have also been other criticisms of goodness-of-fit statistics derived from Rasch models [44]
Examiner goodness of fit statisticsFor the examiner statistics the INFITMS statistic was largerthan 2 in only 3 of the 1259 cases (02) and was largerthan 15 in only 39 (31) cases At the other end of thescale only 38 (30) examiners had values of less than05 Figure 9 shows that the fit of the model improves asthe number of candidates examined increases most of theoutliers occurring with those assessing 50 or fewer candi-dates Overall therefore the fit of the model to the datafrom the examiners is good An important implication isthat examiners can rate different stations equally wellacross candidates (or to put it another way there is no
The standard error of examiner stringencyleniency in rela-tion to the total number of candidates examined in PACESFigure 5The standard error of examiner stringencyleniency in rela-tion to the total number of candidates examined in PACES
NCANDS
6005004003002001000
SE
14
12
10
8
6
4
2
00
Number of PACES candidates examined
Stan
dard
err
or o
f ex
amin
er s
trin
genc
y
Page 11 of 22(page number not for citation purposes)
BMC Medical Education 2006 642 httpwwwbiomedcentralcom1472-6920642
case specificity at the level of examiners who are judgingall stations equally effectively)
Candidate goodness of fit statisticsFigure 10 shows the INFITMS statistic for the fit of individ-ual candidates to the Rasch model in relation to theiroverall logit score It is clear that there is a substantialnumber of cases with values of greater than 2 and thatthese occur particularly in the middle of the range Thislack of fit probably reflects case-specificity The Raschmodel assumes that candidates differ on a single dimen-sion and hence ability on each station is determinedentirely by overall ability However a candidate who wasparticularly good at some stations (perhaps due to specificclinical experience in say cardiology or neurology) butwas relatively poor at other stations would not fit themodel as well as possible Such candidates will of coursebe more apparent in the middle of the range since verypoor candidates will anyway get low marks on everythingand very good candidates will get high marks on all sta-tions irrespective of their specific experience
The long-term reliability of examiner stringency measuresAn important question concerns whether the stringency ofexaminers is a relatively stable feature of their examiningbehaviour or whether it varies with time To answer thisquestion we carried out two separate FACETS analysesone for diets 1ndash4 (June 2000 ndash June 2001) and the otherfor diets 5 ndash 9 (Oct 2001 ndash March 2004) In each analysisthe program calculated entirely separate estimates ofexaminer stringency based on different candidates anddifferent pairings of examiners Of the 1259 examiners inthe overall analysis 749 had examined both in the earlierperiod and the later period Figure 11 shows a scattergramof the stringency estimates for each examiner in the twoperiods broken down according to the total number ofcandidates examined by each examiner in the two peri-ods The overall correlation is 0455 (n = 749 p lt 001)However this correlation will inevitably be reduced some-what by the examiners who have examined only a fewcandidates and for whom the estimates are less stableCorrelations were therefore calculated separately accord-ing to the number of candidates examined Only 14 exam-iners had seen 400 or more candidates and they were
The relationship between examiner stringency (ordinate) and number of candidates examined (abscissa)Figure 6The relationship between examiner stringency (ordinate) and number of candidates examined (abscissa) Examiners who had examined more candidates are shown with larger symbols The fitted Lowess line shows that stringency increases with the number of candidates examined
NCANDS
6005004003002001000
ME
AS
UR
E
15
10
5
00
-5
-10
-15
-20
NCANDS2
400+
200-399
100-199
50-99
1-49
Total Population
Number of candidates examined
[Doves
]
S
trin
gen
cy
[Haw
ks]
Page 12 of 22(page number not for citation purposes)
BMC Medical Education 2006 642 httpwwwbiomedcentralcom1472-6920642
therefore merged into the group of examiners who hadseen 200 or more candidates For these 157 examiners thecorrelation between the stringency measures in the twoperiods was 0598 (p lt 001) For the 393 examiners whohad seen between 100 and 199 candidates the correlationwas 0533 (p lt 001) and for the 152 examiners who hadseen 50 to 99 candidates the correlation was 0411 (p lt001) Finally for the 47 examiners who had seen less than40 candidates the correlation was only 0129 (p = 387)For those examiners seeing large numbers of candidates itis clear that there is an acceptably high correlation of0598 between the two independent estimates of strin-gency A correlation of 0598 given that it is based on twoestimates based on half as many subjects is compatiblewith the overall estimate described earlier of the reliabilityof examiner stringency measures of 070
We also assessed long-term stability using firstly diets 1ndash3and then diets 7ndash9 since the latter diets were all separatedfrom the former by at least a one-year interval The within-
period reliabilities reported by FACETS for these groups ofdiets were 063 and 061 (and of course they are lowerthan those calculated for all nine diets reported earlierbecause they are based on fewer data) The correlations ofthe stringency estimates across the two periods were 0402(n = 146 p lt 001) for those examining more than 200candidates in the entire data 0442 (n = 309 p lt 01) forthose examining 100ndash199 candidates 0335 (n = 101 p lt001) for those examining 50ndash99 candidates and 0468(n = 20 p = 037) for those examining 49 or fewer candi-dates overall These between-period correlations are allcompatible with the within-period reliabilities and con-firm that stringency is stable across periods of a year ortwo within the limits of measurement
Differences between communication and examination stationsAn important innovation of the PACES examination inthe context of the MRCP(UK) was the introduction of twostations which assessed communication rather thanclinical examination skills one assessing history taking
The relationship between examiner stringency (ordinate) and percentage of candidates examined in the UK (abscissa)Figure 7The relationship between examiner stringency (ordinate) and percentage of candidates examined in the UK (abscissa) Examin-ers who had examined more candidates are shown with larger symbols The fitted Lowess line shows the relationship between the two measures
PCTUK
1101009080706050403020100-10
ME
AS
UR
E
15
10
5
00
-5
-10
-15
-20
NCANDS2
400+
200-399
100-199
50-99
1-49
Total Populatio
Percent of candidates examined in the UK
[Doves
]
S
trin
gen
cy
[Haw
ks]
Pass
Page 13 of 22(page number not for citation purposes)
BMC Medical Education 2006 642 httpwwwbiomedcentralcom1472-6920642
and the other assessing how the candidate handled diffi-cult communication and ethical situations Examinerssometime express concern that they feel less confident inassessing these stations because of a relative lack of expe-rience in contrast to the examination stations whichassess skills which they all use and assess on a daily basisand in which they have been proficient for many years Itis therefore of interest to compare the performance of thetwo communication stations with the five examinationstations
The first question concerns whether the communicationstations differ in their difficulty or discrimination as com-
pared with the other stations The Rasch model used forthe multi-facet modelling is a one-parameter Raschmodel and it therefore only allows stations to differ intheir overall difficulty (and the analyses reported earliersuggest that there are only relatively small differences inoverall difficulty) The Rasch model used by FACETS infact assumes that not only stations but also examinerscandidates and marks differ only in their difficulty Thatassumption cannot be tested directly with FACETS as itdoes not allow discrimination to differ between the vari-ous components of the examination However two-parameter item response theory (2-IRT) models do allowdifferences in discrimination between stations [4546]
The relationship between the raw mark on the examination and the FACETS adjusted mark which takes examiner stringency and station difficulty into accountFigure 8The relationship between the raw mark on the examination and the FACETS adjusted mark which takes examiner stringency and station difficulty into account The pass mark for the examination is indicated by the dashed lines and has been set at 405 (see text ie between 40 (fail) and 41 (pass)) Candidates marked in black fail the exam using both raw and adjusted marks and candidates in blue pass the examination using both raw and adjusted marks Candidates in green pass the exam on the basis of their raw mark but fail on the basis of the adjusted mark and candidates in red fail on the basis of their raw mark but pass on the basis of their adjusted mark The inset figure shows a magnification of the region around the pass mark It should be noted that a small amount of random horizontal jitter has been applied to the raw marks (which have to be integers) so that the data points are more easily seen
605040302010
60
50
40
30
20
10 4443424140393837
44
43
42
41
40
39
38
37
Raw mark on examination
Ad
just
ed m
ark
on
ex
amin
atio
n
Page 14 of 22(page number not for citation purposes)
BMC Medical Education 2006 642 httpwwwbiomedcentralcom1472-6920642
(although 2-IRT models can only fit a single facet to thedata) Here the program Xcalibre [41] is used to fit a 2-IRTmodel to the marks at each station in order to assess thedifficulty and the discrimination of each station
The 2-IRT model fitted by Xcalibre has two parameters foreach component in the test the difficulty which is equiva-lent to the single difficulty parameter fitted in the Raschmodel and the discrimination which allows the slope ofthe item response curve to differ between stations A par-tial credit model was also fitted by fitting three separatebinary response measures to each judgement one for theClear Fail-Fail borderline one for the Fail-Pass borderlineand one for the Pass-Clear Pass borderline [47] For eachcandidate there were therefore three binary marks derivedfrom each of the fourteen scaled marks making 42 itemsaltogether Because each candidate was assessed on eachstation by two examiners two marks were analysed foreach station although each was fitted separately Howeverthe two marks which came from each examiner were effec-tively randomly allocated the two parameters wereexpected to be similar and indeed that was exactly the
case The two parameters from each station at each markhave therefore been averaged for the present analysis
Table 2 shows the difficulty and the discriminationparameters at each mark level for the seven stations andfigure 12 shows a plot of the item response functions forthe marks and the stations Table 2 shows that there aresignificant differences between stations in their difficultyand discrimination since the standard errors are small rel-ative to the differences However figure 12 shows that inpractice the differences have little impact on the overallshape of the curves and that the assumption in Raschmodelling of equal discriminations is unlikely to haveinvalidated the analysis to any great extent
Although a concern of examiners has been that they areuncertain whether they are discriminating well on thecommunication stations the fact is that the discrimina-tion parameters at the pass mark are higher in the twocommunication stations (073 and 079) than in any ofthe five examination stations (range = 058 to 070) andthat is also the case at the Clear Fail-Fail boundary (Com-
The INFITMS goodness of fit statistics for individual examiners in relation to the number of candidates examinedFigure 9The INFITMS goodness of fit statistics for individual examiners in relation to the number of candidates examined The solid line shows the fitted Lowess curve The horizontal dashed lines indicate bounds of 05 and 15 which indicate acceptable fit
6005004003002001000-100
INF
ITM
S
25
20
15
10
5
00
-5
NCANDS2
400+
200-399
100-199
50-99
1-49
Total Popula
Number of candidates examined
FA
CE
TS
in
fit
Mea
n S
quar
e st
atis
tic
Page 15 of 22(page number not for citation purposes)
BMC Medical Education 2006 642 httpwwwbiomedcentralcom1472-6920642
munication stations 081 and 089 examination stationsrange = 065 ndash 080) Only at the Pass-Clear Pass bound-ary are discriminations of the two communication sta-tions (061 and 064) similar to those in the examinationstations (range = 056 to 070) Overall it can be con-cluded that examiners are discriminating somewhat betteron the communication stations although the differencesare relatively small Certainly there is no evidence thatexaminers are performing less effectively on the commu-nication stations than on the examination stations
Multi-facet Rasch modelling of communication and examination stationsSince the assumption of equivalent levels of discrimina-tion across stations has been met to a reasonable degree inthe different types of station it is possible to use FACETSto examine scores of candidates on just the communica-tion stations or just the examination stations There arehowever five examination stations and only two commu-nication stations making it difficult to have a direct com-parison of scores on the two since inevitably there is lessmeasurement error with five stations As a result a com-posite of the two communication stations was comparedwith a composite of the respiratory and cardiovascular sta-tions There was somewhat more variation amongst can-didates in the communication stations (SD = 183) thanin the examination stations (SD = 143) and as a resultthe reliability for measurement of candidate ability wasslightly higher in the communication stations (77) thanin the examination stations (69) There was also a littlemore examiner variation in the communication stations(SD = 78) than in the examination stations (SD = 67)and the examiner reliability was also marginally higher inthe communication stations (70) than in the examina-tion stations (68) The boundaries between Clear FailFail Pass and Clear Pass were also slightly further apart inthe communication stations (-260 -005 and 265) thanin the examination stations (-212 010 and 202) Takenoverall though the picture is of remarkable similaritybetween the communication and the examination sta-
tions with a slightly higher reliability and variability inthe communication stations both amongst candidatesand amongst examiners
ConclusionThis paper describes an analysis of 10145 candidates tak-ing the PACES examination over nine diets when theywere examined by a total of 1259 examiners whoawarded a total of 142030 marks The multi-facet Raschmodel allowed the data to be broken down into three sep-arate components of candidate examiner and stationalong with separate measures for the several componentsof the four-point marking scheme Overall the model fit-ted the data reasonably well particularly in the examinerfacet although there was some evidence that the modelfitted less well for candidates which may have been dueto case-specificity in which candidates differed idiosyn-cratically perhaps as a result of different training on dif-ferent stations Nevertheless the latter effects are smalland not relevant to the purpose of the examination as awhole which requires an overall pass across the differentstations
The multi-facet Rasch model has some limitations whichshould be emphasised strongly in considering the currentanalysis In particular FACETS unlike generalisabilitytheory cannot consider variance due to interactioneffects primarily because with say many candidates andmany examiners there is an extremely large number ofdegrees of freedom relating to interaction effects (andhence an extremely large number of dummy variables isneeded) and it is unrealistic to attempt to estimate somany parameters Generalisability theory approaches thisestimation problem in a very different way and suchinteraction effects can be calculated given certain designconstraints (which unfortunately are not applicable here)and the variance terms are often found to be significantand meaningful in examination situations As a result theestimates provided in this paper of total variance and thecontribution of various facets may be inaccurate and
Table 2 Item difficulty and discrimination parameters fitted by Xcalibre to the candidate by station data for PACES The three separate borderlines for the four points on the mark scale are shown separately Figures in brackets are standard errors of the estimates The five examination stations are shown at the top ranked from most to least difficult on the fail-pass criterion The two stations at the bottom in bold are the communication stations
Difficulty DiscriminationStation Clear Fail-Fail Fail-Pass Pass-Clear Pass Clear Fail-Fail Fail-Pass Pass-Clear Pass
3a Cardiovascular -260 (042) -045 (0028) 156 (0032) 065 (0021) 058 (0031) 060 (0023)3b Neurological -237 (037) -065 (0025) 143 (0029) 080 (0022) 070 (0027) 068 (0023)
1b Abdomen -264 (043) -068 (027) 139 (0031) 067 (0021) 061 (0028) 062 (0024)1a Respiratory -277 (045) -085 (026) 113 (0026) 069 (022) 067 (0026) 070 (0024)
5 Other -292 (048) -100 (0028) 166 (0034) 073 (0023) 061 (0026) 056 (0023)2 History -247 (039) -079 (0024) 139 (0031) 081 (0022) 073 (0026) 061 (0024)
4 Communication amp Ethics -236 (036) -085 (0023) 116 (0028) 089 (0023) 079 (0025) 064 (0023)
Page 16 of 22(page number not for citation purposes)
BMC Medical Education 2006 642 httpwwwbiomedcentralcom1472-6920642
should be treated with care In particular they probablyshould not be used for calculating the overall reliability ofthe examination or similar statistics However and it isan important however the major interest of this study isin differences between examiners in leniency-stringencyand those differences are primarily likely to be maineffects which FACETS can handle appropriately Theremight also be additional variance consisting of interac-tions between examiners and other aspects of the exami-nation (such as candidates or cases) and future workneeds to look for such effects using different methodolo-gies but the main effects analysed and discussed here areunlikely to disappear in any such analyses The FACETSanalysis is therefore appropriate and adequate as a firstapproach to studying examiner effects on leniency andstringency
The principle interest of this study is in differencesbetween examiners Humans differ in many behaviouralattributes and it is hardly surprising that examiners alsodiffer in their propensity to pass or fail candidates This
study of hawks and doves amongst examiners foundhighly significant differences in examiner behaviourwhich subsidiary analyses showed were consistent acrosstime (within the limits of the reliability of the measures)Examiner variance accounted for about 12 of the sys-tematic variance (as compared to only 1 depending ondifferences in difficulty of stations and 87 dependingon differences between candidates) Nevertheless thesedifferences are meaningful particularly to a borderlinecandidate for whom random allocation of examiners hap-pens to mean that a majority of examiners assessing themcould be construed as hawks FACETS allows for rawmarks to be adjusted for differences in stringency betweenexaminers If the PACES examination is re-marked usingadjusted marks then about 4 of candidates wouldchange their result across the pass-fail boundary slightlymore going up than down so that the overall pass ratewould increase slightly from 466 to 476
The decision as to whether or not to adjust marks forexaminer stringency depends on a number of factors and
The INFITMS goodness of fit statistics for individual candidates in relation to overall abilityFigure 10The INFITMS goodness of fit statistics for individual candidates in relation to overall ability The horizontal dashed lines indicate bounds of 05 and 15 which indicate acceptable fit
MEASURE
45
40
35
30
25
20
15
10500
-5
-10
-15
-20
-25
-30
-35
INF
ITM
S35
30
25
20
15
10
5
00
FAC
ET
S in
fitM
ean
Squa
re s
tatis
tic
Ability (logit scale)
Page 17 of 22(page number not for citation purposes)
BMC Medical Education 2006 642 httpwwwbiomedcentralcom1472-6920642
the decision is not an easy one Several factors come intoplay
1 The reliability of the adjustments for examiner strin-gency is easier to apply as more examiners assess morecandidates across more diets It is not technically possibleto adjust the results of a single diet of PACES because onecannot obtain linkage across the various subsets of exam-iners (and even if it were possible the result would be lessreliable than a correction based on as much data as possi-ble on the behaviour of examiners based on all examina-tions in which they had taken part) In passing it shouldbe said that it might be possible to obtain linkage withina single diet if linkage could be obtained across stationsperhaps by using a simulator or video station which wasobjectively marked and therefore of fixed difficulty eitherfor all candidates or for large groups of candidates across
examination centres That is not though possible atpresent
2 If examiner stringency can only be assessed reliablyacross multiple diets then correction for stringency doesrequire that stringency is a stable characteristic of examin-ers The comparison of examiners in diets 1ndash3 with thosein diets 7ndash9 suggests that there is reasonable stability instringency across a period of a year or two although thatneeds to be further examined
3 It is sometimes suggested that examiners who arehawks or doves should be given feedback about theirpropensity for marking or high in order that they can thentry and correct that tendency The present analysis wouldin fact require the precise opposite It is better given themethod of analysis that examiners do not try and correct
Examiner stringency estimated from diets 1ndash4 (abscissa) in relation to examiner stringency estimated from diets (5ndash9)Figure 11Examiner stringency estimated from diets 1ndash4 (abscissa) in relation to examiner stringency estimated from diets (5ndash9) Examin-ers who had examined more candidates in total across all diets are shown with larger symbols The solid black line is the fitted lowess curve
MEASURE
1510500-5-10-15-20
ME
AS
UR
E2
20
15
10
5
00
-5
-10
-15
-20
NCANDS2
400+
200-399
100-199
50-99
1-49
Total Population
Examiner stringency (diets 1-4)
Exa
min
er s
trin
genc
y (d
iets
5-9
)
Page 18 of 22(page number not for citation purposes)
BMC Medical Education 2006 642 httpwwwbiomedcentralcom1472-6920642
any differences in stringency but instead they continue tobehave as they have always done Biasses of any sortwhich are fixed and unchanging can be corrected statisti-cally whereas biasses which are varying are of their verynature difficult to predict and correction will be less reli-able (and hence less valid and less justifiable)
4 There might be an argument for pairing examiners onthe basis of their stringency so that if a candidate sees oneexaminer known to have a high stringency then the otherwill have a relatively low stringency Whether that wouldbe practicable given the complex constraints of a realexamination is not clear but it might be worth investigat-
ing The clear advantage would be that the marking of theexamination could then be based on raw scores whichhave a high degree of face validity and are easy to justify
Although there seems little doubt that examiners do differin their stringency it is much less clear where those differ-ences come from Because our sample has a large sampleof more than a thousand examiners it is possible to assessthe role of several background factors Important negativeresults are that we could find no sex differences and nei-ther did there seem to be any relationship to age olderexaminers not being more hawkish than younger examin-ers Examiners who had examined more candidates were
Two-parameter item-response theory curves for the seven stationsFigure 12Two-parameter item-response theory curves for the seven stations The left-most curves are for the Clear Fail ndash Fail border-line the middle curves for the Fail-Pass borderline and the right-most curves for the Pass-Clear Pass borderline The two com-munication stations are shown as solid lines (Black Station 2 ndash History Grey Station 4 ndash Communication and ethics) and the five examination stations are shown as dashed lines (Dark Blue Station 1a ndash Respiratory Green Station 1b ndash Abdomen Purple Station 3a Cardiovascular Orange Station 3b Neurological Pale Blue Station 5 Other) It should be noted that Xcalibre and FACETS calculate their parameters in slightly different ways due to making different assumptions to ensure identifiability and that the output from the programs is therefore not directly comparable (although there is a mathematical relationship between them) This figure should therefore only be used to give a sense of the relative difference between the stations rather than to be used to compare specific values of the parameters with those derived by FACETS
0
01
02
03
04
05
06
07
08
09
1
-3 -25 -2 -15 -1 -05 0 05 1 15 2 25 3
Ability (logit scale)
Pro
bab
ility
Page 19 of 22(page number not for citation purposes)
BMC Medical Education 2006 642 httpwwwbiomedcentralcom1472-6920642
more hawkish although whether that is the result of expe-rience making them more hawkish or more hawkishexaminers choosing to examine more often is not clearLikewise our data suggest that UK examiners from minor-ity ethnic groups are also more hawkish and again wehave no explanation for that although we did find someevidence for a similar effect in a different analysis [43] Aninteresting and important analysis would be to assess howthe ethnic origin of an examiner and a candidate interactbut as yet that analysis has not been possible for a host oftechnical reasons We are however working on it
The reasons for differences in examiner stringency couldform the basis for a number of future studies If as seemspossible stringency is a relatively stable trait then it mightbe predicted that it would relate to other aspects of per-sonality or behaviour and in particular the Big Fivewhich have been shown to relate to many and variedaspects of human behaviour [4849] We would hope toaddress this issue in a future study
The use of FACETS has allowed a full analysis of the marksfrom nine diets of the PACES examination it has allowedthe separate and independent estimation of effects due tocandidate examiner and station type As a result it allowsa fuller discussion of the origins of examiner effects andon ways in which the examination might be revised Apoint of some importance in the context of designingexaminations is that we would not have been able to carryout the present analysis if each station had been assessedby only a single examiner A recurrent suggestion withinthe literature on the design of clinical examinations usu-ally driven by analyses based on generalisability theory isthat when one is trying to maximise the reliability of anOSCE-style examination where rater availability is a lim-iting factor to increasing test length [due to scarcity andexpense] more can be gained by using one rater per sta-tion and having more stations than using two raters perstation [50] Although that seems a reasonable strategyit has two potential problems Firstly it does assume thatexaminer behaviour remains unchanged when only oneexaminer is present rather than two However the pres-ence of another examiner and the potential for cross-checking between independently given marks may wellencourage each of the examiners to be more careful in car-rying out their task and that a lowered examiner reliabil-ity for examiners working individually may mean that theoverall exam reliability does not increase as much asmight be predicted from theoretical calculations Sec-ondly and it is one which is particularly relevant to thepresent analysis the use of a single examiner at each sta-tion does not allow any statistical evaluation of hawk anddove effects with the likelihood that such effects may wellincrease in the absence of effective monitoring
The figurative description of behavioural differences byusing animal names is nothing new the use of hawk todescribe a person who advocates a hard-line policygoes back to at least 1548 although intriguingly suchhawks were contrasted with a range of animals includingbeetles (1824) and pigeons (1843) whereas the moderncontrast with doves only came into use in 1962 at the timeof the Cuban Missile Crisis when The hawks favored anair strike to eliminate the Cuban missile bases The dovesopposed the air strikes and favored a blockade (OxfordEnglish Dictionary online [51]) The earliest usages ofwhich we are aware in the context of medical educationare both from 1974 [726] with one of them concerningthe MRCP(UK) examination [26] However the problemof hawks and doves amongst examiners is not a new oneand has been described for a century or more in education[52] under a number of different names Hawks anddoves were described as the Vulture and the Husband-man by A C Hilton in a poem written in 1872 [27] andvariants of the Hawk were described as the Spider andthe Poultryman in a 1904 poem by T C Dent a surgicalexaminer [53] In 1913 Sir William Osler referred toMetallics with their aggressive harsh nature and hardface whose expression sends a chill to the heart of thecandidate and it reaches his bone marrow [with ] the firstquestion to be contrasted with the Molluscoid theinvertebrate examiner so soft and slushy that he has notthe heart to reject the man Nevertheless Osler recog-nised that between the metallic and the molluscoid isthe large group of sensible examiners [54] Despite thelong-running awareness of the hawk-dove problem inmedical examinations we are not aware of any previousstudy which has used a rigorous statistical method toassess properly the stringency or leniency of large num-bers of examiners and to examine how background fac-tors relate to stringency and leniency
ConclusionThere is little doubt from these data that examiners dodiffer in their leniency or stringency and the effect can beestimated using Rasch modelling The reasons for the dif-ferences are not so clear although there are some demo-graphic correlates and the effects appear to be reliableacross time Various ways are suggested by which accountmay be taken of differences either by adjusting marks orperhaps more effectively and more justifiably by pairinghigh and low stringency examiners so that raw marks canthen be used in the determination of pass and fail Theperformance of the PACES examination is under contin-ual review by the Colleges and the implications of theseand other findings for the running of the examination area part of that review
Page 20 of 22(page number not for citation purposes)
BMC Medical Education 2006 642 httpwwwbiomedcentralcom1472-6920642
AbbreviationsFACETS This is not an abbreviation or an acronym butthe name of a computer program
MRCP(UK) Membership of the Royal Colleges of Physi-cians of the United Kingdom
OSCE Objective Structured Clinical Examination
PACES Practical Assessment of Clinical ExaminationSkills
SD Standard deviation
SE Standard error
UK United Kingdom of Great Britain and Northern Ire-land
Competing interestsICM is Educational Advisor to the MRCP(UK) and hasbeen an examiner for the MRCP(UK) Part 1 and Part 2(but not PACES) MT and JM are employees of theMRCP(UK)
Authors contributionsJM and MT were primarily responsible for the collectionand collation of data ICM was responsible for the statisti-cal analysis and wrote the first draft of the manuscript allauthors contributed to the final draft of the manuscript
Additional material
AcknowledgementsWe are grateful to various members of the MRCP(UK) PACES Board and the MRCP(UK) Research Committee for their comments on previous drafts of this manuscript and in particular we thank Simon Williams for his assistance and Brian Clauser for his detailed comments on an earlier ver-sion of the manuscript
References1 Douglas C A day in the country British Medical Journal 2004
32815732 Weisse AB The oral examination awesome or awful Perspec-
tives in Biology and Medicine 2002 45569-5783 Ferrell BG A critical elements approach to developing check-
lists for a clinical performance examination Medical EducationOnline 1996 15
4 Norcini J Blank LL Arnold GK Kimball HR Examiner differencesin the Mini-Cex Advances in Health Sciences Education 1997227-33
5 Taylor A Rymer J The new MRCOG Objective StructuredClinical Examination ndash the examiners evaluation Journal ofObstetrics and Gynaecology 2001 21103-106
6 Harden RM Cairncross RG Assessment of practical skills theobjective structured practical examination (OSPE) Studies inHigher Education 1980 5187-196
7 Stokes JF The clinical examination ndash assessment of clinical skills ASMEMedical Education Booklet number 2 Dundee Association for the Studyof Medical Education 1974
8 Schubert A Tetzlaff JE Tan M Ryckman JV Mascha E Consistencyinter-rater reliability and validity of 441 consecutive mockoral examinations in anesthesiology Implications for use asa tool for assessment of residents Anesthesiology 199991288-298
9 Allison R Katona C Audit of oral examinations in psychiatryMedical Teacher 1992 14383-389
10 Newble D Dawson B Dauphinee D Page G Macdonald M Mulhol-land H Swanson D Thomson A van der Vleuten C Guidelines forassessing clinical competence Teaching and Learning in Medicine1994 6213-220
11 Ferrell BG Thompson BL Standardised patients a long-stationclinical examination format Medical Education 1993 27376-281
12 Solomon DJ Ferenchick G Sources of measurement error in anECG examination implications for performance-basedassessments Adv Health Sci Educ Theory Pract 2004 9283-290
13 Schuwirth LW Van der Vleuten CP The use of clinical simula-tions in assessment Med Educ 2003 3765-71
14 Govaerts MJ Van der Vleuten CP Schuwirth LW Optimising thereproducibility of a performance-based assessment test inmidwifery education Adv Health Sci Educ Theory Pract 20027133-145
15 Wass V van der Vleuten C Shatzer J Jones R Assessment of clin-ical competence Lancet 2001 357945-949
16 Ferrell BG Clinical performance assessment using standard-ized patients a primer Fam Med 1995 2714-19
17 Norman G Bordage G Page G Keane D How specific is case spe-cificity Medical Education 2006 40618-623
18 Maynard Smith J Evolution and the theory of games Cambridge Cam-bridge University Press 1982
19 Lovett B Collins R Lamparelli M The intercollegiate exam 2001[httpwww frist orgasitmeetingsyearbook2001INTERCOLLEGIATE pdf]
20 Teaching on the run tips 9 in-training assessment MedicalJournal of Australia 2005 18333-34
21 Raymond MR Viswesvaran C Least squares models to correctfor rater effects in performance assessment Journal of Educa-tional Measurement 1993 30253-268
22 Houston WM Raymond MR Svec JC Adjustments for ratereffects in performance assessment Applied Psychological Meas-urement 1991 15409-421
23 Williams SM Laterality newsletter Laterality Newsletter 19882(1)
24 Fitzpatrick AR Ercikan K Yen WM Ferrar S The consistencybetween raters scoring in different test years Applied Measure-ment in Education 1998 11195-208
25 Raymond MR Webb LC Houston WM Correcting perform-ance-rating errors in oral examinations Evaluation and theHealth Professions 1991 14100-122
26 Fleming PR Manderson WG Matthews MB Sanderson PH Stokes JFEvolution of an examination MRCP(UK) British Medical Journal1974 i99
27 Gibberd FB The MRCP(UK) examination London Edinburgh and Glas-gow Royal Colleges of Physicians 1994
28 PACES Practical Assessment of Clinical Examination SkillsThe new MRCP(UK) clinical examination J R Coll PhysiciansLond 2000 3457-60
29 Bradley RA Terry ME The rank analysis of incomplete blockdesigns I The method of paired comparisons Biometrika1952 39324-345
30 Bock RD Jones LV The measurement and prediction of judgement andchoice San Francisco Holden-Day 1968
31 David HA The method of paired comparisons London Charles Griffin1963
Additional File 1Statement by MRCP(UK) concerning recruitment training and monitor-ing of examinersClick here for file[httpwwwbiomedcentralcomcontentsupplementary1472-6920-6-42-S1pdf]
Page 21 of 22(page number not for citation purposes)
BMC Medical Education 2006 642 httpwwwbiomedcentralcom1472-6920642
Publish with BioMed Central and every scientist can read your work free of charge
BioMed Central will be the most significant development for disseminating the results of biomedical research in our lifetime
Sir Paul Nurse Cancer Research UK
Your research papers will be
available free of charge to the entire biomedical community
peer reviewed and published immediately upon acceptance
cited in PubMed and archived on PubMed Central
yours mdash you keep the copyright
Submit your manuscript herehttpwwwbiomedcentralcominfopublishing_advasp
BioMedcentral
32 Rasch G An item analysis which takes individual differencesinto account British Journal of Mathematical and Statistical Psychology1966 1949-57
33 Andrich D Rasch models for measurement Newbury Park Sage 1988 34 Fischer GH Molenaar IW (editors) Rasch models Foundations recent
developments and applications New York Springer 1995 35 Linacre JM FACETS Rasch measurement computer program Chicago
Winstepscom 2004 36 Linacre JM The Partial Credit Model and the One-Item Rating Scale Model
2006 [httpwwwraschorgrmtrmt191ehtm] Accessed 18thAugust 2006
37 Anonymous Polytomous Rasch model 2006 [httpenwikipediaorgwikiPolytomous_Rasch_model] Accessed 18th August 2006
38 Engelhardt G Jr Constructing rater and task banks for per-formance assessments Journal of Outcome Measurement 1997119-33
39 Weeks DL Williams DR A note on the determination of con-nectedness in an N-way cross classification Technometrics1964 6319-324
40 Anonymous Examination Format 1995 [httpwwwmrcpukorgPACESPacesFormathtm] Accessed 18th August 2006
41 Anonymous Users manual for the XCALIBRE marginal maximum-likeli-hood estimation program St Paul Minnesota Assessment Systems Cor-poration 1995
42 Dacre J Besser M White P MRCP(UK) PART 2 Clinical Exam-ination (PACES) a review of the first four examination ses-sions (June 2001 ndash July 2002) Clin Med 2003 3452-459
43 Dewhurst NG McManus IC Mollon J Dacre JE Vale JA Perform-ance in the MRCP(UK) Examination 2003ndash4 Analysis of passrates of UK graduates in relation to self-declared ethnicityand gender 2006 in press
44 Karabatsos G A critique of Rasch residual fit statistics Journalof Applied Measurement 2000 1152-176
45 Hambleton RK Swaminathan H Rogers HJ Fundamentals of itemresponse theory Newbury Park Sage 1991
46 Weiss DJ Yoes ME Item Response Theory In Advances in Educa-tional and Psychological Testing Theory and Applications Edited byHambleton RK Zaal JN Boston London Dordrecht Kluwer Aca-demic Publishers 199169-95
47 Huynh H On equivalence between a partial credit item and aset of independent Rasch binary items Psychometrika 199459111-119
48 Matthews G Deary IJ Whiteman MC Personality traits second editionCambridge Cambridge University Press 2003
49 McCrae RR Costa PT Jr Personality in adulthood A five-factor theoryperspective New York Guilford Press 2003
50 Newble DI Swanson DB Psychometric characteristics of theobjective structured clinical examination Medical Education1988 22325-334
51 Anonymous dove n 2006 httpdictionaryoedcomcgientry50069159query_type=advsearchampquery-word=hawks+ampfirst=1ampmax_to_show=10ampsearch_spec=sim-ple3Afulltextampqueryword2=cubanampsearch_spec2=simple3Afulltextamplogic_op=andampproximity_op=beforeampproximity_num=1amporder=abampreturn_set=entriesampsort_type=alphaampresult_place=1ampcontrol_no=50069159ampsearch_id=PuYN-DpjOU5-527ampside=M -- Accessed18th August 2006
52 Jones JG Zorab JSM Hawks doves and vivas plus ccedila change Bulletin of the Royal College of Anaesthetists 980-983 2003 Number 20(July)
53 Dent TC The Spider and the Poulterer a Yarn of the SpunAnnals of the Royal College of Surgeons of England 1954 15348
54 Osler W Examinations examiners and examinees Lancet19131047-1050
Pre-publication historyThe pre-publication history for this paper can be accessedhere
httpwwwbiomedcentralcom1472-6920642prepub
Page 22 of 22(page number not for citation purposes)
- Abstract
-
- Background
- Methods
- Results
- Conclusion
-
- Background
-
- The Rasch model
- The partial credit model
- The multi-facet Rasch model
-
- Methods
-
- The PACES examination
- Meaning of stations
-
- Results
-
- Candidate data
- Examiners
-
- Multi-facet Rasch modelling
-
- Separating the effects of candidate ability test (station) difficulty examiner stringency and the marking scale
- Scale differences
- Station (test) differences
- Examiner differences
- Sex
- Year of birth
- Number of candidates examined
- Proportion of candidates examined in the UK
- Ethnic origin of examiners
- Multiple regression
- Candidate differences reliability of candidate marks
- Testing the assumptions of the model
- Examiner goodness of fit statistics
- Candidate goodness of fit statistics
- The long-term reliability of examiner stringency measures
- Differences between communication and examination stations
- Multi-facet Rasch modelling of communication and examination stations
-
- Conclusion
- Conclusion
- Abbreviations
- Competing interests
- Authors contributions
- Additional material
- Acknowledgements
- References
- Pre-publication history
-

BMC Medical Education 2006 642 httpwwwbiomedcentralcom1472-6920642
At each station the candidate is assessed by two examinerseach of whom marks entirely independently of the otherexaminer and there is no conferring or discussion afterthe candidate has left the room Marking takes place on aproforma on which examiners indicate the candidatesproficiency on a number of sub-scales and then theymake an overall judgement of the candidate The overalljudgement is implicitly criterion-referenced and has fourcategories (Clear Pass Pass Fail Clear Fail) with anchorstatements describing the performance at each level It isintentional that there is no judgement between the marksof Pass and Fail so that examiners explicitly have to makea decision about each candidate relative to the standardsexpected of a just-passing candidate taking the examina-tion
The four categories of Clear Pass Pass Fail Clear Failreceive numerical marks of 432 and 1 Since each candi-date receives a total of fourteen marks the total mark isbetween 14 and 56 For various historical reasons andafter development and piloting the pass mark at the firstdiet of PACES was set at 41 and has been maintained atthat level for the first nine diets which are reported hereAn additional rule which applies to only a tiny percentageof candidates is that any candidate who receives threeClear Fail marks from three different examiners will auto-matically fail the examination in practice most candi-dates meeting this criterion would have failed theexamination anyway as their total mark is below 41
Statistical analysis used FACETS 3500 [35] for Raschmodelling Xcalibre 110b [41] for fitting two-parameteritem-response theory models and SPSS 115 for all otherstatistical calculations
Meaning of stationsIt should be noted that although there are five physicallyseparate stations in the examination proper for theremainder of this paper the term station will be usedrather more conveniently to refer to each of the seven sep-arate assessments made of a candidate rather than to thefive twenty-minute sessions within which those sevenassessments are made
ResultsCandidate dataThe first nine diets of the PACES examination were takenbetween June 2001 and March 2004 with two diets in2001 three in 2002 and 2003 and one in 2004 The totalnumber of candidates taking the examination was 10145an average of 1127 on each diet (range 784ndash1355)Some candidates took the exam on more than one occa-sion and for the present analysis they have been treated asif at each time they were separate candidates (since it wasto be expected that their performance may have improved
across diets) On each diet the pass mark was set at 41 (forexplanation see Dacre et al [42]) Overall the pass rate was466 (472410145) Overall the analysis considered atotal of 142030 marks
6834 candidates were male (674) and 3311 werefemale (326) 4483 (442) of the candidates weregraduates of UK medical schools and 8916 (879) ofthe candidates were taking the examination in centresbased in the UK
ExaminersOverall 1259 examiners took part in the 9 diets of PACESwith each examiner being paired in every case with a sec-ond examiner Each examiner had assessed an average of113 candidates (SD 83 range 1ndash593 quartiles = 50ndash153median = 96 mode = 40) 1037 examiners (824) onlyexamined candidates in the UK 119 examiners (95)only examined candidates outside the UK and 103 exam-iners (82)examined candidates in both the UK andelsewhere The latter group had more overall experience ofexamining in PACES (mean candidates examined = 238SD = 104) than those examining only in the UK (meancandidates examined = 105 SD = 73) or those examiningonly outside the UK (mean candidates examined = 73 SD= 44) The average year of birth of examiners was 19514(SD = 66 range = 1931 ndash 1968) 1042 examiners wereknown to be male 123 were known to be female and thedatabase did not have information on the other 94 exam-iners (60 of whom examined only outside the UK and 34of whom examined only in the UK)
Multi-facet Rasch modellingSeparating the effects of candidate ability test (station) difficulty examiner stringency and the marking scaleA three-facet Rasch model was run on all 142030 exami-nation marks using the model described in equation 3above Of particular importance was that FACETSreported that subset connection was OK meaning thatthe data were connected and that linkage had occurredsatisfactorily so that examiner stringency could be com-pared on a common scale across all examiners
Since subset connection is so important to FACETS weinvestigated the extent to which it was achieved by smallerdata sets We tried three different sets of just three diets(12 and 3 7 8 and 9 1 4 and 9) and in each case con-nection was OK When however we tried just two diets (8and 9 1 and 9) we found that while the latter was con-nected the former showed 19 disjoint subsets It seemslikely that three diets is necessary for connection to beadequate We also attempted to run a model using datafrom just one station but that analysis failed with multi-ple disjoint subsets showing that although case connec-
Page 6 of 22(page number not for citation purposes)
BMC Medical Education 2006 642 httpwwwbiomedcentralcom1472-6920642
tion is satisfactory for the entire data set it is vulnerable assoon as only a part of the data is used
Figure 2 shows FACETS yardstick display of the logitscores for candidates examiners stations and marks Itshould be emphasised that because all measures are esti-mated through equation 3 then they are all on a commonscale and therefore can be directly compared The reader isalso reminded that high scores correspond to high scoringcandidates stringent examiners difficult stations andhigh marks awarded The analysis also ensures that esti-mates for effects of candidate examiner station and markeach takes into account any effects due to confoundingwith other variables In particular the effects of examinerstake into account whether or not those examiners hadexamined particularly weak or strong candidates or exam-ined on difficult or easy stations Effects shown are there-fore true effects and are not confounded Likewise theeffects for candidates have been disconfounded for differ-ences in examiners (see below for further discussion)
Scale differencesTaking all of the examiners marks together 8 wereClear fail 27 were Fail 40 were Pass and 25 wereClear Pass The rightmost column of figure 2 shows thepositions of the boundaries between these marks on thecommon logit scale of the Rasch model at -139 000and 130 to a good approximation therefore the scale ofmarks is indeed equal interval The numbers 2 and 3 inthe rightmost column of figure 2 indicate the modalpoints of Fail and Pass at -079 logits and 080 logitsFigure 3 shows the conditional probabilities for the threesteps between the four marks and figure 4 shows theprobabilities of the four marks being awarded for candi-dates at different points along the ability scale
Station (test) differencesPrevious analyses of the PACES data have suggested thatthe stations differ to some extent in their difficulty[4243] candidates receiving the highest average mark onthe Communication and Ethics station and the lowest
average mark on the Cardiovascular station Table 1 pro-vides the FACETS analysis of the station differencesranked in order from most difficult to least difficult Thefirst two columns of data show the average mark on eachof the stations and the point-biserial correlation betweenthe mark on each station and on the exam as a whole Thecolumn marked Station effect shows the logit score foreach station and in the next column is shown the stand-ard error of the logit score The standard errors are all ofthe order of 01 Station 3a (Cardiovascular) is the mostdifficult followed by 3b (Neurological) and 1b (Abdom-inal) which are of similar difficulty Stations 2 (Historytaking) and 5 (Other) are easier but of similar difficultyand stations 4 (Comunication Skills and Ethics) and 1a(Respiratory) are the easiest and of equivalent difficultyThe final column of table 1 shows the average mark oneach station adjusted for differences in candidate andexaminer mix These adjusted marks are however verysimilar in pattern to the raw marks FACETS provides anestimate of the reliability of the differences between thelogit scores by comparing the standard deviation of thestation logit scores (010) with the root mean standarderrors for those scores (01) The reliability for station dif-ferences is calculated by FACETS as 099 (ie the differ-ences are highly reliable)
Examiner differencesThe yardstick in Figure 2 shows that examiners are morevariable than are stations the standard deviation being033 for examiners but only 010 for stations However itshould also be noted that the SD for candidates is 087meaning that the spread of candidates is 264 times thatof examiners (and hence the candidate variance is 697times as large as the examiner variance) On the basis ofthose figures 87 of the systematic variance in the marksis due to differences in candidates 12 due to differencesin examiners and 1 due to differences in station type Ininterpreting these results it should be noted that the FAC-ETS analysis cannot take into examiner-by-station andexaminer-by-candidate variance and hence any calcula-tion of reliability or similar figures is likely to be inflated
Table 1 Differences between the seven stations in average mark and effect estimated by FACETS The final column shows the average adjusted mark after taking examiner and candidate differences into account
Station Average (Raw) Point-Biserial Station (test) effect SE of effect Average (adjusted)
3a Cardiovascular 272 030 018 001 2763b Neurological 278 034 007 001 2831b Abdominal 278 030 006 001 2832 History taking 284 033 -005 001 295 Other 284 031 -005 001 294 Communication
and Ethics288 034 -011 001 293
1a Respiratory 288 033 -011 001 293
Page 7 of 22(page number not for citation purposes)
BMC Medical Education 2006 642 httpwwwbiomedcentralcom1472-6920642
Page 8 of 22(page number not for citation purposes)
The yardstick comparing marks on a common logit scale for candidate ability examiner stringency station difficulty and scaled marksFigure 2The yardstick comparing marks on a common logit scale for candidate ability examiner stringency station difficulty and scaled marks
----------------------------------------------------|Measr|+Candidate |-Examiner |-Station |S1 |----------------------------------------------------+ 5 + + + +(4) |rsquoClear passrsquo| | | | | || | | | | || | | | | || | | | | |+ 4 + + + + +| | | | | || | | | | || | Strong | | | || | candidates| | | |+ 3 + + + + +| | | | | || | | | | || | | Stringent | | || | | examiners | | |+ 2 + + (Hawks) + + + [Clear Pass| | | | | --- | Fail]| | | | | || | | | Difficult | || | | | stations | |+ 1 + + + + +| | | | | 3 | lsquoPassrsquo| | | | | || | | | | || | | | 3a | | 0 1b 2 3b 5 --- [PassFail]| | | | 1a 4 | | | | | | | | | | | | | || | | | | 2 | lsquoFailrsquo+ -1 + + + + +| | | | Easy | || | | | stations | || | | | | || | | | | --- | [Fail + -2 + + + + + Clear Fail]| | | | | || | | Lenient | | || | | examiners | | || | | (Doves) | | |+ -3 + + + + +| | | | | || | | | | || | | | | || | | | | |+ -4 + + + + +| | | | | || | | | | || | Weak | | | || | candidates | | | |+ -5 + + + +(1) +lsquoClear failrsquo----------------------------------------------------|Measr| = 103 | = 34 |-Station |S1 |----------------------------------------------------
Mean = 058 Mean = 0 Mean = 0 SD = 087 SD = 033 SD = 010
Note means of examiners stations and marks are fixed at zero
BMC Medical Education 2006 642 httpwwwbiomedcentralcom1472-6920642
relative to the true value However these statistics are notthe main interest of the present paper so that the problemis not a serious one
The yardstick of figure 2 shows that the extremes of exam-iner stringency are of a similar size to the differencebetween the Pass and Fail borderlines The distribution ofexaminer stringency estimates in the yardstick also makesclear that to a good first approximation stringency is nor-mally distributed and refutes any simple differentiationof examiners into two separate classes who can be calledhawks and doves
The accuracy with which examiner stringency is knowndepends for obvious reasons on the number of candi-dates that the examiner has examined Figure 5 shows thestandard error of the stringency effects in relation to thenumber of candidates examined An examiner who hasassessed 50 candidates has a standard error of about 019compared with 13 after examining 100 candidates 09after examining 200 candidates and 07 after examining400 candidates Stringency measures when only smallnumbers of candidates have been examined should betreated with care FACETS allows a calculation of the reli-
ability of examiner stringency effects which it gives as070 That is more than high enough for statistical analysisfor comparison of groups but estimates of the stringencyof individual examiners should also be treated with care
An important question concerns the factors which differ-entiate between stringent and lenient examiners Informa-tion was available on the sex of examiners and their yearof birth the number of candidates they had examinedand the proportion of candidates who were examined inthe UK These will be considered in turn
SexThe 1040 male examiners had a slightly higher stringencyscore (mean = 002 SD = 326) than the 123 female exam-iners (mean = -0537 SD = 359) although the differencewas not statistically significant (t = 1774 1161 df p =076)
Year of birthThere was no significant correlation of stringency withexaminer year of birth (r = -028 n = 1162 p = 336) Scat-tergrams showed no evidence of curvilinearity and nei-ther did quadratic regression show any significant effect
Cumulative probability of a candidate of particular ability crossing each of the scale boundaries between Clear Fail and Fail Fail and Pass and Pass and Clear PassFigure 3Cumulative probability of a candidate of particular ability crossing each of the scale boundaries between Clear Fail and Fail Fail and Pass and Pass and Clear Pass
Pass vs
FailClear Pass
vs Pass
Fail vs
Clear Fail
Ability (logit scale)
Pro
bab
ilit
y
Page 9 of 22(page number not for citation purposes)
BMC Medical Education 2006 642 httpwwwbiomedcentralcom1472-6920642
Number of candidates examinedStringency showed a significant correlation with thenumber of candidates who had been examined (r = 082n = 1259 p = 003) which is shown in figure 6 Examinerswho had examined more candidates tended to be some-what more stringent (more hawkish)
Proportion of candidates examined in the UKOf the 1259 examiners 1037 (824) examined only inthe UK 119 (95) examined only outside the UK (inwhat was usually their home country or a nearby centre)and 103 (82) examined both in and out of the UK usu-ally being the external examiner sent to a non-UK centreto work with the local examiner The correlation betweenstringency and the proportion of candidates examinedoutside the UK is just significant (r = -058 n = 1259 p =039) Figure 7 shows that those examining outside theUK are slightly more hawkish than those examiningwithin the UK although the effect is small
Ethnic origin of examinersSelf-reported ethnic origin was available for 955 examin-ers of whom 84 (88) were non-European and the
remainder were European Ethnic origin was available foronly 5 of the examiners who examined entirely outside ofthe UK and all 5 were non-European The 84 non-Euro-pean examiners had a significantly higher stringency score(mean = 075 SD = 326) compared with the 871 exam-iners of European ethnic origin (mean = -0187 SD =326) the difference being significant (t = 2509 953 df p= 012)
Multiple regressionMany of the background factors describing examinerswere confounded (eg female examiners tended to beyounger and to have examined fewer candidates) Thesimultaneous effects of sex year of birth number of can-didates examined and proportion of candidates exam-ined in the UK were examined by a backwards eliminationmultiple regression Missing values were handled bymean substitution Two effects were independently signif-icant Examiners who had examined more candidateswere more hawkish (beta = 089 p = 005) and examinersof non-European ethnic origin were more hawkish (beta= 079 p = 014) There was no significant sex differencein the multivariate analysis
The probability of a candidate of a particular ability achieving each of the four marks on a station of average difficulty with an average examinerFigure 4The probability of a candidate of a particular ability achieving each of the four marks on a station of average difficulty with an average examiner
Clear Fail Clear Pass
Fail Pass
Ability (logit scale)
Pro
bab
ilit
y
Page 10 of 22(page number not for citation purposes)
BMC Medical Education 2006 642 httpwwwbiomedcentralcom1472-6920642
Candidate differences reliability of candidate marksAs well as scale station and examiner differences theyardstick of figure 2 also shows scores for candidates It isclear that there is a wide variation in candidate ability asmight be expected The standard deviation of the candi-date logit scores is 087 (and the adjusted standard devia-tion is 078) with logit scores in the range of -404 to+510 The average standard error (root mean square) ofthe logit scores is 037 As a result the reliability of the esti-mates of candidate ability is 082 The standard error onthe logit scale for candidates at the pass mark on the rawscale of 41 is about 035 which is equivalent to 3 markson the raw mark scale That means that an individual can-didate scoring 41 has a 95 chance of their true scorebeing two standard errors either side of their actual markin the range 35 to 47 As mentioned above FACETS can-not take into examiner-by-station and examiner-by-candi-date variance and hence estimates of reliability may beinflated relative to the true value
The candidates logit scores can be converted back toscores on the same scale as that used by the examinersand those marks can be adjusted for differences in exam-iner stringency and station difficulty (which FACETS callsfair marks and we will call adjusted marks) Figure 8shows a scattergram of the adjusted mark for each candi-date plotted against the candidates raw mark The corre-lation between the two marks is 0991 Although the rawand adjusted marks are very similar they are not alwaysexactly so some candidates performing better on theadjusted mark which takes into account the differences in
examiner stringency (and these candidates are the oneswho saw more stringent examiners)
The conventional pass mark for the examination based onsummed raw marks is 41 (although it is probably betterdescribed as being 405 since candidates with a mark of 41pass whereas those with a mark of 40 fail and the truepass mark is somewhere between those two bounds) Thevertical and horizontal dashed lines in figure 8 are there-fore set at 405 and indicate those candidates who wouldpass or fail using the raw or the adjusted mark Of the10145 candidates 4568 would pass using either crite-rion and 5158 would fail using either criterion However263 candidates (26) who failed using the raw mark cri-terion would have passed using adjusted marks and 156candidates (15) who currently have passed the exami-nation would have failed using adjusted marks The use ofadjusted marks would therefore have increased the passrate from 466 to 476 a 1 change in the proportionof candidates passing the examination
Testing the assumptions of the modelLike all statistical models the multi-facet Rasch model isa simplification of the subtleties of real data It is useful asa model in so far as a relatively small number of parame-ters can explain most of the variation present in a complexdata In the present case 142030 data points are beingexplained by a total of 11412 parameters (10145 for the10145 candidates 1258 for the 1259 examiners 6 forthe seven stations and 3 for the four scale points) a 92reduction in information (and equivalent to roughly onefourteenth of the total data)
FACETS provides a number of statistics for diagnosing thequality of the fit of the model to the data of which themanual states that If mean-squares indicate only smalldepartures from model-conditions then the data areprobably useful for measurement The manual also saysthat mean-square statistics in the range 05 to 15 aredesirable and that those over 2 should be treated withcare There have also been other criticisms of goodness-of-fit statistics derived from Rasch models [44]
Examiner goodness of fit statisticsFor the examiner statistics the INFITMS statistic was largerthan 2 in only 3 of the 1259 cases (02) and was largerthan 15 in only 39 (31) cases At the other end of thescale only 38 (30) examiners had values of less than05 Figure 9 shows that the fit of the model improves asthe number of candidates examined increases most of theoutliers occurring with those assessing 50 or fewer candi-dates Overall therefore the fit of the model to the datafrom the examiners is good An important implication isthat examiners can rate different stations equally wellacross candidates (or to put it another way there is no
The standard error of examiner stringencyleniency in rela-tion to the total number of candidates examined in PACESFigure 5The standard error of examiner stringencyleniency in rela-tion to the total number of candidates examined in PACES
NCANDS
6005004003002001000
SE
14
12
10
8
6
4
2
00
Number of PACES candidates examined
Stan
dard
err
or o
f ex
amin
er s
trin
genc
y
Page 11 of 22(page number not for citation purposes)
BMC Medical Education 2006 642 httpwwwbiomedcentralcom1472-6920642
case specificity at the level of examiners who are judgingall stations equally effectively)
Candidate goodness of fit statisticsFigure 10 shows the INFITMS statistic for the fit of individ-ual candidates to the Rasch model in relation to theiroverall logit score It is clear that there is a substantialnumber of cases with values of greater than 2 and thatthese occur particularly in the middle of the range Thislack of fit probably reflects case-specificity The Raschmodel assumes that candidates differ on a single dimen-sion and hence ability on each station is determinedentirely by overall ability However a candidate who wasparticularly good at some stations (perhaps due to specificclinical experience in say cardiology or neurology) butwas relatively poor at other stations would not fit themodel as well as possible Such candidates will of coursebe more apparent in the middle of the range since verypoor candidates will anyway get low marks on everythingand very good candidates will get high marks on all sta-tions irrespective of their specific experience
The long-term reliability of examiner stringency measuresAn important question concerns whether the stringency ofexaminers is a relatively stable feature of their examiningbehaviour or whether it varies with time To answer thisquestion we carried out two separate FACETS analysesone for diets 1ndash4 (June 2000 ndash June 2001) and the otherfor diets 5 ndash 9 (Oct 2001 ndash March 2004) In each analysisthe program calculated entirely separate estimates ofexaminer stringency based on different candidates anddifferent pairings of examiners Of the 1259 examiners inthe overall analysis 749 had examined both in the earlierperiod and the later period Figure 11 shows a scattergramof the stringency estimates for each examiner in the twoperiods broken down according to the total number ofcandidates examined by each examiner in the two peri-ods The overall correlation is 0455 (n = 749 p lt 001)However this correlation will inevitably be reduced some-what by the examiners who have examined only a fewcandidates and for whom the estimates are less stableCorrelations were therefore calculated separately accord-ing to the number of candidates examined Only 14 exam-iners had seen 400 or more candidates and they were
The relationship between examiner stringency (ordinate) and number of candidates examined (abscissa)Figure 6The relationship between examiner stringency (ordinate) and number of candidates examined (abscissa) Examiners who had examined more candidates are shown with larger symbols The fitted Lowess line shows that stringency increases with the number of candidates examined
NCANDS
6005004003002001000
ME
AS
UR
E
15
10
5
00
-5
-10
-15
-20
NCANDS2
400+
200-399
100-199
50-99
1-49
Total Population
Number of candidates examined
[Doves
]
S
trin
gen
cy
[Haw
ks]
Page 12 of 22(page number not for citation purposes)
BMC Medical Education 2006 642 httpwwwbiomedcentralcom1472-6920642
therefore merged into the group of examiners who hadseen 200 or more candidates For these 157 examiners thecorrelation between the stringency measures in the twoperiods was 0598 (p lt 001) For the 393 examiners whohad seen between 100 and 199 candidates the correlationwas 0533 (p lt 001) and for the 152 examiners who hadseen 50 to 99 candidates the correlation was 0411 (p lt001) Finally for the 47 examiners who had seen less than40 candidates the correlation was only 0129 (p = 387)For those examiners seeing large numbers of candidates itis clear that there is an acceptably high correlation of0598 between the two independent estimates of strin-gency A correlation of 0598 given that it is based on twoestimates based on half as many subjects is compatiblewith the overall estimate described earlier of the reliabilityof examiner stringency measures of 070
We also assessed long-term stability using firstly diets 1ndash3and then diets 7ndash9 since the latter diets were all separatedfrom the former by at least a one-year interval The within-
period reliabilities reported by FACETS for these groups ofdiets were 063 and 061 (and of course they are lowerthan those calculated for all nine diets reported earlierbecause they are based on fewer data) The correlations ofthe stringency estimates across the two periods were 0402(n = 146 p lt 001) for those examining more than 200candidates in the entire data 0442 (n = 309 p lt 01) forthose examining 100ndash199 candidates 0335 (n = 101 p lt001) for those examining 50ndash99 candidates and 0468(n = 20 p = 037) for those examining 49 or fewer candi-dates overall These between-period correlations are allcompatible with the within-period reliabilities and con-firm that stringency is stable across periods of a year ortwo within the limits of measurement
Differences between communication and examination stationsAn important innovation of the PACES examination inthe context of the MRCP(UK) was the introduction of twostations which assessed communication rather thanclinical examination skills one assessing history taking
The relationship between examiner stringency (ordinate) and percentage of candidates examined in the UK (abscissa)Figure 7The relationship between examiner stringency (ordinate) and percentage of candidates examined in the UK (abscissa) Examin-ers who had examined more candidates are shown with larger symbols The fitted Lowess line shows the relationship between the two measures
PCTUK
1101009080706050403020100-10
ME
AS
UR
E
15
10
5
00
-5
-10
-15
-20
NCANDS2
400+
200-399
100-199
50-99
1-49
Total Populatio
Percent of candidates examined in the UK
[Doves
]
S
trin
gen
cy
[Haw
ks]
Pass
Page 13 of 22(page number not for citation purposes)
BMC Medical Education 2006 642 httpwwwbiomedcentralcom1472-6920642
and the other assessing how the candidate handled diffi-cult communication and ethical situations Examinerssometime express concern that they feel less confident inassessing these stations because of a relative lack of expe-rience in contrast to the examination stations whichassess skills which they all use and assess on a daily basisand in which they have been proficient for many years Itis therefore of interest to compare the performance of thetwo communication stations with the five examinationstations
The first question concerns whether the communicationstations differ in their difficulty or discrimination as com-
pared with the other stations The Rasch model used forthe multi-facet modelling is a one-parameter Raschmodel and it therefore only allows stations to differ intheir overall difficulty (and the analyses reported earliersuggest that there are only relatively small differences inoverall difficulty) The Rasch model used by FACETS infact assumes that not only stations but also examinerscandidates and marks differ only in their difficulty Thatassumption cannot be tested directly with FACETS as itdoes not allow discrimination to differ between the vari-ous components of the examination However two-parameter item response theory (2-IRT) models do allowdifferences in discrimination between stations [4546]
The relationship between the raw mark on the examination and the FACETS adjusted mark which takes examiner stringency and station difficulty into accountFigure 8The relationship between the raw mark on the examination and the FACETS adjusted mark which takes examiner stringency and station difficulty into account The pass mark for the examination is indicated by the dashed lines and has been set at 405 (see text ie between 40 (fail) and 41 (pass)) Candidates marked in black fail the exam using both raw and adjusted marks and candidates in blue pass the examination using both raw and adjusted marks Candidates in green pass the exam on the basis of their raw mark but fail on the basis of the adjusted mark and candidates in red fail on the basis of their raw mark but pass on the basis of their adjusted mark The inset figure shows a magnification of the region around the pass mark It should be noted that a small amount of random horizontal jitter has been applied to the raw marks (which have to be integers) so that the data points are more easily seen
605040302010
60
50
40
30
20
10 4443424140393837
44
43
42
41
40
39
38
37
Raw mark on examination
Ad
just
ed m
ark
on
ex
amin
atio
n
Page 14 of 22(page number not for citation purposes)
BMC Medical Education 2006 642 httpwwwbiomedcentralcom1472-6920642
(although 2-IRT models can only fit a single facet to thedata) Here the program Xcalibre [41] is used to fit a 2-IRTmodel to the marks at each station in order to assess thedifficulty and the discrimination of each station
The 2-IRT model fitted by Xcalibre has two parameters foreach component in the test the difficulty which is equiva-lent to the single difficulty parameter fitted in the Raschmodel and the discrimination which allows the slope ofthe item response curve to differ between stations A par-tial credit model was also fitted by fitting three separatebinary response measures to each judgement one for theClear Fail-Fail borderline one for the Fail-Pass borderlineand one for the Pass-Clear Pass borderline [47] For eachcandidate there were therefore three binary marks derivedfrom each of the fourteen scaled marks making 42 itemsaltogether Because each candidate was assessed on eachstation by two examiners two marks were analysed foreach station although each was fitted separately Howeverthe two marks which came from each examiner were effec-tively randomly allocated the two parameters wereexpected to be similar and indeed that was exactly the
case The two parameters from each station at each markhave therefore been averaged for the present analysis
Table 2 shows the difficulty and the discriminationparameters at each mark level for the seven stations andfigure 12 shows a plot of the item response functions forthe marks and the stations Table 2 shows that there aresignificant differences between stations in their difficultyand discrimination since the standard errors are small rel-ative to the differences However figure 12 shows that inpractice the differences have little impact on the overallshape of the curves and that the assumption in Raschmodelling of equal discriminations is unlikely to haveinvalidated the analysis to any great extent
Although a concern of examiners has been that they areuncertain whether they are discriminating well on thecommunication stations the fact is that the discrimina-tion parameters at the pass mark are higher in the twocommunication stations (073 and 079) than in any ofthe five examination stations (range = 058 to 070) andthat is also the case at the Clear Fail-Fail boundary (Com-
The INFITMS goodness of fit statistics for individual examiners in relation to the number of candidates examinedFigure 9The INFITMS goodness of fit statistics for individual examiners in relation to the number of candidates examined The solid line shows the fitted Lowess curve The horizontal dashed lines indicate bounds of 05 and 15 which indicate acceptable fit
6005004003002001000-100
INF
ITM
S
25
20
15
10
5
00
-5
NCANDS2
400+
200-399
100-199
50-99
1-49
Total Popula
Number of candidates examined
FA
CE
TS
in
fit
Mea
n S
quar
e st
atis
tic
Page 15 of 22(page number not for citation purposes)
BMC Medical Education 2006 642 httpwwwbiomedcentralcom1472-6920642
munication stations 081 and 089 examination stationsrange = 065 ndash 080) Only at the Pass-Clear Pass bound-ary are discriminations of the two communication sta-tions (061 and 064) similar to those in the examinationstations (range = 056 to 070) Overall it can be con-cluded that examiners are discriminating somewhat betteron the communication stations although the differencesare relatively small Certainly there is no evidence thatexaminers are performing less effectively on the commu-nication stations than on the examination stations
Multi-facet Rasch modelling of communication and examination stationsSince the assumption of equivalent levels of discrimina-tion across stations has been met to a reasonable degree inthe different types of station it is possible to use FACETSto examine scores of candidates on just the communica-tion stations or just the examination stations There arehowever five examination stations and only two commu-nication stations making it difficult to have a direct com-parison of scores on the two since inevitably there is lessmeasurement error with five stations As a result a com-posite of the two communication stations was comparedwith a composite of the respiratory and cardiovascular sta-tions There was somewhat more variation amongst can-didates in the communication stations (SD = 183) thanin the examination stations (SD = 143) and as a resultthe reliability for measurement of candidate ability wasslightly higher in the communication stations (77) thanin the examination stations (69) There was also a littlemore examiner variation in the communication stations(SD = 78) than in the examination stations (SD = 67)and the examiner reliability was also marginally higher inthe communication stations (70) than in the examina-tion stations (68) The boundaries between Clear FailFail Pass and Clear Pass were also slightly further apart inthe communication stations (-260 -005 and 265) thanin the examination stations (-212 010 and 202) Takenoverall though the picture is of remarkable similaritybetween the communication and the examination sta-
tions with a slightly higher reliability and variability inthe communication stations both amongst candidatesand amongst examiners
ConclusionThis paper describes an analysis of 10145 candidates tak-ing the PACES examination over nine diets when theywere examined by a total of 1259 examiners whoawarded a total of 142030 marks The multi-facet Raschmodel allowed the data to be broken down into three sep-arate components of candidate examiner and stationalong with separate measures for the several componentsof the four-point marking scheme Overall the model fit-ted the data reasonably well particularly in the examinerfacet although there was some evidence that the modelfitted less well for candidates which may have been dueto case-specificity in which candidates differed idiosyn-cratically perhaps as a result of different training on dif-ferent stations Nevertheless the latter effects are smalland not relevant to the purpose of the examination as awhole which requires an overall pass across the differentstations
The multi-facet Rasch model has some limitations whichshould be emphasised strongly in considering the currentanalysis In particular FACETS unlike generalisabilitytheory cannot consider variance due to interactioneffects primarily because with say many candidates andmany examiners there is an extremely large number ofdegrees of freedom relating to interaction effects (andhence an extremely large number of dummy variables isneeded) and it is unrealistic to attempt to estimate somany parameters Generalisability theory approaches thisestimation problem in a very different way and suchinteraction effects can be calculated given certain designconstraints (which unfortunately are not applicable here)and the variance terms are often found to be significantand meaningful in examination situations As a result theestimates provided in this paper of total variance and thecontribution of various facets may be inaccurate and
Table 2 Item difficulty and discrimination parameters fitted by Xcalibre to the candidate by station data for PACES The three separate borderlines for the four points on the mark scale are shown separately Figures in brackets are standard errors of the estimates The five examination stations are shown at the top ranked from most to least difficult on the fail-pass criterion The two stations at the bottom in bold are the communication stations
Difficulty DiscriminationStation Clear Fail-Fail Fail-Pass Pass-Clear Pass Clear Fail-Fail Fail-Pass Pass-Clear Pass
3a Cardiovascular -260 (042) -045 (0028) 156 (0032) 065 (0021) 058 (0031) 060 (0023)3b Neurological -237 (037) -065 (0025) 143 (0029) 080 (0022) 070 (0027) 068 (0023)
1b Abdomen -264 (043) -068 (027) 139 (0031) 067 (0021) 061 (0028) 062 (0024)1a Respiratory -277 (045) -085 (026) 113 (0026) 069 (022) 067 (0026) 070 (0024)
5 Other -292 (048) -100 (0028) 166 (0034) 073 (0023) 061 (0026) 056 (0023)2 History -247 (039) -079 (0024) 139 (0031) 081 (0022) 073 (0026) 061 (0024)
4 Communication amp Ethics -236 (036) -085 (0023) 116 (0028) 089 (0023) 079 (0025) 064 (0023)
Page 16 of 22(page number not for citation purposes)
BMC Medical Education 2006 642 httpwwwbiomedcentralcom1472-6920642
should be treated with care In particular they probablyshould not be used for calculating the overall reliability ofthe examination or similar statistics However and it isan important however the major interest of this study isin differences between examiners in leniency-stringencyand those differences are primarily likely to be maineffects which FACETS can handle appropriately Theremight also be additional variance consisting of interac-tions between examiners and other aspects of the exami-nation (such as candidates or cases) and future workneeds to look for such effects using different methodolo-gies but the main effects analysed and discussed here areunlikely to disappear in any such analyses The FACETSanalysis is therefore appropriate and adequate as a firstapproach to studying examiner effects on leniency andstringency
The principle interest of this study is in differencesbetween examiners Humans differ in many behaviouralattributes and it is hardly surprising that examiners alsodiffer in their propensity to pass or fail candidates This
study of hawks and doves amongst examiners foundhighly significant differences in examiner behaviourwhich subsidiary analyses showed were consistent acrosstime (within the limits of the reliability of the measures)Examiner variance accounted for about 12 of the sys-tematic variance (as compared to only 1 depending ondifferences in difficulty of stations and 87 dependingon differences between candidates) Nevertheless thesedifferences are meaningful particularly to a borderlinecandidate for whom random allocation of examiners hap-pens to mean that a majority of examiners assessing themcould be construed as hawks FACETS allows for rawmarks to be adjusted for differences in stringency betweenexaminers If the PACES examination is re-marked usingadjusted marks then about 4 of candidates wouldchange their result across the pass-fail boundary slightlymore going up than down so that the overall pass ratewould increase slightly from 466 to 476
The decision as to whether or not to adjust marks forexaminer stringency depends on a number of factors and
The INFITMS goodness of fit statistics for individual candidates in relation to overall abilityFigure 10The INFITMS goodness of fit statistics for individual candidates in relation to overall ability The horizontal dashed lines indicate bounds of 05 and 15 which indicate acceptable fit
MEASURE
45
40
35
30
25
20
15
10500
-5
-10
-15
-20
-25
-30
-35
INF
ITM
S35
30
25
20
15
10
5
00
FAC
ET
S in
fitM
ean
Squa
re s
tatis
tic
Ability (logit scale)
Page 17 of 22(page number not for citation purposes)
BMC Medical Education 2006 642 httpwwwbiomedcentralcom1472-6920642
the decision is not an easy one Several factors come intoplay
1 The reliability of the adjustments for examiner strin-gency is easier to apply as more examiners assess morecandidates across more diets It is not technically possibleto adjust the results of a single diet of PACES because onecannot obtain linkage across the various subsets of exam-iners (and even if it were possible the result would be lessreliable than a correction based on as much data as possi-ble on the behaviour of examiners based on all examina-tions in which they had taken part) In passing it shouldbe said that it might be possible to obtain linkage withina single diet if linkage could be obtained across stationsperhaps by using a simulator or video station which wasobjectively marked and therefore of fixed difficulty eitherfor all candidates or for large groups of candidates across
examination centres That is not though possible atpresent
2 If examiner stringency can only be assessed reliablyacross multiple diets then correction for stringency doesrequire that stringency is a stable characteristic of examin-ers The comparison of examiners in diets 1ndash3 with thosein diets 7ndash9 suggests that there is reasonable stability instringency across a period of a year or two although thatneeds to be further examined
3 It is sometimes suggested that examiners who arehawks or doves should be given feedback about theirpropensity for marking or high in order that they can thentry and correct that tendency The present analysis wouldin fact require the precise opposite It is better given themethod of analysis that examiners do not try and correct
Examiner stringency estimated from diets 1ndash4 (abscissa) in relation to examiner stringency estimated from diets (5ndash9)Figure 11Examiner stringency estimated from diets 1ndash4 (abscissa) in relation to examiner stringency estimated from diets (5ndash9) Examin-ers who had examined more candidates in total across all diets are shown with larger symbols The solid black line is the fitted lowess curve
MEASURE
1510500-5-10-15-20
ME
AS
UR
E2
20
15
10
5
00
-5
-10
-15
-20
NCANDS2
400+
200-399
100-199
50-99
1-49
Total Population
Examiner stringency (diets 1-4)
Exa
min
er s
trin
genc
y (d
iets
5-9
)
Page 18 of 22(page number not for citation purposes)
BMC Medical Education 2006 642 httpwwwbiomedcentralcom1472-6920642
any differences in stringency but instead they continue tobehave as they have always done Biasses of any sortwhich are fixed and unchanging can be corrected statisti-cally whereas biasses which are varying are of their verynature difficult to predict and correction will be less reli-able (and hence less valid and less justifiable)
4 There might be an argument for pairing examiners onthe basis of their stringency so that if a candidate sees oneexaminer known to have a high stringency then the otherwill have a relatively low stringency Whether that wouldbe practicable given the complex constraints of a realexamination is not clear but it might be worth investigat-
ing The clear advantage would be that the marking of theexamination could then be based on raw scores whichhave a high degree of face validity and are easy to justify
Although there seems little doubt that examiners do differin their stringency it is much less clear where those differ-ences come from Because our sample has a large sampleof more than a thousand examiners it is possible to assessthe role of several background factors Important negativeresults are that we could find no sex differences and nei-ther did there seem to be any relationship to age olderexaminers not being more hawkish than younger examin-ers Examiners who had examined more candidates were
Two-parameter item-response theory curves for the seven stationsFigure 12Two-parameter item-response theory curves for the seven stations The left-most curves are for the Clear Fail ndash Fail border-line the middle curves for the Fail-Pass borderline and the right-most curves for the Pass-Clear Pass borderline The two com-munication stations are shown as solid lines (Black Station 2 ndash History Grey Station 4 ndash Communication and ethics) and the five examination stations are shown as dashed lines (Dark Blue Station 1a ndash Respiratory Green Station 1b ndash Abdomen Purple Station 3a Cardiovascular Orange Station 3b Neurological Pale Blue Station 5 Other) It should be noted that Xcalibre and FACETS calculate their parameters in slightly different ways due to making different assumptions to ensure identifiability and that the output from the programs is therefore not directly comparable (although there is a mathematical relationship between them) This figure should therefore only be used to give a sense of the relative difference between the stations rather than to be used to compare specific values of the parameters with those derived by FACETS
0
01
02
03
04
05
06
07
08
09
1
-3 -25 -2 -15 -1 -05 0 05 1 15 2 25 3
Ability (logit scale)
Pro
bab
ility
Page 19 of 22(page number not for citation purposes)
BMC Medical Education 2006 642 httpwwwbiomedcentralcom1472-6920642
more hawkish although whether that is the result of expe-rience making them more hawkish or more hawkishexaminers choosing to examine more often is not clearLikewise our data suggest that UK examiners from minor-ity ethnic groups are also more hawkish and again wehave no explanation for that although we did find someevidence for a similar effect in a different analysis [43] Aninteresting and important analysis would be to assess howthe ethnic origin of an examiner and a candidate interactbut as yet that analysis has not been possible for a host oftechnical reasons We are however working on it
The reasons for differences in examiner stringency couldform the basis for a number of future studies If as seemspossible stringency is a relatively stable trait then it mightbe predicted that it would relate to other aspects of per-sonality or behaviour and in particular the Big Fivewhich have been shown to relate to many and variedaspects of human behaviour [4849] We would hope toaddress this issue in a future study
The use of FACETS has allowed a full analysis of the marksfrom nine diets of the PACES examination it has allowedthe separate and independent estimation of effects due tocandidate examiner and station type As a result it allowsa fuller discussion of the origins of examiner effects andon ways in which the examination might be revised Apoint of some importance in the context of designingexaminations is that we would not have been able to carryout the present analysis if each station had been assessedby only a single examiner A recurrent suggestion withinthe literature on the design of clinical examinations usu-ally driven by analyses based on generalisability theory isthat when one is trying to maximise the reliability of anOSCE-style examination where rater availability is a lim-iting factor to increasing test length [due to scarcity andexpense] more can be gained by using one rater per sta-tion and having more stations than using two raters perstation [50] Although that seems a reasonable strategyit has two potential problems Firstly it does assume thatexaminer behaviour remains unchanged when only oneexaminer is present rather than two However the pres-ence of another examiner and the potential for cross-checking between independently given marks may wellencourage each of the examiners to be more careful in car-rying out their task and that a lowered examiner reliabil-ity for examiners working individually may mean that theoverall exam reliability does not increase as much asmight be predicted from theoretical calculations Sec-ondly and it is one which is particularly relevant to thepresent analysis the use of a single examiner at each sta-tion does not allow any statistical evaluation of hawk anddove effects with the likelihood that such effects may wellincrease in the absence of effective monitoring
The figurative description of behavioural differences byusing animal names is nothing new the use of hawk todescribe a person who advocates a hard-line policygoes back to at least 1548 although intriguingly suchhawks were contrasted with a range of animals includingbeetles (1824) and pigeons (1843) whereas the moderncontrast with doves only came into use in 1962 at the timeof the Cuban Missile Crisis when The hawks favored anair strike to eliminate the Cuban missile bases The dovesopposed the air strikes and favored a blockade (OxfordEnglish Dictionary online [51]) The earliest usages ofwhich we are aware in the context of medical educationare both from 1974 [726] with one of them concerningthe MRCP(UK) examination [26] However the problemof hawks and doves amongst examiners is not a new oneand has been described for a century or more in education[52] under a number of different names Hawks anddoves were described as the Vulture and the Husband-man by A C Hilton in a poem written in 1872 [27] andvariants of the Hawk were described as the Spider andthe Poultryman in a 1904 poem by T C Dent a surgicalexaminer [53] In 1913 Sir William Osler referred toMetallics with their aggressive harsh nature and hardface whose expression sends a chill to the heart of thecandidate and it reaches his bone marrow [with ] the firstquestion to be contrasted with the Molluscoid theinvertebrate examiner so soft and slushy that he has notthe heart to reject the man Nevertheless Osler recog-nised that between the metallic and the molluscoid isthe large group of sensible examiners [54] Despite thelong-running awareness of the hawk-dove problem inmedical examinations we are not aware of any previousstudy which has used a rigorous statistical method toassess properly the stringency or leniency of large num-bers of examiners and to examine how background fac-tors relate to stringency and leniency
ConclusionThere is little doubt from these data that examiners dodiffer in their leniency or stringency and the effect can beestimated using Rasch modelling The reasons for the dif-ferences are not so clear although there are some demo-graphic correlates and the effects appear to be reliableacross time Various ways are suggested by which accountmay be taken of differences either by adjusting marks orperhaps more effectively and more justifiably by pairinghigh and low stringency examiners so that raw marks canthen be used in the determination of pass and fail Theperformance of the PACES examination is under contin-ual review by the Colleges and the implications of theseand other findings for the running of the examination area part of that review
Page 20 of 22(page number not for citation purposes)
BMC Medical Education 2006 642 httpwwwbiomedcentralcom1472-6920642
AbbreviationsFACETS This is not an abbreviation or an acronym butthe name of a computer program
MRCP(UK) Membership of the Royal Colleges of Physi-cians of the United Kingdom
OSCE Objective Structured Clinical Examination
PACES Practical Assessment of Clinical ExaminationSkills
SD Standard deviation
SE Standard error
UK United Kingdom of Great Britain and Northern Ire-land
Competing interestsICM is Educational Advisor to the MRCP(UK) and hasbeen an examiner for the MRCP(UK) Part 1 and Part 2(but not PACES) MT and JM are employees of theMRCP(UK)
Authors contributionsJM and MT were primarily responsible for the collectionand collation of data ICM was responsible for the statisti-cal analysis and wrote the first draft of the manuscript allauthors contributed to the final draft of the manuscript
Additional material
AcknowledgementsWe are grateful to various members of the MRCP(UK) PACES Board and the MRCP(UK) Research Committee for their comments on previous drafts of this manuscript and in particular we thank Simon Williams for his assistance and Brian Clauser for his detailed comments on an earlier ver-sion of the manuscript
References1 Douglas C A day in the country British Medical Journal 2004
32815732 Weisse AB The oral examination awesome or awful Perspec-
tives in Biology and Medicine 2002 45569-5783 Ferrell BG A critical elements approach to developing check-
lists for a clinical performance examination Medical EducationOnline 1996 15
4 Norcini J Blank LL Arnold GK Kimball HR Examiner differencesin the Mini-Cex Advances in Health Sciences Education 1997227-33
5 Taylor A Rymer J The new MRCOG Objective StructuredClinical Examination ndash the examiners evaluation Journal ofObstetrics and Gynaecology 2001 21103-106
6 Harden RM Cairncross RG Assessment of practical skills theobjective structured practical examination (OSPE) Studies inHigher Education 1980 5187-196
7 Stokes JF The clinical examination ndash assessment of clinical skills ASMEMedical Education Booklet number 2 Dundee Association for the Studyof Medical Education 1974
8 Schubert A Tetzlaff JE Tan M Ryckman JV Mascha E Consistencyinter-rater reliability and validity of 441 consecutive mockoral examinations in anesthesiology Implications for use asa tool for assessment of residents Anesthesiology 199991288-298
9 Allison R Katona C Audit of oral examinations in psychiatryMedical Teacher 1992 14383-389
10 Newble D Dawson B Dauphinee D Page G Macdonald M Mulhol-land H Swanson D Thomson A van der Vleuten C Guidelines forassessing clinical competence Teaching and Learning in Medicine1994 6213-220
11 Ferrell BG Thompson BL Standardised patients a long-stationclinical examination format Medical Education 1993 27376-281
12 Solomon DJ Ferenchick G Sources of measurement error in anECG examination implications for performance-basedassessments Adv Health Sci Educ Theory Pract 2004 9283-290
13 Schuwirth LW Van der Vleuten CP The use of clinical simula-tions in assessment Med Educ 2003 3765-71
14 Govaerts MJ Van der Vleuten CP Schuwirth LW Optimising thereproducibility of a performance-based assessment test inmidwifery education Adv Health Sci Educ Theory Pract 20027133-145
15 Wass V van der Vleuten C Shatzer J Jones R Assessment of clin-ical competence Lancet 2001 357945-949
16 Ferrell BG Clinical performance assessment using standard-ized patients a primer Fam Med 1995 2714-19
17 Norman G Bordage G Page G Keane D How specific is case spe-cificity Medical Education 2006 40618-623
18 Maynard Smith J Evolution and the theory of games Cambridge Cam-bridge University Press 1982
19 Lovett B Collins R Lamparelli M The intercollegiate exam 2001[httpwww frist orgasitmeetingsyearbook2001INTERCOLLEGIATE pdf]
20 Teaching on the run tips 9 in-training assessment MedicalJournal of Australia 2005 18333-34
21 Raymond MR Viswesvaran C Least squares models to correctfor rater effects in performance assessment Journal of Educa-tional Measurement 1993 30253-268
22 Houston WM Raymond MR Svec JC Adjustments for ratereffects in performance assessment Applied Psychological Meas-urement 1991 15409-421
23 Williams SM Laterality newsletter Laterality Newsletter 19882(1)
24 Fitzpatrick AR Ercikan K Yen WM Ferrar S The consistencybetween raters scoring in different test years Applied Measure-ment in Education 1998 11195-208
25 Raymond MR Webb LC Houston WM Correcting perform-ance-rating errors in oral examinations Evaluation and theHealth Professions 1991 14100-122
26 Fleming PR Manderson WG Matthews MB Sanderson PH Stokes JFEvolution of an examination MRCP(UK) British Medical Journal1974 i99
27 Gibberd FB The MRCP(UK) examination London Edinburgh and Glas-gow Royal Colleges of Physicians 1994
28 PACES Practical Assessment of Clinical Examination SkillsThe new MRCP(UK) clinical examination J R Coll PhysiciansLond 2000 3457-60
29 Bradley RA Terry ME The rank analysis of incomplete blockdesigns I The method of paired comparisons Biometrika1952 39324-345
30 Bock RD Jones LV The measurement and prediction of judgement andchoice San Francisco Holden-Day 1968
31 David HA The method of paired comparisons London Charles Griffin1963
Additional File 1Statement by MRCP(UK) concerning recruitment training and monitor-ing of examinersClick here for file[httpwwwbiomedcentralcomcontentsupplementary1472-6920-6-42-S1pdf]
Page 21 of 22(page number not for citation purposes)
BMC Medical Education 2006 642 httpwwwbiomedcentralcom1472-6920642
Publish with BioMed Central and every scientist can read your work free of charge
BioMed Central will be the most significant development for disseminating the results of biomedical research in our lifetime
Sir Paul Nurse Cancer Research UK
Your research papers will be
available free of charge to the entire biomedical community
peer reviewed and published immediately upon acceptance
cited in PubMed and archived on PubMed Central
yours mdash you keep the copyright
Submit your manuscript herehttpwwwbiomedcentralcominfopublishing_advasp
BioMedcentral
32 Rasch G An item analysis which takes individual differencesinto account British Journal of Mathematical and Statistical Psychology1966 1949-57
33 Andrich D Rasch models for measurement Newbury Park Sage 1988 34 Fischer GH Molenaar IW (editors) Rasch models Foundations recent
developments and applications New York Springer 1995 35 Linacre JM FACETS Rasch measurement computer program Chicago
Winstepscom 2004 36 Linacre JM The Partial Credit Model and the One-Item Rating Scale Model
2006 [httpwwwraschorgrmtrmt191ehtm] Accessed 18thAugust 2006
37 Anonymous Polytomous Rasch model 2006 [httpenwikipediaorgwikiPolytomous_Rasch_model] Accessed 18th August 2006
38 Engelhardt G Jr Constructing rater and task banks for per-formance assessments Journal of Outcome Measurement 1997119-33
39 Weeks DL Williams DR A note on the determination of con-nectedness in an N-way cross classification Technometrics1964 6319-324
40 Anonymous Examination Format 1995 [httpwwwmrcpukorgPACESPacesFormathtm] Accessed 18th August 2006
41 Anonymous Users manual for the XCALIBRE marginal maximum-likeli-hood estimation program St Paul Minnesota Assessment Systems Cor-poration 1995
42 Dacre J Besser M White P MRCP(UK) PART 2 Clinical Exam-ination (PACES) a review of the first four examination ses-sions (June 2001 ndash July 2002) Clin Med 2003 3452-459
43 Dewhurst NG McManus IC Mollon J Dacre JE Vale JA Perform-ance in the MRCP(UK) Examination 2003ndash4 Analysis of passrates of UK graduates in relation to self-declared ethnicityand gender 2006 in press
44 Karabatsos G A critique of Rasch residual fit statistics Journalof Applied Measurement 2000 1152-176
45 Hambleton RK Swaminathan H Rogers HJ Fundamentals of itemresponse theory Newbury Park Sage 1991
46 Weiss DJ Yoes ME Item Response Theory In Advances in Educa-tional and Psychological Testing Theory and Applications Edited byHambleton RK Zaal JN Boston London Dordrecht Kluwer Aca-demic Publishers 199169-95
47 Huynh H On equivalence between a partial credit item and aset of independent Rasch binary items Psychometrika 199459111-119
48 Matthews G Deary IJ Whiteman MC Personality traits second editionCambridge Cambridge University Press 2003
49 McCrae RR Costa PT Jr Personality in adulthood A five-factor theoryperspective New York Guilford Press 2003
50 Newble DI Swanson DB Psychometric characteristics of theobjective structured clinical examination Medical Education1988 22325-334
51 Anonymous dove n 2006 httpdictionaryoedcomcgientry50069159query_type=advsearchampquery-word=hawks+ampfirst=1ampmax_to_show=10ampsearch_spec=sim-ple3Afulltextampqueryword2=cubanampsearch_spec2=simple3Afulltextamplogic_op=andampproximity_op=beforeampproximity_num=1amporder=abampreturn_set=entriesampsort_type=alphaampresult_place=1ampcontrol_no=50069159ampsearch_id=PuYN-DpjOU5-527ampside=M -- Accessed18th August 2006
52 Jones JG Zorab JSM Hawks doves and vivas plus ccedila change Bulletin of the Royal College of Anaesthetists 980-983 2003 Number 20(July)
53 Dent TC The Spider and the Poulterer a Yarn of the SpunAnnals of the Royal College of Surgeons of England 1954 15348
54 Osler W Examinations examiners and examinees Lancet19131047-1050
Pre-publication historyThe pre-publication history for this paper can be accessedhere
httpwwwbiomedcentralcom1472-6920642prepub
Page 22 of 22(page number not for citation purposes)
- Abstract
-
- Background
- Methods
- Results
- Conclusion
-
- Background
-
- The Rasch model
- The partial credit model
- The multi-facet Rasch model
-
- Methods
-
- The PACES examination
- Meaning of stations
-
- Results
-
- Candidate data
- Examiners
-
- Multi-facet Rasch modelling
-
- Separating the effects of candidate ability test (station) difficulty examiner stringency and the marking scale
- Scale differences
- Station (test) differences
- Examiner differences
- Sex
- Year of birth
- Number of candidates examined
- Proportion of candidates examined in the UK
- Ethnic origin of examiners
- Multiple regression
- Candidate differences reliability of candidate marks
- Testing the assumptions of the model
- Examiner goodness of fit statistics
- Candidate goodness of fit statistics
- The long-term reliability of examiner stringency measures
- Differences between communication and examination stations
- Multi-facet Rasch modelling of communication and examination stations
-
- Conclusion
- Conclusion
- Abbreviations
- Competing interests
- Authors contributions
- Additional material
- Acknowledgements
- References
- Pre-publication history
-
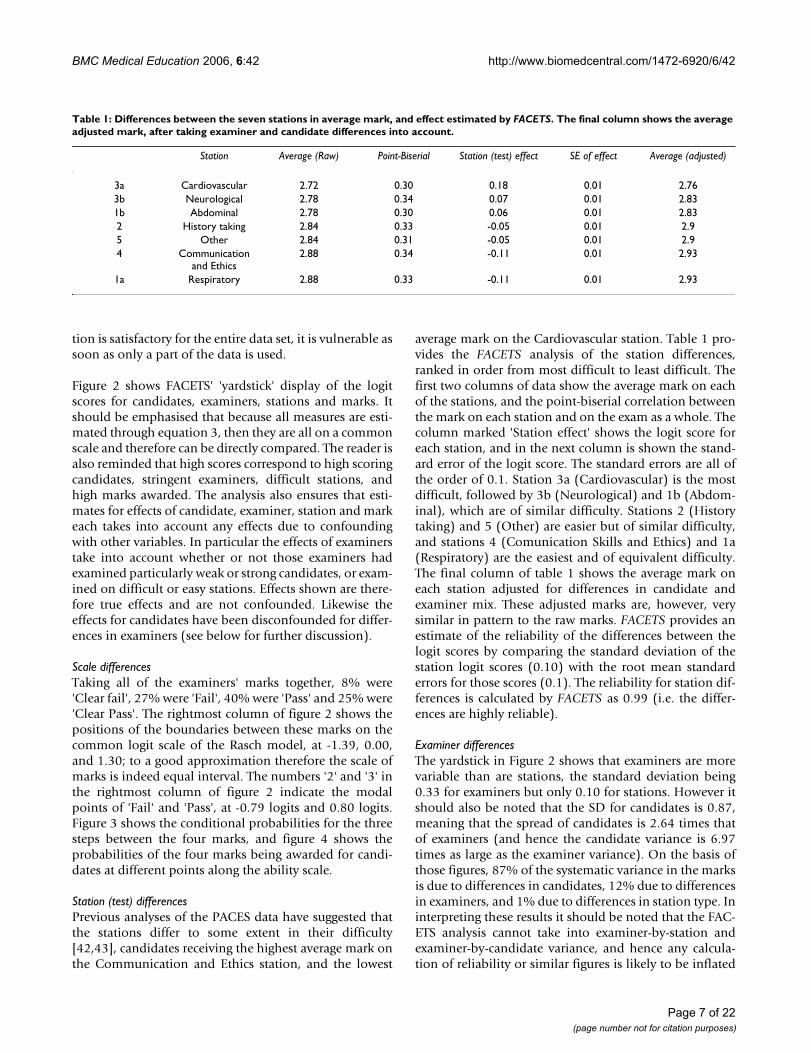
BMC Medical Education 2006 642 httpwwwbiomedcentralcom1472-6920642
Candidate differences reliability of candidate marksAs well as scale station and examiner differences theyardstick of figure 2 also shows scores for candidates It isclear that there is a wide variation in candidate ability asmight be expected The standard deviation of the candi-date logit scores is 087 (and the adjusted standard devia-tion is 078) with logit scores in the range of -404 to+510 The average standard error (root mean square) ofthe logit scores is 037 As a result the reliability of the esti-mates of candidate ability is 082 The standard error onthe logit scale for candidates at the pass mark on the rawscale of 41 is about 035 which is equivalent to 3 markson the raw mark scale That means that an individual can-didate scoring 41 has a 95 chance of their true scorebeing two standard errors either side of their actual markin the range 35 to 47 As mentioned above FACETS can-not take into examiner-by-station and examiner-by-candi-date variance and hence estimates of reliability may beinflated relative to the true value
The candidates logit scores can be converted back toscores on the same scale as that used by the examinersand those marks can be adjusted for differences in exam-iner stringency and station difficulty (which FACETS callsfair marks and we will call adjusted marks) Figure 8shows a scattergram of the adjusted mark for each candi-date plotted against the candidates raw mark The corre-lation between the two marks is 0991 Although the rawand adjusted marks are very similar they are not alwaysexactly so some candidates performing better on theadjusted mark which takes into account the differences in
examiner stringency (and these candidates are the oneswho saw more stringent examiners)
The conventional pass mark for the examination based onsummed raw marks is 41 (although it is probably betterdescribed as being 405 since candidates with a mark of 41pass whereas those with a mark of 40 fail and the truepass mark is somewhere between those two bounds) Thevertical and horizontal dashed lines in figure 8 are there-fore set at 405 and indicate those candidates who wouldpass or fail using the raw or the adjusted mark Of the10145 candidates 4568 would pass using either crite-rion and 5158 would fail using either criterion However263 candidates (26) who failed using the raw mark cri-terion would have passed using adjusted marks and 156candidates (15) who currently have passed the exami-nation would have failed using adjusted marks The use ofadjusted marks would therefore have increased the passrate from 466 to 476 a 1 change in the proportionof candidates passing the examination
Testing the assumptions of the modelLike all statistical models the multi-facet Rasch model isa simplification of the subtleties of real data It is useful asa model in so far as a relatively small number of parame-ters can explain most of the variation present in a complexdata In the present case 142030 data points are beingexplained by a total of 11412 parameters (10145 for the10145 candidates 1258 for the 1259 examiners 6 forthe seven stations and 3 for the four scale points) a 92reduction in information (and equivalent to roughly onefourteenth of the total data)
FACETS provides a number of statistics for diagnosing thequality of the fit of the model to the data of which themanual states that If mean-squares indicate only smalldepartures from model-conditions then the data areprobably useful for measurement The manual also saysthat mean-square statistics in the range 05 to 15 aredesirable and that those over 2 should be treated withcare There have also been other criticisms of goodness-of-fit statistics derived from Rasch models [44]
Examiner goodness of fit statisticsFor the examiner statistics the INFITMS statistic was largerthan 2 in only 3 of the 1259 cases (02) and was largerthan 15 in only 39 (31) cases At the other end of thescale only 38 (30) examiners had values of less than05 Figure 9 shows that the fit of the model improves asthe number of candidates examined increases most of theoutliers occurring with those assessing 50 or fewer candi-dates Overall therefore the fit of the model to the datafrom the examiners is good An important implication isthat examiners can rate different stations equally wellacross candidates (or to put it another way there is no
The standard error of examiner stringencyleniency in rela-tion to the total number of candidates examined in PACESFigure 5The standard error of examiner stringencyleniency in rela-tion to the total number of candidates examined in PACES
NCANDS
6005004003002001000
SE
14
12
10
8
6
4
2
00
Number of PACES candidates examined
Stan
dard
err
or o
f ex
amin
er s
trin
genc
y
Page 11 of 22(page number not for citation purposes)
BMC Medical Education 2006 642 httpwwwbiomedcentralcom1472-6920642
case specificity at the level of examiners who are judgingall stations equally effectively)
Candidate goodness of fit statisticsFigure 10 shows the INFITMS statistic for the fit of individ-ual candidates to the Rasch model in relation to theiroverall logit score It is clear that there is a substantialnumber of cases with values of greater than 2 and thatthese occur particularly in the middle of the range Thislack of fit probably reflects case-specificity The Raschmodel assumes that candidates differ on a single dimen-sion and hence ability on each station is determinedentirely by overall ability However a candidate who wasparticularly good at some stations (perhaps due to specificclinical experience in say cardiology or neurology) butwas relatively poor at other stations would not fit themodel as well as possible Such candidates will of coursebe more apparent in the middle of the range since verypoor candidates will anyway get low marks on everythingand very good candidates will get high marks on all sta-tions irrespective of their specific experience
The long-term reliability of examiner stringency measuresAn important question concerns whether the stringency ofexaminers is a relatively stable feature of their examiningbehaviour or whether it varies with time To answer thisquestion we carried out two separate FACETS analysesone for diets 1ndash4 (June 2000 ndash June 2001) and the otherfor diets 5 ndash 9 (Oct 2001 ndash March 2004) In each analysisthe program calculated entirely separate estimates ofexaminer stringency based on different candidates anddifferent pairings of examiners Of the 1259 examiners inthe overall analysis 749 had examined both in the earlierperiod and the later period Figure 11 shows a scattergramof the stringency estimates for each examiner in the twoperiods broken down according to the total number ofcandidates examined by each examiner in the two peri-ods The overall correlation is 0455 (n = 749 p lt 001)However this correlation will inevitably be reduced some-what by the examiners who have examined only a fewcandidates and for whom the estimates are less stableCorrelations were therefore calculated separately accord-ing to the number of candidates examined Only 14 exam-iners had seen 400 or more candidates and they were
The relationship between examiner stringency (ordinate) and number of candidates examined (abscissa)Figure 6The relationship between examiner stringency (ordinate) and number of candidates examined (abscissa) Examiners who had examined more candidates are shown with larger symbols The fitted Lowess line shows that stringency increases with the number of candidates examined
NCANDS
6005004003002001000
ME
AS
UR
E
15
10
5
00
-5
-10
-15
-20
NCANDS2
400+
200-399
100-199
50-99
1-49
Total Population
Number of candidates examined
[Doves
]
S
trin
gen
cy
[Haw
ks]
Page 12 of 22(page number not for citation purposes)
BMC Medical Education 2006 642 httpwwwbiomedcentralcom1472-6920642
therefore merged into the group of examiners who hadseen 200 or more candidates For these 157 examiners thecorrelation between the stringency measures in the twoperiods was 0598 (p lt 001) For the 393 examiners whohad seen between 100 and 199 candidates the correlationwas 0533 (p lt 001) and for the 152 examiners who hadseen 50 to 99 candidates the correlation was 0411 (p lt001) Finally for the 47 examiners who had seen less than40 candidates the correlation was only 0129 (p = 387)For those examiners seeing large numbers of candidates itis clear that there is an acceptably high correlation of0598 between the two independent estimates of strin-gency A correlation of 0598 given that it is based on twoestimates based on half as many subjects is compatiblewith the overall estimate described earlier of the reliabilityof examiner stringency measures of 070
We also assessed long-term stability using firstly diets 1ndash3and then diets 7ndash9 since the latter diets were all separatedfrom the former by at least a one-year interval The within-
period reliabilities reported by FACETS for these groups ofdiets were 063 and 061 (and of course they are lowerthan those calculated for all nine diets reported earlierbecause they are based on fewer data) The correlations ofthe stringency estimates across the two periods were 0402(n = 146 p lt 001) for those examining more than 200candidates in the entire data 0442 (n = 309 p lt 01) forthose examining 100ndash199 candidates 0335 (n = 101 p lt001) for those examining 50ndash99 candidates and 0468(n = 20 p = 037) for those examining 49 or fewer candi-dates overall These between-period correlations are allcompatible with the within-period reliabilities and con-firm that stringency is stable across periods of a year ortwo within the limits of measurement
Differences between communication and examination stationsAn important innovation of the PACES examination inthe context of the MRCP(UK) was the introduction of twostations which assessed communication rather thanclinical examination skills one assessing history taking
The relationship between examiner stringency (ordinate) and percentage of candidates examined in the UK (abscissa)Figure 7The relationship between examiner stringency (ordinate) and percentage of candidates examined in the UK (abscissa) Examin-ers who had examined more candidates are shown with larger symbols The fitted Lowess line shows the relationship between the two measures
PCTUK
1101009080706050403020100-10
ME
AS
UR
E
15
10
5
00
-5
-10
-15
-20
NCANDS2
400+
200-399
100-199
50-99
1-49
Total Populatio
Percent of candidates examined in the UK
[Doves
]
S
trin
gen
cy
[Haw
ks]
Pass
Page 13 of 22(page number not for citation purposes)
BMC Medical Education 2006 642 httpwwwbiomedcentralcom1472-6920642
and the other assessing how the candidate handled diffi-cult communication and ethical situations Examinerssometime express concern that they feel less confident inassessing these stations because of a relative lack of expe-rience in contrast to the examination stations whichassess skills which they all use and assess on a daily basisand in which they have been proficient for many years Itis therefore of interest to compare the performance of thetwo communication stations with the five examinationstations
The first question concerns whether the communicationstations differ in their difficulty or discrimination as com-
pared with the other stations The Rasch model used forthe multi-facet modelling is a one-parameter Raschmodel and it therefore only allows stations to differ intheir overall difficulty (and the analyses reported earliersuggest that there are only relatively small differences inoverall difficulty) The Rasch model used by FACETS infact assumes that not only stations but also examinerscandidates and marks differ only in their difficulty Thatassumption cannot be tested directly with FACETS as itdoes not allow discrimination to differ between the vari-ous components of the examination However two-parameter item response theory (2-IRT) models do allowdifferences in discrimination between stations [4546]
The relationship between the raw mark on the examination and the FACETS adjusted mark which takes examiner stringency and station difficulty into accountFigure 8The relationship between the raw mark on the examination and the FACETS adjusted mark which takes examiner stringency and station difficulty into account The pass mark for the examination is indicated by the dashed lines and has been set at 405 (see text ie between 40 (fail) and 41 (pass)) Candidates marked in black fail the exam using both raw and adjusted marks and candidates in blue pass the examination using both raw and adjusted marks Candidates in green pass the exam on the basis of their raw mark but fail on the basis of the adjusted mark and candidates in red fail on the basis of their raw mark but pass on the basis of their adjusted mark The inset figure shows a magnification of the region around the pass mark It should be noted that a small amount of random horizontal jitter has been applied to the raw marks (which have to be integers) so that the data points are more easily seen
605040302010
60
50
40
30
20
10 4443424140393837
44
43
42
41
40
39
38
37
Raw mark on examination
Ad
just
ed m
ark
on
ex
amin
atio
n
Page 14 of 22(page number not for citation purposes)
BMC Medical Education 2006 642 httpwwwbiomedcentralcom1472-6920642
(although 2-IRT models can only fit a single facet to thedata) Here the program Xcalibre [41] is used to fit a 2-IRTmodel to the marks at each station in order to assess thedifficulty and the discrimination of each station
The 2-IRT model fitted by Xcalibre has two parameters foreach component in the test the difficulty which is equiva-lent to the single difficulty parameter fitted in the Raschmodel and the discrimination which allows the slope ofthe item response curve to differ between stations A par-tial credit model was also fitted by fitting three separatebinary response measures to each judgement one for theClear Fail-Fail borderline one for the Fail-Pass borderlineand one for the Pass-Clear Pass borderline [47] For eachcandidate there were therefore three binary marks derivedfrom each of the fourteen scaled marks making 42 itemsaltogether Because each candidate was assessed on eachstation by two examiners two marks were analysed foreach station although each was fitted separately Howeverthe two marks which came from each examiner were effec-tively randomly allocated the two parameters wereexpected to be similar and indeed that was exactly the
case The two parameters from each station at each markhave therefore been averaged for the present analysis
Table 2 shows the difficulty and the discriminationparameters at each mark level for the seven stations andfigure 12 shows a plot of the item response functions forthe marks and the stations Table 2 shows that there aresignificant differences between stations in their difficultyand discrimination since the standard errors are small rel-ative to the differences However figure 12 shows that inpractice the differences have little impact on the overallshape of the curves and that the assumption in Raschmodelling of equal discriminations is unlikely to haveinvalidated the analysis to any great extent
Although a concern of examiners has been that they areuncertain whether they are discriminating well on thecommunication stations the fact is that the discrimina-tion parameters at the pass mark are higher in the twocommunication stations (073 and 079) than in any ofthe five examination stations (range = 058 to 070) andthat is also the case at the Clear Fail-Fail boundary (Com-
The INFITMS goodness of fit statistics for individual examiners in relation to the number of candidates examinedFigure 9The INFITMS goodness of fit statistics for individual examiners in relation to the number of candidates examined The solid line shows the fitted Lowess curve The horizontal dashed lines indicate bounds of 05 and 15 which indicate acceptable fit
6005004003002001000-100
INF
ITM
S
25
20
15
10
5
00
-5
NCANDS2
400+
200-399
100-199
50-99
1-49
Total Popula
Number of candidates examined
FA
CE
TS
in
fit
Mea
n S
quar
e st
atis
tic
Page 15 of 22(page number not for citation purposes)
BMC Medical Education 2006 642 httpwwwbiomedcentralcom1472-6920642
munication stations 081 and 089 examination stationsrange = 065 ndash 080) Only at the Pass-Clear Pass bound-ary are discriminations of the two communication sta-tions (061 and 064) similar to those in the examinationstations (range = 056 to 070) Overall it can be con-cluded that examiners are discriminating somewhat betteron the communication stations although the differencesare relatively small Certainly there is no evidence thatexaminers are performing less effectively on the commu-nication stations than on the examination stations
Multi-facet Rasch modelling of communication and examination stationsSince the assumption of equivalent levels of discrimina-tion across stations has been met to a reasonable degree inthe different types of station it is possible to use FACETSto examine scores of candidates on just the communica-tion stations or just the examination stations There arehowever five examination stations and only two commu-nication stations making it difficult to have a direct com-parison of scores on the two since inevitably there is lessmeasurement error with five stations As a result a com-posite of the two communication stations was comparedwith a composite of the respiratory and cardiovascular sta-tions There was somewhat more variation amongst can-didates in the communication stations (SD = 183) thanin the examination stations (SD = 143) and as a resultthe reliability for measurement of candidate ability wasslightly higher in the communication stations (77) thanin the examination stations (69) There was also a littlemore examiner variation in the communication stations(SD = 78) than in the examination stations (SD = 67)and the examiner reliability was also marginally higher inthe communication stations (70) than in the examina-tion stations (68) The boundaries between Clear FailFail Pass and Clear Pass were also slightly further apart inthe communication stations (-260 -005 and 265) thanin the examination stations (-212 010 and 202) Takenoverall though the picture is of remarkable similaritybetween the communication and the examination sta-
tions with a slightly higher reliability and variability inthe communication stations both amongst candidatesand amongst examiners
ConclusionThis paper describes an analysis of 10145 candidates tak-ing the PACES examination over nine diets when theywere examined by a total of 1259 examiners whoawarded a total of 142030 marks The multi-facet Raschmodel allowed the data to be broken down into three sep-arate components of candidate examiner and stationalong with separate measures for the several componentsof the four-point marking scheme Overall the model fit-ted the data reasonably well particularly in the examinerfacet although there was some evidence that the modelfitted less well for candidates which may have been dueto case-specificity in which candidates differed idiosyn-cratically perhaps as a result of different training on dif-ferent stations Nevertheless the latter effects are smalland not relevant to the purpose of the examination as awhole which requires an overall pass across the differentstations
The multi-facet Rasch model has some limitations whichshould be emphasised strongly in considering the currentanalysis In particular FACETS unlike generalisabilitytheory cannot consider variance due to interactioneffects primarily because with say many candidates andmany examiners there is an extremely large number ofdegrees of freedom relating to interaction effects (andhence an extremely large number of dummy variables isneeded) and it is unrealistic to attempt to estimate somany parameters Generalisability theory approaches thisestimation problem in a very different way and suchinteraction effects can be calculated given certain designconstraints (which unfortunately are not applicable here)and the variance terms are often found to be significantand meaningful in examination situations As a result theestimates provided in this paper of total variance and thecontribution of various facets may be inaccurate and
Table 2 Item difficulty and discrimination parameters fitted by Xcalibre to the candidate by station data for PACES The three separate borderlines for the four points on the mark scale are shown separately Figures in brackets are standard errors of the estimates The five examination stations are shown at the top ranked from most to least difficult on the fail-pass criterion The two stations at the bottom in bold are the communication stations
Difficulty DiscriminationStation Clear Fail-Fail Fail-Pass Pass-Clear Pass Clear Fail-Fail Fail-Pass Pass-Clear Pass
3a Cardiovascular -260 (042) -045 (0028) 156 (0032) 065 (0021) 058 (0031) 060 (0023)3b Neurological -237 (037) -065 (0025) 143 (0029) 080 (0022) 070 (0027) 068 (0023)
1b Abdomen -264 (043) -068 (027) 139 (0031) 067 (0021) 061 (0028) 062 (0024)1a Respiratory -277 (045) -085 (026) 113 (0026) 069 (022) 067 (0026) 070 (0024)
5 Other -292 (048) -100 (0028) 166 (0034) 073 (0023) 061 (0026) 056 (0023)2 History -247 (039) -079 (0024) 139 (0031) 081 (0022) 073 (0026) 061 (0024)
4 Communication amp Ethics -236 (036) -085 (0023) 116 (0028) 089 (0023) 079 (0025) 064 (0023)
Page 16 of 22(page number not for citation purposes)
BMC Medical Education 2006 642 httpwwwbiomedcentralcom1472-6920642
should be treated with care In particular they probablyshould not be used for calculating the overall reliability ofthe examination or similar statistics However and it isan important however the major interest of this study isin differences between examiners in leniency-stringencyand those differences are primarily likely to be maineffects which FACETS can handle appropriately Theremight also be additional variance consisting of interac-tions between examiners and other aspects of the exami-nation (such as candidates or cases) and future workneeds to look for such effects using different methodolo-gies but the main effects analysed and discussed here areunlikely to disappear in any such analyses The FACETSanalysis is therefore appropriate and adequate as a firstapproach to studying examiner effects on leniency andstringency
The principle interest of this study is in differencesbetween examiners Humans differ in many behaviouralattributes and it is hardly surprising that examiners alsodiffer in their propensity to pass or fail candidates This
study of hawks and doves amongst examiners foundhighly significant differences in examiner behaviourwhich subsidiary analyses showed were consistent acrosstime (within the limits of the reliability of the measures)Examiner variance accounted for about 12 of the sys-tematic variance (as compared to only 1 depending ondifferences in difficulty of stations and 87 dependingon differences between candidates) Nevertheless thesedifferences are meaningful particularly to a borderlinecandidate for whom random allocation of examiners hap-pens to mean that a majority of examiners assessing themcould be construed as hawks FACETS allows for rawmarks to be adjusted for differences in stringency betweenexaminers If the PACES examination is re-marked usingadjusted marks then about 4 of candidates wouldchange their result across the pass-fail boundary slightlymore going up than down so that the overall pass ratewould increase slightly from 466 to 476
The decision as to whether or not to adjust marks forexaminer stringency depends on a number of factors and
The INFITMS goodness of fit statistics for individual candidates in relation to overall abilityFigure 10The INFITMS goodness of fit statistics for individual candidates in relation to overall ability The horizontal dashed lines indicate bounds of 05 and 15 which indicate acceptable fit
MEASURE
45
40
35
30
25
20
15
10500
-5
-10
-15
-20
-25
-30
-35
INF
ITM
S35
30
25
20
15
10
5
00
FAC
ET
S in
fitM
ean
Squa
re s
tatis
tic
Ability (logit scale)
Page 17 of 22(page number not for citation purposes)
BMC Medical Education 2006 642 httpwwwbiomedcentralcom1472-6920642
the decision is not an easy one Several factors come intoplay
1 The reliability of the adjustments for examiner strin-gency is easier to apply as more examiners assess morecandidates across more diets It is not technically possibleto adjust the results of a single diet of PACES because onecannot obtain linkage across the various subsets of exam-iners (and even if it were possible the result would be lessreliable than a correction based on as much data as possi-ble on the behaviour of examiners based on all examina-tions in which they had taken part) In passing it shouldbe said that it might be possible to obtain linkage withina single diet if linkage could be obtained across stationsperhaps by using a simulator or video station which wasobjectively marked and therefore of fixed difficulty eitherfor all candidates or for large groups of candidates across
examination centres That is not though possible atpresent
2 If examiner stringency can only be assessed reliablyacross multiple diets then correction for stringency doesrequire that stringency is a stable characteristic of examin-ers The comparison of examiners in diets 1ndash3 with thosein diets 7ndash9 suggests that there is reasonable stability instringency across a period of a year or two although thatneeds to be further examined
3 It is sometimes suggested that examiners who arehawks or doves should be given feedback about theirpropensity for marking or high in order that they can thentry and correct that tendency The present analysis wouldin fact require the precise opposite It is better given themethod of analysis that examiners do not try and correct
Examiner stringency estimated from diets 1ndash4 (abscissa) in relation to examiner stringency estimated from diets (5ndash9)Figure 11Examiner stringency estimated from diets 1ndash4 (abscissa) in relation to examiner stringency estimated from diets (5ndash9) Examin-ers who had examined more candidates in total across all diets are shown with larger symbols The solid black line is the fitted lowess curve
MEASURE
1510500-5-10-15-20
ME
AS
UR
E2
20
15
10
5
00
-5
-10
-15
-20
NCANDS2
400+
200-399
100-199
50-99
1-49
Total Population
Examiner stringency (diets 1-4)
Exa
min
er s
trin
genc
y (d
iets
5-9
)
Page 18 of 22(page number not for citation purposes)
BMC Medical Education 2006 642 httpwwwbiomedcentralcom1472-6920642
any differences in stringency but instead they continue tobehave as they have always done Biasses of any sortwhich are fixed and unchanging can be corrected statisti-cally whereas biasses which are varying are of their verynature difficult to predict and correction will be less reli-able (and hence less valid and less justifiable)
4 There might be an argument for pairing examiners onthe basis of their stringency so that if a candidate sees oneexaminer known to have a high stringency then the otherwill have a relatively low stringency Whether that wouldbe practicable given the complex constraints of a realexamination is not clear but it might be worth investigat-
ing The clear advantage would be that the marking of theexamination could then be based on raw scores whichhave a high degree of face validity and are easy to justify
Although there seems little doubt that examiners do differin their stringency it is much less clear where those differ-ences come from Because our sample has a large sampleof more than a thousand examiners it is possible to assessthe role of several background factors Important negativeresults are that we could find no sex differences and nei-ther did there seem to be any relationship to age olderexaminers not being more hawkish than younger examin-ers Examiners who had examined more candidates were
Two-parameter item-response theory curves for the seven stationsFigure 12Two-parameter item-response theory curves for the seven stations The left-most curves are for the Clear Fail ndash Fail border-line the middle curves for the Fail-Pass borderline and the right-most curves for the Pass-Clear Pass borderline The two com-munication stations are shown as solid lines (Black Station 2 ndash History Grey Station 4 ndash Communication and ethics) and the five examination stations are shown as dashed lines (Dark Blue Station 1a ndash Respiratory Green Station 1b ndash Abdomen Purple Station 3a Cardiovascular Orange Station 3b Neurological Pale Blue Station 5 Other) It should be noted that Xcalibre and FACETS calculate their parameters in slightly different ways due to making different assumptions to ensure identifiability and that the output from the programs is therefore not directly comparable (although there is a mathematical relationship between them) This figure should therefore only be used to give a sense of the relative difference between the stations rather than to be used to compare specific values of the parameters with those derived by FACETS
0
01
02
03
04
05
06
07
08
09
1
-3 -25 -2 -15 -1 -05 0 05 1 15 2 25 3
Ability (logit scale)
Pro
bab
ility
Page 19 of 22(page number not for citation purposes)
BMC Medical Education 2006 642 httpwwwbiomedcentralcom1472-6920642
more hawkish although whether that is the result of expe-rience making them more hawkish or more hawkishexaminers choosing to examine more often is not clearLikewise our data suggest that UK examiners from minor-ity ethnic groups are also more hawkish and again wehave no explanation for that although we did find someevidence for a similar effect in a different analysis [43] Aninteresting and important analysis would be to assess howthe ethnic origin of an examiner and a candidate interactbut as yet that analysis has not been possible for a host oftechnical reasons We are however working on it
The reasons for differences in examiner stringency couldform the basis for a number of future studies If as seemspossible stringency is a relatively stable trait then it mightbe predicted that it would relate to other aspects of per-sonality or behaviour and in particular the Big Fivewhich have been shown to relate to many and variedaspects of human behaviour [4849] We would hope toaddress this issue in a future study
The use of FACETS has allowed a full analysis of the marksfrom nine diets of the PACES examination it has allowedthe separate and independent estimation of effects due tocandidate examiner and station type As a result it allowsa fuller discussion of the origins of examiner effects andon ways in which the examination might be revised Apoint of some importance in the context of designingexaminations is that we would not have been able to carryout the present analysis if each station had been assessedby only a single examiner A recurrent suggestion withinthe literature on the design of clinical examinations usu-ally driven by analyses based on generalisability theory isthat when one is trying to maximise the reliability of anOSCE-style examination where rater availability is a lim-iting factor to increasing test length [due to scarcity andexpense] more can be gained by using one rater per sta-tion and having more stations than using two raters perstation [50] Although that seems a reasonable strategyit has two potential problems Firstly it does assume thatexaminer behaviour remains unchanged when only oneexaminer is present rather than two However the pres-ence of another examiner and the potential for cross-checking between independently given marks may wellencourage each of the examiners to be more careful in car-rying out their task and that a lowered examiner reliabil-ity for examiners working individually may mean that theoverall exam reliability does not increase as much asmight be predicted from theoretical calculations Sec-ondly and it is one which is particularly relevant to thepresent analysis the use of a single examiner at each sta-tion does not allow any statistical evaluation of hawk anddove effects with the likelihood that such effects may wellincrease in the absence of effective monitoring
The figurative description of behavioural differences byusing animal names is nothing new the use of hawk todescribe a person who advocates a hard-line policygoes back to at least 1548 although intriguingly suchhawks were contrasted with a range of animals includingbeetles (1824) and pigeons (1843) whereas the moderncontrast with doves only came into use in 1962 at the timeof the Cuban Missile Crisis when The hawks favored anair strike to eliminate the Cuban missile bases The dovesopposed the air strikes and favored a blockade (OxfordEnglish Dictionary online [51]) The earliest usages ofwhich we are aware in the context of medical educationare both from 1974 [726] with one of them concerningthe MRCP(UK) examination [26] However the problemof hawks and doves amongst examiners is not a new oneand has been described for a century or more in education[52] under a number of different names Hawks anddoves were described as the Vulture and the Husband-man by A C Hilton in a poem written in 1872 [27] andvariants of the Hawk were described as the Spider andthe Poultryman in a 1904 poem by T C Dent a surgicalexaminer [53] In 1913 Sir William Osler referred toMetallics with their aggressive harsh nature and hardface whose expression sends a chill to the heart of thecandidate and it reaches his bone marrow [with ] the firstquestion to be contrasted with the Molluscoid theinvertebrate examiner so soft and slushy that he has notthe heart to reject the man Nevertheless Osler recog-nised that between the metallic and the molluscoid isthe large group of sensible examiners [54] Despite thelong-running awareness of the hawk-dove problem inmedical examinations we are not aware of any previousstudy which has used a rigorous statistical method toassess properly the stringency or leniency of large num-bers of examiners and to examine how background fac-tors relate to stringency and leniency
ConclusionThere is little doubt from these data that examiners dodiffer in their leniency or stringency and the effect can beestimated using Rasch modelling The reasons for the dif-ferences are not so clear although there are some demo-graphic correlates and the effects appear to be reliableacross time Various ways are suggested by which accountmay be taken of differences either by adjusting marks orperhaps more effectively and more justifiably by pairinghigh and low stringency examiners so that raw marks canthen be used in the determination of pass and fail Theperformance of the PACES examination is under contin-ual review by the Colleges and the implications of theseand other findings for the running of the examination area part of that review
Page 20 of 22(page number not for citation purposes)
BMC Medical Education 2006 642 httpwwwbiomedcentralcom1472-6920642
AbbreviationsFACETS This is not an abbreviation or an acronym butthe name of a computer program
MRCP(UK) Membership of the Royal Colleges of Physi-cians of the United Kingdom
OSCE Objective Structured Clinical Examination
PACES Practical Assessment of Clinical ExaminationSkills
SD Standard deviation
SE Standard error
UK United Kingdom of Great Britain and Northern Ire-land
Competing interestsICM is Educational Advisor to the MRCP(UK) and hasbeen an examiner for the MRCP(UK) Part 1 and Part 2(but not PACES) MT and JM are employees of theMRCP(UK)
Authors contributionsJM and MT were primarily responsible for the collectionand collation of data ICM was responsible for the statisti-cal analysis and wrote the first draft of the manuscript allauthors contributed to the final draft of the manuscript
Additional material
AcknowledgementsWe are grateful to various members of the MRCP(UK) PACES Board and the MRCP(UK) Research Committee for their comments on previous drafts of this manuscript and in particular we thank Simon Williams for his assistance and Brian Clauser for his detailed comments on an earlier ver-sion of the manuscript
References1 Douglas C A day in the country British Medical Journal 2004
32815732 Weisse AB The oral examination awesome or awful Perspec-
tives in Biology and Medicine 2002 45569-5783 Ferrell BG A critical elements approach to developing check-
lists for a clinical performance examination Medical EducationOnline 1996 15
4 Norcini J Blank LL Arnold GK Kimball HR Examiner differencesin the Mini-Cex Advances in Health Sciences Education 1997227-33
5 Taylor A Rymer J The new MRCOG Objective StructuredClinical Examination ndash the examiners evaluation Journal ofObstetrics and Gynaecology 2001 21103-106
6 Harden RM Cairncross RG Assessment of practical skills theobjective structured practical examination (OSPE) Studies inHigher Education 1980 5187-196
7 Stokes JF The clinical examination ndash assessment of clinical skills ASMEMedical Education Booklet number 2 Dundee Association for the Studyof Medical Education 1974
8 Schubert A Tetzlaff JE Tan M Ryckman JV Mascha E Consistencyinter-rater reliability and validity of 441 consecutive mockoral examinations in anesthesiology Implications for use asa tool for assessment of residents Anesthesiology 199991288-298
9 Allison R Katona C Audit of oral examinations in psychiatryMedical Teacher 1992 14383-389
10 Newble D Dawson B Dauphinee D Page G Macdonald M Mulhol-land H Swanson D Thomson A van der Vleuten C Guidelines forassessing clinical competence Teaching and Learning in Medicine1994 6213-220
11 Ferrell BG Thompson BL Standardised patients a long-stationclinical examination format Medical Education 1993 27376-281
12 Solomon DJ Ferenchick G Sources of measurement error in anECG examination implications for performance-basedassessments Adv Health Sci Educ Theory Pract 2004 9283-290
13 Schuwirth LW Van der Vleuten CP The use of clinical simula-tions in assessment Med Educ 2003 3765-71
14 Govaerts MJ Van der Vleuten CP Schuwirth LW Optimising thereproducibility of a performance-based assessment test inmidwifery education Adv Health Sci Educ Theory Pract 20027133-145
15 Wass V van der Vleuten C Shatzer J Jones R Assessment of clin-ical competence Lancet 2001 357945-949
16 Ferrell BG Clinical performance assessment using standard-ized patients a primer Fam Med 1995 2714-19
17 Norman G Bordage G Page G Keane D How specific is case spe-cificity Medical Education 2006 40618-623
18 Maynard Smith J Evolution and the theory of games Cambridge Cam-bridge University Press 1982
19 Lovett B Collins R Lamparelli M The intercollegiate exam 2001[httpwww frist orgasitmeetingsyearbook2001INTERCOLLEGIATE pdf]
20 Teaching on the run tips 9 in-training assessment MedicalJournal of Australia 2005 18333-34
21 Raymond MR Viswesvaran C Least squares models to correctfor rater effects in performance assessment Journal of Educa-tional Measurement 1993 30253-268
22 Houston WM Raymond MR Svec JC Adjustments for ratereffects in performance assessment Applied Psychological Meas-urement 1991 15409-421
23 Williams SM Laterality newsletter Laterality Newsletter 19882(1)
24 Fitzpatrick AR Ercikan K Yen WM Ferrar S The consistencybetween raters scoring in different test years Applied Measure-ment in Education 1998 11195-208
25 Raymond MR Webb LC Houston WM Correcting perform-ance-rating errors in oral examinations Evaluation and theHealth Professions 1991 14100-122
26 Fleming PR Manderson WG Matthews MB Sanderson PH Stokes JFEvolution of an examination MRCP(UK) British Medical Journal1974 i99
27 Gibberd FB The MRCP(UK) examination London Edinburgh and Glas-gow Royal Colleges of Physicians 1994
28 PACES Practical Assessment of Clinical Examination SkillsThe new MRCP(UK) clinical examination J R Coll PhysiciansLond 2000 3457-60
29 Bradley RA Terry ME The rank analysis of incomplete blockdesigns I The method of paired comparisons Biometrika1952 39324-345
30 Bock RD Jones LV The measurement and prediction of judgement andchoice San Francisco Holden-Day 1968
31 David HA The method of paired comparisons London Charles Griffin1963
Additional File 1Statement by MRCP(UK) concerning recruitment training and monitor-ing of examinersClick here for file[httpwwwbiomedcentralcomcontentsupplementary1472-6920-6-42-S1pdf]
Page 21 of 22(page number not for citation purposes)
BMC Medical Education 2006 642 httpwwwbiomedcentralcom1472-6920642
Publish with BioMed Central and every scientist can read your work free of charge
BioMed Central will be the most significant development for disseminating the results of biomedical research in our lifetime
Sir Paul Nurse Cancer Research UK
Your research papers will be
available free of charge to the entire biomedical community
peer reviewed and published immediately upon acceptance
cited in PubMed and archived on PubMed Central
yours mdash you keep the copyright
Submit your manuscript herehttpwwwbiomedcentralcominfopublishing_advasp
BioMedcentral
32 Rasch G An item analysis which takes individual differencesinto account British Journal of Mathematical and Statistical Psychology1966 1949-57
33 Andrich D Rasch models for measurement Newbury Park Sage 1988 34 Fischer GH Molenaar IW (editors) Rasch models Foundations recent
developments and applications New York Springer 1995 35 Linacre JM FACETS Rasch measurement computer program Chicago
Winstepscom 2004 36 Linacre JM The Partial Credit Model and the One-Item Rating Scale Model
2006 [httpwwwraschorgrmtrmt191ehtm] Accessed 18thAugust 2006
37 Anonymous Polytomous Rasch model 2006 [httpenwikipediaorgwikiPolytomous_Rasch_model] Accessed 18th August 2006
38 Engelhardt G Jr Constructing rater and task banks for per-formance assessments Journal of Outcome Measurement 1997119-33
39 Weeks DL Williams DR A note on the determination of con-nectedness in an N-way cross classification Technometrics1964 6319-324
40 Anonymous Examination Format 1995 [httpwwwmrcpukorgPACESPacesFormathtm] Accessed 18th August 2006
41 Anonymous Users manual for the XCALIBRE marginal maximum-likeli-hood estimation program St Paul Minnesota Assessment Systems Cor-poration 1995
42 Dacre J Besser M White P MRCP(UK) PART 2 Clinical Exam-ination (PACES) a review of the first four examination ses-sions (June 2001 ndash July 2002) Clin Med 2003 3452-459
43 Dewhurst NG McManus IC Mollon J Dacre JE Vale JA Perform-ance in the MRCP(UK) Examination 2003ndash4 Analysis of passrates of UK graduates in relation to self-declared ethnicityand gender 2006 in press
44 Karabatsos G A critique of Rasch residual fit statistics Journalof Applied Measurement 2000 1152-176
45 Hambleton RK Swaminathan H Rogers HJ Fundamentals of itemresponse theory Newbury Park Sage 1991
46 Weiss DJ Yoes ME Item Response Theory In Advances in Educa-tional and Psychological Testing Theory and Applications Edited byHambleton RK Zaal JN Boston London Dordrecht Kluwer Aca-demic Publishers 199169-95
47 Huynh H On equivalence between a partial credit item and aset of independent Rasch binary items Psychometrika 199459111-119
48 Matthews G Deary IJ Whiteman MC Personality traits second editionCambridge Cambridge University Press 2003
49 McCrae RR Costa PT Jr Personality in adulthood A five-factor theoryperspective New York Guilford Press 2003
50 Newble DI Swanson DB Psychometric characteristics of theobjective structured clinical examination Medical Education1988 22325-334
51 Anonymous dove n 2006 httpdictionaryoedcomcgientry50069159query_type=advsearchampquery-word=hawks+ampfirst=1ampmax_to_show=10ampsearch_spec=sim-ple3Afulltextampqueryword2=cubanampsearch_spec2=simple3Afulltextamplogic_op=andampproximity_op=beforeampproximity_num=1amporder=abampreturn_set=entriesampsort_type=alphaampresult_place=1ampcontrol_no=50069159ampsearch_id=PuYN-DpjOU5-527ampside=M -- Accessed18th August 2006
52 Jones JG Zorab JSM Hawks doves and vivas plus ccedila change Bulletin of the Royal College of Anaesthetists 980-983 2003 Number 20(July)
53 Dent TC The Spider and the Poulterer a Yarn of the SpunAnnals of the Royal College of Surgeons of England 1954 15348
54 Osler W Examinations examiners and examinees Lancet19131047-1050
Pre-publication historyThe pre-publication history for this paper can be accessedhere
httpwwwbiomedcentralcom1472-6920642prepub
Page 22 of 22(page number not for citation purposes)
- Abstract
-
- Background
- Methods
- Results
- Conclusion
-
- Background
-
- The Rasch model
- The partial credit model
- The multi-facet Rasch model
-
- Methods
-
- The PACES examination
- Meaning of stations
-
- Results
-
- Candidate data
- Examiners
-
- Multi-facet Rasch modelling
-
- Separating the effects of candidate ability test (station) difficulty examiner stringency and the marking scale
- Scale differences
- Station (test) differences
- Examiner differences
- Sex
- Year of birth
- Number of candidates examined
- Proportion of candidates examined in the UK
- Ethnic origin of examiners
- Multiple regression
- Candidate differences reliability of candidate marks
- Testing the assumptions of the model
- Examiner goodness of fit statistics
- Candidate goodness of fit statistics
- The long-term reliability of examiner stringency measures
- Differences between communication and examination stations
- Multi-facet Rasch modelling of communication and examination stations
-
- Conclusion
- Conclusion
- Abbreviations
- Competing interests
- Authors contributions
- Additional material
- Acknowledgements
- References
- Pre-publication history
-
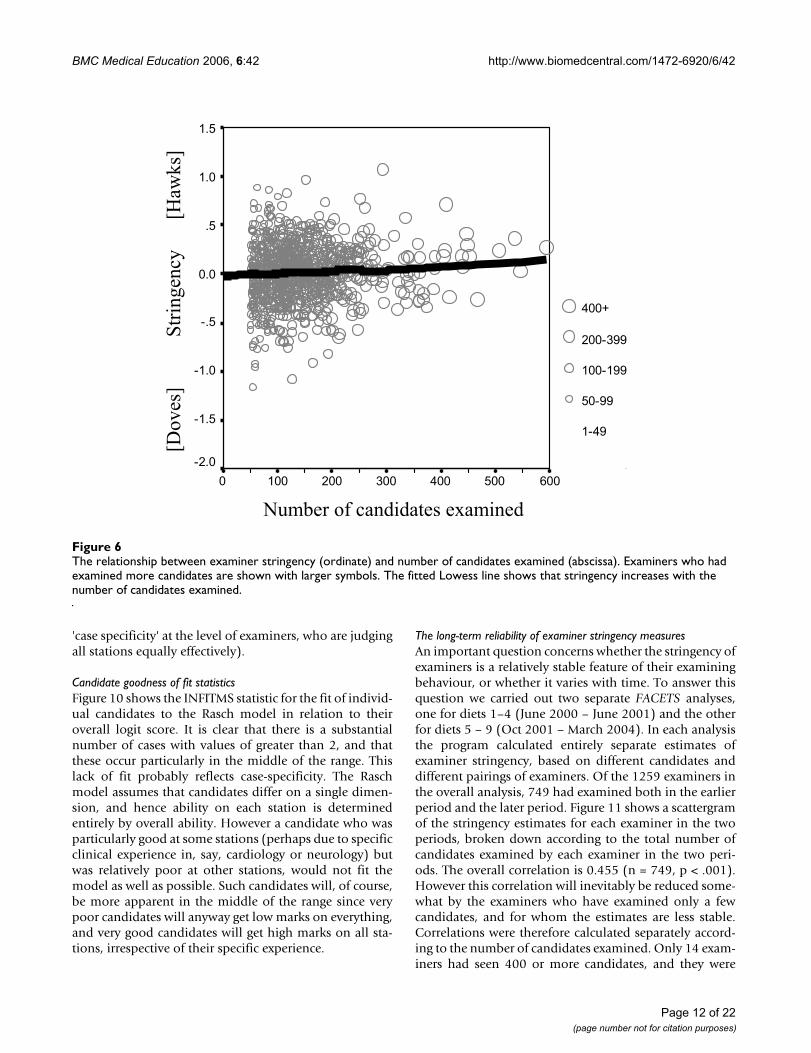
BMC Medical Education 2006 642 httpwwwbiomedcentralcom1472-6920642
Publish with BioMed Central and every scientist can read your work free of charge
BioMed Central will be the most significant development for disseminating the results of biomedical research in our lifetime
Sir Paul Nurse Cancer Research UK
Your research papers will be
available free of charge to the entire biomedical community
peer reviewed and published immediately upon acceptance
cited in PubMed and archived on PubMed Central
yours mdash you keep the copyright
Submit your manuscript herehttpwwwbiomedcentralcominfopublishing_advasp
BioMedcentral
32 Rasch G An item analysis which takes individual differencesinto account British Journal of Mathematical and Statistical Psychology1966 1949-57
33 Andrich D Rasch models for measurement Newbury Park Sage 1988 34 Fischer GH Molenaar IW (editors) Rasch models Foundations recent
developments and applications New York Springer 1995 35 Linacre JM FACETS Rasch measurement computer program Chicago
Winstepscom 2004 36 Linacre JM The Partial Credit Model and the One-Item Rating Scale Model
2006 [httpwwwraschorgrmtrmt191ehtm] Accessed 18thAugust 2006
37 Anonymous Polytomous Rasch model 2006 [httpenwikipediaorgwikiPolytomous_Rasch_model] Accessed 18th August 2006
38 Engelhardt G Jr Constructing rater and task banks for per-formance assessments Journal of Outcome Measurement 1997119-33
39 Weeks DL Williams DR A note on the determination of con-nectedness in an N-way cross classification Technometrics1964 6319-324
40 Anonymous Examination Format 1995 [httpwwwmrcpukorgPACESPacesFormathtm] Accessed 18th August 2006
41 Anonymous Users manual for the XCALIBRE marginal maximum-likeli-hood estimation program St Paul Minnesota Assessment Systems Cor-poration 1995
42 Dacre J Besser M White P MRCP(UK) PART 2 Clinical Exam-ination (PACES) a review of the first four examination ses-sions (June 2001 ndash July 2002) Clin Med 2003 3452-459
43 Dewhurst NG McManus IC Mollon J Dacre JE Vale JA Perform-ance in the MRCP(UK) Examination 2003ndash4 Analysis of passrates of UK graduates in relation to self-declared ethnicityand gender 2006 in press
44 Karabatsos G A critique of Rasch residual fit statistics Journalof Applied Measurement 2000 1152-176
45 Hambleton RK Swaminathan H Rogers HJ Fundamentals of itemresponse theory Newbury Park Sage 1991
46 Weiss DJ Yoes ME Item Response Theory In Advances in Educa-tional and Psychological Testing Theory and Applications Edited byHambleton RK Zaal JN Boston London Dordrecht Kluwer Aca-demic Publishers 199169-95
47 Huynh H On equivalence between a partial credit item and aset of independent Rasch binary items Psychometrika 199459111-119
48 Matthews G Deary IJ Whiteman MC Personality traits second editionCambridge Cambridge University Press 2003
49 McCrae RR Costa PT Jr Personality in adulthood A five-factor theoryperspective New York Guilford Press 2003
50 Newble DI Swanson DB Psychometric characteristics of theobjective structured clinical examination Medical Education1988 22325-334
51 Anonymous dove n 2006 httpdictionaryoedcomcgientry50069159query_type=advsearchampquery-word=hawks+ampfirst=1ampmax_to_show=10ampsearch_spec=sim-ple3Afulltextampqueryword2=cubanampsearch_spec2=simple3Afulltextamplogic_op=andampproximity_op=beforeampproximity_num=1amporder=abampreturn_set=entriesampsort_type=alphaampresult_place=1ampcontrol_no=50069159ampsearch_id=PuYN-DpjOU5-527ampside=M -- Accessed18th August 2006
52 Jones JG Zorab JSM Hawks doves and vivas plus ccedila change Bulletin of the Royal College of Anaesthetists 980-983 2003 Number 20(July)
53 Dent TC The Spider and the Poulterer a Yarn of the SpunAnnals of the Royal College of Surgeons of England 1954 15348
54 Osler W Examinations examiners and examinees Lancet19131047-1050
Pre-publication historyThe pre-publication history for this paper can be accessedhere
httpwwwbiomedcentralcom1472-6920642prepub
Page 22 of 22(page number not for citation purposes)
- Abstract
-
- Background
- Methods
- Results
- Conclusion
-
- Background
-
- The Rasch model
- The partial credit model
- The multi-facet Rasch model
-
- Methods
-
- The PACES examination
- Meaning of stations
-
- Results
-
- Candidate data
- Examiners
-
- Multi-facet Rasch modelling
-
- Separating the effects of candidate ability test (station) difficulty examiner stringency and the marking scale
- Scale differences
- Station (test) differences
- Examiner differences
- Sex
- Year of birth
- Number of candidates examined
- Proportion of candidates examined in the UK
- Ethnic origin of examiners
- Multiple regression
- Candidate differences reliability of candidate marks
- Testing the assumptions of the model
- Examiner goodness of fit statistics
- Candidate goodness of fit statistics
- The long-term reliability of examiner stringency measures
- Differences between communication and examination stations
- Multi-facet Rasch modelling of communication and examination stations
-
- Conclusion
- Conclusion
- Abbreviations
- Competing interests
- Authors contributions
- Additional material
- Acknowledgements
- References
- Pre-publication history
-