BMC Genomics - BioMed Central
13
BioMed Central Page 1 of 13 (page number not for citation purposes) BMC Genomics Open Access Research article EST analysis on pig mitochondria reveal novel expression differences between developmental and adult tissues Karsten Scheibye-Alsing 1 , Susanna Cirera 1 , Michael J Gilchrist 2 , Merete Fredholm 1 and Jan Gorodkin* 1 Address: 1 Division of Genetics and Bioinformatics, IBHV, University of Copenhagen, Grønnegårdsvej 3, DK-1870 Frederiksberg, Denmark and 2 The Wellcome Trust/Cancer Research UK Gurdon Institute, Cambridge, CB2 1QN, UK Email: Karsten Scheibye-Alsing - [email protected]; Susanna Cirera - [email protected]; Michael J Gilchrist - [email protected]; Merete Fredholm - [email protected]; Jan Gorodkin* - [email protected] * Corresponding author Abstract Background: The mitochondria are involved in many basic functions in cells of vertebrates, and can be considered the power generator of the cell. Though the mitochondria have been extensively studied there appear to be only few expression studies of mitochondrial genes involving a large number of tissues and developmental stages. Here, we conduct an analysis using the PigEST resource [1] which contains expression information from 35 tissues distributed on one normalized and 97 non-normalized cDNA libraries of which 24 are from developmental stages. The mitochondrial PigEST resource contains 41,499 mitochondrial sequences. Results: The mitochondrial EST (Expressed Sequence Tag) sequences were assembled into contigs which covers more than 94 percent of the porcine mitochondrial genome, with an average of 976 EST sequences per nucleotide. This data was converted into expression values for the individual genes in each cDNA library revealing differential expression between genes expressed in cDNA libraries from developmental and adult stages. For the 13 protein coding genes (and several RNA genes), we find one set of six genes, containing all cytochrome oxidases, that are upregulated in developmental tissues, whereas the remaining set of seven genes, containing all ATPases, that are upregulated in adult muscle and brain tissues. Further, the COX I (Cytochrome oxidase subunit one) expression profile differs from that of the remaining genes, which could be explained by a tissue specific cleavage event or degradation pattern, and is especially pronounced in developmental tissues. Finally, as expected cDNA libraries from muscle tissues contain by far the largest amount (up to 20%) of expressed mitochondrial genes. Conclusion: Our results present novel insight into differences in mitochondrial gene expression, emphasizing differences between adult and developmental tissues. Our work indicates that there are presently unknown mechanisms which work to customize mitochondrial processes to the specific needs of the cell, illustrated by the different patterns between adult and developmental tissues. Furthermore, our results also provide novel insight into how in-depth sequencing can provide significant information about expression patterns. Published: 11 October 2007 BMC Genomics 2007, 8:367 doi:10.1186/1471-2164-8-367 Received: 16 July 2007 Accepted: 11 October 2007 This article is available from: http://www.biomedcentral.com/1471-2164/8/367 © 2007 Scheibye-Alsing et al.; licensee BioMed Central Ltd. This is an Open Access article distributed under the terms of the Creative Commons Attribution License (http://creativecommons.org/licenses/by/2.0 ), which permits unrestricted use, distribution, and reproduction in any medium, provided the original work is properly cited.
-
Upload
khangminh22 -
Category
Documents
-
view
5 -
download
0
Transcript of BMC Genomics - BioMed Central
BioMed CentralBMC Genomics
ss
Open AcceResearch articleEST analysis on pig mitochondria reveal novel expression differences between developmental and adult tissuesKarsten Scheibye-Alsing1, Susanna Cirera1, Michael J Gilchrist2, Merete Fredholm1 and Jan Gorodkin*1Address: 1Division of Genetics and Bioinformatics, IBHV, University of Copenhagen, Grønnegårdsvej 3, DK-1870 Frederiksberg, Denmark and 2The Wellcome Trust/Cancer Research UK Gurdon Institute, Cambridge, CB2 1QN, UK
Email: Karsten Scheibye-Alsing - [email protected]; Susanna Cirera - [email protected]; Michael J Gilchrist - [email protected]; Merete Fredholm - [email protected]; Jan Gorodkin* - [email protected]
* Corresponding author
AbstractBackground: The mitochondria are involved in many basic functions in cells of vertebrates, andcan be considered the power generator of the cell. Though the mitochondria have been extensivelystudied there appear to be only few expression studies of mitochondrial genes involving a largenumber of tissues and developmental stages. Here, we conduct an analysis using the PigESTresource [1] which contains expression information from 35 tissues distributed on one normalizedand 97 non-normalized cDNA libraries of which 24 are from developmental stages. Themitochondrial PigEST resource contains 41,499 mitochondrial sequences.
Results: The mitochondrial EST (Expressed Sequence Tag) sequences were assembled into contigswhich covers more than 94 percent of the porcine mitochondrial genome, with an average of 976EST sequences per nucleotide. This data was converted into expression values for the individualgenes in each cDNA library revealing differential expression between genes expressed in cDNAlibraries from developmental and adult stages. For the 13 protein coding genes (and several RNAgenes), we find one set of six genes, containing all cytochrome oxidases, that are upregulated indevelopmental tissues, whereas the remaining set of seven genes, containing all ATPases, that areupregulated in adult muscle and brain tissues. Further, the COX I (Cytochrome oxidase subunitone) expression profile differs from that of the remaining genes, which could be explained by atissue specific cleavage event or degradation pattern, and is especially pronounced indevelopmental tissues. Finally, as expected cDNA libraries from muscle tissues contain by far thelargest amount (up to 20%) of expressed mitochondrial genes.
Conclusion: Our results present novel insight into differences in mitochondrial gene expression,emphasizing differences between adult and developmental tissues. Our work indicates that thereare presently unknown mechanisms which work to customize mitochondrial processes to thespecific needs of the cell, illustrated by the different patterns between adult and developmentaltissues. Furthermore, our results also provide novel insight into how in-depth sequencing canprovide significant information about expression patterns.
Published: 11 October 2007
BMC Genomics 2007, 8:367 doi:10.1186/1471-2164-8-367
Received: 16 July 2007Accepted: 11 October 2007
This article is available from: http://www.biomedcentral.com/1471-2164/8/367
© 2007 Scheibye-Alsing et al.; licensee BioMed Central Ltd. This is an Open Access article distributed under the terms of the Creative Commons Attribution License (http://creativecommons.org/licenses/by/2.0), which permits unrestricted use, distribution, and reproduction in any medium, provided the original work is properly cited.
Page 1 of 13(page number not for citation purposes)
BMC Genomics 2007, 8:367 http://www.biomedcentral.com/1471-2164/8/367
BackgroundThe mammalian mitochondrion is a system of only fewcomponents. It consist of 13 protein coding genes, 22tRNA, two rRNAs and possibly a few non-coding RNAs[2]. In spite of this, the mitochondrion is of great impor-tance to the organism, and higher animals would likelynot exist without functional mitochondria. Thus, themitochondria are an essential part of many metabolicpathways, most notably generation of ATP through theoxidative phosphorylation system, and is unique amongthe cellular organelles, because it contains a genome of itsown [3,4] (and references therein). The circular mito-chondrial genome also deviates from the nuclear genomeby being extremely compact in nature with almost nointer-spaced non-coding DNA between genes, further-more, it has a special codon usage using only the 22tRNAs to encode the amino acids. The compact nature ofthe mitochondrion is directly reflected in the transcrip-tion mechanism, as all genes are transcribed in polycis-tronic transcripts which are then processed to give themature RNAs [3,4] (and references therein).
Since, the genes encoded in the mitochondrial DNA areused in pathways central to living organism, the patternsof expression can potentially provide considerableinsights into the metabolic and biochemical mechanismsin different tissues. The massive amount of research onmitochondria (eg. a PubMed search with keywords 'mito-chondrion' or 'mitochondrial' yields almost 150,000 hits)have to some extent uncovered the mechanisms responsi-ble for regulation of mitochondrial genes: It has beenfound that the D-loop is the origin for transcription ofboth strands of the genome, and contains promoter andbinding regions for transcription factors [5], that can serveto up or down regulate transcription. It has, for example,been shown that there is a significant regulation of tran-scription in response to external stimuli [6-8]. However,due to the nature of the polycistronic transcription, suchgenes are expected to be expressed at equal levels and bejointly up- and down-regulated eg. [7]. Furthermore, deg-radational mechanisms related to adenylation, stability,and translation have been linked to post-transcriptionalregulation [9-11], which is expected to lead to uniformrelative expression levels between mitochondrial genes.This coordinated expression of mitochondrial genes hasbeen verified experimentally, by eg. [8,12]. Furthermore,the mitochondrial system is still being investigated fornovel insights into disease mechanics, where a large scaleexpression analysis (as presented here) provide usefulinsights. To conduct these expression studies, good ani-mal models are desirable, and the pig is an obvious candi-date. It is increasingly being used as a model animal [13],since it is relatively close to humans, both genetically andphysiologically, and thus a better model animal candidatethan, for instance rodents. It has, for example, been
shown that, in sequence space, the pig is closer to humanthan mouse [14] and the similar observation can readilybe made for the mitochondrial genomes (data notshown). Additionally, pig (in contrast to human) pro-vides easy access to tissues from various organs at differentdevelopment stages. Also the pig is one of the worlds fore-most production animals and any insights gained couldhave a large economic impact. Due to the extreme read-coverage of the mitochondrion, this study also providespredictions of the outcome from the "next"- generationsequencing methods (ie. 454 sequencing etc.) whenapplied to cDNA sequencing (see eg. [15]). These newmethods are characterized by very high throughput andcan therefore generate huge amounts of data, which can,for example, be used in digital expression studies, in themanner presented herein.
Here, we use the PigEST resource comprising 41,499 mito-chondrial sequences [1,16] to present the first large-scalemitochondrial expression study comparing different tis-sues and different developmental stages.
ResultsEST assemblyThe Sino-Danish pig-genome project generated around685,000 EST (Expressed Sequence Tags) sequences asdescribed in [1,16]. The sequences were generated fromone normalized and 97 non-normalized cDNA librariescovering in total 35 tissues. Details are available online[1]. The library names and corresponding tissues are listedin Table 1. The resource contains 41,499 EST sequences(reads) annotated as mitochondrial sequences. We assem-bled this set of mitochondrial sequences using the Dis-tiller pipeline [17], and generated 35 contigs (geneclusters) and 23 single reads. The largest contig contains11699 reads while the smallest were aggregates of onlytwo ESTs. This also demonstrate the strength of the Dis-tiller pipeline, as it is able to handle such large (and deep)clusters. A complete list of contigs along with their genematch in the mitochondrial genome is provided in Table2.
To ensure that the ESTs were unique for the porcine mito-chondrial genome, the ESTs were matched against the nrdatabase [18] using BLAST [19]. Except for 232 ESTs(which are probably still mitochondrial), all 41,499 mito-chondrial ESTs matched with smaller E-values to mito-chondrial proteins than all other proteins, where the vastmajority (95%) matched the with E-values smaller than1e - 65 (see Methods for details).
Furthermore, our assembly yield an overall high coverageof the mitochondrial genome as the contigs covers 15148positions of 15978 possible, corresponding to 94% of themitochondrial genome, and has an average coverage of
Page 2 of 13(page number not for citation purposes)

BMC Genomics 2007, 8:367 http://www.biomedcentral.com/1471-2164/8/367
Table 1: Overview of Libraries
Lib name Tissue (Animals) Description Reads
amn Amnion (S) -- 126aor Aorta (M) -- 99bla Bladder (M) -- 244nbm* Bone marrow (S) 115 days, bone marrow 135cbe Brain (M) Cerebellum 325cbr• Brain (B) Brain (cortex) 1067fco Brain (M) Frontal cortex 410hyp Brain (S) Hypothalamus 1153pgl Brain (M) Pituitary gland 242ecc* Brain (S) F 50 days, cortex 384ece* Brain (S) F 50 days, cerebellum 206fce* Brain (S) F 100, cerebellum 192fcc* Brain (S) F 107, cortex cerebri 408fhi* Brain (S) F 107 Hippocampus 662cbl• Haemopoetic (B) Blood 200jca Cartillage (S) Joint capsule 327nca* Cartillage (S) 115 days, cartilage 389pan• Endocrine glands (M) Pancreas 60ret Eye (M) Retina 901eye* Eye (S) F 50, eye 174fat Fat (M) Fat 742che Heart (B) -- 40hea Heart (M) -- 974hlv Heart (S) Left ventricle 2103cje Intestine (B) Jejunum 0col Intestine (S) Large intest, colon asc. 342duo Intestine (S) Small intest, duodenum 289ill Intestine (S) Small intest, illeum 147jej Intestine (S) Small intest, jejunum 629lin Intestine (M) Large intestine 1109sin Intestine (M) Small intestine 313eje* Intestine (S) F 50, Jejunum 521nco* Intestine (S) 115 days, colon 548nje* Intestine (S) 115 days, jejunum 460cki Kidney (B) -- 10kid Kidney (M) -- 405cli Liver (B) -- 223liv Liver (M) -- 100eli* Liver (S) F 50, liver 113fli* Liver (S) F 100, liver 95clu Lung (B) -- 313lun‡ Lung (M) -- 176elu* Lung (S) F 50 days, lung 48nlu* Lung (S) 115 days, lung 239cly Lymphatic gland (B) -- 287lyg Lymphatic gland (M) -- 418lnt Lymphatic gland (S) -- 315cga Mammary gland (B) -- 69mcp Mammary gland (S) Mammae, collostrum prod 257mga Mammary gland (M) 7 days after weaning 112mgm• Mammary gland (M) 14 days after birth 81mgp Mammary gland (M) 7 days pre birth 81med Mediastinum (S) -- 480bfe Muscles (M) M. biceps femoris 1738ctl• Muscles (B) Tenderloin 420isp Muscles (M) M. infraspinatus 1530ldo Muscles (M) M. longissimus dorsi 832mas Muscles (S) M. masseter 1214sme Muscles (M) M. semimembranosus 137
Page 3 of 13(page number not for citation purposes)

BMC Genomics 2007, 8:367 http://www.biomedcentral.com/1471-2164/8/367
976. Interestingly, in spite of this extreme coverage, weobserved that there are almost no ESTs originating inregions outside annotated genes, and we essentially didnot pick up any ESTs originating from a completelyunprocessed polycistronic transcript, ie. there is an abruptchange in coverage from genes to the small gaps betweengenes.
The assembly program, Distiller [17], was also able toconduct a phylogenetic decomposition of a number of
clusters. That is, clusters originally composed of ESTs fromboth European (eg. Yorkshire) and Asian (eg. Taihu) pigbreeds were divided into clusters with either Europeanbreed ESTs or Asian breed ESTs based on SNP informa-tion. A result of this is that there are five pairs of highlysimilar consensus sequences where one sequence matchpublished Asian strain sequence while the other matchpublished European strain sequences.
ssp Muscles (M) M. supraspinatus 806ste Muscles (M) M. semitendinosus 711tbr Muscles (M) M. triceps brachii 1314vin Muscles (M) M. vastus intermedius 255ese* Muscles (S) F 50, M. semitendinosus 279nms* Muscles (S) 115 days, M. semitendinosus 745gul Oesophagus (M) -- 291ova Ovary (M) -- 178cov Ovary (S) -- 363pla† Placenta (M) -- 15pro Prostata (M) -- 128rec Rectum (M) -- 393cmu Rhinal mucosal membrane (B) -- 5nmm* Rhinal mucosal membrane (S) 115 days, mucosal memb. 505sag Salivary gland (M) -- 628csk Skin (B) -- 19ski Skin (M) -- 312ton Skin (S) Tip of tongue, mucosa 659eep* Skin (S) F 50, epidermis 53eru* Skin (S) F 50, regium bilicalis 229nep* Skin (S) 115 days, epidermis 143spc Spinal cord (M) Spinal cord 570ebs* Spinal cord (S) F 50 days, brain stem 408fbs* Spinal cord (S) F 107 Brain stem 780spl Spleen (M) -- 126csp Spleen (B) -- 185cst Stomach (B) -- 3sto Stomach (M) -- 7sug Suprarenal glands (M) -- 424cag Suprarenal glands (B) Adrenal gland 316cte Testicle (B) -- 2tes Testicle (M) -- 70cty Thyroid glands (B) -- 462thg Thyroid glands (M) -- 439pty Thyroid glands (S) Piglet 2 days, thymus 288fry* Thyroid glands (S) F 100, thymus 216tra Trachea (M) -- 336ute Uterus (S) -- 380cut Uterus (B) -- 6
*: Developmental tissue.†: Is a normalized library.•: Ignored in expression analysis (see materials and methods).‡: Likely to be heavily contaminated by liver ESTs.The generated cDNA libraries, representing 35 tissues. They are here shown as two (overlapping) sets, a physiological and a developmental set. The column "Libname" gives three letter code for the library, "Tissue" indicates the overall tissue the library has been generated from, where "(Animals)" indicates whether the library has been generated from a single (S or B) or multiple (M) animals. Libraries listed with (M) and (S) represent the pig breeds (mostly cross breeds) used in the Danish breeding (ie. Landrace, Yorkshire, Duroc and Hampshire), whereas the libraries listed with (B) present Chinese pig breeds. "Description" provides a short description. The column "Reads" show the number of mitochondrial reads that went into that library after cleaning. The F NN label refers to fetal tissue, NN days old, eg. F 50 libraries are tissues from 50 days old fetuses.
Table 1: Overview of Libraries (Continued)
Page 4 of 13(page number not for citation purposes)

BMC Genomics 2007, 8:367 http://www.biomedcentral.com/1471-2164/8/367
Another intricacy is overlapping genes, eg. ATP6 andATP8. These were clustered together in the assembly dueto the existence of EST sequences which overlap bothgenes, and therefore the clusters essentially represent bothgenes.
The phylogenetic decomposed pairs along with thegene(s) covered are indicated in Table 2.
cDNA library content of mitochondrial genesAn investigation of the proportion of mitochondrial geneexpression in the different cDNA libraries was performed.We found that cDNA libraries from tissues associated withhigh metabolism (eg. muscles) have a larger fraction ofmitochondrial ESTs compared to the total number ofreads from that library as shown in Figure 1. We observedthat the fraction of total reads that originates from themitochondrion ranges from roughly 0% up to 22%, withthe majority falling between 2% to 10%. However, thelibraries (8 in total) with the smallest fraction seem tohave unusual low mitochondrial-EST counts, and were
excluded in the following clustering. Furthermore, weattempted to see if there were any correlations betweenthe number of counts from a given tissue and diversity ofexpression, however we did not find any such patterns.
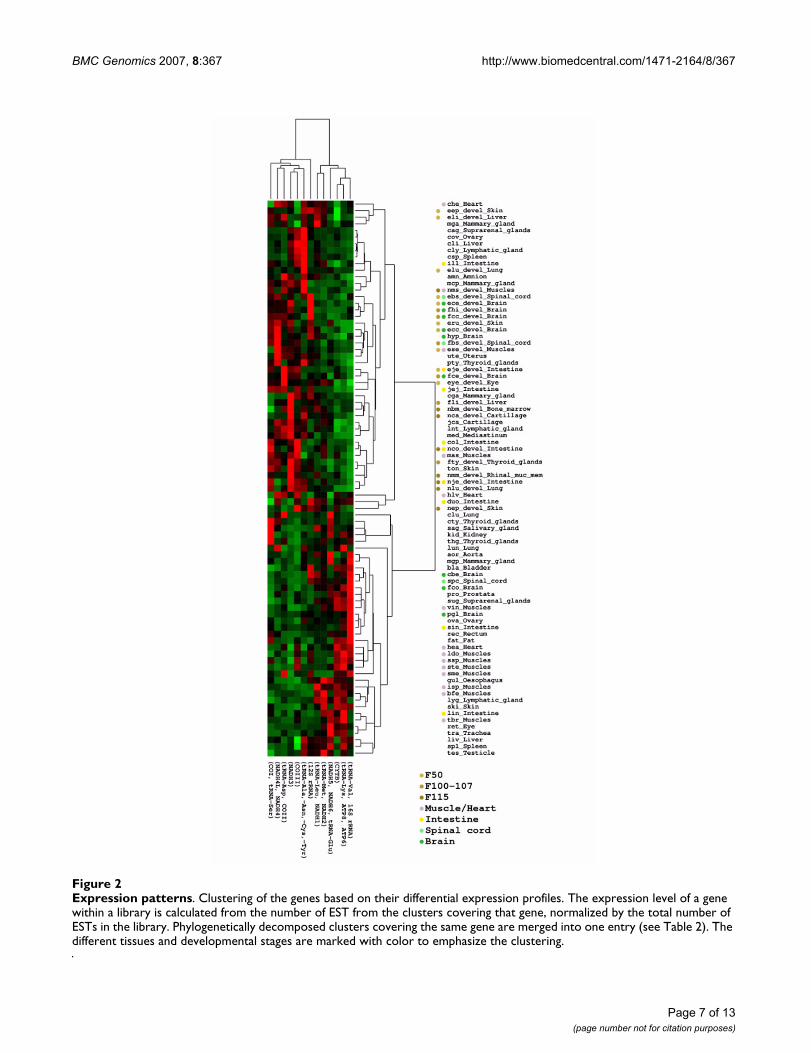
Differential gene expressionTo measure the digital expression of specific genes (con-tigs) in a given cDNA library, we considered the numberof ESTs relative to the library size (see Methods), which ingeneral, for high confident annotations (as here), hasbeen shown to be in agreement with experimental qPCRresults [16]. Using the digital expression values and merg-ing clusters representing the same genes (ie. those that hadbeen phylogenetically decomposed), we conducted ahierarchical clustering using the gene-cluster package [20](with centroid linkage and correlation as similarity met-ric). The result is shown in Figure 2. We observed that thetissues fall in two different main groups: one enriched andone deprived for cDNA libraries established from tissuessampled at different developmental stages.
Table 2: Contig mapping
Contig name Genes Expression Annotation
Mto.1-rpt br0137_p9.5 ATP6, ATP8, tRNA-lys ATP6, ATP8, tRNA-lysMto.1-rcbr0_003330.5 ATP6Mto.1-Pig4-TMW8011D08.5 CoIII CoIIIMto.1-rlin28_c19.5 CoIIIMto.1-ruio09_m24.5 COII, tRNA-asp COII, tRNA-aspMto.1-rfce02c_c7.5 COII, tRNA-aspMto.1-Pig3-SRG8019L17.3 COIIMto.1-rmcp16c_h16.5 tRNA-ala, -asn, -cys, -tyr tRNA-ala, -asn, -cys, -tyrMto.1-rlnt16c_c19.5.5 NADH2, tRNA-met NADH2, tRNA-metMto.1-raor035_i5.5 NADH2Mto.1-Pig1-12J20.5 NADH2Mto.1-rpigcf0_021006.5.5 12s rRNA 12s rRNAMto.1-rfhi4018b_b15.5 12s rRNAMto.1-rfhi4034b_l17.5.5 NADH3 NADH3Mto.1-rmas913b_n9.5 NADH3Mto.1-rpigca0_009382.5.264 NADH5, NADH6, tRNA-leu NADH5, NADH6, tRNA-leuMto.1-rdbla0134_l12.5.265 NADH5, NADH6Mto.1-rcbr0_002402.5.88 NADH1, tRNA-leu NADH1, tRNA-leuMto.1-risp19_019.5.109 NADH1, tRNA-leuMto.1-rmed14c_h17.5 16s rRNA, tRNA-val 16s rRNA, tRNA-valMto.1-rcbr0_008583.5 16s rRNAMto.1-reje01b_b4.5.221 CYTB CYTBMto.1-rnje02c_k15.5.223 CYTBMto.1-rjej10b_b21.5.172 NADH4, NADH4L NADH4, NADH4LMto.1-rcbr0_013551.5.173 NADH4, NADH4LMto.1-Pig3-SRG8014F12.3 NADH4Mto.1-Pig4-TMW8023L12.3 NADH4Mto.1-rece10_n9.5.336 COI, tRNA-ser COI, tRNA-serMto.1-rhlv24b_m17.5.334 COI, tRNA-serMto.1-rhyp06c_f16.5 COIMto.1-Pig3-SRG8017A07.5 COI
Table showing which genes the different contigs maps to. Found by comparing the matched (by BLAST) position to the annotations in genbank entry AF486866. The expression annotation column marks which clusters in the expression clustering the contig has gone into.
Page 5 of 13(page number not for citation purposes)

BMC Genomics 2007, 8:367 http://www.biomedcentral.com/1471-2164/8/367
The confidence of the clustering was assessed using otherclustering schemes and metrics (eg. complete linkage witheuclidean similarity metric). Applying this range ofschemes leads to essentially the same results. However,the exact relation between the individual libraries were tosome extend shuffled from scheme to scheme, ie. theorder of the libraries change slightly.
Though it is difficult to make any clear distinctionbetween the genes that are expressed in the tissue clusters,it appears that 16S RNA and ATPase subunits six and eighthave a higher expression in libraries from muscles andbrain tissues, while there is no systematic pattern in theremaining libraries.
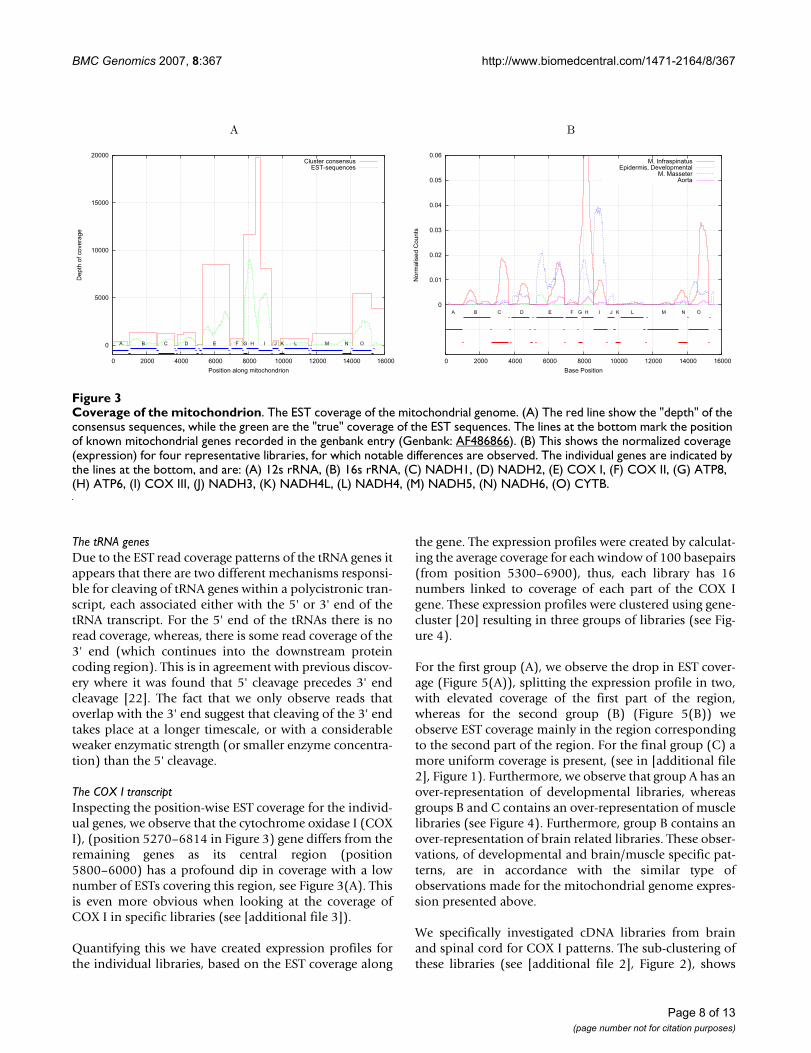
Furthermore, there is a distinct difference between thetotal expression of the different mitochondrial genes. Thisis readily apparent from Figure 3(A), where the depth ofthe EST coverage is shown. Comparing the depth to thegenes it appears that the depth varies considerable, fromjust below ten thousand to zero at gene boundaries. Thedifferences in expression can be seen in more detail in Fig-ure 3(B), where the normalized depth of coverage isshown from four representative libraries (see [additionalfile 1] for all libraries). We see that the expression pattern
varies greatly for different tissues. Interestingly, we alsofind ESTs which map to the D-loop region(15271–15978), where no genes have been annotated.This is particularly intriguing considering the recent dis-covery of non-coding RNA (ncRNA) in the mouse D-loopregion [2], however we were unable to find good matches(using BLAST [19] or FOLDALIGN [21] for local structuralRNA alignment) between the putative mouse ncRNAs,and the porcine D-loop region (from Genbank:AF486866). Therefore, it has not been possible to con-clude whether the porcine D-loop ESTs correspond to anyof the reported mouse D-loop ncRNAs.
Processing of mitochondrial transcriptsThe EST data also contains information about post-tran-scriptional cleavage of the mitochondrial polycistronictranscript. At any given position on the mitochondrialgenome, the coverage of an EST indicates the existence ofa transcript from that position. Conversely, not findingany EST reads in a particular region means that the tran-script is likely to be rapidly degraded. This is exemplifiedby the lack of coverage of the mitochondrial genomebetween annotated structures (genes/ncRNAs) as shownin Figure 3(A).
Mitochondrial fraction of ExpressionFigure 1Mitochondrial fraction of Expression. The libraries are ordered according their fraction of EST originating from mitochon-dria. Selected tissues and their developmental stage are marked by colored bullets.
F50 F100−107 F115 Muscle/Heart Intestine
cst
cte
cmu
cut
sto
cki
pla
csk
che
eep
nb
mp
an tes
mg
m liv eli
mg
asp
lel
ucg
a fli
aor
cbl
ova ill
nep lun
eru
mg
pp
gl
eye
csp
bla cli
cly
ese
jca
clu
fty
pty tra
sme
mcp ec
cln
tsk
in
luec
eca
gco
vct
yeb
sd
uo
ute eje
gu
lfc
eki
dam
nn
casu
gsi
nly
gth
gm
ed jej
ctl
fco
spc
pro co
ln
mm
rec
nje
cbe
fcc
ldo
vin
nco st
ess
pfa
tfh
isa
gto
nre
tcb
rfb
sn
ms
linh
yp hea tb
ris
pm
as bfe hlv
0
5
10
15
20
25
Libraries
Per
cen
t m
tES
T e
xpre
ssed
Page 6 of 13(page number not for citation purposes)
BMC Genomics 2007, 8:367 http://www.biomedcentral.com/1471-2164/8/367
Page 7 of 13(page number not for citation purposes)
Expression patternsFigure 2Expression patterns. Clustering of the genes based on their differential expression profiles. The expression level of a gene within a library is calculated from the number of EST from the clusters covering that gene, normalized by the total number of ESTs in the library. Phylogenetically decomposed clusters covering the same gene are merged into one entry (see Table 2). The different tissues and developmental stages are marked with color to emphasize the clustering.
BMC Genomics 2007, 8:367 http://www.biomedcentral.com/1471-2164/8/367
The tRNA genesDue to the EST read coverage patterns of the tRNA genes itappears that there are two different mechanisms responsi-ble for cleaving of tRNA genes within a polycistronic tran-script, each associated either with the 5' or 3' end of thetRNA transcript. For the 5' end of the tRNAs there is noread coverage, whereas, there is some read coverage of the3' end (which continues into the downstream proteincoding region). This is in agreement with previous discov-ery where it was found that 5' cleavage precedes 3' endcleavage [22]. The fact that we only observe reads thatoverlap with the 3' end suggest that cleaving of the 3' endtakes place at a longer timescale, or with a considerableweaker enzymatic strength (or smaller enzyme concentra-tion) than the 5' cleavage.
The COX I transcriptInspecting the position-wise EST coverage for the individ-ual genes, we observe that the cytochrome oxidase I (COXI), (position 5270–6814 in Figure 3) gene differs from theremaining genes as its central region (position5800–6000) has a profound dip in coverage with a lownumber of ESTs covering this region, see Figure 3(A). Thisis even more obvious when looking at the coverage ofCOX I in specific libraries (see [additional file 3]).
Quantifying this we have created expression profiles forthe individual libraries, based on the EST coverage along
the gene. The expression profiles were created by calculat-ing the average coverage for each window of 100 basepairs(from position 5300–6900), thus, each library has 16numbers linked to coverage of each part of the COX Igene. These expression profiles were clustered using gene-cluster [20] resulting in three groups of libraries (see Fig-ure 4).
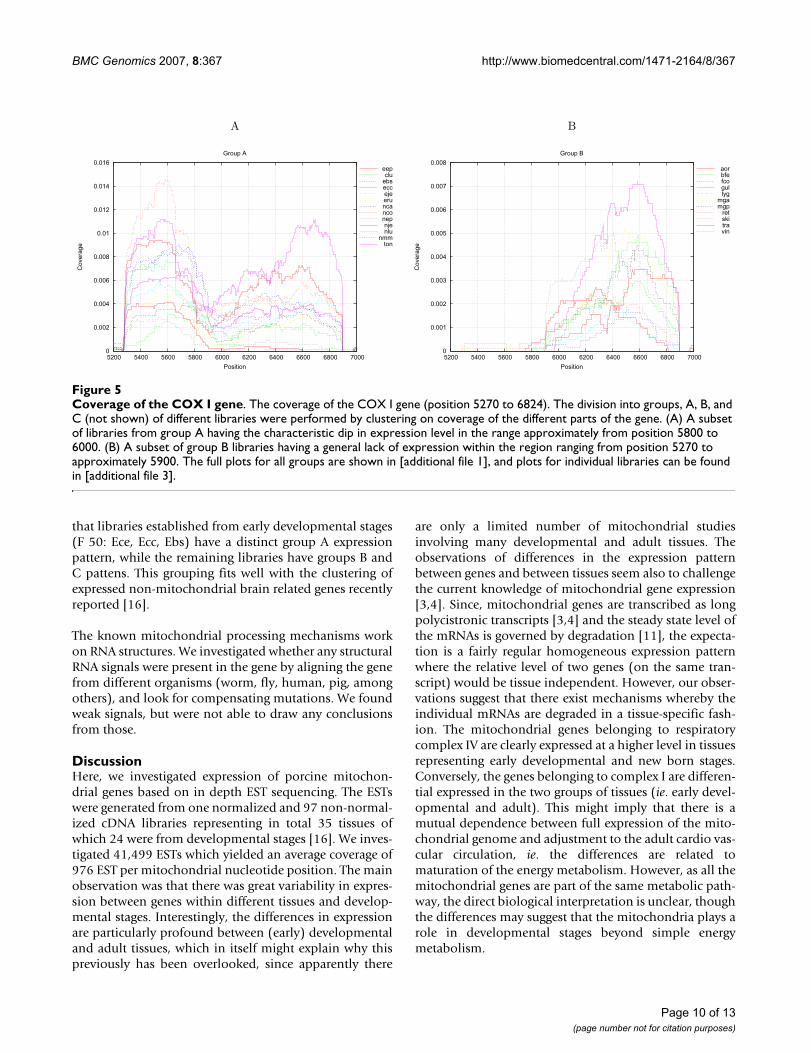
For the first group (A), we observe the drop in EST cover-age (Figure 5(A)), splitting the expression profile in two,with elevated coverage of the first part of the region,whereas for the second group (B) (Figure 5(B)) weobserve EST coverage mainly in the region correspondingto the second part of the region. For the final group (C) amore uniform coverage is present, (see in [additional file2], Figure 1). Furthermore, we observe that group A has anover-representation of developmental libraries, whereasgroups B and C contains an over-representation of musclelibraries (see Figure 4). Furthermore, group B contains anover-representation of brain related libraries. These obser-vations, of developmental and brain/muscle specific pat-terns, are in accordance with the similar type ofobservations made for the mitochondrial genome expres-sion presented above.
We specifically investigated cDNA libraries from brainand spinal cord for COX I patterns. The sub-clustering ofthese libraries (see [additional file 2], Figure 2), shows
Coverage of the mitochondrionFigure 3Coverage of the mitochondrion. The EST coverage of the mitochondrial genome. (A) The red line show the "depth" of the consensus sequences, while the green are the "true" coverage of the EST sequences. The lines at the bottom mark the position of known mitochondrial genes recorded in the genbank entry (Genbank: AF486866). (B) This shows the normalized coverage (expression) for four representative libraries, for which notable differences are observed. The individual genes are indicated by the lines at the bottom, and are: (A) 12s rRNA, (B) 16s rRNA, (C) NADH1, (D) NADH2, (E) COX I, (F) COX II, (G) ATP8, (H) ATP6, (I) COX III, (J) NADH3, (K) NADH4L, (L) NADH4, (M) NADH5, (N) NADH6, (O) CYTB.
A B
0
5000
10000
15000
20000
0 2000 4000 6000 8000 10000 12000 14000 16000
Dep
th o
f cov
erag
e
A B C D E F G H I J K L M N O
Position along mitochondrion
Cluster consensusEST-sequences
0
0.01
0.02
0.03
0.04
0.05
0.06
0 2000 4000 6000 8000 10000 12000 14000 16000
Nor
mal
ised
Cou
nts
A B C D E F G H I J K L M N O
Base Position
M. InfraspinatusEpidermis, Developmental
M. MasseterAorta
Page 8 of 13(page number not for citation purposes)

BMC Genomics 2007, 8:367 http://www.biomedcentral.com/1471-2164/8/367
Page 9 of 13(page number not for citation purposes)
Clustering of specific COX I gene coverageFigure 4Clustering of specific COX I gene coverage. Clustering based specific coverage of the COX I gene. Three main group are found. Group A, with an elevated relative expression of the first part of the gene, and a drop off at position 5900, Group B with an elevated relative expression of the last part of the gene, and group C, with an elevated relative expression of the cen-tral part of the gene. Groups B and C are somewhat similar, but group A has a clear pattern.
BMC Genomics 2007, 8:367 http://www.biomedcentral.com/1471-2164/8/367
that libraries established from early developmental stages(F 50: Ece, Ecc, Ebs) have a distinct group A expressionpattern, while the remaining libraries have groups B andC pattens. This grouping fits well with the clustering ofexpressed non-mitochondrial brain related genes recentlyreported [16].
The known mitochondrial processing mechanisms workon RNA structures. We investigated whether any structuralRNA signals were present in the gene by aligning the genefrom different organisms (worm, fly, human, pig, amongothers), and look for compensating mutations. We foundweak signals, but were not able to draw any conclusionsfrom those.
DiscussionHere, we investigated expression of porcine mitochon-drial genes based on in depth EST sequencing. The ESTswere generated from one normalized and 97 non-normal-ized cDNA libraries representing in total 35 tissues ofwhich 24 were from developmental stages [16]. We inves-tigated 41,499 ESTs which yielded an average coverage of976 EST per mitochondrial nucleotide position. The mainobservation was that there was great variability in expres-sion between genes within different tissues and develop-mental stages. Interestingly, the differences in expressionare particularly profound between (early) developmentaland adult tissues, which in itself might explain why thispreviously has been overlooked, since apparently there
are only a limited number of mitochondrial studiesinvolving many developmental and adult tissues. Theobservations of differences in the expression patternbetween genes and between tissues seem also to challengethe current knowledge of mitochondrial gene expression[3,4]. Since, mitochondrial genes are transcribed as longpolycistronic transcripts [3,4] and the steady state level ofthe mRNAs is governed by degradation [11], the expecta-tion is a fairly regular homogeneous expression patternwhere the relative level of two genes (on the same tran-script) would be tissue independent. However, our obser-vations suggest that there exist mechanisms whereby theindividual mRNAs are degraded in a tissue-specific fash-ion. The mitochondrial genes belonging to respiratorycomplex IV are clearly expressed at a higher level in tissuesrepresenting early developmental and new born stages.Conversely, the genes belonging to complex I are differen-tial expressed in the two groups of tissues (ie. early devel-opmental and adult). This might imply that there is amutual dependence between full expression of the mito-chondrial genome and adjustment to the adult cardio vas-cular circulation, ie. the differences are related tomaturation of the energy metabolism. However, as all themitochondrial genes are part of the same metabolic path-way, the direct biological interpretation is unclear, thoughthe differences may suggest that the mitochondria plays arole in developmental stages beyond simple energymetabolism.
Coverage of the COX I geneFigure 5Coverage of the COX I gene. The coverage of the COX I gene (position 5270 to 6824). The division into groups, A, B, and C (not shown) of different libraries were performed by clustering on coverage of the different parts of the gene. (A) A subset of libraries from group A having the characteristic dip in expression level in the range approximately from position 5800 to 6000. (B) A subset of group B libraries having a general lack of expression within the region ranging from position 5270 to approximately 5900. The full plots for all groups are shown in [additional file 1], and plots for individual libraries can be found in [additional file 3].
A B
0
0.002
0.004
0.006
0.008
0.01
0.012
0.014
0.016
5200 5400 5600 5800 6000 6200 6400 6600 6800 7000
Cov
erag
e
Position
Group A
eepclu
ebseccejeeruncanconepnjenlu
nmmton
0
0.001
0.002
0.003
0.004
0.005
0.006
0.007
0.008
5200 5400 5600 5800 6000 6200 6400 6600 6800 7000
Cov
erag
e
Position
Group B
aorbfefcogullyg
mgamgp
retskitravin
Page 10 of 13(page number not for citation purposes)
BMC Genomics 2007, 8:367 http://www.biomedcentral.com/1471-2164/8/367
The differences between gene expression in developmen-tal and adult tissues were also present in COX I. For thisgene we observed (for several cDNA libraries) a suddendrop of EST coverage within the gene itself, indicatingpost-transcriptional processing. Based on the differentexpression patterns within the cDNA libraries we con-ducted a clustering that led to three main patterns ofexpression. One main group is dominated by cDNAlibraries from developmental stages, whereas the othersare dominated by brain and muscle libraries. Further-more, for brain libraries we found COX I expression pat-terns in agreement with expression patterns from non-mitochondrial genes previously found [10], lending fur-ther credibility to our observation.
One could speculate that these patterns represent a cleav-age event of the COX I gene. The putative cleavage eventdoes not appear to be ubiquitous, and seems to be fol-lowed by specific degradation of one of the cleave-formsin some cases. The cleaving might represent a new modeof regulation of the mitochondrial processes where theCOX I gene is involved. A previous study [23] suggestedregulation of mitochondrial COX genes, emphasizing dif-ferences in developmental stages (in agreement with ourstudy), and suggested a link to the different isoforms ofCOX VIa and COX VIIa.
We do not have any biological interpretation of how thismechanism works. Conventional mitochondrial process-ing would require the mRNA to be spliced due to second-ary RNA structures [22], and though we have found weakRNA structure signals in the COX I gene (by comparing toother organisms), we can not conclusively say what medi-ates this processing. Extensive laboratory work couldhopefully shed some light on the possible biologicalmechanism(s), but is beyond the scope of the work pre-sented here.
ConclusionThe discovery of large expression differences betweenindividual mitochondrial genes is surprising. In particularthe observation that there are large differences betweenmitochondrial gene expression in developmental andadult tissue is of potential great biological interest. Regu-lation of the mitochondrial genes is expected to somedegree. However, the known mechanisms regulate thetranscription of the full polycistronic transcript, anddegrade the mitochondrial encoded RNA, dependent onthe features of the RNA specie [8,10,24], leading to anexpectation of uniform patterns across tissues. Our workindicates that there must be some mechanism(s) thatselectively degrades specific gene transcripts in specific tis-sues. These mechanisms could partly be related to meta-bolic differences in adult and developmental tissues. Ourstudy also demonstrates the usefulness of in-depth
sequencing for expression studies, supporting that expres-sion studies can be carried out by raw sequencing, such asthe recent 454 and solexa parallel sequencing methods[25,26].
MethodsDataThe source of the EST sequences is described in [16]. TheEST sequences from the sources described therein werematched against a known pig mitochondrial sequenceextracted from GenBank (acc: AF486866, gi: 33320837)using blastn [19], and labeled as mitochondrial by usingthe build in tool of the Distiller assembler. In total 41,499ESTs were assigned such label. These ESTs were thenassembled with the Distiller EST assembly pipeline [17],which uses a backbone Microsoft SQL server. Further,based on SNP patterns, the contigs were phylogeneticallysplit into European and Asian strains.
The generated contigs were then matched using blastn[19]) against a known pig mitochondrial sequence (Gen-Bank: AF486866), thereby locating each sequence at aspecific position on the mitochondrial genome, andallowing detailed comparison with known mitochondrialfeatures. Extraction and analysis of the sequence informa-tion was performed using a number of SQL and Perlscripts created for the specific analysis.
The coverage depths were calculated by mapping the ESTsequences to the mitochondrion in a similar fashion tothe contigs, and simply adding the number of ESTs cover-ing that particular position, ie. if two ESTs were mapped tocover a base on the mitochondrial genome, then the cov-erage at that positions is two. The counts were normalizedusing the total number of library specific reads.
To ensure that the porcine ESTs matched against proteindatabases are correct matches to mitochondrial proteins,we performed some validating checks. We (in lack of acomplete porcine genome) matched human mitochon-drial genes to known human genes. We found no matcheswith a high similarity, thus indicating that there are nogenes paralogous to mitochondrial genes in mammals.
Furthermore, when matching the porcine ESTs (usingBLAST [19]) against the known nr database [18], all but232 ESTs hit nr sequences that were clearly identifiable asmitochondrial with a higher score (lower E-value respec-tively) than non-mitochondrial sequences. Also 95% ofthe ESTs match with E-values smaller than 1e - 65 to themitochondrial sequences. For the remaining 232 mostoften a mitochondrial sequence matched with compara-ble E-value as the match with the lowest E-value. Further,for these ESTs the nr sequence that matched with the low-est E-value had unclear annotations, ie. annotations
Page 11 of 13(page number not for citation purposes)

BMC Genomics 2007, 8:367 http://www.biomedcentral.com/1471-2164/8/367
which could not conclusively be identified as belongingto a specific genome. We therefore believe that the 232sequences represent mitochondrial ESTs, and includedthem in the analysis.
Additionally, it is worth noticing that the phylogeneticdecomposition of genes into European and Asian strains,increase the confidence that all ESTs are mitochondrial, asothers would have been likely to merge into a separatecluster and be decomposed along with the already decom-posed gene-clusters.
Digital Expression Profiles
The expression of gene i (contig) in library j is computedas the fraction of ESTs of library j that is assembled into
gene i, that is the expression is . The calcu-
lated expression patterns were then clustered using gene-cluster [20] (normalizing and centering data, centroidclustering based on correlations (uncentered)), and visu-alized with Java Treeview [27,28]. A few libraries wereexcluded in the analysis as they seemed to have artificiallylow read count, the cut-off was set at an absolute count of20 ESTs (excluding the libraries: cst, cfe, cmu, cut, sto, cki,pla, csk). Since 'pla' is the normalized library it wasexpected to have a low read count. Furthermore, clustersthat had been phylogenetically split were merged, so thatthe expression of one gene represented by two clusterswere taken as the sum of the expression in the clusters.
Availability and requirementsAll data for the project including the assembled sequences(contigs), expression and BLAST data is available at http://pigest.ku.dk/more/mito/. From this webpage it is alsopossible to access the assembly for each contig with itscorresponding reads.
Authors' contributionsMJG, MF and JG formulated the project. KSA conductedthe assembly and expression analysis. All authors contrib-uted to and approved the final manuscript.
Additional material
AcknowledgementsWe would like to thank Peter Sestoft for comments in an early version of this work. We would also like to thank Bjørn Quistorff for valuable discus-sion on mitochondrial gene expression. KSA was supported by a grant from the Faculty of Life Sciences, University of Copenhagen. This work was sup-ported by the Danish Pig Breeding Association, the Danish research council FTP (formerly SJVF and STF), and the Danish Center for Scientific Comput-ing.
References1. The PigEST resource v. 1.0 at LIFE [http://pigest.ku.dk]2. Lung B, Zemann A, Madej M, Schuelke M, Techritz S, Ruf S, Bock R,
Huttenhofer A: Identification of small non-coding RNAs frommitochondria and chloroplasts. Nucleic Acids Res 2006,34(14):3842-52.
3. Montoya J, Lopez-Perez M, Ruiz-Pesini E: Mitochondrial DNAtranscription and diseases:past, present and future. BiochimBiophys Acta 2006, 1757(9–10):1179-89.
4. Fernandez-Silva P, Enriquez J, Montoya J: Replication and tran-scription of mammalian mitochondrial DNA. Exp Physiol 2003,88:41-56.
5. Berdanier C: Mitochondrial gene expression: influence ofnutrients and hormones. Exp Biol Med (Maywood) 2006,231(10):1593-601.
6. Chou S, Hannah S, Lowe K, Norman A, Henry H: Tissue-specificregulation by vitamin D status of nuclear and mitochondrialgene expression in kidney and intestine. Endocrinology 1995,136(12):5520-6.
7. Everts H, Claassen D, Hermoyian C, Berdanier C: Nutrient-geneinteractions: dietary vitamin A and mitochondrial geneexpression. IUBMB Life 2002, 53(6):295-301.
8. Mehrabian Z, Liu L, Fiskum G, Rapoport S, Chandrasekaran K: Reg-ulation of mitochondrial gene expression by energy demandin neural cells. J Neurochem 2005, 93(4):850-60.
9. Temperley R, Seneca S, Tonska K, Bartnik E, Bindoff L, Lightowlers R,Chrzanowska-Lightowlers Z: Investigation of a pathogenicmtDNA microdeletion reveals a translation-dependentdeadenylation decay pathway in human mitochondria. HumMol Genet 2003, 12(18):2341-8.
10. Slomovic S, Laufer D, Geiger D, Schuster G: Polyadenylation anddegradation of human mitochondrial RNA: the prokaryoticpast leaves its mark. Mol Cell Biol 2005, 25(15):6427-35.
11. Piechota J, Tomecki R, Gewartowski K, Szczesny R, Dmochowska A,Kudla M, Dybczynska L, Stepien P, Bartnik E: Differential stabilityof mitochondrial mRNA in HeLa cells. Acta Biochim Pol 2006,53:157-68.
12. Ammini C, Hauswirth W: Mitochondrial gene expression is reg-ulated at the level of transcription during early embryogen-esis of Xenopus laevis. J Biol Chem 1999, 274(10):6265-71.
13. Lunney J: Advances in Swine Biomedical Model Genomics. BiolSci 2007, 3(3):179-184.
14. Wernersson R, Schierup M, Jørgensen F, Gorodkin J, Panitz F, Staer-feldt H, Christensen O, Mailund T, Hornshøj H, Klein A, Wang J, Liu
Additional file 1Normalized coverage from libraries. The expression profile of the mito-chondria for each cDNA library.Click here for file[http://www.biomedcentral.com/content/supplementary/1471-2164-8-367-S1.pdf]
#
#
,EST
Total EST
lib gene
lib
j i
j
Additional file 2COXI expression and clustering. Supplementary figures for COX I expres-sion and cluster analysis.Click here for file[http://www.biomedcentral.com/content/supplementary/1471-2164-8-367-S2.pdf]
Additional file 3Normalized COXI coverage from libraries. The expression profile of the COX I gene for each cDN A library.Click here for file[http://www.biomedcentral.com/content/supplementary/1471-2164-8-367-S3.pdf]
Page 12 of 13(page number not for citation purposes)
http://www.ncbi.nlm.nih.gov/entrez/query.fcgi?cmd=Retrieve&db=PubMed&dopt=Abstract&list_uids=7588303
http://www.ncbi.nlm.nih.gov/entrez/query.fcgi?cmd=Retrieve&db=PubMed&dopt=Abstract&list_uids=7588303
BMC Genomics 2007, 8:367 http://www.biomedcentral.com/1471-2164/8/367
Publish with BioMed Central and every scientist can read your work free of charge
"BioMed Central will be the most significant development for disseminating the results of biomedical research in our lifetime."
Sir Paul Nurse, Cancer Research UK
Your research papers will be:
available free of charge to the entire biomedical community
peer reviewed and published immediately upon acceptance
cited in PubMed and archived on PubMed Central
yours — you keep the copyright
Submit your manuscript here:http://www.biomedcentral.com/info/publishing_adv.asp
BioMedcentral
B, Hu S, Dong W, Li W, Wong G, Yu J, Wang J, Bendixen C, FredholmM, Brunak S, Yang H, Bolund L: Pigs in sequence space: a 0.66Xcoverage pig genome survey based on shotgun sequencing.BMC Genomics 2005, 106(1):70.
15. Emrich S, Barbazuk W, Li L, Schnable P: Gene discovery and anno-tation using LCM-454 transcriptome sequencing. Genome Res2007, 17:69-73.
16. Gorodkin J, Cirera S, Hedegaard J, Gilchrist M, Panitz F, Jorgensen C,Scheibye-Knudsen K, Arvin T, Lumholdt S, Sawera M, Green T,Nielsen B, Havgaard J, Rosenkilde C, Wang J, Li H, Li R, Liu B, Hu S,Dong W, Li W, Yu J, Wang J, Staefeldt H, Wernersson R, Madsen L,Thomsen B, Hornshoj H, Bujie Z, Wang X, Wang X, Bolund L, BrunakS, Yang H, Bendixen C, Fredholm M: Porcine transcriptome anal-ysis based on 97 non-normalized cDNA libraries and assem-bly of 1,021,891 ESTs. Genome Biology 2007, 8:R45.
17. Gilchrist M, Zorn A, Voigt J, Smith J, Papalopulu N, Amaya E: Defin-ing a large set of full-length clones from a Xenopus tropicalisEST project. Dev Biol 2004, 271(2):498-516.
18. Benson D, Karsch-Mizrachi I, Lipman D, Ostell J, Wheeler D: Gen-bank. Nucleic Acids Res 2007:D21-5.
19. Altschul S, Gish W, Miller W, Myers E, Lipman D: Basic local align-ment search tool. J Mol Biol 1990, 215(3):403-10.
20. Reich M, Ohm K, Angelo M, Tamayo P, Mesirov J: GeneCluster 2.0:an advanced toolset for bioarray analysis. Bioinformatics 2004,20(11):1797-8.
21. Havgaard J, Lyngso R, Stormo G, Gorodkin J: Pairwise local struc-tural alignment of RNA sequences with sequence similarityless than 40%. Bioinformatics 2005, 21(9):1815-24.
22. Rossmanith W, Tullo A, Potuschak T, Karwan R, Sbisa E: Humanmitochondrial tRNA processing. J Biol Chem 1995,270(21):12885-91.
23. Lefai E, Vincent A, Boespflug-Tanguy O, Tanguy A, Alziari S: Quanti-tative decrease of human cytochrome c oxidase duringdevelopment: evidences for a post-transcriptional regula-tion. Biochim Biophys Acta 1997, 1318(1–2):191-201.
24. Raikhinstein M, Hanukoglu I: Mitochondrial-genome-encodedRNAs: differential regulation by corticotropin in bovineadrenocortical cells. Proc Natl Acad Sci 1993, 90(22):10509-13.
25. Margulies M, Egholm M, Altman W, Attiya S, Bader J, Bemben L, BerkaJ, Braverman M, Chen Y, Chen Z, Dewell S, Du L, Fierro J, Gomes X,Godwin B, He W, Helgesen S, Ho C, Ho C, Irzyk G, Jando S, AleuquerM, Jarvie T, Jirage K, Kim J, Knight J, Lanza J, Leamon J, Lefkowitz S,Lei M, Li J, Lohman K, Lu H, Makhijani V, McDade K, McKenna M,Myers E, Nickerson E, Nobile J, Plant R, Puc B, Ronan M, Roth G,Sarkis G, Simons J, Simpson J, Srinivasan M, Tartaro K, Tomasz A,Vogt K, Volkmer G, Wang S, Wang Y, Weiner M, Yu P, Begley R,Rothberg J: Genome sequencing in microfabricated high-den-sity picolitre reactors. Nature 2005, 437(7057):376-80.
26. Products & services .::. solexa sequencing applications .::. illu-mina, inc [http://www.illumina.com/pages.ilmn?ID=201]
27. Java TreeView [http://jtreeview.sourceforge.net/]28. Saldanha A: Java Treeview – extensible visualization of micro-
array data. Bioinformatics 2004, 20(17):3249-8.
Page 13 of 13(page number not for citation purposes)
http://www.ncbi.nlm.nih.gov/entrez/query.fcgi?cmd=Retrieve&db=PubMed&dopt=Abstract&list_uids=2231712
http://www.ncbi.nlm.nih.gov/entrez/query.fcgi?cmd=Retrieve&db=PubMed&dopt=Abstract&list_uids=2231712
http://www.ncbi.nlm.nih.gov/entrez/query.fcgi?cmd=Retrieve&db=PubMed&dopt=Abstract&list_uids=7759547
http://www.ncbi.nlm.nih.gov/entrez/query.fcgi?cmd=Retrieve&db=PubMed&dopt=Abstract&list_uids=7759547
http://www.ncbi.nlm.nih.gov/entrez/query.fcgi?cmd=Retrieve&db=PubMed&dopt=Abstract&list_uids=9030264
http://www.ncbi.nlm.nih.gov/entrez/query.fcgi?cmd=Retrieve&db=PubMed&dopt=Abstract&list_uids=9030264
http://www.ncbi.nlm.nih.gov/entrez/query.fcgi?cmd=Retrieve&db=PubMed&dopt=Abstract&list_uids=9030264
http://www.ncbi.nlm.nih.gov/entrez/query.fcgi?cmd=Retrieve&db=PubMed&dopt=Abstract&list_uids=7504267
http://www.ncbi.nlm.nih.gov/entrez/query.fcgi?cmd=Retrieve&db=PubMed&dopt=Abstract&list_uids=7504267