Development and evaluation of a field-based, high-thoughput phenotyping platform
Upload
khangminh22Category
view
0download
0
Thiopurine methyltransferase
Phenotyping and Genotyping in
Clinical Practice
by
Valerie Graham
A thesis submitted
for the degree of
Master of Philosophy
College of Medical and Dental Sciences
The University of Birmingham
October 2009

University of Birmingham Research Archive
e-theses repository This unpublished thesis/dissertation is copyright of the author and/or third parties. The intellectual property rights of the author or third parties in respect of this work are as defined by The Copyright Designs and Patents Act 1988 or as modified by any successor legislation. Any use made of information contained in this thesis/dissertation must be in accordance with that legislation and must be properly acknowledged. Further distribution or reproduction in any format is prohibited without the permission of the copyright holder.

ABSTRACT
Thiopurine methyltransferase (TPMT) metabolises the widely prescribed
thiopurine drugs. The activity of this enzyme varies between individuals and this
can influence treatment success. Rapid and accurate assays of TPMT and
6TGN, the active thiopurine metabolites, are increasingly recognised as valuable
clinical tools, to guide dosing and treatment.
This work examines and develops methods for determining a patient's TPMT
status and measuring 6TGN levels, adapting them for analysis using whole blood
rather than washed red blood cell preparations. The advantages and limitations
of these new assays in practice are investigated, which clearly shows that the
more rapid new methods have increased clinical significance and utility.
Experimental work and research provides an increased understanding of factors
influencing determination and significance of a patient's TPMT status and
thiopurine metabolite levels. This includes possible misclassification of TPMT
status when expressing results in relation to patient haemoglobin and a
longitudinal study of TPMT activity of patients commencing thiopurine therapy
which demonstrates no enzyme induction.

CONTENTS
Abstract
Contents
List of figures and tables
List of abbreviations
Acknowledgments
1. Introduction
1.1. Pharmacogenetics
1.2. Clinical significance of TPMT
1.3. Thiopurine drug metabolism
1.4. Pharmacogenetics of TPMT
1.5. Strategies for determining patient TPMT status
1.5.1. Phenotyping
1.5.2. Genotyping
1.6. City Hospital International TPMT Screening Service
1.7. Thioguanine Nucleotides
1.8. Research Objectives
1.8.1. Development and implementation of a whole blood TPMT
assay
1.8.2. Monitoring the new TPMT assay

1.8.3. Development and implementation of a whole blood 6TGN
assay
1.8.4. Induction study
2. Materials and Methods
2.1. TPMT phenotyping
2.1.1 Assay principle
2.1.2 Red blood cell (RBC) method
2.1.3 TPMT incubations
2.1.4 HPLC analysis
2.2. TPMT genotyping extraction
2.2.1. Cell lysis
2.2.2. Phenol/chloroform extraction
2.2.3. DNA Precipitation
2.2.4. Purity and concentration of DNA
2.3. TPMT genotyping polymerase chain reaction
2.3.1. Primer sequences
2.3.2. Primer composition
2.4. TPMT genotyping electrophoresis and visualisation
2.5. Thioguanine nucleotides
2.5.1. Assay principle
2.5.2. Method

3. Whole Blood TPMT Activity
3.1. Development of a new phenotyping assay
3.1.1 Phenotyping
3.1.2. Genotyping
3.3.3 Results
3.2. Correlation of enzyme activities
3.3. Comparison with genotyping
3.4. Advantages of new assay
4. Evaluation of phenotyping
4.1. Enzyme assay
4.2. Effect of sample age
4.3. Haematology effects
4.3.1. Low patient haemoglobin
4.3.2. TPMT activity uncorrected for haemoglobin
4.3.3. Mean corpuscular haemaglobin concentration and white
blood cell count
4.4. Phenotype/genotype comparison
4.4.1. Audit data
4.4.2. Mutation type
4.5. Use of the service
4.5.1. Increase in demand
4.5.2. Requestors

4.6. Individual TPMT variability
4.6.1. Repeat testing
4.6.2. Gender/age differences in TPMT activity
5. Integrity of Results
5.1. Quality System
5.1.1. Failure modes and effects analysis (FMEA)
5.1.2. Acceptance criteria
5.1.3. Introduction of changes
5.1.4. Reagent manufacture
5.1.5. Competency checks
5.1.6. Daily maintenance logs
5.1.7. Introducing a new QC
5.1.8. Repeat samples
5.1.9. Genotyping confirmation
5.1.10. Reporting
5.1.11. Logs
5.2. QC data
5.3. Reducing variability
5.3.1. Freeze thawing techniques
5.3.2. Incubation temperature control
5.3.3. Sampling errors

6. Thioguanine Nucleotides
6.1. Thiopurine drug monitoring
6.2. Reasons for testing
6.3. Results of provisional study and comparison with New Zealand laboratory
6.4. Method development
6.5. Use of the 6TGN service
7. Induction Study
7.1. Aims
7.2. Results
8. Discussion
8.1. Introduction
8.2. Research outcomes
8.2.1. Whole blood assay
8.2.2. Whole blood assay precision profile
8.2.3. Whole blood assay utility
8.2.4. Phenotype / genotype concordance
8.2.5. Variability of TPMT activity
8.2.6. 6TGN assay
8.3. Future directions
8.4. Conclusions

9. Appendices
Appendix 1 Equipment and suppliers
Appendix 2 Whole blood TPMT study data
Appendix 3 Published paper
Whole-blood thiopurine S-methyltransferase activity with genotype
concordance: a new, simplified phenotyping assay.
Ford L, Graham V, Berg J. (2006) Ann Clin Biochem.
Appendix 4 Poster
A simplified assay for determination of red blood cell 6-thioguanine
nucleotides; early evidence suggests UK patients are receiving sub-
optimal doses of thiopurine drugs. Graham V, Ford L T, Berg J (2007)
Euromedlab
Appendix 5 Poster
Improving a test that has a growing clinical demand; whole blood 6TGN
and its role in pharmacogenomics. Graham V, Berg J. (2008)
Appendix 6 Poster Abstract
Patients with high-normal TPMT activity identified during routine
phenotypic testing: What is going on? Ford LT, Graham V, Berg JD
(2006) Ann Clin Chem
Appendix 7 Poster Abstract
Routine thiopurine drug monitoring by rapid determination of blood
metabolite levels. V Graham, L Ford, J Berg (2008) Ann Clin Chem
Appendix 8 6TGN / Mean cell volume correlation data
10. References

LIST OF FIGURES AND TABLES
Figures
Figure 1.1 Azathioprine structure
Figure 1.2 Simplified azathioprine and 6MP biotransformation
Figure 1.3 Distribution of TPMT activity in a 1,000 individuals
Figure 1.4 Thioguanine nucleotide formation
Figure 2.1 Stability of 6TGN hydrolysing reagent
Figure 3.1 Whole blood TPMT analysis
Figure 3.2 Examples of DNA fragments visualized for wild type, heterozygous
and homozygous deficient genotypes
Figure 3.3 Relationship between mean whole blood and mean RBC TPMT
activity
Figure 3.4 Distribution of TPMT activity and genotype in 402 individuals
Figure 4.1 TPMT phenotyping reaction
Figure 4.2 Michaelis Menten analysis for 6TG showing the final choice of
substrate concentration used in the assay
Figure 4.3 Michaelis Menten analysis for S-adenosyl methionine showing the
final choice of substrate concentration used in the assay
Figure 4.4 Linearity of the TPMT assay
Figure 4.5 Study of linearity using a range of lysate dilutions
Figure 4.6 Chromatography typical of high, normal, low and deficient TPMT
Figure 4.7 TPMT activity in samples stored at -80°C

Figure 4.8 TPMT activity in samples stored at 4°C
Figure 4.9 TPMT activity in samples stored at room temperature
Figure 4.10 TPMT activity in samples stored at 4°C and room temperature
compared to activity when stored at -80°C
Figure 4.11 TPMT activity distribution for 400 study samples, corrected for
haemoglobin
Figure 4.12 TPMT activity distribution for 400 study samples, uncorrected for
haemoglobin
Figure 4.13 Correlation of WBC count and TPMT activity
Figure 4.14 Increase in TPMT requests from July 2003 to January 2009
Figure 4.15 Breakdown of TPMT requests by clinical discipline and clinical
condition. Data for August 2007
Figure 4.16 Correlation between activities for patients repeat tested for TPMT
Figure 5.1 Separation between 6MTG and salicylate using a new column
Figure 5.2 Separation between 6MTG and salicylate using a column after
approximately 1,000 injections
Figure 5.3 Plot of TPMT QC April 2006 - September 2008
Figure 5.4 Longitudinal study of TPMT activity in two individuals used as
Quality Control April 2006 - October 2008
Figure 6.1 Formation of 6-thioguanine nucleotides
Figure 6.2 Initial 6TGN comparison with New Zealand laboratory
Figure 6.3 Repeat 6TGN comparison with New Zealand laboratory

Figure 6.4 Comparison between 6TGN concentrations measured in washed
RBC and whole blood
Figure 6.5 Late peaks on 6TGN chromatography
Figure 6.6 6TGN chromatography using mobile phase B composition:
15% Acetonitrile / 5% Methanol / 80% Buffer
Figure 6.7 6TGN chromatography using mobile phase B composition:
30% Acetonitrile / 10% Methanol / 60% Buffer
Figure 6.8 6TGN chromatography using mobile phase B composition:
15% Acetonitrile / 5% Methanol / 80% Buffer. Increased ramp and
duration
Figure 6.9 6TGN sample stability Figure 6.10 Increase in demand for 6TGN analysis Figure 6.11 Mean cell volume / 6TGN level correlation
Figure 7.1 TPMT induction in patients on Azathioprine
Tables
Table 2.1 Primer sequences
Table 2.2 Multiplex reaction primer composition
Table 2.3 PCR Parameters
Table 3.1 Summary of TPMT activities in nmol 6MTG/gHb/h for RBC / whole
blood comparison study
Table 3.2 Summary of TPMT genotypes for RBC / whole blood comparison
study

Table 4.1 RBC and whole blood TPMT for patients with low haemoglobin
Table 4.2 Phenotype / genotype concordance when haemoglobin correction
applied
Table 4.3 Phenotype / genotype concordance without haemoglobin correction
Table 4.4 Data for samples with phenotype / genotype discordance
Table 4.5 Haematology of high TPMT activity samples
Table 4.6 Breakdown of phenotyping results
Table 4.7 Phenotype / genotype concordance
Table 4.8 Common TPMT mutations
Table 4.9 Paired T for C1 - C2
Table 4.10 Gender/Age differences in TPMT activity
Table 6.1 Mean cell volume / 6TGN correlation
Table 5.1 Percentage RBC lysis achieved after 15 minutes at -80°C
Table 5.2 Percentage white blood cell lysis achieved after 15 minutes at
-80°C
Table 7.1 TPMT and 6TGN levels of patients starting azathioprine treatment

LIST OF ABBREVIATIONS
6MMP 6-methylmercaptopurine
6MP 6-mercaptopurine
6MTG 6-methylthioguanine
6TG 6-thioguanine
6TGN 6-thioguanine nucleotides
ADR Adverse drug reaction
ARMS Amplification refractory mutation system
CE Conformité européenne
DHPLC Denaturing high-performance liquid chromatography
DNA Deoxyribonucleic acid
DPK Diphosphate kinases
DTT DL-dithiothreitol
EDTA Ethylenediaminetetraacetic
EQA External quality assurance
FDA Food and drug administration
FBC Full blood count
FMEA Failure modes and effect analysis
GMPS Guanosine monophosphate synthase
Hb Haemoglobin
HPLC High performance liquid chromatography
HPRT Hypoxanthine phosphoribosyltransferase
IMPDH Inosine monophosphate dehydrogenase
IS Internal Standard
ITPA Inosine triphosphatate pyrophosphohydrolase
MALDI-TOF Matrix-assisted laser desorption/ionization time of flight analysis
MCV Mean cell volume
MPK Monophosphate kinases
MTHFR Methylenetetrahydrofolate reductase
NEQAS National External Quality Assessment Service
NCBI National centre for biotechnology information
PCR Polymerase chain reaction
QC Quality control
RBC Red blood cells
RFLP Restriction fragment length polymorphism
RNA Ribonucleic acid
SAM S-adenosyl methionine
SNP Single nucleotide polymorphisms
SSCP Single strand conformational polymorphism
TBE Tris borate EDTA
TPMT Thiopurine methyltransferase
UGT1a1 Uridine diphosphate glucuronosyltransferase 1A1
UV Ultraviolet
WBC White blood cells
XO Xanthine oxidase

ACKNOWLEDGEMENTS
I am indebted to the SWBH NHS Trust for financing this research and granting
me permission to carry out the practical work in the Clinical Biochemistry
Department of City Hospital, Birmingham.
I would also like to express my gratitude to my supervisors, Dr. Margaret Eggo
for her guidance and Dr. Jonathan Berg for his reassurance and encouragement.
This work has relied on help from all colleagues within the TPMT section of the
laboratory. In particular, I would like to thank, Dr. Loretta Ford, Dr. Nicola Barlow,
Mrs. Deb Oakley and Mrs. Pardeep Bangh, for advice and assistance with
methodology, analysis and data collection.
Finally, I am grateful to my family and friends for their patience and moral
support.
1
1. INTRODUCTION
1.1. Pharmacogenetics
A patient’s response to a drug can be influenced by the genetic make-up of the
individual. Genetic variation affecting drug metabolism can result in an
unpredictable outcome to treatment. Pharmacogenetics is the linking of
differences in gene expression (genotype) to drug response (phenotype) and
advances in this field are helping to better predict drug efficacy and toxicity.
These developments have obvious major medical benefits as they enable
optimization of drug dosage.
The field of pharmacogenetics dates back to the 1950s, when it was first
proposed that inherited traits may account for individual variability in drug
response (Motulsky 1957). Today, one of the main applications of
pharmacogenetics is research into disease mechanisms and new drug
discovery. Meanwhile, development and clinical application, help to improve
drug efficacy and safety.
The possibility of therapy being more effective and better tolerated has enormous
financial implications. Each year in the United Kingdom, adverse drug reactions
(ADR) account for an estimated 6.5% of hospital admissions, at a cost to the
National Health Service of approximately £466 million (Pirmohamed et al 2004).
In the future, these medical costs may be compounded by claims for
compensation, as patients may have a strong legal case, if their suffering could

2
have been averted. Many of the drugs responsible for ADR are metabolized by
an enzyme with variant alleles (Zhou et al 2008). Pre-treatment screening of the
enzyme phenotype or genotype could predict therapy outcome. Currently, the
best clinically applied example of pharmacogenetics is the determination of
thiopurine methyltransferase (TPMT) status prior to commencement of thiopurine
drugs (Wang & Weinshilboum 2006), and it is this which forms the basis of this
thesis.
1.2. Clinical significance of TPMT
TPMT (EC 2.1.1.6.7) is a cytosolic enzyme present in most cells of the body. It
catalyses the S-methylation of aromatic and heterocyclic sulphydryl compounds
(Weinshilboum 1989). TPMT is of clinical interest as it is involved in the
metabolism of thiopurine drugs, for example azathioprine, 6-mercaptopurine
(6MP) and 6-thioguanine (6TG). These drugs are largely used in the
management of auto-immune diseases, in the disciplines of gastroenterology,
dermatology and rheumatology. They are also used effectively in the
management of acute lymphoblastic leukaemia and to prevent transplant organ
rejection (Weinshilboum & Sladek 1980; Lennard & Lilleyman 1996; Anstey et al
2004; Ernest & Seidman 2003; Whisnat & Pelkay 1982).
It is estimated that approximately 60,000 patients per year commence thiopurine
drug treatment in the UK. The most widely prescribed thiopurine drug is
azathioprine, with the brand name IMURAN. This is now a generic drug, of

3
relatively low cost, having been at the centre of a cost reduction agreement
between the Government and the pharmaceutical industry. It is used extensively
as it provides an attractive alternative to steroid treatment. Although thiopurine
drugs are widely used, gastrointestinal intolerance, pancreatitis, hypersensitivity
and myelosuppression are observed in up to 30% of patients. These ADR often
result in the withdrawal of treatment (Weinshilboum & Sladek 1980; Lennard &
Lilleyman 1996; Clunie & Lennard 2004; Anstey et al 1992). In some instances
the unexpected reaction to therapy can be fatal, for example in cases of severe
myelosuppression (Slaner et al 2008). If this occurs, all cells produced in the
bone marrow become suppressed. The reduction in leucocytes leaves the body
susceptible to infection, while reduced platelets cause clotting abnormalities and
red cell anaemia results.
Comprehensive evaluation of the clinical benefit and cost effectiveness of
screening strategies for pharmacogenetic testing in the UK is incomplete, despite
the Government published a strategy in 2003 for maximizing the potential of
genetics in the NHS (Department of Health). So far evidence has indicated
sufficient benefit to warrant informing prescribers, pharmacists and patients of the
available tests and their possible role in the selection and dosing of these drugs.
This has prompted the Food and Drug Administration (FDA), in the United States
of America, to approve label changes for 6MP and Azathioprine.

4
1.3. Thiopurine drug metabolism
Figure 1.1 Azathioprine structure
Azathioprine is the 1-methyl-4-nitro-imadazolyl of thioguanine. It is classed as a
pro-drug which is converted by the sulphydryl compounds, glutathione and
cysteine, in red blood cells (RBC) to 6-mercaptopurine (6MP). This metabolite
undergoes activation, via a multi-step enzymatic pathway, into thioguanine
nucleotides (6TGN) (Lennard & Maddocks 1983) as seen in Figure 1.2. 6TGN
achieve therapeutic efficacy primarily by virtue of their cytotoxic action. They are
incorporated as false bases into newly synthesized DNA, preventing proliferation
of the target bone marrow and white blood cells, and also interfere with other
biochemical pathways.

5
Figure 1.2 Simplified azathioprine and 6MP biotransformation
HPRT= hypoxanthine phosphoribosyltransferase, XO = xanthine oxidase, TPMT= thiopurine methyltransferase, IMPDH = inosine monophosphate dehydrogenase, GMPS = guanosine monophosphate synthase , SAM = S-adenosyl methionine
Three enzymes, hypoxanthine phosphoribosyltransferase (HPRT), xanthine
oxidase (XO) and thiopurine methyltransferase (TPMT) compete to break down
6MP.
The primary anabolic (HPRT) route, leads to pharmacologically active 6TGN.
Normally, methylation by TPMT diverts a proportion of available substrate away
from this pathway to form 6-methylmercaptopurine (6MMP). Therefore, a
deficiency in TPMT activity will result in more substrate following the HPRT route
and much higher concentration of 6TGN. Conversely, a high TPMT activity will
result in more 6MMP but less 6TGN being produced, posing potential treatment
AZATHIOPRINE
6-THIOURIC ACID 6-MERCAPTOPURINE 6-METHYL MERCAPTOPURINE
TGN
GMPS
IMPDH
HPRT
TPMT XO
SAM

6
failure. The increased levels of 6MMP produced in this scenario can inhibit purine
biosynthesis (Dever 2001) and lead to liver damage.
Xanthine oxidase (XO) metabolises 6MP, by oxidation of the purine ring, to
inactive thiouric acid which is excreted from the body. This catabolic process
takes place in the liver and intestinal mucosa after oral administration of the drug.
It has been shown that there is a 4 to 10 fold inter-individual variation in XO
activity, with a significant sex related difference, XO activity tending to be higher
in men (Guerciolini et al 1991). XO activity is very difficult to measure.
Consequently, the effect of this on thiopurine treatment is not, as yet, clearly
defined.
1.4. Pharmacogenetics of TPMT
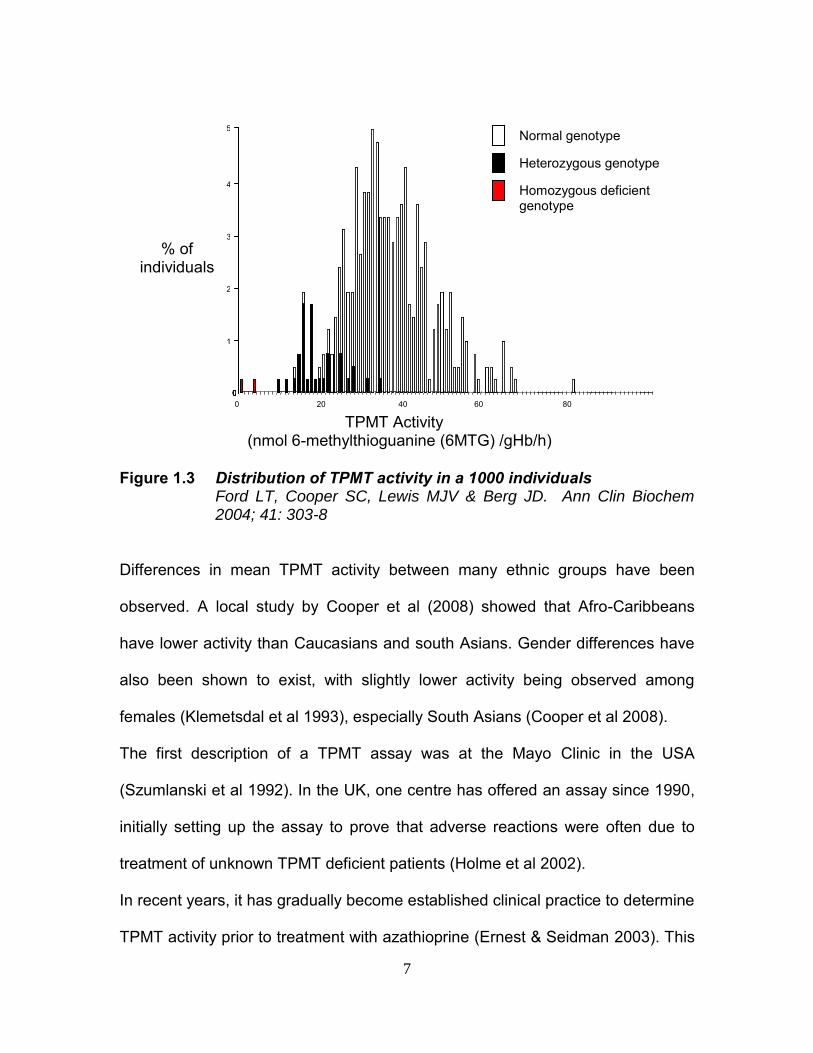
Activity and stability of TPMT are primarily governed by a common autosomal co-
dominant polymorphism. This genetic variation gives rise to a trimodal distribution
of TPMT activity, as shown in Figure 1.3, with approximately 89% of the
population having normal TPMT activity, 0.3% with undetectable enzyme activity
and a further 11% having low activity. (Weinshilboum & Sladek 1980).
7
Figure 1.3 Distribution of TPMT activity in a 1000 individuals
Ford LT, Cooper SC, Lewis MJV & Berg JD. Ann Clin Biochem 2004; 41: 303-8
Differences in mean TPMT activity between many ethnic groups have been
observed. A local study by Cooper et al (2008) showed that Afro-Caribbeans
have lower activity than Caucasians and south Asians. Gender differences have
also been shown to exist, with slightly lower activity being observed among
females (Klemetsdal et al 1993), especially South Asians (Cooper et al 2008).
The first description of a TPMT assay was at the Mayo Clinic in the USA
(Szumlanski et al 1992). In the UK, one centre has offered an assay since 1990,
initially setting up the assay to prove that adverse reactions were often due to
treatment of unknown TPMT deficient patients (Holme et al 2002).
In recent years, it has gradually become established clinical practice to determine
TPMT activity prior to treatment with azathioprine (Ernest & Seidman 2003). This
0 0 0 0
1
2
3
4
5
0 20 40 60 80
% of individuals
Normal genotype
Heterozygous genotype
Homozygous deficient genotype
TPMT Activity (nmol 6-methylthioguanine (6MTG) /gHb/h)

8
screening does not reduce the necessity for careful clinical monitoring. Other
factors can influence individual degrees of tolerance and clinical guidelines
appropriate for one disease are not necessarily applicable to other pathological
states. Mutations in the inosine triphosphatate pyrophosphohydrolase (ITPA)
gene may also cause intolerance to azathioprine (Marinaki et al 2004 a & b; Von
Ahsen et al 2005; Marsh & van Boovan 2009). Deficiency in this enzyme could
lead to potentially increased concentrations of thioinosine triphosphate
metabolites. Resulting symptoms would be non-myelosuppressive, for example
nausea and pancreatitis (Ansari 2008).
Thiopurine drugs have a relatively narrow therapeutic index, with little difference
between therapeutic and toxic doses. Consequently, inappropriate dosing may
result in ADR, at one end of the spectrum and treatment failure at the other.
Individuals with undetectable TPMT activity are those most at risk of severe ADR
including haemopoietic toxicity, myelosuppression or even death, as grossly high
levels of 6TGN can occur if they are given standard thiopurine medication (Clunie
& Lennard 2004). Treatment with thiopurine drugs is contra-indicated for these
patients, although there are reports of individuals with undetectable TPMT being
treated successfully with <20% of normal thiopurine drug dosage (Kaskas et al
2003). Individuals with normal TPMT activity can be given the full dose of the
thiopurine drug from the start. Those with low activity can be treated, with fewer
adverse effects, using a reduced dose (Lennard & Lilleyman 1996; Sanderson et

9
al 2004; Gardiner et al 2006; Richard et al 2007). Studies, including our own,
have provided evidence of a cohort, of approximately 1.8%, with high TPMT
activity (Szumlanski et al 1996; Sanderson et al 2004; Coulthard et al 2002; Ford
et al 2006b), which may be predicted by an unknown genetic polymorphism.
These patients may not respond to standard doses of thiopurine drugs, and are
at risk of hepatotoxicity from increased production of methylated thiopurine
metabolites such as 6MMP (Dubinsky 2004).
1.5. Strategies for determining patient TPMT status
1.5.1. Phenotyping
Human TPMT phenotype is typically determined by measuring the enzyme
activity in RBC. TPMT in these cells is easily accessible and demonstrates a
level of enzyme activity and immunoreactive protein which is representative of
that found in tissues, such as the liver, where the majority of thiopurine
metabolism takes place. (Szumlanski et al 1992; Van Loon & Weinshilboum
1982; Woodson et al 1982).
The following methods are routinely used for TPMT phenotyping:
Radio-enzymatic methods - these rely on the transfer of methyl groups
from radio-labelled 14C-methyl-S-adenosyl-methionine to 6-
mercaptopurine. The 14C-methyl thio-ether reaction product is then
extracted into 20% iso-amyl alcohol in toluene. The radioactivity, which is
directly proportional to TPMT activity, is measured using a scintillation

10
counter. (Weinshilboum et al 1978). These methods are unpopular as the
use of radioactive isotopes has health and safety implications.
High Performance Liquid Chromatography (HPLC) - this is the most
widely used strategy in routine clinical use. In a typical assay, the products
of a reaction in which rate is directly related to TPMT activity, are
measured by HPLC with ultra-violet, fluorescence or mass spectrometry
detection. The metabolites are injected into a stream of high pressure
liquid. This mobile phase carries the sample into a column where
separation takes place, as different components have a different affinity for
the column packing. Those with least affinity elute first and are carried to
the detector where they are quantified.
Immunoassays - qualitative (Rapid Immunomigration) and quantitative
(Enzyme Linked Immunosorbant) assays have been developed by
BIOLOGIX Research Corporation. These utilize an antibody specific to the
riboside of 6-methyl mercaptopurine. There is a kit on the market, but so
far these methods have not found their way into routine use.
The advantages of phenotyping are the relatively low costs and ease of
analysis. The result assesses the activity of TPMT, giving an idea of the extent
of gene expression which can be of major benefit. The three to four fold
variations in activity, seen amongst wild type individuals, can influence dosing
11
even among this group (Yip et al 2008). Phenotypic assays can also assess
other factors that may affect enzyme activity, for instance presence of inhibitors
such as aminosalicylates (Dewit et al 2002). Disadvantages of phenotyping
include possible misclassification for recently transfused patients. This can
have serious consequences as the deficient status of a patient can be masked
by TPMT activity present in the patient’s sample due to donor cells. (Ford et al
2004b). Misclassification using phenotypic analysis could theoretically occur in
patients whose therapy interferes with the in vitro reaction or which induces
enzyme activity (Ames et al 1986; Lysaa RA 1996; Szumlanski & Weinshilboum
1995; Woodson et al 1983; Xin et al 2005).
1.5.2 Genotyping
The TPMT cDNA and gene were cloned and characterized by Honchel et al in
1993. The TPMT gene is located on chromosome 6 and is approximately 34 kb in
length. It consists of 10 exons, 8 of which encode for a 245 amino acid long
protein. The allele for normal TPMT activity (wild-type) has been designated
TPMT *1 (Szumlanski et al 1996). At least twenty five genetic polymorphisms
have so far been identified (Tamm et al 2008), the majority of which are
associated with decreased levels of TPMT activity. Differences in specific mutant
allele frequency have been observed between population groups (Otterness et al
1997). The predominant variant alleles are TPMT*3A, TPMT*3C and to a lesser
extent TPMT*2. In Caucasians the most common variant is TPMT*3A (~5%)
which has two nucleotide polymorphisms (SNPs), on exon 7 and 10 (Yates et al

12
1997). In African-Americans the most common mutant allele is TPMT *3C, which
has the same, exon 10 SNP as for TPMT *3A (Szumlanski et al 1996), this is
also the most common mutation in East Asians (Collie-Duguid et al 1998). It has
also been observed that the frequency of mutations in the TPMT gene is lower in
Chinese populations (Engen et al 2006).
Techniques used for TPMT genotyping include:
Restriction Fragment Length Polymorphism (RFLP) - differentiation by
analysis of patterns derived from cleavage of DNA, using restriction
endonucleases, which cleave DNA molecules at specific nucleotide
sequences.
Amplification Refractory Mutation System (ARMS) - takes advantage
of the fact that the 3’-OH end of a primer bound to template DNA is
required for the polymerase enzyme to synthesize a new copy of DNA.
Any mismatch leads to PCR failure. Consequently, any point mutation can
be detected by synthesizing two primers specific to the wild type or mutant
DNA. Several mutations can be screened for at once, using multiplex
reactions containing more than one set of primers.
Single Strand Conformational Polymorphism (SSCP) - this is a method
to screen the exons of the TPMT gene for mutations using

13
electrophoresis. This method, although relatively simple and low cost, is
time consuming and is not suited for routine use in a clinical setting.
Denaturing High-Performance Liquid Chromatography (DHPLC) -
identifies mutations by detecting sequence variation in re-annealed DNA
strands (hetero-duplexes). This method efficiently detects single
nucleotide and insertion/deletion variation in crude PCR products directly
without DNA sequencing.
DNA microchip technology - fluorescently labelled amplified DNA is
hybridized with oligo-nucleotide DNA probes immobilized in gel pads on a
biochip. This specially designed, costly biochip can recognize six point
mutations in the TPMT gene and seven corresponding alleles associated
with TPMT deficiency (Nasedkina et al 2006).
Mass spectrometry - highly multiplexed genotyping of TPMT variants has
been performed using matrix-assisted laser desorption/ionization - time of
flight analysis (MALDI-TOF) (Schaeffeler et al 2008). A matrix is used to
protect the molecules during ionisation, transforming the energy from the
laser into excitation energy. The time-of-flight analyser separates the ions
according to their mass (m) to charge (z) (m/z) ratio by measuring the time
it takes for them to travel through a field free region.

14
Most of these techniques require polymerase chain reaction (PCR), which
amplifies a specific region of DNA, defined by a set of two ‘primers’. DNA
synthesis is initiated by a thermo-stable DNA polymerase. It was developed in
1987 by Kary Mullis and associates. Usually, at least a million-fold increase of a
specific section of a DNA molecule can be realised, the amplified products
(amplicons) are usually between 150-3,000 base pairs in length and can be
separated and detected using gel electrophoresis.
One of the main limitations of PCR based genotyping techniques is that they do
not identify on which allele a mutation lies. Consequently, where two different
heterozygous mutations are identified, it is not possible to distinguish whether
they lie on the same allele or on different alleles. If they lie on the same allele,
one allele is wild type. This is a heterozygote genotype which will result in low
activity, requiring treatment with a reduced dose of thiopurines. If the mutations
lie on different alleles the patient would be classed as a compound heterozygote.
They would have deficient TPMT status and thiopurine drug therapy would be
contraindicated. It is rarely practical to screen for all known TPMT mutations, so
rare mutations are likely to be missed as well as any new deficient TPMT activity
causing mutations. Another important disadvantage of TPMT genotyping is that it
does not identify the small percentage of high methylators which are at risk of
hepatoxicity (Dubinsky & Lamothe 2000). Genotypic analysis has the advantage
of not being affected by drug interactions, RBC transfusions or sample age but
methods are slower, much more costly than phenotyping, can only detect
common mutations and do not give a quantitative result. Consequently,
15
genotyping is not often the first-line approach to routine TPMT screening.
However, it has a clear complementary role, alongside phenotyping in a routine
TPMT service, in the following scenarios:
To confirm the deficient TPMT status of patients identified by phenotyping.
Phenotypic / genotypic correlation. This will establish a clearer reference
interval between patients heterozygous for the deficient TPMT activity
allele and those who are homozygous for normal TPMT activity alleles.
To determine the TPMT status of patients who have recently been
transfused, for whom phenotyping is not reliable.
The concordance between phenotyping and genotyping has been reported to be
approximately 60-70% for patients with low TPMT activity and >90% overall
(Ford et al 2009; Schaeffeler et al 2004).
1.6. City Hospital Birmingham International TPMT Screening Service
At City Hospital a nationwide referral service was established in 2003. This is
now used by over 200 external laboratories. This service has made TPMT testing
in the UK quicker, cheaper and more accessible. In this time the laboratory has
received over 60000 requests for TPMT phenotypic analysis. Approximately
12% of these were reported as a low TPMT activity, while over 200 patients with
undetectable TPMT activity have been identified. At present, (Sept 2009) over
350 samples are analysed per week, with the capability for over 160 per day.

16
The service provided for TPMT phenotyping used the determination of thiopurine
S-methyltransferase activity in erythrocytes using 6-thioguanine as substrate and
a non-extraction liquid chromatographic technique (Ford & Berg 2003). This was
an improvement on older assays, making it more suitable for routine use. This
was the first NHS hospital in-house assay to be CE marked. This has required
the use of a rigorous vigilance system, described in Chapter 5, which has helped
control this inherently complex assay.
A strategy for routine genotyping TPMT alleles is also in place which underpins
the phenotyping service. Based on the multiplex amplification refractory mutation
system (ARMS) of Roberts et al, modifications make it more suitable for routine
use. This offers a screening method for the TPMT gene, without having to resort
to expensive molecular biology equipment. In comparison to restriction digest
techniques, where incomplete cutting of the target DNA can lead to inaccurate
results, it seems to be more reliable and is less time consuming. This can detect
the common mutations of the TPMT gene, TPMT*2, TPMT *3A and TPMT *3C.
1.7. Thioguanine Nucleotides
The next step to aid management of patients on thiopurine drugs is the
measurement of 6TGN. Monitoring of 6TGN levels can increase drug efficacy
and reduce the likelihood of side effects as it guides dosage (Gearry et al 2006).
A correlation has been demonstrated between 6TGN concentration and clinical
remission rates (Cuffari et al 2001 & 2004; Dubinsky 2005). An inverse
correlation has also been observed between the level of RBC 6TGN and

17
leucocyte counts, which is consistent with the immunosuppressive effects 6TGN
(Lennard et al 2004).
6TGN are formed as shown in Figure 1.3. This figure also shows the TPMT
catalysed methylation of 6-thioinosine 5’-monophosphate which leads to the
production of 6-methylthioinosine 5’-monophosphate. This metabolite is found in
relatively high concentrations. It is an inhibitor of de novo purine synthesis and
high levels are associated with hepatotoxicity (Gardiner et al 2008).
Figure 1.4 Thioguanine nucleotide formation
HPRT=hypoxanthine phosphoribosyltransferase, XO=xanthine oxidase, TPMT=thiopurine methyltransferase, IMPDH=inosine monophosphate dehydrogenase GMPS=guanosine monophosphate synthetase. The diphosphates and triphosphates are formed by their respective monophosphate (MPK) and diphosphate (DPK) kinases
OXIDIZED METABOLITES
6-MP 6-METHYL MERCAPTOPURINE
6-THIOINOSINE 5’-MONOPHOSPHATE
IMPDH
HRPT
TPMT XO
6-THIOXANTHOSINE 5’-MONOPHOSPHATE
GMPS
6-THIOGUANOSINE 5’-MONOPHOSPHATE
MPK
6-THIOGUANOSINE 5’-DIPHOSPHATE
DPK
6-THIOGUANOSINE 5’-TRIPHOSPHATE
6-THIOGUANINE NUCLEOTIDES
TPMT
HRPT
6-METHYLTHIOINOSINE 5’-MONOPHOSPHATE

18
Therapeutic drug monitoring of thiopurine drugs is complex. Plasma 6MP levels
and the measurement of plasma and urine thiouric acid, the xanthine oxidase
pathway metabolite, have been utilised (Weller et al 1995; Bruunshuus &
Schmiegelow 1989). Thiouric acid is only useful in assessing compliance, as it
does not give any indication of therapeutic response. Both these assays are
limited in their reliability to predict efficacy or toxicity. A greater understanding of
thiopurine metabolic pathways has led to the development of methods to estimate
6TGN concentration. These assays use erythrocytes as an indicator of
intracellular levels of metabolites in the target cells i.e. peripheral blood
leucocytes or bone marrow pre-cursors. The RBC is not an ideal surrogate for
these target cells as it is not nucleated. It therefore lacks full purine functionality,
as IMPDH, one of the enzymes required for the conversion of 6MP to 6TGN, is
not expressed in erythrocytes. The 6TGN produced, as a result of 6MP
metabolism, are made indirectly, largely in hepatic tissue. Therefore erythrocyte
6TGN levels are more likely to reflect liver cell, rather than target white blood cell
metabolism. (Dulay & Florin 2005). This is different for patients being treated with
6-thioguanine (6TG), a guanine analogue that can be converted to 6TGN via
HRPT. This direct incorporation of 6TG into 6TGN, compared with the indirect
route followed by 6MP, results in relatively higher RBC 6TGN in patients
receiving 6TG than those on 6MP. Patients who prove intolerant to 6MP may
benefit from 6TG therapy. (Dulay & Florin 2005). Ideally 6TGN should be
measured in non-stimulated target cells. This would be difficult in practice as it
would involve the laborious purification of leucocytes. In the measurement of

19
RBC 6TGN it is difficult to avoid contamination with white blood cells, which could
affect results. Further problems arise when considering sample stability between
collection and analysis. The degree of degradation of the labile cell nucleotides
depends on factors such as storage conditions, time and anti-coagulant used.
Increased RBC 6TGN and improved efficacy of 6MP and azathioprine have been
noted when these thiopurines are co-administered with allopurinol (Teml et al 2007).
This is a treatment which prevents hyperuraemia, gout and formation of calcium
oxalate renal stones. Allopurinol inhibits xanthine oxidase, theoretically increasing the
conversion from 6MP to 6TGN. A patient receiving this drug would require a reduction
in their thiopurine dose, to a third or less, suggesting that two thirds of a normal dose
is catabolized by xanthine oxidase. This contradicts the experience of patients that are
deficient for TPMT who are successfully treated with 5% of a normal dose. This would
suggest that 95% of 6MP is catabolized by TPMT. It has been found that allopurinol
co-therapy with low-dose Azathioprine can alleviate thiopurine hepatotoxicity (Ansari et
al 2008).
Studies have demonstrated elevated 6TGN levels and subsequent thiopurine
sensitivity in patients treated with methotrexate, an antifolate drug. It has been
suggested that a polymorphism of a key folate gene (MTHFR) may be
responsible. This gene regulates the supply of the s-adenosyl - methionine (SAM)
co-factor.
Complex variations e.g. differing tissue distribution, possible inhibition or
induction of enzymes, require research to explain these drug interactions further.

20
1.8. Research Objectives
1.8.1 Development and implementation of whole blood TPMT assay
Since its introduction, improvement of the TPMT service at City Hospital has
been ongoing. Pre-analytical steps of TPMT phenotype analysis, using the
method of Ford & Berg 2003, were quite laborious, using a series of
centrifugation and washing steps to prepare erythrocytes, from which a lysate
was finally produced. This required a relatively large primary sample volume.
Also, it had become apparent that the pellet of washed red blood cells, produced
as part of this process, was not homogeneous, as repeat aliquots did not give the
same result. Further washing and mixing was required to obtain a sample that
could be aliquoted repeatedly to give acceptable precision.
Further issues involved higher than expected numbers of patients having results
reported in the low activity range. It was suspected that the cut-off between low
and normal activity was set too high. Possible explanations for this include:
Reference ranges were established using results from samples that had
been taken in the last 24hrs, which is not typical for the samples routinely
received for analysis, although our studies have shown TPMT activity to
be stable at 4°C for up to 8 days.

21
The patient group from which samples are received is not a 'normal'
population; many could be undergoing therapy that could affect observed
TPMT activity.
As the method has become optimised, under the efforts of continuous
quality improvement, variables that could impact on results have come
under more vigilant control.
A major research objective in this work has been to develop a new method for
analysis of TPMT in whole blood. Research would then be carried out to
determine if whole blood is better than RBC for monitoring TPMT activity and
detection of any induction effects as the new assay entered routine use. A major
comparative study between activity in RBC preparations and activity in whole
blood samples alongside relevant screening for common genetic mutations is
also presented.
1.8.2 Monitoring the new assay
This work assesses the whole blood TPMT phenotyping methodology. This has
involved looking at all aspects of the method, identifying actual and potential
causes of variation and implementing limiting measures wherever possible.
Reagents, enzyme kinetics, operator variability and instrumentation are all
evaluated. The effect of sample age and haemoglobin concentration will also be
considered. Finally the use of the service will be assessed.

22
1.8.3 Development and implementation of whole blood 6TGN assay
A method for 6TGN analysis in RBC lysates has already been developed in the
City Hospital Laboratory. This technique is rapid and well suited for routine use in
a clinical laboratory and provides a service for 6TGN monitoring in the UK. A
further aim of this work has been to improve this method and assess the
feasibility of measuring 6TGN in whole blood rather than washed erythrocytes.
1.8.4 Induction study
It has been suggested that TPMT activity may be induced by thiopurine drugs
(Weyer et al 2001; Thervet et al 2001). If induction occurs this may necessitate
dose adjustment during therapy to maintain adequate active metabolite levels
and associated therapeutic effects. Induction effects may be more apparent in
whole blood samples, due to the presence of nucleated cells which unlike
erythrocytes can continually synthesize protein. To test this hypothesis it is
intended to monitor TPMT activity and 6TGN levels in patients commencing on
azathioprine treatment.

23
2. MATERIALS AND METHODS
2.1 TPMT Phenotyping
2.1.1 Assay principle
TPMT catalyses the methylation of 6-thioguanine (6TG), in the presence of a
methyl donor, to produce highly fluorescent 6-methylthioguanine (6MTG). The
amount of 6MTG produced is directly proportional to the amount of enzyme in the
sample. Results are expressed in nmol 6MTG/g Hb/hour.
6 - Thioguanine 6 - Methylthioguanine
S- Adenosyl Methionine (methyl donor)
2.1.2 Red blood cell (RBC) method
A lysate of RBC was prepared from a whole blood sample containing the
anticoagulant ethylenediaminetetraacetic acid (EDTA). The sample was
centrifuged at 2000g for 5 minutes then the plasma and buffy coat removed. An
equal volume of sterile physiological saline was added to the cells; the sample
was then mixed and re-centrifuged. The supernatant and white blood cells
(WBC) were removed and the RBC rewashed in saline, retaining the WBC for
genotyping if required. After a third centrifugation the supernatant and any white

24
cells were discarded, 200ul of the washed, packed RBC were then mixed with
1ml of phosphate buffer (0.02M KH2PO4 (Sigma-Aldrich) titrated with 0.02M
K2HPO4 (Sigma-Aldrich) to pH 7.4). The hypotonic shock lysed the RBC.
The haemoglobin concentration of the lysate was measured using a colorimetric
method. The reagent (Bayer ADVIA Haemoglobin) is 20mM potassium cyanide in
a 2% dimethyllaurylamine oxide solution. In this method the haem iron in the
haemoglobin is oxidised from the ferrous to the ferric state. It is then combined
with cyanide to form the reaction product, which is measured at 546nm.
(Instrumentation Laboratories ILab 600 analyser).
Haemoglobin + Reagent Methaemoglobin Cyanide haemoglobin Fe++ Fe+++ Fe+++.CN
2.1.3 TPMT incubations
200ul of lysate was added to 500ul of Test Reagent (59mg S-adenosyl
methionine (Sigma-Aldrich) and 140mg 6TG (Alpha Aesar) in 1 litre of 0.1M
phosphate buffer 0.01M KH2PO4 (Sigma-Aldrich) titrated with 0.01M K2HPO4
(Sigma-Aldrich) to pH 7.4). This mixture was incubated at 37°C, for one hour.
Protein was precipitated by heating to 90°C and removed by centrifugation.
2.1.4 HPLC analysis
The 6MTG produced was measured by reverse phase HPLC, using a Kingsorb
3µ C18 90A, 75 x 4.6mm column (Phenonomex). The mobile phase used was
0.05M phosphate buffer (0.05M KH2PO4 (Sigma-Aldrich) titrated with 0.05M

25
K2HPO4 (Sigma-Aldrich) to pH 6.2), acetonitrile (VWR) and tetrahydrofuran
(VWR) in the ratio 89:7:4. Fluorescence detection was performed at an emission
wavelength of 390nm, excitation 315nm (Shimadzu HPLC, LC Solutions
software). A 0.11nmol/L 6MTG (Sigma-Aldrich) one-point calibrator (20ng/L) was
used. Normal and low TPMT control samples were prepared from volunteers with
a known genotype. The Sandwell and West Birmingham Ethical Committee have
given approval for collection of these samples. Calibrators and controls were
treated in the same way as patient samples.
This method used is based on that of Ford & Berg, published in 2003. Reference
ranges were published based on 1000 results from out-patients in the local
population (Ford et al 2004a).
nmol/6MTG/gHb/h
TPMT Deficient <5
Low Activity 6-24
Normal Activity 25-55
High activity >55
2.2 TPMT genotyping extraction
2.2.1 Cell lysis
0.5ml of the white blood cell rich buffy coat was treated, on ice for 20 minutes,
with 1ml buffer (0.32M sucrose, 1% Triton-X 100, 0.01M Tris pH 7.5, 0.005M
MgCl2 (Sigma-Aldrich)), to lyse the cells The samples were then centrifuged, the
cell lysis step repeated and centrifuged once more, before removal of the

26
supernatant. The resulting nuclear material pellet was re-suspended in 100µl
buffer (10mM Tris-HCl, 0.4M NaCl, 2mM EDTA titrated to pH 8.2 with NaOH
(Sigma-Aldrich)) and 5µl 10% sodium dodecysulphate (Sigma-Aldrich). Protein
digestion was achieved by incubation with 10µl 10mg/ml DNAse free Proteinase
K (Sigma-Aldrich) in a water bath, for 2.5 hours at 65°C or 37°C overnight.
2.2.2 Phenol/chloroform extraction
The protein digests were mixed gently with an equal volume of buffered phenol
pH 8.0 (QBiogene), then centrifuged and the upper aqueous layer removed and
retained. Treatment with phenol and centrifugation was repeated until the
resultant aqueous layer was clear. 300ul of Chloroform/Butanol 80:20 (Sigma-
Aldrich) was added to the aqueous phase and mixed gently by inversion,
followed by centrifugation. The supernatant was transferred to a sterile micro-
centrifuge tube.
2.2.3 DNA precipitation
Sodium acetate (3M) was added to the supernatant in the ratio 1:10. The sodium
ions shield the negative charges on the DNA phosphates. This decreases inter-
strand repulsion and allows the nucleic acids to aggregate. Four volumes of ice-
cold 100% ethanol (Sigma-Aldrich) were then added, the precipitated DNA
appeared as white strands. After gentle mixing, followed by centrifugation for 10
minutes, the ethanol was removed. 300µl of ice-cold 70% ethanol was added to
the pellet of DNA. After gentle mixing, the ethanol was removed and the pellet

27
left to dry at room temperature for approximately 20 minutes. The dried pellet
was re-suspended in 50-200µl (depending on the size of the pellet) buffer (10
mM Tris pH 8.0 and
1 mM EDTA (Sigma-Aldrich)). The pellet was left to dissolve at room temperature
for a minimum of 30 min then stored at -80C.
2.2.4 Purity and concentration of DNA
Care must be taken to ensure protein and phenol are absent from the isolated
DNA as both can interfere with PCR reactions. The purity of the isolated DNA
can be assessed by measuring the absorbance at 260 and 280nm. Pure
preparations of DNA have ratios of optical density at 260nm / optical density at
280nm of 1.7-2.0 (a ratio < 1.7 suggests phenol or protein contamination, >2.0
suggests RNA contamination).
The DNA concentration in g/ml can be estimated using the Beer-Lambert Law,
A = cl, which relates the amount of light absorbed at a given wavelength to the
molar extinction coefficient and concentration of an absorbing molecule. Where A
is absorbance, is the molar extinction coefficient, c is the concentration of the
solute, and l is the length of the light path of the solution measured (cm). Maximal
spectral absorption by double stranded DNA occurs at 260 nm and is
characterized by a specific absorption coefficient of 0.02(µg/ml) –1 cm –1. This
absorption is a function of the molar extinction coefficients of the substituent
nucleotide bases.

28
If the DNA concentration is very low (<50 g/ml) the DNA can be concentrated by
re-precipitation in ethanol, drying then re-suspension in a smaller volume of
buffer. If the DNA concentration is very high (>500 g/ml), it can be diluted with
buffer, until a final concentration of 500 g/ml is achieved.
2.3. TPMT genotyping polymerase chain reaction
This simplified version of the ARMS of Roberts et al uses a PCR master-mix
which contains pre-optimised concentrations DNA polymerase, MgCl2,
deoxynucleotide triphosphate and buffer. Using a master-mix reduces the
number of pipetting steps which decreases the time taken to set up a reaction,
reducing the likelihood of pipetting errors and increasing reproducibility.
Primers used for ARMS analysis were for the common mutations of the TPMT
gene TPMT*2, and TPMT*3C and were custom-synthesised to order. The
synthesis scale used was Standard >15 O.D. units.
The specificity of the primers was checked using NCBI BLAST programme
(www.ncbi.nih.gov/BLAST/)

29
2.3.1 Primer sequences
Primer Type
(wildtype/mutation)
Direction Sequence (5’ – 3’)
TPMT2C Common wild type Sense ATCTgCTTTCCTgCATgTTCT TTgAAACCC
TPMT2W Wild type Antisense CACACCAACTACACTgTgTCCCCggTCTCC
TPMT2M TPMT*2 mutation Antisense CACACCAACTACACTgTgTCCCCggTCTCg
TPMT3CC Common wild type Sense ATTTTTAgTAgAgACAgAgTTTCACCATCT
NTPMT3CW Wild type Antisense TgTCTCATTTACTTTTCTgTAAgTAgTT
NTPMT3CM TPMT*3C mutation Antisense TgTCTCATTTACTTTTCTgTAAgTAgTC
Table 2.1 Primer sequences
Primer positions indicated are relative to the sequence of human TPMT gene,
Genbank Accession number AB045146.
2.3.2 Primer composition
Two different multiplex reactions are required for TPMT genotyping:
TPMT32Wild
TPMT32Mutant
EXON 1 2 3 4 5 6 7 8 9 10
TPMT3CC
TPMT3CW
TPMT3CM
TPMT*3C A719G
5’ 3’
TPMT2W
TPMT2MTPMT2C
TPMT*2 G238C
TPMT3BW
TPMT3BM TPMT3BCPRIMERS
TPMT*3B G460AMUTATION
EXON 1 2 3 4 5 6 7 8 9 10
TPMT3CC
TPMT3CW
TPMT3CM
TPMT*3C A719G
5’ 3’
TPMT2W
TPMT2MTPMT2C
TPMT*2 G238C
TPMT3BW
TPMT3BM TPMT3BCPRIMERS
TPMT*3B G460AMUTATION

30
The primer composition of each multiplex reaction is shown in the table below:
Multiplex Reaction
Reaction Forward Primer
Reverse Primer
Predicted Product Size
TPMT32Wild B2M (Control) BMIF BMIR 574
WildType TPMT*2 TPMT2C TPMT2W 194
WildType TPMT*3 TPMT3CC NTPMT3CW 325
TPMT32Mut B2M (Control) BMIF BMIR 574
Mutant TPMT*2 TPMT2C TPMT2M 194
Mutant TPMT*3 TPMT3CC NTPMT3CM 325
Table 2.2 Multiplex reaction primer composition
Method
For each multiplex reaction, 20 l of the appropriate 100mol/L primer stocks
(Alta Bioscience) were added and made up to a final volume of 1 ml using sterile
water. After mixing by inversion 10 x 100 L fractions were aliquoted into 1.5 ml
labelled sterile micro-centrifuge tubes and store at -20C. Before use, the
multiplex PCR master mix kit, multiplex primer mixes and patient DNA samples
were completely thawed at room temperature.
To guard against cross-contamination a blank containing no DNA template was
performed for both the TPMT32Wild and TPMT32Mut multiplex reactions
Analysis of TPMT*1/*1, TPMT*1/*2, TPMT*1/*3C and TPMT*3C/*3C control DNA
was included each time the PCR analysis was performed
Both TPMT32Wild and TPMT32Mut multiplex reactions were performed for every
patient sample. 2.5µl of the appropriate primer master mix and 1ul of DNA was

31
added to a 0.2ml thermal tube containing 9µl of RNase-free water and 12.5µl
multiplex master mix (Queen).
The tubes were processed in the thermal cycle using the following parameters:
Stage Temp Time Cycles Prig No Link
HotStarTaq DNA polymerase activation
95C 15 min 1 4 5
PCR Amplification: Denaturing Annealing Extension
94C
62.5C
72C
30s 90s 30s
30 5 7
Final Primer Extension 72C 2 min 1 7 8
Hold at 4C 4C Hold 1 8 E
Table 2.3 PCR Parameters
2.4. TPMT genotyping electrophoresis and visualisation
Agarose (2g) (Sigma-Aldrich) was heated until dissolved in 100ml of a 1:5
dilution of Tris borate EDTA (TBE) buffer (54g Tris base (Sigma-Aldrich), 27.5g
boric acid (Sigma-Aldrich), 7.4g EDTA (Sigma-Aldrich) made up to 1 litre in
distilled water). After cooling to approximately 65°C, 5µl ethidium bromide
(Sigma-Aldrich) was mixed in and the molten gel poured into a welled casting
tray. When set the gel was placed in the electrophoresis gel chamber and
submerged in 1:5 TBE buffer.
A loading dye was prepared from (25mg Orange-G (Sigma-Aldrich), 1.5g Ficoll
(Sigma-Aldrich), 100µl 1M Tris pH 8.0 (Sigma-Aldrich), 20µl 0.5M EDTA (Sigma-
Aldrich)). 5µl of dye was mixed with each 25ul of ARMS PCR reaction mix, 20µl
of this mixture was loaded into the wells. Electrophoresis of the PCR products

32
was carried out at 100V for approximately 45 minutes, until adequate separation
was achieved as indicated by the dye front.
The resulting DNA fragments were visualised under UV light using a Gene
Genius Bio-imaging system (Syngene).
2.5. Thioguanine nucleotides
2.5.1 Assay principle
6TGN extraction is performed using a single reagent containing perchloric acid,
an internal standard (IS) and an anti-oxidant. 6TGN are hydrolysed back to 6TG
which is measured using isocratic HPLC with UV detection.
2.5.2 Method
RBC were first isolated from other blood components in a whole blood EDTA
sample. This was achieved by centrifugation, removal of plasma and buffy coat
and washing RBC in an equal volume of physiological saline. These steps were
repeated and the resulting RBC re-suspended in saline, aiming for an
approximate red cell count of 8x10¹² cells/L.
A red cell count was performed (Bayer Advia 120). Two 100µl aliquots were
pipetted into labelled micro-centrifuge tubes, using a displacement pipette, these
were frozen for a minimum of 15 minutes at -80°C before analysis.
A concentrated calibrator stock solution (20mg/100ml) was prepared from 20mg
6TG (Alpha Aesar) dissolved in 4ml of 0.1M NaOH (Sigma-Aldrich) made up to
100ml with distilled water. This was diluted 1:20 in distilled water to give
1mg/100ml. This was further 1:20 diluted with Paratek (Alpha Laboratories) a

33
haematology blood control (checked to contain no measurable 6TGN/6TG), to
give a working concentration of 50ng/ml.
An internal quality control sample was also prepared from pooled patient
samples. Samples where clinical details indicated that the patient was on
thiopurine therapy were collected and the RBC washed as previously described.
These were pooled, mixed and aliquoted into 100µl fractions and stored at -80°C.
This was initially analysed 5 times to give a target internal quality control
concentration.
Two 100µl aliquots of calibrator, internal quality control and each patient sample
were allowed to defrost at room temperature. 500µl of hydrolysing reagent (10ml
70% perchloric acid (Sigma-Aldrich), 400µl 10mM 5-bromouricil (Sigma-Aldrich),
500mg DL-Dithiothreitol (DTT) (Sigma-Aldrich) made up to 100ml with distilled
water) was added to each aliquot. Each aliquot was capped and vortex mixed
immediately after addition of the hydrolysing reagent. The samples were then
centrifuged, to separate the precipitated proteins. The supernatant from each
micro-centrifuge tube was then transferred, using a micro-pastette, into
appropriately labelled HPLC vials. The vials were then capped and heated at
95°C for 1 hour to hydrolyse liberated 6TGN back to their parent 6TG. The
addition of DTT prevents oxidative degradation of 6TG, which is promoted by
contaminant ions and UV light and prevents the binding of 6TG to acid denatured
RBC proteins. The 6TG concentration is measured using HPLC with UV
detection at a wavelength of 304nm. Any losses are accounted for by inclusion

34
of the internal standard, 5-bromouracil, which is detected at a wavelength of
342nm.
The hydrolysing reagent was found to stable for at least 1 week at room
temperature. Aliquots of a sample stored at -80°C were analysed over an eight
day period with both freshly prepared reagent and reagent prepared on Day 1.
Results are as follows:
Day
6TGN pmol/8x108 cells
Fresh Reagent
6TGN pmol/8x108 cells
Pre-prepared Reagent
1 215 215
4 248 232
6 249 261
7 201 201
8 257 253
Table 2.4 Stability of 6TGN hydrolysing reagent
Days
6TG
N p
mo
l/8
x1
0e
8 c
ells
876543210
300
250
200
150
100
50
0
Fresh
Pre-prepared
6TGN Hydrolysing Reagent Stability
Figure 2.1 Stability of 6TGN hydrolysing reagent

35
3. WHOLE BLOOD TPMT ACTIVITY
3.1 Development of a new phenotyping assay underpinned by genotyping This section of work develops a new TPMT phenotyping method, which analyses
whole blood rather than washed RBC. This new method uses freezing at -80C as
the method of cell rupture, instead of using a lysis buffer.
Whole blood samples (n=402) that had been collected into EDTA tubes and
received for routine analyses of TPMT activity, were selected randomly over a
four-week period. Samples were stored for a maximum of 2 days at 4C prior to
analysis. Samples greater than 8 days old at time of analysis were excluded from
the study as earlier work in the department has shown TPMT activity to decline
after a week at room temperature.
3.1.1 Phenotype
The whole blood samples were mixed well by inversion and two 200 l aliquots
were accurately pipetted into test tubes and capped. The tubes were frozen for
15 minutes at -80C to disrupt the cells, percentage cells lysed is detailed in
Chapter 5.3. The cells were shock thawed by the addition of 600 l of whole
blood suspension buffer (0.1 M KH2PO4 titrated with 0.1 M K2HPO4 (Sigma-
Aldrich) to pH 7.4), then vortex mixed. RBC lysates were also prepared in
duplicate, from the same EDTA blood samples. The buffy coats were retained in
separate labelled test tubes for DNA extraction and TPMT genotyping.

36
Figure 3.1 Whole blood TPMT analysis
Freeze 200µl whole blood at -80°C for 15
minutes. Add 600µl buffer and mix to produce
a whole blood lysate
Determine lysate haemoglobin concentration
Incubate 200µl of lysate with 500ul of test
reagent for exactly 1 hour at 37°C
Stop the reaction by heat inactivation at 95°C
for 10 minutes
Centrifuge vials to produce a clear supernatant
Measure 6MTG by HPLC fluorimetry

37
The TPMT enzyme reaction, determination of haemoglobin concentration and
HPLC analysis were performed on all whole blood and RBC lysates, as
described in the methods chapter.
For both the standard RBC and whole blood methods, TPMT activities were
calculated from 6-methyl-thioguanine (6MTG) peak height, and expressed in
relation to haemoglobin concentration (nmol 6MTG/gHb/h).
3.1.2 Genotyping
DNA was extracted from buffy coats using phenol-chloroform extraction and our
multiplex amplification refractory mutation system (ARMS) strategy was used to
screen for the common TPMT mutations, TPMT*2 and TPMT*3 (TPMT*3A,
TPMT*3C and TPMT*3D). The gel provides the support medium for the
separation of the DNA fragments which were visualised using ethidium bromide,
under UV light as shown in Figure 3.1.
For each PCR run it was checked that there were no products in the blank
reactions. If there were, due to cross-contamination, the run was rejected and
repeated.
For each DNA sample it was checked that the control B2M product was present
in both the wild and mutant reactions, if it was not the ARMS reaction was
rejected and repeated.

38
TPMT*3/*3TPMT*1/*3TPMT Genotype: TPMT*1/*1 TPMT*1/*2
TPMT*3 325bp
TPMT*2 194bp
Control 574bp
ARMS Reaction:
PCR Product
Wild Mut Wild Mut Wild Mut Wild Mut
TPMT*3/*3TPMT*1/*3TPMT Genotype: TPMT*1/*1 TPMT*1/*2
TPMT*3 325bp
TPMT*2 194bp
Control 574bp
ARMS Reaction:
PCR Product
Wild Mut Wild Mut Wild Mut Wild Mut
As part of the DNA method, quality control checks were made to ensure that the
TPMT*1/*1, TPMT*1/*3C, TPMT*1/*2 and TPMT*3C/*3C control DNA reactions
had all worked. If these QC checks failed the run was rejected and repeated.
Figure 3.2 Examples of DNA fragments visualized for wild type,
heterozygous and homozygous deficient genotypes
To evaluate this new technique the whole blood results were compared to both
the established RBC lysate method results and the TPMT genotype. Agreement
between duplicates for each assay was compared and the percentage difference
between methods was calculated. Reference intervals were determined for the
new whole blood assay, in-line with the RBC method, by using the already
established percentages for deficient, low and normal TPMT status individuals,
previously obtained from the RBC method phenotyping-genotyping data (Ford et
al 2004a).

39
3.1.3 Results
The data for this study can be found in Appendix 2
Method Mean TPMT Median Std Dev SE Mean Min Max
RBC 37.0 36.0 11.3 0.56 0.0 82.0
Whole Blood 51.0 50.0 13.6 0.68 0.0 102.0
Table 3.1 Summary of TPMT activities in nmol 6MTG/gHb/h for
RBC / whole blood comparison study. 402 samples analysed in duplicate by both methods
The intra and inter batch variation for the new method was determined using
EDTA whole blood collected from a healthy volunteer.
Method Imprecision Mean TPMT activity (nmol 6MTG/gHb/h)
CV (%) n
Conventional
RBC
Within batch 39 3.6 10
Between batch 53 8.0 20
New
Whole Blood
Within batch 45 2.7 10
Between batch 53 7.6 20
Table 3.2 Within batch and between batch imprecision data for RBC and
whole blood phenotyping methods

40
3.2 Correlation of enzyme activities
RBC TPMT Activity (nmol 6MTG/gHb/h)
Wh
ole
Blo
od
TP
MT A
cti
vit
y (
nm
ol/
6M
TG
/g
Hb
/h
)
9080706050403020100
120
100
80
60
40
20
0
Comparison of Whole Blood and RBC TPMT Activity
Figure 3.3 Relationship between mean whole blood and mean RBC TPMT activity r = 0.834
3.3 Comparison with genotyping TPMT activities were higher, per g of Hb, in whole blood than in RBC, in 98.5%
of samples. The mean percentage increase observed in whole blood was
calculated to be 42%, with a range of -8.5% to 172.5%. The mean TPMT activity
for whole blood was 51 nmol 6MTG/gHb/h compared to the RBC lysate mean of
37.
The normal, low and deficient TPMT groups give rise to tri-modal distributions of
activity. These three groups can be seen for both methods in Figure 3.4.

41
28 31 34 37 40 43 46 49 52 55 58 61 64 67 70 73 76 79 82 85 88 91 94 97 4 7 10 13 16 19 22 25 28 31 34 37 40 43 46 49 52 55 58 61 64 67 70 73 76 79 82 85 88 91 94 97 100 1 10 13 16 19 22 25 TPMT Activity (nmol 6-MTG/gHb/h)
(b)
10 13 16 19 22 25 28 31 34 37 40 43 46 49 52 55 58 61 64 67 70 73 76 79 82 85 88 91 94 97 100 19 22 25 28 31 34 37 40 43 46 49 52 55 58 61 64 67 70 73 76 79 82 85 88 91 94 97
20
19 22 25 28 31 34 37 40 43 46 49 52 55 58 61 64 67 70 73 76 79 82 85 88 91 94 97 0
5
10
15
1 4 7 19 22 25 28 31 34 37 40 43 46 49 52 55 58 61 64 67 70 73 76 79 82 85 88 91 94 97
(a)
Figure 3.4 Distribution of TPMT activity and genotype in 402 individuals (a) TPMT activity measured using red blood cell lysate. (b) TPMT activity measured using Whole blood lysate. Individuals with a TPMT*3/*3 genotype are shaded red, a heterozygous genotype, either TPMT*1/*2 or TPMT*1/*3 are shaded black and TPMT*1/*1 genotype white. TPMT, thiopurine S-methyltransferase; 6-MTG, methylthioguanine
0
5
10
15
20
Number of patients
Number of patients
Number of patients

42
Genotype Number of Patients % of Patient Total
TPMT *3/*3 2 0.5
TPMT *1/*3 31 7.7
TPMT *1/*2 3 0.8
TPMT *1/*1 366 91
Table 3.2 Summary of TPMT genotypes for RBC / whole blood
comparison study Concordance between low TPMT activity and heterozygotes was 79% for both
the new whole blood and standard RBC lysate methods, while overall
concordance with genotypic analysis was 97% for both phenotypic methods. This
is as expected as the RBC assay has been used to determine the whole blood
assay reference intervals.
3.4 Advantages of new assay Offering whole blood TPMT phenotyping has a number of benefits:
Easier and quicker - Washed RBC do not need to be prepared.
Elimination of washing the cells twice in physiological saline saves around
two hours of biomedical scientist time on an average working day. This
has obvious cost and turnaround time implications.
Safer - Sampling is directly from the primary tubes which are used to take
blood from the patient and are fully labelled. This minimises any sample
handling errors.
More reproducible - The original whole blood sample is more
homogeneous than a pellet of washed cells. The mean percentage
difference between duplicates was 9.4% for RBC lysates and 5.1% for
43
whole blood. This shows that the new whole blood method can inherently
give more reproducible results
Increased accuracy - Whole blood may give a better indication of what is
happening in vivo rather than RBC only, being representative of the
reactions taking place in drug metabolizing tissues.
Multiplex ARMS testing for TPMT*2 and 3*C mutations has been used to define
the reference ranges for low and normal TPMT activity. This has been used to
demonstrate that the new whole blood TPMT phenotyping method performs as
well as the conventional RBC lysate assay. This new method overcomes the
need to prepare washed RBC, a process that is time-consuming, and increases
analytical variation. The resulting assay is better suited to a regional or national
TPMT phenotyping service.
When whole blood samples were analysed, using the RBC method, higher
activity was virtually always observed. It was postulated that this increase was
due to the contribution to TPMT activity by leucocytes. In some samples, the
whole blood activity was markedly higher than in RBC. This led to the hypothesis
that TPMT activity maybe induced in some patients, which would be seen
primarily in the nucleated white blood cells.
The development of this assay has been published by us; Ford L, Graham V,
Berg J. (2006) Whole-blood thiopurine S-methyltransferase activity with genotype
concordance: a new, simplified phenotyping assay. Ann Clin Biochem. Sep;43(Pt
5):354-60

44
4. EVALUATION OF PHENOTYPING
4.1 Enzyme Assay
4.1.1 Introduction
Our TPMT phenotyping method depends on the measurement of the product
formed in the reaction:
6TG 6MTG
Figure 4.1 TPMT phenotyping reaction
A constant rate of reaction, where velocity throughout the incubation time is
directly proportional to enzyme concentration, is required in order to calculate
enzyme activity.
In reactions of this type reaction rate can decline due to:
Substrate depletion - velocity decreases as the enzyme becomes less
saturated
Product inhibition
Instability of components
TPMT
S- Adenosyl Methionine
45
Assay method artefact - if the specific detection procedure ceases to
respond linearly to increasing product concentration, this can lead to a
decline in the measured rate of reaction with time
Change in assay conditions - for example if a reaction causes a pH
change, this will affect the rate if adequate buffering systems are not in
place.
These factors are controlled in the assay and the reaction is stopped after a fixed
incubation time, within the linear period.
4.1.2 Establishing substrate concentrations
Enzyme kinetics are examined periodically, usually when a new lot of substrate is
received, or when problems are encountered, to ensure measurement is being
performed in the linear range.
In our assay, where the amount of enzyme present is being determined, the
amount of product needs to be influenced by the level of enzyme activity only.
Therefore zero order kinetics are established, with regard to our two substrates.
The concentration of 6TG and SAM is determined using a Michaelis Menten
approach to ensure there is sufficient of each substrate in the reaction mixture to
achieve such zero order kinetics. This is carried out by analysing a high activity
sample using the routine phenotyping method, but varying the substrate
concentrations independently as shown in Figures 4.2 and 4.3.

46
6TG (mg/l)
6M
TG
(p
ea
k h
eig
ht)
300250200150100500
10000
8000
6000
4000
2000
0Working concentration (140mg/l)
Vmax
Michaelis Menten for 6TG
Figure 4.2 Michaelis Menten plot for 6TG showing the final choice of substrate concentration used in the assay
SAM (mg/l)
6M
TG
(p
ea
k h
eig
ht)
200150100500
12000
10000
8000
6000
4000
2000
0 Working concentration (59 mg/l)
Vmax
Michaelis Menten for SAM
Figure 4.3 Michaelis Menten plot for S-adenosyl methionine showing the final choice of substrate concentration used in the assay

47
Working concentrations of the substrates have been selected so that the reaction
is at, or close to, its maximum rate (Vmax). Concentrations above this are
avoided, as this excess substrate is seen to contribute to increased blank
readings.
4.1.3 Linearity of the reaction
It is also required that the kinetics of the reaction are first order in relation to the
enzyme. This is demonstrated in Figure 4.4, where the enzyme concentration is
directly proportional to the product formed.
Lysate volume (ul)
6M
TG
(p
ea
k h
eig
ht)
200150100500
20000
15000
10000
5000
0
Linearity of TPMT method
Figure 4.4 Linearity of the TPMT assay

48
Another experiment was carried out to check the linearity of the TPMT
phenotyping method. Four samples covering a range of TPMT activity were
carried through the method using a series of dilutions of the whole blood lysate.
Activity per gram of Hb was calculated for each reaction. Results are presented
in Figure 4.5.
Lysate Hb (g/dl)
TP
MT A
cti
vit
y (
nm
ol 6
MTG
/g
Hb
/h
)
0.60.50.40.30.20.1
60
55
50
45
40
35
30
25 Acceptable Hb range routinely used
Further Linearity Study of TPMT Method
Figure 4.5 Study of linearity using a range of lysate dilutions It can be seen in Figure 4.5, that as the amount of sample in the reaction mixture
is increased, activity tends to reduce slightly, this may reflect substrate depletion.
For this reason, only lysates with a Hb concentration within the range indicated
are acceptable.

49
4.1.3 Controlling reaction conditions
Accurate reaction start times may be difficult to determine and bursts or lag
phase in product formation can occur, which could distort the reflection of the
linear reaction. Effects of these are minimised in our assay by using sand in the
hot block wells to dissipate heat, thus avoiding spikes in temperature and by pre-
warming all components of the reaction mixture prior to their combination.
Additional important practical considerations include purity and stability of all
reagents and samples. This necessitates appropriate supply, storage and
handling. The chemicals for our assay are purchased in bulk from consistent
sources. Reagents are prepared in lots then stored appropriately. Preparation,
freezing and thawing is carried out as quickly as possible, to avoid any reagent
deterioration. Samples are stored at 4°C and analysed on the next working day,
to minimise further loss of enzyme activity.
4.1.4 Importance of blank
Background rates of reaction can be observed in the absence of TPMT. Causes
for these readings include contamination of one of the components or non-
enzymatic reactions. It is important to compensate for these ’blank’ readings, or
falsely high readings could be recorded. This is achieved for our assay by
preparing a vial containing all components except the sample lyste which is
replaced with saline. This vial is carried through the method and the resulting
chromatography is automatically subtracted from that of the unknown samples.
50
4.1.5 Checking for artefactual product peaks
It is routine practice to check for any underlying peaks for samples with very high
TPMT activity. Any substance present in the sample, which elutes at the same
retention time as 6MTG and exhibits similar fluorescent properties, could lead to
falsely elevated results. This could cause major consequences if such a peak
‘masked’ a deficient result. The original method for checking for any such
interfering substances was to immediately move the reaction vial to the 90°C
precipitation block as soon as the test reagent had been added to the sample. In
theory this was a zero incubation time. On several occasions a 6MTG peak was
observed on these samples. This seemed to be the result of some reaction
actually taking place, as these were very high activity samples and a finite period
of time was being taken to reach a sufficient temperature to stop the reaction. An
attempt has been made to overcome this problem by a change of practice.
Reaction vials containing the test reagent are preheated to 90°C, before addition
of the sample lyste. At this temperature no reaction can occur, as all protein is
denatured immediately. Even though this is a true zero time incubation some
6MTG is still observed. This seems to be due some methylation of the 6TG in the
preheating stage. For this reason a blank zero minute incubation reagent vial is
prepared and the blank reading subtracted from the tests. To date well over 1000
such checks on high TPMT activity samples have not identified any directly
interfering substances.

51
4.1.6 HPLC
After the reaction, the incubate is treated so that it is suitable for analysis by
HPLC with fluorescence detection. The metabolites of the TPMT reaction are
injected into a stream of high pressure liquid (mobile phase) which carries the
sample into a column and then to the detector. Separation takes place in the
column as different components have a different affinity for the column packing.
Those with least affinity will exit first. Each component elutes from the column as
a narrow band or peak. The retention time on the column is specific to the
compound and the peak height is proportional to its concentration.
The retention time is influenced by:
Characteristics of the stationary phase (pore diameter, particle shape,
surface area and pH)
Composition of the mobile phase - the elution power increases as the
polarity of the solvent decreases
pH and salts
Temperature
Fluorescence is the detection method of choice for our assay as it has greater
specificity and sensitivity than UV detection. Fluorescence-based photometric
detection methods are capable of much greater sensitivity than absorbance
assays as comparisons are being made between a reading and zero, in contrast
to the comparison between two relatively high readings.

52
Figure 4.6 Chromatography typical of high, normal, low and deficient TPMT
0.00 0.50 1.00 1.50 2.00 min
Deficient TPMT Activity NO PEAK
0.00 0.50 1.00 1.50 2.00 min
6-Methylthioguanine
Low TPMT Activity
0.00 0.50 1.00 1.50 2.00 min
6-Methylthioguanine
Normal TPMT Activity
0.00 0.50 1.00 1.50 2.00 min
6-Methylthioguanine
High TPMT Activity

53
Originally, a calibration curve was constructed to cover the range expected from
the assay. This exhibited a linear relationship; therefore calculations are now
based upon the measured fluorescence of a single point calibrator, whereby a
6MTG standard of known concentration is on each run.
4.2 Effect of sample age
The samples received for TPMT phenotyping come from all over the world and
can take several days to reach the laboratory. The storage and transport
conditions prior to receipt are unknown, therefore it is important to have some
understanding of the stability of TPMT at various temperatures.
An experiment was carried out looking at the change in TPMT activity for 5 donor
samples. These samples were aliquoted immediately after taking and stored at
three different storage temperatures.
The results of this study are presented graphically in Figures 4.6 - 4.8.

54
Days
TP
MT A
cti
vit
y
121086420
50
40
30
20
10
0
Sample 1
Sample 2
Sample 3
Sample 4
Sample 5
Stability of samples stored at -80°C
Figure 4.7 TPMT activity in samples stored at 80°C
Days
TP
MT A
cti
vit
y
121086420
50
40
30
20
10
0
Sample 1
Sample 2
Sample 3
Sample 4
Sample 5
Stability of samples stored at 4°C
Figure 4.8 TPMT activity in samples stored at 4°C

55
Days
TP
MT A
cti
vit
y
121086420
50
40
30
20
10
0
Sample 1
Sample 2
Sample 3
Sample 4
Sample 5
Stability of samples stored at Room Temperature
Figure 4.9 TPMT activity in samples stored at room temperature These results show that TPMT is stable for over 10 days at -80°C and 4°C, but
activity is seen to fall after about 6 days at room temperature.
A second experiment was carried out where blood from a suitable donor was
collected into 3 specimen tubes. These were stored as follows:
1. Aliquoted into 200µl fractions and stored at -80°C
2. 4°C
3. Room Temperature (ranged from 18.5 - 24°C)
On each working day a frozen aliquot and 200µl of whole blood from each of the
other storage conditions were analysed using the whole blood TPMT method.

56
4.2.1 Results
Days
% o
f A
cti
vit
y o
f A
liqu
ot
sto
red
at
-80
°C
20151050
100
80
60
40
20
0
4°C
Room Temp.
Variable
Effect of Storage Conditions on TPMT Activity
Figure 4.10 TPMT activity of samples stored at 4°C and room temperature compared to activity when stored at -80°C
Activity of 4°C and room temperature samples were calculated as a percentage
of the 80°sample activity, on each day.
The results from both these experiments suggest that TPMT activity is stable for
over 10 days at 4°C but begins to fall after 6 days at room temperature.

57
4.3 Haematology effects
4.3.1 Low patient haemoglobin
TPMT activity is expressed per gram of haemoglobin. The RBC act as a
surrogate marker for cells, such as the liver, where TPMT activity takes place.
(Szumlanski et al 1996). The inter-relationship between Hb and calculated TPMT
activity has been studied in several ways:
From 14/08/07 to 28/08/07 527 samples were phenotyped for TPMT. In
this period there were 13 high TPMT activity results, 54% of these had a
low lysate haemoglobin concentration (defined as <2.6g/dL). If the applied
haemoglobin correction for these samples is removed, all but one of these
samples would be classified as normal.
Nineteen EDTA samples from patients with low Hb (<7.6g/dL) were
collected from the haematology department. The whole blood and RBC
TPMT activity of these patients was determined. This was found to be high
(>80 nmol 6MTG/gHb/hr) in 42% of the specimens, as shown in Table 4.1.
This is a significant proportion as routinely only 2 to 3% of our results fall
into this high category.
In 2005 a questionnaire was sent out with all high TPMT activity reports.
Of the 42 responses received 45% of patients were classed as anaemic at
the time of testing.

58
RBC TPMT (nmol 6MTG/gHb/h)
Normal (25-56)
Whole blood TPMT (nmol 6MTG/gHb/h)
Normal (35-79)
Sample Hb (g/dL) Normal
Female 11.5-16.0 Male 13.2-17.5
78 103 6.9
113 117 11.8
48 61 6.5
127 134 6.6
45 65 6.9
71 88 6.9
22 27 4.1
24 32 6.0
119 160 6.4
39 45 7.3
74 96 6.3
32 52 7.3
28 50 7.1
31 45 7.3
75 94 7.3
33 71 7.5
119 129 7.5
26 28 7.5
36 68 7.5
Table 4.1 RBC and whole blood TPMT for patients with low Hb
This combined evidence shows that a relatively high proportion of samples that
have a low haemoglobin concentration have abnormally high calculated TPMT.
This suggests that when the Hb content of RBC is low, it may actually be a poor
marker of cellular contents. This raises the question, as to whether elevated

59
results on patients with low Hb are misleading, sometimes resulting in
misclassification of the TPMT status.
Previous experimental work (4.1.3) has shown that differing concentrations of
lysates prepared from the same sample give similar results, once corrected for
Hb. This demonstrates that the increased substrate/enzyme ratio that exists, in
lower concentration lysates, should not significantly affect the reaction rate.
4.3.2 TPMT activity uncorrected for Hb
For the reasons highlighted in 4.3.1 and 4.3.2, it was studied whether it would it
be more straightforward to express TPMT activity in units per litre of whole blood
(U/L) instead of using haemoglobin correction. This could have advantages over
the existing method, as it would be simpler, faster and cheaper and may avoid
misclassification of patients with low Hb.
The whole blood phenotype/genotype concordance study data was re-analysed.
Comparisons were made between genotype and TPMT activity corrected and not
corrected for Hb concentration.
Looking at the whole blood results of samples from the whole blood study
(Chapter 3), phenotyping and genotyping for 400 wild type or heterozygous
samples were available.
This data was examined more closely to look for differences in
phenotype/genotype concordance between activity expressed per gram of Hb
and TPMT activity not corrected for Hb.

60
Results corrected for Hb Total Concordance = 96.5%
Low Phenotype
(<35 nmol 6MTG/g/Hb/h)
Normal/High Phenotype (>34 nmol 6MTG/g/Hb/h)
33 (8.3%)
367 (91.7%)
Wild
Genotype
Heterozygous
Genotype
Wild
Genotype
Heterozygous
Genotype
6
27
359
8
Table 4.2 Phenotype / Genotype concordance when Hb correction
applied
TPMT Activity (g/Hb)
Fre
qu
en
cy
907560453015
80
70
60
50
40
30
20
10
0
Low Normal
TPMT Activity Distribution (Corrected for Hb)
Figure 4.11 TPMT activity distribution for 400 study samples, corrected for
Hb

61
Results not corrected for Hb Total Concordance = 95.6%
Low Phenotype
(Peak Height 6MTG <7.5)
Normal/High Phenotype
(Peak Height 6MTG >7.4)
36 (9.0%)
364 (91%)
Wild
Genotype
Heterozygous
Genotype
Wild
Genotype
Heterozygous
Genotype
9
27
356
8
Table 4.3 Phenotype / Genotype concordance without Hb correction
6MTG Peak Height
Fre
qu
en
cy
21181512963
70
60
50
40
30
20
10
0
Low Normal
TPMT Activity Distribution (Uncorrected for Hb)
Figure 4.12 TPMT activity distribution for 400 study samples, uncorrected
for Hb

62
A cut-off of 6MTG peak height of 7.5 as the bottom of the 'normal' range for
results uncorrected for Hb was set. This gave very similar genotype concordance
data to that obtained for results corrected for Hb.
Discordance where the phenotype is low but a wild type genotype is observed is
likely to be due to sample deterioration or the presence of a mutation that is not
being screened for. Discordance due to the samples that have a normal activity
but exhibit a TPMT mutation can be due to one allele coding for relatively high
enzyme production or misclassification.
Looking at the results corrected for Hb, there were 8 samples where a 1/*3
genotype was determined but the calculated TPMT activity was in the normal
range.
Calculated TPMT activity
(nmol/6MTG/gHb/h)
6MTG (Peak
Height)
Genotype
36 6.8 1/*3
36 8.7 1/*3
37 7.3 1/*3
38 8.8 1/*3
40 7.3 1/*3
42 7.4 1/*3
45 7.8 1/*3
60 12.4 1/*3
Table 4.4 Data for samples with phenotype / genotype discordance

63
Looking at 6MTG peak heights, half of these patients would not have been
misclassified if interpretation had been based on activity uncorrected for Hb
concentration. These results raise the question whether there is any advantage
and indeed possibly a disadvantage in correcting for Hb.
4.3.3 Haemoglobin concentration and white blood cell counts
Full blood counts were carried out on 55 samples that had a high calculated
TPMT activity. These results suggest a strong correlation between low Hb and
high calculated TPMT activity, with approximately 80% of these samples having a
Hb concentration below the quoted reference intervals. No obvious correlation
was observed between level of TPMT and WBC count.
RBC TPMT
(nmol 6MTG/gHb/h)
Normal (25-56)
Hb (g/dL) Normal
Female 11.5-16.0 Male 13.2-17.5
WBC count
(x109/L)
Normal (4.0-11.0)
79 7.1 4.03
80 8.5 6.61
80 9.6 2.93
80 9.5 7.67
80 12.4 12.38
81 13.7 14.71
81 13.8 12.41
82 11.3 14.20
82 9.9 5.37
82 9.8 13.04
83 13.7 5.74
84 8.8 1.29
84 9.6 5.35
84 11.7 5.36
84 11.2 4.55

64
RBC TPMT
(nmol 6MTG/gHb/h)
Normal (25-56)
Hb (g/dL) Normal
Female 11.5-16.0 Male 13.2-17.5
WBC count
(x109/L)
Normal (4.0-11.0)
85 8.1 5.97
85 10.3 3.33
85 16.2 6.73
86 11.7 3.79
86 9.0 7.47
86 9.4 4.75
86 13.2 6.00
87 9.5 10.31
87 13.9 8.35
87 10.5 4.68
88 7.3 5.39
88 12.0 8.62
88 11.8 9.52
88 10.7 12.74
89 9.7 6.57
89 9.6 12.99
89 12.9 4.39
87 10.9 7.06
90 10.3 8.42
91 10.7 12.13
92 10.3 7.19
92 11.3 12.48
92 9.5 11.73
92 9.5 5.08
92 9.5 6.23
94 10.3 7.06
95 10.4 5.03
96 9.5 11.93
96 11.0 4.90
97 8.5 7.17
97 12.6 8.20
97 10.2 6.63
100 13.4 3.58

65
RBC TPMT
(nmol 6MTG/gHb/h)
Normal (25-56)
Hb (g/dL) Normal
Female 11.5-16.0 Male 13.2-17.5
WBC count
(x109/L)
Normal (4.0-11.0)
102 6.6 11.32
102 6.2 5.92
112 7.9 12.59
113 7.6 5.91
115 9.8 6.09
135 7.7 13.34
163 9.8 9.10
Table 4.5 Haematology of high TPMT activity samples
WBC (x10e9/L)
TP
MT (
nm
ol 6
MTG
/g
Hb
/h
)
1614121086420
140
130
120
110
100
90
80
TPMT vs WBC
Figure 4.13 Correlation of WBC count and TPMT activity r=0.156

66
4.4 Phenotype / genotype comparison 4.4.1 Audit data
Requests
Deficient
<6
Low
6-34
Normal
35-79
High
>79
No. % No.
% No.
% No.
%
Jun-07 682 1 0.1 98 14.3 577 84.8 6 0.8
Jul-07 1078 1 0.1 160 14.8 910 84.4 7 0.7
Aug-07 1100 5 0.5 137 12.5 942 85.5 16 1.5
Sep-07 1136 1 0.1 109 9.6 990 87.1 36 3.2
Oct-07 1336 1 0.1 134 10.0 1148 85.9 53 4.0
Nov-07 1305 6 0.5 118 9.0 1146 87.8 35 2.7
Dec-07 1103 1 0.1 106 9.6 964 87.4 32 2.9
Jan-08 1315 4 0.3 129 9.8 1146 87.1 36 2.7
Feb-08 1248 5 0.4 103 8.3 1112 89.1 28 2.2
Mar-08 1113 5 0.5 116 10.4 974 87.5 18 1.6
Apr-08 1372 3 0.2 121 9.0 1216 88.5 32 2.3
May-08 1353 8 0.6 121 8.9 1203 88.9 21 1.6
Jun-08 1360 7 0.5 144 10.6 1180 86.8 29 2.1
Jul-08 1496 10 0.7 125 8.4 1322 88.3 39 2.6
Aug-08 1326 3 0.2 104 7.8 1180 89.1 39 2.9
Sep-08 1464 10 0.7 148 10.1 1278 87.3 28 1.9
Mean
1237
4.4
0.3
123
10.2
1081
87.2
28
2.2
Table 4.6 Breakdown of phenotyping results

67
Deficient
<6
Low
6-23
Low
24-29
Low
30-34
Normal
>34
Heterozygote
Concordance
Jun-07 100.0 100.0 69.3 8.0 92.4 63.2
Jul-07 100.0 100.0 84.0 79.6 100.0 67.3
Aug-07 100.0 84.6 91.8 53.6 80.9 78.1
Sep-07 100.0 89.5 94.4 82.9 68.8 89.8
Oct-07 100.0 76.5 90.6 78.0 75.0 83.7
Nov-07 83.3 89.5 64.1 82.1 42.8 82.9
Dec-07 100.0 95.8 75.0 79.3 33.3 73.9
Jan-08 75.0 86.7 95.6 90.0 100.0 86.0
Feb-08 80.0 100.0 94.1 83.9 50.0 85.1
Mar-08 100.0 91.3 93.9 86.2 33.0 88.1
Apr-08 100.0 95.2 90.9 76.5 91.0 87.5
May-08 100.0 100.0 87.0 58.0 94.0 81.7
Jun-08 100.0 87.1 94.8 73.3 94.3 85.1
Jul-08 100.0 100.0 94.5 90.0 76.6 94.8
Aug-08 100.0 100.0 97.5 78.6 60.5 92.0
Sep-08 100.0 97.0 91.5 81.2 82.4 89.9
Mean 96.1 93.3 88.1 73.8 73.4 83.1
Table 4.7 Phenotype/Genotype Concordance The overall concordance between TPMT phenotype and genotype reported in
this audit was 83.1%. This is lower than our previous concordance rate of 96.8%
in the whole blood study. However, this audit concentrated on TPMT activity
results either side of the cut-off between low and normal TPMT activity rather

68
than all results, which is the likely explanation for the lower phenotype-genotype
concordance found.
The mean concordance between deficient TPMT activity and the 3*/3* genotype
is 90%, with the concordance being 100% in thirteen out of the sixteen months
the audit was performed. It is likely, where the concordance for deficient TPMT
samples is less than 100%, that these samples have TPMT mutations not
screened for using our current genotyping strategy. Where no or only one
mutant allele was identified these individuals are either compound heterozygous
or homozygous for rare mutations, which are not screened for. These findings
are highly significant as it demonstrates the importance of our testing strategy,
using phenotyping to screen all samples and genotyping for selective testing.
Using genotyping alone these patients would have been misclassified and could
have been treated with thiopurine drugs with serious consequences. In the period
April 2007 to April 2009, 10 patients were identified possessing both*2 and *3
mutations, two of these had deficient activity and 8 had low activity.
Sample instability may have impacted on concordance in some instances where
delays in transit meant many samples were older than 8 days when analysed.
This could result in a normal genotype being classified as 'low' using phenotyping
only. All such 'old' samples are flagged as such on patient reports.
This vigilance system requires constant communication and interaction between
the DNA and TPMT laboratories in our department. This produces clinically valid
and reproducible results that aid the appropriate treatment of patients screened

69
by our test. This type of audit is invaluable in monitoring the performance of the
phenotyping assay and will remain a part of the stringent quality system.
4.4.2 Mutation type
There have been over 25 mutations in the TPMT gene identified. The location of
the mutation and its effect on the protein, for the most common mutations are
detailed in Table 4.6.
Designation Mutation Exon Effect on TPMT protein
TPMT*2 G238C 5 80 (Ala) A (Prol) P TPMT*3A G460A 7 I54 (Ala) A (Thr) T Double mutant allele A719G 10 240 (Tyr) Y (Cys) C TPMT*3B G460A 7 I54 (Ala) A (Thr) T TPMT*3C A719G 10 240 (Tyr) Y (Cis) C TPMT*3D T146C 5 98 (Glu) E (Stop)X Triple mutant allele G460A 7 I54 (Ala) A (Thr) T A719G 10 240 (Tyr) Y (Cys) C
Table 4.8 Common TPMT mutations
The presence of TPMT*2 or TPMT*3C results in a significant decrease in TPMT
activity and protein expression, while TPMT*3A results in a more dramatic
reduction (Tai et al 1996). As each type of mutation has a different effect on the
protein coding for the enzyme, type of mutation may influence the degree of
activity reduction. To test this hypothesis, audit data for one year was examined
to look at the correlation between mutation type and TPMT activity. This did not
show any significant difference in activity between samples that were genotyped
as 1/*2 and those identified as 1/*3.

70
An explanation for this could lie in the screening strategy. One of the mutations
screened for is A719G, which is present in both *3A and *3C genotypes, as can
be seen from Table 4.8. If this mutation is detected, it is not possible to tell
whether patient is a *3A or a *3C genotype.
Several allelic variants are silent, producing no detectable effect, the most
common being TPMT *1s (Alves et al 2000).
4.5 Use of the service 4.5.2 Requestors The demand for the service has increased steadily over the last three years. This
is demonstrated graphically in Figure 4.14.
Date
Nu
mb
er
of
req
ue
sts
pe
r m
on
th
01/0901/0801/0701/0601/0501/0401/03
1600
1400
1200
1000
800
600
400
200
0
Number of TPMT Requests 2003 - 2009
Figure 4.14 Increase in TPMT requests from July 2003 to January 2009

71
The clinical disciplines requesting TPMT phenotyping are represented
diagrammatically in Figure 4.15. These data were obtained by looking at the
location and clinical details of requests over a one month period.
Sources of TPMT requests August 2007
IBD 5%
Crohn's 24%
Colitis 22%
Misc 4%
Eczema 6%
Pemphigoid 3%
Misc 7%
Rheumatoid Arthritis
6%
Polymyalgia
Rheumatica 3%
Misc 4%
Respiratory 5%
Immunology 5%
Liver 2%
Misc 4%
Figure 4.15 Breakdown of TPMT requests by clinical discipline and clinical
condition. Data for August 2007 4.6 Individual variability in TPMT activity
4.6.1 Repeat testing
To look at individual TPMT variability, results for samples received for repeat
testing were analysed. Change in activity for patients where two samples had
been assayed at a time interval greater than one month but no more than six
Gastroenterology
Dermatology
Rheumatology
Miscellaneous

72
months apart were recorded. The correlation between the two results for each
patient is shown in Figure 4.16.
1st TPMT Result
2n
d T
PM
T R
esu
lt
1101009080706050403020
110
100
90
80
70
60
50
40
30
20
Comparison of Repeat TPMT Activity in Individual Patients
Figure 4.16 Correlation between activities for patients repeat tested for TPMT The r value is 0.791, this indicates a fairly strong positive correlation between the
first TPMT result and the second TPMT result.
Variables beyond our control in this study included:
Age and storage of samples - after approximately 6 days at room
temperature TPMT activity begins to fall, as shown in Chapter 4.2. It is not
known what conditions the samples were subject to before receipt, which
could account for differences in activity.

73
Change in patient haemoglobin - as results are expressed per gramme of
Hb, fluctuations in a patient's Hb status could influence the calculated
TPMT activity. High TPMT activity per gramme of Hb is often observed in
patients with very low Hb concentration, as shown in Chapter 4.3.
Drug treatment, which may affect activity - for example possible inhibition
of activity by non-steroidal anti-inflammatory drugs (Oselin & Anier 2007).
A paired T-test was also performed. The results are shown in Table 4.7.
n Mean Standard Deviation
SE Mean
1st TPMT result 111 53.4 16.1 1.5
2nd TPMT result 111 52.4 15.6 1.5
Difference 111 1.0 10.3 1.0
Table 4.9 Paired T for C1 - C2
With a null hypothesis that the mean difference is equal to zero and an
alternative hypothesis that it does not equal zero gives 95% confidence intervals
for mean difference (-0.90484, 2.95890)
T-Test of mean difference = 0 (vs not = 0): T-Value = 1.05 P-Value = 0.294
With a level of significance of 0.05 the T value does not exceed 2.96, implying
there is no evidence to reject the null hypothesis. The data strongly suggest that
the mean for the first TPMT test is the same as the mean for the second TPMT
test.

74
4.6.2 Gender / age differences in TPMT activity
All 15580 TPMT results from May 2008 through to May 2009 were analysed with
respect to gender and age. (Results <10 or >100 were excluded from the
calculated mean).
Female (Years)
Number of samples
Mean SD High Activity
(>100)
<20
694 52.3 15.6 11
21-40
2374 50.4 12.9 6
41-60
2453 50.8 12.9 8
61+
2688 51.4 13.1 8
All females 8209 51.0 13.2
Male (Years)
Number of samples
Mean SD High Activity
(>100)
Age <20
760 52.8 14.0 4
21-40
1900 51.8 14.0 10
41-60
2079 51.6 13.6 8
61+
2632 52.4 13.8 10
All males 7371 52.1 13.8
Total Overall Mean Proportion of total results
15580 51.7 13.5 0.42%
Table 4.10 Gender / age differences in TPMT activity
This data shows no variation in TPMT activity with respect to gender or age. This
is based on a t-test at 99.9% level of significance which suggests values outside
the range 38.8 to 64.6 for differences to be significant.

75
5. INTEGRITY OF RESULTS
5.1 Quality system
An incorrect TPMT result has the potential to cause serious harm; therefore a
Quality Control System is in place to minimise errors. This vigilance system has
CE marking of this assay as an integral component and it covers the following
elements:
5.1.1 Failure modes and effect analysis (FMEA)
This is a bottom up approach, where every element of the system is examined
with regard to the potential for failure. Following FMEA, mechanisms are put in
place to eliminate or minimise the risks identified.
An example of how analysis of the method in this way can prevent erroneous
results has been demonstrated by identifying the effects of column age on peak
resolution. It has been found that salicylate elutes and is detected slightly after
6MTG. As column use increases the resolution between these two peaks
diminishes, to the extent that a deficient activity could be missed as the saliyclate
peak could be mistaken for a 6MTG peak. For this reason columns are changed
after approximately 1000 injections. The degree of separation between 6MTG
and salicylate is monitored by including salicylate in our quality control material.
The column is changed when resolution of the 6MTG and salicylate peak back to
baseline is lost. Reduction of peak height and resolution is shown in Figure 5.1
and 5.2.

76
Figure 5.1 Separation between 6MTG and salicylate using a new column
Figure 5.2 Separation between 6MTG and salicylate using a column after
approximately 1000 injections
0.00 0.50 1.00 1.50 2.00 min
6MTG
Salicylate
0.00 0.50 1.00 1.50 2.00 min
6MTG
Salicylate

77
5.1.2 Acceptance criteria
Once a run is complete the quality of the chromatography is examined to ensure
6MTG peaks are fully resolved and correctly integrated. The 6MTG peak in a
blank sample is automatically subtracted from all subsequent chromatography.
Quality control samples are included in every run, results of which must be within
two standard deviations of the target, for both lysate haemoglobin concentration
and TPMT activity.
Recovery of a 6MTG calibrator placed at the end of the run must be in the range
85 – 115%.The calculated mean TPMT activity for all patient samples on the run
must be within the range 40-55 nmol 6MTG/gHb/hr, excluding a very high or very
low TPMT result.
TPMT results are automatically calculated from the 6MTG concentration and the
lysate haemoglobin concentration, by the laboratory data management system.
At least three patient results for each run must be manually calculated to check
this is functioning correctly.
5.1.3 Introduction of changes
Before being put into routine use, any changes to the method must be fully
validated to ensure there is no effect on the quality of the result. All relevant
experimental data is held on record and a FMEA performed to identify any new
areas of risk.

78
5.1.4 Reagent manufacture
A log sheet is used to record the manufacture of all reagents used to obtain a
TPMT result. This includes the name of the operator, lot number of chemicals
used and the preparation and expiry dates of the manufactured reagents. Each
reagent is given a unique batch no, so that for any result the reagents used can
be identified.
5.1.5 Competency checks
After training, new operators must satisfactorily complete a competency check,
before being allowed to run the assay unsupervised. For this, they must perform
a run in which all acceptance criteria are met and a sample analysed five times
within that run gives an intra-run CV of <5%.
5.1.6 Daily maintenance logs
Each time an assay is performed the details are recorded e.g. operator, reagents
/ controls used, incubation temperature, pump pressures. Any calibration details,
operator comments and whether a run has been accepted or rejected are also
recorded.
5.1.7 Introducing a new QC
Control samples are prepared from screened volunteers. These are analysed
alongside an established QC for a minimum of ten runs. A mean target
concentration is then calculated and a Levy Jennings chart prepared.

79
5.1.8 Repeat samples
All patient samples found to have deficient activity are confirmed by repeat
analysis. A second patient's sample is also requested.
Samples with confirmed lysate haemoglobin concentrations outside the range
1.5 - 4.5 g/dL are put for repeat analysis using a fresh, more concentrated or
dilute lysate as appropriate.
Patient samples with TPMT activity >89 are checked by repeat analysis. These
samples are also checked for interfering substances as outlined in 4.1.5.
5.1.9 Genotyping confirmation
TPMT genotyping is used to confirm the status of patients in the following
situations:
Samples with deficient TPMT activity
Recently transfused patients
Samples with low TPMT activity
Where there is a change of status between present and previous results
Patients known to have had an adverse reaction to thiopurine drugs
5.1.10 Reporting
All new users of the service are sent communication introducing the service.
Any relevant comments e.g. sample age are added to reports before issue.
Deficient TPMT activity results are telephoned to the requesting clinician as soon
as possible, requesting an additional sample for confirmation.
80
5.1.11 Logs
A user feedback log is in place which provides a summary of all contacts with
end users. All communications are reviewed at the end of each month. If this
identifies an area in which the service can be improved a record of action taken
should be made.
A TPMT incident log also exists which serves as an important troubleshooting
guide for operators. All major equipment failures and reasons for rejecting runs
must be recorded in detail in this log. This is also reviewed every month.
5.2 QC data
The graphs in Figure 5.3 represent the data from over 800 separate TPMT
analytical runs.
The JB and VG controls are blood samples that are collected from two laboratory
donors, who have been screened negative for hepatitis and HIV. Blood is
donated approximately every 3 months, aliquoted, frozen, then thawed and
analysed on every run. Levy-Jennings charts are constructed for each new batch
of control.
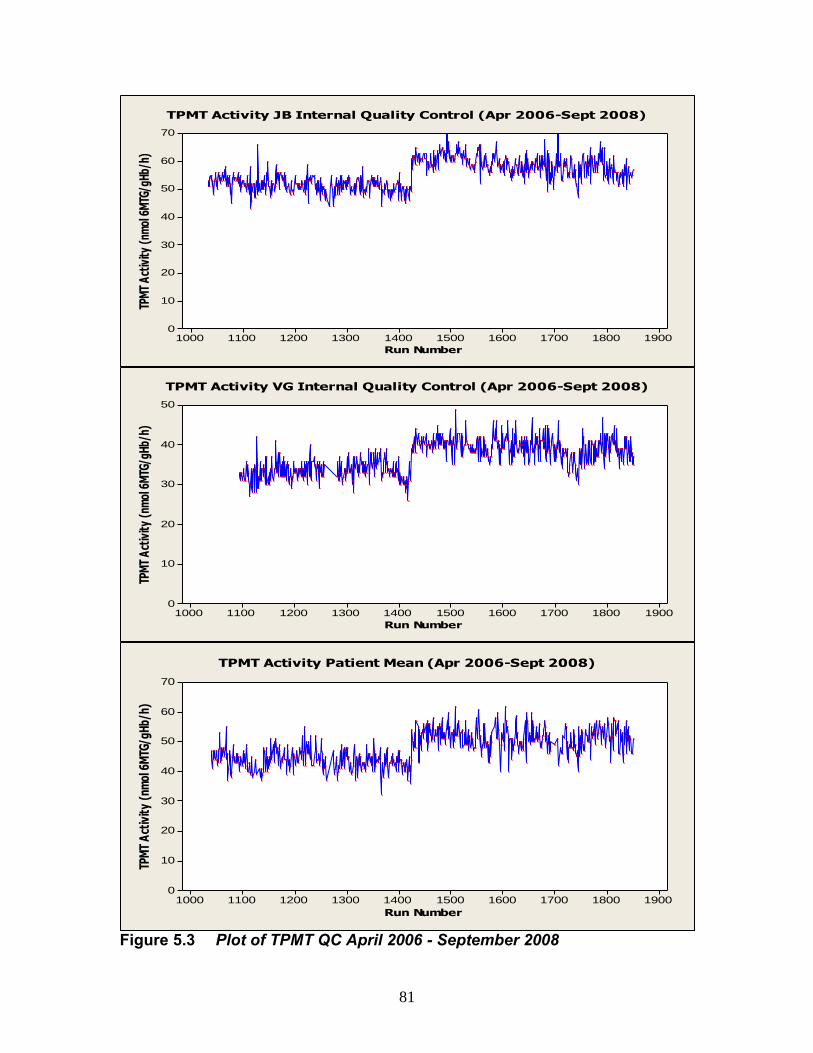
81
Run Number
TPM
T A
ctiv
ity
(nm
ol 6
MTG
/gH
b/h)
1900180017001600150014001300120011001000
70
60
50
40
30
20
10
0
TPMT Activity JB Internal Quality Control (Apr 2006-Sept 2008)
Run Number
TPM
T A
ctiv
ity
(nm
ol 6
MTG
/gH
b/h)
1900180017001600150014001300120011001000
50
40
30
20
10
0
TPMT Activity VG Internal Quality Control (Apr 2006-Sept 2008)
Run Number
TPM
T A
ctiv
ity
(nm
ol 6
MTG
/gH
b/h)
1900180017001600150014001300120011001000
70
60
50
40
30
20
10
0
TPMT Activity Patient Mean (Apr 2006-Sept 2008)
Figure 5.3 Plot of TPMT QC April 2006 - September 2008

82
The Levy-Jennings assessment is one of the main criteria when determining
whether a run is acceptable to report.
Due to the relatively high numbers of samples analysed, looking at the patient
mean for each run also gives an indication of the acceptability of the run. Any
deficient or results over 90 nmol 6MTG/gHb/h are excluded when calculating the
patient mean.
It can be clearly seen from these graphs that the QC and patient mean results
have moved in parallel over the time period studied. Shifts in the graph have
reflected issues with the assay such as reagent lot changes and problems with
incubation temperature control. For example, around run 1420 a new lot of one of
the substrates (SAM) was introduced. This resulted in a considerable shift
upwards in results. This gave better genotype/phenotype concordance and the
percentage of low results became more in line with published data. This
overcame concerns, within the laboratory, that our results had been slightly low
at that time.
The JB and VG internal QC results demonstrate the consistency in activity for
each individual. The data has been looked at in a different way by calculating the
mean and confidence limits for each batch of QC. This is represented in Figure
5.4.

83
TP
MT A
cti
vit
y n
mo
l 6
MTG
/g
Hb
/h
JB9JB8JB7JB6JB5JB4JB3JB2JB1
70
60
50
40
30
20
10
0
QC Batch
95% CI for the Mean
Interval Plot of Individual Batches of JB QC
QC Batch
TP
MT A
cti
vit
y n
mo
l 6
MTG
/g
Hb
/h
VG9VG8VG7VG6VG5VG4VG3VG2VG1
70
60
50
40
30
20
10
0
95% CI for the Mean
Interval Plot of Individual Batches of VG QC
Figure 5.4 Longitudinal study of TPMT activity in two individuals used as Quality Control April 2006 - October 2008

84
5.3 Reducing variability
Sample handling has been standardised as much as possible to minimise
operator variance. The whole blood is thoroughly mixed, to give a homogeneous
sample, before aliquoting. The aliquots are then frozen for a minimum of 15 mins
to ensure maximum lysis. An experiment was performed to determine the extent
of blood cell lysis in this time. Cell counts were performed pre and post freeze
using a Bayer Advia 120.
Sample
Pre freeze
Red blood cell count
Post freeze
Red blood cell count
% RBC lysis
1 4.65 0.16 96.6
2 4.57 0.29 93.7
3 5.09 0.34 93.3
4 4.84 0.40 91.7
5 3.95 0.22 94.4
6 4.21 0.13 96.9
7 4.90 0.48 90.2
8 4.43 0.27 93.9
9 4.77 0.26 94.5
10 4.56 0.31 93.2
Mean 93.8
Table 5.1 % RBC lysis achieved after 15 minutes at -80°C
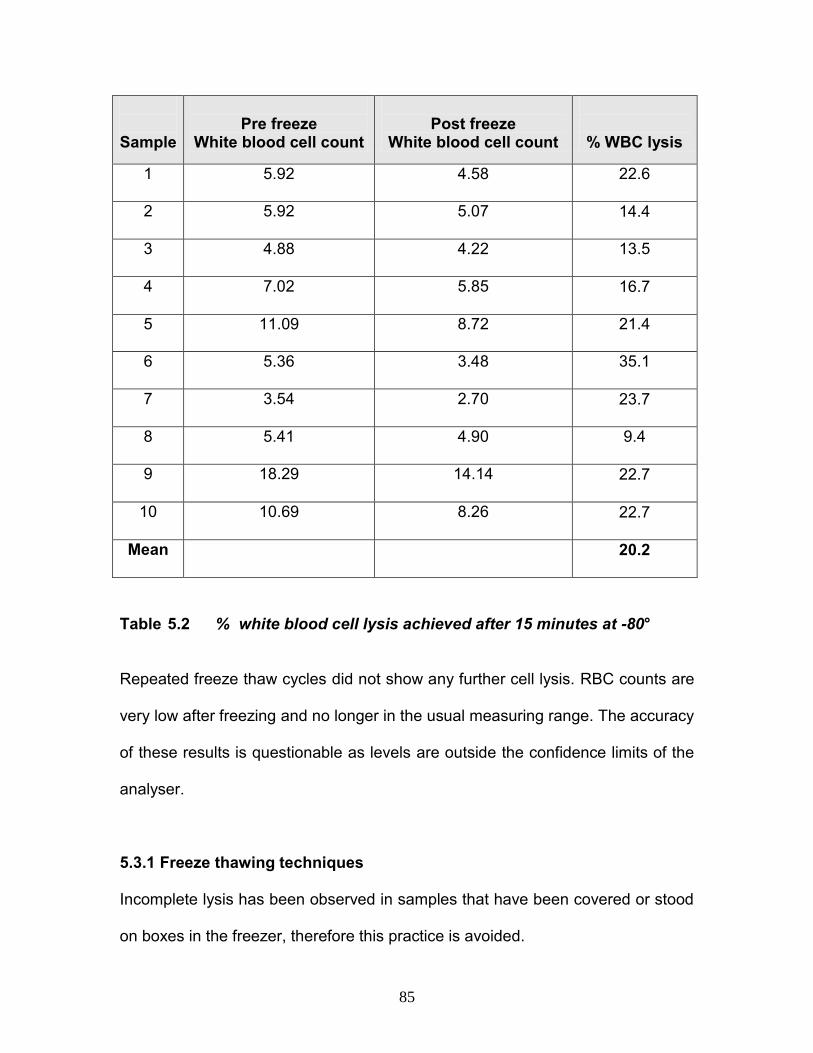
85
Sample
Pre freeze
White blood cell count
Post freeze
White blood cell count
% WBC lysis
1 5.92 4.58 22.6
2 5.92 5.07 14.4
3 4.88 4.22 13.5
4 7.02 5.85 16.7
5 11.09 8.72 21.4
6 5.36 3.48 35.1
7 3.54 2.70 23.7
8 5.41 4.90 9.4
9 18.29 14.14 22.7
10 10.69 8.26 22.7
Mean 20.2
Table 5.2 % white blood cell lysis achieved after 15 minutes at -80°
Repeated freeze thaw cycles did not show any further cell lysis. RBC counts are
very low after freezing and no longer in the usual measuring range. The accuracy
of these results is questionable as levels are outside the confidence limits of the
analyser.
5.3.1 Freeze thawing techniques
Incomplete lysis has been observed in samples that have been covered or stood
on boxes in the freezer, therefore this practice is avoided.

86
Once removed from the freezer buffer must be added to the aliquots immediately
to prevent sample degradation. The samples are then allowed to thaw for
approximately 5 minutes, before mixing thoroughly. Deviations from these
practices have resulted in unacceptable quality control.
5.3.2 Incubation temperature control
It has been found that the rate of methylation of 6TG is extremely temperature
dependent. This has necessitated strict vigilance systems to keep the assay in
control. The 1 hour 37ºC incubation was initially performed in a water bath; this
was substituted by a hot block, for convenience, as sample numbers increased.
The temperature of the blocks is monitored closely and adjusted when necessary
to maintain the required temperature. Problems with quality control seem to be
more frequent when the temperature in the laboratory is low. The installation of
air-conditioning has helped minimise any changes in ambient temperature.
Ideally, the reaction rate will be linear over the total incubation time. To allow this,
the test reagent is brought up to 37ºC prior to addition to the sample lysate. This
reagent preparation is crucial as if the starting temperature is too low an initial lag
in the reaction will occur. Conversely, if the reagent is over heated, non-
enzymatic methylation of 6TG to 6MTG can occur. This could contribute to a high
6MTG peak in blank samples. If the pre heating process is unduly long the
reagent can begin to degrade, with substrates, being seen by visual inspection,
precipitating out of solution.

87
5.3.3 Sampling errors
Precise injection volumes of only 2µl are required to be dispensed by the HPLC
autosampler, therefore a system has been put in place that would detect a ‘short’
sample. This risk has been overcome by the addition of L-tryptophan to the
whole blood suspension buffer. This acts as an internal standard and the L-
tryptophan peak is monitored by the UV detector. Monitoring these peak heights
will highlight any imprecision in injection volume.
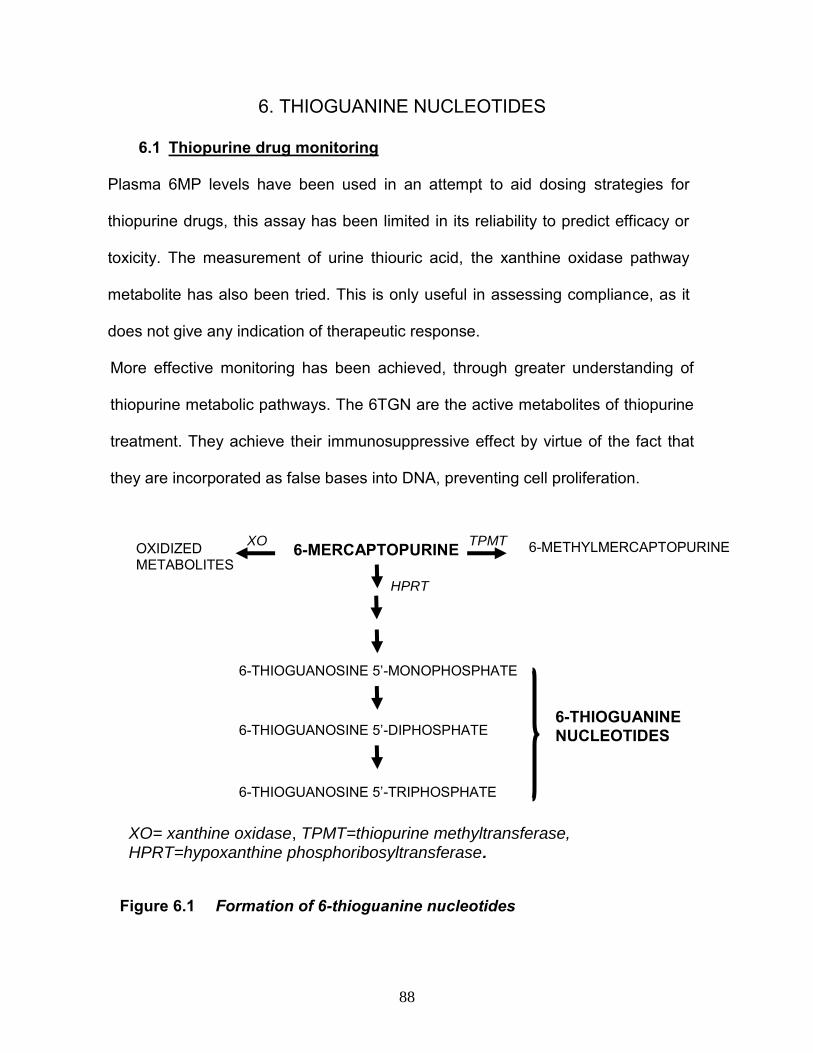
88
6. THIOGUANINE NUCLEOTIDES
6.1 Thiopurine drug monitoring
Plasma 6MP levels have been used in an attempt to aid dosing strategies for
thiopurine drugs, this assay has been limited in its reliability to predict efficacy or
toxicity. The measurement of urine thiouric acid, the xanthine oxidase pathway
metabolite has also been tried. This is only useful in assessing compliance, as it
does not give any indication of therapeutic response.
More effective monitoring has been achieved, through greater understanding of
thiopurine metabolic pathways. The 6TGN are the active metabolites of thiopurine
treatment. They achieve their immunosuppressive effect by virtue of the fact that
they are incorporated as false bases into DNA, preventing cell proliferation.
Figure 6.1 Formation of 6-thioguanine nucleotides
OXIDIZED METABOLITES
6-MERCAPTOPURINE 6-METHYLMERCAPTOPURINE TPMT XO
6-THIOGUANOSINE 5’-MONOPHOSPHATE
6-THIOGUANOSINE 5’-DIPHOSPHATE
6-THIOGUANOSINE 5’-TRIPHOSPHATE
6-THIOGUANINE
NUCLEOTIDES
HPRT
XO= xanthine oxidase, TPMT=thiopurine methyltransferase, HPRT=hypoxanthine phosphoribosyltransferase.

89
Another explanation of the immunosuppressive mechanism of thiopurine
metabolites is induced T cell apoptosis by modulation of Rac1 activation (Tiede
et al 2003).
At the moment most 6TGN quantification methods measure nucleotides
indirectly. Direct measurement is possible using mass spectrometry and ion-
exchange HPLC. These methods can differentiate 6TGN from 6TG and can also
measure thio-ITP from 6MP which may be useful in studying ITPA deficient
patients. Other direct assays include enzymatic conversion of 6TGN to
nucleosides with reverse-phase HPLC measurement.
Many of the assays developed use erythrocytes as a surrogate pharmacokinetic
marker, to indicate the intracellular levels of metabolites in the target cells i.e.
peripheral blood leucocytes or bone marrow pre-cursors. In the measurement of
RBC 6TGN it is difficult to avoid contamination with white blood cells, which may
affect results. Further problems arise when considering the degree of possible
degradation of the labile cell nucleotides between collection and analysis.
A 6TGN concentration of >235 pmol/108 RBC is associated with therapeutic
efficacy, while concentrations of >450 pmol/108 are linked with myelotoxicity
(Dubinsky et al 2000).
It is important that measurement is performed when a steady state has been
achieved, after approximately four weeks of treatment, in order to give a reliable
prediction of response to therapy.

90
6.2 Reasons for testing
It is argued that TPMT phenotyping, genotyping and measurement of 6TGN all
have value in the clinical evaluation of patients receiving thiopurine therapy.
Thiopurine metabolism is complex, with three competing enzyme pathways. Also,
polymorphisms exist in the TPMT gene and may also exist for genes encoding
for other metabolic enzymes. These factors result in a wide range of metabolite
concentrations, for a given dose, in each individual patient. The poor correlation
between dose and 6TGN concentration supports measurement of 6TGN, to aid
rational dose adjustment as increased 6TGN has been correlated to reduction in
disease activity (Hindorf et al 2004).
The usefulness of 6TGN measurement is to monitor the patient, in response to
treatment, to help achieve a dosing regime with maximum therapeutic effects and
minimal toxicity. This quantification allows confident escalation of dose in non-
responders and dose reduction for those with unexpectedly high, potentially
harmful, 6TGN concentrations. It is particularly useful in assessing:
patients heterozygous for TPMT activity who may not be receiving
standard dosage
patients who fail to respond to therapy
cases where compliance is questionable.
patients receiving the XO inhibitor allopurinol
hypermethylators, that have higher than normal TPMT activity, who could
require treatment with a higher dose to achieve adequate response

91
A study of samples received in our laboratory from patients being treated with
Azathioprine indicated that a large proportion of patients were being treated with
a sub-optimal dose. These findings were summarized and presented as a poster
at the EuroMedLab conference in Amsterdam 2007; a copy is included as
Appendix 4.
A simplified assay for determination of red blood cell 6-thioguanine
nucleotides; early evidence suggestions UK patients are receiving sub-
optimal doses of thiopurine drugs Graham V, Ford L T, Berg J
Similar findings by Morales et al in 2007 highlighted a high proportion of low
6TGN level in patients using the standard mg/kg strategy.
Higher TGN levels have been observed in Crohns disease (CD) patients than in
those with Ulcerative Colitis (UC), on similar dosing regimes (Hande et al 2006).
This is unexpected as reduced absorption would be expected in those with
Crohns disease. This could be indicative of an independent association between
disease type and nucleotide levels.
If 6TGN concentrations are low this could indicate abnormal absorption or
metabolism, this may be warrant measurement of 6MMP concentration. If this is
also low it would suggest under dosing or non-adherence. While elevated 6MMP
coupled with low 6TGN indicates preferential metabolism of 6MP to 6MMP by
TPMT.

92
6.3 Results of provisional study and comparison with New Zealand
laboratory
In 2006, a 6TGN assay was put into use at City Hospital. This assay was
adapted from the methods of (Dervieux & Boulieu 1998; Lennard 1987) and was
performed using washed RBC. Initial comparisons were carried out using RBC
samples from a laboratory with an established service in New Zealand.
New Zealand 6TGN pmol/8x10e8 cells
Cit
y 6
TG
N p
mo
l/8
x1
0e
8 c
ells
6005004003002001000
1000
800
600
400
200
0
6TGN Comparison with Established Method
Figure 6.2 Initial 6TGN comparison with New Zealand laboratory
y = 1.6165x - 35.395 r = 0.99
The City laboratory assay results initially showed a positive bias of 25-30%. It
was discovered that if the prepared 6TG calibrator was heated alongside the
samples the 6TG peak height increased. This heating of the calibrator was

93
introduced into the method; this change resulted in a lowering of results, and
brought the comparison results much more in line with the New Zealand
laboratory.
New Zealand 6TGN pmol/8x10e8 RBC
Cit
y 6
TG
N p
mo
l/8
x1
0e
8 R
BC
600500400300200
600
500
400
300
200
100
Repeat Comparison with Established Method
Figure 6.3 Repeat 6TGN comparison with New Zealand
y = 0.8635x + 58.674 r = 0.97
6.4 Method development
The original method developed liberates 6TGN from RBC, using perchloric acid
at 95ºC, hydrolysing them back to their parent thiopurine, 6-thioguanine (6TG).
The 6TG concentration is measured by HPLC, any losses are accounted for by
inclusion of an internal standard.
This method requires a relatively large sample volume, as RBC are washed and
counted prior to analysis. This preparation procedure is laborious and can
introduce errors in the cell counting step. A radical approach was therefore

94
adopted, similar to that taken with TPMT, to assess the feasibility of measuring
6TGN using whole blood.
Whole blood aliquots and red cell counts were taken from 70 patient samples
before they were prepared for the existing washed red blood cell method. These
whole blood samples were analysed alongside the routine samples and results
compared.
Whole Blood TGN (pmol 6TGN/8x10e8 cells)
RB
C T
GN
(p
mo
l 6
TG
N/
8x1
0e
8 c
ells
)
7006005004003002001000
700
600
500
400
300
200
100
0
Correlation of RBC and WBC TGN Concentrations
Figure 6.4 Comparison between 6TGN concentrations measured in
washed RBC and whole blood r = 0.978 The correlation between washed red cell and whole blood results was excellent
which is in concordance with a study carried out at the Mayo Foundation in the
USA (Pike et al 2001).

95
The quality of the chromatography for this method was poor, due to several
factors including:
the low concentrations of solvent in the circulating mobile phase meant the
system was prone to microbial growth. Resulting in frequent pump
problems and blocked filters
using an isocratic system, the analysis time allotted to each sample, was
too short to allow complete elution of some unknown compounds. This
resulted in huge, very late peaks appearing in subsequent
chromatography, as shown in Figure 6.2
Figure 6.5 Late peaks on 6TGN chromatography
These problems were solved by the introduction of a gradient elution method.
The theory behind this change was to bring in a more hydrophobic mobile phase
after elution of the peaks of interest. This was designed to achieve elution of all
0.0 2.5 5.0 7.5 10.0 12.5 15.0 17.5 min -1
0
1
2
3
4
5
6
7
8
9
10
11
12
13
14
15 mV
6TG
IS
Late peaks

96
residual compounds from the column in a relatively short time frame. Then the
system would return to the original mobile phase in preparation for the next
sample injection. Several compositions of mobile phase and pump settings were
trialled to achieve optimum settings, as show in Figures 6.6 - 6.8. The rate of
introduction and duration of the more hydrophobic mobile phase is as shown.
Figure 6.6 6TGN chromatography using mobile phase B composition: 15% Acetonitrile / 5% Methanol / 80%Buffer
0.0 2.5 5.0 7.5 10.0 12.5 15.0 17.5 min -1
0
1
2
3
4
5
6
7
8
9
10
11
12
13
14
15 mV
6TG
IS
100% Mobile Phase B
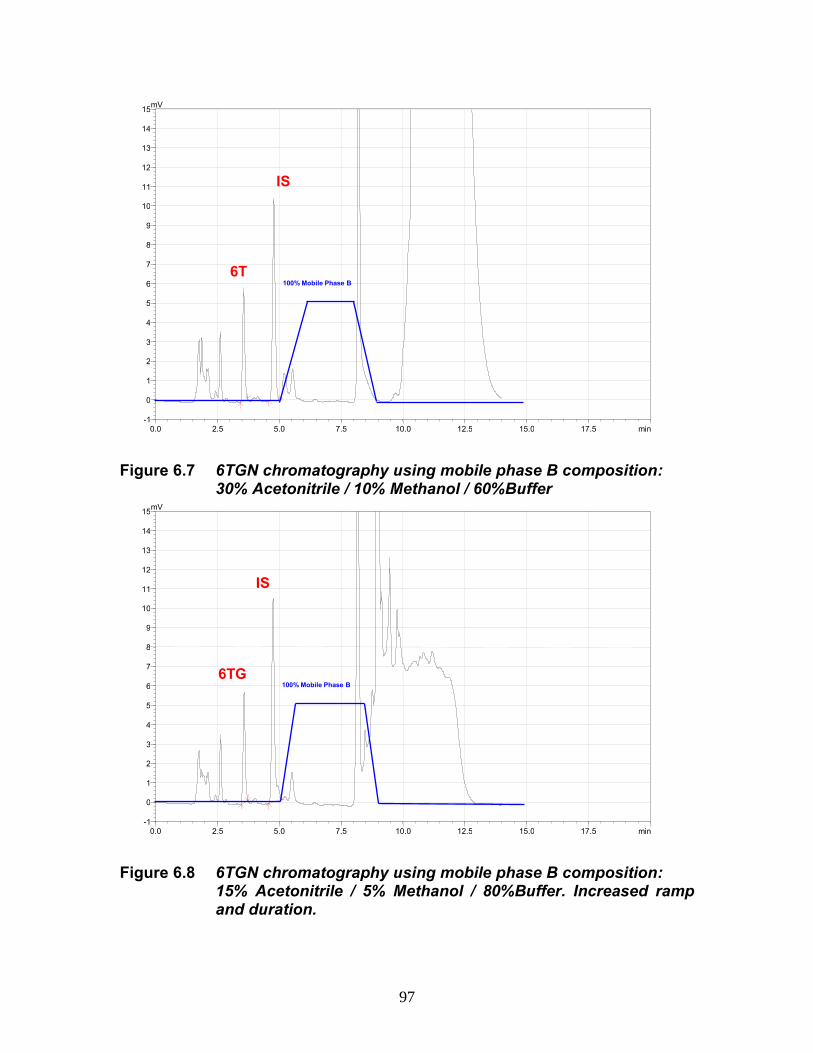
97
Figure 6.7 6TGN chromatography using mobile phase B composition: 30% Acetonitrile / 10% Methanol / 60%Buffer
Figure 6.8 6TGN chromatography using mobile phase B composition: 15% Acetonitrile / 5% Methanol / 80%Buffer. Increased ramp and duration.
0.0 2.5 5.0 7.5 10.0 12.5 15.0 17.5 min -1
0
1
2
3
4
5
6
7
8
9
10
11
12
13
14
15 mV
6TG
IS
100% Mobile Phase B
0.0 2.5 5.0 7.5 10.0 12.5 15.0 17.5 min -1
0
1
2
3
4
5
6
7
8
9
10
11
12
13
14
15 mV
6T
IS
100% Mobile Phase B

98
The intra batch variation for this new method is 8.3% (n=10) and inter batch
variation 10.2% (n=18).
A study of 6TGN stability in whole blood has shown levels to fall rapidly after
around 5 days at room temperature (Figure 6.9). For this reason, results for
samples that are over 5 days old on receipt are flagged to be interpreted with
caution.
Storage Time (Days)
pm
ol 6
TG
N /
8 x
10
e8
RB
C
1614121086420
250
200
150
100
50
0
4°C
25°C
Temperature
Storage
6TGN Stability
Figure 6.9 6TGN sample stability
The new whole blood assay, developed as part of this research, has taken this
test forward in several ways:
sample preparation is less labour intensive
cell counting and pipetting errors are minimised
the sample volume required is reduced

99
the quality of the chromatography is much improved and less failed runs
are encountered since the change to the gradient method
the assay is quicker and more cost effective
A poster summarising some of this work is included as Appendix 5.
Improving a test that has a growing clinical demand; blood 6TGN and its
role in pharmacogenomics. (2008) Graham V. Berg J.
Now in routine use, this simplified assay will allow more confident escalation of
dose in non-responders and dose reduction for those with high, potentially
harmful, 6TGN concentrations. It will be particularly useful in assessing patients
heterozygous for TPMT activity, who receive a reduced dose and for which
achieving therapeutic levels can be problematic.
6.5 Use of the 6TGN service
The number of users of this service is still relatively small, at around 15
laboratories. Those who do request 6TGN often send a number of samples on
the same patient. The number of requests received per month has risen by
approximately 100% in the last year as shown in Figure 6.10.

100
Date
Nu
mb
er
of
req
ue
sts
pe
r m
on
th
07/0904/0901/0910/0807/0804/08
60
50
40
30
20
10
0
Number of 6TGN Requests Apr 2008 - Jun 2009
Figure 6.10 Increase in demand for 6TGN analysis
If it becomes common practice to monitor 6TGN levels huge escalation in
demand for this test could be seen. As unlike TPMT testing, which usually only
needs to be done once per patient, this is a therapeutic drug monitoring assay,
where a number of determinations on one patient are more likely.
TPMT activity was been performed on 166 samples requesting 6TGN and the
correlation between TPMT activity and 6TGN concentration examined. For
samples with a high 6TGN concentration (>450 pmol/8x108 RBC), which is
associated with myelotoxicity, 24% exhibited a low TPMT activity compared to
only 11% low activity overall.

101
The correlation between 6TGN concentration and mean cell volume was also
examined for patients samples received for routine analysis.
6TGN pmol/8x10e8 RBC
MC
V (
fL)
120010008006004002000
130
120
110
100
90
80
70
60
MCV vs 6TGN
Figure 6.11 Mean cell volume / 6TGN level correlation
No significant correlation was observed but this data is flawed as most of the
samples analysed were several days old, which can result in falsely high MCVs.

102
7. INDUCTION STUDY
7.1 Aims
Many of the enzymes involved in drug metabolism may be up-regulated by
exposure to drugs and environmental chemicals leading to increased rates of
metabolism. This phenomenon is known as enzyme induction. Studies on renal
transplant patients in 2001 showed increases in patient TPMT activity, possibly
due to induction by Azathioprine (Weyer et al 2001; Thervet et al 2001). More
recent studies in Sweden do not support this hypothesis (Lindqvist et al 2006) but
these researchers used RBC TPMT. The research in this chapter looks at
possible TPMT induction in whole blood.
Eight patients from within our hospital, which were about to commence on
Azathioprine were selected at random. Patient details, other than hospital
number, were not recorded. As haematology samples were received for routine
monitoring on these patients they were tested for TPMT activity and 6TGN.
The levels of 6TGN achieved and variation in TPMT activity observed over a 5-6
month period is represented in Table 7.1, with a graphical representation of
variation of TPMT activity in Figure 7.1.

103
Week
TPMT Activity (nmol 6MTG/gHb/h)
Patient 1
Patient 2
Patient 3
Patient 4
Patient 5
Patient 6
Patient 7
Patient 8
1 38 * * * 42 * * *
2 * 39 * * * * * *
3 * * 52 52 * 35 * *
4 * * * * * * * *
5 * * * * * * * *
6 37 43 58 45 39 * 35 *
7 * * * 48 42 30 * 37
8 * * * 48 40 37 31 35
9 35 * 51 * 41 33 * 37
10 * * * * 51 38 35 44
11 36 43 * * 48 39 * *
12 * * * * 49 41 33 42
13 * * * * 45 42 * *
14 36 * * 63 * * 37 44
15 * 42 * * * * * *
16 * * * * * 43 39 *
17 * * * * * * * 41
18 38 * * * * * 40 *
19 * 41 * * * 42 * 43
20 * * 50 68 * * 34 *
21 * * 54 * * * * 44
22 * * * * * * 35 *
23 * 46 * 68 42 40 * 41
24 * * * * * * 36 *
25 36 * 55 * * * * 41
6TGN level sub-therapeutic
Therapeutic 6TGN level
6TGN level above therapeutic range Table 7.1 TPMT and 6TGN levels of patients starting azathioprine treatment

104
Week
TP
MT A
cti
vit
y (
nm
ol 6
MTG
/g
Hb
/h
)
2520151050
100
80
60
40
20
0
35
79
Patient 1
Patient 2
Patient 3
Patient 4
Patient 5
Patient 6
Patient 7
Patient 8
TPMT Activity of Patients on Azathioprine
Figure 7.1 TPMT induction in patients on Azathioprine
It can be seen from the data in Table 7.1 that 7 of the 8 patients in this study
achieved at least therapeutic levels of 6TGN. But it can be seen from Figure 7.1
that, with the exception of one patient, no increase in TPMT activity was
observed. The apparent increase in this one patient may have been due to
factors other than induction e.g. possible fall in patient Hb levels, which could
give rise to high calculated activity as explained in Chapter 4.3.

105
8. DISCUSSION
8.1 Introduction
There is an increasing interest and availability of pharmacogenetic products and
services, many of which, including TPMT testing, detect polymorphisms
associated with severe adverse drug reactions. These tests have obvious
theoretical clinical advantages, some have relatively strong evidence bases and
there can be a commercial interest in their development. Yet, validation and
approval can take a very long time. Expense and poorly defined legal
frameworks have contributed to this ‘logistical challenge’ and this is delaying
widespread clinical use (Hopkins et al 2006). The thiopurine drugs which are the
basis of TPMT testing are ‘off patent’, making them open to generic competition.
Therefore, there is little incentive for manufacturers to invest in pharmacogenetic
services. Despite these facts, TPMT testing is one service which has become
well established in the UK and is currently the best example of applied clinical
phamacogenetics. The work of this thesis has researched and developed the
pharmacogentic services of City Hospital Birmingham, part of the Sandwell and
West Birmingham NHS Trust, which is currently a major provider of TPMT
testing in the UK.
In a 2007 study, it was found that over two thirds of UK National Health Service
consultants were requesting determination of TPMT before initiation of
Azathioprine treatment (Fargher et al 2007). This is compared with virtually zero
requests in 1997 (Tan BB et al 1997). This increase in testing, which has been

106
demonstrated in this thesis, reflects to a certain extent, changes in national
guidelines. However, the guidelines are not strictly adhered to and advice
relating to TPMT testing can be discipline specific, for example resulting in a
higher uptake from dermatologists, compared with gastroenterologists and
rheumatologists (Fargher et al 2007b). Pre-treatment and regular measurements
of full blood count, liver function tests, urea and electrolytes are still strongly
recommended in all clinical situations.
Training and education of healthcare professionals in the field of
pharmacogenetics is taking place (Higgs et al 2008) but this requires escalation
to meet patients' expectations (Fargher et al 2007). Emerging tests need to be
explained and interpreted. It has become necessary for clinical pharmacists to
be able to understand both enzyme level and DNA based TPMT tests in order to
guide optimal prescribing rather than solely relying on the British National
Formulary recommended dosing based on mg/kg body weight (between 1 and 3
mg/kg). The national survey by Fargher et al 2007 shows how well Azathioprine
is tolerated, with around 67% of patients having good, 17% having reasonable
and 15% having poor tolerance. With more informed dosing this should continue
to improve.

107
8.2 Research outcomes
8.2.1 Whole Blood Assay
The work in this thesis has helped develop a new TPMT assay that has
improved clinical utility. This whole blood assay has been introduced after
comparing RBC TPMT with whole blood TPMT. This work involved comparison
of the phenotyping for both methods, with genotyping, for 406 patient samples.
The new whole blood assay is simpler and requires less sample volume. The
fundamental changes to the method are that whole blood is used rather than
washed RBC and cell lysis is achieved using freezing rather than using a lysis
buffer. A strong correlation (r=0.834) was observed between the RBC and whole
blood phenotyping methods. Both techniques demonstrated 97% genotype
concordance and 79% concordance between low TPMT results and
heterozygous genotypes.
8.2.2 Whole blood assay precision profile
One of the main reasons for the development of a whole blood TPMT method
was to improve the relatively high imprecision of the conventional RBC assay.
This imprecision was shown to be due to the washed cell pellet not being
homogeneous. This results in varying mixtures of cell type being aliquoted on
repeat analysis. Variation in activity on repeat analysis may also have been due
to differences in the amount of old blood cells or white blood cells present in the
aliquot. Studies by Lennard L et al in 2001 showed that older RBC, which could
be partially separated during centrifugation, have a lower than average TPMT

108
activity. While in 2008, de Boer et al found extremely high TPMT levels in
patients that had a high percentage of young RBC. This supports the hypothesis
that all RBC in a sample do not have similar activity. The activity in the aliquot
could also be affected by the amount of WBC present. The data from the whole
blood study shows that whole blood activities are always higher but the degree
of increase can vary enormously. The higher TPMT activities seen in whole
blood compared to washed red cell preparations are likely to be due to white cell
activity. Preliminary studies by ourselves have shown the activity per white cell
to be very high but considering the haematology of high activity samples in Table
4.5, there is no obvious correlation between WBC and TPMT activity. WBC
TPMT activities would be an interesting area of research, but is beyond the
scope of this thesis.
8.2.3 Whole blood assay utility
Another main driver for the whole blood method development was to try to
eliminate the RBC washing steps. The new method has achieved this, saving
several hours biomedical scientist time every day, making the assay more cost
effective. These time and cost savings have impacted positively on the
turnaround time of results, which has typically been kept to less than two
working days. This short time frame enables rapid, informed dosing of
thiopurines for patients that may be extremely ill. The importance of emphasis on
turnaround is demonstrated by this service now being used by over 200 external
laboratories. The income the test has generated has allowed development in

109
other areas of the department, including work presented here on the 6TGN
assay.
8.2.4 Phenotype / genotype concordance
Now the whole blood method is in use, all samples with a TPMT of less than 41
(normal range 35-79) are routinely genotyped (Ford et al 2009). This selective
genotyping underpins the whole blood phenotyping service providing a valuable
quality control function. This gives confidence in an assay which can be difficult
to control, due to in-house reagent production and a number of variables,
including operator technique.
Additional samples selected for genotyping include those where the clinical
details suggest that the patient has been transfused. Genotyping these samples
overcomes one of the disadvantages of phenotyping where the measurement of
activity from the donor blood masks the true TPMT status. In a worst case
scenario, a deficient patient could be missed, as TPMT in a donor’s cells can
produce a significant amount of reaction product. The transfused blood usually
contains only a very small percentage of nucleated cells; therefore the
genotyping should still give a true indication of the patient’s TPMT status. In
transfusion cases it is suggested that TPMT phenotyping is repeated at least 120
days after the last transfusion, so that no donor cells remain in circulation. A case
study where a transfusion masked a deficient patient, tested at City Hospital, is
described by Ford et al 2004b. After eight weeks treatment with Azathioprine this
patient developed neutropenic sepsis and staphylococcal skin impetigo. They

110
had become pancytopenic and a bone marrow examination revealed severe
aplastic anaemia. The azathioprine was stopped after nine weeks and the
following week blood was analysed for TPMT. The RBC activity was found to be
low, 16 nmol 6MTG/gHb/h (normal 24-55). At a review eight weeks later the
patient's TPMT activity was found to be undetectable at <2 nmol6MTG/gHb/h.
The sample was genotyped and found to be homozygous for *3A, the most
common TPMT mutation in Caucasians, demonstrating a clear
phenotype/genotype concordance. Due to the apparent change in TPMT status,
from low to deficient, the clinical history for the patient was re-examined. It was
discovered that the patient had received a blood transfusion of one unit of blood
and two units of platelets six days before the first sample for TPMT measurement
was taken. In cases like this, the activity detected can be that of the donor cells.
This is the likely cause of the discrepancy in this case and the cause of the initial
misleading result. This highlights the importance of interpreting the TPMT results
with caution in patients who have been transfused. It also highlights one of the
reasons why our service genotypes all low activity samples and all samples
where the clinical details indicate a recent transfusion.
The testing strategy of phenotyping to screen all samples and genotyping for
selective testing should minimize the risk of missing ‘deficient’ patients which
may have gone undetected using a single technique.
As well as genotyping assurance, all aspects of the method have been examined
and adjusted if necessary to reduce variability and ensure the integrity of the
results reported. A comprehensive vigilance system has been developed as part

111
of the overall Quality System. This has been necessary to maintain CE marking
for this assay.
8.2.5 Variability of TPMT activity
A pre-analytical issue, which may give low results and possible misclassification
of status, is sample deterioration due to age or storage conditions. Results in
Chapter 4 show that TPMT is stable for over 10 days at -80°C and 4°C, but
activity is seen to fall after about 6 days at room temperature. Users of the TPMT
service are advised to store samples at 4°C prior to posting at ambient
temperature. It is not known what temperatures the samples are subjected to in
transit. Therefore, all samples >8 days old are flagged with the comment that the
result must be interpreted with caution due to enzyme instability.
The issue of individual variability in TPMT activity was examined in detail. The
analysis of two donors over period of several years has shown no significant
fluctuation in their respective activities. Repeat samples from patients also
suggest that an individual's TPMT activity remains relatively constant.
The data presented in Table 4.10 gives no indication of gender or age
differences in TPMT activity. This supports the much smaller study of Keizer-
Garritsen et al (2003) but is contrary to the findings of Klemetsdal et al (1993)
and Cooper et al (2008), who observed slightly lower activities in females.
Slightly lower results for children compared with adults were found by Ganiere-
Monteil et al in 2004.

112
The demand for the City Hospital TPMT service has continued to increase, with
an observed 100% increase over a three year period. This has occurred as it is
becoming established practice in many NHS Trusts to screen all patients before
initiating thiopurine therapy. Users switching their business to us, to take
advantage of the rapid service, have also contributed to the increase in requests.
The main users of the service continue to be gastroenterology, dermatology and
rheumatology (Barlow et al 2009).
8.2.6 6TGN assay
The usefulness of the 6TGN test is still open to debate as it has been suggested
that erythrocyte 6TGN levels are highly variable, even in the same patient and
that levels do not reliably provide sufficient information to predict efficacy or
toxicity (Sandborn 2004; Lennard & Lilleyman 1989; Lowry et al 2001; Mardini et
al 2003). There does not seem to be a weight/dose correlation with metabolite
levels (Tani et al 2009). Similarly, Morales in 2007 found the level of 6MP dose
to be only weakly associated with 6TGN levels, due to individual variability, and
for this reason supports the use of 6TGN testing. Work by Hindorf et al 2006 has
shown metabolite monitoring to be cost effective and that of Tani et al 2009
suggests it is necessary to adequately personalise dosing. Some health
insurance policies in the USA cover the monitoring of thiopurine metabolite
levels, as it is considered medically necessary for individuals with inflammatory
bowel disease (IBD) to guide dose changes in those who have not responded to
113
azathioprine (AZA) and / or 6-mercaptopurine (6-MP) therapy or for those
suspected of having toxic responses to these medications.
The level of 6TGN required to achieve therapeutic effect may have an element of
disease specificity. Lower mean levels have been observed in patients in
remission for dermatological conditions compared with those having a positive
response to treatment for inflammatory bowel disease (el-Azhary et al 2009).
Most 6TGN methods, including that used at City Hospital, are not ideal as they
do not measure nucleotides directly. Some use enzymatic conversion of TGN to
nucleosides with reverse-phase HPLC measurement; others depend on the
hydrolysis back to the thiopurine bases. In the latter, the efficiency of hydrolysis
is difficult to ascertain due to the unavailability of TGN standards. Another major
issue concerns patients being treated with 6TG, where it is impossible to
distinguish between the hydrolysed derivatives of TGN and the non-metabolised
drug present in the blood cells. Another issue with the majority of 6TGN testing
approaches is that RBC are used as a surrogate marker for target cells. This is
not an ideal, as RBC are not nucleated and therefore lack full purine functionality.
The enzyme IMP dehydrogenase is required for the conversion of 6MP, a
hypoxanthine analogue, to thio-GM and TGN, this enzyme is not expressed in
erythrocytes. Therefore the TGN produced as a result of 6MP metabolism are
made indirectly, largely in hepatic tissue. For this reason it is suggested that
erythrocyte TGN levels are more likely to reflect liver cell, rather than target white
blood cell metabolism (Dulay & Florin 2005). 6TG is a guanine analogue, which
can be converted to thio-GMP and TGN via HRPT. This direct incorporation of

114
6TG into TGN, compared with the indirect route followed by 6MP, results in
relatively higher RBC TGN in patients receiving 6TG than those on 6MP. It has
been recommended that patients who prove intolerant to 6MP may benefit from
6TG therapy. (Cheung et al 2003, Lennard et al 1993 & 1996). Ideally TGN
should be measured in non-stimulated target cells. This would be difficult in
practice as it would involve the laborious purification of leucocytes.
This work has included comparisons between whole blood 6TGN levels and
levels in a preparation of washed RBC. Furthermore, research undertaken here
has enabled a whole blood 6TGN assay to be introduced which is quicker,
minimizes errors and is more suitable for routine clinical use than previously
published methods. The actual HPLC analysis has also been improved with the
introduction of a gradient elution method, which has greatly improved the quality
of the chromatography, making the method much more suitable for routine use.
Work by Decaux et al (2000) and Thomas et al (2003) found a correlation
between high levels of 6TGN and increased mean cell volume (MCV). Thomas et
al suggest that MCV measurement is a simple and inexpensive alternative to
measurement of 6TGN concentrations. No such correlation was found in this
research although this data is of limited value. Many of the measured MCVs were
above the reference range but most of the samples analysed were several days
old, which can result in falsely high MCVs.
In Chapter 7, eight patients commencing on azathioprine were monitored for any
apparent TPMT enzyme induction in whole blood. With the exception of one
patient no significant increase in TPMT activity was observed. This fails to

115
support the hypothesis that induction effects may be more apparent in whole
blood samples than in washed RBC. The work of Arenas et al in 2004 and
Hindorf et al, in 2006, saw no increase in TPMT activity during treatment, in
contrast to that of el-Azhary et al (2009), of the Mayo Clinic, where apparent
induction was observed.
8.3 Future directions
Due to the high number of samples analysed by this service, a huge amount of
valuable data has been available in this study. This has made it relatively easy to
look at patterns in results. One of the most interesting trends observed has been
the apparent correlation between low sample haemoglobin concentration and
high calculated TPMT activity; this is detailed in Chapter 4. Evidence presented
in this thesis suggests that the convention for reporting TPMT with respect to Hb
concentration may give a misleading, high result for some patients with abnormal
haematology, where the Hb measurement is a false indicator of cellular contents.
These observations are to be followed up with further studies, including
performing genomic analysis on low Hb samples that have borderline low/normal
TPMT activity, to compare degree of concordance with routine samples. There is
the possibility of taking the radical step of reporting TPMT activity in 'units per
litre'. Recent literature shows a range of units are being used to express TPMT
activity, many not adjusting for Hb concentration.

116
To give clinicians a better picture of what is happening 'in vivo' a service for
6MMP is being developed. This assay will be performed alongside 6TGN after
slight method modifications. It is important to be able to offer quantification of this
metabolite as increased levels can lead to hepatotoxicity. If a low 6TGN result is
reported without a 6MMP, this does not give enough information to ascertain
why. The thiopurine dose maybe too low, the patient may be non-compliant or
6MP could be being preferentially shunted towards 6MMP, due to high TPMT
activity or other contributory factors. Such a 6TGN result could lead to
inappropriate dose escalation; this risk is highlighted in the work of Gardiner et al
(2008).
As seen in section 4.4, genotyping underpins this TPMT phenotyping service. In
the absence of an organized external quality assurance (EQA) scheme. Regular
audit of phenotype/genotype concordance ensures the validity of the phenotyping
results.
City Hospital previously set up a worldwide EQA scheme for TPMT in conjunction
with UK National External Quality Assessment Service (NEQAS). This was
difficult to keep running due to difficulty in obtaining suitable material to distribute
and also due to staffing issues both at City Hospital and NEQAS. A priority area
for development of the service is to initiate a form of external quality control for
both TPMT and 6TGN, possibly sample sharing with other laboratories.
117
Thiopurines are widely used as they are an attractive alternative to steroids, both
in terms of cost and side effects. In 2004 nearly 0.6 million prescriptions for
Azathioprine were dispensed (The Information Centre NHS 2005). Evidence
suggests that treating a patient with these drugs, without firstly checking their
TPMT status is ethically questionable. Such treatment has a 1% risk of death
from associated bone marrow suppression and there is a four fold increased risk
of suppression in heterozygotes (Gisbert & Gomollón 2008). Economic evidence
in New Zealand has highlighted the cost savings of thiopurine treatment versus
non-treatment of IBD patients (Priest el al 2006). Also, TPMT screening, prior to
treatment, has been shown to be cost effective, phenotyping more so than
genotyping (van den Akker-van Marle et al 2006) (Payne et al 2009). But robust
evidence and accurate costs are difficult to obtain, this is due to reasons such as,
under reporting of ADR and differences of opinion of what level constitutes
neutropenia (Compagni et al 2008). In addition, when considering economics,
phenotyping and metabolite monitoring can facilitate ‘tailored’ dosing. This is
much more likely to have a favourable outcome, resulting in direct cost savings
as well as improved quality of life.
Conclusions
This work has studied the development of a whole blood assay for TPMT and
monitored it as it took over as the routine test, replacing an earlier more labour
intensive and less precise assay. This project has confirmed that the new assay
not only produces more precise and reliable results but that the concordance with

118
genotype is essentially unchanged from the previous test based on a RBC lysate
preparation. One feature of this assay, and most others offered by other UK
providers of TPMT and centres around the world, is expression of the TPMT
activity in relation to haemoglobin or RBC content of the blood cell lysate. We
have shown that there is little, if any, advantage to this and that expressing
patient whole blood activity as U/L will give a result which classifies patients
equally well against their underlying genotype. Furthermore, in some patients
with low haemoglobin levels, evidence has been presented that misleading high
results can be obtained and that this is not seen when results are expressed as
U/L TPMT. Bringing the use of U/L expression into routine use would require
further presentation of our evidence which would ideally encourage other
providers to move to this reporting format. Such a move is to some extent
facilitated by a recently launched commercial assay in kit form (BIOLOGIX
Research Corporation) which disregards the link to haemoglobin and expresses
a semi-quantitative result in U/L.
Our concept of a whole blood assay rather than using a sample based on
washed RBC has also been applied to develop an assay for thioguanine
nucleotides, another important outcome of this project has been bringing this into
routine use. Again this has produced an assay which is much more suited to
routine analysis as it reduces the analytical steps considerably. As the interest in
therapeutic drug monitoring using 6TGN grows, this is a very useful
development.

119
Alongside the timeline of this research project interest in TPMT analysis prior to
starting treatment with thiopurines has grown considerably. Indeed in January
2009 the Drugs and Therapeutics Bulletin recommend that patients should be
pre-screened with TPMT before commencing therapy. The provision of a service
at City Hospital, which has always been able to maintain a 1-2 working day
turnaround, is to a great part related to the process of continuous development
and quality improvement that has been the foundation of the work in this thesis.
This work has aided UK clinicians prescribing thiopurines, by offering a timely
service for determination of TPMT status in patients commencing therapy, which
can only impact positively on patient care.

120
9. APPENDICES
Appendix 1 Consumable and Equipment Suppliers
General
Camlab Gilson pipettes
VWR ART 10µl sterile pipette tips with filter
ART 20µl sterile pipette gel tips with filter
ART 200µ sterile pipette tips with filter
ART 1000 sterile pipette tips with filter
Alpha Labs 1.5 ml sterile micro-centrifuge tubes
Pastettes
Micro-pastettes
TPMT Phenotyping
Hettich Rotanda 460 Centrifuge
Grant UBD Dri Incubation Blocks
Shimadzu SCL-10AVP System Controller
SIL-10ADVP Autosampler
LC-10ADVP LC Pump
DGU-14A Degasser
CTO-10ASVP Column Oven with Phenomenex Kingsorb
column
SPD-10 AVP UV Detector
RF-10AXL Fluorescence Detector

121
TPMT Genotyping
Grant Water Bath
LEC Automatic Ice Maker
Unicam UV/visible spectrophotometer quartz micro-cuvettes (10mm)
Abgene 0.2 ml Thermo-tube, thin walled tubes with flat caps
Techne 96 well plate Genius thermal cycler
Eppendorf 5415D Micro-centrifuge
Thermo EC330 Midicell Primo Submarine Gel System
EC135-90 Power Pack
Syngene GeneGenius Gel Documentation System
Consisting of: Gel Documentation Analysis System (IBM Thinkpad
Computer)
Bio Imaging System
GelVue UV Transilluminator
Slim Light Panel
Sony Digital Graphic Printer UDP-D895-MD
Sony Printing Paper Type IV (Enhanced) UPP-110HA
6TGN
Shimadzu CTO -20A Column Oven Phenomenex Prodigy 5uODS(2)
column
LC20 -AD HPLC Pump
SIL -20A Autosampler
SPD -20A UV/Vis Absorbance Detector
Hettich MIKRO 200 Eppendorf Microcentrifuge
Stuart Scientific SHT 100D Dri Block Unit

122
Appendix 2 Whole blood TPMT study raw data

123
RBC Lysate 1 RBC Lysate 2 Mean RBC Lysate Whole Blood 1 Whole Blood 2 Mean WB
Sample Peak Ht. Activity Peak Ht. Activity Peak Ht. Activity Peak Ht. Activity Peak Ht. Activity Peak Ht. Activity Genotype
219424 9.2 33 6.6 35 7.9 34 11.1 47 11.3 48 11.2 48 TPMT*1/1
219425 2.5 9 2.8 11 2.7 10 2.4 9 3.3 12 2.9 11 TPMT*1/3
219426 4.8 23 2.0 21 3.4 22 11.6 46 11.4 43 11.5 45 TPMT*1/1
219427 6.4 26 7.9 32 7.2 29 11.0 58 9.8 49 10.4 54 TPMT*1/1
219428 7.8 24 7.3 22 7.6 23 7.5 36 8.3 35 7.9 36 TPMT*1/1
219414 8.0 29 9.8 28 8.9 29 9.5 45 9.7 40 9.6 43 TPMT*1/1
219415 9.5 28 9.8 43 9.7 36 7.4 35 7.6 33 7.5 34 TPMT*1/1
219416 8.7 32 10.5 33 9.6 33 7.5 37 7.8 36 7.7 37 TPMT*1/1
219417 9.7 25 12.6 36 11.2 31 8.3 37 8.6 35 8.5 36 TPMT*1/1
219418 11.0 34 8.9 28 10.0 31 9.6 44 9.9 42 9.8 43 TPMT*1/1
219419 16.3 44 16.2 45 16.3 45 10.5 44 11.3 44 10.9 44 TPMT*1/1
219420 10.1 38 * * 10.1 38 12.4 41 * * 12.4 41 TPMT*1/1
219421 9.1 32 10.4 34 9.8 33 8.2 35 10.4 42 9.3 39 TPMT*1/1
219422 15.2 56 * * 15.2 56 14.5 59 * * 14.5 59 TPMT*1/1
219423 11.9 40 12.5 37 12.2 39 8.4 40 9.1 42 8.8 41 TPMT*1/1
219429 8.1 33 10.5 34 9.3 34 12.0 46 12.0 47 12.0 47 TPMT*1/1
219431 13.6 35 12.3 31 13.0 33 12.4 43 11.7 40 12.1 42 TPMT*1/1
219432 16.0 37 8.8 37 12.4 37 11.9 55 11.0 55 11.5 55 TPMT*1/1
219433 13.7 47 16.0 57 14.9 52 15.2 60 14.1 57 14.7 59 TPMT*1/1
219434 14.0 50 16.2 59 15.1 55 14.5 66 14.0 64 14.3 65 TPMT*1/1
219435 10.2 31 12.6 36 11.4 34 11.7 46 10.8 46 11.3 46 TPMT*1/1
219436 6.9 28 9.4 33 8.2 31 12.1 43 12.3 44 12.2 44 TPMT*1/1
219437 8.1 31 12.6 36 10.4 34 9.8 45 9.4 45 9.6 45 TPMT*1/1
219438 6.9 20 4.0 23 5.5 22 11.8 46 11.7 48 11.8 47 TPMT*1/1
219440 7.2 26 3.0 22 5.1 24 7.8 34 7.1 35 7.5 35 TPMT*1/1
219442 7.2 25 9.8 27 8.5 26 8.5 36 7.8 34 8.2 35 TPMT*1/1
219443 9.8 35 * * 9.8 35 11.1 41 11.0 42 11.1 42 TPMT*1/1
219444 9.4 33 9.5 34 9.5 34 10.0 38 10.2 42 10.1 40 TPMT*1/1
219445 7.4 20 10.9 32 9.2 26 9.2 37 9.0 40 9.1 39 TPMT*1/1
219446 9.2 37 13.8 41 11.5 39 12.7 48 12.7 48 12.7 48 TPMT*1/1
219447 5.0 15 5.4 16 5.2 16 5.9 21 5.7 22 5.8 22 TPMT*1/3

124
RBC Lysate 1 RBC Lysate 2 Mean RBC Lysate Whole Blood 1 Whole Blood 2 Mean WB
Sample Peak Ht. Activity Peak Ht. Activity Peak Ht. Activity Peak Ht. Activity Peak Ht. Activity Peak Ht. Activity Genotype
219448 9.0 30 13.4 35 11.2 33 9.7 44 9.4 45 9.6 45 TPMT*1/1
219449 11.5 57 5.8 49 8.7 53 11.2 56 10.2 51 10.7 54 TPMT*1/1
219450 12.7 58 18.5 64 15.6 61 12.3 80 17.9 76 15.1 78 TPMT*1/1
219451 5.4 17 6.2 18 5.8 18 5.9 26 6.0 28 6.0 27 TPMT*1/3
219452 9.4 29 11.7 32 10.6 31 11.3 48 12.2 48 11.8 48 TPMT*1/1
219453 5.3 23 7.6 26 6.5 25 8.4 40 8.4 39 8.4 40 TPMT*1/1
219454 4.5 15 5.7 17 5.1 16 5.6 21 5.9 22 5.8 22 TPMT*1/3
219455 5.0 39 9.5 42 7.3 41 14.1 50 13.8 52 14.0 51 TPMT*1/1
219456 11.1 34 12.2 37 11.7 36 3.1 53 14.2 54 8.7 54 TPMT*1/1
219457 12.9 35 8.7 26 10.8 31 10.9 52 10.1 53 10.5 53 TPMT*1/1
219459 13.6 36 12.7 37 13.2 37 13.6 50 13.3 54 13.5 52 TPMT*1/1
219460 10.9 39 10.4 39 10.7 39 12.2 48 12.1 49 12.2 49 TPMT*1/1
219461 5.4 33 7.8 37 6.6 35 10.2 42 9.7 41 10.0 42 TPMT*1/1
219462 15.3 43 13.6 44 14.5 44 13.6 55 13.3 59 13.5 57 TPMT*1/1
219463 16.0 44 14.2 43 15.1 44 11.5 55 10.9 52 11.2 54 TPMT*1/1
219464 6.6 32 9.9 31 8.3 32 9.8 36 9.8 39 9.8 38 TPMT*1/1
219465 11.0 39 16.2 48 13.6 44 8.9 51 11.2 54 10.1 53 TPMT*1/1
219466 15.3 54 14.8 58 15.1 56 14.7 67 13.5 62 14.1 65 TPMT*1/1
219468 9.0 30 15.0 37 12.0 34 13.4 51 12.1 44 12.8 48 TPMT*1/1
219469 10.0 39 12.6 40 11.3 40 12.6 58 11.3 52 12.0 55 TPMT*1/1
219476 11.0 36 16.3 44 13.7 40 13.1 53 12.5 55 12.8 54 TPMT*1/1
219477 10.6 26 13.3 32 12.0 29 11.1 49 10.4 48 10.8 49 TPMT*1/1
219478 18.0 44 * * 18.0 44 11.5 51 10.3 45 10.9 48 TPMT*1/1
219479 7.5 29 9.3 34 8.4 32 11.4 48 12.0 49 11.7 49 TPMT*1/1
219480 11.8 35 15.4 39 13.6 37 14.3 49 13.8 51 14.1 50 TPMT*1/1
219481 6.5 17 8.7 24 7.6 21 6.3 36 6.3 36 6.3 36 TPMT*1/1
219482 5.6 17 6.9 19 6.3 18 4.4 25 4.5 25 4.5 25 TPMT*1/3
219483 11.1 38 15.5 34 13.3 36 11.8 46 12.7 48 12.3 47 TPMT*1/1
219484 13.7 40 17.8 42 15.8 41 13.0 53 12.2 50 12.6 52 TPMT*1/1
219485 8.5 33 13.3 39 10.9 36 18.1 77 14.5 61 16.3 69 TPMT*1/1
219486 13.9 44 18.7 53 16.3 49 14.6 59 13.9 64 14.3 62 TPMT*1/1

125
RBC Lysate 1 RBC Lysate 2 Mean RBC Lysate Whole Blood 1 Whole Blood 2 Mean WB
Sample Peak Ht. Activity Peak Ht. Activity Peak Ht. Activity Peak Ht. Activity Peak Ht. Activity Peak Ht. Activity Genotype
219487 16.0 57 10.7 44 13.4 51 * * 12.2 71 12.2 71 TPMT*1/1
219488 13.9 44 15.5 47 14.7 46 20.0 69 18.0 66 19.0 68 TPMT*1/1
219489 6.0 44 5.0 46 5.5 45 11.4 55 10.6 58 11.0 57 TPMT*1/1
219490 3.4 29 2.9 29 3.2 29 12.5 51 12.0 53 12.3 52 TPMT*1/1
219491 6.9 42 4.6 40 5.8 41 7.8 48 7.3 45 7.6 47 TPMT*1/1
219492 5.2 30 4.6 39 4.9 35 10.7 44 10.2 43 10.5 44 TPMT*1/1
219493 4.7 34 4.1 32 4.4 33 17.1 82 17.4 87 17.3 85 TPMT*1/1
219494 5.2 36 2.8 34 4.0 35 10.2 36 9.9 36 10.1 36 TPMT*1/1
219495 6.5 55 4.4 60 5.5 58 16.0 73 15.3 76 15.7 75 TPMT*1/1
219496 7.0 45 5.4 42 6.2 44 10.2 45 10.2 47 10.2 46 TPMT*1/1
219497 3.3 28 4.1 30 3.7 29 12.2 45 12.3 48 12.3 47 TPMT*1/1
219498 3.6 30 2.5 31 3.1 31 12.0 44 11.4 43 11.7 44 TPMT*1/1
219499 4.7 32 3.2 32 4.0 32 9.6 48 9.3 46 9.5 47 TPMT*1/1
219500 4.4 32 3.4 34 3.9 33 15.9 53 15.8 51 15.9 52 TPMT*1/1
219501 2.3 42 2.9 35 2.6 39 14.5 57 14.9 63 14.7 60 TPMT*1/1
219502 5.1 51 3.5 48 4.3 50 12.4 51 11.7 51 12.1 51 TPMT*1/1
219503 4.0 29 2.9 32 3.5 31 9.9 50 9.4 49 9.7 50 TPMT*1/1
219504 2.1 23 1.6 20 1.9 22 6.6 27 6.8 29 6.7 28 TPMT*1/3
219505 7.0 45 3.4 27 5.2 36 7.8 43 7.2 38 7.5 41 TPMT*1/1
219470 9.6 29 15.6 40 12.6 35 11.1 47 11.8 48 11.5 48 TPMT*1/1
219471 7.7 26 8.0 31 7.9 29 10.3 40 11.0 42 10.7 41 TPMT*1/1
219472 5.1 19 9.0 24 7.1 22 6.2 31 7.5 36 6.9 34 TPMT*1/3
219473 12.9 38 15.8 49 14.4 44 13.6 53 14.3 54 14.0 54 TPMT*1/1
219474 5.9 17 9.9 25 7.9 21 6.9 30 6.9 30 6.9 30 TPMT*1/3
219475 10.7 32 20.8 67 15.8 50 12.8 61 13.2 61 13.0 61 TPMT*1/1
219506 5.6 19 9.0 32 7.3 26 7.7 40 8.0 40 7.9 40 TPMT*1/1
219507 6.1 20 10.2 33 8.2 27 9.5 55 9.4 54 9.5 55 TPMT*1/1
219508 6.4 23 10.0 35 8.2 29 8.6 45 8.4 44 8.5 45 TPMT*1/1
219509 8.1 32 12.3 50 10.2 41 11.2 56 10.1 53 10.7 55 TPMT*1/1
219510 5.7 18 9.2 32 7.5 25 9.7 44 9.2 44 9.5 44 TPMT*1/1
219511 9.1 29 12.3 41 10.7 35 10.4 46 9.8 43 10.1 45 TPMT*1/1

126
RBC Lysate 1 RBC Lysate 2 Mean RBC Lysate Whole Blood 1 Whole Blood 2 Mean WB
Sample Peak Ht. Activity Peak Ht. Activity Peak Ht. Activity Peak Ht. Activity Peak Ht. Activity Peak Ht. Activity Genotype
219512 7.6 33 11.1 37 9.4 35 11.6 51 11.1 49 11.4 50 TPMT*1/1
219513 9.0 34 10.8 40 9.9 37 14.2 52 14.4 53 14.3 53 TPMT*1/1
219518 6.1 23 8.3 28 7.2 26 8.3 35 8.1 36 8.2 36 TPMT*1/1
219519 17.5 69 19.7 66 18.6 68 13.4 74 12.3 68 12.9 71 TPMT*1/1
219520 9.4 30 9.1 30 9.3 30 10.2 47 9.3 46 9.8 47 TPMT*1/1
219521 7.5 28 10.9 33 9.2 31 9.6 44 9.2 42 9.4 43 TPMT*1/1
219522 12.2 41 13.6 43 12.9 42 13.8 56 14.7 54 14.3 55 TPMT*1/1
219523 7.9 33 14.7 34 11.3 34 13.2 48 13.2 47 13.2 48 TPMT*1/1
219524 18.4 70 18.3 59 18.4 65 18.0 91 20.4 94 19.2 93 TPMT*1/1
219515 10.4 24 11.7 27 11.1 26 5.7 37 7.2 36 6.5 37 TPMT*1/1
219516 16.1 52 * * 16.1 52 16.0 61 * * 16.0 61 TPMT*1/1
219517 10.4 26 8.9 38 9.7 32 8.9 38 10.6 45 9.8 42 TPMT*1/1
219525 5.8 16 8.3 19 7.1 18 5.5 23 6.4 26 6.0 25 TPMT*1/3
219527 13.0 31 13.6 34 13.3 33 9.4 40 9.0 37 9.2 39 TPMT*1/1
219528 14.2 65 21.2 65 17.7 65 16.0 73 17.0 72 16.5 73 TPMT*1/1
219529 6.6 21 9.4 25 8.0 23 11.9 55 12.3 52 12.1 54 TPMT*1/1
219530 8.7 27 11.0 33 9.9 30 9.3 46 10.2 47 9.8 47 TPMT*1/1
219531 4.6 13 5.1 15 4.9 14 5.3 22 5.8 22 5.6 22 TPMT*1/1
219532 13.4 43 15.1 46 14.3 45 10.9 60 11.6 58 11.3 59 TPMT*1/1
219533 8.4 26 10.1 30 9.3 28 8.8 39 9.3 39 9.1 39 TPMT*1/1
219534 9.8 31 15.5 42 12.7 37 11.0 58 12.6 63 11.8 61 TPMT*1/1
219535 11.8 31 12.4 35 12.1 33 14.0 51 15.1 52 14.6 52 TPMT*1/1
219536 5.3 25 8.0 30 6.7 28 12.4 51 14.2 58 13.3 55 TPMT*1/1
219537 9.7 31 12.5 40 11.1 36 10.4 67 12.0 66 11.2 67 TPMT*1/1
219538 12.1 43 17.8 53 15.0 48 12.4 68 12.9 68 12.7 68 TPMT*1/1
219539 15.8 45 19.1 58 17.5 52 14.7 65 15.7 64 15.2 65 TPMT*1/1
219540 17.4 46 * * 17.4 46 11.7 56 * * 11.7 56 TPMT*1/1
219541 12.4 40 16.9 50 14.7 45 13.7 66 13.0 62 13.4 64 TPMT*1/1
219542 15.4 56 14.0 48 14.7 52 14.1 55 15.1 66 14.6 61 TPMT*1/1
219543 16.8 58 18.1 51 17.5 55 12.3 61 11.9 62 12.1 62 TPMT*1/1
219544 7.7 24 9.6 28 8.7 26 13.9 44 13.5 45 13.7 45 TPMT*1/1

127
RBC Lysate 1 RBC Lysate 2 Mean RBC Lysate Whole Blood 1 Whole Blood 2 Mean WB
Sample Peak Ht. Activity Peak Ht. Activity Peak Ht. Activity Peak Ht. Activity Peak Ht. Activity Peak Ht. Activity Genotype
219545 7.9 24 8.0 30 8.0 27 8.8 36 8.5 36 8.7 36 TPMT*1/3
219546 10.8 52 8.0 33 9.4 43 10.8 42 10.8 48 10.8 45 TPMT*1/1
219547 9.1 29 13.1 38 11.1 34 12.4 52 11.8 52 12.1 52 TPMT*1/1
219548 7.6 30 11.3 30 9.5 30 11.4 42 11.3 44 11.4 43 TPMT*1/1
219549 12.8 38 14.2 42 13.5 40 14.1 55 14.2 56 14.2 56 TPMT*1/1
219550 11.4 34 11.9 34 11.7 34 12.3 45 11.7 44 12.0 45 TPMT*1/1
219551 7.0 28 7.5 32 7.3 30 10.8 40 10.7 42 10.8 41 TPMT*1/1
219552 10.6 28 11.6 36 11.1 32 11.8 52 11.5 51 11.7 52 TPMT*1/1
219553 5.8 16 7.0 20 6.4 18 7.5 27 8.0 29 7.8 28 TPMT*1/3
219554 10.7 29 9.9 38 10.3 34 15.1 69 16.9 60 16.0 65 TPMT*1/1
219555 6.6 21 7.8 28 7.2 25 10.6 47 10.3 47 10.5 47 TPMT*1/1
219556 15.9 50 22.2 53 19.1 52 17.0 69 16.8 71 16.9 70 TPMT*1/1
219557 5.2 36 14.5 39 9.9 38 10.3 54 10.0 52 10.2 53 TPMT*1/1
219558 9.5 33 7.5 27 8.5 30 10.6 45 10.3 45 10.5 45 TPMT*1/1
219559 15.9 42 11.2 33 13.6 38 15.3 56 16.1 55 15.7 56 TPMT*1/1
219560 13.4 38 15.6 42 14.5 40 14.9 59 16.0 61 15.5 60 TPMT*1/1
219561 11.6 35 10.1 32 10.9 34 8.8 57 9.2 53 9.0 55 TPMT*1/1
219562 8.1 28 8.9 30 8.5 29 9.8 47 10.3 54 10.1 51 TPMT*1/1
219563 11.9 31 14.0 28 13.0 30 14.9 55 15.8 54 15.4 55 TPMT*1/1
219565 10.4 34 13.4 33 11.9 34 10.6 42 9.1 39 9.9 41 TPMT*1/1
219567 13.7 38 15.6 40 14.7 39 13.6 53 14.0 53 13.8 53 TPMT*1/1
219568 19.3 66 14.2 68 16.8 67 15.5 81 15.3 99 15.4 90 TPMT*1/1
219569 15.5 41 15.6 39 15.6 40 13.2 52 14.1 53 13.7 53 TPMT*1/1
219570 12.8 45 5.7 57 9.3 51 8.7 60 10.0 61 9.4 61 TPMT*1/1
219571 8.9 33 * * 8.9 33 8.9 39 9.3 39 9.1 39 TPMT*1/1
219572 8.8 25 7.5 23 8.2 24 7.7 37 5.6 26 6.7 32 TPMT*1/1
219573 5.6 15 6.2 15 5.9 15 6.6 24 6.8 25 6.7 25 TPMT*1/2
219577 4.8 14 * * 4.8 14 6.3 22 6.7 22 6.5 22 TPMT*1/3
219578 15.0 50 14.4 50 14.7 50 13.1 85 13.4 82 13.3 84 TPMT*1/1
219579 11.2 32 13.9 35 12.6 34 11.4 48 12.3 48 11.9 48 TPMT*1/1
219580 11.9 35 13.3 37 12.6 36 12.6 50 13.6 52 13.1 51 TPMT*1/1

128
RBC Lysate 1 RBC Lysate 2 Mean RBC Lysate Whole Blood 1 Whole Blood 2 Mean WB
Sample Peak Ht. Activity Peak Ht. Activity Peak Ht. Activity Peak Ht. Activity Peak Ht. Activity Peak Ht. Activity Genotype
219581 13.5 51 10.5 52 12.0 52 13.1 53 16.4 60 14.8 57 TPMT*1/1
219582 15.3 41 15.6 42 15.5 42 18.1 59 19.6 58 18.9 59 TPMT*1/1
219583 12.7 36 13.3 35 13.0 36 15.3 58 15.3 50 15.3 54 TPMT*1/1
219584 9.8 31 5.6 34 7.7 33 10.7 44 12.3 47 11.5 46 TPMT*1/1
219687 8.1 25 7.0 25 7.6 25 9.7 44 9.7 44 9.7 44 TPMT*1/1
219688 10.5 29 12.9 34 11.7 32 10.3 49 11.1 49 10.7 49 TPMT*1/1
219689 14.7 29 12.7 32 13.7 31 9.7 41 10.3 40 10.0 41 TPMT*1/1
219690 10.3 31 12.1 32 11.2 32 10.7 44 11.6 44 11.2 44 TPMT*1/1
219691 11.0 31 * * 11.0 31 8.3 40 8.9 40 8.6 40 TPMT*1/1
219692 12.3 36 13.3 38 12.8 37 8.9 36 9.4 38 9.2 37 TPMT*1/1
219693 11.1 29 10.6 30 10.9 30 10.4 39 10.8 38 10.6 39 TPMT*1/1
219694 7.9 24 6.1 25 7.0 25 7.5 38 7.7 35 7.6 37 TPMT*1/1
219695 10.2 28 10.5 26 10.4 27 7.7 35 8.3 34 8.0 35 TPMT*1/1
219696 12.2 34 12.3 34 12.3 34 11.3 48 11.9 48 11.6 48 TPMT*1/1
219697 11.5 28 11.9 30 11.7 29 9.2 37 9.9 39 9.6 38 TPMT*1/1
219698 11.2 29 10.4 29 10.8 29 11.8 50 12.4 54 12.1 52 TPMT*1/1
219699 10.2 32 10.9 32 10.6 32 8.0 30 8.6 30 8.3 30 TPMT*1/1
219700 3.7 11 4.5 13 4.1 12 4.8 20 4.8 21 4.8 21 TPMT*1/3
219701 8.8 24 9.2 25 9.0 25 11.6 44 12.0 41 11.8 43 TPMT*1/1
219702 9.3 27 9.8 28 9.6 28 9.8 41 10.6 42 10.2 42 TPMT*1/1
219703 10.2 30 9.4 32 9.8 31 8.3 48 7.4 48 7.9 48 TPMT*1/1
219704 9.1 29 9.3 27 9.2 28 10.3 38 12.1 42 11.2 40 TPMT*1/1
219705 8.5 25 9.3 26 8.9 26 10.5 50 10.4 48 10.5 49 TPMT*1/1
219706 6.4 19 6.7 20 6.6 20 9.3 38 10.3 39 9.8 39 TPMT*1/1
219707 11.0 35 12.0 38 11.5 37 11.4 48 11.7 50 11.6 49 TPMT*1/1
219708 7.1 27 7.4 27 7.3 27 8.0 42 9.1 40 8.6 41 TPMT*1/1
219709 5.0 13 7.2 23 6.1 18 4.3 19 5.1 20 4.7 20 TPMT*1/3
219710 10.1 35 6.6 38 8.4 37 7.4 45 7.8 45 7.6 45 TPMT*1/1
219711 15.6 42 16.6 46 16.1 44 14.6 53 18.3 54 16.5 54 TPMT*1/1
219712 13.6 39 14.1 43 13.9 41 11.9 57 13.5 55 12.7 56 TPMT*1/1
219713 10.0 42 10.7 39 10.4 41 9.7 44 9.1 48 9.4 46 TPMT*1/1

129
RBC Lysate 1 RBC Lysate 2 Mean RBC Lysate Whole Blood 1 Whole Blood 2 Mean WB
Sample Peak Ht. Activity Peak Ht. Activity Peak Ht. Activity Peak Ht. Activity Peak Ht. Activity Peak Ht. Activity Genotype
219714 15.0 59 15.3 56 15.2 58 15.2 67 15.6 75 15.4 71 TPMT*1/1
219715 11.9 41 12.0 41 12.0 41 13.4 55 12.9 55 13.2 55 TPMT*1/1
219716 8.0 25 11.4 26 9.7 26 8.5 42 8.7 43 8.6 43 TPMT*1/1
219717 5.5 20 6.3 21 5.9 21 7.3 36 8.0 38 7.7 37 TPMT*1/1
219718 8.4 23 9.3 24 8.9 24 10.5 39 9.6 39 10.1 39 TPMT*1/1
219719 13.8 56 19.5 56 16.7 56 12.2 84 12.8 83 12.5 84 TPMT*1/1
219720 5.7 17 7.0 19 6.4 18 5.6 21 6.1 21 5.9 21 TPMT*1/3
219721 11.7 35 12.1 34 11.9 35 11.7 43 11.0 45 11.4 44 TPMT*1/1
219722 5.3 25 9.3 27 7.3 26 9.5 37 10.2 37 9.9 37 TPMT*1/1
219723 11.7 33 12.3 33 12.0 33 11.3 46 12.2 48 11.8 47 TPMT*1/1
219724 9.3 29 9.3 29 9.3 29 8.3 40 8.4 40 8.4 40 TPMT*1/1
219725 12.5 43 12.1 43 12.3 43 13.6 53 14.7 54 14.2 54 TPMT*1/1
219726 7.5 26 10.1 25 8.8 26 8.9 43 8.5 37 8.7 40 TPMT*1/1
219727 9.8 33 12.1 35 11.0 34 12.5 55 13.7 56 13.1 56 TPMT*1/1
219728 4.9 15 6.0 15 5.5 15 4.8 23 4.9 22 4.9 23 TPMT*1/3
219729 10.7 36 9.9 39 10.3 38 10.3 47 11.7 44 11.0 46 TPMT*1/1
219730 14.5 39 16.6 42 15.6 41 11.8 52 12.4 49 12.1 51 TPMT*1/1
219731 10.3 28 12.7 30 11.5 29 10.2 42 10.7 42 10.5 42 TPMT*1/1
219732 10.9 33 8.2 25 9.6 29 11.9 59 12.8 52 12.4 56 TPMT*1/1
219733 10.9 29 12.3 31 11.6 30 10.2 42 11.1 42 10.7 42 TPMT*1/1
219734 11.8 36 12.1 33 12.0 35 11.4 50 12.2 50 11.8 50 TPMT*1/1
219735 7.7 24 7.0 24 7.4 24 7.1 34 7.1 34 7.1 34 TPMT*1/1
219736 8.1 29 7.8 29 8.0 29 6.9 45 7.5 43 7.2 44 TPMT*1/1
219738 10.1 31 12.1 33 11.1 32 9.3 43 9.8 41 9.6 42 TPMT*1/1
219737 7.8 50 10.7 56 9.3 53 14.3 66 14.1 70 14.2 68 TPMT*1/1
219739 8.0 46 9.6 46 8.8 46 12.3 59 13.2 63 12.8 61 TPMT*1/1
219740 4.3 43 6.2 36 5.3 40 9.0 50 9.4 49 9.2 50 TPMT*1/1
219741 4.4 48 5.6 44 5.0 46 12.2 52 11.9 48 12.1 50 TPMT*1/1
219743 3.9 43 4.2 39 4.1 41 10.8 50 10.6 47 10.7 49 TPMT*1/1
219744 16.1 52 16.8 58 16.5 55 16.8 64 18.0 66 17.4 65 TPMT*1/1

130
RBC Lysate 1 RBC Lysate 2 Mean RBC Lysate Whole Blood 1 Whole Blood 2 Mean WB
Sample Peak Ht. Activity Peak Ht. Activity Peak Ht. Activity Peak Ht. Activity Peak Ht. Activity Peak Ht. Activity Genotype
219745 11.2 49 7.1 60 9.2 55 13.8 72 14.4 72 14.1 72 TPMT*1/1
219746 10.5 41 10.8 44 10.7 43 9.1 56 10.6 65 9.9 61 TPMT*1/1
219747 12.7 42 12.3 45 12.5 44 13.1 53 12.1 56 12.6 55 TPMT*1/1
219748 9.4 45 11.3 44 10.4 45 10.0 58 10.7 59 10.4 59 TPMT*1/1
219749 4.8 23 4.9 20 4.9 22 7.4 41 7.2 38 7.3 40 TPMT*1/3
219750 9.0 47 12.3 45 10.7 46 17.4 74 18.5 73 18.0 74 TPMT*1/1
219752 13.4 48 13.0 48 13.2 48 10.9 52 11.7 56 11.3 54 TPMT*1/1
219753 12.9 46 15.1 55 14.0 51 13.8 63 12.3 59 13.1 61 TPMT*1/1
219754 9.0 66 10.4 60 9.7 63 14.6 64 17.1 70 15.9 67 TPMT*1/1
219755 10.8 48 10.1 50 10.5 49 13.9 53 14.0 57 14.0 55 TPMT*1/1
219756 9.5 39 8.7 43 9.1 41 12.6 53 14.0 59 13.3 56 TPMT*1/1
219757 7.2 27 * * 7.2 27 10.3 42 10.7 51 10.5 47 TPMT*1/1
219759 1.2 4 1.3 4.9 1.3 4 1.6 7.7 1.3 5.9 1.5 7 TPMT*3/3
219760 8.0 28 5.4 33 6.7 31 9.7 44 11.3 46 10.5 45 TPMT*1/1
219761 8.5 31 9.0 33 8.8 32 10.4 44 11.2 44 10.8 44 TPMT*1/1
219762 8.7 34 11.2 37 10.0 36 10.8 48 14.7 60 12.8 54 TPMT*1/1
219763 10.3 49 12.0 48 11.2 49 10.4 60 13.0 55 11.7 58 TPMT*1/1
219764 10.2 36 10.6 42 10.4 39 12.3 52 12.3 50 12.3 51 TPMT*1/1
219765 10.3 45 6.3 53 8.3 49 14.5 59 15.9 58 15.2 59 TPMT*1/1
219922 9.2 56 9.6 59 9.4 58 11.9 57 13.8 58 12.9 58 TPMT*1/1
219925 0.0 0 0.0 0 0.0 0 0.0 0 0.0 0 0.0 0 TPMT*3/3
219926 9.3 33 10.8 33 10.1 33 9.3 43 9.5 44 9.4 44 TPMT*1/1
219927 11.0 34 12.8 39 11.9 37 10.1 40 10.8 44 10.5 42 TPMT*1/1
219928 20.8 67 21.2 67 21.0 67 13.9 80 13.9 85 13.9 83 TPMT*1/1
219929 11.0 42 11.4 36 11.2 39 11.3 48 12.5 51 11.9 50 TPMT*1/1
219930 20.9 62 21.7 68 21.3 65 13.5 57 13.6 62 13.6 60 TPMT*1/1
219931 12.4 40 13.6 40 13.0 40 11.4 45 11.6 49 11.5 47 TPMT*1/1
219932 13.3 38 10.5 40 11.9 39 13.3 56 13.0 49 13.2 53 TPMT*1/1
219933 12.5 38 11.1 41 11.8 40 12.2 52 13.5 62 12.9 57 TPMT*1/1
219934 8.2 50 12.5 53 10.4 52 10.9 57 11.2 65 11.1 61 TPMT*1/1
219935 11.1 39 11.1 37 11.1 38 11.8 50 11.3 48 11.6 49 TPMT*1/1
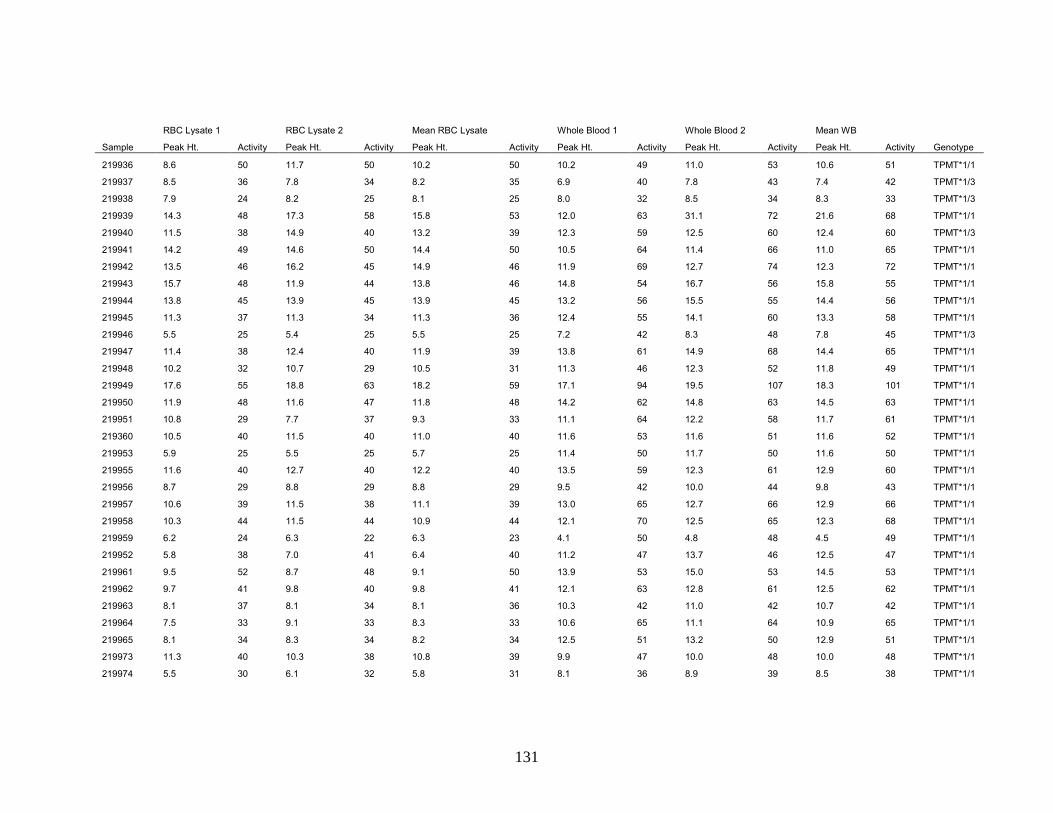
131
RBC Lysate 1 RBC Lysate 2 Mean RBC Lysate Whole Blood 1 Whole Blood 2 Mean WB
Sample Peak Ht. Activity Peak Ht. Activity Peak Ht. Activity Peak Ht. Activity Peak Ht. Activity Peak Ht. Activity Genotype
219936 8.6 50 11.7 50 10.2 50 10.2 49 11.0 53 10.6 51 TPMT*1/1
219937 8.5 36 7.8 34 8.2 35 6.9 40 7.8 43 7.4 42 TPMT*1/3
219938 7.9 24 8.2 25 8.1 25 8.0 32 8.5 34 8.3 33 TPMT*1/3
219939 14.3 48 17.3 58 15.8 53 12.0 63 31.1 72 21.6 68 TPMT*1/1
219940 11.5 38 14.9 40 13.2 39 12.3 59 12.5 60 12.4 60 TPMT*1/3
219941 14.2 49 14.6 50 14.4 50 10.5 64 11.4 66 11.0 65 TPMT*1/1
219942 13.5 46 16.2 45 14.9 46 11.9 69 12.7 74 12.3 72 TPMT*1/1
219943 15.7 48 11.9 44 13.8 46 14.8 54 16.7 56 15.8 55 TPMT*1/1
219944 13.8 45 13.9 45 13.9 45 13.2 56 15.5 55 14.4 56 TPMT*1/1
219945 11.3 37 11.3 34 11.3 36 12.4 55 14.1 60 13.3 58 TPMT*1/1
219946 5.5 25 5.4 25 5.5 25 7.2 42 8.3 48 7.8 45 TPMT*1/3
219947 11.4 38 12.4 40 11.9 39 13.8 61 14.9 68 14.4 65 TPMT*1/1
219948 10.2 32 10.7 29 10.5 31 11.3 46 12.3 52 11.8 49 TPMT*1/1
219949 17.6 55 18.8 63 18.2 59 17.1 94 19.5 107 18.3 101 TPMT*1/1
219950 11.9 48 11.6 47 11.8 48 14.2 62 14.8 63 14.5 63 TPMT*1/1
219951 10.8 29 7.7 37 9.3 33 11.1 64 12.2 58 11.7 61 TPMT*1/1
219360 10.5 40 11.5 40 11.0 40 11.6 53 11.6 51 11.6 52 TPMT*1/1
219953 5.9 25 5.5 25 5.7 25 11.4 50 11.7 50 11.6 50 TPMT*1/1
219955 11.6 40 12.7 40 12.2 40 13.5 59 12.3 61 12.9 60 TPMT*1/1
219956 8.7 29 8.8 29 8.8 29 9.5 42 10.0 44 9.8 43 TPMT*1/1
219957 10.6 39 11.5 38 11.1 39 13.0 65 12.7 66 12.9 66 TPMT*1/1
219958 10.3 44 11.5 44 10.9 44 12.1 70 12.5 65 12.3 68 TPMT*1/1
219959 6.2 24 6.3 22 6.3 23 4.1 50 4.8 48 4.5 49 TPMT*1/1
219952 5.8 38 7.0 41 6.4 40 11.2 47 13.7 46 12.5 47 TPMT*1/1
219961 9.5 52 8.7 48 9.1 50 13.9 53 15.0 53 14.5 53 TPMT*1/1
219962 9.7 41 9.8 40 9.8 41 12.1 63 12.8 61 12.5 62 TPMT*1/1
219963 8.1 37 8.1 34 8.1 36 10.3 42 11.0 42 10.7 42 TPMT*1/1
219964 7.5 33 9.1 33 8.3 33 10.6 65 11.1 64 10.9 65 TPMT*1/1
219965 8.1 34 8.3 34 8.2 34 12.5 51 13.2 50 12.9 51 TPMT*1/1
219973 11.3 40 10.3 38 10.8 39 9.9 47 10.0 48 10.0 48 TPMT*1/1
219974 5.5 30 6.1 32 5.8 31 8.1 36 8.9 39 8.5 38 TPMT*1/1

132
RBC Lysate 1 RBC Lysate 2 Mean RBC Lysate Whole Blood 1 Whole Blood 2 Mean WB
Sample Peak Ht. Activity Peak Ht. Activity Peak Ht. Activity Peak Ht. Activity Peak Ht. Activity Peak Ht. Activity Genotype
219975 8.2 31 8.5 35 8.4 33 12.0 49 12.5 62 12.3 56 TPMT*1/1
219976 5.6 39 5.0 37 5.3 38 14.3 63 15.2 64 14.8 64 TPMT*1/1
219977 11.7 54 14.0 53 12.9 54 13.6 68 15.4 74 14.5 71 TPMT*1/1
219978 6.6 38 8.4 37 7.5 38 11.4 48 12.1 49 11.8 49 TPMT*1/1
219979 5.0 42 7.1 46 6.1 44 13.3 56 13.8 58 13.6 57 TPMT*1/1
219980 3.3 33 5.2 34 4.3 34 11.4 52 11.7 51 11.6 52 TPMT*1/1
219981 3.7 34 8.6 31 6.2 33 7.3 47 7.6 46 7.5 47 TPMT*1/1
219960 2.9 15 3.6 16 3.3 16 5.3 21 5.3 21 5.3 21 TPMT*1/3
219971 11.1 41 11.5 42 11.3 42 13.6 53 12.5 51 13.1 52 TPMT*1/1
219966 9.6 38 10.6 38 10.1 38 9.6 75 10.4 76 10.0 76 TPMT*1/1
219968 5.8 32 7.6 33 6.7 33 11.2 44 12.4 52 11.8 48 TPMT*1/1
219969 9.8 40 7.2 40 8.5 40 10.5 44 11.6 51 11.1 48 TPMT*1/1
219982 7.6 31 8.7 31 8.2 31 10.8 38 11.6 40 11.2 39 TPMT*1/1
219983 9.5 28 7.6 28 8.6 28 9.4 41 9.7 43 9.6 42 TPMT*1/1
219984 5.3 25 7.2 28 6.3 27 13.9 42 15.3 47 14.6 45 TPMT*1/1
219985 3.8 14 4.7 16 4.3 15 5.2 21 5.9 24 5.6 23 TPMT*1/3
219986 4.1 15 4.8 17 4.5 16 5.9 22 5.8 21 5.9 22 TPMT*1/3
219987 4.5 18 5.4 17 5.0 18 7.4 26 7.7 26 7.6 26 TPMT*1/3
219988 5.8 30 8.8 35 7.3 33 11.4 46 11.5 45 11.5 46 TPMT*1/1
219989 8.6 31 8.6 32 8.6 32 8.1 45 8.9 49 8.5 47 TPMT*1/1
219990 4.2 17 4.6 17 4.4 17 8.2 28 8.5 29 8.4 29 TPMT*1/3
219991 6.4 24 6.6 27 6.5 26 12.2 67 13.1 72 12.7 70 TPMT*1/1
219992 8.8 32 9.1 33 9.0 33 12.4 52 13.0 55 12.7 54 TPMT*1/1
219993 7.8 32 8.2 32 8.0 32 9.5 50 11.9 50 10.7 50 TPMT*1/1
219994 7.3 27 4.6 23 6.0 25 8.5 42 8.9 44 8.7 43 TPMT*1/1
219995 13.0 43 15.7 44 14.4 44 13.5 59 11.9 59 12.7 59 TPMT*1/1
219996 14.7 43 8.7 46 11.7 45 13.0 55 12.1 53 12.6 54 TPMT*1/1
219997 6.1 21 6.6 19 6.4 20 6.3 26 6.4 28 6.4 27 TPMT*1/3
219998 11.5 38 15.3 41 13.4 40 14.5 47 14.0 48 14.3 48 TPMT*1/1
219999 15.9 46 14.8 43 15.4 45 13.3 50 12.6 51 13.0 51 TPMT*1/1
210000 13.4 41 17.9 50 15.7 46 15.8 58 15.3 58 15.6 58 TPMT*1/1
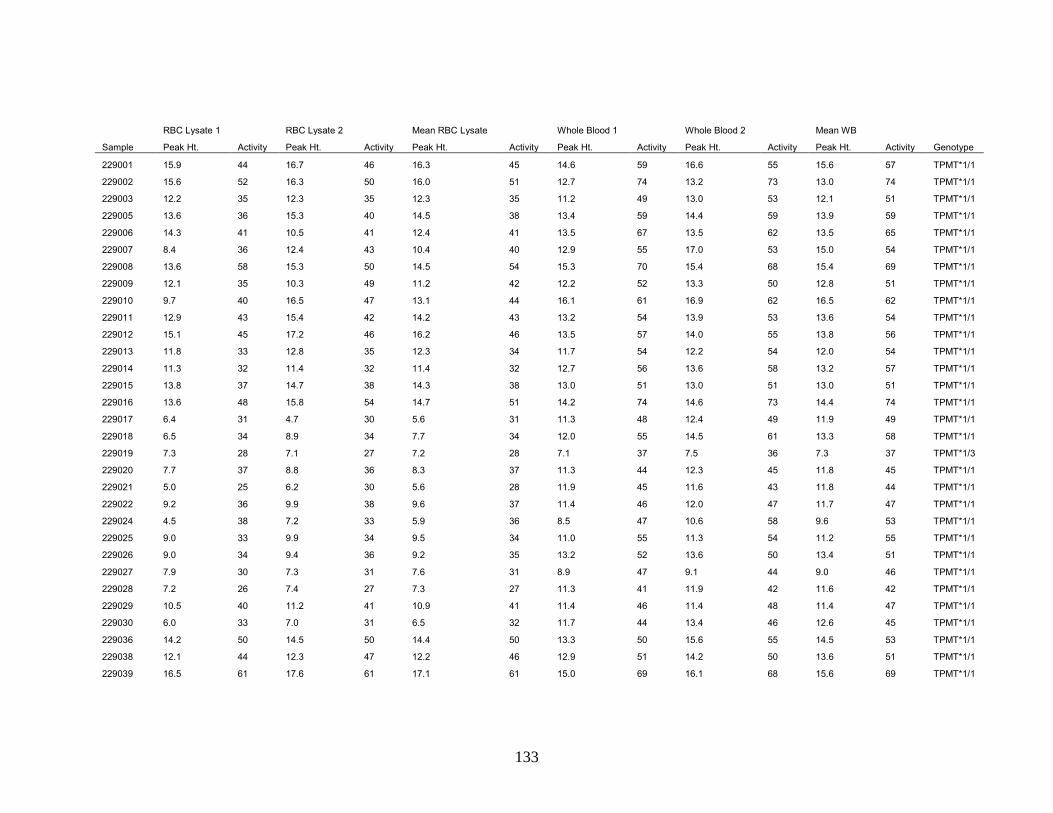
133
RBC Lysate 1 RBC Lysate 2 Mean RBC Lysate Whole Blood 1 Whole Blood 2 Mean WB
Sample Peak Ht. Activity Peak Ht. Activity Peak Ht. Activity Peak Ht. Activity Peak Ht. Activity Peak Ht. Activity Genotype
229001 15.9 44 16.7 46 16.3 45 14.6 59 16.6 55 15.6 57 TPMT*1/1
229002 15.6 52 16.3 50 16.0 51 12.7 74 13.2 73 13.0 74 TPMT*1/1
229003 12.2 35 12.3 35 12.3 35 11.2 49 13.0 53 12.1 51 TPMT*1/1
229005 13.6 36 15.3 40 14.5 38 13.4 59 14.4 59 13.9 59 TPMT*1/1
229006 14.3 41 10.5 41 12.4 41 13.5 67 13.5 62 13.5 65 TPMT*1/1
229007 8.4 36 12.4 43 10.4 40 12.9 55 17.0 53 15.0 54 TPMT*1/1
229008 13.6 58 15.3 50 14.5 54 15.3 70 15.4 68 15.4 69 TPMT*1/1
229009 12.1 35 10.3 49 11.2 42 12.2 52 13.3 50 12.8 51 TPMT*1/1
229010 9.7 40 16.5 47 13.1 44 16.1 61 16.9 62 16.5 62 TPMT*1/1
229011 12.9 43 15.4 42 14.2 43 13.2 54 13.9 53 13.6 54 TPMT*1/1
229012 15.1 45 17.2 46 16.2 46 13.5 57 14.0 55 13.8 56 TPMT*1/1
229013 11.8 33 12.8 35 12.3 34 11.7 54 12.2 54 12.0 54 TPMT*1/1
229014 11.3 32 11.4 32 11.4 32 12.7 56 13.6 58 13.2 57 TPMT*1/1
229015 13.8 37 14.7 38 14.3 38 13.0 51 13.0 51 13.0 51 TPMT*1/1
229016 13.6 48 15.8 54 14.7 51 14.2 74 14.6 73 14.4 74 TPMT*1/1
229017 6.4 31 4.7 30 5.6 31 11.3 48 12.4 49 11.9 49 TPMT*1/1
229018 6.5 34 8.9 34 7.7 34 12.0 55 14.5 61 13.3 58 TPMT*1/1
229019 7.3 28 7.1 27 7.2 28 7.1 37 7.5 36 7.3 37 TPMT*1/3
229020 7.7 37 8.8 36 8.3 37 11.3 44 12.3 45 11.8 45 TPMT*1/1
229021 5.0 25 6.2 30 5.6 28 11.9 45 11.6 43 11.8 44 TPMT*1/1
229022 9.2 36 9.9 38 9.6 37 11.4 46 12.0 47 11.7 47 TPMT*1/1
229024 4.5 38 7.2 33 5.9 36 8.5 47 10.6 58 9.6 53 TPMT*1/1
229025 9.0 33 9.9 34 9.5 34 11.0 55 11.3 54 11.2 55 TPMT*1/1
229026 9.0 34 9.4 36 9.2 35 13.2 52 13.6 50 13.4 51 TPMT*1/1
229027 7.9 30 7.3 31 7.6 31 8.9 47 9.1 44 9.0 46 TPMT*1/1
229028 7.2 26 7.4 27 7.3 27 11.3 41 11.9 42 11.6 42 TPMT*1/1
229029 10.5 40 11.2 41 10.9 41 11.4 46 11.4 48 11.4 47 TPMT*1/1
229030 6.0 33 7.0 31 6.5 32 11.7 44 13.4 46 12.6 45 TPMT*1/1
229036 14.2 50 14.5 50 14.4 50 13.3 50 15.6 55 14.5 53 TPMT*1/1
229038 12.1 44 12.3 47 12.2 46 12.9 51 14.2 50 13.6 51 TPMT*1/1
229039 16.5 61 17.6 61 17.1 61 15.0 69 16.1 68 15.6 69 TPMT*1/1

134
RBC Lysate 1 RBC Lysate 2 Mean RBC Lysate Whole Blood 1 Whole Blood 2 Mean WB
Sample Peak Ht. Activity Peak Ht. Activity Peak Ht. Activity Peak Ht. Activity Peak Ht. Activity Peak Ht. Activity Genotype
229040 8.5 42 13.9 42 11.2 42 12.6 53 13.0 49 12.8 51 TPMT*1/1
229041 4.8 29 6.3 30 5.6 30 10.9 50 10.5 44 10.7 47 TPMT*1/1
229042 11.2 32 13.5 34 12.4 33 11.2 47 11.3 48 11.3 48 TPMT*1/1
229043 10.0 32 9.5 32 9.8 32 6.7 37 6.8 34 6.8 36 TPMT*1/3
229044 11.9 31 12.8 34 12.4 33 10.1 38 11.2 42 10.7 40 TPMT*1/1
229045 14.0 44 15.1 40 14.6 42 13.6 55 13.7 54 13.7 55 TPMT*1/1
229046 10.1 25 11.2 26 10.7 26 10.5 46 11.0 45 10.8 46 TPMT*1/1
229047 11.2 40 12.6 42 11.9 41 10.4 60 10.8 59 10.6 60 TPMT*1/1
229048 8.0 28 11.6 39 9.8 34 12.4 47 13.3 47 12.9 47 TPMT*1/1
229049 5.2 25 6.1 22 5.7 24 6.7 31 6.7 29 6.7 30 TPMT*1/1
229050 15.7 47 18.0 51 16.9 49 13.7 75 12.5 76 13.1 76 TPMT*1/1
229051 11.2 32 13.0 38 12.1 35 11.1 53 18.1 42 14.6 48 TPMT*1/1
229052 8.1 25 9.2 26 8.7 26 9.6 56 10.2 59 9.9 58 TPMT*1/1
229053 8.0 26 10.5 32 9.3 29 11.9 48 10.9 43 11.4 46 TPMT*1/1
229054 3.6 13 5.8 18 4.7 16 5.2 20 4.6 22 4.9 21 TPMT*1/2
229055 11.1 39 10.8 35 11.0 37 9.0 50 9.4 49 9.2 50 TPMT*1/1
229031 11.0 38 11.8 38 11.4 38 11.0 50 10.5 48 10.8 49 TPMT*1/1
229033 10.4 41 10.9 40 10.7 41 12.6 48 10.3 47 11.5 48 TPMT*1/1
229034 5.7 26 6.2 27 6.0 27 10.0 48 9.2 51 9.6 50 TPMT*1/1
229035 11.3 44 12.6 43 12.0 44 13.1 53 8.7 53 10.9 53 TPMT*1/1
229056 9.0 38 12.0 38 10.5 38 9.2 51 4.0 49 6.6 50 TPMT*1/1
229057 6.7 29 7.3 28 7.0 29 10.2 51 11.2 51 10.7 51 TPMT*1/1
229058 9.7 43 8.4 42 9.1 43 11.7 58 12.0 53 11.9 56 TPMT*1/1
229059 3.9 21 9.2 39 6.6 30 11.7 51 12.3 50 12.0 51 TPMT*1/1
229060 5.4 20 4.7 18 5.1 19 4.0 22 4.3 24 4.2 23 TPMT*1/3
229061 4.8 16 4.9 15 4.9 16 6.2 25 6.7 29 6.5 27 TPMT*1/3
229062 5.0 15 5.0 17 5.0 16 5.4 28 5.3 29 5.4 29 TPMT*1/2
229063 10.2 36 9.2 35 9.7 36 10.1 53 10.6 58 10.4 56 TPMT*1/1
229064 9.9 36 5.8 34 7.9 35 9.6 46 69.0 40 39.3 43 TPMT*1/1
229065 10.6 38 11.6 39 11.1 39 12.7 58 12.7 63 12.7 61 TPMT*1/1
229066 29.5 83 32.4 81 31.0 82 19.4 101 18.6 102 19.0 102 TPMT*1/1

135
RBC Lysate 1 RBC Lysate 2 Mean RBC Lysate Whole Blood 1 Whole Blood 2 Mean WB
Sample Peak Ht. Activity Peak Ht. Activity Peak Ht. Activity Peak Ht. Activity Peak Ht. Activity Peak Ht. Activity Genotype
229067 13.9 40 15.9 43 14.9 42 21.4 67 21.8 69 21.6 68 TPMT*1/1
229068 16.1 45 15.6 48 15.9 47 13.8 61 13.4 61 13.6 61 TPMT*1/1
229069 13.0 38 13.4 35 13.2 37 12.0 60 12.7 66 12.4 63 TPMT*1/1
229070 13.2 44 15.9 45 14.6 45 16.2 59 15.3 60 15.8 60 TPMT*1/1
229071 5.8 49 9.3 49 7.6 49 16.2 61 16.0 61 16.1 61 TPMT*1/1
229072 8.0 28 11.8 35 9.9 32 17.6 61 17.3 61 17.5 61 TPMT*1/1
229073 13.8 41 14.0 41 13.9 41 12.8 59 12.9 62 12.9 61 TPMT*1/1
229074 13.3 39 13.4 40 13.4 40 11.7 50 8.6 59 10.2 55 TPMT*1/1
229076 17.4 48 12.8 49 15.1 49 18.5 70 18.0 71 18.3 71 TPMT*1/1
229077 12.6 42 13.1 44 12.9 43 16.1 61 11.8 65 14.0 63 TPMT*1/1
229078 14.7 40 14.3 41 14.5 41 11.6 61 11.3 62 11.5 62 TPMT*1/1
229079 6.2 30 9.4 29 7.8 30 10.3 47 10.6 51 10.5 49 TPMT*1/1
229080 10.8 34 11.6 38 11.2 36 13.6 60 13.0 62 13.3 61 TPMT*1/1
229081 13.3 56 11.3 56 12.3 56 19.5 65 18.9 69 19.2 67 TPMT*1/1
229082 13.8 39 15.9 42 14.9 41 14.0 57 13.5 57 13.8 57 TPMT*1/1
229083 5.7 39 13.0 38 9.4 39 16.0 53 14.8 51 15.4 52 TPMT*1/1
229084 13.2 45 15.9 43 14.6 44 15.6 57 15.5 61 15.6 59 TPMT*1/1
229086 19.2 62 21.6 61 20.4 62 17.3 73 16.9 69 17.1 71 TPMT*1/1
229087 14.6 46 13.4 42 14.0 44 15.0 66 15.7 72 15.4 69 TPMT*1/1
229088 9.2 28 10.0 28 9.6 28 9.1 39 8.4 37 8.8 38 TPMT*1/3
229089 15.3 50 16.4 49 15.9 50 20.1 74 18.6 71 19.4 73 TPMT*1/1
229090 13.6 50 16.3 45 15.0 48 16.2 59 15.9 65 16.1 62 TPMT*1/1
229091 16.0 48 16.1 47 16.1 48 17.6 81 17.5 77 17.6 79 TPMT*1/1
229094 14.2 56 15.2 54 14.7 55 17.0 72 16.3 72 16.7 72 TPMT*1/1
229095 18.0 57 17.4 53 17.7 55 14.7 67 14.3 68 14.5 68 TPMT*1/1
229096 14.5 46 16.0 45 15.3 46 16.6 65 15.6 64 16.1 65 TPMT*1/1
229097 23.0 63 24.2 61 23.6 62 18.5 73 17.3 70 17.9 72 TPMT*1/1
229098 16.3 45 19.7 46 18.0 46 13.4 61 13.4 61 13.4 61 TPMT*1/1
229099 18.0 52 19.1 51 18.6 52 17.2 79 16.5 83 16.9 81 TPMT*1/1
229100 21.9 67 21.8 63 21.9 65 16.5 73 16.8 74 16.7 74 TPMT*1/1
229101 13.6 38 13.6 36 13.6 37 15.6 64 14.7 62 15.2 63 TPMT*1/1

Appendix 3
Whole-blood thiopurine S-methyltransferase activity with genotype concordance: a new, simplified phenotyping assay Loretta Ford, Valerie Graham and Jonathan Berg http://acb.rsmjournals.com/cgi/content/abstract/43/5/354

Appendix 4 A Poster A simplified assay for determination of red blood cell 6-thioguanine nucleotides; early evidence suggestions UK patients are receiving sub-optimal doses of thiopurine drugs V Graham, Dr L T Ford, Dr J Berg Department of Clinical Biochemistry, City Hospital, Birmingham, B18 7QH

Improving a test that has a growing clinical demand; blood 6TGN and
it's role in pharmacogenomics
Valerie Graham, Dr. Jonathan Berg
Department of Clinical Biochemistry, City Hospital, Birmingham B18 7QH
Sandwell and West Birmingham Hospitals
NHS Trust NHS
Introduction
Pharmacogenetics links differences in gene expression
to drug response. Advances in this field are helping to
predict drug efficacy and toxicity. These developments
have major medical benefits as they aid optimisation of
drug dosage.
Currently, the measurement of thiopurine methyl
transferase (TPMT) is the best clinically applied example
of pharmacogenetics. This enzyme is involved in the
metabolism of the widely used Thiopurine drugs. The
quantitative determination of the active metabolites of
these drugs, the 6-thioguanine nucleotides (6TGN),
helps monitor a patient's response to treatment.
6TGN monitoring has not yet become routine practice in
the UK, in part because methods have involved time
consuming washed cell preparations, as conventionally
6TGN has been estimated in erythrocytes.
Results
Our new whole blood method results were compared
to those from conventional RBC analysis in 70 patient
samples.
Method
We have improved our method for 6TGN, estimating
metabolite levels in whole blood rather than washed
cells, making it more suitable for routine clinical use. The
method liberates 6TGN from red blood cells (RBC).
Perchloric acid at 95ºC hydrolyses the nucleotides back
to their parent thiopurine, 6-thioguanine (6TG) which is
measured by HPLC.
0.0 2.5 5.0 7.5 10.0 12.5min
6TG
Internal Standard
Example of
Chromatography
Red Blood Cell 6TGN (pmol/8x10e8 rbc)
Whole
Blo
od 6
TG
N (
pm
ol/8x10e8 r
bc)
7006005004003002001000
700
600
500
400
300
200
100
0
Red Blood Cell / Whole Blood 6TGN Comparison
R = 0.978
Conclusions
Our whole blood 6-TGN method shows excellent
correlation between whole blood and washed RBC.
The whole blood assay is less labour intensive and
cell counting and pipetting errors are minimised. The
sample volume required is also reduced. This quick,
cost effective, simplified assay is now being
introduced into routine clinical use.
This quantification will allow more confident
escalation of dose in non-responders and dose
reduction for those with high, potentially harmful,
6TGN concentrations. It will be particularly useful in
assessing patients heterozygous for TPMT activity,
who receive a reduced dose and for which achieving
therapeutic levels can be problematic.
Appendix 5

144
Appendix 6
Patients with high-normal TPMT activity identified during routine phenotypic
testing: What is going on?
L T Ford, V Graham, J D Berg (Focus 2006 Poster)
Department of Clinical Biochemistry, City Hospital, Birmingham B18 7QH
In addition to individuals with undetectable and low TPMT activity at risk of adverse
reactions to thiopurine drug treatment, there is also evidence of a group of patients with
very high TPMT activity. These patients may not respond to standard doses of thiopurine
drugs, and are at risk of hepatotoxicity from increased production of methylated-thiopurine
metabolites and it is important to be able to identify this patient group. Approximately 2%
of the patient samples sent to our TPMT phenotyping service have very high TPMT
activity defined as greater than 60 nmol/gHb/hour. To determine if there is a pre-analytical
cause in 2005 we sent out audit forms with all high TPMT activity results and received 42
returns.The mean patient age was 46 years and there were an equal number of males
and females. The mean TPMT activity was 71 nmol/gHb/hour (range 60-92
nmol/gHb/hour). The mean patient haemoglobin concentration at the time of analysis was
10.5 g/dL (range 7-14 g/dL). Prior to measuring TPMT activity a red blood cell lysate is
prepared. The haemoglobin concentration of this lysate is used to determine the
concentration of TPMT enzyme present, and could result in over-estimation of TPMT
activity. However, no correlation was found between haemoglobin concentration and
TPMT activity. On average patients were receiving 5 different drugs at the time of testing,
one patient was on 12 different drugs. The most common drug treatment was
prednisolone with 79% of patients receiving therapy of between 10-100 mg
od daily. No correlation was found between prednisolone dose and TPMT activity.
Thiopurine drug treatment can itself induce TPMT activity but only 5 patients were
receiving azathioprine at the time of testing. We could identify no pre-analytical factors
responsible for the high TPMT activity measured in some patientsamples using TPMT
phenotyping.

145
Appendix 7
Routine thiopurine drug monitoring by rapid determination of whole blood
metabolite levels
V Graham, L Ford, J Berg (2008) Focus Poster
Department of Clinical Biochemistry, City Hospital, Birmingham B18 7QH
Thiopurine drugs are widely used to treat auto-immune disease.Quantitative
determination of the thiopurine active metabolites, 6-thioguanine nucleotides (6TGN), can
guide treatment, increasing drug efficacy and reducing likelihood of side effects.
Monitoring is particularly useful for individuals heterozygous for TPMT, who usually
require a lower than normal dose to achieve therapeutic levels. Despite the potential
benefits of 6TGN monitoring, it has not yet become an established test. Complex
methods involving time consuming manufacture of washed cell preparations have clearly
not been easy to apply in the routine laboratory.
Method: We have compared levels of 6TGN in both wholeblood and washed red blood
cells after conversion of thiopurine metabolites back to 6TGN. The lystate method starts
by preparing washed RBC. The whole blood assay does not
undertake this preparative step. The 6TGNs are hydrolysed to 6-thioguanine (6TG) by
incubation with perchloric acid and dithiothretiol at 95°C for 1 hour. The concentration of
6TG is then measured using isocratic HPLC with UV detection at 304 nm.
Results: A comparison was made between the conventional washed red blood cell
method and the new whole blood method. Results from whole blood were significantly
higher than lysate preparations with a Mann Whitney U Test giving p=0.61. Regression
analysis for patient samples prepared by the two methods gave the regression line:
Whole Blood TGN = 16.4 + Lysate TGN x 0.977. Conclusion: The whole blood procedure
is much less labour intensive and errors in cell counting and pipetting are also minimised.
Our whole blood approach offers a simplified assay, which is quick and cost effective
making it suitable for routine clinical use. Whole blood results are slightly higher but as
application of the 6TGN assay has been limited, establishing reference intervals for the
whole blood assay would be ideal at this stage.

146
Appendix 8 6TGN / Mean cell volume correlation data
6TGN
Therapeutic range
235-450 pmol
6TG/8x108 rbc
MCV
Normal range
77-99 fl
6TGN
Therapeutic range
235-450 pmol
6TG/8x108 rbc
MCV
Normal range
77-99 fl
<50 83.0 335 107.0
<50 94.5 336 92.8
<50 107.5 339 108.7
<50 99.1 357 96.8
<50 91.6 408 112.6
97 100.6 432 99.4
109 107.7 436 85.2
115 67.0 460 98.8
116 91.4 472 103.8
132 102.1 479 106.2
147 88.5 481 90.4
147 107.1 482 101.7
157 92.1 483 88.0
161 105.7 485 107.2
174 98.4 501 81.6
178 76.2 508 78.3
186 93.2 508 113.0
186 114.2 513 111.8
191 101.9 541 90.0
197 107.0 567 108.8
210 96.9 581 104.9
215 110.2 581 89.6
217 102.7 620 121.0
230 115.7 620 111.8
261 99.4 665 79.8
282 82.9 672 89.5
292 109.2 705 102.6
297 113.4 789 110.3
302 109.8 802 109.0
304 103.0 888 123.6
312 87.7 911 113.1
325 103.3 1043 90.0
327 113.3 1116 101.0
327 113.4

147
10. REFERENCES
1. Alves S, Prata MJ, Ferreira F, Amorim A. (2000) Screening of thiopurine S-methyltransferase mutations by horizontal conformation-sensitive gel electrophoresis. Hum Mutat, 15(3):246-53
2. Ames MM, Selassie CD, Woodson LC, Van Loon JA, Hansch C, Weinshilboum RM. (1986) Thiopurine methyltransferase: structure-activity relationships for benzoic acid inhibitors and thiophenol substrates. J Med Chem, Mar;29(3):354-8
3. Ansari A, Elliott T, Baburajan B, Mayhead P, O'Donohue J, Chocair P, Sanderson J, Duley J. (2008) Long term outcome of using allopurinol co-therapy as a strategy for overcoming thiopurine hepatotoxicity in treating inflammatory bowel disease. Aliment Pharmacol Ther, Jun 2
4. Anstey A, Lennard L, Mayou SC, Kirby JD. (1992) Pancytopenia related to azathioprine – an enzyme deficiency caused by a common genetic polymorphism. J. Royal Soc. Med, 85: 752-756
5. Anstey AV, Wakelin S, Reynolds NJ. (2004) Guidelines for prescribing azathioprine in dermatology. British J Derm, 151: 1123-1132
6. Arenas M, Duley JA, Ansari A, Shobowale-Bakre EA, Fairbanks L, Soon SY, Sanderson J, Marinaki AM. (2004) Genetic determinants of the pre- and post-azathioprine therapy thiopurine methyltransferase activity phenotype. Nucleosides Nucleotides Nucleic Acids, Oct;23(8-9):1403-5
7. N Barlow, R Adams, P Bangh, J D Berg (2009) Who is using the TPMT test in the UK? A review of requests sent to a national referral centre Ann Clin Biochem, Focus Poster
8. Bruunshuus I, Schmiegelow K. (1989) Analysis of 6-mercaptopurine, 6-thioguanine nucleotides, and 6-thiouric acid in biological fluids by high-performance liquid chromatography. Scand J Clin Lab Invest, Dec;49(8):779-84
9. Cheung TK, Florin TH. (2003) 6-thioguanine: a new old drug to procure remission in inflammatory bowel disease. Intern Med J. Jan-Feb;33(1-2):44-6
10. Clunie G, Lennard L. (2004) Relevance of thiopurine methyl transferase status in rheumatology patients receiving azathioprine. Rheumatology, 43: 13-18
11. Collie-Duguid ES, Pritchard SC, Powrie RH, Sludden J, Collier DA, Li T, McLeod HL. (1999) The frequency and distribution of thiopurine methyltransferase alleles in Caucasian and Asian populations. Pharmacogenetics. Feb;9(1):37-42
12. Compagni A, Bartoli S, Buehrlen B, Fattore G, Ibarreta D, de Mesa EG. (2008) Avoiding adverse drug reactions by pharmacogenetic testing: a systematic review of the economic evidence in the case of TPMT and AZA-induced side effects. Int J Technol Assess Health Care. Summer;24(3):294-302

148
13. Cooper SC, Ford LT, Berg JD, Lewis MJ. (2008) Ethnic variation of thiopurine S-methyltransferase activity; a large, prospective population study. Pharmacogenomics. Mar;9(3):303-9.
14. Coulthard SA, Hogarth LA, Little M, Mathieson EC, Redfern CPF, Minto L, Hall AG. (2002) The effect of methyl transferase expression on sensitivity to thiopurine drugs. Molecular Pharmacology, 62:102-109
15. Cuffari C, Dassopoulos T, Turnbough L, Thompson RE, Bayless TM. (2004) Thiopurine methyltransferase activity influences clinical response to azathioprine in inflammatory bowel disease. Clin Gastroenterol Hepatol, May;2(5):410-7
16. Cuffari C, Hunt S, Bayless T (2001) Utilisation of erythrocyte 6-thioguanine metabolite levels to optimise azathioprine therapy in patients with inflammatory bowel disease Gut. May;48(5):642-6
17. de Boer NK, van Bodegraven AA, de Graaf P, van der Hulst RW, Zoetekouw L, van Kuilenburg AB. (2008) Paradoxical elevated thiopurine S-methyltransferase activity after pancytopenia during azathioprine therapy: potential influence of red blood cell age. Ther Drug Monit. Jun;30(3):390-3
18. Decaux G, Prospert F, Horsmans Y, Desager JP. (2000) Relationship between red cell mean corpuscular volume and 6-thioguanine nucleotides in patients treated with azathioprine. J Lab Clin Med, Mar;135(3):256-62
19. Department of Health (2003) Our inheritance, our future. Realising the potential of genetics in the NHS.
20. Dervieux T, Boulieu R. (1998) Simultaneous determination of 6-thioguanine and methyl 6-mercaptopurine nucleotides of azathioprine in red blood cells by HPLC. Clin Chem, Mar;44(3):551-5
21. Dewit O, Vanheuverzwyn R, Desager JP, Horsmans Y. (2002) Interaction between azathioprine and aminosalicylates: an in vivo study in patients with Crohns disease. Aliment Pharmacol Ther, Jan;16(1):79-85
22. Drug and Therapeutics Bulletin TPMT testing before azathioprine therapy? DTB, January 2009; 47: 9-12
23. Dubinsky MC. (2004) Azathioprine, 6-mercaptopurine in inflammatory bowel disease: pharmacology, efficacy, and safety. Clin Gastroenterol Hepatol, Sep;2(9):731-43
24. Dubinsky MC, Lamothe S, Yang HY, Targan SR, Sinnett D, Théorêt Y, Seidman EG.(2000) Pharmacogenomics and metabolite measurement for 6-mercaptopurine therapy in inflammatory bowel disease. Gastroenterology, Apr;118(4):705-13
25. Dubinsky MC, Reyes E, Ofman J, Chiou CF, Wade S, Sandborn WJ.( 2005) A cost-effectiveness analysis of alternative disease management strategies in patients with Crohns disease treated with azathioprine or 6-mercaptopurine. Am J Gastroenterol, Oct;100(10):2239-47

149
26. Duley JA, Florin TH. (2005) Thiopurine therapies: problems, complexities, and progress with monitoring thioguanine nucleotides. Ther Drug Monit, Oct;27(5):647-54
27. el-Azhary RA, Farmer SA, Drage LA, Rogers RS 3rd, McEvoy MT, Davis MD, Bridges AG, Gibson LE. (2009) Thioguanine nucleotides and thiopurine methyltransferase in immunobullous diseases: optimal levels as adjunctive tools for azathioprine monitoring. Arch Dermatol. Jun;145(6):644-52
28. Engen RM, Marsh S, Van Booven DJ, McLeod HL. (2006) Ethnic differences in pharmacogenetically relevant genes. Curr Drug Targets, Dec;7(12):1641-8
29. Ernest G, Seidman MD. (2003) Clinical use and practical application of TPMT enzyme and 6-mercaptopurine metabolite monitoring in IBD. Rev Gastroenterol Disord, 3: S30-S38
30. Fargher EA, Eddy C, Newman W, Qasim F, Tricker K, Elliott RA, Payne K (2007) Patients' and healthcare professionals' views on pharmacogenetic testing and its future delivery in the NHS. Pharmacogenomics. Nov;8(11):1511-9
31. Fargher EA, Tricker K, Newman W, Elliott R, Roberts SA, Shaffer JL, Bruce I, Payne K (2007) Current use of pharmacogenetic testing: a national survey of thiopurine methyltransferase testing prior to azathioprine prescription. J Clin Pharm Ther. Apr;32(2):187-95
32. Ford LT, Berg JD. (2003) Determination of thiopurine S-methyltransferase activity in erythrocytes using 6- thioguanine as substrate and a non-extraction liquid chromatographic technique. J Chrom B, 798: 111-115
33. Ford LT, Cooper SC, Lewis MJ, Berg JD (2004a) Reference intervals for thiopurine S-methyltransferase activity in red blood cells using 6-thioguanine as substrate and rapid non-extraction liquid chromatography. Ann Clin Biochem, Jul;41(Pt 4):303-8
34. Ford L, Graham V, Berg J. (2006) Whole-blood thiopurine S-methyltransferase activity with genotype concordance: a new, simplified phenotyping assay. Ann Clin Biochem. Sep;43(Pt 5):354-60
35. Ford LT, Graham V, Berg JD (2006) Patients with high-normal TPMT activity identified during routine phenotypic testing: What is going on? Ann Clin Biochem Focus Poster
36. Ford L, Kampanis P, Berg J. (2009) Thiopurine S-methyltransferase genotype-phenotype concordance: used as a quality assurance tool to help control the phenotype assay. Ann Clin Biochem, Mar;46(Pt 2):152-4
37. Ford L, Prout C, Gaffney D, Berg J. (2004b) Whose TPMT activity is it anyway? Ann Clin Biochem, Nov;41(Pt 6):498-500

150
38. Ganiere-Monteil C, Medard Y, Lejus C, Bruneau B, Pineau A, Fenneteau O, Bourin M, Jacqz-Aigrain E. (2004) Phenotype and genotype for thiopurine methyltransferase activity in the French Caucasian population: impact of age. Eur J Clin Pharmacol. Apr;60(2):89-96
39. Gardiner SJ, Gearry RB, Barclay ML, Begg EJ. (2006) Two cases of thiopurine methyltransferase (TPMT) deficiency - a lucky save and a near miss with azathioprine. Br J Clin Pharmacol, Oct;62(4):473-6
40. Gardiner SJ, Gearry RB, Burt MJ, Ding SL, Barclay ML. (2008) Severe hepatotoxicity with high 6-methylmercaptopurine nucleotide concentrations after thiopurine dose escalation due to low 6-thioguanine nucleotides. Eur J Gastroenterol Hepatol, Dec;20(12):1238-42
41. Gearry RB, Barclay ML, Roberts RL, Harraway J, Zhang M, Pike LS, George PM, Florkowski CM. (2005) Thiopurine methyltransferase and 6-thioguanine nucleotide measurement: early experience of use in clinical practice. Intern Med J, Oct;35(10):580-5
42. Gisbert JP, Gomollón F. (2008) Thiopurine-induced myelotoxicity in patients with inflammatory bowel disease: a review. Am J Gastroenterol. Jul;103(7):1783-800
43. Guerciolini R, Szumlanski C, Weinshilboum RM. (1991) Human liver xanthine oxidase: nature and extent of individual variation. Clin Pharmacol Ther, Dec;50(6):663-72
44. Hande S, Wilson-Rich N, Bousvaros A, Zholudev A, Maurer R, Banks P, Makrauer F, Reddy S, Burakoff R, Friedman S. (2006) 5-aminosalicylate therapy is associated with higher 6-thioguanine levels in adults and children with inflammatory bowel disease in remission on 6-mercaptopurine or azathioprine. Inflamm Bowel Dis, Apr;12(4):251-7
45. Higgs JE, Andrews J, Gurwitz D, Payne K, Newman W2008 Pharmacogenetics education in British medical schools Genomic Med. Dec;2(3-4):101-5
46. Hindorf U, Lindqvist M, Peterson C, Söderkvist P, Ström M, Hjortswang H, Pousette A, Almer S. (2006) Pharmacogenetics during standardised initiation of thiopurine treatment in inflammatory bowel disease. Gut, Oct;55(10):1423-31
47. Hindorf U, Lyrenäs E, Nilsson A, Schmiegelow K. (2004) Monitoring of long-term thiopurine therapy among adults with inflammatory bowel disease. Scand J Gastroenterol, Nov;39(11):1105-12
48. Holme SA, Duley JA, Sanderson J, Routledge PA, Anstey AV. (2002) Erythrocyte thiopurine methyl transferase assessment prior to azathioprine use in the UK. QJM, Jul;95(7):439-44
49. Hopkins MM, Ibarreta D, Gaisser S, Enzing CM, Ryan J, Martin PA, Lewis G, Detmar S, van den Akker-van Marle ME, Hedgecoe AM, Nightingale P, Dreiling M, Hartig KJ, Vullings W, Forde T. (2006) Putting pharmacogenetics into practice. Nat Biotechnol. Apr;24(4):403-10

151
50. Kaskas BA, Louis E, Hindorf U, Schaeffeler E, Deflandre J, Graepler F, Schmiegelow K, Gregor M, Zanger UM, Eichelbaum M, Schwab M. (2003) Safe treatment of thiopurine S-methyltransferase deficient Crohn's disease patients with azathioprine. Gut, Jan;52(1):140-2
51. Keizer-Garritsen JJ, Brouwer C, Lambooy LH, Ter Riet P, Bökkerink JP, Trijbels FJ, De Abreu RA. (2003) Measurement of thiopurine S-methyltransferase activity in human blood samples based on high-performance liquid chromatography: reference values in erythrocytes from children. Ann Clin Biochem. Jan;40(Pt 1):86-93
52. Klemetsdal B, Wist E, Aarbakke J. (1993) Gender difference in red blood cell thiopurine methyltransferase activity. Scand J Clin Lab Invest, Nov;53(7):747-9
53. Lennard L. (1987) Assay of 6-thioinosinic acid and 6-thioguanine nucleotides, active metabolites of 6-mercaptopurine, in human red blood cells. J Chromatogr. Dec 25;423:169-78
54. Lennard L, Chew TS, Lilleyman JS (2001) Human thiopurine methyltransferase activity varies with red blood cell age. Br J Clin Pharmacol. Nov;52(5):539-46
55. Lennard L, Davies HA, Lilleyman JS (1993) Is 6-thioguanine more appropriate than 6-mercaptopurine for children with acute lymphoblastic leukaemia? Br J Cancer. Jul;68(1):186-90.
56. Lennard L, Lilleyman JS. (1989) Variable mercaptopurine metabolism and treatment outcome in childhood lymphoblastic leukemia. J Clin Oncol, Dec;7(12):1816-23
57. Lennard L, Lilleyman JS. (1996) Individualising therapy with 6-mercaptopurine and 6-thioguanine related to the thiopurine methyl transferase genetic polymorphism. Ther Drug Monit,18: 328-334
58. Lennard L, Maddocks J. (1983) Assay of 6-thioguanine nucleotide, a major metabolite of azathioprine, 6-mercaptopurine and 6-thioguanine, in human red blood cells. J Pharm Pharmacol, 35: 15-18
59. Lennard L, Rees CA, Lilleyman JS, Maddocks JL. (2004) Childhood leukaemia: a relationship between intracellular 6-mercaptopurine metabolites and neutropenia. Br J Clin Pharmacol, Dec;58(7):S867-71
60. Lindqvist M, Hindorf U, Almer S, Söderkvist P, Ström M, Hjortswang H, Peterson C. (2006) No induction of thiopurine methyltransferase during thiopurine treatment in inflammatory bowel disease. Nucleosides Nucleotides Nucleic Acids, 25(9-11):1033-7
61. Lowry PW, Franklin CL, Weaver AL, Pike MG, Mays DC, Tremaine WJ, Lipsky JJ, Sandborn WJ. (2001) Measurement of thiopurine methyltransferase activity and azathioprine metabolites in patients with inflammatory bowel disease. Gut, Nov;49(5):665-70

152
62. Lysaa RA, Giverhaug T, Wold HL, Aarbakke J. (1996) Inhibition of human thiopurine methyltransferase by furosemide, bendroflumethiazide and trichlormethiazide. Eur J Clin Pharmacol, 49(5):393-6
63. Mardini HE, Arnold GL. (2003) Utility of measuring 6-methylmercaptopurine and 6-thioguanine nucleotide levels in managing inflammatory bowel disease patients treated with 6-mercaptopurine in a clinical practice setting. J Clin Gastroenterol, May-Jun;36(5):390-5
64. Marinaki AM, Ansari A, Duley JA, Arenas M, Sumi S, Lewis CM, Shobowale-Bakre el-M, Escuredo E, Fairbanks LD, Sanderson JD. 2004 Adverse drug reactions to azathioprine therapy are associated with polymorphism in the gene encoding inosine triphosphate pyrophosphatase (ITPase) Pharmacogenetics. Mar;14(3):181-7
65. Marinaki AM, Duley JA, Arenas M, Ansari A, Sumi S, Lewis CM, Shobowale-Bakre M, Fairbanks LD, Sanderson J2004 Mutation in the ITPA gene predicts intolerance to azathioprine Nucleosides Nucleotides Nucleic Acids. Oct;23(8-9):1393-7
66. Marsh S, Van Booven DJ (2009) The increasing complexity of mercaptopurine
pharmacogenomics Clin Pharmacol Ther. Feb;85(2):139-41
67. Morales A, Salguti S, Miao CL, Lewis JD. (2007) Relationship between 6-mercaptopurine dose and 6-thioguanine nucleotide levels in patients with inflammatory bowel disease. Inflamm Bowel Dis. Apr;13(4):380-5
68. Motulsky AG. 1957 Drug reactions enzymes, and biochemical genetics. J Am Med Assoc. Oct 19;165(7):835-7
69. Nasedkina TV, Fedorova OE, Glotov AS, Chupova NV, Samochatova EV, Maiorova OA, Zemlyakova VV, Roudneva AE, Chudinov AV, Yurasov RA, Kozhekbaeva JM, Barsky VE, Krynetskiy EY, Krynetskaia NF, Cheng C, Ribeiro RC, Evans WE, Roumyantsev AG, Zasedatelev AS. (2006) Rapid genotyping of common deficient thiopurine S-methyltransferase alleles using the DNA-microchip technique. Eur J Hum Genet. Sep;14(9):991-8
70. Oselin K, Anier K. (2007) Inhibition of human thiopurine S-methyltransferase by various nonsteroidal anti-inflammatory drugs in vitro: a mechanism for possible drug interactions. Drug Metab Dispos, Sep;35(9):1452-4
71. Payne K; Newman WG; Gurwitz D; Ibarreta D; Phillips KA (2009) TPMT Testing in Azathioprine: A 'Cost-effective Use of Healthcare Resources'? Personalized Medicine Mar 6; 103-113
72. Pike MG, Franklin CL, Mays DC, Lipsky JJ, Lowry PW, Sandborn WJ. (2001) Improved methods for determining the concentration of 6-thioguanine nucleotides and 6-methylmercaptopurine nucleotides in blood. Chromatogr B Biomed Sci Appl, Jun 5;757(1):1-9

153
73. Pirmohamed M, James S, Meakin S, Green C, Scott AK, Walley TJ, Farrar K, Park BK, Breckenridge AM. (2004) Adverse drug reactions as cause of admission to hospital: prospective analysis of 18 820 patients. BMJ, 329:15-19
74. Priest VL, Begg EJ, Gardiner SJ, Frampton CM, Gearry RB, Barclay ML, Clark DW, Hansen P. 2006 Pharmacoeconomic analyses of azathioprine, methotrexate and prospective pharmacogenetic testing for the management of inflammatory bowel disease. Pharmacoeconomics.;24(8):767-81
75. Richard VS, Al-Ismail D, Salamat A.(2007) Should we test TPMT enzyme levels before starting azathioprine? Hematology. Aug;12(4):359-60
76. Roberts RL, Barclay ML, Gearry RB, & Kennedy MA.(2004) A multiplexed allele-specific polymerase chain reaction assay for the detection of common thiopurine s-methyltransferase (TPMT) mutations. Clinica Chimica Acta, 341: 49-53
77. Sandborn WJ. (2004) Pharmacogenomics and IBD: TPMT and thiopurines.Inflamm Bowel Dis, Feb;10 Suppl 1:S35-7
78. Sanderson J, Ansari A, Marinaki T, Dulay J. (2004) Thiopurine methyltransferase: should it be measured before commencing thiopurine drug therapy? Ann Clin Biochem, 41: 294-302
79. Schaeffeler E, Fischer C, Brockmeier D, Wernet D, Moerike K, Eichelbaum M, Zanger UM, Schwab M. (2004) Comprehensive analysis of thiopurine S-methyltransferase phenotype-genotype correlation in a large population of German-Caucasians and identification of novel TPMT variants. Pharmacogenetics, Jul;14(7):407-17
80. Schaeffeler E, Zanger UM, Eichelbaum M, Asante-Poku S, Shin J, Schwab M (2008) Highly multiplexed genotyping of thiopurine S-methyltransferase variants using MALDI-TOF mass spectrometry: reliable genotyping in different ethnic groups. Clin Chem, Oct;54(10):1637-47
81. Shimasaki N, Mori T, Torii C, Sato R, Shimada H, Tanigawara Y, Kosaki K, Takahashi T. (2008) Influence of MTHFR and RFC1 polymorphisms on toxicities during maintenance chemotherapy for childhood acute lymphoblastic leukemia or lymphoma. J Pediatr Hematol Oncol, May;30(5):347-52
82. Slanar O, Chalupná P, Novotný A, Bortlík M, Krska Z, Lukás M (2008) Fatal myelotoxicity after azathioprine treatment Nucleosides Nucleotides Nucleic Acids. Jun;27(6):661-5
83. Szumlanski CL, Honchel R, Scott MC, Weinshilboum RM. (1992) Human liver thiopurine methyltransferase pharmacogenetics: biochemical properties, liver-erythrocyte correlation and presence of isozymes. Pharmacogenetics. Aug;2(4):148-59

154
84. Szumlanski C, Otterness D, Her C, Lee D, Brandriff B, Kelsell D, Spurr N, Lennard L, Wieben E, Weinshilboum R. (1996) Thiopurine pharmacogenetics: Human gene cloning and characterization of a common polymorphism. DNA Cell Biol, 15; 1: 17-30
85. Szumlanski CL, Weinshilboum RM. (1995) Sulphasalazine inhibition of thiopurine methyltransferase: possible mechanism for interaction with 6-mercaptopurine and azathioprine. Br J Clin Pharmacol, Apr;39(4):456-9
86. Tai HL, Krynetski EY, Yates CR, Loennechen T, Fessing MY, Krynetskaia NF, Evans WE. (1996) Thiopurine S-methyltransferase deficiency: two nucleotide transitions define the most prevalent mutant allele associated with loss of catalytic activity in Caucasians. Am J Hum Genet, Apr;58(4):694-702
87. Tamm R, Oselin K, Kallassalu K, Magi R, Anier K, Remm M, Metspalu A. (2008) Thiopurine S-methyltransferase (TPMT) pharmacogenetics: three new mutations and haplotype analysis in the Estonian population. Clin Chem Lab Med, 46(7):974-9
88. Tan BB, Lear JT, Gawkrodger DJ, English JS. (1997) Azathioprine in dermatology: a survey of current practice in the U.K. Br J Dermatol. Mar;136(3):351-5
89. Tani C, Mosca M, Colucci R, Gori G, d'Ascanio A, Ghisu N, Fornai M, Di Paolo A, Blandizzi C, Del Tacca M, Bombardieri S. (2009) Genetic polymorphisms of thiopurine S-methyltransferase in a cohort of patients with systemic autoimmune diseases. Clin Exp Rheumatol. Mar-Apr;27(2):321-4
90. Teml A, Schaeffeler E, Herrlinger KR, Klotz U, Schwab M. (2007) Thiopurine treatment in inflammatory bowel disease: clinical pharmacology and implication of pharmacogenetically guided dosing. Clin Pharmacokinet, 46(3):187-208
91. Thervet E, Anglicheau D, Toledano N, Houllier AM, Noel LH, Kreis H, Beaune P, Legendre C. (2001) Long-term results of TMPT activity monitoring in azathioprine-treated renal allograft recipients. J Am Soc Nephrol, Jan;12(1):170-6
92. Thomas CW Jr, Lowry PW, Franklin CL, Weaver AL, Myhre GM, Mays DC, Tremaine WJ, Lipsky JJ, Sandborn WJ. (2003) Erythrocyte mean corpuscular volume as a surrogate marker for 6-thioguanine nucleotide concentration monitoring in patients with inflammatory bowel disease treated with azathioprine or 6-mercaptopurine. Inflamm Bowel Dis. Jul;9(4):237-45
93. Tiede I, Fritz G, Strand S, Poppe D, Dvorsky R, Strand D, Lehr HA, Wirtz S, Becker C, Atreya R, Mudter J, Hildner K, Bartsch B, Holtmann M, Blumberg R, Walczak H, Iven H, Galle PR, Ahmadian MR, Neurath MF. (2003) CD28-dependent Rac1 activation is the molecular target of azathioprine in primary human CD4+ T lymphocytes. J Clin Invest, Apr;111(8):1133-45

155
94. Von Ahsen N, Armstrong VW, Behrens C, von Tirpitz C, Stallmach A, Herfarth H, Stein J, Bias P, Adler G, Shipkova M, Oellerich M, Kruis W, Reinshagen M (2005) Association of inosine triphosphatase 94C>A and thiopurine S-methyltransferase deficiency with adverse events and study drop-outs under azathioprine therapy in a prospective crohn disease study Clin. Chem, Dec 51: 2282 - 2288
95. van den Akker-van Marle ME, Gurwitz D, Detmar SB, Enzing CM, Hopkins MM, Gutierrez de Mesa E, Ibarreta D. 2006 Cost-effectiveness of pharmacogenomics in clinical practice: a case study of thiopurine methyltransferase genotyping in acute lymphoblastic leukemia in Europe. Pharmacogenomics. 2006 Jul;7(5):783-92
96. Van Loon JA, Weinshilboum RM. (1982) Thiopurine methyltransferase biochemical genetics: human lymphocyte activity. Biochem Genet, Aug;20 (7-8):637-58
97. Wang L, Weinshilboum R. (2006) Thiopurine S-methyltransferase pharmacogenetics: insights, challenges and future directions. Oncogene, Mar 13;25(11):1629-38
98. Weinshilboum R. Methyltransferase pharmacogenetics. Pharmacol Ther.1989;43(1):77-90
99. Weinshilboum RM, Raymond FA, Pazmino PA. (1978) Human erythrocyte thiopurine methyltransferase: radiochemical microassay and biochemical properties. Clin Chim Acta, May 2;85(3):323-33
100. Weinshilboum RM, Sladek SL. (1980) Mercaptopurine pharmacogenetics: monogenic inheritance of erythrocyte thiopurine methyltransferase activity. Am J Hum Genet, 32: 651-662
101. Weinshilboum R, Wang L. (2004) Pharmacogenomics: bench to bedside. Nat Rev Drug Discov, Sep;3(9):739-48
102. Weller S, Thürmann P, Rietbrock N, Gossmann J, Scheuermann EH. (1995) HPLC analysis of azathioprine metabolites in red blood cells, plasma and urine in renal transplant recipients. Int J Clin Pharmacol Ther, Dec;33(12):639-45
103. Weyer N, Kröplin T, Fricke L, Iven H. (2001) Human thiopurine S-methyltransferase activity in uremia and after renal transplantation. Eur J Clin Pharmacol, May;57(2):129-36
104. Whisnat JK, Pelkay J. (1982) Rheumatoid arthritis: treatment with azathioprine (IMURAN R). Clinical side effects and laboratory abnormalities. Ann Rheum Dis, 41: 44-47
105. Woodson LC, Ames MM, Selassie CD, Hansch C, Weinshilboum RM. (1983) Thiopurine methyltransferase. Aromatic thiol substrates and inhibition by benzoic acid derivatives. Mol Pharmacol, Nov;24(3):471-8

156
106. Woodson LC, Dunnette JH, Weinshilboum RM. (1982) Pharmacogenetics of human thiopurine methyltransferase: kidney-erythrocyte correlation and immunotitration studies. J Pharmacol Exp Ther, Jul;222(1):174-81
107. Xin HW, Fischer C, Schwab M, Klotz U. (2005) Thiopurine S-methyltransferase as a target for drug interactions. Eur J Clin Pharmacol, Jul;61(5-6):395-8
108. Yates CR, Krynetski EY, Loennechen T, Fessing MY, Tai HL, Pui CH, Relling MV, Evans WE. (1997) Molecular Diagnosis of thiopurine S-methyl transferase deficiency. Genetic basis for azathioprine and mercaptopurine intolerance. Ann Intern Med, 126: 608-614
109. Yip JS, Woodward M, Abreu MT, Sparrow MP. (2008) How are Azathioprine and 6-mercaptopurine dosed by gastroenterologists? Results of a survey of clinical practice. Inflamm Bowel Dis, Apr;14(4):514-8
110. Zhou SF, Di YM, Chan E, Du YM, Chow VD, Xue CC, Lai X, Wang JC, Li CG, Tian M, Duan W. (2008) Clinical pharmacogenetics and potential application in personalized medicine. Curr Drug Metab, Oct;9(8):738-84
Copyright © 2022 FDOKUMEN