Genotyping and Evaluation of Pleurotus ostreatus (oyster ...
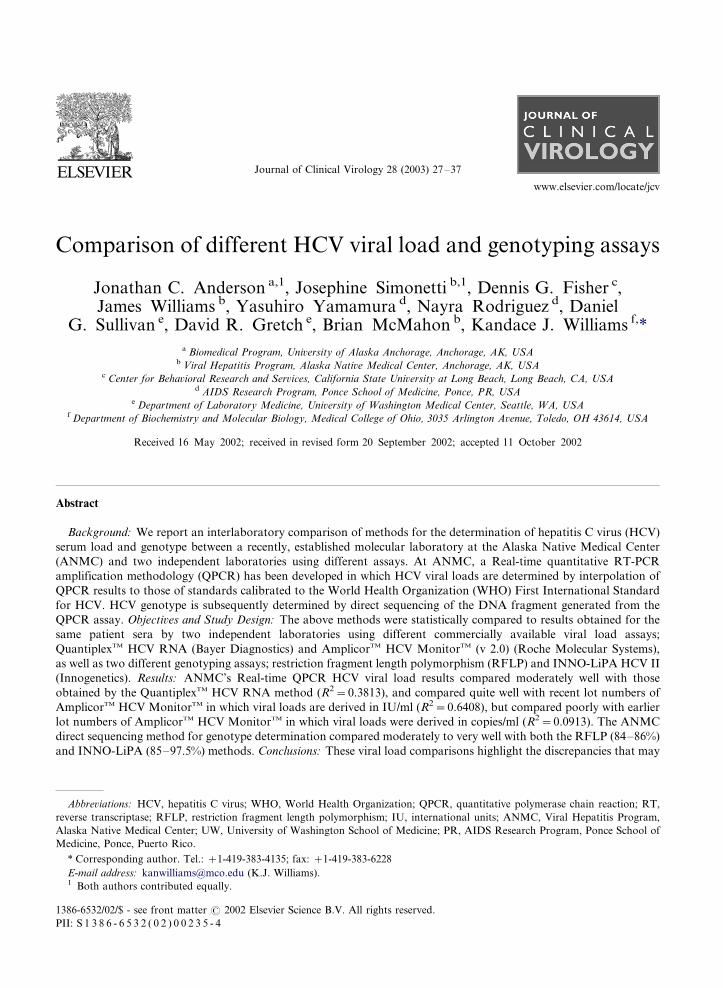
Comparison of different HCV viral load and genotyping assays
Jonathan C. Anderson a,1, Josephine Simonetti b,1, Dennis G. Fisher c,James Williams b, Yasuhiro Yamamura d, Nayra Rodriguez d, Daniel
G. Sullivan e, David R. Gretch e, Brian McMahon b, Kandace J. Williams f,*a Biomedical Program, University of Alaska Anchorage, Anchorage, AK, USA
b Viral Hepatitis Program, Alaska Native Medical Center, Anchorage, AK, USAc Center for Behavioral Research and Services, California State University at Long Beach, Long Beach, CA, USA
d AIDS Research Program, Ponce School of Medicine, Ponce, PR, USAe Department of Laboratory Medicine, University of Washington Medical Center, Seattle, WA, USA
f Department of Biochemistry and Molecular Biology, Medical College of Ohio, 3035 Arlington Avenue, Toledo, OH 43614, USA
Received 16 May 2002; received in revised form 20 September 2002; accepted 11 October 2002
Abstract
Background: We report an interlaboratory comparison of methods for the determination of hepatitis C virus (HCV)
serum load and genotype between a recently, established molecular laboratory at the Alaska Native Medical Center
(ANMC) and two independent laboratories using different assays. At ANMC, a Real-time quantitative RT-PCR
amplification methodology (QPCR) has been developed in which HCV viral loads are determined by interpolation of
QPCR results to those of standards calibrated to the World Health Organization (WHO) First International Standard
for HCV. HCV genotype is subsequently determined by direct sequencing of the DNA fragment generated from the
QPCR assay. Objectives and Study Design: The above methods were statistically compared to results obtained for the
same patient sera by two independent laboratories using different commercially available viral load assays;
QuantiplexTM HCV RNA (Bayer Diagnostics) and AmplicorTM HCV MonitorTM (v 2.0) (Roche Molecular Systems),
as well as two different genotyping assays; restriction fragment length polymorphism (RFLP) and INNO-LiPA HCV II
(Innogenetics). Results: ANMC’s Real-time QPCR HCV viral load results compared moderately well with those
obtained by the QuantiplexTM HCV RNA method (R2�/0.3813), and compared quite well with recent lot numbers of
AmplicorTM HCV MonitorTM in which viral loads are derived in IU/ml (R2�/0.6408), but compared poorly with earlier
lot numbers of AmplicorTM HCV MonitorTM in which viral loads were derived in copies/ml (R2�/0.0913). The ANMC
direct sequencing method for genotype determination compared moderately to very well with both the RFLP (84�/86%)
and INNO-LiPA (85�/97.5%) methods. Conclusions: These viral load comparisons highlight the discrepancies that may
Abbreviations: HCV, hepatitis C virus; WHO, World Health Organization; QPCR, quantitative polymerase chain reaction; RT,
reverse transcriptase; RFLP, restriction fragment length polymorphism; IU, international units; ANMC, Viral Hepatitis Program,
Alaska Native Medical Center; UW, University of Washington School of Medicine; PR, AIDS Research Program, Ponce School of
Medicine, Ponce, Puerto Rico.
* Corresponding author. Tel.: �/1-419-383-4135; fax: �/1-419-383-6228
E-mail address: [email protected] (K.J. Williams).1 Both authors contributed equally.
Journal of Clinical Virology 28 (2003) 27�/37
www.elsevier.com/locate/jcv
1386-6532/02/$ - see front matter # 2002 Elsevier Science B.V. All rights reserved.
PII: S 1 3 8 6 - 6 5 3 2 ( 0 2 ) 0 0 2 3 5 - 4
occur when patient HCV viral loads are monitored using different types of assays. Comparison of HCV genotype by
different methods is more reliable statistically and important clinically for predicting probability of response to antiviral
therapy. However, viral loads are important for monitoring response once therapy has begun.
# 2002 Elsevier Science B.V. All rights reserved.
Keywords: Hepatitis C virus; Serum viral load; Genotype; Interlaboratory comparison
1. Introduction
Hepatitis C virus (HCV) is a flavivirus that
currently infects an estimated 1.8% of the US
population (Alter et al., 1999). It is estimated that
only 20% of infected individuals will recover from
this viral infection, while the rest become chroni-
cally infected (Cohen, 1999; Management of
Hepatitis C, NIH Consensus Statement Online).
While the majority of chronically infected indivi-
duals never exhibit symptoms, approximately 10�/
30% of these patients will eventually develop
cirrhosis or hepatocellular carcinoma, both of
which are associated with significant morbidity
and mortality (Di Bisceglie et al., 1991; Tibor et
al., 1999). HCV infection is currently estimated to
cause 40�/60% of chronic liver disease and as a
consequence is recognized as the leading cause for
liver transplantation in the United States (Arens,
2001; Cohen, 1999; Hepatitis C Fact Sheet, CDC
Website).
To date, the most effective treatment regimen
for HCV consists of combination therapy with
Interferon-a-2b and Ribavirin; a treatment that
has varied effectiveness and adverse side effects
(Thomas and Lemon, 2000). However, in recent
clinical trials both pretreatment serum HCV RNA
levels (viral load) and viral genotype were found to
be the two best indicators of the potential for
treatment success (McHutchinson et al., 1998;
Poynard et al., 1998). Therefore, once an indivi-
dual has tested positive for HCV, current recom-
mendations are that viral load and genotype tests
be performed to establish patient suitability for
treatment and subsequent length of treatment
(Carithers et al., 2000; EASL International Con-
sensus Conference on Hepatitis C, 1999).
The most commonly used methods for the
determination of serum HCV viral load involve
amplification of either (i) a direct HCV genome
target (QPCR) or (ii) an associated signal
(branched chain or bDNA assays) (reviewed in
Morishima and Gretch, 1999). Many laboratories
have developed ‘home-brew’ assays based on these
methodologies. HCV quantitative assays are also
commercially available as the QPCR-based Am-
plicorTM HCV MonitorTM test from Roche Mole-
cular Systems and the bDNA-based QuantiplexTM
HCV RNA assay from Bayer Diagnostics.
Because each commercially available viral load
assay has been developed using proprietary HCV
RNA standards, the units of measure in each assay
are particular to that method, making comparison
of results between different assays difficult. As a
consequence, a patient’s HCV viral load can be
accurately compared from one time point to
another only if the same assay is used for analysis
each time. Recently, however, a WHO Interna-
tional Standard, expressed in international units
(IU), was established for HCV RNA viral load
assays and has led to the development of a HCV
RNA quantification panel (Jorgenson and Neu-
wald, 2001; Saldanha, 1999; Saldanha et al., 1999).
The NAPTM HCV�/RNA nucleic acid panel pro-
vides a commercially available standard for the
comparison of HCV RNA viral loads between
different viral load assays and fulfills the recom-
mendation that all HCV RNA quantitative assays
report results as IU/ml (Pawlotsky et al., 2000).
For genotype analysis, the three major meth-
odologies are (i) direct sequencing of PCR pro-
ducts (Arens, 2001), (ii) restriction fragment length
polymorphism (RFLP) of PCR products (David-
son et al., 1995), and (iii) reverse hybridization of
PCR products to genotype-specific probes, such as
the line probe assay available commercially as
INNO-LiPA from Innogenetics (Le Pogam et al.,
1998). Although the recognized gold standard for
genotype determination is direct DNA sequencing,
this methodology has been criticized as too
J.C. Anderson et al. / Journal of Clinical Virology 28 (2003) 27�/3728
expensive and labor intensive for routine clinicaluse (Thomas and Lemon, 2000). However, recent
advances, such as one step RT-PCR and auto-
mated sequencing technology, have made this
method less cumbersome and more cost effective,
and thus a viable and excellent alternative to the
less specific commercial methods for routine
genotype testing.
The Viral Hepatitis Program at the AlaskaNative Medical Center (ANMC) recently estab-
lished a molecular biology laboratory for both
epidemiological research and patient monitoring
purposes which has HCV viral load and genotyp-
ing capabilities. This is the first facility of this type
to be established in Alaska, thus negating the need
to transport specimens elsewhere for analyses. The
methodologies employed by ANMC consist of aone step viral load determination by Real-time
quantitative PCR and subsequent genotype deter-
mination by direct sequencing of the same ampli-
fied fragment. The portion of the HCV genome
targeted is a 250 base pair (bp) fragment of the 5
prime non-coding region (5? NCR). The 5? NCR
portion of HCV is widely used in assays of this
type because it is conserved enough betweengenotypes to allow consistent amplification but
sufficiently different at the nucleotide level to
distinguish individual genotypes from one another
(Zein, 2000). Here we report validation of the
ANMC methodology through the statistical com-
parison of ANMC genotype and viral load results
to those obtained by two independent laboratories
using different commercially available assays.Ninety serum samples were compared by ANMC
in all; 40 samples were provided by the Ponce
School of Medicine AIDS Research Program in
Ponce, Puerto Rico (PR) and 50 samples were
provided by the University of Washington School
of Medicine, Seattle, WA (UW).
2. Materials and methods
2.1. Specimen acquisition and processing
At the originating laboratory, each serum was
labeled with an individual code number and no
other identification. All sera were transported on
dry ice and subsequently stored at �/70 8C. HCVserum viral load and genotype results correspond-
ing to the individual serum code numbers were
obtained from the originating laboratory only
after all sera were processed by ANMC, thus these
interlaboratory comparisons were masked from
the data from the originating sites.
2.2. ANMC viral load and genotype determination
2.2.1. Viral RNA isolation
Viral RNA was extracted from 100 ml of serum
using the Roche High Pure Viral RNA kit (Roche
Diagnostics Corporation) as per the manufac-turer’s instructions with the following exception:
the viral RNA was eluted in 50 ml of nuclease free
water containing a 5? NCR reverse PCR primer
(5?-TACCACAAGGCCTTTCGCGACCCAA-
CACTACTC-3?) (Chen et al., 1996). The reverse
PCR primer was added in an amount sufficient to
produce a final concentration of 0.3 mM in the RT-
PCR reaction mix (described below). Immediatelybefore addition to the RT-PCR reaction solution,
the sample RNA/reverse primer mixture was
denatured at 70 8C for 3 min and quenched on ice.
2.2.2. Viral load determination by Real-time
QPCR
A 250 bp region of the HCV 5? NCR was
amplified in the presence of a dual-labeled fluoro-
genic probe specific for the cDNA region between
the forward and reverse primers. When in the
intact form, the probe contains a fluorescentreporter and a quencher dye whose physical
proximity to each other suppress any light emitted
by the reporter. During PCR the 5?0/3? nuclease
activity of the DNA polymerase releases the
reporter dye from the probe and results in an
increase in fluorescence that is then measured by
the GeneAmp† 5700 sequence detection system
(Applied Biosystems). The 5? NCR HCV primersand probe were designed using Primer ExpressTM
version 2.0 software (Applied Biosystems) and
information from the references Chen et al.
(1996), Kawai et al. (1999), Martell et al. (1999),
Takeuchi et al. (1999). All synthetic primers were
purchased from Operon Technologies, Inc.
J.C. Anderson et al. / Journal of Clinical Virology 28 (2003) 27�/37 29
Reverse transcription and QPCR amplificationswere carried out in a single step, in triplicate using
96-well plates and the SuperscriptTM 1-Step RT-
PCR Kit with Platinum† Taq (Invitrogen). Each
50 ml reaction mixture contained 1X SuperscriptTM
reaction mix, 2.8 mM MgSO4, 0.3 mM forward
primer 1 (5?-CACTCCCCTGTGAGGAACTAC-
TGTCT-3?), 0.3 mM forward primer 2 (5?-CT-
GATGGGGGCGACACTCCACCATGAA-3?),0.15 mM Fluorogenic probe (5?-FAM-TGTACT-
CACCGGTTCCGCAGACCA-TAMRA-3?) and
1 ml of the RT/Platinum† Taq enzyme mix.
Finally, 10 ml of the primed RNA/reverse primer
template was added to each reaction. Reaction
mixtures were initially heated to 50 8C for 60 min
to facilitate cDNA synthesis. An incubation of 10
min at 95 8C activated the Taq polymerase anddenatured the DNA template and reverse tran-
scriptase. Forty-five cycles of denaturation (95 8C/
30 s), annealing (65 8C/15 s) and extension (72 8C/
1 min) were then carried out allowing the con-
current amplification and quantification of the
HCV 5? NCR fragments.
Quantities of HCV RNA, in IU/ml, were
determined by comparing the results for theunknown serum samples to those on a standard
curve (NAPTM HCV panel ranging in concentra-
tion from 500 to 2 000 000 IU/ml [Acrometrix
Corporation] generated from HCV samples cali-
brated to the World Health Organization (WHO)
First International Standard for HCV RNA
(Saldanha et al., 1999). In addition to negative
controls, a 100 ml aliquot of each of the standardswas extracted, amplified and detected in separate
reactions that were run in parallel with the samples
being tested. A standard curve was generated at
the end of each run by plotting the threshold cycle
(CT) (the cycle at which a fluorescence signal
above baseline can be detected) against log10(N ),
where N is the initial concentration of the stan-
dard in IU/ml. HCV RNA concentrations for allunknown samples were subsequently calculated by
interpolation of the standard curve.
2.2.3. Genotyping
The genotype of the infecting HCV virus in each
serum sample was determined by direct sequencing
of the 5? NCR PCR product generated in the one
step Real-time QPCR viral load assay. Briefly, 6 mlof each PCR product was treated with 2 ml of
ExoSAP-IT, as described by the manufacturer
(USB Corporation), to remove excess deoxynu-
cleotides and primers. Next, cycle sequencing was
carried out using the BigDyeTM Terminator v3.0
cycle sequencing reaction kit as per manufacturer’s
instructions (Applied Biosystems). Briefly, the
products of the ExoSAP-IT reaction, 8 ml of theBigDyeTM Terminator Ready Reaction mix and 40
pmols of reverse PCR primer were combined. The
sequencing reaction was carried out for 24 cycles
of denaturation (96 8C/10 s) and annealing/exten-
sion (60 8C/4 min). Excess dye terminators were
removed using the Qiaquick-8† PCR Purification
kit as per manufacturer’s instructions (Qiagen
Inc.). Purified reaction mixtures were vacuumdried and resuspended in 6 ml of loading buffer
(3.2 mM deionized formamide, 5 mM EDTA/10
mg/ml Blue dextran) (Sigma Chemical Co.). The
sequencing reactions were analyzed on an Applied
Biosystems model 373A automated sequencer with
373XL-translation processor upgrade. The se-
quences obtained were aligned with sequences
corresponding to HCV genotypes 1a, 1b, 1c, 2a,2b, 2c, 3a and 3b obtained from GenBank
(Accession numbers: M62321; D31601;
AJ238799; D31602; D14853; D00944; D31604;
AF238485; D10988; D31606; AF238486; D50409;
D17763; AF046866; D28917; D49374, respec-
tively). The SequencherTM 3.0 software program
(GeneCodes Corp.) was then used to determine
genotype identity by sequence similarity.
2.2.4. UW Viral load determination and genotyping
Viral loads were obtained using the bDNA
signal amplification method as described by the
manufacturer (QuantiplexTM HCV RNA; Bayer
Diagnostics). Genotyping was accomplished by
RFLP analysis of 5? NCR HCV RT-PCR products
from the serum samples as described previously(Davidson et al., 1995).
2.2.5. PR Viral load determination and genotyping
Viral load quantification was performed using
earlier lot numbers of AmplicorTM HCV Mon-
itorTM (v 2.0) kit in which viral loads were derived
as copies/ml (Roche Molecular Diagnostics Sys-
J.C. Anderson et al. / Journal of Clinical Virology 28 (2003) 27�/3730
tems) for serum samples 1�/26, and later lotnumbers of the same assay in which viral loads
were derived as IU/ml for serum samples 27�/40.
This assay also quantifies the copy number of 5?NCR HCV in the patient serum samples by reverse
transcription and QPCR. Genotyping was per-
formed by reverse hybridization of genotype-
specific primers to the above 5? NCR HCV
QPCR products using the line probe assay kit asdescribed by the manufacturer (INNO-LiPA HCV
II, Innogenetics).
2.2.6. Statistical analyses
All analyses were performed in SAS for Win-
dows 2000 version 8.1 (Cary, 1999). Each of the
analytical results has been presented as two
different pairwise comparisons. One comparisonis between the ANMC Viral Hepatitis Program,
and UW. Briefly, HCV viral load and genotype
results determined by the Real-time QPCR and
DNA sequencing methods developed by ANMC
were compared to UW results obtained for the
same 50 specimens using bDNA and RFLP
methodology. Similarly, in the second comparison
ANMC’s HCV viral load and genotype results forthe 40 samples provided by the Ponce School of
Medicine (PR) were compared to the results
obtained by PR using the AmplicorTM HCV
Monitor kit and the line probe assay. The UW
bDNA and RFLP methods were not compared to
PR’s AmplicorTM HCV MonitorTM kit or the line
probe assay. Viral loads were compared by linear
regression of the log10 transformed data in theunits of measure established for each test (Jorgen-
son and Neuwald, 2001). Genotype comparisons
were analyzed and presented as both percent
agreement and either Cohen’s kappa (Cohen et
al., 1960) or Adjusted Rand Statistic (Fisher and
Hoffman, 1988; Hubert and Arabie, 1985; Morey
and Agresti, 1984; Rand, 1971) for each pairwise
comparison.
3. Results
HCV RNA was detected in 46 out of 50 UW
samples analyzed by ANMC’s Real-time QPCR
methodology but was detected in only 42 of the
same samples when analyzed by UW’s Quanti-plexTM HCV bDNA assay, although 2 of these
samples were subsequently genotyped by UVs.
This is likely due to the fact that several serum
samples were below the 200 000 Eq/ml detection
limit of the less sensitive bDNA methodology but
not below the detection limit of the more sensitive
Real-time QPCR assay (Jorgenson and Neuwald,
2001). Viral RNA was detected in all 40 PRsamples analyzed by both ANMC’s Real-time
QPCR assay and either version of the AmplicorTM
HCV MonitorTM assay used by PR.
Because Jorgenson and Neuwald (2001) have
recently published a similar evaluation of different
commercial and research methods for the determi-
nation of HCV viral loads, we determined whether
our statistical comparison results were signifi-cantly different from theirs. However, it should
be noted that we compared results for patient sera
obtained from several clinical laboratories using
different methods, while Jorgenson and Neuwald
compared results only for the NAPTM HCV
standard panel performed within the facilities of
each assay manufacturer.
The viral load data from the Quantiplex HCVbDNA procedure used at UW compared moder-
ately well with the Real-time QPCR HCV RNA
procedure used at ANMC (R2�/0.3813; Fig. 1).
The regression coefficient was 0.41047 and the
intercept was �/3.93362 (resulting in a regression
equation of log10 Eq/ml�/0.41047 log10 IU/ml�/
3.93362). Our regression coefficient of 0.41047
was significantly different from the Jorgensenand Neuwald coefficient of 0.9802 (P�/0.0001)
when comparing the same methodologies (Jorgen-
son and Neuwald, 2001). Similarly our intercept of
�/3.93362 was significantly different from theirs of
�/0.9157 (P�/0.0001) for this pairwise compar-
ison.
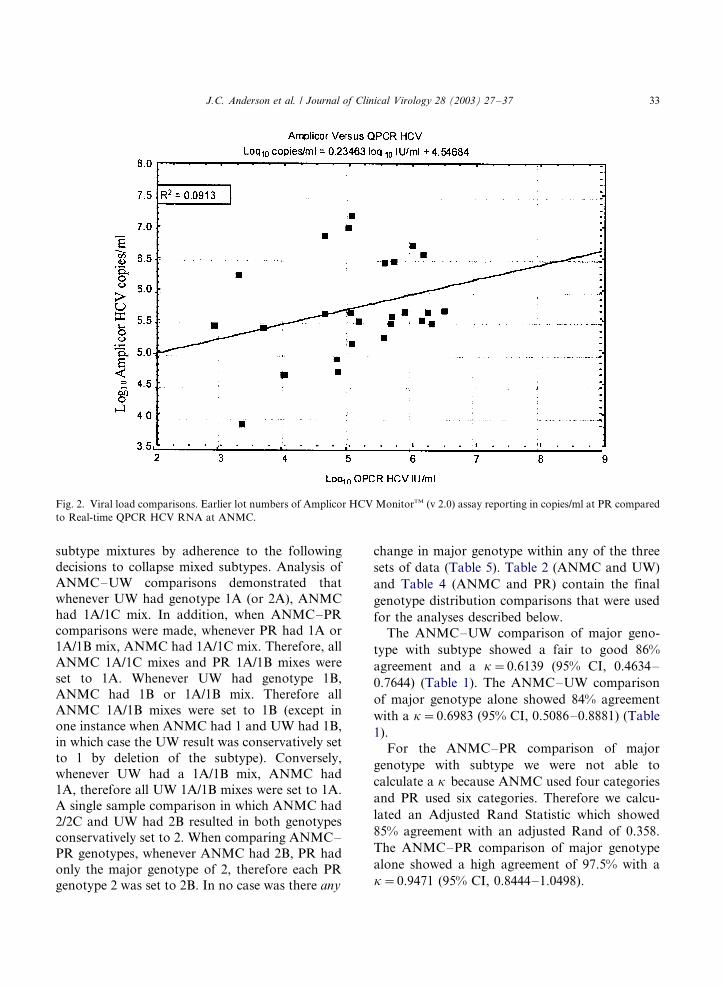
Although PR used version 2.0 of AmplicorTM
HCV MonitorTM assay for all samples, earlier lotnumbers determined viral loads as copies/ml, while
later lot numbers determined viral loads as IU/ml.
The viral load data from earlier lot numbers used
by PR compared poorly with the Real-time QPCR
HCV RNA procedure used at ANMC (R2�/
0.0913; Fig. 2). The regression coefficient was
0.23463 and the intercept was �/4.54684 (resulting
J.C. Anderson et al. / Journal of Clinical Virology 28 (2003) 27�/37 31

in a regression equation of log10 copies/ml�/
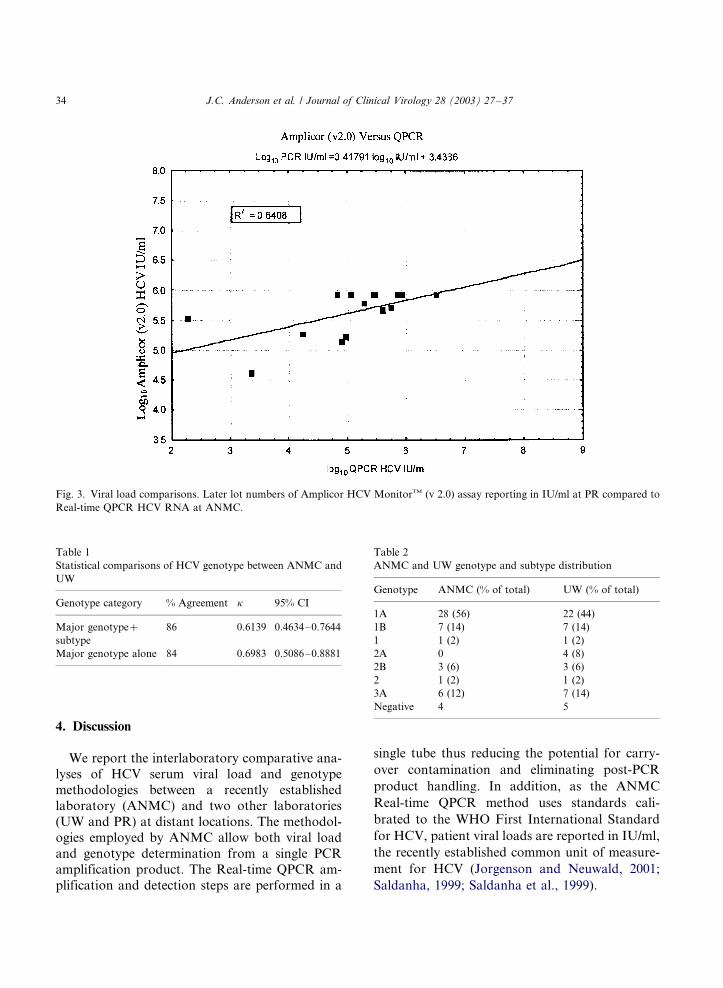
0.23463 log10 IU/ml�/4.54684). The later lot num-
bers reporting in IU/ml used by PR performed
much better than the earlier lot numbers reporting
in copies/ml as compared to ANMC results (R2�/
0.6408; Fig. 3). The regression equation obtained
was log10 PR IU/ml�/0.41791 log10 IU/ml�/
3.4386. Our regression coefficient of 0.41791 for
this comparison was still significantly different
from Jorgensen and Neuwald of 0.9081 (P�/
0.0003) (Jorgenson and Neuwald, 2001). Our
intercept of �/3.4386 was also significantly differ-
ent from theirs of 0.4335 (P�/0.0001). Clearly, the
above regression coefficients derived from this
interlaboratory comparison study would result in
a high degree of variability when converting
patient viral loads into the different units of
measurement used by each clinical laboratory.
Overall, these results are significantly different
from Jorgenson and Neuwald’s viral load compar-
ison study which used only the NAPTM HCV
standard panel (Jorgenson and Neuwald, 2001).
Two different sets of HCV genotype data have
been analyzed between ANMC and UW, as well as
between ANMC and PR. The first set is the major
genotype including subtype. The second set is just
the major genotype. The results of each compar-
ison are presented both as percent agreement, and
as Cohen’s kappa or Adjusted Rand Statistic
(Tables 1�/4). Cohen’s kappa (k ) is the amount
of agreement that is corrected for the amount of
agreement to be expected due to chance alone
(Cohen et al., 1960). The Adjusted Rand Statistic
is a measure of agreement when there are an
unequal number of categories (Fisher and Hoff-
man, 1988; Hubert and Arabie, 1985; Morey and
Agresti, 1984; Rand, 1971).
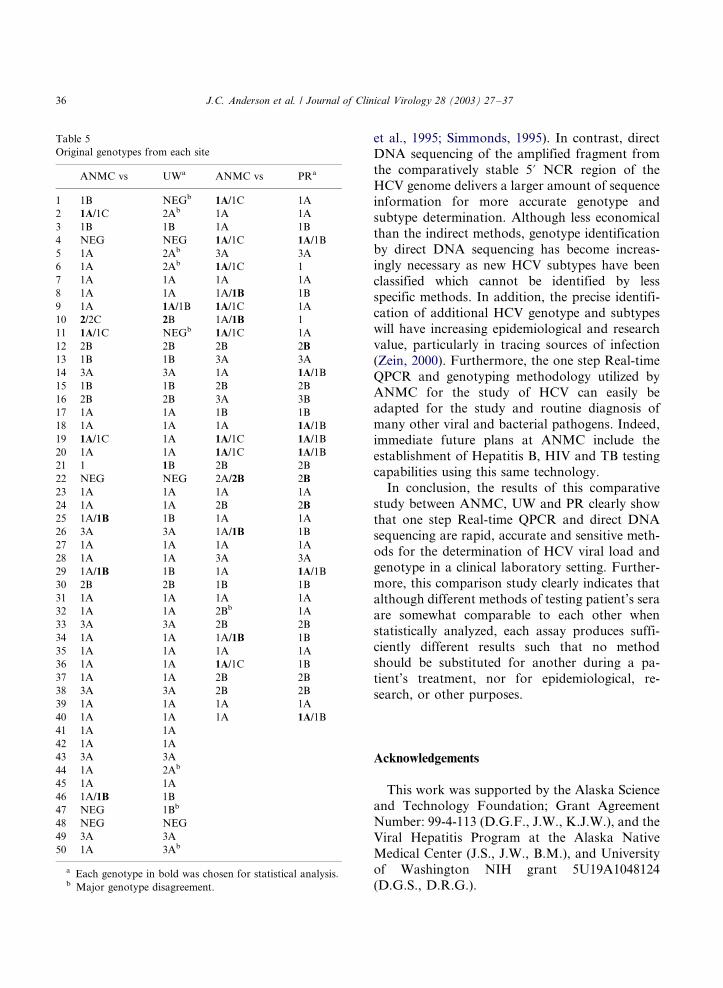
There were several instances of mixtures of
different subtypes at all three sites (note: all
genotyping data indicated that the subtype could
be one or the other, rather than a mixture of
subtypes) (Table 5). Because we were unable to
statistically compare subtype mixtures, obvious
patterns between the sites were used to adjust only
Fig. 1. Viral load comparisons. Quantiplex HCV bDNA at UW compared to Real-time QPCR HCV RNA at ANMC.
J.C. Anderson et al. / Journal of Clinical Virology 28 (2003) 27�/3732
subtype mixtures by adherence to the following
decisions to collapse mixed subtypes. Analysis of
ANMC�/UW comparisons demonstrated that
whenever UW had genotype 1A (or 2A), ANMC
had 1A/1C mix. In addition, when ANMC�/PR
comparisons were made, whenever PR had 1A or
1A/1B mix, ANMC had 1A/1C mix. Therefore, all
ANMC 1A/1C mixes and PR 1A/1B mixes were
set to 1A. Whenever UW had genotype 1B,
ANMC had 1B or 1A/1B mix. Therefore all
ANMC 1A/1B mixes were set to 1B (except in
one instance when ANMC had 1 and UW had 1B,
in which case the UW result was conservatively set
to 1 by deletion of the subtype). Conversely,
whenever UW had a 1A/1B mix, ANMC had
1A, therefore all UW 1A/1B mixes were set to 1A.
A single sample comparison in which ANMC had
2/2C and UW had 2B resulted in both genotypes
conservatively set to 2. When comparing ANMC�/
PR genotypes, whenever ANMC had 2B, PR had
only the major genotype of 2, therefore each PR
genotype 2 was set to 2B. In no case was there any
change in major genotype within any of the three
sets of data (Table 5). Table 2 (ANMC and UW)
and Table 4 (ANMC and PR) contain the final
genotype distribution comparisons that were used
for the analyses described below.
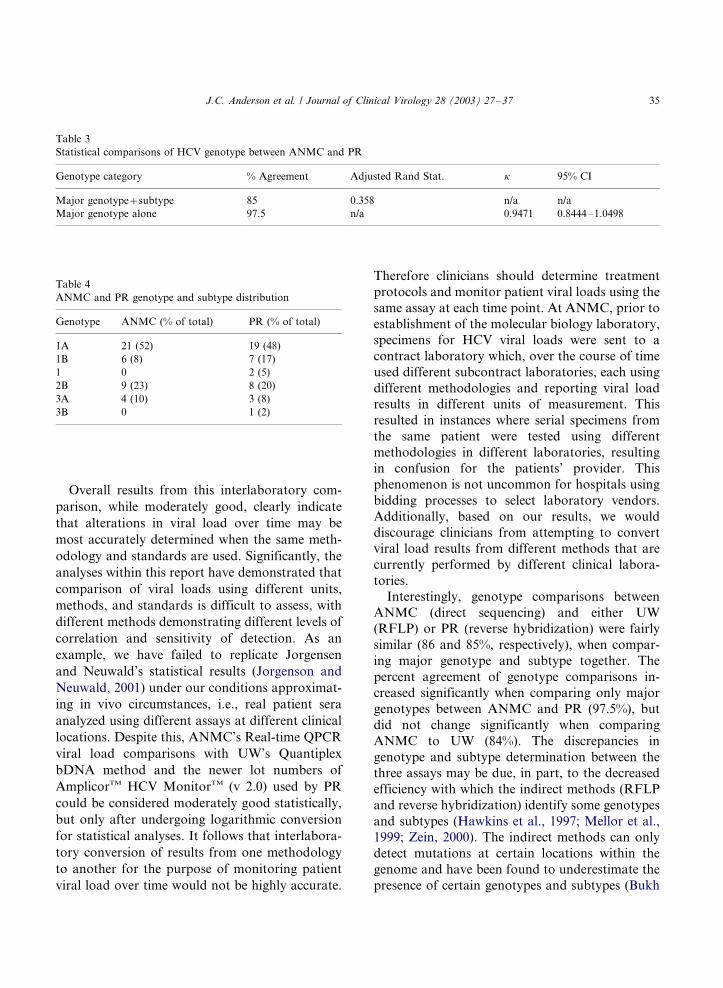
The ANMC�/UW comparison of major geno-
type with subtype showed a fair to good 86%
agreement and a k�/0.6139 (95% CI, 0.4634�/
0.7644) (Table 1). The ANMC�/UW comparison
of major genotype alone showed 84% agreement
with a k�/0.6983 (95% CI, 0.5086�/0.8881) (Table
1).
For the ANMC�/PR comparison of major
genotype with subtype we were not able to
calculate a k because ANMC used four categories
and PR used six categories. Therefore we calcu-
lated an Adjusted Rand Statistic which showed
85% agreement with an adjusted Rand of 0.358.
The ANMC�/PR comparison of major genotype
alone showed a high agreement of 97.5% with a
k�/0.9471 (95% CI, 0.8444�/1.0498).
Fig. 2. Viral load comparisons. Earlier lot numbers of Amplicor HCV MonitorTM (v 2.0) assay reporting in copies/ml at PR compared
to Real-time QPCR HCV RNA at ANMC.
J.C. Anderson et al. / Journal of Clinical Virology 28 (2003) 27�/37 33
4. Discussion
We report the interlaboratory comparative ana-
lyses of HCV serum viral load and genotypemethodologies between a recently established
laboratory (ANMC) and two other laboratories
(UW and PR) at distant locations. The methodol-
ogies employed by ANMC allow both viral load
and genotype determination from a single PCR
amplification product. The Real-time QPCR am-
plification and detection steps are performed in a
single tube thus reducing the potential for carry-
over contamination and eliminating post-PCR
product handling. In addition, as the ANMC
Real-time QPCR method uses standards cali-
brated to the WHO First International Standard
for HCV, patient viral loads are reported in IU/ml,
the recently established common unit of measure-
ment for HCV (Jorgenson and Neuwald, 2001;
Saldanha, 1999; Saldanha et al., 1999).
Fig. 3. Viral load comparisons. Later lot numbers of Amplicor HCV MonitorTM (v 2.0) assay reporting in IU/ml at PR compared to
Real-time QPCR HCV RNA at ANMC.
Table 1
Statistical comparisons of HCV genotype between ANMC and
UW
Genotype category % Agreement k 95% CI
Major genotype�/
subtype
86 0.6139 0.4634�/0.7644
Major genotype alone 84 0.6983 0.5086�/0.8881
Table 2
ANMC and UW genotype and subtype distribution
Genotype ANMC (% of total) UW (% of total)
1A 28 (56) 22 (44)
1B 7 (14) 7 (14)
1 1 (2) 1 (2)
2A 0 4 (8)
2B 3 (6) 3 (6)
2 1 (2) 1 (2)
3A 6 (12) 7 (14)
Negative 4 5
J.C. Anderson et al. / Journal of Clinical Virology 28 (2003) 27�/3734
Overall results from this interlaboratory com-
parison, while moderately good, clearly indicate
that alterations in viral load over time may be
most accurately determined when the same meth-
odology and standards are used. Significantly, the
analyses within this report have demonstrated that
comparison of viral loads using different units,
methods, and standards is difficult to assess, with
different methods demonstrating different levels of
correlation and sensitivity of detection. As an
example, we have failed to replicate Jorgensen
and Neuwald’s statistical results (Jorgenson and
Neuwald, 2001) under our conditions approximat-
ing in vivo circumstances, i.e., real patient sera
analyzed using different assays at different clinical
locations. Despite this, ANMC’s Real-time QPCR
viral load comparisons with UW’s Quantiplex
bDNA method and the newer lot numbers of
AmplicorTM HCV MonitorTM (v 2.0) used by PR
could be considered moderately good statistically,
but only after undergoing logarithmic conversion
for statistical analyses. It follows that interlabora-
tory conversion of results from one methodology
to another for the purpose of monitoring patient
viral load over time would not be highly accurate.
Therefore clinicians should determine treatment
protocols and monitor patient viral loads using the
same assay at each time point. At ANMC, prior to
establishment of the molecular biology laboratory,
specimens for HCV viral loads were sent to a
contract laboratory which, over the course of time
used different subcontract laboratories, each using
different methodologies and reporting viral load
results in different units of measurement. This
resulted in instances where serial specimens from
the same patient were tested using different
methodologies in different laboratories, resulting
in confusion for the patients’ provider. This
phenomenon is not uncommon for hospitals using
bidding processes to select laboratory vendors.
Additionally, based on our results, we would
discourage clinicians from attempting to convert
viral load results from different methods that are
currently performed by different clinical labora-
tories.
Interestingly, genotype comparisons between
ANMC (direct sequencing) and either UW
(RFLP) or PR (reverse hybridization) were fairly
similar (86 and 85%, respectively), when compar-
ing major genotype and subtype together. The
percent agreement of genotype comparisons in-
creased significantly when comparing only major
genotypes between ANMC and PR (97.5%), but
did not change significantly when comparing
ANMC to UW (84%). The discrepancies in
genotype and subtype determination between the
three assays may be due, in part, to the decreased
efficiency with which the indirect methods (RFLP
and reverse hybridization) identify some genotypes
and subtypes (Hawkins et al., 1997; Mellor et al.,
1999; Zein, 2000). The indirect methods can only
detect mutations at certain locations within the
genome and have been found to underestimate the
presence of certain genotypes and subtypes (Bukh
Table 3
Statistical comparisons of HCV genotype between ANMC and PR
Genotype category % Agreement Adjusted Rand Stat. k 95% CI
Major genotype�/subtype 85 0.358 n/a n/a
Major genotype alone 97.5 n/a 0.9471 0.8444�/1.0498
Table 4
ANMC and PR genotype and subtype distribution
Genotype ANMC (% of total) PR (% of total)
1A 21 (52) 19 (48)
1B 6 (8) 7 (17)
1 0 2 (5)
2B 9 (23) 8 (20)
3A 4 (10) 3 (8)
3B 0 1 (2)
J.C. Anderson et al. / Journal of Clinical Virology 28 (2003) 27�/37 35
et al., 1995; Simmonds, 1995). In contrast, directDNA sequencing of the amplified fragment from
the comparatively stable 5? NCR region of the
HCV genome delivers a larger amount of sequence
information for more accurate genotype and
subtype determination. Although less economical
than the indirect methods, genotype identification
by direct DNA sequencing has become increas-
ingly necessary as new HCV subtypes have beenclassified which cannot be identified by less
specific methods. In addition, the precise identifi-
cation of additional HCV genotype and subtypes
will have increasing epidemiological and research
value, particularly in tracing sources of infection
(Zein, 2000). Furthermore, the one step Real-time
QPCR and genotyping methodology utilized by
ANMC for the study of HCV can easily beadapted for the study and routine diagnosis of
many other viral and bacterial pathogens. Indeed,
immediate future plans at ANMC include the
establishment of Hepatitis B, HIV and TB testing
capabilities using this same technology.
In conclusion, the results of this comparative
study between ANMC, UW and PR clearly show
that one step Real-time QPCR and direct DNAsequencing are rapid, accurate and sensitive meth-
ods for the determination of HCV viral load and
genotype in a clinical laboratory setting. Further-
more, this comparison study clearly indicates that
although different methods of testing patient’s sera
are somewhat comparable to each other when
statistically analyzed, each assay produces suffi-
ciently different results such that no methodshould be substituted for another during a pa-
tient’s treatment, nor for epidemiological, re-
search, or other purposes.
Acknowledgements
This work was supported by the Alaska Scienceand Technology Foundation; Grant Agreement
Number: 99-4-113 (D.G.F., J.W., K.J.W.), and the
Viral Hepatitis Program at the Alaska Native
Medical Center (J.S., J.W., B.M.), and University
of Washington NIH grant 5U19A1048124
(D.G.S., D.R.G.).
Table 5
Original genotypes from each site
ANMC vs UWa ANMC vs PRa
1 1B NEGb 1A/1C 1A
2 1A/1C 2Ab 1A 1A
3 1B 1B 1A 1B
4 NEG NEG 1A/1C 1A/1B
5 1A 2Ab 3A 3A
6 1A 2Ab 1A/1C 1
7 1A 1A 1A 1A
8 1A 1A 1A/1B 1B
9 1A 1A/1B 1A/1C 1A
10 2/2C 2B 1A/1B 1
11 1A/1C NEGb 1A/1C 1A
12 2B 2B 2B 2B
13 1B 1B 3A 3A
14 3A 3A 1A 1A/1B
15 1B 1B 2B 2B
16 2B 2B 3A 3B
17 1A 1A 1B 1B
18 1A 1A 1A 1A/1B
19 1A/1C 1A 1A/1C 1A/1B
20 1A 1A 1A/1C 1A/1B
21 1 1B 2B 2B
22 NEG NEG 2A/2B 2B
23 1A 1A 1A 1A
24 1A 1A 2B 2B
25 1A/1B 1B 1A 1A
26 3A 3A 1A/1B 1B
27 1A 1A 1A 1A
28 1A 1A 3A 3A
29 1A/1B 1B 1A 1A/1B
30 2B 2B 1B 1B
31 1A 1A 1A 1A
32 1A 1A 2Bb 1A
33 3A 3A 2B 2B
34 1A 1A 1A/1B 1B
35 1A 1A 1A 1A
36 1A 1A 1A/1C 1B
37 1A 1A 2B 2B
38 3A 3A 2B 2B
39 1A 1A 1A 1A
40 1A 1A 1A 1A/1B
41 1A 1A
42 1A 1A
43 3A 3A
44 1A 2Ab
45 1A 1A
46 1A/1B 1B
47 NEG 1Bb
48 NEG NEG
49 3A 3A
50 1A 3Ab
a Each genotype in bold was chosen for statistical analysis.b Major genotype disagreement.
J.C. Anderson et al. / Journal of Clinical Virology 28 (2003) 27�/3736
References
Alter MJ, Kruszon-Moran D, Nainan OV, McQuillan GM,
Gao F, Moyer LA, et al. The epidemiology of hepatitis C
virus infection in the United States, 1988 through 1994. N
Engl J Med 1999;341:556�/62.
Arens M. Clinically relevant sequence-based genotyping of
HBV, HCV, CMV and HIV. J Clin Virol 2001;22:11�/29.
Bukh J, Miller RH, Purcell RH. Genetic heterogeneity of
hepatitis C virus; quasispecies and genotypes. Semin Liver
Dis 1995;15:41�/63.
Carithers RL, Marquarot A, Gretch DR. Diagnostic testing for
hepatitis C. Semin Liver Dis 2000;20:159�/71.
Cary NC. SAS/STAT User’s Guide, Version 8. SAS Institute,
Inc.; 1999.
Chen Y, Cooper DL, Ehrlich GD. Comparative analysis of
three nucleic acid-based detection systems for hepatitis C
virus RNA in plasma from liver transplant recipients. Mol
Cell Probes 1996;10:331�/6.
Cohen J. A coefficient of agreement for nominal scales. Educ
Psychol Measurement 1960;20:37�/46.
Cohen J. The scientific challenge of hepatitis C. Science
1999;285:26�/30.
Davidson F, Simmonds P, Ferguson JC, Jarvis LM, Dow BC,
Follett EA, et al. Survey of major genotypes and subtypes of
hepatitis C virus using RFLP of sequences amplified from
the 5? non-coding region. J Gen Virol 1995;76:1197�/204.
Di Bisceglie AM, Order SE, Klein JL, Waggoner JG, Sjogren
MH, Kuo G, et al. The role of chronic viral hepatitis in
hepatocellular carcinoma in the United States. Am J
Gastroenterol 1991;86:335�/8.
EASL International Consensus Conference on Hepatitis C.
Concensus Statement. J. Hepatol. 1999;30:956�/61.
Fisher DG, Hoffman P. The adjusted Rand statistic: a SAS
macro. Psychometrika 1988;53:417�/23.
Hawkins A, Davidson F, Simmonds P. Comparison of plasma
virus loads among individuals infected with hepatitis C virus
(HCV) genotypes 1, 2, and 3 by quantiplex HCV RNA
assay version 1 and 2, Roche Monitor Assay, and an in-
house limiting dilution method. J Clin Microbiol
1997;35:187�/92.
Hepatitis C Fact Sheet, CDC Website.
Hubert L, Arabie P. Camparing partitions. J Classification
1985;2:193�/218.
Jorgenson PA, Neuwald PD. Standardized hepatitis C virus
RNA panels for nucleic acid testing assays. J Clin Virol
2001;20:35�/40.
Kawai S, Yokosuka O, Kanda T, Imazeki F, Maru Y, Saisho
H. Quantification of hepatitis C virus by Taqman PCR:
comparison with HCV Amplicor Monitor assay. J Med
Virol 1999;58:121�/6.
Le Pogam S, Dubois F, Christen R, Raby C, Cavicchini A,
Goudeau A. Comparison of DNA enzyme immunoassay
and line probe assays (Inno-LiPA HCV I and II) for
hepatitis C virus genotyping. J Clin Microbiol
1998;36:1461�/3.
Management of Hepatitis C, NIH Consensus Statement Online.
Martell M, Gomez J, Esteban JI, Sauleda S, Quer J, Cabot B, et
al. High-throughput Real-Time reverse transcription-PCR
quantitation of hepatitis C virus RNA. J Clin Microbiol
1999;37:327�/32.
McHutchinson JG, Gordon SC, Schiff ER, Shiffman ML, Lee
WM, Rustgi UK, et al. Interferon alpha-2b alone or in
combination with Ribavirin as initial treatment for chronic
hepatitis C. N Engl J Med 1998;339:1485�/92.
Mellor J, Hawkins A, Simmonds P. Genotype dependence of
Hepatitis C virus load measurements in commercially
available quantitative assays. J Clin Microbiol 1999:37.
Morey L, Agresti A. The measurement of classification agree-
ment: an adjustment to the Rand statistic for chance
agreement. Educ Psychol Measurement 1984;44:33�/7.
Morishima C, Gretch DR. Clinical use of hepatitis C virus tests
for diagnosis and monitoring during therapy. In: Keefe EB,
editor. Treatment of chronic hepatitis C. Philadelphia:
Saunders, WB, 1999:717�/40.
Pawlotsky J-M, Bouvier-Alias M, Hesode C, Darthuy F,
Remire J, Dhumeaux D. Standardization of hepatitis C
virus quantification. Hepatology 2000;32:654�/9.
Poynard T, Marcellin P, Lee SS, Niederau C, Minuk GS, Ideo
G, et al. Randomized trial of Interferon alpha-2b plus
Ribavirin for 48 weeks or 24 weeks versus Interferon alpha-
2b plus placebo for 48 weeks for treatment of
chronic infection with hepatitis C virus. Lancet
1998;352:1426�/32.
Rand WM. Objective criteria for the evaluation of clustering
methods. J Am Stat Assoc 1971;66:846�/50.
Saldanha J. Standardization: a progress report. Biologicals
1999;27:285�/9.
WHO Collaborative Study Group, Saldanha J, Lelie N, Heath
A. Establishment of the First International Standard for
Nucleic Acid Amplification Technology (NAT) Assays for
HCV RNA. Vox Sang 1999;76:149�/58.
Simmonds P. Variability of hepatitis C virus. Hepatology
1995;21:570�/83.
Takeuchi T, Katsume A, Tanaka T, Abe A, Inoue K,
Tsukiyama-Kohara K, et al. Real-Time detection system
for quantification of hepatitis C virus genome. Gastroenter-
ology 1999;116:636�/42.
Thomas DL, Lemon SM. Hepatitis C. In: Mandell GL, Bennett
JF, Dolin R, editors. Principles and practice of disease,
2000:1736�/60.
Tibor L, Funk E, Beller M. Hepatitis C. State Alaska
Epidemiol Bull 1999:3.
Zein NN. Clinical significance of hepatitis C virus genotypes.
Clin Microbiol Rev 2000;13:223�/35.
J.C. Anderson et al. / Journal of Clinical Virology 28 (2003) 27�/37 37
Copyright © 2022 FDOKUMEN