Liver fibrosis, microbial translocation and immune activation markers in HIV and HCV infections and...
8
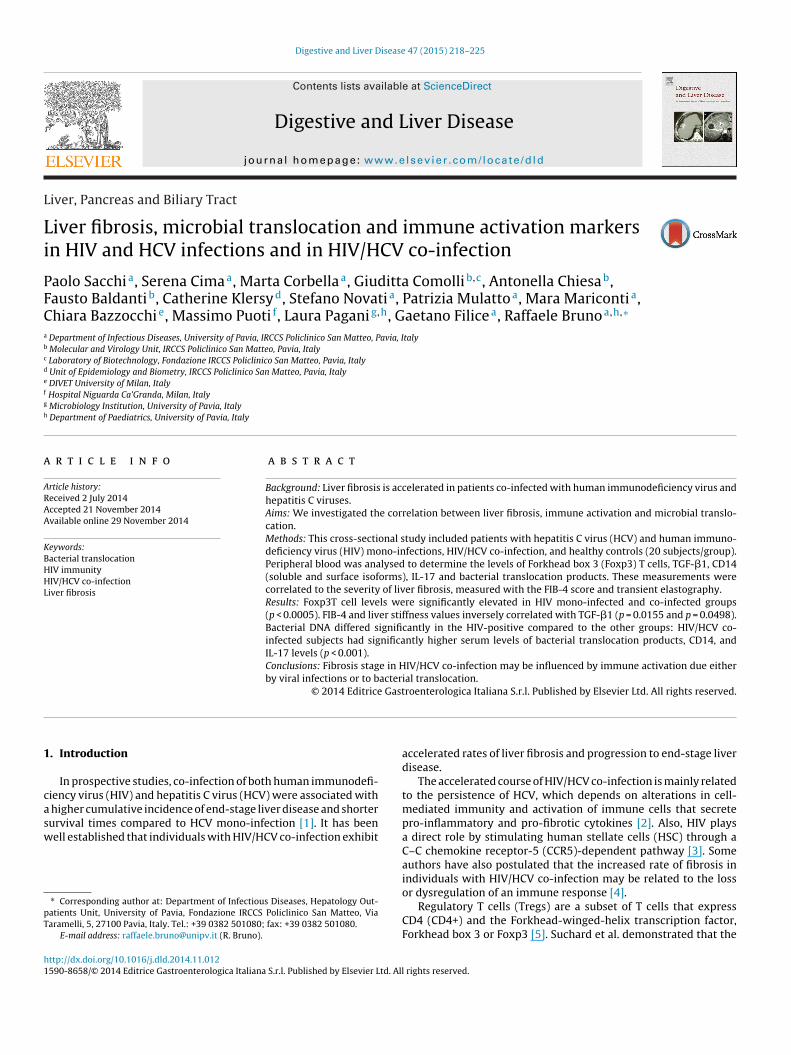
Digestive and Liver Disease 47 (2015) 218–225 Contents lists available at ScienceDirect Digestive and Liver Disease journal h om epage: www.elsevier.com/locate/dld Liver, Pancreas and Biliary Tract Liver fibrosis, microbial translocation and immune activation markers in HIV and HCV infections and in HIV/HCV co-infection Paolo Sacchi a , Serena Cima a , Marta Corbella a , Giuditta Comolli b,c , Antonella Chiesa b , Fausto Baldanti b , Catherine Klersy d , Stefano Novati a , Patrizia Mulatto a , Mara Mariconti a , Chiara Bazzocchi e , Massimo Puoti f , Laura Pagani g,h , Gaetano Filice a , Raffaele Bruno a,h,∗ a Department of Infectious Diseases, University of Pavia, IRCCS Policlinico San Matteo, Pavia, Italy b Molecular and Virology Unit, IRCCS Policlinico San Matteo, Pavia, Italy c Laboratory of Biotechnology, Fondazione IRCCS Policlinico San Matteo, Pavia, Italy d Unit of Epidemiology and Biometry, IRCCS Policlinico San Matteo, Pavia, Italy e DIVET University of Milan, Italy f Hospital Niguarda Ca’Granda, Milan, Italy g Microbiology Institution, University of Pavia, Italy h Department of Paediatrics, University of Pavia, Italy a r t i c l e i n f o Article history: Received 2 July 2014 Accepted 21 November 2014 Available online 29 November 2014 Keywords: Bacterial translocation HIV immunity HIV/HCV co-infection Liver fibrosis a b s t r a c t Background: Liver fibrosis is accelerated in patients co-infected with human immunodeficiency virus and hepatitis C viruses. Aims: We investigated the correlation between liver fibrosis, immune activation and microbial translo- cation. Methods: This cross-sectional study included patients with hepatitis C virus (HCV) and human immuno- deficiency virus (HIV) mono-infections, HIV/HCV co-infection, and healthy controls (20 subjects/group). Peripheral blood was analysed to determine the levels of Forkhead box 3 (Foxp3) T cells, TGF-1, CD14 (soluble and surface isoforms), IL-17 and bacterial translocation products. These measurements were correlated to the severity of liver fibrosis, measured with the FIB-4 score and transient elastography. Results: Foxp3T cell levels were significantly elevated in HIV mono-infected and co-infected groups (p < 0.0005). FIB-4 and liver stiffness values inversely correlated with TGF-1 (p = 0.0155 and p = 0.0498). Bacterial DNA differed significantly in the HIV-positive compared to the other groups: HIV/HCV co- infected subjects had significantly higher serum levels of bacterial translocation products, CD14, and IL-17 levels (p < 0.001). Conclusions: Fibrosis stage in HIV/HCV co-infection may be influenced by immune activation due either by viral infections or to bacterial translocation. © 2014 Editrice Gastroenterologica Italiana S.r.l. Published by Elsevier Ltd. All rights reserved. 1. Introduction In prospective studies, co-infection of both human immunodefi- ciency virus (HIV) and hepatitis C virus (HCV) were associated with a higher cumulative incidence of end-stage liver disease and shorter survival times compared to HCV mono-infection [1]. It has been well established that individuals with HIV/HCV co-infection exhibit ∗ Corresponding author at: Department of Infectious Diseases, Hepatology Out- patients Unit, University of Pavia, Fondazione IRCCS Policlinico San Matteo, Via Taramelli, 5, 27100 Pavia, Italy. Tel.: +39 0382 501080; fax: +39 0382 501080. E-mail address: [email protected] (R. Bruno). accelerated rates of liver fibrosis and progression to end-stage liver disease. The accelerated course of HIV/HCV co-infection is mainly related to the persistence of HCV, which depends on alterations in cell- mediated immunity and activation of immune cells that secrete pro-inflammatory and pro-fibrotic cytokines [2]. Also, HIV plays a direct role by stimulating human stellate cells (HSC) through a C–C chemokine receptor-5 (CCR5)-dependent pathway [3]. Some authors have also postulated that the increased rate of fibrosis in individuals with HIV/HCV co-infection may be related to the loss or dysregulation of an immune response [4]. Regulatory T cells (Tregs) are a subset of T cells that express CD4 (CD4+) and the Forkhead-winged-helix transcription factor, Forkhead box 3 or Foxp3 [5]. Suchard et al. demonstrated that the http://dx.doi.org/10.1016/j.dld.2014.11.012 1590-8658/© 2014 Editrice Gastroenterologica Italiana S.r.l. Published by Elsevier Ltd. All rights reserved.
Transcript of Liver fibrosis, microbial translocation and immune activation markers in HIV and HCV infections and...
L
Li
PFCa
b
c
d
e
f
g
h
a
ARAA
KBHHL
1
casw
pT
h1
Digestive and Liver Disease 47 (2015) 218–225
Contents lists available at ScienceDirect
Digestive and Liver Disease
journa l h om epage: www.elsev ier .com/ locate /d ld
iver, Pancreas and Biliary Tract
iver fibrosis, microbial translocation and immune activation markersn HIV and HCV infections and in HIV/HCV co-infection
aolo Sacchia, Serena Cimaa, Marta Corbellaa, Giuditta Comollib,c, Antonella Chiesab,austo Baldantib, Catherine Klersyd, Stefano Novati a, Patrizia Mulattoa, Mara Mariconti a,hiara Bazzocchie, Massimo Puoti f, Laura Paganig,h, Gaetano Filicea, Raffaele Brunoa,h,∗
Department of Infectious Diseases, University of Pavia, IRCCS Policlinico San Matteo, Pavia, ItalyMolecular and Virology Unit, IRCCS Policlinico San Matteo, Pavia, ItalyLaboratory of Biotechnology, Fondazione IRCCS Policlinico San Matteo, Pavia, ItalyUnit of Epidemiology and Biometry, IRCCS Policlinico San Matteo, Pavia, ItalyDIVET University of Milan, ItalyHospital Niguarda Ca’Granda, Milan, ItalyMicrobiology Institution, University of Pavia, ItalyDepartment of Paediatrics, University of Pavia, Italy
r t i c l e i n f o
rticle history:eceived 2 July 2014ccepted 21 November 2014vailable online 29 November 2014
eywords:acterial translocationIV immunityIV/HCV co-infectioniver fibrosis
a b s t r a c t
Background: Liver fibrosis is accelerated in patients co-infected with human immunodeficiency virus andhepatitis C viruses.Aims: We investigated the correlation between liver fibrosis, immune activation and microbial translo-cation.Methods: This cross-sectional study included patients with hepatitis C virus (HCV) and human immuno-deficiency virus (HIV) mono-infections, HIV/HCV co-infection, and healthy controls (20 subjects/group).Peripheral blood was analysed to determine the levels of Forkhead box 3 (Foxp3) T cells, TGF-�1, CD14(soluble and surface isoforms), IL-17 and bacterial translocation products. These measurements werecorrelated to the severity of liver fibrosis, measured with the FIB-4 score and transient elastography.Results: Foxp3T cell levels were significantly elevated in HIV mono-infected and co-infected groups(p < 0.0005). FIB-4 and liver stiffness values inversely correlated with TGF-�1 (p = 0.0155 and p = 0.0498).
Bacterial DNA differed significantly in the HIV-positive compared to the other groups: HIV/HCV co-infected subjects had significantly higher serum levels of bacterial translocation products, CD14, andIL-17 levels (p < 0.001).Conclusions: Fibrosis stage in HIV/HCV co-infection may be influenced by immune activation due eitherby viral infections or to bacterial translocation.© 2014 Editrice Gastroenterologica Italiana S.r.l. Published by Elsevier Ltd. All rights reserved.
. Introduction
In prospective studies, co-infection of both human immunodefi-iency virus (HIV) and hepatitis C virus (HCV) were associated with
higher cumulative incidence of end-stage liver disease and shorter
urvival times compared to HCV mono-infection [1]. It has beenell established that individuals with HIV/HCV co-infection exhibit∗ Corresponding author at: Department of Infectious Diseases, Hepatology Out-atients Unit, University of Pavia, Fondazione IRCCS Policlinico San Matteo, Viaaramelli, 5, 27100 Pavia, Italy. Tel.: +39 0382 501080; fax: +39 0382 501080.
E-mail address: [email protected] (R. Bruno).
ttp://dx.doi.org/10.1016/j.dld.2014.11.012590-8658/© 2014 Editrice Gastroenterologica Italiana S.r.l. Published by Elsevier Ltd. All
accelerated rates of liver fibrosis and progression to end-stage liverdisease.
The accelerated course of HIV/HCV co-infection is mainly relatedto the persistence of HCV, which depends on alterations in cell-mediated immunity and activation of immune cells that secretepro-inflammatory and pro-fibrotic cytokines [2]. Also, HIV playsa direct role by stimulating human stellate cells (HSC) through aC–C chemokine receptor-5 (CCR5)-dependent pathway [3]. Someauthors have also postulated that the increased rate of fibrosis inindividuals with HIV/HCV co-infection may be related to the loss
or dysregulation of an immune response [4].Regulatory T cells (Tregs) are a subset of T cells that expressCD4 (CD4+) and the Forkhead-winged-helix transcription factor,Forkhead box 3 or Foxp3 [5]. Suchard et al. demonstrated that the
rights reserved.
Liver
loo
ciri(tfcaand
ptdIihc
peifiltio
baa
aam
2
2
mUmiomaPcabvh
2
ma
P. Sacchi et al. / Digestive and
evel of Foxp3 expression in the CD4+ T cell population is a markerf the severity of HIV infection and a potential prognostic markerf disease progression [6].
Alterations in the cytokine network have important impli-ations, on both global immune regulation and on the specificmmunologic alterations that occur in subjects with HIV/HCV. Inesponse to infection, the host immune response is mediated bynflammatory cytokines, including tumour necrosis factor-alphaTNF-�), interleukin-1 (IL-1), IL-6, and interferons (IFN) [7]. In addi-ion, alterations in Treg cells or the levels of transforming growthactor beta1 (TGF-�1), a regulatory cytokine released by numerousell types during inflammation [8], might be involved in the acceler-ted course of liver fibrosis characteristically observed in individu-ls with HIV/HCV co-infection. HIV/HCV co-infection induces a sig-ificant increase in TGF-�1, a central mediator of liver fibrogenesis,etected in the liver and serum of patients and in cell culture [9–12].
Microbial translocation is likely to promote liver fibrosis inatients with HIV/HCV co-infection via two main mechanismshat activate Kupffer cells and HSCs [13]. First, microbial productsirectly induce the secretion of pro-fibrotic cytokines, including
L-4, IL-5, IL-13, and TGF-� [14]. Second, microbial products [15]ndirectly induce systemic immune responses and promote local,epatocyte activation-induced apoptotic death, which results inollagen deposition [16].
Lipopolysaccharide (LPS) and toll-like receptor (TLR) 4, bothroducts of microbial translocation, play key roles in the pathogen-sis of HCV infections. Patients with chronic HCV infections displayncreased serum levels of LPS, even in the absence of significantbrosis [17]. In HIV patients, the early damage of gut associated
ymphoid tissue causes an increase of microbial translocation andhe presence of increased LPS blood levels. Thus, in HIV/HCV co-nfection, increased levels of LPS may act to drive the developmentf more frequent and more rapid progression of liver disease.
The primary aim of this study was to assess the correlationsetween liver fibrosis, microbial translocation, and immune-ctivation markers in subjects with HIV and HCV mono-infectionsnd in HIV/HCV co-infection, compared to healthy controls.
A secondary aim was to investigate whether markers of immunectivation, fibrogenesis, and microbial translocation were related tolterations in glucose metabolism, calculated with the homeostasisodel assessment (HOMA) score.
. Materials and methods
.1. Study design and patients
This cross-sectional study included 80 subjects at the Depart-ent of infectious Diseases of Policlinico San Matteo, Pavianiversity. The study population included patients with HIVono-infection (n = 20), HCV mono-infection (n = 20), HIV/HCV co-
nfection (n = 20), and healthy controls (n = 20). All subjects werever 18 years of age and had undergone a biochemical assess-ent. HCV infection was diagnosed based on the presence of serum
ntibodies against HCV and detectable serum HCV RNA (real timeCR). Patients in both mono- and co-infected HCV+ groups hadhronic hepatitis. All patients with HIV infection were receivingnti-retroviral therapy. Healthy controls were sero-negative foroth HIV and HCV. Patients were excluded if they had been pre-iously diagnosed with diabetes, hepatitis B, or cirrhosis, or if theyad a history of excessive alcohol intake.
.2. Biochemical assessment
All patients underwent a biochemical assessment to deter-ine serum levels of aspartate aminotransferase (AST), alanine
minotransferase (ALT), platelets, albumin, cholesterol, CD4,
Disease 47 (2015) 218–225 219
HCV-RNA, HIV-RNA, insulin, and glucose. The FIB4 score wascalculated as follows: (age [years] × AST [U/L])/(platelet count[×109/L]) × (ALT2 [U/L]). A cut-off FIB4 value >3.25 is consistentwith significant (F3–F4) fibrosis at a sensitivity of 70% and aspecificity of 86–97% in individuals with HIV/HCV co-infection[18]. For each patient, insulin resistance was determined withthe HOMA calculation: fasting plasma insulin (�U/ml) × fastingplasma glucose (ml/L)/22.5 [19].
2.3. Liver stiffness measurement
Liver stiffness was measured with transient elastography, per-formed with a FibroScan® apparatus (Echosens, Paris, France) by asingle operator (a staff physician), who had previously performedat least 100 determinations in patients with chronic liver disease.In each patient examination, at least ten valid measures of liverstiffness were obtained. To guarantee the validity of the transientelastography results, only examinations with an interquartile range(IQR) smaller than 30% of the median value and a success rate ofacquisitions greater than 60% were analysed. The median valueof all tests per patient was expressed in kilopascal (kPa) units.Advanced liver fibrosis (severe fibrosis or cirrhosis, correspond-ing to Metavir scores of F3 and F4) was defined as a liver stiffness≥9.5 kPa, based on previous studies from patients with HCV mono-infection and HIV/HCV co-infection [20–22].
2.4. Flow cytometric analysis of CD4+CD25+Foxp3+ T-cells
Peripheral blood mononuclear cells (PBMCs) were isolated bydensity gradient centrifugation. Then, 106 PBMCs were washedwith phosphate-buffered saline (PBS) with 2% EDTA and stainedfor surface markers with a FITC-conjugated monoclonal antibody(MoAb) against Human CD4 (eBioscience) or a phycoerythrin-cyanine tandem (PE-Cy®)-conjugated mouse MoAb against humanCD25 (BD Pharmingen). Cells were stained for 30 min at 4 ◦Caccording to the manufacturer’s instructions. Cells were thenwashed with 2 ml PBS, resuspended, and incubated in 1 ml fixa-tion/permeabilization solution (eBioscience) for 30 min at 4 ◦C.
The permeabilized cells were washed twice with 2 mlPerm/Wash Buffer (BD Biosciences) and stained for intracellularmarkers by incubating with the PE-conjugated MoAb, anti-humanFoxp3 (eBioscience) at 4 ◦C for 30 min according to manufacturer’sinstructions. After intracellular staining, cells were washed withpermeabilization buffer and resuspended in 1% paraformaldehyde.Isotype-matched MoAbs were prepared for each sample.
Cell acquisition and analysis were performed with a Cytomics FC500 flow cytometer (Beckman Coulter). Colour compensation wasachieved with an appropriate single fluorochrome-labelled sample.For each sample, a minimum of 50,000 CD4+ events were acquired.
2.5. Determination of monocyte subpopulations in peripheralblood with flow cytometry
For direct immunofluorescence labelling, 100 �l whole bloodwas incubated with 10 �l FITC-conjugated anti-human CD14 MoAb(BD Pharmingen) and with 10 �l PE CyTM-conjugated mouse anti-human CD16 MoAb (BD Pharmingen) for 15 min at room tempera-ture. For erythrocyte lysis, we added 2 ml of lysis solution from theImmunoprep Reagent System (Beckman Coulter). Fixed cells wereanalysed by flow cytometry (Cytomics FC 500 Beckman Coulter).
2.6. TGF-ˇ1, sCD14, and IL-17
Biomarker levels were measured in all blood samples. Enzyme-linked immunosorbent assays (ELISA) were used to identify cellsthat expressed TGF-�1 (human TGF-�1, Quantikine ELISA kit, R&D
220 P. Sacchi et al. / Digestive and Liver Disease 47 (2015) 218–225
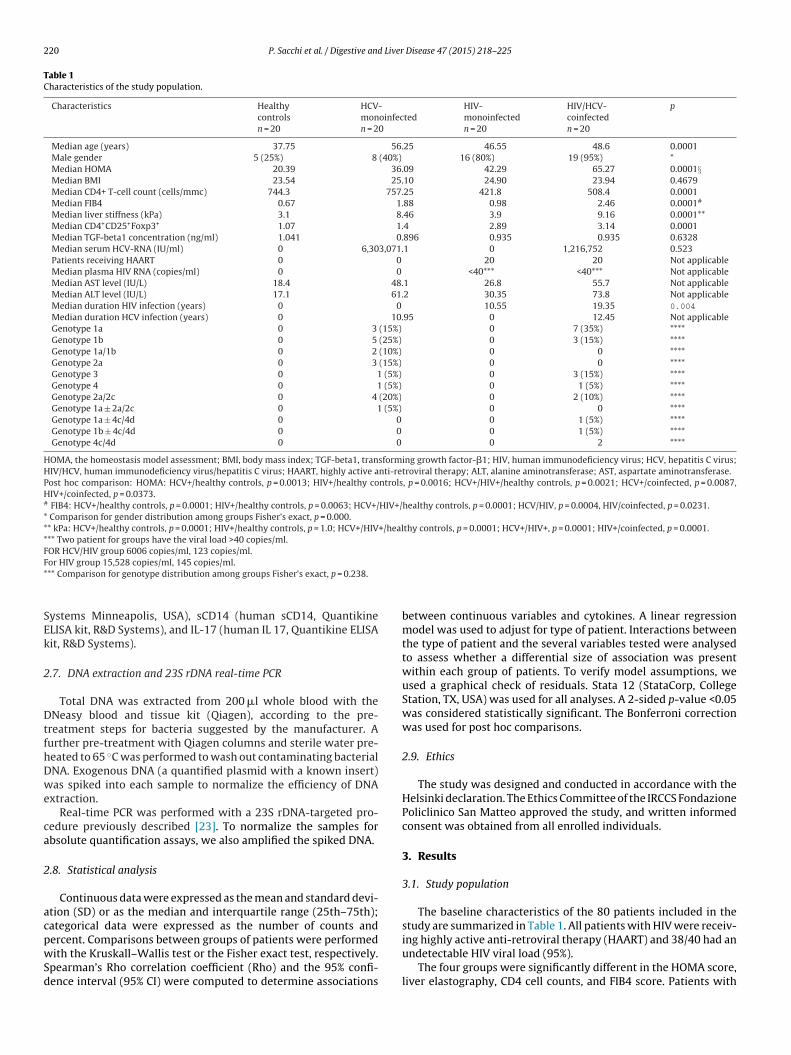
Table 1Characteristics of the study population.
Characteristics Healthycontrolsn = 20
HCV-monoinfectedn = 20
HIV-monoinfectedn = 20
HIV/HCV-coinfectedn = 20
p
Median age (years) 37.75 56.25 46.55 48.6 0.0001Male gender 5 (25%) 8 (40%) 16 (80%) 19 (95%) *Median HOMA 20.39 36.09 42.29 65.27 0.0001§Median BMI 23.54 25.10 24.90 23.94 0.4679Median CD4+ T-cell count (cells/mmc) 744.3 757.25 421.8 508.4 0.0001Median FIB4 0.67 1.88 0.98 2.46 0.0001#
Median liver stiffness (kPa) 3.1 8.46 3.9 9.16 0.0001**Median CD4+CD25+Foxp3+ 1.07 1.4 2.89 3.14 0.0001Median TGF-beta1 concentration (ng/ml) 1.041 0.896 0.935 0.935 0.6328Median serum HCV-RNA (IU/ml) 0 6,303,071.1 0 1,216,752 0.523Patients receiving HAART 0 0 20 20 Not applicableMedian plasma HIV RNA (copies/ml) 0 0 <40*** <40*** Not applicableMedian AST level (IU/L) 18.4 48.1 26.8 55.7 Not applicableMedian ALT level (IU/L) 17.1 61.2 30.35 73.8 Not applicableMedian duration HIV infection (years) 0 0 10.55 19.35 0.004
Median duration HCV infection (years) 0 10.95 0 12.45 Not applicableGenotype 1a 0 3 (15%) 0 7 (35%) ****Genotype 1b 0 5 (25%) 0 3 (15%) ****Genotype 1a/1b 0 2 (10%) 0 0 ****Genotype 2a 0 3 (15%) 0 0 ****Genotype 3 0 1 (5%) 0 3 (15%) ****Genotype 4 0 1 (5%) 0 1 (5%) ****Genotype 2a/2c 0 4 (20%) 0 2 (10%) ****Genotype 1a ± 2a/2c 0 1 (5%) 0 0 ****Genotype 1a ± 4c/4d 0 0 0 1 (5%) ****Genotype 1b ± 4c/4d 0 0 0 1 (5%) ****Genotype 4c/4d 0 0 0 2 ****
HOMA, the homeostasis model assessment; BMI, body mass index; TGF-beta1, transforming growth factor-�1; HIV, human immunodeficiency virus; HCV, hepatitis C virus;HIV/HCV, human immunodeficiency virus/hepatitis C virus; HAART, highly active anti-retroviral therapy; ALT, alanine aminotransferase; AST, aspartate aminotransferase.Post hoc comparison: HOMA: HCV+/healthy controls, p = 0.0013; HIV+/healthy controls, p = 0.0016; HCV+/HIV+/healthy controls, p = 0.0021; HCV+/coinfected, p = 0.0087,HIV+/coinfected, p = 0.0373.# FIB4: HCV+/healthy controls, p = 0.0001; HIV+/healthy controls, p = 0.0063; HCV+/HIV+/healthy controls, p = 0.0001; HCV/HIV, p = 0.0004, HIV/coinfected, p = 0.0231.* Comparison for gender distribution among groups Fisher’s exact, p = 0.000.** kPa: HCV+/healthy controls, p = 0.0001; HIV+/healthy controls, p = 1.0; HCV+/HIV+/healthy controls, p = 0.0001; HCV+/HIV+, p = 0.0001; HIV+/coinfected, p = 0.0001.*** Two patient for groups have the viral load >40 copies/ml.FOR HCV/HIV group 6006 copies/ml, 123 copies/ml.F*
SEk
2
DtfhDwe
ca
2
acpwSd
or HIV group 15,528 copies/ml, 145 copies/ml.** Comparison for genotype distribution among groups Fisher’s exact, p = 0.238.
ystems Minneapolis, USA), sCD14 (human sCD14, QuantikineLISA kit, R&D Systems), and IL-17 (human IL 17, Quantikine ELISAit, R&D Systems).
.7. DNA extraction and 23S rDNA real-time PCR
Total DNA was extracted from 200 �l whole blood with theNeasy blood and tissue kit (Qiagen), according to the pre-
reatment steps for bacteria suggested by the manufacturer. Aurther pre-treatment with Qiagen columns and sterile water pre-eated to 65 ◦C was performed to wash out contaminating bacterialNA. Exogenous DNA (a quantified plasmid with a known insert)as spiked into each sample to normalize the efficiency of DNA
xtraction.Real-time PCR was performed with a 23S rDNA-targeted pro-
edure previously described [23]. To normalize the samples forbsolute quantification assays, we also amplified the spiked DNA.
.8. Statistical analysis
Continuous data were expressed as the mean and standard devi-tion (SD) or as the median and interquartile range (25th–75th);ategorical data were expressed as the number of counts and
ercent. Comparisons between groups of patients were performedith the Kruskall–Wallis test or the Fisher exact test, respectively.pearman’s Rho correlation coefficient (Rho) and the 95% confi-ence interval (95% CI) were computed to determine associations
between continuous variables and cytokines. A linear regressionmodel was used to adjust for type of patient. Interactions betweenthe type of patient and the several variables tested were analysedto assess whether a differential size of association was presentwithin each group of patients. To verify model assumptions, weused a graphical check of residuals. Stata 12 (StataCorp, CollegeStation, TX, USA) was used for all analyses. A 2-sided p-value <0.05was considered statistically significant. The Bonferroni correctionwas used for post hoc comparisons.
2.9. Ethics
The study was designed and conducted in accordance with theHelsinki declaration. The Ethics Committee of the IRCCS FondazionePoliclinico San Matteo approved the study, and written informedconsent was obtained from all enrolled individuals.
3. Results
3.1. Study population
The baseline characteristics of the 80 patients included in thestudy are summarized in Table 1. All patients with HIV were receiv-
ing highly active anti-retroviral therapy (HAART) and 38/40 had anundetectable HIV viral load (95%).The four groups were significantly different in the HOMA score,liver elastography, CD4 cell counts, and FIB4 score. Patients with
P. Sacchi et al. / Digestive and Liver Disease 47 (2015) 218–225 221
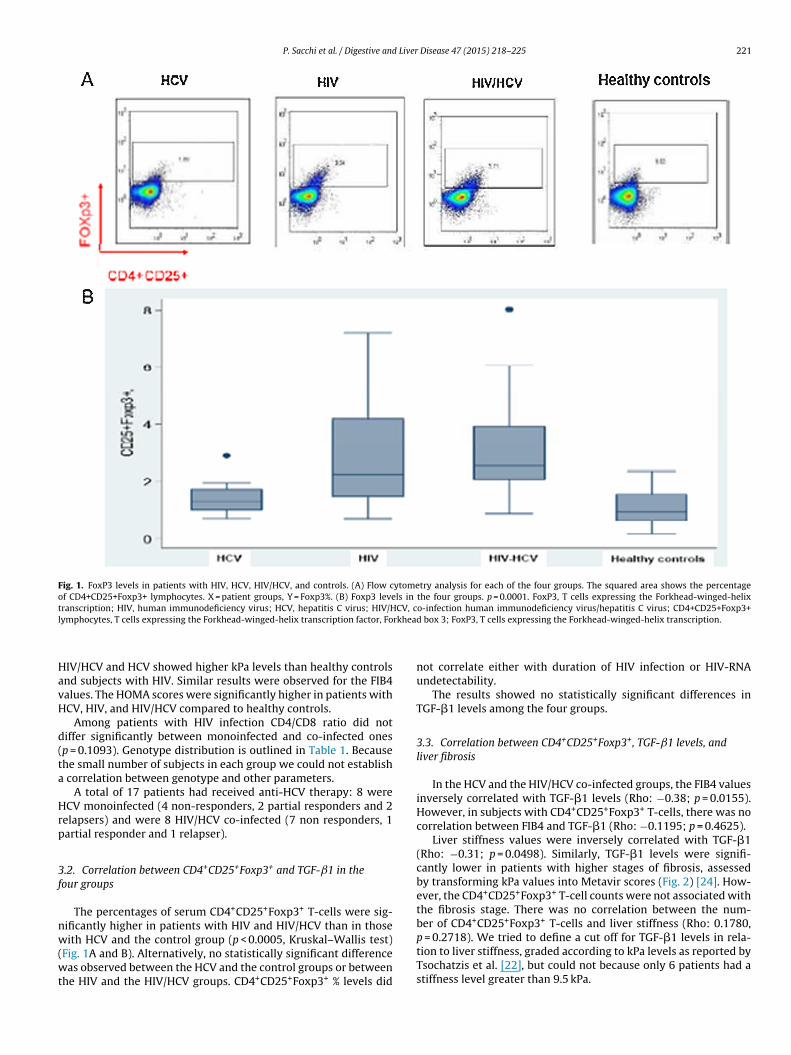
Fig. 1. FoxP3 levels in patients with HIV, HCV, HIV/HCV, and controls. (A) Flow cytometry analysis for each of the four groups. The squared area shows the percentageof CD4+CD25+Foxp3+ lymphocytes. X = patient groups, Y = Foxp3%. (B) Foxp3 levels in the four groups. p = 0.0001. FoxP3, T cells expressing the Forkhead-winged-helixt CV, cl rkhea
HavH
d(ta
Hrp
3f
nw(wt
ranscription; HIV, human immunodeficiency virus; HCV, hepatitis C virus; HIV/Hymphocytes, T cells expressing the Forkhead-winged-helix transcription factor, Fo
IV/HCV and HCV showed higher kPa levels than healthy controlsnd subjects with HIV. Similar results were observed for the FIB4alues. The HOMA scores were significantly higher in patients withCV, HIV, and HIV/HCV compared to healthy controls.
Among patients with HIV infection CD4/CD8 ratio did notiffer significantly between monoinfected and co-infected onesp = 0.1093). Genotype distribution is outlined in Table 1. Becausehe small number of subjects in each group we could not establish
correlation between genotype and other parameters.A total of 17 patients had received anti-HCV therapy: 8 were
CV monoinfected (4 non-responders, 2 partial responders and 2elapsers) and were 8 HIV/HCV co-infected (7 non responders, 1artial responder and 1 relapser).
.2. Correlation between CD4+CD25+Foxp3+ and TGF-ˇ1 in theour groups
The percentages of serum CD4+CD25+Foxp3+ T-cells were sig-ificantly higher in patients with HIV and HIV/HCV than in those
ith HCV and the control group (p < 0.0005, Kruskal–Wallis test)Fig. 1A and B). Alternatively, no statistically significant differenceas observed between the HCV and the control groups or between
he HIV and the HIV/HCV groups. CD4+CD25+Foxp3+ % levels did
o-infection human immunodeficiency virus/hepatitis C virus; CD4+CD25+Foxp3+d box 3; FoxP3, T cells expressing the Forkhead-winged-helix transcription.
not correlate either with duration of HIV infection or HIV-RNAundetectability.
The results showed no statistically significant differences inTGF-�1 levels among the four groups.
3.3. Correlation between CD4+CD25+Foxp3+, TGF-ˇ1 levels, andliver fibrosis
In the HCV and the HIV/HCV co-infected groups, the FIB4 valuesinversely correlated with TGF-�1 levels (Rho: −0.38; p = 0.0155).However, in subjects with CD4+CD25+Foxp3+ T-cells, there was nocorrelation between FIB4 and TGF-�1 (Rho: −0.1195; p = 0.4625).
Liver stiffness values were inversely correlated with TGF-�1(Rho: −0.31; p = 0.0498). Similarly, TGF-�1 levels were signifi-cantly lower in patients with higher stages of fibrosis, assessedby transforming kPa values into Metavir scores (Fig. 2) [24]. How-ever, the CD4+CD25+Foxp3+ T-cell counts were not associated withthe fibrosis stage. There was no correlation between the num-ber of CD4+CD25+Foxp3+ T-cells and liver stiffness (Rho: 0.1780,
p = 0.2718). We tried to define a cut off for TGF-�1 levels in rela-tion to liver stiffness, graded according to kPa levels as reported byTsochatzis et al. [22], but could not because only 6 patients had astiffness level greater than 9.5 kPa.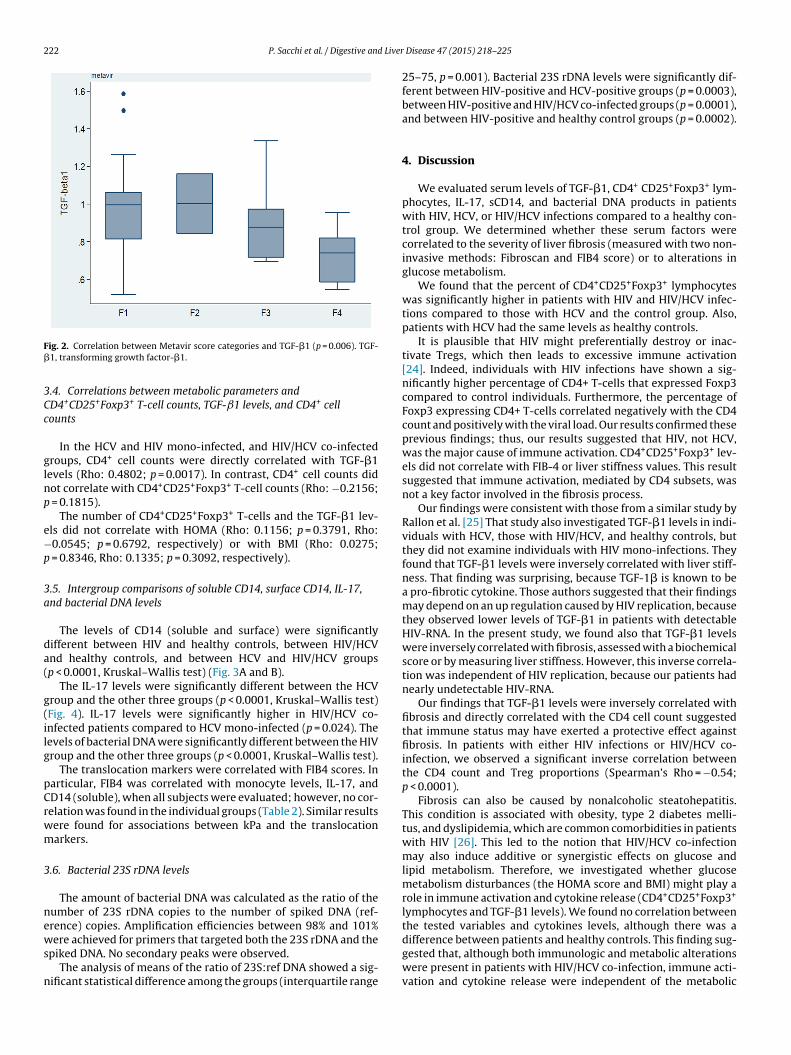
222 P. Sacchi et al. / Digestive and Liver
F�
3Cc
glnp
e−p
3a
da(
g(ilg
pCrwm
3
news
n
ig. 2. Correlation between Metavir score categories and TGF-�1 (p = 0.006). TGF-1, transforming growth factor-�1.
.4. Correlations between metabolic parameters andD4+CD25+Foxp3+ T-cell counts, TGF-ˇ1 levels, and CD4+ cellounts
In the HCV and HIV mono-infected, and HIV/HCV co-infectedroups, CD4+ cell counts were directly correlated with TGF-�1evels (Rho: 0.4802; p = 0.0017). In contrast, CD4+ cell counts didot correlate with CD4+CD25+Foxp3+ T-cell counts (Rho: −0.2156;
= 0.1815).The number of CD4+CD25+Foxp3+ T-cells and the TGF-�1 lev-
ls did not correlate with HOMA (Rho: 0.1156; p = 0.3791, Rho:0.0545; p = 0.6792, respectively) or with BMI (Rho: 0.0275;
= 0.8346, Rho: 0.1335; p = 0.3092, respectively).
.5. Intergroup comparisons of soluble CD14, surface CD14, IL-17,nd bacterial DNA levels
The levels of CD14 (soluble and surface) were significantlyifferent between HIV and healthy controls, between HIV/HCVnd healthy controls, and between HCV and HIV/HCV groupsp < 0.0001, Kruskal–Wallis test) (Fig. 3A and B).
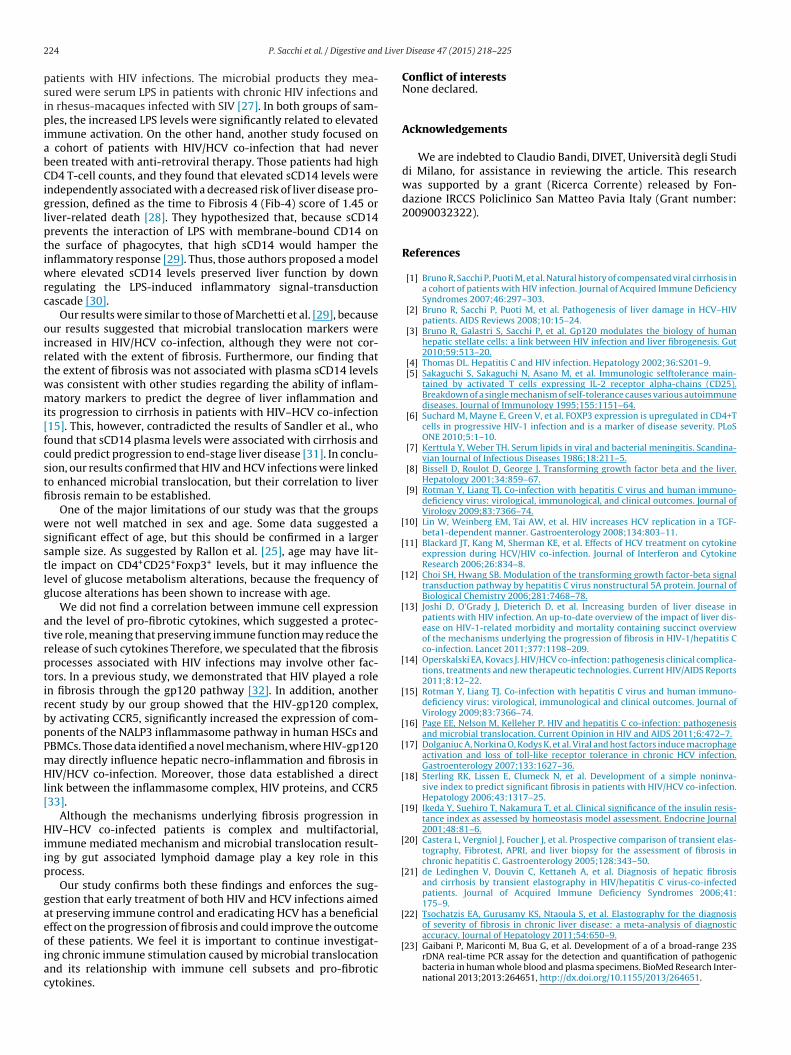
The IL-17 levels were significantly different between the HCVroup and the other three groups (p < 0.0001, Kruskal–Wallis test)Fig. 4). IL-17 levels were significantly higher in HIV/HCV co-nfected patients compared to HCV mono-infected (p = 0.024). Theevels of bacterial DNA were significantly different between the HIVroup and the other three groups (p < 0.0001, Kruskal–Wallis test).
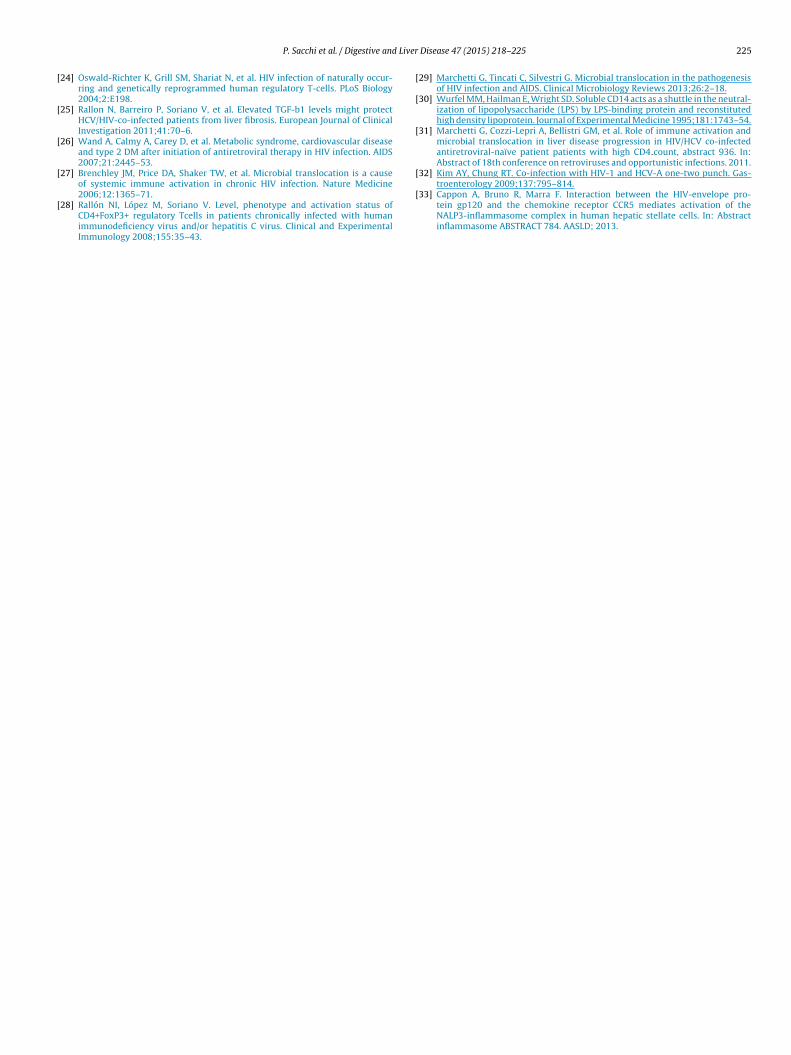
The translocation markers were correlated with FIB4 scores. Inarticular, FIB4 was correlated with monocyte levels, IL-17, andD14 (soluble), when all subjects were evaluated; however, no cor-elation was found in the individual groups (Table 2). Similar resultsere found for associations between kPa and the translocationarkers.
.6. Bacterial 23S rDNA levels
The amount of bacterial DNA was calculated as the ratio of theumber of 23S rDNA copies to the number of spiked DNA (ref-rence) copies. Amplification efficiencies between 98% and 101%
ere achieved for primers that targeted both the 23S rDNA and thepiked DNA. No secondary peaks were observed.The analysis of means of the ratio of 23S:ref DNA showed a sig-
ificant statistical difference among the groups (interquartile range
Disease 47 (2015) 218–225
25–75, p = 0.001). Bacterial 23S rDNA levels were significantly dif-ferent between HIV-positive and HCV-positive groups (p = 0.0003),between HIV-positive and HIV/HCV co-infected groups (p = 0.0001),and between HIV-positive and healthy control groups (p = 0.0002).
4. Discussion
We evaluated serum levels of TGF-�1, CD4+ CD25+Foxp3+ lym-phocytes, IL-17, sCD14, and bacterial DNA products in patientswith HIV, HCV, or HIV/HCV infections compared to a healthy con-trol group. We determined whether these serum factors werecorrelated to the severity of liver fibrosis (measured with two non-invasive methods: Fibroscan and FIB4 score) or to alterations inglucose metabolism.
We found that the percent of CD4+CD25+Foxp3+ lymphocyteswas significantly higher in patients with HIV and HIV/HCV infec-tions compared to those with HCV and the control group. Also,patients with HCV had the same levels as healthy controls.
It is plausible that HIV might preferentially destroy or inac-tivate Tregs, which then leads to excessive immune activation[24]. Indeed, individuals with HIV infections have shown a sig-nificantly higher percentage of CD4+ T-cells that expressed Foxp3compared to control individuals. Furthermore, the percentage ofFoxp3 expressing CD4+ T-cells correlated negatively with the CD4count and positively with the viral load. Our results confirmed theseprevious findings; thus, our results suggested that HIV, not HCV,was the major cause of immune activation. CD4+CD25+Foxp3+ lev-els did not correlate with FIB-4 or liver stiffness values. This resultsuggested that immune activation, mediated by CD4 subsets, wasnot a key factor involved in the fibrosis process.
Our findings were consistent with those from a similar study byRallon et al. [25] That study also investigated TGF-�1 levels in indi-viduals with HCV, those with HIV/HCV, and healthy controls, butthey did not examine individuals with HIV mono-infections. Theyfound that TGF-�1 levels were inversely correlated with liver stiff-ness. That finding was surprising, because TGF-1� is known to bea pro-fibrotic cytokine. Those authors suggested that their findingsmay depend on an up regulation caused by HIV replication, becausethey observed lower levels of TGF-�1 in patients with detectableHIV-RNA. In the present study, we found also that TGF-�1 levelswere inversely correlated with fibrosis, assessed with a biochemicalscore or by measuring liver stiffness. However, this inverse correla-tion was independent of HIV replication, because our patients hadnearly undetectable HIV-RNA.
Our findings that TGF-�1 levels were inversely correlated withfibrosis and directly correlated with the CD4 cell count suggestedthat immune status may have exerted a protective effect againstfibrosis. In patients with either HIV infections or HIV/HCV co-infection, we observed a significant inverse correlation betweenthe CD4 count and Treg proportions (Spearman’s Rho = −0.54;p < 0.0001).
Fibrosis can also be caused by nonalcoholic steatohepatitis.This condition is associated with obesity, type 2 diabetes melli-tus, and dyslipidemia, which are common comorbidities in patientswith HIV [26]. This led to the notion that HIV/HCV co-infectionmay also induce additive or synergistic effects on glucose andlipid metabolism. Therefore, we investigated whether glucosemetabolism disturbances (the HOMA score and BMI) might play arole in immune activation and cytokine release (CD4+CD25+Foxp3+
lymphocytes and TGF-�1 levels). We found no correlation betweenthe tested variables and cytokines levels, although there was a
difference between patients and healthy controls. This finding sug-gested that, although both immunologic and metabolic alterationswere present in patients with HIV/HCV co-infection, immune acti-vation and cytokine release were independent of the metabolic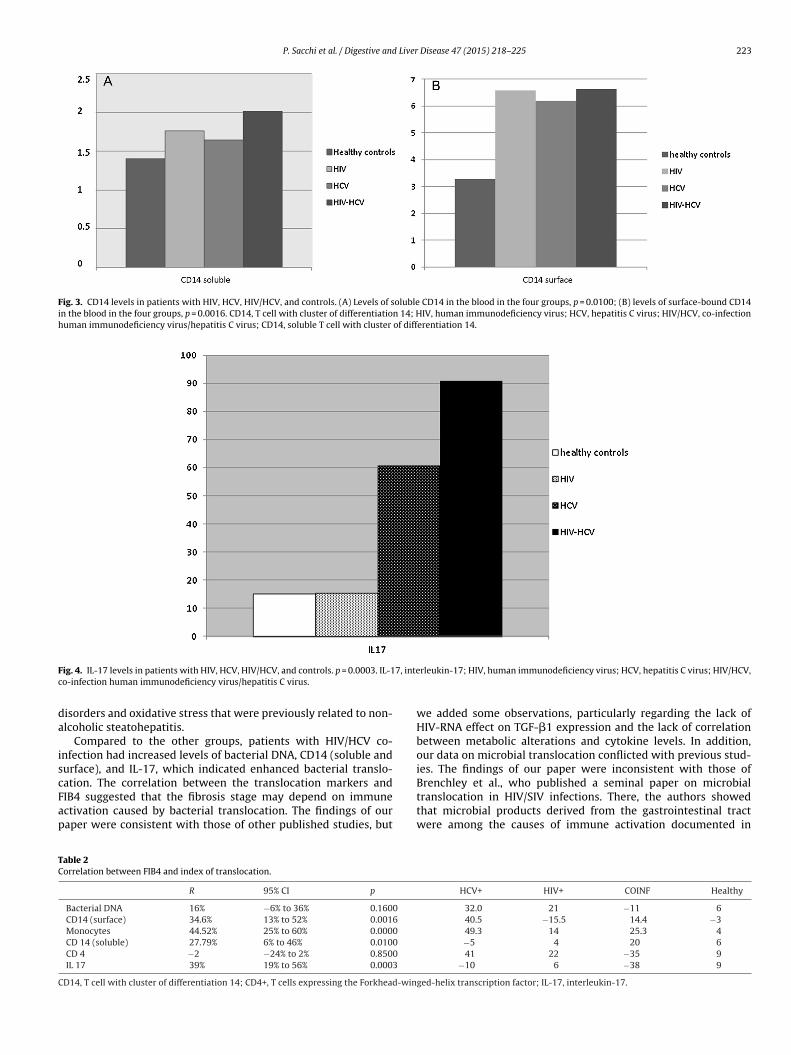
P. Sacchi et al. / Digestive and Liver Disease 47 (2015) 218–225 223
Fig. 3. CD14 levels in patients with HIV, HCV, HIV/HCV, and controls. (A) Levels of soluble CD14 in the blood in the four groups, p = 0.0100; (B) levels of surface-bound CD14in the blood in the four groups, p = 0.0016. CD14, T cell with cluster of differentiation 14; HIV, human immunodeficiency virus; HCV, hepatitis C virus; HIV/HCV, co-infectionhuman immunodeficiency virus/hepatitis C virus; CD14, soluble T cell with cluster of differentiation 14.
F 7, intec
da
iscFap
TC
C
ig. 4. IL-17 levels in patients with HIV, HCV, HIV/HCV, and controls. p = 0.0003. IL-1o-infection human immunodeficiency virus/hepatitis C virus.
isorders and oxidative stress that were previously related to non-lcoholic steatohepatitis.
Compared to the other groups, patients with HIV/HCV co-nfection had increased levels of bacterial DNA, CD14 (soluble andurface), and IL-17, which indicated enhanced bacterial translo-
ation. The correlation between the translocation markers andIB4 suggested that the fibrosis stage may depend on immunectivation caused by bacterial translocation. The findings of ouraper were consistent with those of other published studies, butable 2orrelation between FIB4 and index of translocation.
R 95% CI p
Bacterial DNA 16% −6% to 36% 0.1600
CD14 (surface) 34.6% 13% to 52% 0.0016
Monocytes 44.52% 25% to 60% 0.0000
CD 14 (soluble) 27.79% 6% to 46% 0.0100
CD 4 −2 −24% to 2% 0.8500
IL 17 39% 19% to 56% 0.0003
D14, T cell with cluster of differentiation 14; CD4+, T cells expressing the Forkhead-win
rleukin-17; HIV, human immunodeficiency virus; HCV, hepatitis C virus; HIV/HCV,
we added some observations, particularly regarding the lack ofHIV-RNA effect on TGF-�1 expression and the lack of correlationbetween metabolic alterations and cytokine levels. In addition,our data on microbial translocation conflicted with previous stud-ies. The findings of our paper were inconsistent with those of
Brenchley et al., who published a seminal paper on microbialtranslocation in HIV/SIV infections. There, the authors showedthat microbial products derived from the gastrointestinal tractwere among the causes of immune activation documented inHCV+ HIV+ COINF Healthy
32.0 21 −11 640.5 −15.5 14.4 −349.3 14 25.3 4−5 4 20 641 22 −35 9
−10 6 −38 9
ged-helix transcription factor; IL-17, interleukin-17.
2 Liver
psipiabCiglptiwrc
oirtwmi[fcstfi
wsstlg
atrptirbpPmHl[
Hiip
gaeoiac
[
[
[
[
[
[
[
[
[
[
[
[
[
accuracy. Journal of Hepatology 2011;54:650–9.
24 P. Sacchi et al. / Digestive and
atients with HIV infections. The microbial products they mea-ured were serum LPS in patients with chronic HIV infections andn rhesus-macaques infected with SIV [27]. In both groups of sam-les, the increased LPS levels were significantly related to elevated
mmune activation. On the other hand, another study focused on cohort of patients with HIV/HCV co-infection that had nevereen treated with anti-retroviral therapy. Those patients had highD4 T-cell counts, and they found that elevated sCD14 levels were
ndependently associated with a decreased risk of liver disease pro-ression, defined as the time to Fibrosis 4 (Fib-4) score of 1.45 oriver-related death [28]. They hypothesized that, because sCD14revents the interaction of LPS with membrane-bound CD14 onhe surface of phagocytes, that high sCD14 would hamper thenflammatory response [29]. Thus, those authors proposed a model
here elevated sCD14 levels preserved liver function by downegulating the LPS-induced inflammatory signal-transductionascade [30].
Our results were similar to those of Marchetti et al. [29], becauseur results suggested that microbial translocation markers werencreased in HIV/HCV co-infection, although they were not cor-elated with the extent of fibrosis. Furthermore, our finding thathe extent of fibrosis was not associated with plasma sCD14 levelsas consistent with other studies regarding the ability of inflam-atory markers to predict the degree of liver inflammation and
ts progression to cirrhosis in patients with HIV–HCV co-infection15]. This, however, contradicted the results of Sandler et al., whoound that sCD14 plasma levels were associated with cirrhosis andould predict progression to end-stage liver disease [31]. In conclu-ion, our results confirmed that HIV and HCV infections were linkedo enhanced microbial translocation, but their correlation to liverbrosis remain to be established.
One of the major limitations of our study was that the groupsere not well matched in sex and age. Some data suggested a
ignificant effect of age, but this should be confirmed in a largerample size. As suggested by Rallon et al. [25], age may have lit-le impact on CD4+CD25+Foxp3+ levels, but it may influence theevel of glucose metabolism alterations, because the frequency oflucose alterations has been shown to increase with age.
We did not find a correlation between immune cell expressionnd the level of pro-fibrotic cytokines, which suggested a protec-ive role, meaning that preserving immune function may reduce theelease of such cytokines Therefore, we speculated that the fibrosisrocesses associated with HIV infections may involve other fac-ors. In a previous study, we demonstrated that HIV played a rolen fibrosis through the gp120 pathway [32]. In addition, anotherecent study by our group showed that the HIV-gp120 complex,y activating CCR5, significantly increased the expression of com-onents of the NALP3 inflammasome pathway in human HSCs andBMCs. Those data identified a novel mechanism, where HIV-gp120ay directly influence hepatic necro-inflammation and fibrosis inIV/HCV co-infection. Moreover, those data established a direct
ink between the inflammasome complex, HIV proteins, and CCR533].
Although the mechanisms underlying fibrosis progression inIV–HCV co-infected patients is complex and multifactorial,
mmune mediated mechanism and microbial translocation result-ng by gut associated lymphoid damage play a key role in thisrocess.
Our study confirms both these findings and enforces the sug-estion that early treatment of both HIV and HCV infections aimedt preserving immune control and eradicating HCV has a beneficialffect on the progression of fibrosis and could improve the outcomef these patients. We feel it is important to continue investigat-
ng chronic immune stimulation caused by microbial translocationnd its relationship with immune cell subsets and pro-fibroticytokines.[
Disease 47 (2015) 218–225
Conflict of interestsNone declared.
Acknowledgements
We are indebted to Claudio Bandi, DIVET, Università degli Studidi Milano, for assistance in reviewing the article. This researchwas supported by a grant (Ricerca Corrente) released by Fon-dazione IRCCS Policlinico San Matteo Pavia Italy (Grant number:20090032322).
References
[1] Bruno R, Sacchi P, Puoti M, et al. Natural history of compensated viral cirrhosis ina cohort of patients with HIV infection. Journal of Acquired Immune DeficiencySyndromes 2007;46:297–303.
[2] Bruno R, Sacchi P, Puoti M, et al. Pathogenesis of liver damage in HCV–HIVpatients. AIDS Reviews 2008;10:15–24.
[3] Bruno R, Galastri S, Sacchi P, et al. Gp120 modulates the biology of humanhepatic stellate cells: a link between HIV infection and liver fibrogenesis. Gut2010;59:513–20.
[4] Thomas DL. Hepatitis C and HIV infection. Hepatology 2002;36:S201–9.[5] Sakaguchi S, Sakaguchi N, Asano M, et al. Immunologic selftolerance main-
tained by activated T cells expressing IL-2 receptor alpha-chains (CD25).Breakdown of a single mechanism of self-tolerance causes various autoimmunediseases. Journal of Immunology 1995;155:1151–64.
[6] Suchard M, Mayne E, Green V, et al. FOXP3 expression is upregulated in CD4+Tcells in progressive HIV-1 infection and is a marker of disease severity. PLoSONE 2010;5:1–10.
[7] Kerttula Y, Weber TH. Serum lipids in viral and bacterial meningitis. Scandina-vian Journal of Infectious Diseases 1986;18:211–5.
[8] Bissell D, Roulot D, George J. Transforming growth factor beta and the liver.Hepatology 2001;34:859–67.
[9] Rotman Y, Liang TJ. Co-infection with hepatitis C virus and human immuno-deficiency virus: virological, immunological, and clinical outcomes. Journal ofVirology 2009;83:7366–74.
10] Lin W, Weinberg EM, Tai AW, et al. HIV increases HCV replication in a TGF-beta1-dependent manner. Gastroenterology 2008;134:803–11.
11] Blackard JT, Kang M, Sherman KE, et al. Effects of HCV treatment on cytokineexpression during HCV/HIV co-infection. Journal of Interferon and CytokineResearch 2006;26:834–8.
12] Choi SH, Hwang SB. Modulation of the transforming growth factor-beta signaltransduction pathway by hepatitis C virus nonstructural 5A protein. Journal ofBiological Chemistry 2006;281:7468–78.
13] Joshi D, O’Grady J, Dieterich D, et al. Increasing burden of liver disease inpatients with HIV infection. An up-to-date overview of the impact of liver dis-ease on HIV-1-related morbidity and mortality containing succinct overviewof the mechanisms underlying the progression of fibrosis in HIV-1/hepatitis Cco-infection. Lancet 2011;377:1198–209.
14] Operskalski EA, Kovacs J. HIV/HCV co-infection: pathogenesis clinical complica-tions, treatments and new therapeutic technologies. Current HIV/AIDS Reports2011;8:12–22.
15] Rotman Y, Liang TJ. Co-infection with hepatitis C virus and human immuno-deficiency virus: virological, immunological and clinical outcomes. Journal ofVirology 2009;83:7366–74.
16] Page EE, Nelson M, Kelleher P. HIV and hepatitis C co-infection: pathogenesisand microbial translocation. Current Opinion in HIV and AIDS 2011;6:472–7.
17] Dolganiuc A, Norkina O, Kodys K, et al. Viral and host factors induce macrophageactivation and loss of toll-like receptor tolerance in chronic HCV infection.Gastroenterology 2007;133:1627–36.
18] Sterling RK, Lissen E, Clumeck N, et al. Development of a simple noninva-sive index to predict significant fibrosis in patients with HIV/HCV co-infection.Hepatology 2006;43:1317–25.
19] Ikeda Y, Suehiro T, Nakamura T, et al. Clinical significance of the insulin resis-tance index as assessed by homeostasis model assessment. Endocrine Journal2001;48:81–6.
20] Castera L, Vergniol J, Foucher J, et al. Prospective comparison of transient elas-tography, Fibrotest, APRI, and liver biopsy for the assessment of fibrosis inchronic hepatitis C. Gastroenterology 2005;128:343–50.
21] de Ledinghen V, Douvin C, Kettaneh A, et al. Diagnosis of hepatic fibrosisand cirrhosis by transient elastography in HIV/hepatitis C virus-co-infectedpatients. Journal of Acquired Immune Deficiency Syndromes 2006;41:175–9.
22] Tsochatzis EA, Gurusamy KS, Ntaoula S, et al. Elastography for the diagnosisof severity of fibrosis in chronic liver disease: a meta-analysis of diagnostic
23] Gaibani P, Mariconti M, Bua G, et al. Development of a of a broad-range 23SrDNA real-time PCR assay for the detection and quantification of pathogenicbacteria in human whole blood and plasma specimens. BioMed Research Inter-national 2013;2013:264651, http://dx.doi.org/10.1155/2013/264651.
Liver
[
[
[
[
[
[
[
[
[troenterology 2009;137:795–814.
P. Sacchi et al. / Digestive and
24] Oswald-Richter K, Grill SM, Shariat N, et al. HIV infection of naturally occur-ring and genetically reprogrammed human regulatory T-cells. PLoS Biology2004;2:E198.
25] Rallon N, Barreiro P, Soriano V, et al. Elevated TGF-b1 levels might protectHCV/HIV-co-infected patients from liver fibrosis. European Journal of ClinicalInvestigation 2011;41:70–6.
26] Wand A, Calmy A, Carey D, et al. Metabolic syndrome, cardiovascular diseaseand type 2 DM after initiation of antiretroviral therapy in HIV infection. AIDS2007;21:2445–53.
27] Brenchley JM, Price DA, Shaker TW, et al. Microbial translocation is a causeof systemic immune activation in chronic HIV infection. Nature Medicine
2006;12:1365–71.28] Rallón NI, López M, Soriano V. Level, phenotype and activation status ofCD4+FoxP3+ regulatory Tcells in patients chronically infected with humanimmunodeficiency virus and/or hepatitis C virus. Clinical and ExperimentalImmunology 2008;155:35–43.
[
Disease 47 (2015) 218–225 225
29] Marchetti G, Tincati C, Silvestri G. Microbial translocation in the pathogenesisof HIV infection and AIDS. Clinical Microbiology Reviews 2013;26:2–18.
30] Wurfel MM, Hailman E, Wright SD. Soluble CD14 acts as a shuttle in the neutral-ization of lipopolysaccharide (LPS) by LPS-binding protein and reconstitutedhigh density lipoprotein. Journal of Experimental Medicine 1995;181:1743–54.
31] Marchetti G, Cozzi-Lepri A, Bellistri GM, et al. Role of immune activation andmicrobial translocation in liver disease progression in HIV/HCV co-infectedantiretroviral-naïve patient patients with high CD4 count, abstract 936. In:Abstract of 18th conference on retroviruses and opportunistic infections. 2011.
32] Kim AY, Chung RT. Co-infection with HIV-1 and HCV-A one-two punch. Gas-
33] Cappon A, Bruno R, Marra F. Interaction between the HIV-envelope pro-tein gp120 and the chemokine receptor CCR5 mediates activation of theNALP3-inflammasome complex in human hepatic stellate cells. In: Abstractinflammasome ABSTRACT 784. AASLD; 2013.