An artificial neural network improves the non-invasive diagnosis of significant fibrosis in HIV/HCV...
10
Author's personal copy An artificial neural network improves the non-invasive diagnosis of significant fibrosis in HIV/HCV coinfected patients Salvador Resino a, *, Jos e Antonio Seoane b , Jos e Mar ıa Bell on c , Juli an Dorado b , Fernando Martin-Sanchez d , Emilio Alvarez e , Jaime Cos ın f , Juan Carlos L opez f , Guilllermo Lop ez d , Pilar Miralles f , Juan Berenguer f a Laboratory of Molecular Epidemiology of Infectious Diseases, National Centre of Microbiology, Instituto de Salud Carlos III, Carretera Majadahonda- Pozuelo, Km 2.2; 28220 Majadahonda, Madrid, Spain b Artificial Neural Networks and Adaptative System Laboratory, Information and Communications Tecnologies Department, Universidade da Coru ~ na, Spain c Biomedical Research Foundation, Hospital General Universitario “Gregorio Mara ~ n on”, Madrid, Spain d Medical NanoBioInformatics Department (nBIOTIC), Instituto de Salud Carlos III, Majadahonda, Madrid, Spain e Pathology Department, Hospital General Universitario “Gregorio Mara ~ n on”, Madrid, Spain f Infectious Diseases-HIV Unit, Hospital General Universitario “Gregorio Mara ~ n on”, Madrid, Spain Accepted 2 November 2010 Available online 10 November 2010 KEYWORDS AIDS; Chronic hepatitis C; Biological markers; Liver fibrosis; Hepatic biopsy; Diagnosis Summary Objective: To develop an artificial neural network to predict significant fibrosis (F 2) (ANN-SF) in HIV/Hepatitis C (HCV) coinfected patients using clinical data derived from peripheral blood. Methods: Patients were randomly divided into an estimation group (217 cases) used to generate the ANN and a test group (145 cases) used to confirm its power to predict F 2. Liver fibrosis was estimated according to the METAVIR score. Results: The values of the area under the receiver operating characteristic curve (AUC-ROC) of the ANN-SF were 0.868 in the estimation set and 0.846 in the test set. In the estimation set, with a cut- off value of <0.35 to predict the absence of F 2, the sensitivity (Se), specificity (Sp), and positive (PPV) and negative predictive values (NPV) were 94.1%, 41.8%, 66.3% and 85.4% respectively. Fur- thermore, with a cut-off value of >0.75 to predict the presence of F 2, the ANN-SF provided Se, Abbreviations: ALT, Alanine aminotransferase; ALP, Alkaline phosphatase; AUC-ROC, Area under the receiver operating characteristic curve; ANNs, Artificial Neural Networks; APRI, Aspartate aminotransferase to platelet ratio; AST, Aspartate aminotransferase; GGT, C-glu- tamyl transpeptidase; CHC, Chronic hepatitis C; DOR, Diagnostic odds ratio; FN, False negatives; FP, False positive; HCV, Hepatitis C virus; INR, International normalized ratio; LR, Likelihood ratios; NPV, Negative predictive value; PPV, Positive predictive value; Se, Sensitivity; Sp, Significant fibrosis (F2) Specificity; TN, True negatives; TP, True positive. * Corresponding author. Tel.: þ34 918 223 266; fax: þ34 915 097 946. E-mail address: [email protected] (S. Resino). 0163-4453/$36 ª 2010 The British Infection Association. Published by Elsevier Ltd. All rights reserved. doi:10.1016/j.jinf.2010.11.003 www.elsevierhealth.com/journals/jinf Journal of Infection (2011) 62, 77e86
Transcript of An artificial neural network improves the non-invasive diagnosis of significant fibrosis in HIV/HCV...

Author's personal copy
An artificial neural network improves thenon-invasive diagnosis of significant fibrosis inHIV/HCV coinfected patients
Salvador Resino a,*, Jos�e Antonio Seoane b, Jos�e Mar�ıa Bell�on c,Juli�an Dorado b, Fernando Martin-Sanchez d, Emilio �Alvarez e, Jaime Cos�ın f,Juan Carlos L�opez f, Guilllermo Lop�ez d, Pilar Miralles f, Juan Berenguer f
a Laboratory of Molecular Epidemiology of Infectious Diseases, National Centre of Microbiology,Instituto de Salud Carlos III, Carretera Majadahonda- Pozuelo, Km 2.2; 28220 Majadahonda, Madrid, SpainbArtificial Neural Networks and Adaptative System Laboratory, Information and Communications Tecnologies Department,Universidade da Coru~na, SpaincBiomedical Research Foundation, Hospital General Universitario “Gregorio Mara~n�on”, Madrid, SpaindMedical NanoBioInformatics Department (nBIOTIC), Instituto de Salud Carlos III, Majadahonda, Madrid, Spaine Pathology Department, Hospital General Universitario “Gregorio Mara~n�on”, Madrid, Spainf Infectious Diseases-HIV Unit, Hospital General Universitario “Gregorio Mara~n�on”, Madrid, Spain
Accepted 2 November 2010Available online 10 November 2010
KEYWORDSAIDS;Chronic hepatitis C;Biological markers;Liver fibrosis;Hepatic biopsy;Diagnosis
Summary Objective: To develop an artificial neural network to predict significant fibrosis(F� 2) (ANN-SF) in HIV/Hepatitis C (HCV) coinfected patients using clinical data derived fromperipheral blood.Methods: Patients were randomly divided into an estimation group (217 cases) used to generatethe ANN and a test group (145 cases) used to confirm its power to predict F� 2. Liver fibrosiswas estimated according to the METAVIR score.Results: The values of the areaunder the receiver operating characteristic curve (AUC-ROC) of theANN-SFwere 0.868 in the estimation set and 0.846 in the test set. In the estimation set, with a cut-off value of<0.35 to predict the absence of F� 2, the sensitivity (Se), specificity (Sp), and positive(PPV) and negative predictive values (NPV) were 94.1%, 41.8%, 66.3% and 85.4% respectively. Fur-thermore, with a cut-off value of>0.75 to predict the presence of F� 2, the ANN-SF provided Se,
Abbreviations: ALT, Alanine aminotransferase; ALP, Alkaline phosphatase; AUC-ROC, Area under the receiver operating characteristiccurve; ANNs, Artificial Neural Networks; APRI, Aspartate aminotransferase to platelet ratio; AST, Aspartate aminotransferase; GGT, C-glu-tamyl transpeptidase; CHC, Chronic hepatitis C; DOR, Diagnostic odds ratio; FN, False negatives; FP, False positive; HCV, Hepatitis C virus;INR, International normalized ratio; LR, Likelihood ratios; NPV, Negative predictive value; PPV, Positive predictive value; Se, Sensitivity; Sp,Significant fibrosis (F�2) Specificity; TN, True negatives; TP, True positive.* Corresponding author. Tel.: þ34 918 223 266; fax: þ34 915 097 946.E-mail address: [email protected] (S. Resino).
0163-4453/$36 ª 2010 The British Infection Association. Published by Elsevier Ltd. All rights reserved.doi:10.1016/j.jinf.2010.11.003
www.elsevierhealth.com/journals/jinf
Journal of Infection (2011) 62, 77e86
Author's personal copy
Sp, PPVand NPV of 53.8%, 94.9%, 92.8% and 62.8% respectively. In the test set, with a cut-off valueof <0.35 to predict the absence of F� 2, the Se, Sp, PPV and NPV were 91.8%, 51.7%, 72.9% and81.6% respectively. Furthermore, with a cut-off value of >0.75 to predict the presence of F� 2,the ANN-SF provided Se, Sp, PPV and NPV of 43.5%, 96.7%, 94.9% and 54.7% respectively.Conclusion: The ANN-SF accurately predicted significant fibrosis and outperformed other simplenon-invasive indices for HIV/HCV coinfected patients. Our data suggest that ANNmay be a helpfultool for guiding therapeutic decisions in clinical practice concerning HIV/HCV coinfection.ª 2010 The British Infection Association. Published by Elsevier Ltd. All rights reserved.
Introduction
Hepatitis C virus (HCV) infection is common among HIV-infected patients resulting in higher rates of fibrosis pro-gression, cirrhosis, and end-stage liver disease than for HCVmono-infected patients.1,2 Staging liver fibrosis is consid-ered an essential part in the management of patientswith chronic hepatitis C (CHC), because it provides prognos-tic information and, in many cases, assists in therapeuticdecisions. When liver biopsy demonstrates lower grades ofliver fibrosis (F0e1), regardless of HCV genotype, HCV ther-apy can be deferred in HIV/HCV coinfected patients.3
For many years, the diagnosis and quantification offibrosis have relied on liver biopsies, a procedurewith severaldrawbacks.4 Currently, there are several non-invasive diag-nostic methods for determining liver fibrosis such as bloodmarker indices and imaging methods.5 HGM-1,6 aspartateaminotransferase (AST) to platelet ratio (APRI),7 FIB-4,8
and Forns’ index9 are non-invasive fibrosis indices which in-cludedata from routinebiochemical andhematological anal-yses (indirect markers). The variables included in theseindices are easily accessible and the calculations are rela-tively easy. However, the diagnostic accuracy of the indicesmentioned above is low for fibrosis diagnosis in HIV/HCV co-infected patients10; and the search for more precise systemsto predict significant fibrosis is therefore justified.
Liver fibrosis is a pathology concerning a biological systemwhere the relationship between variables that determine thefibrosis diagnosis is complex, multidimensional and non-linear.11 Artificial Neural Networks (ANNs) are efficient non-parametric alternatives which perform pattern recognitionandclassificationtasksbetter thanconventionalanalyses.12,13
ANNs are computational models that consist of a set of artifi-cial neurons linked togetherwithweighted connectionswhichcan learn through examples and therefore establish the corre-sponding weight for each input (e.g., several laboratorytests). Next, the ANN can assign outputs (e.g., different out-comes) to new input datanot used in the learningprocess.12,13
In this study, we aimed to develop an ANN using routinebiochemical and hematological analyses to predict signifi-cant fibrosis in HIV/HCV coinfected patients, and comparedthe prognostic performance of the ANN to previouslyreported liver fibrosis indices calculated from routinedata such as HGM-1, APRI, FIB-4, and Forns’ index.
Patients and methods
Patients
We carried out a cross-sectional study with 362 HIV/HCVcoinfected patients fromHospital GregorioMara~n�on (Madrid,Spain) who underwent liver biopsies between May 2000 andJan 2009. Data and samples were analyzed retrospectively.
Liver biopsies were performed on patients who werepotential candidates for HCV therapy and had not receivedprevious interferon therapy. The inclusion criteria were: noclinical evidence of hepatic decompensation, detectableHCV-RNA by polymerase chain reaction, negative hepatitisB surface antigen, CD4þ lymphocyte count higher than 200cells/mL, stable antiretroviral therapy or no need forantiretroviral therapy. The exclusion criteria were: diabe-tes, active opportunistic infections, and active drug oralcohol addiction.
All work was conducted in accordance with the Decla-ration of Helsinki. All patients gave their written consentfor the liver biopsy and the Institutional Ethics Committeeapproved the study.
Clinical and laboratory data
On the day of the biopsy, clinical and epidemiological datawere obtained from medical records. The duration of HCVinfection for patients with a history of intravenous drug usewas estimated to begin the first year needles were shared.Patients were questioned in relation to alcohol consump-tion. We considered the consumption of greater than 50 gof alcohol per day for �12 months as a high intake. Afteran overnight fast and immediately before the liver biopsywas performed, a blood sample was taken from the patientto analyze complete blood counts, liver panel, basic meta-bolic panel, coagulation tests, plasma HIV-RNA levels andCD4þ T cell counts. All patients gave written consent forthe samples to be collected.
Hematological data (international normalized ratio(INR)) were determined using a fully automated hematologyanalyzer (ACL TOP 700 CTS, Instrumentation Laboratory,Werfen Group, Barcelona, Spain). Platelet counts wereobtained with a Sysmex XE2100 Hematology Analyzer(Roche Diagnostics, Indianapolis, IN, USA). Biochemicaldata (glucose, aspartate aminotransferase (AST), alanineaminotransferase (ALT), c-glutamyl transpeptidase (GGT),alkaline phosphatase (ALP), cholesterol, and fibrinogen)were determined using a fully automated clinical chemistryanalyzer (Hitachi 912, Boehringer Mannheim, Germany).The CD4þ cell counts were determined using FACSCalibur
78 S. Resino et al.

Author's personal copy
flow cytometer (BD FACSCalibur�, BD Biosciences, Califor-nia USA) according to the manufacturer’s specifications.
HIV and HCV infection were documented in all patientsby enzyme-linked immunosorbent assay (ELISA) and poly-merase chain reaction (PCR). The HCV viral load wasmeasured by PCR (Cobas Amplicor HCV Monitor Test,Branchburg, NJ, USA) and the results were reported in IU/mL. HCV genotype was determined by hybridization ofbiotin-labeled PCR products to oligonucleotide probesbound to nitrocellulose membrane strips (INNO-LiPA HCVII, Innogenetics, Ghent, Belgium).
Liver biopsy and histology
Liver biopsies were performed on an outpatient basisfollowing the recommendations of the Patient Care Com-mittee of the American Gastroenterological Association.14
All liver biopsies were performed by the same physicians(JB and PM) with a suction needle (HISTO-CUT 16G, SterylabSrl. Milano, Italy). Ultrasound was routinely used to deter-mine the percutaneous biopsy site. We did not systemati-cally record the size of liver biopsy specimens; however,during the study period, only 5 out of 297 biopsies yieldedinsufficient liver tissue for pathological diagnoses.
The liver tissue sections were fixed in fomalin, embed-ded in paraffin and stained by hematoxylin-eosin, Mason’strichrome, and Perls’ iron. The samples were evaluatedby a pathologist (E.A.) who was unaware of the patients’clinical or laboratory data. Liver fibrosis was estimated fol-lowing the criteria established by the METAVIR CooperativeStudy Group.15 Fibrosis was scored as follows: F0, no fibro-sis; F1, portal fibrosis; F2 periportal fibrosis or rare portal-portal septa; F3, fibrous septa with architectural distortionbut with no obvious cirrhosis (bridging fibrosis); and F4, def-inite cirrhosis.
The researchers in charge of evaluating the biopsies,interpreting the clinical data, or calculating and analyzingthe reference standard all performed each function with-out knowledge of the results of the other evaluations.
Development of the artificial neural network
The neural network was developed in MATLAB using NeuralNetwork Toolbox 6.0.3 (Mathworks, Natick, MA, USA). Inthis study, a multilayer perceptron neural network withat least three layers of neurons was constructed: one inputlayer, one output layer and at least one hidden layer. Neu-rons are linked together with weighted connections. Thenumber of input neurons is equal to the number of labora-tory tests in this study, and the number of output neuronsis equal to the number of outcomes. The present multi-layer perceptron has 10 input neurons which are availablevariables (Fig. 1): (a) fibrinogen (mg/dL) which has beenassociated with fibrosis and cirrhosis in chronic liver dis-ease16; and (b) variables included in other predictive indi-ces of hepatic fibrosis: glucose (mg/dL),6 AST (IU/l),6e8
ALT (IU/L),8 GGT (IU/l),9 ALP (IU/l),6 cholesterol (mg/dL),9 platelet count (x103/mm3),6e9 INR value,6 and age(years).8,9
Patients of the HGUGM cohort were randomly dividedinto: (a) an estimation or training/validation group (217
cases; 60%) used to train the network; and (b) a test group(145 cases; 40%) used to confirm its power to predictoutcome in different subsets of patients (Fig. 2). Firstlythe training set (145 out of 217 patients) was used to createthe ANN model over several iterations. Next, the valida-tions of training set (71 out of 217 patients) was used tocheck the generalization capacity of the ANN. Learning oc-curs through exposure to paired inputeoutput data, bymodifying the weight of the connections between its neu-rons. An error signal is generated when the output patterndisagrees with the desired output. This error signal is thentransmitted backwards across the ANN for updating theweight of the connections between neurons and for de-creasing the overall error of the ANN.12,13 The relativeweights of the clinical input parameters for the ANN analy-sis were calculated according to the General Influence Mea-sure method17 and they are shown in Fig. 3. All variableshad a significant contribution in predicting significant or ad-vanced fibrosis and the removal of any one of them dimin-ished the performance of the ANN.
The network keeps training with a specific training setwhile the network error is reduced during the evaluation ofthe validation set. At this point, if the network has trainedmore, it will have memorized the training set, making itsgeneralization capacity worse. Instead of this, the networkstops when the validation error increases. This techniqueavoids overtraining, which is a very common problem inoptimization and learning algorithms. Finally, the ANN testor validation of model examples that the network has neverseen before are provided to the network as an independentgeneralization test.12,13
Different trials were performed with different architec-tures with 1, 2 and 3 hidden layers. The number of ProcessingElements (PEs) of each one was changed from between 3 and30, and three different transfer functions were used: linear,tangent sigmoid and logarithmic sigmoid. During the trainingprocess, different back-propagation algorithms weretried (gradient descent, gradient descent with momentum,quasi-Newton and LevenbergeMarquardt), with meansquare error as the error measure. The architecture thatachieved the best results in all of these trials was a feed-forward with 1 hidden layer and 12 PEs, with a tangentsigmoid as the transfer function in the hidden layer anda logarithmic sigmoid as the transfer function in the outputlayer, and with the LevenbergeMarquardt algorithm as theback-propagation training algorithm.
Statistics
Overall, results are presented as medians (percentile 25,percentile 75) for continuous variables and as frequenciesand percentages for categorical data. Analysis of normalitywas performed with the KolmogoroveSmirnov test. Cate-gorical data and proportions were analyzed using the chi-squared test or Fisher’s exact test as required. The Stu-dent’s t-test was used to compare the means of the twogroups with normal distributions and the ManneWhitneytest to compare variables with non-normal distributions.The ANOVA test adjusted by the Bonferroni test was usedto compare the means of the three or more groups with nor-mal distributions.
ANN improves fibrosis diagnosis 79

Author's personal copy
We evaluated the diagnostic values of ANN for significantfibrosis (ANN-SF) by calculating the areas under the receiveroperating characteristic curves (AUC-ROCs) for the estima-tion and test groups (Fig. 4). For purposes of comparison, weevaluated four simple reported models consisting of routineparameters to predict liver fibrosis: (a) HGM-1,6 (b) FIB-4,8
(c) AST to platelet ratio (APRI),7 and (d) Forns’ index.9 Weevaluated the diagnostic ability of these indices by comparingthe calculated AUC-ROCs18,19 with Sidak correction for all pa-tients included in this study. We also carried out an analysisusing the DANA method, which is used when the distributionof fibrosis stages is highly asymmetric.20
We evaluated several cut-offs for the ANN-SF indexaccording to a sensitivity (Se) of 95% for the low cut-offused to predict liver biopsies without significant fibrosis(F< 2) or advanced fibrosis (F< 3); and a specificity (Sp) of95% for the high cut-off used to predict liver biopsies withsignificant fibrosis (F� 2) or advanced fibrosis (F� 3). Wecalculated the Se, Sp, positive predictive value (PPV) andnegative predictive value (NPV) for each cut-off point toevaluate the diagnostic accuracy. We also calculated thediagnostic odds ratio (DOR) which expresses the strengthof the association between test result and disease: it isthe ratio of the odds of a positive result in a person withthe target condition compared to a person without the con-dition.21 A DOR of 1 suggests the test provides no diagnosticevidence. Moreover, we also calculated the likelihood ra-tios (LR) which describe how many times a person with
Input nodes
Glucose (mg/dL)
AST (IU/L)
ALT (IU/L)
GGT (IU/L)
ALP (IU/L)
Cholesterol (mg/dL)
Platelet count (x103/mm3)
INR
Fibrinogen (mg/dL)
Age (years)
Back-propagation of error adjusted the weight of interconnection to reduced of overall error generated at output node
ERROR
Hidden layer
Output node
Significant fibrosis
0= No
1= Yes
General Neuron
tan-sigmoid transfer function (tansig)
12
log-sigmoid transfer function (logsig)
Figure 1 Schematic representation of the artificial neural network (ANN) model developed to predict significant fibrosis (F� 2) ofHIV/HCV coinfected patients. aspartate aminotransferase (AST), alanine aminotransferase (ALT), c-glutamyl transpeptidase (GGT),alkaline phosphatase (ALP), INR, international normalized ratio.
HGUGM Cohort (Madrid, Spain),
n= 362
Estimation group (Training and validation groups),
n= 217 (60%)
Training and validation groups, • ROC analysis• Diagnostic accuracy at different cut-off values of ANN output
Development of ANN
Estimation and test groups, • ROC analysis• Comparison to HGM-1, APRI, FIB-4, and Forns` index
Test group, n= 145 (40%)
Prediction of significant fibrosisof patients unknown to ANNPrediction of significant fibrosis
Training and validation groups, • ROC analysis• Diagnostic accuracy at different cut-off values of ANN output
Figure 2 Datasets used in the development (estimation) andexternal validation (test) of the artificial neural network(ANN). ROC, receiver operating characteristics; aspartate ami-notransferase/platelet ratio index (APRI).
80 S. Resino et al.

Author's personal copy
the target condition is more likely to have a particular testresult than a person without that condition. LRs contributeto change the probability that a target condition is presentafter the test has been made. Binary tests have two LRs,positive and negative (LRþ, LR�). An LR of 1 indicates nodiagnostic value.
All tests were two-tailed with P values <0.05 consideredto be significant. Statistical analysis was performed by SPSS16.0 software (SPSS INC, Chicago, IL, USA) and STATA 9.1(Lakeway Drive Texas, USA).
Results
Patients
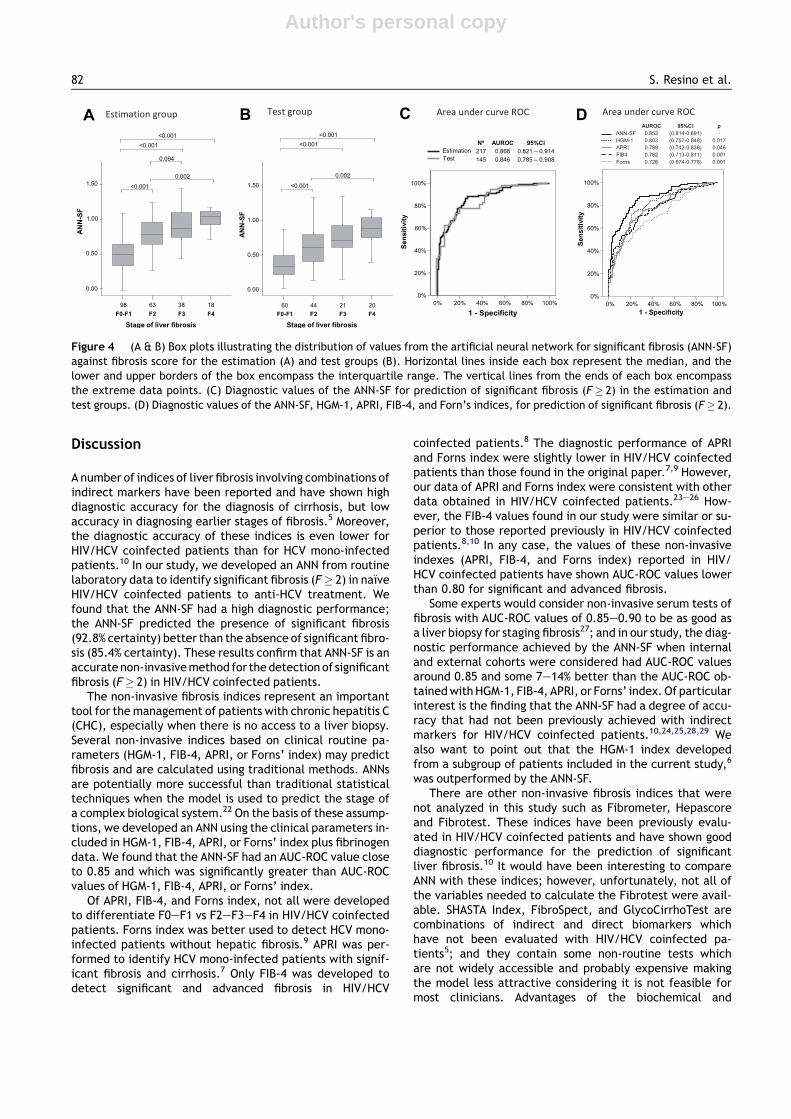
We randomly divided the 362 patients who underwent liverbiopsy into 2 groups: an estimation group and a test group(Fig. 2). Both groups were well-matched in baseline charac-teristics except for a lower baseline CD4þ T-cells/mL levelin the estimation group compared to the test group(Table 1).
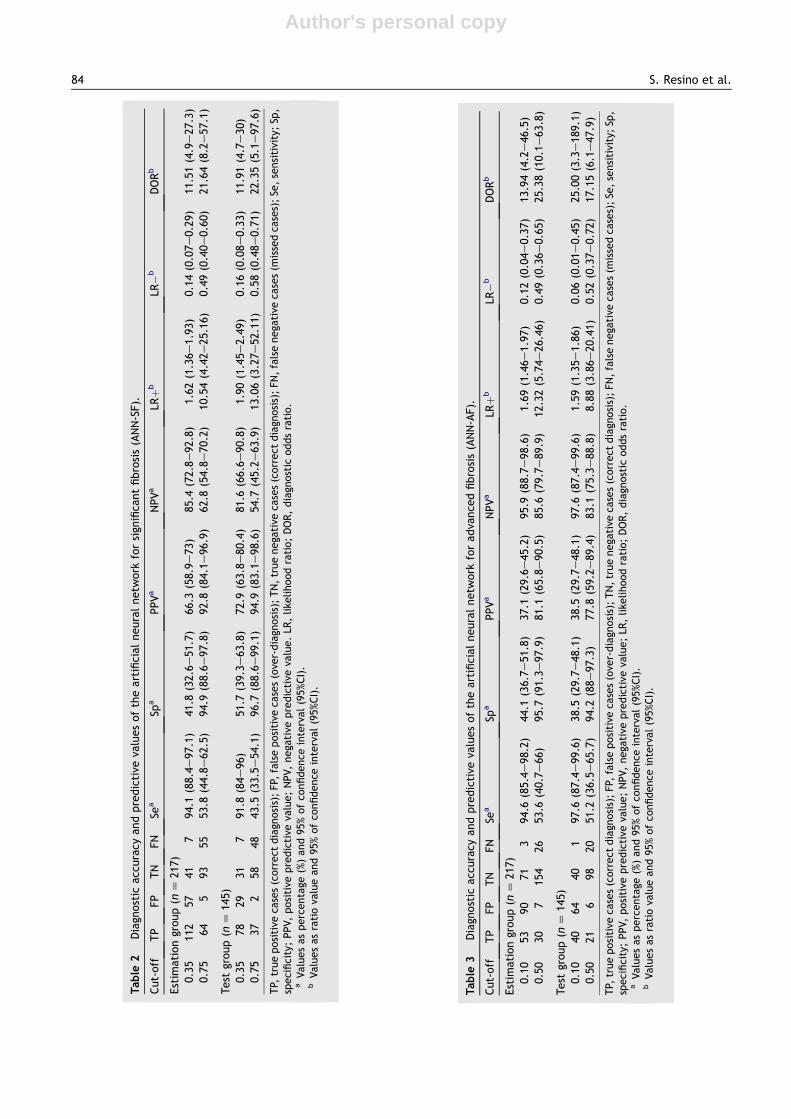
Diagnostic performance of ANN for significantfibrosis (F ‡ 2)
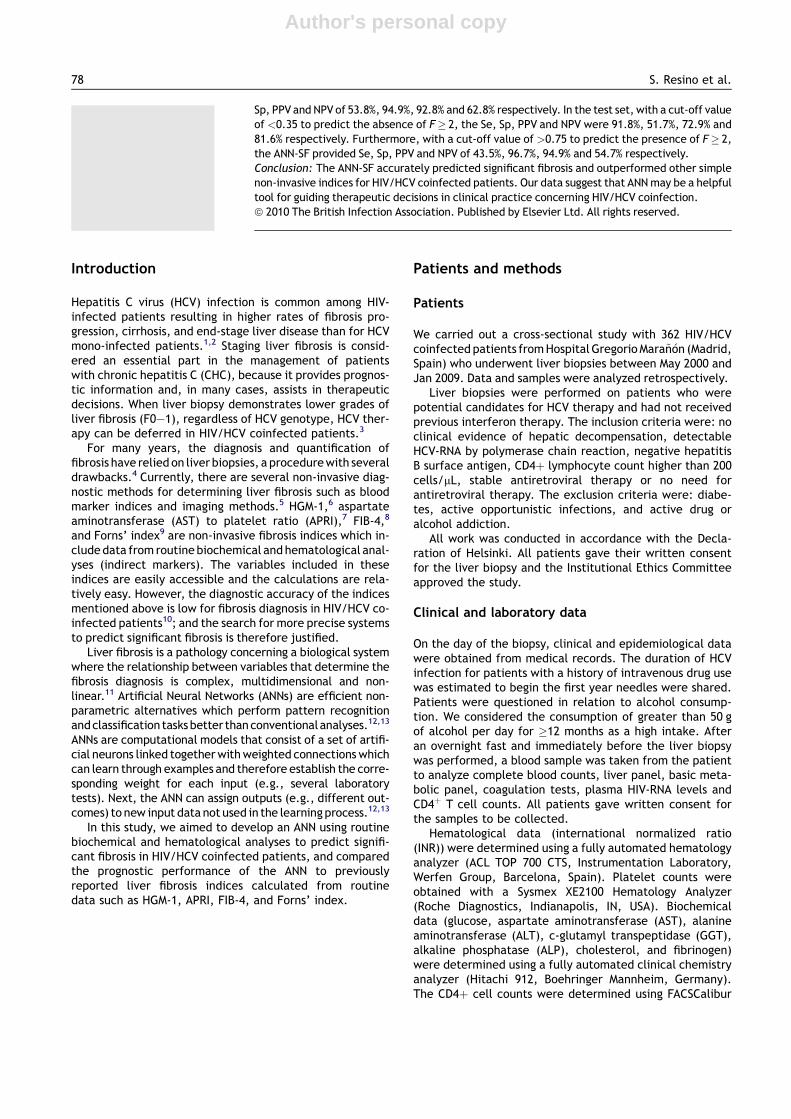
Fig. 4A & B shows that the ANN-SF values increased signifi-cantly for the advanced stage of hepatic fibrosis in both the
estimation and test groups. We found statistical differenceswhen comparing F2, F3 and F4 with F0e1; and F2 with F4(P< 0.05). Moreover, we found similar AUC-ROCs values ofANN-SF for the estimation and test groups (Fig. 4C). Further-more, the AUC-ROC values of the ANN-SF were higher thanHGM-1, FIB-4, APRI, and Forns’ indices for significant fibrosis(F� 2) (P< 0.05) (Fig. 4D). The AUC-ROC adjusted value bythe DANAmethod of ANN-SF was 0.920 (95%CI: 0.881; 0.958).
With the low ANN-SF cut-off point (<0.35) for the estima-tion group, 41 patients were correctly identified (true nega-tives (TN) without significant fibrosis), and only 7 patientswere misclassified (false negatives (FN) with significantfibrosis) (Table 2). We found the presence of F< 2 with a cer-tainty of 85.4%. The LR(�) was below 0.15 and the DOR wasabove 11. For the test group, the diagnostic accuracy valueswere similar to the values for the estimation group (Table 2).
With the high ANN-SF cut-off (>0.75) for the estimationgroup, 64 patients were correctly identified (true positive(TP) with significant fibrosis), and only 5 patients weremisclassified (false positive (FP) without significant fibrosis)(Table 2). We found the presence of F� 2 with a certaintyof 92.8%. The LR(þ) was greater than 10 and the DOR wasgreater than 20. For the test group, the diagnostic accuracyvalues were similar to the values for the estimation group(Table 2).
Diagnostic performance of ANN for advancedfibrosis (F ‡ 3)
The ANN was also set-up for the diagnosis of advancedfibrosis (ANN-AF) with the same 10 inputs described for theANN-SF, but with weights assigned to each variable specificfor the diagnosis of advanced fibrosis (F� 3). We found sim-ilar AUC-ROC values for the ANN (0.866 (95%CI: 0.806;0.926)) and HGM-2 (0.850 (95%CI: 0.790; 0.910)). Further-more, AUC-ROC values for FIB-4 (0.787 (95%CI: 0.729;0.844)), APRI (0.793 (95%CI: 0.741; 0.846)), and Forns’ in-dex (0.776 (95%CI: 0.720; 0.832)) for the diagnosis of ad-vanced fibrosis were slightly lower than the ANN, butthere were no statistically significant differences. TheAUC-ROC adjusted value by the DANA method of ANN-AFwas 0.907 (95%CI: 0.847; 0.967).
With the low ANN-AF cut-off point (<0.10) for theestimation group, 71 patients were correctly identified(TN without advanced fibrosis), and only 3 patients weremisclassified (FN with advanced fibrosis) (Table 3). Wefound the presence of F< 3 with a certainty of 95.9%.The LR(�) was below 0.15 and the DOR was above 13. Forthe test group, the diagnostic accuracy values were similarto the values for the estimation group (Table 3).
With the high ANN-AF cut-off (>0.50) for the estimationgroup, 30 patients were correctly identified (TP withadvanced fibrosis), and only 7 patients were misclassified(FP without advanced fibrosis) (Table 2). We found the pres-ence of F� 3 with a certainty of 81.1%. The LR(þ) wasgreater than 12 and the DOR was greater than 25. For thetest group, the diagnostic accuracy values were similar tothe values for the estimation group (Table 2).
A
B
Figure 3 Relative weights of the clinical input parameters inan artificial neural network (ANN) trained with patients oftraining set. (A) ANN-SF, ANN for significant fibrosis; (B) ANN-AF, ANN for advanced fibrosis.
ANN improves fibrosis diagnosis 81
Author's personal copy
Discussion
A number of indices of liver fibrosis involving combinations ofindirect markers have been reported and have shown highdiagnostic accuracy for the diagnosis of cirrhosis, but lowaccuracy in diagnosing earlier stages of fibrosis.5 Moreover,the diagnostic accuracy of these indices is even lower forHIV/HCV coinfected patients than for HCV mono-infectedpatients.10 In our study, we developed an ANN from routinelaboratory data to identify significant fibrosis (F� 2) in na€ıveHIV/HCV coinfected patients to anti-HCV treatment. Wefound that the ANN-SF had a high diagnostic performance;the ANN-SF predicted the presence of significant fibrosis(92.8% certainty) better than the absence of significant fibro-sis (85.4% certainty). These results confirm that ANN-SF is anaccuratenon-invasivemethod for thedetection of significantfibrosis (F� 2) in HIV/HCV coinfected patients.
The non-invasive fibrosis indices represent an importanttool for themanagement of patients with chronic hepatitis C(CHC), especially when there is no access to a liver biopsy.Several non-invasive indices based on clinical routine pa-rameters (HGM-1, FIB-4, APRI, or Forns’ index) may predictfibrosis and are calculated using traditional methods. ANNsare potentially more successful than traditional statisticaltechniques when the model is used to predict the stage ofa complex biological system.22 On the basis of these assump-tions, we developed an ANN using the clinical parameters in-cluded in HGM-1, FIB-4, APRI, or Forns’ index plus fibrinogendata. We found that the ANN-SF had an AUC-ROC value closeto 0.85 and which was significantly greater than AUC-ROCvalues of HGM-1, FIB-4, APRI, or Forns’ index.
Of APRI, FIB-4, and Forns index, not all were developedto differentiate F0eF1 vs F2eF3eF4 in HIV/HCV coinfectedpatients. Forns index was better used to detect HCV mono-infected patients without hepatic fibrosis.9 APRI was per-formed to identify HCV mono-infected patients with signif-icant fibrosis and cirrhosis.7 Only FIB-4 was developed todetect significant and advanced fibrosis in HIV/HCV
coinfected patients.8 The diagnostic performance of APRIand Forns index were slightly lower in HIV/HCV coinfectedpatients than those found in the original paper.7,9 However,our data of APRI and Forns index were consistent with otherdata obtained in HIV/HCV coinfected patients.23e26 How-ever, the FIB-4 values found in our study were similar or su-perior to those reported previously in HIV/HCV coinfectedpatients.8,10 In any case, the values of these non-invasiveindexes (APRI, FIB-4, and Forns index) reported in HIV/HCV coinfected patients have shown AUC-ROC values lowerthan 0.80 for significant and advanced fibrosis.
Some experts would consider non-invasive serum tests offibrosis with AUC-ROC values of 0.85e0.90 to be as good asa liver biopsy for staging fibrosis27; and in our study, the diag-nostic performance achieved by the ANN-SF when internaland external cohorts were considered had AUC-ROC valuesaround 0.85 and some 7e14% better than the AUC-ROC ob-tainedwithHGM-1, FIB-4, APRI, or Forns’ index. Of particularinterest is the finding that the ANN-SF had a degree of accu-racy that had not been previously achieved with indirectmarkers for HIV/HCV coinfected patients.10,24,25,28,29 Wealso want to point out that the HGM-1 index developedfrom a subgroup of patients included in the current study,6
was outperformed by the ANN-SF.There are other non-invasive fibrosis indices that were
not analyzed in this study such as Fibrometer, Hepascoreand Fibrotest. These indices have been previously evalu-ated in HIV/HCV coinfected patients and have shown gooddiagnostic performance for the prediction of significantliver fibrosis.10 It would have been interesting to compareANN with these indices; however, unfortunately, not all ofthe variables needed to calculate the Fibrotest were avail-able. SHASTA Index, FibroSpect, and GlycoCirrhoTest arecombinations of indirect and direct biomarkers whichhave not been evaluated with HIV/HCV coinfected pa-tients5; and they contain some non-routine tests whichare not widely accessible and probably expensive makingthe model less attractive considering it is not feasible formost clinicians. Advantages of the biochemical and
IC%59CORUAºN
noitamitsE 712 868.0 419.0–128.0tseT 541 648.0 809.0–587.0
sisorbifrevilfoegatS
4F3F2F1F-0F
ANN-SF
05.1
00.1
05.0
00.0
81833689
100.0<
490.0
100.0<100.0<
200.0
sisorbifrevilfoegatS
ANN-SF
05.1
00.1
05.0
00.0
4F3F2F1F-0F
02124406
100.0<
100.0<100.0<
200.0
yticificepS-1
%001%08%06%04%02%0
Sensitivity
%001
%08
%06
%04
%02
%0
CBA D
yticificepS-1
%001%08%06%04%02%0
Sensitivity
%001
%08
%06
%04
%02
%0
Figure 4 (A & B) Box plots illustrating the distribution of values from the artificial neural network for significant fibrosis (ANN-SF)against fibrosis score for the estimation (A) and test groups (B). Horizontal lines inside each box represent the median, and thelower and upper borders of the box encompass the interquartile range. The vertical lines from the ends of each box encompassthe extreme data points. (C) Diagnostic values of the ANN-SF for prediction of significant fibrosis (F� 2) in the estimation andtest groups. (D) Diagnostic values of the ANN-SF, HGM-1, APRI, FIB-4, and Forn’s indices, for prediction of significant fibrosis (F� 2).
82 S. Resino et al.
Author's personal copy
hematological parameters like those used in the develop-ment of the current ANN-SF are that they are affordableand widely available. Nevertheless, they are hamperedfrom potential distortions, because they may be affectedby factors associated with HIV infection such as
hematological abnormalities and antiretroviral therapy,which can lead to increases in transaminases orcholesterol.30e32
Aside from these laboratory biomarkers, liver fibrosis isevaluated using transient elastography (FibroScan).33
Table 1 Characteristics of 362 HIV/HCV coinfected patients, who underwent a liver biopsy.
Estimation group Test group All patients
No. HIV-1 patientsa 217 145 362Sex (male)a 164 (75.6) 114 (78.6) 278 (76.8)Age (years)b 39.5 (36.8; 43.6) 40 (36.8; 43.5) 39.6 (36.8; 43.6)HIV acquired by IVDUa 190 (87.6) 121 (83.4) 311 (85.9)Prior AIDSa 69 (31.8) 35 (24.1) 104 (28.7)Years since HCV infectionb 21.2 (17.1; 24.5) 22 (17.6; 24.9) 21.4 (17.4; 24.7)High alcohol intakea 25 (11.5) 22 (15.2) 47 (13)
Antiretroviral therapyNon treated 35 (16.1) 23 (15.9) 58 (16)PI-baseda 52 (24) 35 (24.1) 87 (24)NNRTI-baseda 95 (43.8) 62 (42.8) 157 (43.4)3 NRTI-baseda 32 (14.7) 22 (15.2) 54 (14.9)Othera 3 (1.4) 3 (2.1) 6 (1.7)Months on HAART (nZ 304)b 51.3 (37.2; 68.1) 57.1 (34.9; 79.2) 54 (36.2; 73.9)
Stage of liver fibrosisa
F0 19 (8.8) 13 (9) 32 (8.8)F1 79 (36.4) 47 (32.4) 126 (34.8)F2 63 (29) 44 (30.3) 107 (29.6)F3 38 (17.5) 21 (14.5) 59 (16.3)F4 18 (8.3) 20 (13.8) 38 (10.5)
HIV markersNadir CD4þ T-cellsb 190 (93; 306) 235 (100; 355) 200 (94; 331)Baseline CD4þ T-cells/mLb 455 (306; 660) 540 (380; 722)* 485 (330; 682)HIV-RNA< 50 cp/mLa 110 (50.7) 75 (51.7) 185 (51.1)Log10 VL copies/mL (nZ 177) 2.69 (1.69; 3.87) 2.28 (1.69; 3.26) 2.61 (1.69; 3.69)
HCV markersa
HCV genotype (comprobar)1e4 153 (73.6) 110 (77.5) 263 (75.1)2e3 55 (26.4) 32 (22.5) 87 (24.9)
HCV-RNA >850,000 cp/ml 120 (58.5) 79 (56.4) 199 (57.7)
Hematologic parametersb
Platelet count (� 109/L) 176 (138; 215) 180 (137; 225) 177 (138; 218)Fibrinogen (mg/dL) 261 (221; 305) 264 (226; 312) 263 (223; 309)INR 1 (1; 1.05) 1 (1; 1.07) 1 (1; 1.05)
Biochemical parametersb
Glucose (mg/dL) 85 (76; 96) 89 (78; 96) 86 (77; 96)ALP (UI/L) 109 (80; 184) 112 (78; 196) 110 (79; 190)AST (UI/L) 62 (37; 96) 57 (41; 82) 59 (38; 91)GGT (UI/L) 97 (55; 192) 113 (53; 212) 104 (54; 200)ALT (UI/L) 75 (48; 119) 76 (50; 112) 76 (49; 118)AST/ALT 0.8 (0.62; 1.03) 0.77 (0.63; 0.97) 0.79 (0.63; 1)Cholesterol 169 (141; 195) 174 (152; 197) 170 (143; 196)
*Significant differences (P< 0.05).HCV, Hepatitis C virus; HIV-1, Human immunodeficiency virus type 1; HAART, highly active antiretroviral therapy; NRTI, nucleoside an-alogue HIV reverse transcriptase inhibitor; NNRTI, non-nucleoside analogue HIV reverse transcriptase inhibitor; PI, protease inhibitor;HIV-RNA, HIV plasma viral load; HCV-RNA, HCV plasma viral load; INR, international normalized ratio; ALP, alkaline phosphatase;AST, aspartate aminotransferase; GGT, gamma glutamyl transpeptidase; ALT, alanine aminotransferase.a Absolute number (percentage).b Median (percentile 25; percentile 75).
ANN improves fibrosis diagnosis 83
Author's personal copy
Table
3Diagn
ostic
acc
uracy
andpredictive
valuesoftheartificialneuralnetw
ork
foradva
nce
dfibrosis(ANN-AF).
Cut-off
TP
FP
TN
FN
Sea
Spa
PPVa
NPVa
LRþb
LR�b
DORb
Estim
ationgroup(n
Z21
7)0.10
5390
713
94.6
(85.4e
98.2)
44.1
(36.7e
51.8)
37.1
(29.6e
45.2)
95.9
(88.7e
98.6)
1.69
(1.46e
1.97
)0.12
(0.04e
0.37
)13
.94(4.2e46
.5)
0.50
307
154
2653
.6(40.7e
66)
95.7
(91.3e
97.9)
81.1
(65.8e
90.5)
85.6
(79.7e
89.9)
12.32(5.74e
26.46)
0.49
(0.36e
0.65
)25
.38(10.1e63
.8)
Test
group(n
Z14
5)0.10
4064
401
97.6
(87.4e
99.6)
38.5
(29.7e
48.1)
38.5
(29.7e
48.1)
97.6
(87.4e
99.6)
1.59
(1.35e
1.86
)0.06
(0.01e
0.45
)25
.00(3.3e18
9.1)
0.50
216
9820
51.2
(36.5e
65.7)
94.2
(88e
97.3)
77.8
(59.2e
89.4)
83.1
(75.3e
88.8)
8.88
(3.86e
20.41)
0.52
(0.37e
0.72
)17
.15(6.1e47
.9)
TP,
truepositive
cases(correct
diagn
osis);FP,
falsepositive
cases(ove
r-diagn
osis);TN,truenega
tive
cases(correct
diagn
osis);FN,falsenega
tive
cases(m
issedca
ses);Se
,sensitivity;Sp
,specificity;PPV,positive
predictive
value;NPV,nega
tive
predictive
value;LR
,like
lihoodratio;DOR,diagn
ostic
oddsratio.
aValuesaspercentage
(%)and95
%ofco
nfidence
interval
(95%
CI).
bValuesasratiova
lueand95
%ofco
nfidence
interval(95%
CI).
Table
2Diagn
ostic
acc
uracy
andpredictive
valuesoftheartificialneuralnetw
ork
forsign
ifica
ntfibrosis(ANN-SF).
Cut-off
TP
FP
TN
FN
Sea
Spa
PPVa
NPVa
LRþb
LR�b
DORb
Estim
ationgroup(n
Z21
7)0.35
112
5741
794
.1(88.4e97
.1)
41.8
(32.6e51
.7)
66.3
(58.9e
73)
85.4
(72.8e
92.8)
1.62
(1.36e
1.93
)0.14
(0.07e0.29
)11
.51(4.9e27
.3)
0.75
645
9355
53.8
(44.8e62
.5)
94.9
(88.6e97
.8)
92.8
(84.1e
96.9)
62.8
(54.8e
70.2)
10.54(4.42e
25.16)
0.49
(0.40e0.60
)21
.64(8.2e57
.1)
Test
group(n
Z14
5)0.35
7829
317
91.8
(84e
96)
51.7
(39.3e63
.8)
72.9
(63.8e
80.4)
81.6
(66.6e
90.8)
1.90
(1.45e
2.49
)0.16
(0.08e0.33
)11
.91(4.7e30
)0.75
372
5848
43.5
(33.5e54
.1)
96.7
(88.6e99
.1)
94.9
(83.1e
98.6)
54.7
(45.2e
63.9)
13.06(3.27e
52.11)
0.58
(0.48e0.71
)22
.35(5.1e97
.6)
TP,
truepositive
cases(correct
diagn
osis);FP,
falsepositive
cases(ove
r-diagn
osis);TN,truenega
tive
cases(correct
diagn
osis);FN,falsenega
tive
cases(m
issedca
ses);Se
,sensitivity;Sp
,specificity;PPV,positive
predictive
value;NPV,nega
tive
predictive
value.LR
,like
lihoodratio;DOR,diagn
ostic
oddsratio.
aValuesaspercentage
(%)and95
%ofco
nfidence
interval(95%
CI).
bValuesasratiova
lueand95
%ofco
nfidence
interval
(95%
CI).
84 S. Resino et al.
Author's personal copy
However, the diagnostic performance of liver stiffness forsignificant fibrosis reported in HIV/HCV coinfected patientswas lower than the diagnostic performance of the ANN-SFshown here.34,35
On the other hand, the ANN-AF had similar AUC-ROCvalues to HGM-2 and slightly higher values than FIB-4, APRI,and Forns’ index for the diagnosis of advanced fibrosis(F� 3). Moreover, Cacoub et al. reported that other non-in-vasive tests (Fibrometer, Hepascore and Fibrotest) wereable to stage liver with advanced fibrosis with AUROC of0.84 in HIV/HCV coinfected patients.10 Transient elastogra-phy have shown a higher diagnostic performance (AUC-ROCZ 0.93) than our ANN for advanced fibrosis.34 Thus,we think that ANN is less useful for the diagnosis of ad-vanced fibrosis because there are other non-invasivemethods with similar or superior diagnostic performances.
An important point is the clinical usefulness of theproposed algorithms in this article. We have uploaded theANN-SF at an easily accessible web application at http://ibsen.tic.udc.es:8080/WebANN-SF/Default.aspx, whichcan be useful for the clinical management of patients.This application is in a free access website with the goalof having the largest possible dissemination andapplicability. The website provides the values of Sp, Se,PPV and NPV for each value of ANN-SF by interpolation inan ROC curve constructed with all data of patientsincluded in this study. When the algorithm providesa value less than 0.35, it could help eliminate the need forbiopsy and rule out HCV antiviral treatment. However, theNPV and LR- were moderate and the test is not clinicallystrong enough to completely discard significant fibrosis.When the algorithm provides a value greater than 0.75, itcould likewise help eliminate biopsy procedures and callfor HCV antiviral treatment with a certainty greater than90%. Furthermore, another algorithm in this website canalso give a diagnosis of advanced fibrosis (ANN-AF), whichcould be useful for the clinical management of patients.In this case, the ANN-SF predicted the absence ofadvanced fibrosis better than the presence of advancedfibrosis.
This study has several limitations that must be taken intoaccount for the correct interpretation of the data: (a) A lownumber of patients: The ANN-SF was constructed using 10variables and each group should have 100 patients to avoidthe risk of overfitting of the data. This was not fullyachieved for the validations of training examples (71 out217 patients). However, the model was confirmed in thetest group (145 cases). (b) Extrapolating data: This studywas limited to patients with well preserved immunefunction (>200 CD4þ/mm3) and the extrapolation to indi-viduals with more marked immune suppression will requirefurther study. (c) The ANN-SF was derived from the major-ity of this combined cohort and so would be expected toperform optimally in this cohort; whereas the other indicestested (APRI, FIB-4 and Forns’ index) were not optimized inthis cohort and would be expected to be outperformed. (d)Some important laboratory data were not used to build theneural network, for example albumin, albumin percentageof total proteins, serum nitrogen or creatinine, and serumsodium although they could have contributed to improvethe ANN. These variables were not available in a high per-centage of patients. (e) We cannot give exact information
regarding biopsy length or portal tracts however we onlyfound a 1.68% of defective biopsies for pathological diagno-sis and these cases were excluded in this study. In any case,the pathologist had a biopsy quality and he was able tomake the diagnosis of fibrosis in 98.32% of obtainedbiopsies.
In summary, we have provided evidence that the ANN-SFaccurately predicted significant fibrosis (F� 2) and outper-formed other simple non-invasive indices in HIV/HCV coin-fected patients. Our data suggest that ANN is a helpfultool for guiding therapeutic decisions in the clinical prac-tice of HIV/HCV coinfection.
Conflict of interest
The authors do not have commercial or other associationsthat might pose a conflict of interest.
Authors’ contributions
SR had primary responsibility for protocol development,participated in the design of the study, performed thestatistical analysis, and contributed to the writing of themanuscript. JAS, JMB, JD, FMS, GL carried out the statis-tical and bioinformatic analysis, and contributed to thewriting of the manuscript. EA had primary responsibility offibrosis liver diagnosis. JB, PM, JCL, and JC carried outpatient screening, collecting and recording data, andcontributed to the writing of the manuscript. JB conceivedof the study, and participated in its design and coordina-tion. All authors read and approved the final manuscript.
Acknowledgements
This work was supported by grants from Fundaci�on para laInvestigaci�on y la Prevenci�on del SIDA en Espa~na (FIPSE)(Ref. 36650/07) and Instituto de Salud Carlos III (ISC-III)(Ref. PI07/90201; Ref.: UIPY 1467/07; PI08/0738) to SR.From ISC-III (Ref. RD07/0067) to JS, JD and FM. From ISC-III (Ref. ISCIII-RETIC RD06/006, PI08/0928), and FIPSE(Ref. 36443/03) to JB.
Dr. Nick Weber provided writing assistance for thismanuscript.
References
1. Graham CS, Baden LR, Yu E, Mrus JM, Carnie J, Heeren T, et al.Influence of human immunodeficiency virus infection on thecourse of hepatitis C virus infection: a meta-analysis. Clin In-fect Dis 2001;33(4):562e9.
2. Soto B, Sanchez-Quijano A, Rodrigo L, del Olmo JA, Garcia-Bengoechea M, Hernandez-Quero J, et al. Human immunodefi-ciency virus infection modifies the natural history of chronicparenterally-acquired hepatitis C with an unusually rapid pro-gression to cirrhosis. J Hepatol 1997;26(1):1e5.
3. Alberti A, Clumeck N, Collins S, Gerlich W, Lundgren J, Pal�u G,et al. Short statement of the first european consensus confer-ence on the treatment of chronic hepatitis b and c in HIV co-infected patients. J Hepatol 2005;42(5):615e24.
4. Dienstag JL. The role of liver biopsy in chronic hepatitis C. Hep-atology 2002;36(5 Suppl. 1):S152e60.
ANN improves fibrosis diagnosis 85

Author's personal copy
5. Manning DS, Afdhal NH. Diagnosis and quantitation of fibrosis.Gastroenterology 2008;134(6):1670e81.
6. Berenguer J, Bellon JM, Miralles P, Alvarez E, Sanchez-Conde M,Cosin J, et al. Identification of liver fibrosis in HIV/HCV-coin-fected patients using a simple predictivemodel basedon routinelaboratory data. J Viral Hepat 2007;14(12):859e69.
7. Wai CT, Greenson JK, Fontana RJ, Kalbfleisch JD, Marrero JA,Conjeevaram HS, et al. A simple noninvasive index can predictboth significant fibrosis and cirrhosis in patients with chronichepatitis C. Hepatology 2003;38(2):518e26.
8. Sterling RK, Lissen E, Clumeck N, Sola R, Correa MC,Montaner J, et al. Development of a simple noninvasive indexto predict significant fibrosis in patients with HIV/HCV coinfec-tion. Hepatology 2006;43(6):1317e25.
9. Forns X, Ampurdanes S, Llovet JM, Aponte J, Quinto L, Marti-nez-Bauer E, et al. Identification of chronic hepatitis C patientswithout hepatic fibrosis by a simple predictive model. Hepatol-ogy 2002;36(4 Pt 1):986e92.
10. Cacoub P, Carrat F, Bedossa P, Lambert J, Penaranda G,Perronne C, et al. Comparison of non-invasive liver fibrosis bio-markers in HIV/HCV co-infected patients: the fibrovic study e
ANRS HC02. J Hepatol 2008;48(5):765e73.11. Friedman SL. Liver fibrosis e from bench to bedside. J Hepatol
2003;38(Suppl. 1):S38e53.12. Baxt WG. Application of artificial neural networks to clinical
medicine. Lancet 1995;346(8983):1135e8.13. Krogh A. What are artificial neural networks? Nat Biotechnol
2008;26(2):195e7.14. Jacobs WH, Goldberg SB. Statement on outpatient percutane-
ous liver biopsy. Dig Dis Sci. 1989;34(3):322e3.15. Bedossa P, Poynard T. An algorithm for the grading of activity in
chronic hepatitis C. The METAVIR Cooperative Study Group.Hepatology 1996;24(2):289e93.
16. Calvaruso V, Maimone S, Gatt A, Tuddenham E, Thursz M,Pinzani M, et al. Coagulation and fibrosis in chronic liver dis-ease. Gut 2008;57(12):1722e7.
17. Howes P, Crook N. Using input parameter influences to supportthe decisions of feedforward neural networks. Neurocomput-ing 1999;24(1e3):191e206.
18. DeLong ER, DeLong DM, Clarke-Pearson DL. Comparing theareas under two or more correlated receiver operating charac-teristic curves: a nonparametric approach. Biometrics 1988;44(3):837e45.
19. Song HH. Analysis of correlated ROC areas in diagnostic testing.Biometrics 1997;53(1):370e82.
20. Poynard T, Halfon P, Castera L, Munteanu M, Imbert-Bismut F,Ratziu V, et al. Standardization of ROC curve areas for diagnos-tic evaluation of liver fibrosis markers based on prevalences offibrosis stages. Clin Chem. 2007;53(9):1615e22.
21. Glas AS, Lijmer JG, Prins MH, Bonsel GJ, Bossuyt PM. The diag-nostic odds ratio: a single indicator of test performance. J ClinEpidemiol 2003;56(11):1129e35.
22. AlmeidaJS.Predictivenon-linearmodelingof complexdatabyar-tificial neural networks. Curr Opin Biotechnol 2002;13(1):72e6.
23. Trang T, Petersen JR, Snyder N. Non-invasive markers of hepaticfibrosis in patients co-infected with HCV and HIV: comparison ofthe APRI and FIB-4 index. Clin Chim Acta 2008;397(1, 2):51e4.
24. Macias J, Giron-Gonzalez JA, Gonzalez-Serrano M, Merino D,Cano P, Mira JA, et al. Prediction of liver fibrosis in human im-munodeficiency virus/hepatitis C virus coinfected patients bysimple non-invasive indexes. Gut 2006;55(3):409e14.
25. Loko MA, Castera L, Dabis F, Le Bail B, Winnock M, Coureau G,et al. Validation and comparison of simple noninvasive indexesfor predicting liver fibrosis in HIV-HCV-coinfected patients:ANRS CO3 Aquitaine cohort. Am J Gastroenterol 2008;103(8):1973e80.
26. Tural C, Tor J, Sanvisens A, Perez-Alvarez N, Martinez E,Ojanguren I, et al. Accuracy of simple biochemical tests inidentifying liver fibrosis in patients co-infected with human im-munodeficiency virus and hepatitis C. Virus. Clin GastroenterolHepatol 2008;7(1):339e45.
27. Afdhal NH, Nunes D. Evaluation of liver fibrosis: a concise re-view. Am J Gastroenterol 2004;99(6):1160e74.
28. Macias J, Gonzalez J, Ortega E, Tural C, Cabrero E, Burgos A,et al. Use of simple noninvasive biomarkers to predict liver fi-brosis in HIV/HCV coinfection in routine clinical practice. HIVMed; in press.
29. Tural C, Tor J, Sanvisens A, Perez-Alvarez N, Martinez E,Ojanguren I, et al. Accuracy of simple biochemical tests inidentifying liver fibrosis in patients co-infected with human im-munodeficiency virus and hepatitis C virus. Clin GastroenterolHepatol 2009;7(3):339e45.
30. Kontorinis N, Dieterich D. Hepatotoxicity of antiretroviral ther-apy. AIDS Rev. 2003;5(1):36e43.
31. Bonacini M. Liver injury during highly active antiretroviral ther-apy: the effect of hepatitis C coinfection. Clin Infect Dis 2004;38(Suppl. 2):S104e8.
32. Cole JL, Marzec UM, Gunthel CJ, Karpatkin S, Worford L,Sundell IB, et al. Ineffective platelet production in thrombocy-topenic human immunodeficiency virus-infected patients.Blood 1998;91(9):3239e46.
33. Moreno S, Garcia-Samaniego J, Moreno A, Ortega E, Pineda JA,del Romero J, et al. Noninvasive diagnosis of liver fibrosis in pa-tients with HIV infection and HCV/HBV co-infection. J ViralHepat 2009;16(4):249e58.
34. Sanchez-Conde M, Montes-Ramirez ML, Miralles P, CastroAlvarez JM, Bellon JM, Ramirez M, et al. Comparison of tran-sient elastography and liver biopsy for the assessment of liverfibrosis in HIV/hepatitis C virus-coinfected patients and corre-lation with noninvasive serum markers. J Viral Hepat; 2009.
35. de Ledinghen V, Douvin C, Kettaneh A, Ziol M, Roulot D,Marcellin P, et al. Diagnosis of hepatic fibrosis and cirrhosisby transient elastography in HIV/hepatitis C virus-coinfectedpatients. J Acquir Immune Defic Syndr 2006;41(2):175e9.
86 S. Resino et al.